Dell Latitude 15 3590 (i7-8550U, Radeon 530) Laptop Review
The Dell Inspiron family consists of the low-end 3000 series, mid-range 5000 series, and higher-end 7000 series. Unsurprisingly, the Dell Latitude family is also organized in a similar fashion. Our unit today is the 15.6-inch Latitude 3590 as part of the budget 3000 series to succeed last year's Latitude 3580. It also acts as a less expensive version of the pricier 15.6-inch Latitude 5590.
As one of the most affordable business laptops from Dell, the Latitude 3590 starts at just $450 USD with a Celeron 3865U CPU, 4 GB of RAM, and a 768p TN display while the highest-end SKU is equipped with a Core i7-8550U CPU, 8 GB of RAM, discrete Radeon 530 graphics, and a 1080p TN display for $1070 USD. Our test unit is the higher-end SKU but with a primary HDD instead of a SSD for about $150 less.
The Latitude 3590 competes directly with other budget 15.6-inch business laptops including the Acer TravelMate P2510, HP ProBook 650 G4, Lenovo ThinkPad E580, and the Toshiba Tecra series.
Case
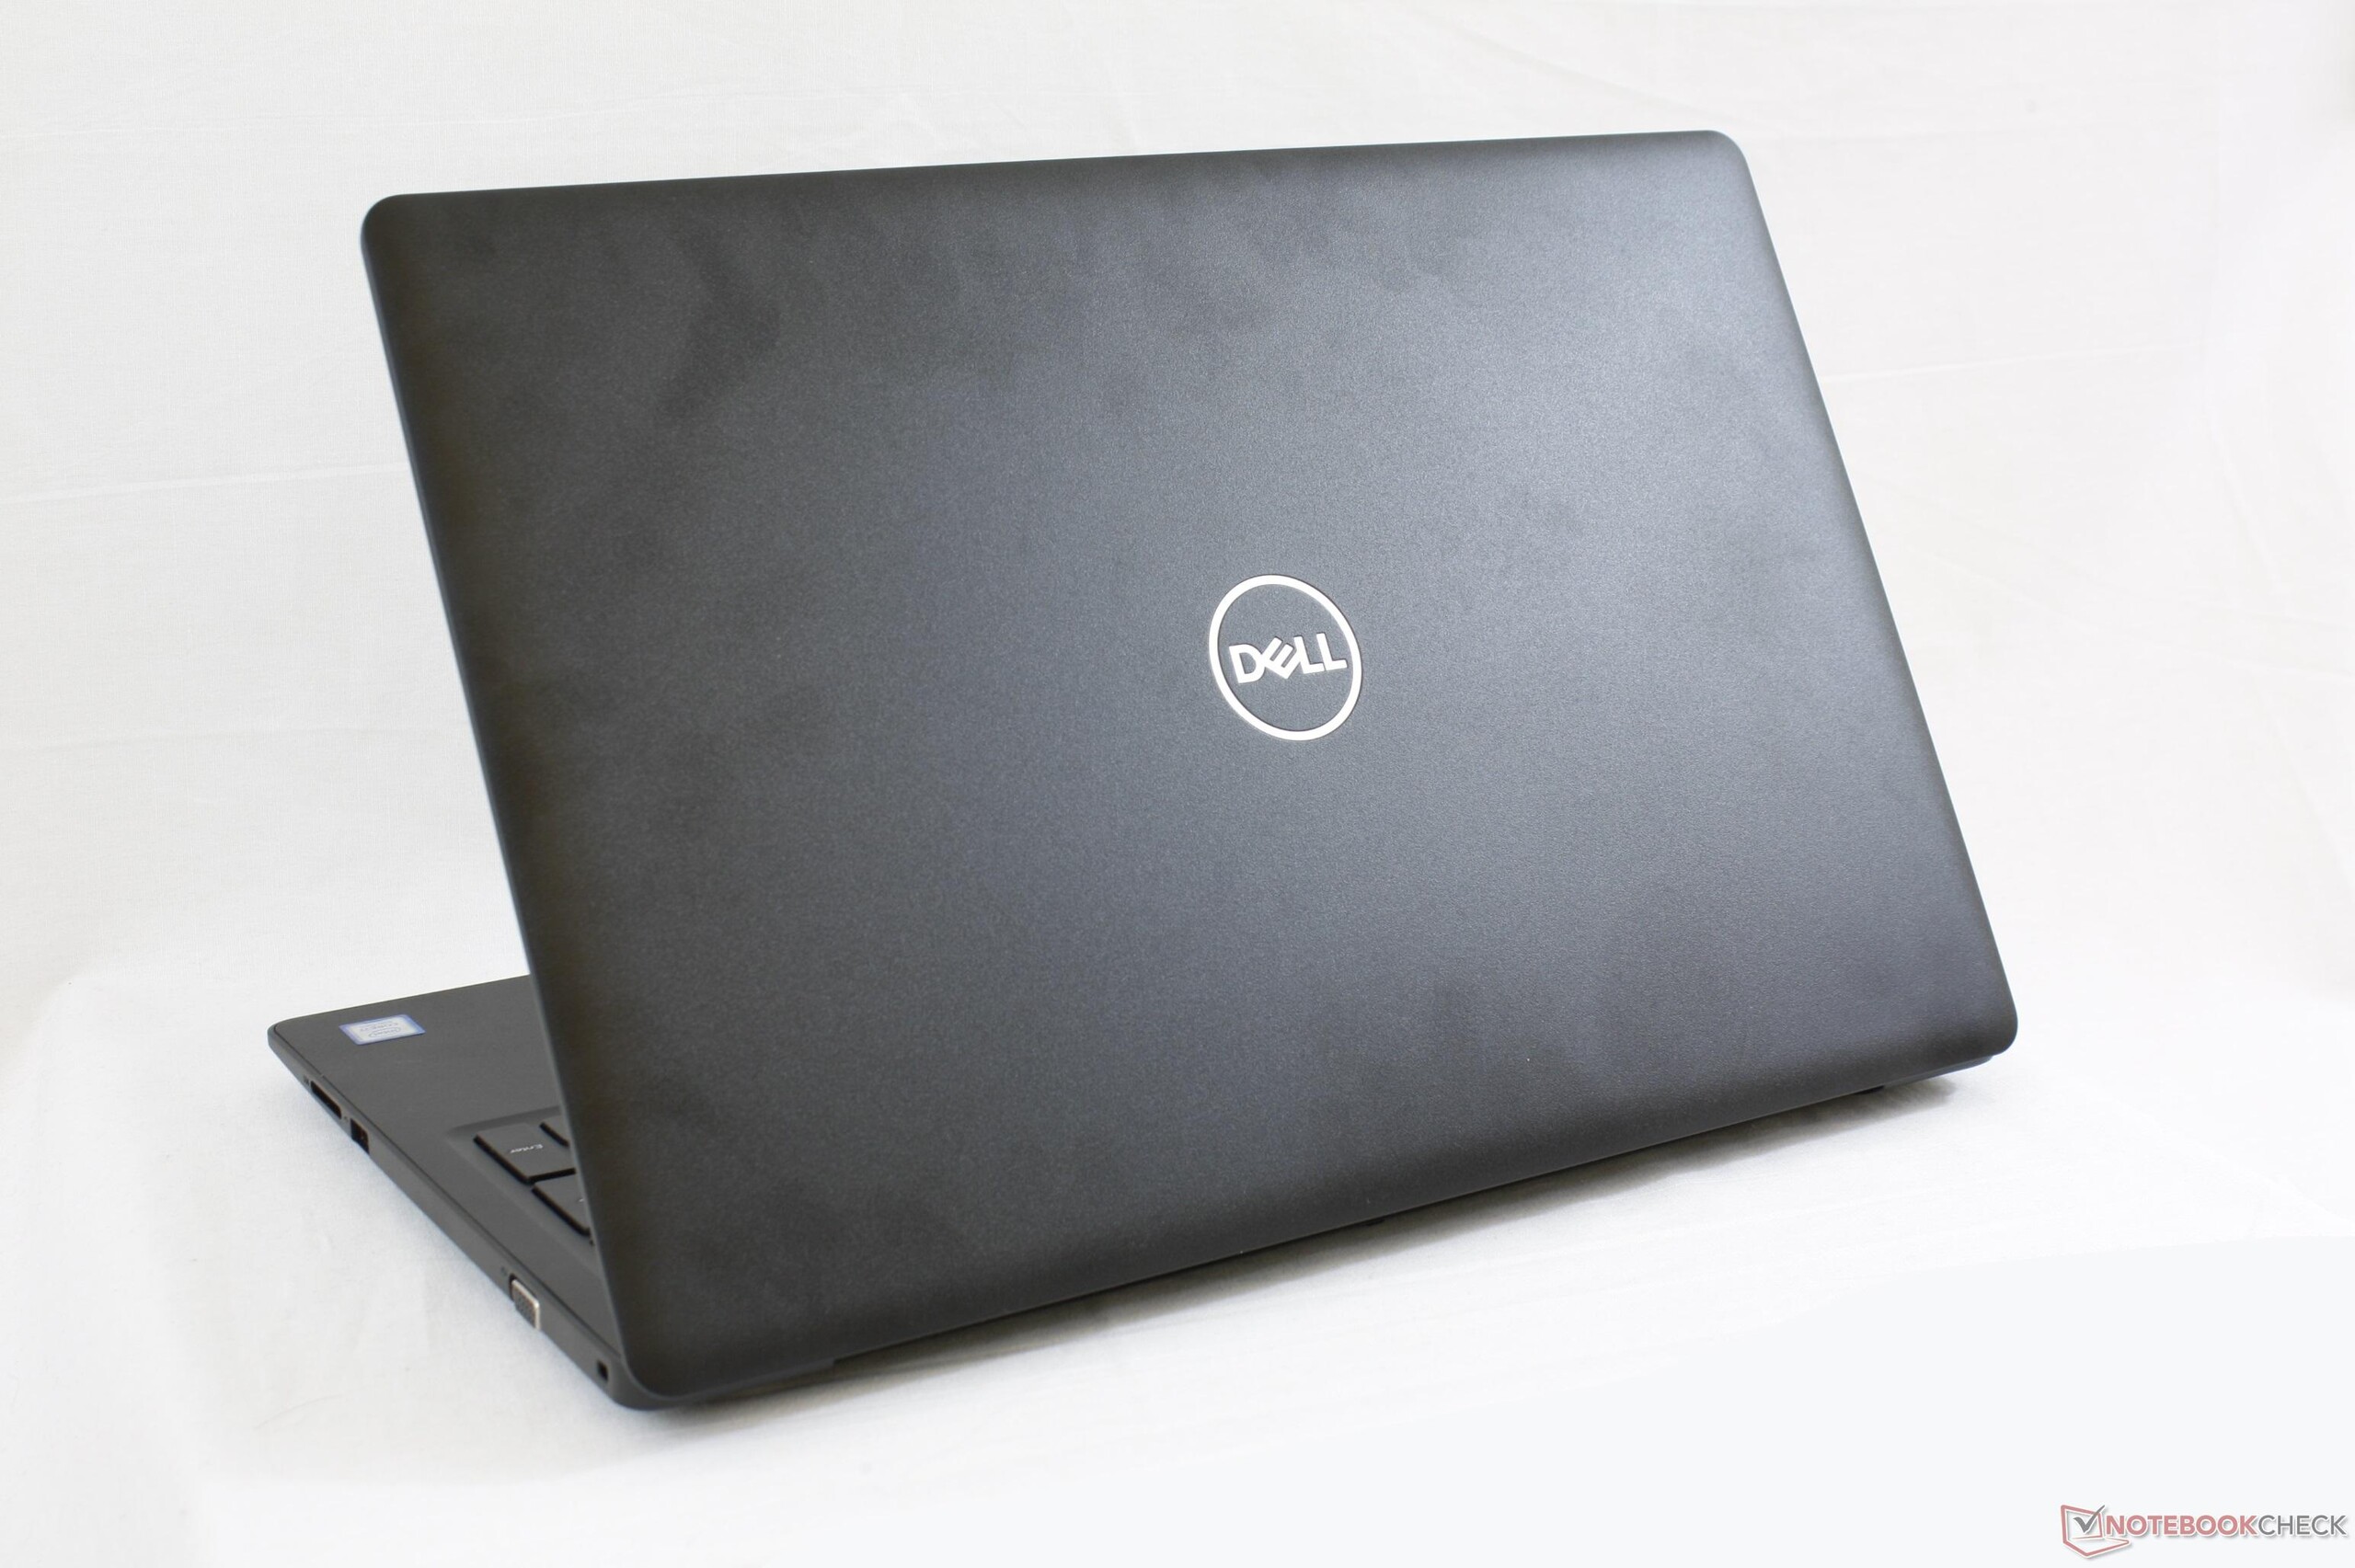
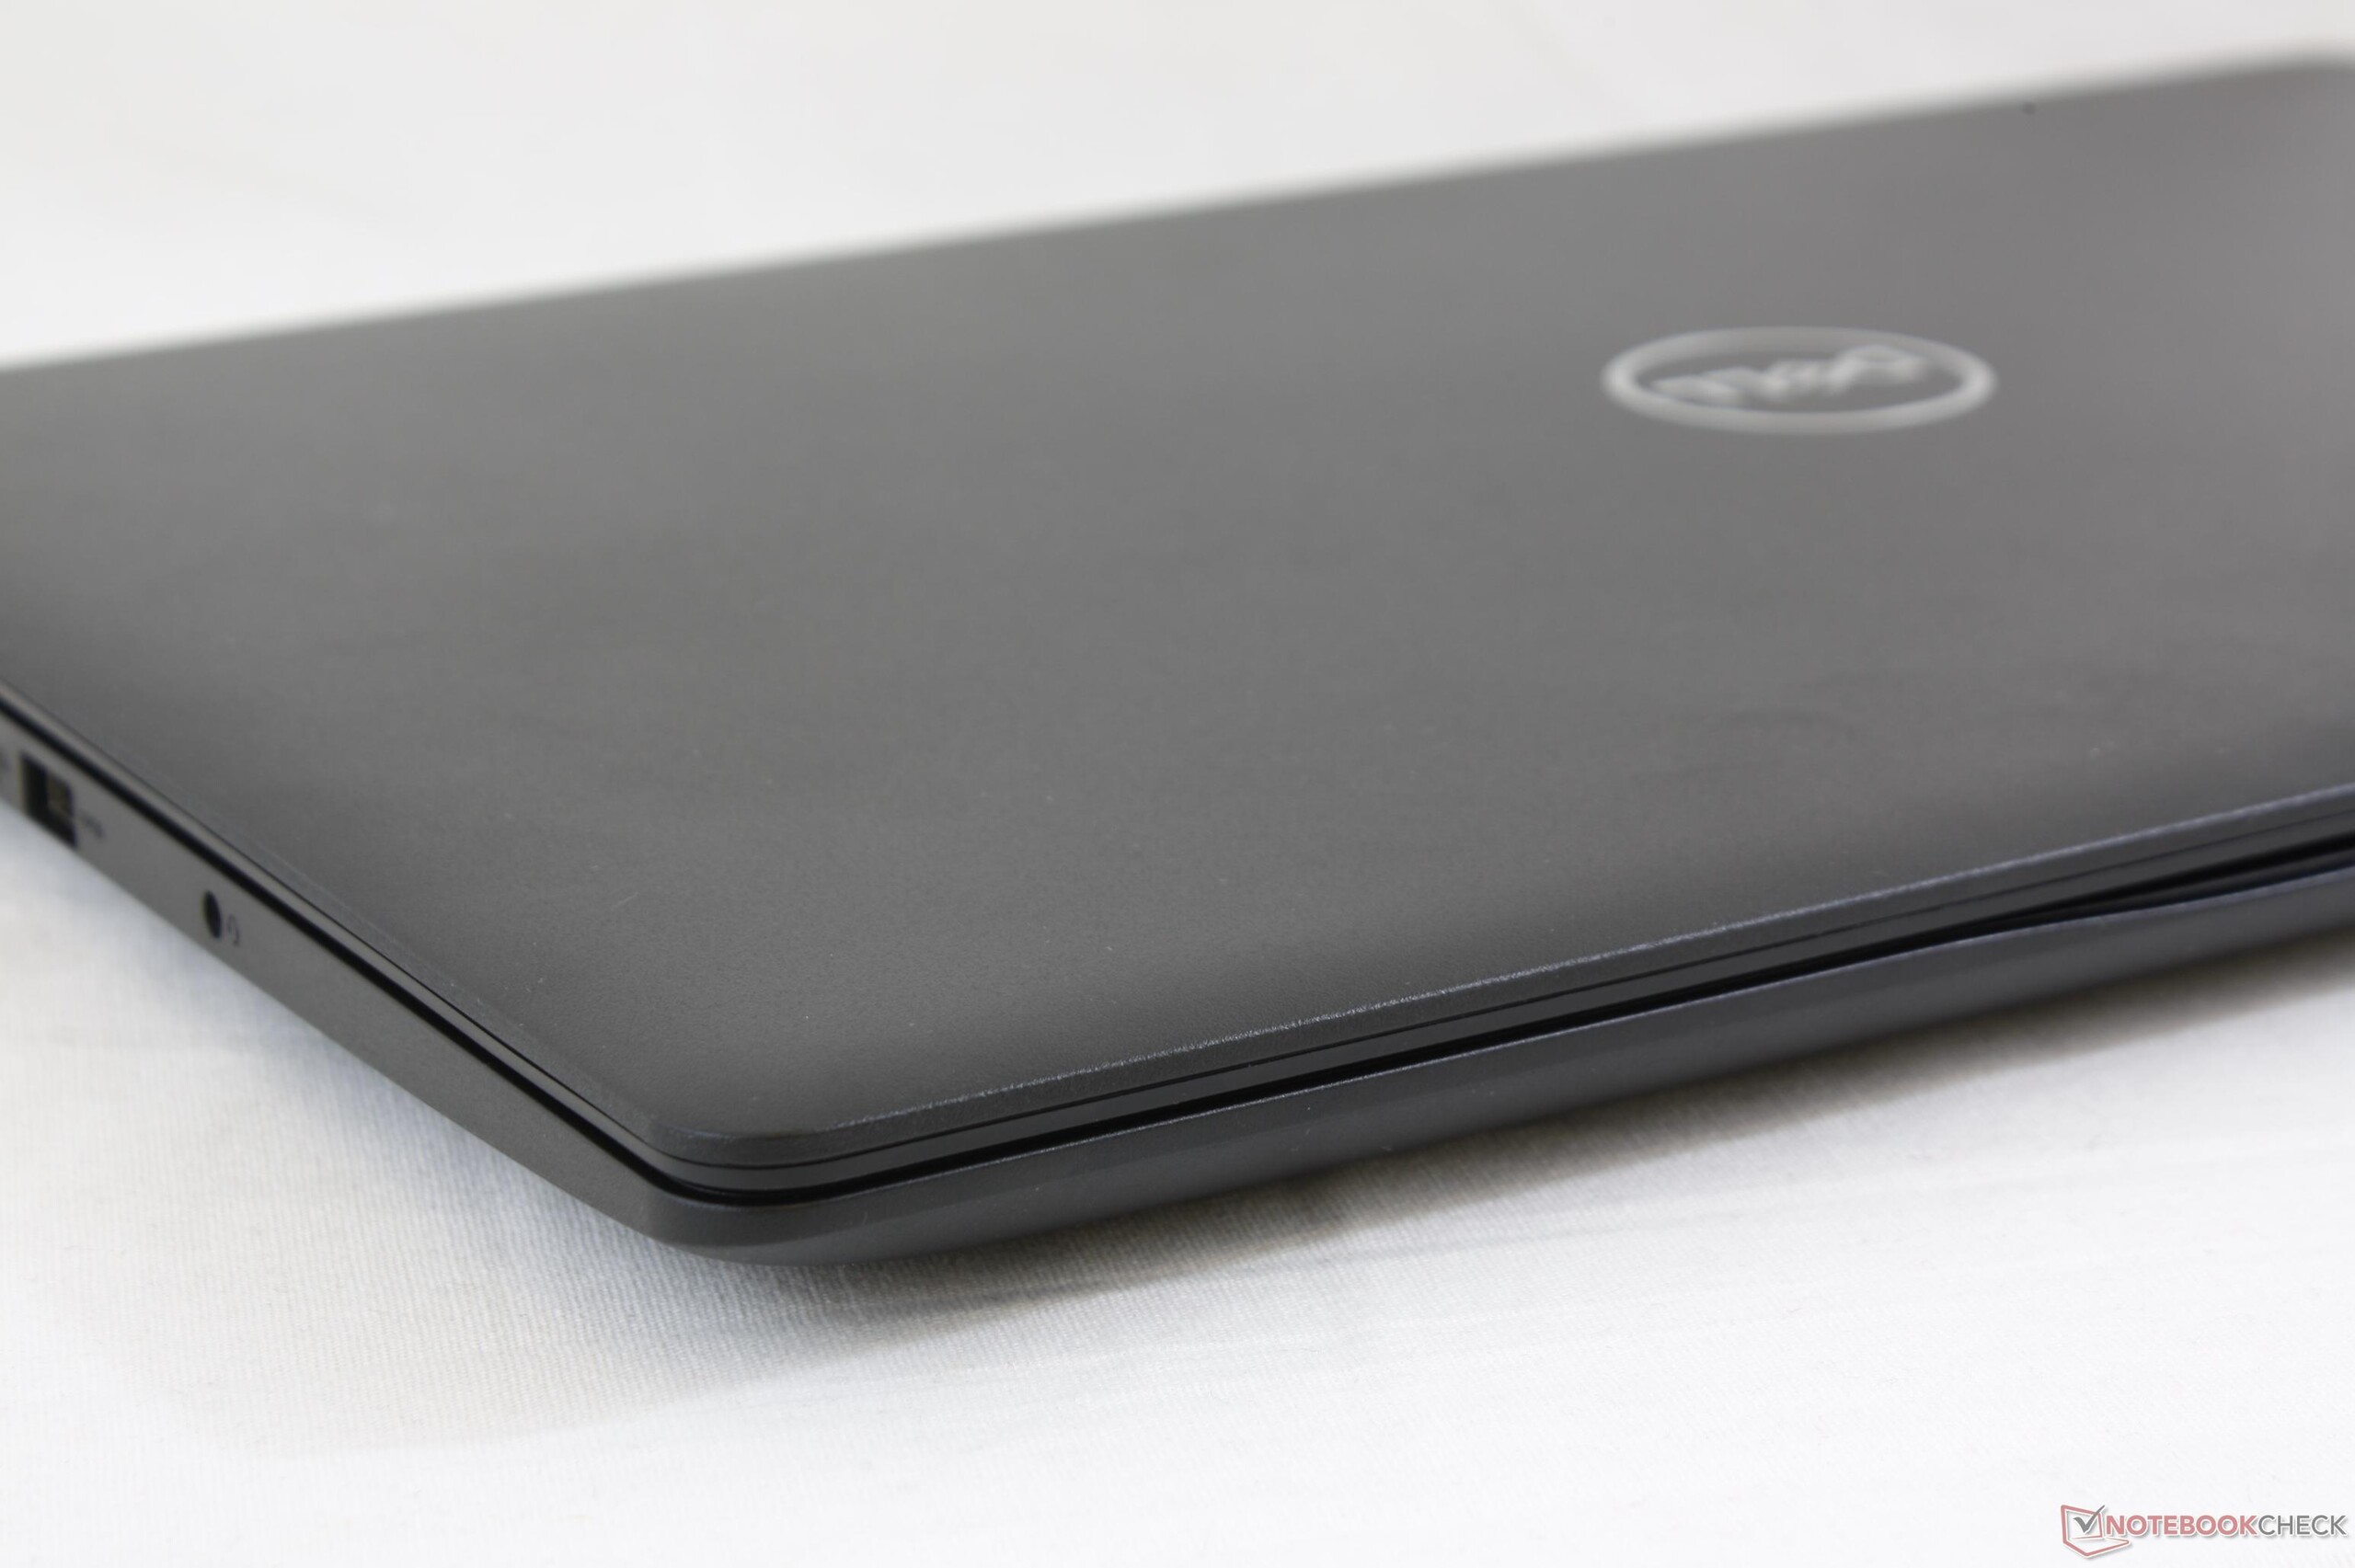
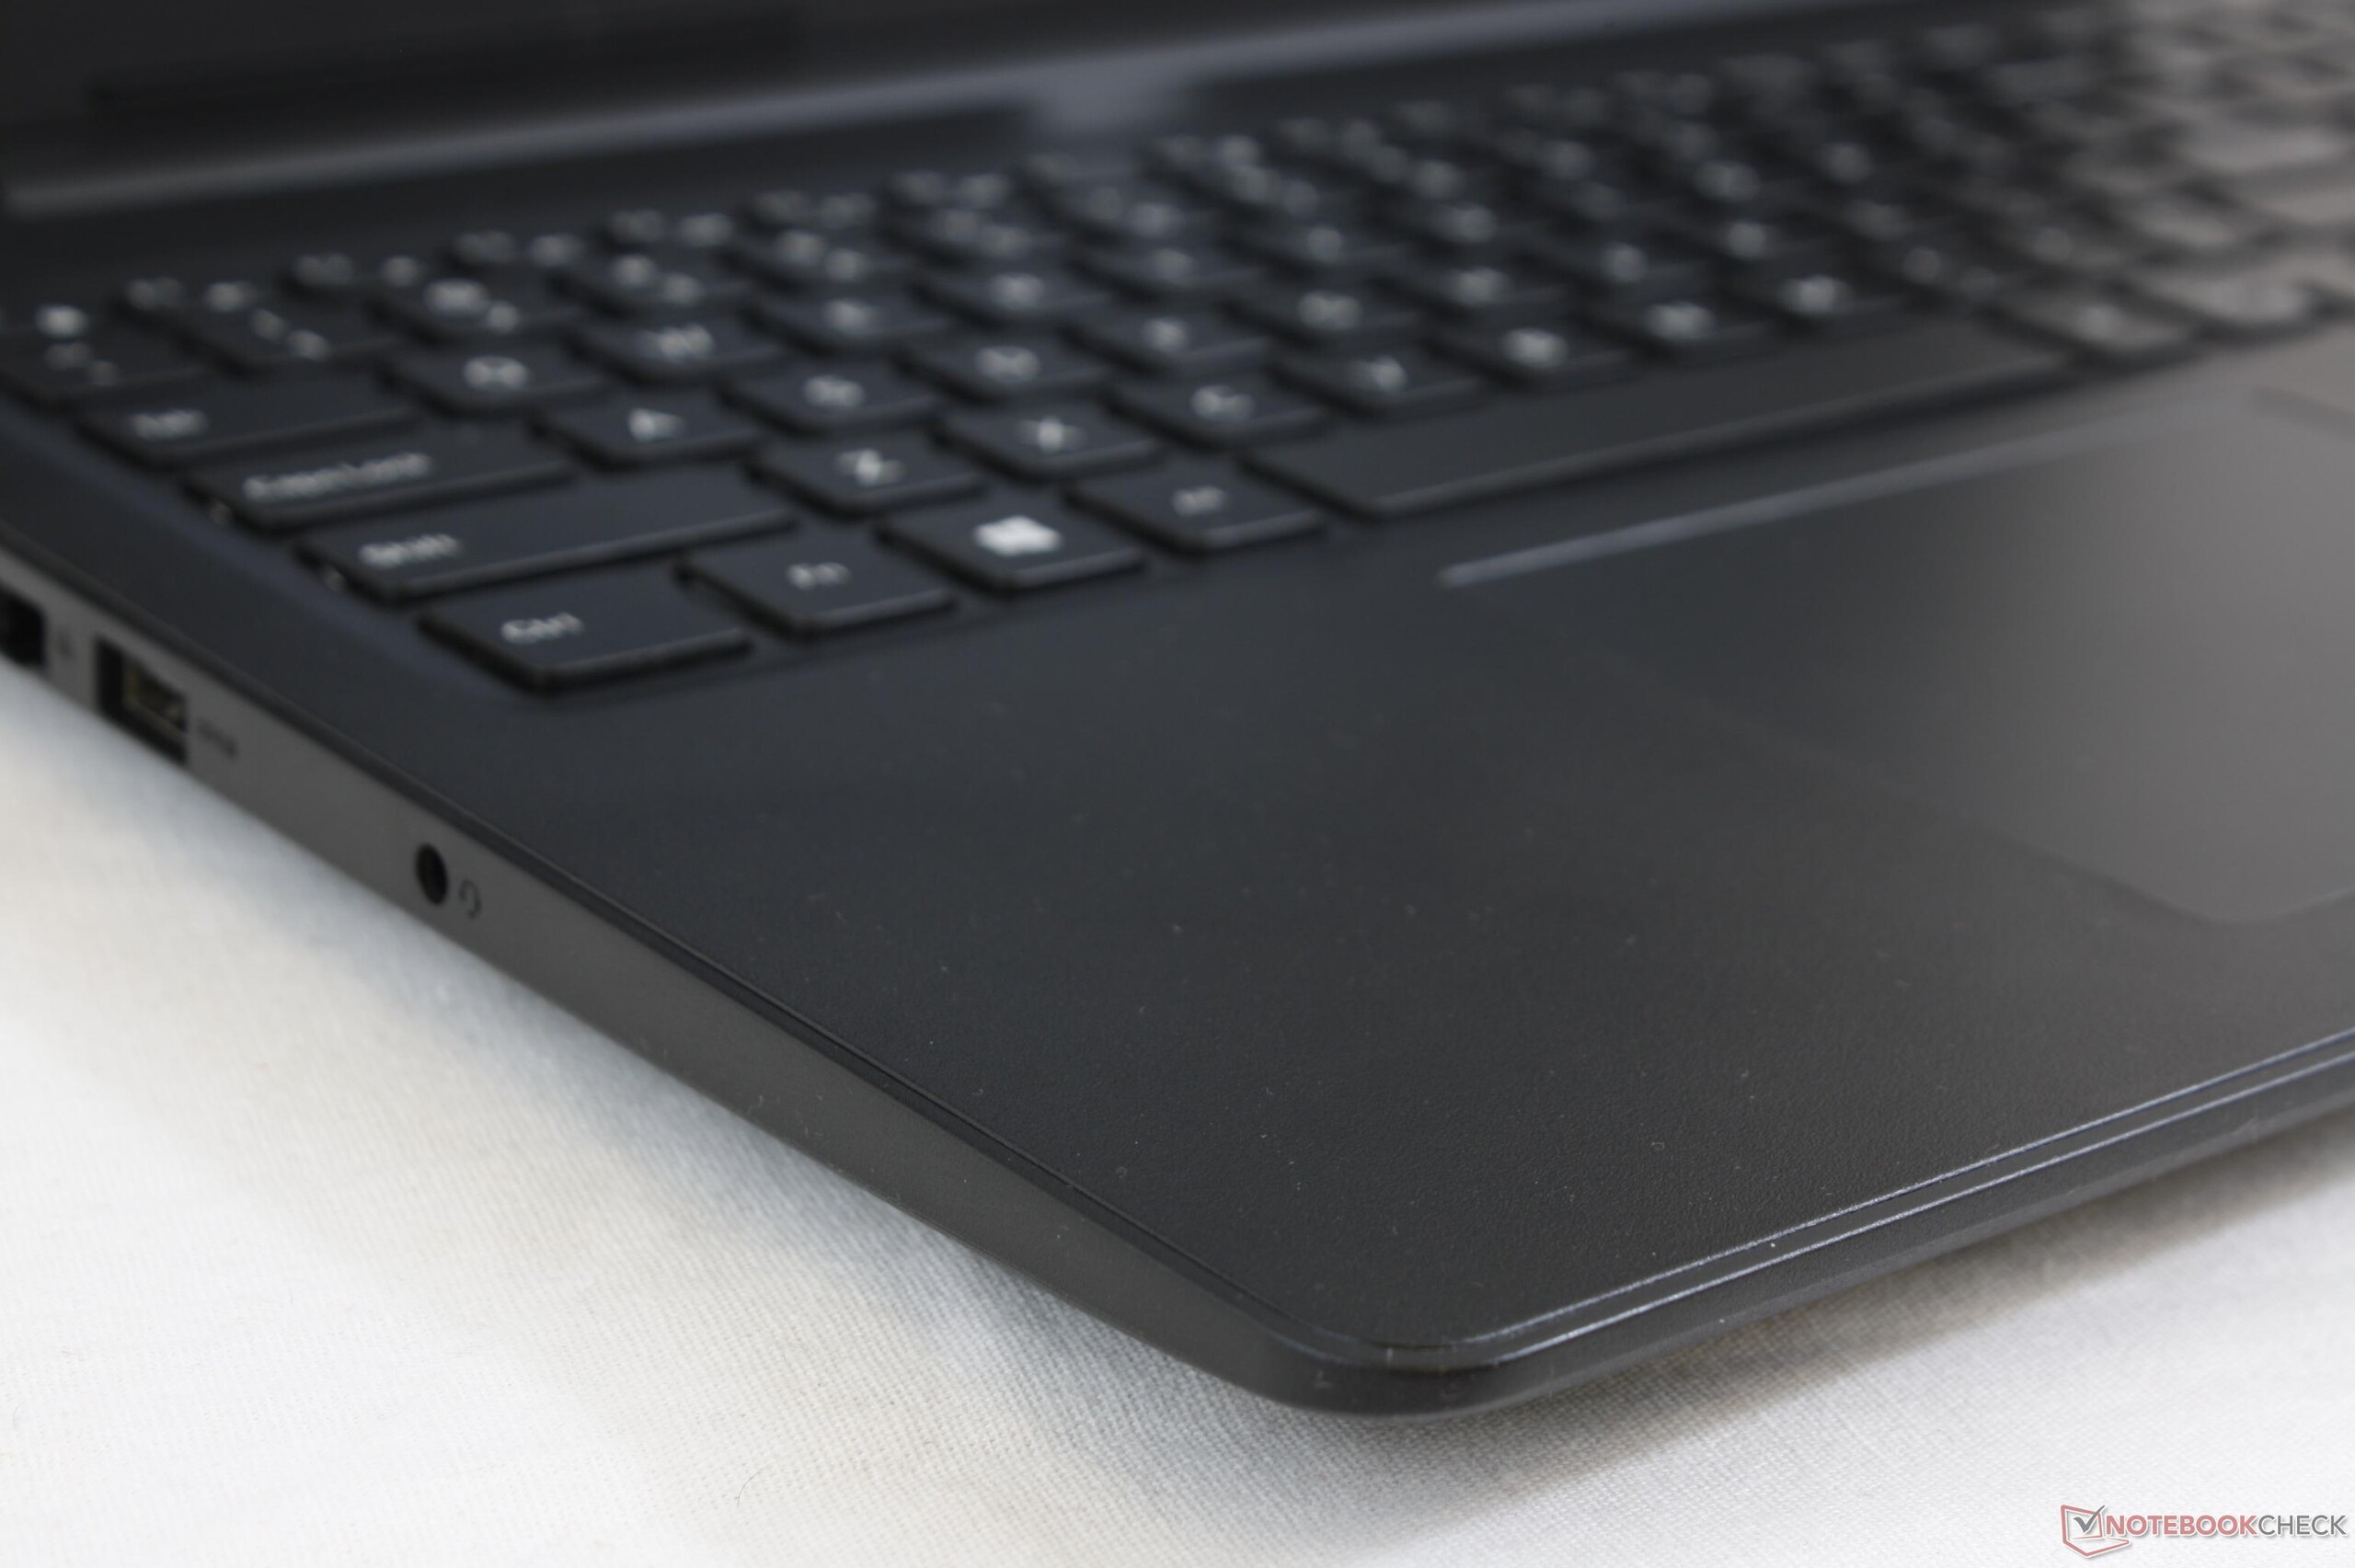
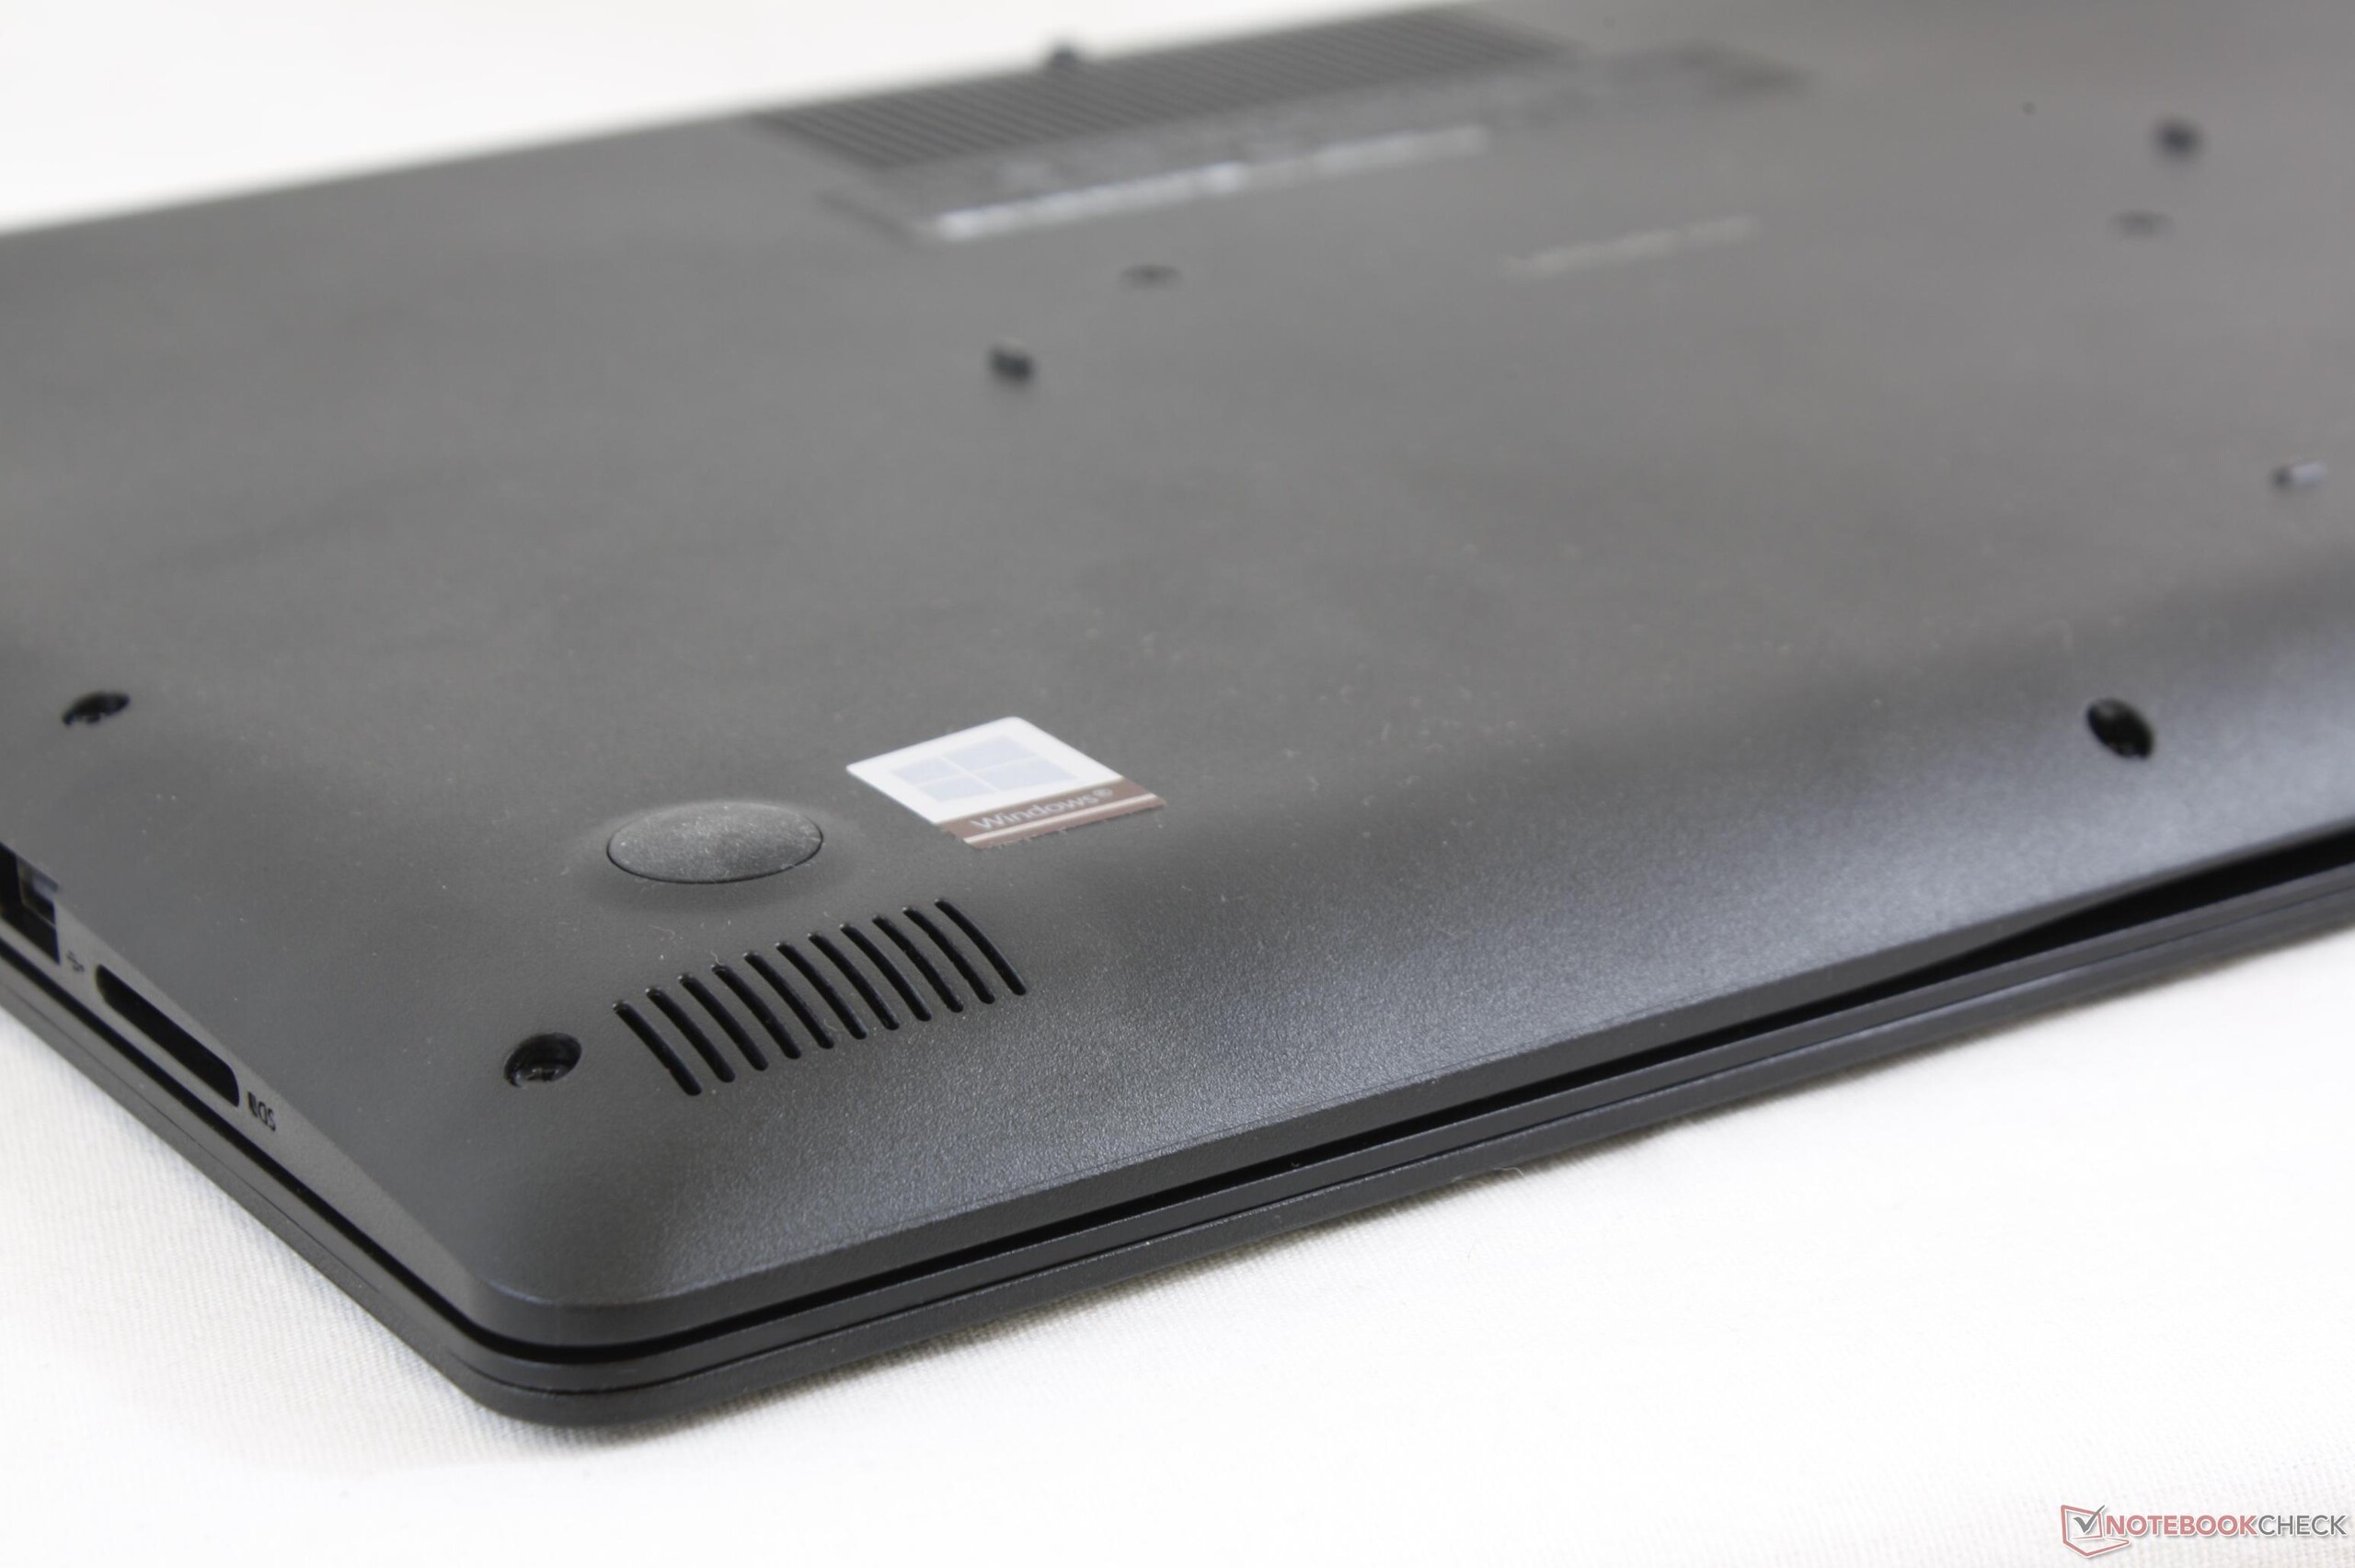
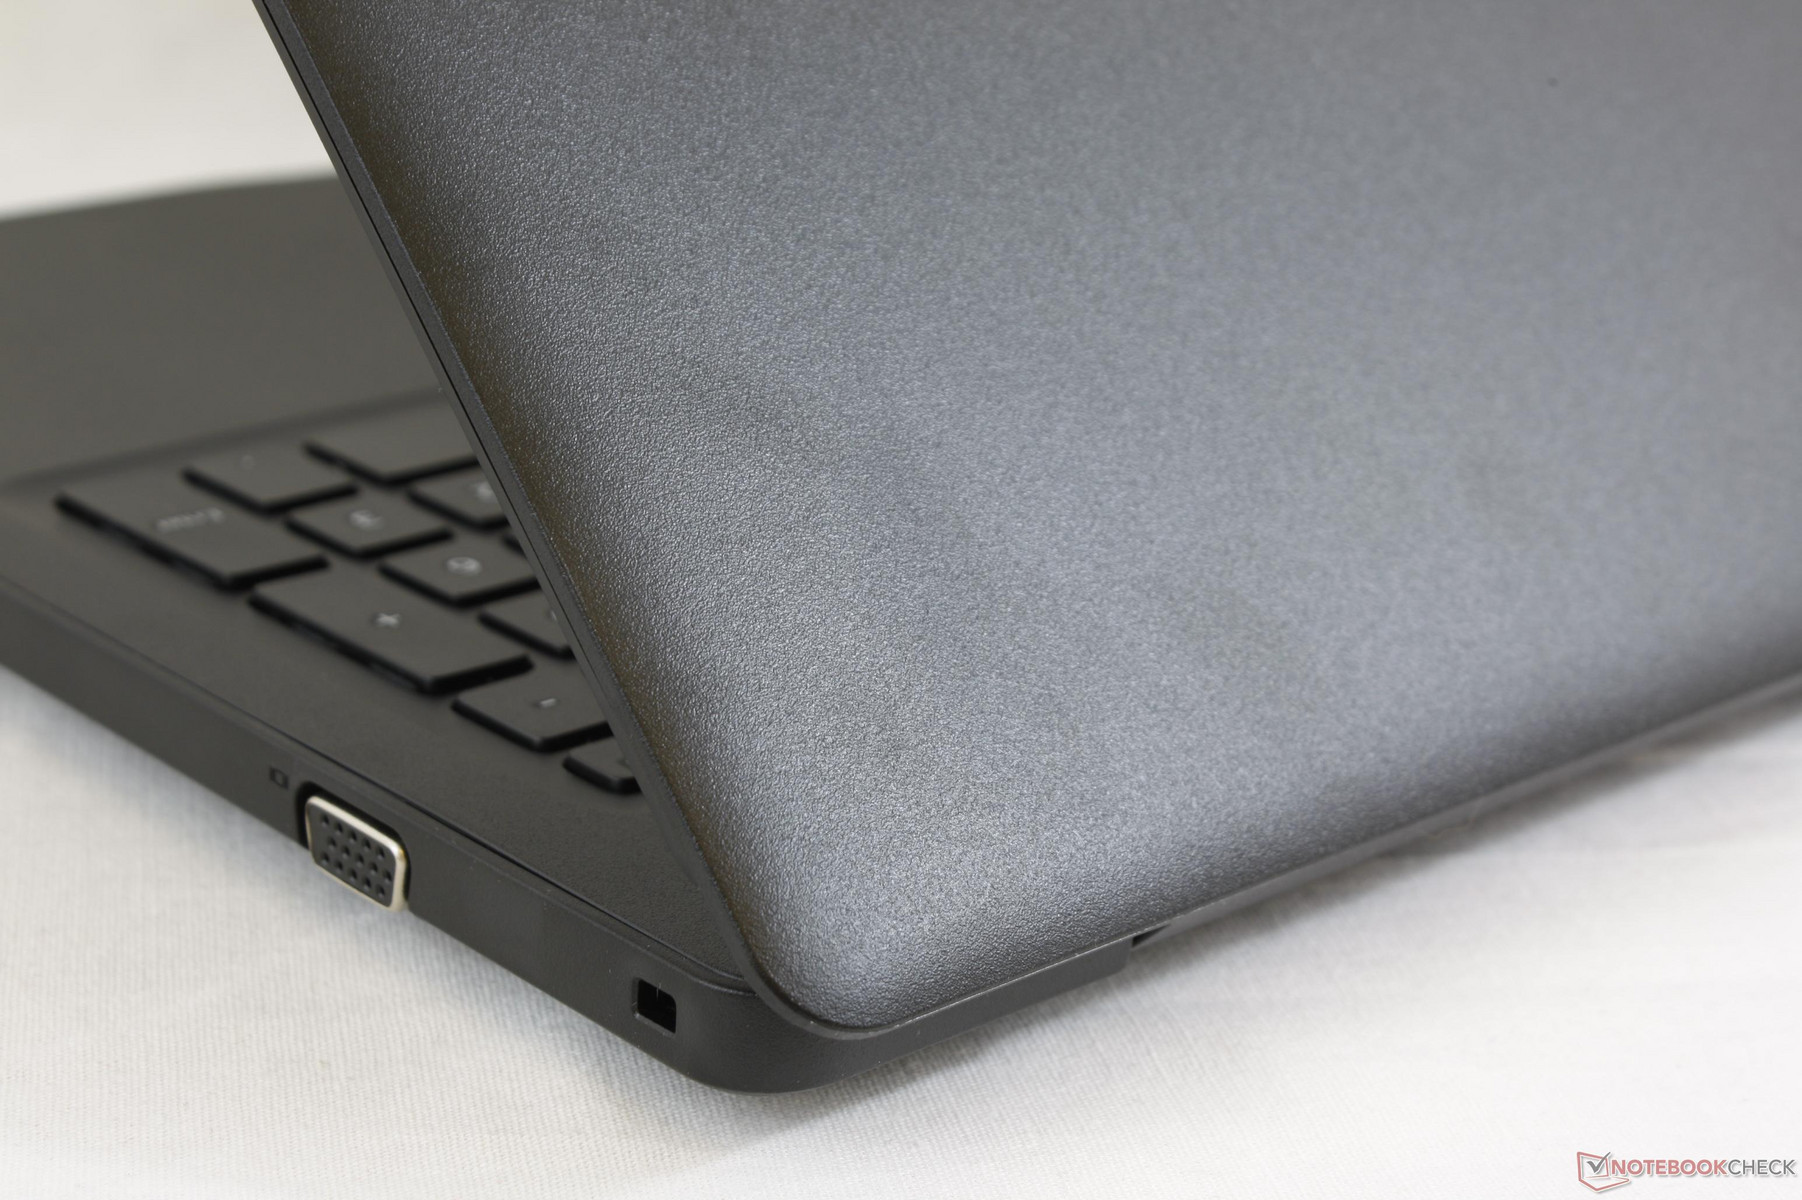
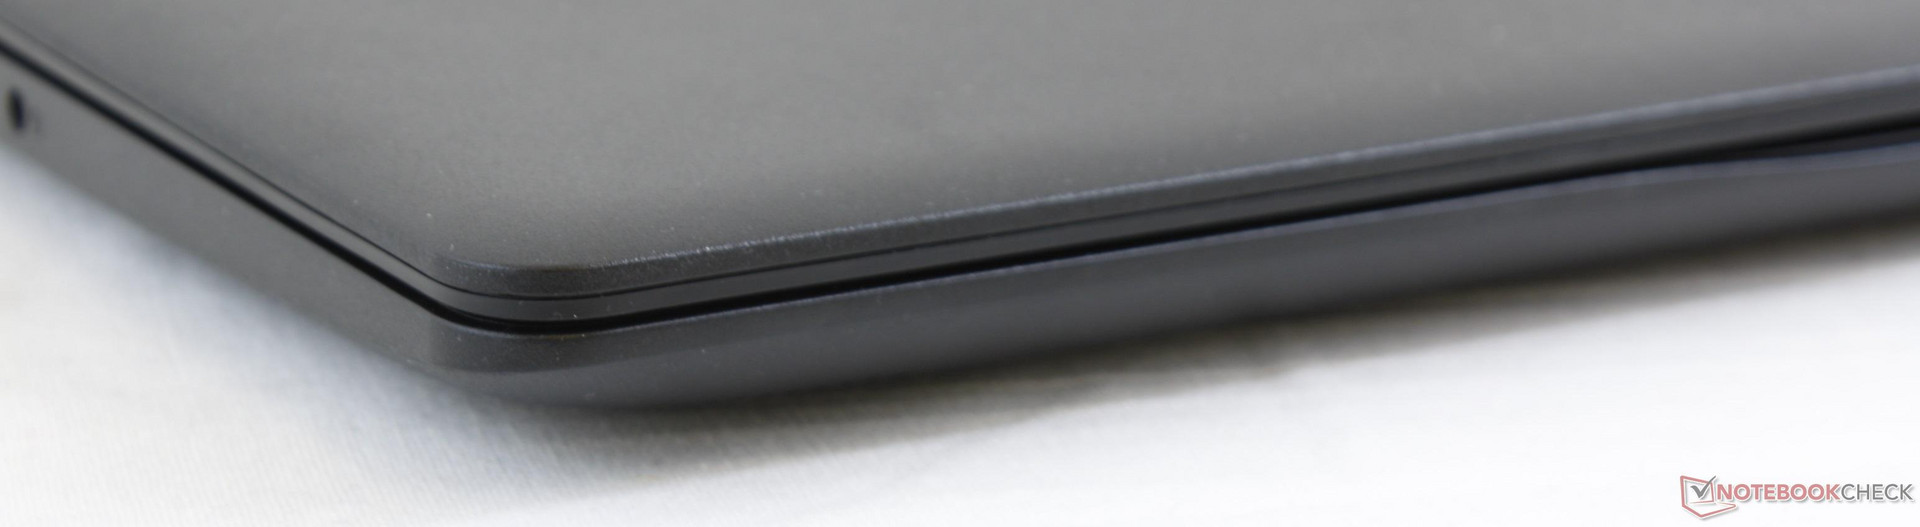
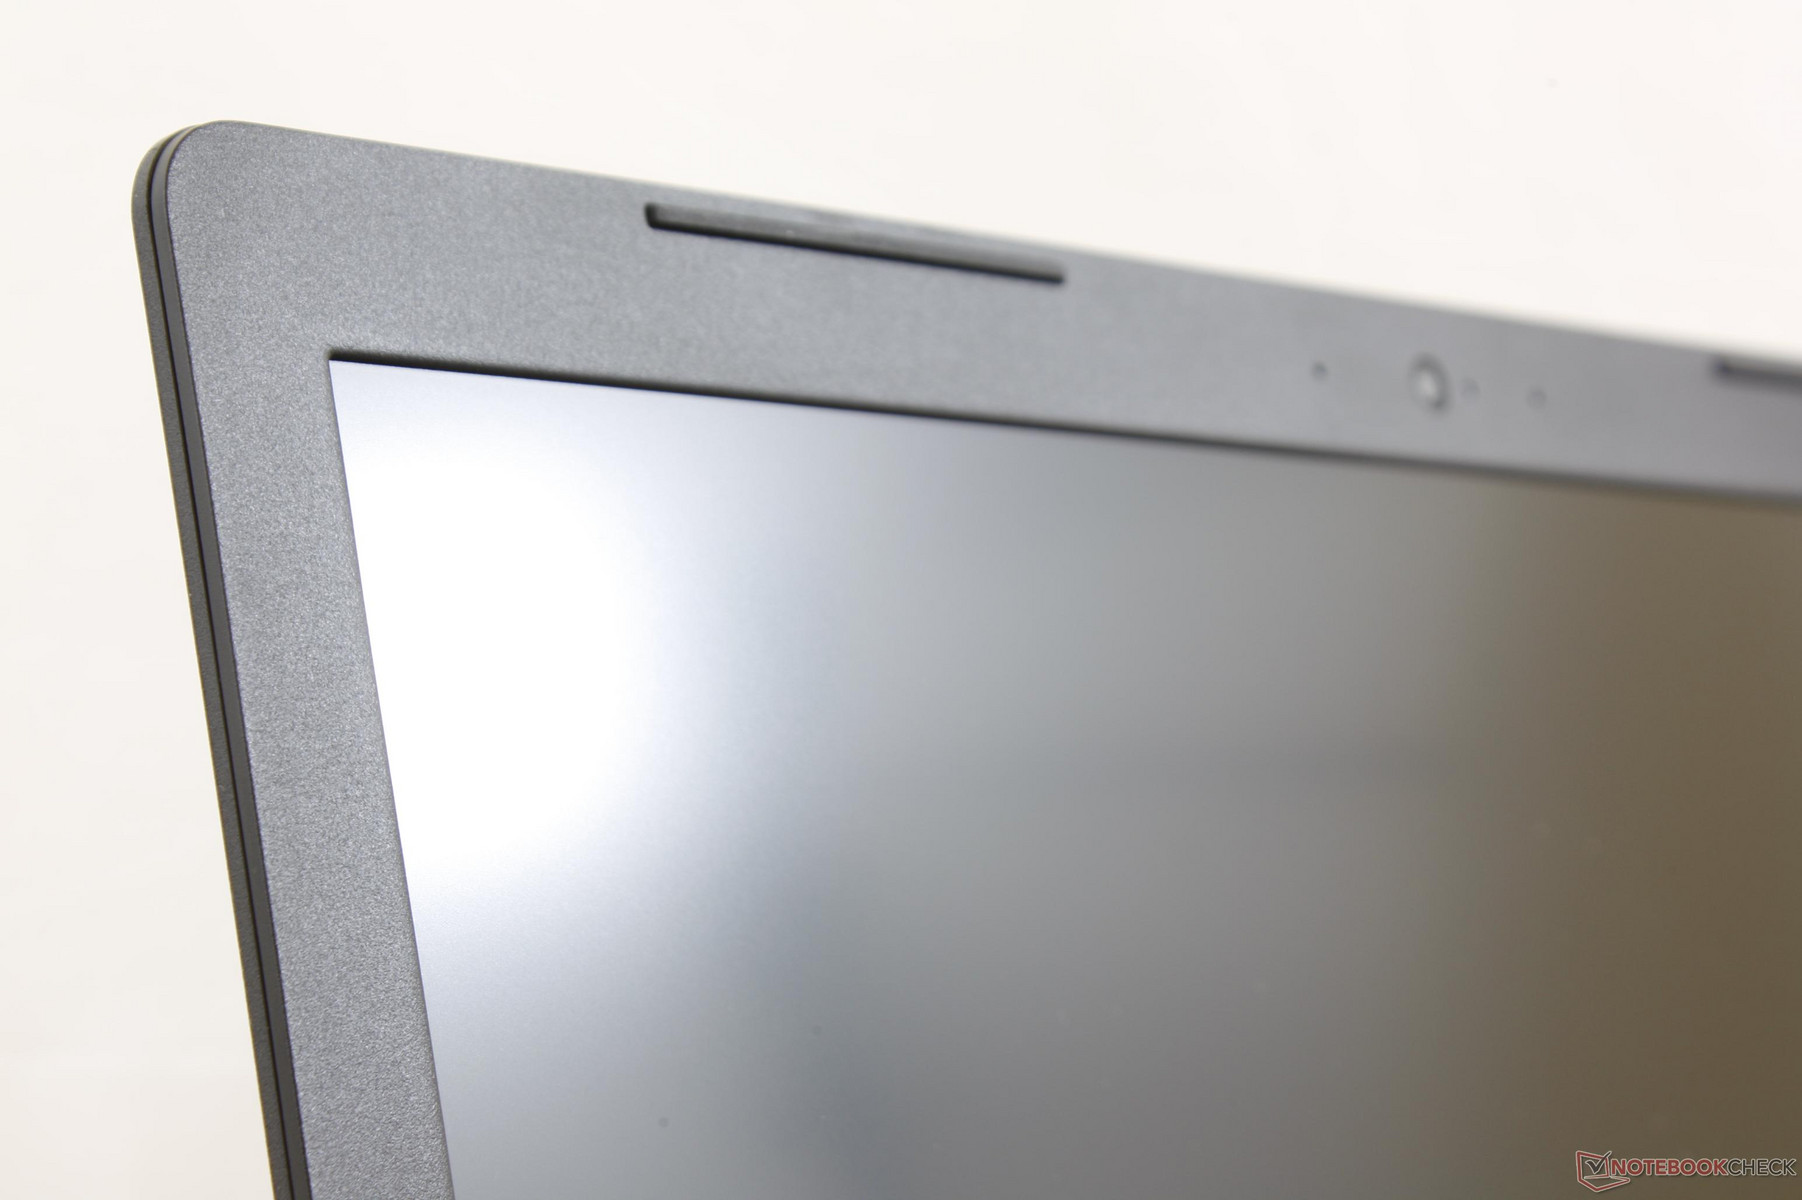
We're accustomed to smooth flat surfaces on nearly all Dell laptops including those from the Inspiron, Latitude, XPS, and Precision families. The Latitude 3590, however, bucks the trend by having rough plastic surfaces from top to bottom for a more budget impression. Gone are the magnesium alloy and carbon fiber makeup of the Latitude 5590 or XPS 15 to save on costs and the result is a visually stale matte design.
There are a couple of advantages for the plastic chassis. When compared to the traditionally white HP ProBook or XPS, the Latitude 3590 is able to mask fingerprints and smudges more easily. Scratches are also much less noticeable. Overall, however, the system is just slightly more flexible around both its base and lid while still promising MIL-STD 810G certification. Our particular test unit exhibits no unattended gaps or production defects.
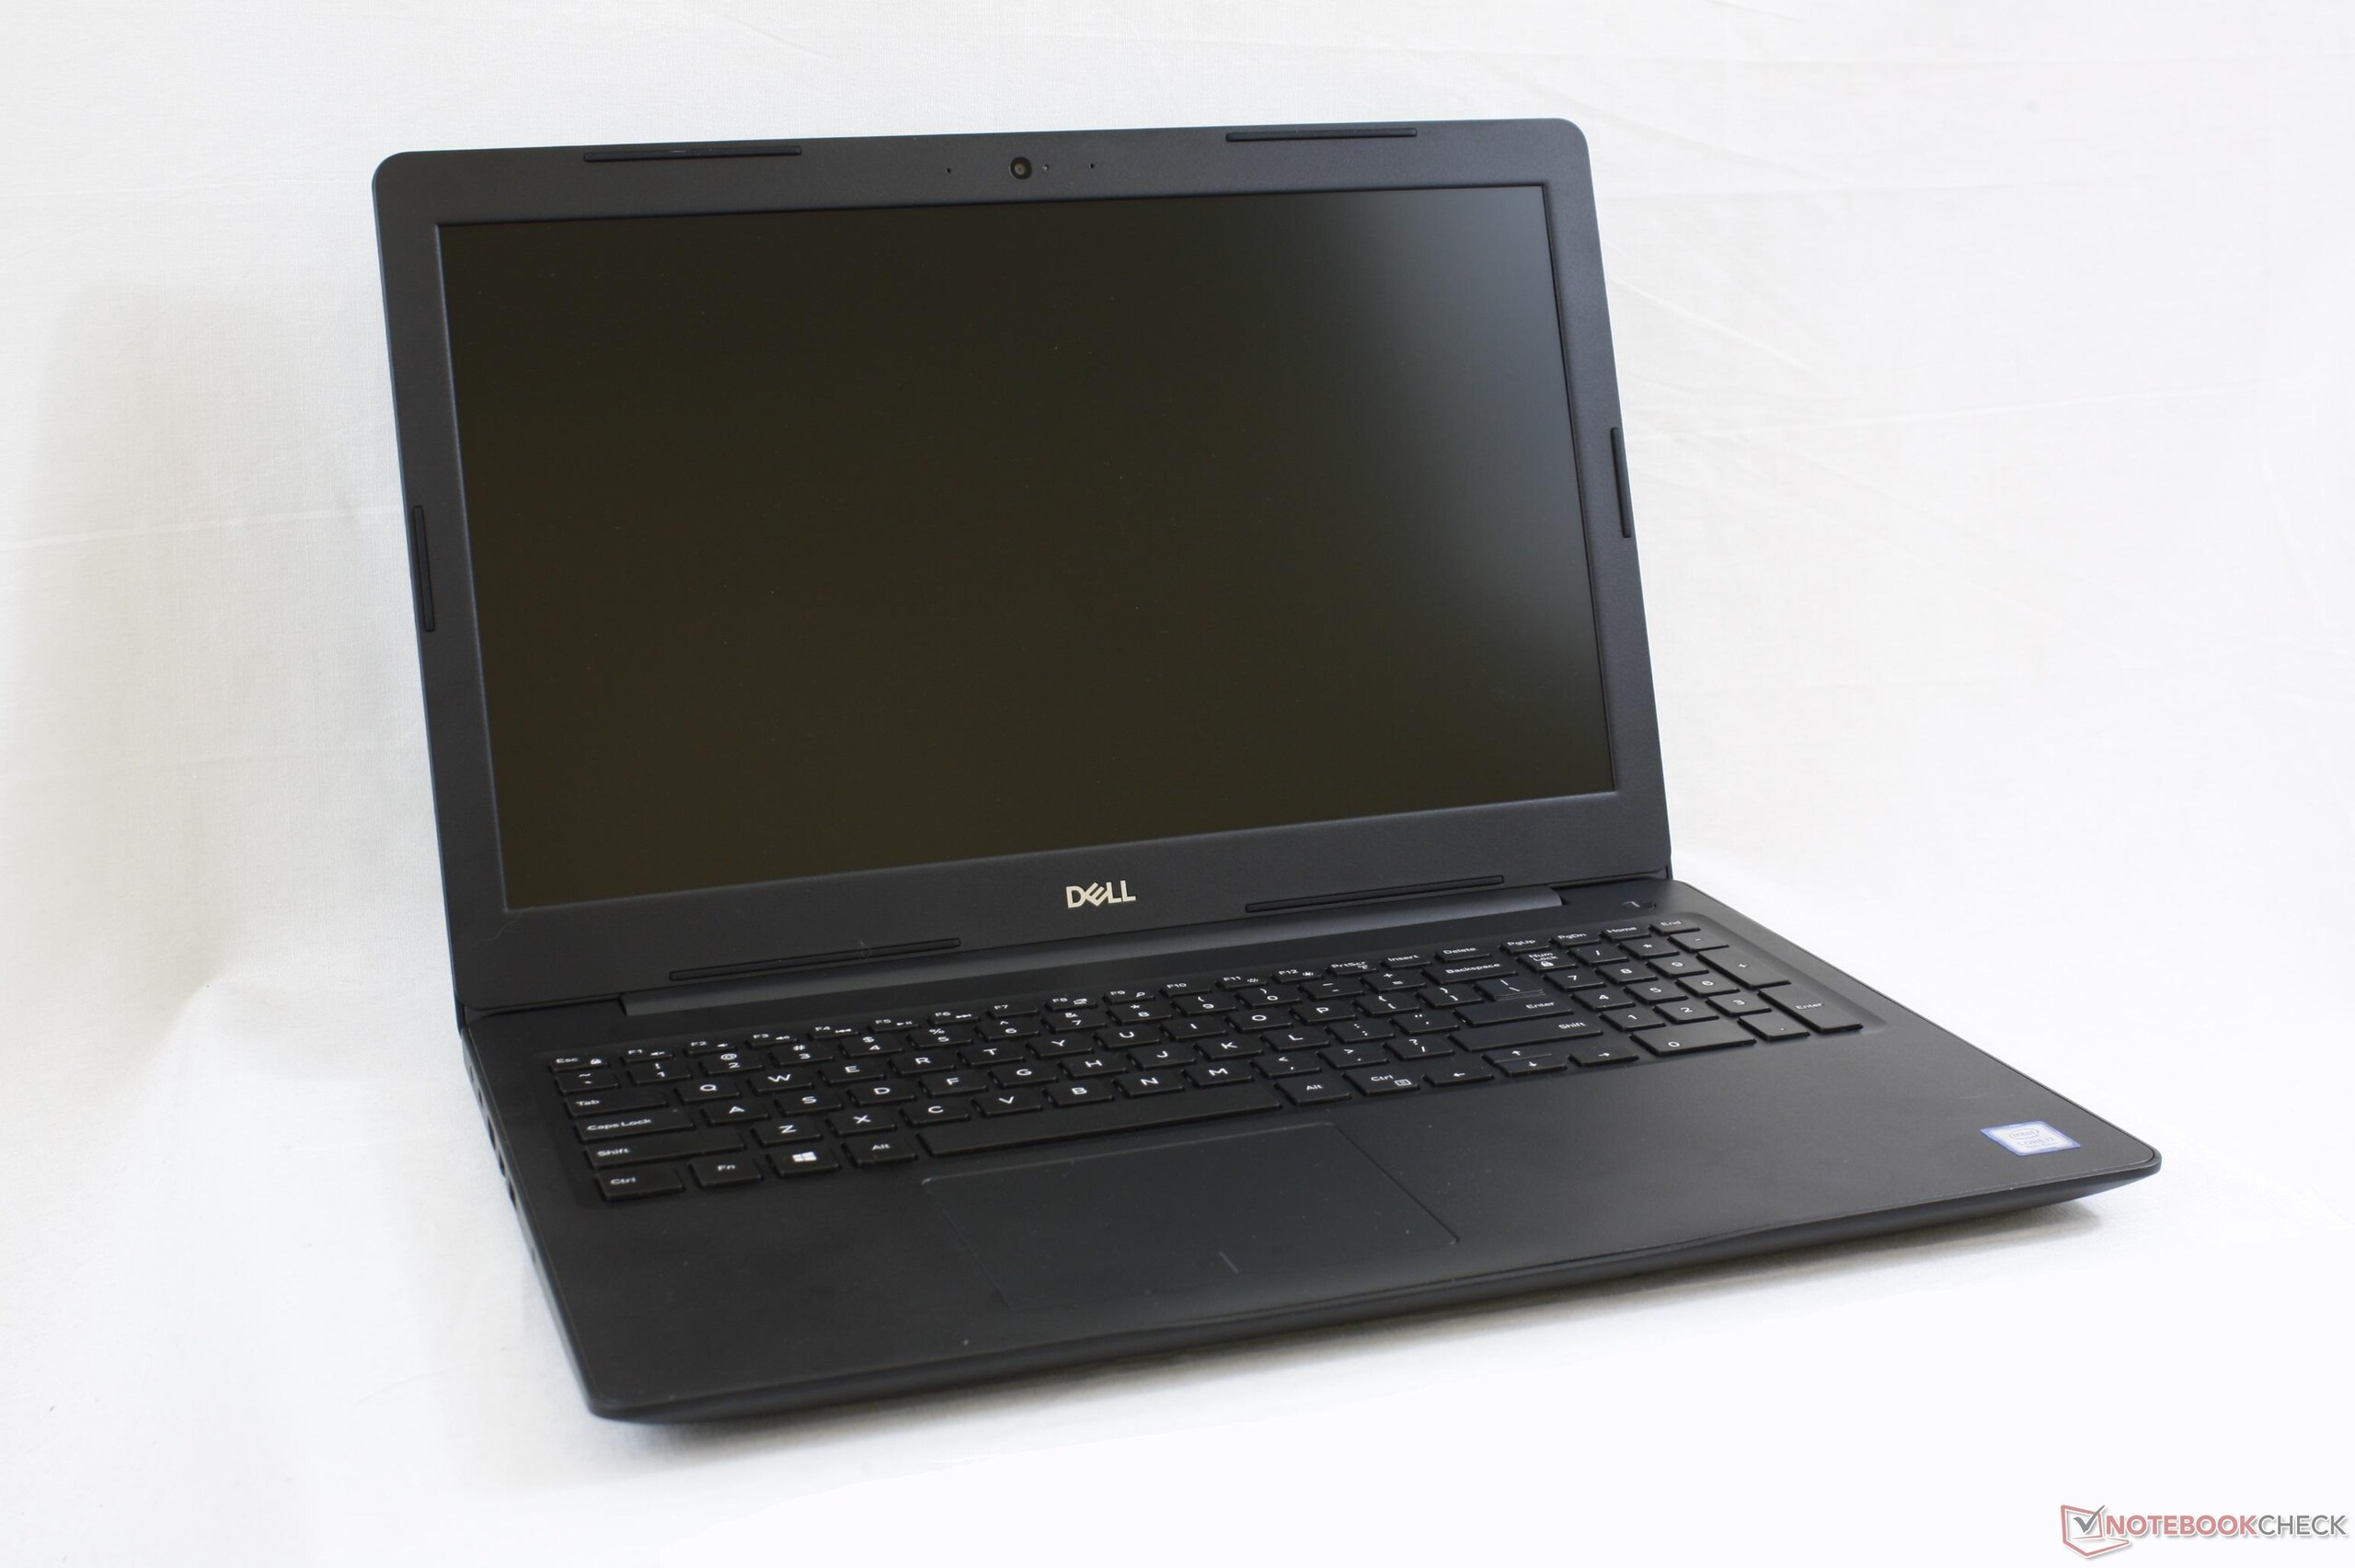
The size and weight of the system are very similar to other budget office laptops like the TravelMate P2510, HP ProBook 650 G4, or ThinkPad L580. In this regard, the Latitude 3590 does not particularly stand out from the competition in terms of visual appeal or portability. To the target office user, however, these factors may not be deal breakers. Users who want something more portable should consider the EliteBook 850 or consumer laptops with narrow-bezels like the XPS 15.
Connectivity
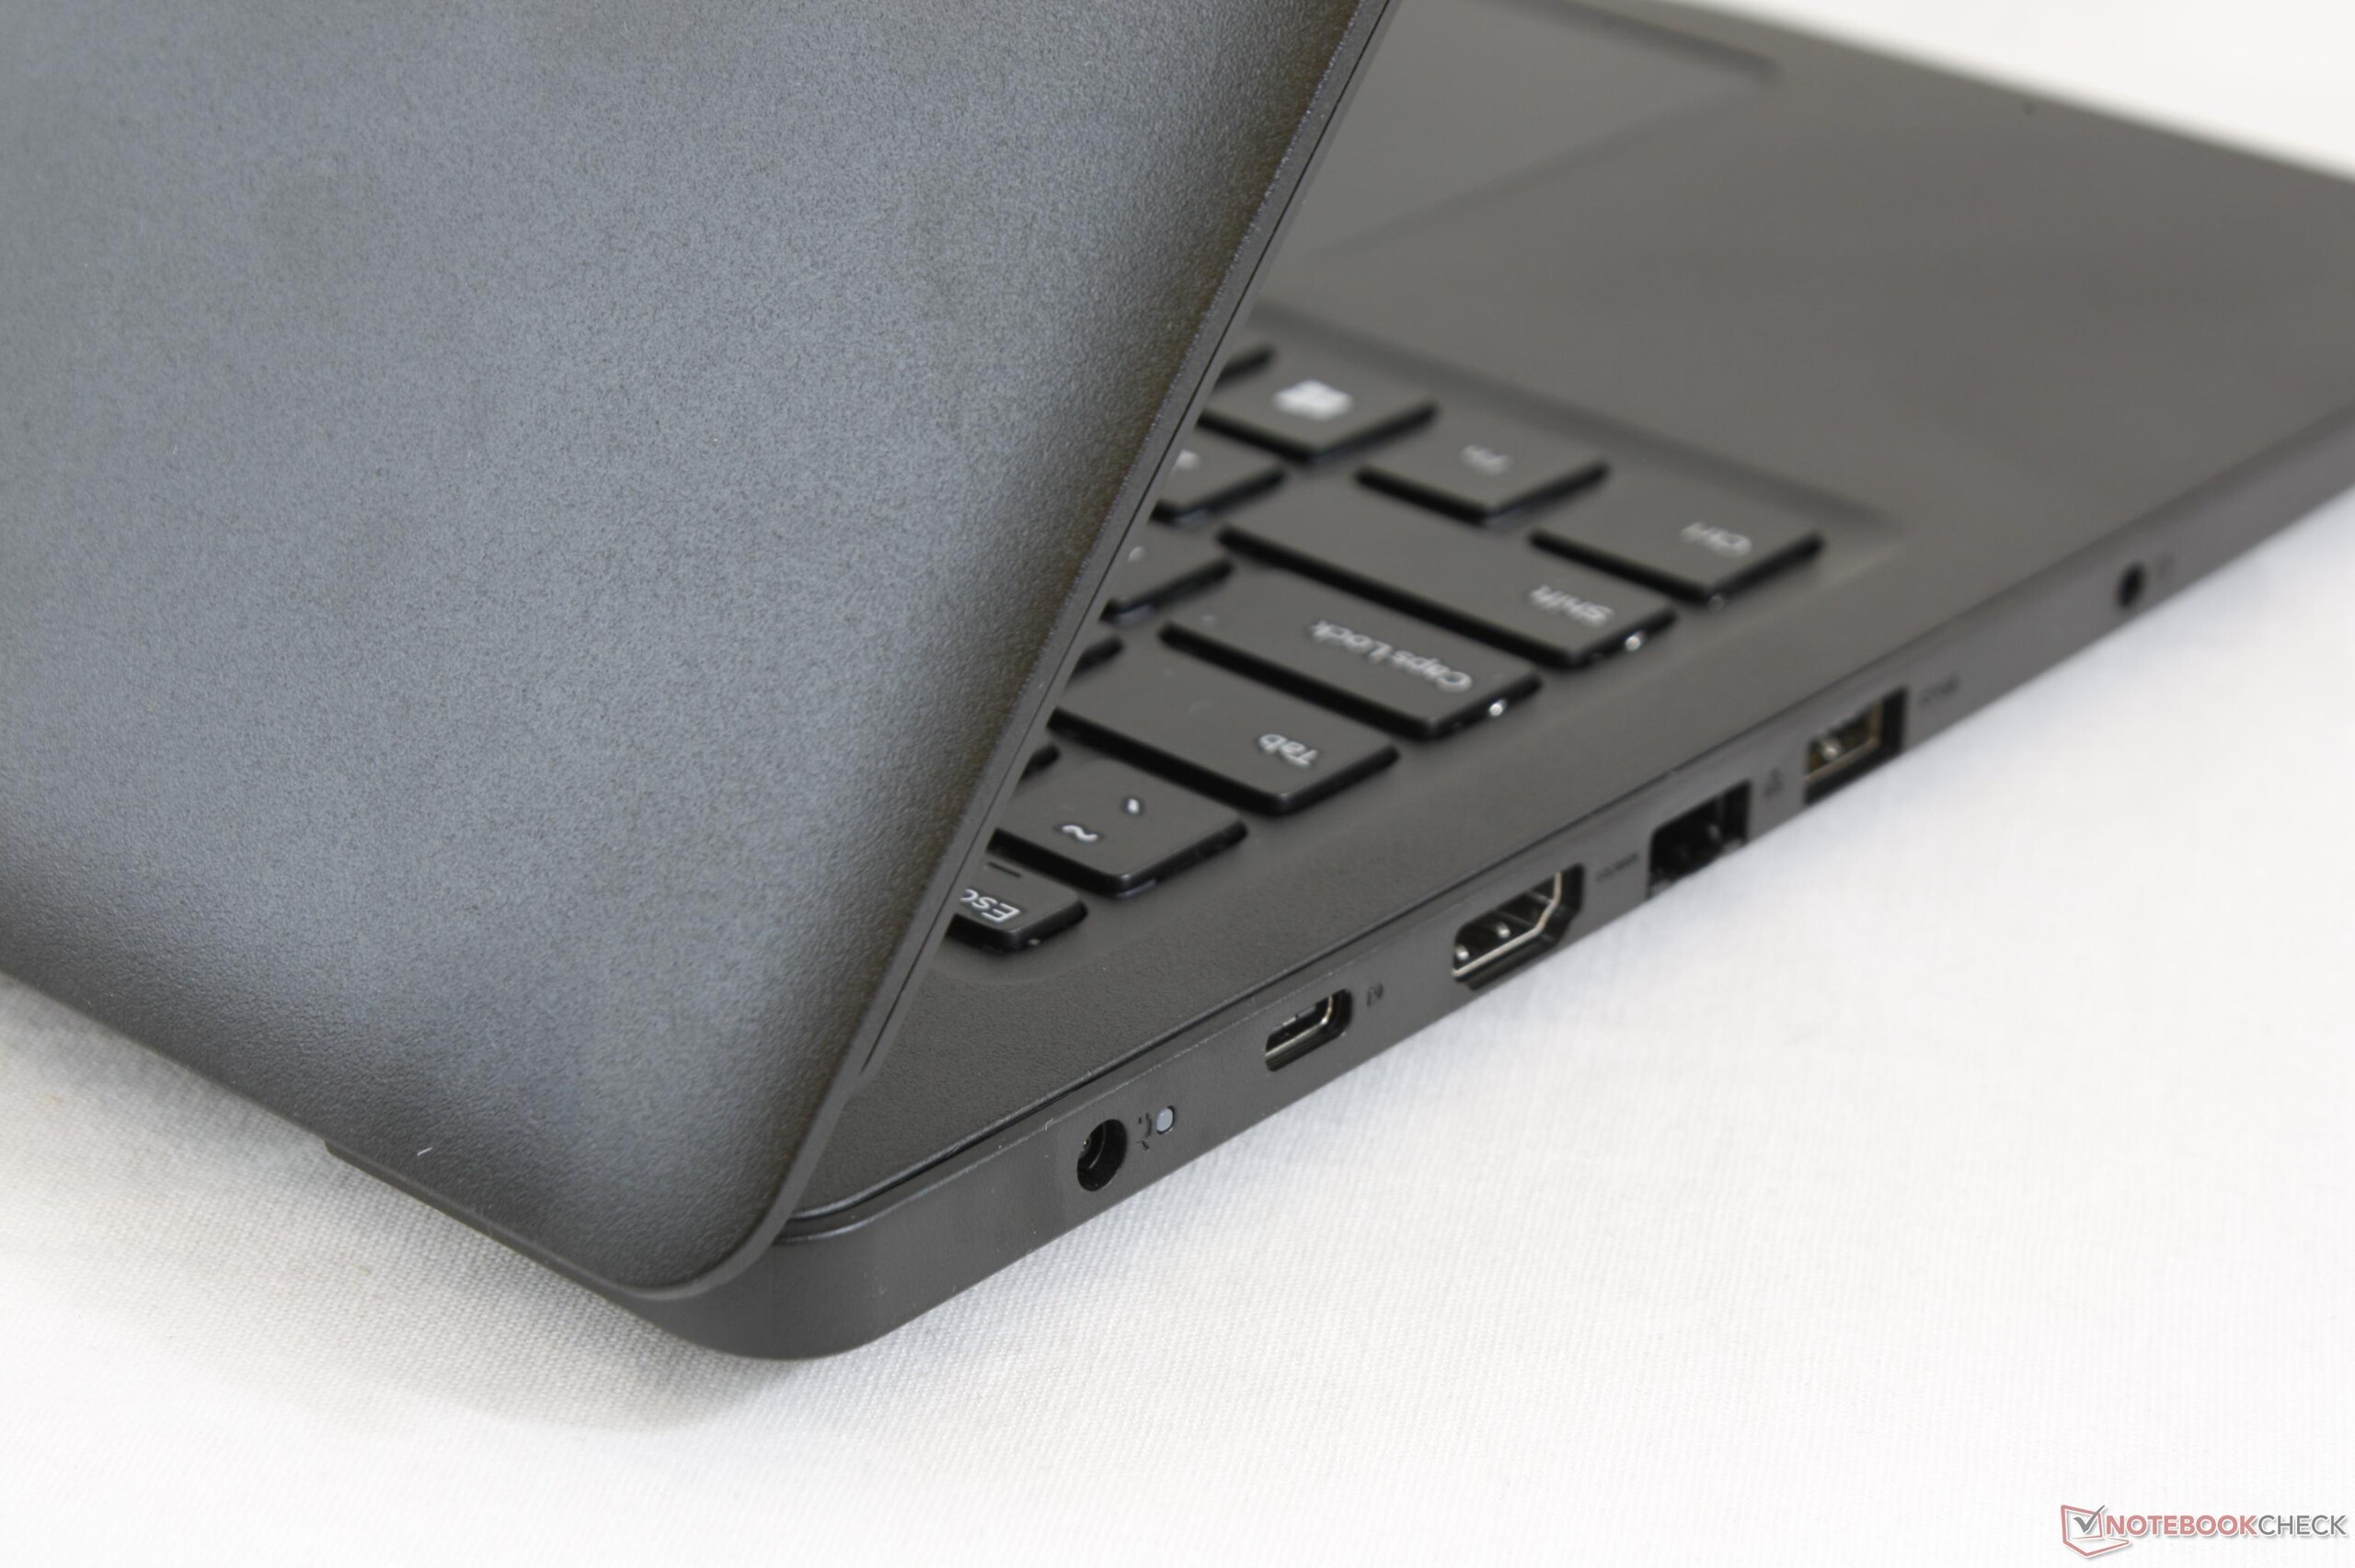
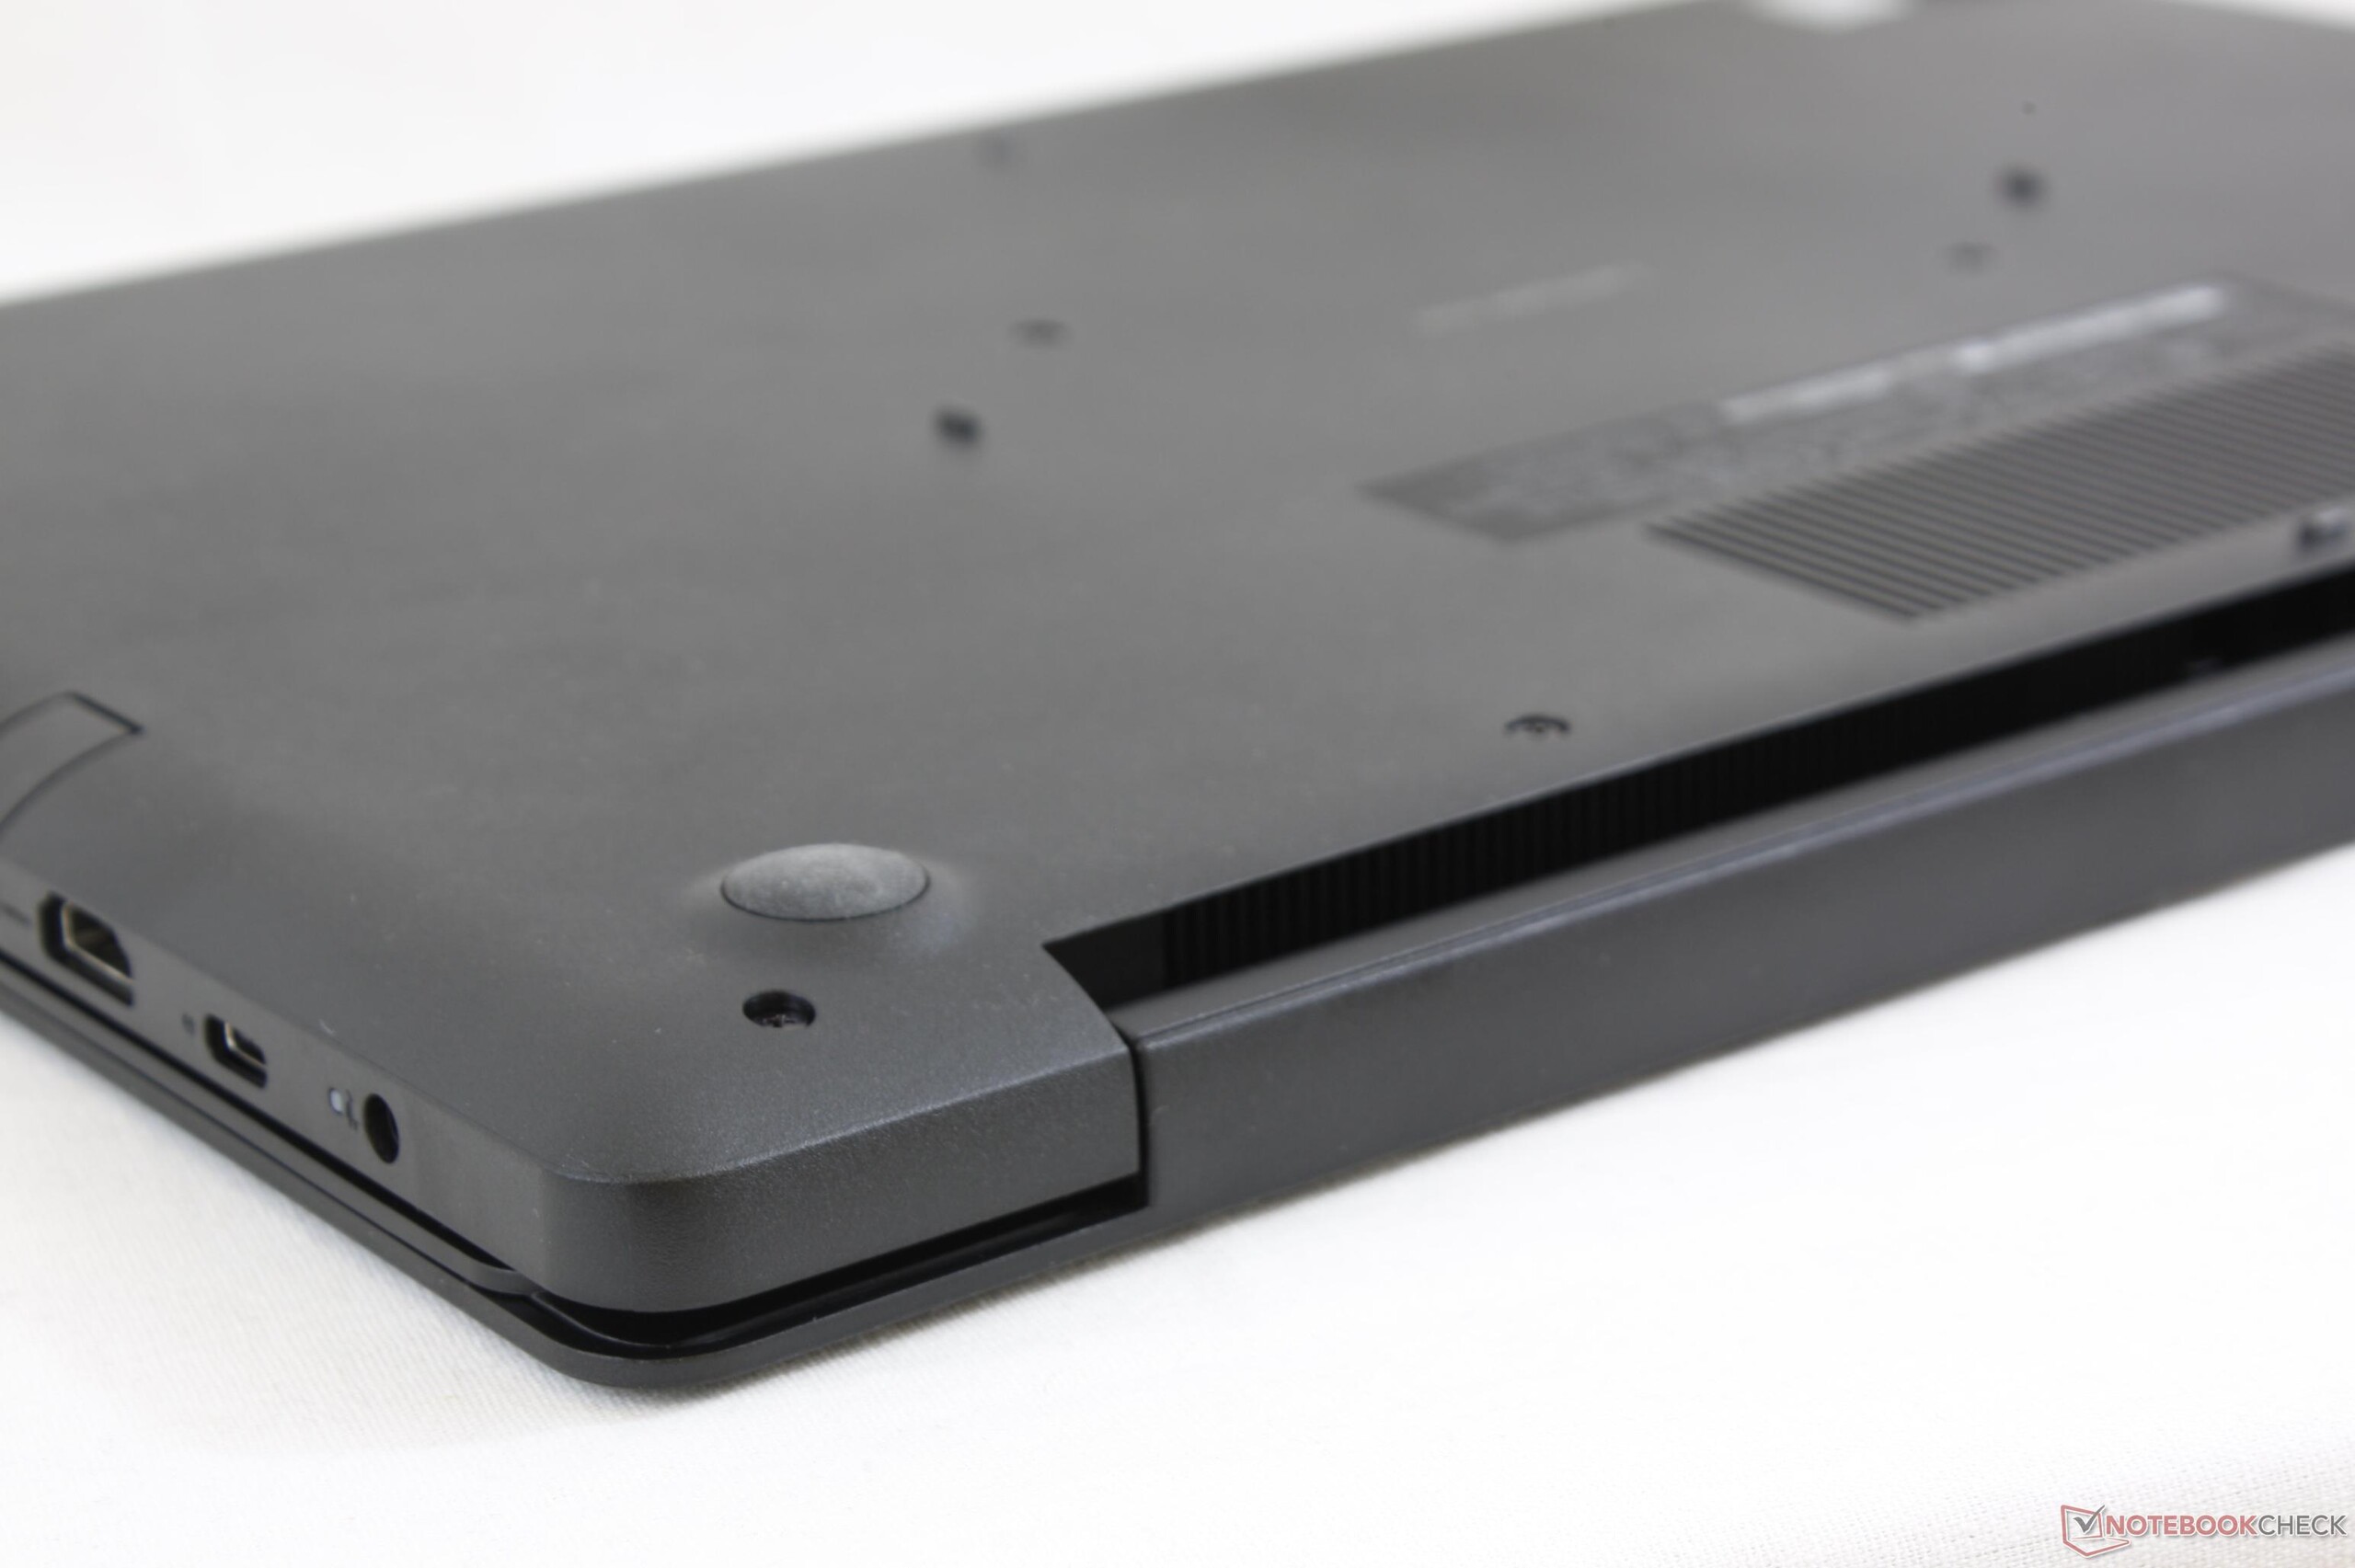
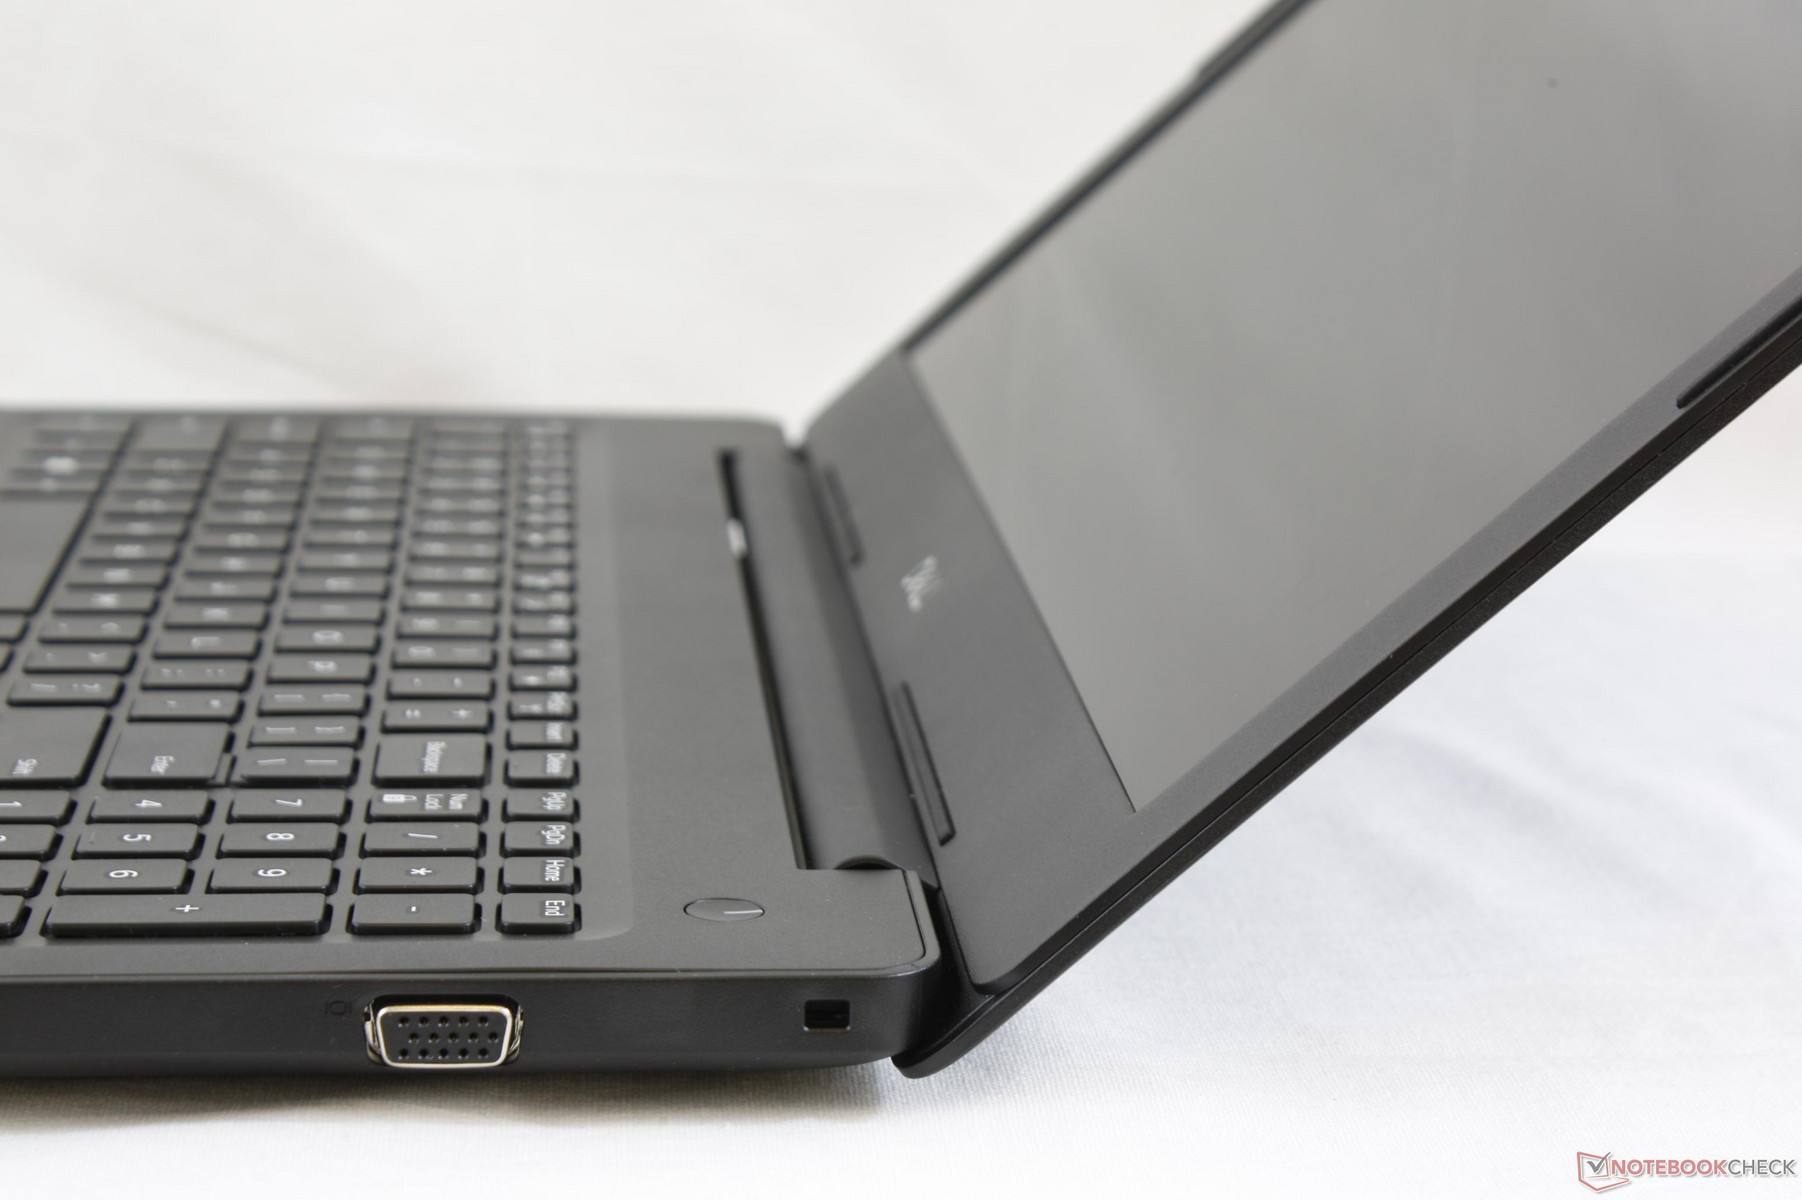
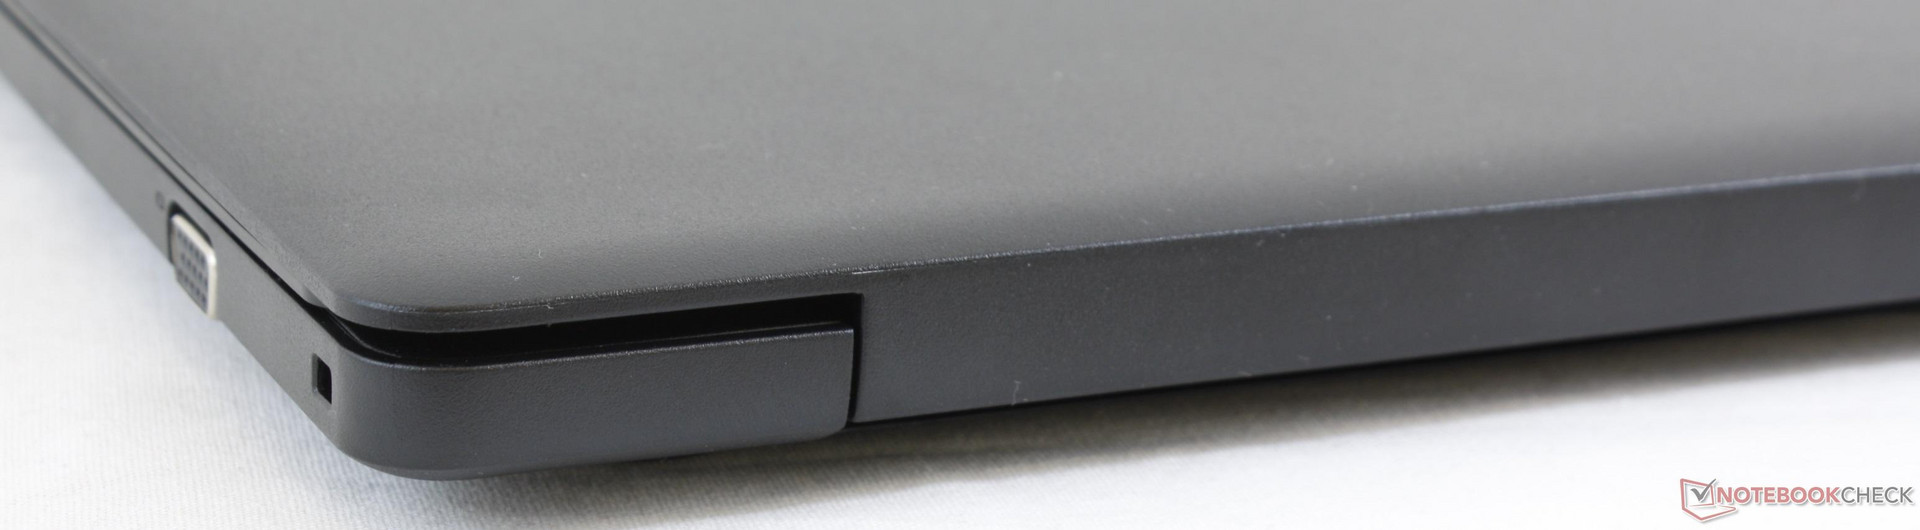
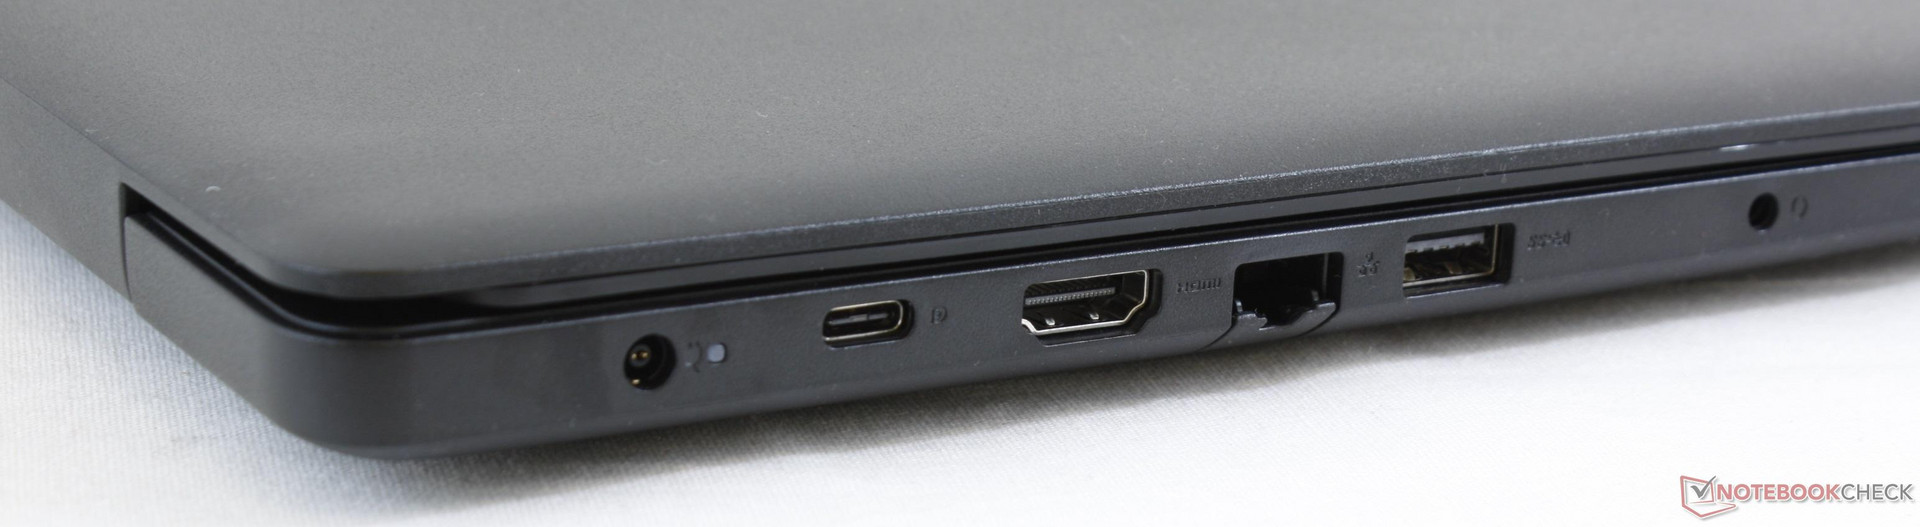
The most notable port is the aging VGA port that is becoming increasingly uncommon on newer business laptops. Otherwise, available ports are standard fare with an optional Micro-SIM slot on some SKUs. We're hoping that future models will incorporate USB Type-C charging in lieu of the proprietary AC adapter port like on most newer Ultrabooks.
Port positioning is good as all ports are easy to reach. A few ports are close to the front edge where cables can potentially get in the way on an external mouse.
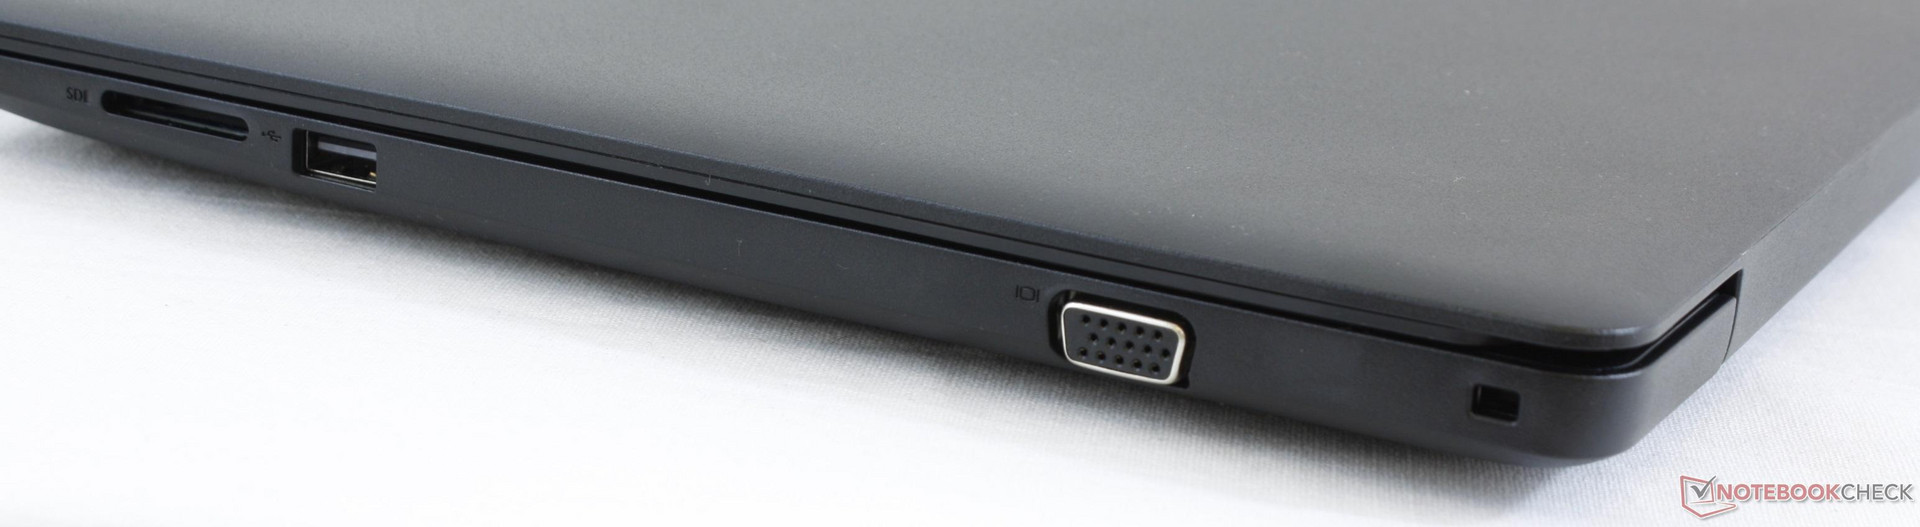
SD Card Reader
Transfer rates from the integrated card reader are slow. Moving 1 GB worth of images from our UHS-II test card to desktop takes about 40 seconds compared to just 6 or 7 seconds on the XPS 15.
The card reader is not spring-loaded as a fully inserted SD card still protrudes by about half its length.
| SD Card Reader | |
| average JPG Copy Test (av. of 3 runs) | |
| Dell XPS 15 9570 i7 UHD (Toshiba Exceria Pro SDXC 64 GB UHS-II) | |
| HP ProBook 650 G4 3UP57EA (Toshiba Exceria Pro M501 microSDXC 64GB) | |
| Dell Latitude 15 3590-K8JP (Toshiba Exceria Pro SDXC 64 GB UHS-II) | |
| maximum AS SSD Seq Read Test (1GB) | |
| Dell XPS 15 9570 i7 UHD (Toshiba Exceria Pro SDXC 64 GB UHS-II) | |
| HP ProBook 650 G4 3UP57EA (Toshiba Exceria Pro M501 microSDXC 64GB) | |
| Dell Latitude 15 3590-K8JP (Toshiba Exceria Pro SDXC 64 GB UHS-II) | |
Communication
We experienced no connectivity issues with the Qualcomm QCA6174 wireless. Options for an Intel 8265 module are also available if desired. For regular browsing or streaming, however, the default Qualcomm solution works just fine.
| Networking | |
| iperf3 transmit AX12 | |
| Dell XPS 15 9570 i7 UHD | |
| Dell Latitude 15 3590-K8JP | |
| HP ProBook 650 G4 3UP57EA | |
| iperf3 receive AX12 | |
| Dell Latitude 15 3590-K8JP | |
| HP ProBook 650 G4 3UP57EA | |
| Dell XPS 15 9570 i7 UHD | |
Security
All SKUs have TPM 2.0 and a suite of Dell security software including Client Command, Data Guardian, Encryption, Threat Defense, RSA SecurID Access, and more. Both the IR camera and fingerprint reader are optional extras.
Maintenance
The bottom panel is secured by 9 Philips screws and it is very tightly attached to the rest of the notebook around the edges and corners. Unlike the pricier Latitude 5000 or 7000 series, the 3590 makes servicing much more difficult. Consequently, making use of the 2x SODIMM slots and 2x storage bays is a cumbersome task.
Accessories and Warranty
There are no extras in the box outside of the AC adapter and warranty card.
Warranty options are extensive beyond the included one-year service. Dell offers up to five years of accidental damage protection and onsite troubleshooting for an additional fee.
Input Devices
Keyboard
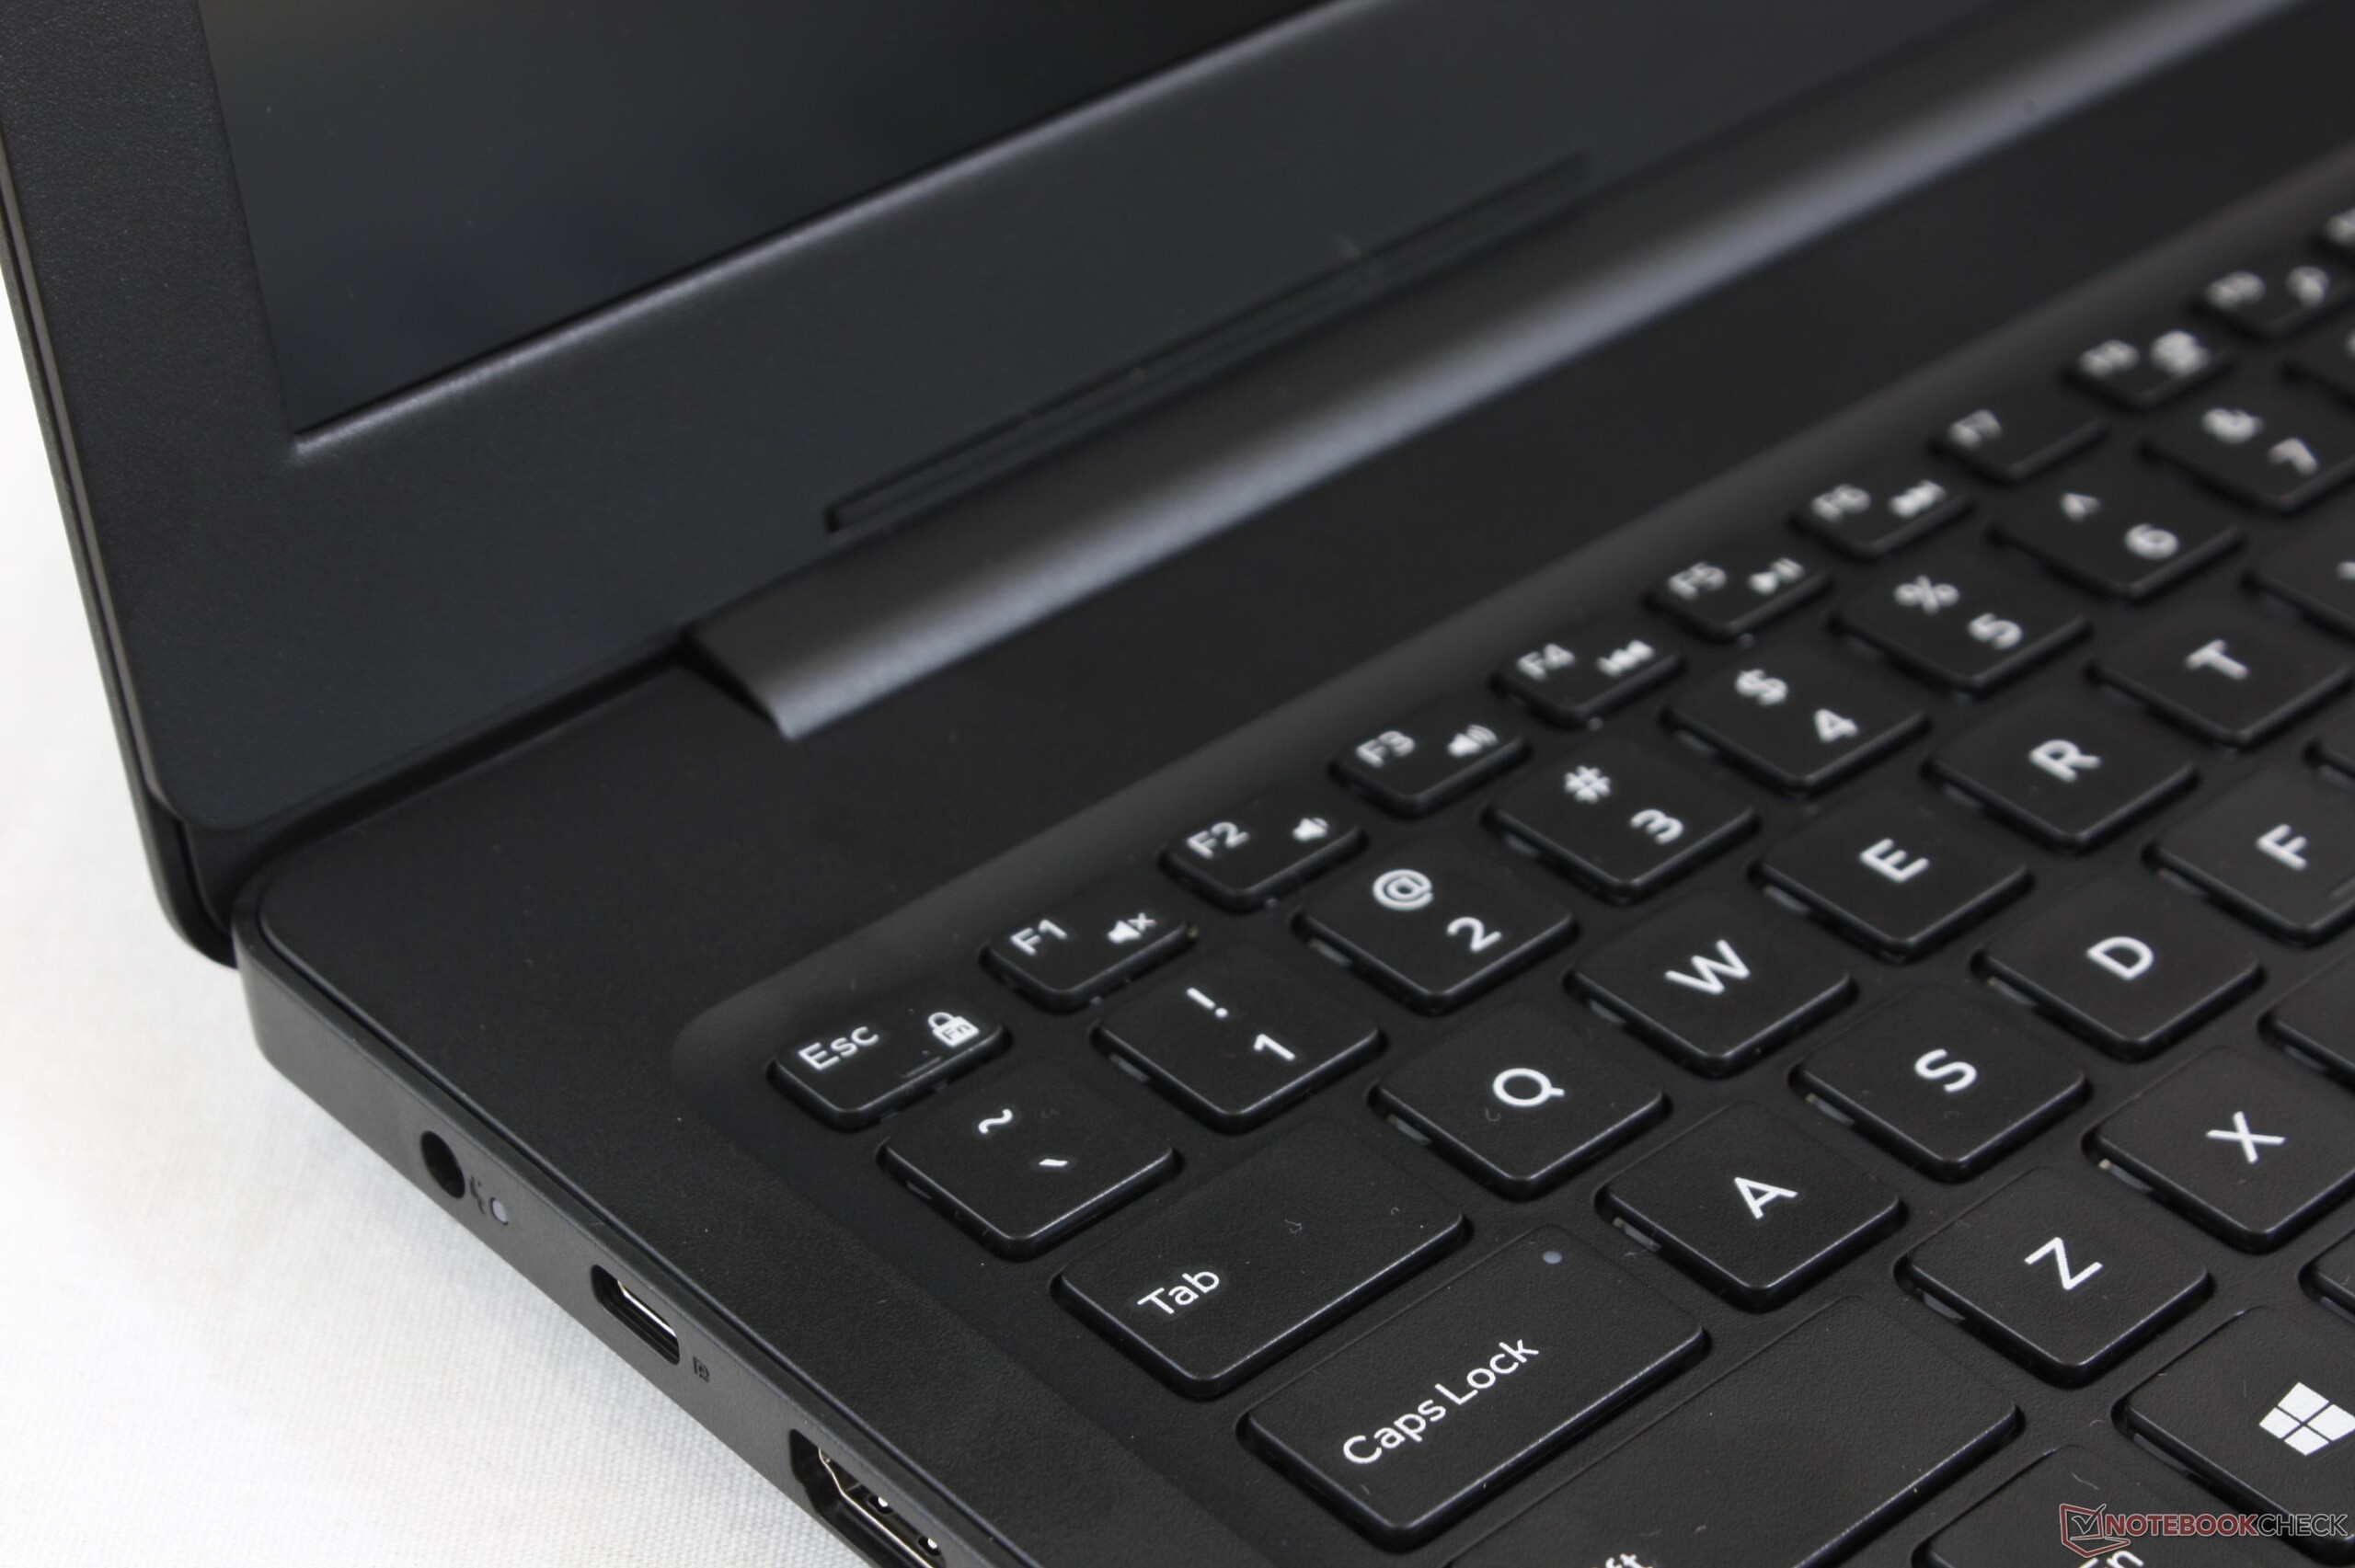
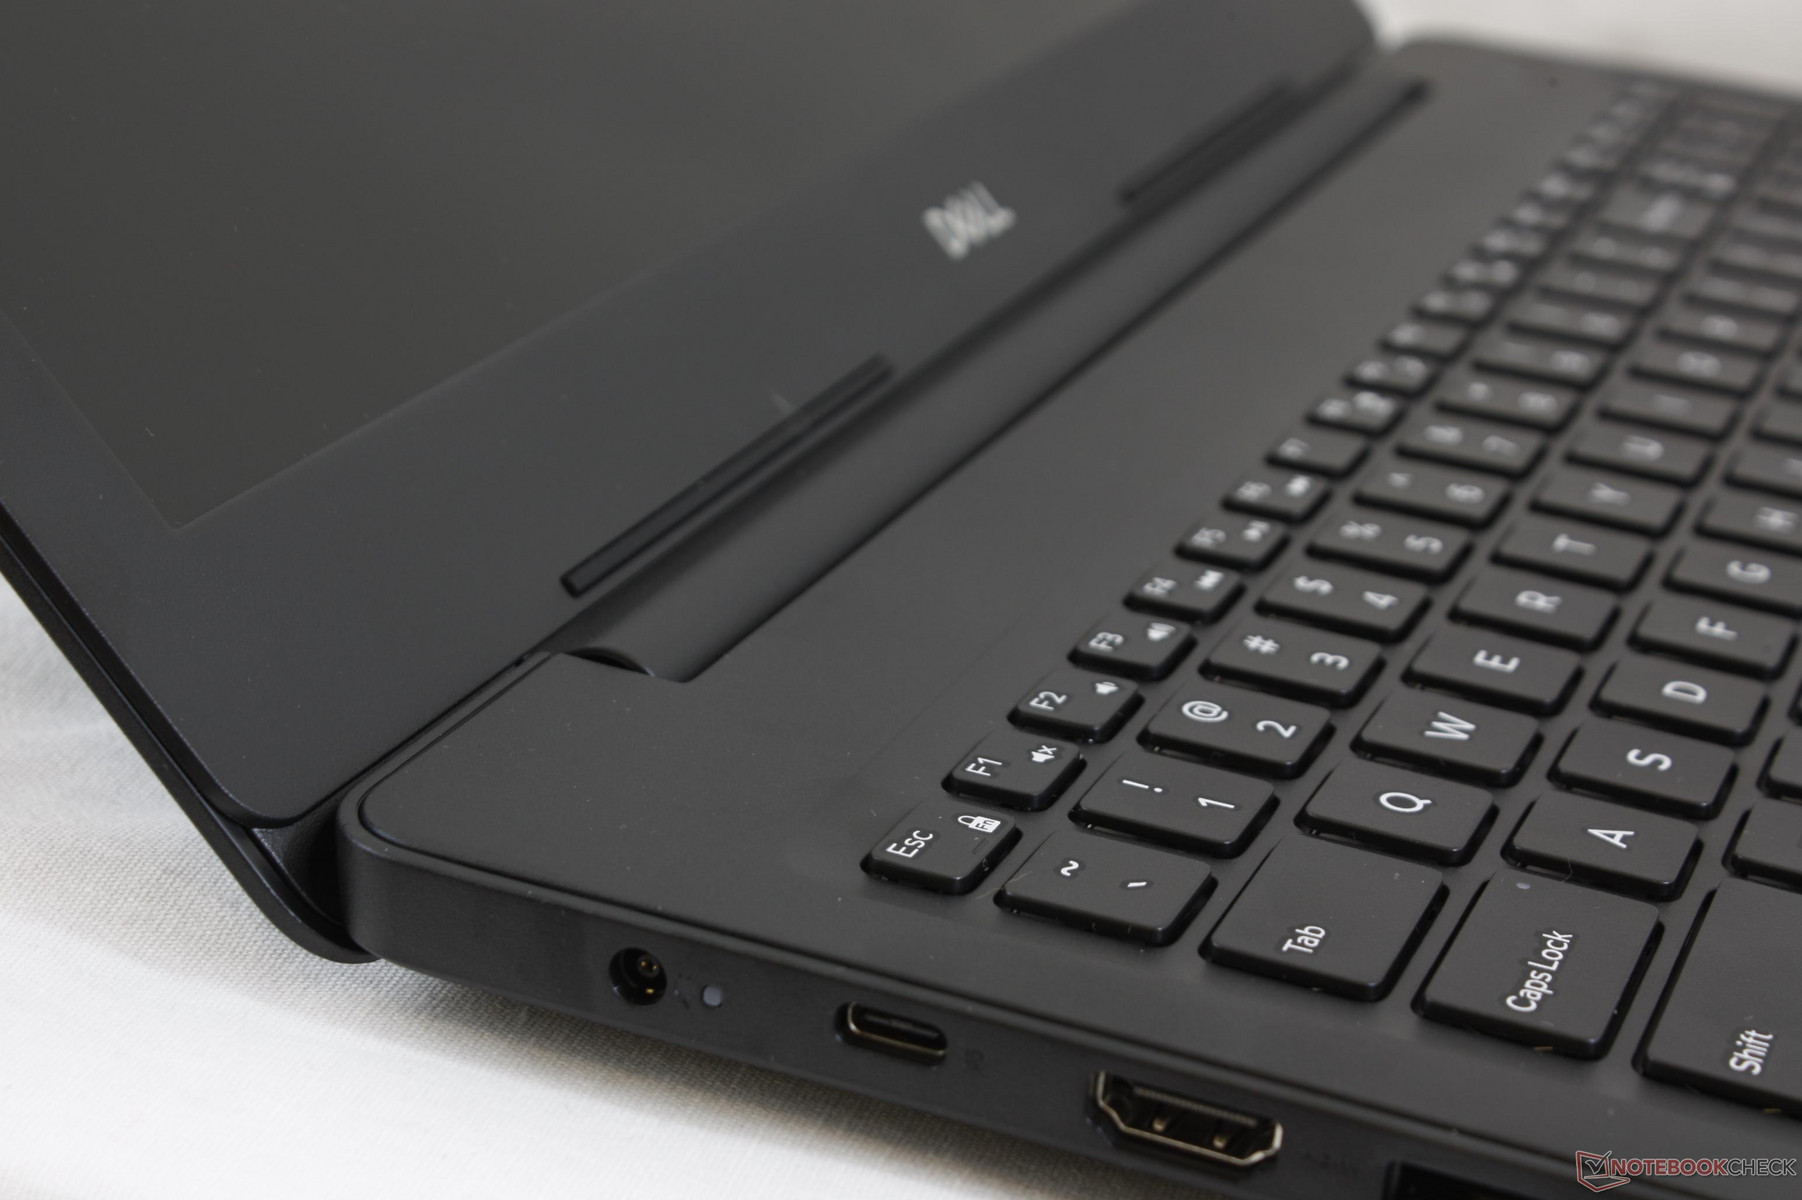
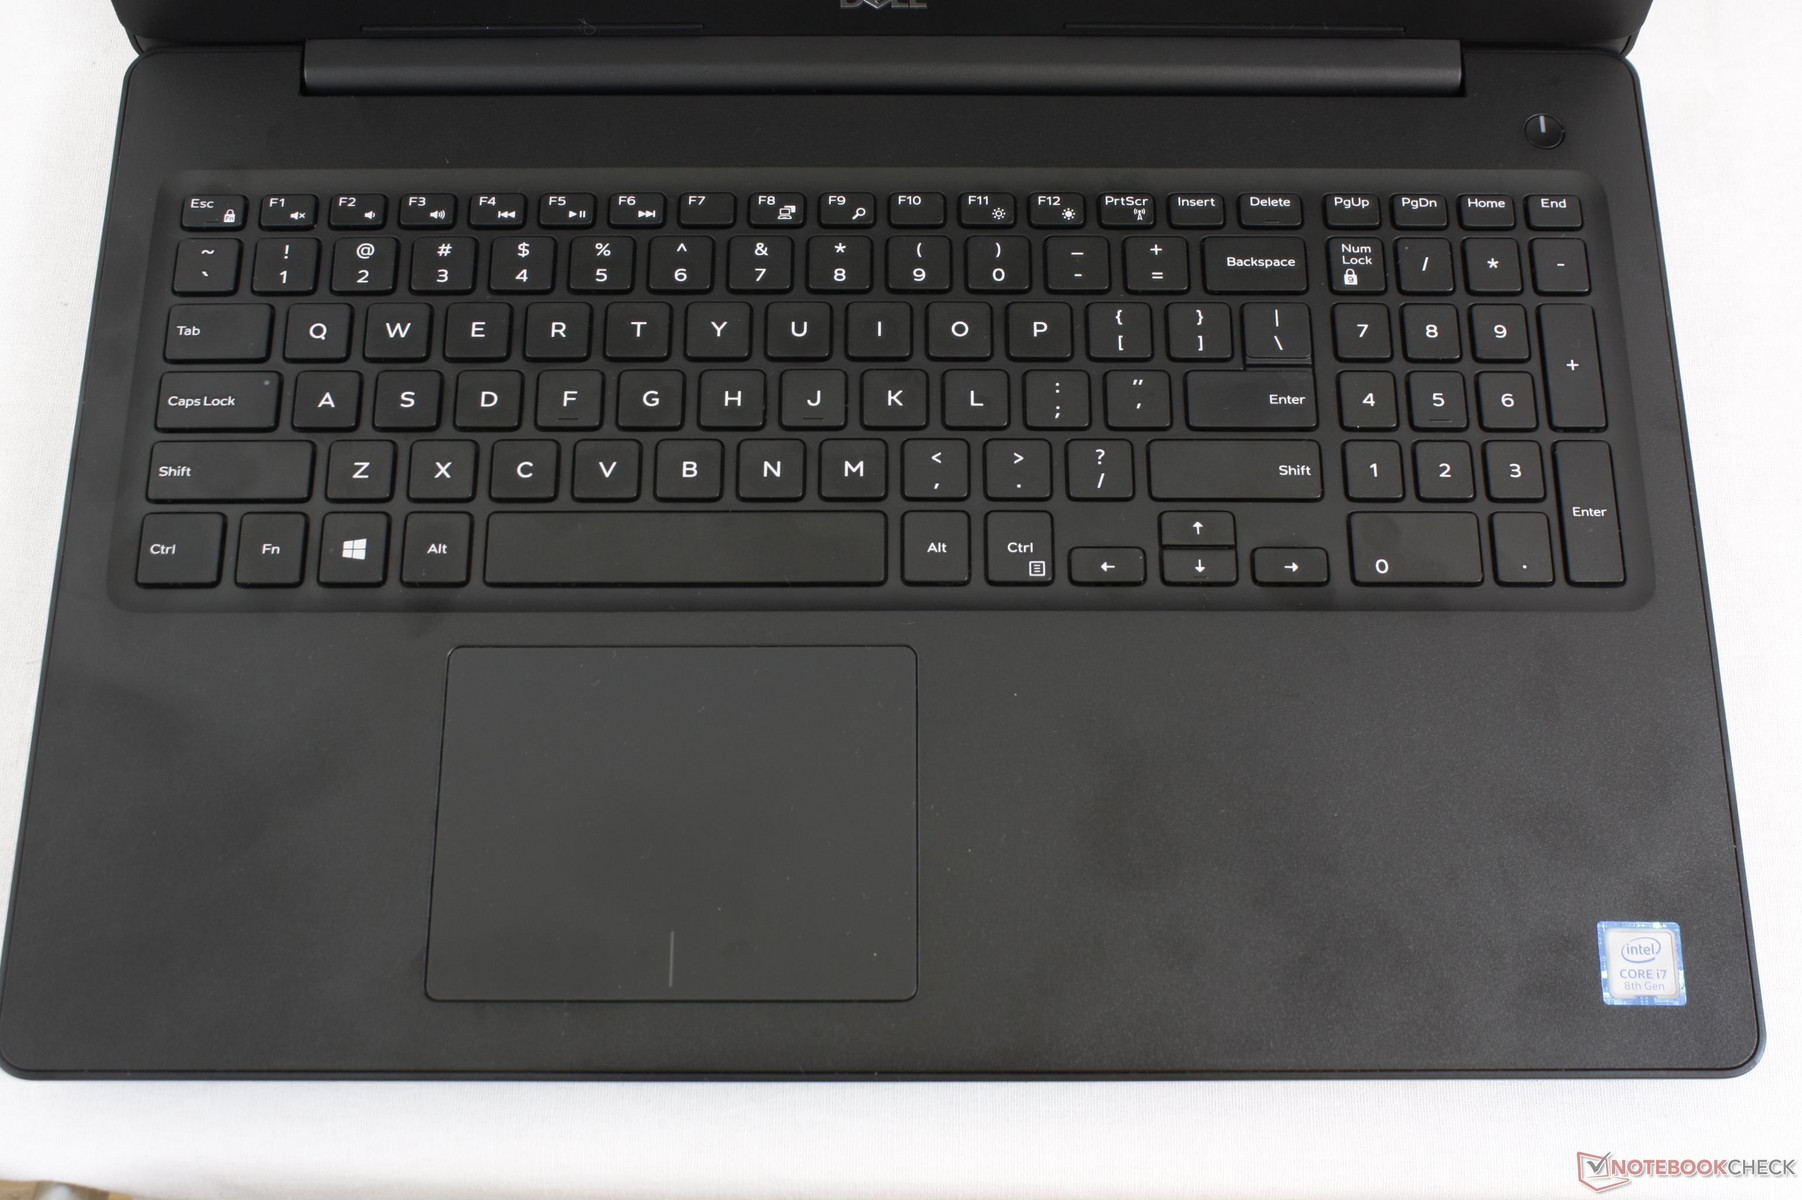
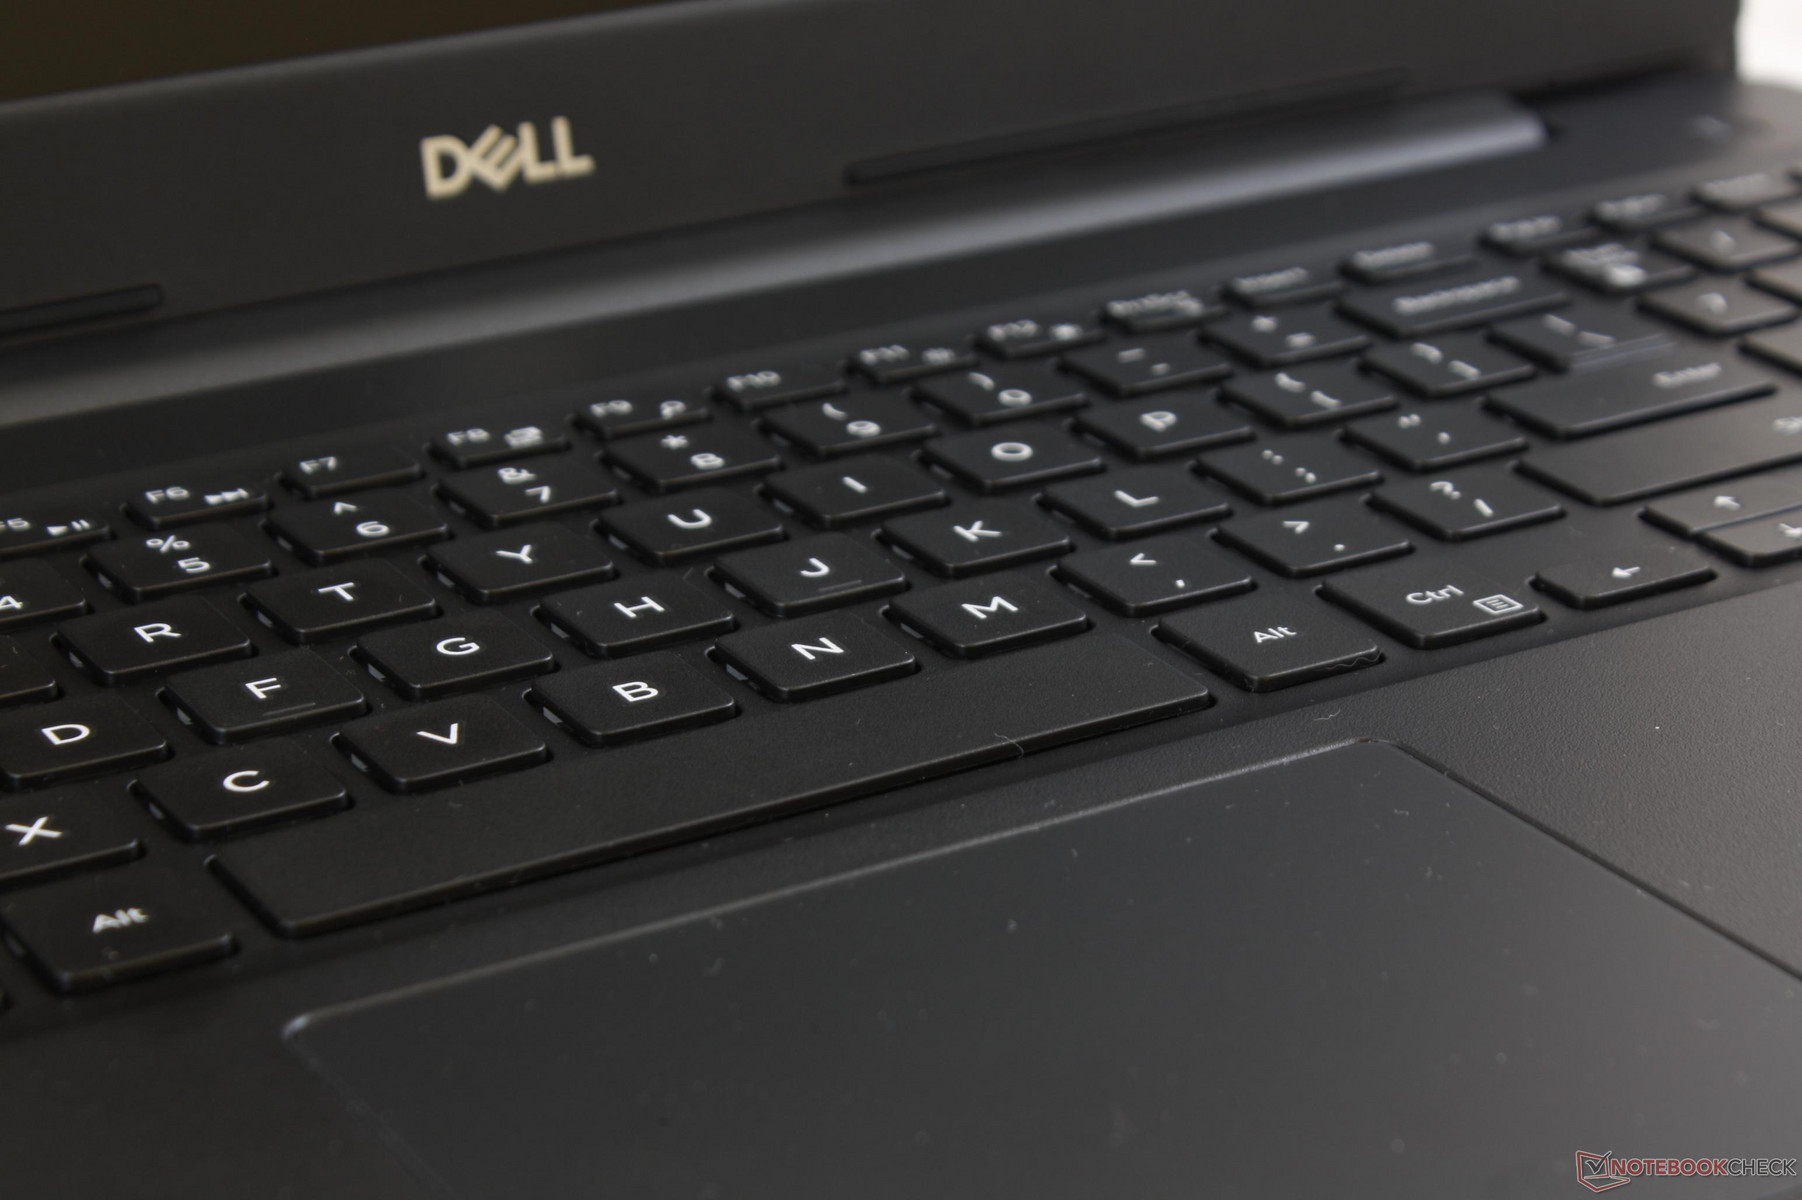
The non-backlit chiclet keyboard (~84 x 60.2 cm) has a cheaper look and feel when compared to newer Ultrabooks and pricier Latitude models. Key travel is very short and feedback is softer than what we are used to on the XPS 15. Key clatter is louder than the XPS as well due to the plastic chassis and more hollow design. The only notable exception is the Space key which has a more satisfying click and feel when pressed.
The NumPad keys are smaller than the main QWERTY keys, but they manage to have similar feedback and clatter regardless. In comparison, the competing HP ProBook 650 G4 fits a NumPad without reducing the size of the keys for a more uniform appearance.
Touchpad
The trackpad (10.5 x 8.0 cm) is of adequate size if not slightly smaller than the trackpad on the XPS 15 (10.5 x 8.5 cm). Unlike the rest of the notebook, its surface is smooth for excellent gliding properties and responsiveness. Short and slow cursor movements are easy to control.
The integrated mouse keys are reminiscent of inexpensive budget laptops. Travel is shallow and spongy for a cheap first impression. Interestingly enough, clatter is moderately loud despite the soft feedback when pressed.
Display
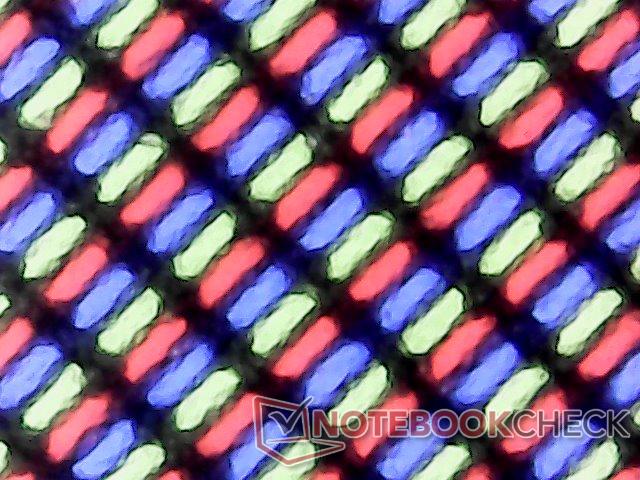
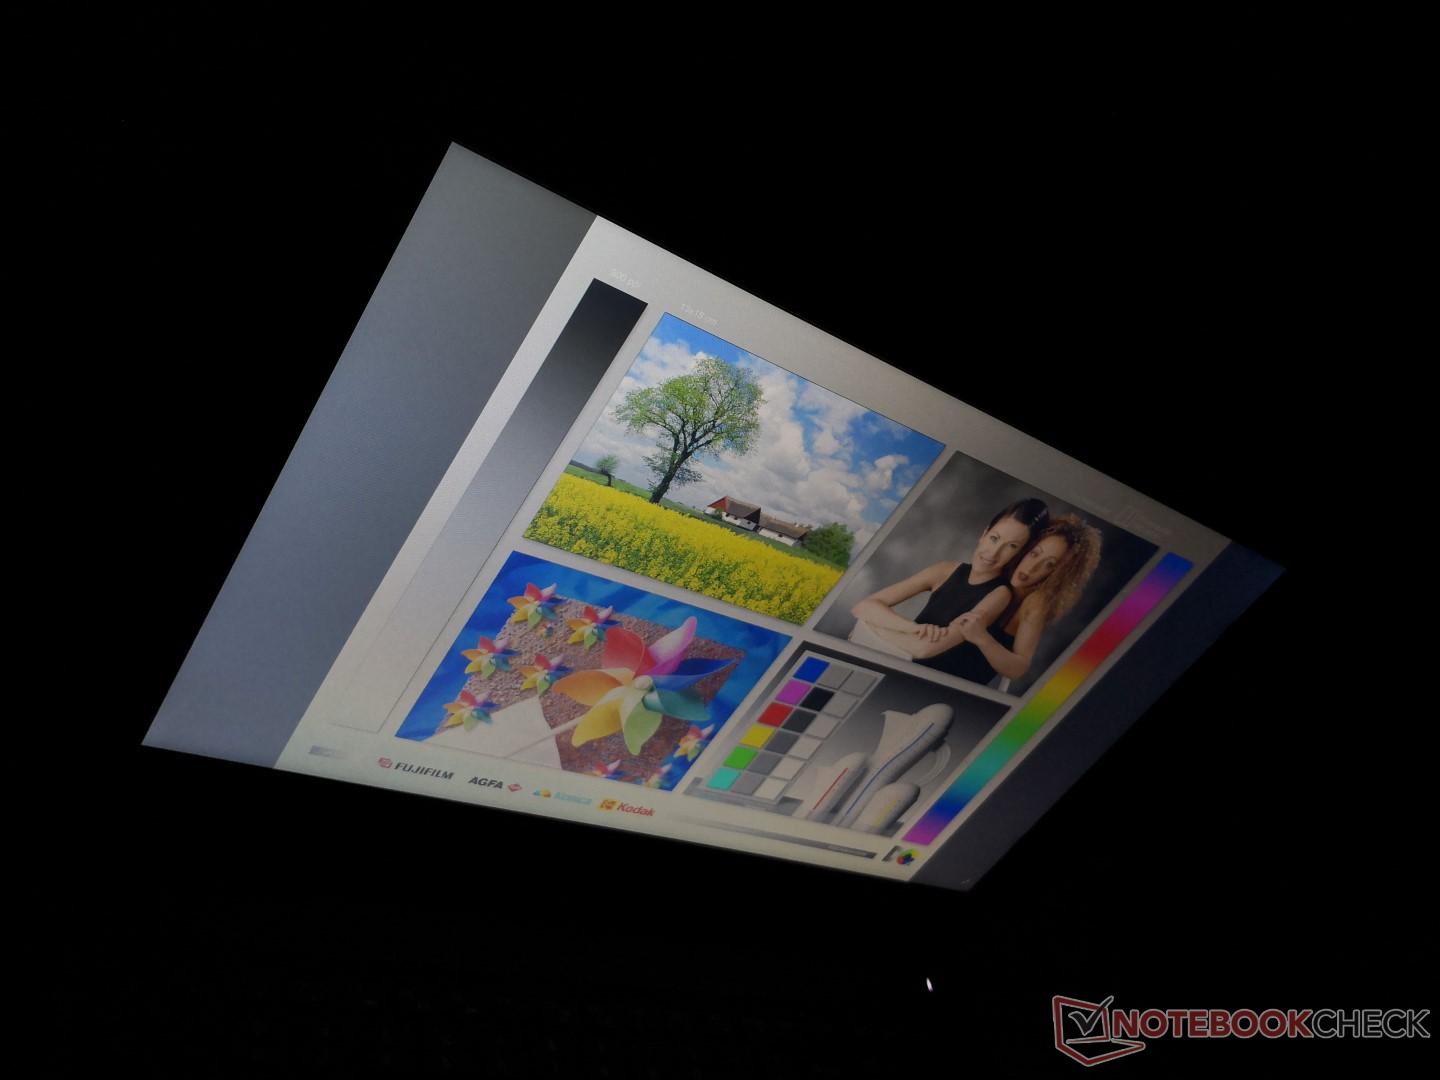
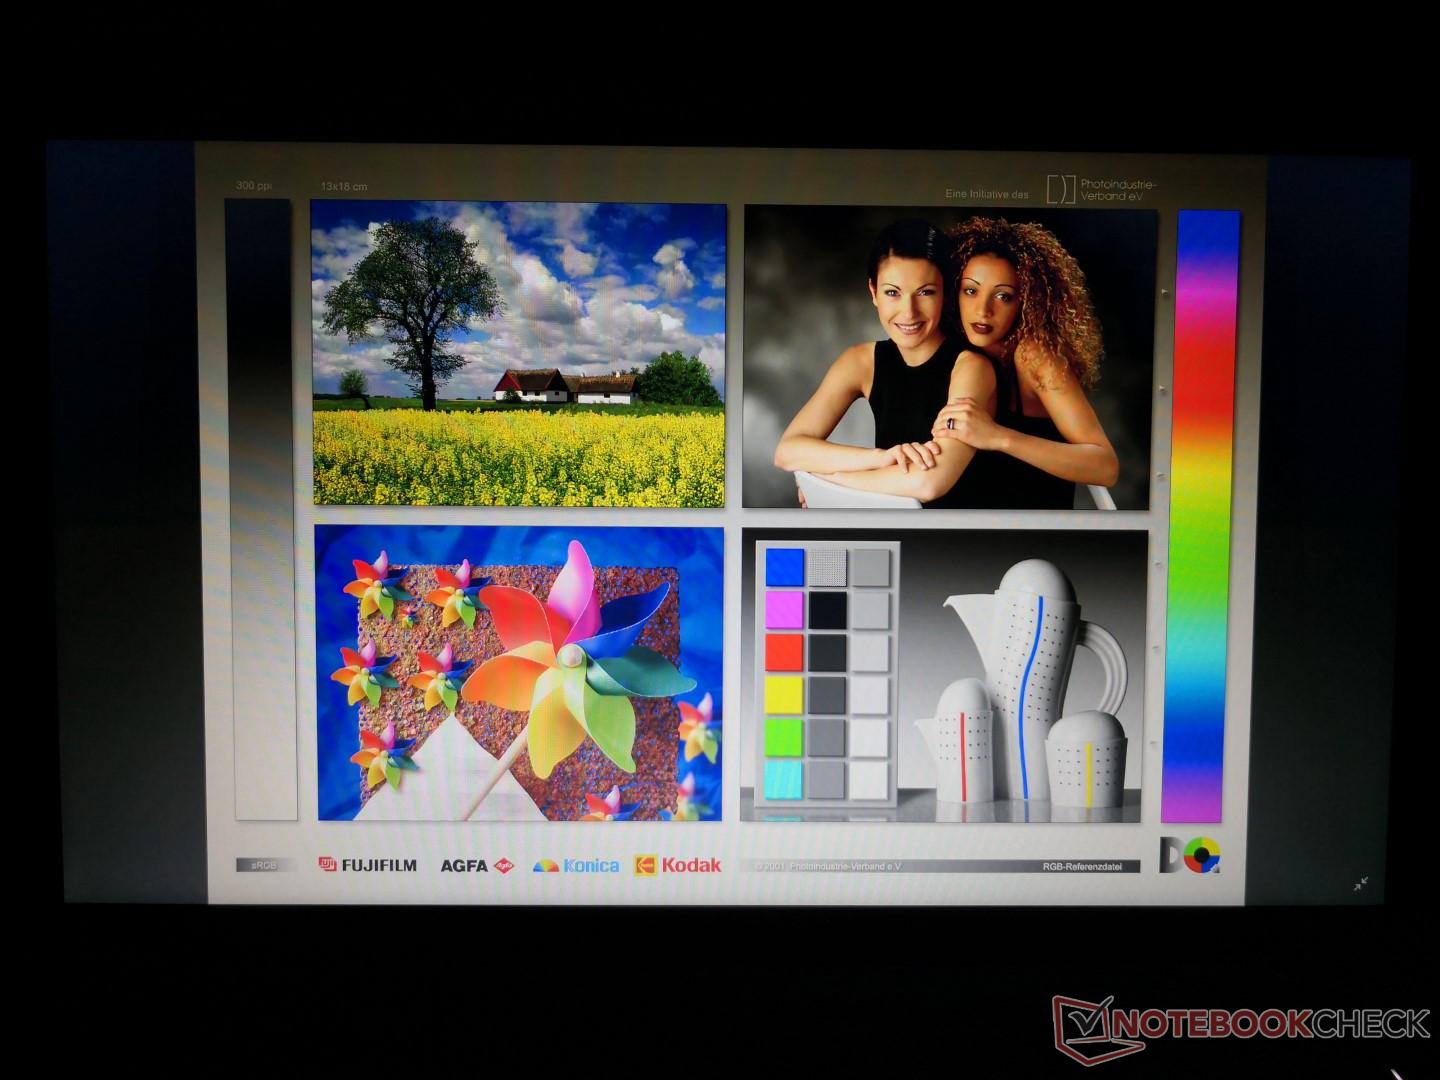
The Latitude 3590 utilizes a budget TN panel with seemingly no IPS options available. Contrast is poor, colors are muddy, backlight is relatively dim, and the matte panel is moderately grainy. Furthermore, it's fairly obvious that colors and grayscale are very poorly calibrated just by looking at the screen. The Asus FX550IU also uses the same AU Optronics AUO38ED panel as our Dell and so both systems share very similar display properties. Perhaps unsurprisingly, we found the display on the FX550IU to be one of the weakest aspects of the notebook.
Notable pluses about the display are its fast black-white response times for less ghosting when compared to most IPS panels and the lack of pulse-width modulation for brightness control. Still, this is an unremarkable display all around.
| |||||||||||||||||||||||||
Brightness Distribution: 85 %
Center on Battery: 229.9 cd/m²
Contrast: 451:1 (Black: 0.51 cd/m²)
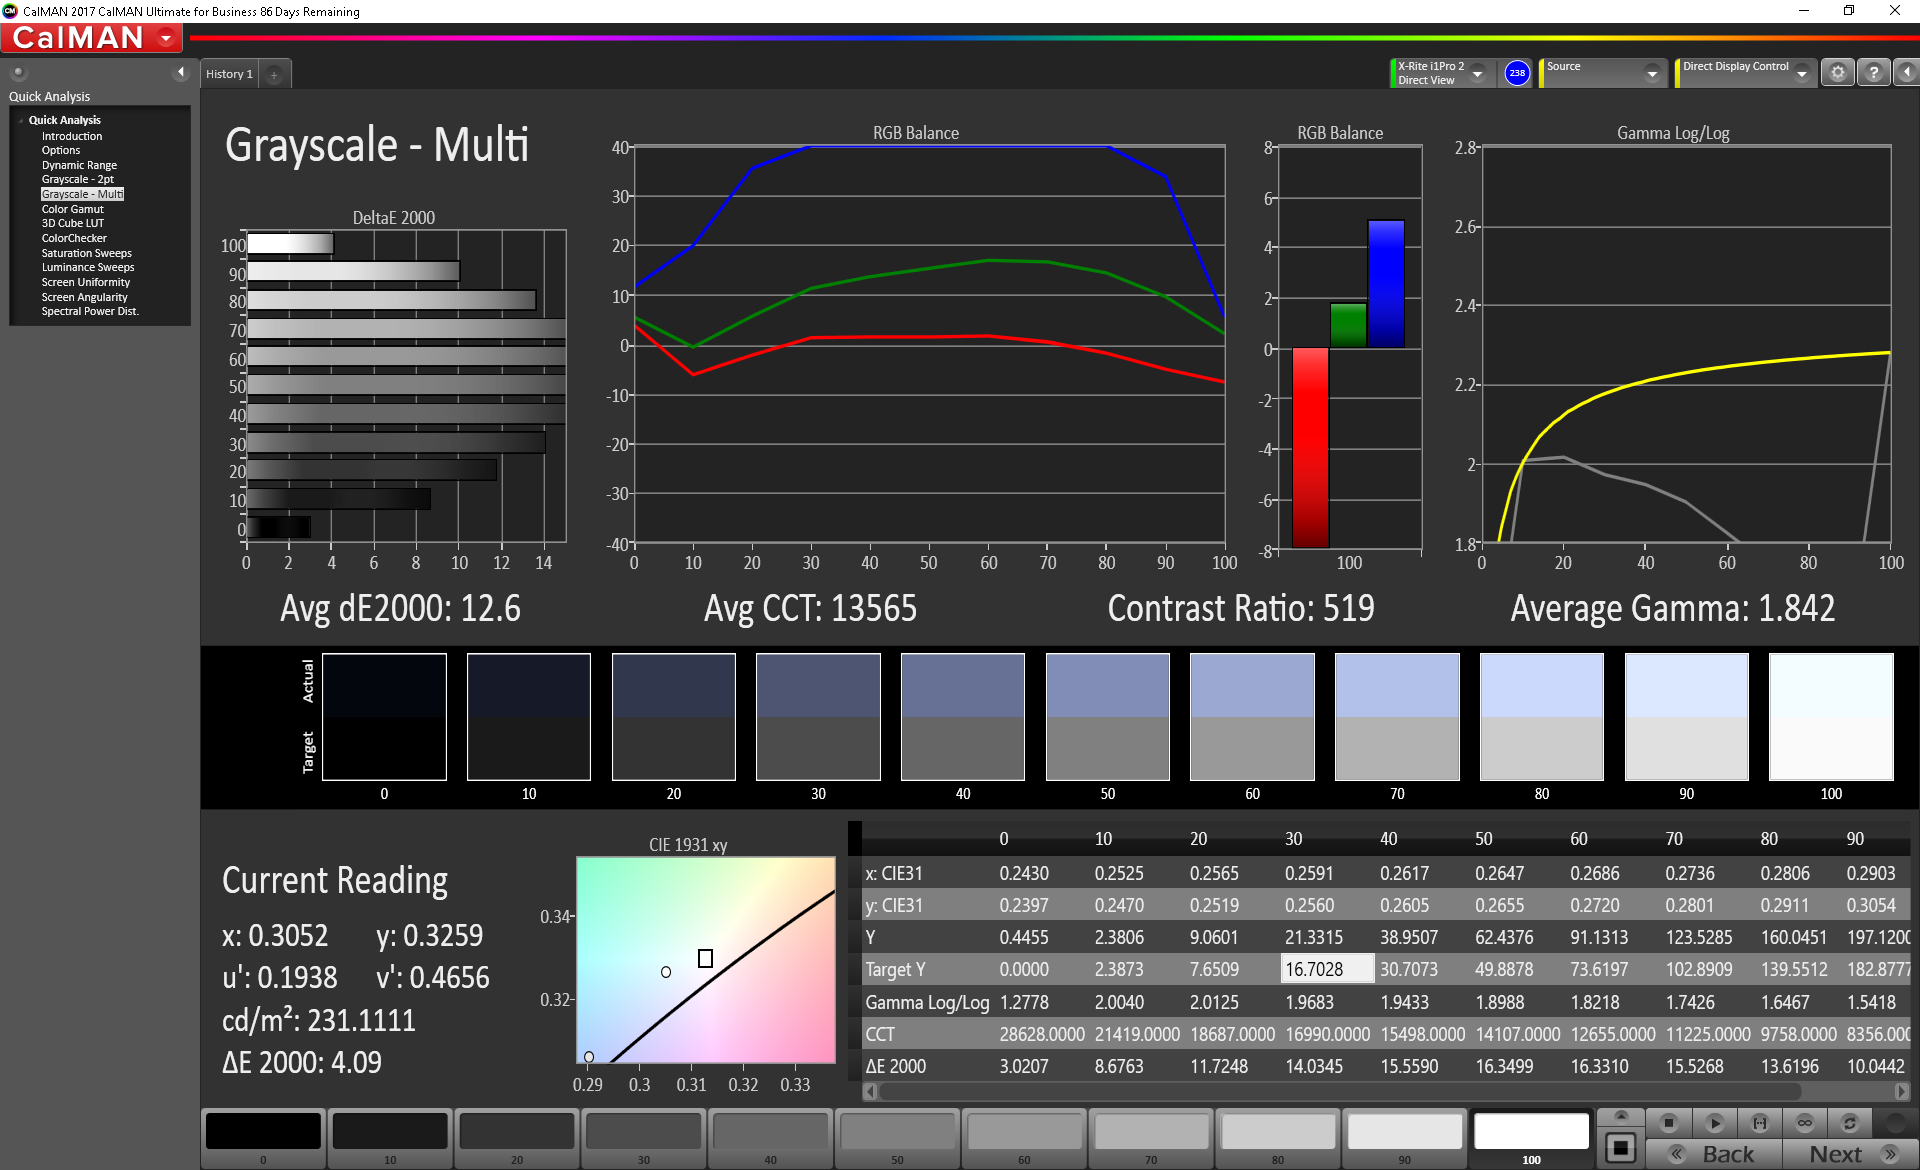
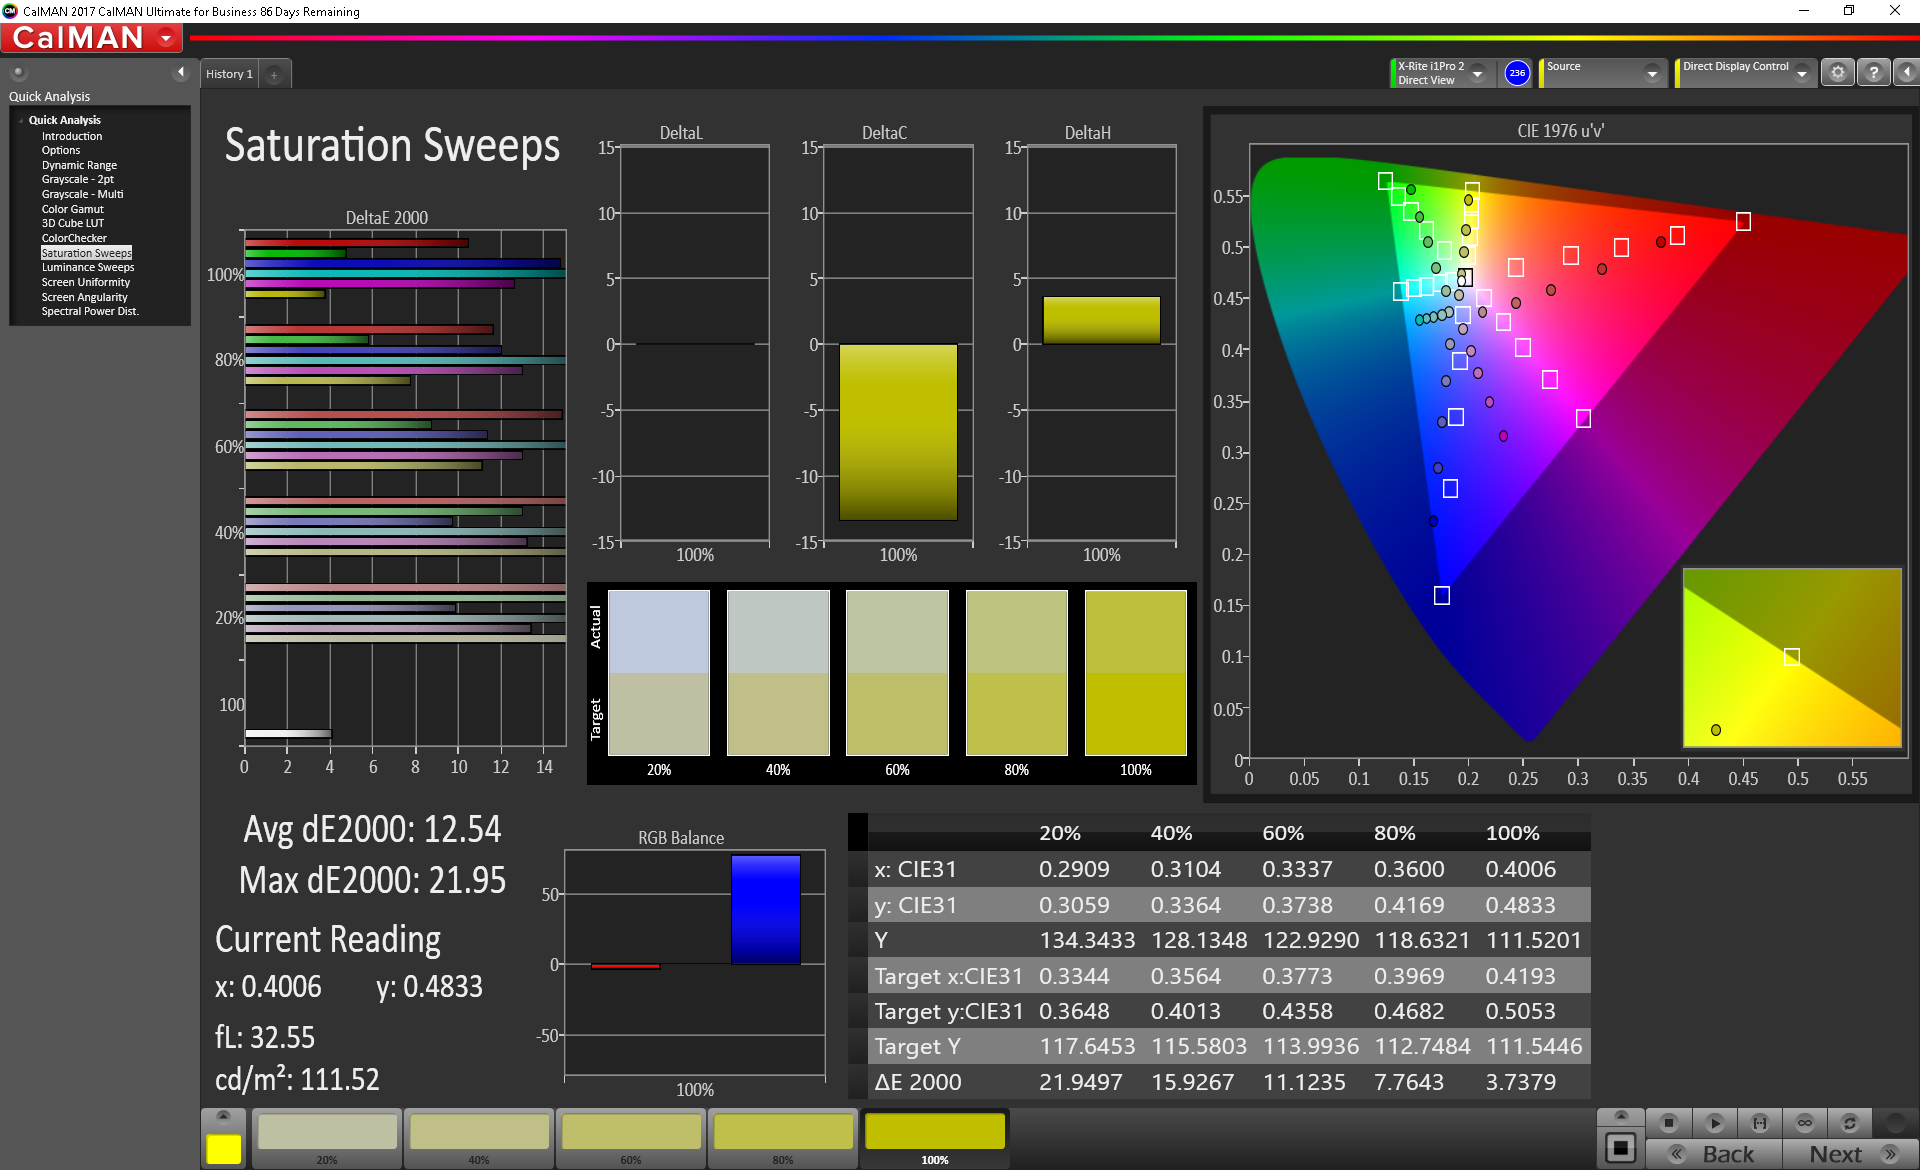
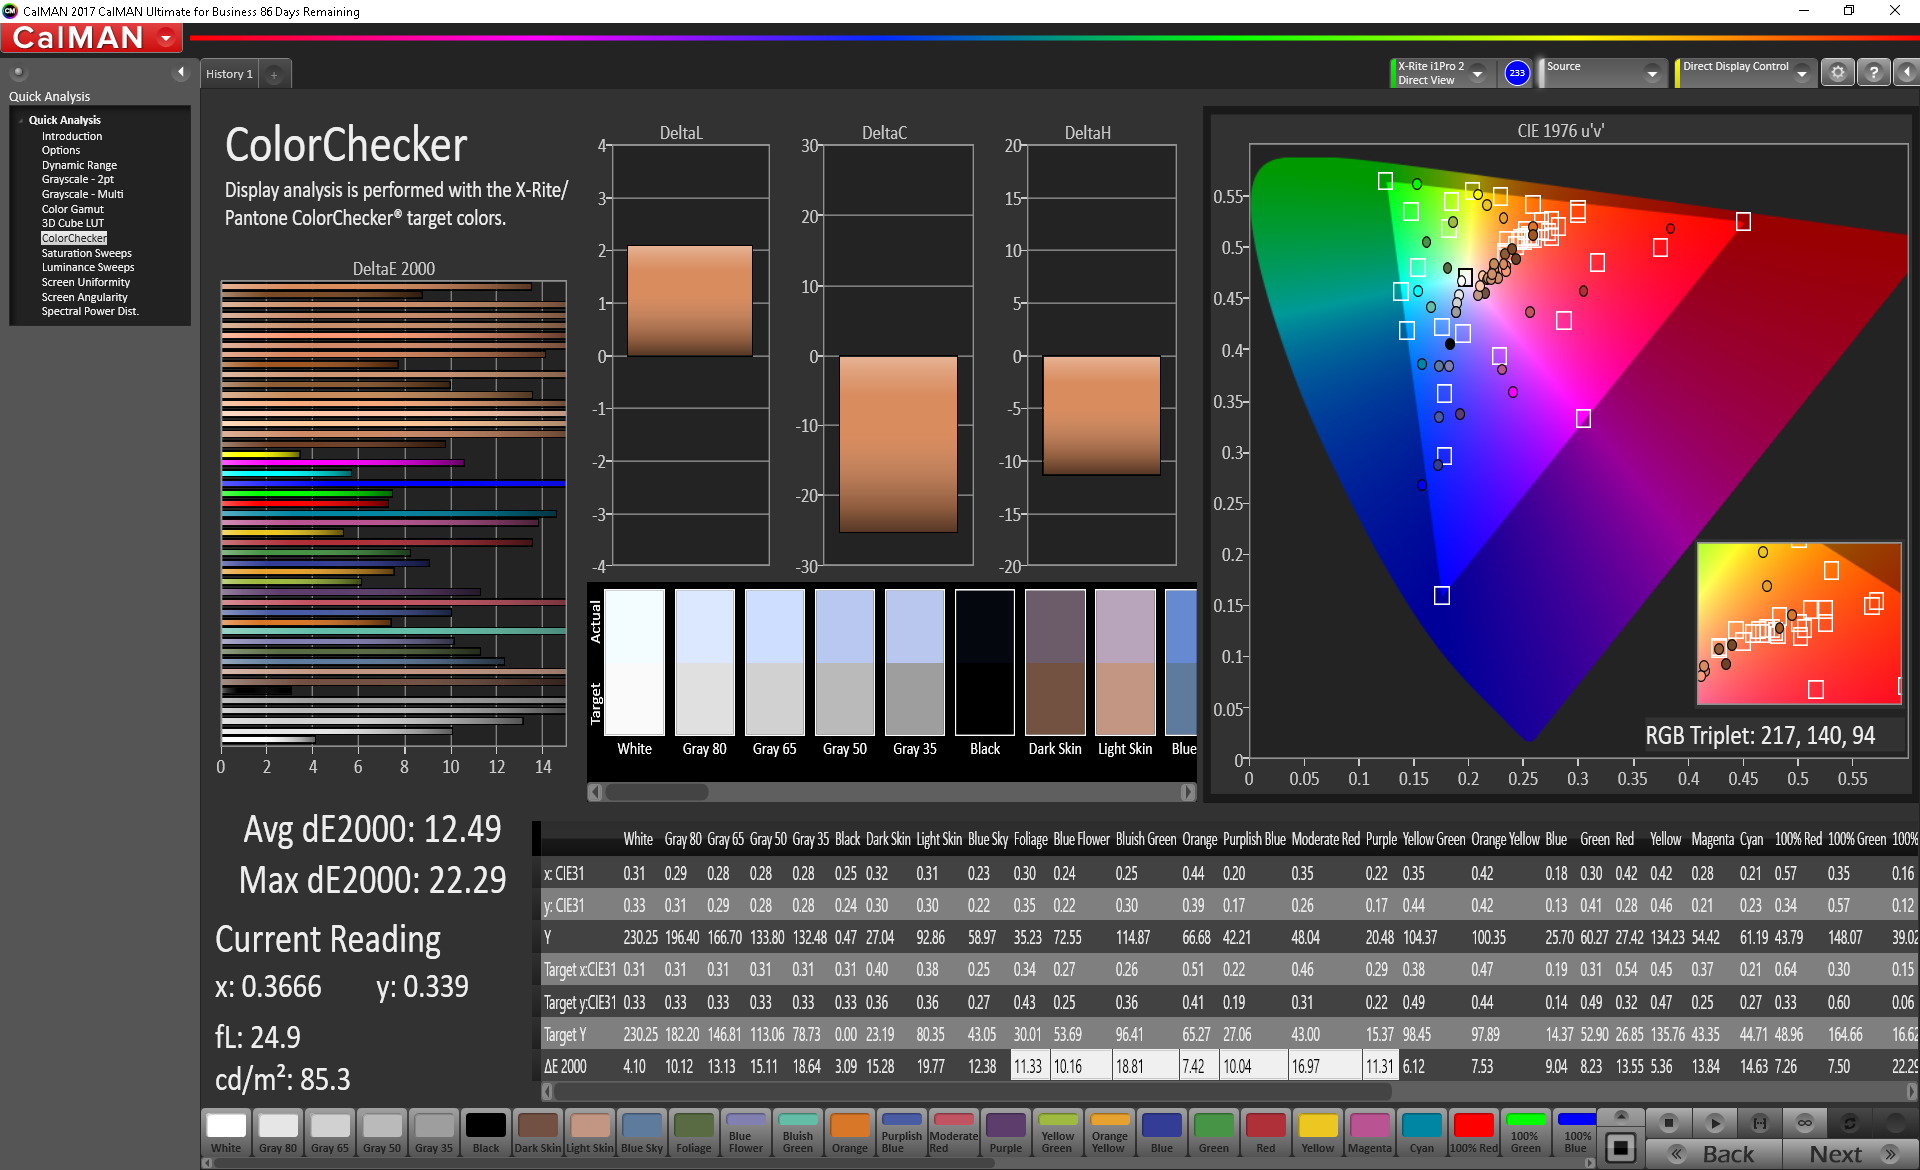
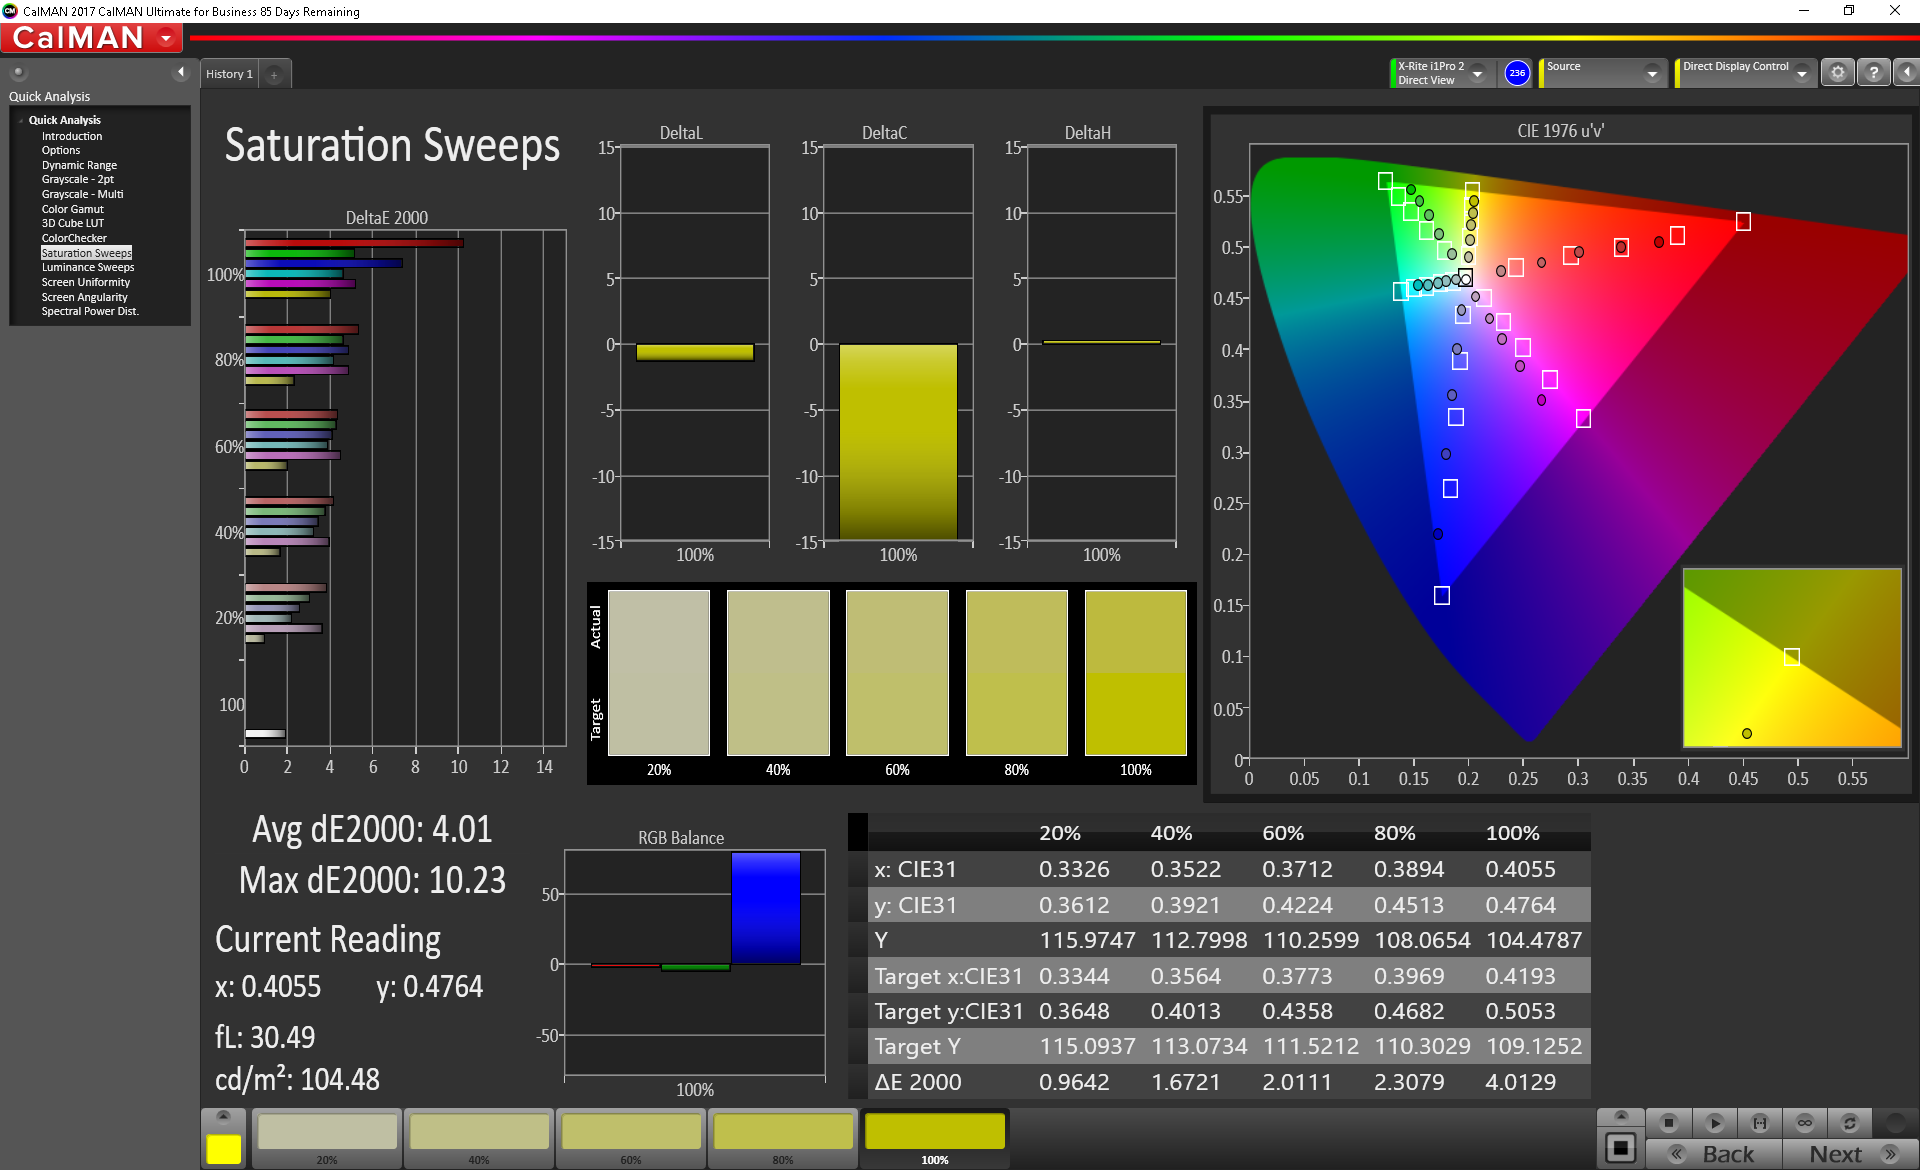
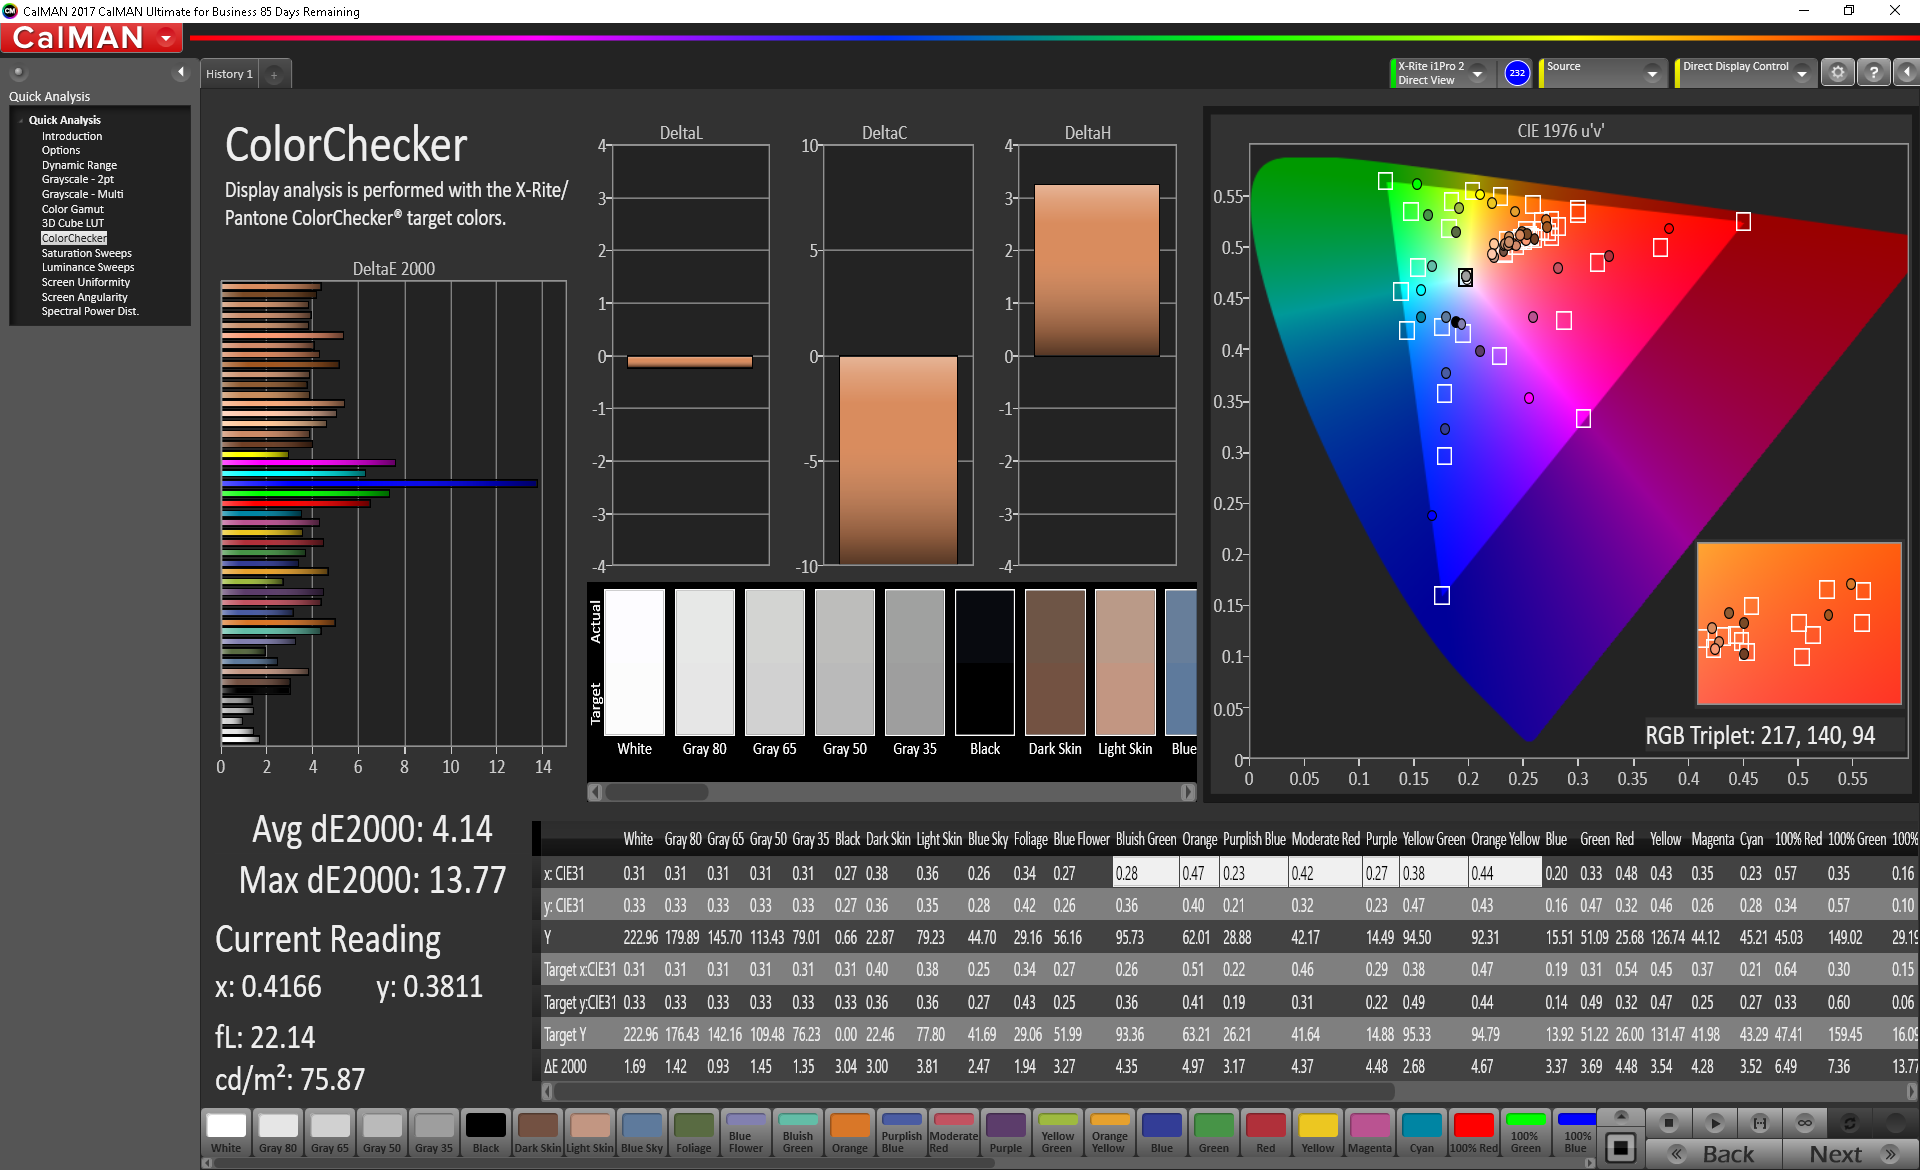
ΔE ColorChecker Calman: 12.49 | ∀{0.5-29.43 Ø4.73}
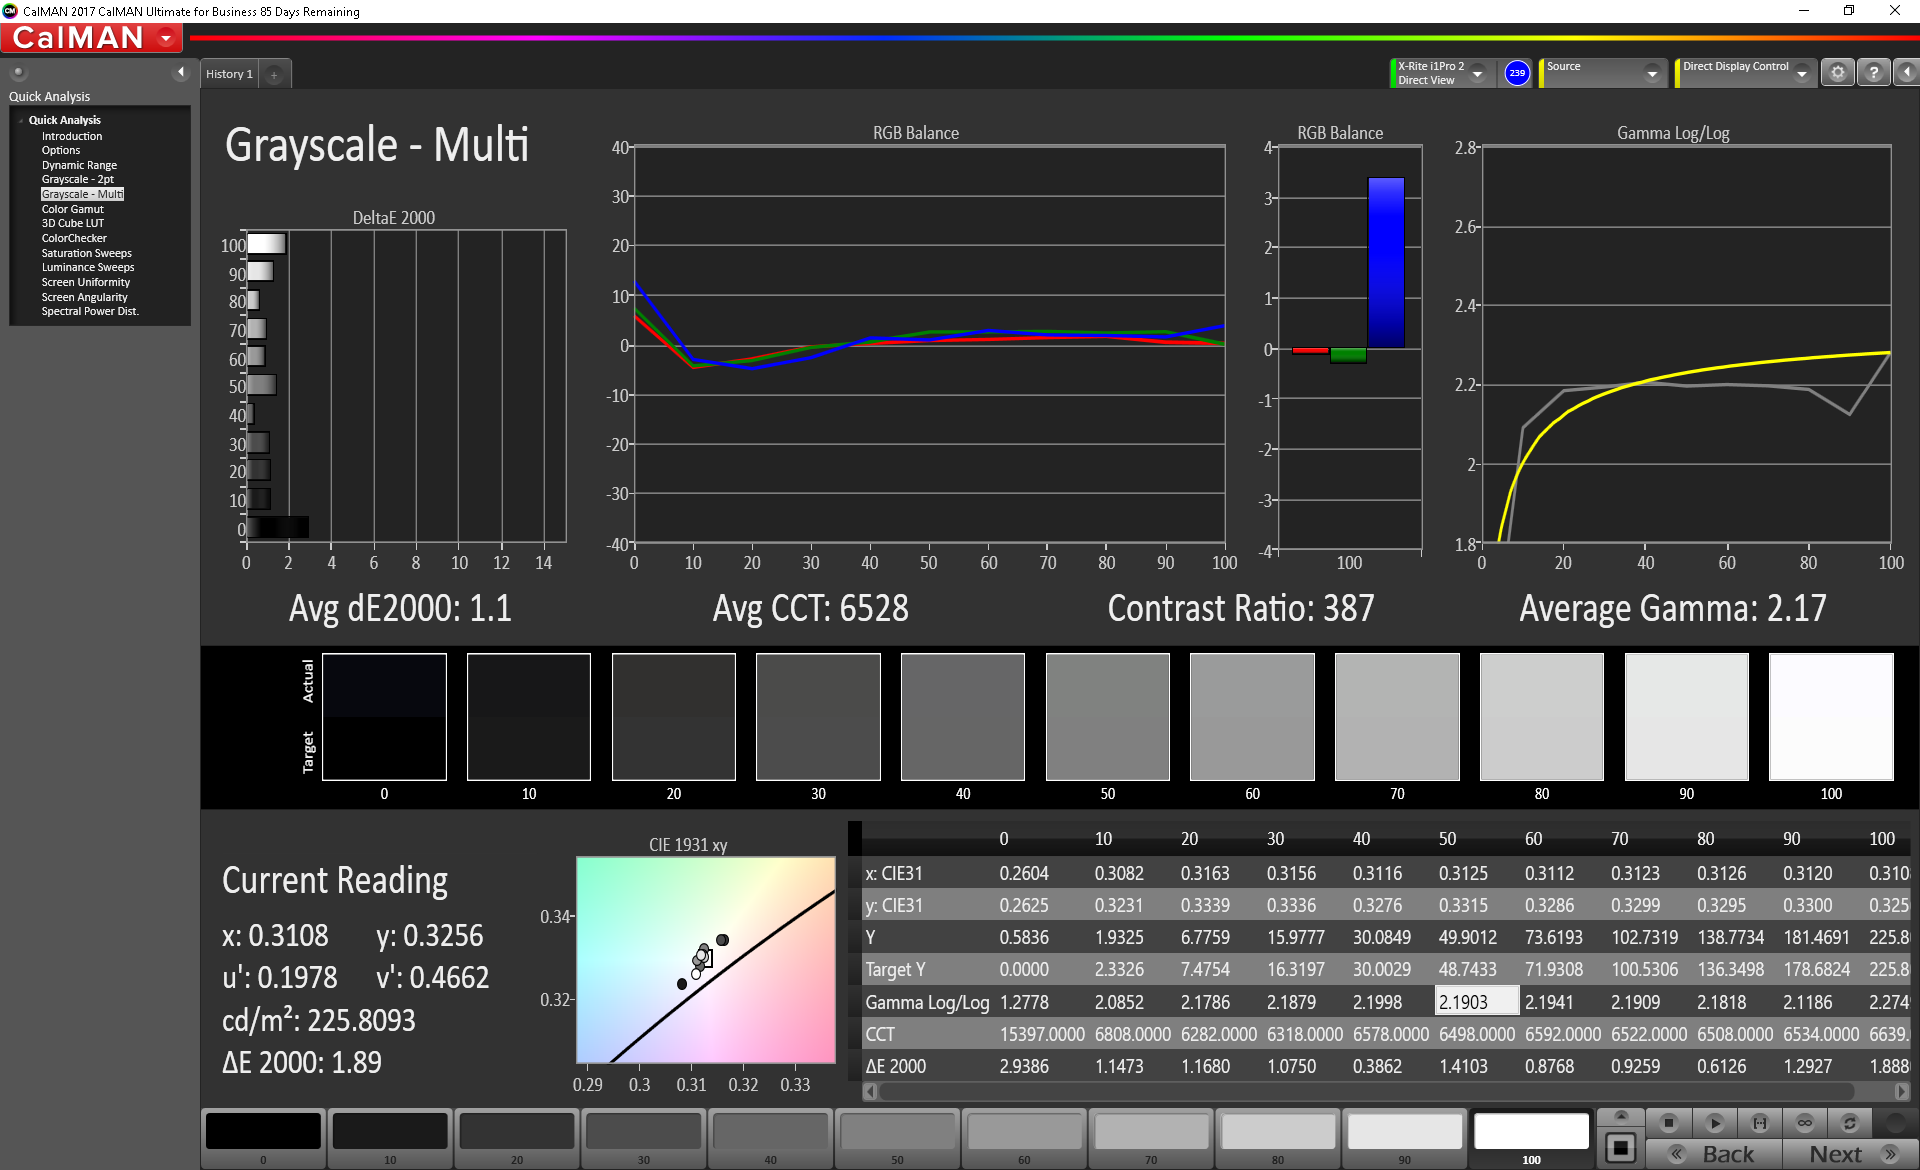
calibrated: 4.01
ΔE Greyscale Calman: 12.6 | ∀{0.09-98 Ø4.97}
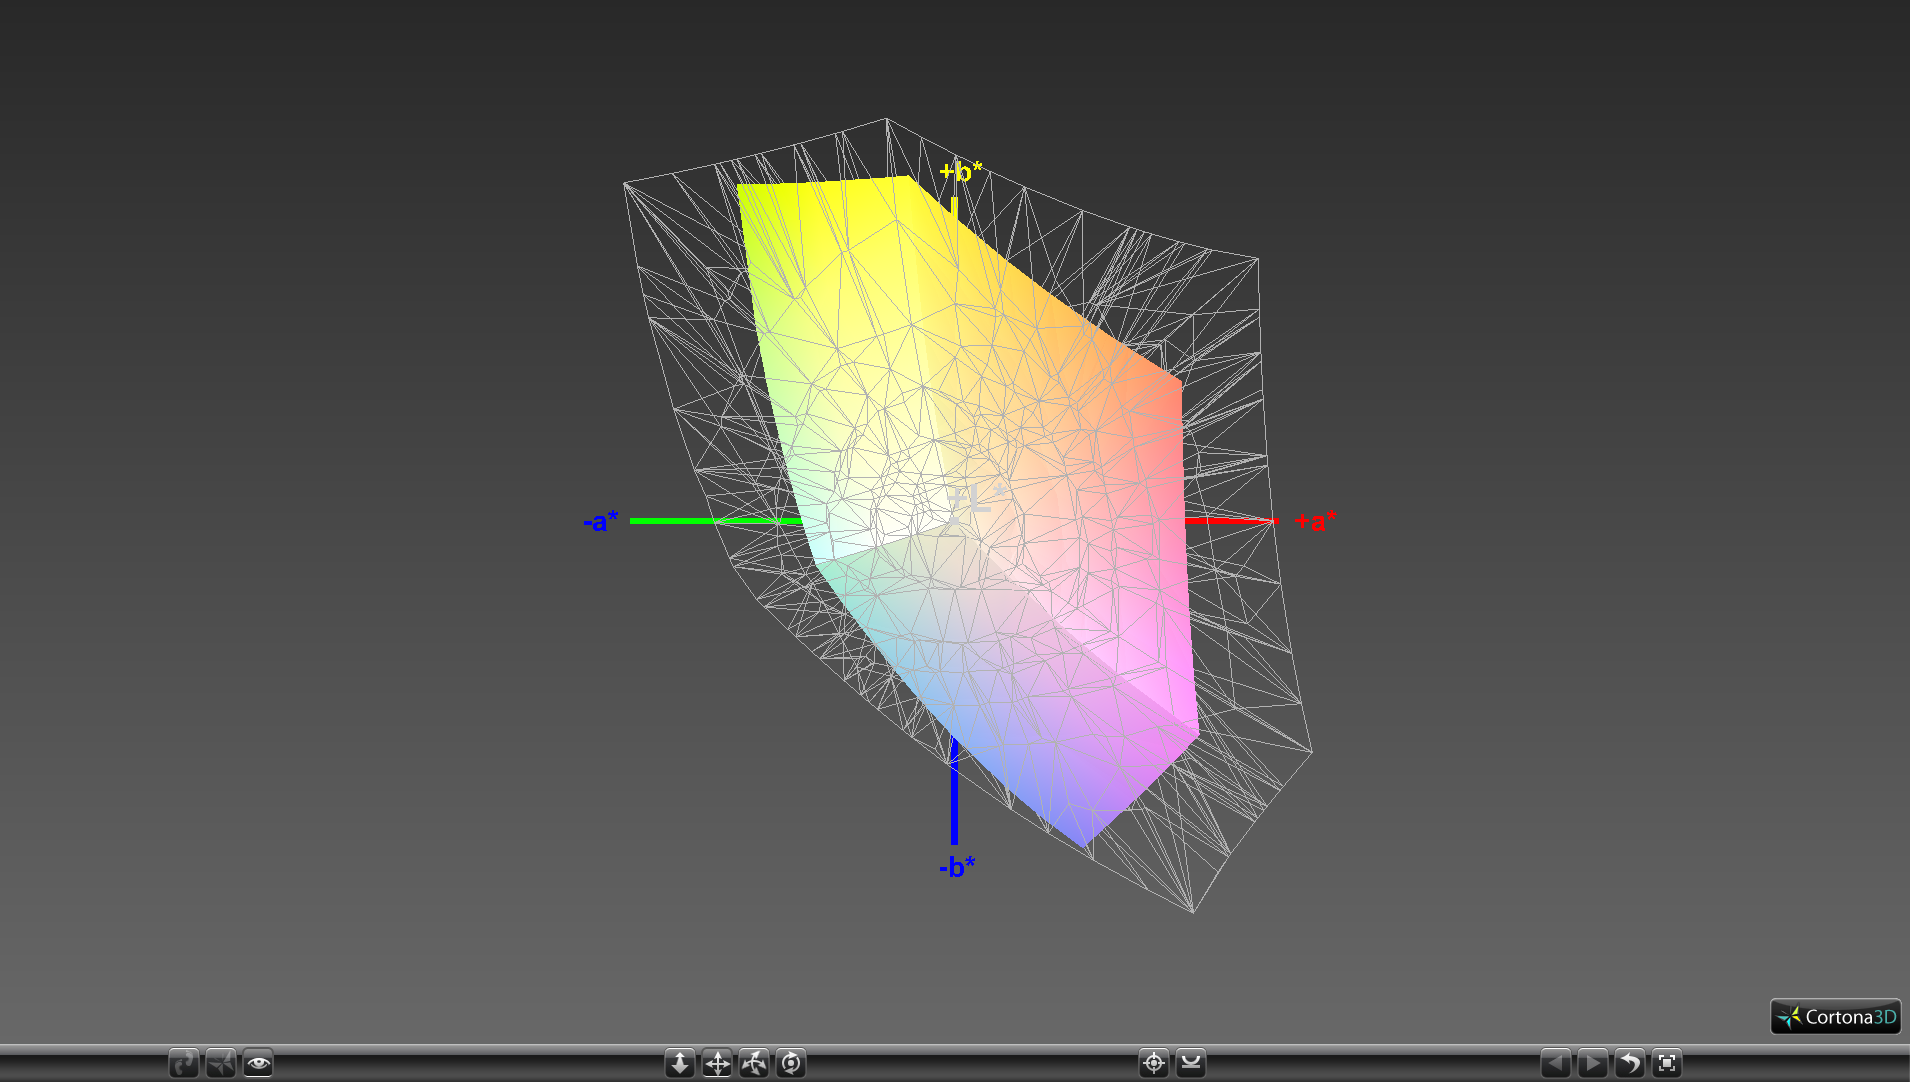
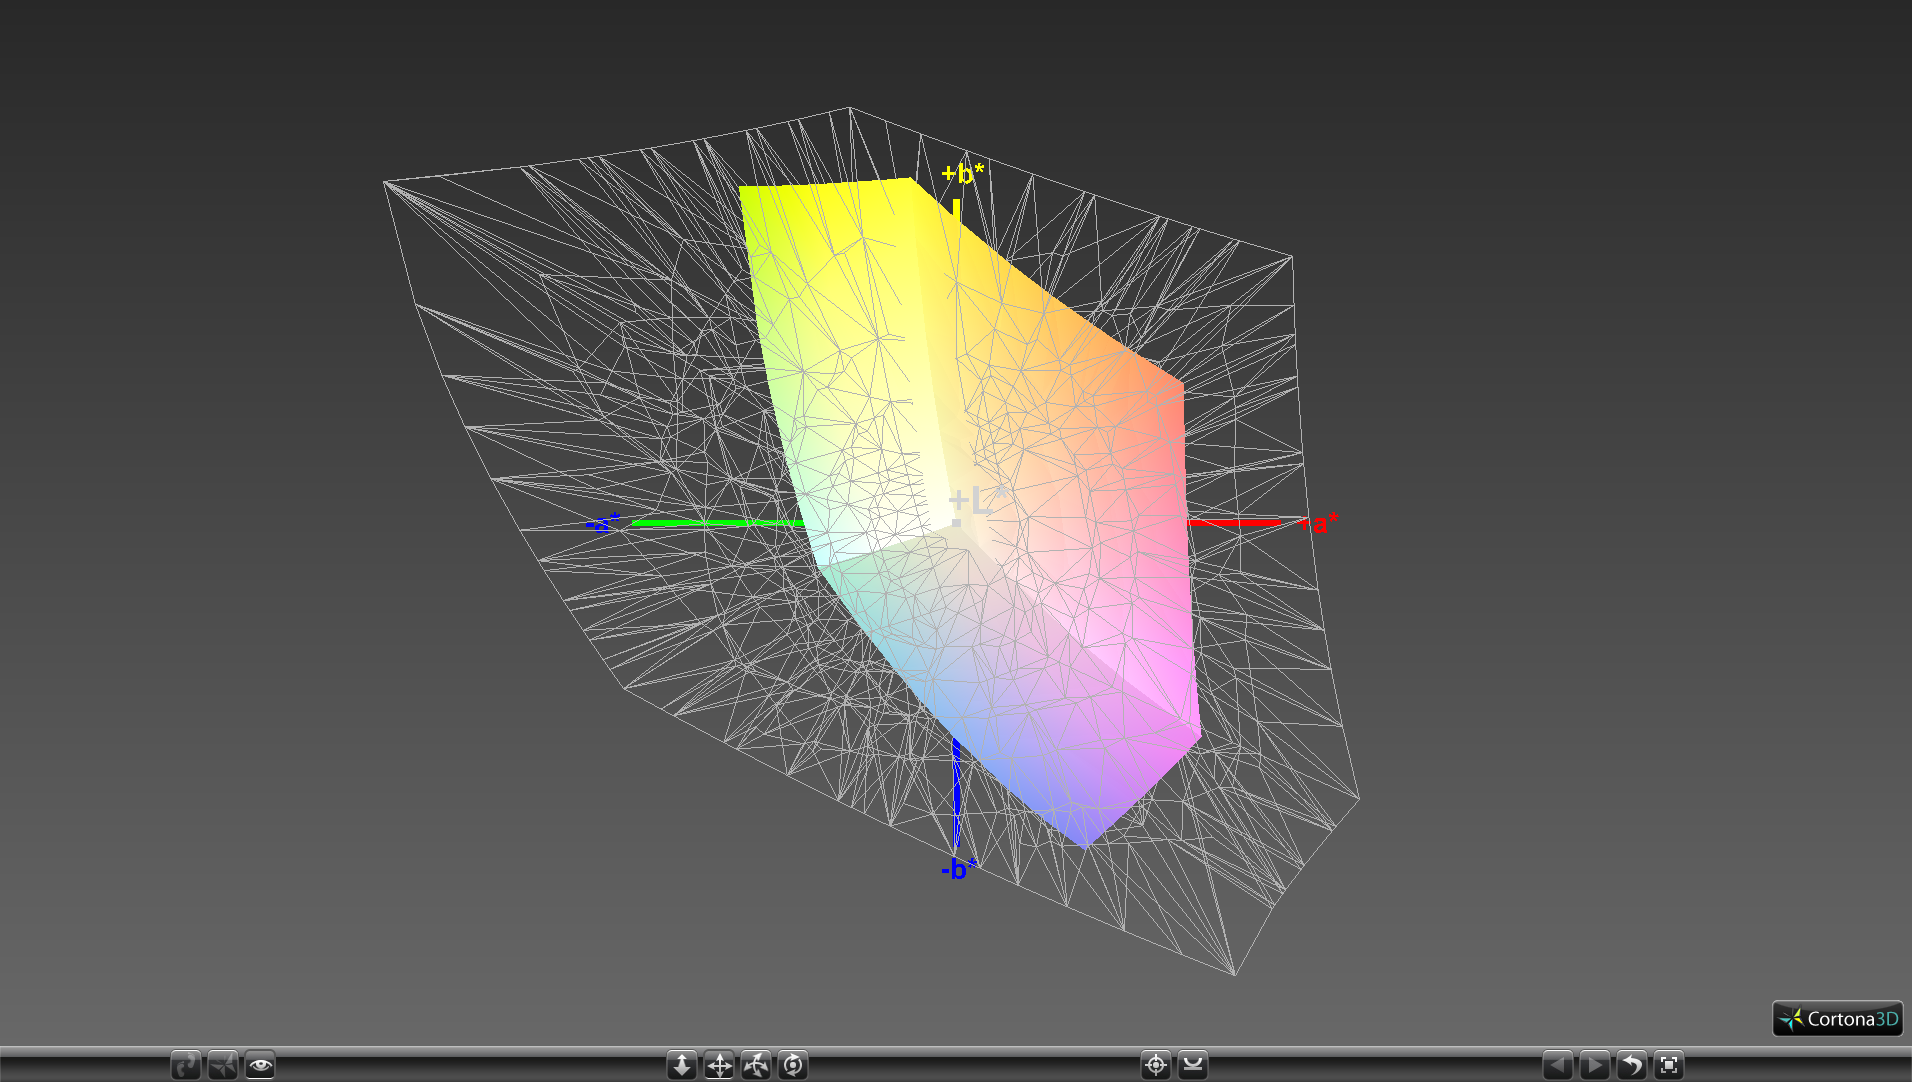
56.2% sRGB (Argyll 1.6.3 3D)
35.7% AdobeRGB 1998 (Argyll 1.6.3 3D)
38.68% AdobeRGB 1998 (Argyll 3D)
56.4% sRGB (Argyll 3D)
37.44% Display P3 (Argyll 3D)
Gamma: 1.84
CCT: 13565 K
| Dell Latitude 15 3590-K8JP AU Optronics AUO38ED, TN LED, 15.6", 1920x1080 | Dell XPS 15 9570 i7 UHD LQ156D1, IPS, 15.6", 3840x2160 | Acer TravelMate P2510-G2-MG-50WE Chi Mei CMN15D3, IPS, 15.6", 1920x1080 | HP ProBook 650 G4 3UP57EA CMN15D3, IPS LED, 15.6", 1920x1080 | Fujitsu Lifebook E558 E5580MP581DE LG Philips LP156WFB-SPB1, IPS, 15.6", 1920x1080 | |
|---|---|---|---|---|---|
| Display | 97% | 13% | 12% | -6% | |
| Display P3 Coverage (%) | 37.44 | 79.1 111% | 42.27 13% | 41.89 12% | 35.25 -6% |
| sRGB Coverage (%) | 56.4 | 98.8 75% | 63.5 13% | 63 12% | 53 -6% |
| AdobeRGB 1998 Coverage (%) | 38.68 | 79.2 105% | 43.69 13% | 43.28 12% | 36.43 -6% |
| Response Times | -104% | -93% | -47% | -59% | |
| Response Time Grey 50% / Grey 80% * (ms) | 29.6 ? | 46.4 ? -57% | 40 ? -35% | 31 ? -5% | 36 ? -22% |
| Response Time Black / White * (ms) | 12.8 ? | 32 ? -150% | 32 ? -150% | 24 ? -88% | 25 ? -95% |
| PWM Frequency (Hz) | 980 ? | 25000 ? | 1000 ? | ||
| Screen | 82% | 50% | 40% | 48% | |
| Brightness middle (cd/m²) | 229.9 | 494 115% | 259 13% | 305 33% | 231 0% |
| Brightness (cd/m²) | 219 | 457 109% | 230 5% | 270 23% | 227 4% |
| Brightness Distribution (%) | 85 | 88 4% | 82 -4% | 80 -6% | 88 4% |
| Black Level * (cd/m²) | 0.51 | 0.34 33% | 0.19 63% | 0.39 24% | 0.16 69% |
| Contrast (:1) | 451 | 1453 222% | 1363 202% | 782 73% | 1444 220% |
| Colorchecker dE 2000 * | 12.49 | 5.2 58% | 3.13 75% | 3.26 74% | 4.83 61% |
| Colorchecker dE 2000 max. * | 22.29 | 17.5 21% | 7.81 65% | 6.84 69% | 8.42 62% |
| Colorchecker dE 2000 calibrated * | 4.01 | 3.09 23% | |||
| Greyscale dE 2000 * | 12.6 | 2.7 79% | 1.42 89% | 1.98 84% | 3.49 72% |
| Gamma | 1.84 120% | 2.1 105% | 2.36 93% | 2.38 92% | 2.54 87% |
| CCT | 13565 48% | 7038 92% | 6391 102% | 6540 99% | 6233 104% |
| Color Space (Percent of AdobeRGB 1998) (%) | 35.7 | 71.2 99% | 40 12% | 40 12% | 34 -5% |
| Color Space (Percent of sRGB) (%) | 56.2 | 98.8 76% | 63 12% | 63 12% | 53 -6% |
| Total Average (Program / Settings) | 25% /
60% | -10% /
26% | 2% /
23% | -6% /
23% |
* ... smaller is better
Color space is only 56 percent and 36 percent of the sRGB and AdobeRGB standards, respectively. Results are similar to other cheap panels on inexpensive laptops like the TravelMate P2510 whereas flagship Ultrabook displays commonly reach over 90 percent sRGB coverage for more vivid colors. While color accuracy is not priority for word processing or general office work, the muddier colors of the 3590 display are noticeable and a bit of an eyesore.
Further analyses with an X-Rite spectrophotometer confirm our suspicions above on the overly cool color temperature and inaccurate colors. RGB balance, grayscale, and gamma are all way off when up against the sRGB standard. Calibration addresses many of these extreme shortcomings as shown by our CalMan results below, but colors are still inaccurate at higher saturation levels due to the narrow color space. If an end-user calibration is not possible, then we recommend applying our ICC profile above to improve image quality.
Display Response Times
| ↔ Response Time Black to White | ||
|---|---|---|
| 12.8 ms ... rise ↗ and fall ↘ combined | ↗ 8.4 ms rise | 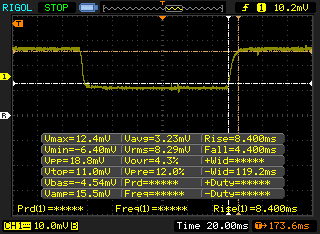 |
| ↘ 4.4 ms fall | ||
| The screen shows good response rates in our tests, but may be too slow for competitive gamers. In comparison, all tested devices range from 0.1 (minimum) to 240 (maximum) ms. » 33 % of all devices are better. This means that the measured response time is better than the average of all tested devices (19.9 ms). | ||
| ↔ Response Time 50% Grey to 80% Grey | ||
| 29.6 ms ... rise ↗ and fall ↘ combined | ↗ 17.2 ms rise | 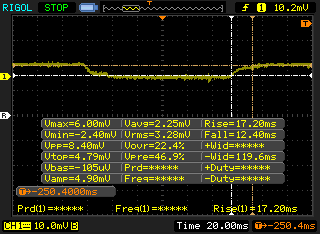 |
| ↘ 12.4 ms fall | ||
| The screen shows relatively slow response rates in our tests and may be too slow for gamers. In comparison, all tested devices range from 0.165 (minimum) to 636 (maximum) ms. » 40 % of all devices are better. This means that the measured response time is similar to the average of all tested devices (31.1 ms). | ||
Screen Flickering / PWM (Pulse-Width Modulation)
| Screen flickering / PWM not detected | 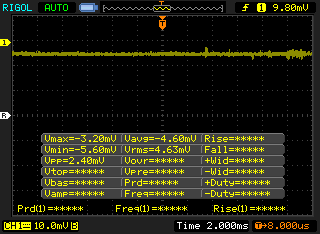 | ||
In comparison: 52 % of all tested devices do not use PWM to dim the display. If PWM was detected, an average of 7798 (minimum: 5 - maximum: 343500) Hz was measured. | |||
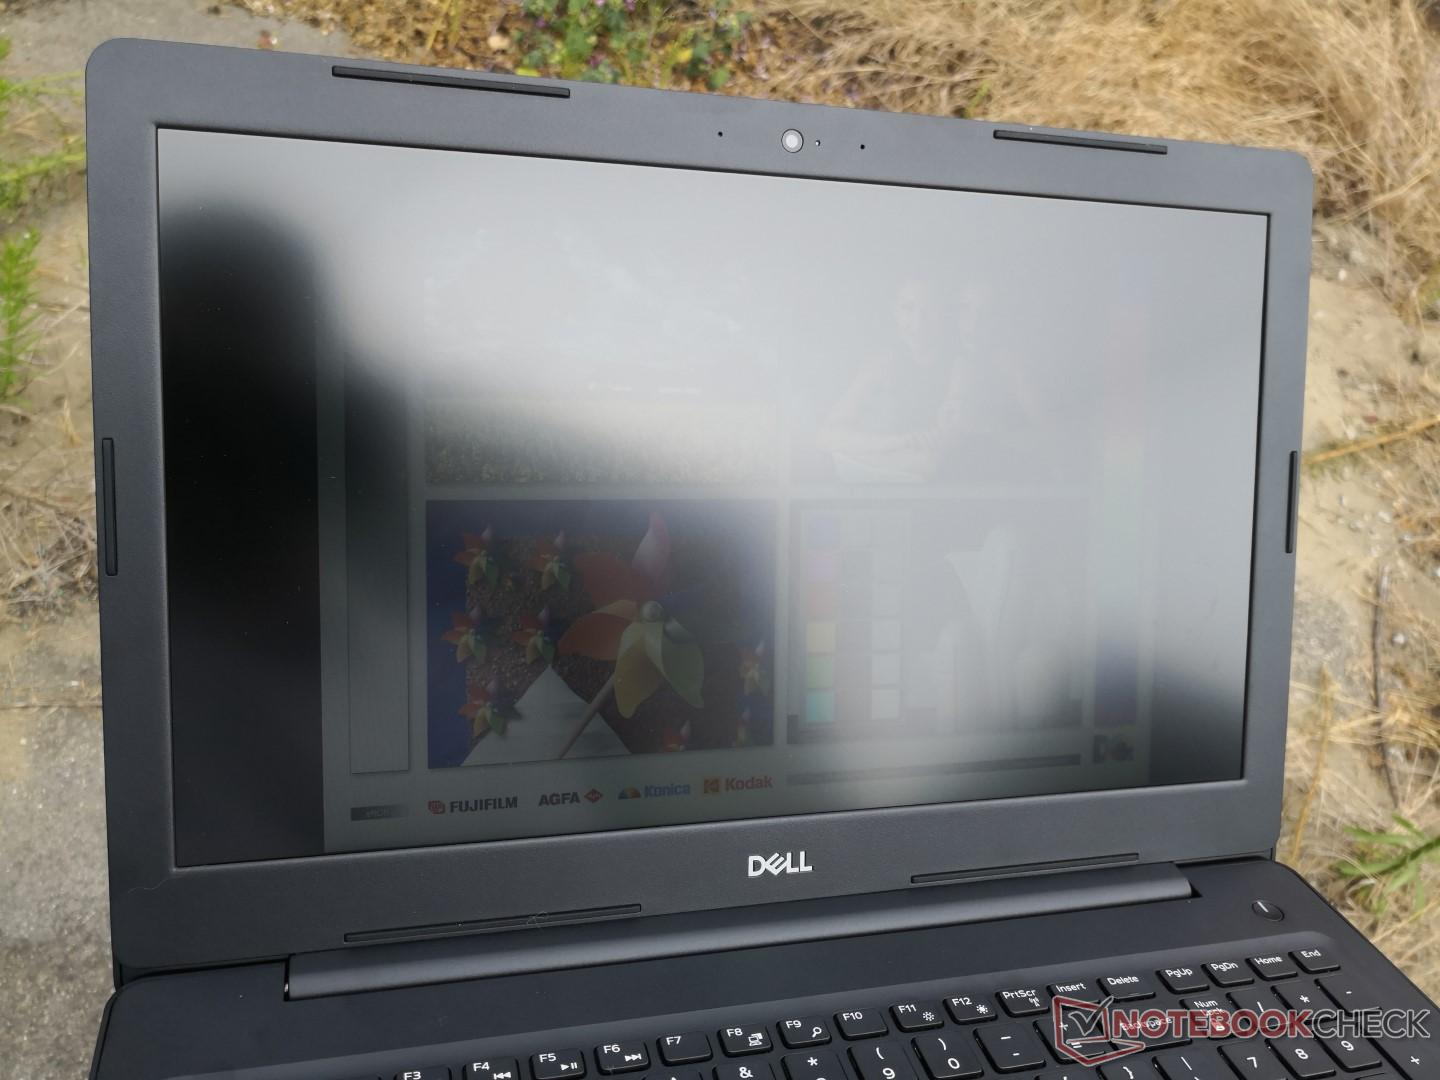
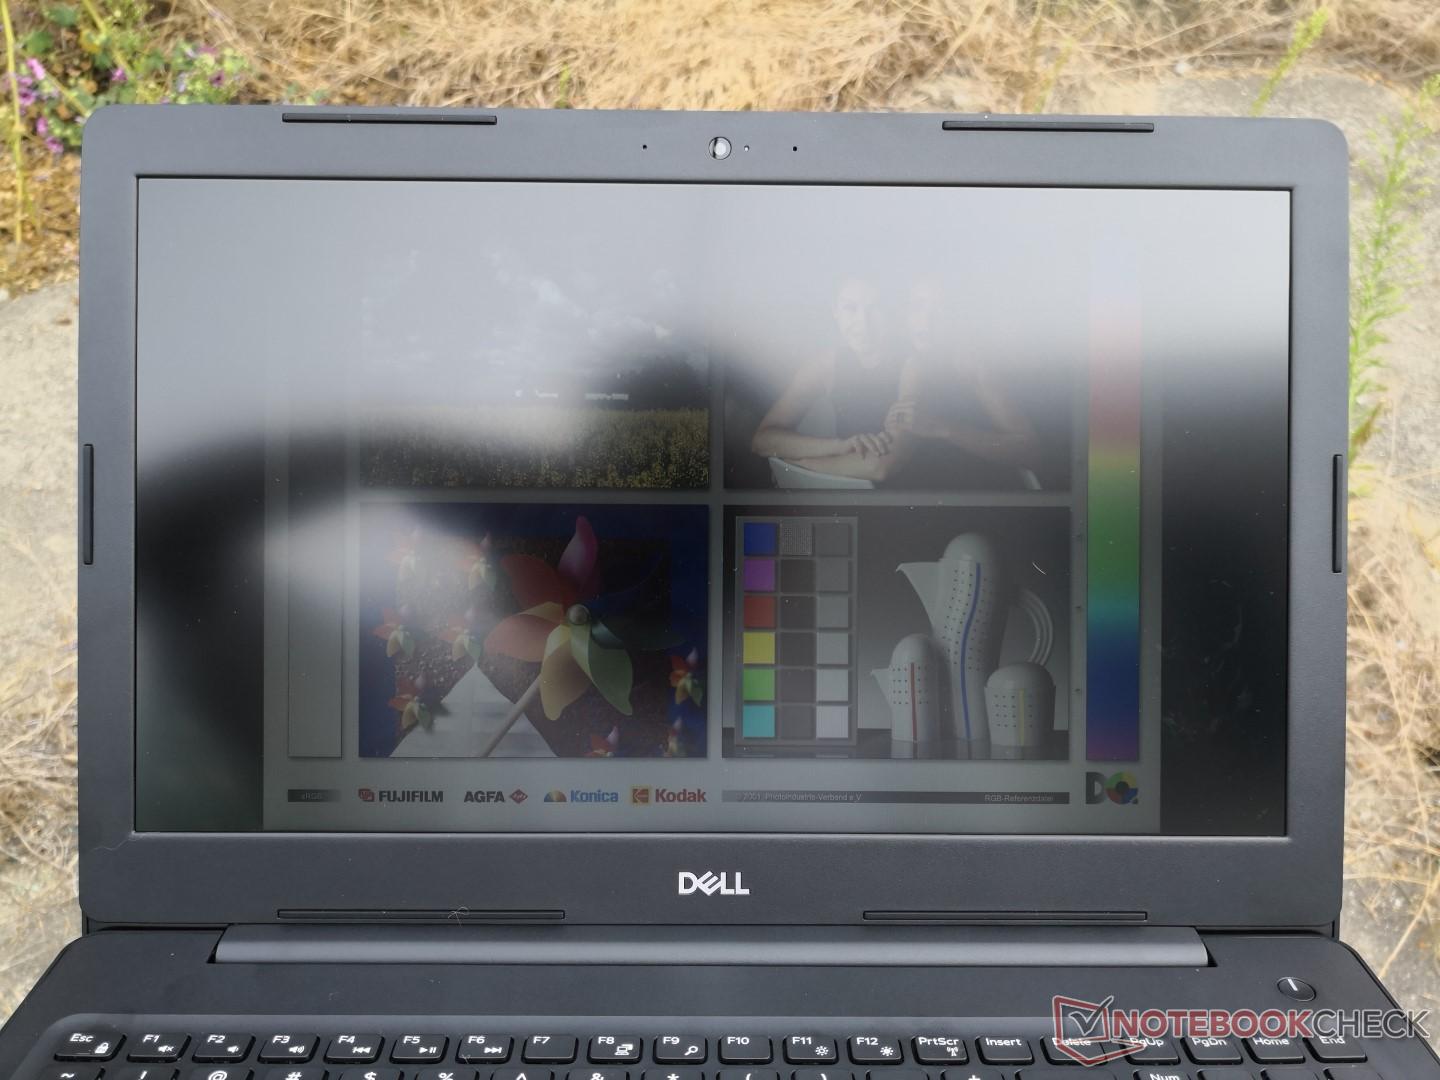
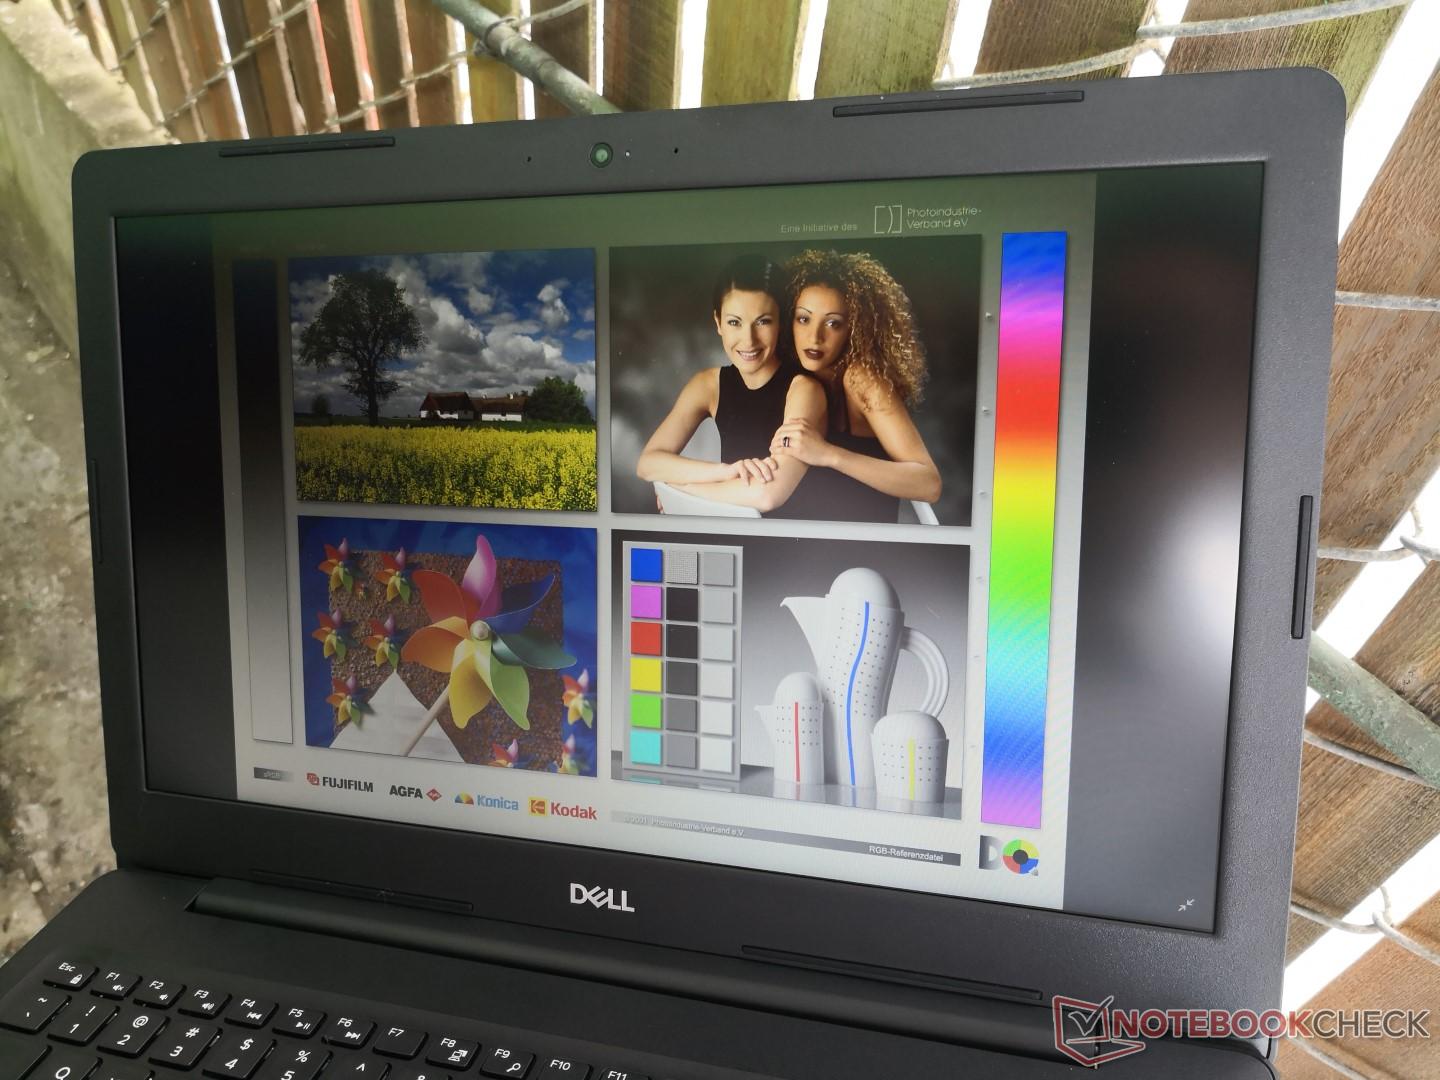
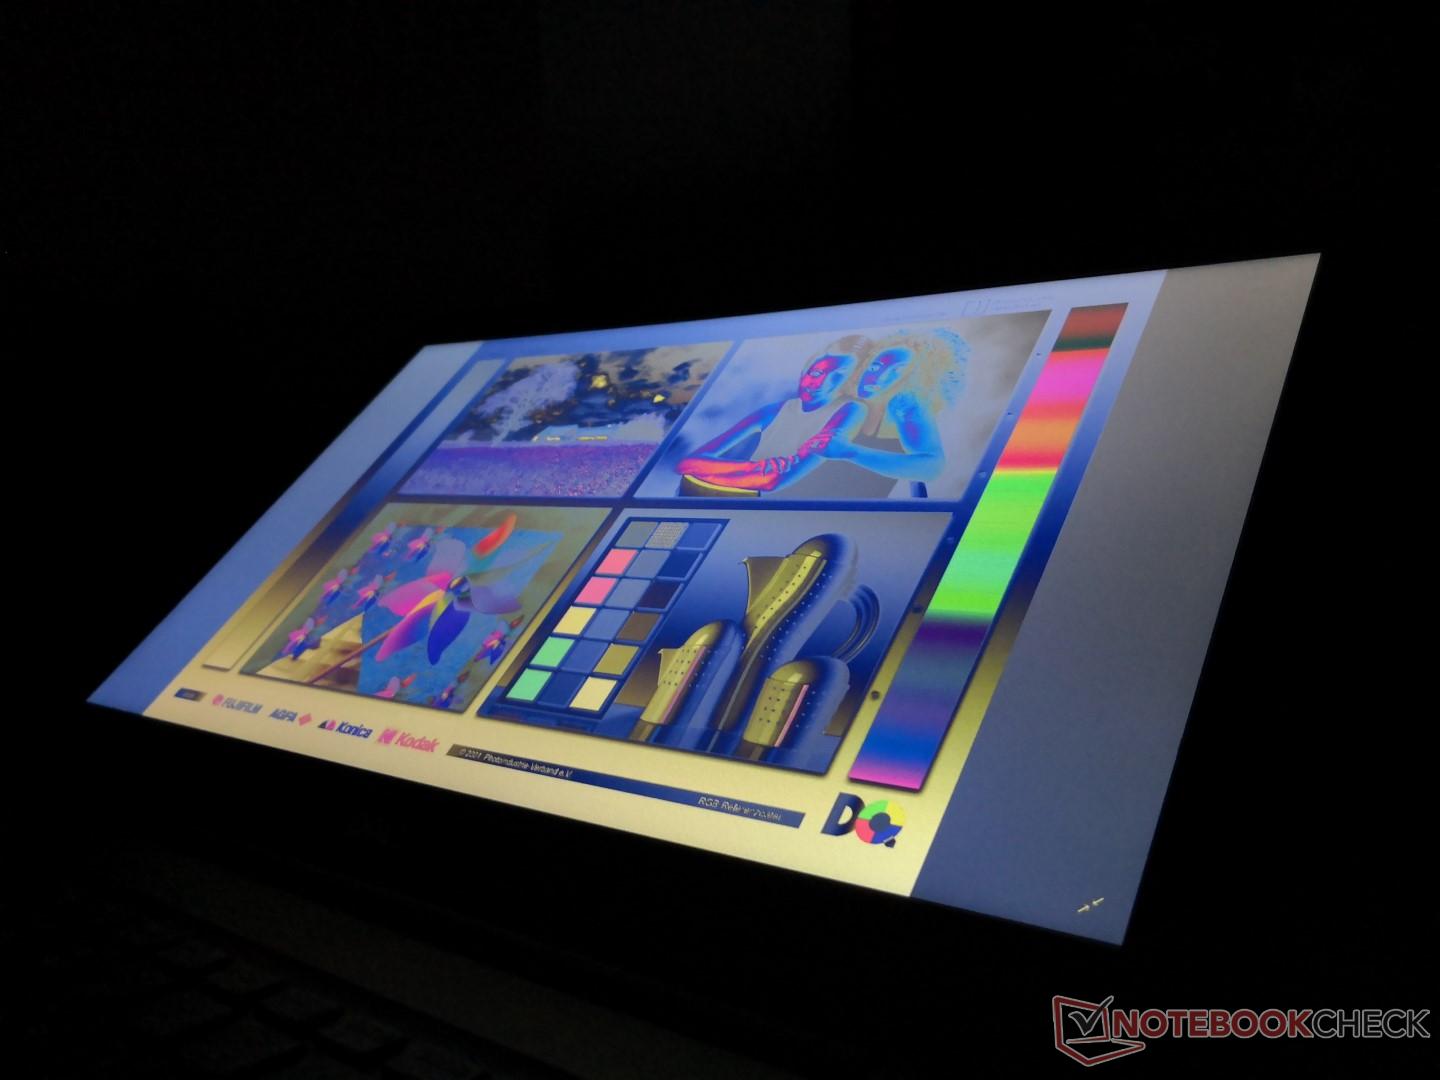
Outdoor visibility is poor to average at best. The backlight is simply too dim to overcome ambient lighting. The narrow TN viewing angles don't help and some glare is still visible despite the matte panel.
Performance
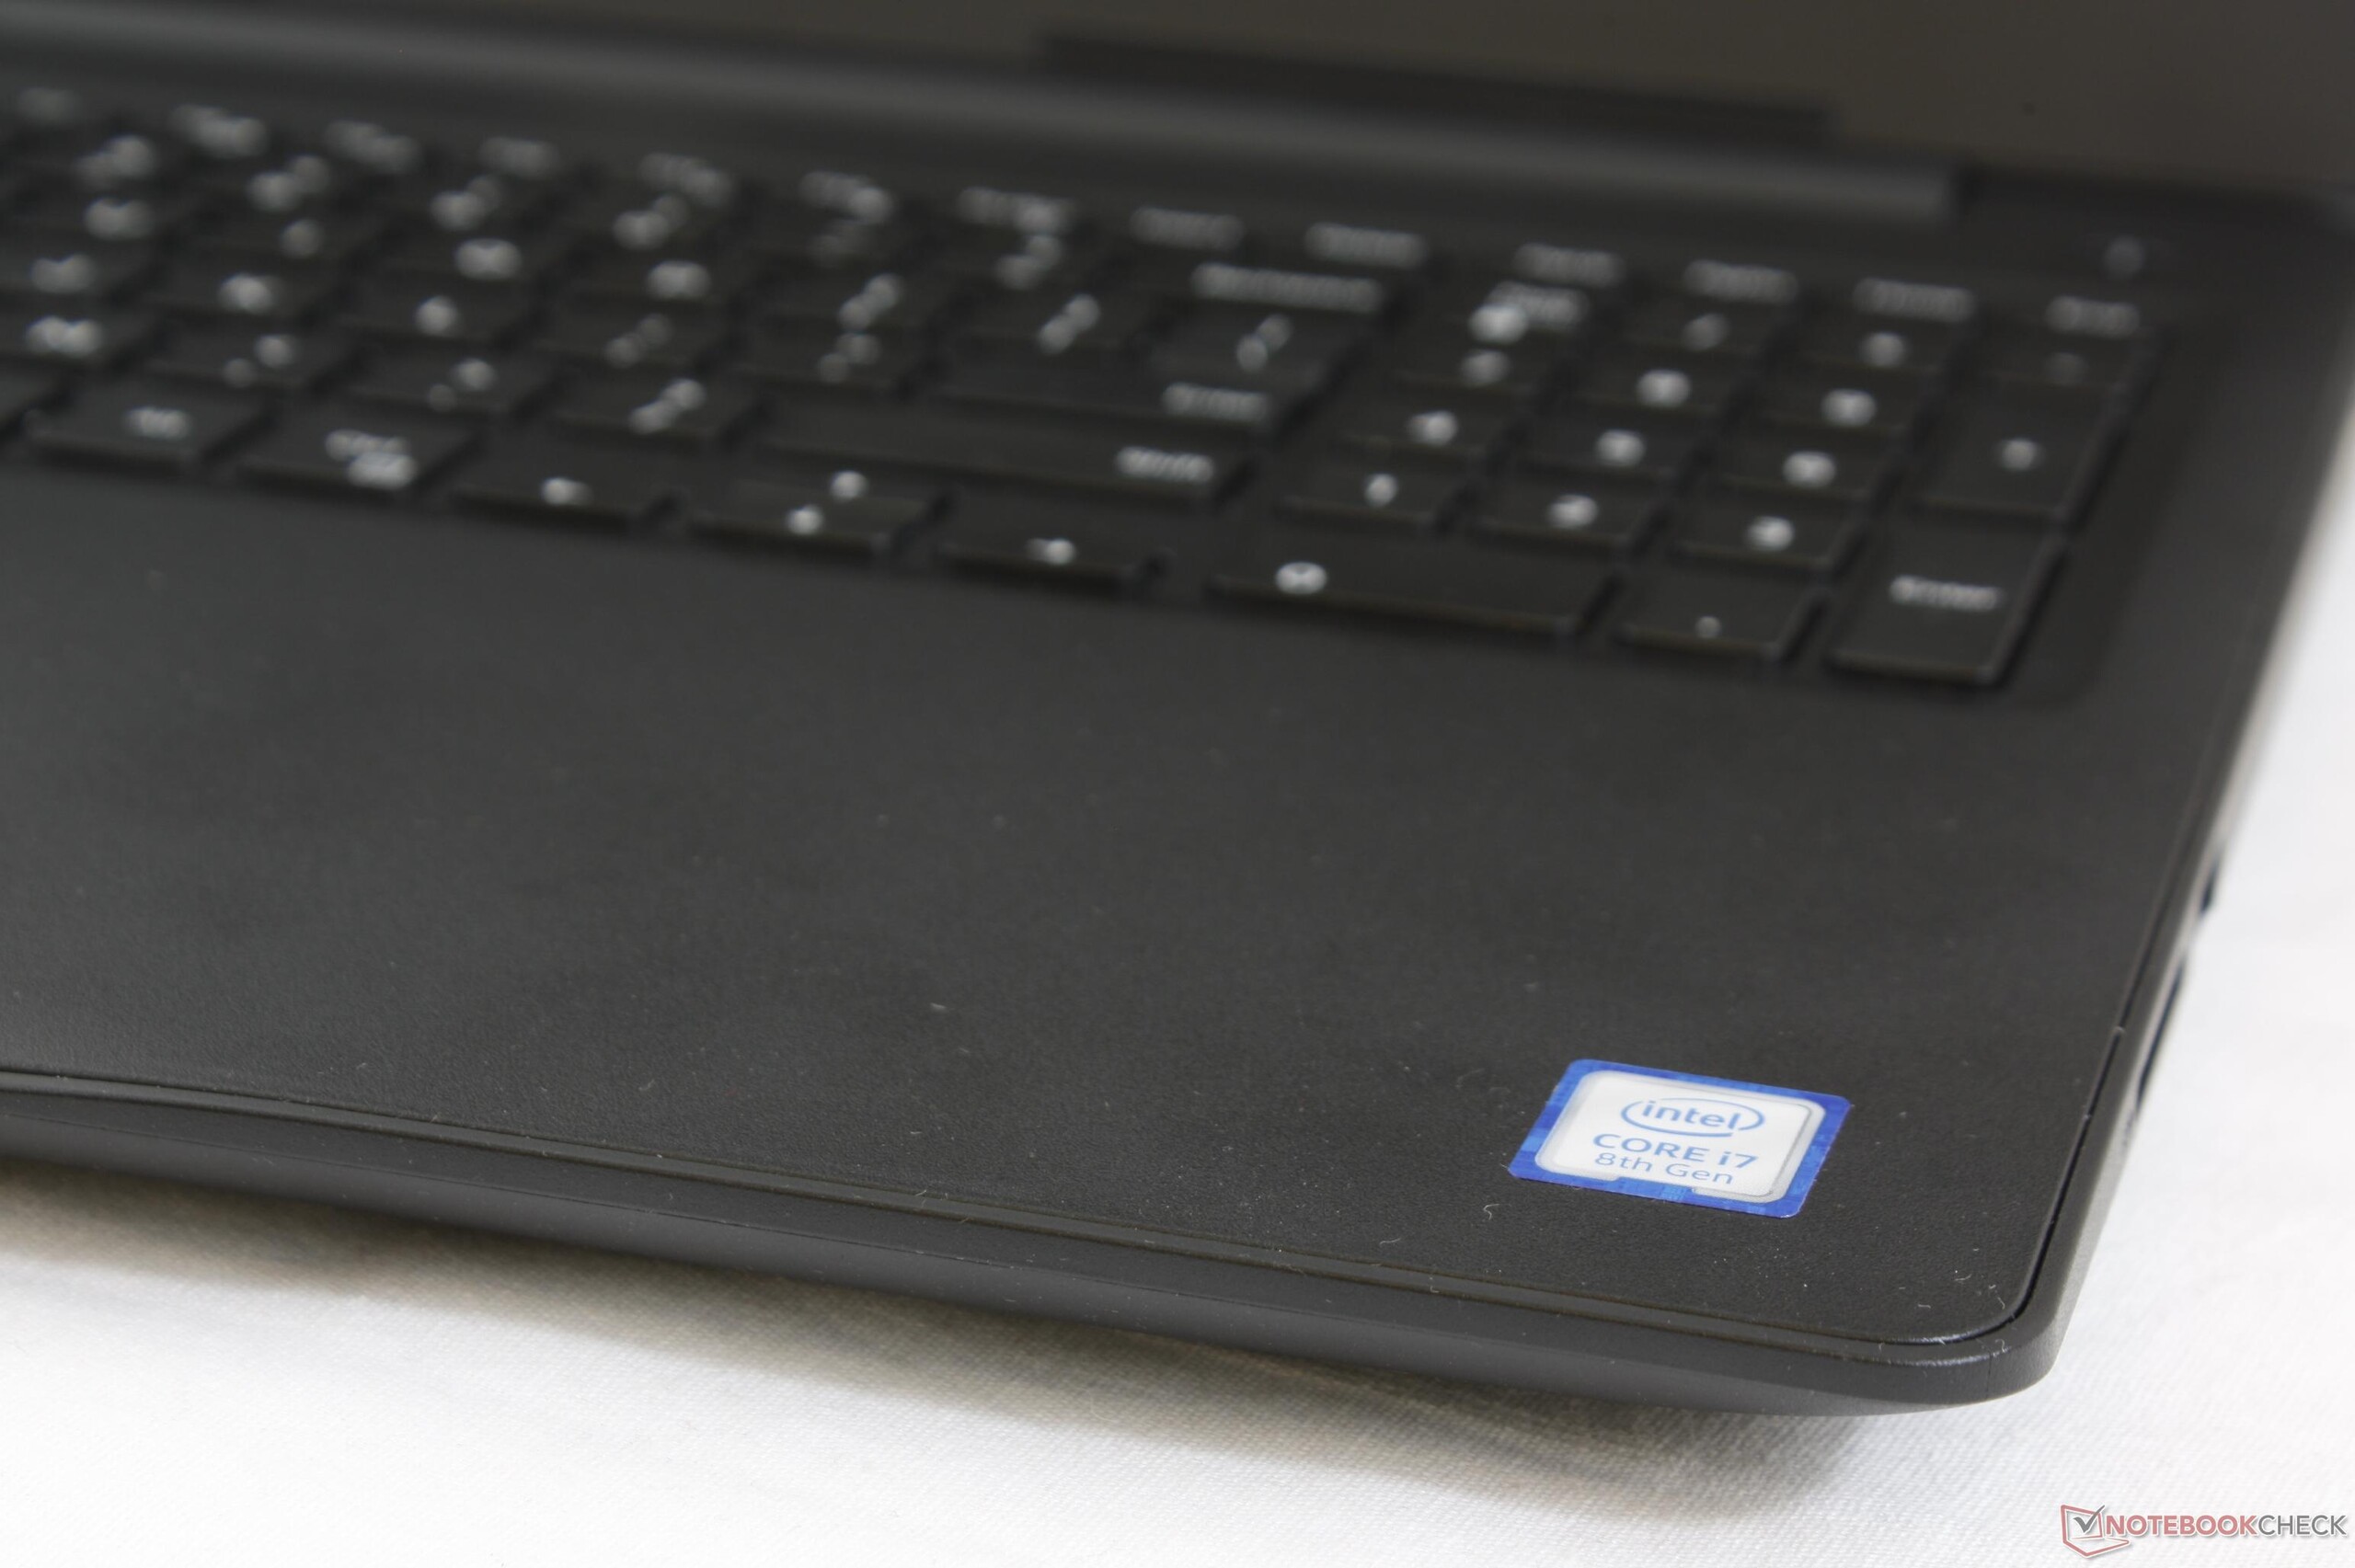
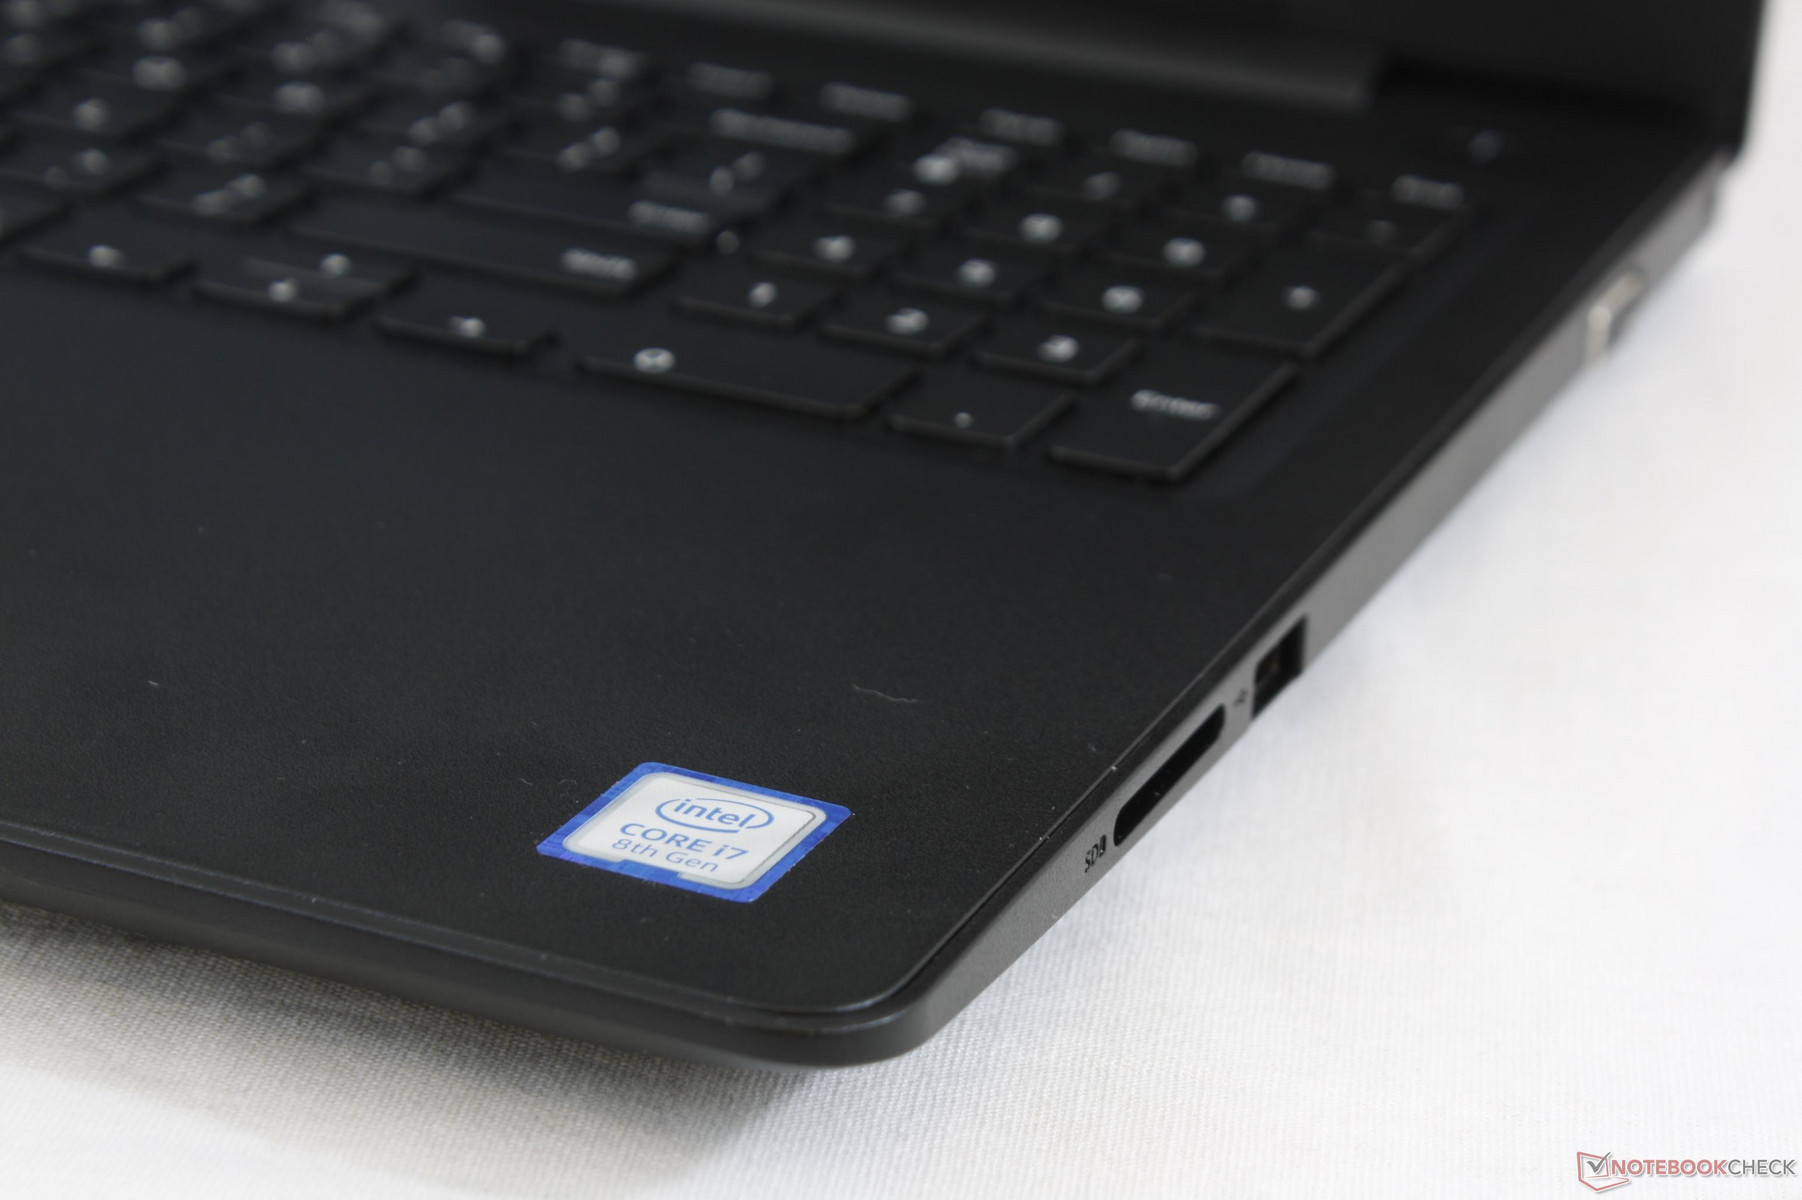
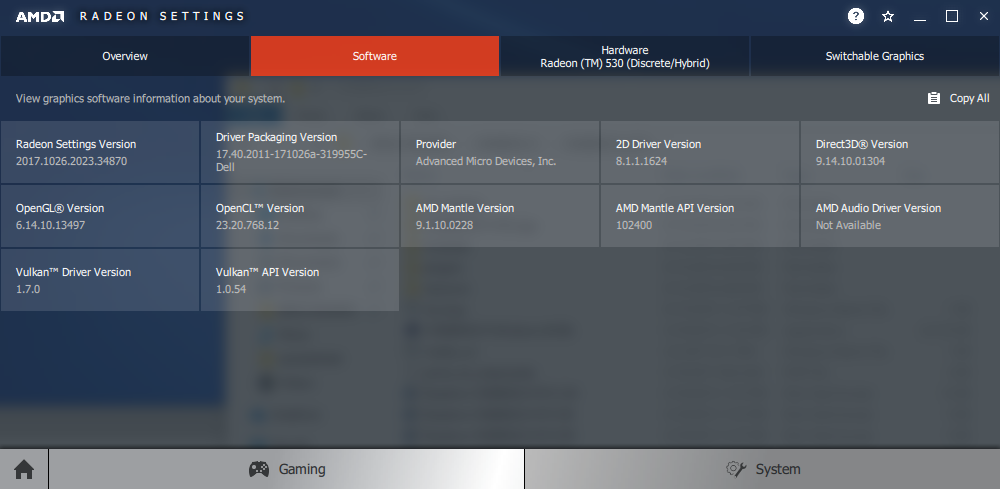
Current SKUs include the Celeron 3865U, i3-7130U, i5-8250U, and i7-8550U with integrated UHD Graphics or optional AMD Radeon 530. These 15 W ULV CPUs target general office work or home users whereas power users should consider 45 W Coffee Lake-H CPUs as found on the Latitude 5591. There are unfortunately no other discrete GPU options besides the single AMD solution. A GeForce MX130 or MX150, for example, would have been preferable as our power consumption and performance metrics below will show.
SKUs with only integrated Intel graphics are available. These less demanding configurations are likely to run for longer, cooler, and quieter than what we've recorded below.
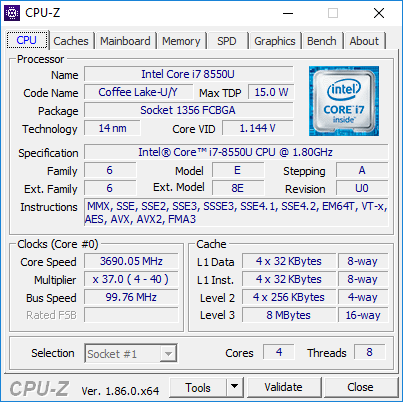

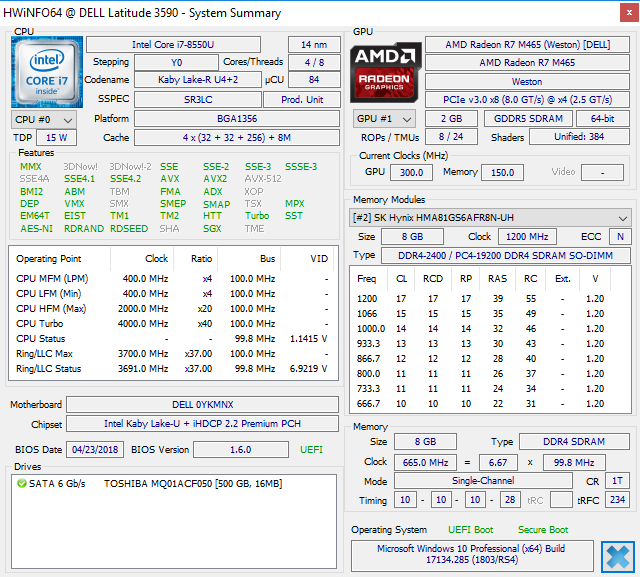
Processor
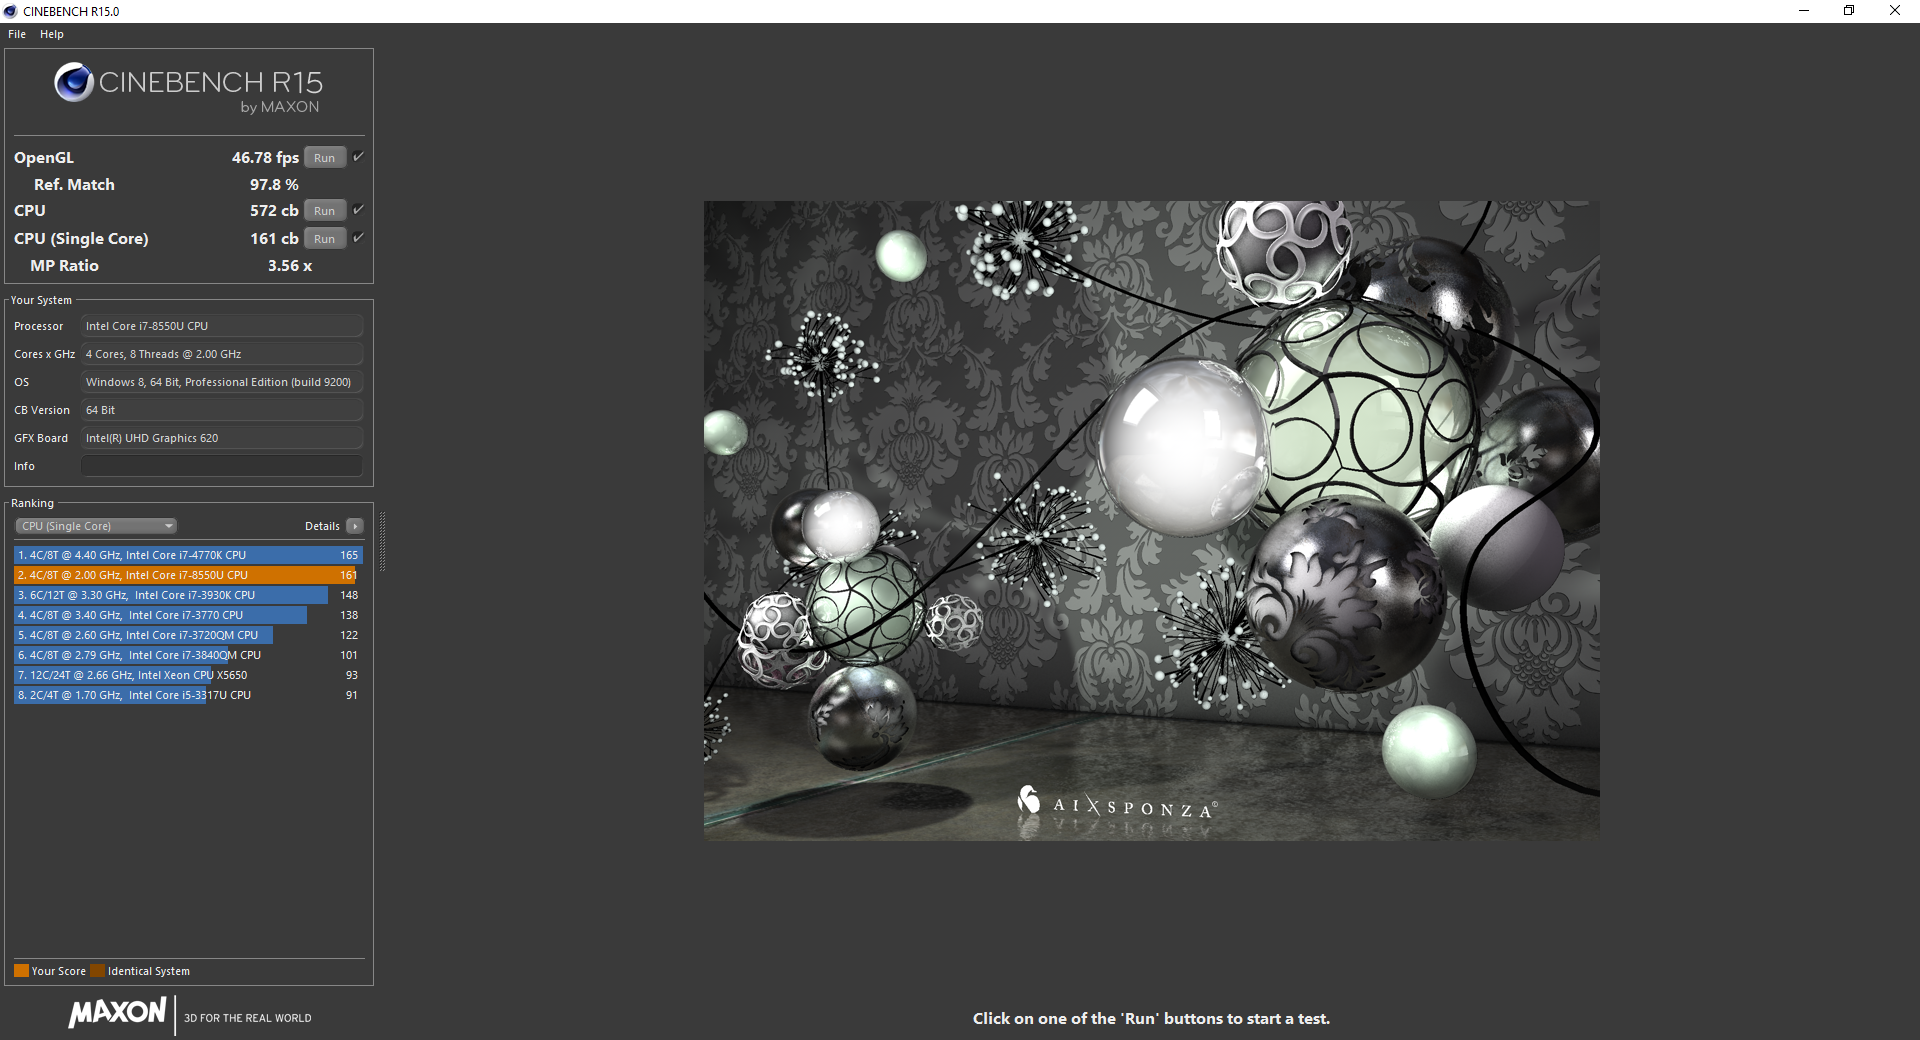
CPU performance is in line with the average i7-8550U in our database as shown by our chart below. Users can expect a multi-core performance boost of about 70 percent if jumping from the i7-7500U. Meanwhile, users who opt in for the cheaper SKU with the slower Core i3-7130U will experience a 50 percent drop in CPU performance. Note that the performance delta between a Core i5-8250U and Core i7-8550U is minor and essentially unnoticeable if simply browsing, streaming, or word processing.
We can test performance sustainability by running CineBench R15 Multi-Thread in a loop and recording any dips in scores over time. The initial score of 587 points drop to 544 points by the second loop to represent a performance drop of about 7 percent. Our Stress Test section shows falling clock rates that mirror our CineBench loop results.
See our dedicated page on the Core i7-8550U for more technical information and benchmark comparisons.
| Cinebench R11.5 | |
| CPU Single 64Bit | |
| Alienware 17 R5 | |
| Average Intel Core i7-8550U (1.43 - 1.95, n=32) | |
| Lenovo V330-15IKB | |
| CPU Multi 64Bit | |
| Alienware 17 R5 | |
| Average Intel Core i7-8550U (4.38 - 8.56, n=32) | |
| Lenovo V330-15IKB | |
| Cinebench R10 | |
| Rendering Multiple CPUs 32Bit | |
| Average Intel Core i7-8550U (11694 - 24180, n=31) | |
| Lenovo V330-15IKB | |
| Rendering Single 32Bit | |
| Average Intel Core i7-8550U (4202 - 8211, n=31) | |
| Lenovo V330-15IKB | |
| wPrime 2.10 - 1024m | |
| Lenovo V330-15IKB | |
| Lenovo ThinkPad 13 20J1005TPB | |
| Average Intel Core i7-8550U (258 - 435, n=11) | |
* ... smaller is better
System Performance
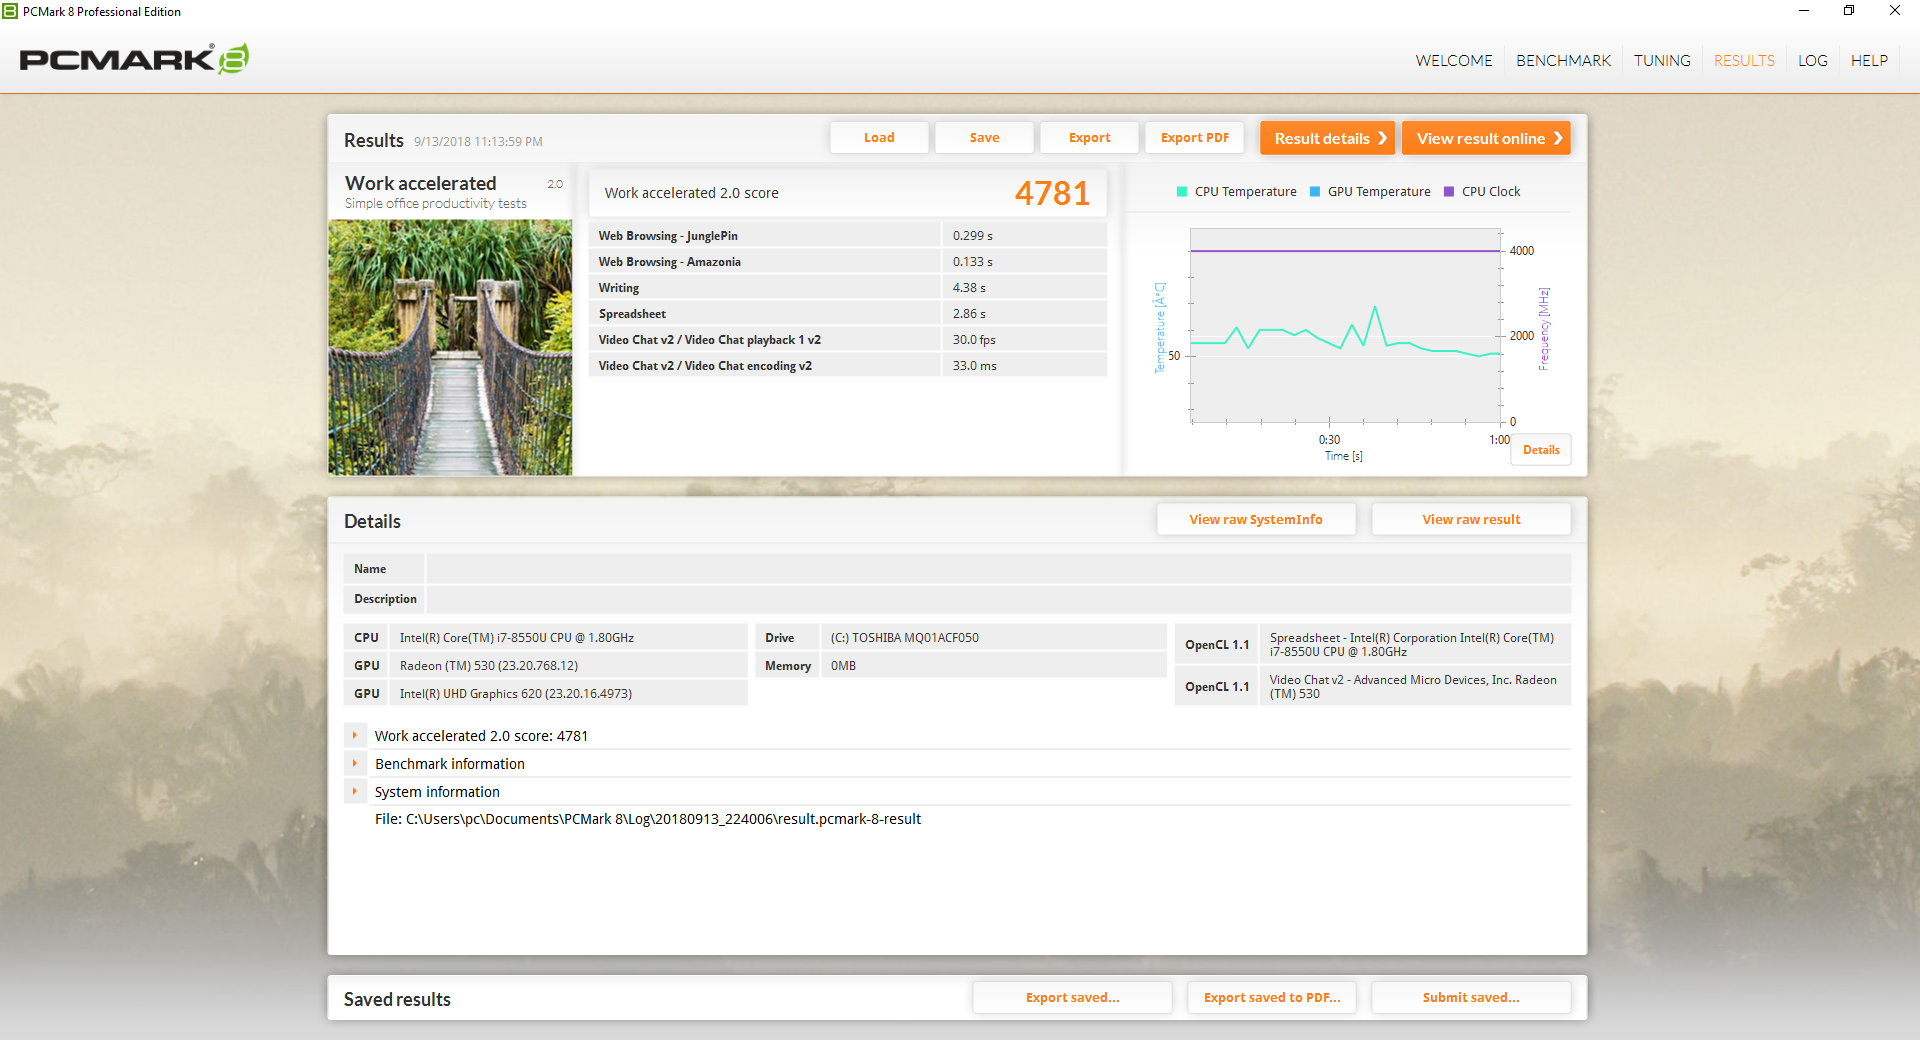
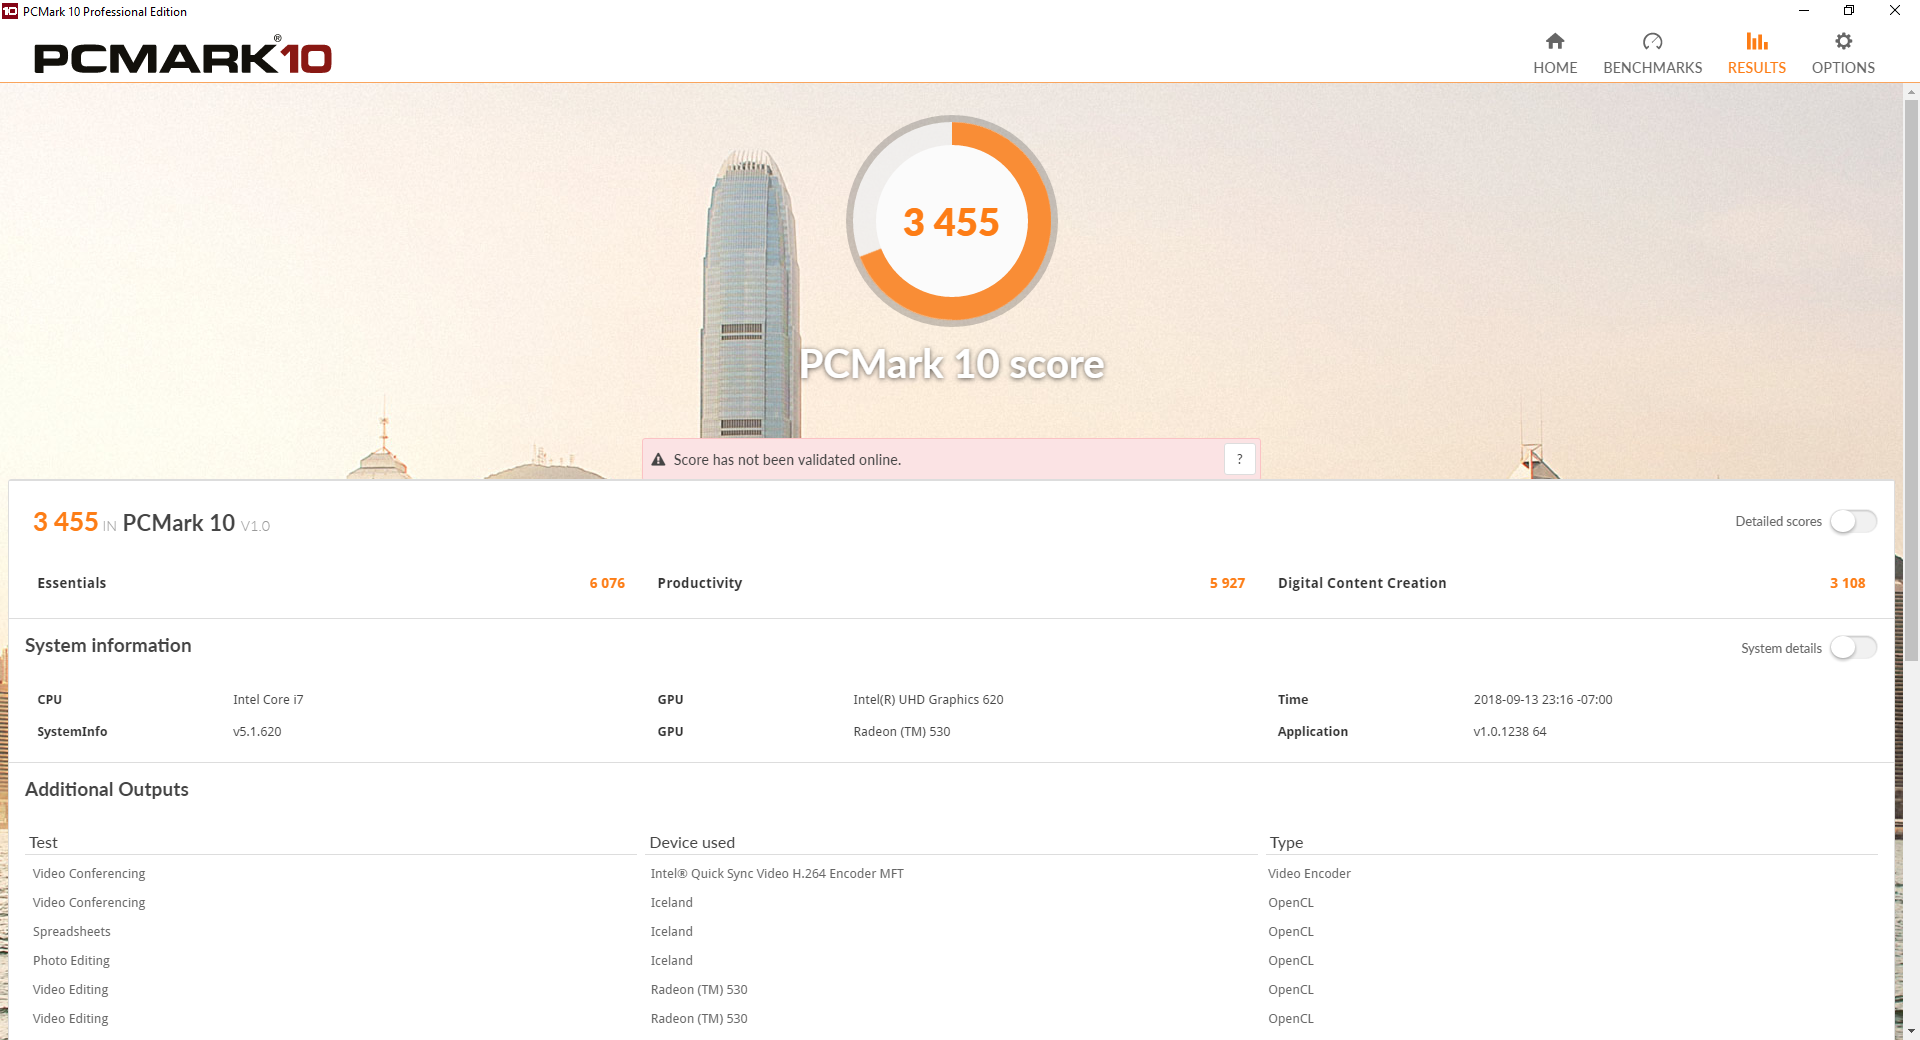
PCMark benchmarks rank our Latitude similarly to other Office-class laptops including those with just integrated Intel graphics. Its PCMark 8 Home score is the only outlier as it is higher than anticipated. Subjectively, system performance is not all that smooth with longer loading times compared to most Ultrabooks because of the primary HDD.
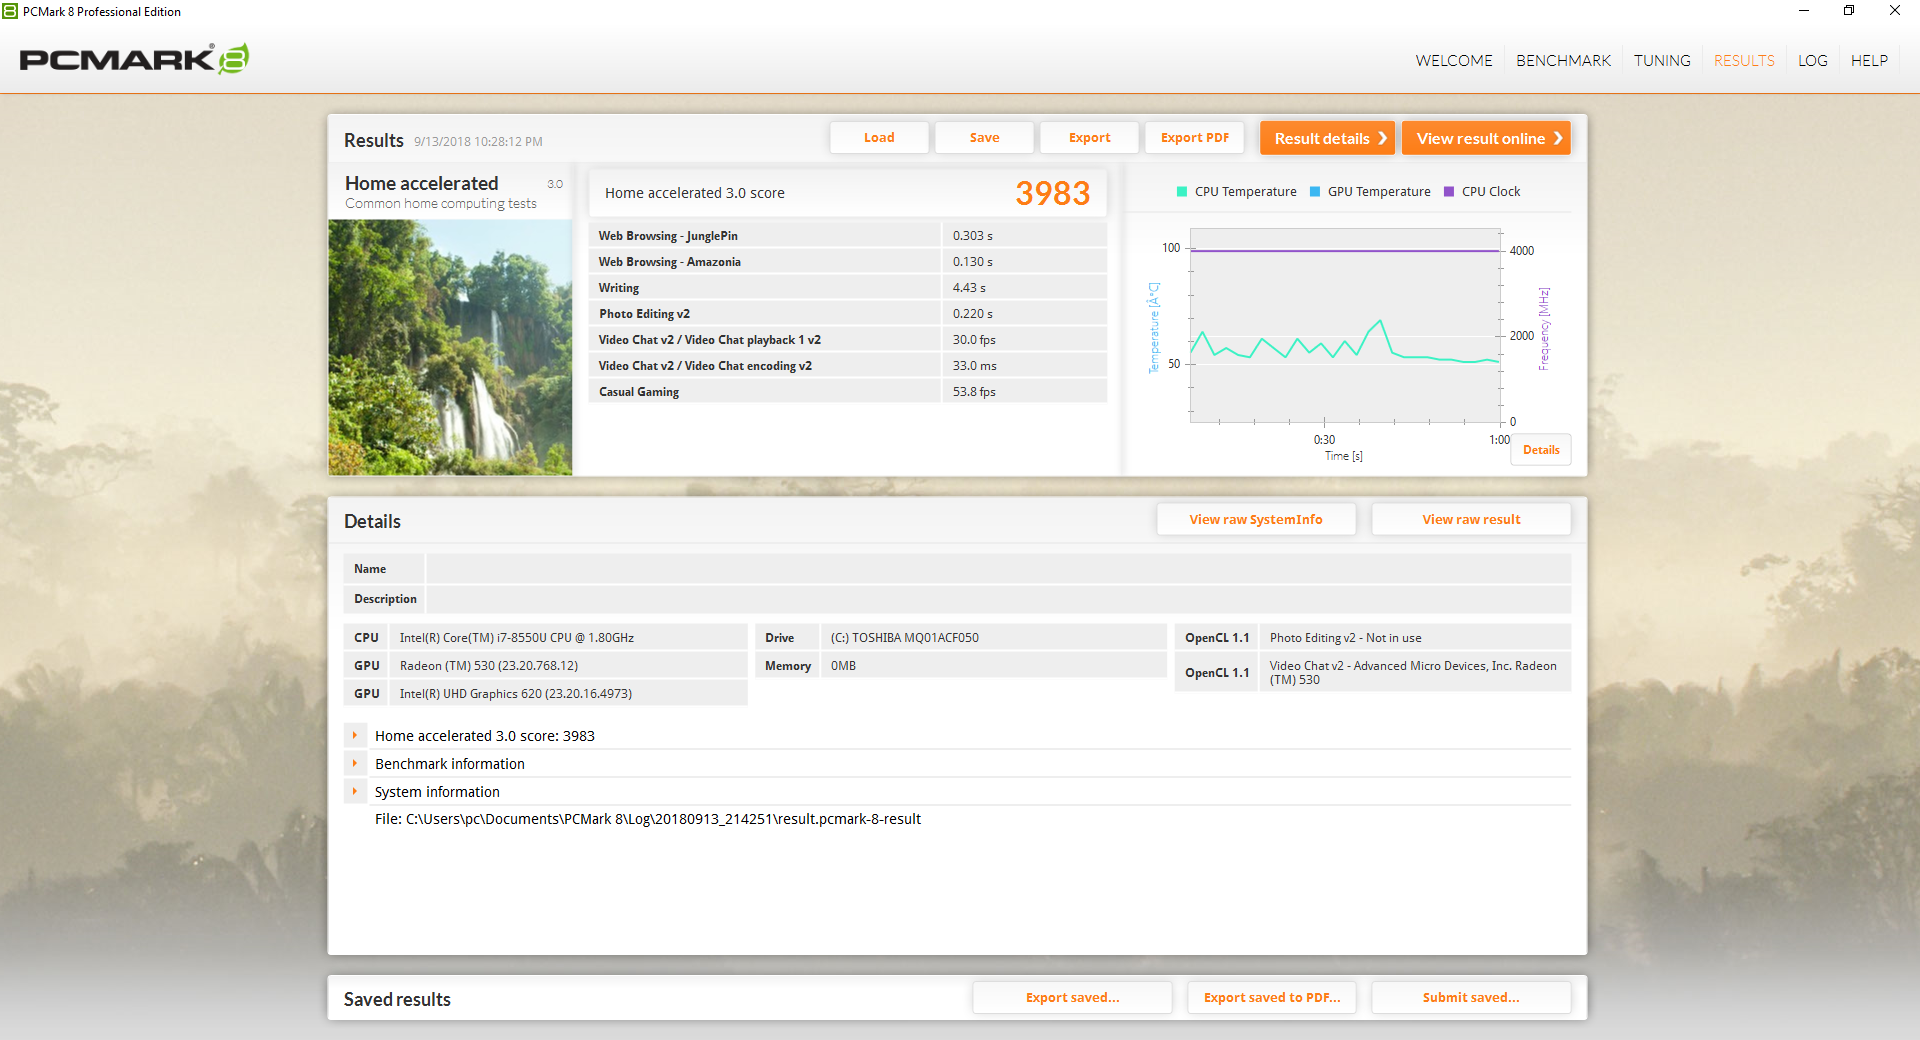
| PCMark 8 Home Score Accelerated v2 | 3983 points | |
| PCMark 8 Work Score Accelerated v2 | 4781 points | |
| PCMark 10 Score | 3455 points | |
Help | ||
Storage Devices
Two internal storage slots are available (2.5-inch SATA III + M.2 SATA). The 500 GB Toshiba MQ01ACF050 HDD in our unit shows an average transfer rate of 97 MB/s when running HD Tune. It's not bad for a 7200 RPM HDD as it is at least faster than the Seagate ST1000LM035, but performance pales in comparison to even the cheapest SATA III SSD option. If storage space is a concern, then we recommend configuring a small primary M.2 SSD for the (C:) drive with a larger secondary 2.5-inch HDD.
See our table of HDDs and SSDs for more benchmark comparisons.
| Dell Latitude 15 3590-K8JP Toshiba MQ01ACF050 | Asus VivoBook 15 F510UF-ES71 Seagate Mobile HDD 1TB ST1000LM035 | MSI Prestige PS42 8RB-059 Toshiba KSG60ZMV512G | Dell XPS 15 2018 i5 FHD 97Wh Lite-On CA3-8D256-Q11 | Lenovo IdeaPad 330-15ARR-81D2005JGE Seagate Mobile HDD 1TB ST1000LM035 | |
|---|---|---|---|---|---|
| CrystalDiskMark 5.2 / 6 | 15% | 7598% | 9873% | -30% | |
| Write 4K (MB/s) | 1.216 | 1.283 6% | 96.3 7819% | 89.4 7252% | 0.217 -82% |
| Read 4K (MB/s) | 0.451 | 0.493 9% | 25.29 5508% | 44.64 9798% | 0.367 -19% |
| Write Seq (MB/s) | 117.6 | 79.3 -33% | 475.8 305% | 830 606% | 98.8 -16% |
| Read Seq (MB/s) | 120 | 136.7 14% | 464.5 287% | 1774 1378% | 131.1 9% |
| Write 4K Q32T1 (MB/s) | 1.212 | 2.266 87% | 182 14917% | 310.6 25527% | 0.222 -82% |
| Read 4K Q32T1 (MB/s) | 0.844 | 1.068 27% | 264.6 31251% | 266.4 31464% | 0.781 -7% |
| Write Seq Q32T1 (MB/s) | 115.1 | 108.7 -6% | 512 345% | 831 622% | 97 -16% |
| Read Seq Q32T1 (MB/s) | 121.6 | 143.7 18% | 545 348% | 2962 2336% | 93.3 -23% |

GPU Performance
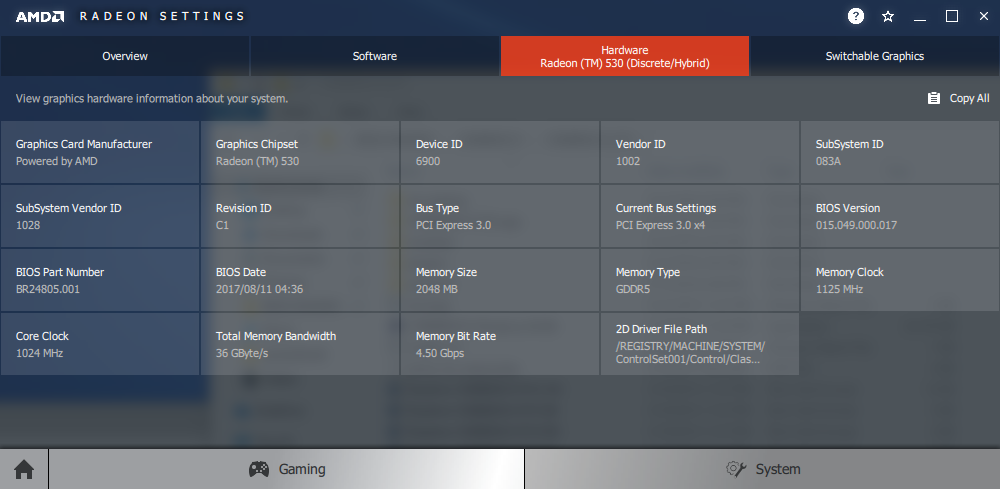
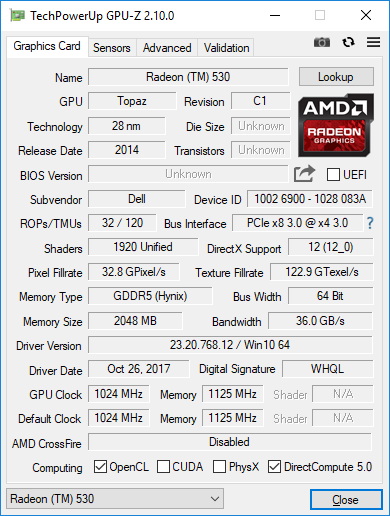
Raw graphics performance from the Radeon 530 is poor by today's standards as even the older GeForce 940MX is comparable if not slightly faster. Alternatives like the Iris Plus Graphics 655 (as found on the MacBook Pro 13) or GeForce MX130 outperform our AMD GPU while consuming less power in the process. It's still faster than the integrated UHD Graphics 620 found on most Ultrabooks, but the cost in added weight, fan noise, and temperature is a very high price.
Gaming performance is poor as expected. Older and less demanding titles can get away with a native 1080p resolution, but newer titles will be limited to very low settings and resolutions.
See our dedicated page on the Radeon 530 for more technical information and benchmark comparisons.
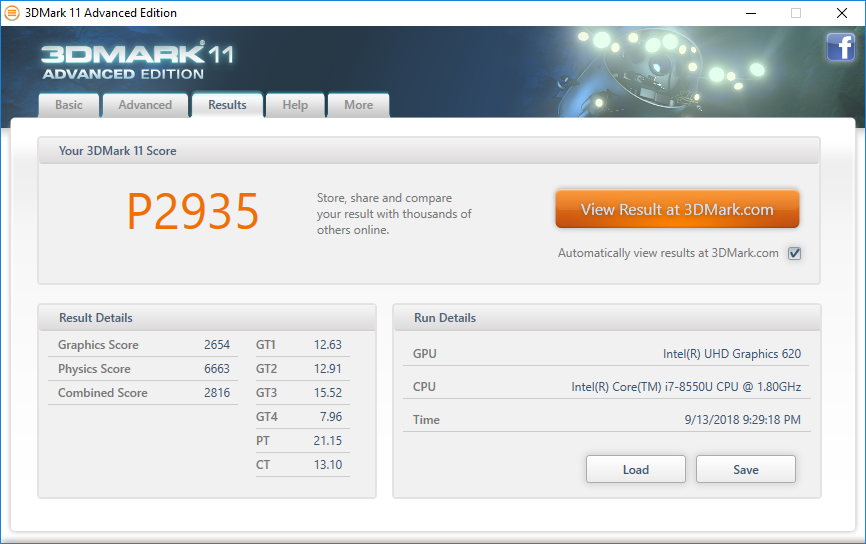
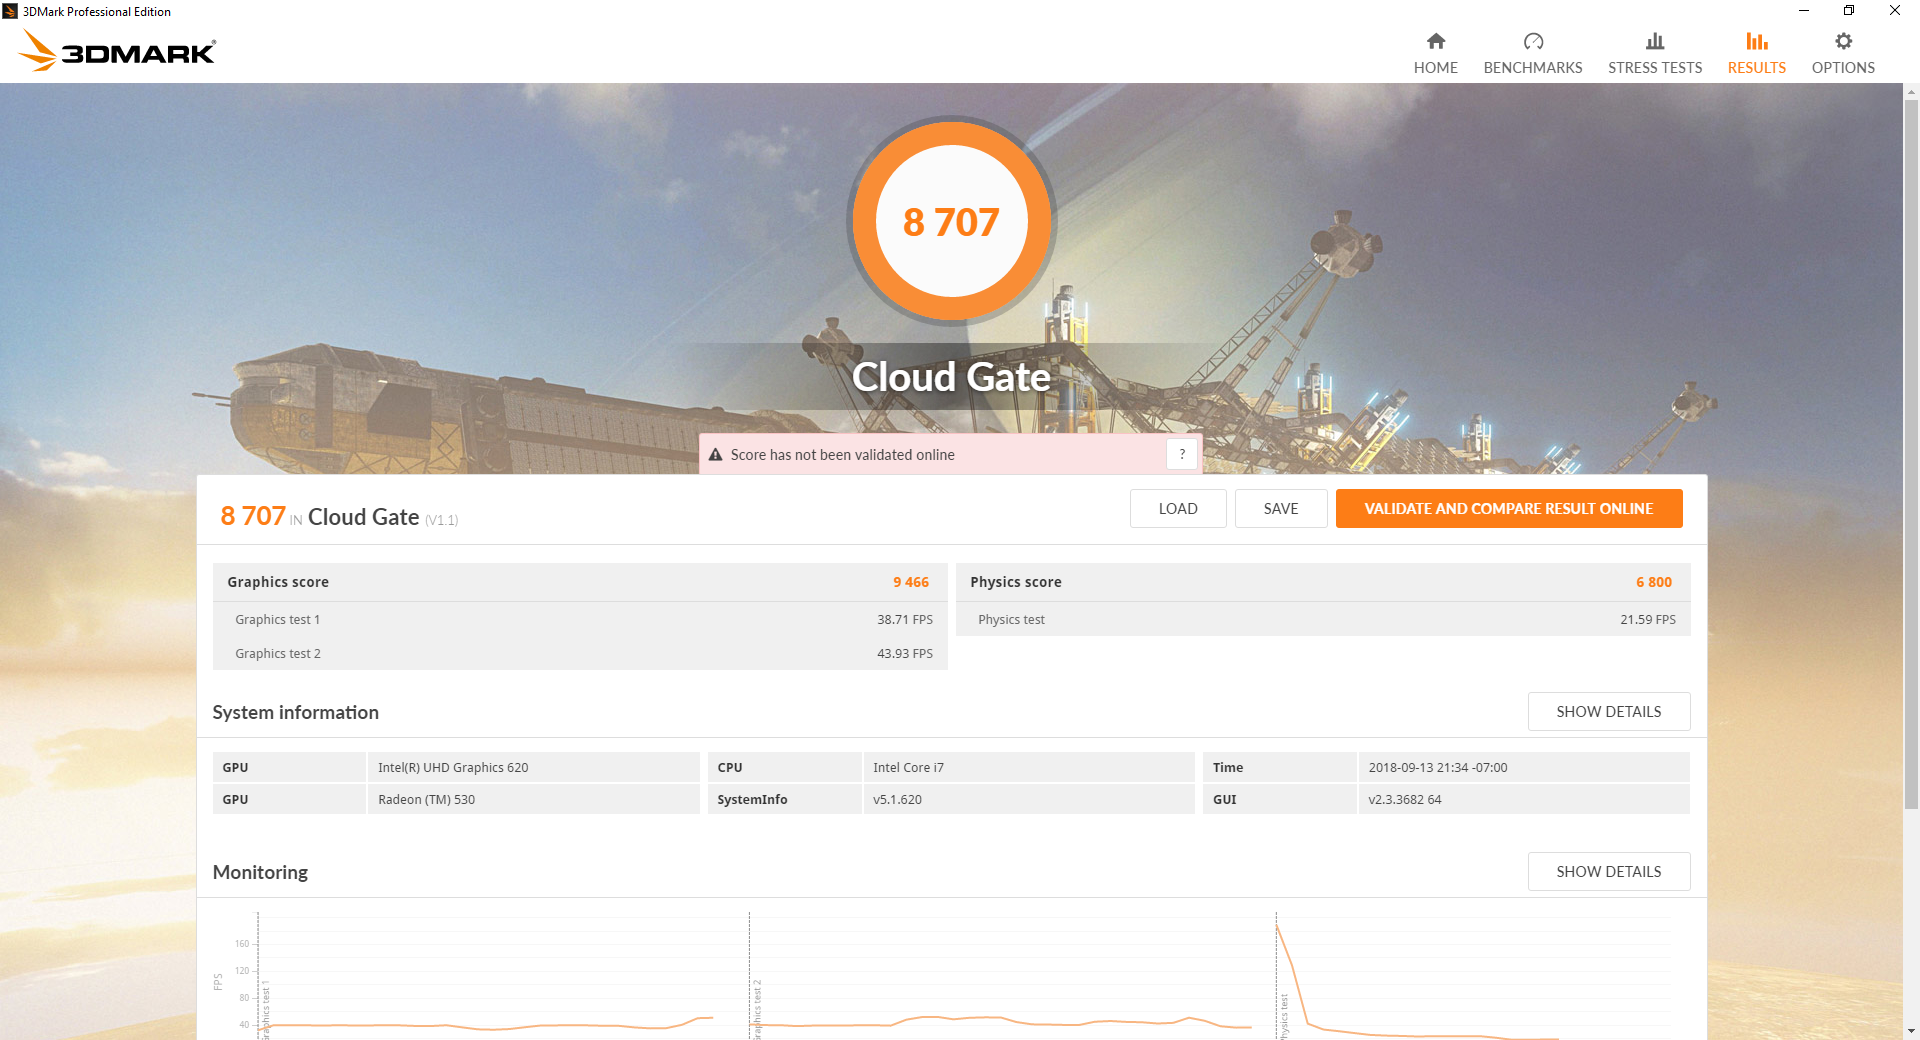
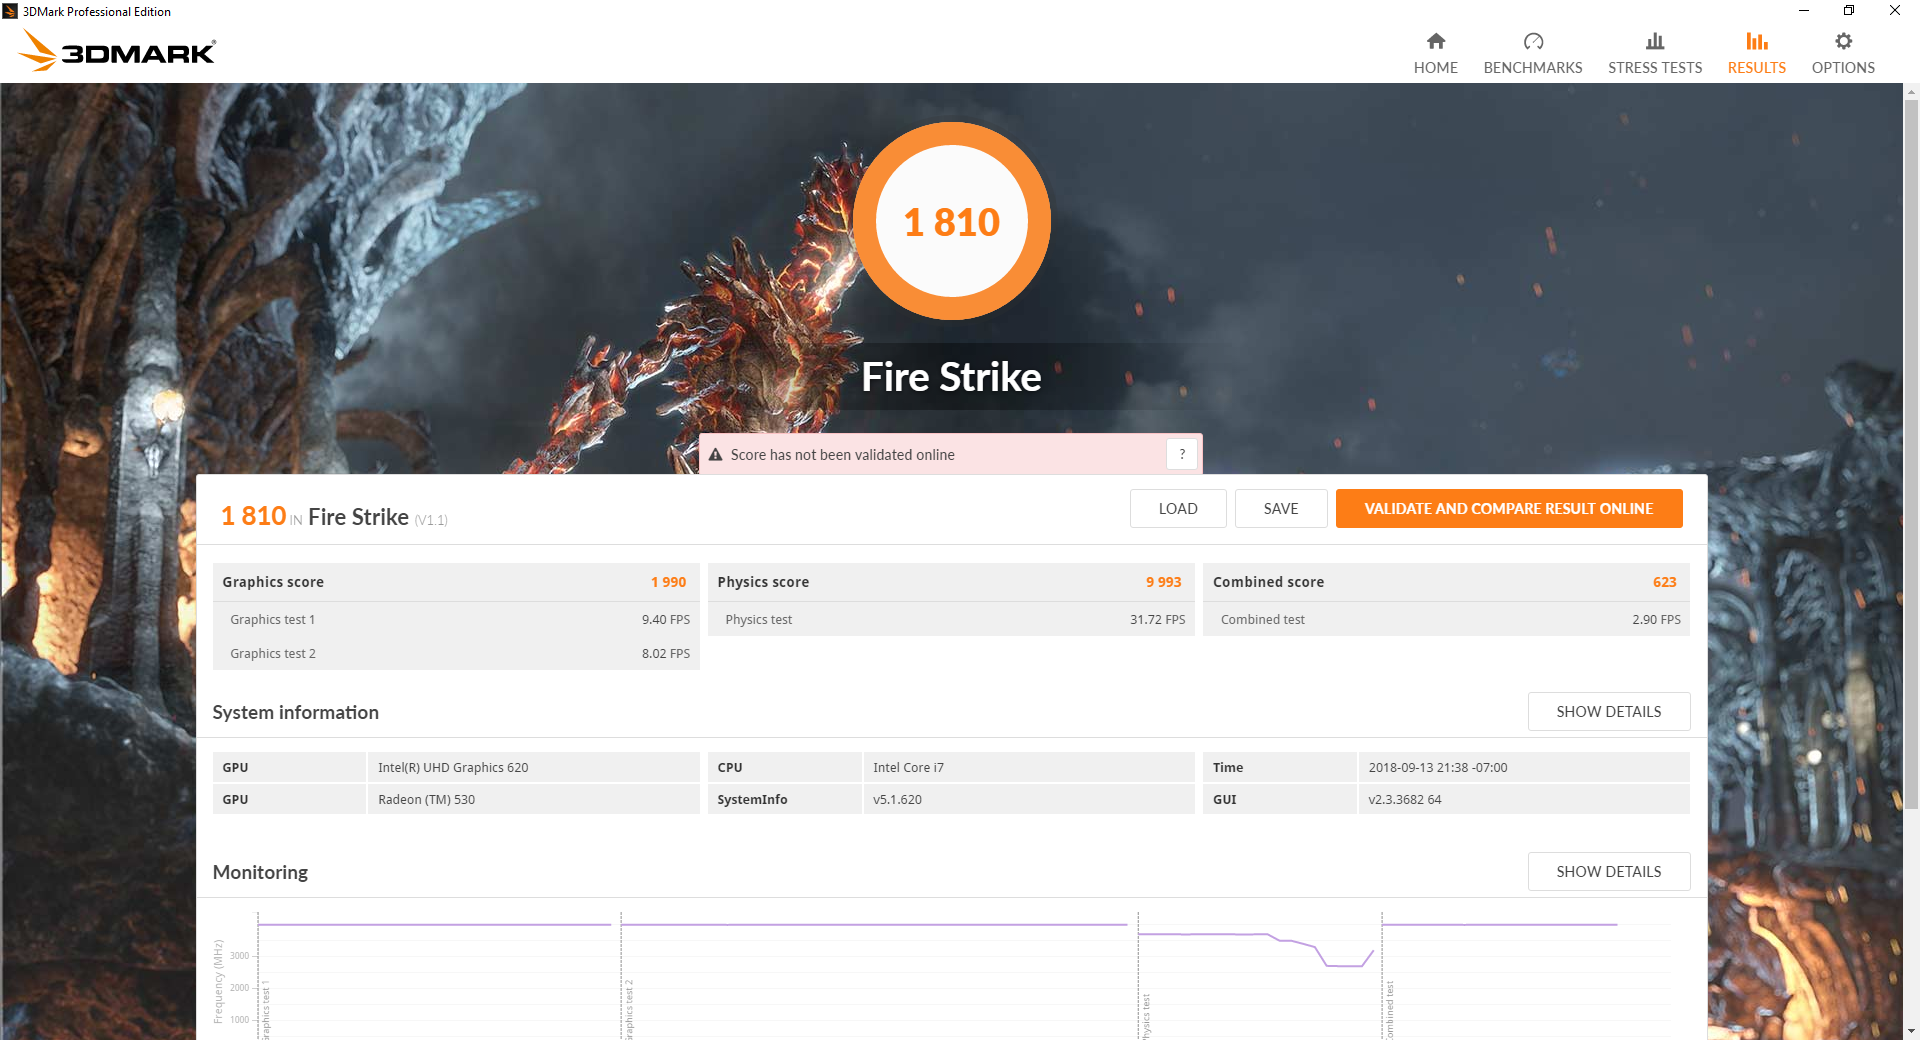
| 3DMark 11 Performance | 2935 points | |
| 3DMark Cloud Gate Standard Score | 8707 points | |
| 3DMark Fire Strike Score | 1810 points | |
Help | ||
| low | med. | high | ultra | |
|---|---|---|---|---|
| BioShock Infinite (2013) | 108.9 | 59.6 | 49.4 | 15.4 |
| The Witcher 3 (2015) | 32.8 | 19.8 | 11.1 | 6.3 |
| Rise of the Tomb Raider (2016) | 33.3 | 21.3 | 10.6 | 8.5 |
Stress Test
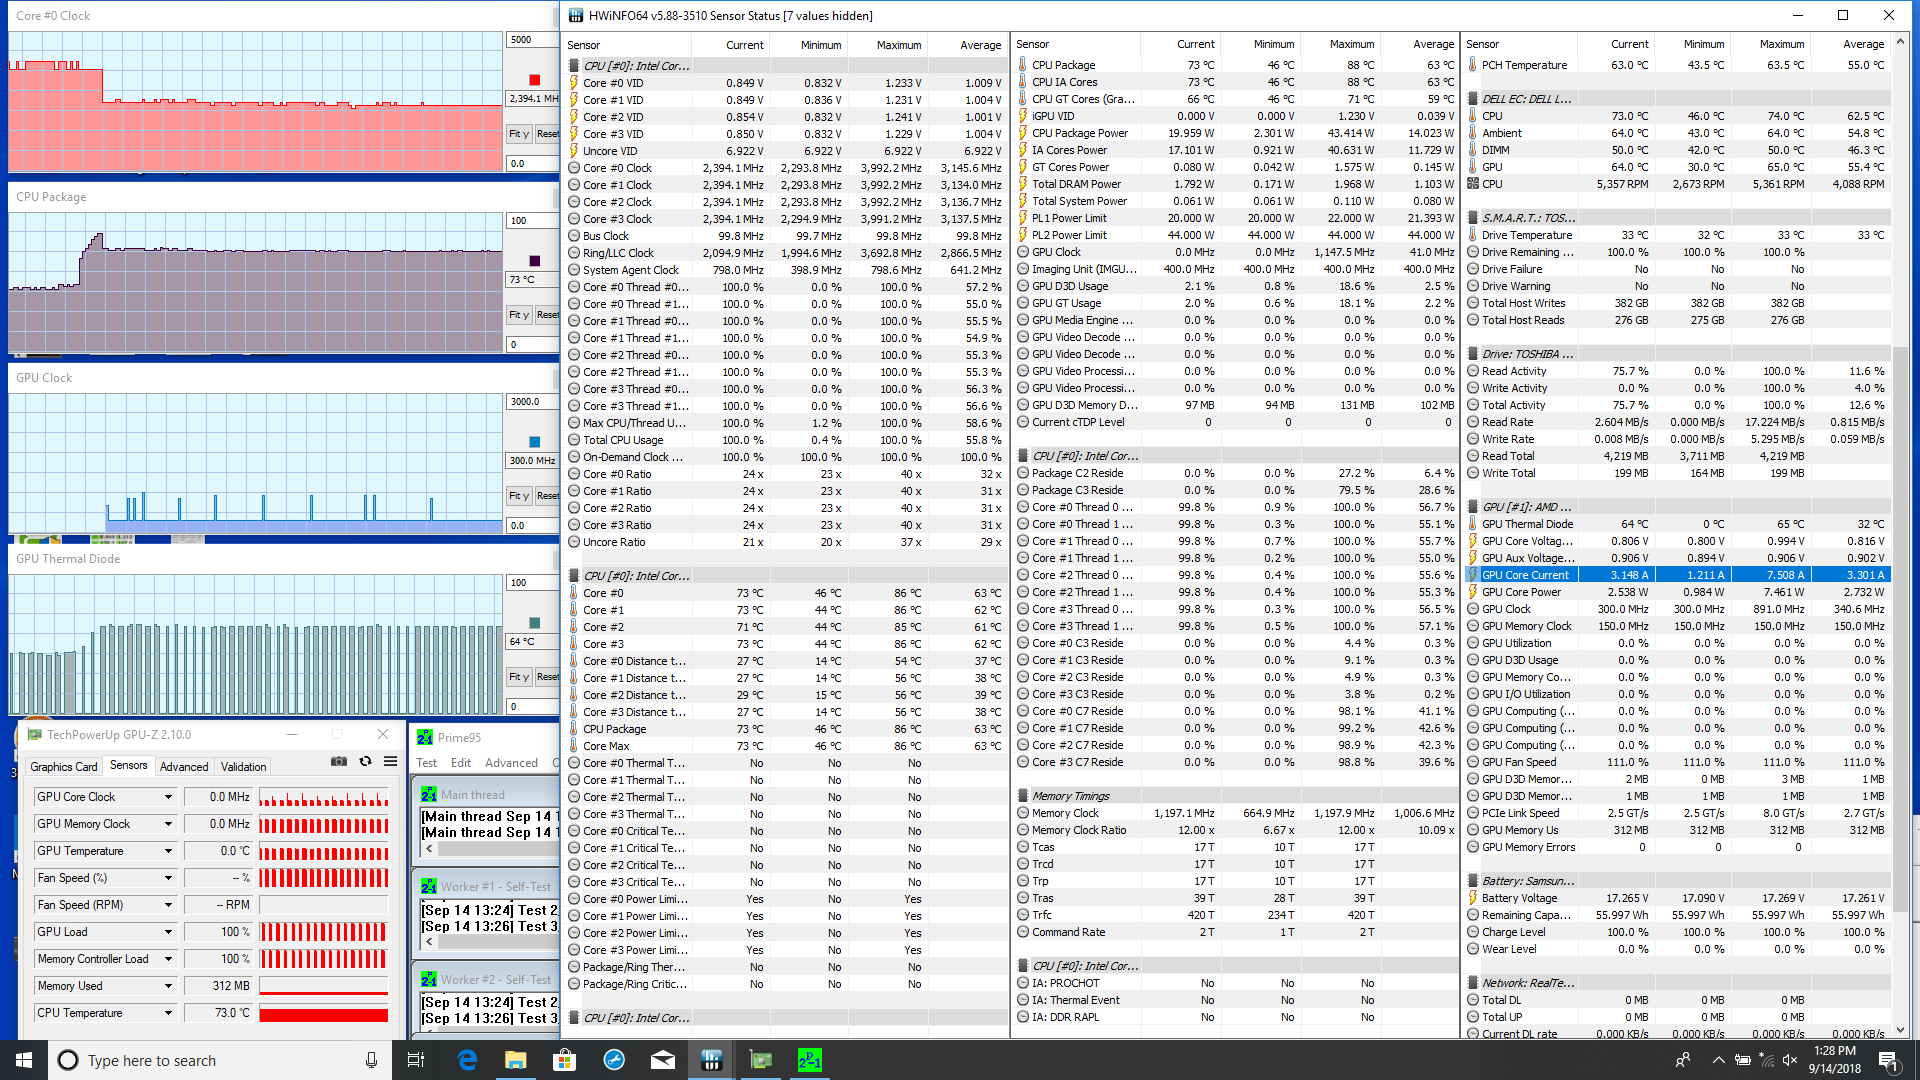
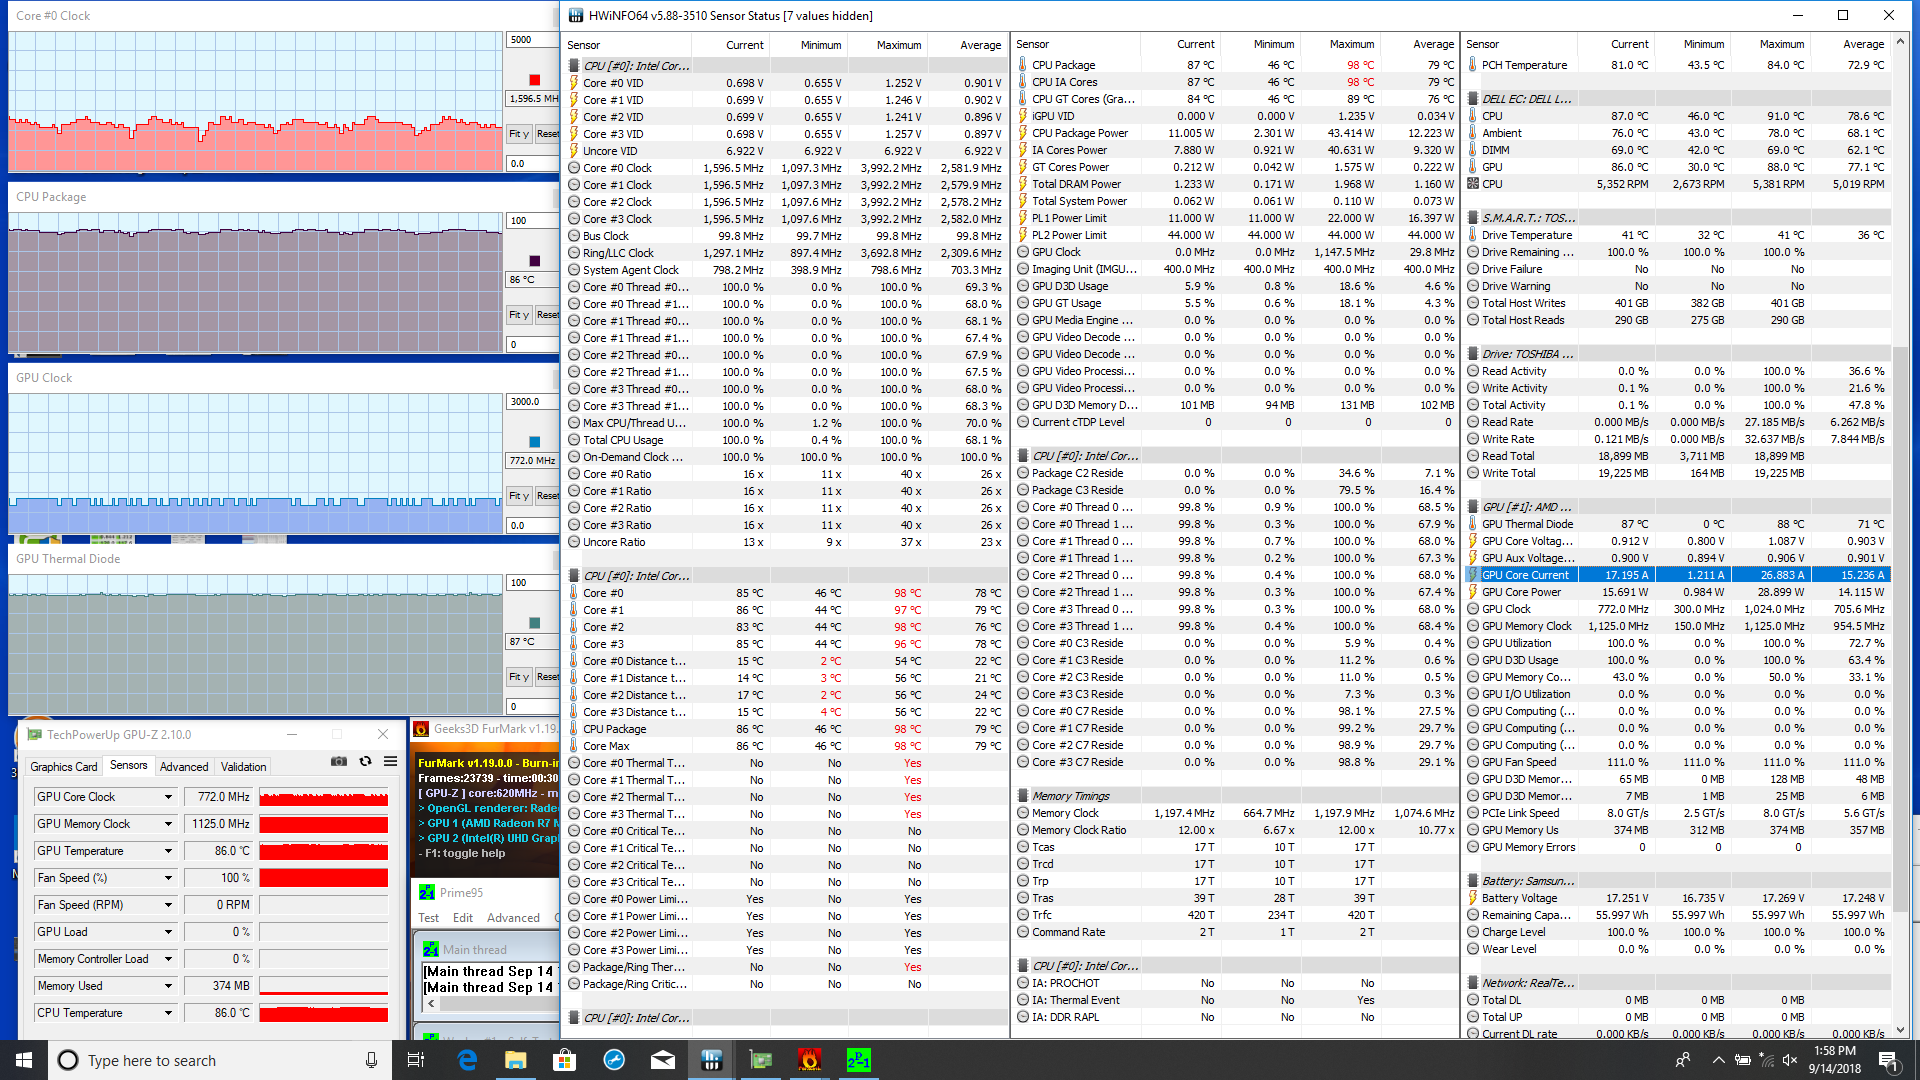
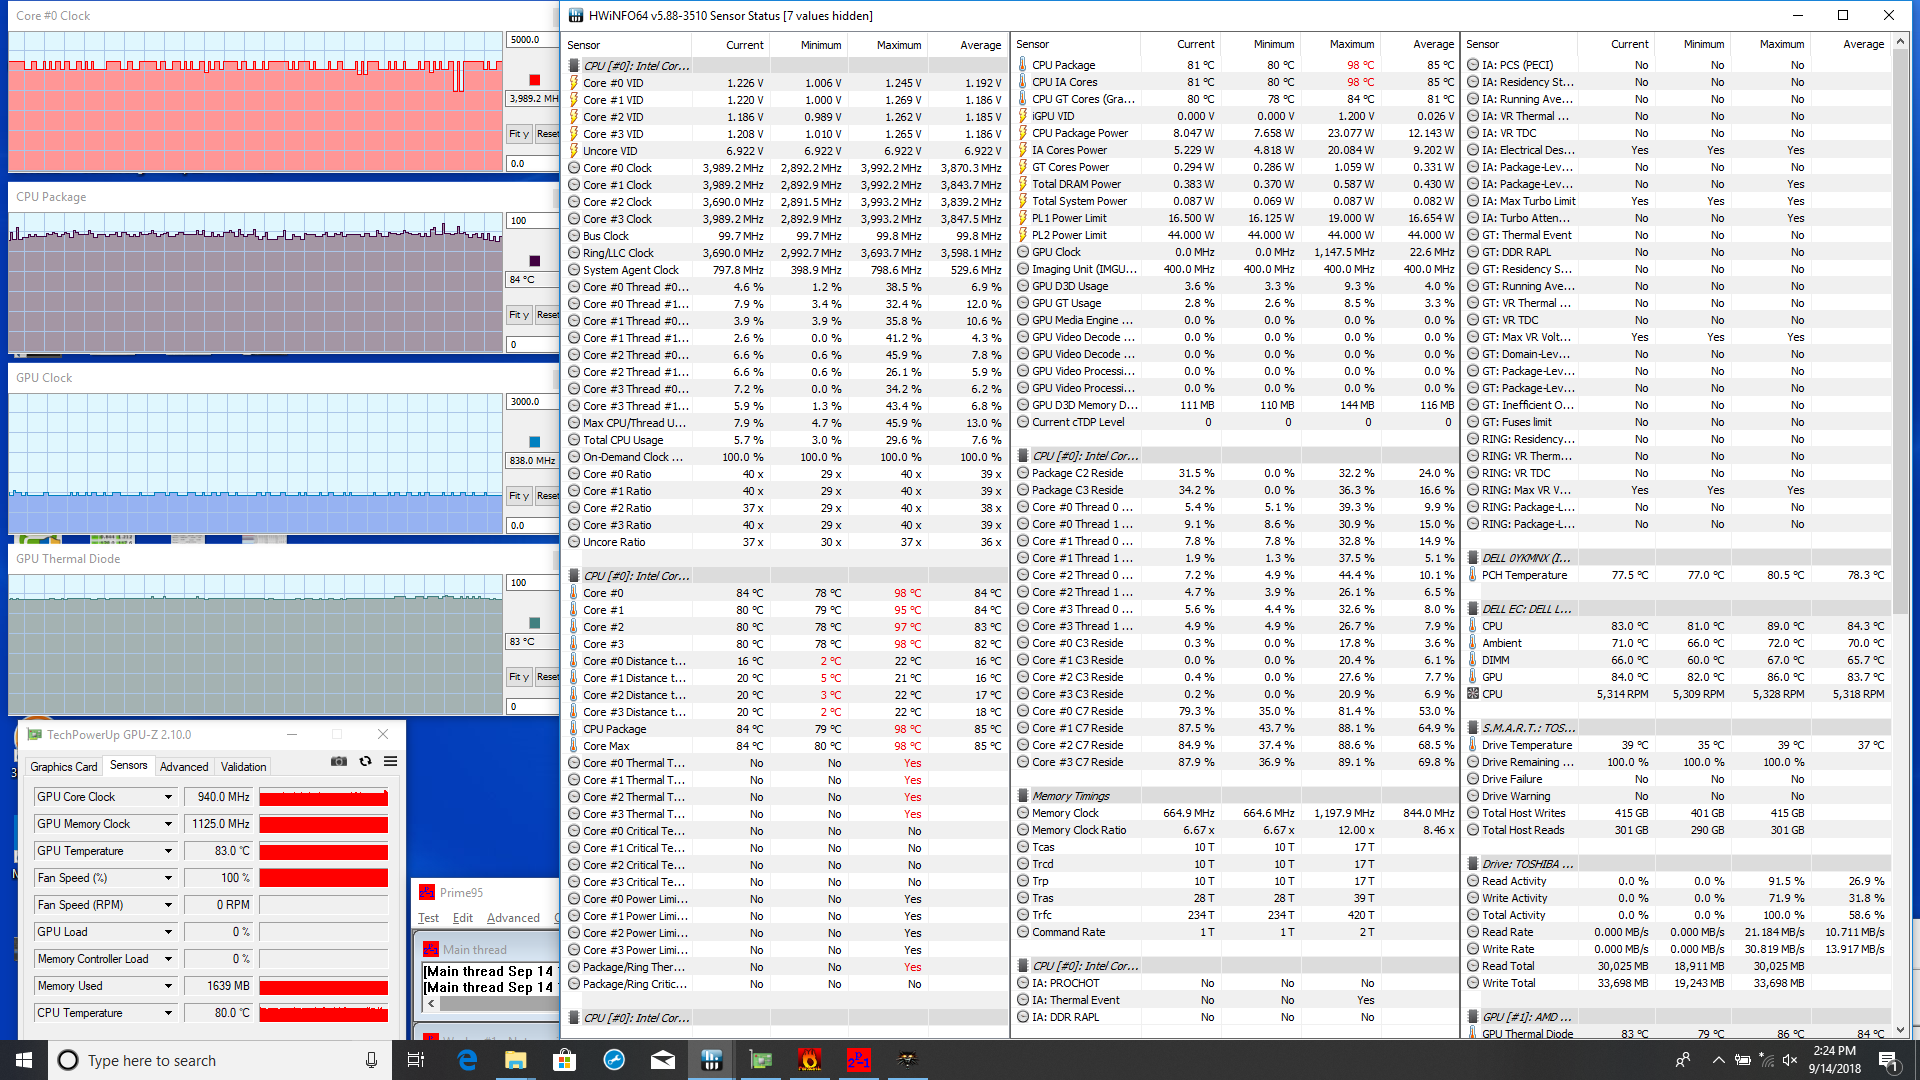
We stress the notebook with synthetic loads in order to identify for any potential throttling or stability issues. When running Prime95, we can observe a CPU clock rate of 3.7 GHz for the first few seconds before falling to 2.4 GHz when core temperature reaches 86 C. Since the base clock rate of the i7-8550U is 1.8 GHz, the Latitude 3590 is able to sustain a reasonable Turbo Boost of +600 MHz at a stable core temperature of 73 C. If running both Prime95 and FurMark simultaneously, core temperatures can reach almost 90 C and the CPU will throttle heavily to as low as 1.3 GHz.
When running Witcher 3, both the CPU and GPU run stably in the low 80 C range with no major throttling issues. While a bit too warm for desktop PCs, this temperature range is not uncommon for thin notebooks with dedicated graphics like on our Latitude system. Performance does not change when running on battery power as 3DMark scores remain almost identical.
| CPU Clock (GHz) | GPU Clock (MHz) | Average CPU Temperature (°C) | Average GPU Temperature (°C) | |
| Prime95 Stress | 2.4 | -- | 73 | 64 |
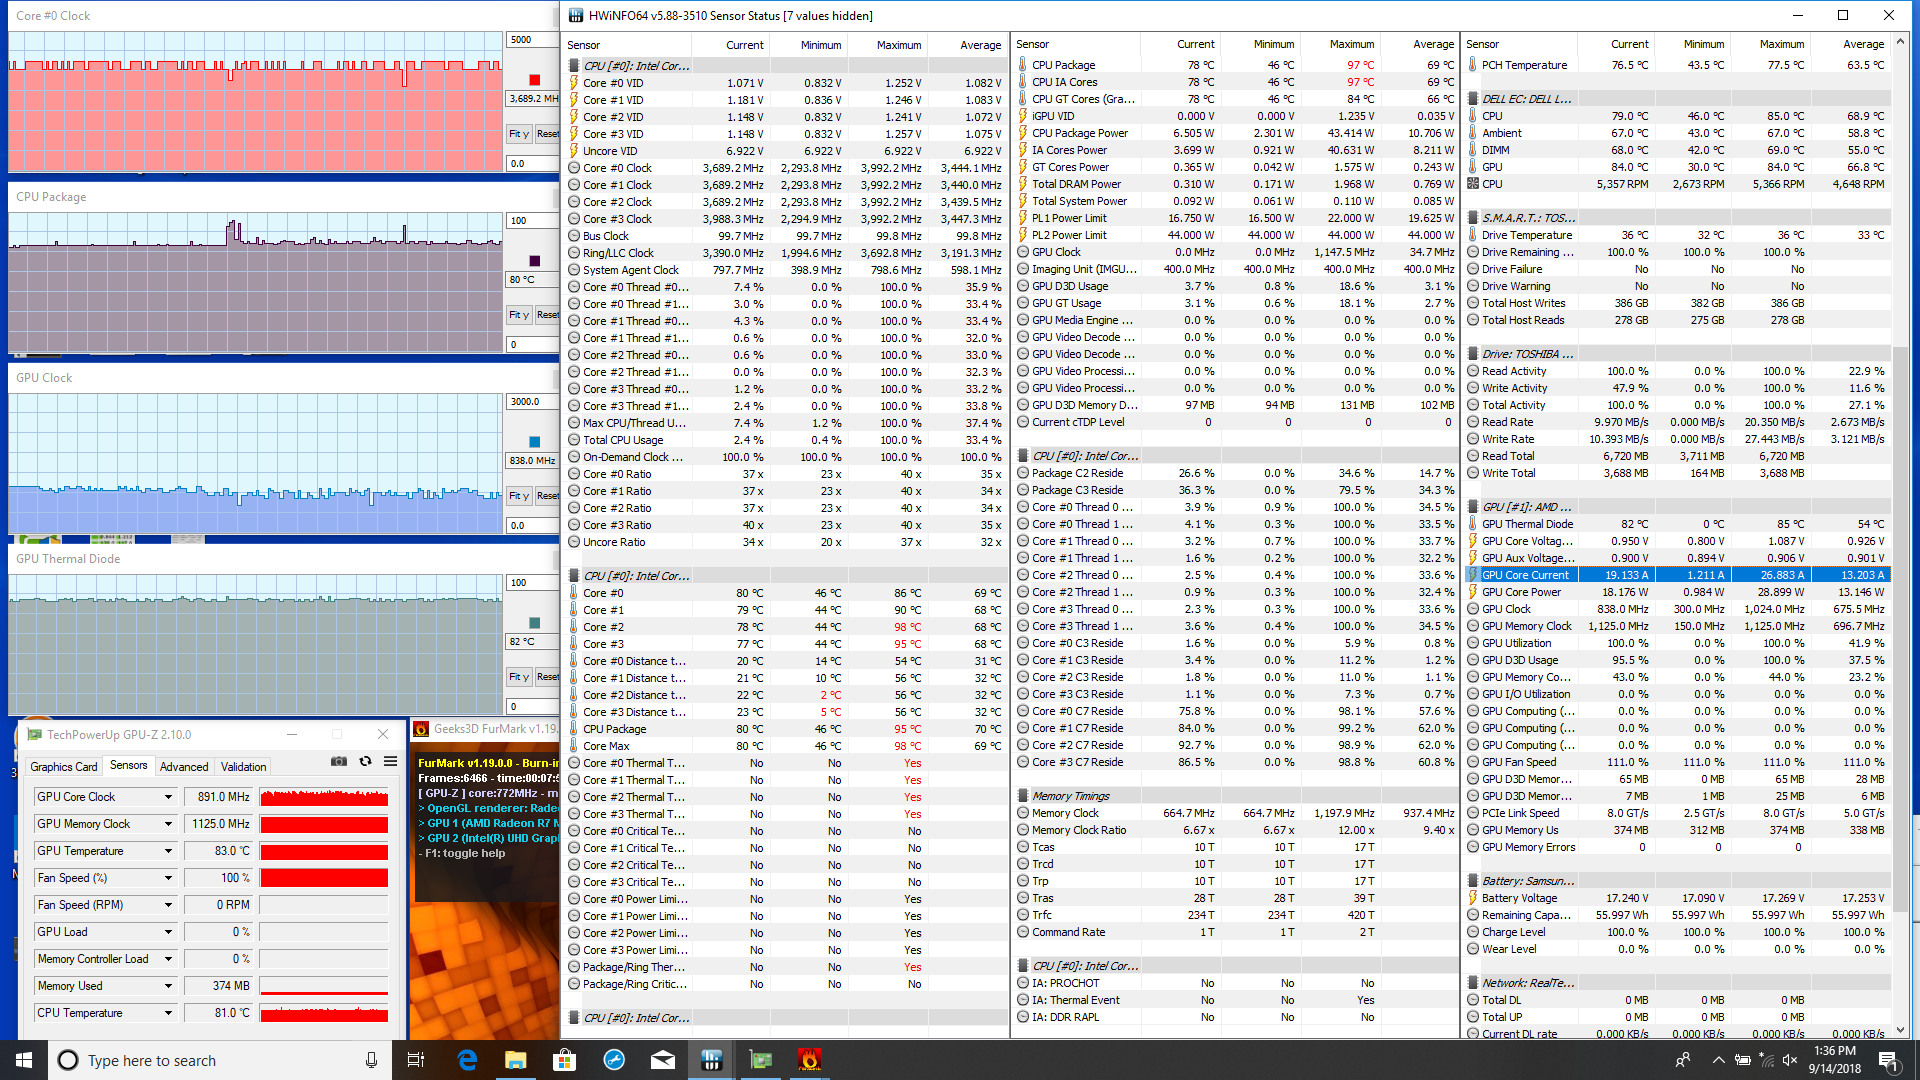
| FurMark Stress | -- | ~838 | 80 | 82 |
| Prime95 + FurMark Stress | 1.3 - 1.9 | ~772 | 86 - 89 | 87 |
| Witcher 3 Stress | ~4.0 | 838 | 84 | 83 |
Emissions
System Noise
Fan noise is somewhat disappointing. The system is never truly silent as the fan is always active no matter the load. Furthermore, fan noise jumps quickly and abruptly to as high as 45 dB(A) when under medium loads to be significantly louder than competing business laptops. Such a fan behavior is unfortunately more common on Windows laptops equipped with AMD graphics. In fact, the system is about as loud as the pricier Latitude 5591 despite having weaker CPU and GPU power.
Thankfully, we can notice no coil whine on our test unit.
Noise level
| Idle |
| 31.6 / 31.8 / 31.8 dB(A) |
| Load |
| 45.5 / 48.8 dB(A) |
 | ||
30 dB silent 40 dB(A) audible 50 dB(A) loud |
||
min: | ||
| Dell Latitude 15 3590-K8JP Radeon 530, i5-8550U, Toshiba MQ01ACF050 | Dell XPS 15 2018 i5 FHD 97Wh GeForce GTX 1050 Mobile, i5-8300H, Lite-On CA3-8D256-Q11 | Acer TravelMate P2510-G2-MG-50WE GeForce MX130, i5-8250U, SK Hynix HFS256G39TND-N210A | HP ProBook 650 G4 3UP57EA UHD Graphics 620, i5-8250U, Toshiba XG5 KXG50ZNV256G | Fujitsu Lifebook E558 E5580MP581DE UHD Graphics 620, i5-8250U, Micron 1100 MTFDDAV256TBN | HP EliteBook 755 G5 3UN79EA Vega 10, R7 2700U, Toshiba XG5 KXG50ZNV512G | Dell Latitude 5591 GeForce MX130, i7-8850H, Toshiba XG5 KXG50ZNV512G | |
|---|---|---|---|---|---|---|---|
| Noise | 7% | 8% | 4% | 11% | 8% | 3% | |
| off / environment * (dB) | 28.2 | 30.3 -7% | 30.3 -7% | 30.3 -7% | 30 -6% | 30.5 -8% | 29 -3% |
| Idle Minimum * (dB) | 31.6 | 30.3 4% | 30.3 4% | 32 -1% | 30 5% | 30.5 3% | 29 8% |
| Idle Average * (dB) | 31.8 | 30.3 5% | 30.3 5% | 33.8 -6% | 30 6% | 30.5 4% | 29 9% |
| Idle Maximum * (dB) | 31.8 | 30.3 5% | 31 3% | 34.2 -8% | 30 6% | 30.5 4% | 30.3 5% |
| Load Average * (dB) | 45.5 | 37.1 18% | 35.6 22% | 36.2 20% | 34.8 24% | 37.5 18% | 46.5 -2% |
| Witcher 3 ultra * (dB) | 49.2 | 43.3 12% | |||||
| Load Maximum * (dB) | 48.8 | 43 12% | 38.6 21% | 35.6 27% | 33.5 31% | 35 28% | 48.6 -0% |
* ... smaller is better
Temperature
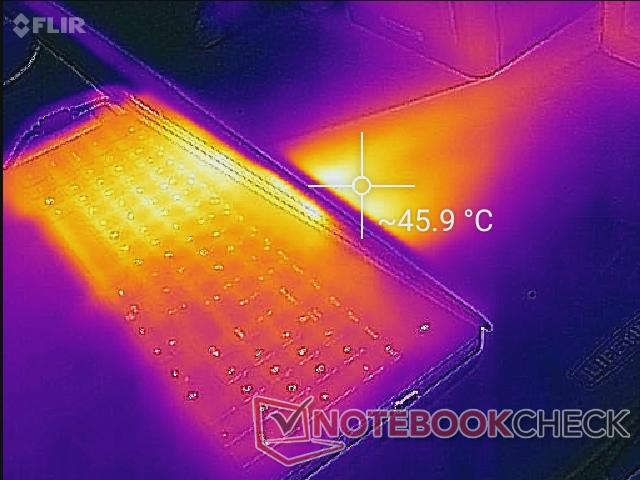
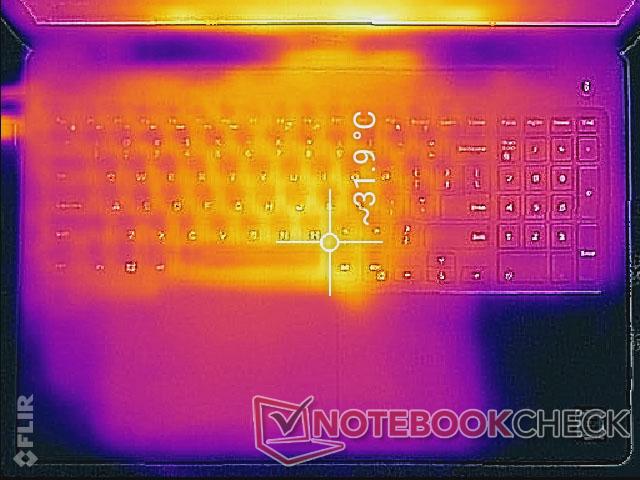
Surface temperatures when idling are flat with a warm spot near the center of the notebook around the "H" key. When running very high loads, the hot spot shifts to above the "G" key where temperature can be as warm as 50 C as shown by our temperature maps below. As a result, the temperature difference between the QWERTY keys and NumPad keys can be greater than 10 C. Notebooks like the TravelMate P2510 have superior temperature development because the hot spots are above the first row of keyboard keys where users are less likely to touch for a more comfortable typing experience. Fortunately, both palm rests remain cool no matter the system load.

(-) The maximum temperature on the upper side is 52.6 °C / 127 F, compared to the average of 34.3 °C / 94 F, ranging from 21.2 to 62.5 °C for the class Office.
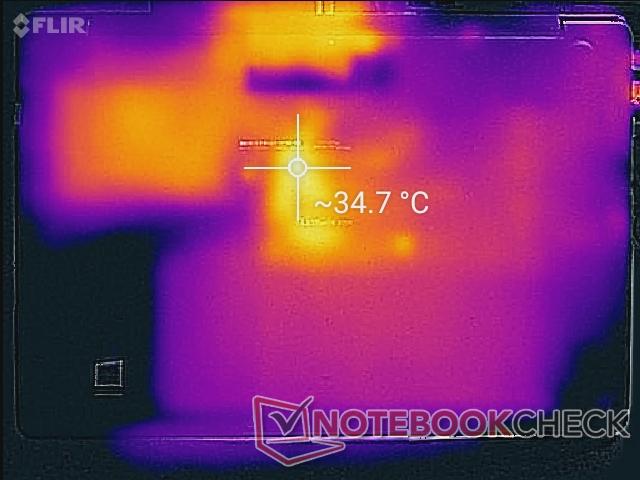
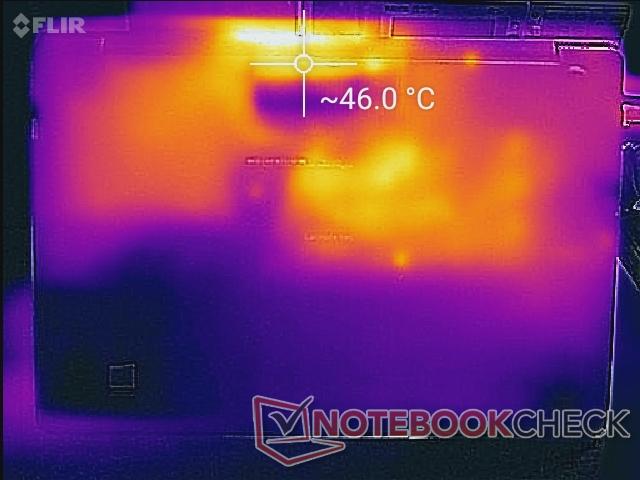
(±) The bottom heats up to a maximum of 44.4 °C / 112 F, compared to the average of 36.8 °C / 98 F
(+) In idle usage, the average temperature for the upper side is 28.2 °C / 83 F, compared to the device average of 29.5 °C / 85 F.
(±) Playing The Witcher 3, the average temperature for the upper side is 33.4 °C / 92 F, compared to the device average of 29.5 °C / 85 F.
(+) The palmrests and touchpad are cooler than skin temperature with a maximum of 31.2 °C / 88.2 F and are therefore cool to the touch.
(-) The average temperature of the palmrest area of similar devices was 27.5 °C / 81.5 F (-3.7 °C / -6.7 F).
Speakers
The integrated stereo speakers are lacking in bass for poor multimedia playback which isn't much of an issue for a business notebook. Instead, what's more important is a loud volume without any static or reverberations for clear conference calls. We can notice some very slight static when on maximum volume, but it's not enough to be distracting.
The same WavesMaxxAudio Pro software used on the XPS series is also found here on the Latitude.


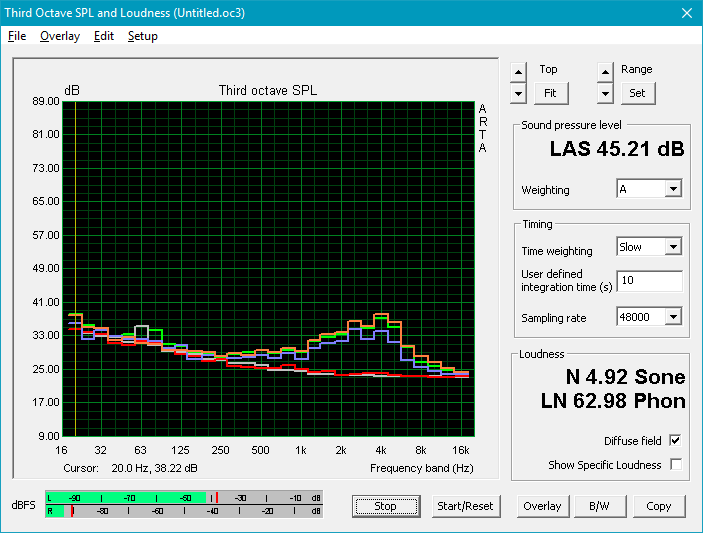
Dell Latitude 15 3590-K8JP audio analysis
(±) | speaker loudness is average but good (75.3 dB)
Bass 100 - 315 Hz
(-) | nearly no bass - on average 22% lower than median
(±) | linearity of bass is average (12.2% delta to prev. frequency)
Mids 400 - 2000 Hz
(±) | reduced mids - on average 5.5% lower than median
(+) | mids are linear (5.6% delta to prev. frequency)
Highs 2 - 16 kHz
(+) | balanced highs - only 4.9% away from median
(±) | linearity of highs is average (12.5% delta to prev. frequency)
Overall 100 - 16.000 Hz
(±) | linearity of overall sound is average (25.3% difference to median)
Compared to same class
» 76% of all tested devices in this class were better, 7% similar, 17% worse
» The best had a delta of 7%, average was 21%, worst was 53%
Compared to all devices tested
» 78% of all tested devices were better, 5% similar, 18% worse
» The best had a delta of 4%, average was 24%, worst was 134%
Apple MacBook 12 (Early 2016) 1.1 GHz audio analysis
(+) | speakers can play relatively loud (83.6 dB)
Bass 100 - 315 Hz
(±) | reduced bass - on average 11.3% lower than median
(±) | linearity of bass is average (14.2% delta to prev. frequency)
Mids 400 - 2000 Hz
(+) | balanced mids - only 2.4% away from median
(+) | mids are linear (5.5% delta to prev. frequency)
Highs 2 - 16 kHz
(+) | balanced highs - only 2% away from median
(+) | highs are linear (4.5% delta to prev. frequency)
Overall 100 - 16.000 Hz
(+) | overall sound is linear (10.2% difference to median)
Compared to same class
» 7% of all tested devices in this class were better, 2% similar, 91% worse
» The best had a delta of 5%, average was 18%, worst was 53%
Compared to all devices tested
» 5% of all tested devices were better, 1% similar, 94% worse
» The best had a delta of 4%, average was 24%, worst was 134%
Energy Management
Power Consumption
When idling, the system draws an average of about 8 W no matter the power profile due to spikes in background activity and thus power consumption during testing. Running higher loads demands a little over 60 W to be slightly more than other 15-inch notebooks equipped with the GeForce MX150 GPU. The results are disappointing because the MX150 is indubitably more powerful than the Radeon 530 and yet the AMD solution is noticeably more power hungry.
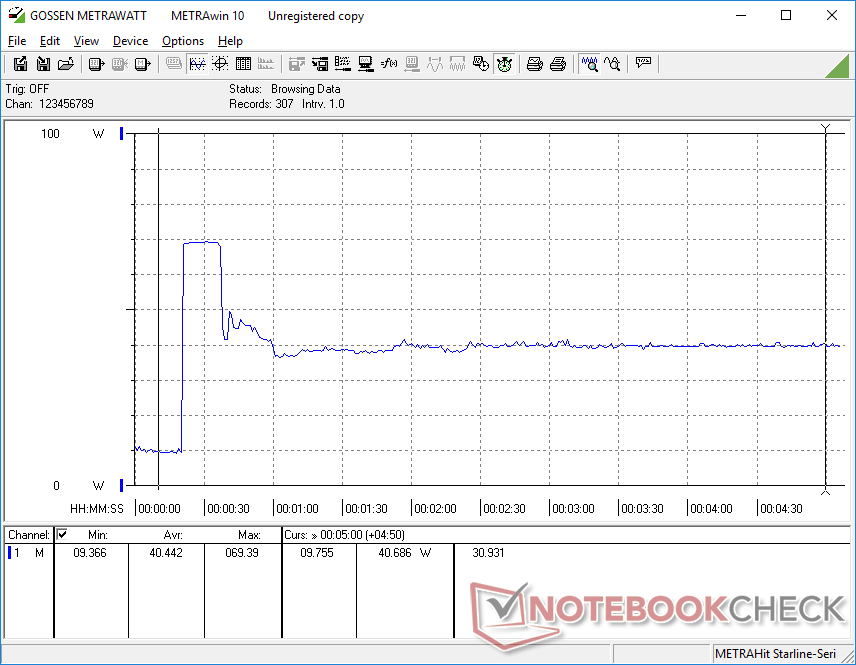
When running Prime95, we can observe a spike in power consumption at up to 69 W for the first few seconds before falling and stabilizing at 40.7 W due to throttling as shown by our graph on the right. This behavior backs up what we recorded above when running our CineBench loop test.
The small (~10.5 x 4.5 x 3.0 cm) 65 W AC adapter is sufficient for the system albeit barely when running at maximum load.
| Off / Standby | |
| Idle | |
| Load |
|
Key:
min: | |
| Dell Latitude 15 3590-K8JP i5-8550U, Radeon 530, Toshiba MQ01ACF050, TN LED, 1920x1080, 15.6" | Dell XPS 15 9570 i7 UHD i7-8750H, GeForce GTX 1050 Ti Max-Q, Toshiba XG5 KXG50ZNV512G, IPS, 3840x2160, 15.6" | Acer TravelMate P2510-G2-MG-50WE i5-8250U, GeForce MX130, SK Hynix HFS256G39TND-N210A, IPS, 1920x1080, 15.6" | HP ProBook 650 G4 3UP57EA i5-8250U, UHD Graphics 620, Toshiba XG5 KXG50ZNV256G, IPS LED, 1920x1080, 15.6" | HP EliteBook 755 G5 3UN79EA R7 2700U, Vega 10, Toshiba XG5 KXG50ZNV512G, IPS, 1920x1080, 15.6" | Huawei MateBook D 15-53010BAJ i5-8250U, GeForce MX150, Samsung SSD PM981 MZVLB512HAJQ, IPS, 1920x1080, 15.6" | |
|---|---|---|---|---|---|---|
| Power Consumption | -71% | 24% | 42% | 5% | 8% | |
| Idle Minimum * (Watt) | 8.2 | 9.48 -16% | 3.3 60% | 3.2 61% | 5 39% | 4.2 49% |
| Idle Average * (Watt) | 8.4 | 16.1 -92% | 5.6 33% | 6 29% | 10.6 -26% | 7.2 14% |
| Idle Maximum * (Watt) | 8.4 | 16.9 -101% | 7.8 7% | 6.4 24% | 12.9 -54% | 12.1 -44% |
| Load Average * (Watt) | 62.6 | 90.8 -45% | 54 14% | 34 46% | 40.6 35% | 51.1 18% |
| Witcher 3 ultra * (Watt) | 53.6 | 52.7 2% | ||||
| Load Maximum * (Watt) | 66.8 | 134.4 -101% | 63 6% | 34.4 49% | 46.6 30% | 59.9 10% |
* ... smaller is better
Battery Life
Expect a runtime of almost 7 hours from the internal 56 Wh battery when browsing the web compared to 8 hours or more on the HP ProBook 650 G4 or Acer TravelMate P2510 when under similar conditions. Note that lower-end SKUs of the Latitude 3590 may be equipped with a smaller 42 Wh battery that will produce shorter runtimes than what we've recorded below.
Charging from near empty to full capacity will take just under 2 hours.
| Dell Latitude 15 3590-K8JP i5-8550U, Radeon 530, 56 Wh | Dell XPS 15 9570 i7 UHD i7-8750H, GeForce GTX 1050 Ti Max-Q, 97 Wh | Acer TravelMate P2510-G2-MG-50WE i5-8250U, GeForce MX130, 48 Wh | HP ProBook 650 G4 3UP57EA i5-8250U, UHD Graphics 620, 48 Wh | Fujitsu Lifebook E558 E5580MP581DE i5-8250U, UHD Graphics 620, 50 Wh | HP EliteBook 755 G5 3UN79EA R7 2700U, Vega 10, 56 Wh | |
|---|---|---|---|---|---|---|
| Battery runtime | 5% | 15% | 21% | 6% | -2% | |
| Reader / Idle (h) | 14.3 | 11.9 -17% | ||||
| WiFi v1.3 (h) | 6.8 | 9.6 41% | 8.4 24% | 8.2 21% | 7.2 6% | 8.3 22% |
| Load (h) | 1.9 | 1.3 -32% | 2 5% | 1.7 -11% | ||
| Witcher 3 ultra (h) | 1 |
Pros
Cons
Verdict
The Latitude 3590 targets budget-conscious business users who aren't looking for the best display or attractive design. It's an underwhelming system that just barely gets the job done with its poorly calibrated colors, cheap plastic keys, relatively loud fan noise, and soft trackpad. Not bad for the low starting price of under $500 USD, but definitely not worth anywhere near the $1000 asking price of the higher-end configurations.
There are numerous outdated aspects of the Latitude 3590 that we hope will be addressed in future revisions. Firstly, the proprietary AC adapter is inconvenient and becoming obsolete when USB Type-C charging of up to 100 W is readily available. The competing ThinkPad E580, for example, has already dropped the AC adapter port for USB Type-C. Secondly, the optional fingerprint reader is only a touch fingerprint reader instead of the power button combo found on newer XPS models. Lastly, the lack of GeForce MX Pascal graphics is unfortunate since there is already an option for the aging Radeon 530. These newer features could have been implemented without significantly affecting the price of the model.
The biggest reasons for owning a Latitude 3590 are its low price of entry and the extensive warranty options available. Otherwise, competitors like the ProBook 650 G4, TravelMate P2510, and ThinkPad E580 are easier to self-service and offer a bit more bang for the buck. Avoid the costlier configurations because even the cheapest Latitude 5590 would be the superior buy.
Dell Latitude 15 3590-K8JP
- 09/20/2018 v6 (old)
Allen Ngo
Price comparison
