Asus VivoBook 15 F510UF (i7-8550U, GeForce MX130) Laptop Review
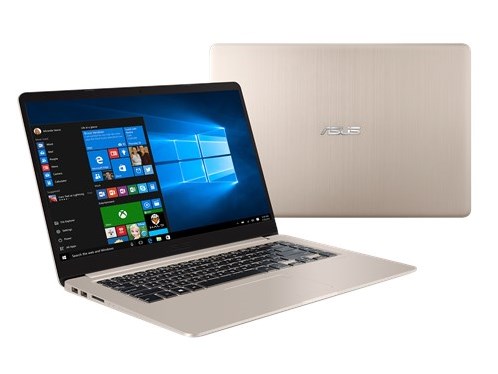
Whereas the Asus Zenbook series encompasses the high-end flagship range, the Asus Vivobook series targets the budget to mainstream market through cheaper prices and more down-to-Earth designs. The Vivobook here today is simply an internal update of the existing VivoBook S15 S510UQ, Vivobook S X510UA, and Vivobook S510UA. Thus, we recommend checking out the reviews on these prior SKUs for more information on the chassis, keyboard, connectivity, and more. Our focus will instead be on the GeForce MX130 GPU as it is an uncommon find.
Our Vivobook F510UF as configured can be found at retail for about $750 USD or several hundred cheaper than the 15.6-inch alternatives like the Dell XPS 15 9560 or HP Spectre x360 15. Direct competitors include the Envy 15, Acer Aspire 5 A515, Lenovo V330-15IKB, and the Dell Inspiron 15 series.
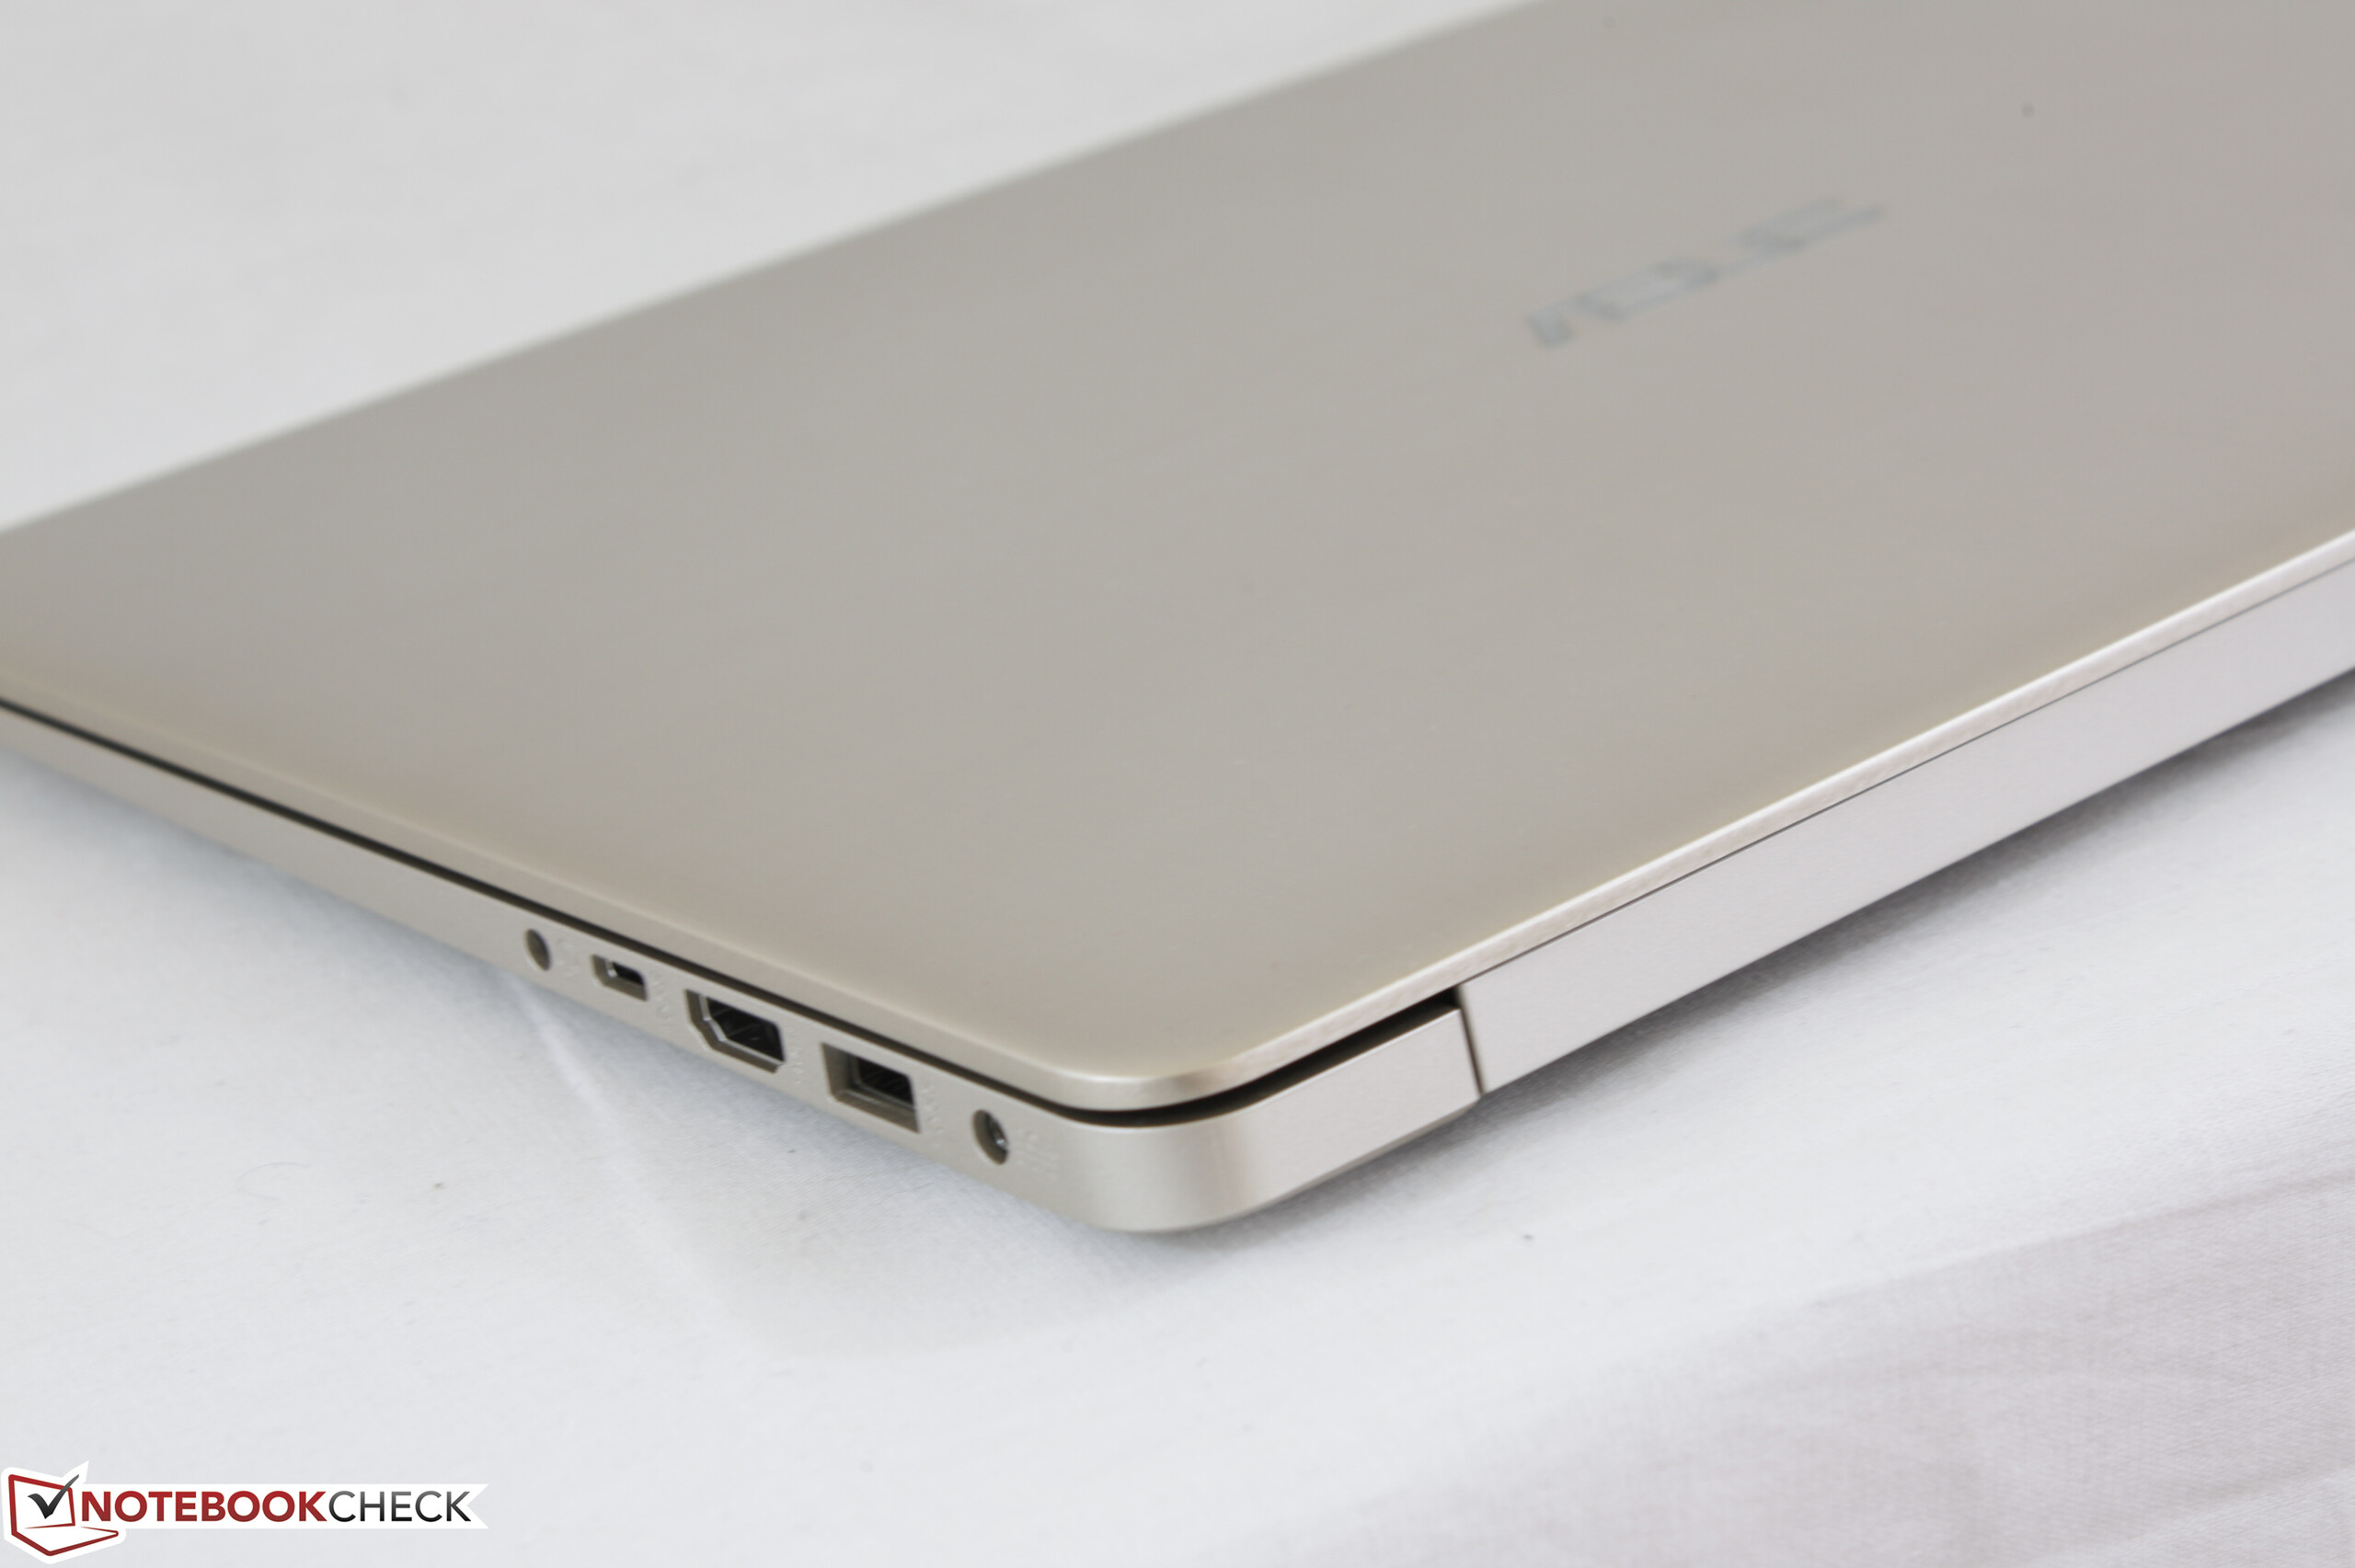
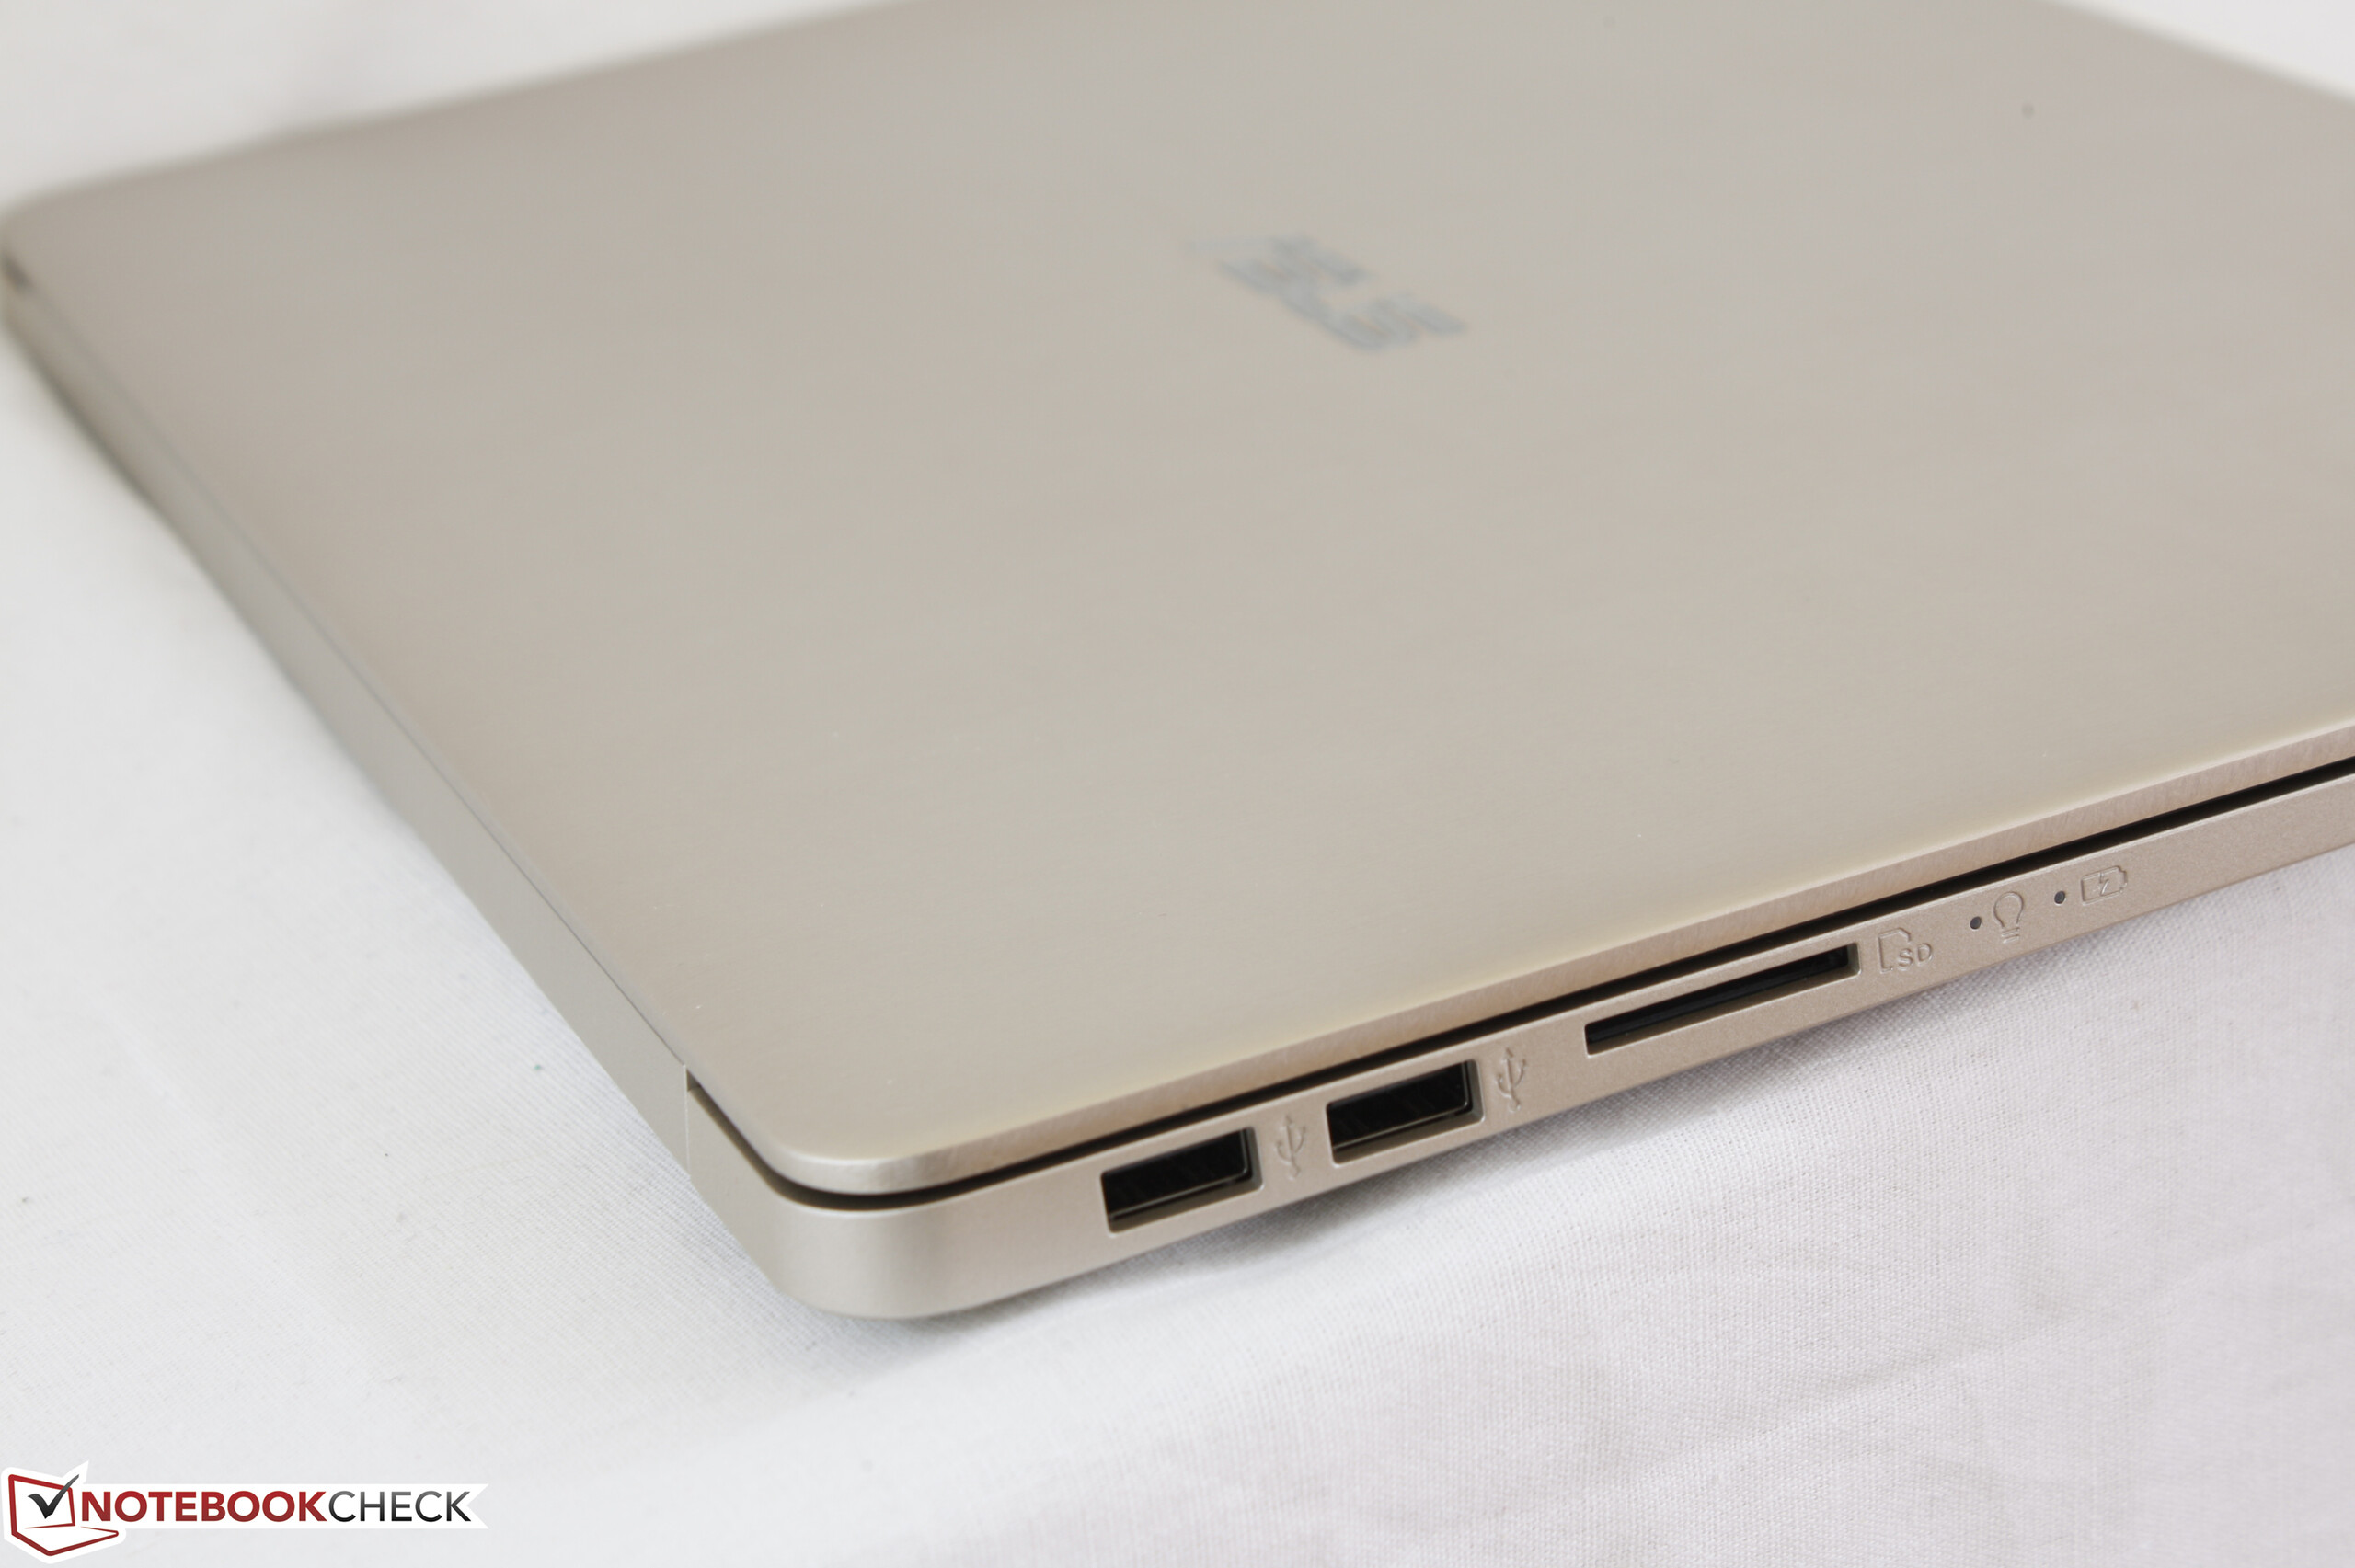
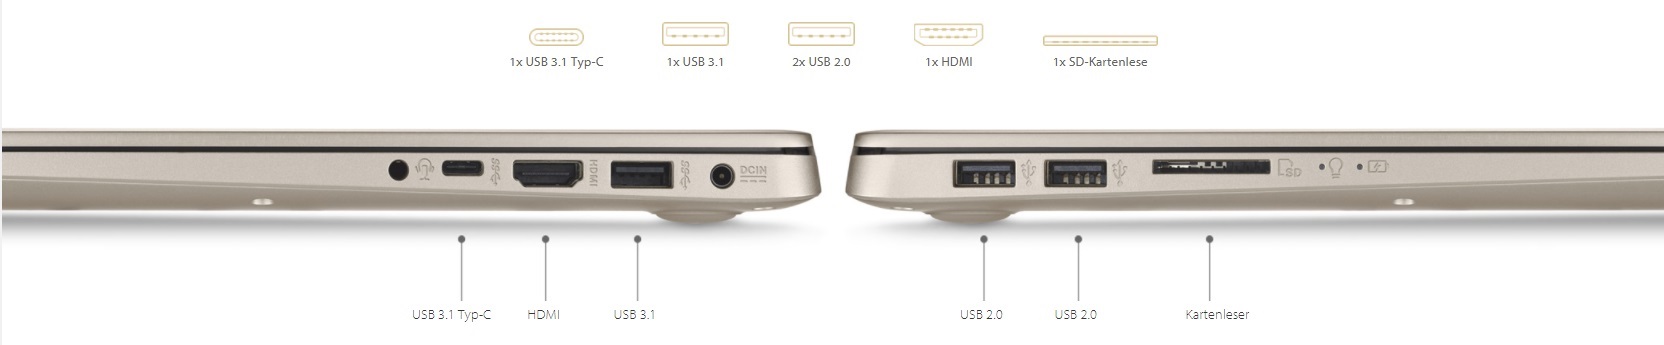
Connectivity
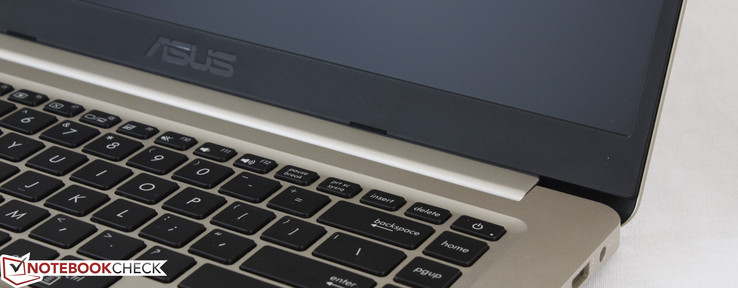
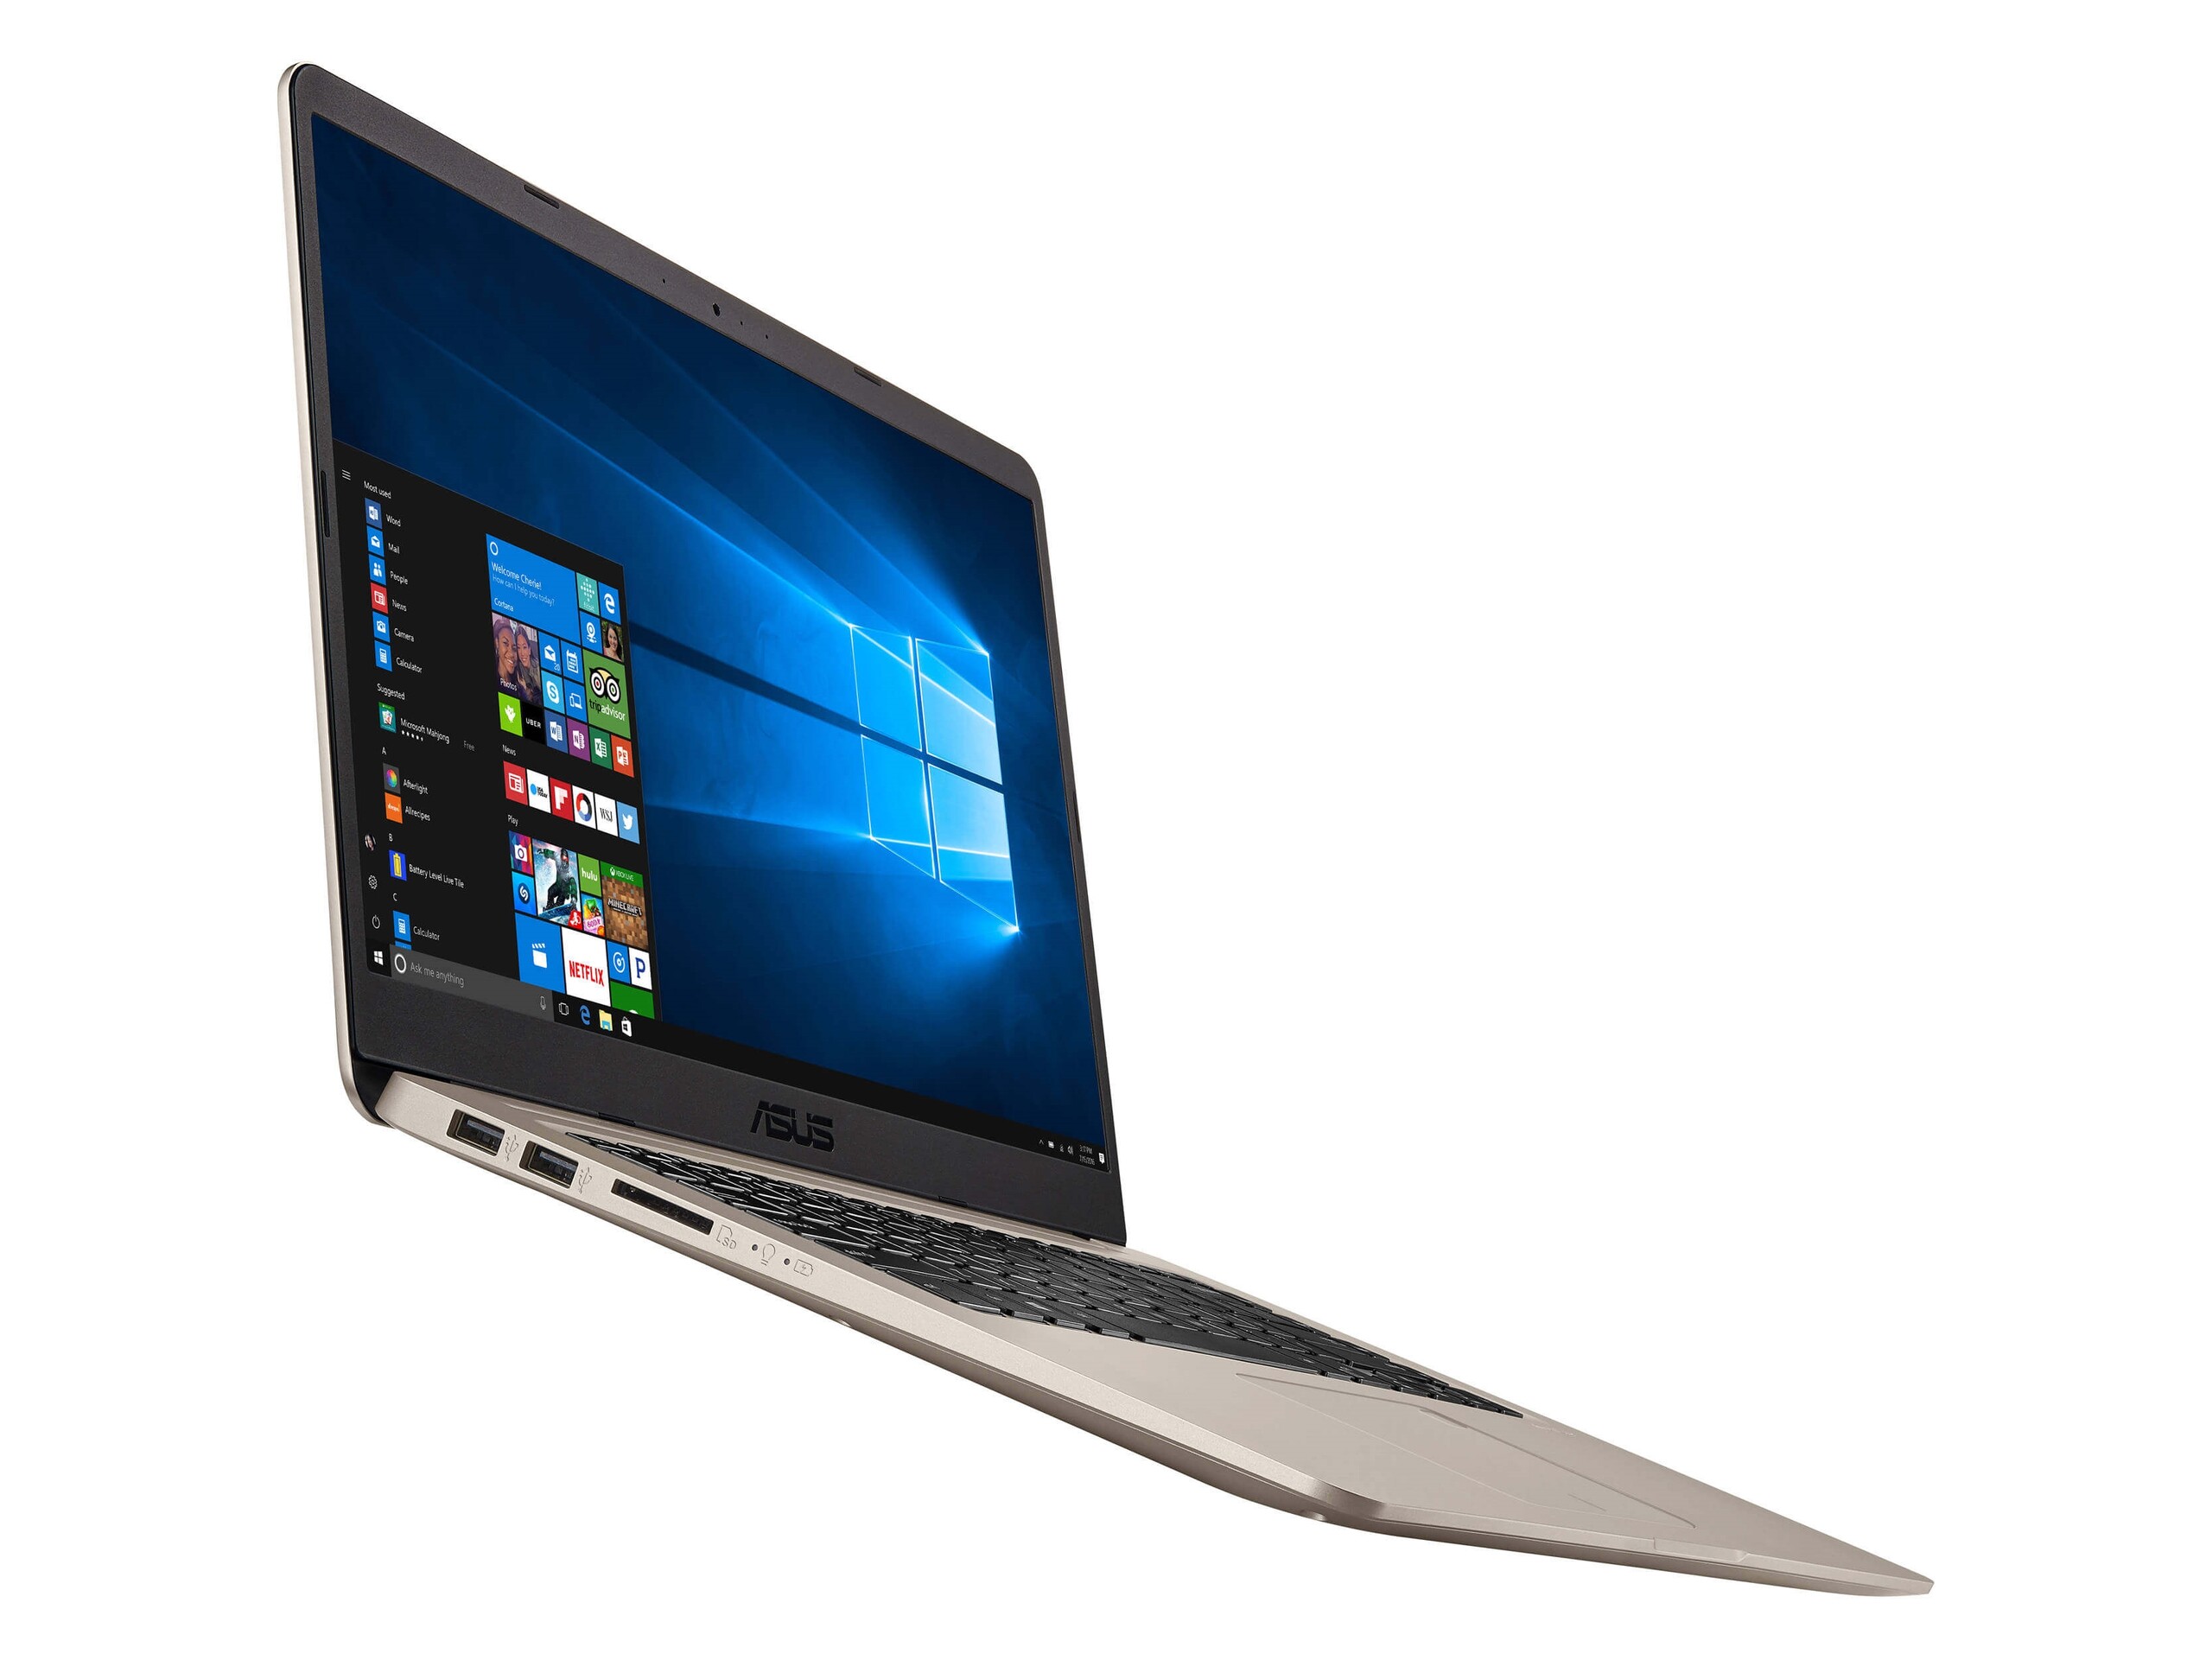
Ports remain identical to the SKUs that have come before it. It's a bit disappointing that the notebook is still relying on a proprietary AC adapter as standard Type-C charging would have been much more convenient for the end user.
SD Card Reader
| SD Card Reader | |
| average JPG Copy Test (av. of 3 runs) | |
| Lenovo IdeaPad 720-15IKB (Toshiba Exceria Pro SDXC 64 GB UHS-II) | |
| HP Envy x360 15-bq102ng (Toshiba Exceria Pro SDXC 64 GB UHS-II) | |
| Acer Swift 3 SF315-41-R4W1 | |
| Dell Inspiron 15 5575-98MH4 (Toshiba Exceria Pro SDXC 64 GB UHS-II) | |
| Asus VivoBook 15 F510UF-ES71 (Toshiba Exceria Pro SDXC 64 GB UHS-II) | |
| maximum AS SSD Seq Read Test (1GB) | |
| Lenovo IdeaPad 720-15IKB (Toshiba Exceria Pro SDXC 64 GB UHS-II) | |
| HP Envy x360 15-bq102ng (Toshiba Exceria Pro SDXC 64 GB UHS-II) | |
| Dell Inspiron 15 5575-98MH4 (Toshiba Exceria Pro SDXC 64 GB UHS-II) | |
| Asus VivoBook 15 F510UF-ES71 (Toshiba Exceria Pro SDXC 64 GB UHS-II) | |
| Acer Swift 3 SF315-41-R4W1 | |
Communication
Dual-band wireless and Bluetooth 4.2 come standard. We experienced no connection issues during our time with the unit.
Input Devices
Keyboard and Touchpad
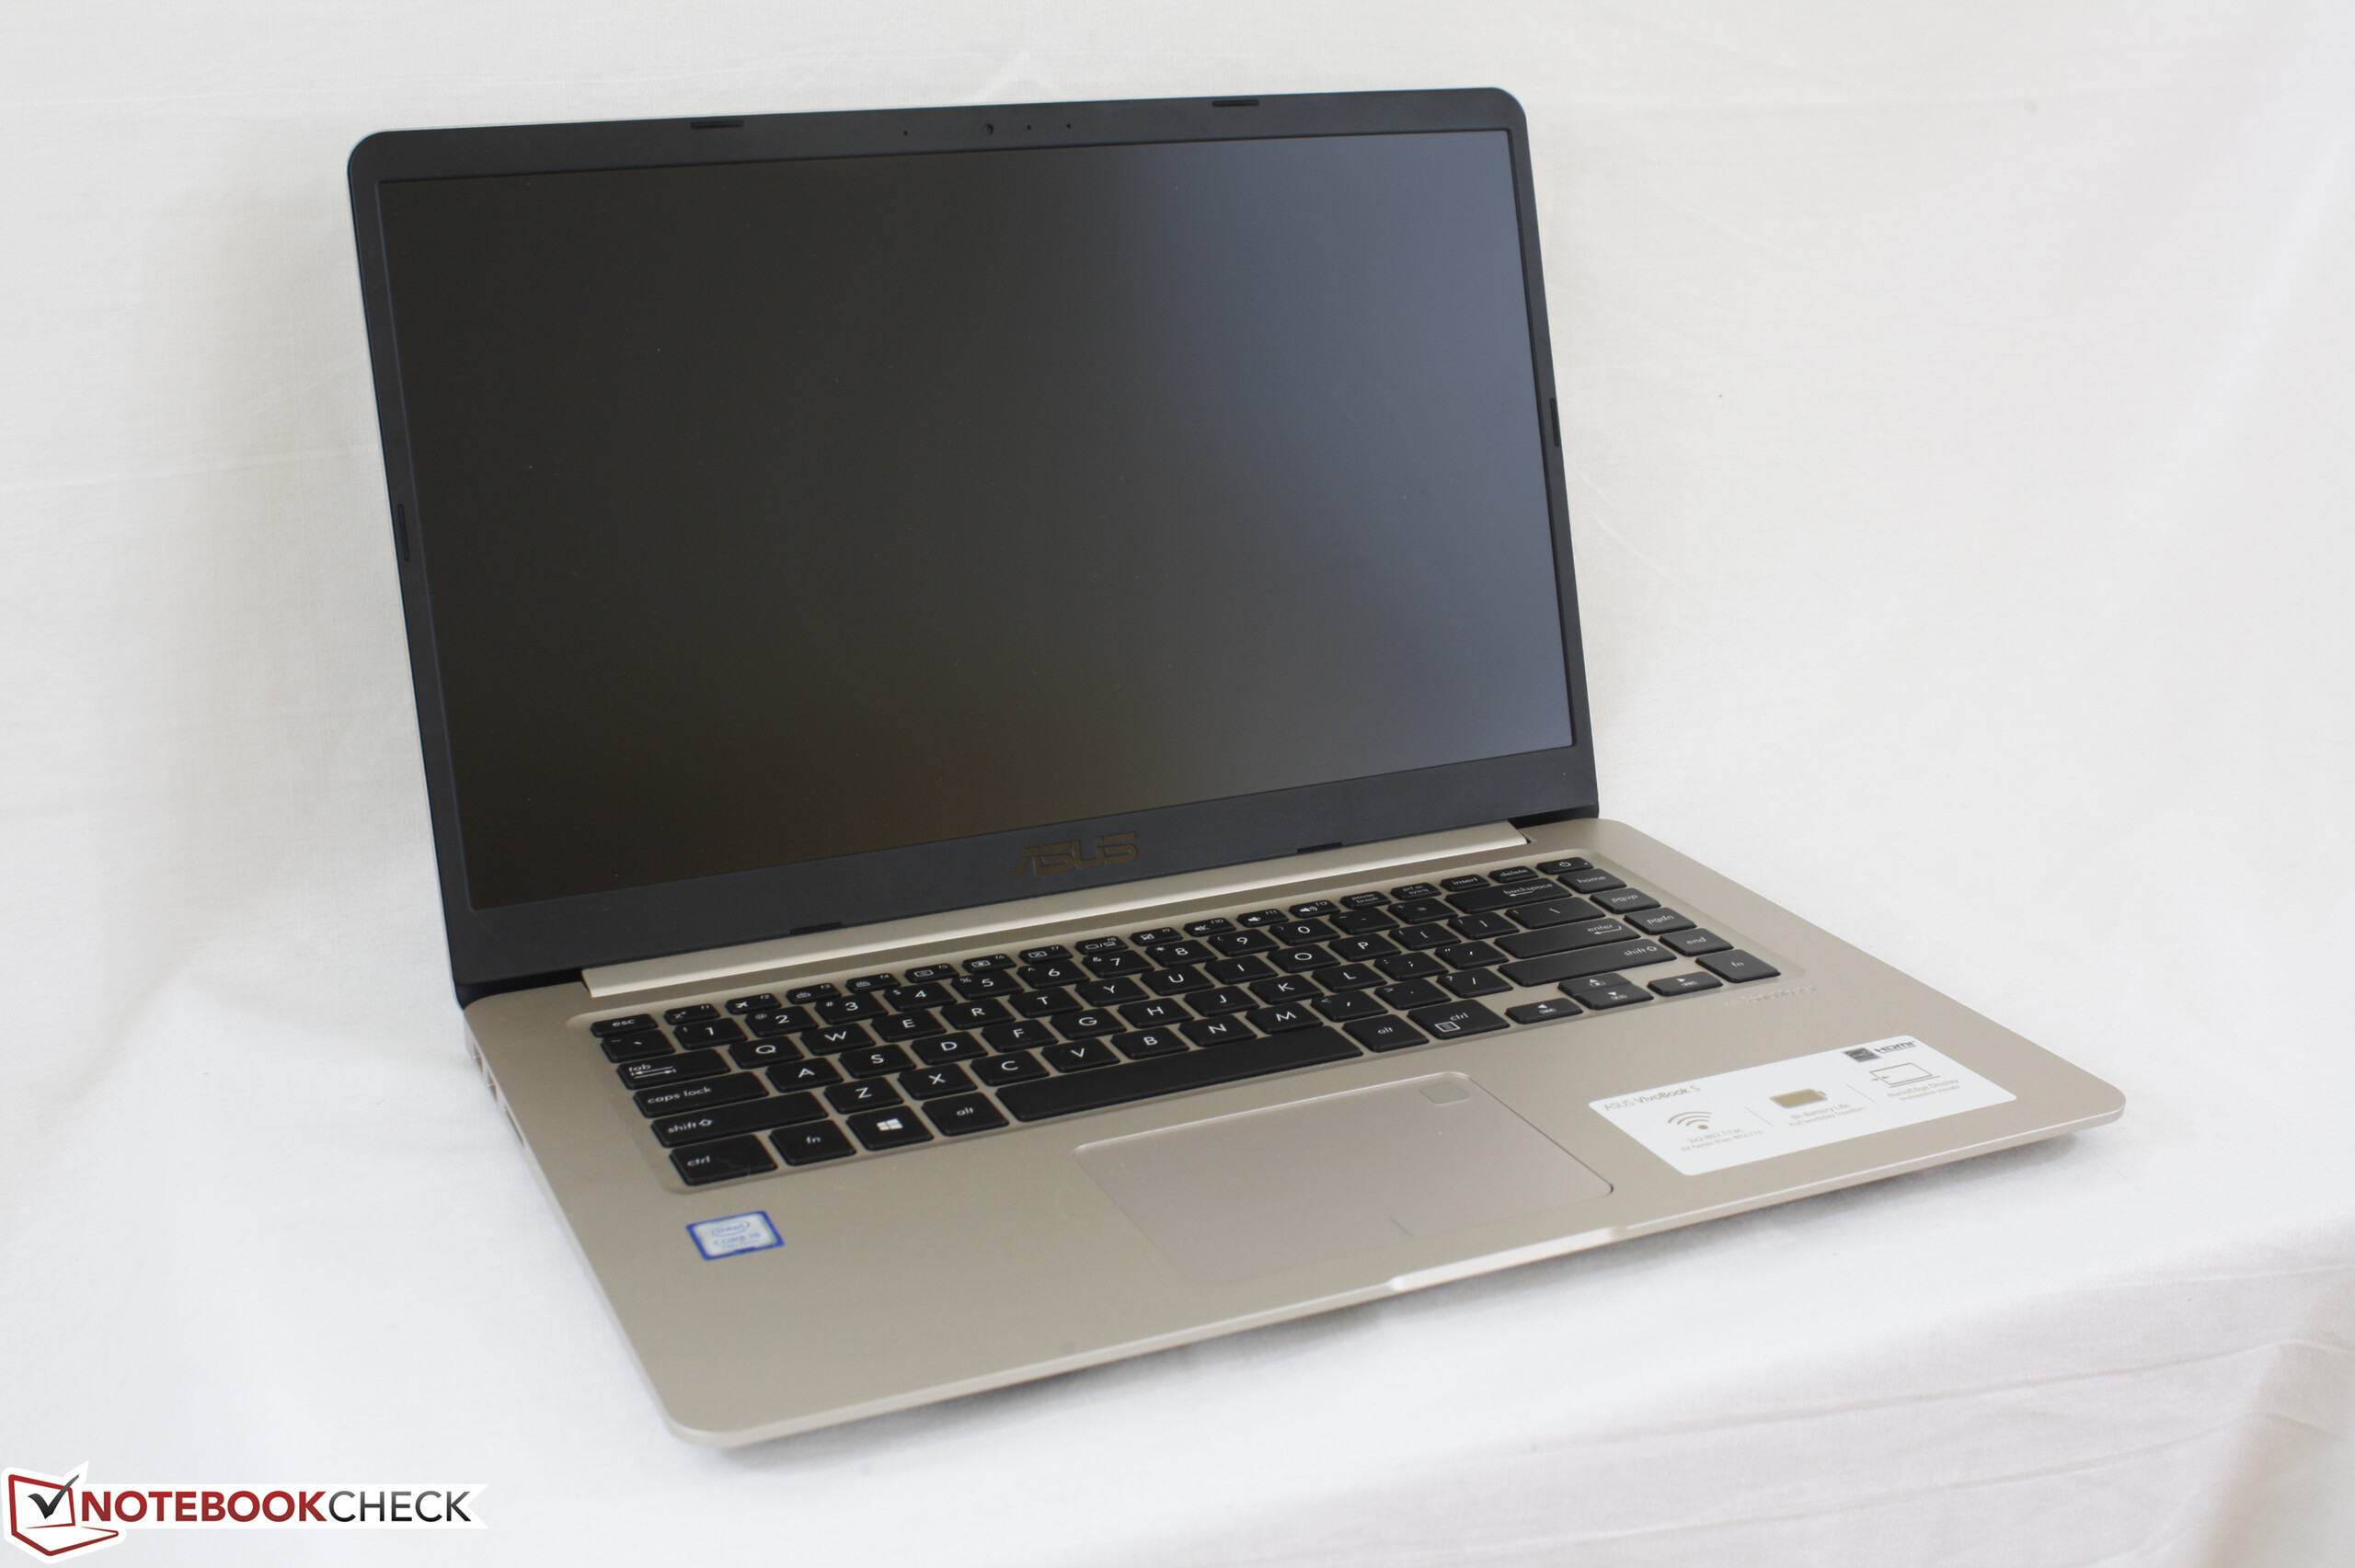
The keyboard and touchpad continue to be average at best. Individual keys feel cheap to the touch and they tend to wiggle in place. Feedback could have been firmer and travel is very shallow even for an Ultrabook.
Display
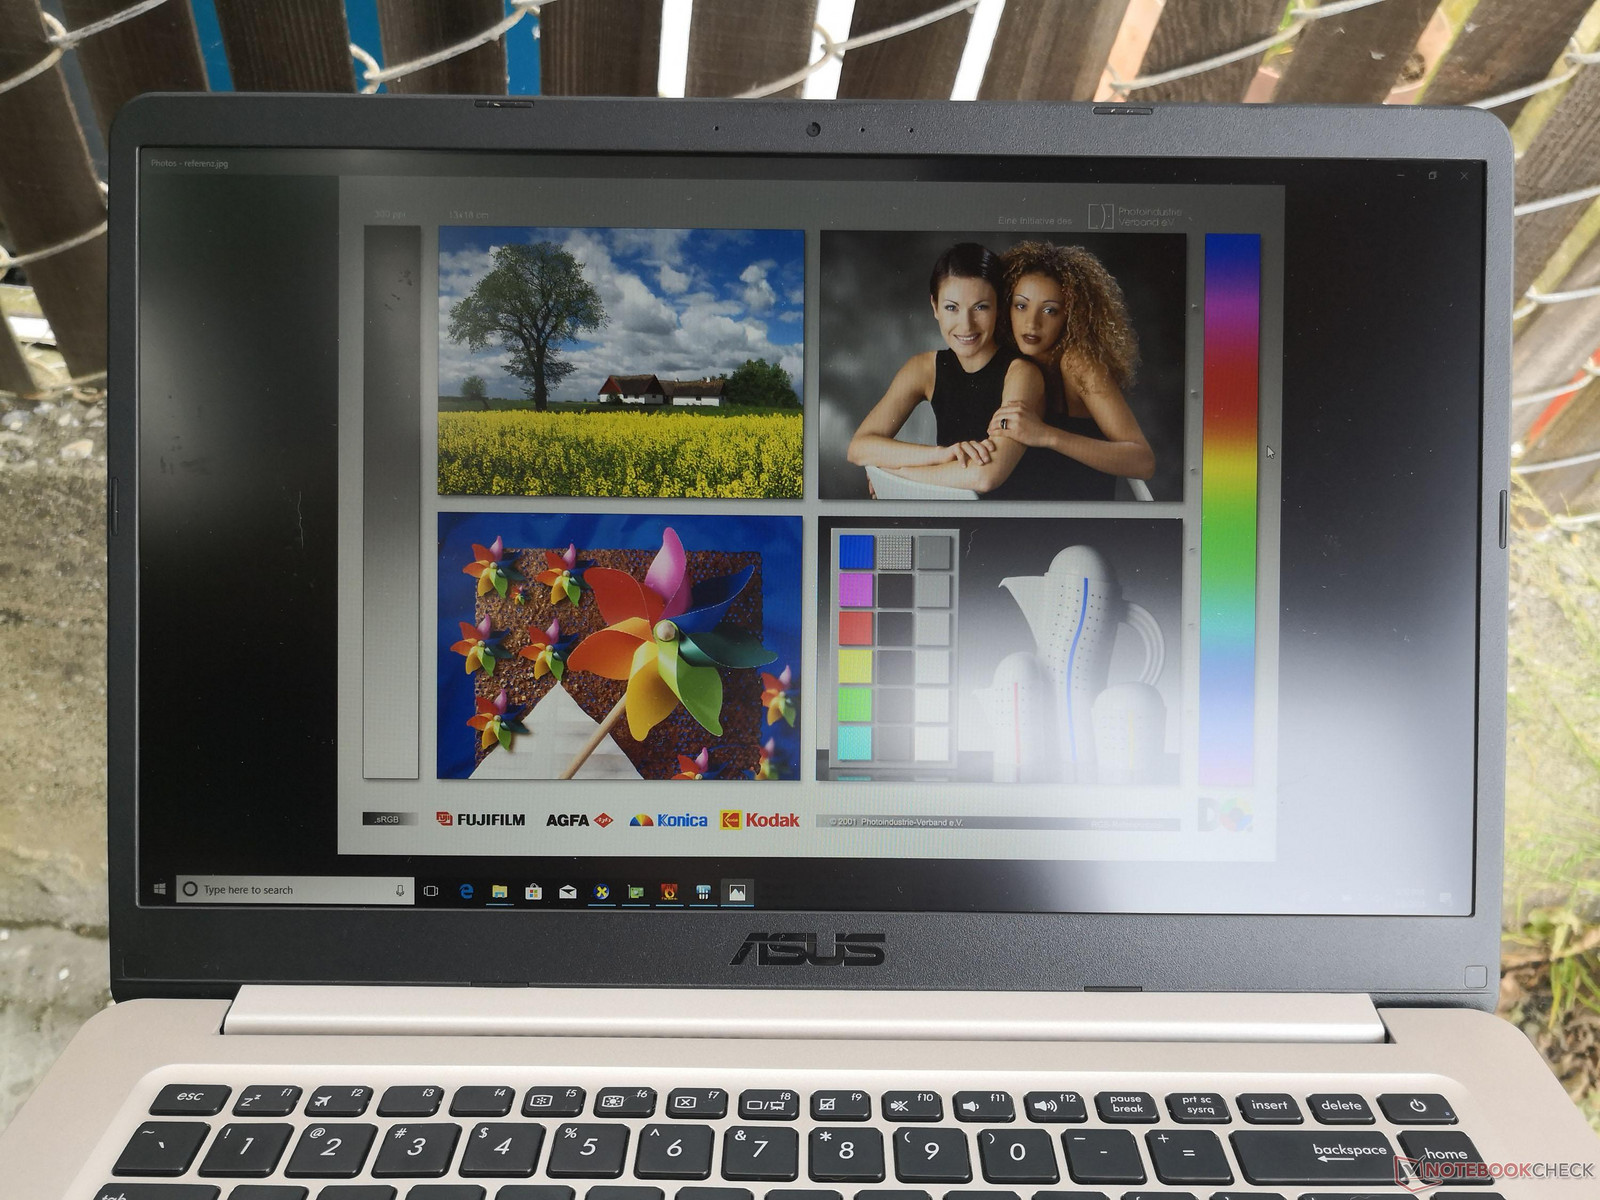
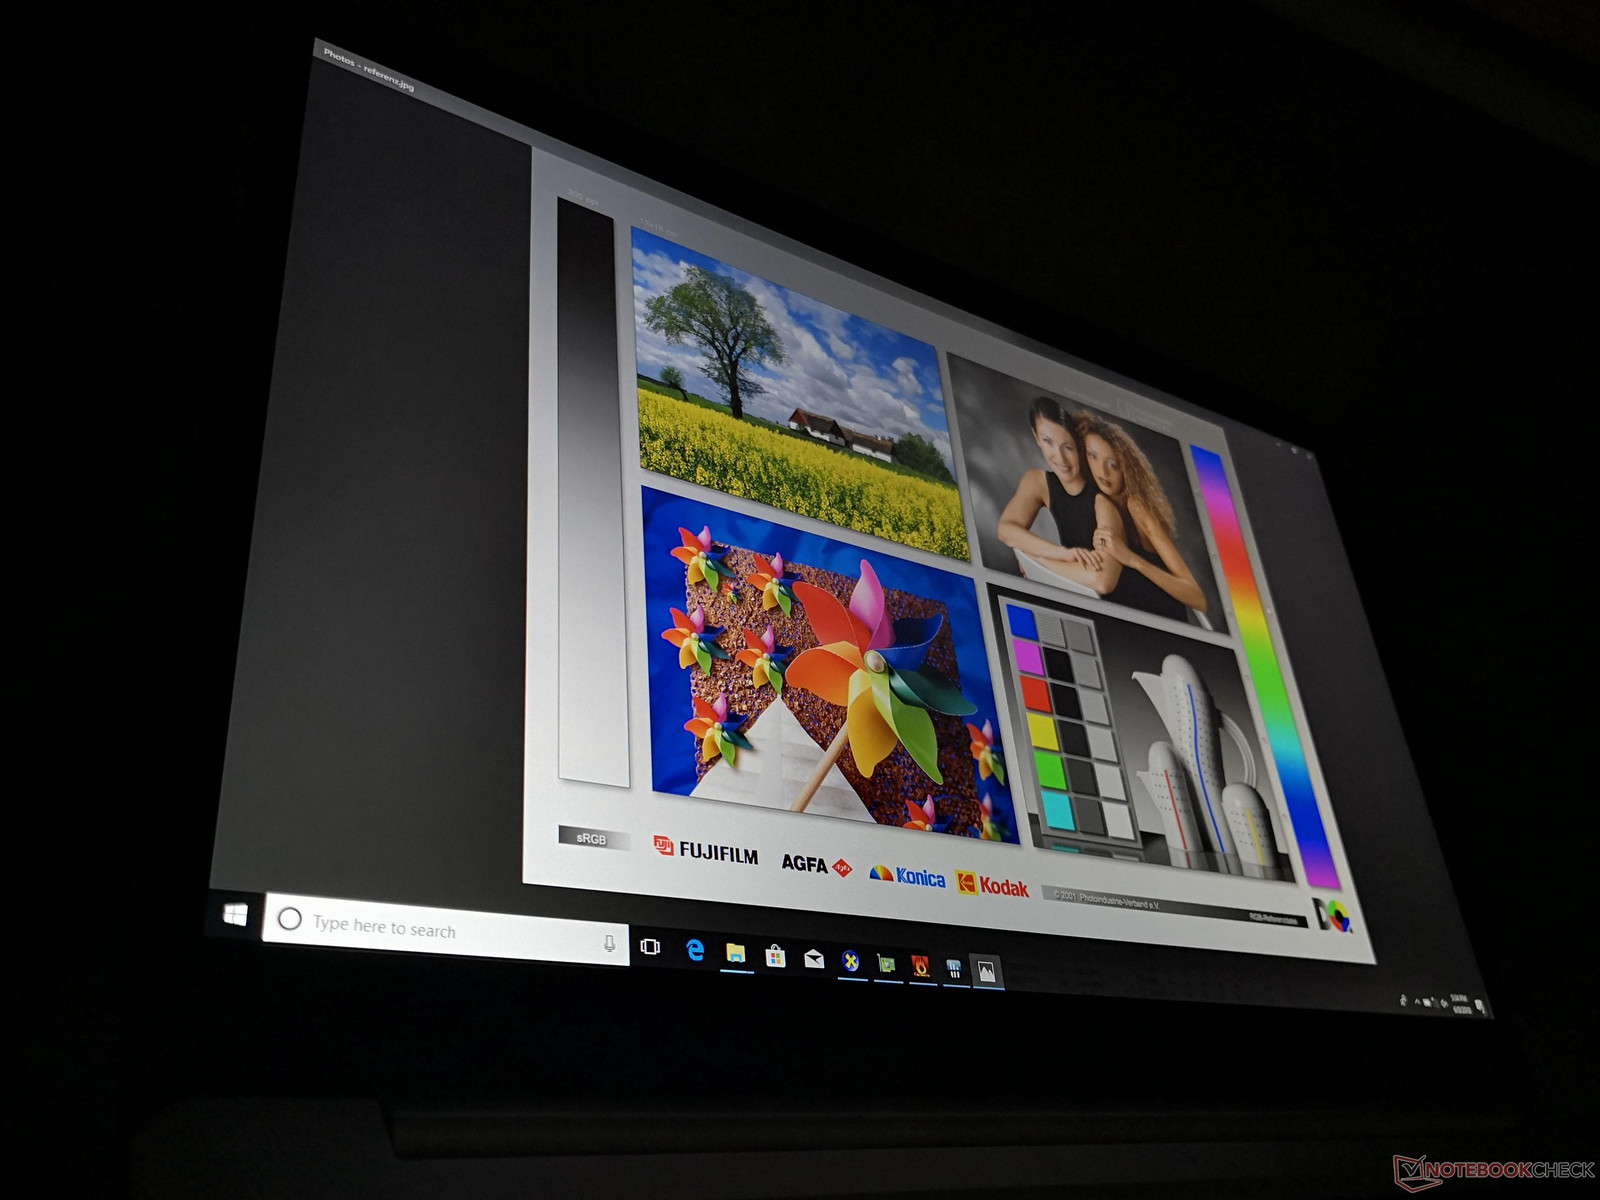
Screen quality is sharp and it's perhaps the best aspect of the notebook. Despite being matte, the IPS display is almost completely free of grains for a very clean first impression. It's worth noting that its LG Philips LP156WF9-SPK2 panel can also be found on the similarly priced 15-inch Yoga 720.
Our test unit suffers from light-moderate uneven backlight bleeding around the top and bottom edges. It's thankfully not noticeable during regular use, but it will be visible during video playback.

| |||||||||||||||||||||||||
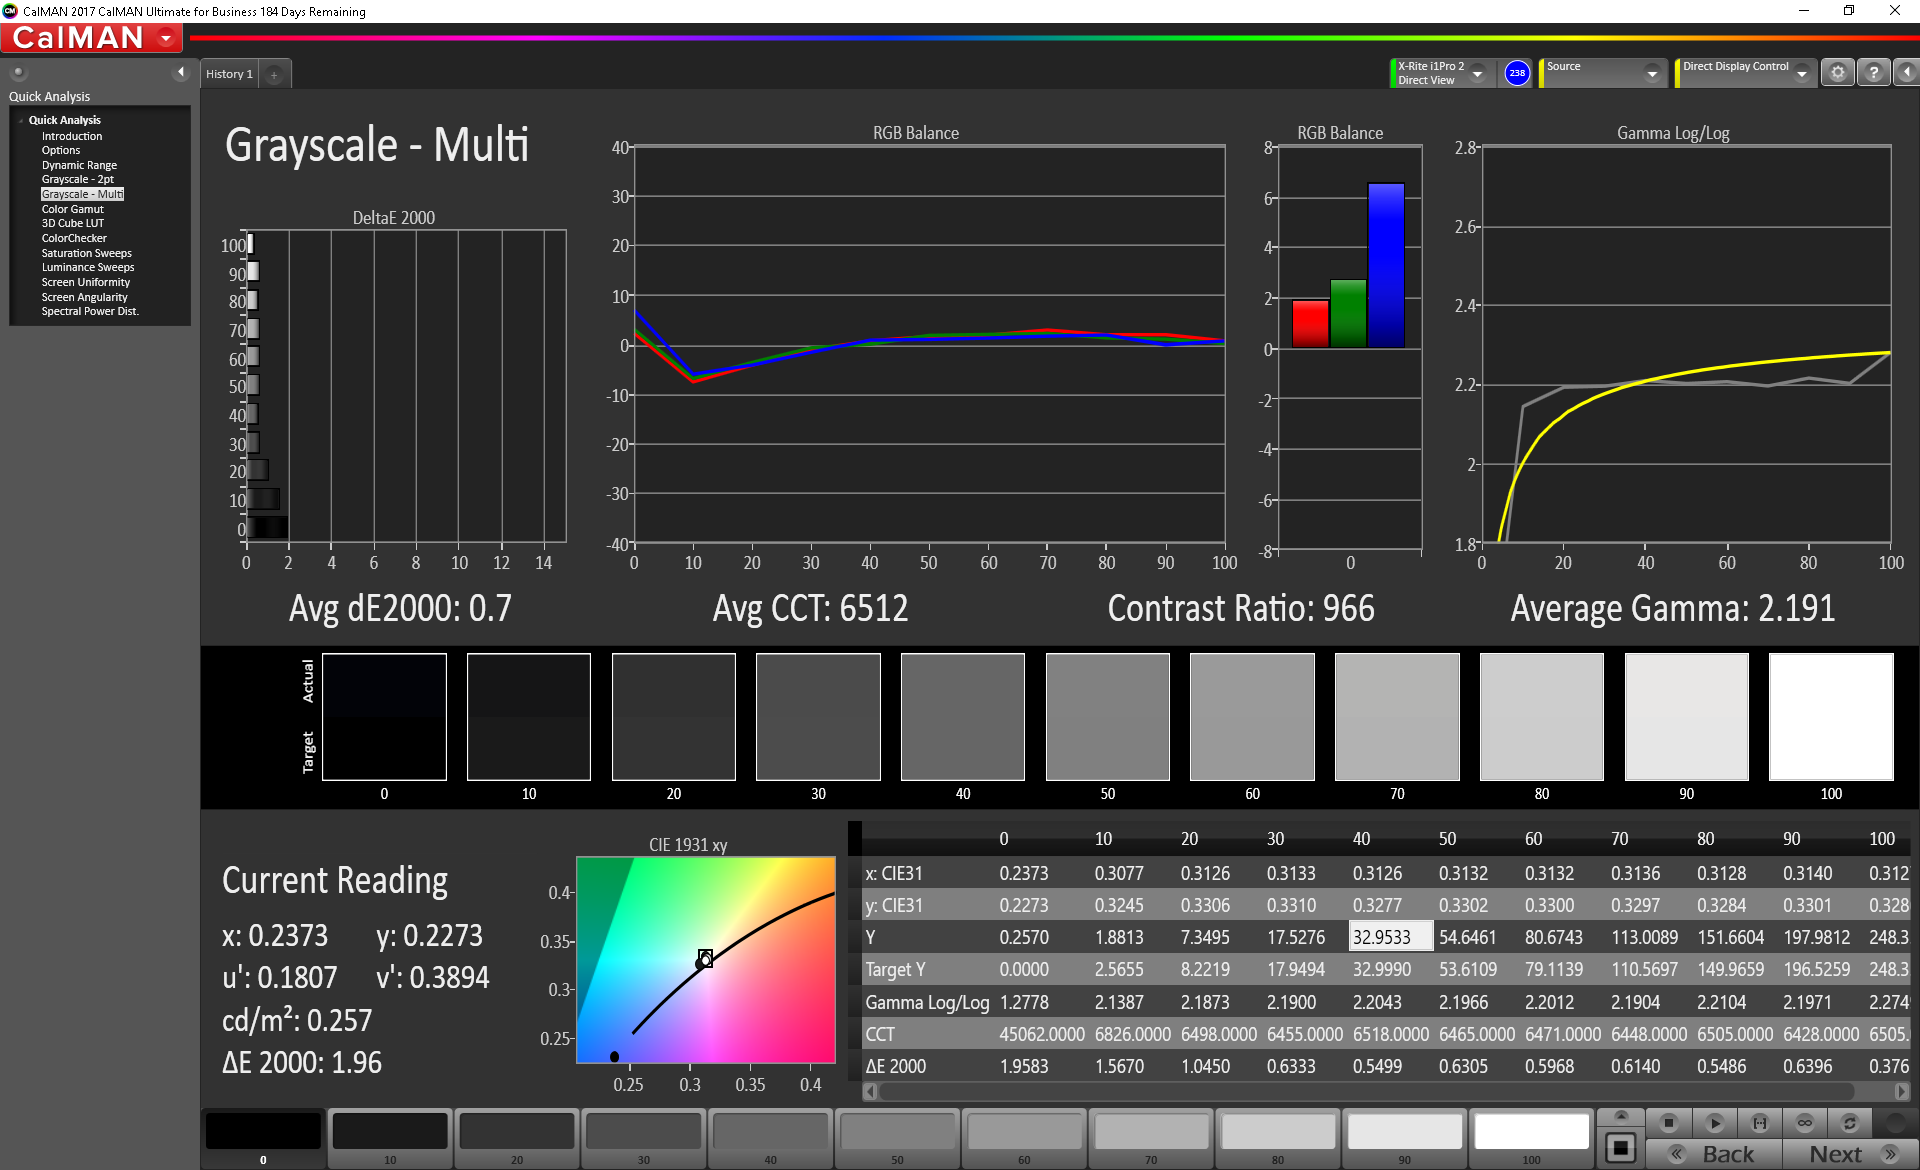
Brightness Distribution: 89 %
Center on Battery: 257 cd/m²
Contrast: 756:1 (Black: 0.34 cd/m²)
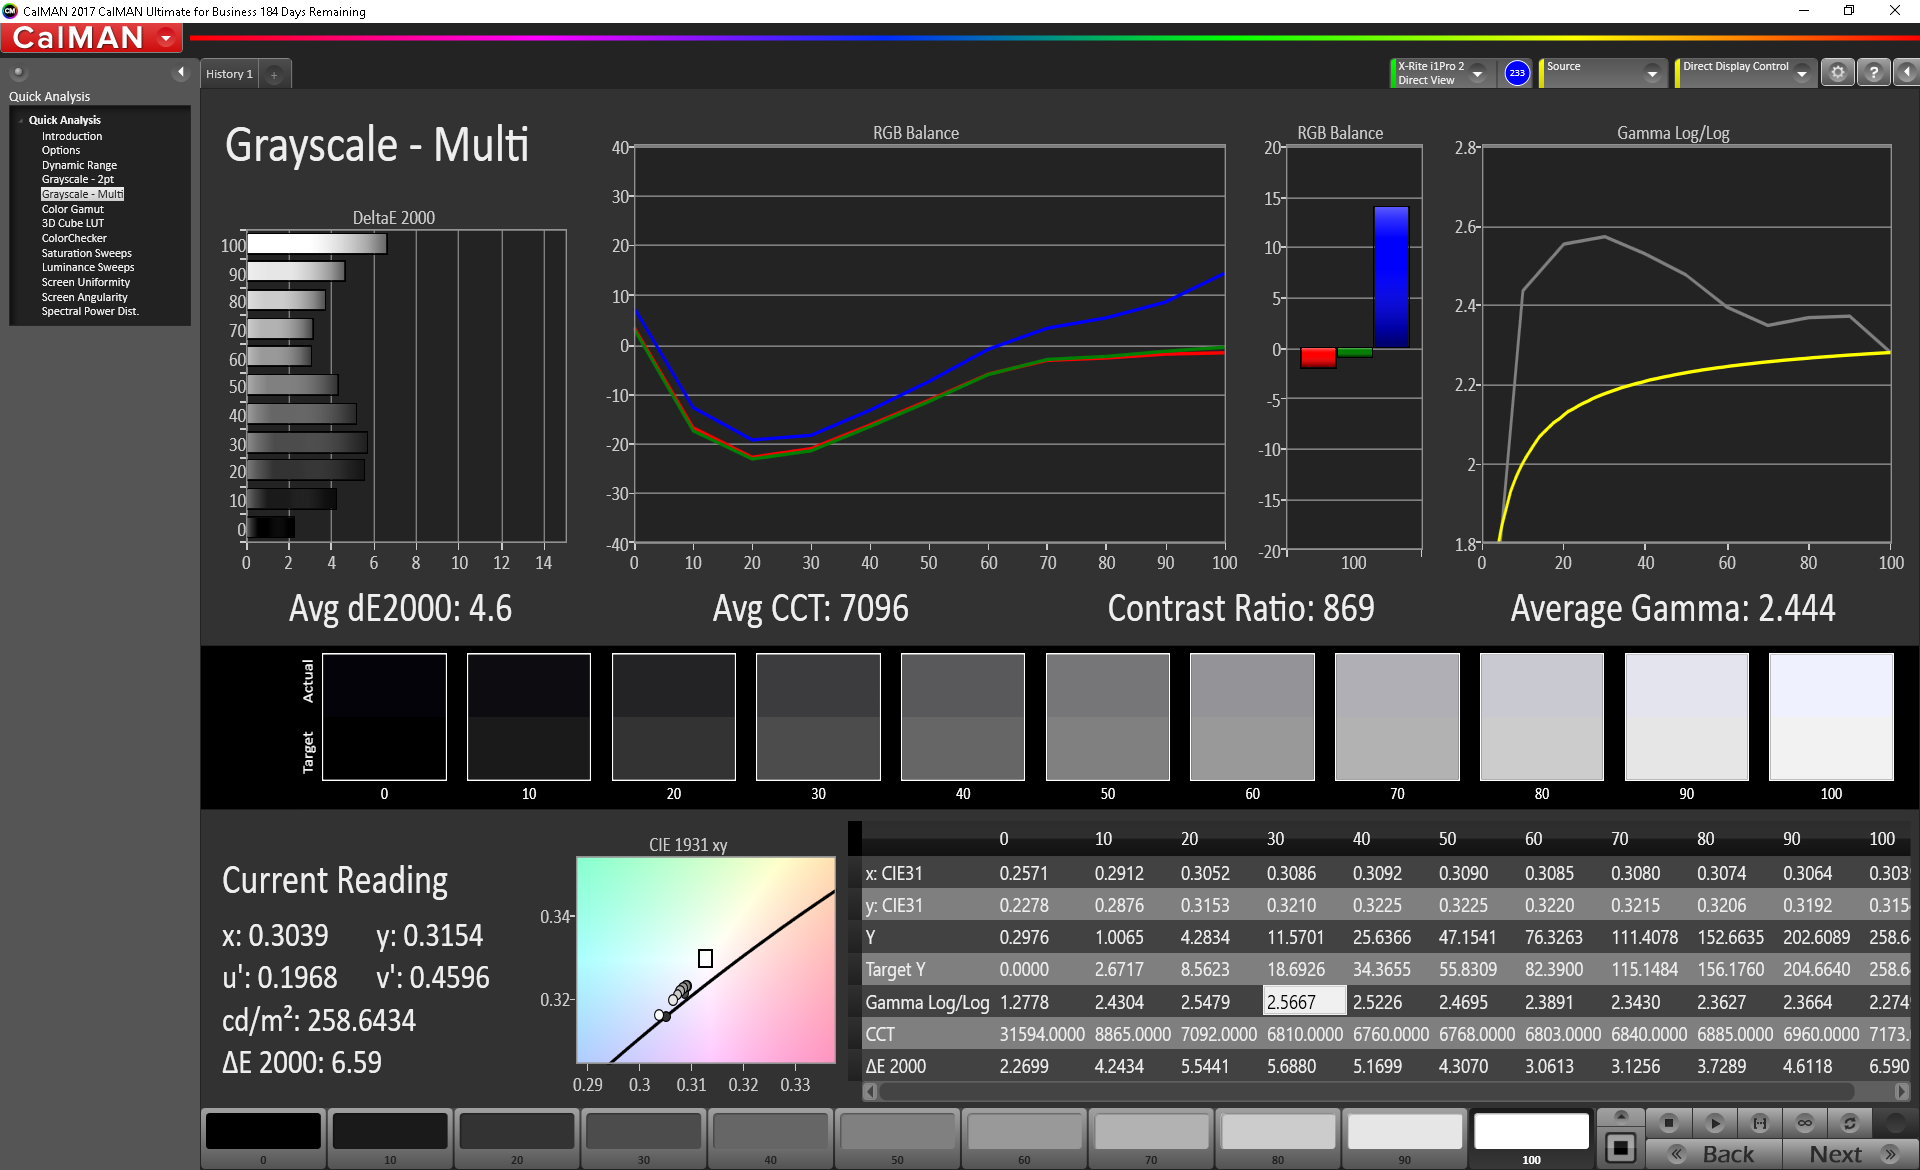
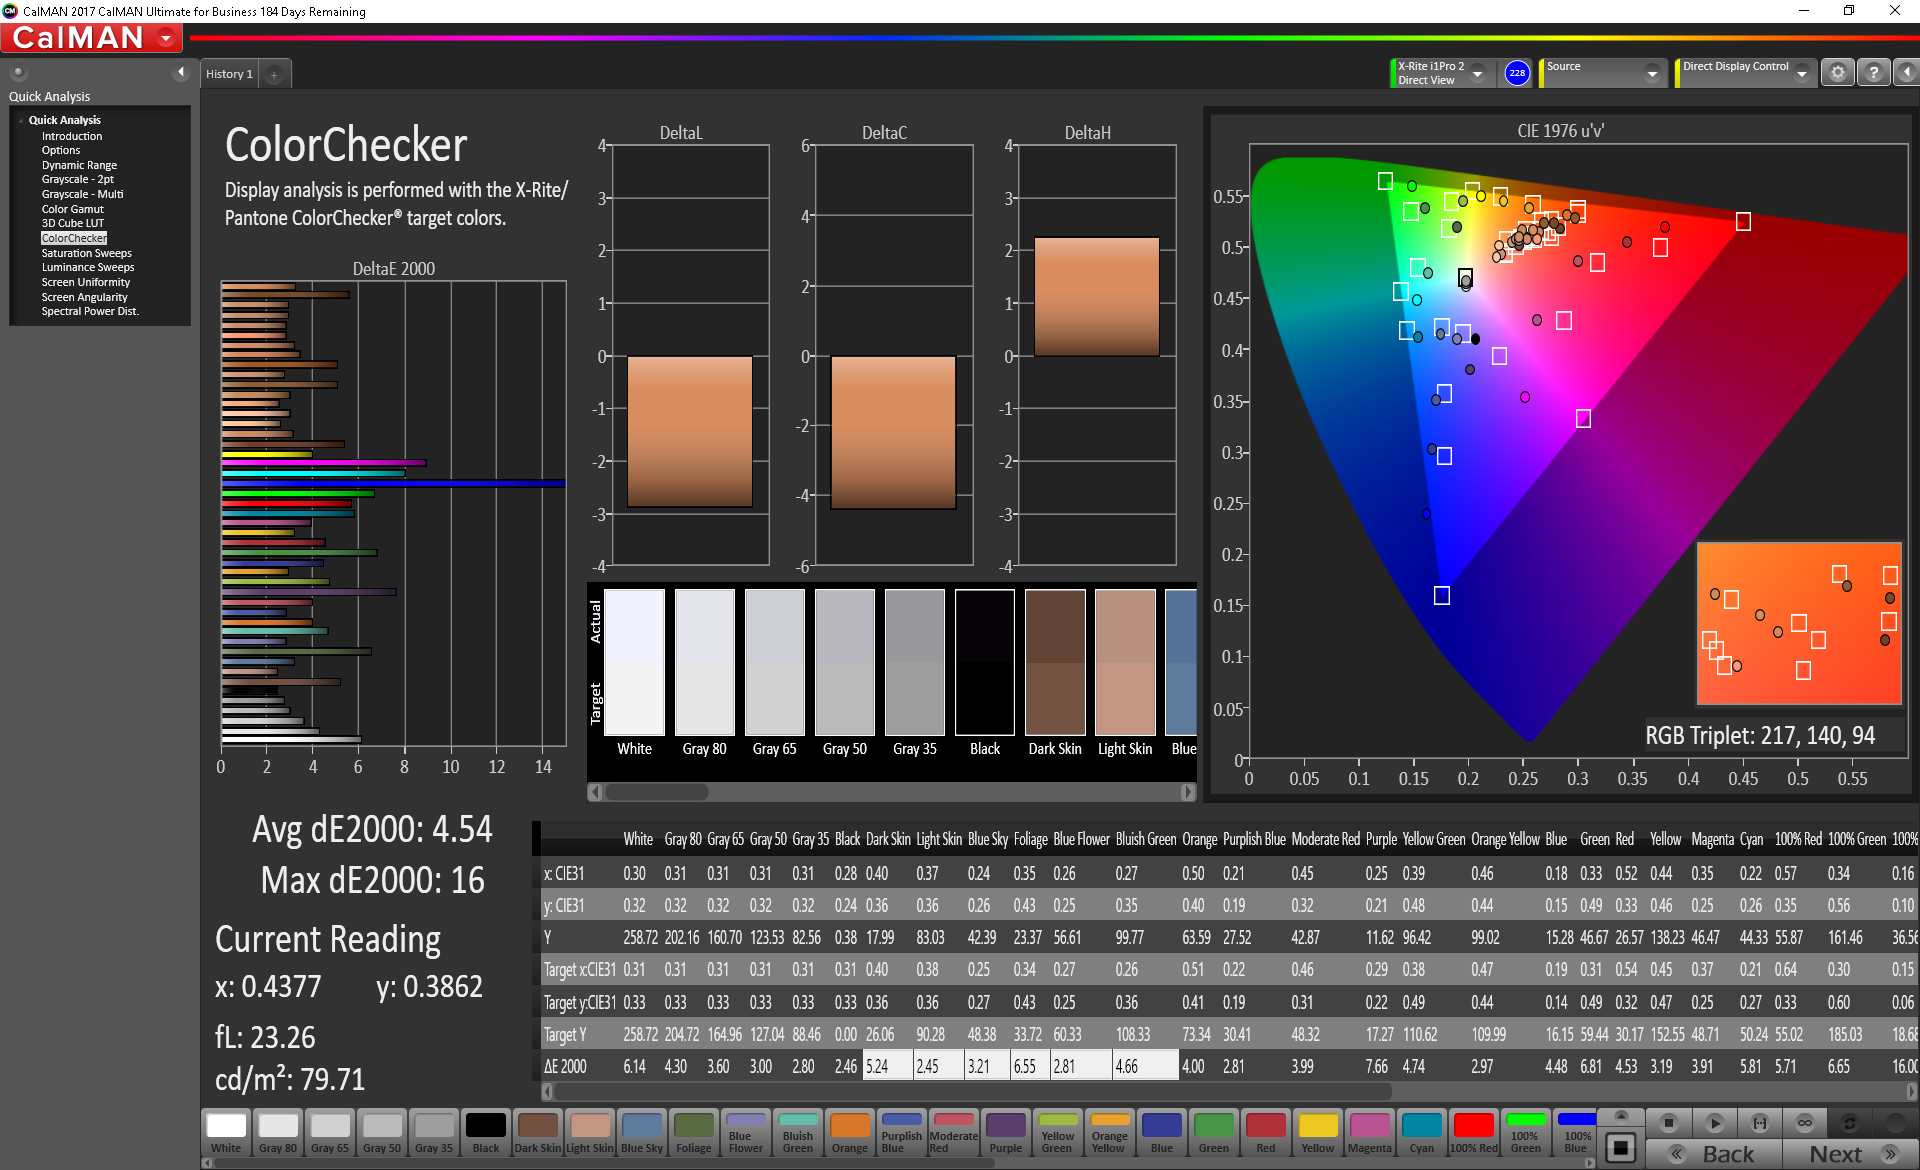
ΔE ColorChecker Calman: 4.54 | ∀{0.5-29.43 Ø4.73}
calibrated: 3.61
ΔE Greyscale Calman: 4.6 | ∀{0.09-98 Ø4.97}
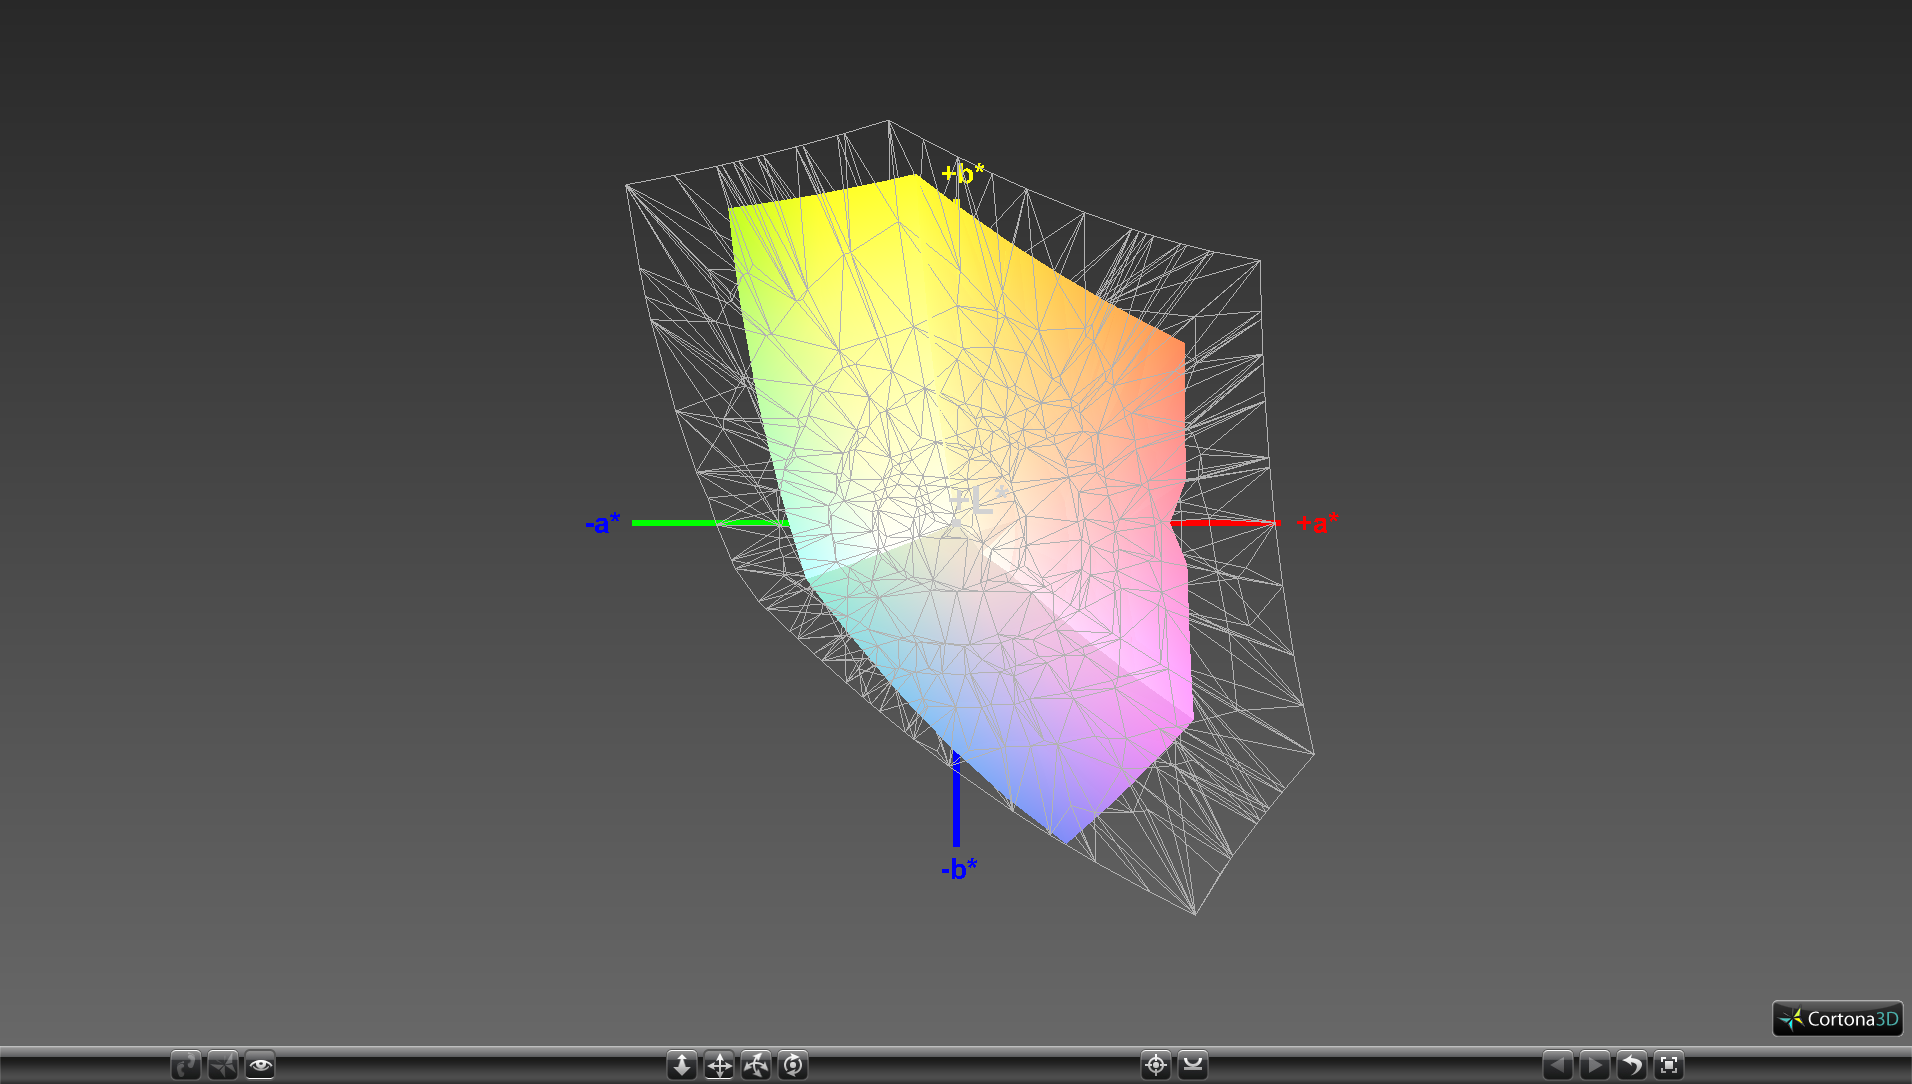
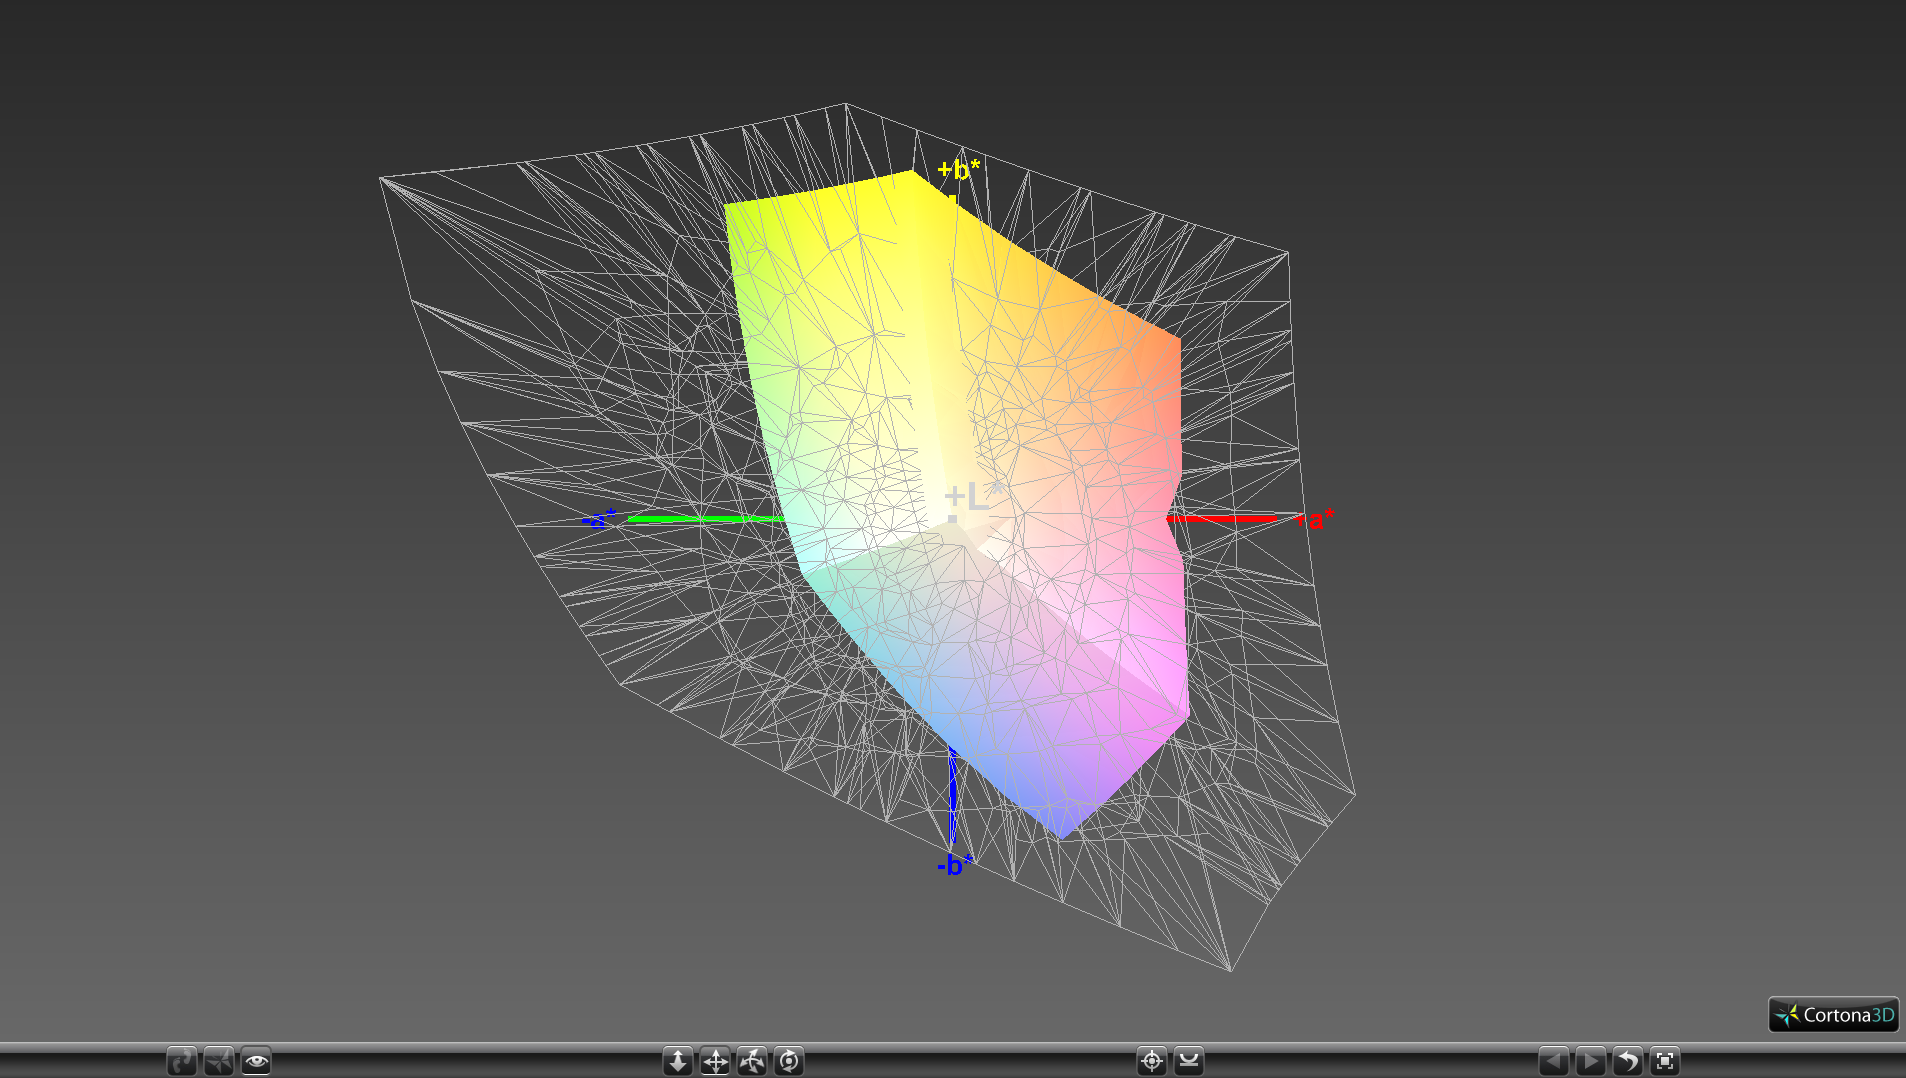
59.2% sRGB (Argyll 1.6.3 3D)
37.5% AdobeRGB 1998 (Argyll 1.6.3 3D)
40.65% AdobeRGB 1998 (Argyll 3D)
59.2% sRGB (Argyll 3D)
39.35% Display P3 (Argyll 3D)
Gamma: 2.44
CCT: 7096 K
| Asus VivoBook 15 F510UF-ES71 LG Philips LP156WF9-SPK2, IPS, 15.6", 1920x1080 | Asus Vivobook S15 S510UQ-BQ189T AU Optronics B156W02 / AUO B156HAN02.1, IPS, 15.6", 1920x1080 | Dell Inspiron 15 5575-98MH4 Innolux JMC9X 156BGA, TN LED, 15.6", 1366x768 | HP Envy x360 15-bq102ng Chi Mei CM15E9, IPS, 15.6", 1920x1080 | Lenovo IdeaPad 720-15IKB LG Philips LGD0573 LP156WF9-SPK2, IPS, 15.6", 1920x1080 | Acer Swift 3 SF315-41-R4W1 BOE CQ NV156FHM-N48, IPS, 15.6", 1920x1080 | |
|---|---|---|---|---|---|---|
| Display | -1% | 2% | 5% | -2% | 0% | |
| Display P3 Coverage (%) | 39.35 | 38.94 -1% | 40.02 2% | 41.36 5% | 38.62 -2% | 39.59 1% |
| sRGB Coverage (%) | 59.2 | 58.5 -1% | 59.8 1% | 62.2 5% | 58.1 -2% | 58.5 -1% |
| AdobeRGB 1998 Coverage (%) | 40.65 | 40.23 -1% | 41.37 2% | 42.74 5% | 39.91 -2% | 40.9 1% |
| Response Times | -43% | -41% | -26% | -30% | -57% | |
| Response Time Grey 50% / Grey 80% * (ms) | 27.2 ? | 47 ? -73% | 50 ? -84% | 40 ? -47% | 42 ? -54% | 46 ? -69% |
| Response Time Black / White * (ms) | 24.8 ? | 28 ? -13% | 24 ? 3% | 26 ? -5% | 26 ? -5% | 36 ? -45% |
| PWM Frequency (Hz) | 250 ? | 25000 ? | 21000 ? | |||
| Screen | 22% | -39% | 29% | 9% | 15% | |
| Brightness middle (cd/m²) | 257 | 293 14% | 197 -23% | 221 -14% | 270 5% | 237 -8% |
| Brightness (cd/m²) | 246 | 275 12% | 195 -21% | 207 -16% | 250 2% | 229 -7% |
| Brightness Distribution (%) | 89 | 86 -3% | 78 -12% | 87 -2% | 87 -2% | 88 -1% |
| Black Level * (cd/m²) | 0.34 | 0.25 26% | 0.43 -26% | 0.15 56% | 0.25 26% | 0.19 44% |
| Contrast (:1) | 756 | 1172 55% | 458 -39% | 1473 95% | 1080 43% | 1247 65% |
| Colorchecker dE 2000 * | 4.54 | 3.81 16% | 10.35 -128% | 4.35 4% | 4.79 -6% | 4.85 -7% |
| Colorchecker dE 2000 max. * | 16 | 6.64 58% | 16.02 -0% | 8.98 44% | 8.83 45% | 8.34 48% |
| Colorchecker dE 2000 calibrated * | 3.61 | |||||
| Greyscale dE 2000 * | 4.6 | 2.66 42% | 11.25 -145% | 3.09 33% | 5.66 -23% | 3.84 17% |
| Gamma | 2.44 90% | 2.54 87% | 2.08 106% | 2.23 99% | 2.64 83% | 2.42 91% |
| CCT | 7096 92% | 6541 99% | 11592 56% | 6068 107% | 7179 91% | 6790 96% |
| Color Space (Percent of AdobeRGB 1998) (%) | 37.5 | 37 -1% | 38 1% | 56 49% | 37 -1% | 37 -1% |
| Color Space (Percent of sRGB) (%) | 59.2 | 58 -2% | 60 1% | 86 45% | 59 0% | 58 -2% |
| Total Average (Program / Settings) | -7% /
9% | -26% /
-31% | 3% /
17% | -8% /
2% | -14% /
2% |
* ... smaller is better
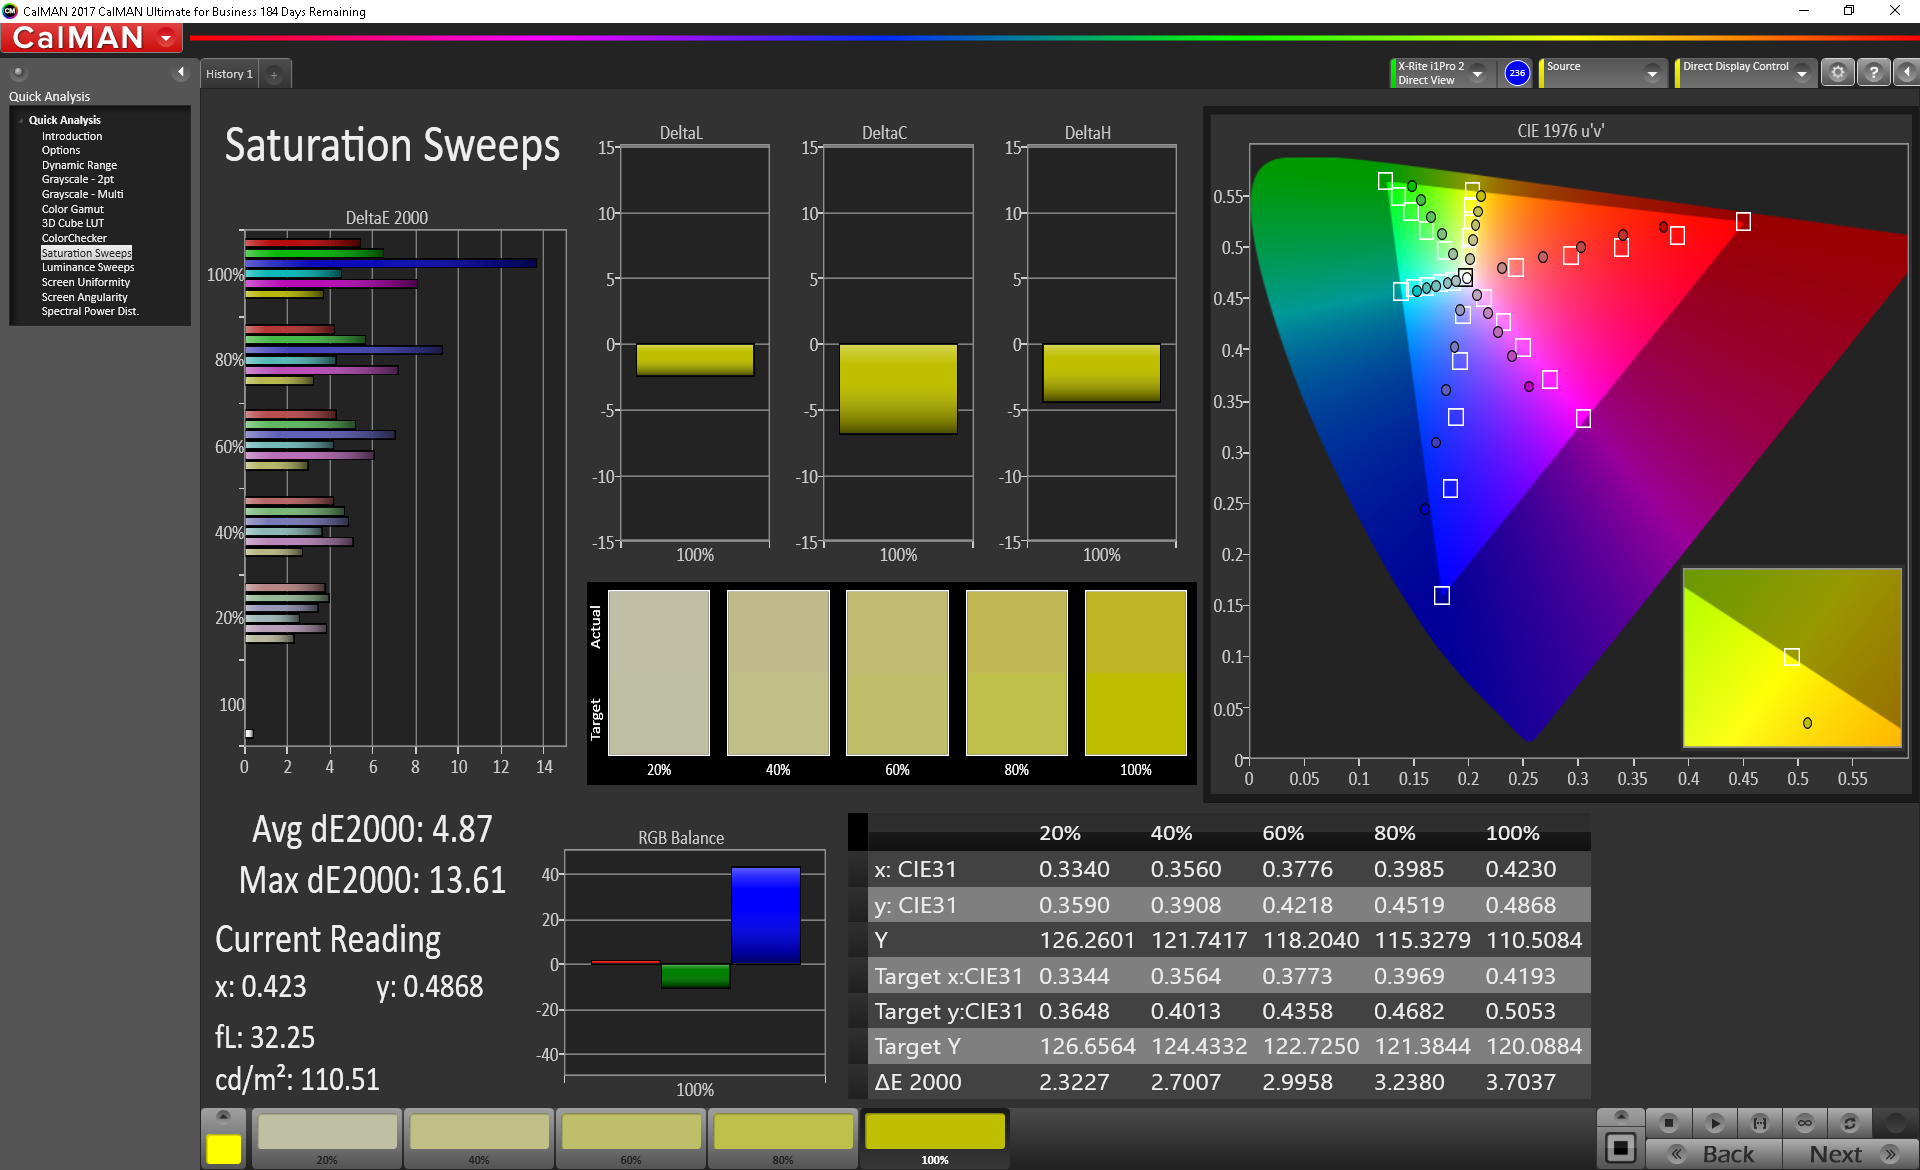
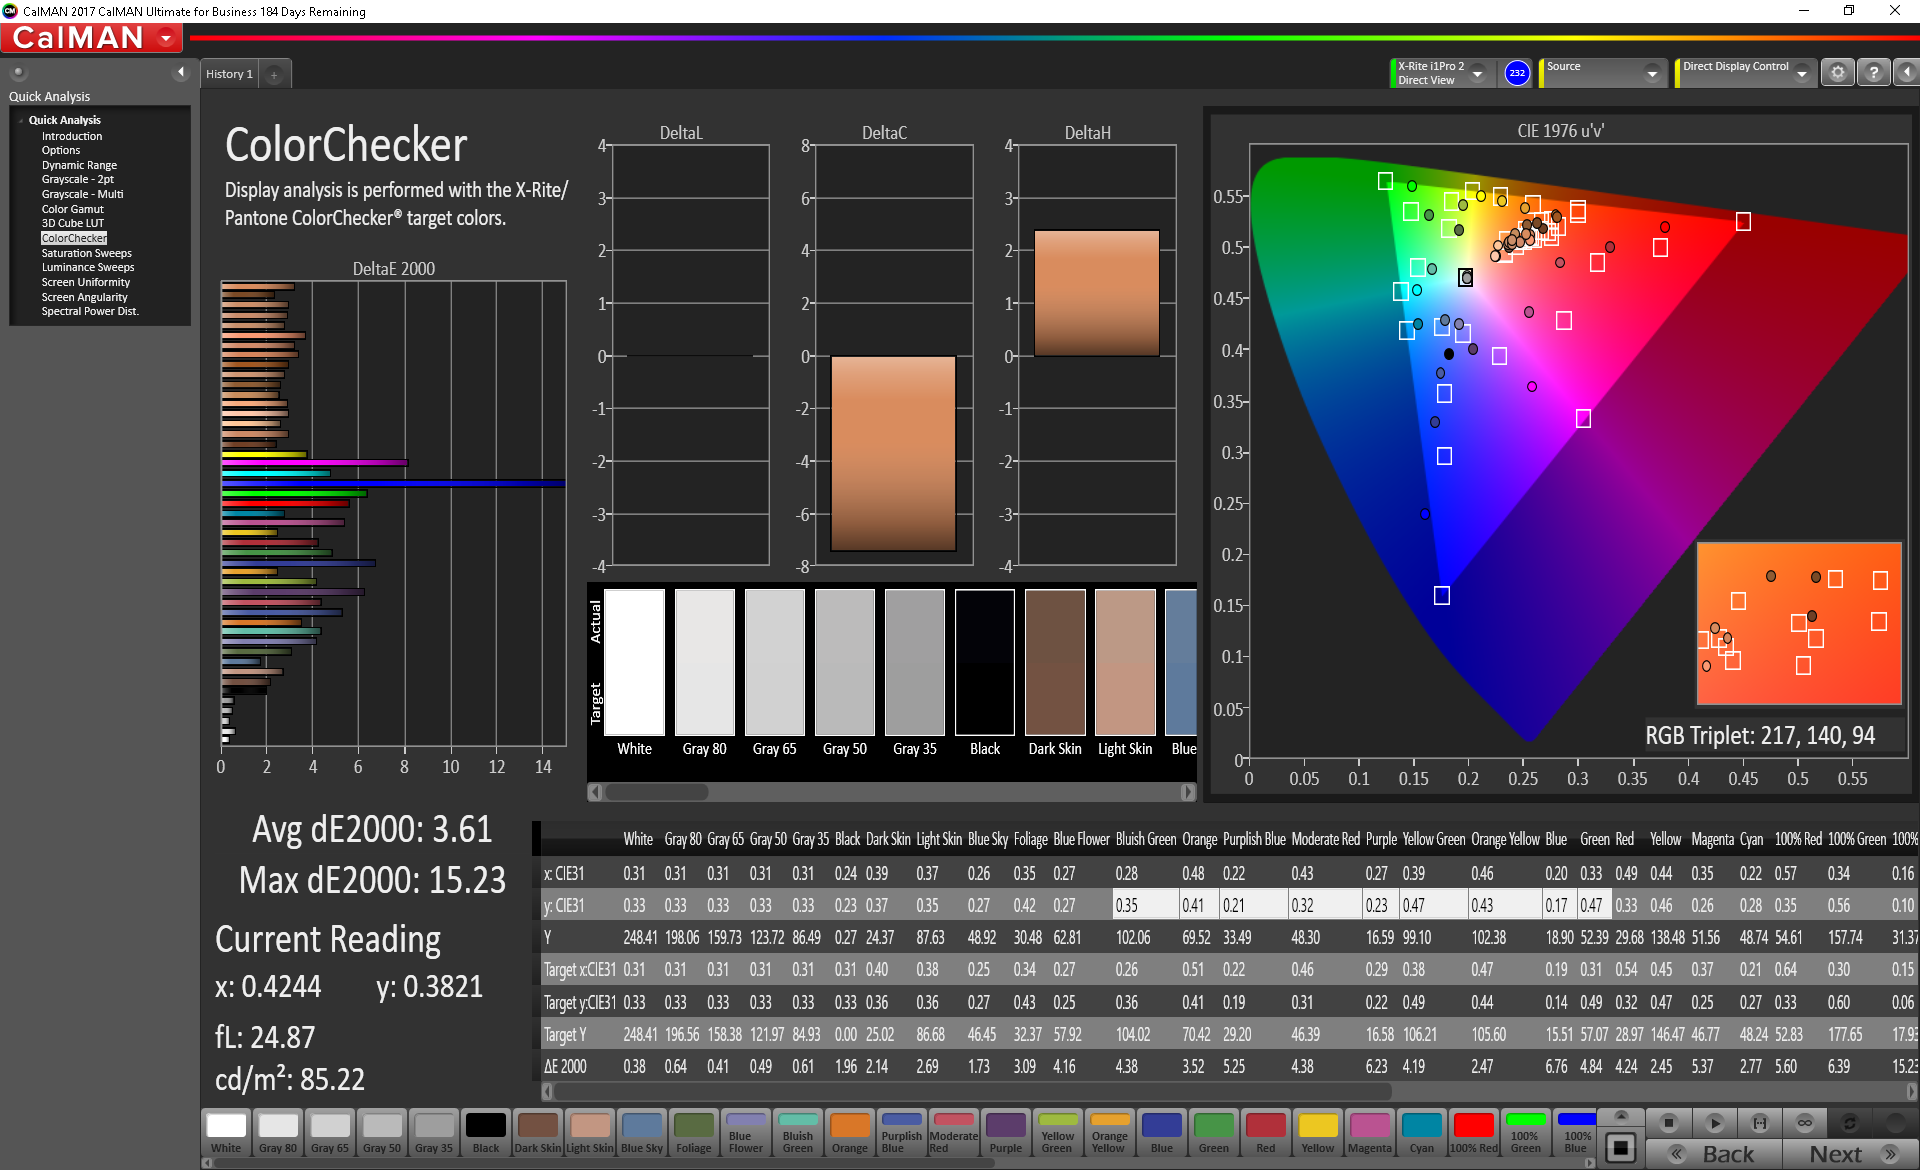
Dig deeper into the colors of the panel and its cut corners begin to show. Color space is only 59 percent and 38 percent of the sRGB and AdobeRGB standards, respectively, which is indicative of a cheap panel. Higher-end laptops like the XPS 15 include Sharp IGZO options for full sRGB coverage and more. For the average user, this means that colors will not be as vivd or accurate on vivobook.
Further analyses with a X-Rite spectrophotometer reveal average grayscale and colors out of the box. The color Blue in particular is very poorly represented as it can appear blue-voilet instead especially on deeper saturation levels. Our calibration efforts improve grayscale by a noticeable degree and we recommend applying our ICC profile above to get the most out of the display. Nonetheless, Blue continues to be very inaccurate no matter our efforts.

Display Response Times
| ↔ Response Time Black to White | ||
|---|---|---|
| 24.8 ms ... rise ↗ and fall ↘ combined | ↗ 14 ms rise | 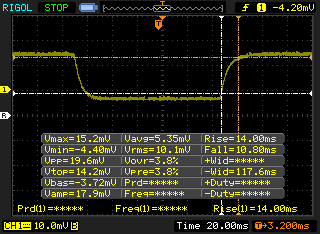 |
| ↘ 10.8 ms fall | ||
| The screen shows good response rates in our tests, but may be too slow for competitive gamers. In comparison, all tested devices range from 0.1 (minimum) to 240 (maximum) ms. » 58 % of all devices are better. This means that the measured response time is worse than the average of all tested devices (19.9 ms). | ||
| ↔ Response Time 50% Grey to 80% Grey | ||
| 27.2 ms ... rise ↗ and fall ↘ combined | ↗ 13.2 ms rise | 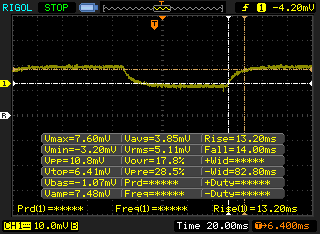 |
| ↘ 14 ms fall | ||
| The screen shows relatively slow response rates in our tests and may be too slow for gamers. In comparison, all tested devices range from 0.165 (minimum) to 636 (maximum) ms. » 37 % of all devices are better. This means that the measured response time is better than the average of all tested devices (31.1 ms). | ||
Screen Flickering / PWM (Pulse-Width Modulation)
| Screen flickering / PWM not detected | 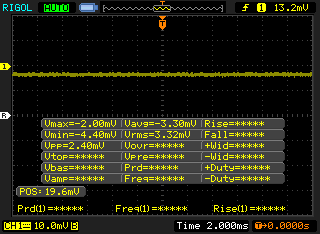 | ||
In comparison: 52 % of all tested devices do not use PWM to dim the display. If PWM was detected, an average of 7798 (minimum: 5 - maximum: 343500) Hz was measured. | |||
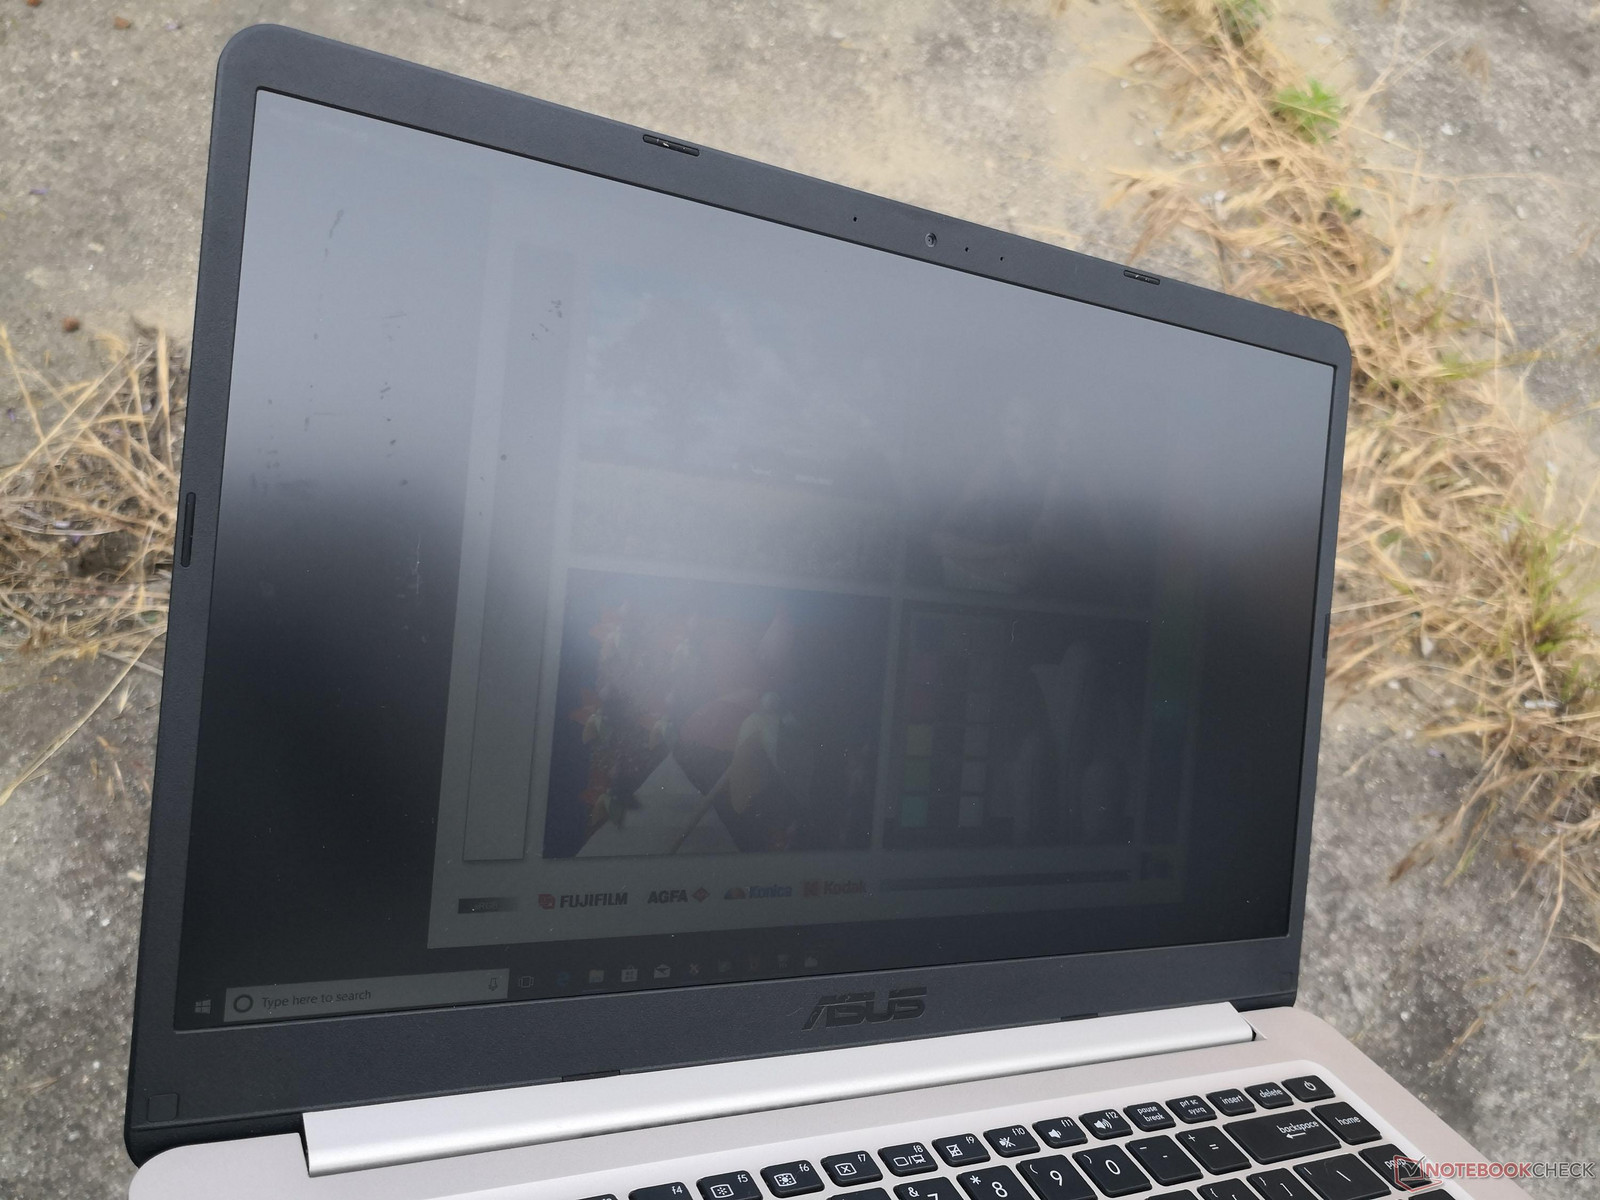
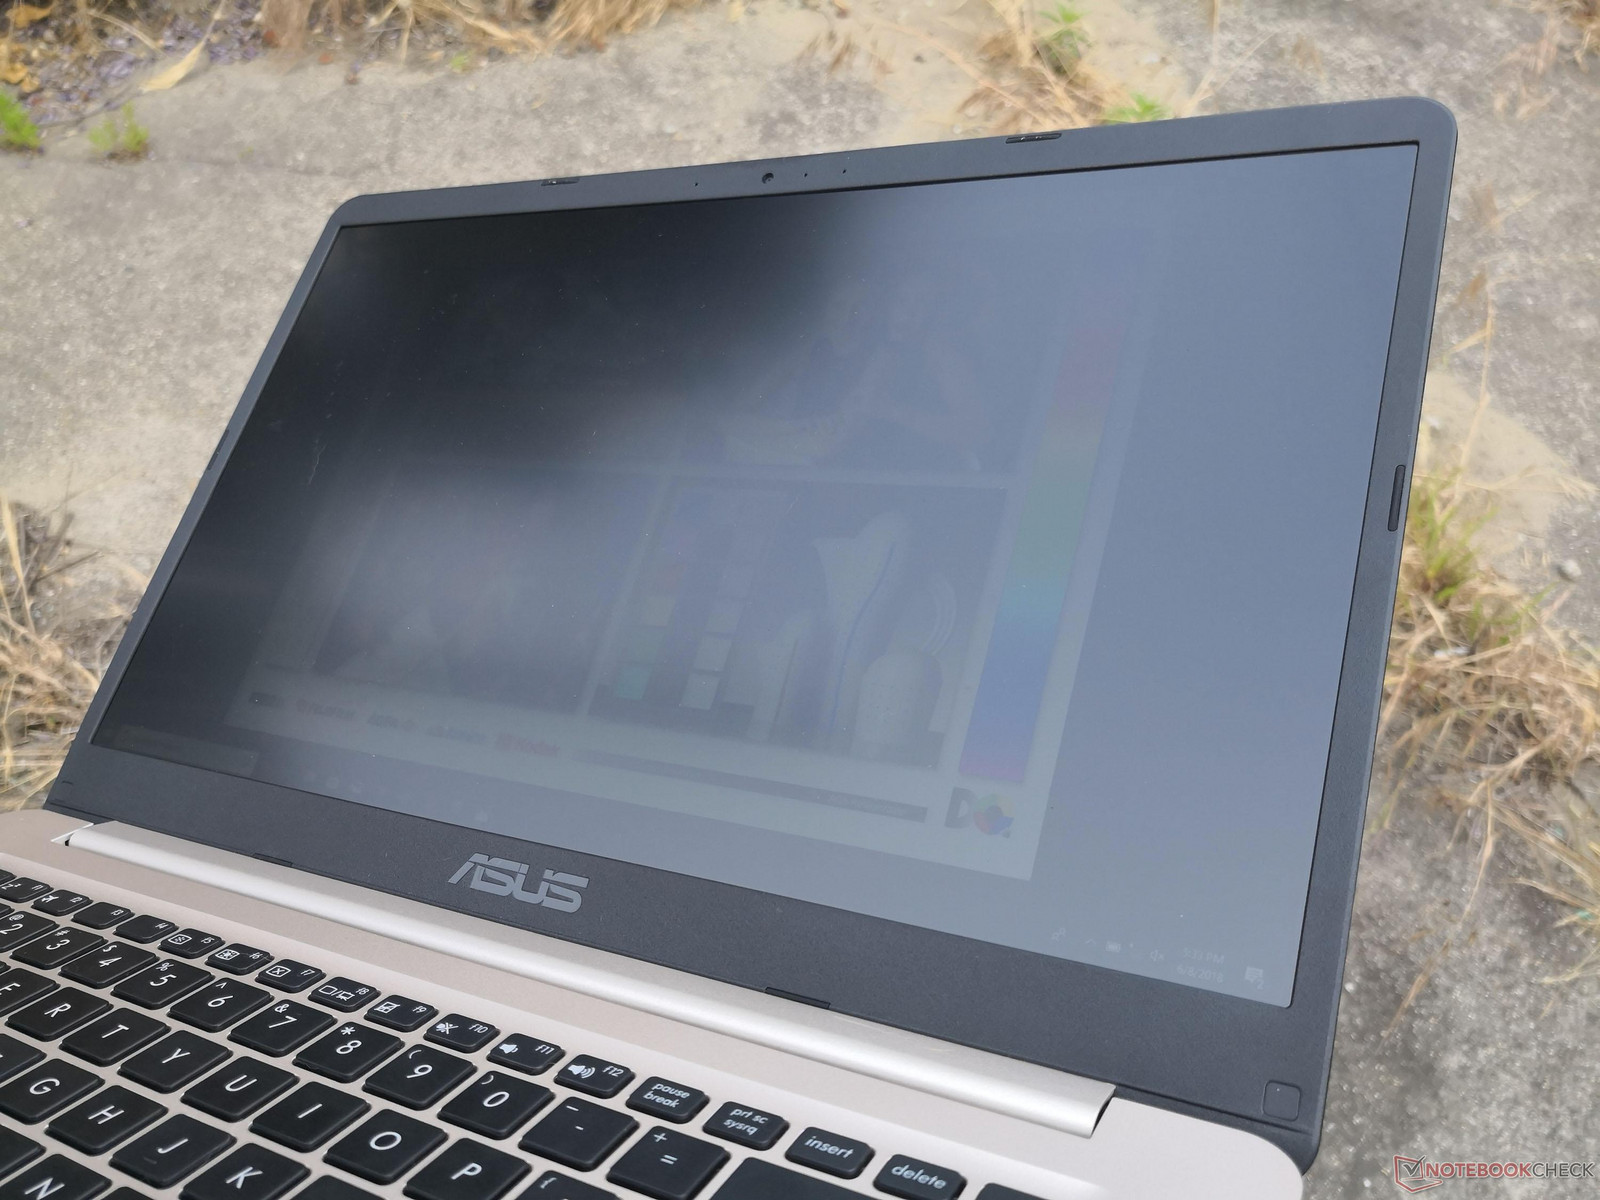
Outdoor visibility is below average since the panel backlight is not powerful enough to overcome glare. Colors become washed out even when under shade and the wide IPS viewing angles do little to help.
Performance
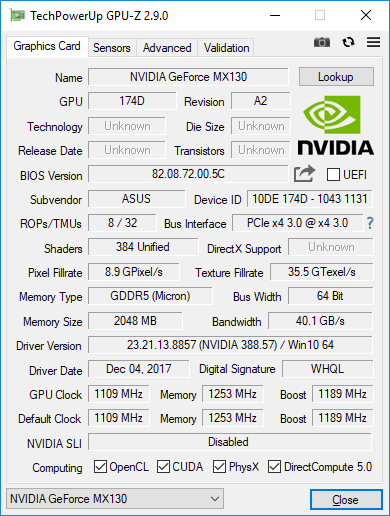
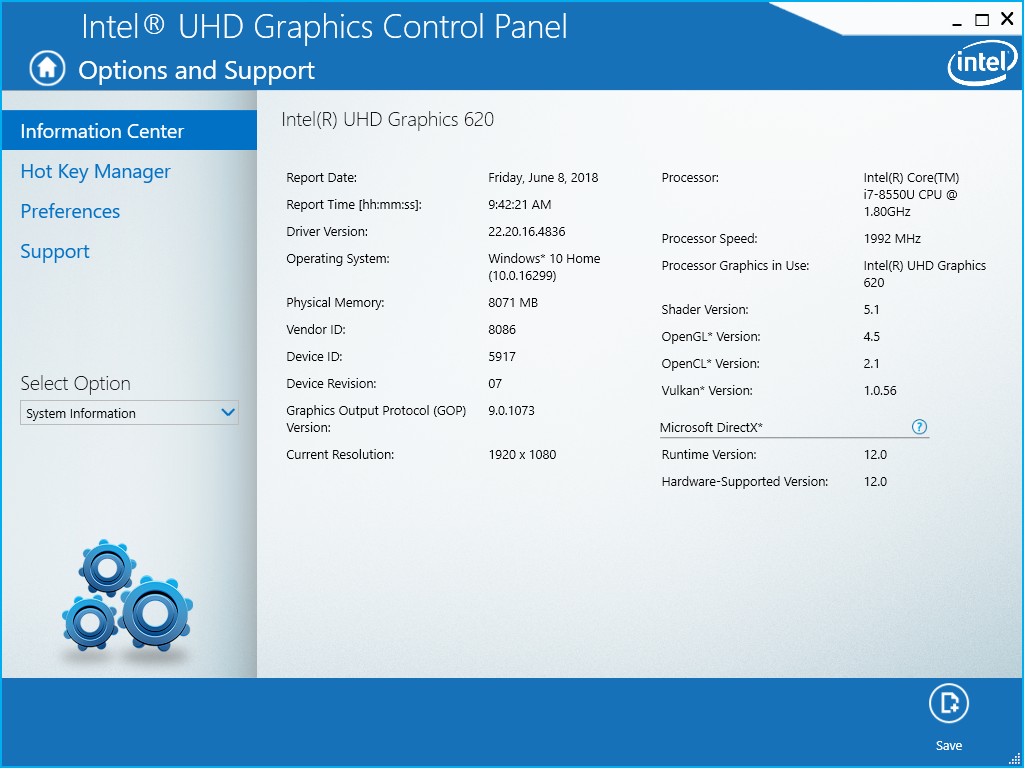
The Core i7-8550U is becoming increasingly common on Ultrabooks of all price ranges. This is the same CPU that can also be found on systems costing double of what our Vivobook is worth. Meanwhile, the GeForce MX130 is much rarer, but it should provide a healthy boost over the Intel UHD Graphics solution. Optimus is included for additional power savings.
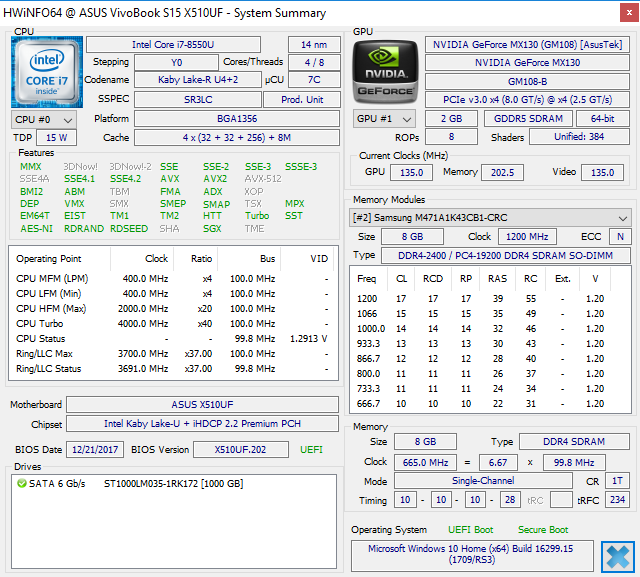
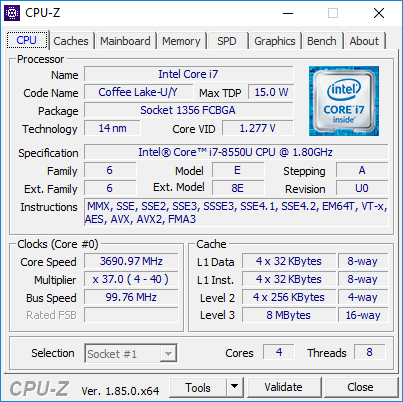
Processor
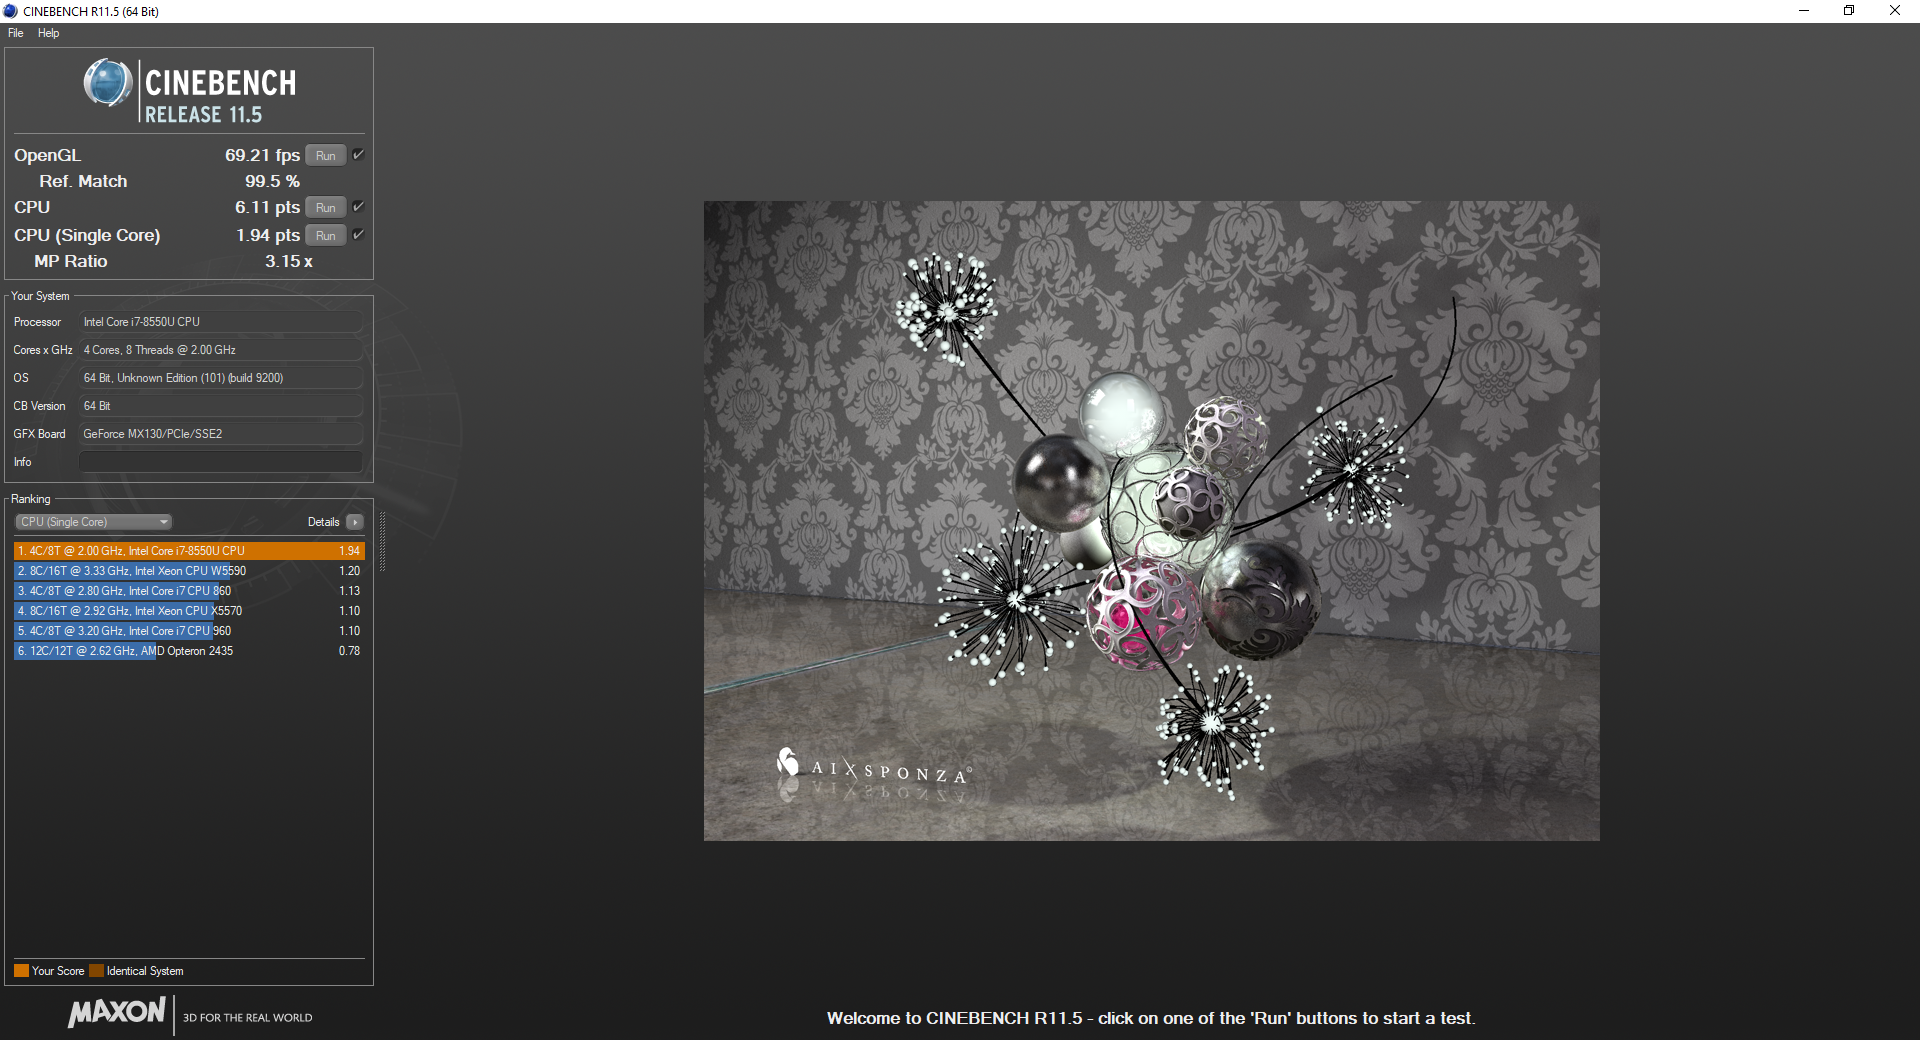
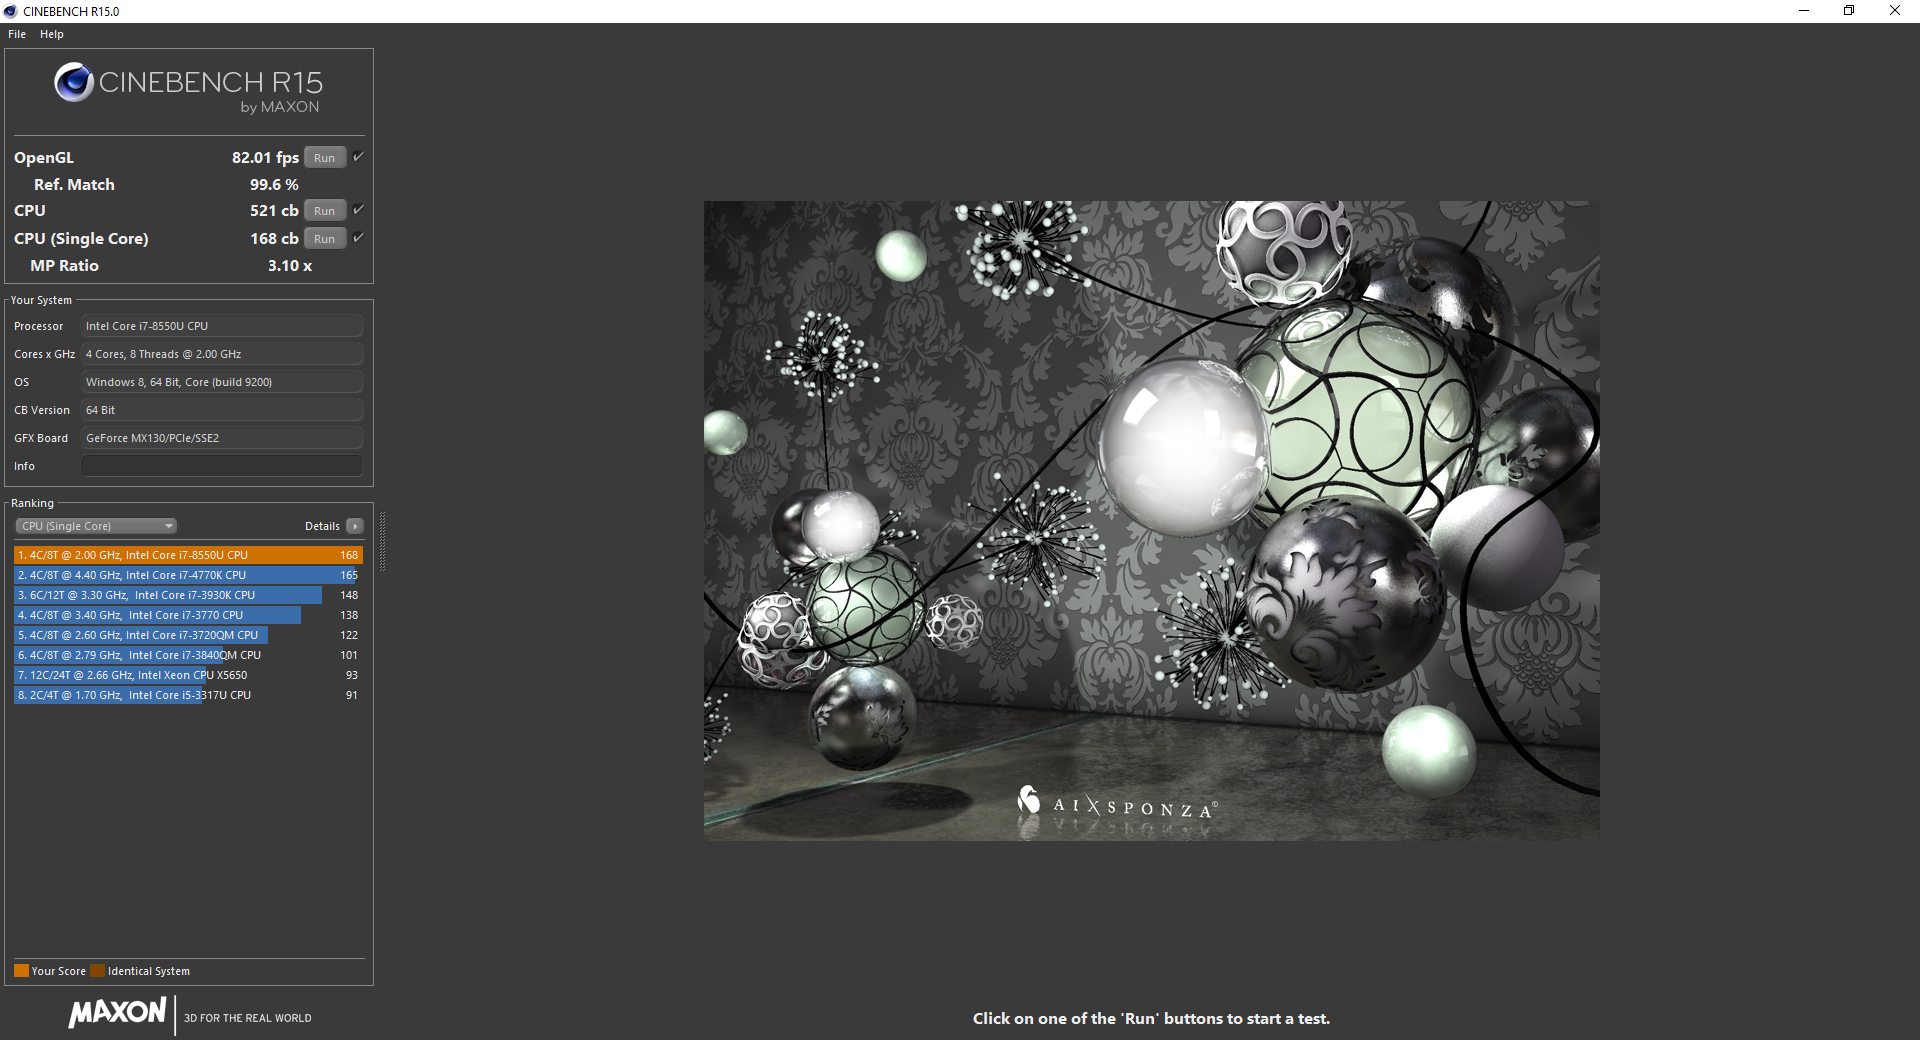
CPU performance is excellent on the Vivobook. Not only are initial scores where we expect them to be for an average i7-8550U CPU, but the system is able to maintain these scores throughout. Running CineBench R15 Multi-Thread in a loop results in just a 5 percent drop in performance at worst. We've seen steeper performance drops from pricier laptops with the same class of CPU such as on the MateBook X Pro.
Users upgrading from the older i5-7200U or i7-7500U will see a massive performance boost of around 100 percent and 80 percent, respectively.
More technical information and benchmarks on the Core i7-8550U can be found on our dedicated page here.
System Performance
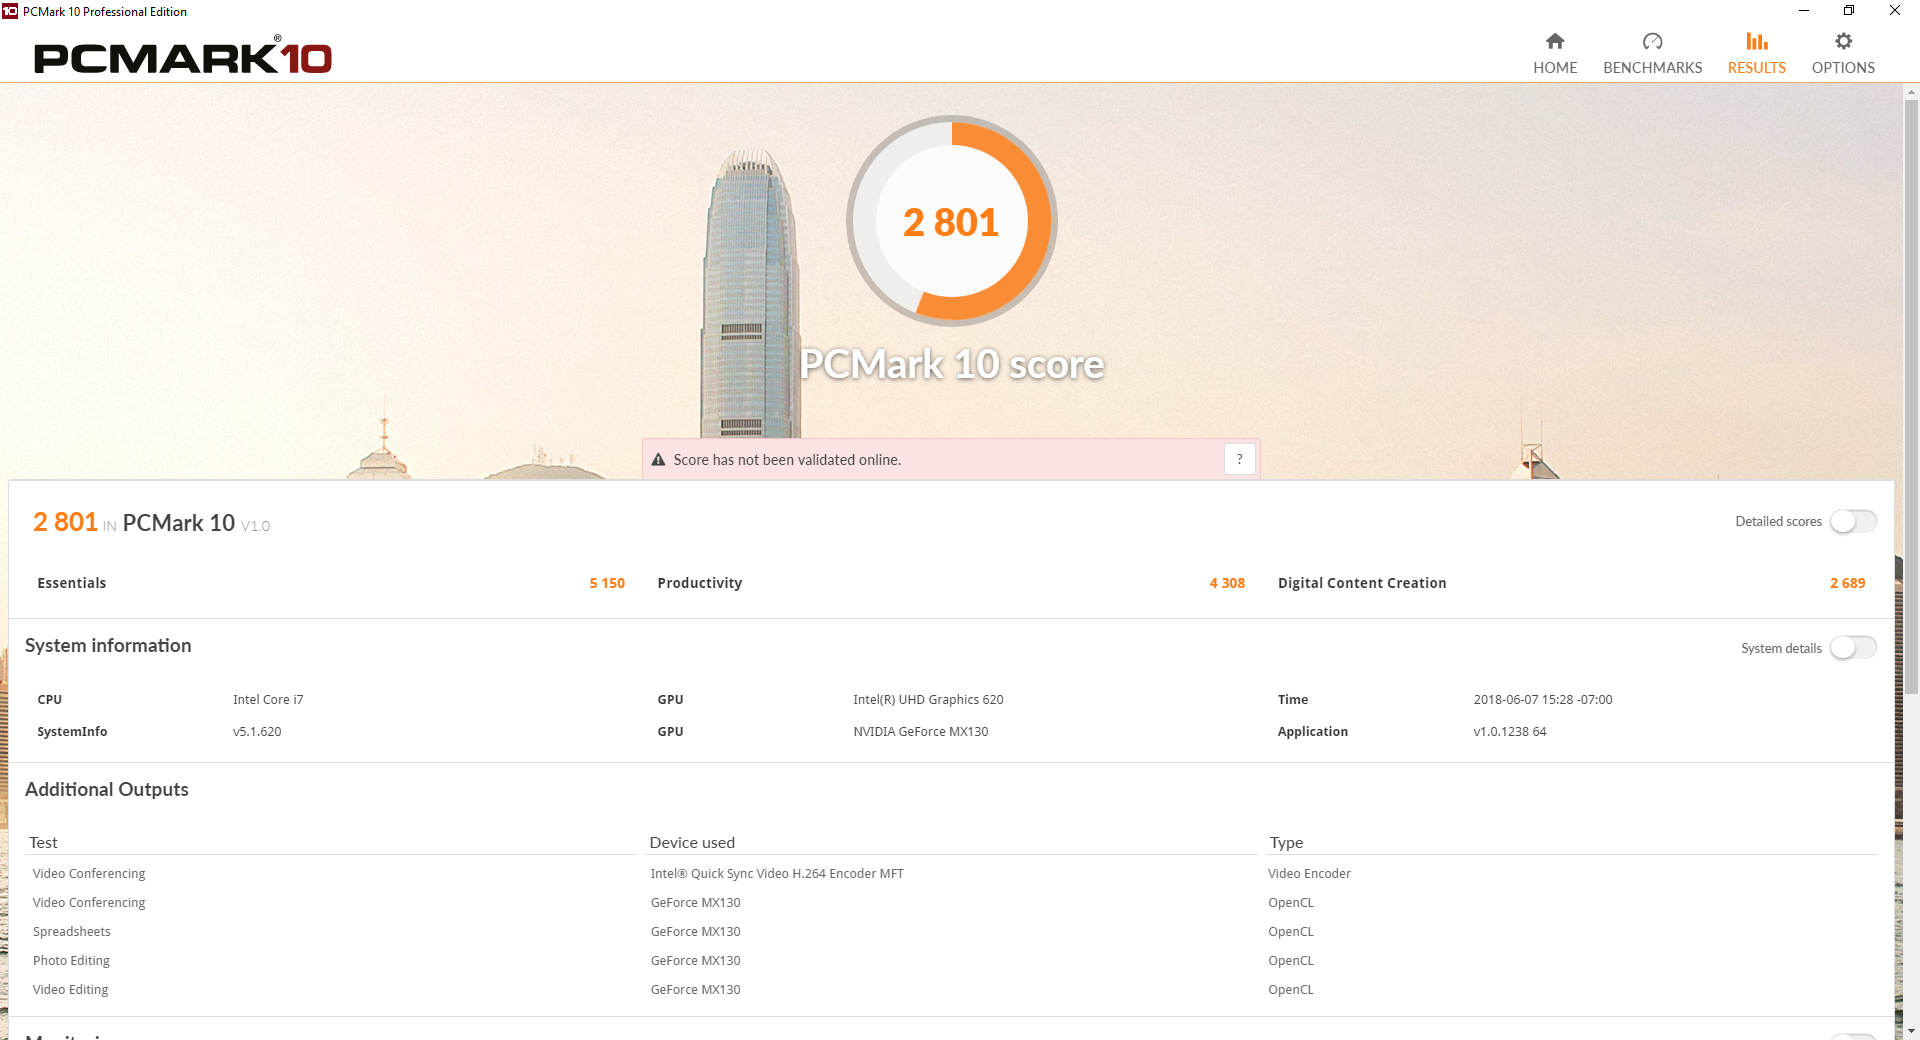
Pcmark scores are on par with competing budget-mainstream notebooks like the Acer Swift 3 or HP Envy x360. We experienced no software issues during our time with the unit save for the slow system responsiveness as one would expect from a primary HDD.
| PCMark 10 - Score | |
| Asus VivoBook 15 X542UF-DM143T | |
| HP Envy x360 15-bq102ng | |
| Asus VivoBook 15 F510UF-ES71 | |
| Dell Inspiron 15 5575-98MH4 | |
| Acer Swift 3 SF315-41-R4W1 | |
| PCMark 8 Home Score Accelerated v2 | 3704 points | |
| PCMark 10 Score | 2801 points | |
Help | ||
Storage Devices
Our unit ships with only a primary 5400 RPM HDD from Seagate even though the system includes two internal storage bays (1x 2.5-inch SATA III + 1x M.2). The result is a very slow system that chugs during bootup, installations, and especially when loading large applications like games or editing software. We highly recommend upgrading or configuring the system with at least a small M.2 SSD for the primary C: drive.
More HDD and SSD benchmarks can be found on our comparison page here.
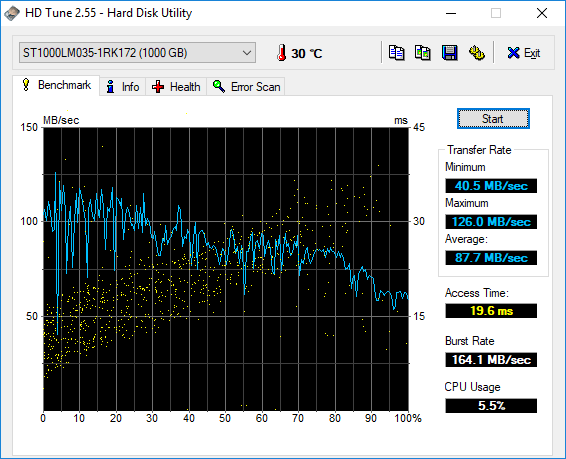
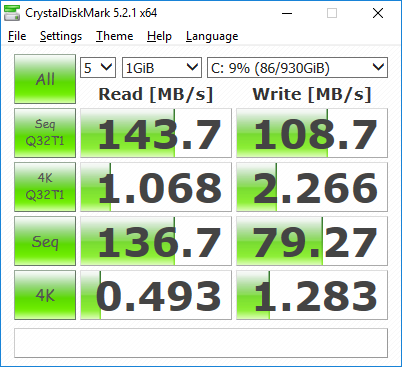
| Asus VivoBook 15 F510UF-ES71 Seagate Mobile HDD 1TB ST1000LM035 | Dell Inspiron 15 5575-98MH4 Seagate Mobile HDD 1TB ST1000LM035 | Asus VivoBook 15 X542UF-DM143T Micron 1100 MTFDDAV256TBN | Acer Swift 3 SF315-41-R4W1 Intel SSD 600p SSDPEKKW256G7 | Asus FX504GD Seagate Mobile HDD 1TB ST1000LX015-1U7172 | Average Seagate Mobile HDD 1TB ST1000LM035 | |
|---|---|---|---|---|---|---|
| CrystalDiskMark 5.2 / 6 | 37% | 5966% | 6335% | -25% | -17% | |
| Write 4K (MB/s) | 1.283 | 3.776 194% | 94.9 7297% | 98.7 7593% | 0.27 -79% | 1.254 ? -2% |
| Read 4K (MB/s) | 0.493 | 0.439 -11% | 27.3 5438% | 29.07 5797% | 0.586 19% | 0.3733 ? -24% |
| Write Seq (MB/s) | 79.3 | 74.9 -6% | 410.4 418% | 606 664% | 86.8 9% | 84 ? 6% |
| Read Seq (MB/s) | 136.7 | 136.3 0% | 464 239% | 1118 718% | 113.2 -17% | 108.7 ? -20% |
| Write 4K Q32T1 (MB/s) | 2.266 | 4.585 102% | 246.5 10778% | 175.2 7632% | 0.242 -89% | 1.574 ? -31% |
| Read 4K Q32T1 (MB/s) | 1.068 | 1.135 6% | 246.4 22971% | 287.8 26848% | 0.963 -10% | 0.87 ? -19% |
| Write Seq Q32T1 (MB/s) | 108.7 | 114.5 5% | 451.4 315% | 599 451% | 98.4 -9% | 91.1 ? -16% |
| Read Seq Q32T1 (MB/s) | 143.7 | 146 2% | 532 270% | 1551 979% | 110.2 -23% | 104.4 ? -27% |

GPU Performance
The GeForce MX130 can be considered a direct successor to the older 930MX. According to 3DMark benchmarks, its raw graphics power is 20 to 40 percent faster than the 930MX and about 200 percent faster than the UHD Graphics 620. Users can expect a performance level similar to that of the GeForce 940MX. Most newer games will run only on low settings and resolutions while older and less demanding titles like Starcraft 2 or DOTA 2 can get away with low 1080p settings.
Jumping from the MX130 to the MX150 as found on the Vivbook S510UN SKU will bring a performance boost of about 20 to 25 percent. The gain would only be noticeable to gamers and possibly video editors. Users who intend to use the notebook mostly for video streaming and browsing will benefit very little from more powerful GPUs. More technical information and benchmark comparisons can be found on our MX130 page here.
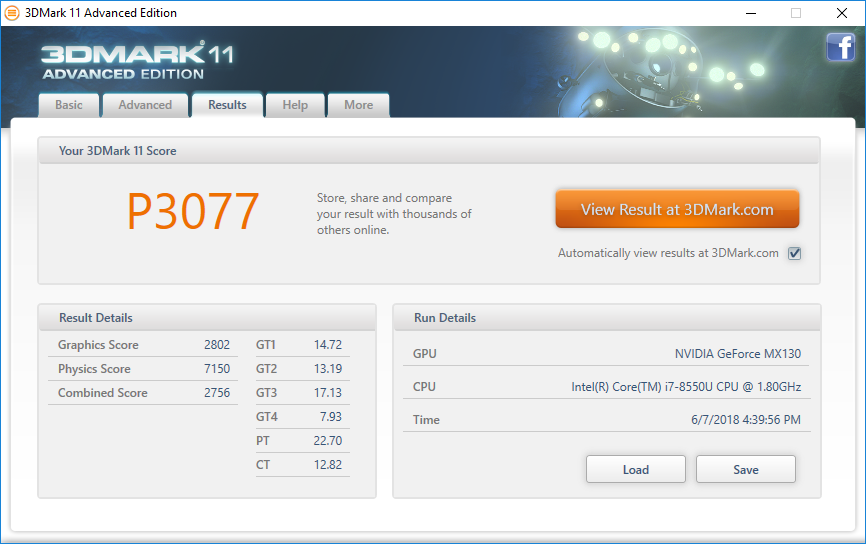
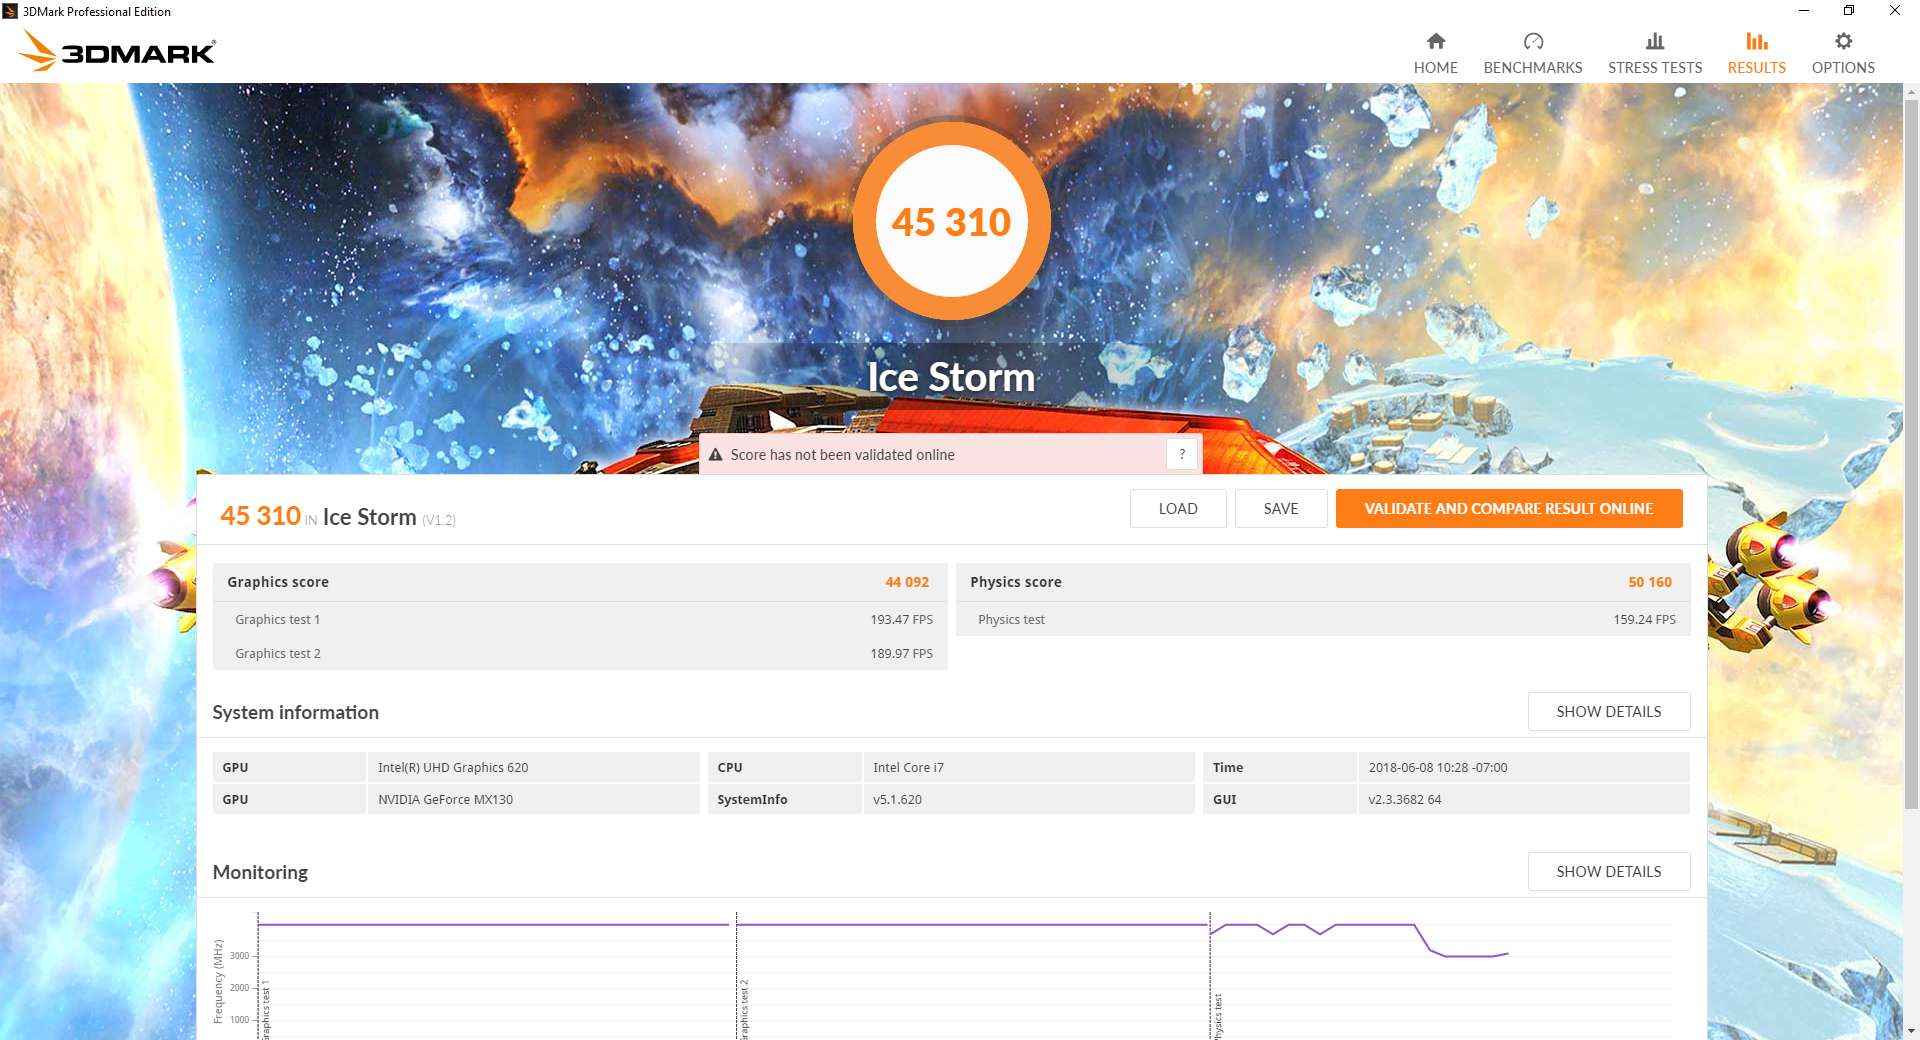
| 3DMark 11 Performance | 3077 points | |
| 3DMark Ice Storm Standard Score | 45310 points | |
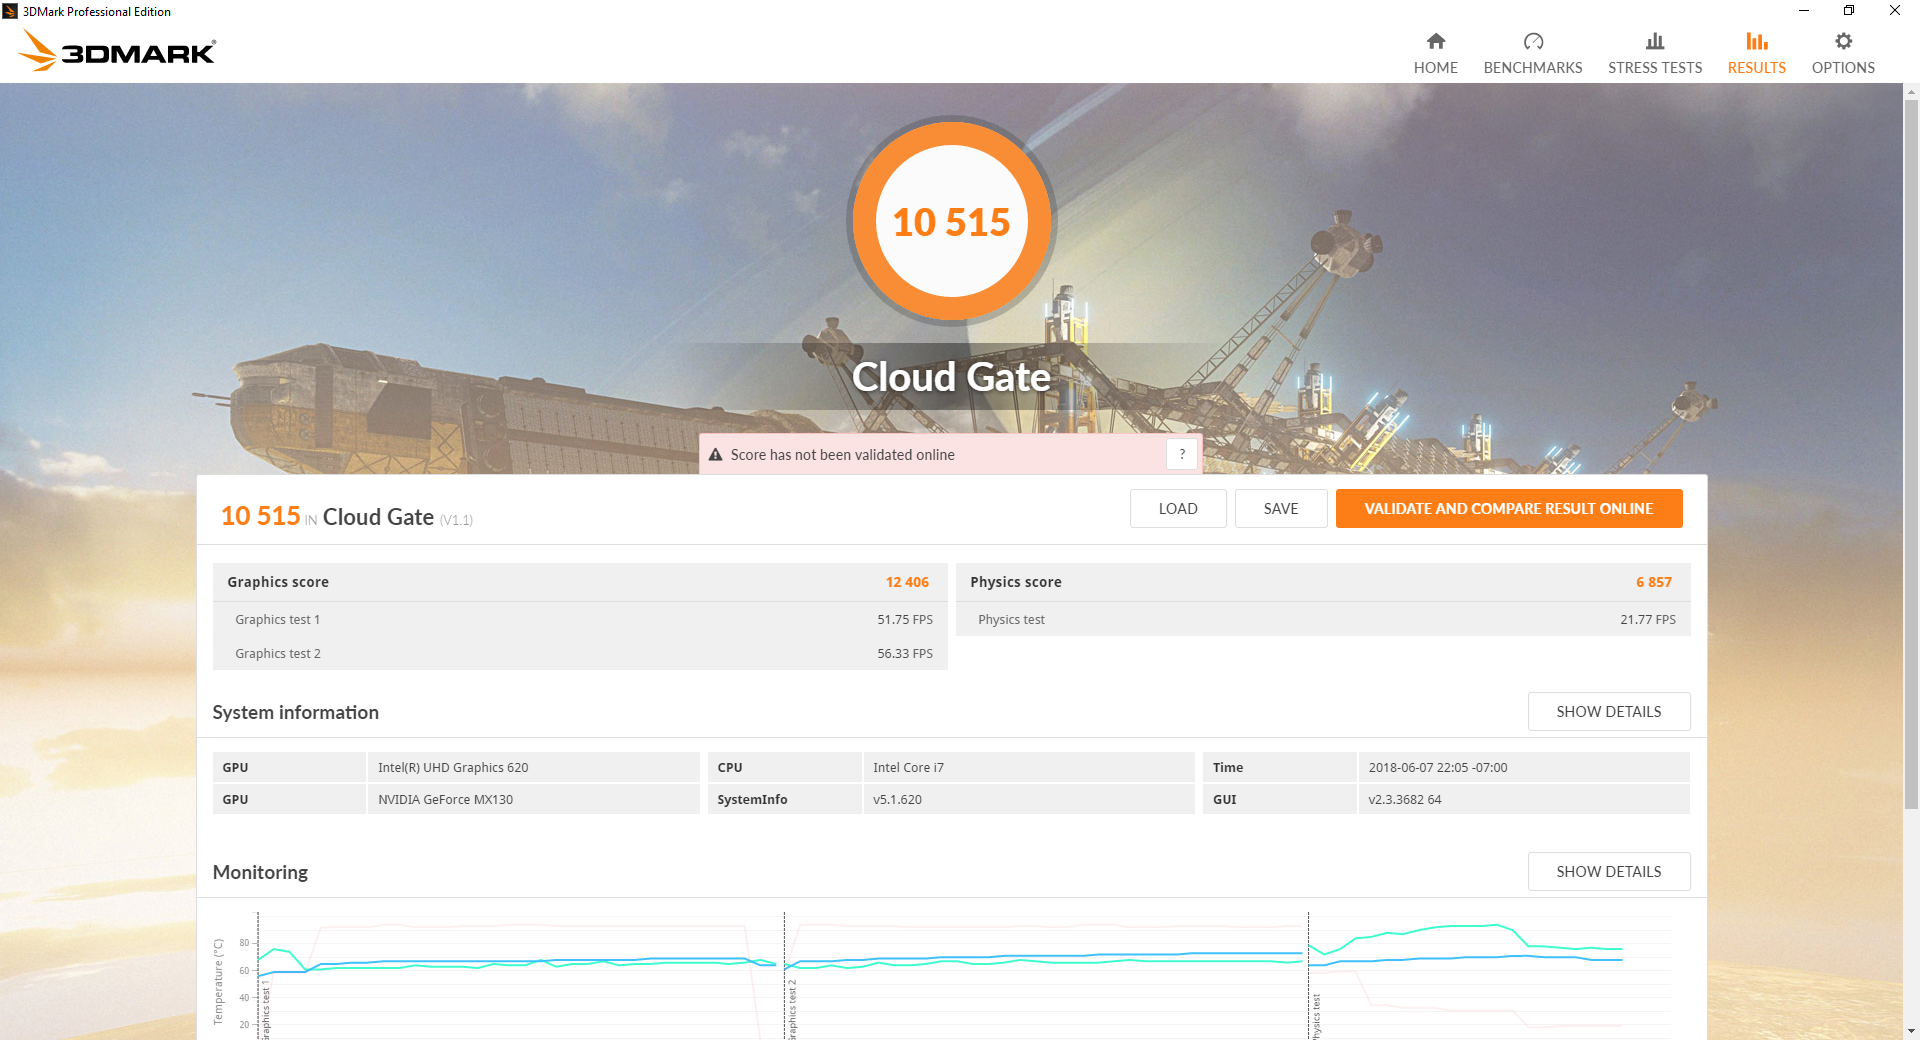
| 3DMark Cloud Gate Standard Score | 10515 points | |
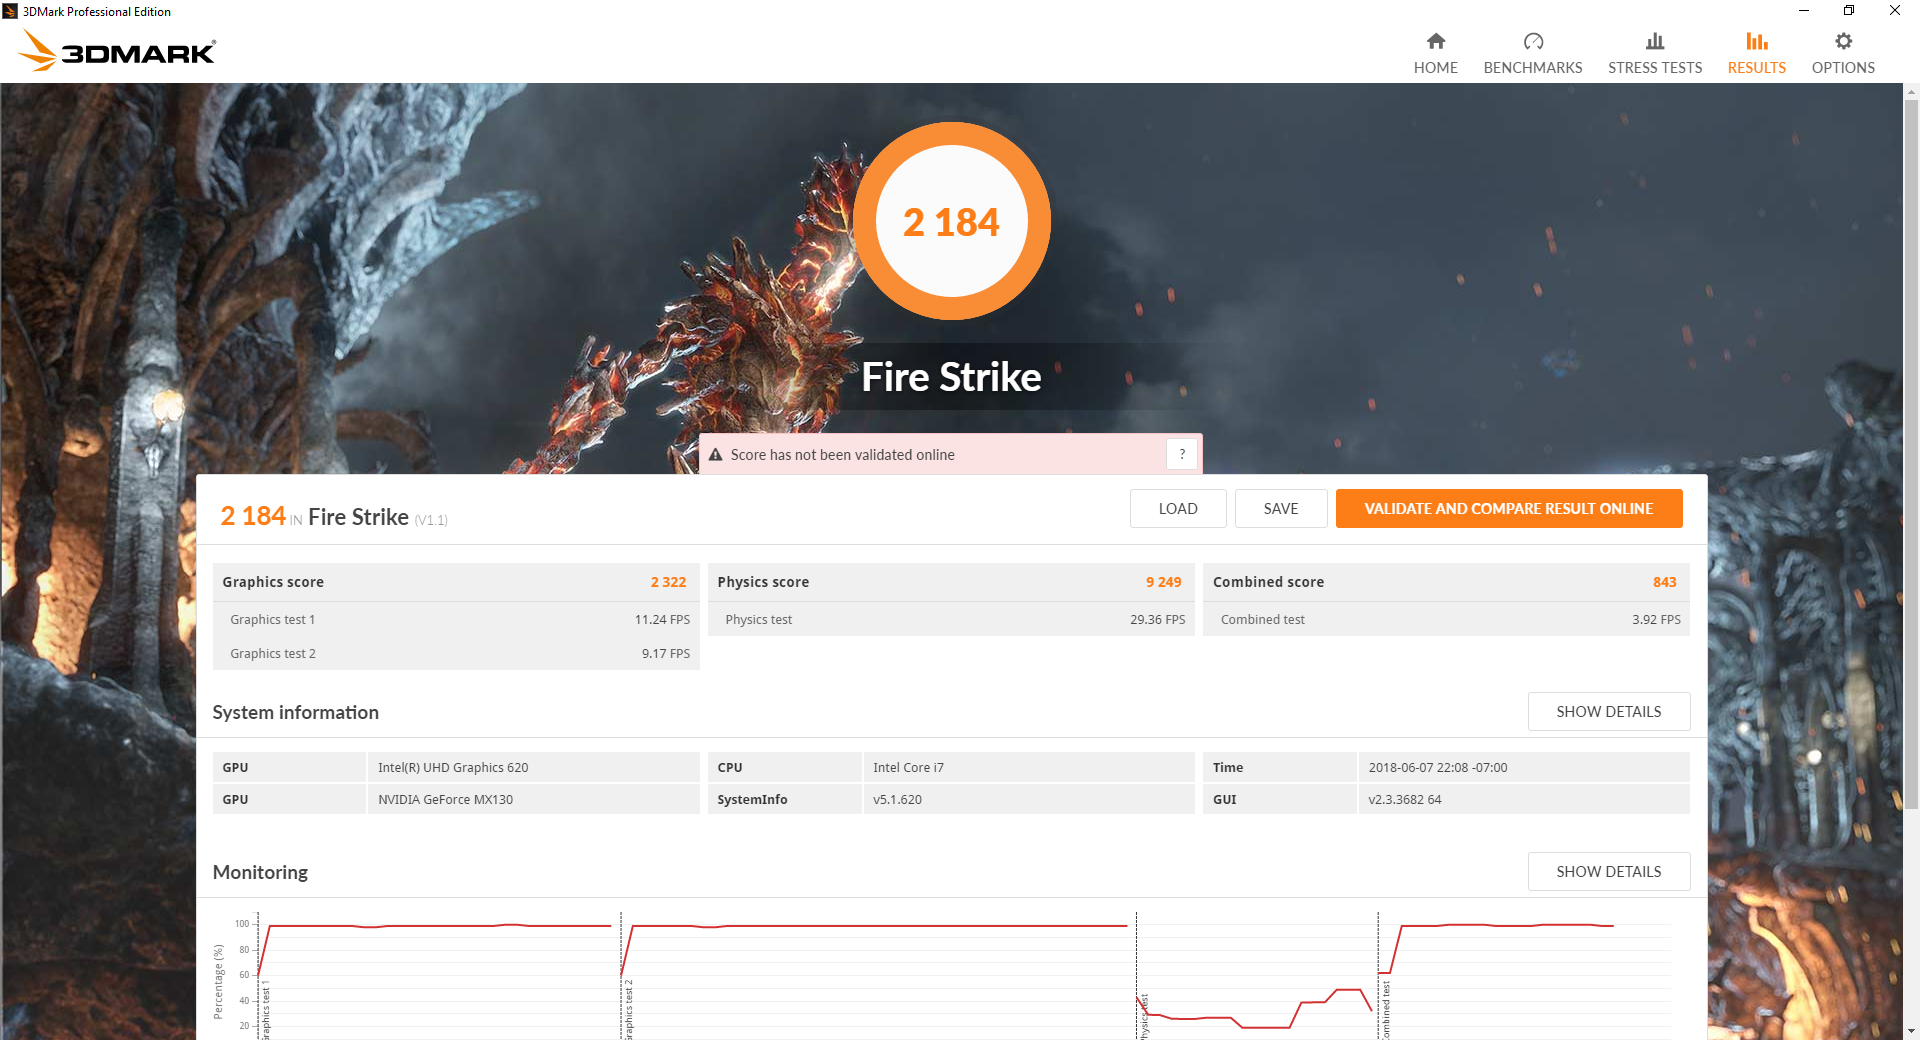
| 3DMark Fire Strike Score | 2184 points | |
Help | ||
| low | med. | high | ultra | |
|---|---|---|---|---|
| StarCraft II: Heart of the Swarm (2013) | 289 | 123.2 | 69.7 | 34.7 |
| BioShock Infinite (2013) | 119.5 | 69.9 | 60.5 | 22.8 |
| The Witcher 3 (2015) | 43.9 | 25.3 | 14 | 7.6 |
| Rise of the Tomb Raider (2016) | 37.3 | 29.2 | 15.8 | 12.8 |
| Overwatch (2016) | 111.3 | 75.2 | 35.6 |
Stress Test
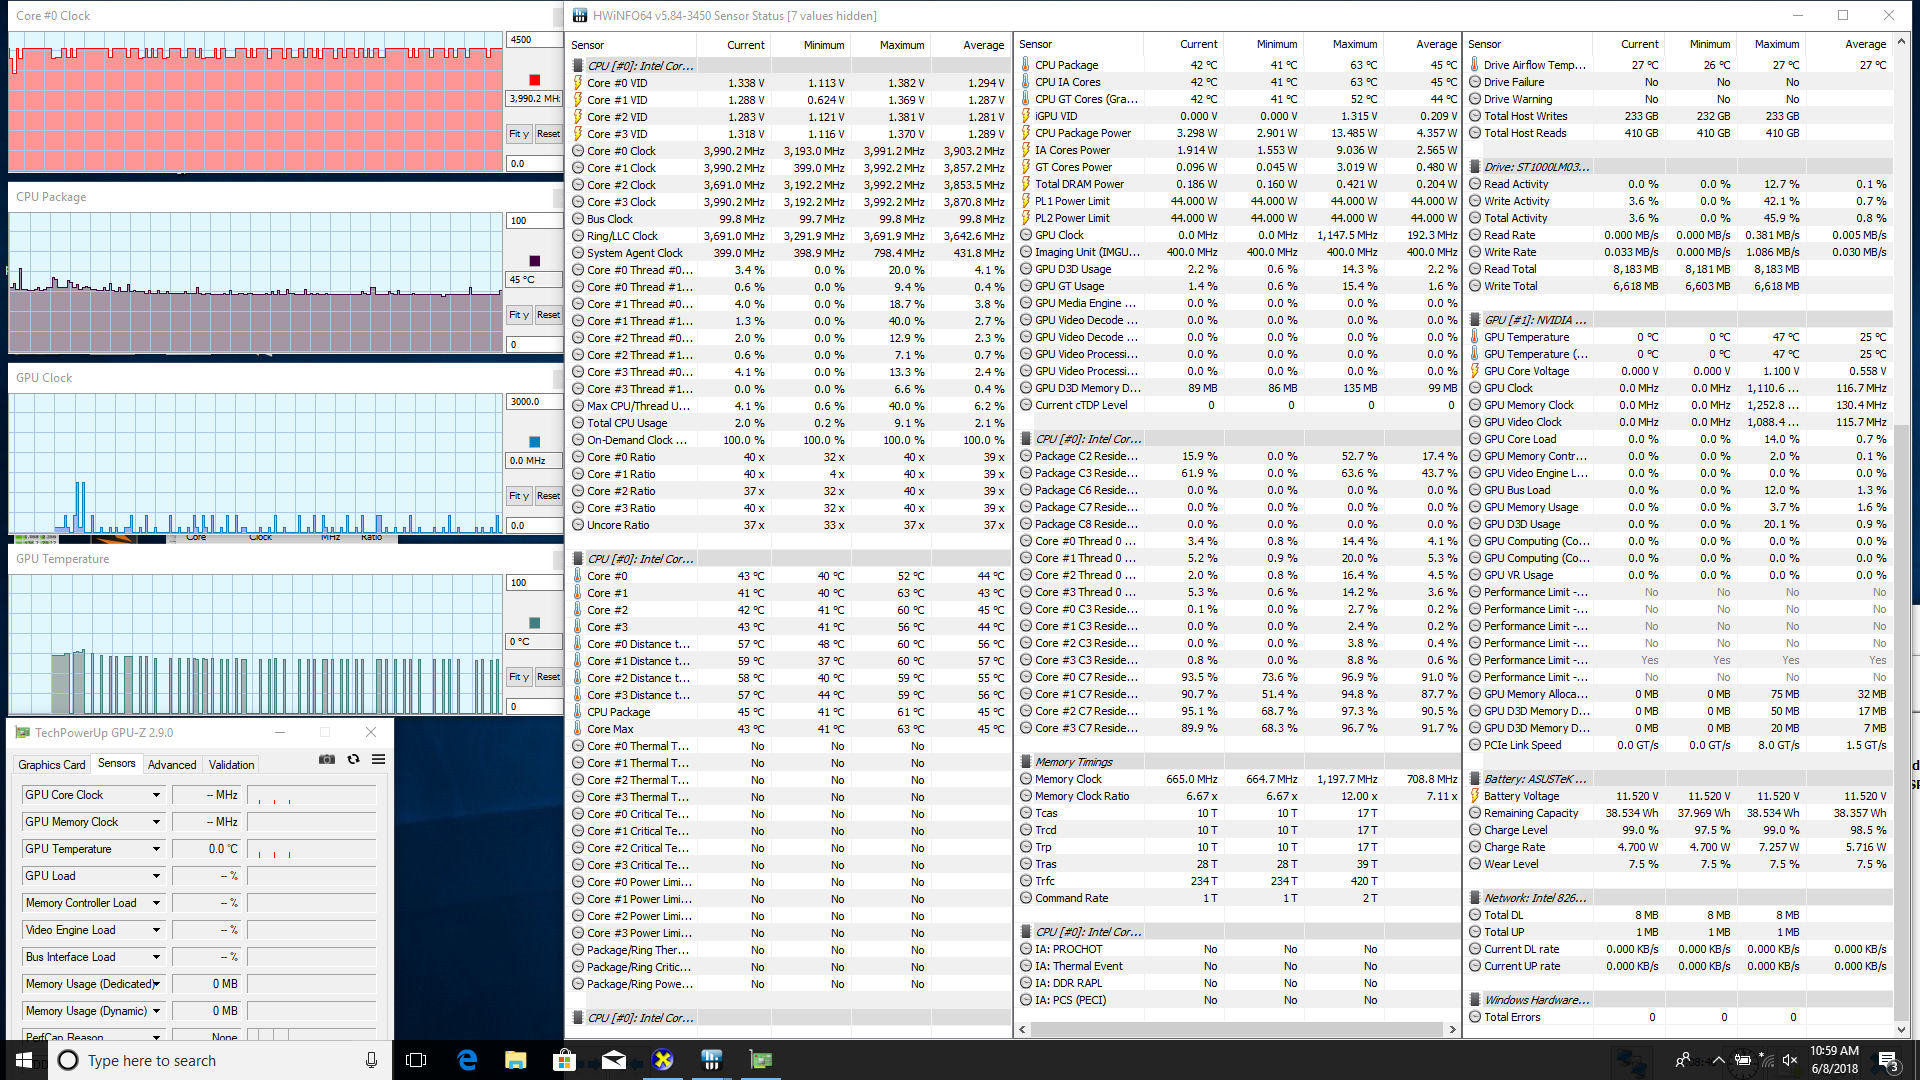
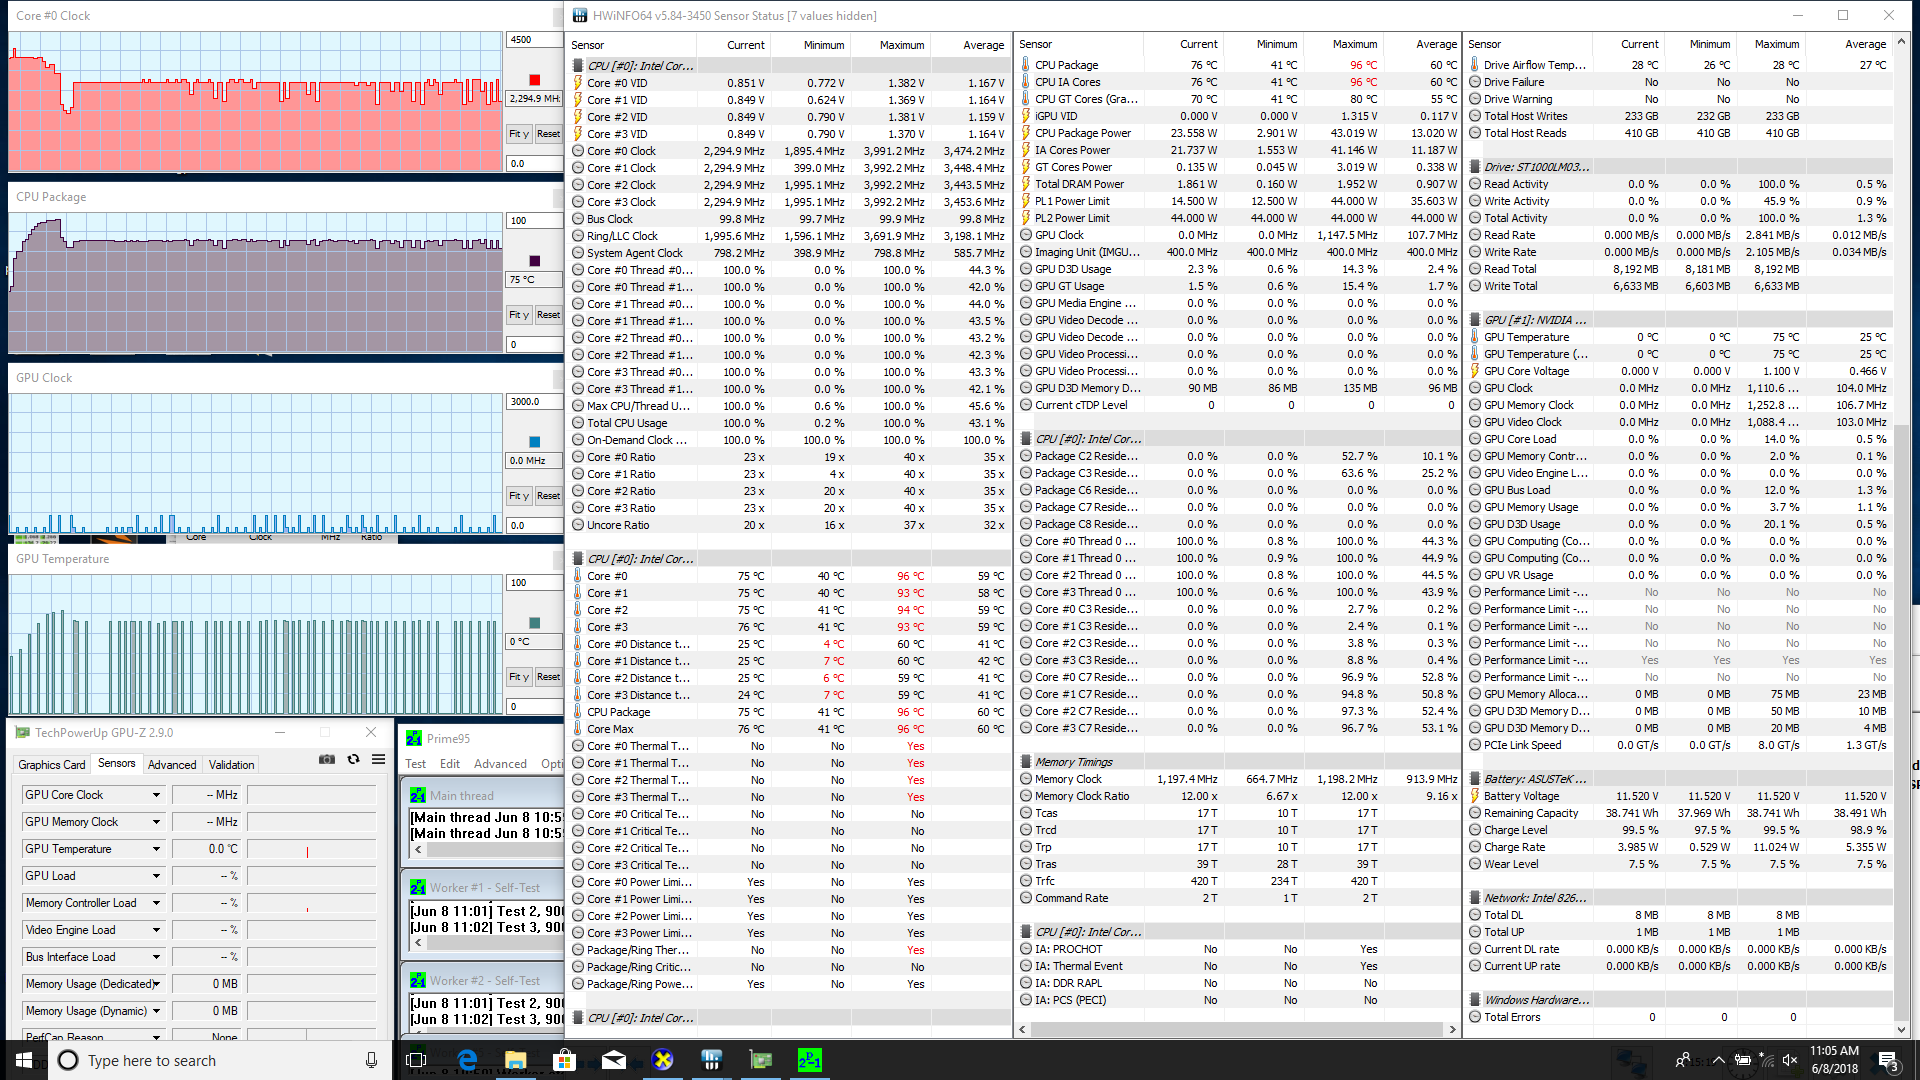
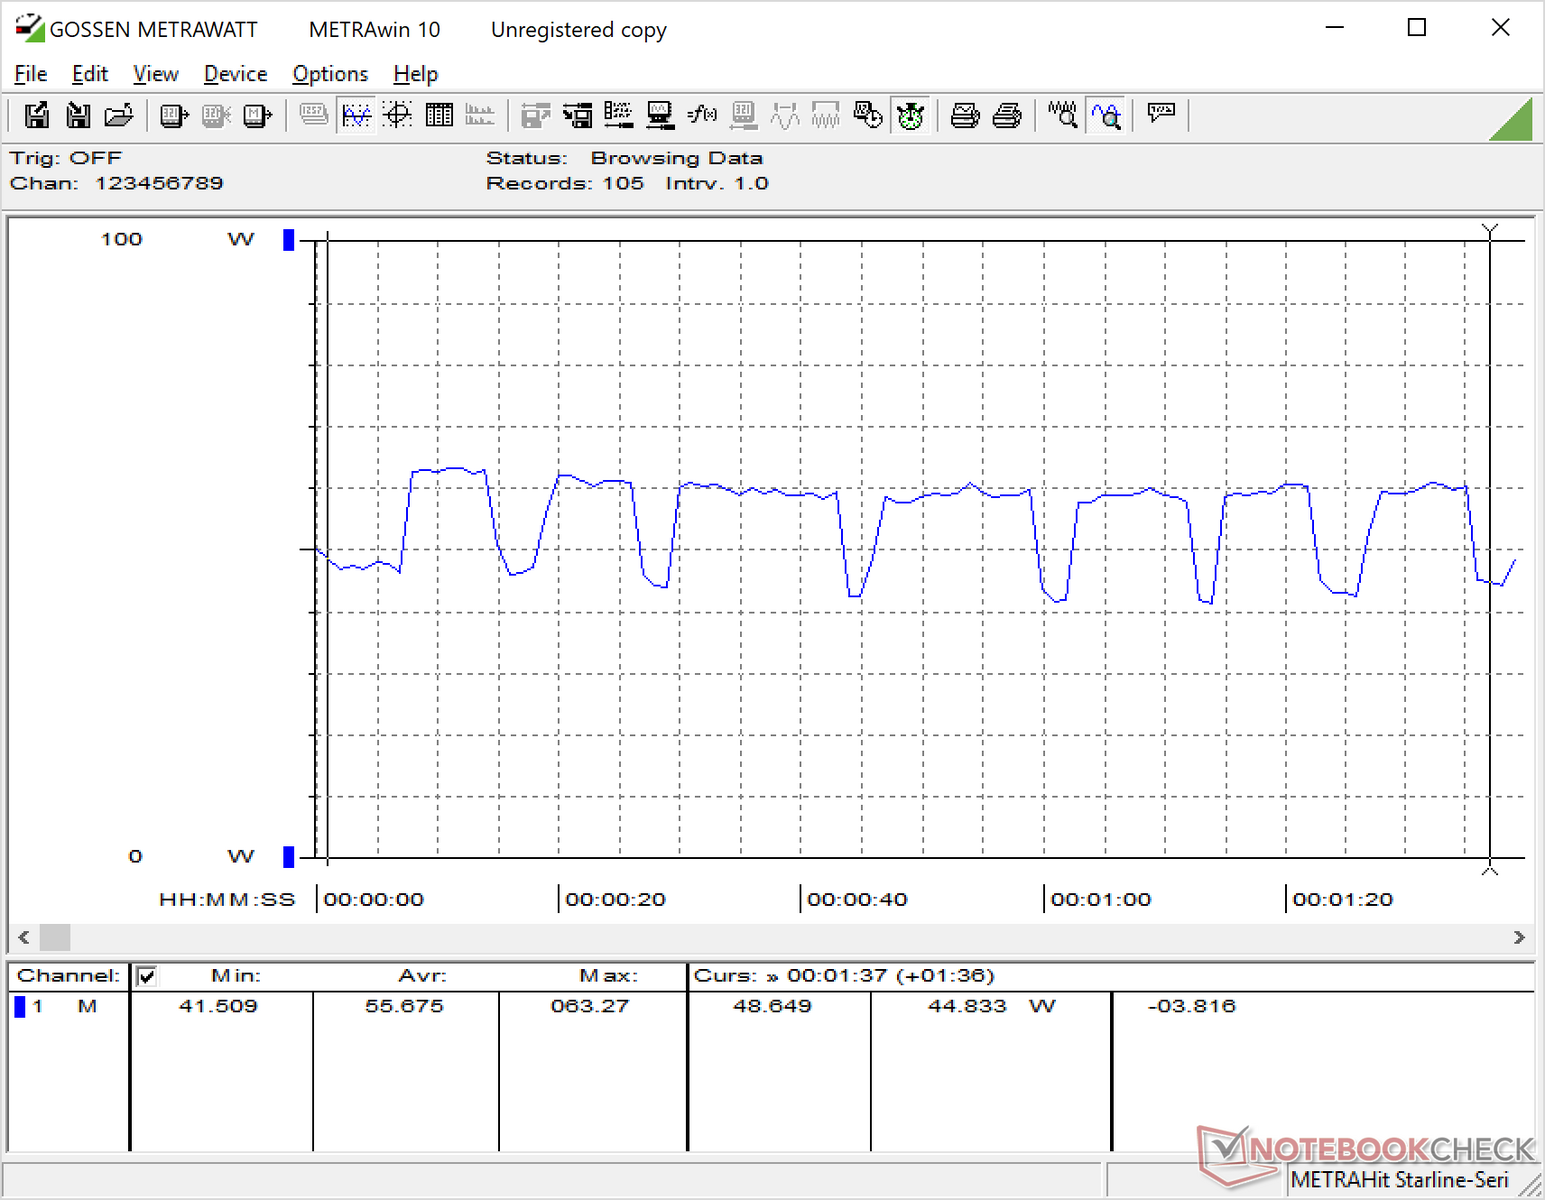
We stress the notebook to identify for any potential throttling or stability issues. When running Prime95 to stress the CPU, clock rates can be observed as high as 3.7 GHz for the first few seconds until core temperatures reach 96 C. Afterwards, clock rates stabilize between 2.3 GHz and 2.9 GHz in order to maintain a cooler core temperature of 75 C as shown by the Prime95 stress test screenshot below. Running both Prime95 and FurMark simultaneously will drop the CPU down to just 1.9 GHz. Interestingly, GPU memory clock rate will alternate between 400 MHz and 1252 MHz when under such extreme loads. The changes in GPU temperature and system power consumption reflect the uncommon behavior of the GPU memory clock rate.
We would have expected steadier CPU clock rates during the Prime95 stress test since the results from the CineBench loop test above are very good. The dips to 2.3 GHz may be short-lived enough to not have any on impact our CineBench results.
Running Witcher 3 is more representative of real-world gaming loads. Fortunately, the odd GPU VRAM behavior from above is not present as it remains steady at 1253 MHz. The CPU is able to operate comfortably at 3.8 GHz or faster with core temperatures averaging at about 77 C for both processors.
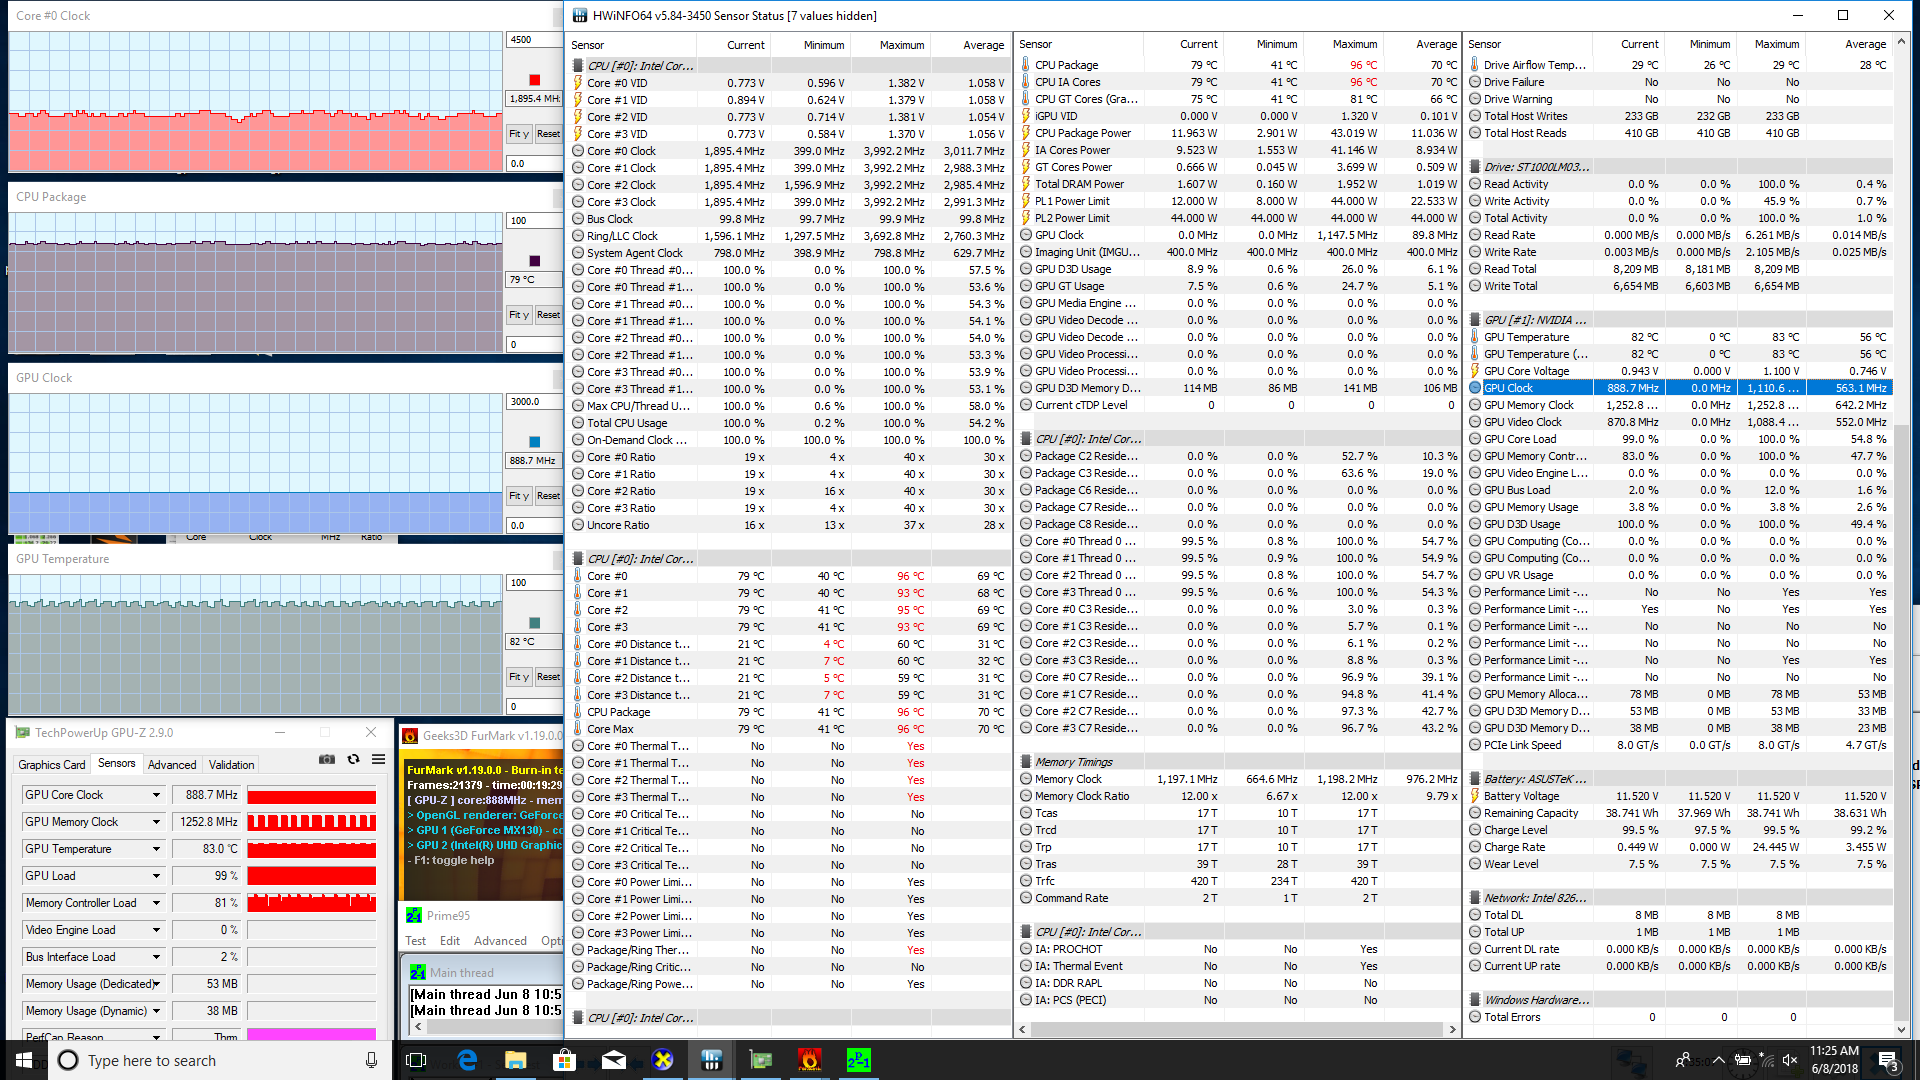
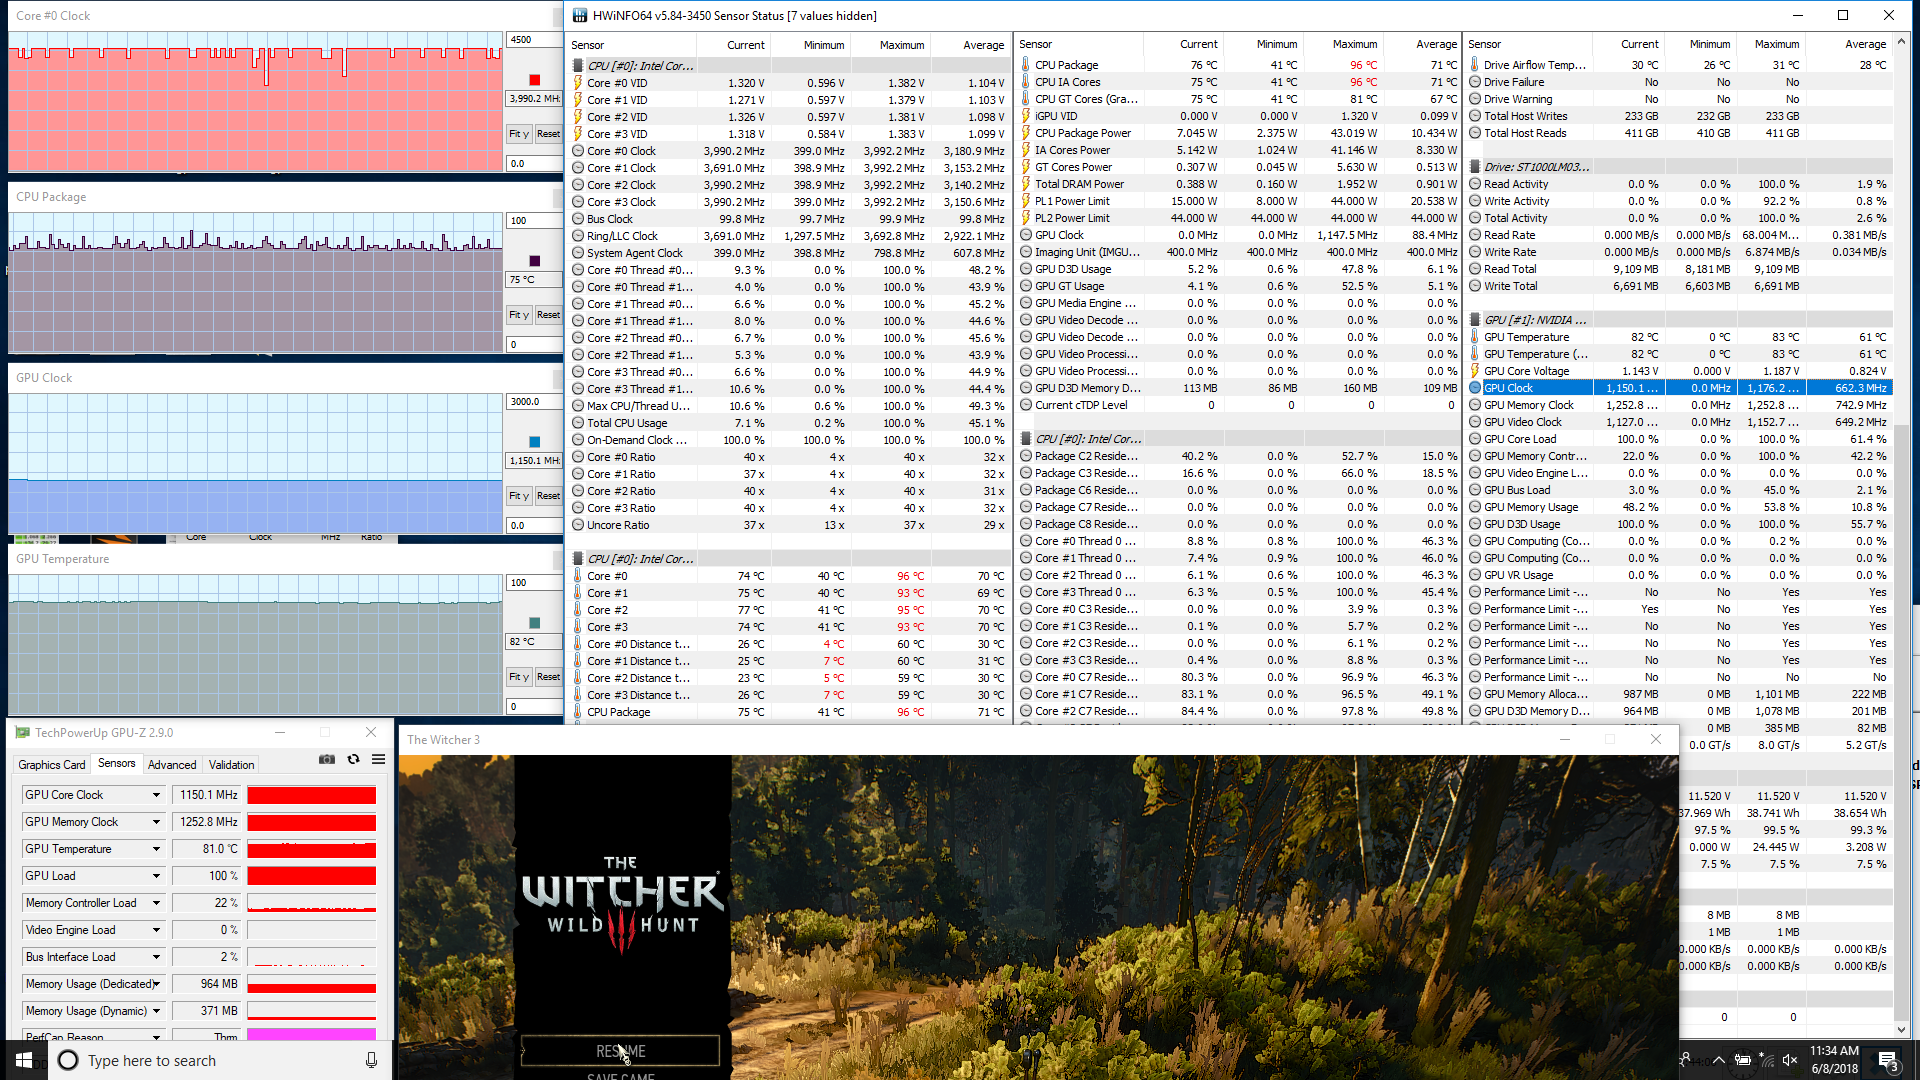
| CPU Clock (GHz) | GPU Clock (MHz) | Average CPU Temperature (°C) | Average GPU Temperature (°C) | |
| Prime95 Stress | 2.3 - 2.9 | -- | 75 | -- |
| FurMark Stress | -- | 980 | 73 | 82 |
| Prime95 + FurMark Stress | 1.9 | 889 | 79 | 70 |
| Witcher 3 Stress | 3.8 - 4.0 | 1150 | 75 | 82 |
Emissions
System Noise
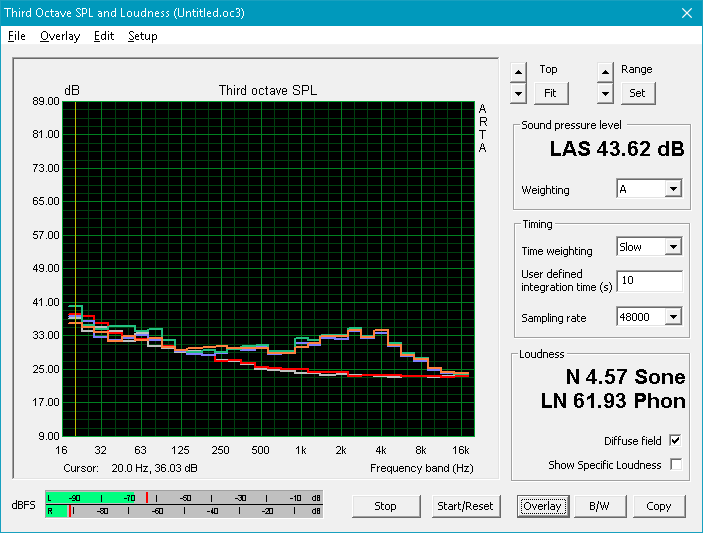
While CPU and GPU performance is very good, it comes at the cost of higher fan noise. The Vivobook can become very loud at almost 46 dB(A) simply by running the first benchmark scene of 3DMark 06. Gaming will induce a very similar fan noise level as well. Most ultrabooks like the Envy x360 15 or even the Yoga 720 with the uncommon Radeon RX 560 are quieter when subjected to similar loads.
Perhaps the only few bright spots are that we can notice no coil whining and the single fan is lethargic during low processing loads. Thus, the fan is unlikely to pulsate or suddenly jump in RPM when video streaming, browsing, or word processing when set to the Power Saver profile.
Noise level
| Idle |
| 30.8 / 30.8 / 31 dB(A) |
| Load |
| 45.6 / 46.7 dB(A) |
 | ||
30 dB silent 40 dB(A) audible 50 dB(A) loud |
||
min: | ||
| Asus VivoBook 15 F510UF-ES71 GeForce MX130, i5-8550U, Seagate Mobile HDD 1TB ST1000LM035 | Asus Vivobook S15 S510UQ-BQ189T GeForce 940MX, i5-7200U, Toshiba SG5 THNSNK128GVN8 | Dell Inspiron 15 5575-98MH4 Vega 3, R3 2200U, Seagate Mobile HDD 1TB ST1000LM035 | HP Envy x360 15-bq102ng Vega 8, R5 2500U, Samsung PM961 MZVLW256HEHP | Lenovo IdeaPad 720-15IKB Radeon RX 560 (Laptop), i5-7200U, Samsung PM961 MZVLW256HEHP | Acer Swift 3 SF315-41-R4W1 Vega 8, R5 2500U, Intel SSD 600p SSDPEKKW256G7 | |
|---|---|---|---|---|---|---|
| Noise | 0% | 5% | 6% | 6% | 5% | |
| off / environment * (dB) | 28.5 | 30.6 -7% | 30.4 -7% | 30.13 -6% | 30.3 -6% | 31.8 -12% |
| Idle Minimum * (dB) | 30.8 | 31.2 -1% | 31.4 -2% | 30.13 2% | 30.3 2% | 31.8 -3% |
| Idle Average * (dB) | 30.8 | 31.2 -1% | 31.4 -2% | 30.13 2% | 30.3 2% | 32.1 -4% |
| Idle Maximum * (dB) | 31 | 31.2 -1% | 31.6 -2% | 30.13 3% | 30.3 2% | 32.1 -4% |
| Load Average * (dB) | 45.6 | 43.3 5% | 31.9 30% | 38.8 15% | 39.2 14% | 33 28% |
| Witcher 3 ultra * (dB) | 45.6 | 41.6 9% | ||||
| Load Maximum * (dB) | 46.7 | 43.3 7% | 40.9 12% | 38.8 17% | 39.2 16% | 34.8 25% |
* ... smaller is better
Temperature
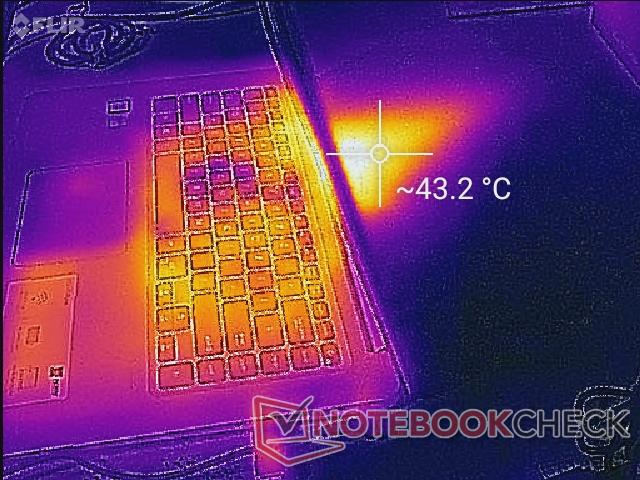
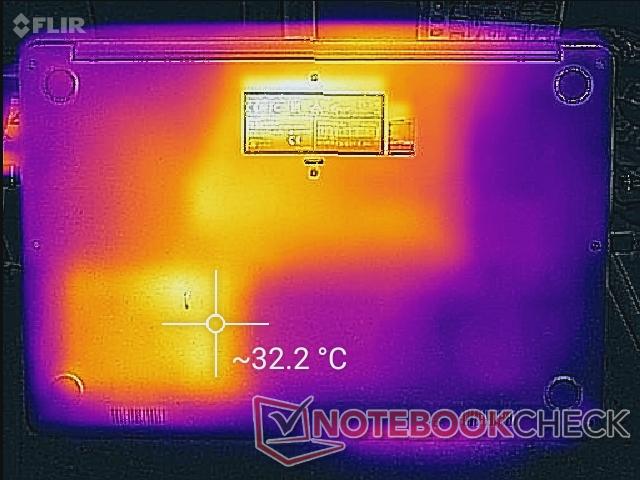
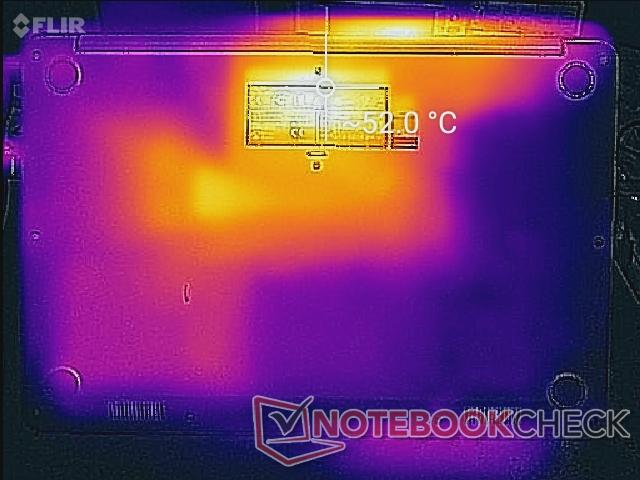
Surface temperatures are generally cooler on the left half of the notebook when compared to the right half. The asymmetric positioning of the hard drive and heat pipe is responsible for the noticeable temperature difference between the two sides of the keyboard. Fortunately, temperatures around the palm rests and keyboard are never at uncomfortable levels no matter the onscreen load.
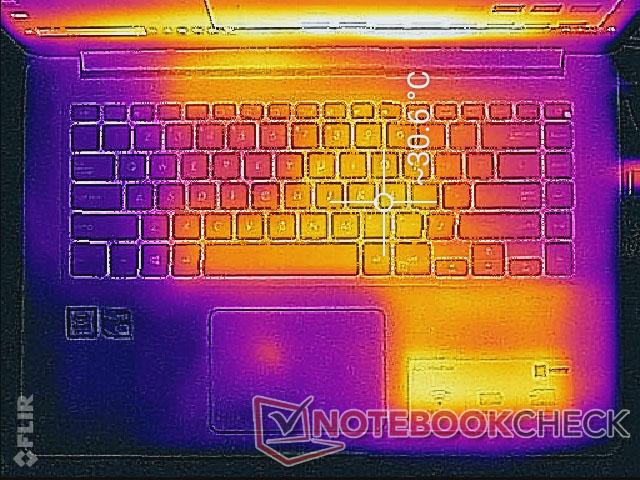
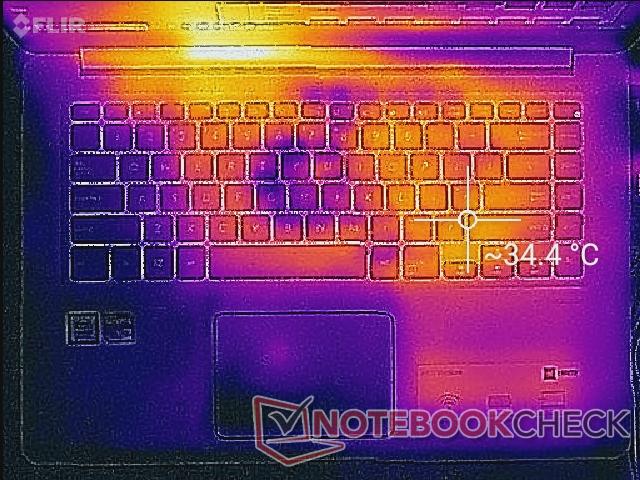
(+) The maximum temperature on the upper side is 35.2 °C / 95 F, compared to the average of 36.8 °C / 98 F, ranging from 21 to 71 °C for the class Multimedia.
(-) The bottom heats up to a maximum of 52 °C / 126 F, compared to the average of 39.1 °C / 102 F
(+) In idle usage, the average temperature for the upper side is 27.1 °C / 81 F, compared to the device average of 31.3 °C / 88 F.
(+) The palmrests and touchpad are cooler than skin temperature with a maximum of 28.8 °C / 83.8 F and are therefore cool to the touch.
(±) The average temperature of the palmrest area of similar devices was 28.7 °C / 83.7 F (-0.1 °C / -0.1 F).
Speakers

The internal speakers are again decent for the size and price. Bass is poorly represented and this becomes obvious on higher volume settings where balance is poor. Headphones are recommend especially when gaming due to the loud system fan.
Asus VivoBook 15 F510UF-ES71 audio analysis
(-) | not very loud speakers (69.4 dB)
Bass 100 - 315 Hz
(±) | reduced bass - on average 13.2% lower than median
(±) | linearity of bass is average (11.5% delta to prev. frequency)
Mids 400 - 2000 Hz
(+) | balanced mids - only 2.7% away from median
(±) | linearity of mids is average (7% delta to prev. frequency)
Highs 2 - 16 kHz
(+) | balanced highs - only 4.5% away from median
(+) | highs are linear (6% delta to prev. frequency)
Overall 100 - 16.000 Hz
(±) | linearity of overall sound is average (22% difference to median)
Compared to same class
» 78% of all tested devices in this class were better, 4% similar, 18% worse
» The best had a delta of 5%, average was 17%, worst was 45%
Compared to all devices tested
» 63% of all tested devices were better, 6% similar, 30% worse
» The best had a delta of 4%, average was 24%, worst was 134%
Apple MacBook 12 (Early 2016) 1.1 GHz audio analysis
(+) | speakers can play relatively loud (83.6 dB)
Bass 100 - 315 Hz
(±) | reduced bass - on average 11.3% lower than median
(±) | linearity of bass is average (14.2% delta to prev. frequency)
Mids 400 - 2000 Hz
(+) | balanced mids - only 2.4% away from median
(+) | mids are linear (5.5% delta to prev. frequency)
Highs 2 - 16 kHz
(+) | balanced highs - only 2% away from median
(+) | highs are linear (4.5% delta to prev. frequency)
Overall 100 - 16.000 Hz
(+) | overall sound is linear (10.2% difference to median)
Compared to same class
» 7% of all tested devices in this class were better, 2% similar, 91% worse
» The best had a delta of 5%, average was 18%, worst was 53%
Compared to all devices tested
» 5% of all tested devices were better, 1% similar, 94% worse
» The best had a delta of 4%, average was 24%, worst was 134%
Energy Management
Power Consumption
Power consumption is very similar to last year's Vivobook S510UQ with the 7200U CPU and 940MX GPU. In other words, the newer F510UF is able to provide almost twice the CPU processing power and a similar level of GPU power without demanding more from an AC outlet.
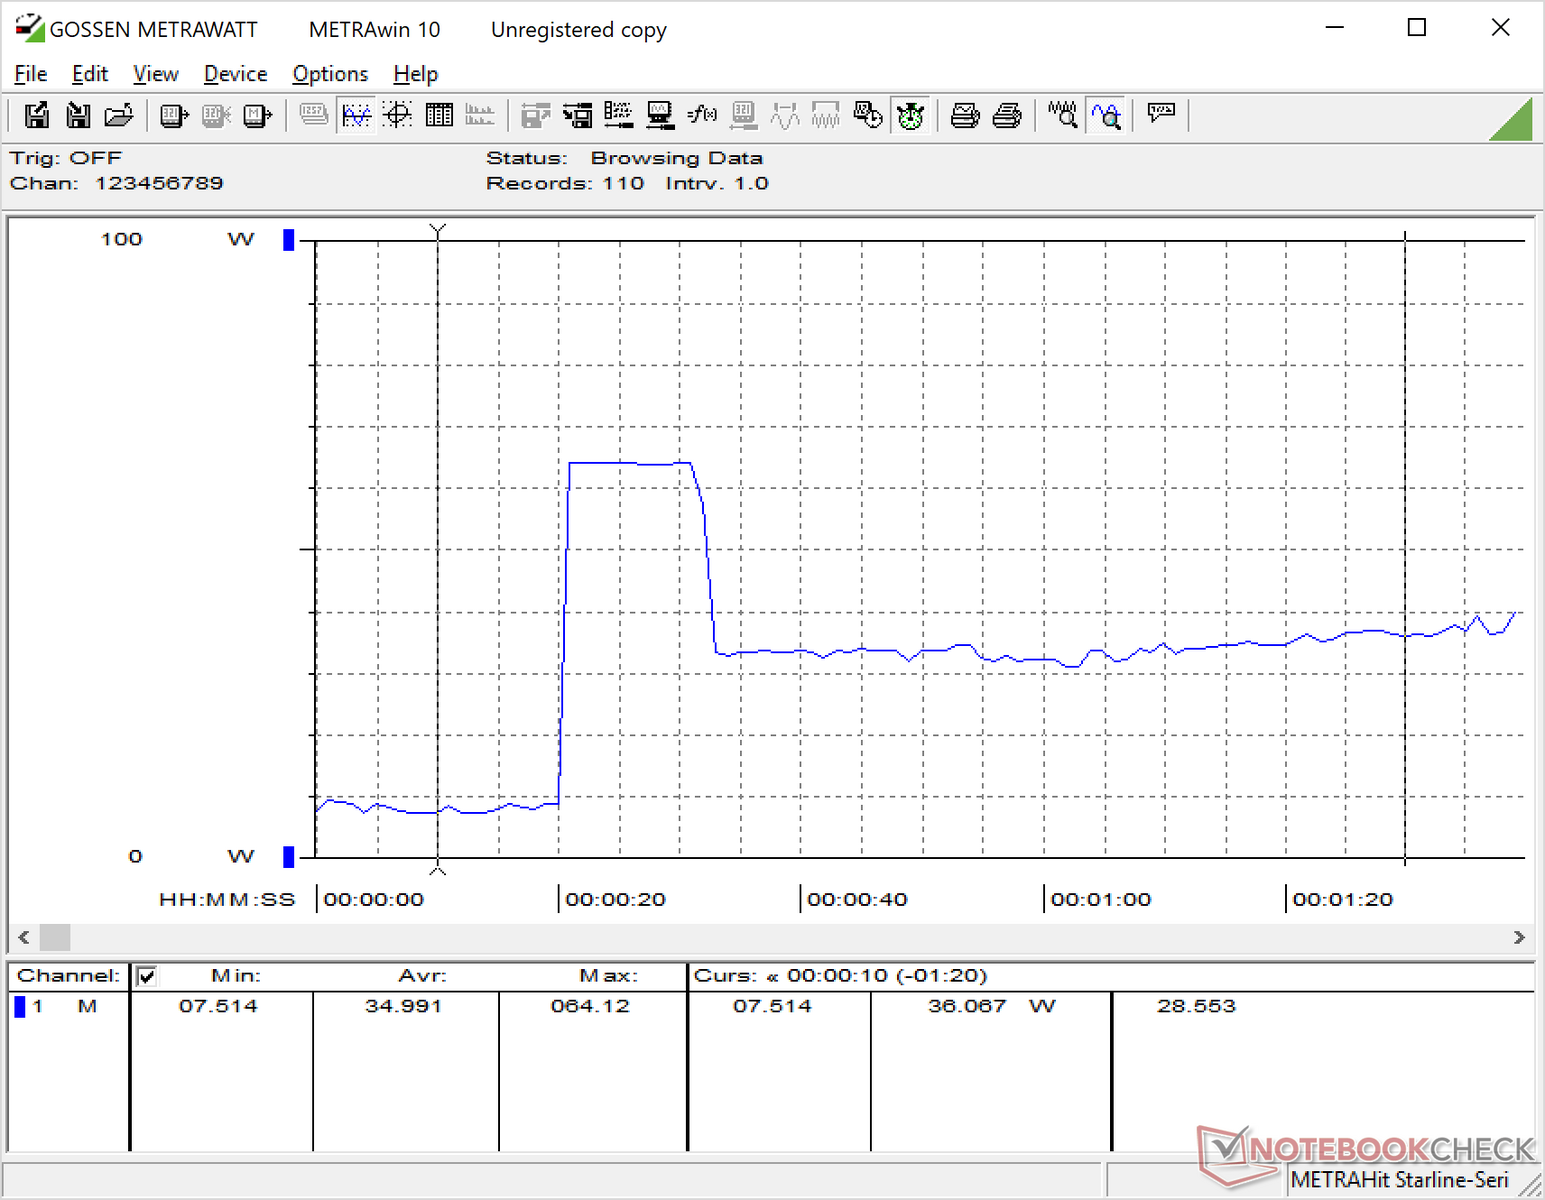
Measuring power consumption over time confirms our stress test results from above. As shown by our graphs below, initiating Prime95 will cause the system to draw 64 W for just a few seconds before falling down to a steady ~35 W. Similarly, running Prime95 and FurMark simultaneously will cause power consumption to fluctuate between 40 W and 60 W similar to the alternating behavior of the GPU memory clock rate.
Note that this SKU ships with a 65 W AC adapter whereas SKUs with only integrated HD graphics, like the Vivobook S15 S510UA, ship with less capable 45 W adapters.
| Off / Standby | |
| Idle | |
| Load |
|
Key:
min: | |
| Asus VivoBook 15 F510UF-ES71 i5-8550U, GeForce MX130, Seagate Mobile HDD 1TB ST1000LM035, IPS, 1920x1080, 15.6" | Asus Vivobook S15 S510UQ-BQ189T i5-7200U, GeForce 940MX, Toshiba SG5 THNSNK128GVN8, IPS, 1920x1080, 15.6" | Dell Inspiron 15 5575-98MH4 R3 2200U, Vega 3, Seagate Mobile HDD 1TB ST1000LM035, TN LED, 1366x768, 15.6" | Lenovo IdeaPad 720-15IKB i5-7200U, Radeon RX 560 (Laptop), Samsung PM961 MZVLW256HEHP, IPS, 1920x1080, 15.6" | Acer Swift 3 SF315-41-R4W1 R5 2500U, Vega 8, Intel SSD 600p SSDPEKKW256G7, IPS, 1920x1080, 15.6" | |
|---|---|---|---|---|---|
| Power Consumption | 7% | 10% | -44% | -13% | |
| Idle Minimum * (Watt) | 5.9 | 3.6 39% | 5 15% | 9.9 -68% | 7.3 -24% |
| Idle Average * (Watt) | 7 | 6.8 3% | 8.4 -20% | 9.5 -36% | 9.7 -39% |
| Idle Maximum * (Watt) | 8.5 | 9.5 -12% | 9.2 -8% | 10.7 -26% | 13 -53% |
| Load Average * (Watt) | 54.5 | 51.6 5% | 30 45% | 62 -14% | 40.4 26% |
| Witcher 3 ultra * (Watt) | 50.6 | 84 -66% | |||
| Load Maximum * (Watt) | 55.7 | 56 -1% | 44.7 20% | 86.7 -56% | 42.2 24% |
* ... smaller is better
Battery Life
Runtimes are very nearly the same as on the older S510UQ SKU. This is perhaps unsurprising given the fact that both have the same 42 Wh capacity battery with very similar power demands as shown in our comparison above. Users can expect just short of four hours of real-world WLAN use when on the Balanced profile with the display brightness set to 150 nits or 80 percent.
Charging from near empty to full capacity will take about 1.5 hours.
| Asus VivoBook 15 F510UF-ES71 i5-8550U, GeForce MX130, 42 Wh | Asus Vivobook S15 S510UQ-BQ189T i5-7200U, GeForce 940MX, 42 Wh | Dell Inspiron 15 5575-98MH4 R3 2200U, Vega 3, 42 Wh | Asus VivoBook 15 X542UF-DM143T i5-8250U, GeForce MX130, 38 Wh | Lenovo IdeaPad 720-15IKB i5-7200U, Radeon RX 560 (Laptop), 40 Wh | Acer Swift 3 SF315-41-R4W1 R5 2500U, Vega 8, 48 Wh | |
|---|---|---|---|---|---|---|
| Battery runtime | 10% | 8% | 74% | 82% | 33% | |
| WiFi v1.3 (h) | 3.9 | 4.3 10% | 4.2 8% | 6.8 74% | 7.1 82% | 5.2 33% |
| Reader / Idle (h) | 7.1 | 9.5 | 16.1 | 12.2 | ||
| Load (h) | 1.2 | 1.3 | 0.8 | 1.4 |
Pros
Cons
Verdict

On a performance level, the Vivobook F510UF is impressive for the price. It offers quite the leap over the last generation i5-7200U or i7-7500U without significant throttling or impacting battery life. Meanwhile, the MX130 GPU is a noticeable bump over the common UHD Graphics 620 that many smaller 13-inch Ultrabooks are stuck with.
The Asus system begins to falter when we look beyond its performance. Its chassis is more flexible and nowhere near the quality of flagships like the Spectre x360 15 or XPS 15. This includes the keyboard keys which feel spongy and cheap as if they belong on a netbook. While we don't expect the best or most rigid chassis design, we do expect the keyboard and trackpad to be representative of the price range of the system. As such, there is still a strong case for purchasing the least expensive and slower XPS 15 SKU because of its much stronger case.
Our last major complaint is fan noise. The system fan is as loud as some full-fledged gaming notebooks when under stress despite the Vivobook being slower by orders of magnitude. The MX130 GPU certainly comes at a cost if users intend to take full advantage of it.
Other downsides to the system are typical of budget-mainstream notebooks in its price range such as the limited color space, average battery life, average display backlight, and plain design. We're hoping that future revisions will improve the keyboard, install a more powerful cooling solution, and swap out the proprietary AC port for the more universal USB Type-C charging.
The CPU, GPU, and matte panel are the highlights of the system and a decent bargain for the price. Users should be aware of the cheap keyboard keys, loud fan when gaming, and very slow primary HDD. It may be worth considering paying $100 to $200 USD more for the stronger-built entry-level XPS 15 SKU instead.
Asus VivoBook 15 F510UF-ES71
- 06/17/2018 v6 (old)
Allen Ngo
Price comparison
