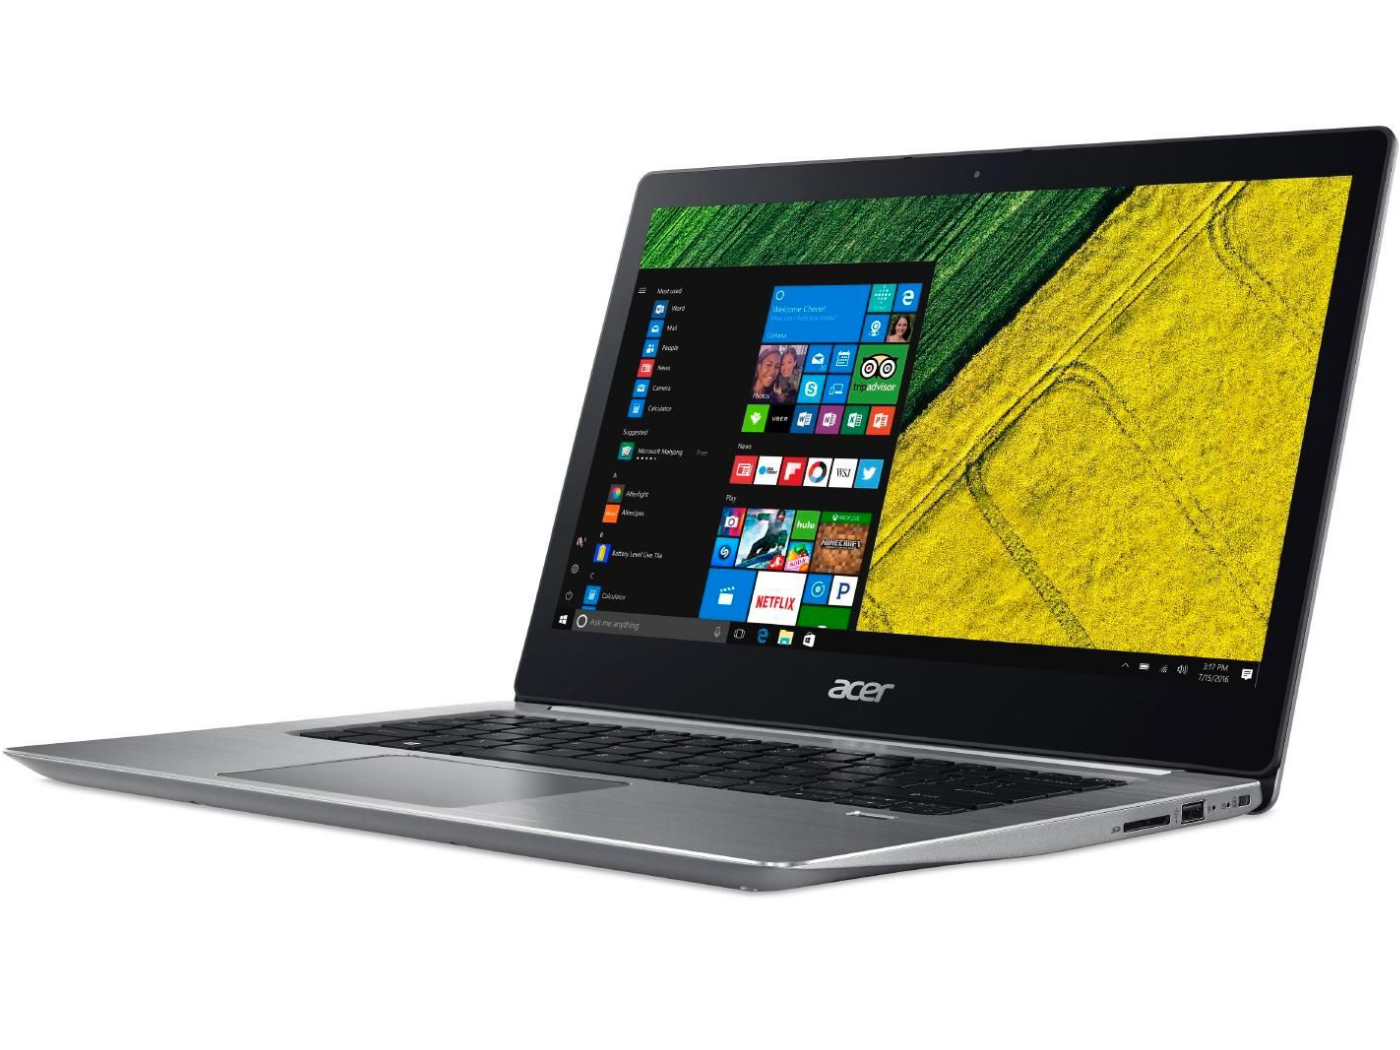
Acer Swift 3 SF315 (8250U, MX150, FHD) Laptop Review
For the original German review, click here.
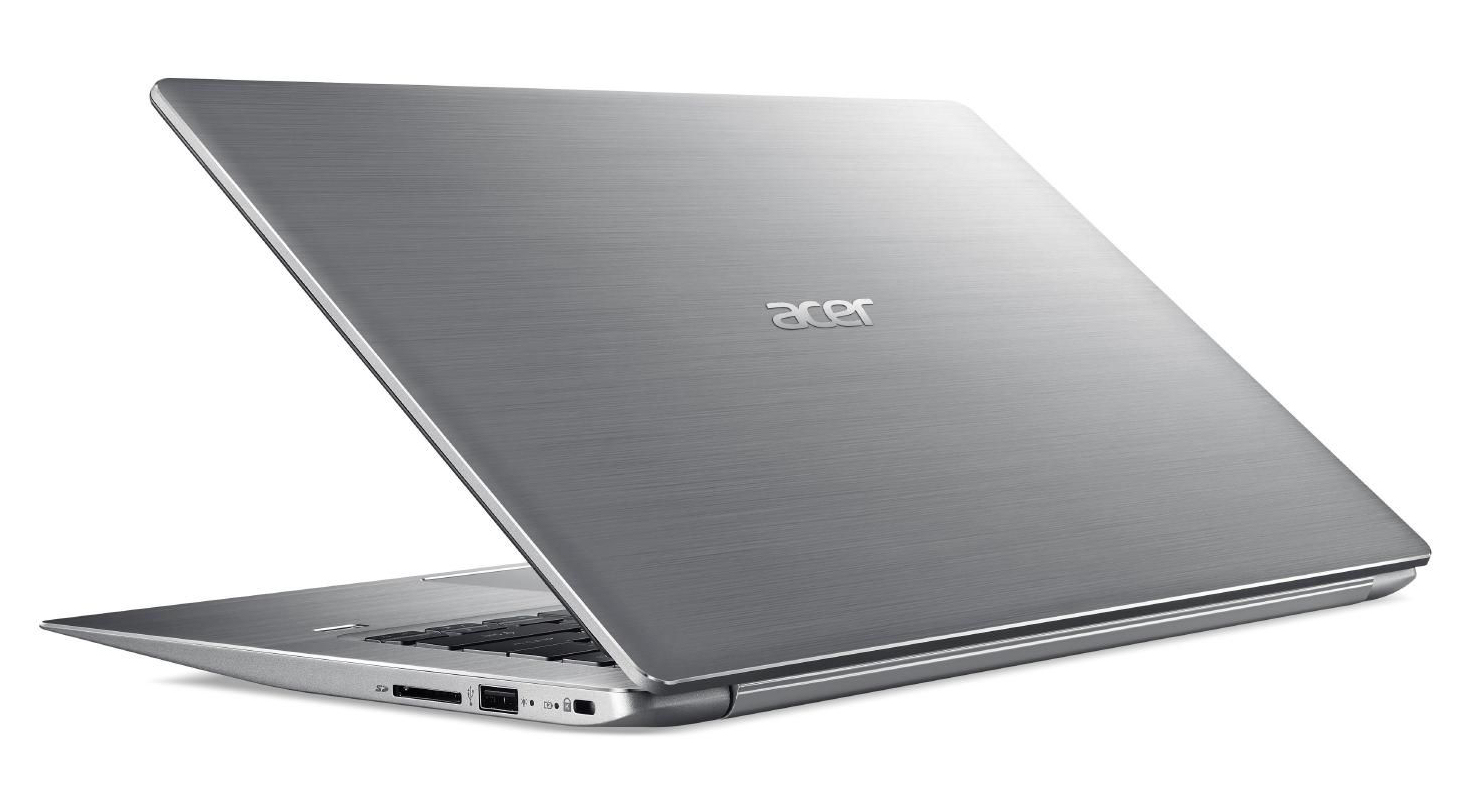
Acer has packed the Swift 3's components into a classy metal case. The computer runs on a Kaby Lake quad-core processor. This is not a conventional laptop processor (TDP: 45 watts), but a ULV model that uses energy economically (TDP: 15 watts). The competition includes computers like the Asus FX553VD, the HP Pavilion 15 Power and the Dell Inspiron 15 5567-1753.
Since we have already reviewed a Swift 3 SF315 51G model that is structurally identical to our current test device, we will not cover the case, connectivity, input devices, display or speakers at length. For more information on these subjects, please see our review of the Swift 3 SF315-51G-55Z9.
Update 07/25/2018: We got our hands on the 4K model of the Swift 3 315. It was not only brighter than the FHD model but also covered the sRGB color space by 100 %.
| SD Card Reader | |
| average JPG Copy Test (av. of 3 runs) | |
| Asus FX553VD-DM249T (Toshiba Exceria Pro SDXC 64 GB UHS-II) | |
| HP Pavilion 15 Power 1GK62AV (Toshiba Exceria Pro SDXC 64 GB UHS-II) | |
| HP Pavilion Power 15t-cb2000 (Toshiba Exceria Pro SDXC 64 GB UHS-II) | |
| Acer Swift 3 SF315-51G-55Z9 (Toshiba Exceria Pro SDXC 64 GB UHS-II) | |
| Dell Inspiron 15 5000 5567-1753 (Toshiba Exceria Pro SDXC 64 GB UHS-II) | |
| Acer Swift 3 SF315-51G-57E5 (Toshiba Exceria Pro SDXC 64 GB UHS-II) | |
| maximum AS SSD Seq Read Test (1GB) | |
| HP Pavilion Power 15t-cb2000 (Toshiba Exceria Pro SDXC 64 GB UHS-II) | |
| Asus FX553VD-DM249T (Toshiba Exceria Pro SDXC 64 GB UHS-II) | |
| HP Pavilion 15 Power 1GK62AV (Toshiba Exceria Pro SDXC 64 GB UHS-II) | |
| Dell Inspiron 15 5000 5567-1753 (Toshiba Exceria Pro SDXC 64 GB UHS-II) | |
| Acer Swift 3 SF315-51G-57E5 (Toshiba Exceria Pro SDXC 64 GB UHS-II) | |
| Acer Swift 3 SF315-51G-55Z9 (Toshiba Exceria Pro SDXC 64 GB UHS-II) | |
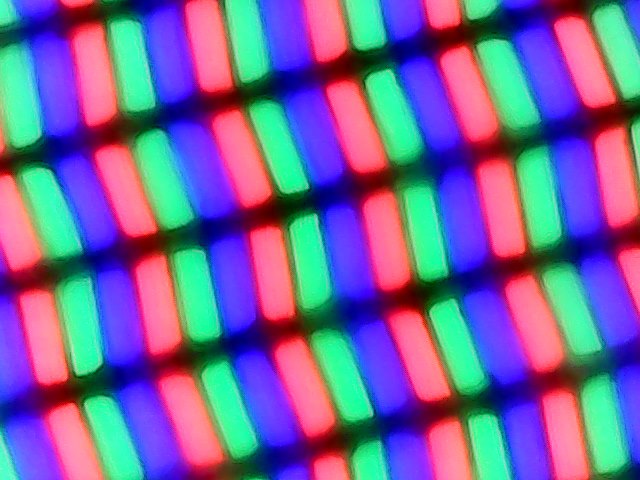
Display

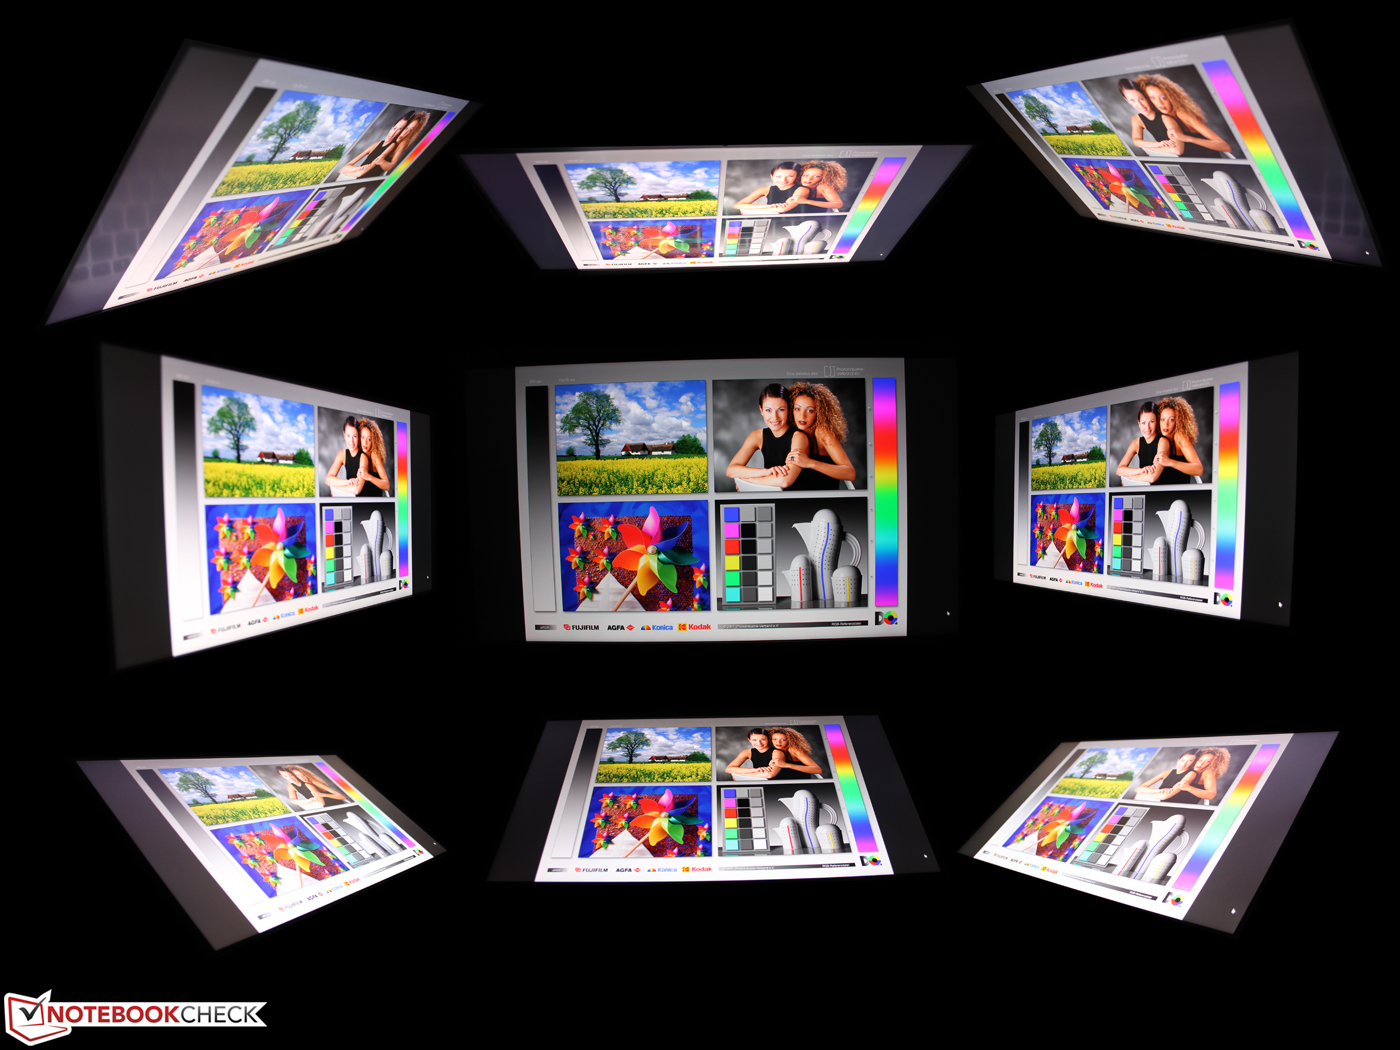
The Swift 3 is equipped with the same IPS FHD panel as the sister model that we have reviewed previously. This is a panel that displays the screen content accurately from any viewing angle and has a good contrast ratio. In terms of brightness, we expect more from a laptop in this price bracket – a number over 300 cd/m² would be more appropriate. The two panels yielded somewhat different results, which is normal. Two structurally identical displays are never 100% alike.
Both screens produce backlight flicker due to pulse width modulation, but our current test device flickers at a frequency of 21000 Hz, which is a significantly higher number than we measured on its sister model. A frequency in that range should spare even sensitive users from eye problems and/or headaches.
| |||||||||||||||||||||||||
Brightness Distribution: 79 %
Center on Battery: 249 cd/m²
Contrast: 1181:1 (Black: 0.21 cd/m²)
ΔE ColorChecker Calman: 4.98 | ∀{0.5-29.43 Ø4.72}
ΔE Greyscale Calman: 4.26 | ∀{0.09-98 Ø4.97}
58% sRGB (Argyll 1.6.3 3D)
38% AdobeRGB 1998 (Argyll 1.6.3 3D)
41.18% AdobeRGB 1998 (Argyll 3D)
58.7% sRGB (Argyll 3D)
39.86% Display P3 (Argyll 3D)
Gamma: 2.37
CCT: 7149 K
| Acer Swift 3 SF315-51G-57E5 IPS, 1920x1080, 15.6" | HP Pavilion Power 15t-cb2000 IPS, 1920x1080, 15.6" | Asus FX553VD-DM249T TN, 1920x1080, 15.6" | Dell Inspiron 15 5000 5567-1753 TN LED, 1920x1080, 15.6" | HP Pavilion 15 Power 1GK62AV IPS, 1920x1080, 15.6" | Acer Swift 3 SF315-51G-55Z9 IPS, 1920x1080, 15.6" | |
|---|---|---|---|---|---|---|
| Display | -1% | -4% | -8% | -2% | -2% | |
| Display P3 Coverage (%) | 39.86 | 39.28 -1% | 37.98 -5% | 36.24 -9% | 38.81 -3% | 39.02 -2% |
| sRGB Coverage (%) | 58.7 | 58.9 0% | 57.1 -3% | 54.6 -7% | 57.9 -1% | 57.7 -2% |
| AdobeRGB 1998 Coverage (%) | 41.18 | 40.59 -1% | 39.24 -5% | 37.44 -9% | 40.03 -3% | 40.31 -2% |
| Response Times | -7% | 32% | 27% | 10% | 0% | |
| Response Time Grey 50% / Grey 80% * (ms) | 42 ? | 51.6 ? -23% | 43 ? -2% | 43 ? -2% | 38.8 ? 8% | 42 ? -0% |
| Response Time Black / White * (ms) | 32 ? | 29.2 ? 9% | 11 ? 66% | 14 ? 56% | 28 ? 12% | 32 ? -0% |
| PWM Frequency (Hz) | 21000 ? | 1087 ? | ||||
| Screen | -10% | -11% | -66% | -7% | 3% | |
| Brightness middle (cd/m²) | 248 | 256 3% | 225 -9% | 145 -42% | 256.6 3% | 248 0% |
| Brightness (cd/m²) | 237 | 241 2% | 215 -9% | 144 -39% | 243 3% | 239 1% |
| Brightness Distribution (%) | 79 | 88 11% | 91 15% | 90 14% | 81 3% | 69 -13% |
| Black Level * (cd/m²) | 0.21 | 0.21 -0% | 0.46 -119% | 0.49 -133% | 0.19 10% | 0.18 14% |
| Contrast (:1) | 1181 | 1219 3% | 489 -59% | 296 -75% | 1351 14% | 1378 17% |
| Colorchecker dE 2000 * | 4.98 | 5.2 -4% | 3.94 21% | 9.27 -86% | 5 -0% | 4.85 3% |
| Colorchecker dE 2000 max. * | 8.41 | 19.3 -129% | 6.83 19% | 16.9 -101% | 20.1 -139% | 8.34 1% |
| Greyscale dE 2000 * | 4.26 | 3.5 18% | 2.68 37% | 12.28 -188% | 2.7 37% | 3.84 10% |
| Gamma | 2.37 93% | 2.35 94% | 2.35 94% | 2.03 108% | 2.32 95% | 2.29 96% |
| CCT | 7149 91% | 6576 99% | 6709 97% | 10732 61% | 6599 98% | 6790 96% |
| Color Space (Percent of AdobeRGB 1998) (%) | 38 | 37 -3% | 36 -5% | 35 -8% | 36.7 -3% | 37 -3% |
| Color Space (Percent of sRGB) (%) | 58 | 59 2% | 57 -2% | 55 -5% | 57.7 -1% | 57 -2% |
| Total Average (Program / Settings) | -6% /
-8% | 6% /
-4% | -16% /
-42% | 0% /
-4% | 0% /
1% |
* ... smaller is better
Screen Flickering / PWM (Pulse-Width Modulation)
| Screen flickering / PWM detected | 21000 Hz | ≤ 80 % brightness setting | 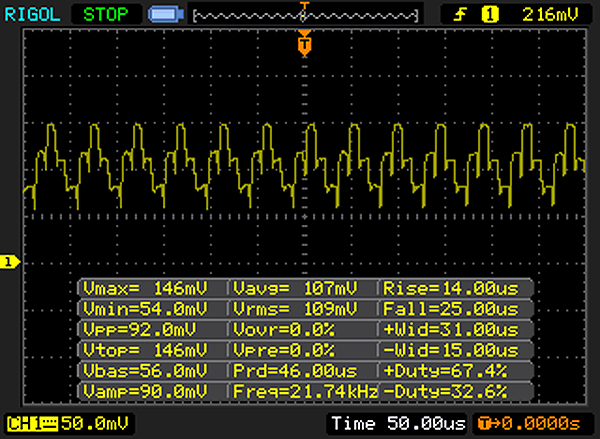 |
The display backlight flickers at 21000 Hz (worst case, e.g., utilizing PWM) Flickering detected at a brightness setting of 80 % and below. There should be no flickering or PWM above this brightness setting. The frequency of 21000 Hz is quite high, so most users sensitive to PWM should not notice any flickering. In comparison: 52 % of all tested devices do not use PWM to dim the display. If PWM was detected, an average of 7747 (minimum: 5 - maximum: 343500) Hz was measured. | |||

Display Response Times
| ↔ Response Time Black to White | ||
|---|---|---|
| 32 ms ... rise ↗ and fall ↘ combined | ↗ 17 ms rise | 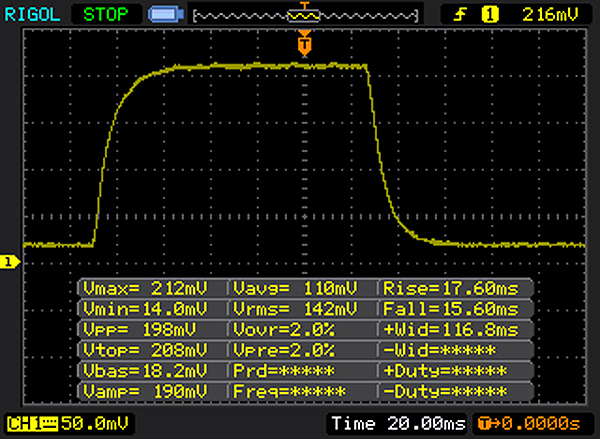 |
| ↘ 15 ms fall | ||
| The screen shows slow response rates in our tests and will be unsatisfactory for gamers. In comparison, all tested devices range from 0.1 (minimum) to 240 (maximum) ms. » 86 % of all devices are better. This means that the measured response time is worse than the average of all tested devices (19.8 ms). | ||
| ↔ Response Time 50% Grey to 80% Grey | ||
| 42 ms ... rise ↗ and fall ↘ combined | ↗ 22 ms rise | 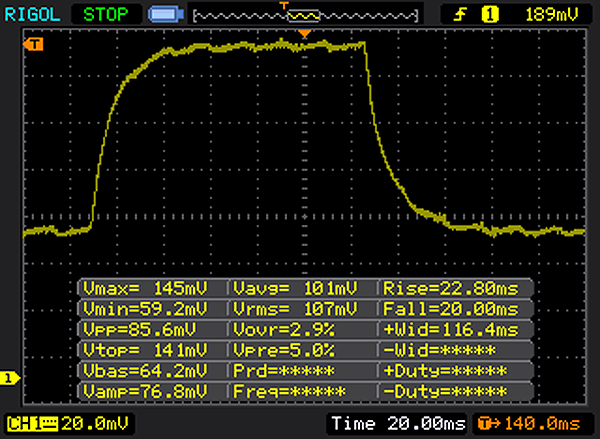 |
| ↘ 20 ms fall | ||
| The screen shows slow response rates in our tests and will be unsatisfactory for gamers. In comparison, all tested devices range from 0.165 (minimum) to 636 (maximum) ms. » 67 % of all devices are better. This means that the measured response time is worse than the average of all tested devices (31 ms). | ||
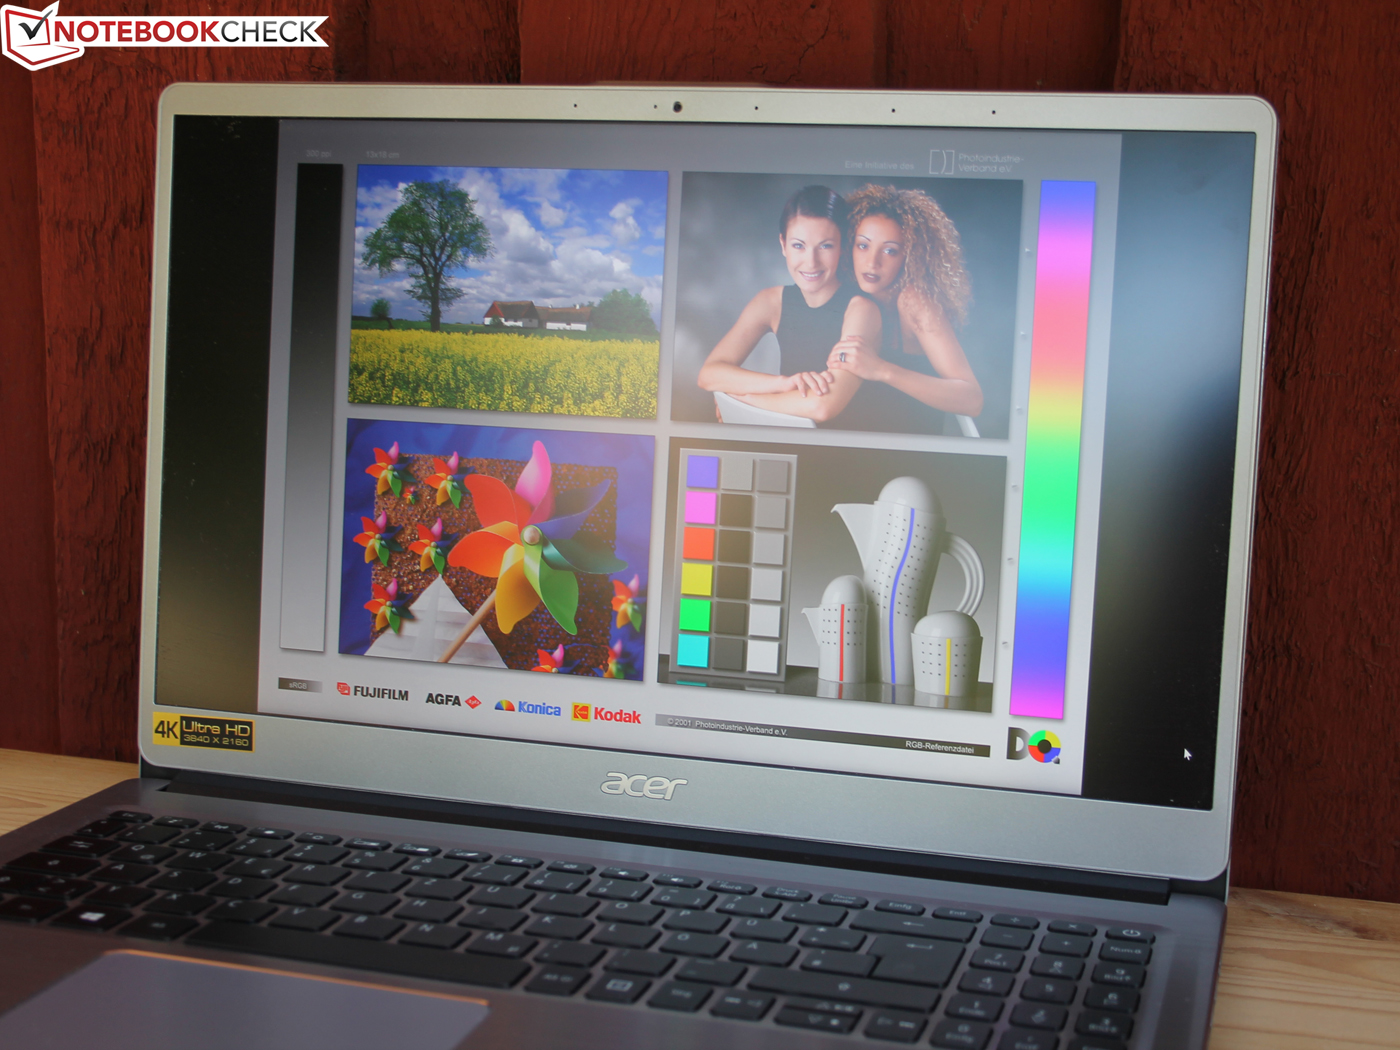
Display 4K
Update 07/25/2018: The 4K panel in the more expensive Swift 3 SKU (SF315-52G-8376) offered an astonishingly high brightness. Unfortunately, it was also plagued by massive halations on the corners. The contrast ratio was excellent and we found no evidence of PWM.
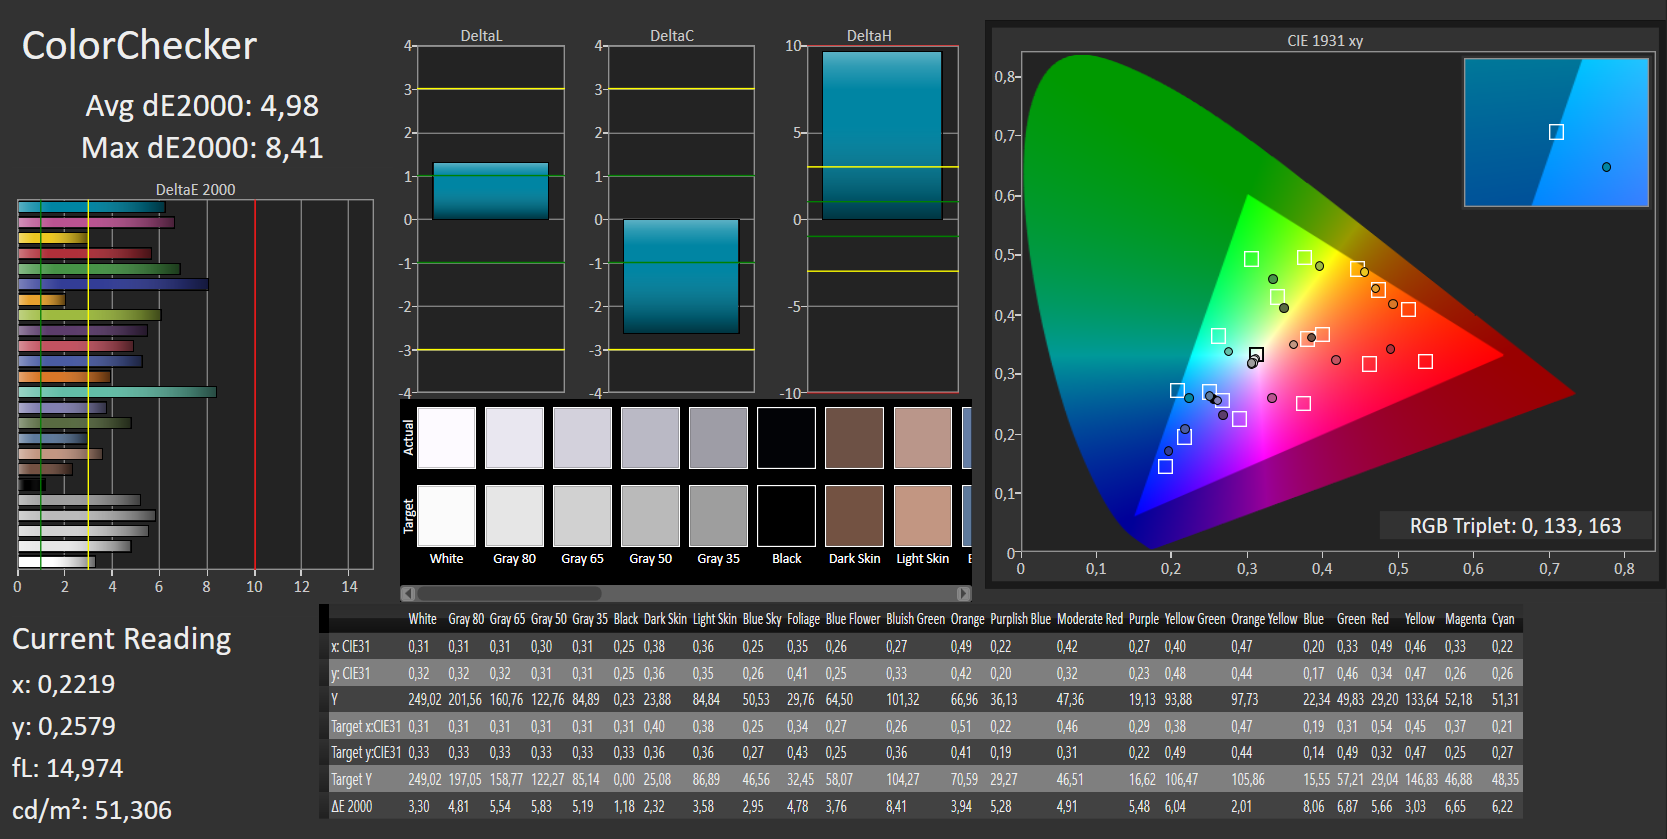
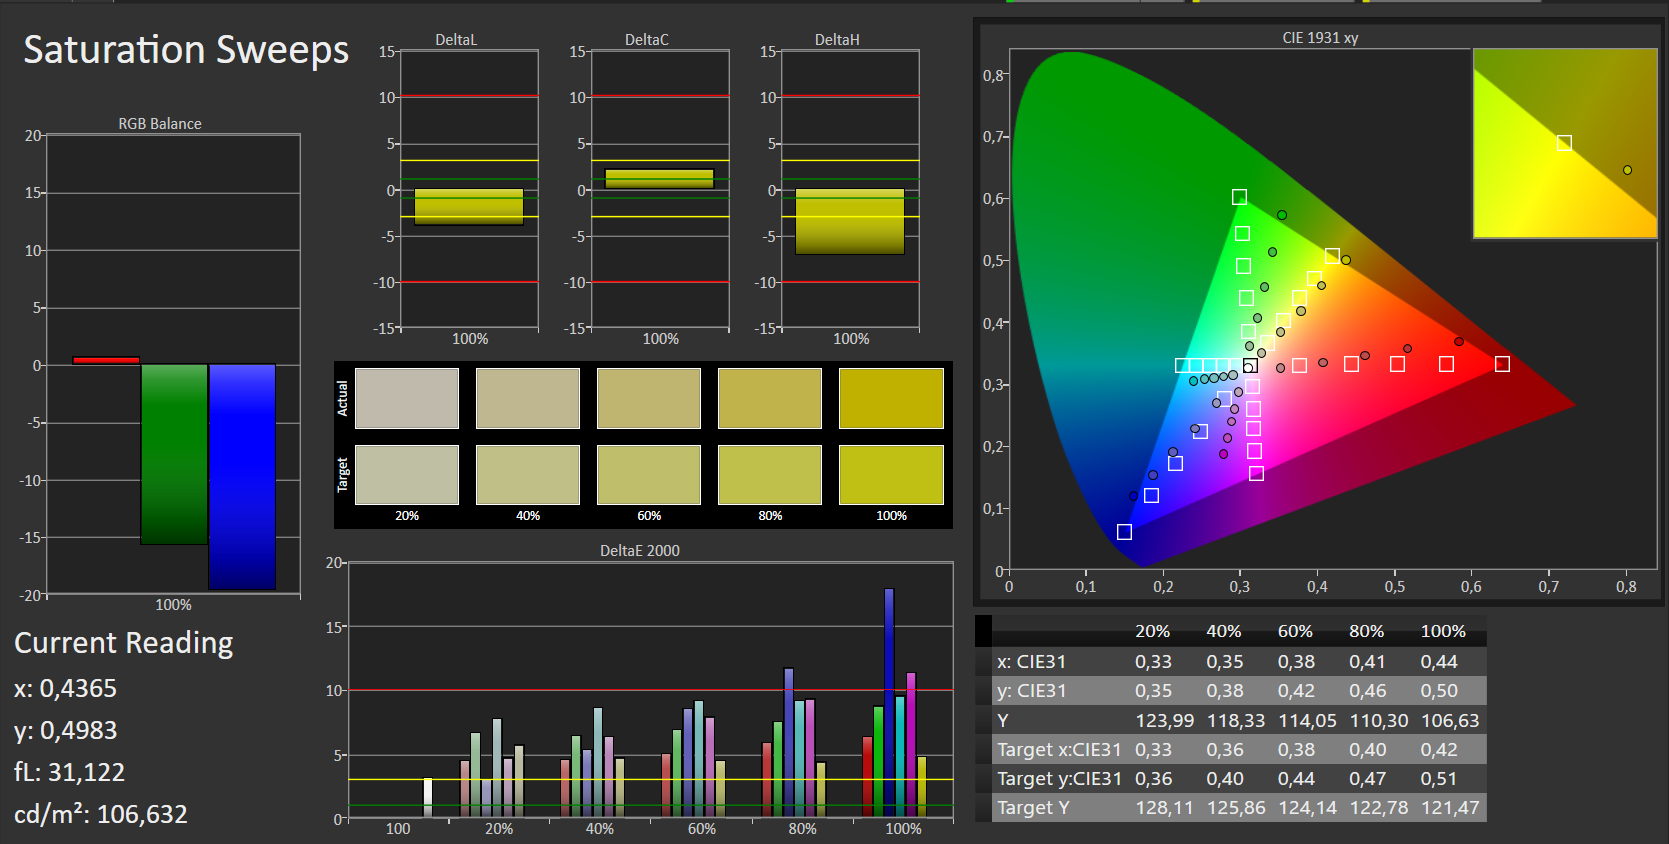
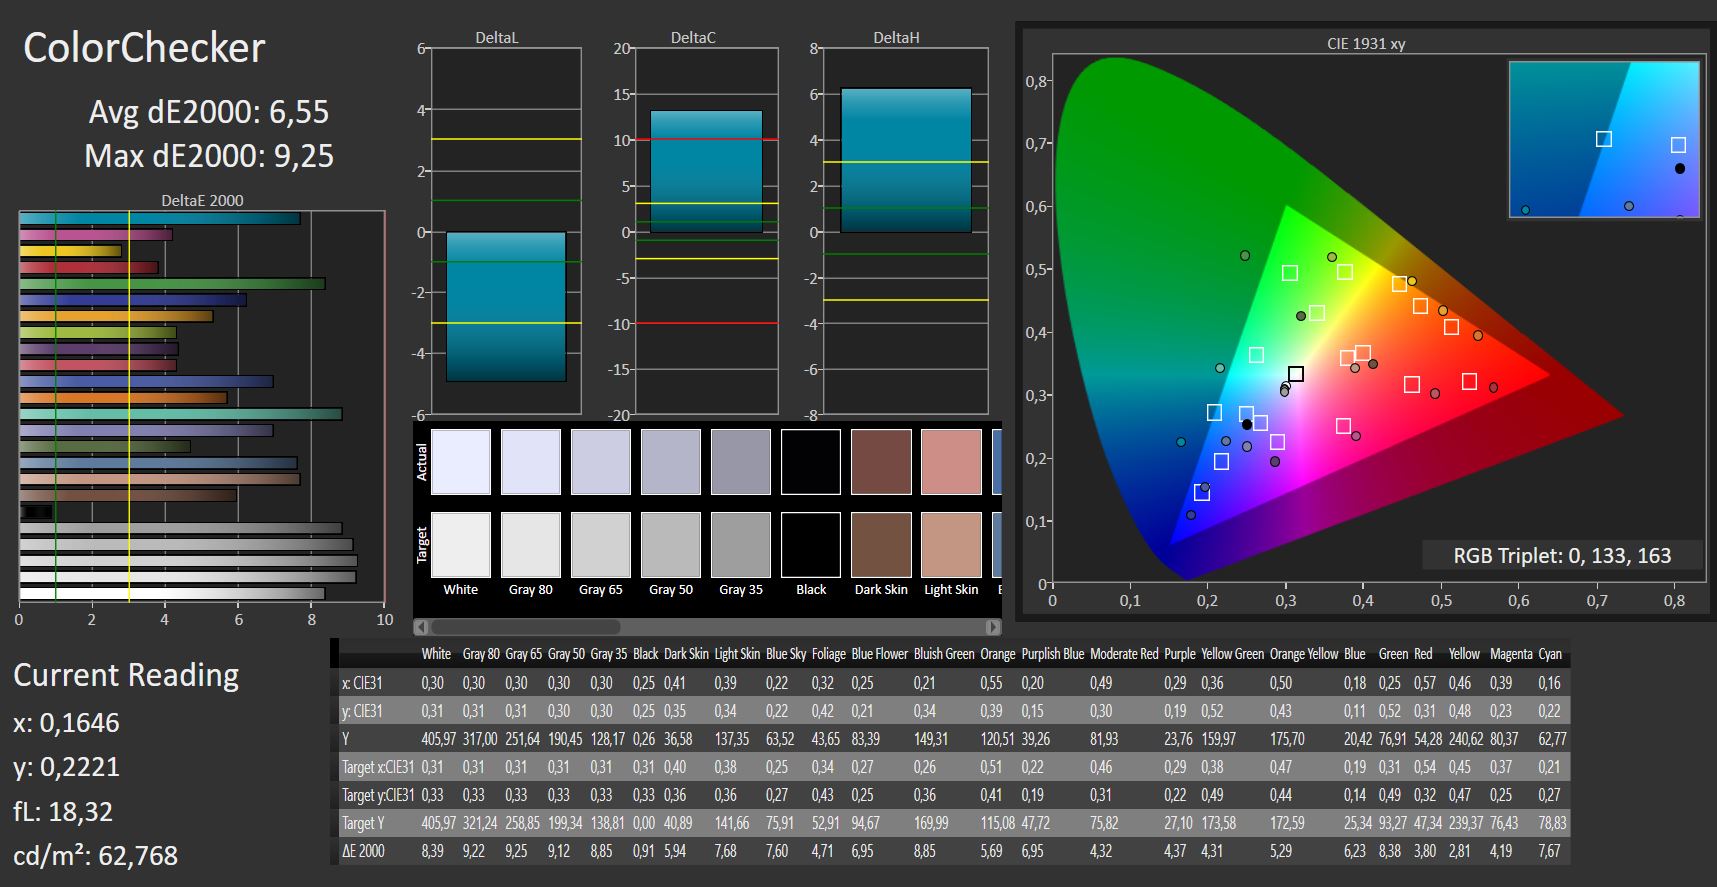
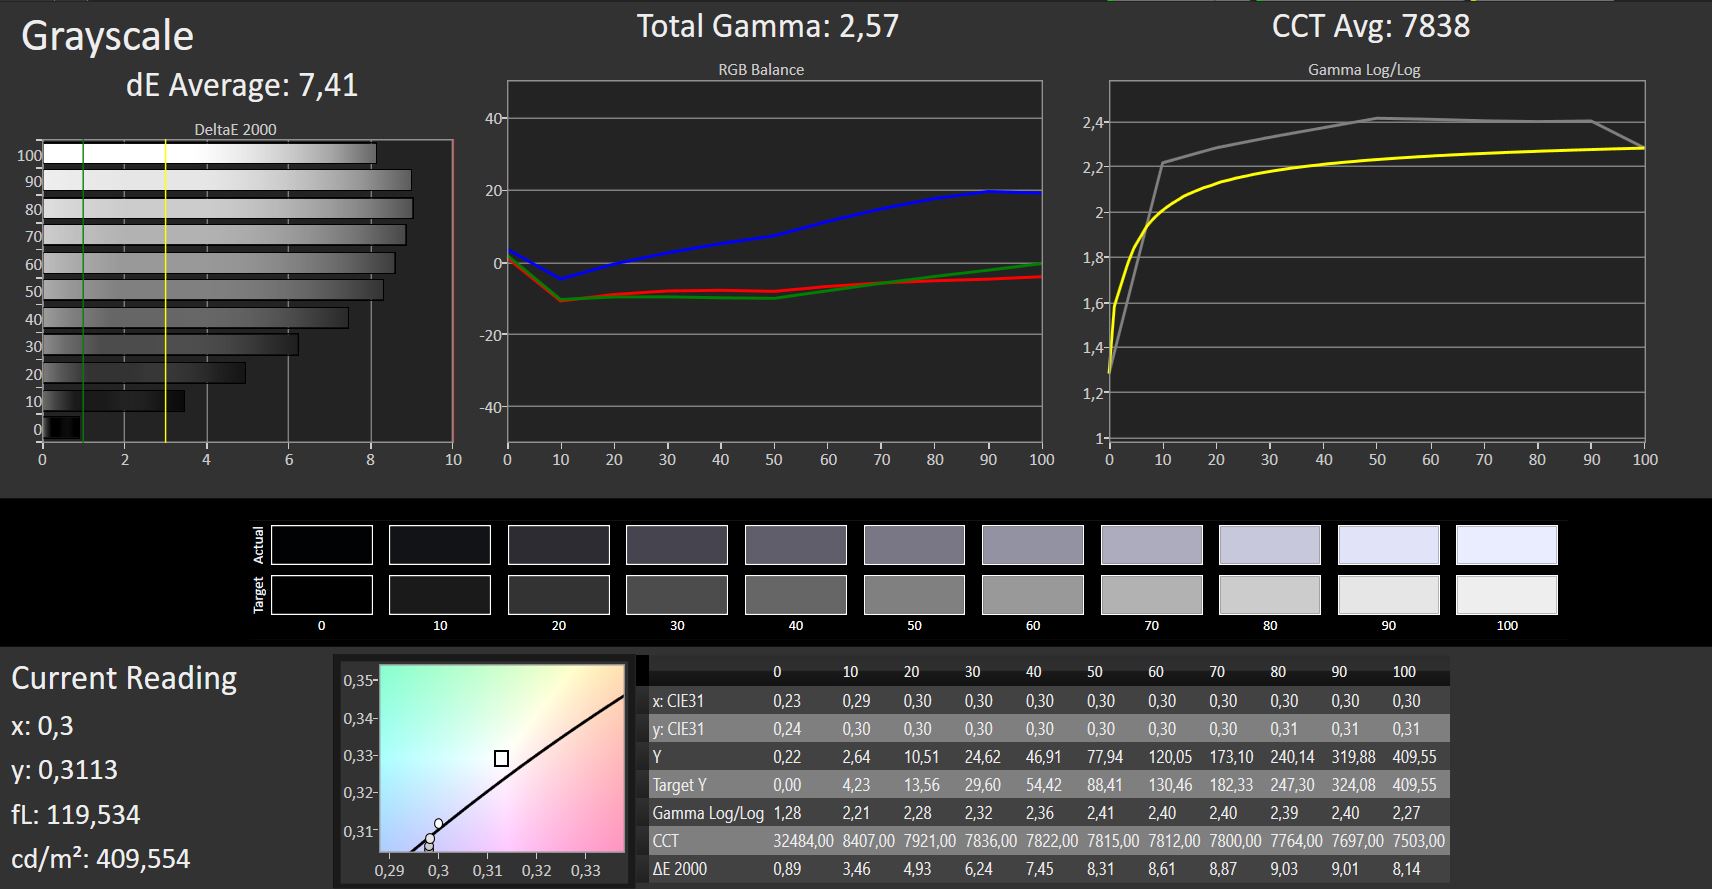
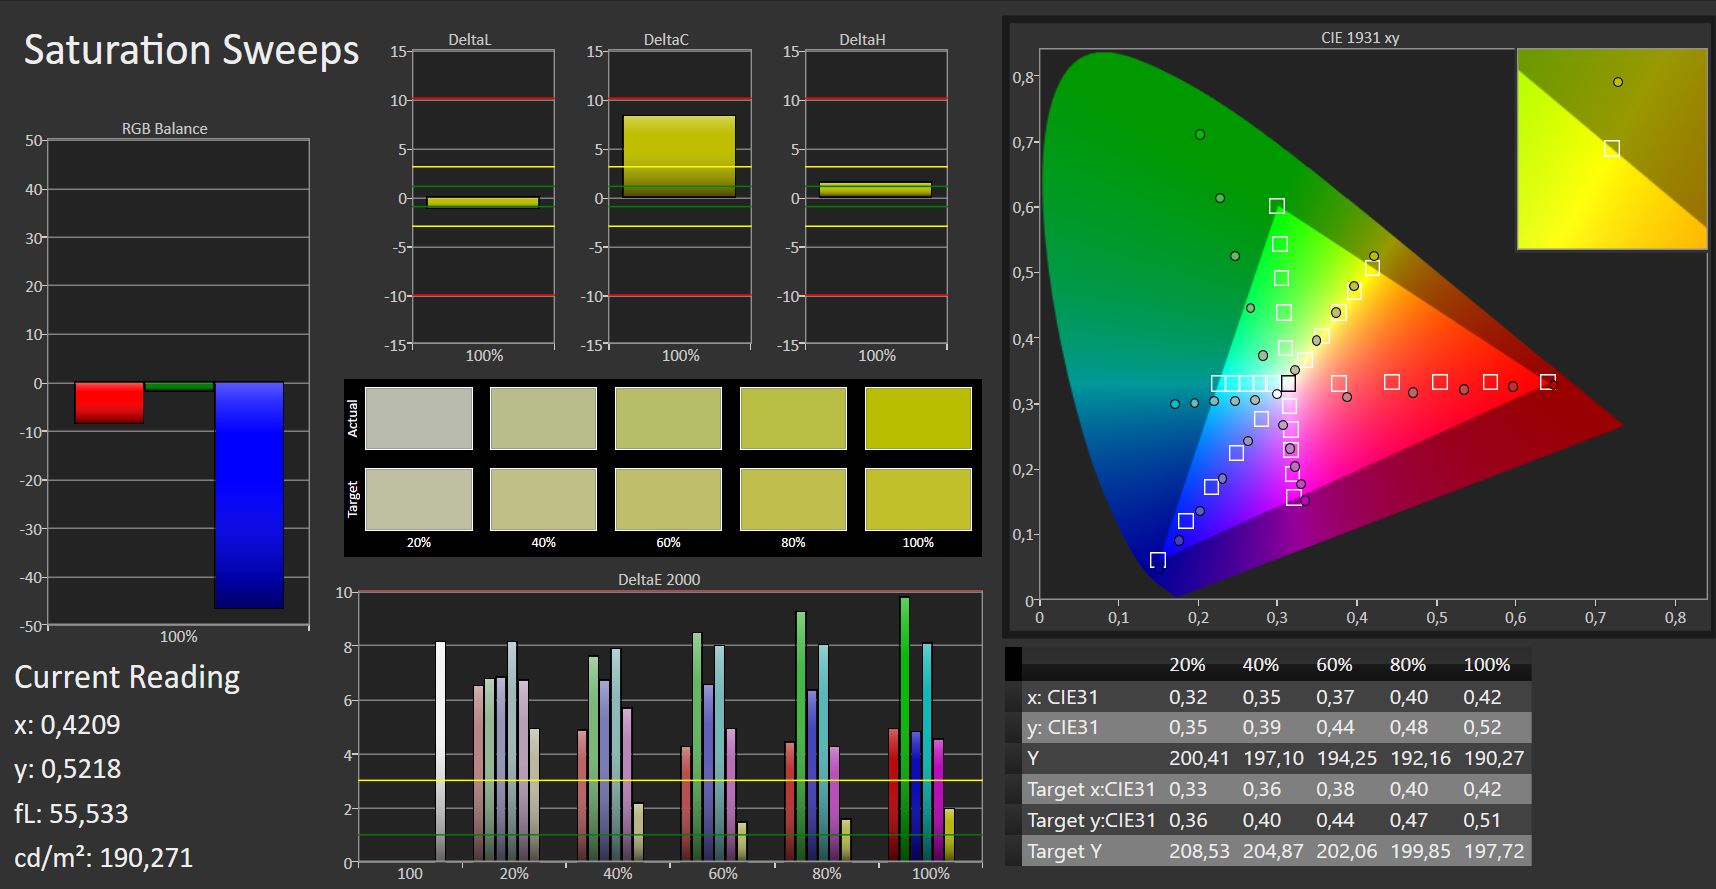
Out of the box our 4K display suffered from a very noticeable blue tint resulting in a very high DeltaE deviation of 7. With a maximum of up to 9 and an average of 6.5 Delta E deviations for colors were similarly poor. Ideally, you should be aiming for values of less than 3, which would result in no visible difference between the actual color and the reference color for the untrained eye.
The panel’s response times were longer than for the FHD panel, and brightness distribution was very similar.
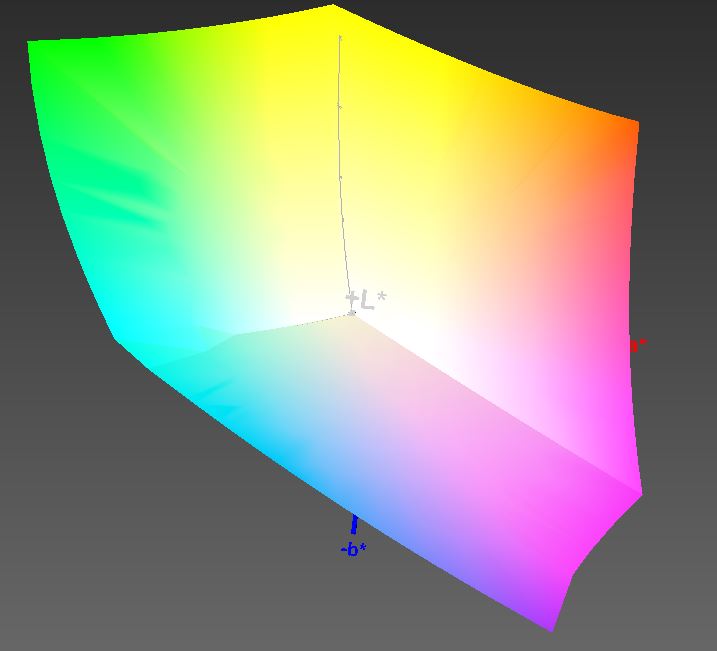
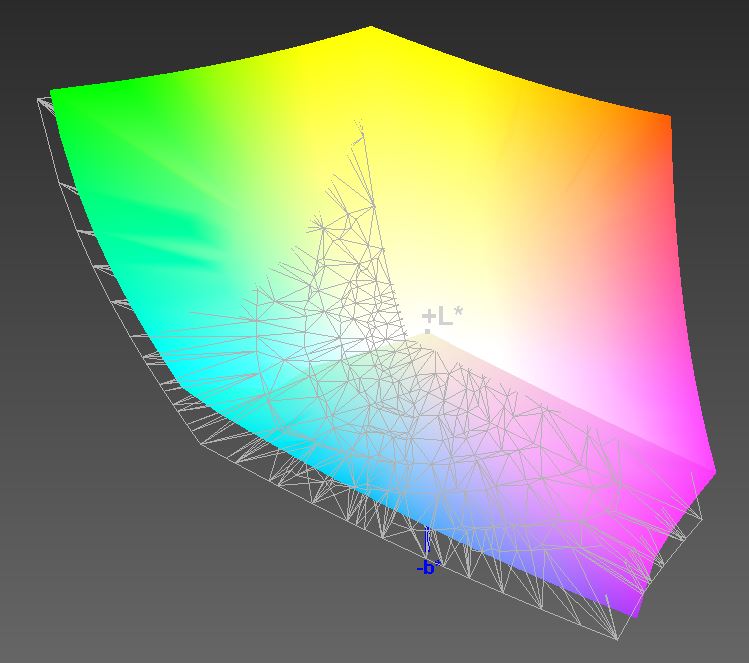
sRGB color space coverage was certainly the 4K panel’s highlight, and not one of its competitors was able to keep up with the 4K Swift 3. The same can be said about its 88 % AdobeRGB coverage – most competitors fail to exceed 40 % coverage of this much larger color space.
| |||||||||||||||||||||||||
Brightness Distribution: 81 %
Center on Battery: 394 cd/m²
Contrast: 1683:1 (Black: 0.24 cd/m²)
ΔE ColorChecker Calman: 6.55 | ∀{0.5-29.43 Ø4.72}
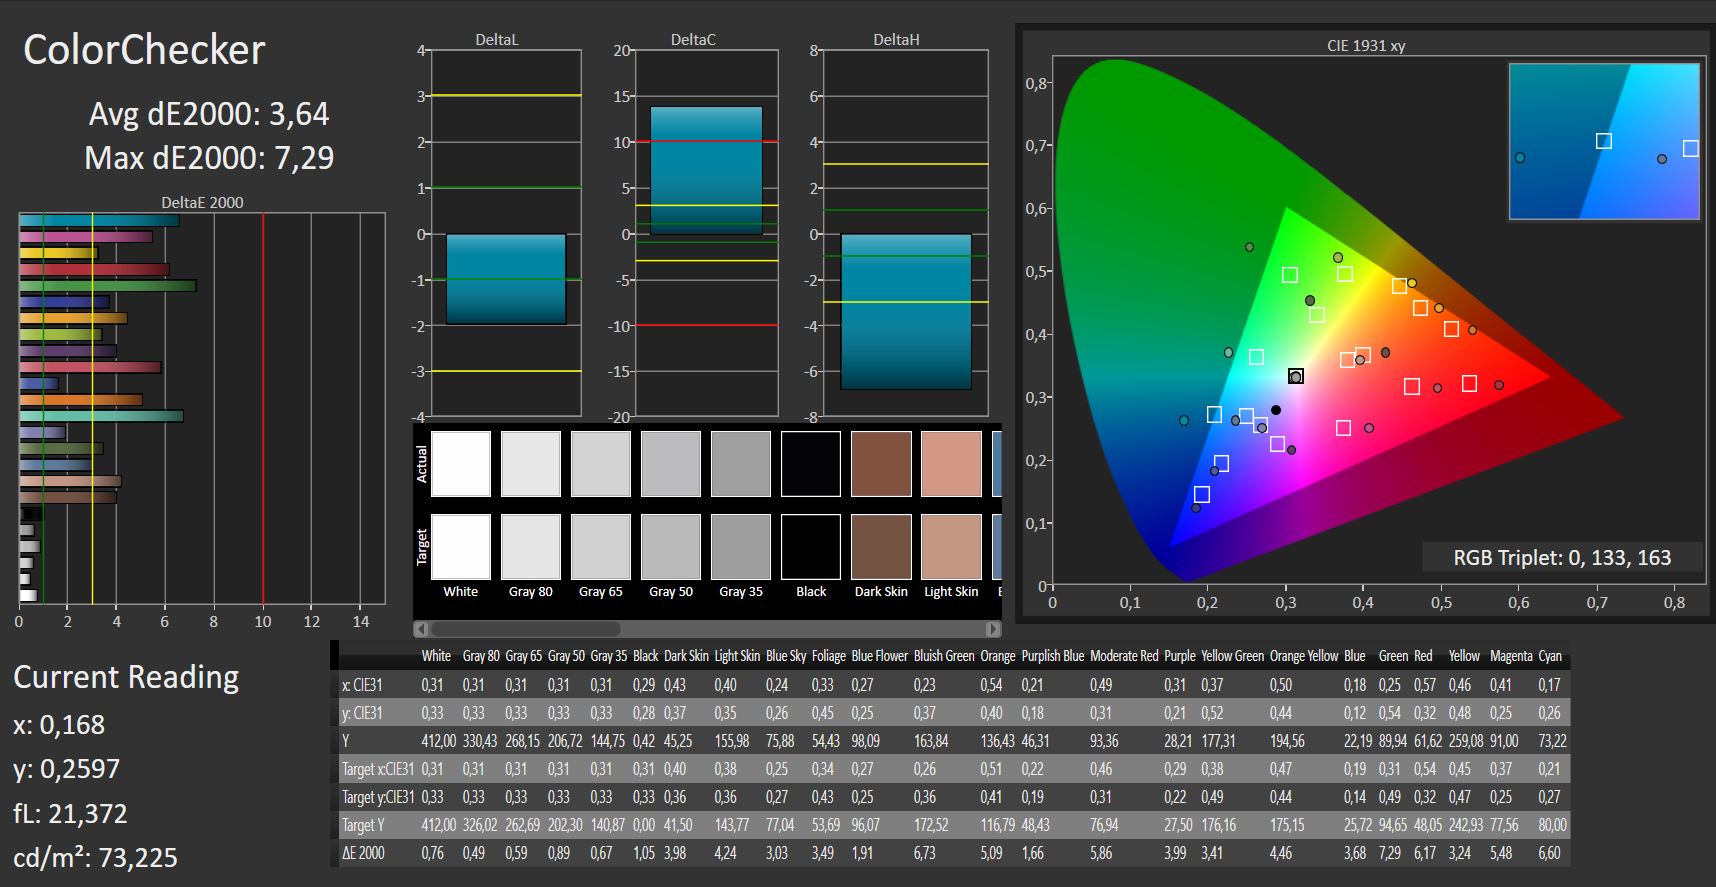
calibrated: 3.64
ΔE Greyscale Calman: 7.41 | ∀{0.09-98 Ø4.97}
100% sRGB (Argyll 1.6.3 3D)
88% AdobeRGB 1998 (Argyll 1.6.3 3D)
Gamma: 2.57
CCT: 7838 K
Screen Flickering / PWM (Pulse-Width Modulation)
| Screen flickering / PWM not detected | 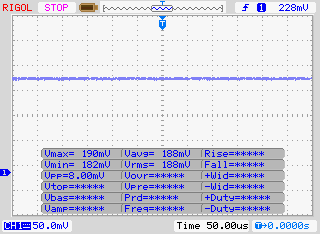 | ||
In comparison: 52 % of all tested devices do not use PWM to dim the display. If PWM was detected, an average of 7747 (minimum: 5 - maximum: 343500) Hz was measured. | |||
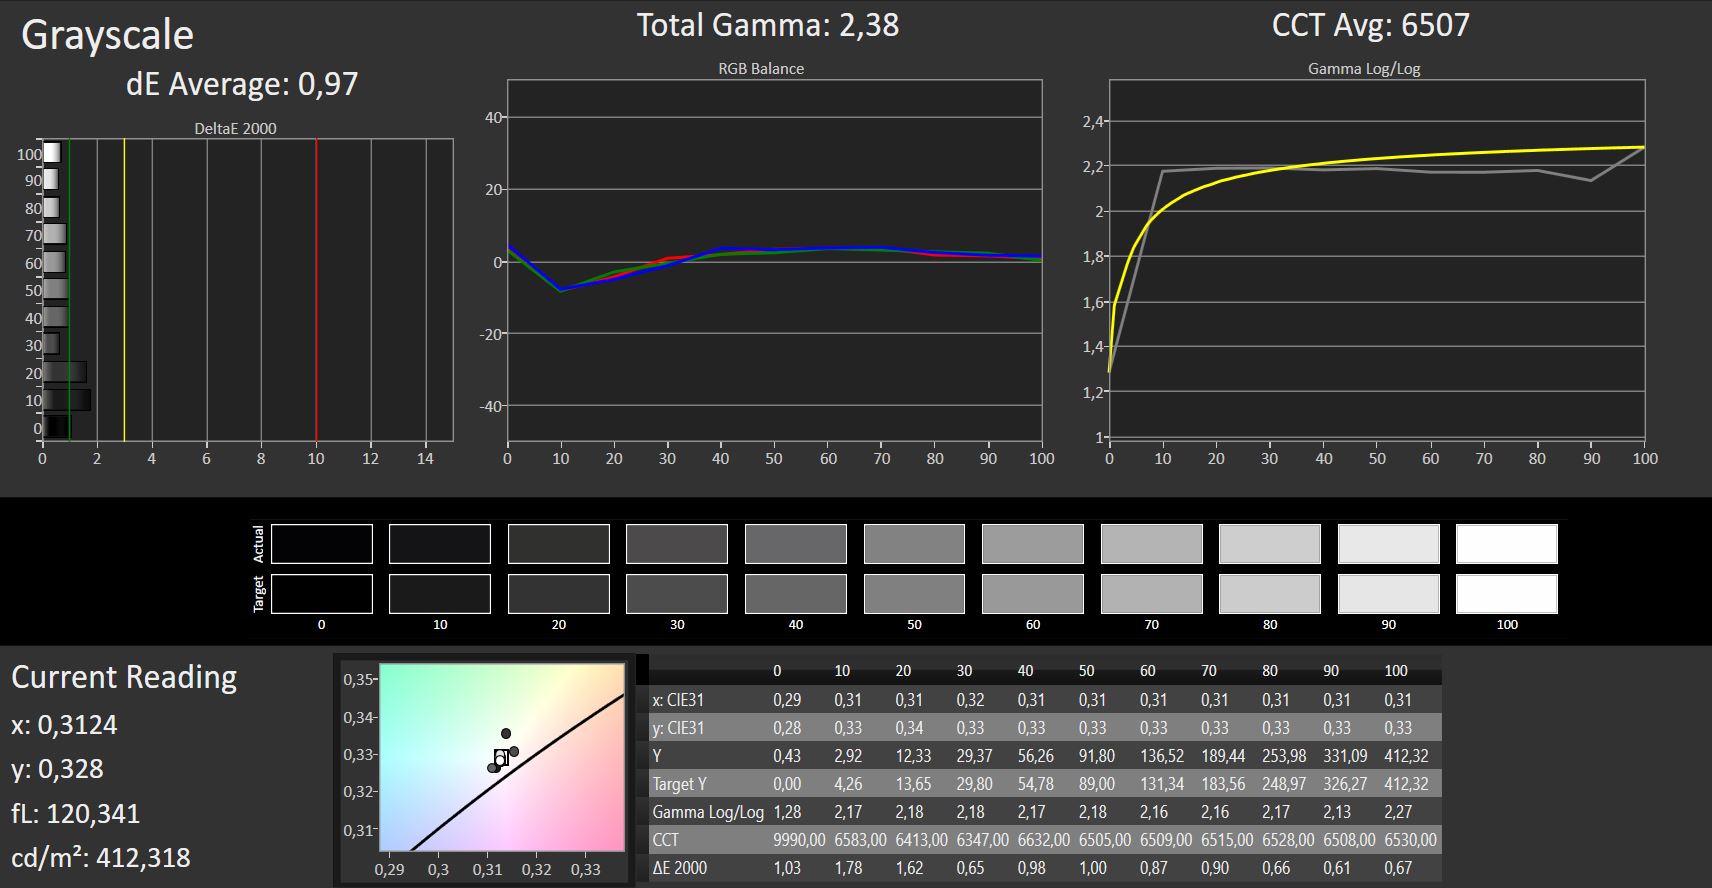
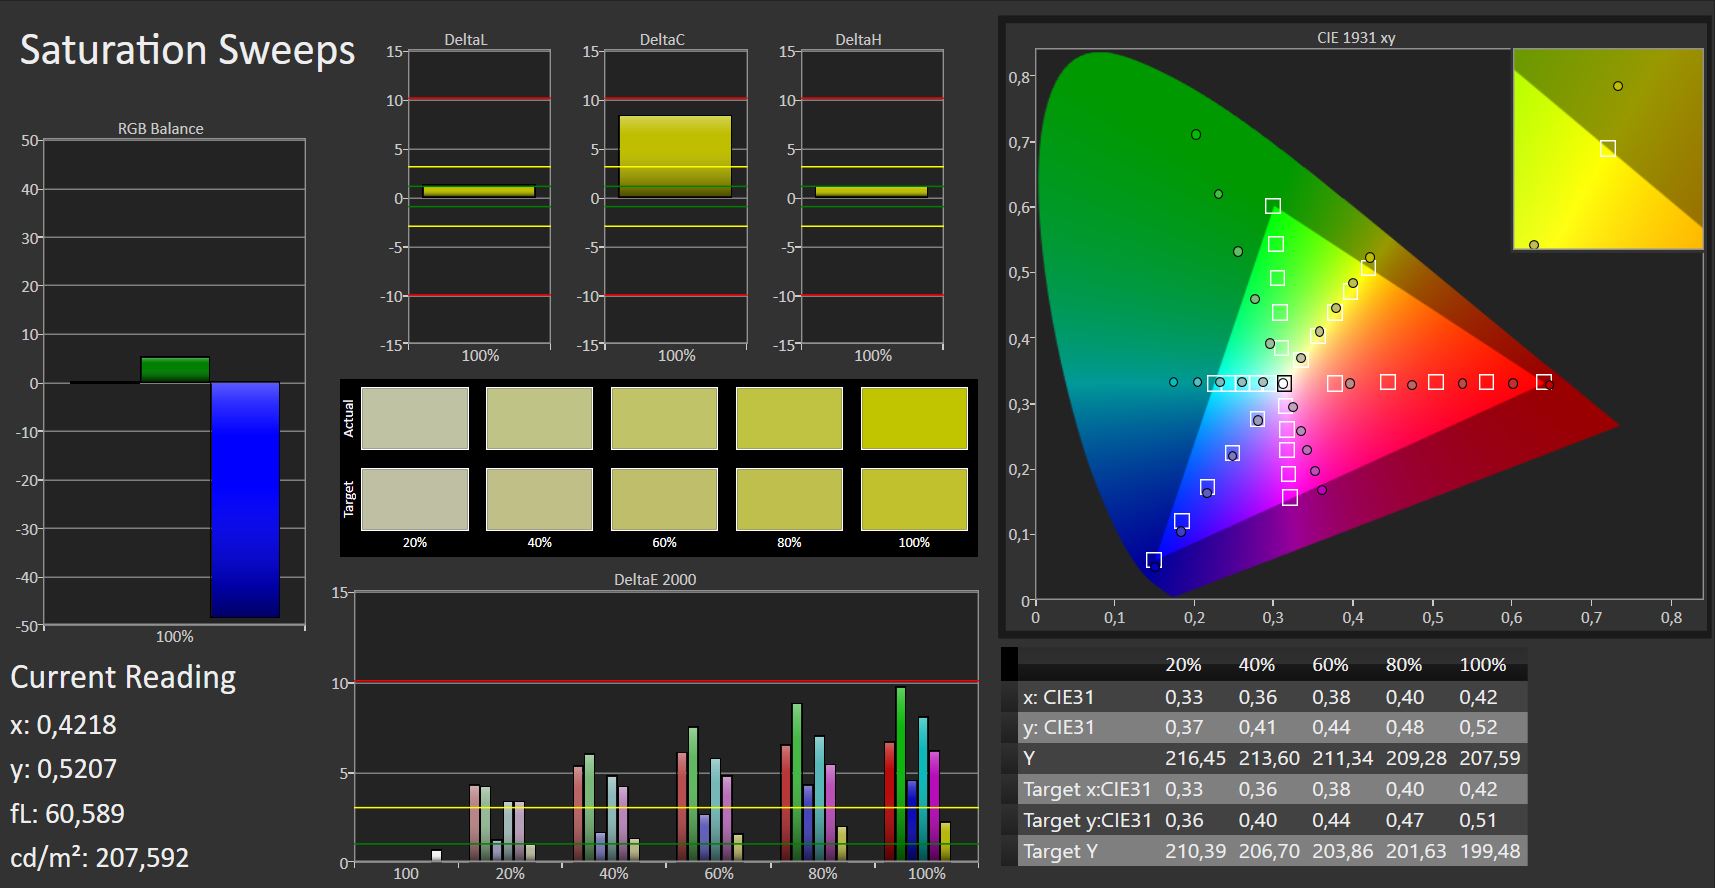
Thankfully, we were able to alleviate the color distortions all but completely through calibration. As always, the resulting ICC profile can be found for download in the box above. Please note that your system needs to be equipped with the exact same AOU B156ZA03.1 panel in order to benefit from the color profile. Many manufacturers use various panels for their seemingly identical notebooks.
Through calibration, we were able to decrease DeltaE for grayscale to 1 and DeltaE for colors to 3.6 and 7, respectively.
Display Response Times
| ↔ Response Time Black to White | ||
|---|---|---|
| 23 ms ... rise ↗ and fall ↘ combined | ↗ 13 ms rise | 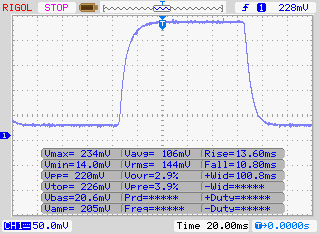 |
| ↘ 10 ms fall | ||
| The screen shows good response rates in our tests, but may be too slow for competitive gamers. In comparison, all tested devices range from 0.1 (minimum) to 240 (maximum) ms. » 52 % of all devices are better. This means that the measured response time is worse than the average of all tested devices (19.8 ms). | ||
| ↔ Response Time 50% Grey to 80% Grey | ||
| 38 ms ... rise ↗ and fall ↘ combined | ↗ 19 ms rise | 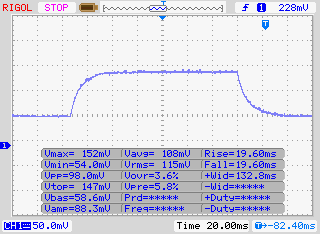 |
| ↘ 19 ms fall | ||
| The screen shows slow response rates in our tests and will be unsatisfactory for gamers. In comparison, all tested devices range from 0.165 (minimum) to 636 (maximum) ms. » 55 % of all devices are better. This means that the measured response time is worse than the average of all tested devices (31 ms). | ||
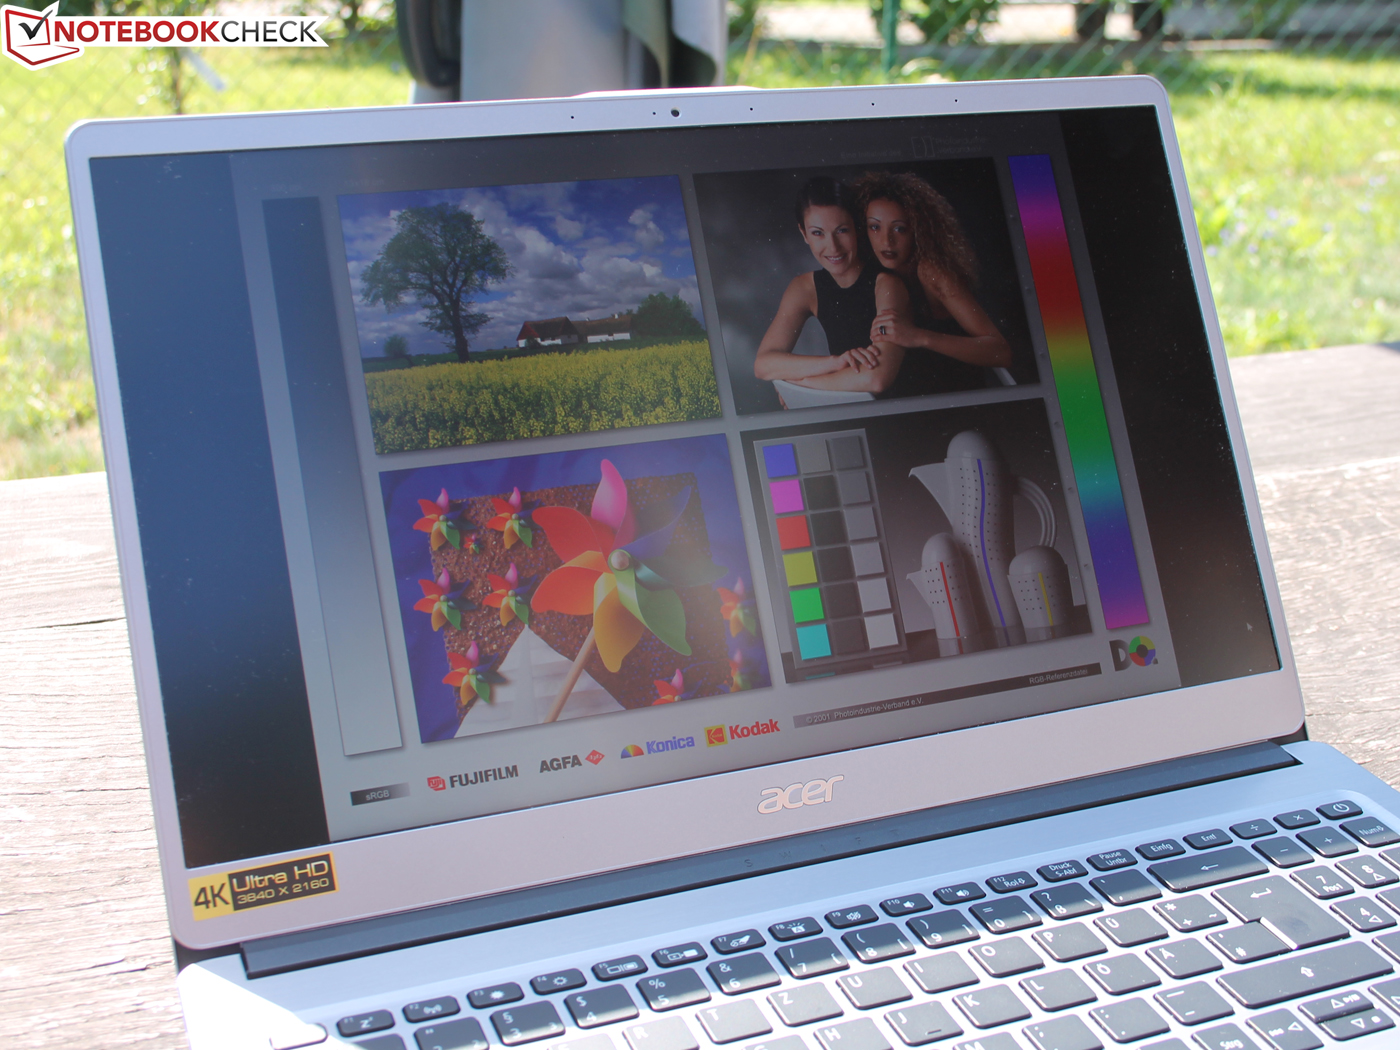
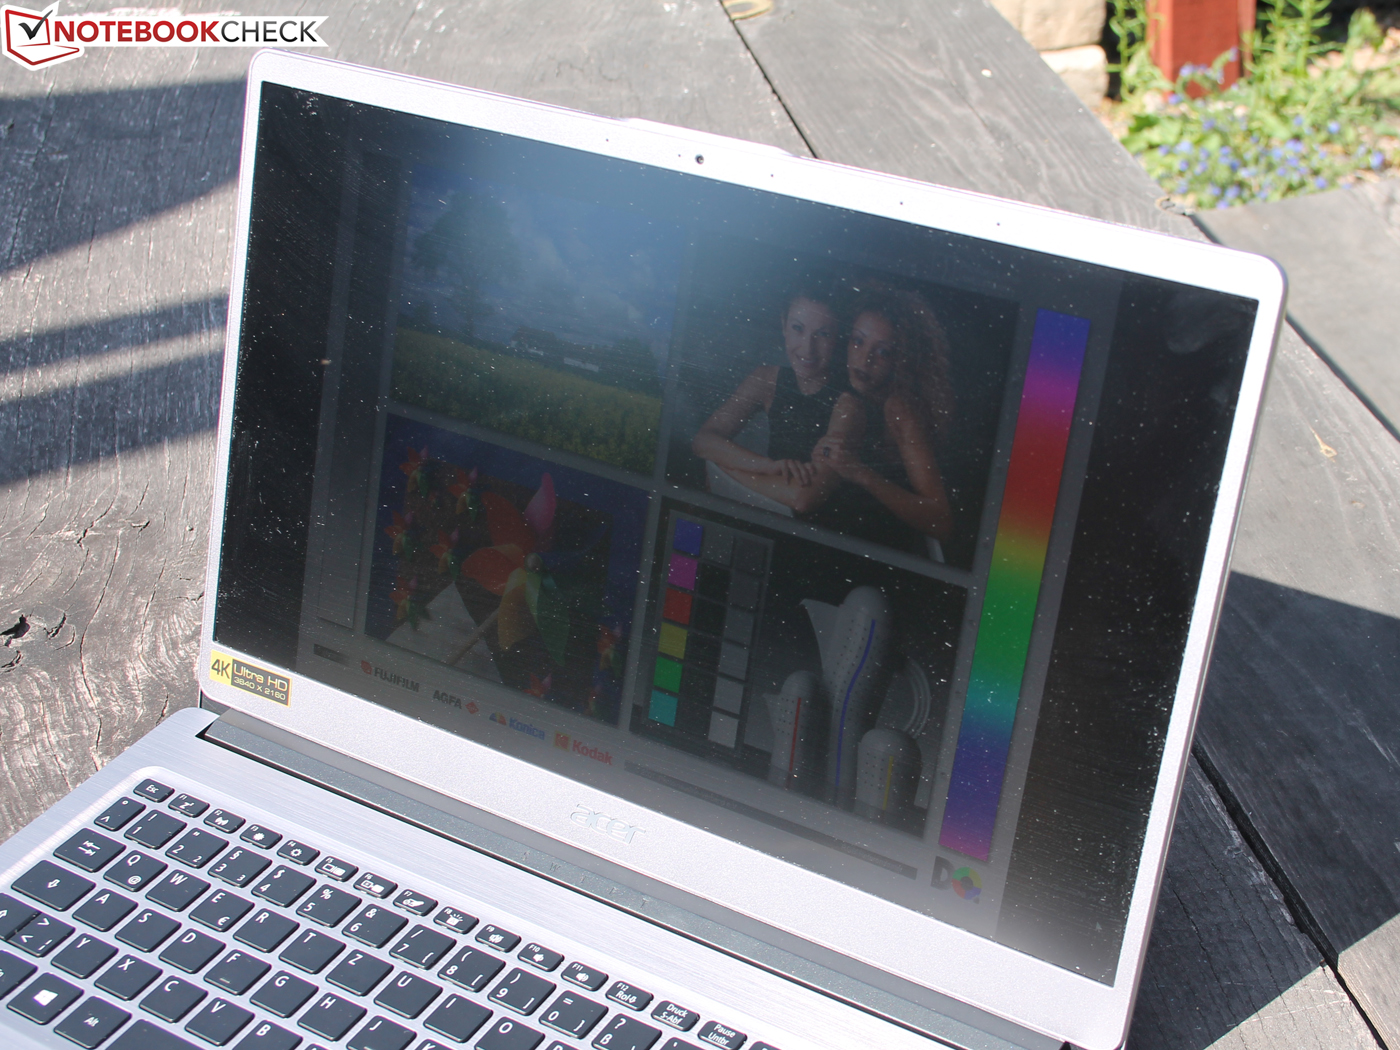
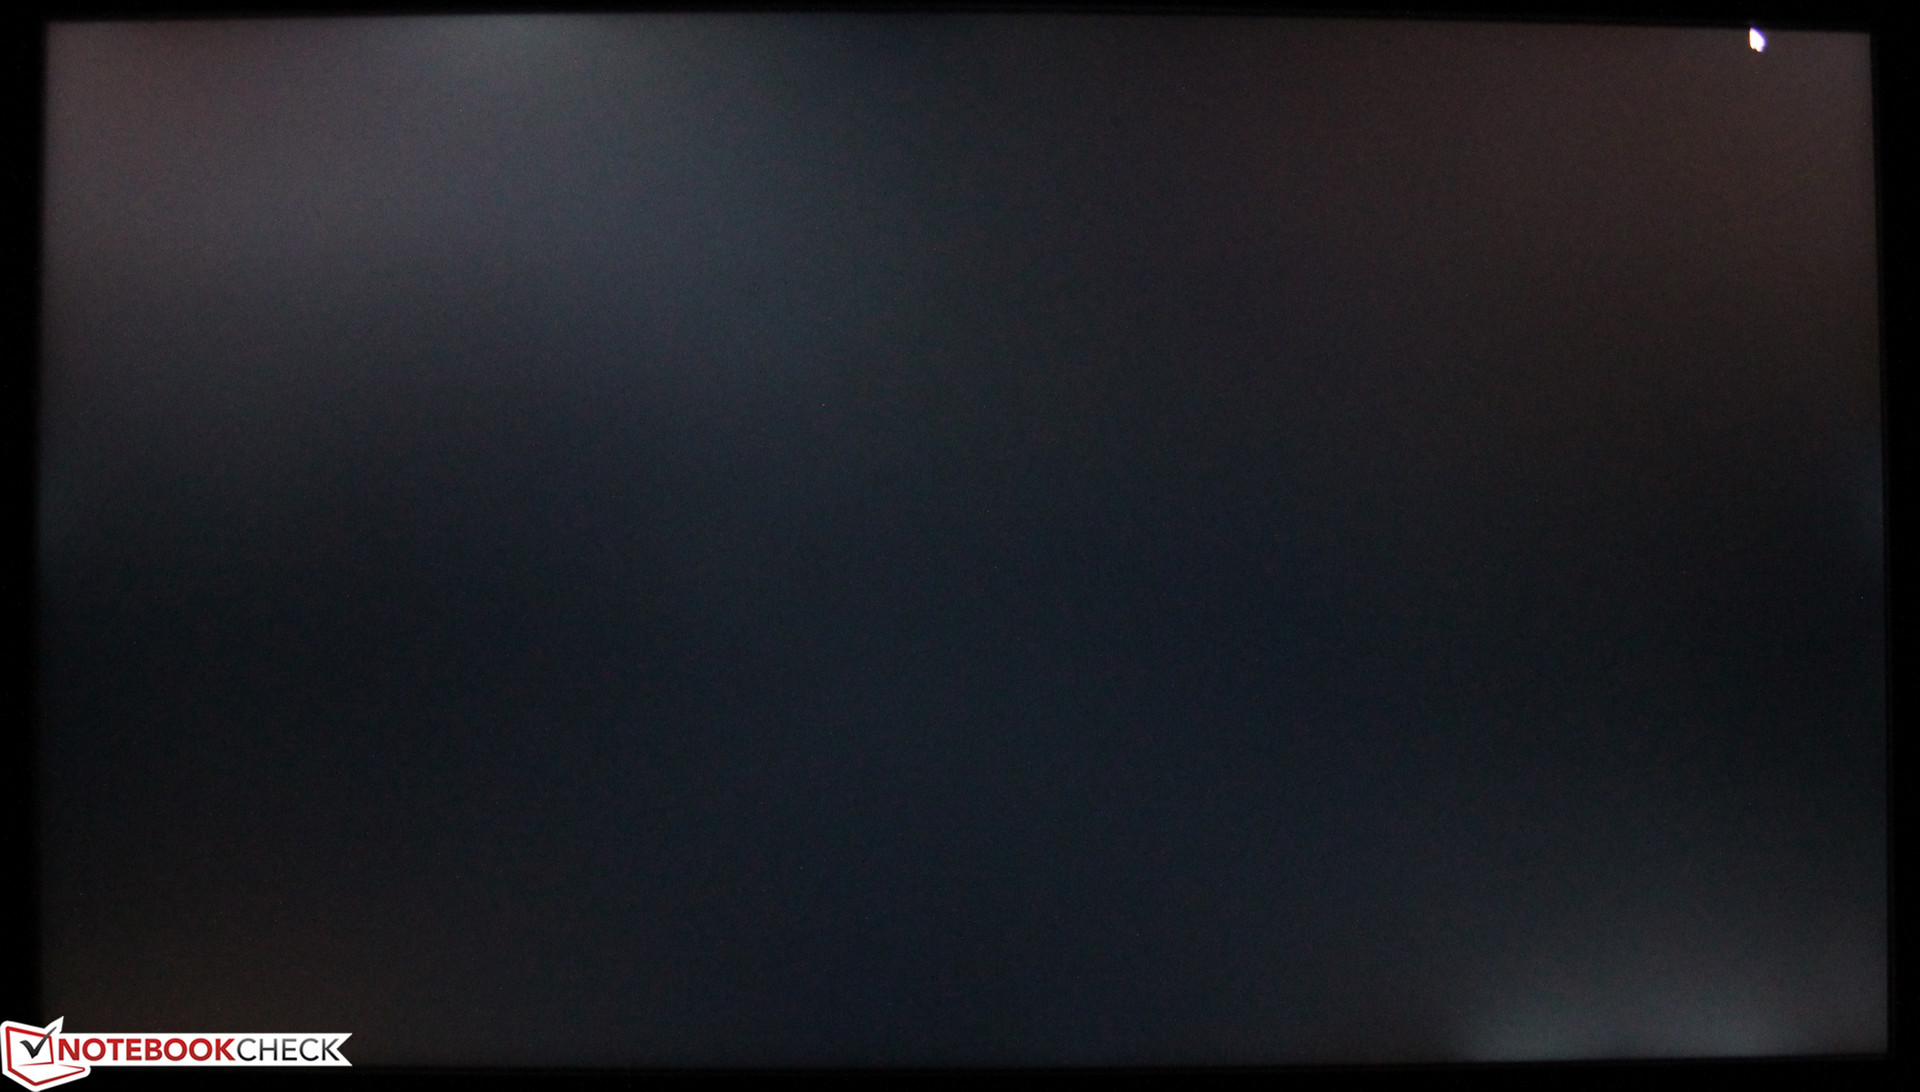
Thanks to its impressive maximum brightness of up to 44 nits the display remained usable even in bright sunshine outdoors. Our photo shows the Swift 3 4K on a particularly bright day in direct sunlight and in the shade, respectively. The matte display showed little to no reflections, and its viewing angles were as wide as expected of an IPS panel.
Performance
Acer's Swift 3 SF315-51G is a 15.6-inch multimedia device that is good in various aspects, including gaming. It renders all of today's popular games smoothly. Our test device is available for around 1000 Euros (~$1175; US model on the market for $750). Acer also offers other versions of the computer with different hardware components. The price starts at around 900 Euros (~$1050; US version $730).
Processor
The Swift 3 runs on an Intel Core i5-8250U quad-core processor from the Kaby Lake Refresh generation. The CPU supports Hyperthreading (each core can process two threads simultaneously). This chip is the direct successor of the dual-core Core i5-7200U and Core i5-7260U processors. In order to maintain the TDP of 15 watts even with four cores, the processor runs at a significantly lower base clock speed than its dual-core siblings. The 8250U's base clock speed is 1.6 GHz. Using turbo, it is possible to increase the speed to up to 3.4 GHz.
The extent to which the processor's turbo can be used is dependent on which application(s) the user is running. For example, the chip could only process the Multithread tests in the Cinebench benchmark at full turbo speed for 2 to 3 seconds. Afterward, the speed throttles down to between 2.4 and 2.5 GHz. The processor runs the entirety of the single thread tests at full turbo speed. The same goes for the Geekbench benchmarks: 3.4 GHz. With these results, the CPU positions itself between the Core i5-7300HQ and the Core i7-7700HQ.
To determine whether the CPU fully utilizes its turbo without interruption in AC power mode, we run the Cinebench R15 Multithread test for about 30 minutes in a continuous loop. After the first cycle, the results fall to between 525 and 530 points and remain there – demonstrating that the CPU is able to maintain a turbo speed of 2.4 to 2.5 GHz.
Cinebench R11.5 or R15 analysis, compared to the competition:
| Geekbench 3 | |
| 32 Bit Multi-Core Score | |
| Acer Nitro 5 AN515-51-788E | |
| Acer Swift 3 SF315-51G-57E5 | |
| Lenovo Legion Y520-15IKBN 80WK0042GE | |
| Acer Aspire VX15 VX5-591G-589S | |
| 32 Bit Single-Core Score | |
| Acer Nitro 5 AN515-51-788E | |
| Acer Swift 3 SF315-51G-57E5 | |
| Acer Aspire VX15 VX5-591G-589S | |
| Lenovo Legion Y520-15IKBN 80WK0042GE | |
| Geekbench 4.0 | |
| 64 Bit Multi-Core Score | |
| Acer Nitro 5 AN515-51-788E | |
| Acer Swift 3 SF315-51G-57E5 | |
| Lenovo Legion Y520-15IKBN 80WK0042GE | |
| Acer Aspire VX15 VX5-591G-589S | |
| 64 Bit Single-Core Score | |
| Acer Nitro 5 AN515-51-788E | |
| Acer Swift 3 SF315-51G-57E5 | |
| Lenovo Legion Y520-15IKBN 80WK0042GE | |
| Acer Aspire VX15 VX5-591G-589S | |
* ... smaller is better
System Performance
In terms of system performance, the Swift 3 is irreproachable. A solid-state disk and powerful Core i5 processor ensure a fast running system. The laptop's very good scores in the PCMark benchmarks attest to its ability to run programs beyond the realm of office and internet-related applications. It is not possible to improve the computer's overall performance – Acer has already maximized the machine's performance power.
| PCMark 8 Home Score Accelerated v2 | 3935 points | |
| PCMark 8 Creative Score Accelerated v2 | 5065 points | |
| PCMark 8 Work Score Accelerated v2 | 4992 points | |
| PCMark 10 Score | 3802 points | |
Help | ||
Storage Devices
A solid-state disk from Hynix serves as the system drive. This M.2 2280 model has a capacity of 128 GB. The SSD's transfer rates are good. The laptop offers plenty of storage space – alongside the SSD, Acer has packed a conventional 2.5-inch hard drive in the classy metal case. This drive provides 1 TB of storage and runs at 5400 RPM.

| Acer Swift 3 SF315-51G-57E5 Hynix HFS128G39TND | Asus FX553VD-DM249T Hynix HFS128G39TND | Dell Inspiron 15 5000 5567-1753 SanDisk X400 SED 256GB, SATA (SD8TB8U-256G) | HP Pavilion 15 Power 1GK62AV SK Hynix HFS256G39TND-N210A | Acer Swift 3 SF315-51G-55Z9 Kingston RBUSNS8180DS3128GH | |
|---|---|---|---|---|---|
| CrystalDiskMark 3.0 | 2% | 61% | -5% | 34% | |
| Read Seq (MB/s) | 481.5 | 504 5% | 502 4% | 491.6 2% | 462.2 -4% |
| Write Seq (MB/s) | 131.5 | 136.2 4% | 458.1 248% | 141.7 8% | 409.9 212% |
| Read 512 (MB/s) | 324.8 | 340.9 5% | 382.8 18% | 345.6 6% | 310.3 -4% |
| Write 512 (MB/s) | 130.6 | 136.9 5% | 385.7 195% | 142.6 9% | 216.6 66% |
| Read 4k (MB/s) | 30.81 | 29.74 -3% | 29.25 -5% | 18.83 -39% | 31.89 4% |
| Write 4k (MB/s) | 84.8 | 76.8 -9% | 55.9 -34% | 76.3 -10% | 73.2 -14% |
| Read 4k QD32 (MB/s) | 345 | 348.2 1% | 285.2 -17% | 348.5 1% | 287.9 -17% |
| Write 4k QD32 (MB/s) | 131.6 | 136.4 4% | 239.6 82% | 104.8 -20% | 170.6 30% |
Graphics Card
The GeForce MX150 graphics core is one of Nvidia's current midrange GPUs. This graphics card is a mobile version of the GeForce GT 1030. It reaches speeds of up to 1798 MHz, supports DirectX 12, and has 2048 MB of GDDR5 memory at its command. The results in the 3D Mark benchmarks are in the normal range for this GPU.
| 3DMark 06 Standard Score | 22407 points | |
| 3DMark 11 Performance | 4918 points | |
| 3DMark Ice Storm Standard Score | 82307 points | |
| 3DMark Cloud Gate Standard Score | 13562 points | |
| 3DMark Fire Strike Score | 3289 points | |
| 3DMark Time Spy Score | 1201 points | |
Help | ||
Gaming Performance
The Swift 3 is able to run every current game smoothly. Most titles reach sufficiently high frame rates at HD resolution (1366x768 pixels) and medium quality settings. It is possible to run some games at higher resolutions and/or quality settings, provided that their hardware demands are not too high. Titles that require a lot of performance power must be played at lower resolutions and/or quality settings. This is true of the game “Mafia 3”, for example.
| low | med. | high | ultra | |
|---|---|---|---|---|
| BioShock Infinite (2013) | 139.6 | 108 | 89.5 | 34 |
| X-Plane 10.25 (2013) | 104.2 | 54.6 | 29.8 | 21.9 |
| Dirt Rally (2015) | 229.2 | 99.3 | 52.2 | 27 |
| XCOM 2 (2016) | 72.8 | 25.9 | 15.8 | 7.1 |
| Hitman 2016 (2016) | 45.2 | 45.5 | 25.9 | 24.5 |
| Need for Speed 2016 (2016) | 95.8 | 61.7 | 31.4 | 22.7 |
| Overwatch (2016) | 121.7 | 87.4 | 66.8 | 41.9 |
| Mirror's Edge Catalyst (2016) | 81.4 | 54.5 | 39.5 | 23.4 |
| Titanfall 2 (2016) | 99.7 | 70.7 | 28.5 | 22.2 |
| Team Fortress 2 (2017) | 101 | 94 | 80.3 | 75.1 |
| Ark Survival Evolved (2017) | 52.7 | 13.3 | 10.2 | |
| FIFA 18 (2017) | 174.2 | 99.8 | 76.6 | 59.5 |
| BioShock Infinite - 1366x768 High Preset | |
| Acer Nitro 5 AN515-51-788E | |
| HP Pavilion Power 15t-cb2000 | |
| Acer Swift 3 SF315-51G-57E5 | |
| Dell Inspiron 15 5000 5567-1753 | |
| Titanfall 2 - 1366x768 Medium / Disabled AF:4x | |
| Acer Swift 3 SF315-51G-57E5 | |
| Dell Inspiron 15 5000 5567-1753 | |
| Overwatch - 1920x1080 High (Render Scale 100 %) AA:SM AF:4x | |
| HP Pavilion 15 Power 1GK62AV | |
| Acer Swift 3 SF315-51G-57E5 | |
| Apple MacBook Pro 15 2017 (2.8 GHz, 555) | |
| Dell Inspiron 15 5000 5567-1753 | |
Emissions & Energy
The Swift 3 is relatively quiet under any level of load. In idle mode, the fan stands still as a general rule. At most, the user might hear the very quiet whirring of the 2.5-inch hard drive. Even under load the fan does not run very often. During our stress test, we recorded a sound pressure level of 35.6 dB(A).
Noise level
| Idle |
| 30.5 / 30.5 / 30.9 dB(A) |
| Load |
| 35.7 / 35.6 dB(A) |
 | ||
30 dB silent 40 dB(A) audible 50 dB(A) loud |
||
min: | ||
Temperature
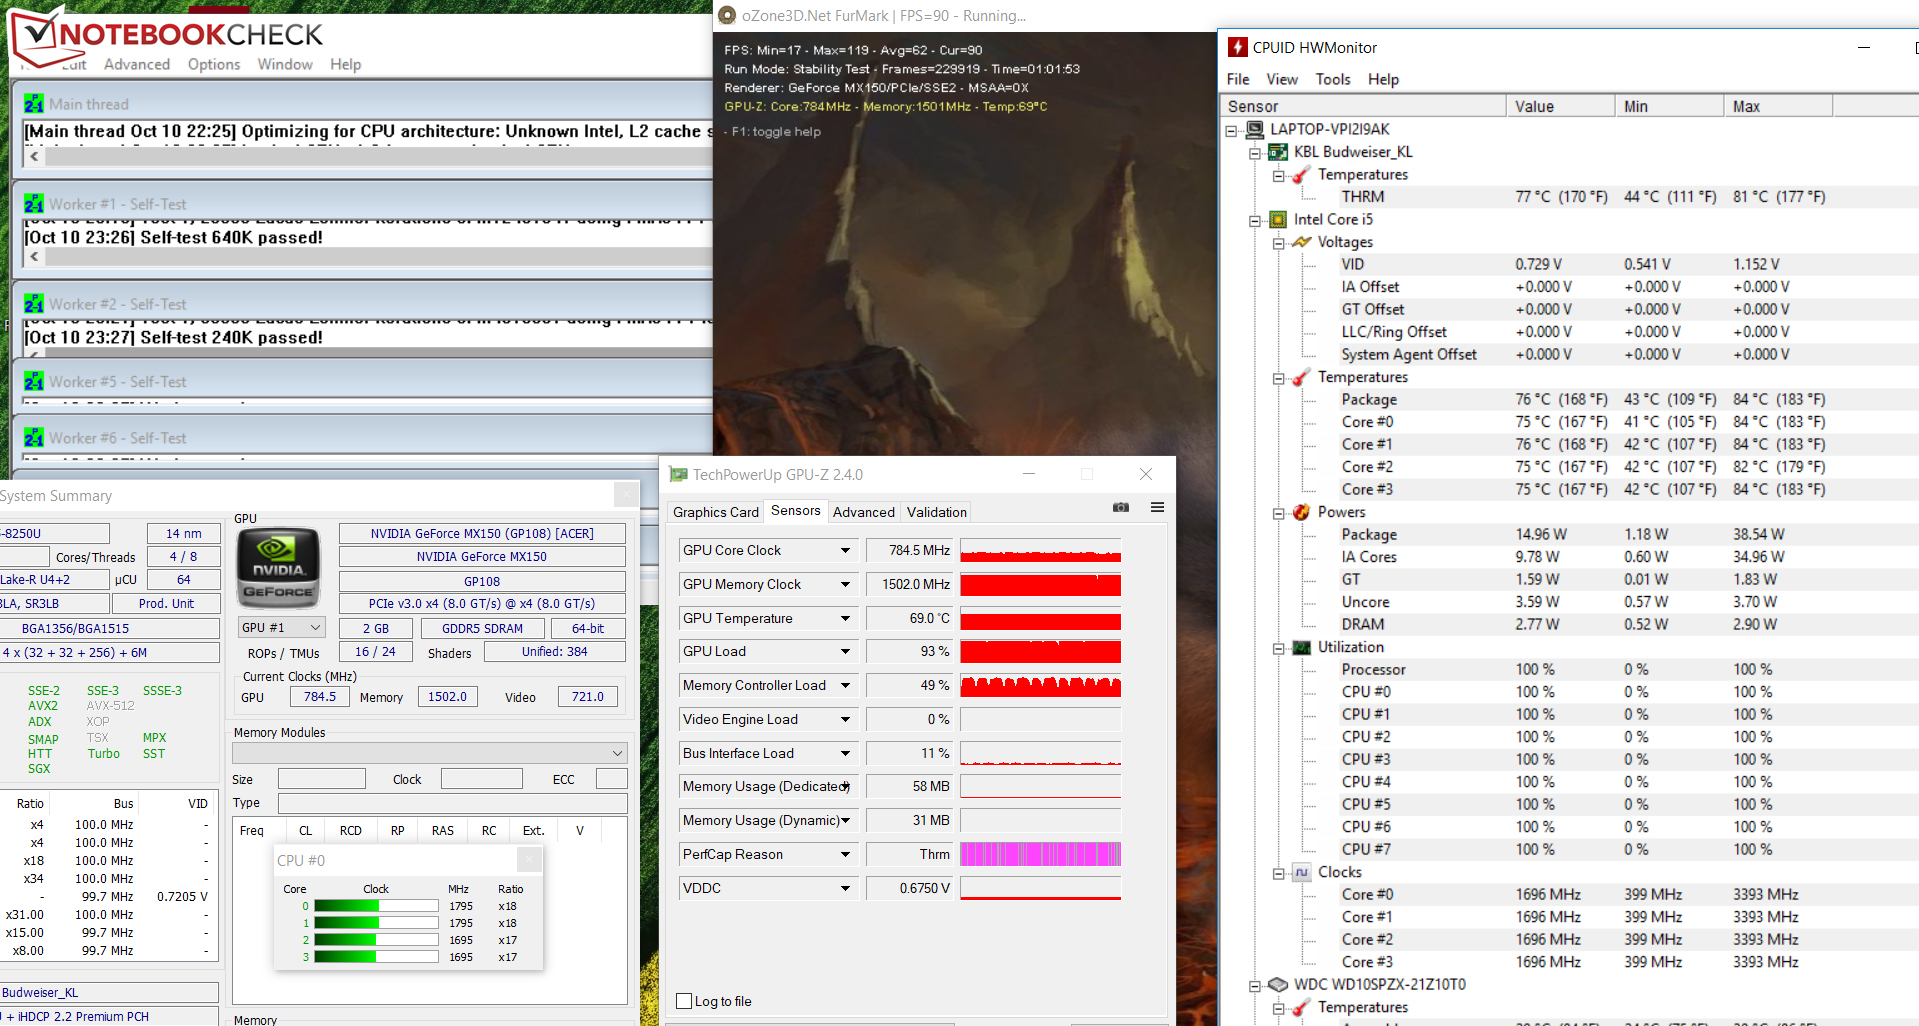
The Swift 3 completed our stress test (Prime95 and FurMark running simultaneously for at least an hour) in different ways in AC power mode vs. battery mode. In AC power mode, the processor ran at 1.6 to 2 GHz. The graphics core's speed registered between 700 and 800 MHz. In battery mode, the CPU speed jumped back and forth between 400 MHz and 3.4 GHz. The GPU reached speeds between 1000 and 1300 MHz.
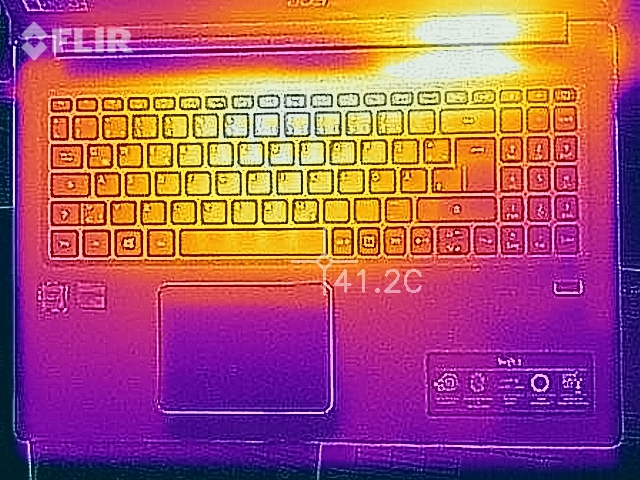
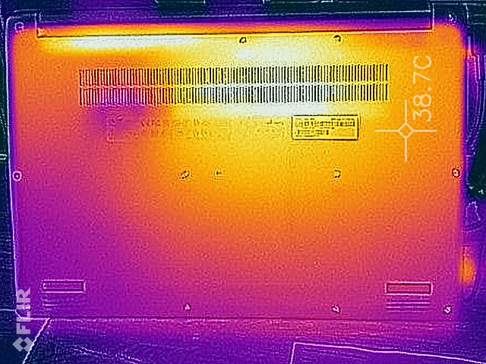
During the stress test (AC power mode), the laptop did not warm past moderate temperatures. The temperature crossed 40°C (104°F) in only one spot.
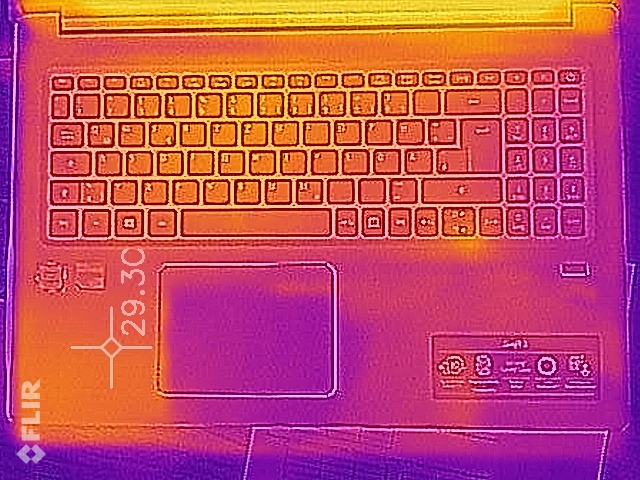
(±) The maximum temperature on the upper side is 43.4 °C / 110 F, compared to the average of 36.8 °C / 98 F, ranging from 21 to 71 °C for the class Multimedia.
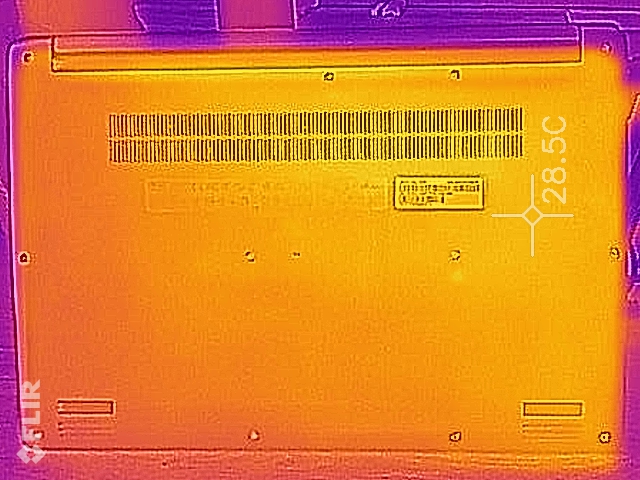
(+) The bottom heats up to a maximum of 38.1 °C / 101 F, compared to the average of 39.1 °C / 102 F
(+) In idle usage, the average temperature for the upper side is 24 °C / 75 F, compared to the device average of 31.3 °C / 88 F.
(+) The palmrests and touchpad are cooler than skin temperature with a maximum of 27.2 °C / 81 F and are therefore cool to the touch.
(±) The average temperature of the palmrest area of similar devices was 28.7 °C / 83.7 F (+1.5 °C / 2.7 F).
Acer Swift 3 SF315-51G-57E5 audio analysis
(±) | speaker loudness is average but good (75.3 dB)
Bass 100 - 315 Hz
(-) | nearly no bass - on average 26.7% lower than median
(±) | linearity of bass is average (10.2% delta to prev. frequency)
Mids 400 - 2000 Hz
(+) | balanced mids - only 4.6% away from median
(+) | mids are linear (5.2% delta to prev. frequency)
Highs 2 - 16 kHz
(+) | balanced highs - only 3.7% away from median
(+) | highs are linear (3.3% delta to prev. frequency)
Overall 100 - 16.000 Hz
(±) | linearity of overall sound is average (19.7% difference to median)
Compared to same class
» 65% of all tested devices in this class were better, 6% similar, 29% worse
» The best had a delta of 5%, average was 17%, worst was 45%
Compared to all devices tested
» 50% of all tested devices were better, 7% similar, 43% worse
» The best had a delta of 4%, average was 23%, worst was 134%
Apple MacBook 12 (Early 2016) 1.1 GHz audio analysis
(+) | speakers can play relatively loud (83.6 dB)
Bass 100 - 315 Hz
(±) | reduced bass - on average 11.3% lower than median
(±) | linearity of bass is average (14.2% delta to prev. frequency)
Mids 400 - 2000 Hz
(+) | balanced mids - only 2.4% away from median
(+) | mids are linear (5.5% delta to prev. frequency)
Highs 2 - 16 kHz
(+) | balanced highs - only 2% away from median
(+) | highs are linear (4.5% delta to prev. frequency)
Overall 100 - 16.000 Hz
(+) | overall sound is linear (10.2% difference to median)
Compared to same class
» 7% of all tested devices in this class were better, 2% similar, 90% worse
» The best had a delta of 5%, average was 18%, worst was 53%
Compared to all devices tested
» 5% of all tested devices were better, 1% similar, 94% worse
» The best had a delta of 4%, average was 23%, worst was 134%
frequency diagram in comparison (checkboxes above selectable/deselectable!)
Energy Consumption
In terms of energy consumption, the computer behaves as expected. In idle mode, we measured a maximum energy consumption rate of 9.1 watts. During the stress test, the rate rose to 55.6 watts. The energy consumption rate under load would be higher if the CPU fully utilized its turbo and the GPU ran at full power. The power supply that comes with the computer is rated at 65 watts.
| Off / Standby | |
| Idle | |
| Load |
|
Key:
min: | |
Battery Life
Our WLAN test – designed to simulate normal, everyday use – uses a script to keep the system busy by regularly loading new websites. The "balanced" profile is active, the display brightness is set to about 150 cd/m², and the device's energy saving functions are deactivated. The Swift 3 lasted 8:31 hours – an excellent run time.
Update 07/25/2018: Unsurprisingly, the 4K SKU’s battery life was much shorter than the FHD’s. This was less noticeable during our load tests and much more so when idle where they decreased by almost 2 hours (8:29 hours / 509 minutes). We were unable to run our Wi-Fi battery benchmark again due to technical difficulties.
Pros
Cons
Verdict
Acer's 15.6-inch multi-talented multimedia machine smoothly renders current computer games on its glossy Full HD display. It makes a good impression in every other aspect too, regardless of the kind of application. The device never grows particularly warm or loud. The new ULV quad-core processor provides plenty of power.
A solid-state disk ensures a fast running system. In addition, Acer has packed a 1 TB 2.5-inch hard drive into the laptop's case. The Swift 3's backlit keyboard made a good impression on us and is suitable for users who do a lot of typing. An excellent battery life tops off the package.
Acer's Swift 3 SF315-51G is a well-rounded and multi-talented multimedia machine, but it has a few weaknesses.
Acer has made some mistakes in terms of the display. Yes, the IPS panel displays the screen content accurately from any viewing angle, the contrast is good, and the color representation is reasonably faithful. But for a laptop in this price bracket, the display brightness is much too low. To make matters worse, Acer has chosen a panel with a glossy surface. A display like this does not belong in a mobile device.
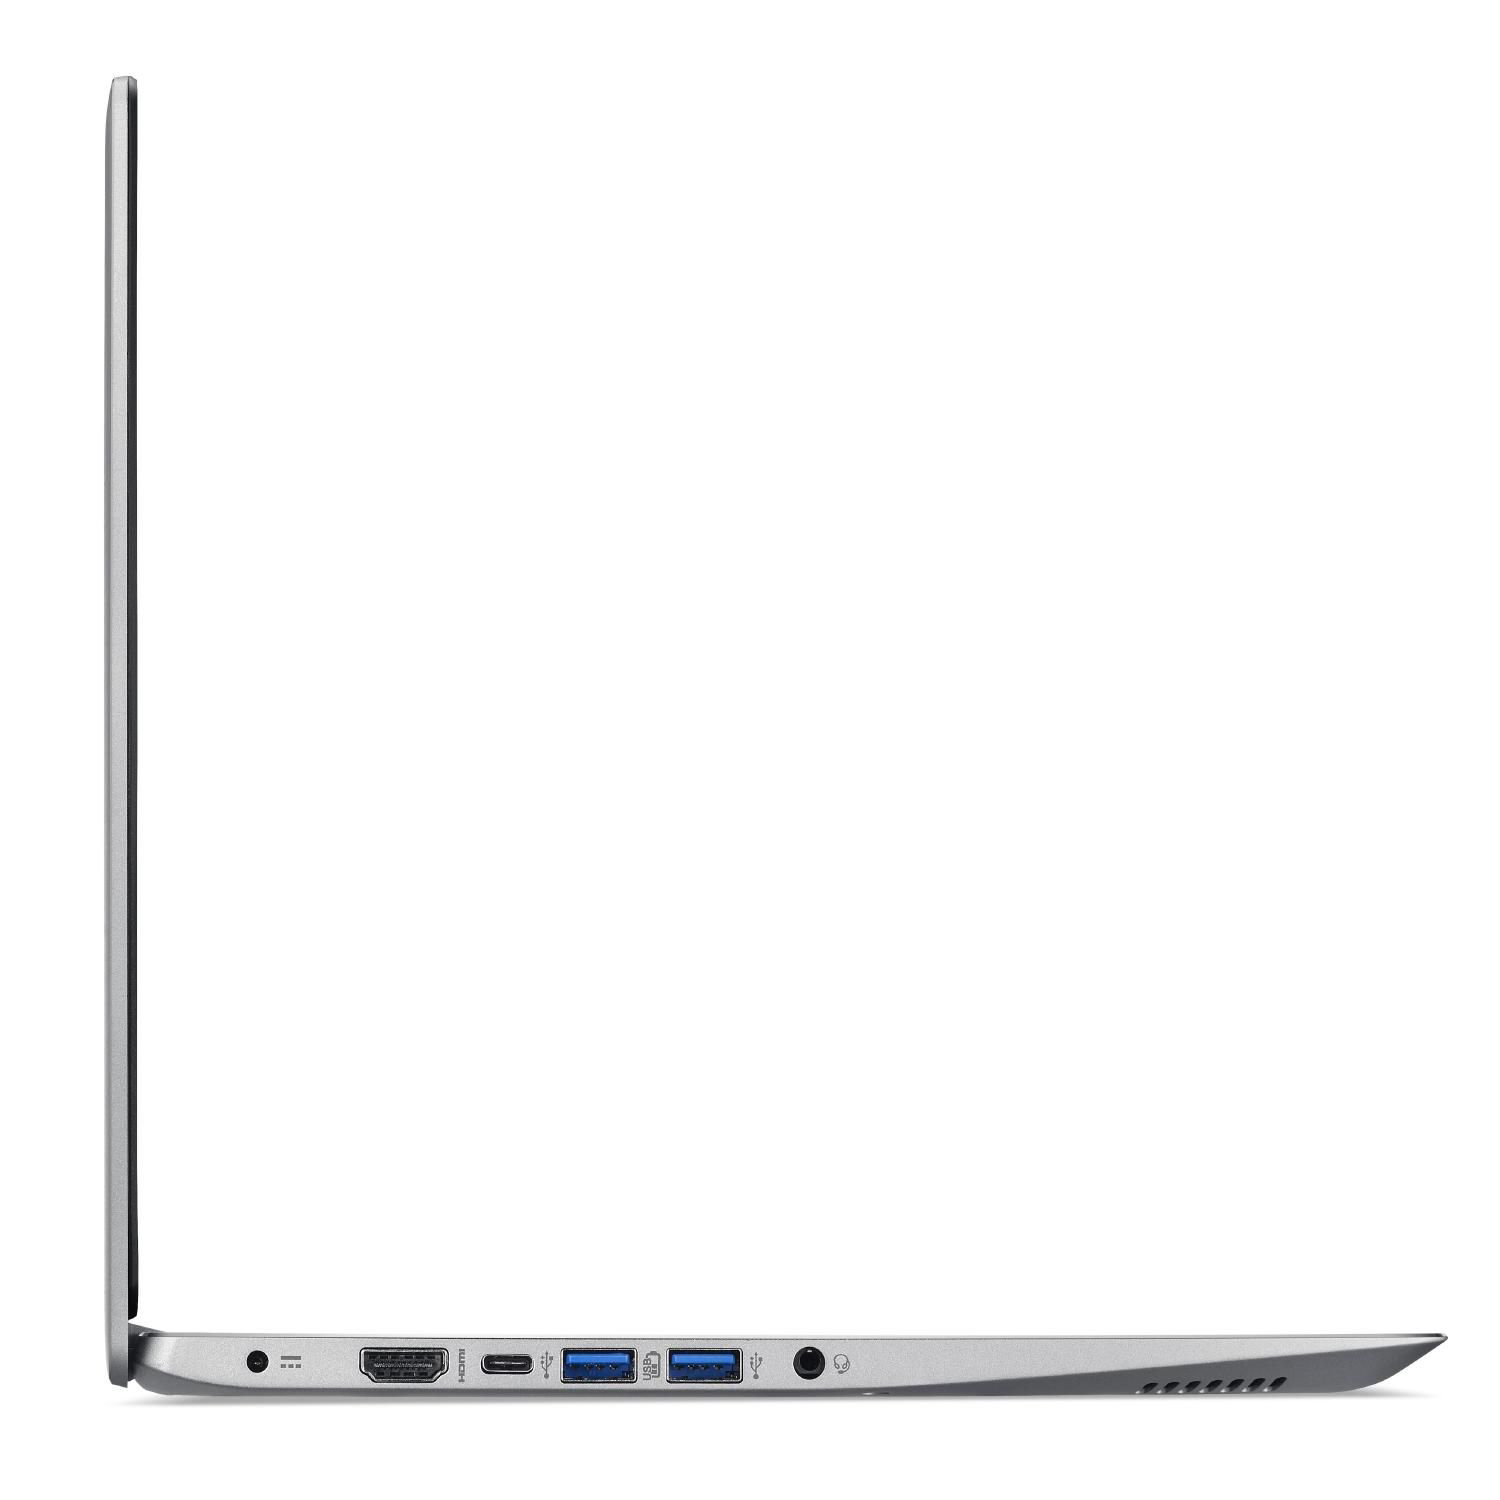
Further criticism is due to the choice of speakers. The sound is not adequate for a multimedia laptop. We commend Acer for equipping the computer with a Type C USB 3.1 port, but it should have been a Gen 2 port. Acer has chosen a Gen 1 port instead.
Update 07/25/2018: We loved the 4K SKU of the Acer Swift 3 SF-315. The matte panel was very bright, and was thus even usable outdoors. Its 100 % sRGB color space coverage means it’s ideal for professional photo editing, and we were able to all but eliminate the blue tint with calibration. As usual, you can find the resulting ICC profile for download in the box above. Battery life was significantly shorter than for the FHD model.
Acer Swift 3 SF315-51G-57E5
- 10/16/2017 v6 (old)
Sascha Mölck
Price comparison
