Notebook reviews with NVIDIA GeForce MX130 graphics card
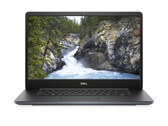
Dell Vostro 15-5581 Laptop Review: An office laptop with an MX130 for some light gaming
The Vostro name has been the moniker of Dell's series of budget laptops for years. The company has given the old workhorse a hardware upgrade and ironed out some of the kinks, but some questionable decisions remain.
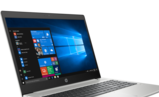
Intel Core i5-8265U, NVIDIA GeForce MX130, 15.6", 2 kgHP ProBook 450 G6 (Core i7-8565U, GeForce MX130) Laptop Review
We have covered several HP ProBook 400 series laptops recently, including the 440 G6 and 430 G6. Now it is the turn of the ProBook 450 G6, the 15-inch version of HP's entry-level business-laptop range. The company has equipped our test device with an Intel Core i7 processor and an Nvidia GeForce MX130 GPU that promises to be a good all-round package, at least on paper. Read on to find out whether the ProBook 450 G6 improves upon its predecessor and if it can challenge other established 15.6-inch business laptops.
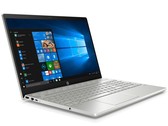
Intel Core i7-8565U, NVIDIA GeForce MX130, 15.6", 2 kgHP Pavilion 15 (Core i5-8250U, NVIDIA MX130) Laptop Review
After reviewing the AMD variant of the HP Pavilion 15, we now have the Intel Core i5 version with an NVIDIA GeForce MX130 GPU in for testing. The design remains the same and is finished to a high quality. Read on to find out what to expect from the Intel variant of the Pavilion 15 and how it compares against its AMD sibling.
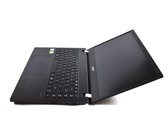
Intel Core i5-8250U, NVIDIA GeForce MX130, 15.6", 1.9 kgAcer TravelMate X3410 (i7, MX130, FHD) Laptop Review
In the enterprise-laptop market, avoiding Dell, Lenovo or HP is hardly possible, but Acer wants to have a piece of that lucrative market segment as well. The Acer TravelMate X3410 is made to appeal to business customers, but will it be able to win-out over the well-established competition? To find out more, read this in-depth review.
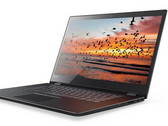
Intel Core i7-8550U, NVIDIA GeForce MX130, 14", 1.7 kgLenovo Flex 5 15 (i7-8550U, GeForce MX130) Convertible Review
Not that flexible. Lenovo's Flex 5 is an affordable 2-in-1 that looks and feels great for the price with plenty of integrated ports. Unfortunately, the dim display and poor Turbo Boost performance leave a lot to be desired.
Intel Core i7-8550U, NVIDIA GeForce MX130, 15.6", 2 kgAcer TravelMate P2510-G2-MG-50WE: Intel Core i5-8250U, 15.60", 2.1 kg
Review » Acer TravelMate P2510 (i5-8250U, MX130) Laptop Review
Acer TravelMate 2410-G2-MG-82E6: Intel Core i7-8550U, 14.00", 1.8 kg
Review » Acer TravelMate P2410 (i7-8550U, MX130) Laptop Review
Dell Latitude 5591: Intel Core i7-8850H, 15.60", 2.3 kg
Review » Dell Latitude 5591 (8850H, MX130, Touchscreen) Laptop Review
Dell Latitude 5491: Intel Core i7-8850H, 14.00", 1.8 kg
Review » Dell Latitude 5491 (8850H, MX130, Touchscreen) Laptop Review
Lenovo Flex 6-14IKB: Intel Core i5-8250U, 14.00", 1.7 kg
Review » Lenovo Flex 6-14IKB (i5 8250U, GeForce MX130) Convertible Review
Asus VivoBook 15 F510UF-ES71: Intel Core i7-8550U, 15.60", 1.6 kg
Review » Asus VivoBook 15 F510UF (i7-8550U, GeForce MX130) Laptop Review
Asus VivoBook 15 X542UF-DM143T: Intel Core i5-8250U, 15.60", 2.3 kg
Review » ASUS VivoBook 15 X542UF (i5-8250U, MX130, SSD, FHD) Laptop Review
Acer Aspire 5 A515-51G-509A: Intel Core i5-8250U, 15.60", 2.2 kg
Review » Acer Aspire 5 A515-51G-509A (8250U, MX130, FHD) Laptop Review
Lenovo IdeaPad 3 14IML05-81WA005VAU: Intel Core i3-10110U, 14.00", 1.6 kg
External Review » Lenovo IdeaPad 3 14IML05-81WA005VAU
HP Pavilion 14-ce3003ns: Intel Core i5-1035G1, 14.00", 1.6 kg
External Review » HP Pavilion 14-ce3003ns
HP 15-da1017ns: Intel Core i7-8565U, 15.60", 1.8 kg
External Review » HP 15-da1017ns
Acer Aspire 5 A517-51G-87A7: Intel Core i7-8550U, 17.30", 3 kg
External Review » Acer Aspire 5 A517-51G-87A7
Acer Aspire 3 A315-53G-888K: Intel Core i7-8550U, 15.60", 2.1 kg
External Review » Acer Aspire 3 A315-53G-888K
Acer Aspire 3 A315-53G-5947: Intel Core i5-8250U, 15.60", 2.1 kg
External Review » Acer Aspire 3 A315-53G-5947
Lenovo Ideapad 530s-14IKB-81EU00LASP: Intel Core i5-8250U, 14.00", 1.6 kg
External Review » Lenovo Ideapad 530s-14IKB-81EU00LASP
HP Pavilion 15-cs2026ng: Intel Core i5-8265U, 15.60", 1.9 kg
External Review » HP Pavilion 15-cs2026ng
Asus Vivobook X507UF-EJ171T: Intel Core i3-8130U, 15.60", 1.7 kg
External Review » Asus Vivobook X507UF-EJ171T
HP Pavilion x360 14-cd0014ns: Intel Core i7-8550U, 14.00", 1.6 kg
External Review » HP Pavilion x360 14-cd0014ns
Acer Aspire 5 A515-52G-78V3: Intel Core i7-8565U, 15.60", 1.9 kg
External Review » Acer Aspire 5 A515-52G-78V3
Dell Inspiron 14 5482-cn54805: Intel Core i5-8250U, 14.00", 1.7 kg
External Review » Dell Inspiron 14 5482-cn54805
Acer Aspire 3 A315-53G-56SU: Intel Core i5-8250U, 15.60", 2.1 kg
External Review » Acer Aspire 3 A315-53G-56SU
Acer Swift 3 SF314-55G-71NF: Intel Core i7-8565U, 14.00", 1.4 kg
External Review » Acer Swift 3 SF314-55G-71NF
Asus VivoBook 15 X512UF-BQ135T: Intel Core i7-8550U, 15.60", 1.8 kg
External Review » Asus VivoBook 15 X512UF-BQ135T
Acer Aspire 3 A315-53G-51GB: Intel Core i5-8250U, 15.60", 2.1 kg
External Review » Acer Aspire 3 A315-53G-51GB
Acer Aspire 5 A515-52G-73ML: Intel Core i7-8565U, 15.60", 1.8 kg
External Review » Acer Aspire 5 A515-52G-73ML
Asus Pro P5440UF-BM0043R: Intel Core i5-8265U, 14.00", 1.2 kg
External Review » Asus Pro P5440UF-BM0043R
HP 15-da1016ns: Intel Core i7-8565U, 15.60", 1.8 kg
External Review » HP 15-da1016ns
HP Pavilion 15-cs0003ng: Intel Core i5-8250U, 15.60", 1.9 kg
External Review » HP Pavilion 15-cs0003ng
Asus F507UF-EJ044T: Intel Core i5-8250U, 15.60", 1.7 kg
External Review » Asus F507UF-EJ044T
Lenovo Yoga 530-14IKB-81EK00WEGE: Intel Core i7-8550U, 14.00", 1.7 kg
External Review » Lenovo Yoga 530-14IKB-81EK00WEGE
Asus VivoBook S15 S510UF-BR452T: Intel Core i7-8550U, 14.00", 1.7 kg
External Review » Asus VivoBook S15 S510UF-BR452T
HP Pavilion 15-cs0004ns: Intel Core i5-8250U, 15.60", 1.9 kg
External Review » HP Pavilion 15-cs0004ns
HP 15-da0077ns: Intel Core i7-8550U, 15.60", 2.1 kg
External Review » HP 15-da0077ns
Acer TravelMate X3410-MG-50LB: Intel Core i5-8250U, 14.00", 1.6 kg
External Review » Acer TravelMate X3410-MG-50LB
Lenovo Yoga 530-14IKB-81EK00A5MJ: Intel Core i5-8250U, 14.00", 1.6 kg
External Review » Lenovo Yoga 530-14IKB-81EK00A5MJ
Dell Inspiron 14 5482-VC58K: Intel Core i7-8565U, 14.00", 1.8 kg
External Review » Dell Inspiron 14 5482-VC58K
Asus Vivobook X507UF-EJ078T: Intel Core i5-8250U, 15.60", 1.7 kg
External Review » Asus Vivobook X507UF-EJ078T
Asus Pro P5440UF-XB74: Intel Core i7-8550U, 14.00", 1.2 kg
External Review » Asus Pro P5440UF-XB74
Lenovo Flex 6 14 81EM0008US: Intel Core i5-8250U, 14.00", 1.7 kg
External Review » Lenovo Flex 6 14 81EM0008US
Lenovo Ideapad 530s-14IKB-81EU00AGFE: Intel Core i5-8250U, 14.00", 1.5 kg
External Review » Lenovo Ideapad 530s-14IKB-81EU00AGFE
Dell Inspiron 15 7570, GeForce MX130: Intel Core i5-8250U, 15.60", 2 kg
External Review » Dell Inspiron 15 7570, GeForce MX130
Asus VivoBook S15 S530UF-BQ819T: Intel Core i5-8250U, 15.60", 1.8 kg
External Review » Asus VivoBook S15 S530UF-BQ819T
HP Pavilion 14-ce0010ns: Intel Core i5-8250U, 14.00", 1.7 kg
External Review » HP Pavilion 14-ce0010ns
HP Pavilion 15-cs0649nd: Intel Core i5-8250U, 15.60", 1.9 kg
External Review » HP Pavilion 15-cs0649nd
Acer Aspire 5 A515-51G-509A: Intel Core i5-8250U, 15.60", 2.2 kg
External Review » Acer Aspire 5 A515-51G-509A
HP Pavilion 14-ce0002ns: Intel Core i5-8250U, 14.00", 1.6 kg
External Review » HP Pavilion 14-ce0002ns
HP Pavilion x360 14-cd0011ns: Intel Core i5-8250U, 14.00", 1.6 kg
External Review » HP Pavilion x360 14-cd0011ns
Dell Latitude 5591: Intel Core i7-8850H, 15.60", 2.3 kg
External Review » Dell Latitude 5591
Dell Latitude 5491: Intel Core i7-8850H, 14.00", 1.8 kg
External Review » Dell Latitude 5491
HP Pavilion 14-ce0004ns: Intel Core i5-8250U, 14.00", 1.6 kg
External Review » HP Pavilion 14-ce0004ns
HP Pavilion 14-ce0015ns: Intel Core i7-8550U, 14.00", 1.6 kg
External Review » HP Pavilion 14-ce0015ns
Acer Aspire 5 A515-51G-56UG: Intel Core i5-8250U, 15.60", 2.2 kg
External Review » Acer Aspire 5 A515-51G-56UG
Acer Aspire 5 A515-51G-8907: Intel Core i7-8550U, 15.60", 2.2 kg
External Review » Acer Aspire 5 A515-51G-8907
Acer Aspire 5 A515-51G-73QQ: Intel Core i7-7500U, 15.60", 2.2 kg
External Review » Acer Aspire 5 A515-51G-73QQ
Lenovo Flex 6-14IKB: Intel Core i5-8250U, 14.00", 1.7 kg
External Review » Lenovo Flex 6-14IKB
Acer Aspire 5 A515-51G-558H: Intel Core i5-8250U, 15.60", 2.2 kg
External Review » Acer Aspire 5 A515-51G-558H
Acer Aspire 5 A515-51G-55SC: Intel Core i5-8250U, 15.60", 2.2 kg
External Review » Acer Aspire 5 A515-51G-55SC