Notebookcheck Logo

AMD Radeon 760M

AMD Radeon 760M

The AMD Radeon 760M is an integrated GPU in the Ryzen 7040 series for laptops (Phoenix, e.g. Ryzen 5 7640HS). The iGPU is based on the new RDNA3 architecture and has 8 of the 12 CUs (= 512 shaders) clocked at up to 2.8 GHz (depending on the CPU model). As the predecessor Radeon 660M, the 760M supports hardware raytracing, although the performance is too slow to use it in current games.

Thanks to the new architecture and higher clock speeds, the Radeon 760M should be clearly faster then the old Radeon 660M.

Thanks to the modern 4nm process and clever power-saving features, the power consumption is comparatively low (according to AMD). The whole chip of the first two models can be configured between 15 - 54 Watt TDP.

AMD Radeon 700M Series

Radeon 780M compare 768 @ 1.5 - 3 GHz
Radeon 760M 512 @ 1.5 - 2.8 GHz
Radeon 740M compare 256 @ 1.5 - 2.5 GHz
CodenamePhoenix
ArchitectureRDNA 3
Pipelines512 - unified
Raytracing Cores8
Core Speed1500 - 2800 (Boost) MHz
Shared Memoryyes
APIDirectX 12_2, OpenGL 4.6, OpenCL 2.1, Vulkan 1.3
Power Consumption54 Watt (35 - 54 Watt TGP)
technology4 nm
Displays4 Displays (max.), HDMI 2.1, DisplayPort 2.1
FeaturesMiracast, FreeSync, Adaptive-Sync, UHBR10, HDR Metadata, SmartShift MAX, SmartAccess Memory, 8k60 AV1, 8k43 H.265, 4k175 H.264 De- and Encode
Date of Announcement05.01.2023
Link to Manufacturer Pagewww.amd.com
PredecessorRadeon 680M
CPU in Radeon 760MGPU Base SpeedGPU Boost / Turbo
AMD Ryzen 5 2406 x 4300 MHz, 45 W? MHz2600 MHz
AMD Ryzen 5 8645HS6 x 4300 MHz, 45 W? MHz2600 MHz
AMD Ryzen 5 8640HS6 x 3500 MHz, 28 W? MHz2600 MHz
min. - max.? MHz2600 MHz

Benchmarks

Performance Rating - 3DMark 11 + Fire Strike + Time Spy
2.5 pt (7%)
Restrict / Search: Model: Max. age: years
3DMark - 3DMark Speed Way Score
394 Points (3%)
3DMark - 3DMark Steel Nomad
min: 395     avg: 399     median: 399 (3%)     max: 403 Points
3DMark - 3DMark Wild Life Extreme Unlimited
3382 Points (4%)
3DMark - 3DMark Solar Bay
9578 Points (4%)
3DMark - 3DMark Fire Strike Standard Score
min: 5664     avg: 6051     median: 6086 (9%)     max: 6616 Points
3DMark - 3DMark Fire Strike Standard Graphics
min: 6121     avg: 6481     median: 6558 (6%)     max: 7004 Points
3DMark - 3DMark Ice Storm Graphics
min: 182718     avg: 238151     median: 241129 (27%)     max: 287628 Points
3DMark - 3DMark Time Spy Score
min: 2244     avg: 2519     median: 2541 (7%)     max: 2762 Points
3DMark - 3DMark Time Spy Graphics
min: 1997     avg: 2260     median: 2281 (5%)     max: 2495 Points
Restrict / Search: Model: Max. age: years
3DMark - 3DMark Ice Storm Unlimited Graphics
356457 Points (36%)
3DMark - 3DMark Ice Storm Extreme Graphics
171487 Points (20%)
3DMark - 3DMark Cloud Gate Score
min: 26354     avg: 28066     median: 28402 (27%)     max: 29070 Points
3DMark - 3DMark Cloud Gate Graphics
min: 39213     avg: 41042     median: 40615 (10%)     max: 42919 Points
3DMark - 3DMark Night Raid
23611 Points (22%)
3DMark - 3DMark Night Raid Graphics Score
27808 Points (11%)
3DMark 11 - 3DM11 Performance Score
min: 9564     avg: 10049     median: 9999 (12%)     max: 10487 Points
3DMark 11 - 3DM11 Performance GPU
min: 9356     avg: 9912     median: 9899 (8%)     max: 10436 Points
Restrict / Search: Model: Max. age: years
3DMark Vantage
3DM Vant. Perf. total +
3DMark Vantage - 3DM Vant. Perf. total
min: 32985     avg: 33210     median: 33210 (10%)     max: 33435 Points
3DM Vant. Perf. GPU no PhysX +
3DMark Vantage - 3DM Vant. Perf. GPU no PhysX
min: 28693     avg: 28995     median: 28995 (16%)     max: 29297 Points
Restrict / Search: Model: Max. age: years
3DMark 05 - 3DMark 05 - Standard
44915 Points (49%)
Restrict / Search: Model: Max. age: years
3DMark 06 3DMark 06 - Standard 1280x1024 +
3DMark 06
min: 34113     avg: 35295     median: 34993 (46%)     max: 37079 Points
Unigine Valley 1.0 - Unigine Valley 1.0 DX
19.5 fps (6%)
SPECviewperf 2020 specvp2020 snx-04 1080p +
SPECviewperf 2020 - specvp2020 snx-04 1080p
94.3 fps (12%)
specvp2020 medical-03 1080p +
SPECviewperf 2020 - specvp2020 medical-03 1080p
32.7 fps (9%)
specvp2020 maya-06 1080p +
SPECviewperf 2020 - specvp2020 maya-06 1080p
96.2 fps (10%)
specvp2020 energy-03 1080p +
SPECviewperf 2020 - specvp2020 energy-03 1080p
17.9 fps (3%)
specvp2020 creo-03 1080p +
SPECviewperf 2020 - specvp2020 creo-03 1080p
50.3 fps (17%)
specvp2020 catia-06 1080p +
SPECviewperf 2020 - specvp2020 catia-06 1080p
31.6 fps (15%)
specvp2020 3dsmax-07 1080p +
SPECviewperf 2020 - specvp2020 3dsmax-07 1080p
28.9 fps (8%)
specvp2020 snx-04 4k +
SPECviewperf 2020 - specvp2020 snx-04 4k
48.6 fps (5%)
specvp2020 medical-03 4k +
SPECviewperf 2020 - specvp2020 medical-03 4k
11 fps (7%)
specvp2020 maya-06 4k +
SPECviewperf 2020 - specvp2020 maya-06 4k
36.5 fps (5%)
specvp2020 energy-03 4k +
SPECviewperf 2020 - specvp2020 energy-03 4k
10.1 fps (1%)
specvp2020 creo-03 4k +
SPECviewperf 2020 - specvp2020 creo-03 4k
26.2 fps (12%)
specvp2020 catia-06 4k +
SPECviewperf 2020 - specvp2020 catia-06 4k
21.1 fps (14%)
specvp2020 3dsmax-07 4k +
SPECviewperf 2020 - specvp2020 3dsmax-07 4k
15.8 fps (5%)
Cinebench R10 Cinebench R10 Shading (32bit) +
Cinebench R10 - Cinebench R10 Shading (32bit)
min: 14191     avg: 15163     median: 15163 (11%)     max: 16135 points
Cinebench R15
Cinebench R15 OpenGL 64 Bit +
Cinebench R15 - Cinebench R15 OpenGL 64 Bit
min: 156.7     avg: 179.1     median: 187.2 (11%)     max: 199.88 fps
Cinebench R15 OpenGL Ref. Match 64 Bit +
Cinebench R15 - Cinebench R15 OpenGL Ref. Match 64 Bit
min: 97.8     avg: 97.9     median: 97.9 (98%)     max: 97.9 %
GFXBench - GFXBench 5.0 4K Aztec Ruins High Tier Offscreen
23 fps (9%)
GFXBench - GFXBench 5.0 Aztec Ruins High Tier Offscreen
48.6 fps (9%)
Restrict / Search: Model: Max. age: years
GFXBench - GFXBench 5.0 Aztec Ruins Normal Tier Offscreen
123.2 fps (9%)
Basemark GPU 1.2 - Basemark GPU 1.2 Vulkan Official Medium Offscreen 1080
min: 104.6     avg: 176.3     median: 155.8 (4%)     max: 289 fps
Geekbench 6.5 - Geekbench 6.5 GPU OpenCL
min: 6104     avg: 18836     median: 21050 (5%)     max: 23264 points
Geekbench 6.5 - Geekbench 6.5 GPU Vulkan
min: 23512     avg: 24596     median: 24990 (6%)     max: 25490 points
LuxMark v2.0 64Bit - LuxMark v2.0 Room GPU
min: 510     avg: 696     median: 696 (3%)     max: 882 Samples/s
LuxMark v2.0 64Bit - LuxMark v2.0 Sala GPU
min: 981     avg: 1279     median: 1278.5 (2%)     max: 1576 Samples/s
ComputeMark v2.1 - ComputeMark v2.1 Result
min: 6520     avg: 6721     median: 6721 (6%)     max: 6922 points
Power Consumption - Furmark Stress Test Power Consumption - external Monitor *
min: 42.1     avg: 56.6     median: 56.4 (8%)     max: 71.7 Watt
0510152025303540455055606570Tooltip
Power Consumption - The Witcher 3 Power Consumption - external Monitor *
55.5 Watt (8%)
0510152025303540455055Tooltip
Power Consumption - Witcher 3 Power Consumption *
58.2 Watt (13%)
051015202530354045505560Tooltip
Power Consumption - Power Efficiency - Witcher 3 ultra
0.4 fps per Watt (36%)
Power Consumption - Power Efficiency - Witcher 3 ultra external Monitor
0.4 fps per Watt (35%)
Power Consumption - Cyberpunk 2077 Power Consumption 150cd *
min: 44.4     avg: 49.9     median: 49.9 (14%)     max: 55.4 Watt
0510152025303540455055Tooltip
Power Consumption - Cyberpunk 2077 Power Consumption - external Monitor *
min: 42.8     avg: 55.3     median: 52.7 (7%)     max: 70.5 Watt
0510152025303540455055606570Tooltip
Power Consumption - Power Efficiency - Cyberpunk 2077 ultra
min: 0.2482     avg: 0.3     median: 0.3 (1%)     max: 0.3055 fps per Watt
Emissions Witcher 3 Fan Noise +
Emissions - Witcher 3 Fan Noise
min: 39     avg: 42     median: 42 (60%)     max: 45 dB(A)
- Range of benchmark values
red legend - Average benchmark values
* Smaller numbers mean a higher performance

Game Benchmarks

The following benchmarks stem from our benchmarks of review laptops. The performance depends on the used graphics memory, clock rate, processor, system settings, drivers, and operating systems. So the results don't have to be representative for all laptops with this GPU. For detailed information on the benchmark results, click on the fps number.

low 1920x1080
62.6 72.9 ~ 68 fps    + Compare + 📈 Graph
med. 1920x1080
34.8 42.7 ~ 39 fps    + Compare + 📈 Graph
high 1920x1080
14.5 22.9 ~ 19 fps    + Compare + 📈 Graph
» With most tested laptops playable in detail settings med..
low 1920x1080
17.4 26.9 ~ 22 fps    + Compare + 📈 Graph
med. 1920x1080
13.2 20.4 ~ 17 fps    + Compare + 📈 Graph
high 1920x1080
10.9 17.1 ~ 14 fps    + Compare + 📈 Graph
» The benchmarks indicate that the game is not playable in the tested settings.
low 1920x1080
16.6 18.2 ~ 17 fps    + Compare + 📈 Graph
high 1920x1080
0 (!) 0 (!) ~ 0 fps    + Compare
» The benchmarks indicate that the game is not playable in the tested settings.
Stalker 2

Stalker 2

2024
low 1920x1080
14.3 14.8 ~ 15 fps    + Compare + 📈 Graph
med. 1920x1080
11 11.7 ~ 11 fps    + Compare + 📈 Graph
high 1920x1080
8.2 10.8 ~ 9 fps    + Compare + 📈 Graph
» The benchmarks indicate that the game is not playable in the tested settings.
low 1920x1080
36 38 ~ 37 fps    + Compare
med. 1920x1080
33 34 ~ 34 fps    + Compare
high 1920x1080
20 22 ~ 21 fps    + Compare
» With all tested laptops playable in detail settings low.
low 1920x1080
26.7  fps    + Compare + 📈 Graph
med. 1920x1080
16.5  fps    + Compare + 📈 Graph
high 1920x1080
11  fps    + Compare + 📈 Graph
» The benchmarks indicate that the game is not playable in the tested settings.
low 1920x1080
0 (!)  fps    + Compare
med. 1920x1080
0 (!)  fps    + Compare
high 1920x1080
0 (!)  fps    + Compare
low 1920x1080
14.3  fps    + Compare + 📈 Graph
med. 1920x1080
10.6  fps    + Compare + 📈 Graph
high 1920x1080
10.1  fps    + Compare + 📈 Graph
» The benchmarks indicate that the game is not playable in the tested settings.
low 1920x1080 cinem.
7.2  fps    + Compare + 📈 Graph
med. 1920x1080 cinem.
5.7  fps    + Compare + 📈 Graph
high 1920x1080 cinem.
4.5  fps    + Compare + 📈 Graph
» The benchmarks indicate that the game is not playable in the tested settings.
low 1920x1080
20  fps    + Compare
med. 1920x1080
15  fps    + Compare
» The benchmarks indicate that the game is not playable in the tested settings.
Additional Benchmarks
low TSR 100 1280x720
35
low FSR 68 1280x720
51
low 1920x1080
27.1  fps    + Compare + 📈 Graph
med. 1920x1080
19.9  fps    + Compare + 📈 Graph
high 1920x1080
14.9  fps    + Compare + 📈 Graph
ultra 1920x1080
14.2  fps    + Compare + 📈 Graph
» The benchmarks indicate that the game is not playable in the tested settings.
Additional Benchmarks
Very Low Preset 1280x720
64.1
low 1920x1080
36.6  fps    + Compare + 📈 Graph
med. 1920x1080
23.1  fps    + Compare + 📈 Graph
high 1920x1080
19  fps    + Compare + 📈 Graph
ultra 1920x1080
15.4  fps    + Compare + 📈 Graph
» With all tested laptops playable in detail settings low.
Additional Benchmarks
Low Preset 1280x720
67
F1 24

F1 24

2024
low 1920x1080
58 66.1 ~ 62 fps    + Compare
med. 1920x1080
50.4 58.1 ~ 54 fps    + Compare
high 1920x1080
38.5 43.4 ~ 41 fps    + Compare
ultra 1920x1080
10.4  fps    + Compare
» With all tested laptops playable in detail settings high.
low 1920x1080
25.5  fps    + Compare + 📈 Graph
med. 1920x1080
15.8  fps    + Compare + 📈 Graph
» The benchmarks indicate that the game is not playable in the tested settings.
Additional Benchmarks
Low Preset 1280x720
25.7
low 1920x1080
43.6  fps    + Compare + 📈 Graph
med. 1920x1080
38.4  fps    + Compare + 📈 Graph
high 1920x1080
30.5  fps    + Compare + 📈 Graph
ultra 1920x1080
28.5  fps    + Compare + 📈 Graph
QHD 2560x1440
22.7  fps    + Compare + 📈 Graph
» With all tested laptops playable in detail settings med..
low 1920x1080
23.8  fps    + Compare + 📈 Graph
med. 1920x1080
20.6  fps    + Compare + 📈 Graph
high 1920x1080
15.4  fps    + Compare + 📈 Graph
ultra 1920x1080
14.7  fps    + Compare + 📈 Graph
» The benchmarks indicate that the game is not playable in the tested settings.
Additional Benchmarks
Very Low Preset 1280x720
42.1
low 1920x1080
13.3  fps    + Compare + 📈 Graph
high 1920x1080
10.5  fps    + Compare + 📈 Graph
» The benchmarks indicate that the game is not playable in the tested settings.
low 1920x1080
45.2  fps    + Compare + 📈 Graph
med. 1920x1080
35.3  fps    + Compare + 📈 Graph
high 1920x1080
28.8  fps    + Compare + 📈 Graph
ultra 1920x1080
21.5  fps    + Compare + 📈 Graph
QHD 2560x1440
15.3  fps    + Compare + 📈 Graph
» With all tested laptops playable in detail settings med..
Additional Benchmarks
Very Low Preset 1280x720
91.6
low 1920x1080
28.1  fps    + Compare + 📈 Graph
med. 1920x1080
21.6  fps    + Compare + 📈 Graph
high 1920x1080
19.2  fps    + Compare + 📈 Graph
ultra 1920x1080
18.4  fps    + Compare + 📈 Graph
» The benchmarks indicate that the game is not playable in the tested settings.
Additional Benchmarks
Low Preset 1280x720
48.9
low 1920x1080
16.2  fps    + Compare + 📈 Graph
med. 1920x1080
14.9  fps    + Compare + 📈 Graph
high 1920x1080
12.9  fps    + Compare + 📈 Graph
ultra 1920x1080
9.5  fps    + Compare + 📈 Graph
» The benchmarks indicate that the game is not playable in the tested settings.
Additional Benchmarks
Max. Performance 1280x720
35.9
Palworld

Palworld

2024
low 1920x1080
47.9  fps    + Compare + 📈 Graph
med. 1920x1080
36.7  fps    + Compare + 📈 Graph
high 1920x1080
23.6  fps    + Compare + 📈 Graph
ultra 1920x1080
20.9  fps    + Compare + 📈 Graph
» With all tested laptops playable in detail settings med..
Additional Benchmarks
Very Low Preset 1280x720
66.3
med. 1920x1080
135.7  fps    + Compare + 📈 Graph
high 1920x1080
102.5  fps    + Compare + 📈 Graph
ultra 1920x1080
96.8  fps    + Compare + 📈 Graph
» With all tested laptops playable in detail settings ultra.
low 1920x1080
54.2  fps    + Compare + 📈 Graph
med. 1920x1080
38.8  fps    + Compare + 📈 Graph
high 1920x1080
35.4  fps    + Compare + 📈 Graph
ultra 1920x1080
24.8  fps    + Compare + 📈 Graph
QHD 2560x1440
13.2  fps    + Compare + 📈 Graph
» With all tested laptops playable in detail settings high.
Additional Benchmarks
Low Preset 1280x720
105.5
low 1920x1080
48  fps    + Compare
med. 1920x1080
43  fps    + Compare
high 1920x1080
32  fps    + Compare
ultra 1920x1080
27  fps    + Compare
» With all tested laptops playable in detail settings med..
Additional Benchmarks
Minimum Preset 1280x720
88
low 1920x1080
28.9  fps    + Compare + 📈 Graph
med. 1920x1080
19.8  fps    + Compare + 📈 Graph
high 1920x1080
16.8  fps    + Compare + 📈 Graph
ultra 1920x1080
15.4  fps    + Compare + 📈 Graph
» The benchmarks indicate that the game is not playable in the tested settings.
Additional Benchmarks
Ultra Low Preset LowAA 1280x720
74.7
low 1920x1080
16.4  fps    + Compare + 📈 Graph
med. 1920x1080
13.7  fps    + Compare + 📈 Graph
» The benchmarks indicate that the game is not playable in the tested settings.
Additional Benchmarks
Low Preset 1280x720
25.9
low 1920x1080
77.8  fps    + Compare
med. 1920x1080
62  fps    + Compare
high 1920x1080
47.4  fps    + Compare
ultra 1920x1080
42.9  fps    + Compare
QHD 2560x1440
24.1  fps    + Compare
» With all tested laptops playable in detail settings ultra.
ultra 1920x1080
47.9  fps    + Compare + 📈 Graph
» With all tested laptops playable in detail settings ultra.
low 1920x1080
104.9  fps    + Compare + 📈 Graph
med. 1920x1080
77.4  fps    + Compare + 📈 Graph
high 1920x1080
39.4  fps    + Compare + 📈 Graph
ultra 1920x1080
26.2  fps    + Compare + 📈 Graph
QHD 2560x1440
15.7  fps    + Compare + 📈 Graph
» With all tested laptops playable in detail settings high.
Additional Benchmarks
Low Preset 1280x720
117.9
low 1920x1080
28.9 29.7 32.9 33.2 ~ 31 fps    + Compare
med. 1920x1080
22.3 22.8 23.9 26 ~ 24 fps    + Compare
high 1920x1080
17.8 19.1 20.5 20.9 ~ 20 fps    + Compare
ultra 1920x1080
16.2 17.7 18 18.1 ~ 18 fps    + Compare
» The benchmarks indicate that the game is not playable in the tested settings.
Additional Benchmarks
Low Preset (FSR off) 1280x720
53.8
55
30min Start Ultra Preset (FSR off) 1920x1080
13
16.1
17.5
low 1920x1080
27.2 29.5 29.5 31.8 ~ 30 fps    + Compare + 📈 Graph
med. 1920x1080
22.6 23.7 24.2 25 ~ 24 fps    + Compare + 📈 Graph
high 1920x1080
18.3 19.1 19.8 20 ~ 19 fps    + Compare + 📈 Graph
ultra 1920x1080
16.3 18.9 19.6 ~ 18 fps    + Compare + 📈 Graph
» The benchmarks indicate that the game is not playable in the tested settings.
Additional Benchmarks
Low Preset SMAA 1280x720
52.1
Lies of P

Lies of P

2023
low 1920x1080
33.7  fps    + Compare + 📈 Graph
med. 1920x1080
27.9  fps    + Compare + 📈 Graph
high 1920x1080
24  fps    + Compare + 📈 Graph
» The benchmarks indicate that the game is not playable in the tested settings.
low 1920x1080
25  fps    + Compare
med. 1920x1080
23  fps    + Compare
high 1920x1080
19  fps    + Compare
» The benchmarks indicate that the game is not playable in the tested settings.
Starfield

Starfield

2023
low 1920x1080
14.3  fps    + Compare + 📈 Graph
med. 1920x1080
8  fps    + Compare + 📈 Graph
high 1920x1080
5  fps    + Compare + 📈 Graph
» The benchmarks indicate that the game is not playable in the tested settings.
low 1920x1080
0 (!) 40.7 ~ 20 fps    + Compare + 📈 Graph
med. 1920x1080
0 (!) 32.1 ~ 16 fps    + Compare + 📈 Graph
high 1920x1080
0 (!) 28.3 ~ 14 fps    + Compare + 📈 Graph
ultra 1920x1080
23  fps    + Compare + 📈 Graph
QHD 2560x1440
15.8  fps    + Compare + 📈 Graph
» With all tested laptops playable in detail settings low.
Additional Benchmarks
Low Preset 1280x720
62.3
low 1920x1080
15.4  fps    + Compare + 📈 Graph
high 1920x1080
13.3  fps    + Compare + 📈 Graph
» The benchmarks indicate that the game is not playable in the tested settings.
low 1920x1080
31.1  fps    + Compare + 📈 Graph
med. 1920x1080
29.2  fps    + Compare + 📈 Graph
high 1920x1080
24.2  fps    + Compare + 📈 Graph
» The benchmarks indicate that the game is not playable in the tested settings.
low 1920x1080
20.5  fps    + Compare + 📈 Graph
med. 1920x1080
0 (!)  fps    + Compare
high 1920x1080
0 (!)  fps    + Compare
» The benchmarks indicate that the game is not playable in the tested settings.
F1 23

F1 23

2023
low 1920x1080
71.6  fps    + Compare
med. 1920x1080
63.6  fps    + Compare
high 1920x1080
45.5  fps    + Compare
» With all tested laptops playable in detail settings high.
Additional Benchmarks
Ultra Low Preset TAA 1280x720
123.1
low 1920x1080
0 (!) 16.2 ~ 8 fps    + Compare + 📈 Graph
med. 1920x1080
0 (!) 13.9 ~ 7 fps    + Compare + 📈 Graph
high 1920x1080
0 (!) 13.1 ~ 7 fps    + Compare + 📈 Graph
» The benchmarks indicate that the game is not playable in the tested settings.
Additional Benchmarks
Low Preset 1280x720
29.6
low 1920x1080
23.5  fps    + Compare + 📈 Graph
med. 1920x1080
16.8  fps    + Compare + 📈 Graph
high 1920x1080
14.6  fps    + Compare + 📈 Graph
» The benchmarks indicate that the game is not playable in the tested settings.
low 1920x1080
46.4  fps    + Compare
med. 1920x1080
38.9  fps    + Compare
high 1920x1080
29.6  fps    + Compare
» With all tested laptops playable in detail settings med..
low 1920x1080
32  fps    + Compare + 📈 Graph
med. 1920x1080
19.6  fps    + Compare + 📈 Graph
high 1920x1080
19  fps    + Compare + 📈 Graph
» The benchmarks indicate that the game is not playable in the tested settings.
low 1920x1080
38.6  fps    + Compare + 📈 Graph
med. 1920x1080
28.8  fps    + Compare + 📈 Graph
high 1920x1080
16.7  fps    + Compare + 📈 Graph
» With all tested laptops playable in detail settings low.
Returnal

Returnal

2023
low 1920x1080
20  fps    + Compare
med. 1920x1080
19  fps    + Compare
high 1920x1080
17  fps    + Compare
» The benchmarks indicate that the game is not playable in the tested settings.
low 1920x1080
25.8  fps    + Compare + 📈 Graph
med. 1920x1080
19.8  fps    + Compare + 📈 Graph
high 1920x1080
15.2  fps    + Compare + 📈 Graph
» The benchmarks indicate that the game is not playable in the tested settings.
low 1920x1080
20.7  fps    + Compare + 📈 Graph
med. 1920x1080
19.7  fps    + Compare + 📈 Graph
high 1920x1080
16.2  fps    + Compare + 📈 Graph
ultra 1920x1080
16.1  fps    + Compare + 📈 Graph
» The benchmarks indicate that the game is not playable in the tested settings.
Additional Benchmarks
Low Preset TAA 1280x720
35.5
low 1920x1080
45.2 48.2 ~ 47 fps    + Compare + 📈 Graph
med. 1920x1080
35.3 37.3 ~ 36 fps    + Compare + 📈 Graph
high 1920x1080
15 30.3 ~ 23 fps    + Compare + 📈 Graph
ultra 1920x1080
25.6  fps    + Compare + 📈 Graph
» With all tested laptops playable in detail settings med..
Additional Benchmarks
Low Preset / Off 1280x720
86
82
low 1920x1080
50.6  fps    + Compare + 📈 Graph
med. 1920x1080
28.8  fps    + Compare + 📈 Graph
high 1920x1080
23.5  fps    + Compare + 📈 Graph
» With all tested laptops playable in detail settings low.
low 1920x1080
18.8  fps    + Compare + 📈 Graph
med. 1920x1080
15.7  fps    + Compare + 📈 Graph
high 1920x1080
13.7  fps    + Compare + 📈 Graph
» The benchmarks indicate that the game is not playable in the tested settings.
F1 22

F1 22

2022
low 1920x1080
75.9  fps    + Compare
med. 1920x1080
66.5  fps    + Compare
high 1920x1080
49  fps    + Compare
» With all tested laptops playable in detail settings high.
Additional Benchmarks
Ultra Low Preset 16xAF TAA 1280x720
132.2
low 1920x1080
30  fps    + Compare
med. 1920x1080
24  fps    + Compare
high 1920x1080
18  fps    + Compare
» The benchmarks indicate that the game is not playable in the tested settings.
F1 2021

F1 2021

2021
low 1280x720
172.1  fps    + Compare
med. 1920x1080
82.5  fps    + Compare
high 1920x1080
61.6  fps    + Compare
ultra 1920x1080
26.1  fps    + Compare
» With all tested laptops playable in detail settings high.
Strange Brigade

Strange Brigade

2018
low 1280x720
121 133.3 135.9 139.4 140.1 ~ 134 fps    + Compare
med. 1920x1080
50.2 52.6 55.2 55.2 57.4 ~ 54 fps    + Compare
high 1920x1080
42.8 44.4 45.1 46.2 47.5 ~ 45 fps    + Compare
ultra 1920x1080
35.8 37.8 38 38.4 39.6 ~ 38 fps    + Compare
» With all tested laptops playable in detail settings ultra.
Far Cry 5

Far Cry 5

2018
low 1280x720
74  fps    + Compare
med. 1920x1080
38  fps    + Compare
high 1920x1080
35  fps    + Compare
ultra 1920x1080
33  fps    + Compare
» With all tested laptops playable in detail settings med..
low 1280x720
41.4 44.6 45.1 48.8 54.2 ~ 47 fps    + Compare
med. 1920x1080
29.9 31.5 33.1 36.7 38.9 ~ 34 fps    + Compare
high 1920x1080
25.6 27.3 27.7 29.8 33.5 ~ 29 fps    + Compare
» With all tested laptops playable in detail settings low.
low 1280x720
55.3 61.1 61.7 66.3 69.9 ~ 63 fps    + Compare
med. 1920x1080
27.5 28.7 30.9 32.3 32.7 ~ 30 fps    + Compare
high 1920x1080
21.1 21.2 22.7 23.6 24.1 ~ 23 fps    + Compare
» With all tested laptops playable in detail settings low.
low 1280x720
122.6 127.6 143.7 151.6 160.8 ~ 141 fps    + Compare
med. 1366x768
105.3 105.4 106.4 110.9 113.4 ~ 108 fps    + Compare
high 1920x1080
41.2 70.2 75.1 79.9 90.3 ~ 71 fps    + Compare
ultra 1920x1080
39 64.8 68.2 72.4 75.1 ~ 64 fps    + Compare
» With all tested laptops playable in detail settings ultra.
low 1024x768
115 123 127.3 ~ 122 fps    + Compare + 📈 Graph
med. 1366x768
73.9 78 78.4 ~ 77 fps    + Compare + 📈 Graph
high 1920x1080
34.9 38 39.9 ~ 38 fps    + Compare + 📈 Graph
ultra 1920x1080
23 23.3 25.4 ~ 24 fps    + Compare + 📈 Graph
» With most tested laptops playable in detail settings high.
Additional Benchmarks
Medium Graphics & Postprocessing 1920x1080
48.2
GTA V

GTA V

2015
low 1024x768
126.9 141 147.6 150.4 157 ~ 145 fps    + Compare
med. 1366x768
122.7 126.2 133.8 138.4 144.5 ~ 133 fps    + Compare
high 1920x1080
50.2 50.5 52.7 54.8 57.3 ~ 53 fps    + Compare
ultra 1920x1080
17.3 18.1 18.3 22.6 23.2 ~ 20 fps    + Compare
» With all tested laptops playable in detail settings high.
Additional Benchmarks
Normal/Off 4xAF 1920x1080
101.2
115.9
Lowest Settings possible 1920x1080
103.7
113.4
lowmed.highultraQHD4K
Civilization 7683919
Kingdom Come Deliverance 2221714
Indiana Jones and the Great Circle170
Stalker 215119
Call of Duty Black Ops 6373421
Until Dawn26.716.511
Final Fantasy XVI0
Space Marine 214.310.610.1
Star Wars Outlaws7.155.714.5
Black Myth: Wukong2015
Once Human27.119.914.914.2
The First Descendant36.623.11915.4
F1 2462544110.4
Senua's Saga Hellblade 225.515.8
Ghost of Tsushima43.638.430.528.522.7
Horizon Forbidden West23.820.615.414.7
Dragon's Dogma 213.310.5
Last Epoch45.235.328.821.515.3
Helldivers 228.121.619.218.4
Enshrouded16.214.912.99.48
Palworld47.936.723.620.9
Prince of Persia The Lost Crown135.7102.596.8
The Finals54.238.835.424.813.2
Call of Duty Modern Warfare 3 202348433227
EA Sports WRC28.919.816.815.4
Alan Wake 216.413.7
Total War Pharaoh77.86247.442.924.1
EA Sports FC 2447.9
Counter-Strike 2104.977.439.426.215.7
Cyberpunk 2077 2.2 Phantom Liberty31242018
Baldur's Gate 330241918
Lies of P33.727.924
The Crew Motorfest252319
Starfield14.37.995.04
Armored Core 62016142315.8
Immortals of Aveum15.413.3
Atlas Fallen31.129.224.2
Ratchet & Clank Rift Apart20.5
F1 2371.663.645.5
Star Wars Jedi Survivor877
Resident Evil 4 Remake23.516.814.6
Company of Heroes 346.438.929.6
Sons of the Forest3219.619
Atomic Heart38.628.816.7
Returnal201917
Hogwarts Legacy25.819.815.2
Dead Space Remake20.719.716.216.1
The Witcher 3 v447362325.6
High On Life50.628.823.5
A Plague Tale Requiem18.815.713.7
F1 2275.966.549
Cyberpunk 2077 1.6302418
F1 2021172.182.561.626.1
Strange Brigade134544538
Far Cry 574383533
X-Plane 11.11473429
Final Fantasy XV Benchmark633023
Dota 2 Reborn1411087164
The Witcher 3122773824
GTA V1451335320
lowmed.highultraQHD4K
< 30 fps
< 60 fps
< 120 fps
≥ 120 fps
26
18
8
5
31
14
7
2
38
12
3
21
4
2
6


For more games that might be playable and a list of all games and graphics cards visit our Gaming List

Add one or more devices and compare

In the following list you can select (and also search for) devices that should be added to the comparison. You can select more than one device.

search for model:
v1.34
log 12. 13:04:31

#0 ran 0s before starting gpusingle class +0s ... 0s

#1 no ids found in url (should be separated by "_") +0s ... 0s

#2 not redirecting to Ajax server +0s ... 0s

#3 did not recreate cache, as it is less than 5 days old! Created at Fri, 10 Oct 2025 05:38:03 +0200 +0.001s ... 0.001s

#4 composed specs +0.032s ... 0.033s

#5 did output specs +0s ... 0.033s

#6 start showIntegratedCPUs +0s ... 0.033s

#7 getting avg benchmarks for device 11566 +0.032s ... 0.065s

#8 got single benchmarks 11566 +0.029s ... 0.093s

#9 got avg benchmarks for devices +0s ... 0.093s

#10 min, max, avg, median took s +1.048s ... 1.141s

#11 before gaming benchmark output +0s ... 1.141s

#12 Got 332 rows for game benchmarks. +0.044s ... 1.186s

#13 composed SQL query for gamebenchmarks +0s ... 1.186s

#14 got data and put it in $dataArray +0.039s ... 1.225s

#15 benchmarks composed for output. +0.456s ... 1.681s

#16 return log +0.005s ... 1.686s

Notebook reviews with AMD Radeon 760M graphics card

GMKtec NucBox M6 Ultra

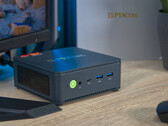
Mini PC at a great price with AMD Ryzen power and USB4 versatility - GMKtec NucBox M6 Ultra review

The GMKtec NucBox M6 Ultra combines the AMD Ryzen 5 7640HS with a compact, sleek case and extensive connectivity. Of particular interest is the question of how ...
AMD Ryzen 5 7640HS | AMD Radeon 760M | 506 g
Lenovo Yoga 7 2-in-1 laptop review: Sleek 14-inch convertible with an OLED screen

Lenovo Yoga 7 2-in-1 laptop review: Sleek 14-inch convertible with an OLED screen

During our test, the Yoga 7 2-in-1 14 with a Ryzen 5 8640HS had to face its brother based on the Core Ultra 5 125U. Read our review to find out whether there ar...
AMD Ryzen 5 8640HS | AMD Radeon 760M | 14.00" | 1.5 kg
Acer Swift Edge 16 review: A lightweight 16-inch laptop with an OLED display

Acer Swift Edge 16 review: A lightweight 16-inch laptop with an OLED display

Traditionally, 16-inch laptops are only partly intended to be used as portable companions for frequent trips or traveling. Acer's Swift Edge 16 shows, however, ...
AMD Ryzen 5 8640U | AMD Radeon 760M | 16.00" | 1.2 kg
HP ZBook Firefly 14 G10 A in review: Strong office notebook that relies on Zen 4

HP ZBook Firefly 14 G10 A in review: Strong office notebook that relies on Zen 4

While some notebooks from HP feel more like plastic bombers, the ZBook Firefly looks pretty high-end. We tested the current 14-inch AMD-based G10 A variant and ...
AMD Ryzen 5 PRO 7640HS | AMD Radeon 760M | 14.00" | 1.5 kg
Testing the performance of AMD Radeon 780M & 760M iGPUs with new drivers

Testing the performance of AMD Radeon 780M & 760M iGPUs with new drivers

Nearly three months after we initially reviewed the new integrated Radeon 780M, AMD has now finally released official drivers for the GPU. We are thus taking an...
AMD Ryzen 5 7640HS | AMD Radeon 760M | 15.60" | 2.5 kg

HP Pavilion Aero 13-bg: AMD Ryzen 5 8640U, 13.30", 1 kg
  External Review » HP Pavilion Aero 13-bg

HP EliteBook 635 Aero G11: AMD Ryzen 5 8640U, 13.30", 1 kg
  External Review » HP EliteBook 635 Aero G11

Lenovo Yoga 7 16AHP9: AMD Ryzen 5 8640HS, 14.00", 1.5 kg
  External Review » Lenovo Yoga 7 16AHP9

Lenovo IdeaPad Slim 5 14AHP9: AMD Ryzen 5 8645HS, 14.00", 1.5 kg
  External Review » Lenovo IdeaPad Slim 5 14AHP9

Lenovo IdeaPad Slim 5 16AHP9: AMD Ryzen 5 8645HS, 16.00", 1.8 kg
  External Review » Lenovo IdeaPad Slim 5 16AHP9

Acer Swift Go 14 SFG14-63: AMD Ryzen 5 8645HS, 14.00", 1.3 kg
  External Review » Acer Swift Go 14 SFG14-63

Lenovo IdeaPad 5 2-in-1 14AHP9: AMD Ryzen 5 8645HS, 14.00", 1.6 kg
  External Review » Lenovo IdeaPad 5 2-in-1 14AHP9

Lenovo Yoga 7 14APH9: AMD Ryzen 5 8640HS, 14.00", 1.5 kg
  External Review » Lenovo Yoga 7 14APH9

Lenovo IdeaPad 5 14AHP9: AMD Ryzen 5 8645HS, 14.00", 1.5 kg
  External Review » Lenovo IdeaPad 5 14AHP9

HP ZBook Firefly 14 G10 A: AMD Ryzen 5 PRO 7640HS, 14.00", 1.5 kg
  External Review » HP ZBook Firefly 14 G10 A

Lenovo LOQ 15APH8 Ryzen 5: AMD Ryzen 5 7640HS, 15.60", 2.5 kg
  External Review » Lenovo LOQ 15APH8 Ryzen 5

GMK NucBox M6 Ultra: AMD Ryzen 5 7640HS, 0.5 kg
   » Best value for money? GMKtec NucBox M6 Ultra mini PC with AMD Ryzen APU and USB4 review

Lenovo LOQ 15APH8 Ryzen 5: AMD Ryzen 5 7640HS, 15.60", 2.5 kg
   » Lenovo LOQ 15 with RTX 4070 is now going for cheaper than many RTX 4060 laptops

Please share our article, every link counts!
Mail Logo

» Comparison of GPUs
Detailed list of all laptop GPUs sorted by class and performance.

» Benchmark List
Sort and restrict laptop GPUs based on performance in synthetic benchmarks.

» Notebook Gaming List
Playable games for each graphics card and their average FPS results.

Class 1

Class 2

Radeon PRO W6600M *

Class 3

Arc Graphics 3-core (Arrow Lake) *
Arc Graphics 2-core (Arrow Lake) *
UHD Graphics 32EUs
UHD Graphics 750

Class 4

* Approximate position of the graphics adapter

Klaus Hinum (Update: 2023-01-11)