Notebook reviews with Intel HD Graphics 505 graphics card
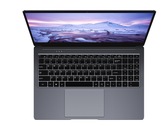
A 4K Laptop For $440: Chuwi LapBook Plus Review
It's got the looks of a $1000 Ultrabook but with the performance of a $100 netbook. There's a good reason why you don't see many Intel Atom laptops with 4K UHD displays in the market; they are an imbalanced pairing.
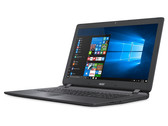
Intel Atom x7-E3950, HD Graphics 505, 15.6", 1.5 kgAcer Aspire ES 17 ES1-732 (N4200, 1 TB HDD, HD+) Laptop Review
Acer's new budget 17.3-inch laptop features an Apollo Lake processor, plenty of storage and a decent keyboard. In short, the Aspire ES 17 ES1-732 is a simple office laptop that is suited for home use.
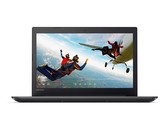
Intel Pentium N4200, HD Graphics 505, 17.3", 2.8 kgLenovo IdeaPad 320 (128-GB SSD, FHD) Review
Almost free. In a world of smartphones and tablets we may often wonder whether we actually still need a notebook. Lenovo's answer to that question is the IdeaPad 320. It is available for an impressively low $300 and is supposed to support web-browsing and office applications.
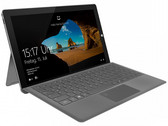
Intel Pentium N4200, HD Graphics 505, 15.6", 1.9 kgTrekstor Primetab T13B (N4200, HD505) Convertible Review
The Primetab T13B, a 2-in-1 tablet with an attachable keyboard cover, is Trekstor's latest contribution to the tablet market. At less than 400 Euros (~$460), the price is already a strong argument in favor of the Windows tablet. Curious what else the Trekstor device has to offer? Our review tells all.
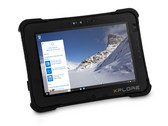
Intel Pentium N4200, HD Graphics 505, 13.3", 1.5 kgXplore Technologies XSLATE L10 (Pentium N4200, FHD) Tablet Review
Modern and rugged. A hardened tablet with all the amenities one would expect from a consumer tablet and more. The Xplore XSLATE L10 runs on the same processor as the latest Ultrabooks with NFC, 4G LTE, and even a removable battery and a full-size HDMI port.
Intel Pentium N4200, HD Graphics 505, 10.1", 1.3 kgAsus VivoBook Flip 14 TP401NA: Intel Pentium N4200, 14.00", 1.5 kg
Review » Asus VivoBook Flip 14 TP401NA (N4200, FHD) Convertible Review
Acer TravelMate Spin B1 118-RN-P6BE: Intel Pentium N4200, 11.60", 1.5 kg
Review » Acer TravelMate Spin B1 Convertible Review
HP ProBook x360 11 G1 EE Z3A47EA: Intel Pentium N4200, 11.60", 1.5 kg
Review » HP ProBook x360 11 G1 (Pentium N4200, 256 GB) Convertible Review
Acer Switch 3 SW312-31-P5VG: Intel Pentium N4200, 12.20", 0.9 kg
Review » Acer Switch 3 SW312 (Pentium N4200) Convertible Review
Asus VivoBook Flip 12 TP203NAH-BP049T: Intel Pentium N4200, 11.60", 1.3 kg
Review » Asus VivoBook Flip 12 TP203NAH (N4200, HD) Laptop Review
Dell Latitude 3189: Intel Pentium N4200, 11.60", 1.4 kg
Review » Dell Latitude 3189 (N4200, HD) Convertible Review
Dell Latitude 3180: Intel Pentium N4200, 11.60", 1.6 kg
Review » Dell Latitude 3180 (N4200, HD) Laptop Review
Acer Aspire ES1-533-P7WA: Intel Pentium N4200, 15.60", 2.4 kg
Review » Acer Aspire ES1-533-P7WA Notebook Review
Acer Aspire ES1-332-P91H: Intel Pentium N4200, 13.30", 1.5 kg
Review » Acer Aspire ES1-332-P91H Notebook Review
Asus Chromebook C423NA-EB0243: Intel Pentium N4200, 14.00", 1.2 kg
External Review » Asus Chromebook C423NA-EB0243
Acer Chromebook 514 CB514-1HT-P1BM: Intel Pentium N4200, 14.00", 1.4 kg
External Review » Acer Chromebook 514 CB514-1HT-P1BM
Asus Chromebook Z1500CN-EJ0165: Intel Pentium N4200, 15.60", 1.5 kg
External Review » Asus Chromebook Z1500CN-EJ0165
Asus Chromebook Z1400CN-BV0305: Intel Pentium N4200, 14.00", 1.2 kg
External Review » Asus Chromebook Z1400CN-BV0305
Chuwi LapBook Plus: Intel Atom x7-E3950, 15.60", 1.5 kg
External Review » Chuwi LapBook Plus
Acer Chromebook 14 CB514-1HT-P2D1: Intel Pentium N4200, 14.00", 1.4 kg
External Review » Acer Chromebook 14 CB514-1HT-P2D1
Acer Chromebook 14 CB514-1HT-P1BM: Intel Pentium N4200, 14.00", 1.4 kg
External Review » Acer Chromebook 14 CB514-1HT-P1BM
Trekstor Surfbook A13-P: Intel Pentium N4200, 13.30", 1.2 kg
External Review » Trekstor Surfbook A13-P
Acer Aspire ES1-732-P7YA: Intel Pentium N4200, 17.30", 2.8 kg
External Review » Acer Aspire ES1-732-P7YA
Acer Chromebook Spin 15 CP315-1H: Intel Pentium N4200, 15.60", 1.7 kg
External Review » Acer Chromebook Spin 15 CP315-1H
Acer Chromebook C523NA-IH24T: Intel Pentium N4200, 15.60", 1.4 kg
External Review » Acer Chromebook C523NA-IH24T
Acer Spin 1 SP111-32N-P1PR: Intel Pentium N4200, 11.60", 1.3 kg
External Review » Acer Spin 1 SP111-32N-P1PR
Lenovo IdeaPad 120S-14IAP-81A500EDGE: Intel Pentium N4200, 14.00", 1.4 kg
External Review » Lenovo IdeaPad 120S-14IAP-81A500EDGE
Trekstor Primebook P14B: Intel Pentium N4200, 14.10", 1.4 kg
External Review » Trekstor Primebook P14B
Asus VivoBook Flip 14 TP401NA: Intel Pentium N4200, 14.00", 1.5 kg
External Review » Asus VivoBook Flip 14 TP401NA
Acer Chromebook Spin 15 CP315-1H-P75Z: Intel Pentium N4200, 15.60", 2.1 kg
External Review » Acer Chromebook Spin 15 CP315-1H-P75Z
Acer Chromebook 15 CB515-1HT-P099: Intel Pentium N4200, 15.60", 2 kg
External Review » Acer Chromebook 15 CB515-1HT-P099
Acer Chromebook Spin 15 CP315-1H-P1K8: Intel Pentium N4200, 15.60", 2.2 kg
External Review » Acer Chromebook Spin 15 CP315-1H-P1K8
Asus X540NA-GQ151T: Intel Pentium N4200, 15.60", 2 kg
External Review » Asus X540NA-GQ151T
Acer Aspire ES1-533-P5MS: Intel Pentium N4200, 15.60", 2.4 kg
External Review » Acer Aspire ES1-533-P5MS
Acer Aspire 3 A315-31-P3ZM: Intel Pentium N4200, 15.60", 2.4 kg
External Review » Acer Aspire 3 A315-31-P3ZM
Lenovo Ideapad 320-15IAP-80XR0094GE: Intel Pentium N4200, 15.60", 2.2 kg
External Review » Lenovo Ideapad 320-15IAP-80XR0094GE
Acer Switch 3 SW312-31-P7SF: Intel Pentium N4200, 12.20", 0.9 kg
External Review » Acer Switch 3 SW312-31-P7SF
Acer Chromebook 15 CB515-1HT-P80X: Intel Pentium N4200, 15.60", 1.8 kg
External Review » Acer Chromebook 15 CB515-1HT-P80X
Acer Swift 1 SF113-31-P72F: Intel Pentium N4200, 13.30", 1.3 kg
External Review » Acer Swift 1 SF113-31-P72F
Acer Chromebook 15 CB515-1HT-P39B: Intel Pentium N4200, 15.60", 1.8 kg
External Review » Acer Chromebook 15 CB515-1HT-P39B
Medion Akoya E3216-MD61800: Intel Pentium N4200, 13.30", 1.5 kg
External Review » Medion Akoya E3216-MD61800
Acer Aspire ES1-533-P8BX: Intel Pentium N4200, 15.60", 2.4 kg
External Review » Acer Aspire ES1-533-P8BX
Acer Swift 1 SF113-31-P56D: Intel Pentium N4200, 13.30", 1.4 kg
External Review » Acer Swift 1 SF113-31-P56D
Acer Swift 1 SF113-31-P3P0: Intel Pentium N4200, 13.30", 1.3 kg
External Review » Acer Swift 1 SF113-31-P3P0
Acer Switch 3 SW312-31-P3FT: Intel Pentium N4200, 12.20", 0.9 kg
External Review » Acer Switch 3 SW312-31-P3FT
Asus VivoBook E14 E403NA-GA016T: Intel Pentium N4200, 14.00", 1.5 kg
External Review » Asus VivoBook E403NA-GA016T
Acer Spin 1 SP111-32N-P9VD: Intel Pentium N4200, 11.60", 1.3 kg
External Review » Acer Spin 1 SP111-32N-P9VD
Lenovo IdeaPad V110-15IAP-80TG00W3GE: Intel Pentium N4200, 15.60", 1.9 kg
External Review » Lenovo IdeaPad V110-15IAP-80TG00W3GE
Acer TravelMate Spin B1 B118-RN-P6BE: Intel Pentium N4200, 11.60", 1.5 kg
External Review » Acer TravelMate Spin B1 B118-RN-P6BE
Medion Akoya E3215-MD60794: Intel Pentium N4200, 13.30", 1.5 kg
External Review » Medion Akoya E3215-MD60794
HP Pavilion x360 11-ad051nr: Intel Pentium N4200, 11.60", 1.4 kg
External Review » HP Pavilion x360 11-ad051nr
Acer Switch 3 SW312-31P: Intel Pentium N4200, 12.00", 1.2 kg
External Review » Acer Switch 3 SW312-31P
Acer Swift 1 SF113-31-P5CK: Intel Pentium N4200, 13.30", 1.4 kg
External Review » Acer Swift 1 SF113-31-P5CK
Asus Vivobook E14 L403NA-FA017TS: Intel Pentium N4200, 14.00", 1.4 kg
External Review » Asus Vivobook E14 L403NA-FA017TS
Acer Swift 1 SF113-31-P63H: Intel Pentium N4200, 13.30", 1.4 kg
External Review » Acer Swift 1 SF113-31-P63H
Medion Akoya E3216-MD60900: Intel Pentium N4200, 13.30", 1.5 kg
External Review » Medion Akoya E3216-MD60900
Acer Chromebook 15 CB515-1HT-P58C: Intel Pentium N4200, 15.60", 1.8 kg
External Review » Acer Chromebook 15 CB515-1HT-P58C
BTO Notebooks U-BOOK 14CL23: Intel Pentium N4200, 14.00", 1.8 kg
External Review » BTO Notebooks U-BOOK 14CL23
Asus VivoBook Flip 12 TP203NAH-BP049T: Intel Pentium N4200, 11.60", 1.3 kg
External Review » Asus VivoBook Flip 12 TP203NAH-BP049T
Dell Latitude 3189: Intel Pentium N4200, 11.60", 1.4 kg
External Review » Dell Latitude 3189
Acer Swift 1 SF113-31-P2CP: Intel Pentium N4200, 13.30", 1.4 kg
External Review » Acer Swift 1 SF113-31-P2CP
Acer Aspire ES1-533-P2V5: Intel Pentium N4200, 15.60", 2.4 kg
External Review » Acer Aspire ES1-533-P2V5
Acer Switch 3 SW312-31-P5VG: Intel Pentium N4200, 12.20", 0.9 kg
External Review » Acer Switch 3 SW312-31-P5VG
Acer Aspire A315-31-P72U: Intel Pentium N4200, 15.60", 2.4 kg
External Review » Acer Aspire A315-31-P72U
Acer Aspire ES1-533-P6NL: Intel Pentium N4200, 15.60", 2.4 kg
External Review » Acer Aspire ES1-533-P6NL
Acer Aspire ES1-132-P065: Intel Pentium N4200, 11.60", 1.3 kg
External Review » Acer Aspire ES1-132-P065
Acer Swift 1 SF113-31-P2CP: Intel Pentium N4200, 13.30", 1.4 kg
External Review » Acer Swift 1 SF113-31-P2CP
Acer Aspire ES1-332-P7SA: Intel Pentium N4200, 13.30", 1.7 kg
External Review » Acer Aspire ES1-332-P7SA
Lenovo IdeaPad V110-15IAP-80TG00W8GE: Intel Pentium N4200, 15.60", 1.9 kg
External Review » Lenovo IdeaPad V110-15IAP-80TG00W8GE
Acer Spin 1 SP113-31-P0ZN: Intel Pentium N4200, 13.30", 1.6 kg
External Review » Acer Spin 1 SP113-31-P0ZN
Lenovo IdeaPad V110-15IAP 80TG00W4GE: Intel Pentium N4200, 15.60", 1.9 kg
External Review » Lenovo IdeaPad V110-15IAP 80TG00W4GE
Acer Spin 1 SP111-31-P40B: Intel Pentium N4200, 11.60", 1.5 kg
External Review » Acer Spin 1 SP111-31-P40B
Acer Aspire ES1-533-P591: Intel Pentium N4200, 15.60", 2.4 kg
External Review » Acer Aspire ES1-533-P591
HP ProBook x360 11-G1: Intel Pentium N4200, 11.60", 1.4 kg
External Review » HP ProBook x360 11-G1
Acer Aspire ES1-332-P91H: Intel Pentium N4200, 13.30", 1.5 kg
» HP targets classrooms with the ProBook x360 11