Acer Aspire ES1-533-P7WA Notebook Review

For the original German review, see here.
Acer is represented by a number of models in the low-price segment. The 15.6-inch Aspire ES1-533 now joins their ranks with an Intel Apollo Lake platform. This platform should offer 30% more performance compared to the predecessor (Braswell). We will check this assertion in our review. The competition includes names, such as the HP 250 G5, the Lenovo G51-35, the Asus F540SA and the Lenovo B50-10.
Case and Connectivity
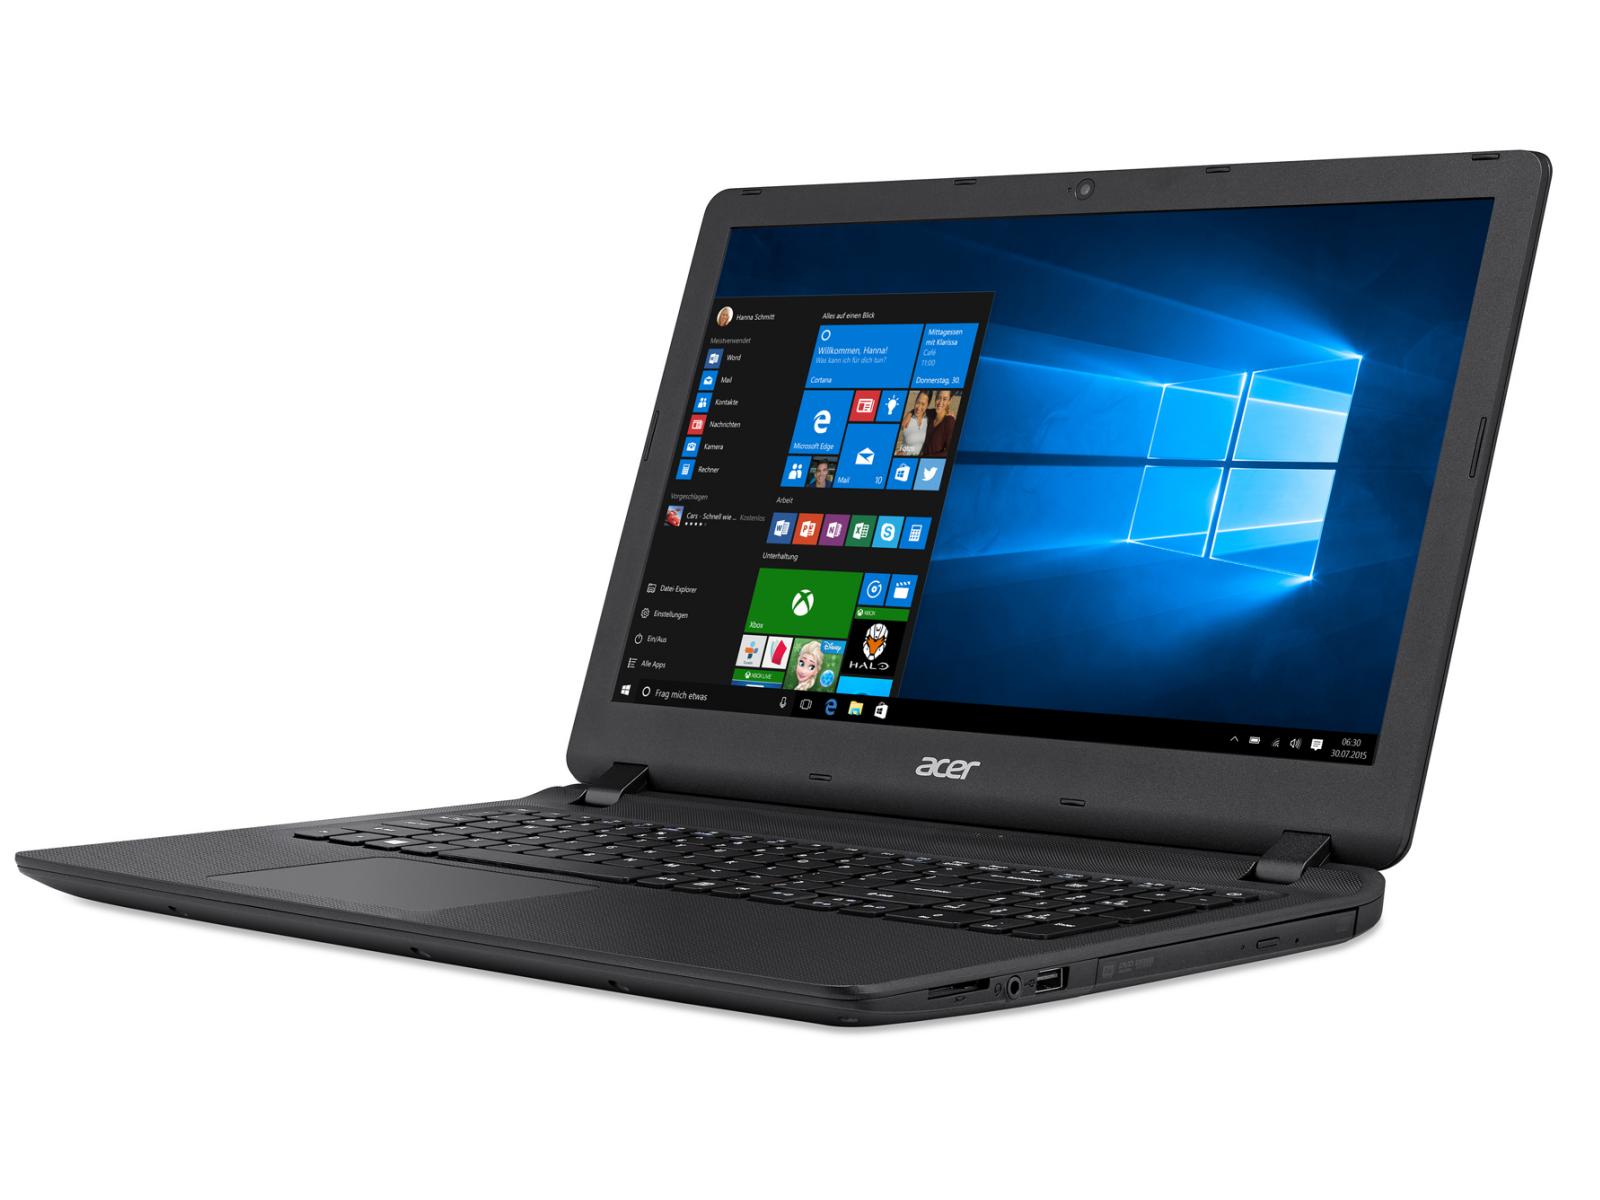
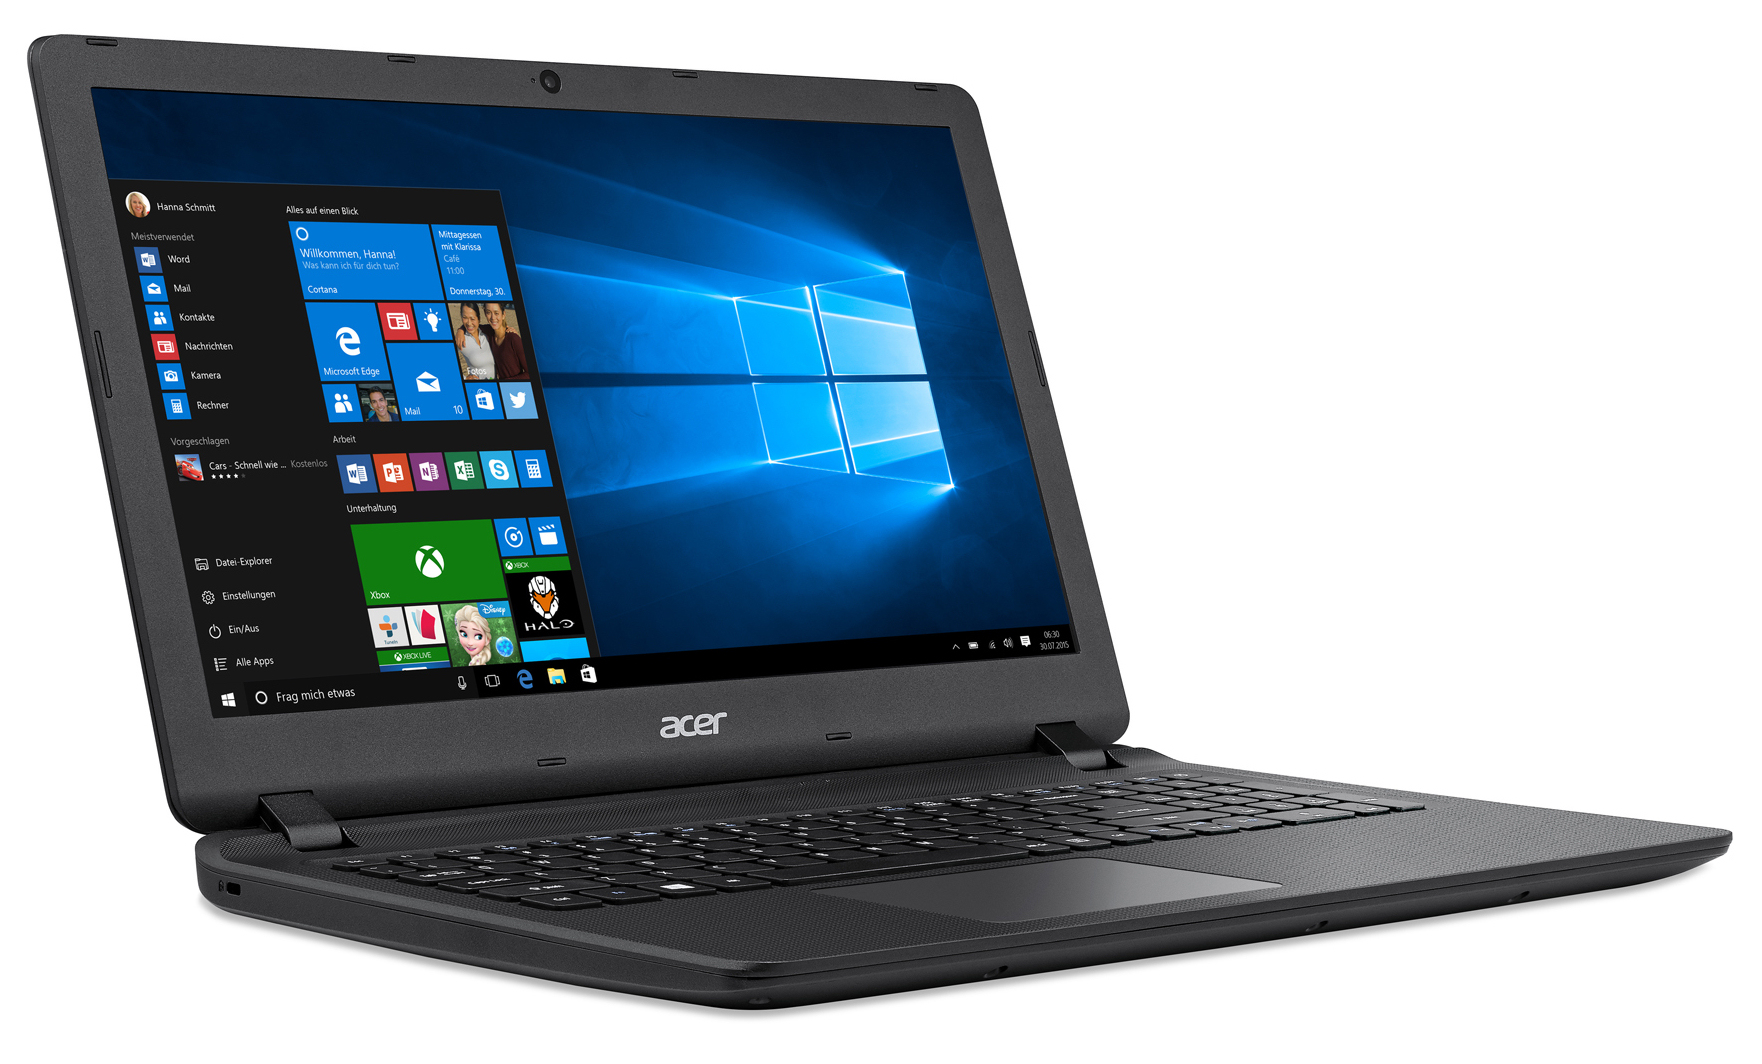
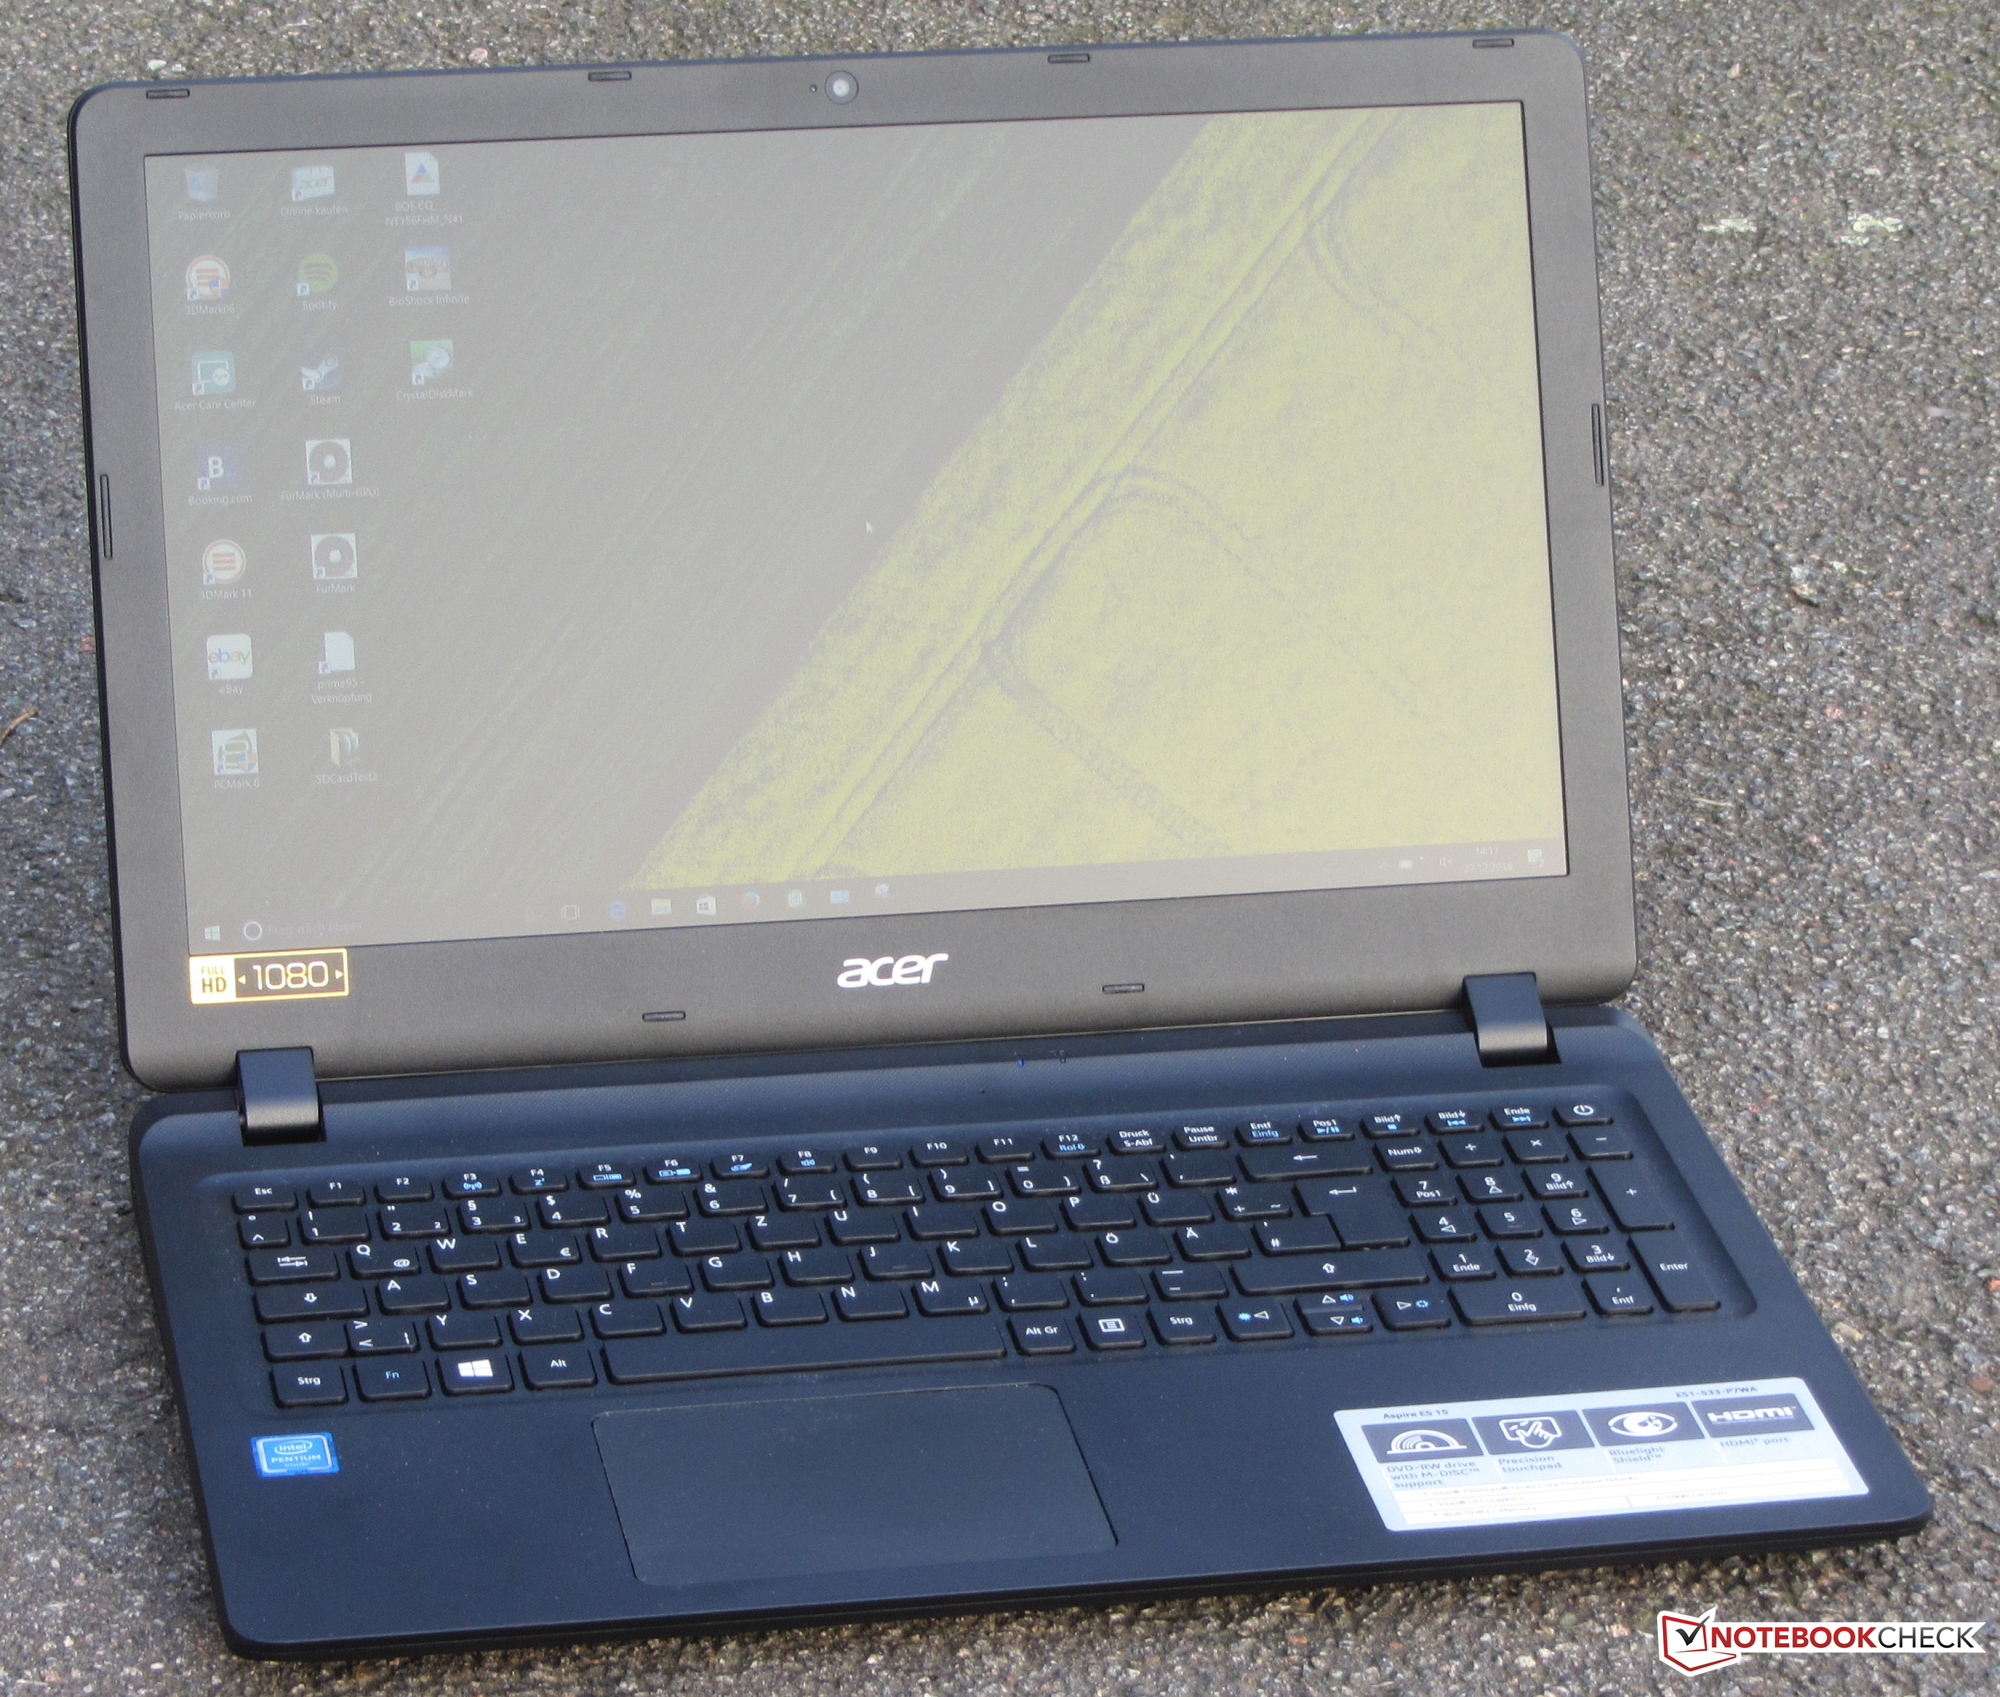
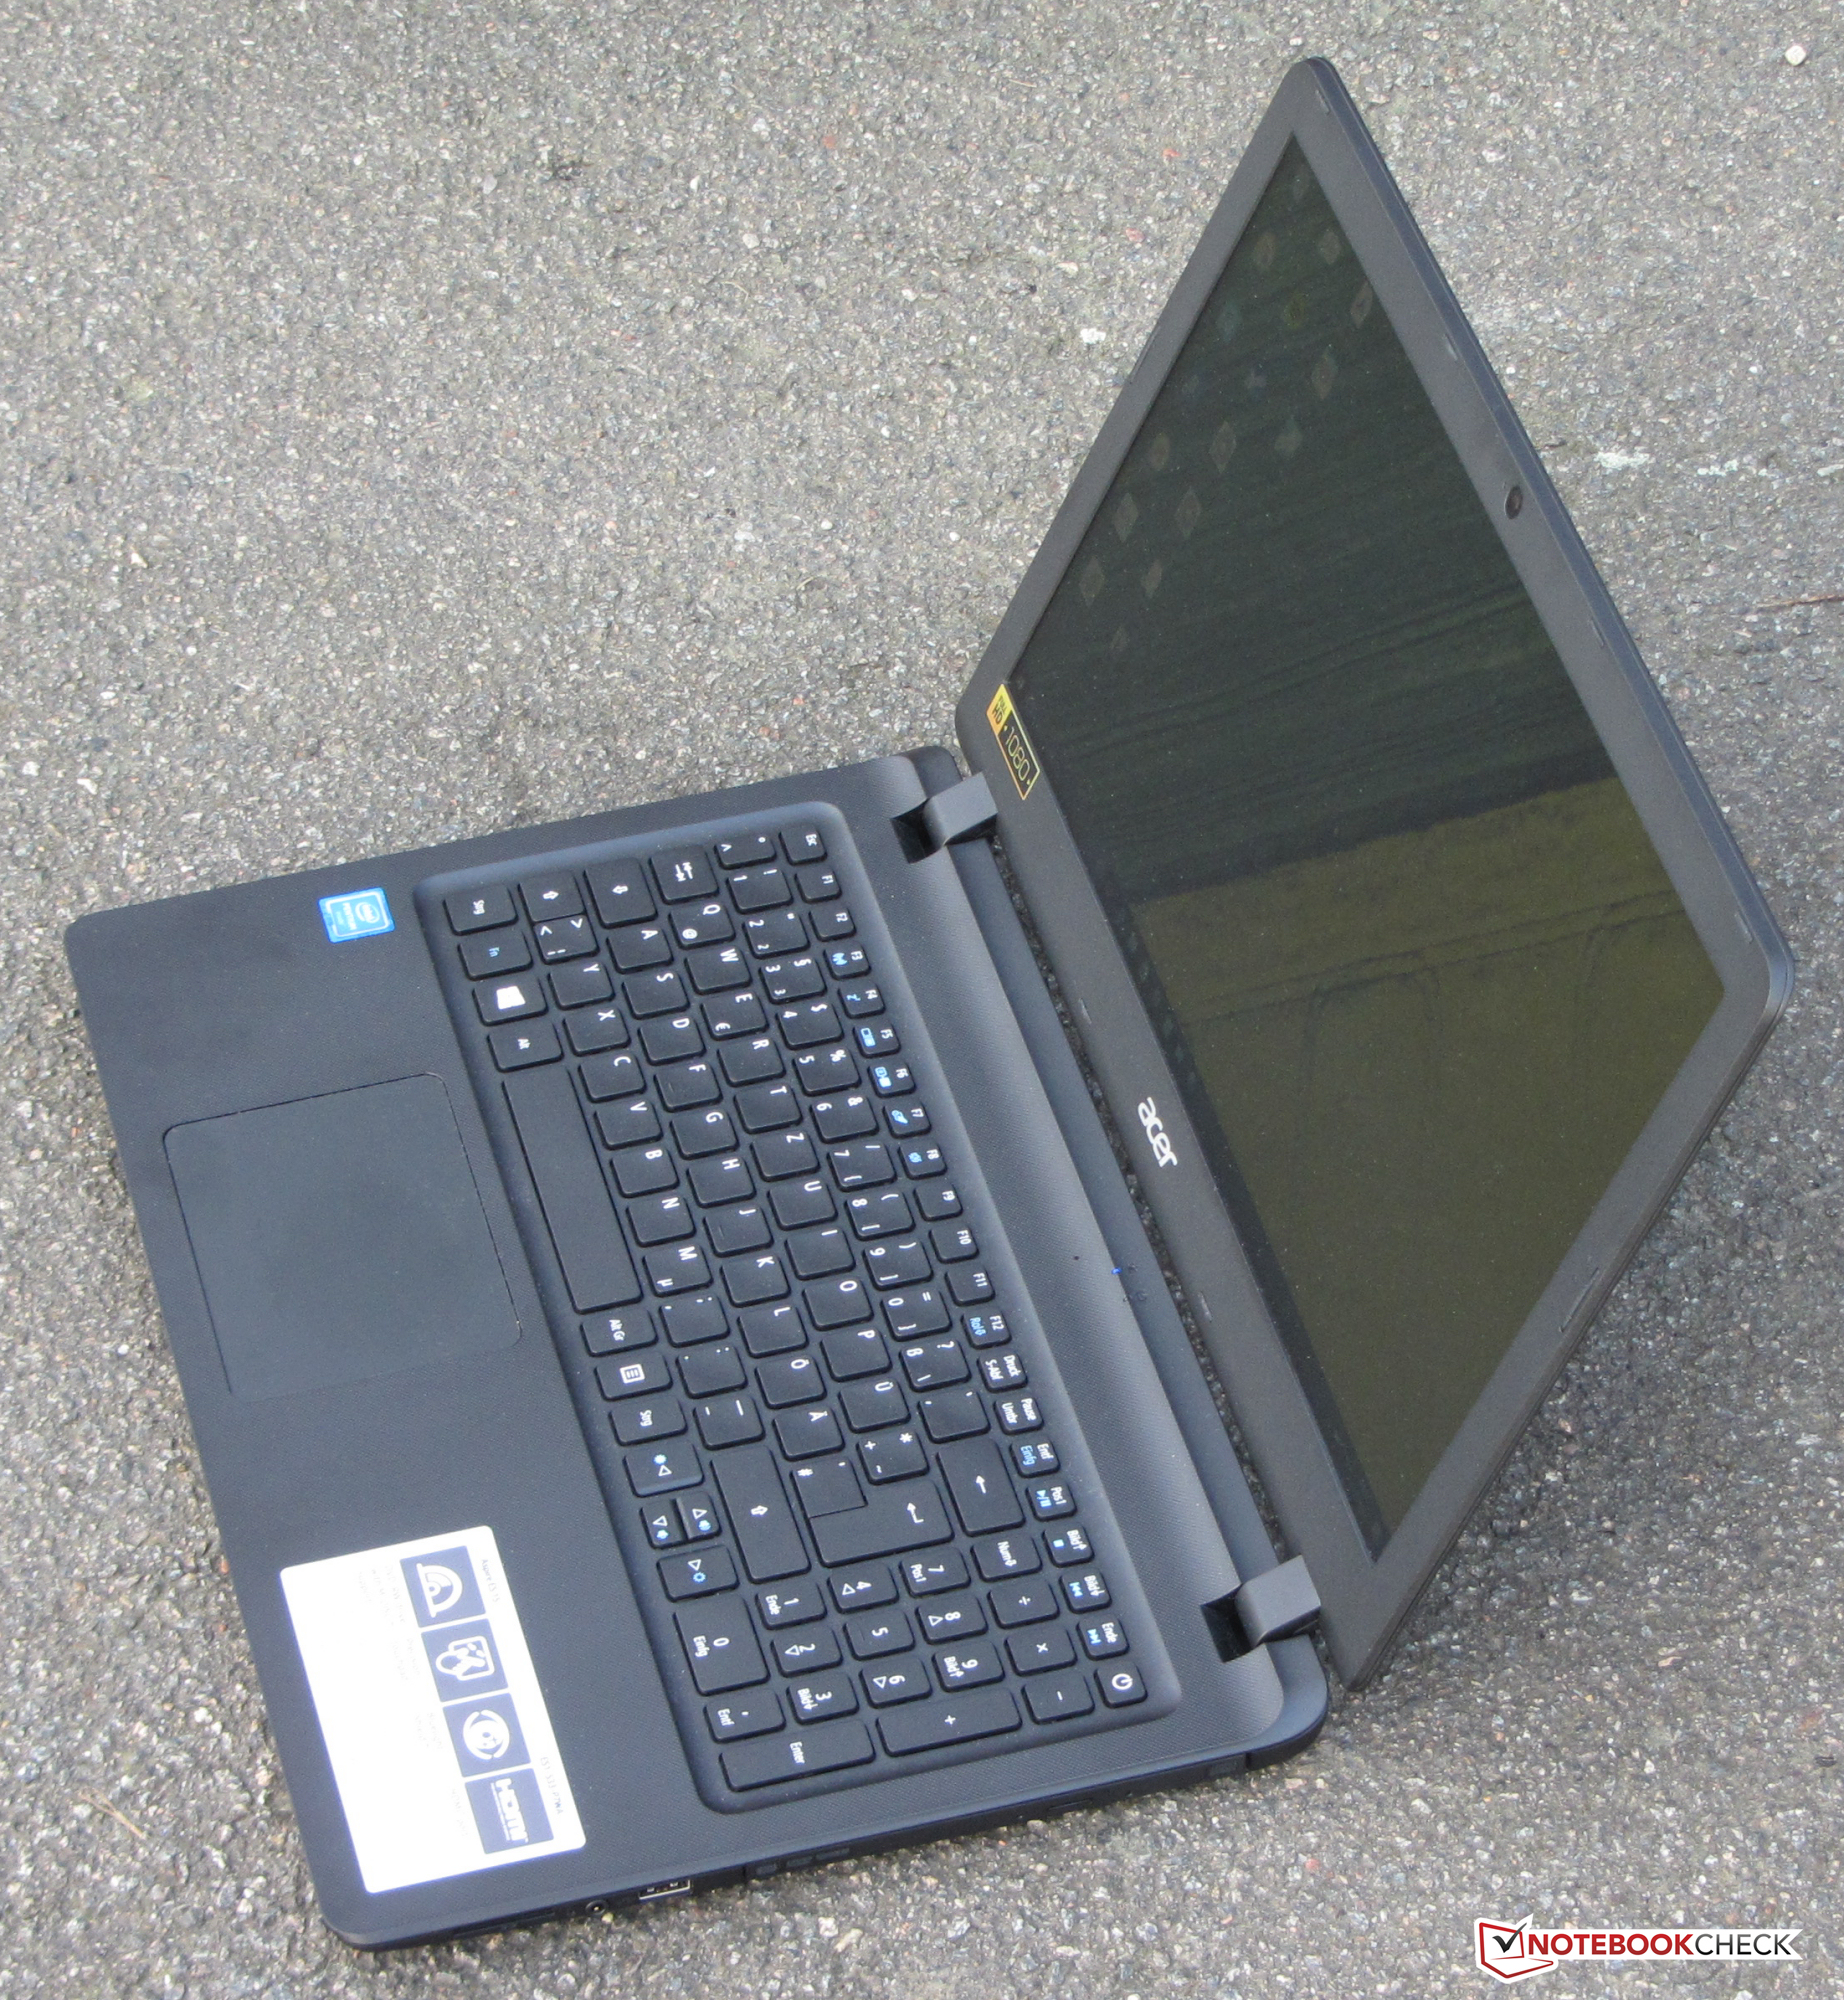
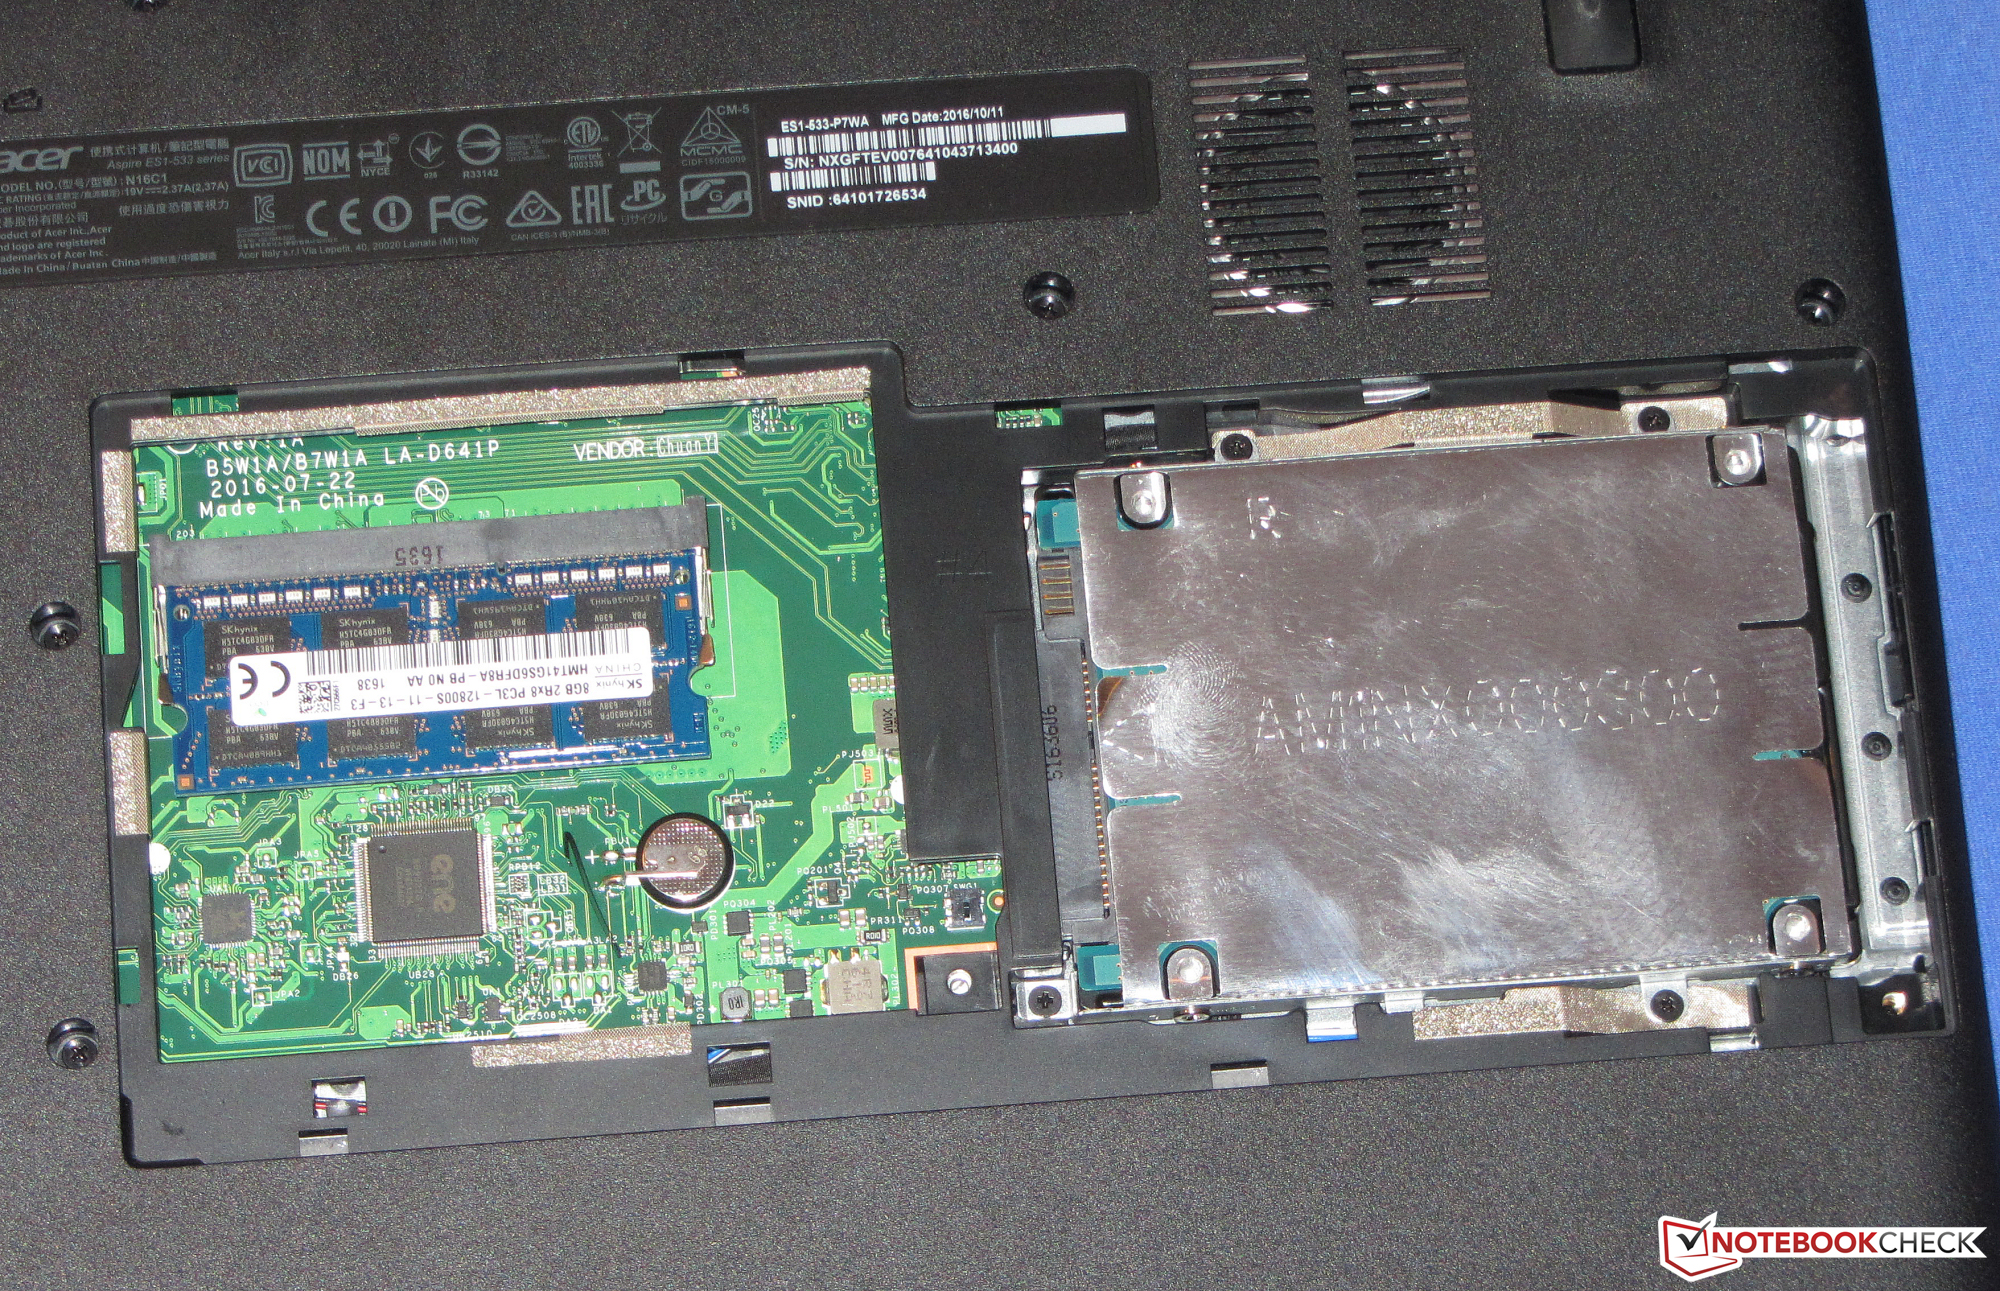
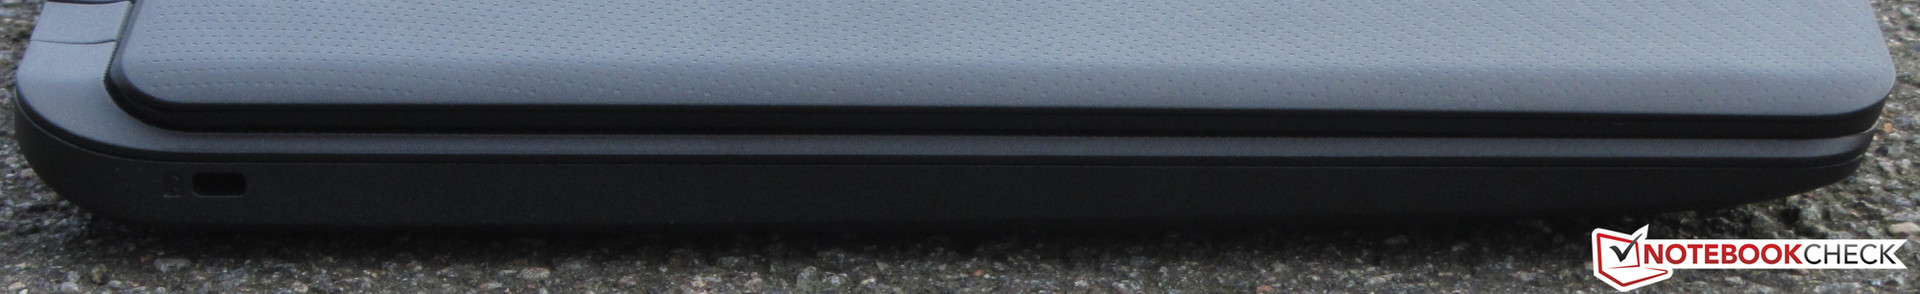
The test model is very similar to the predecessors (ES1-512 and ES1-521), as there are few visual differences. The case of the ES1-533 is made of matte, black synthetic material. The wrist-rest area and the display cover are adorned with textures. We like the workmanship and sturdiness of this laptop. Sadly, the base unit proves to be an exception, as it is a little weak. The battery is integrated into the laptop. We appreciate that the manufacturer has provided a maintenance flap, as this provides access to the RAM and the storage device.
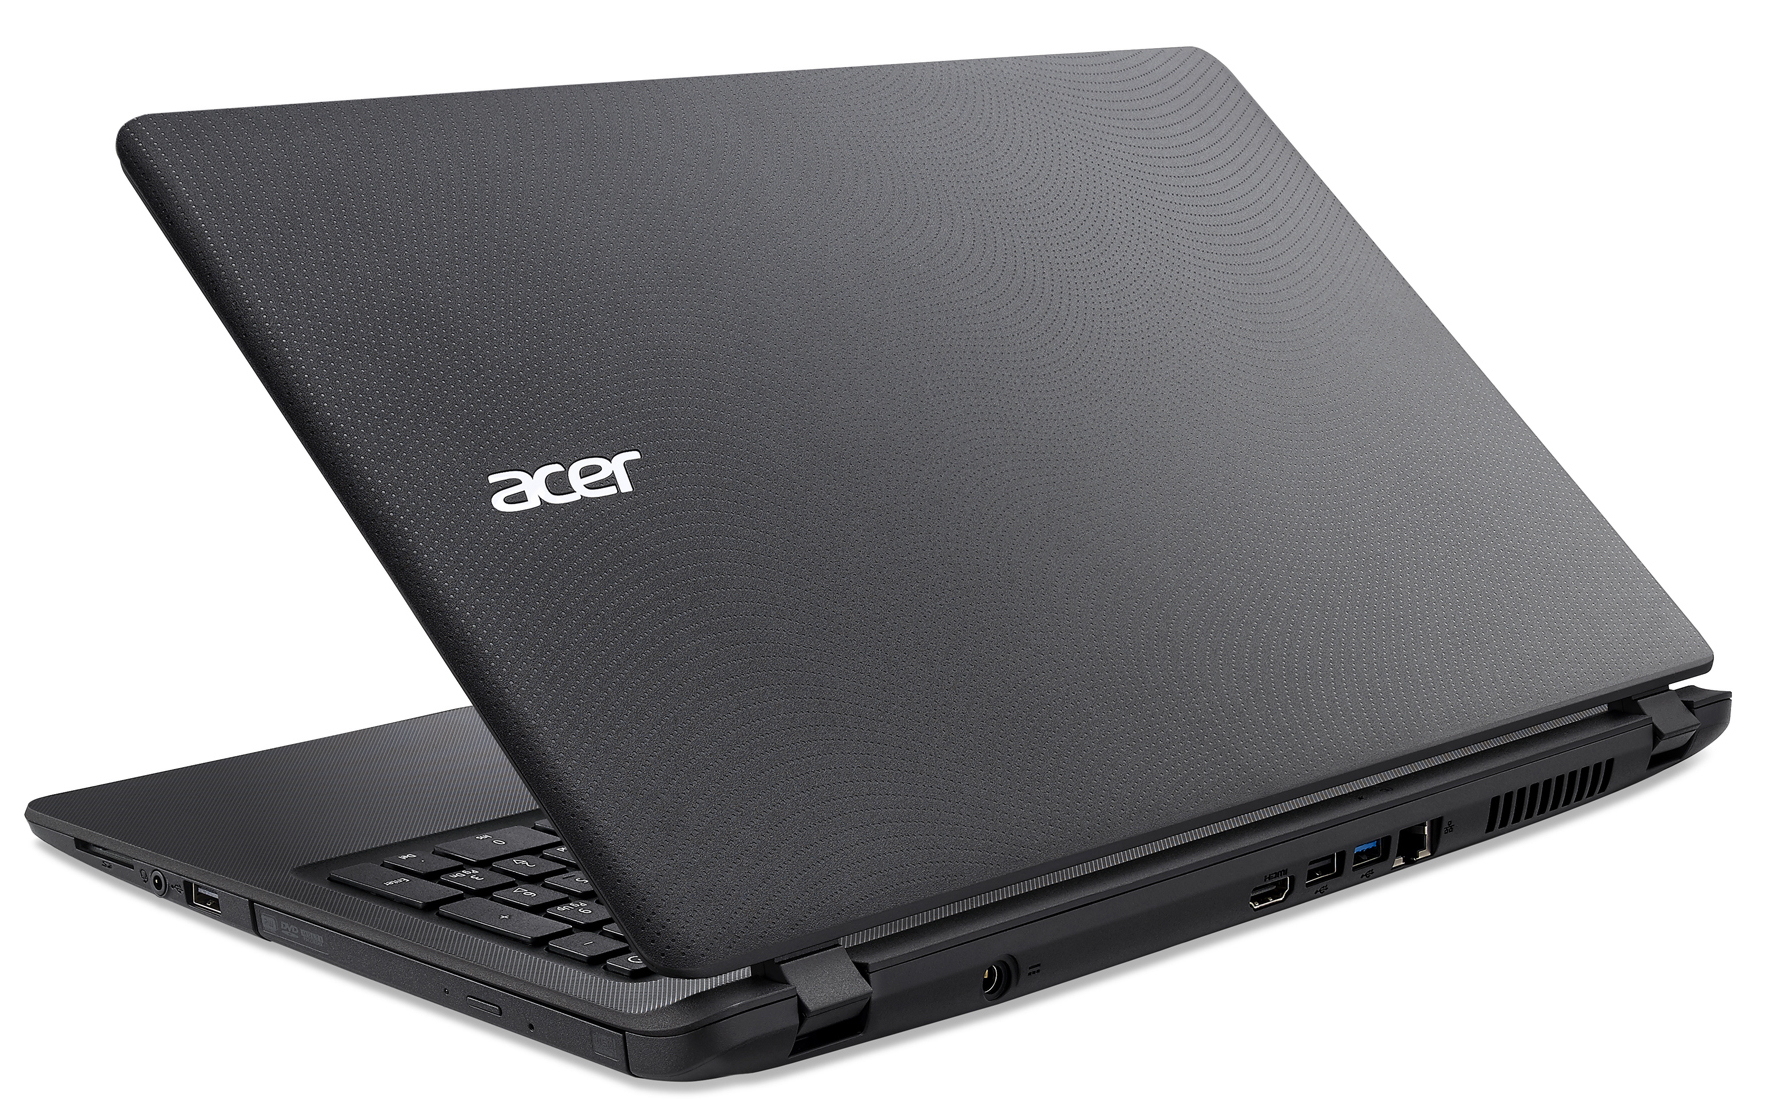
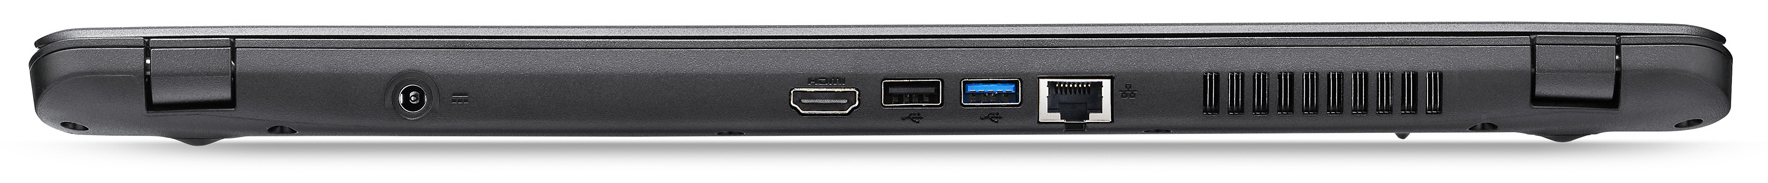
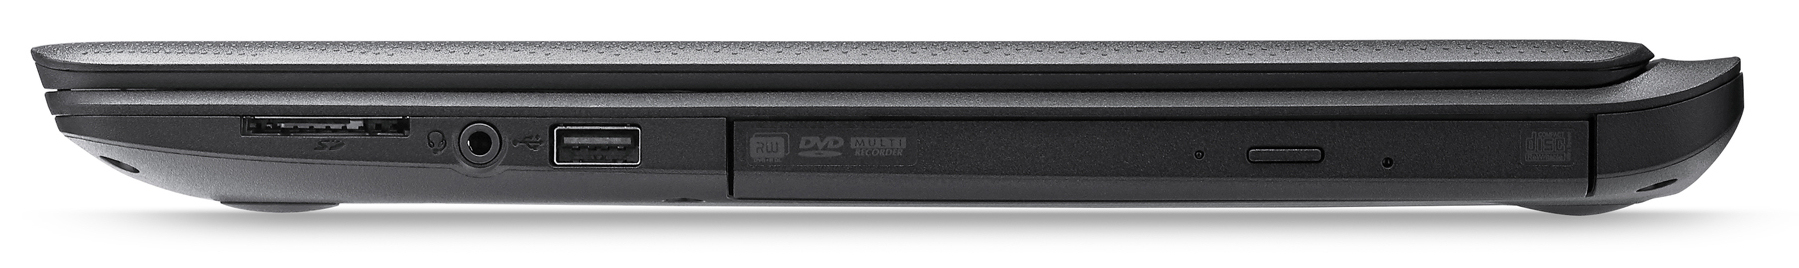
The number and type of ports have stayed the same. The positioning has changed slightly: the ports have been pushed to the back and the right sides of the laptop. The memory card reader is decent: it can copy large data blocks at a maximum transfer speed of 36.7 MB/s. The transfer of 250 jpg files (each roughly 5 MB) is completed at a speed of 17.8 MB/s. We tested the memory card reader with our reference card (the Toshiba Exceria Pro SDXC 64 GB UHS-II).
The WLAN module is an Intel chip (3168). We tested the module under ideal conditions (no other WLAN devices nearby, close to the router). The results were encouraging as the WLAN module offered good speeds. Furthermore, the WLAN module supports the fast ac standard.
| SD Card Reader | |
| average JPG Copy Test (av. of 3 runs) | |
| Lenovo IdeaPad 300-15IBR | |
| Lenovo B50-10 80QR0013GE | |
| Lenovo B50-70 MCC2GGE | |
| Asus F540SA-XX087T | |
| Lenovo G51-35 80M8002HGE | |
| HP 250 G5 Y1V08UT | |
| Acer Aspire ES1-533-P7WA | |
| Acer Aspire ES1-521-87DN | |
| maximum AS SSD Seq Read Test (1GB) | |
| Lenovo B50-70 MCC2GGE | |
| Lenovo B50-10 80QR0013GE | |
| Lenovo IdeaPad 300-15IBR | |
| Acer Aspire ES1-533-P7WA | |
| Acer Aspire ES1-521-87DN | |
| Lenovo G51-35 80M8002HGE | |
| HP 250 G5 Y1V08UT | |
| Networking | |
| iperf Client (transmit) TCP 1 m | |
| Lenovo B50-70 MCC2GGE | |
| Lenovo B50-10 80QR0013GE | |
| iperf3 receive AX12 | |
| Acer Aspire ES1-533-P7WA | |
| iperf3 transmit AX12 | |
| Acer Aspire ES1-533-P7WA | |
Input Devices
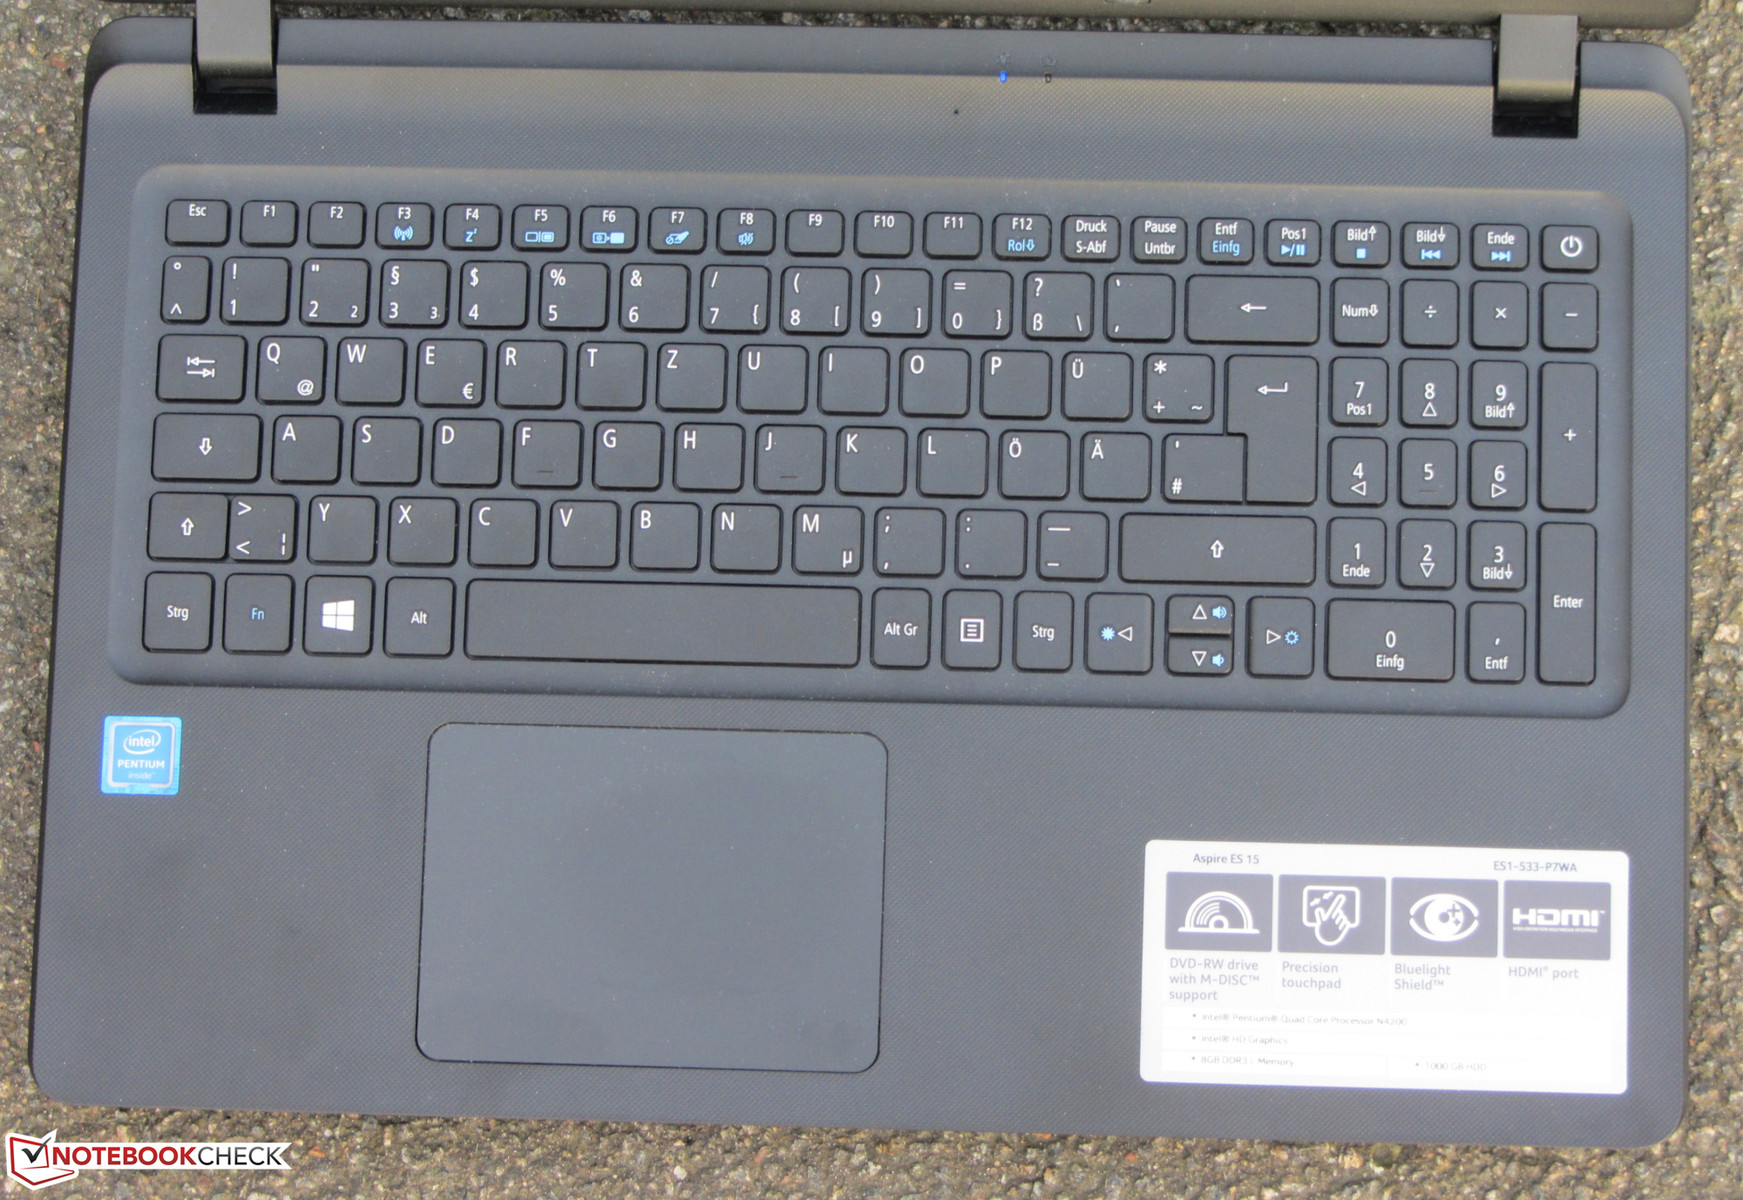
The laptop has an unlit chiclet keyboard with a numeric keypad. The slightly roughened keys have short stroke distances and clear pressure points. They offer a comfortable resistance. While typing, the keyboard bends slightly, but this did not annoy us. Overall, Acer has built a decent keyboard for home use. The multi-touch ClickPad occupies a surface measuring 10.6 x 7.8 cm (~4.2 x 3.1 in). The device offers sufficient space for gestures and the smooth surface enables fingers to slide easily. The pad has a short stroke distance and a clear pressure point.
Display
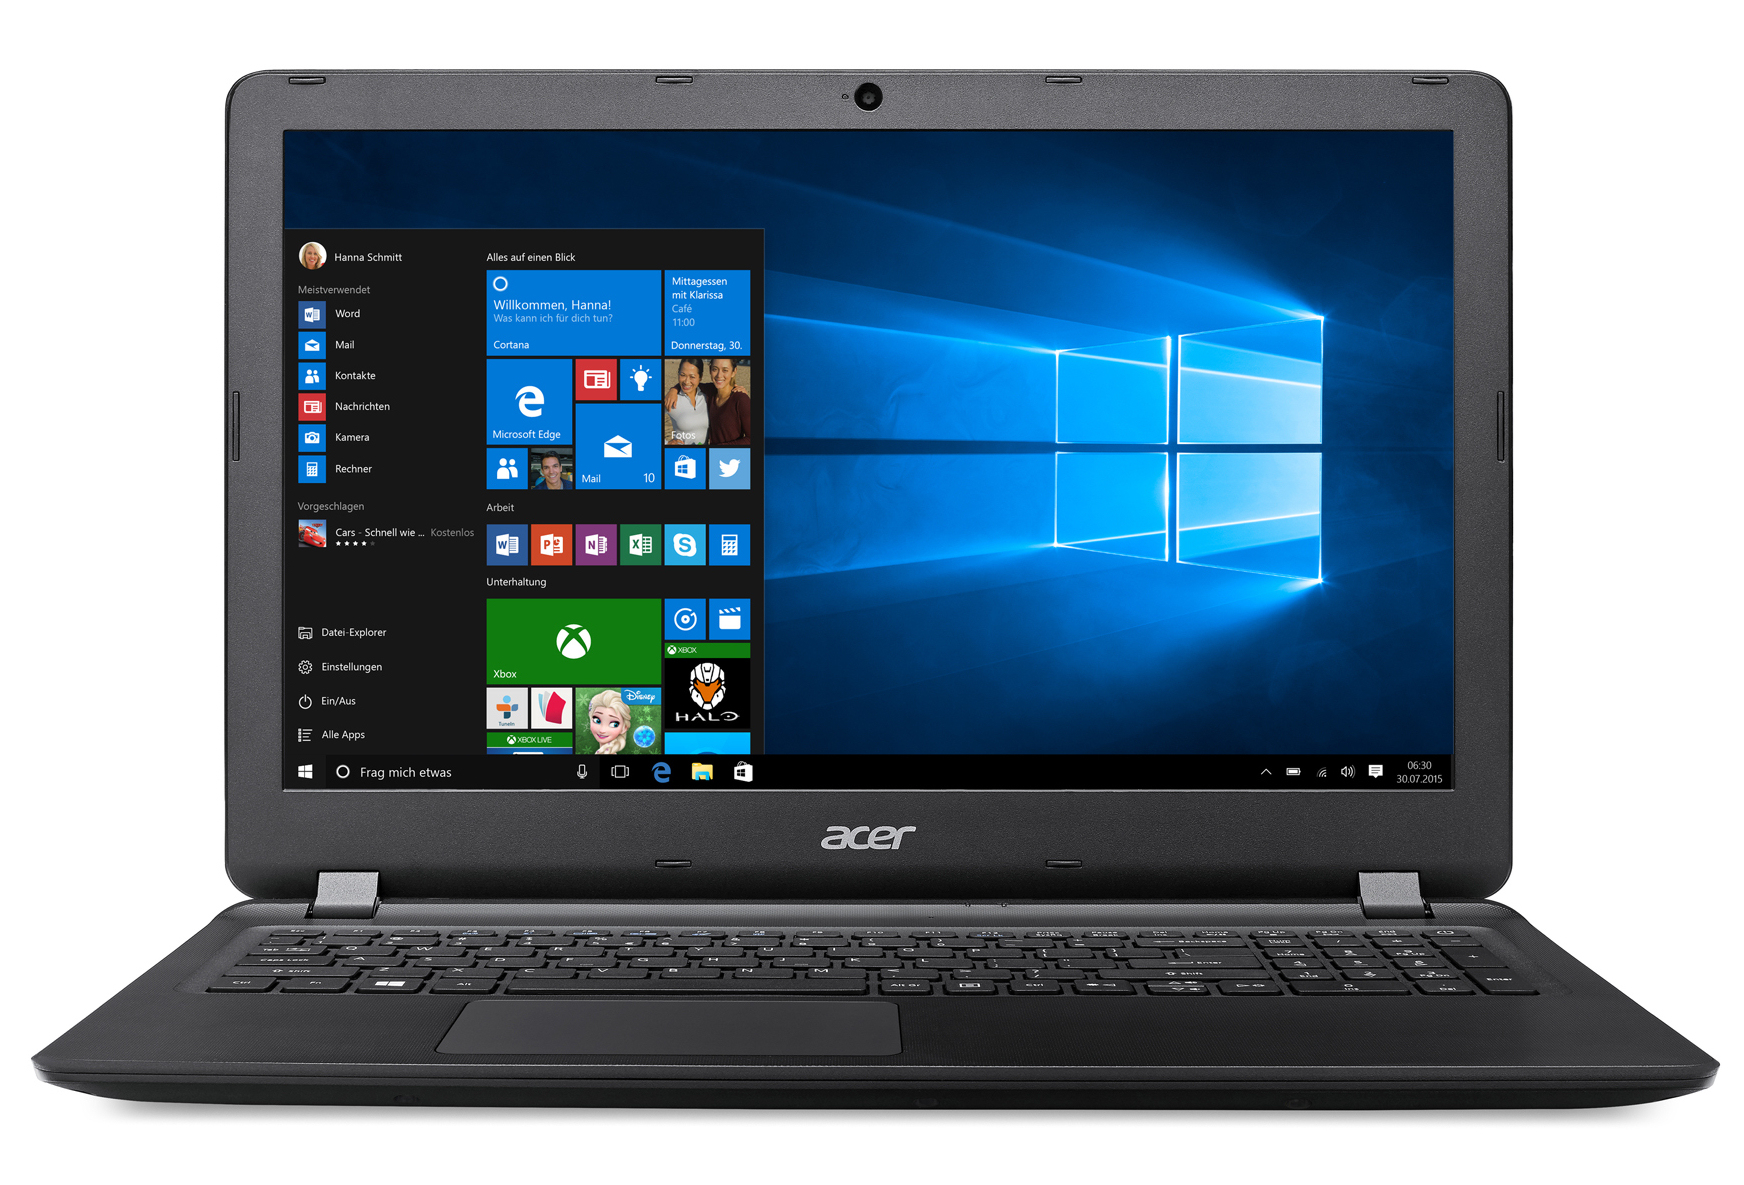
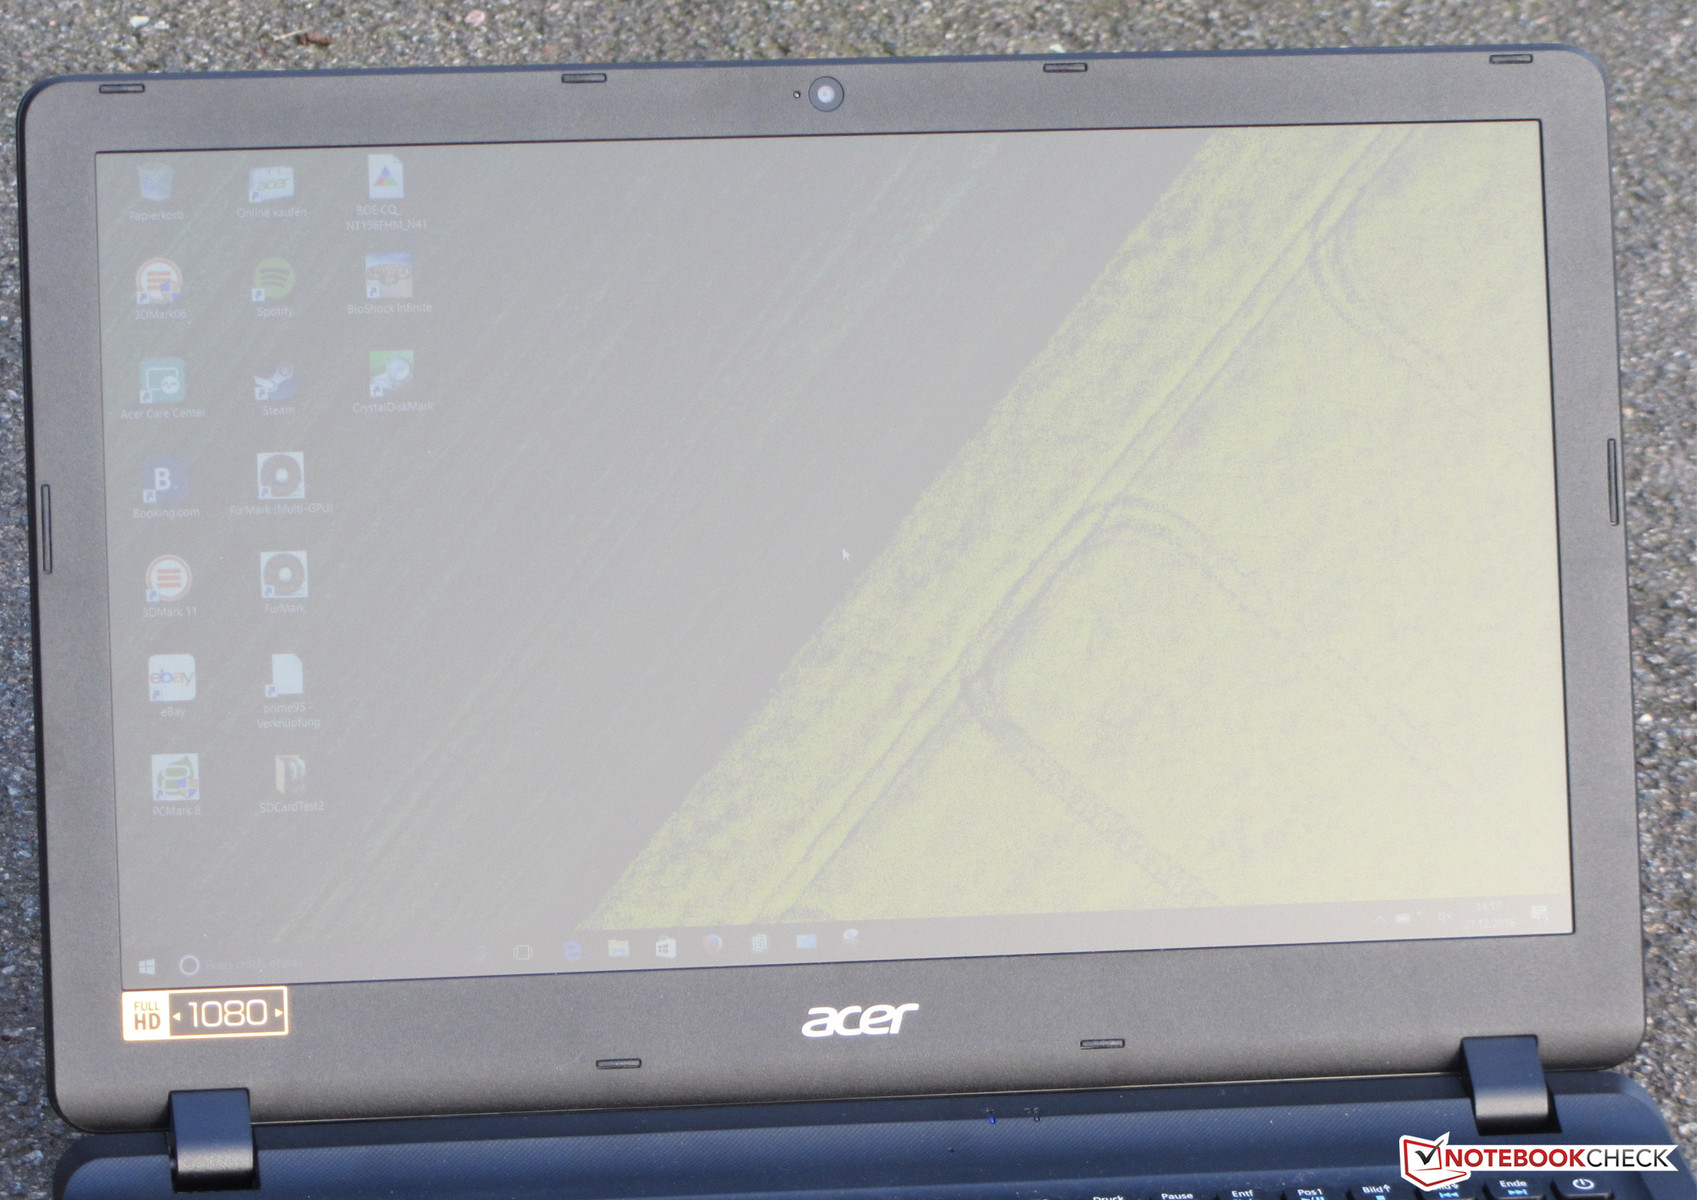
The matte 15.6-inch display offers the FHD resolution (1920x1080 pixels). This is rare in the low-price segment. Sadly, the brightness (202 cd/m²) and the contrast (300:1) are far too low. At least the screen does not suffer from PWM flickering.
| |||||||||||||||||||||||||
Brightness Distribution: 92 %
Center on Battery: 201 cd/m²
Contrast: 300:1 (Black: 0.67 cd/m²)
ΔE ColorChecker Calman: 10.36 | ∀{0.5-29.43 Ø4.72}
ΔE Greyscale Calman: 11.06 | ∀{0.09-98 Ø4.97}
57% sRGB (Argyll 1.6.3 3D)
36% AdobeRGB 1998 (Argyll 1.6.3 3D)
39.3% AdobeRGB 1998 (Argyll 3D)
57.2% sRGB (Argyll 3D)
38.04% Display P3 (Argyll 3D)
Gamma: 2.56
CCT: 11368 K
| Acer Aspire ES1-533-P7WA TN LED, 1920x1080, 15.6" | Acer Aspire ES1-521-87DN TN LED, 1366x768, 15.6" | Lenovo B50-10 80QR0013GE TN LED, 1366x768, 15.6" | HP 250 G5 Y1V08UT TN LED, 1366x768, 15.6" | Asus F540SA-XX087T TN LED, 1366x768, 15.6" | Lenovo G51-35 80M8002HGE ChiMei CMN15C6 N156BGE-EB2, 1366x768, 15.6" | |
|---|---|---|---|---|---|---|
| Display | 5% | 6% | -7% | 6% | -1% | |
| Display P3 Coverage (%) | 38.04 | 39.83 5% | 40.21 6% | 35.43 -7% | 40.17 6% | 37.59 -1% |
| sRGB Coverage (%) | 57.2 | 59.5 4% | 60.1 5% | 53.3 -7% | 60 5% | 56.3 -2% |
| AdobeRGB 1998 Coverage (%) | 39.3 | 41.19 5% | 41.56 6% | 36.6 -7% | 41.54 6% | 38.85 -1% |
| Response Times | -11% | 24% | -12% | 33% | -6% | |
| Response Time Grey 50% / Grey 80% * (ms) | 43 ? | 47 ? -9% | 28 ? 35% | 42.4 ? 1% | 20 ? 53% | 43.6 ? -1% |
| Response Time Black / White * (ms) | 23 ? | 26 ? -13% | 20 ? 13% | 28.8 ? -25% | 20 ? 13% | 25.6 ? -11% |
| PWM Frequency (Hz) | 1000 ? | 200 ? | 200 ? | 200 ? | ||
| Screen | 18% | 21% | -10% | 30% | 19% | |
| Brightness middle (cd/m²) | 201 | 245 22% | 245 22% | 199.8 -1% | 215 7% | 206 2% |
| Brightness (cd/m²) | 202 | 238 18% | 230 14% | 199 -1% | 200 -1% | 195 -3% |
| Brightness Distribution (%) | 92 | 88 -4% | 84 -9% | 85 -8% | 87 -5% | 88 -4% |
| Black Level * (cd/m²) | 0.67 | 0.42 37% | 0.46 31% | 0.712 -6% | 0.26 61% | 0.35 48% |
| Contrast (:1) | 300 | 583 94% | 533 78% | 281 -6% | 827 176% | 589 96% |
| Colorchecker dE 2000 * | 10.36 | 10.49 -1% | 8.34 19% | 13.24 -28% | 13.07 -26% | 8.96 14% |
| Colorchecker dE 2000 max. * | 18.88 | 16.84 11% | 12.31 35% | 21.52 -14% | 16.06 15% | 14.26 24% |
| Greyscale dE 2000 * | 11.06 | 11.47 -4% | 9.48 14% | 13.33 -21% | 4.34 61% | 9.27 16% |
| Gamma | 2.56 86% | 2.52 87% | 2.38 92% | 1.69 130% | 2.48 89% | 2.38 92% |
| CCT | 11368 57% | 13286 49% | 10624 61% | 15879 41% | 7212 90% | 11213 58% |
| Color Space (Percent of AdobeRGB 1998) (%) | 36 | 38 6% | 38 6% | 33.8 -6% | 38 6% | 35.89 0% |
| Color Space (Percent of sRGB) (%) | 57 | 60 5% | 57 0% | 53.4 -6% | 60 5% | 56.26 -1% |
| Total Average (Program / Settings) | 4% /
12% | 17% /
18% | -10% /
-9% | 23% /
25% | 4% /
12% |
* ... smaller is better
Screen Flickering / PWM (Pulse-Width Modulation)
| Screen flickering / PWM not detected | ||
In comparison: 52 % of all tested devices do not use PWM to dim the display. If PWM was detected, an average of 7781 (minimum: 5 - maximum: 343500) Hz was measured. | ||
The display has poor color accuracy. When we turned it on for the first time, the display had a DeltaE-2000 color deviation of 10.36. This is far from the ideal range of 3 or less. Sadly, the display has a blue tinge.


Display Response Times
| ↔ Response Time Black to White | ||
|---|---|---|
| 23 ms ... rise ↗ and fall ↘ combined | ↗ 7 ms rise | 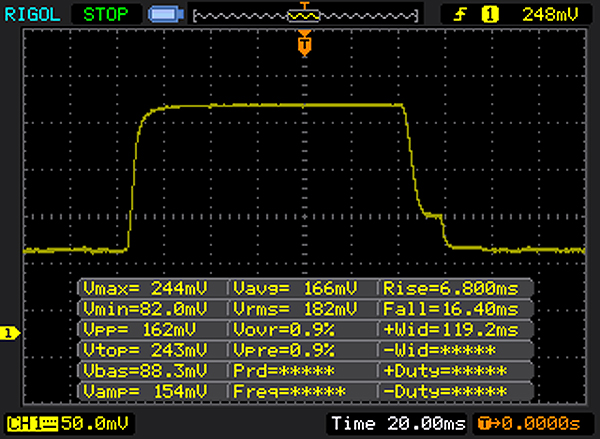 |
| ↘ 16 ms fall | ||
| The screen shows good response rates in our tests, but may be too slow for competitive gamers. In comparison, all tested devices range from 0.1 (minimum) to 240 (maximum) ms. » 52 % of all devices are better. This means that the measured response time is worse than the average of all tested devices (19.8 ms). | ||
| ↔ Response Time 50% Grey to 80% Grey | ||
| 43 ms ... rise ↗ and fall ↘ combined | ↗ 21 ms rise | 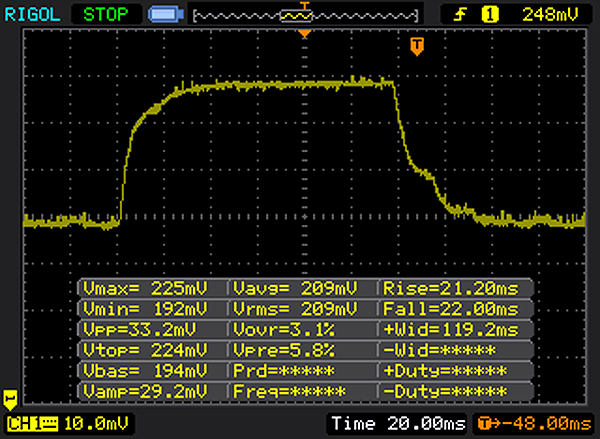 |
| ↘ 22 ms fall | ||
| The screen shows slow response rates in our tests and will be unsatisfactory for gamers. In comparison, all tested devices range from 0.165 (minimum) to 636 (maximum) ms. » 71 % of all devices are better. This means that the measured response time is worse than the average of all tested devices (31 ms). | ||
Acer has installed a TN panel with weak viewing angles. This prevents the screen from being legible from all angles. The notebook can only be used outdoors if the sun is not shining.
Performance
The Acer Aspire ES1-533 is a simple 15.6-inch office notebook. This laptop is primarily designed for office and Internet use. Our test model is available for around 400 Euros ($421). Other configurations are also available with prices starting at 280 Euros (~$295).
Processor
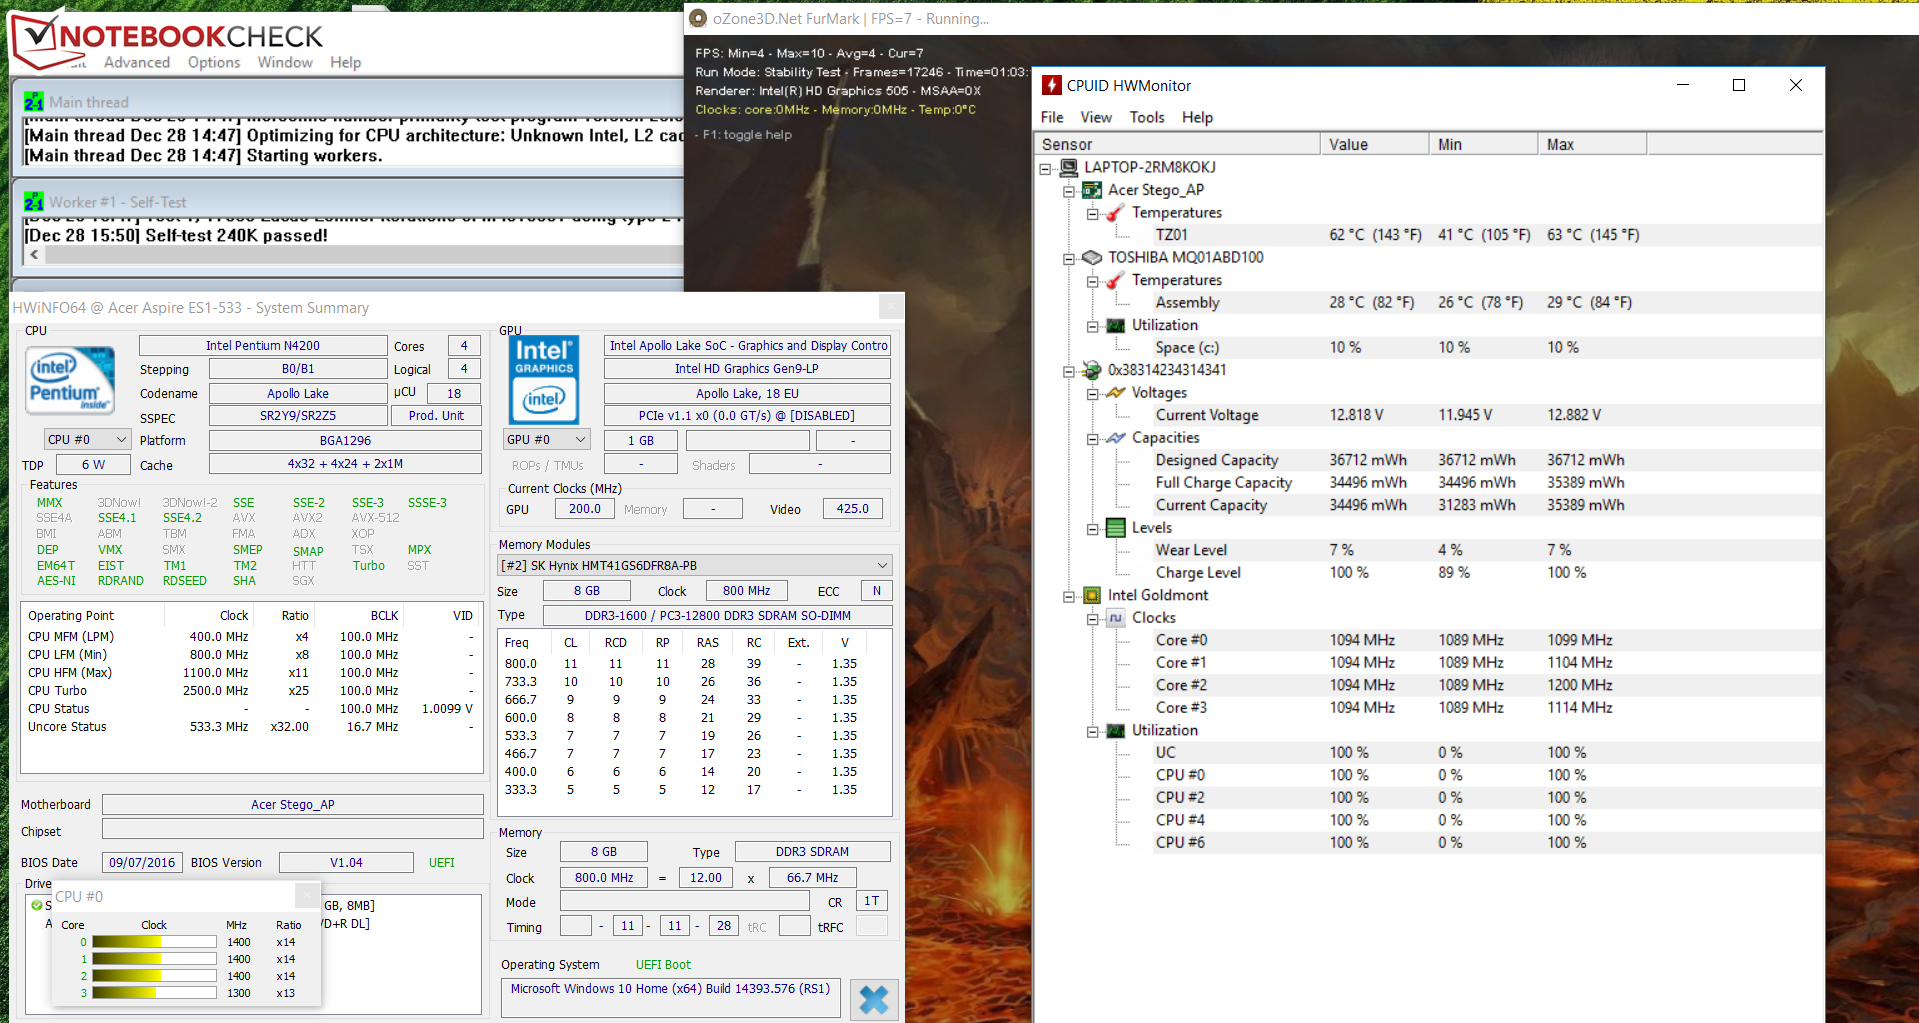
On the inside, the Aspire boasts of an Intel Pentium N4200 quad-core processor of the new Apollo Lake generation. The ULV CPU (TDP: 6 W) runs at a base clock speed of 1.1 GHz. Turbo boosts the processor up to 2.5 GHz. The Goldmont architecture of the processor provides significantly higher per-MHz performance than the predecessor (Silvermont). Intel claims this increase is around 30%. The benchmark results confirm this assertion. The N4200 performs better in the CPU tests than its predecessors (N3700/N3710), which have similar speeds. In our tests, the CPU ran at 2.0 to 2.1 GHz (Multithread) and 2.4 GHz (single thread). This performance stays the same while running on battery.
| Geekbench 4.0 | |
| 64 Bit Single-Core Score | |
| Acer Aspire ES1-533-P7WA | |
| 64 Bit Multi-Core Score | |
| Acer Aspire ES1-533-P7WA | |
System Performance
The hardware for the Aspire is good for office and Internet tasks. The integrated decoder of the GPU allows the playback of popular formats. Compared to the Core-i processors, the Pentium line-up offers less performance, which is noticeable when loading websites with lots of ads. The PC Mark benchmark results meet our expectations. To increase the system performance, the user can swap out the HDD for an SSD. The system will be faster thanks to the shorter loading times.
| PCMark 8 Home Score Accelerated v2 | 1993 points | |
Help | ||
Storage Device
The system drive of the laptop is a 2.5-inch drive from Toshiba. The drive operates at 5400 RPM and features a capacity of 1 TB. The transfer speeds are normal. It is easy to replace the HDD with an SSD, thanks to the maintenance flap.

| Acer Aspire ES1-533-P7WA Toshiba MQ01ABD100 | Acer Aspire E15 ES1-512-P1SM Western Digital Scorpio Blue WD5000LPVX | Lenovo B50-10 80QR0013GE Seagate Momentus Thin ST500LT012-1DG142 | HP 250 G5 Y1V08UT Samsung CM871 MZNLF128HCHP | Asus F540SA-XX087T Seagate Momentus Thin ST500LT012-1DG142 | Lenovo G51-35 80M8002HGE WDC Scorpio Blue WD10JPCX-24UE4T0 | |
|---|---|---|---|---|---|---|
| CrystalDiskMark 3.0 | 9% | -0% | 2813% | -12% | 18% | |
| Read Seq (MB/s) | 107.6 | 105.1 -2% | 103.5 -4% | 484.4 350% | 98.3 -9% | 100 -7% |
| Write Seq (MB/s) | 96.6 | 102.8 6% | 91.1 -6% | 139.2 44% | 89.8 -7% | 99.8 3% |
| Read 512 (MB/s) | 22.5 | 31.56 40% | 33.74 50% | 338.1 1403% | 20.79 -8% | 35.48 58% |
| Write 512 (MB/s) | 24.23 | 45.47 88% | 38.77 60% | 134.7 456% | 34.84 44% | 46.19 91% |
| Read 4k (MB/s) | 0.474 | 0.35 -26% | 0.374 -21% | 17.21 3531% | 0.335 -29% | 0.424 -11% |
| Write 4k (MB/s) | 1.089 | 0.94 -14% | 0.649 -40% | 31.52 2794% | 0.619 -43% | 0.966 -11% |
| Read 4k QD32 (MB/s) | 0.861 | 0.72 -16% | 0.818 -5% | 94.6 10887% | 0.789 -8% | 1.031 20% |
| Write 4k QD32 (MB/s) | 0.991 | 0.94 -5% | 0.648 -35% | 31.08 3036% | 0.641 -35% | 1 1% |
Graphics Card
The graphics chip has improved since the previous generation. The Aspire uses the HD Graphics 505 GPU, which is based on the Intel Skylake architecture (predecessor: Broadwell). Although this makes the 505 more powerful, it is still relatively weak. The GPU supports DirectX 12 and works at up to 750 MHz. The memory controller supports dual-channel mode. This means that a second RAM module would have allowed the laptop to use dual-channel mode and thus boost performance. Sadly, the laptop only has a single RAM slot.
| 3DMark 11 Performance | 686 points | |
Help | ||
Gaming Performance
The Aspire runs games smoothly on the screen, but only at low resolutions and settings. This covers all older or less-demanding games. The Windows store offers casual games which are ideal for this hardware.
| low | med. | high | ultra | |
|---|---|---|---|---|
| Counter-Strike: GO (2012) | 35 | 31 | ||
| BioShock Infinite (2013) | 23.7 | 13.6 | 11.5 | |
| Dota 2 Reborn (2015) | 32 | 22 |
Emissions and Energy
System Noise
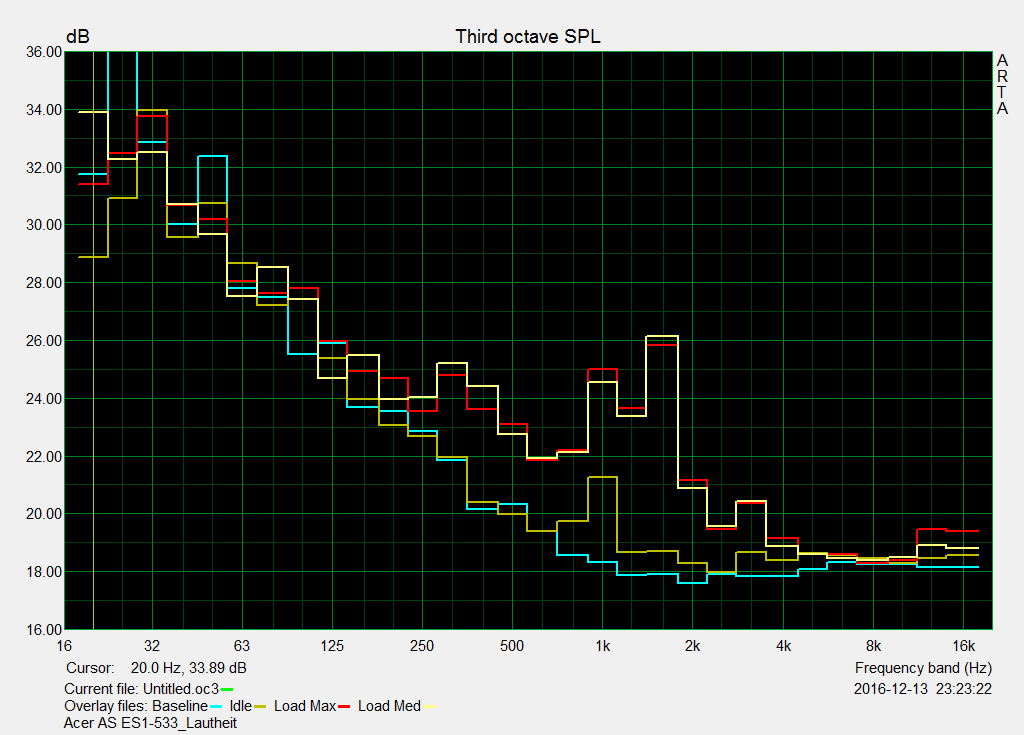
The Aspire model is relatively quiet, which is to be expected as the hardware is relatively weak. While idle, the fan is usually off and only the HDD is audible. The laptop would be entirely silent if the HDD was swapped out for an SSD. Under load, the fan barely turns up. During our stress test, we measure a noise emission of 34.2 dB(A).
Noise level
| Idle |
| 31.2 / 31.2 / 31.2 dB(A) |
| HDD |
| 31.2 dB(A) |
| DVD |
| 34.8 / dB(A) |
| Load |
| 33.9 / 34.2 dB(A) |
 | ||
30 dB silent 40 dB(A) audible 50 dB(A) loud |
||
min: | ||
Temperature
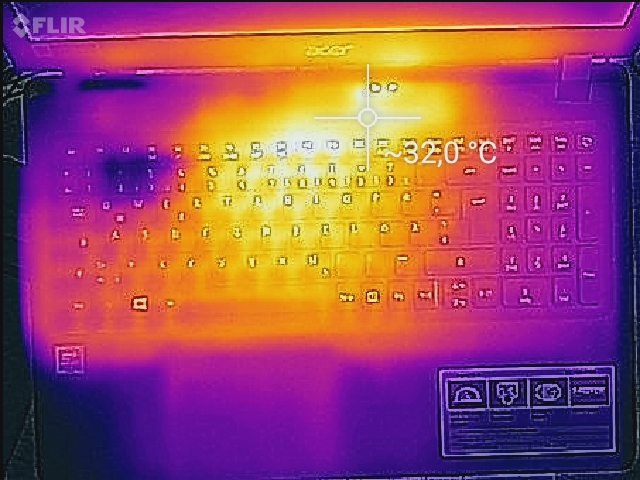
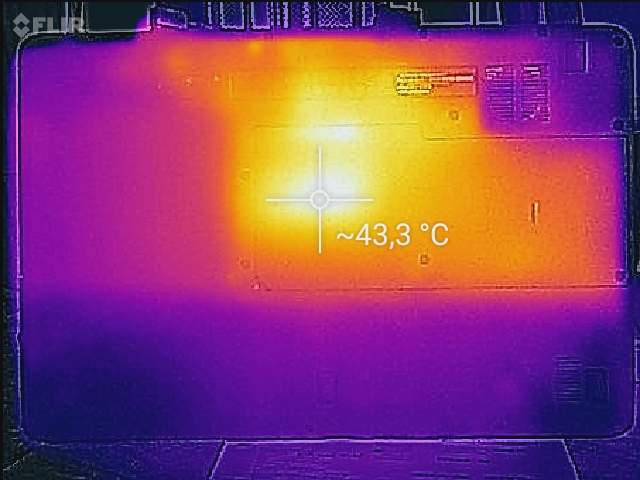
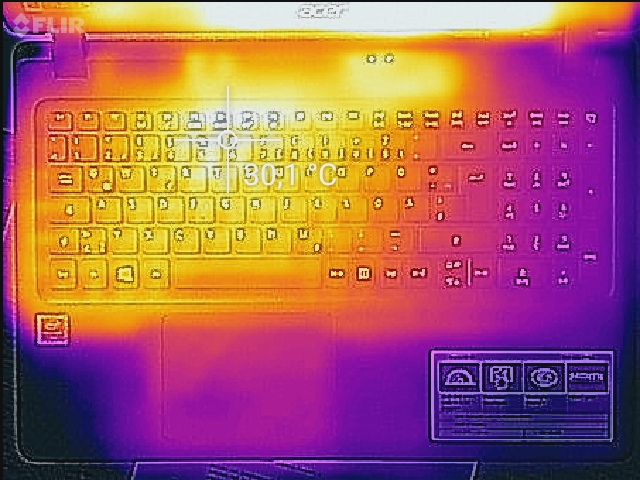
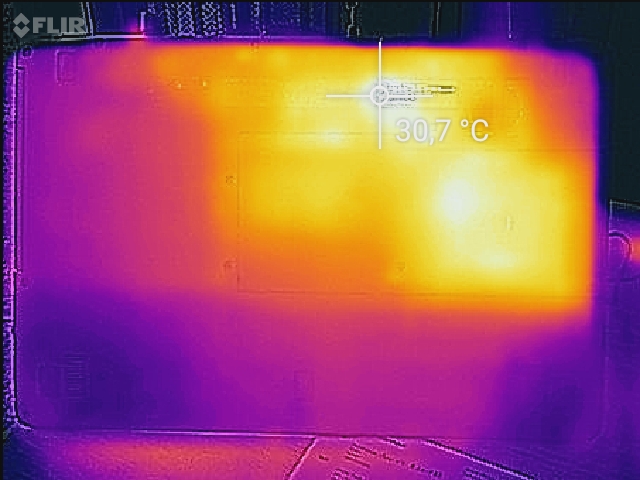
In our stress test, we run Prime95 and FurMark together for at least an hour. The Aspire performs at the same level while plugged in and on battery. The processor runs at 1.3 to 1.4 GHz and the graphics chip runs at 200 MHz. It is not surprising that the laptop remains relatively cool: the test model was below the 40 degrees Celsius (~104 degrees Fahrenheit) mark at all measurement points during testing.
(+) The maximum temperature on the upper side is 33.3 °C / 92 F, compared to the average of 34.3 °C / 94 F, ranging from 21.2 to 62.5 °C for the class Office.
(+) The bottom heats up to a maximum of 39.4 °C / 103 F, compared to the average of 36.8 °C / 98 F
(+) In idle usage, the average temperature for the upper side is 25.1 °C / 77 F, compared to the device average of 29.5 °C / 85 F.
(+) The palmrests and touchpad are cooler than skin temperature with a maximum of 26 °C / 78.8 F and are therefore cool to the touch.
(±) The average temperature of the palmrest area of similar devices was 27.5 °C / 81.5 F (+1.5 °C / 2.7 F).
Speakers
The stereo speakers have been placed on the bottom of the laptop. They produce a slightly dull, tinny sound, which lacks bass. We recommend the use of headphones or external speakers for a better sound experience.
Acer Aspire ES1-533-P7WA audio analysis
(±) | speaker loudness is average but good (72 dB)
Bass 100 - 315 Hz
(-) | nearly no bass - on average 23% lower than median
(±) | linearity of bass is average (10.6% delta to prev. frequency)
Mids 400 - 2000 Hz
(+) | balanced mids - only 3.4% away from median
(+) | mids are linear (6.8% delta to prev. frequency)
Highs 2 - 16 kHz
(±) | higher highs - on average 9.6% higher than median
(±) | linearity of highs is average (10.8% delta to prev. frequency)
Overall 100 - 16.000 Hz
(±) | linearity of overall sound is average (29.4% difference to median)
Compared to same class
» 90% of all tested devices in this class were better, 3% similar, 7% worse
» The best had a delta of 7%, average was 21%, worst was 53%
Compared to all devices tested
» 87% of all tested devices were better, 2% similar, 10% worse
» The best had a delta of 4%, average was 24%, worst was 134%
Apple MacBook 12 (Early 2016) 1.1 GHz audio analysis
(+) | speakers can play relatively loud (83.6 dB)
Bass 100 - 315 Hz
(±) | reduced bass - on average 11.3% lower than median
(±) | linearity of bass is average (14.2% delta to prev. frequency)
Mids 400 - 2000 Hz
(+) | balanced mids - only 2.4% away from median
(+) | mids are linear (5.5% delta to prev. frequency)
Highs 2 - 16 kHz
(+) | balanced highs - only 2% away from median
(+) | highs are linear (4.5% delta to prev. frequency)
Overall 100 - 16.000 Hz
(+) | overall sound is linear (10.2% difference to median)
Compared to same class
» 7% of all tested devices in this class were better, 2% similar, 91% worse
» The best had a delta of 5%, average was 18%, worst was 53%
Compared to all devices tested
» 5% of all tested devices were better, 1% similar, 94% worse
» The best had a delta of 4%, average was 24%, worst was 134%
Frequency diagram for comparison (checkboxes can be selected!)
Power Consumption
While idle, the test model runs up a maximum consumption of 9.7 W. This value should be a little lower as the laptop is using a weak SoC. During our stress test, the consumption rises up to 18.2 W. In this case, we noticed the low speeds of the CPU and GPU. If only the Prime95 tool is running, the power consumption is a little higher. The power adapter provides up to 45 W.
| Off / Standby | |
| Idle | |
| Load |
|
Key:
min: | |
Battery Life
In our practical WLAN test, we simulate the load of the laptop while surfing websites. The power profile is set to "Balanced" and the power saver functions are turned off. The brightness is reduced to around 150 cd/m². The Aspire can offer 5:21 hours, which is a modest runtime at best.
Pros
Cons
Verdict
The Acer Aspire ES1-533-P7WA is a simple 15.6-inch office notebook, which relies on the Intel Apollo Lake platform. The quad-core processor offers sufficient performance for office work and web surfing. The integrated decoder supports the typical video formats. The laptop works quietly and barely heats up. Storage space is provided in abundance on this test model, thanks to a 1 TB HDD. The HDD can be swapped out for an SSD via the maintenance flap. The keyboard may not be the best on the market, but it is convenient for home use. The laptop has an average battery life and the offer is rounded out with a 2-year warranty.
This Aspire is a simple laptop for writing and surfing.
What was supposed to be its most intriguing selling point is its biggest weakness: the FHD display. Acer has picked a dark panel with poor viewing angles. At least, the manufacturer has selected a matte display with no PWM flickering.
A tip: users, who would like to use an SSD instead of an HDD, should take a look at the Aspire ES1-533-P9CX. This model uses a 256 GB SSD instead of an HDD. The rest of the connectivity is the same as our current test model.
Acer Aspire ES1-533-P7WA
- 12/30/2016 v6 (old)
Sascha Mölck
Price comparison
