A 4K Laptop For $440: Chuwi LapBook Plus Review
The 15.6-inch Chuwi LapBook Plus is Chuwi's latest model in its lineup of visually appealing and yet super-cheap laptops. It follows on the footsteps of the smaller AeroBook and HeroBook in terms of chassis design and so many of our existing comments on Chuwi systems can apply here.
The LapBook Plus is most notable for its pairing of an Intel Atom E3950 CPU with a 4K UHD display for just $439 USD — not something you see everyday in the laptop world. Nonetheless, our benchmarks and experience with the model will show why it's not a very good idea to have such a weak processor power a very high resolution display on a Windows PC.
There are no major direct competitors in this space because the LapBook Plus is one of the only laptops with a 4K UHD display retailing for under $500 USD. However, plenty of laptops and tablets with very low power CPUs are available in this price range including the HP Pavilion 15, Acer Swift 3, HP x2, or Lenovo IdeaPad 110.
The official product page for the LapBook Plus can be found here.
More Chuwi reviews:
Case
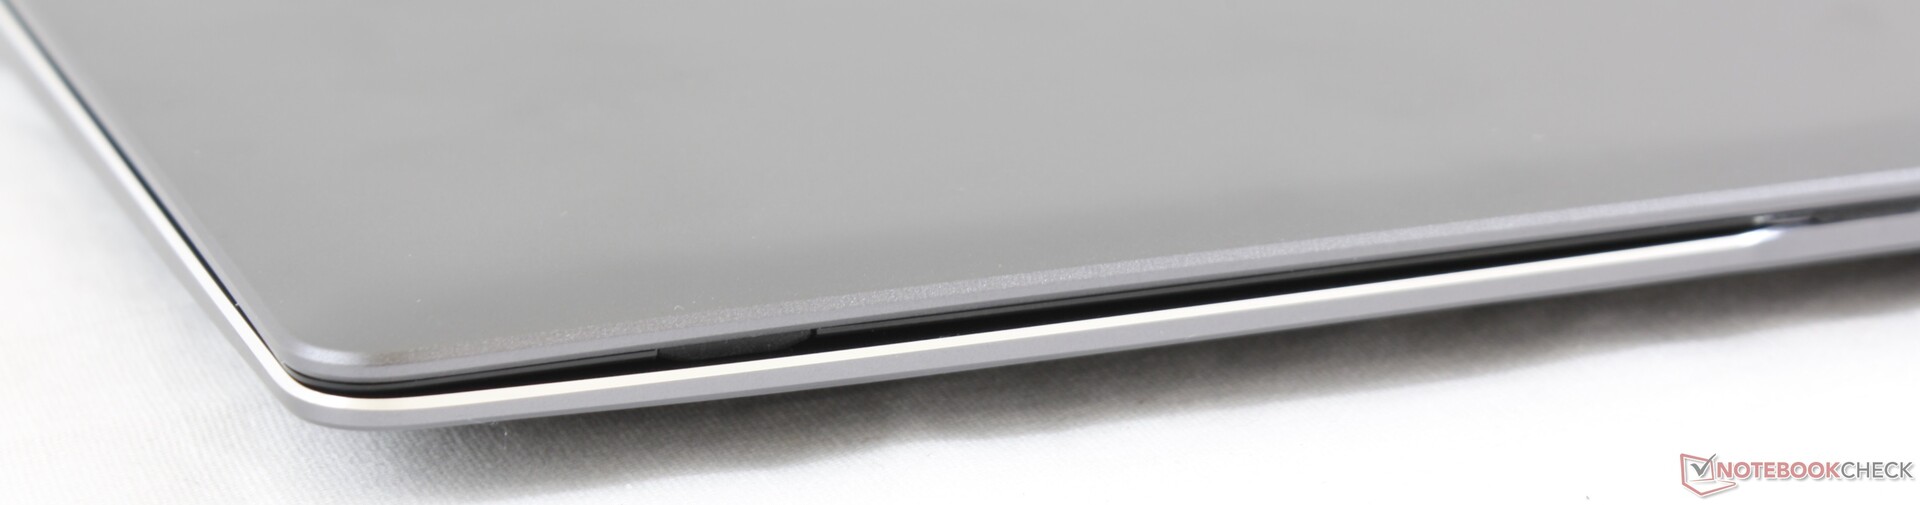
Like other Chuwi laptops, the LapBook Plus is an unabashed knockoff of Apple or, in this case, the 2018 MacBook Air. Colors and surfaces mimic the Apple equivalent even if the chassis itself is noticeably weaker and more flexible to the touch. The hinges in particular tend to creak and become more fragile when opened to their maximum angle. Other 15-inch Ultrabooks like the XPS 15 or Spectre x360 15 have stiffer and sounder bodies that are more reflective of their 4-digit price points. This may look like an Apple, but it definitely doesn't feel like one.
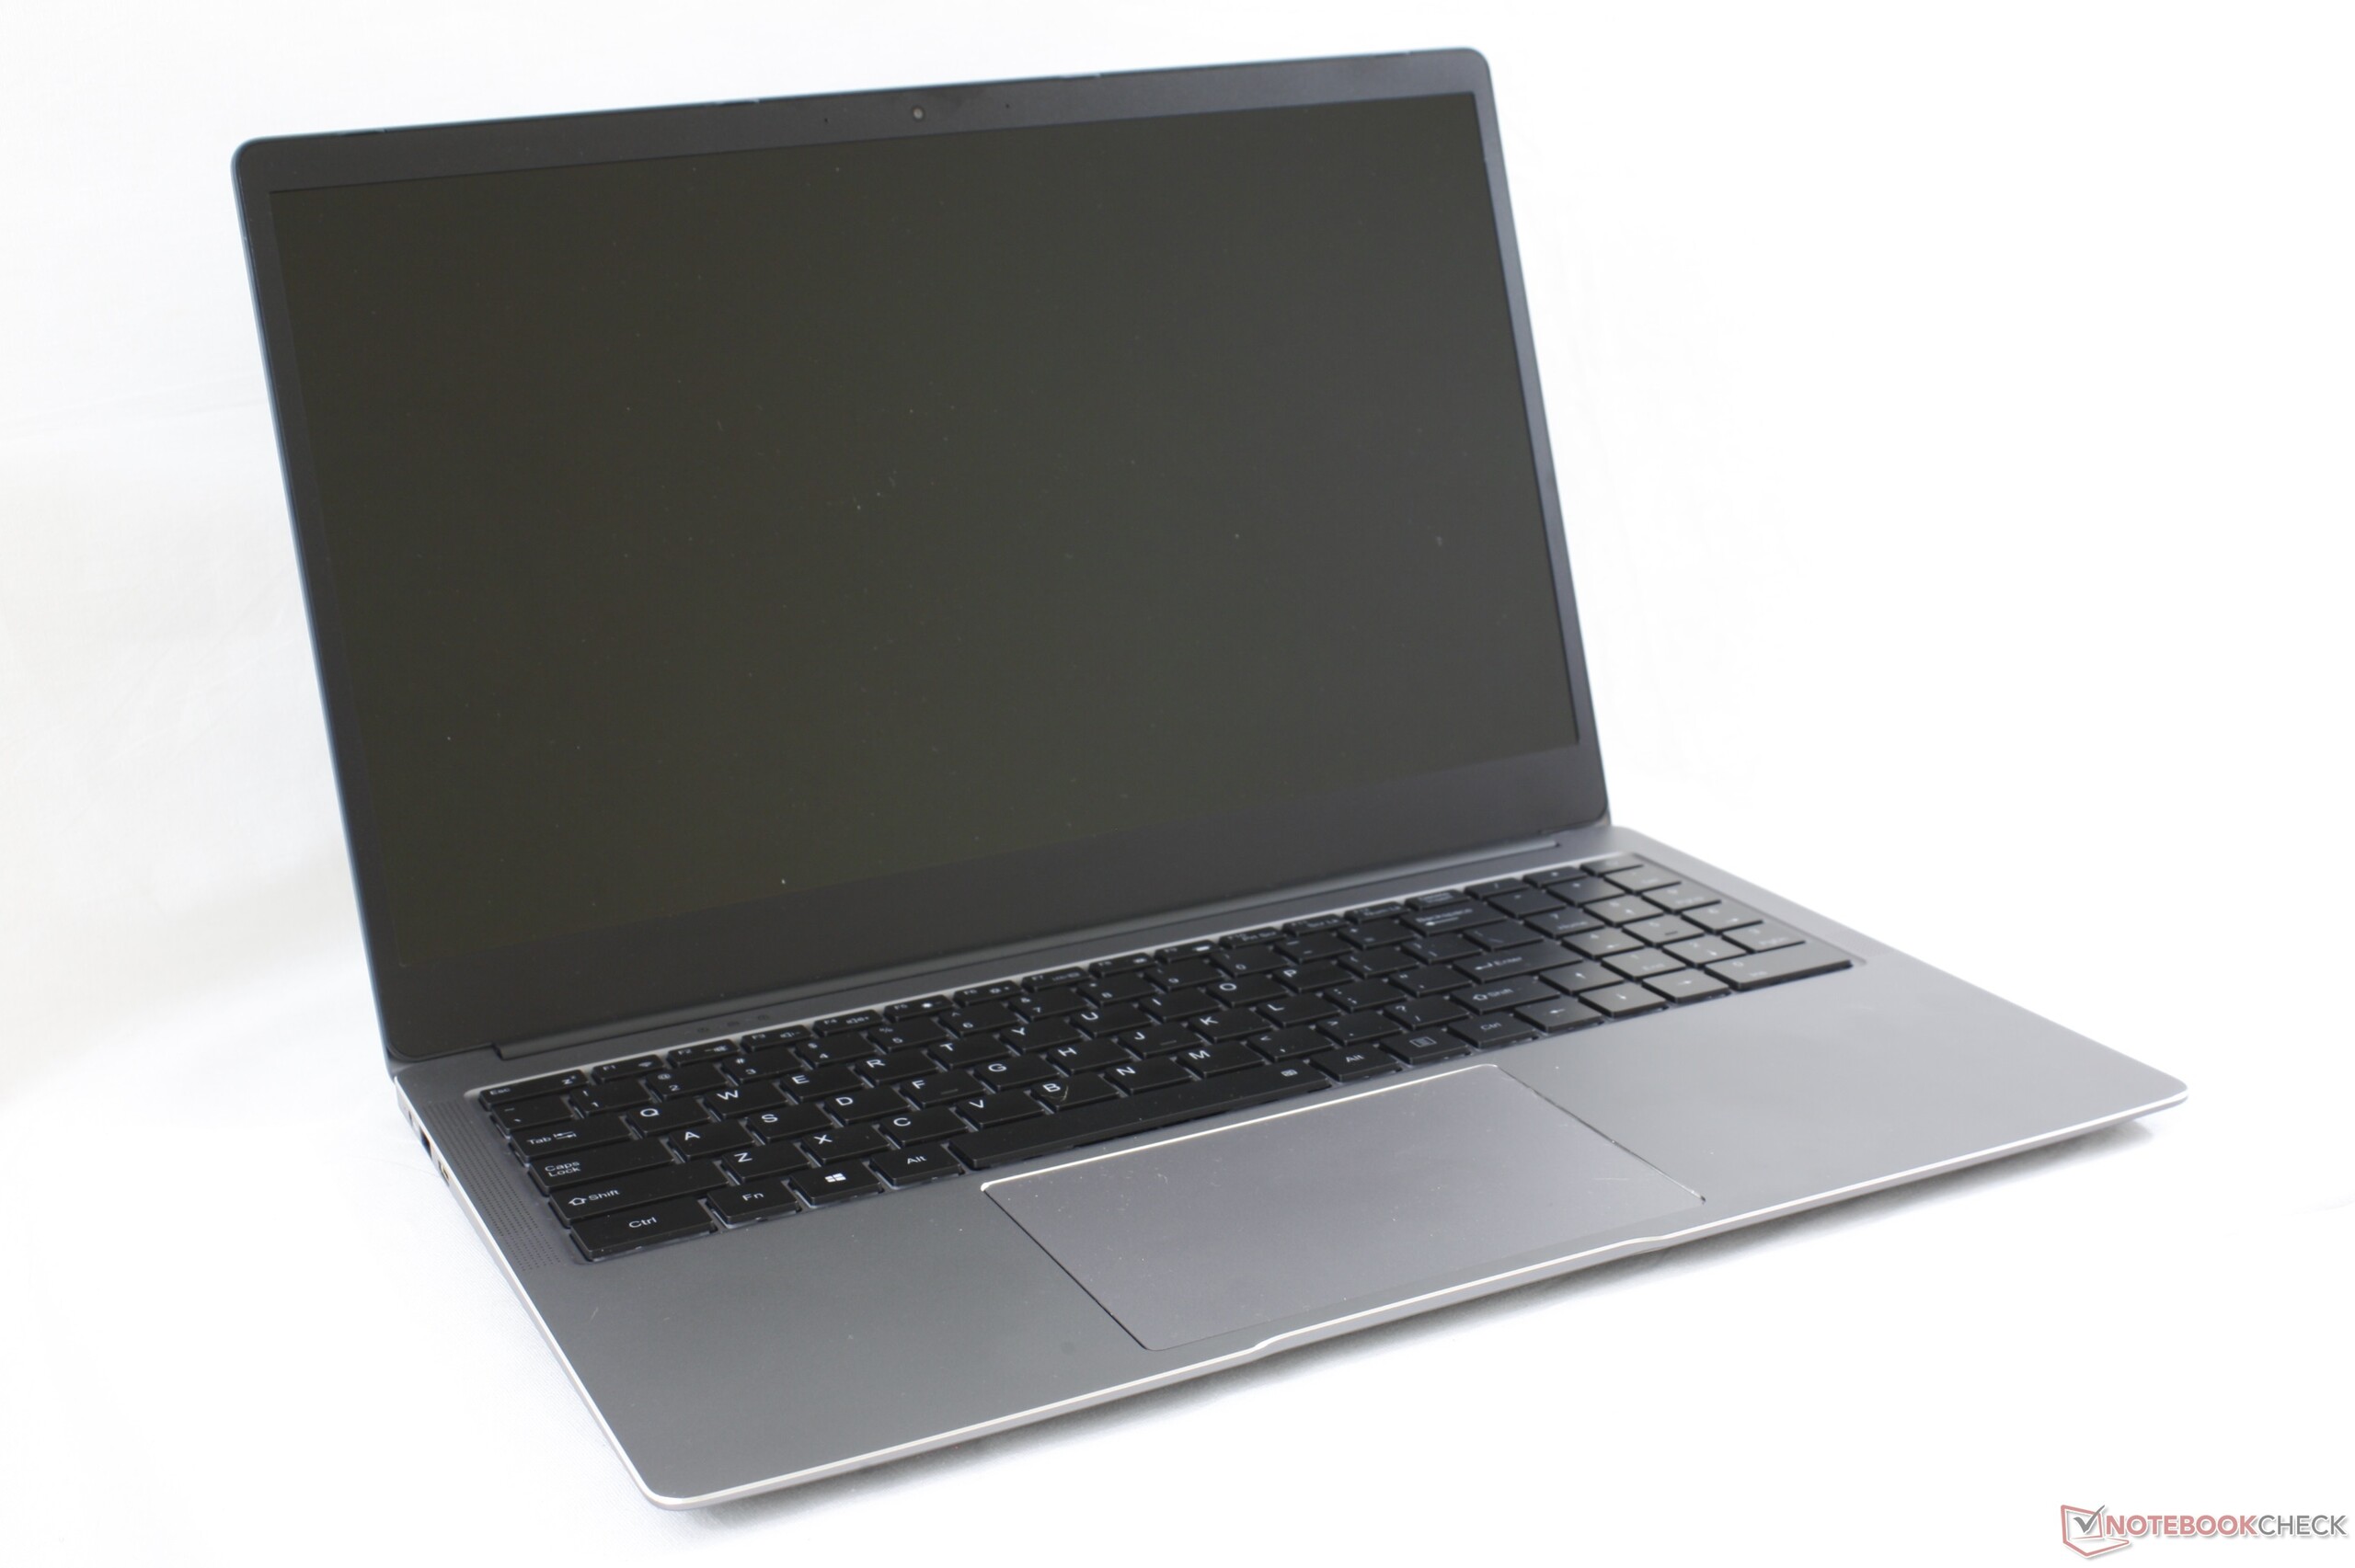

The LapBook Plus can afford to be very thin and lightweight because its very low-power CPU requires no active cooling. In fact, it's lighter than most 15.6-inch laptops with the notable exception of the LG Gram 15. Dimensions are very nearly identical to the Asus VivoBook S15.
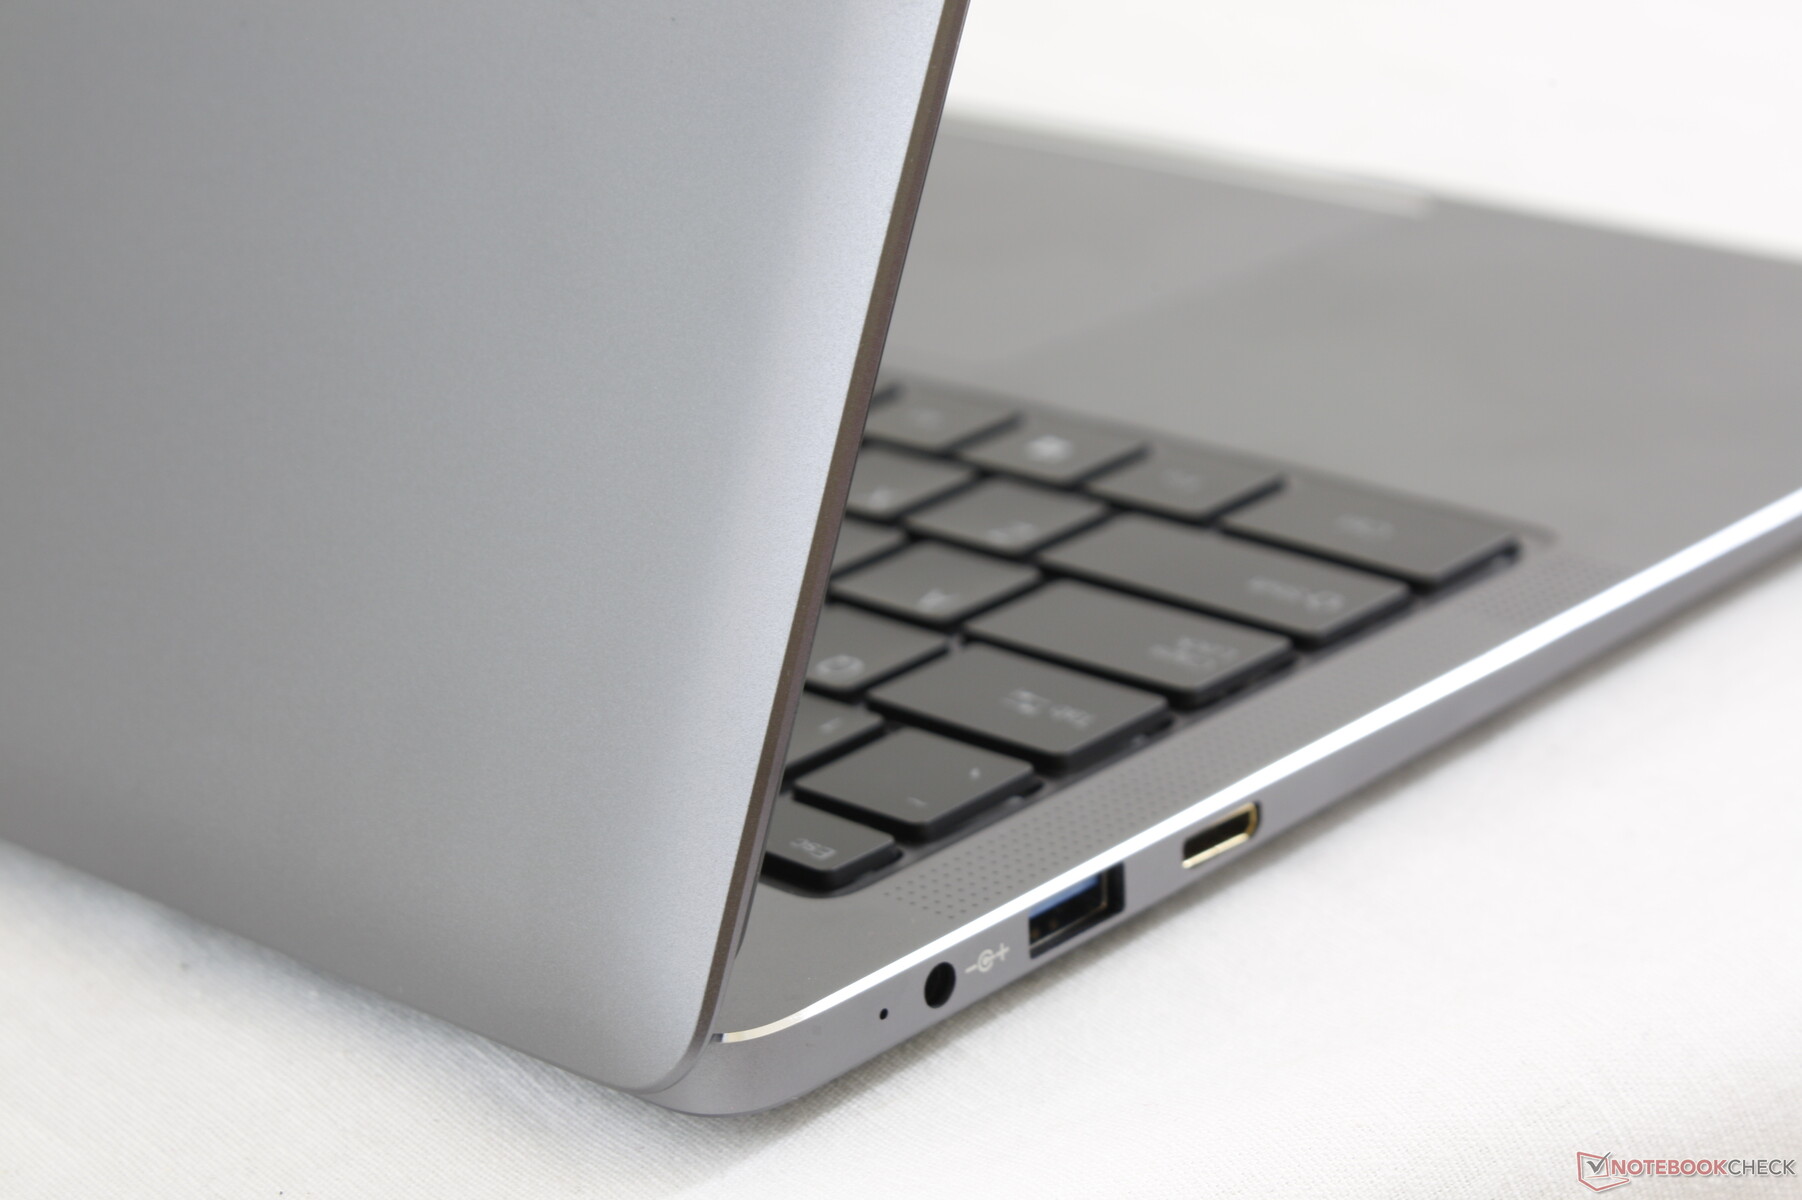
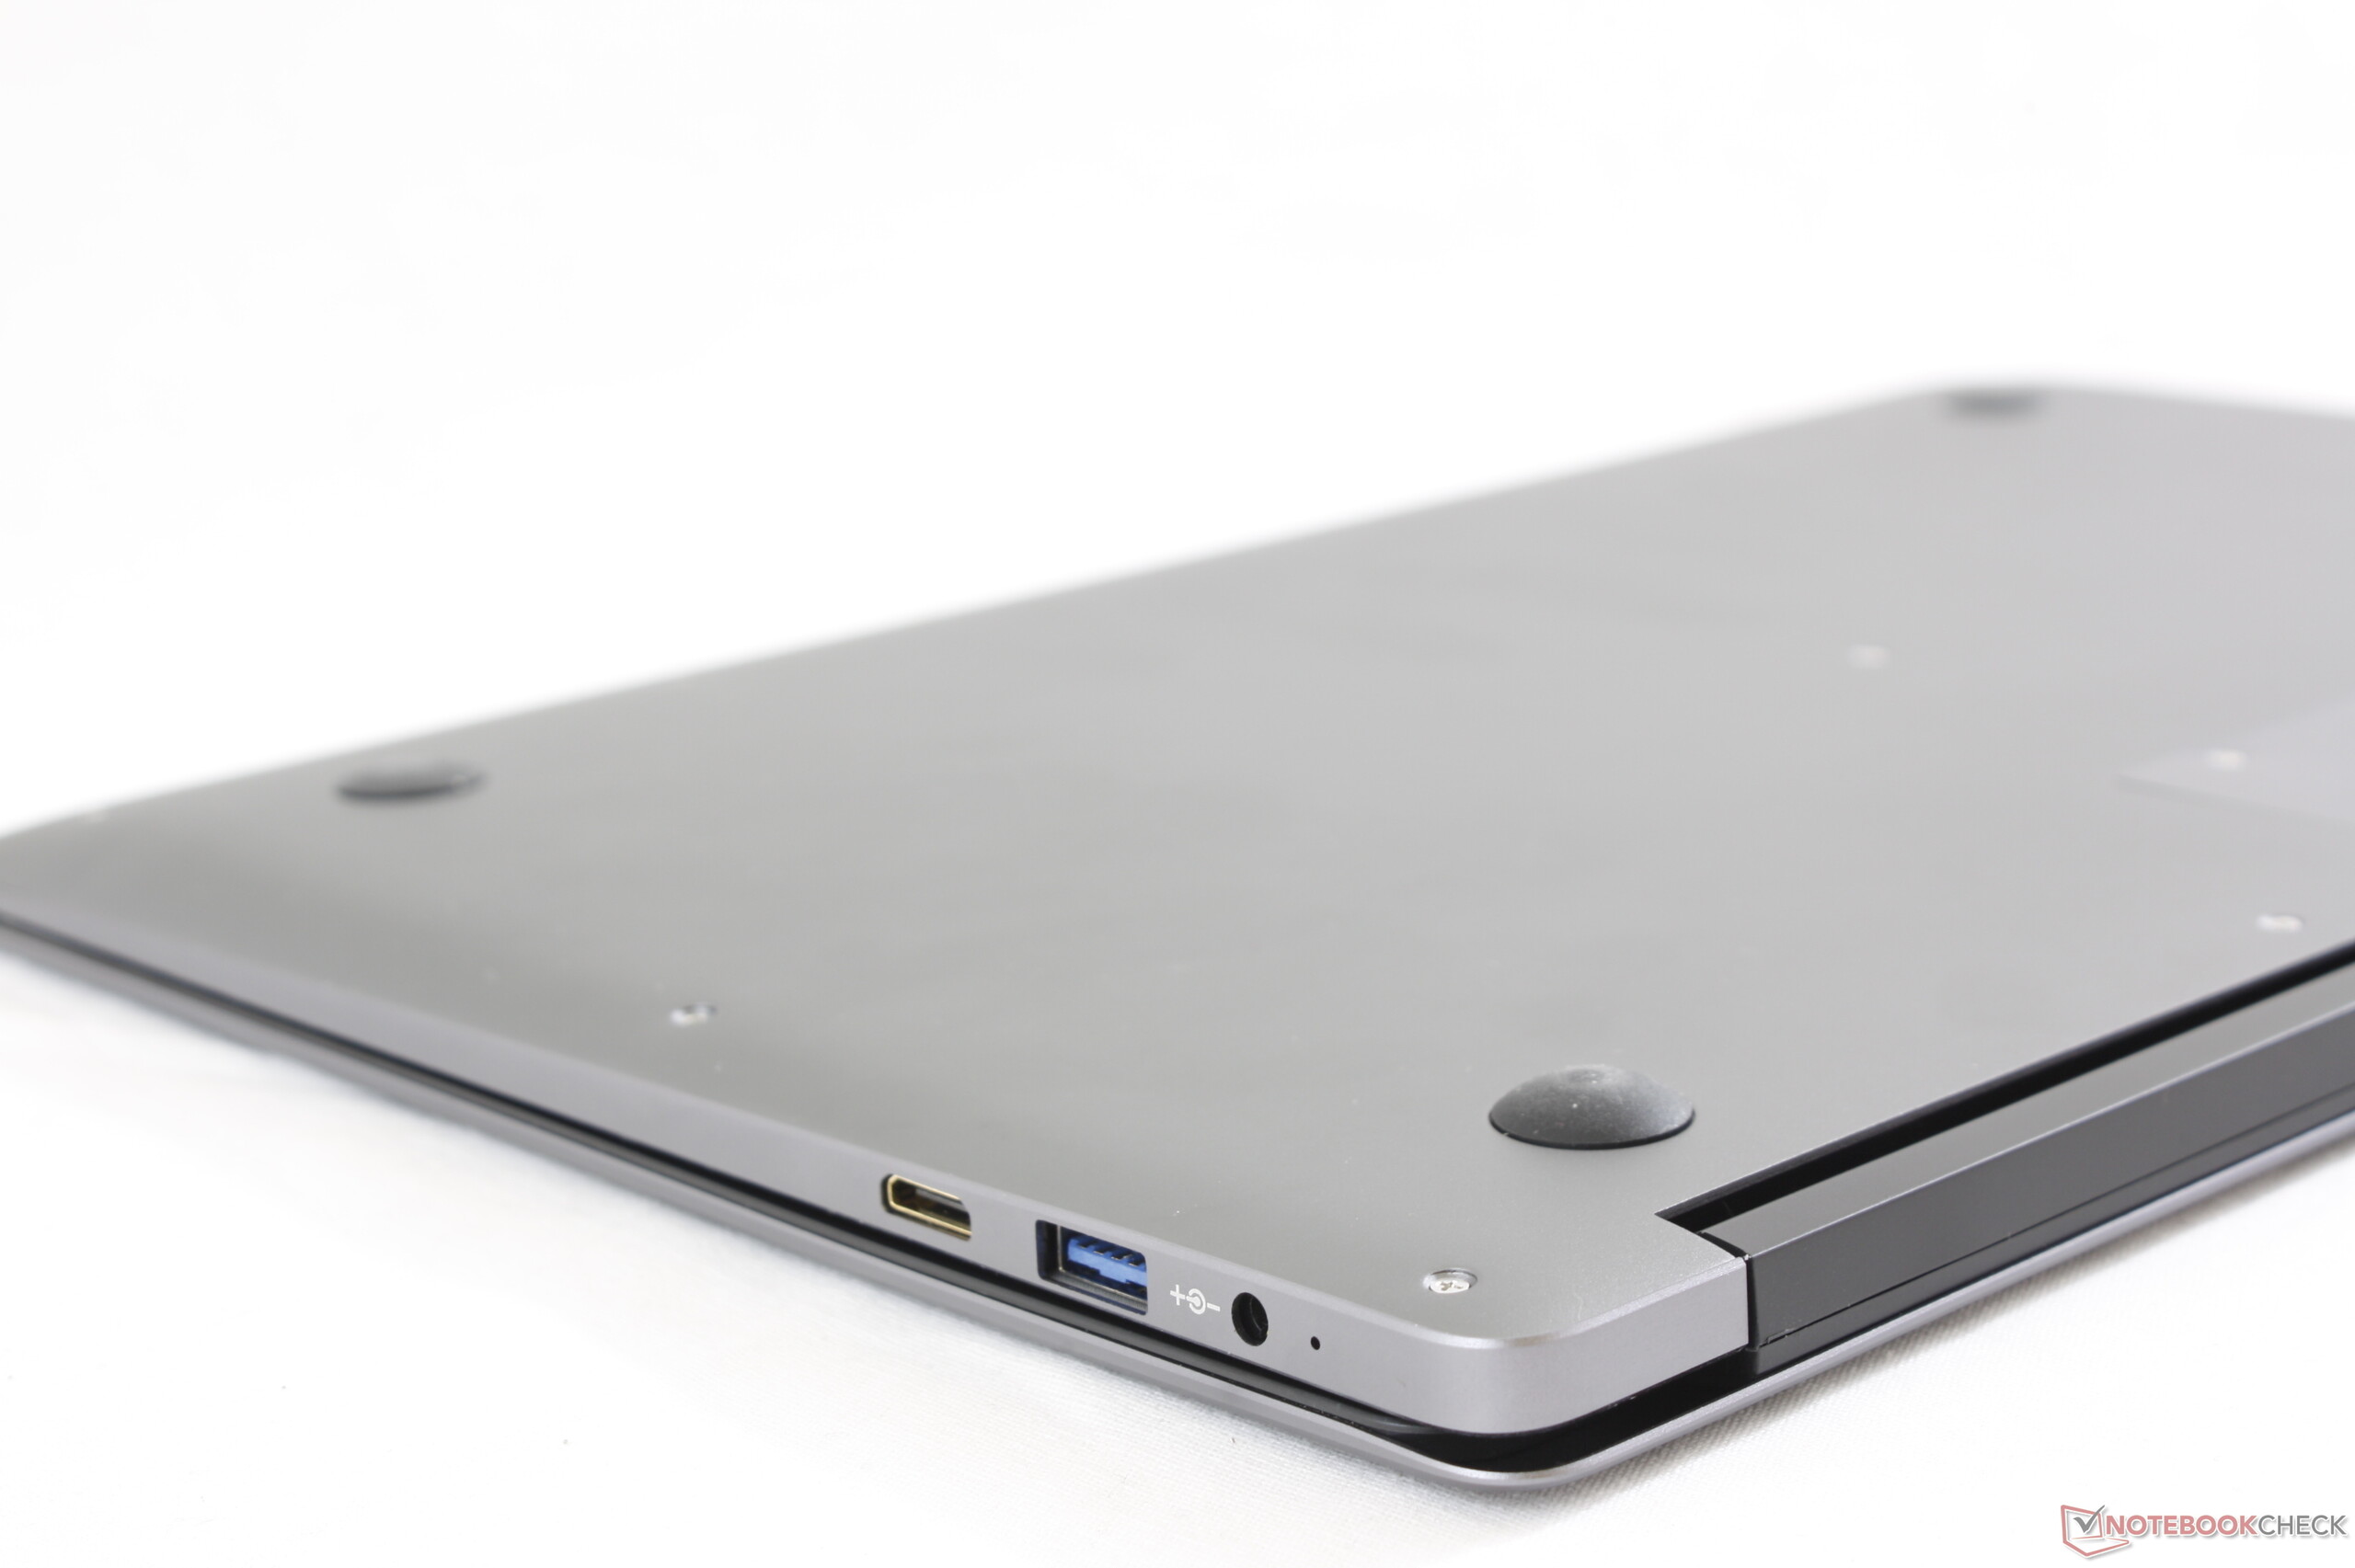
Connectivity
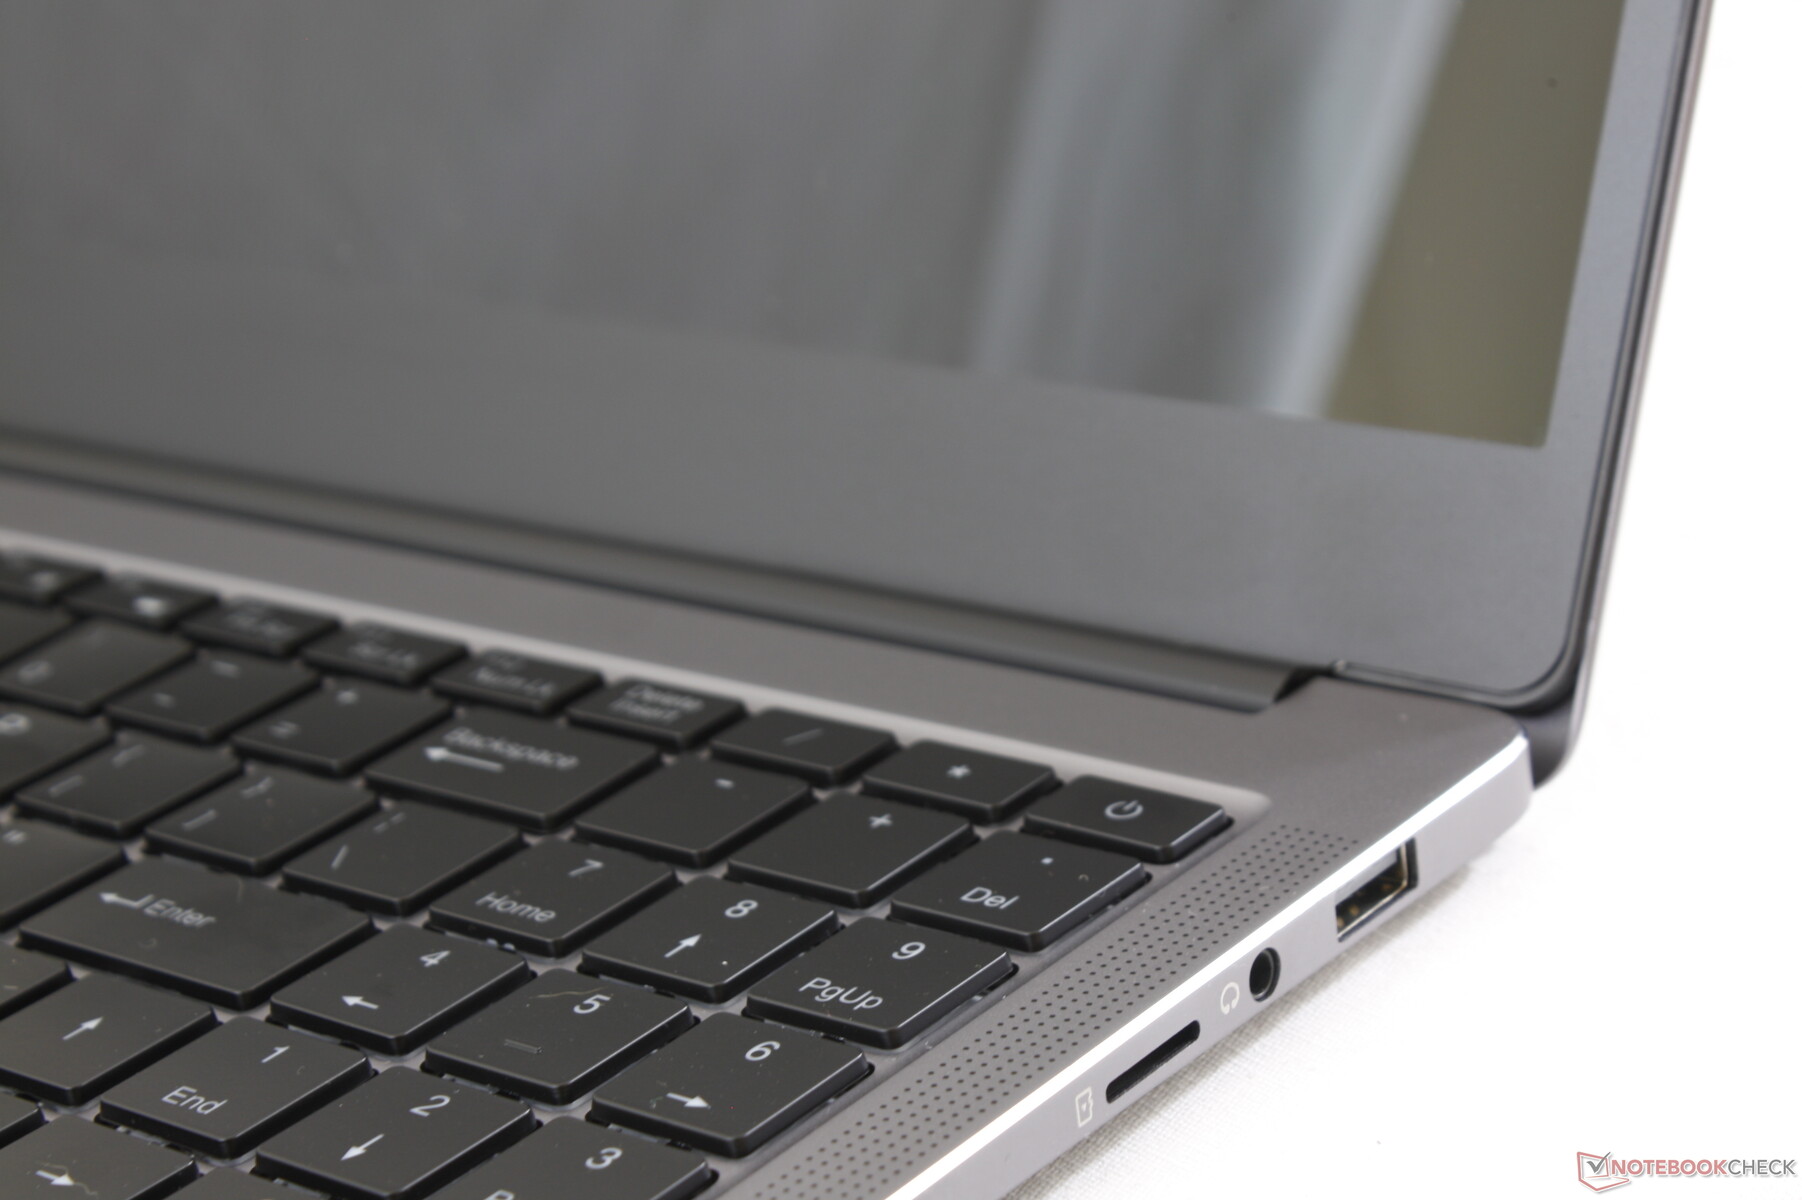
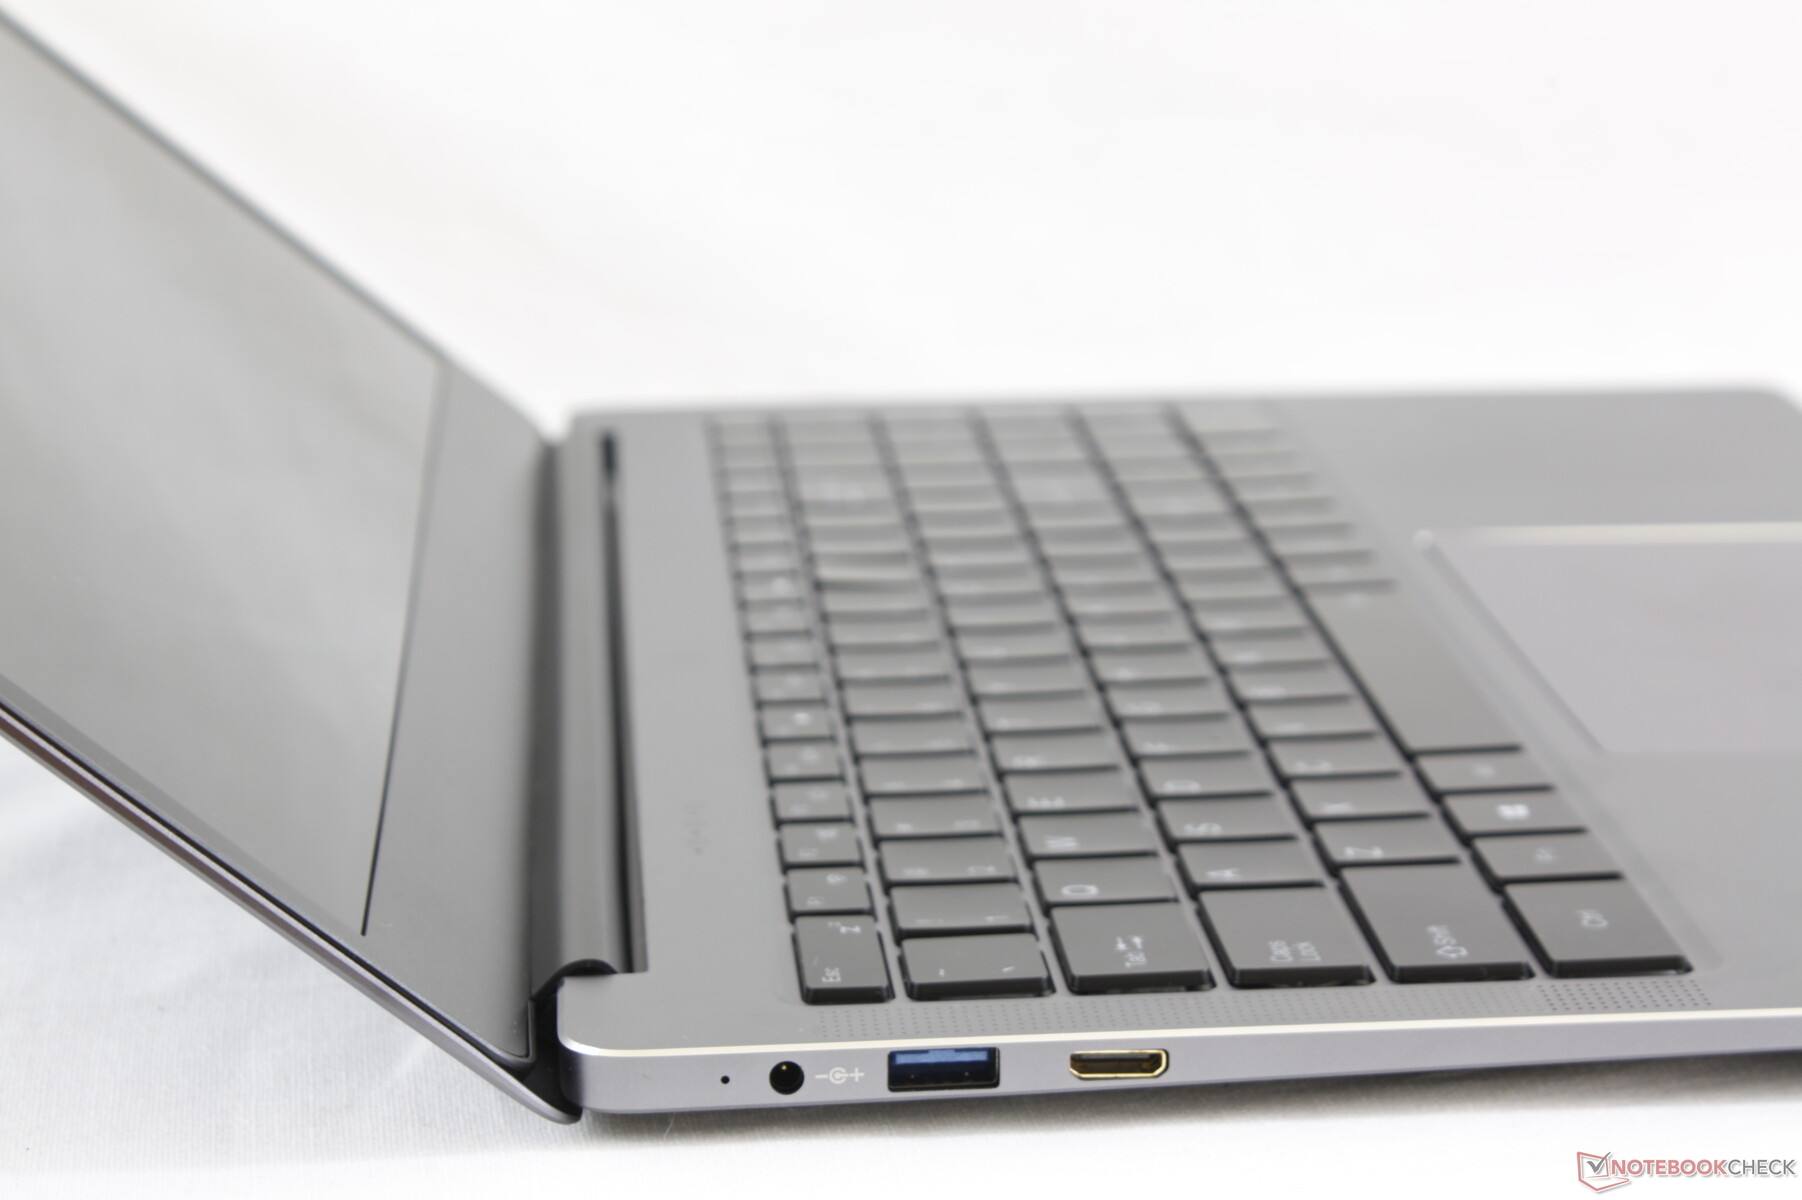
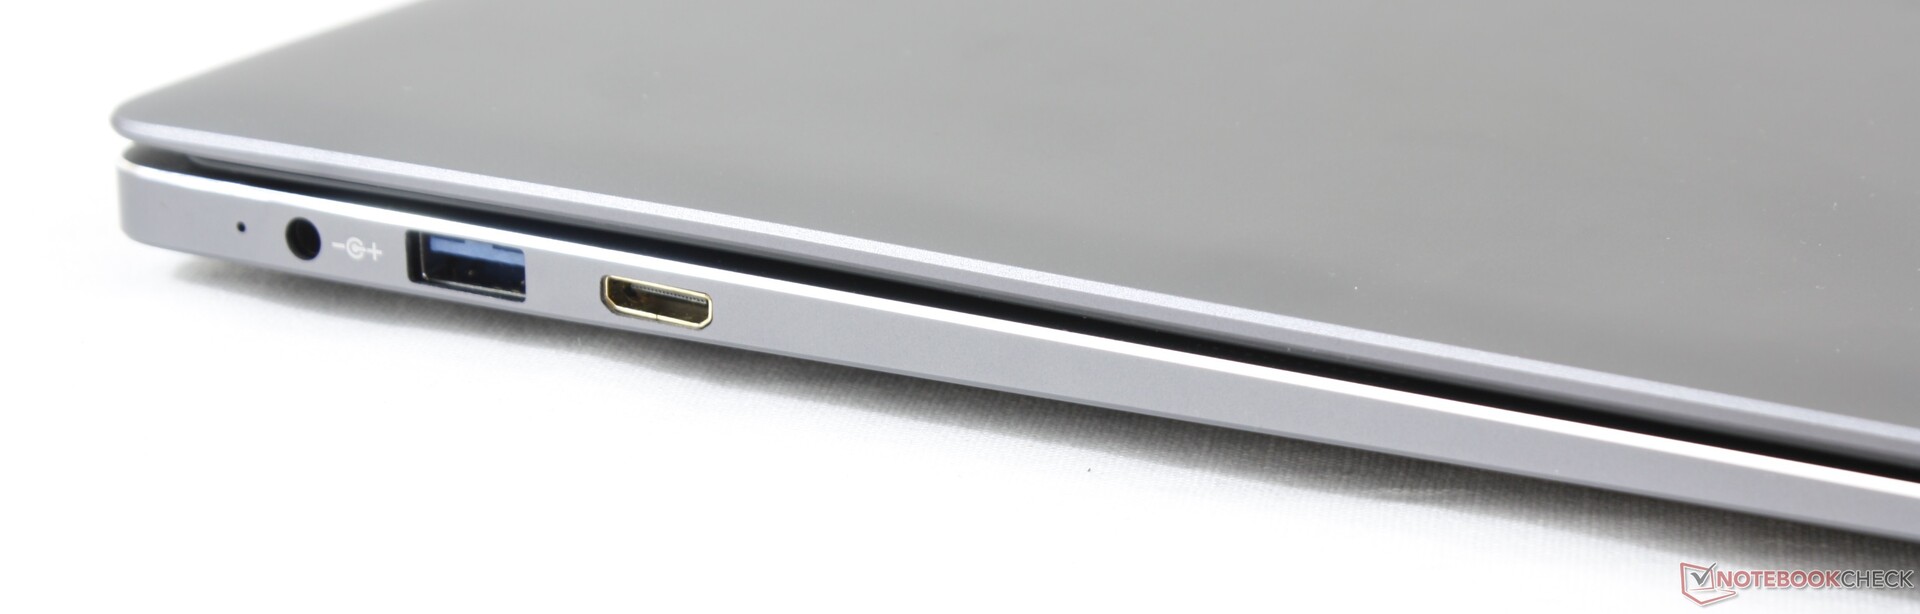
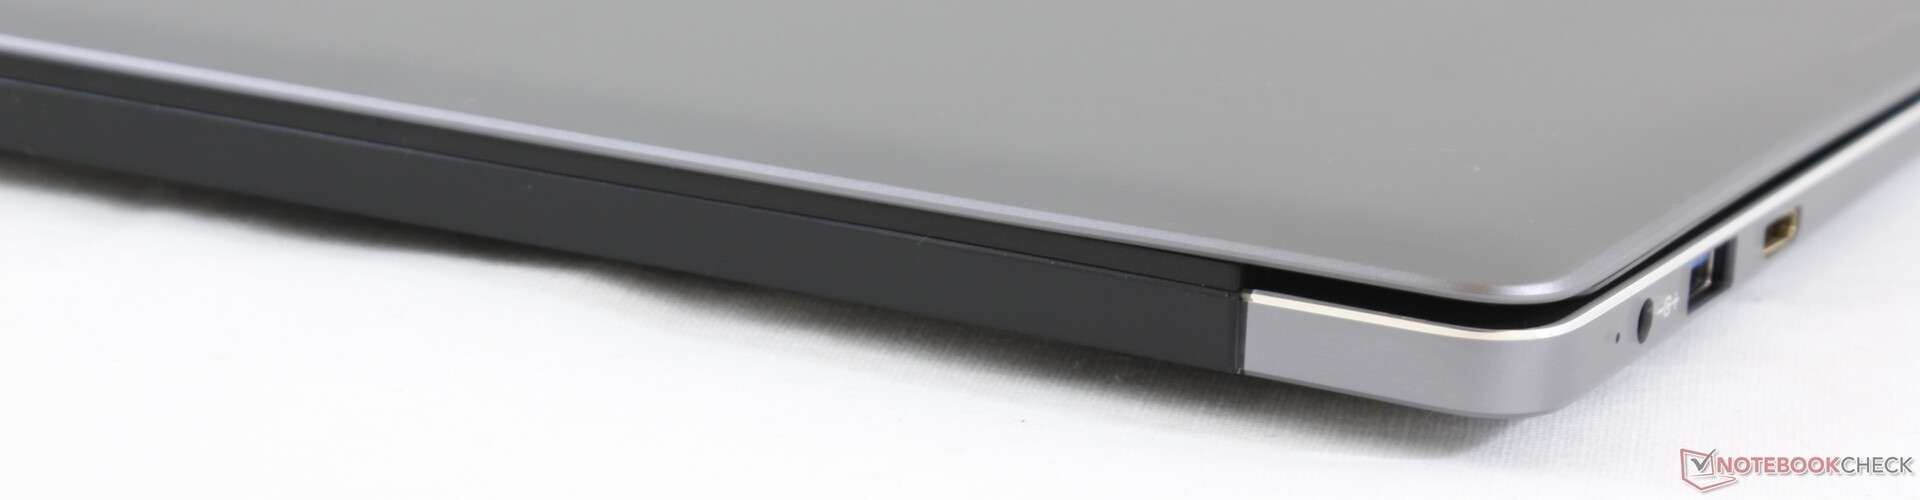
While port positioning is excellent, port options are a mixed bag. The system utilizes the uncommon mini-HDMI port instead of a full-size HDMI and there is no USB Type-C. A proprietary AC adapter is required for charging whereas many other Ultrabooks have already moved on to universal USB Type-C charging.
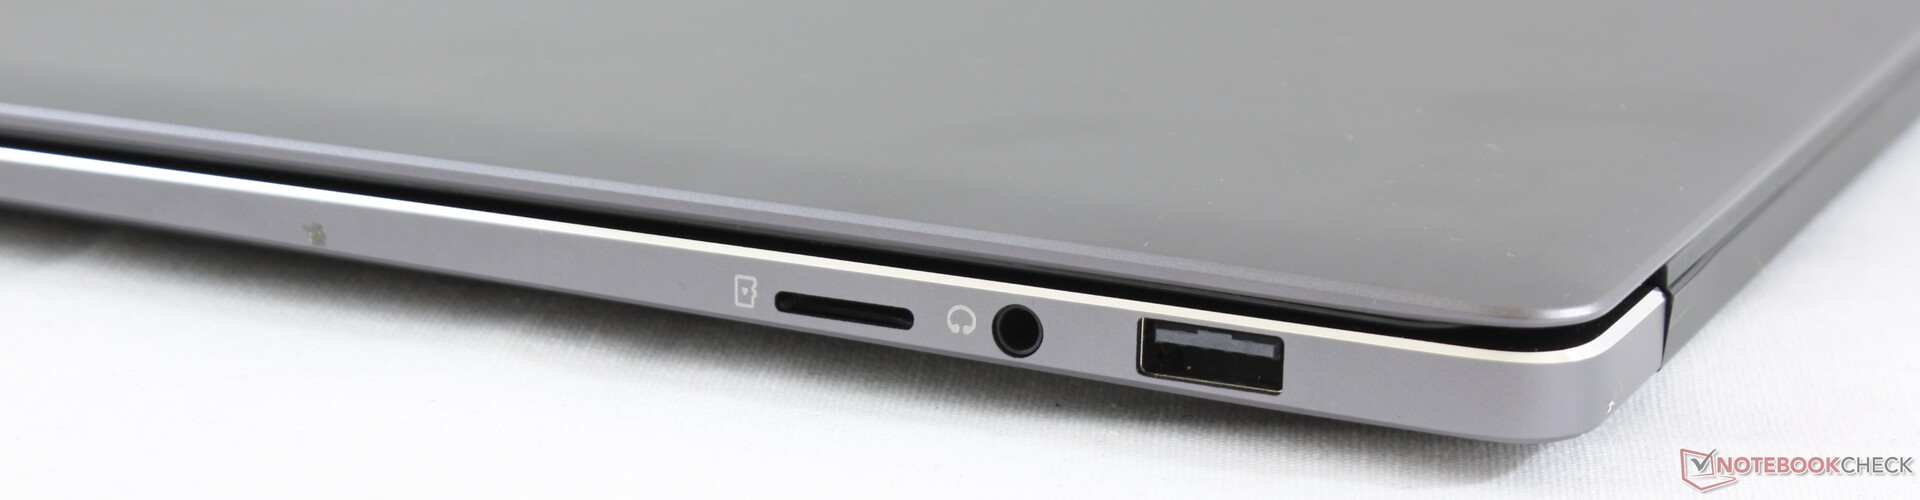
SD Card Reader
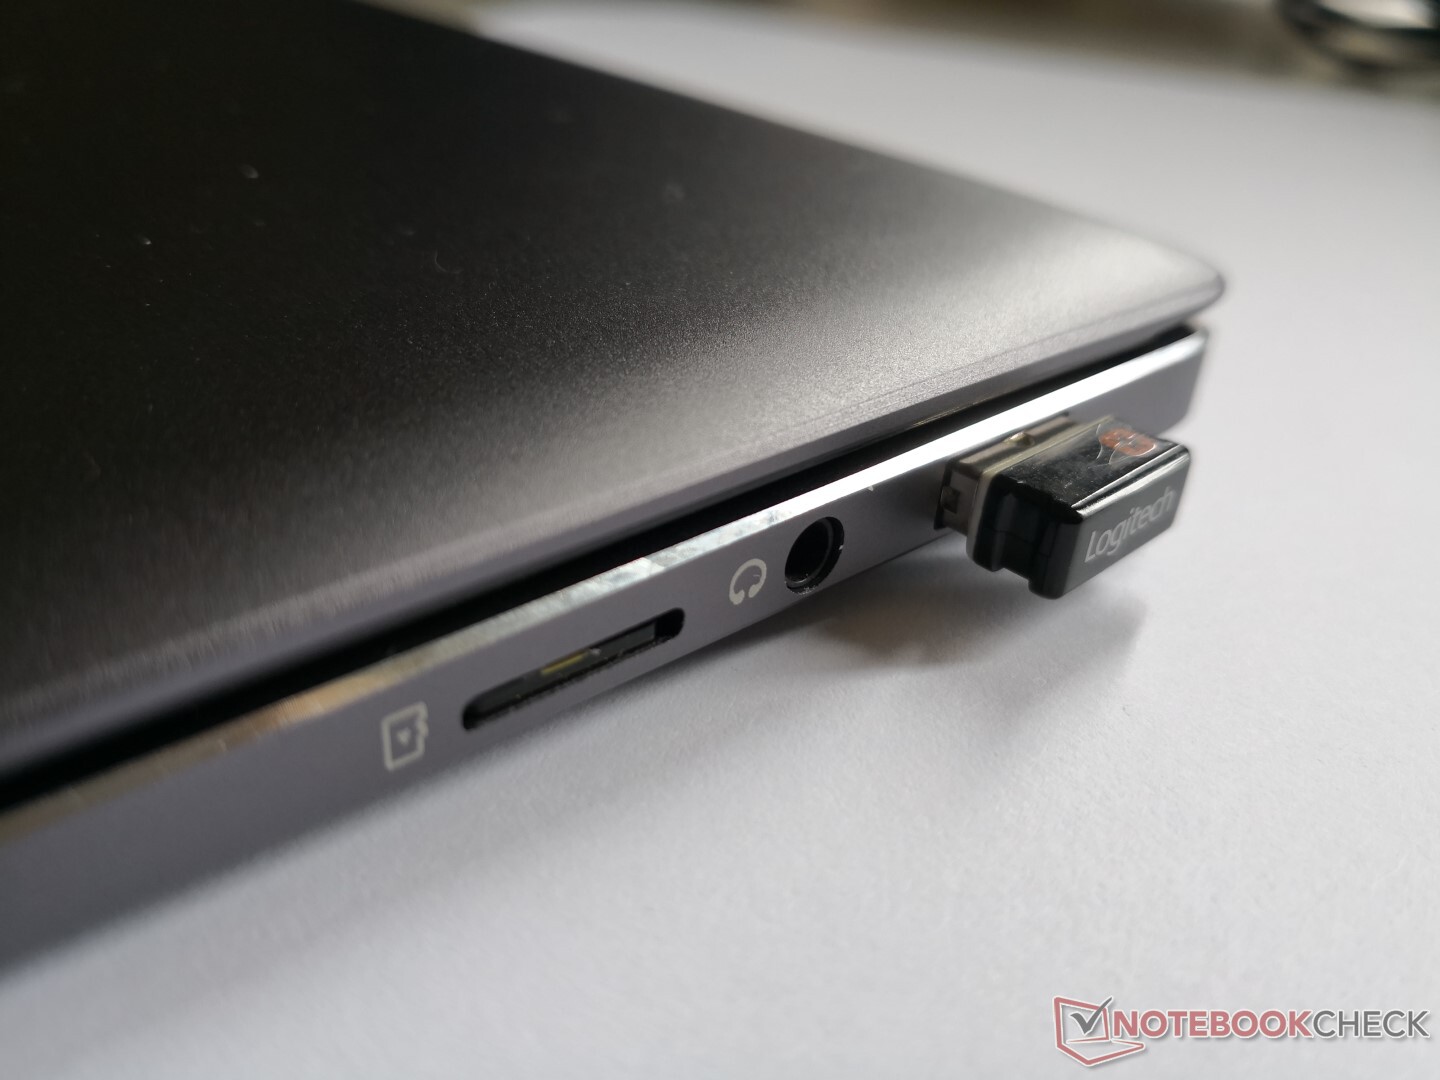
Transfer rates from the integrated MicroSD card reader are slow at only about 16 MB/s. Moving 1 GB of images from our UHS-II test card to desktop takes 45 seconds compared to under 8 seconds on the XPS 15.
Perhaps the worst aspect of the spring-loaded card reader slot is that a fully inserted MicroSD card sits inside slot to be very difficult to eject without a long fingernail or sharp pen.
| SD Card Reader | |
| average JPG Copy Test (av. of 3 runs) | |
| Dell XPS 15 9570 i7 UHD (Toshiba Exceria Pro SDXC 64 GB UHS-II) | |
| HP Spectre x360 15-df0126ng (Toshiba Exceria Pro M501 microSDXC 64GB) | |
| HP Pavilion 15-cs2019ng (Toshiba Exceria Pro SDXC 64 GB UHS-II) | |
| Asus VivoBook S15 S530UN-BQ097T (Toshiba Exceria Pro M501 64 GB UHS-II) | |
| Chuwi LapBook Plus (Toshiba Exceria Pro M501 microSDXC) | |
| maximum AS SSD Seq Read Test (1GB) | |
| HP Spectre x360 15-df0126ng (Toshiba Exceria Pro M501 microSDXC 64GB) | |
| Dell XPS 15 9570 i7 UHD (Toshiba Exceria Pro SDXC 64 GB UHS-II) | |
| HP Pavilion 15-cs2019ng (Toshiba Exceria Pro SDXC 64 GB UHS-II) | |
| Asus VivoBook S15 S530UN-BQ097T (Toshiba Exceria Pro M501 64 GB UHS-II) | |
| Chuwi LapBook Plus (Toshiba Exceria Pro M501 microSDXC) | |
Communication
An integrated Intel 3165 module provides WLAN and Bluetooth 4.2. Transfer rates are limited to a theoretical 433 Mbps compared to 1.73 Gbps with the Intel 9560 commonly found on newer Ultrabooks. We experienced a couple of connectivity issues during the start of testing, but they never propped up again thereafter.
| Networking | |
| iperf3 transmit AX12 | |
| Asus VivoBook S15 S530UN-BQ097T | |
| Dell XPS 15 9570 i7 UHD | |
| HP Pavilion 15-cs2019ng | |
| Chuwi LapBook Plus | |
| iperf3 receive AX12 | |
| HP Pavilion 15-cs2019ng | |
| Dell XPS 15 9570 i7 UHD | |
| Chuwi LapBook Plus | |
| Asus VivoBook S15 S530UN-BQ097T | |
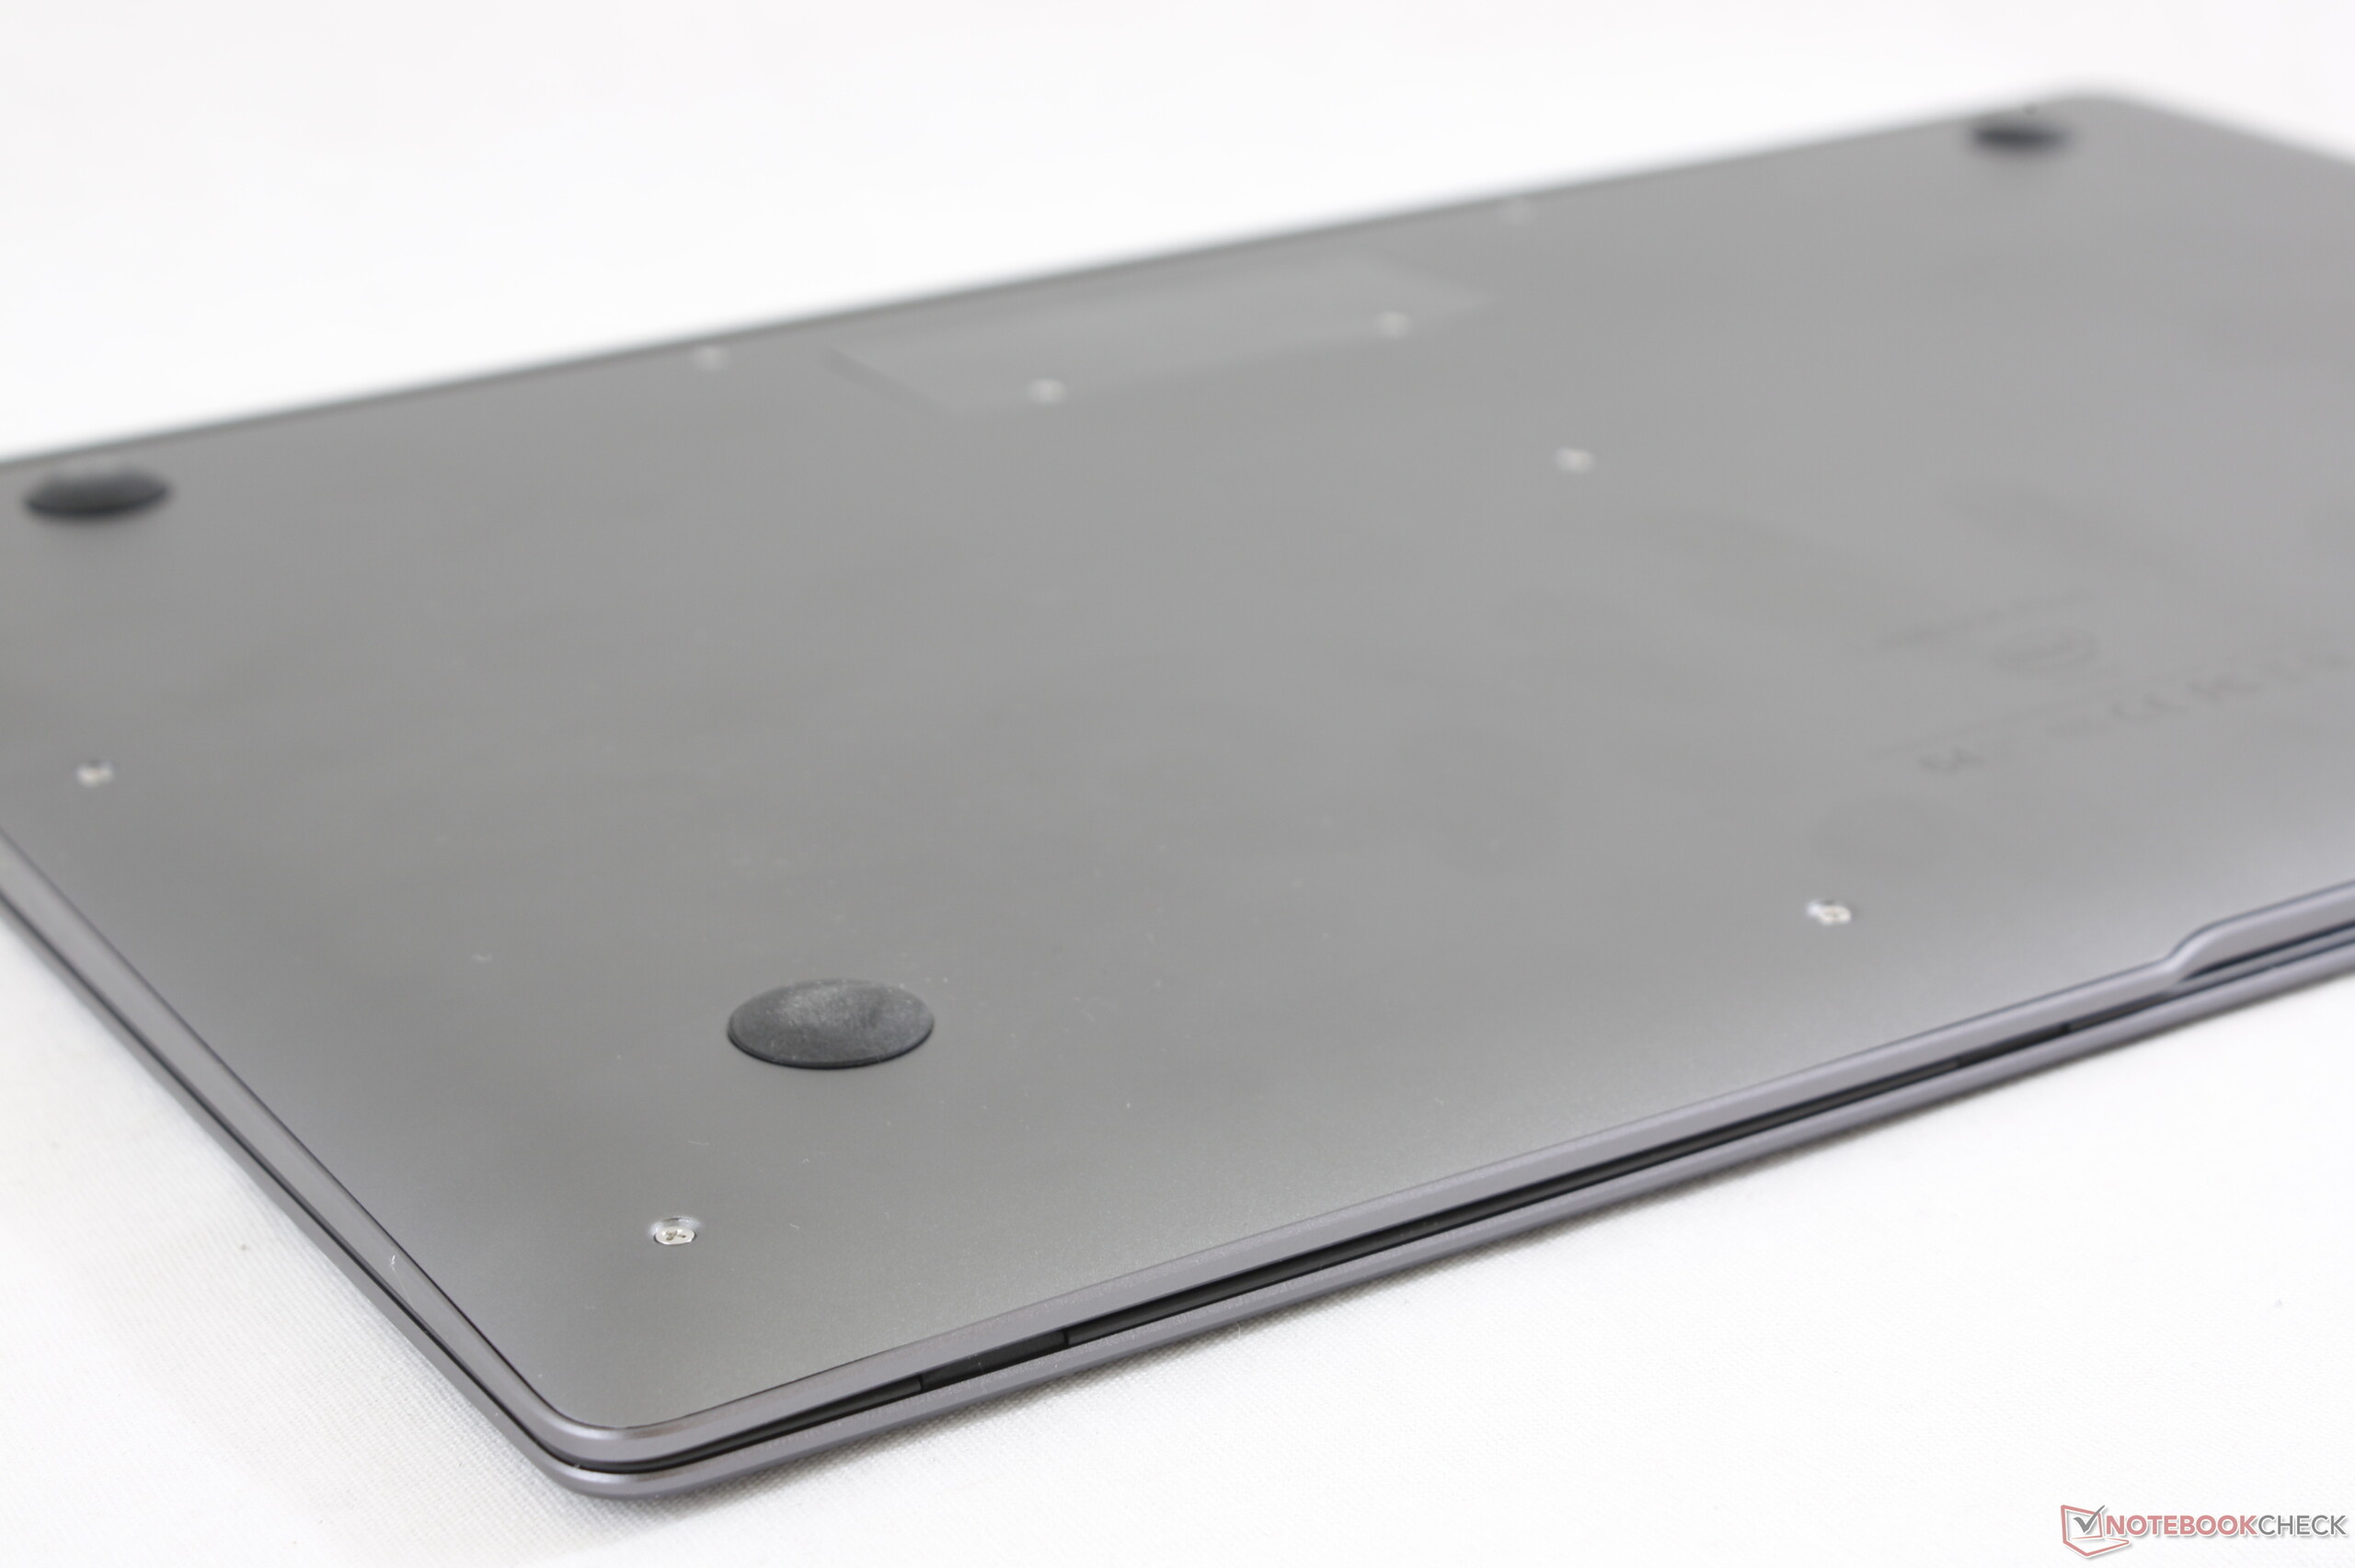
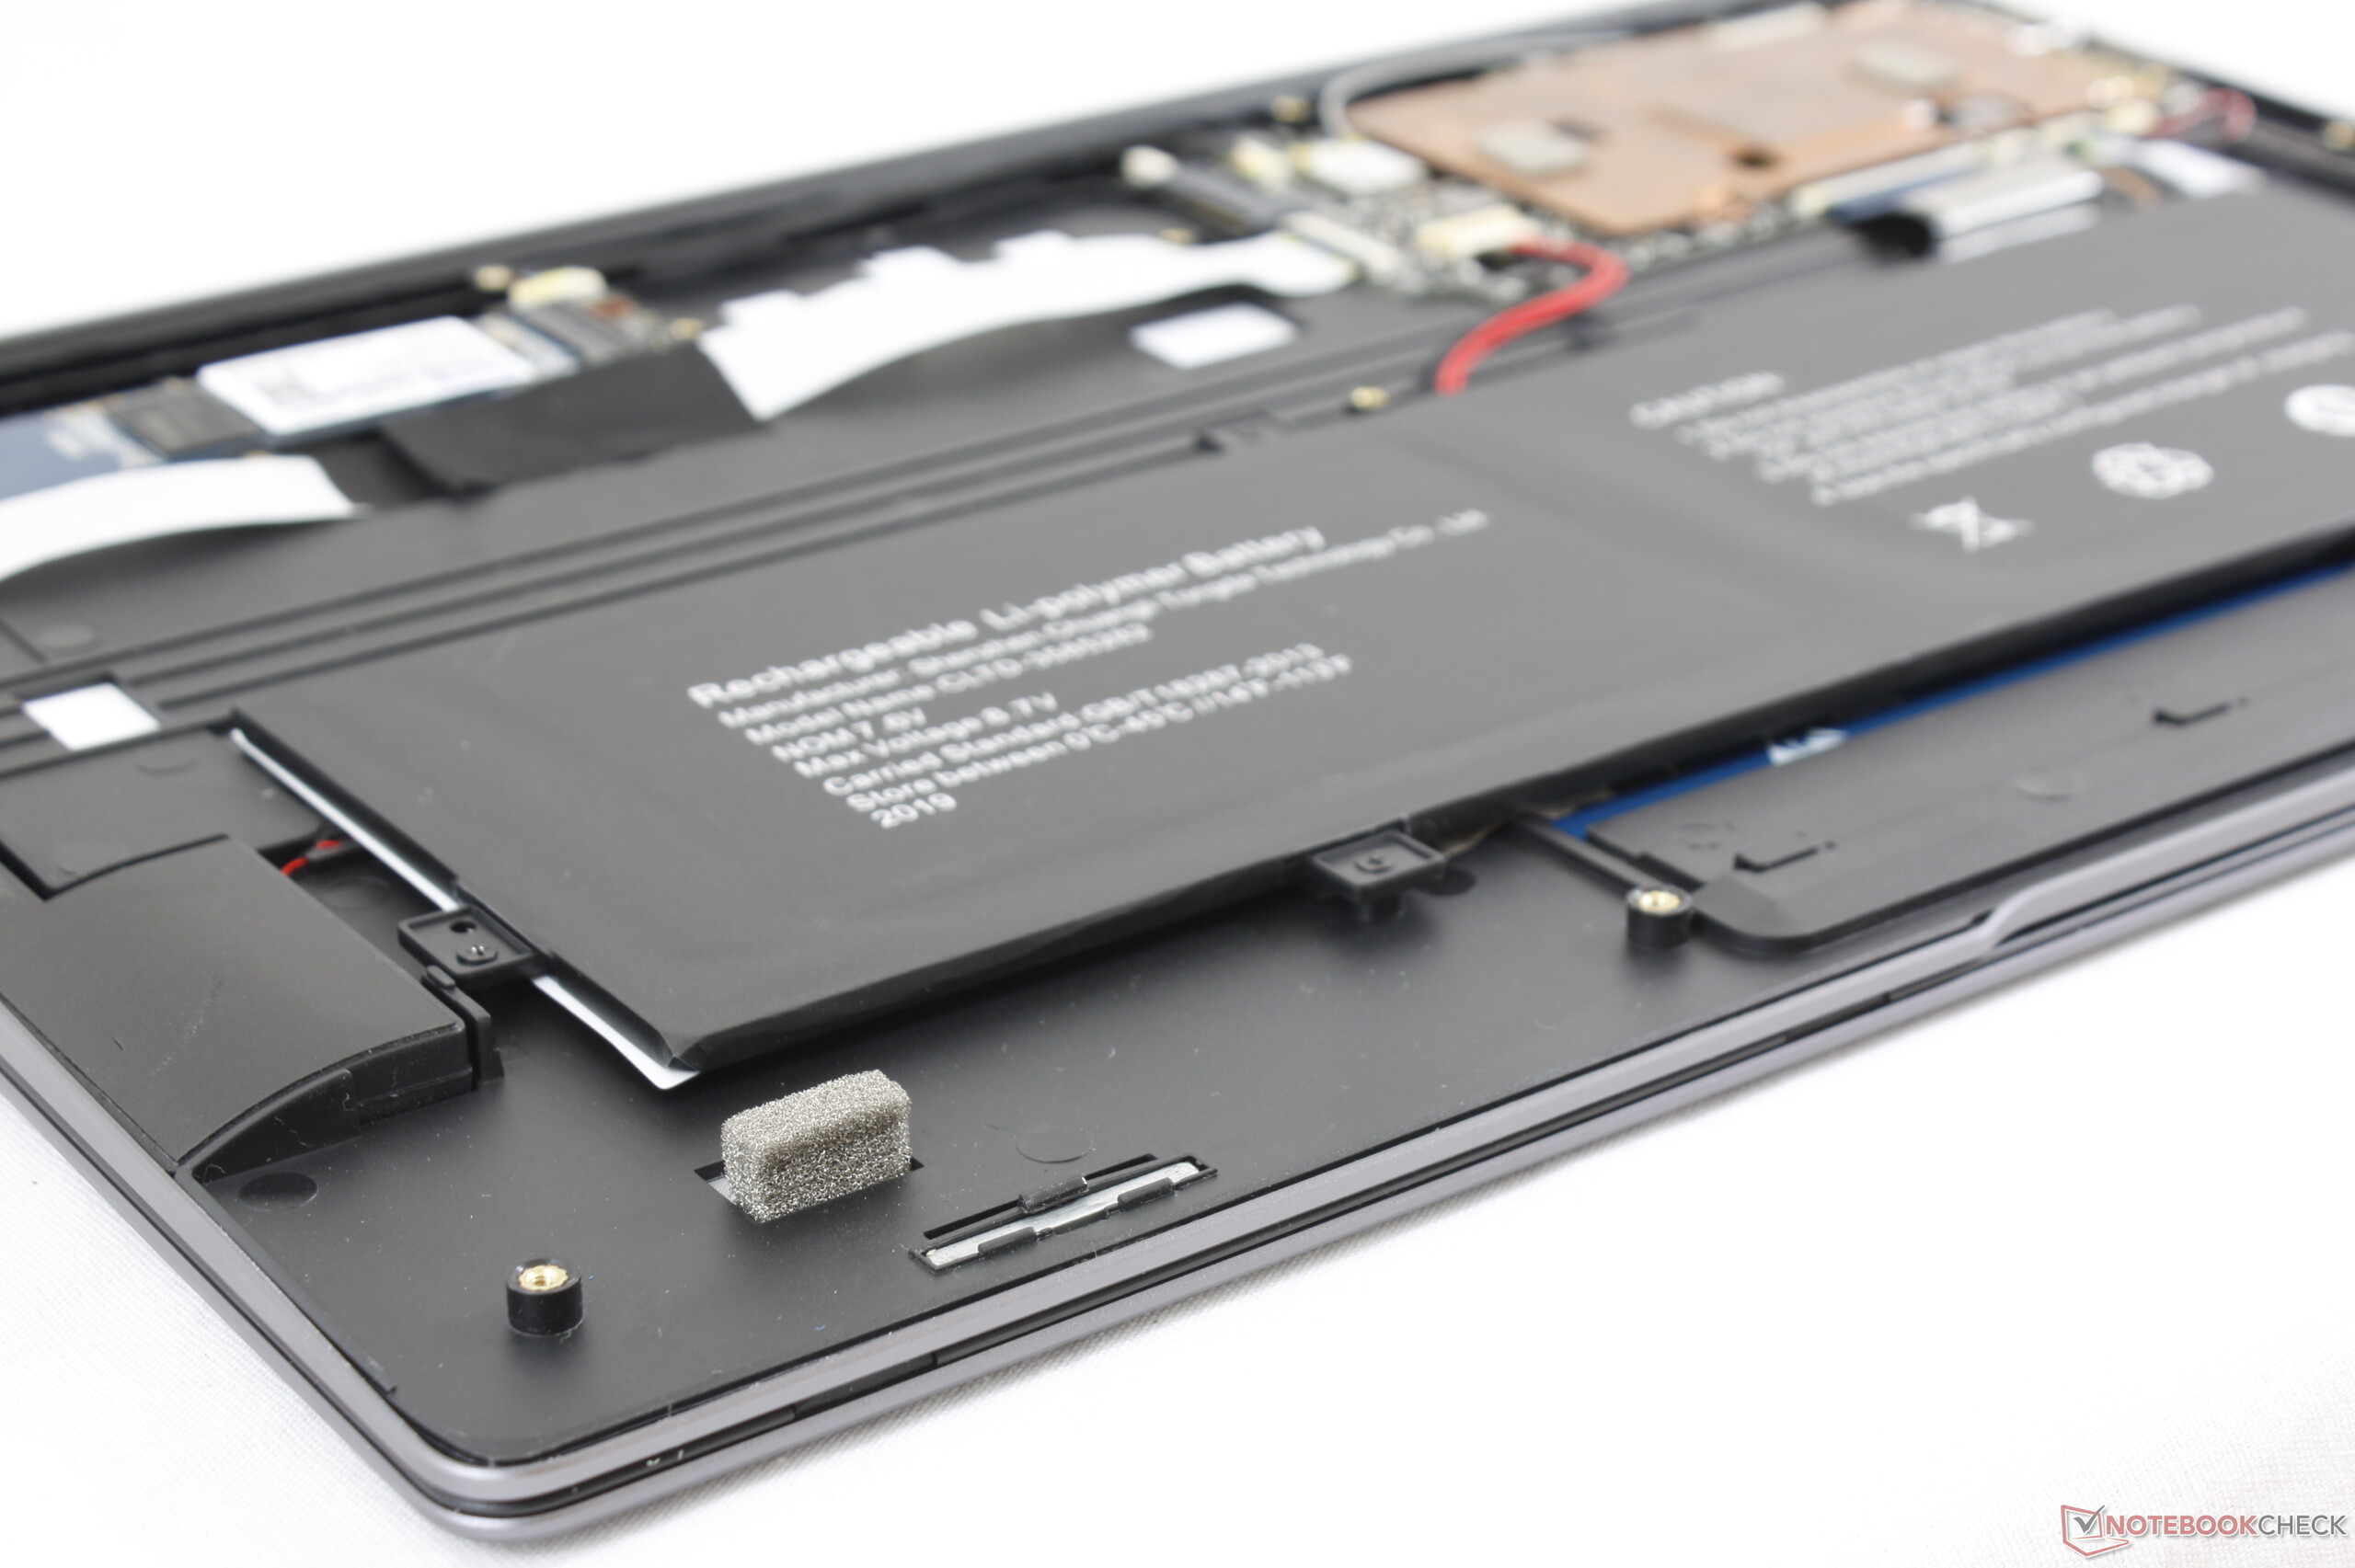
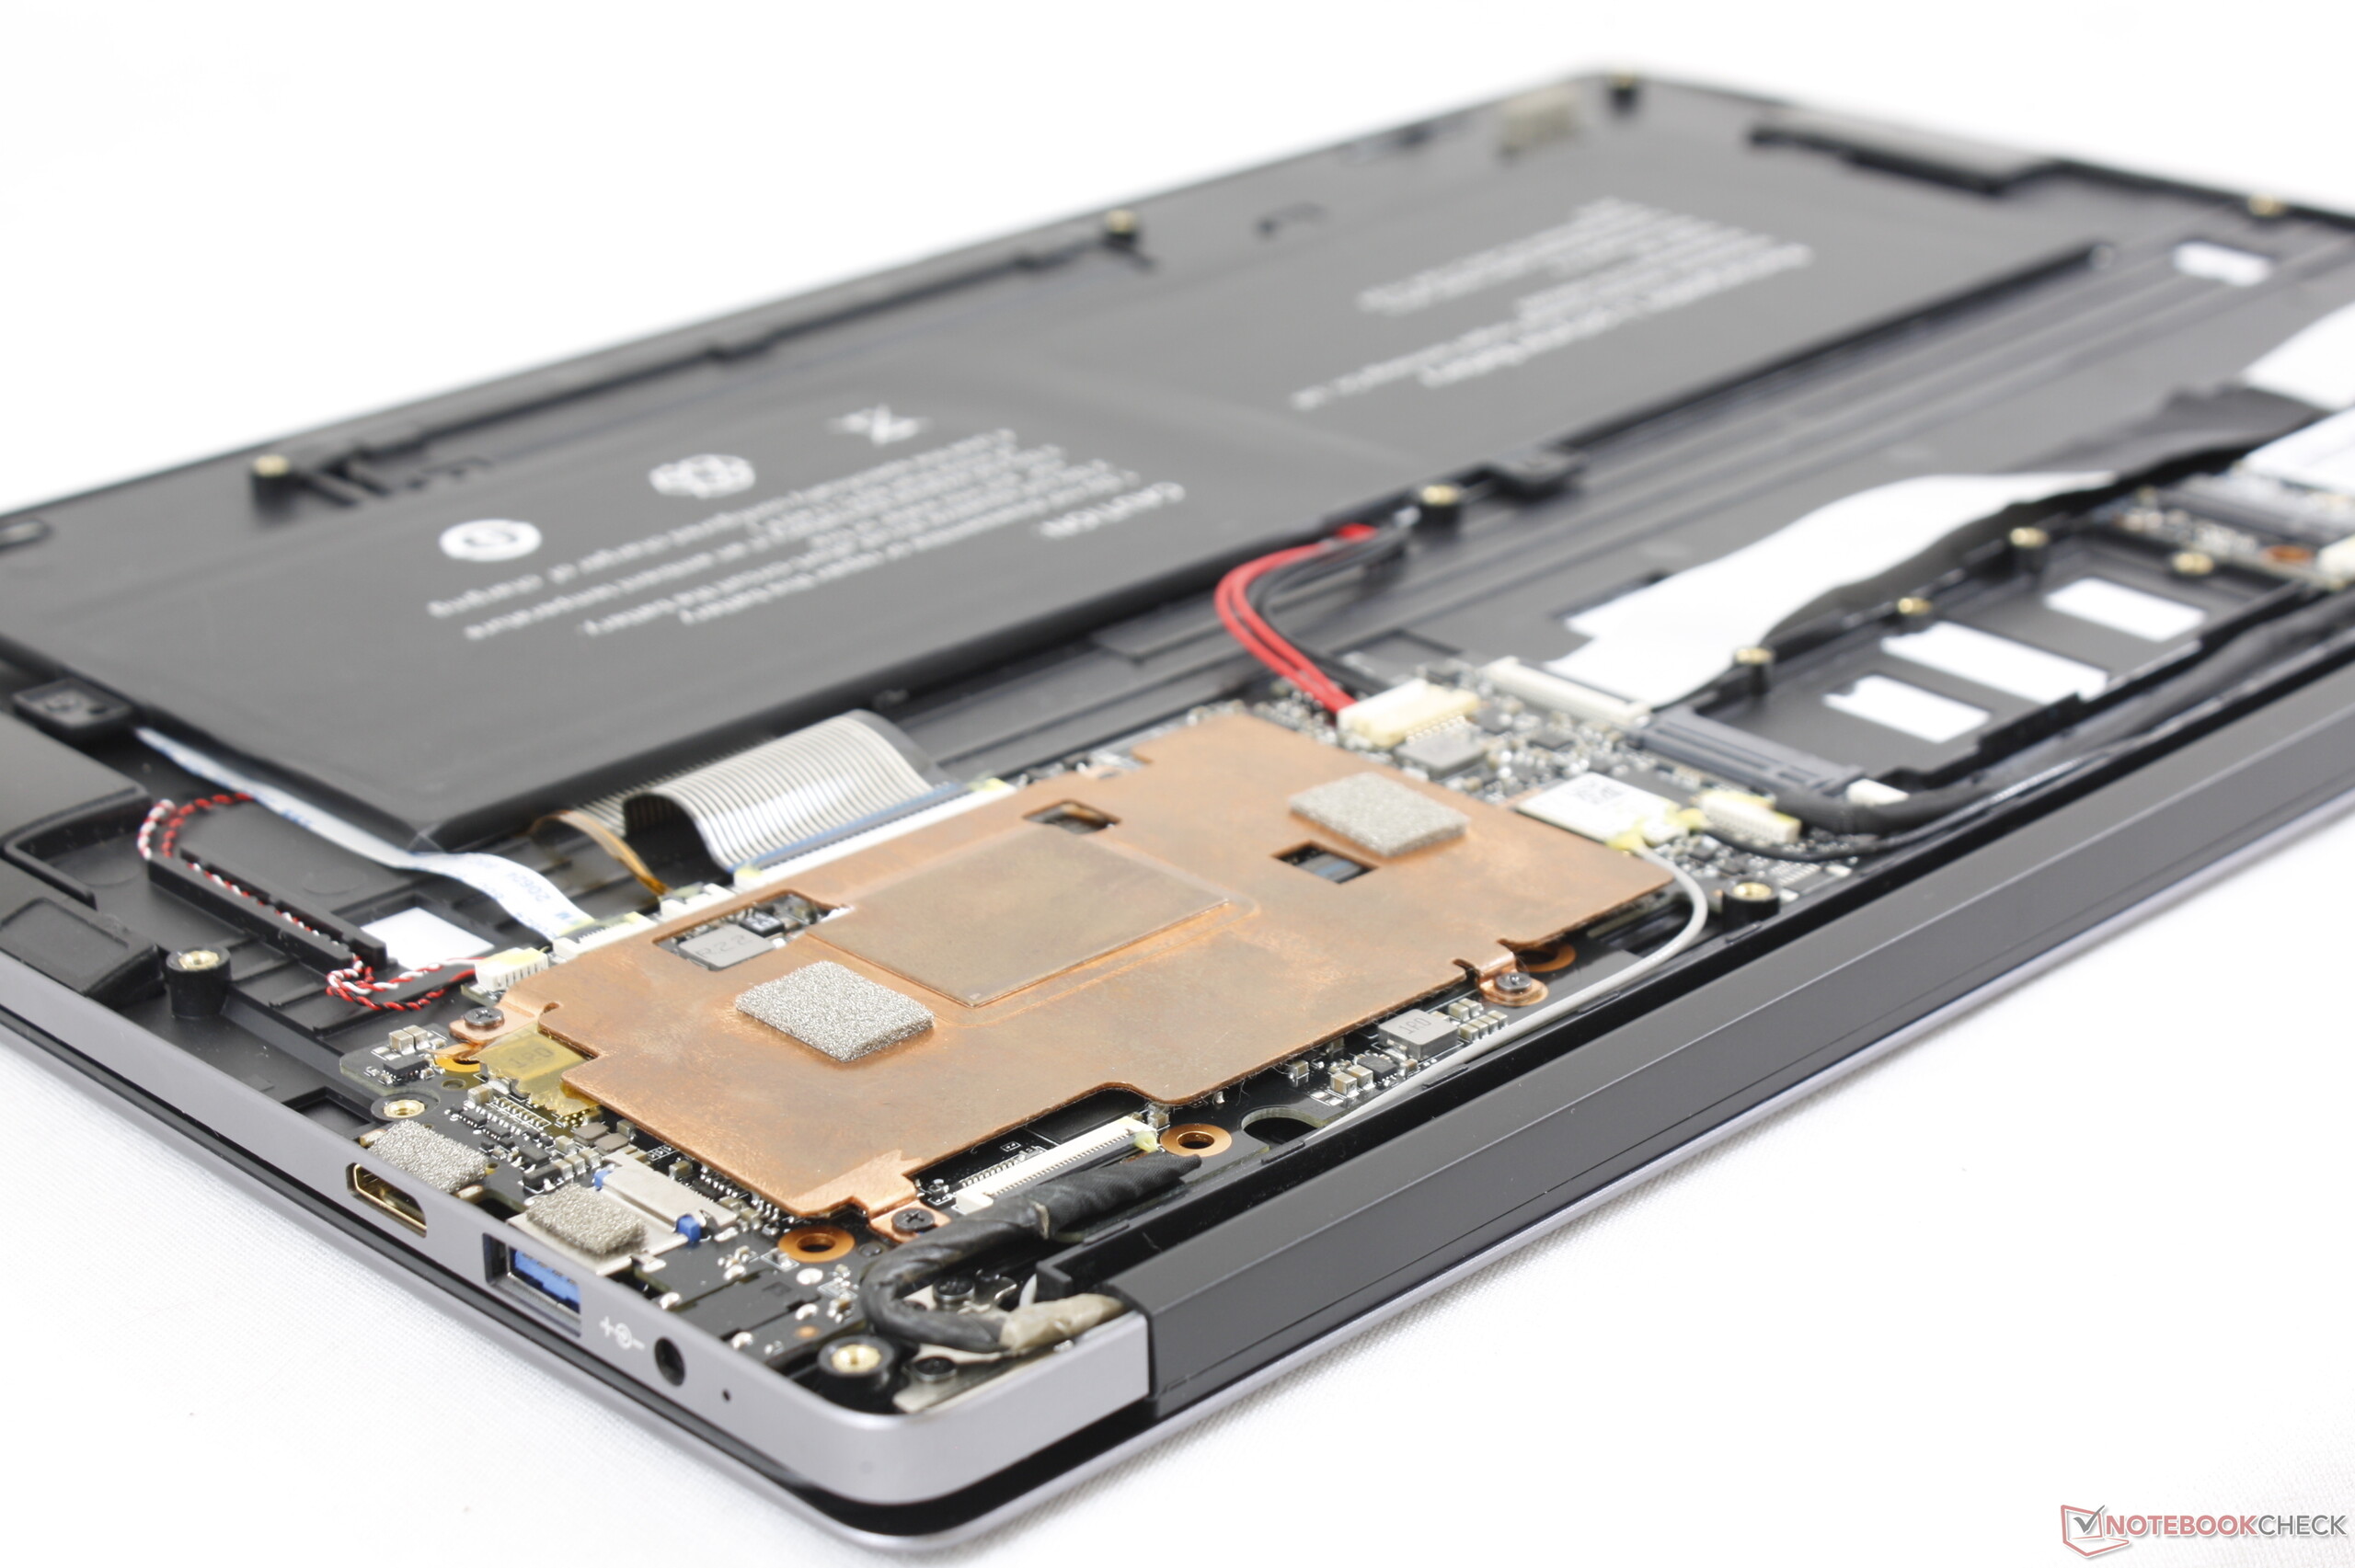
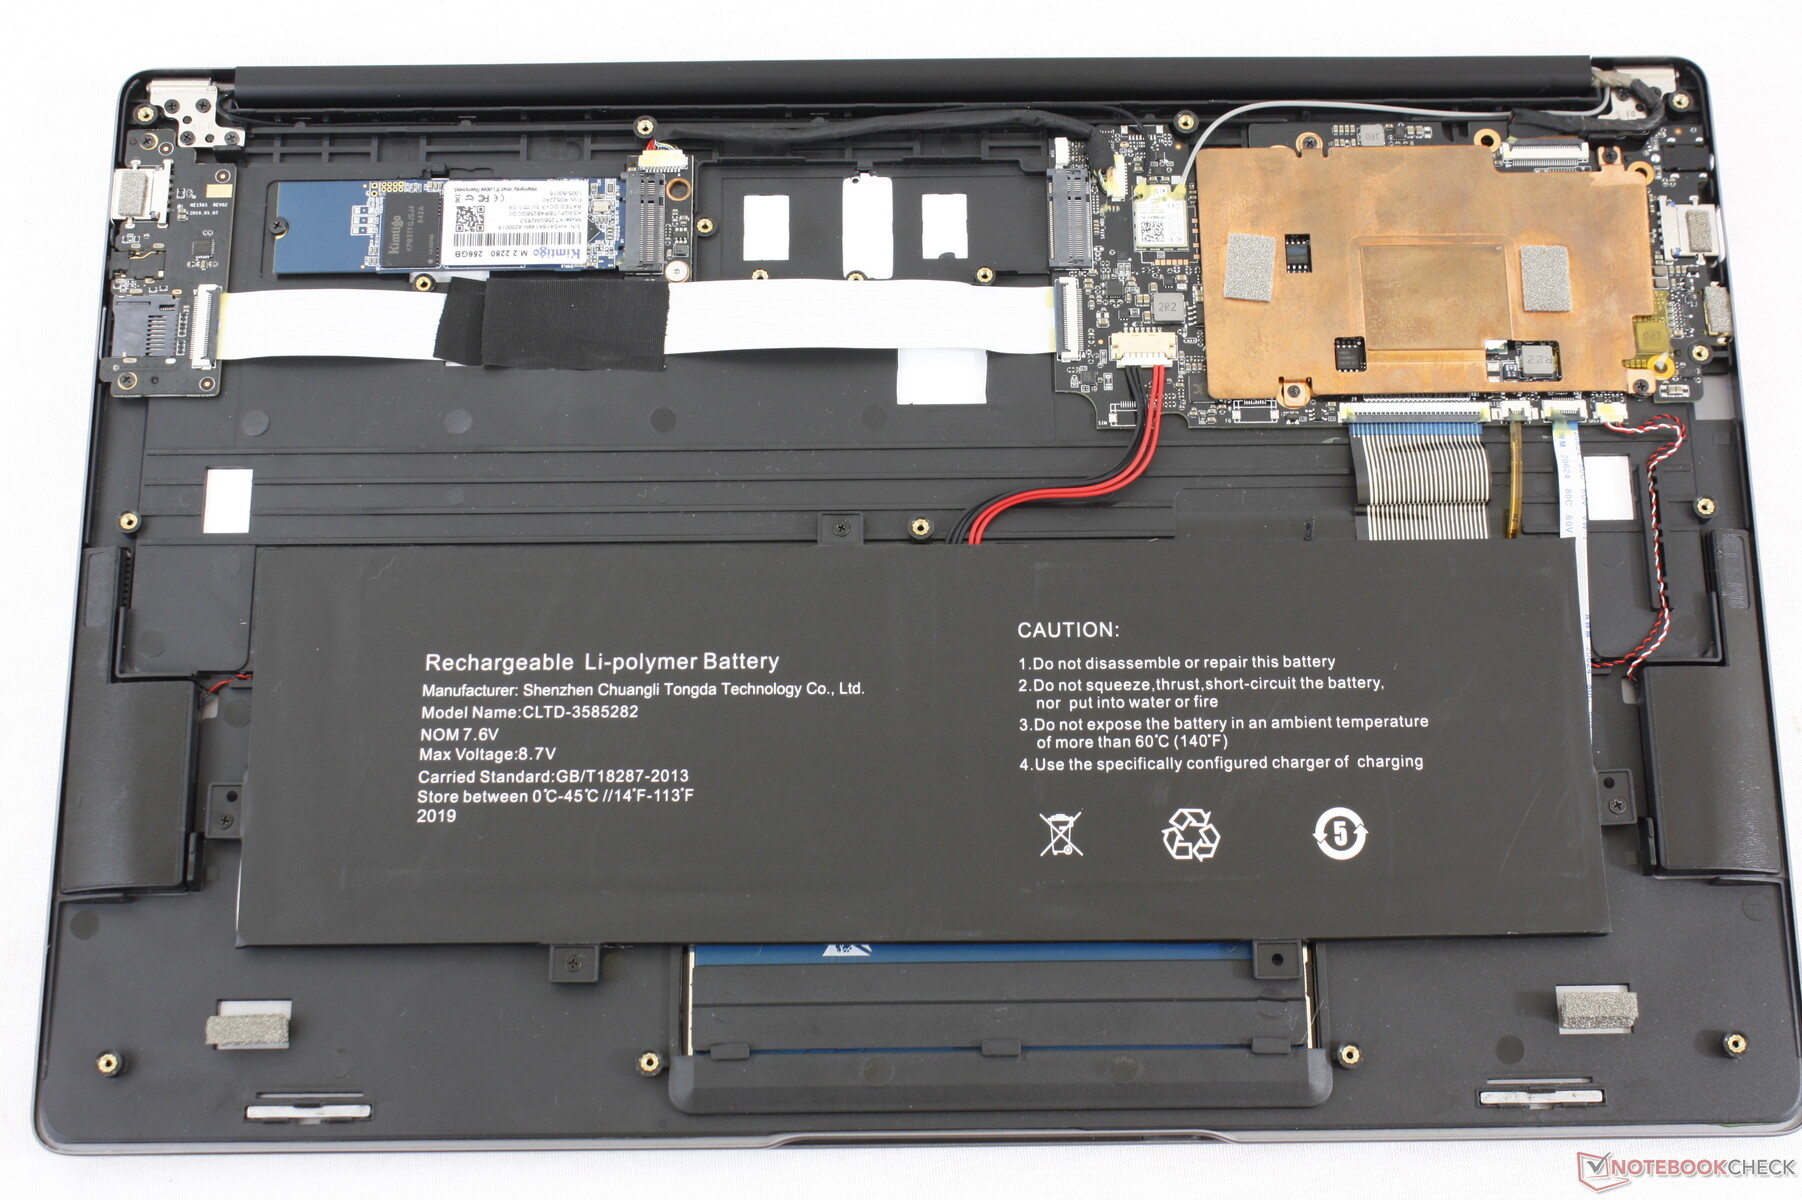
Maintenance
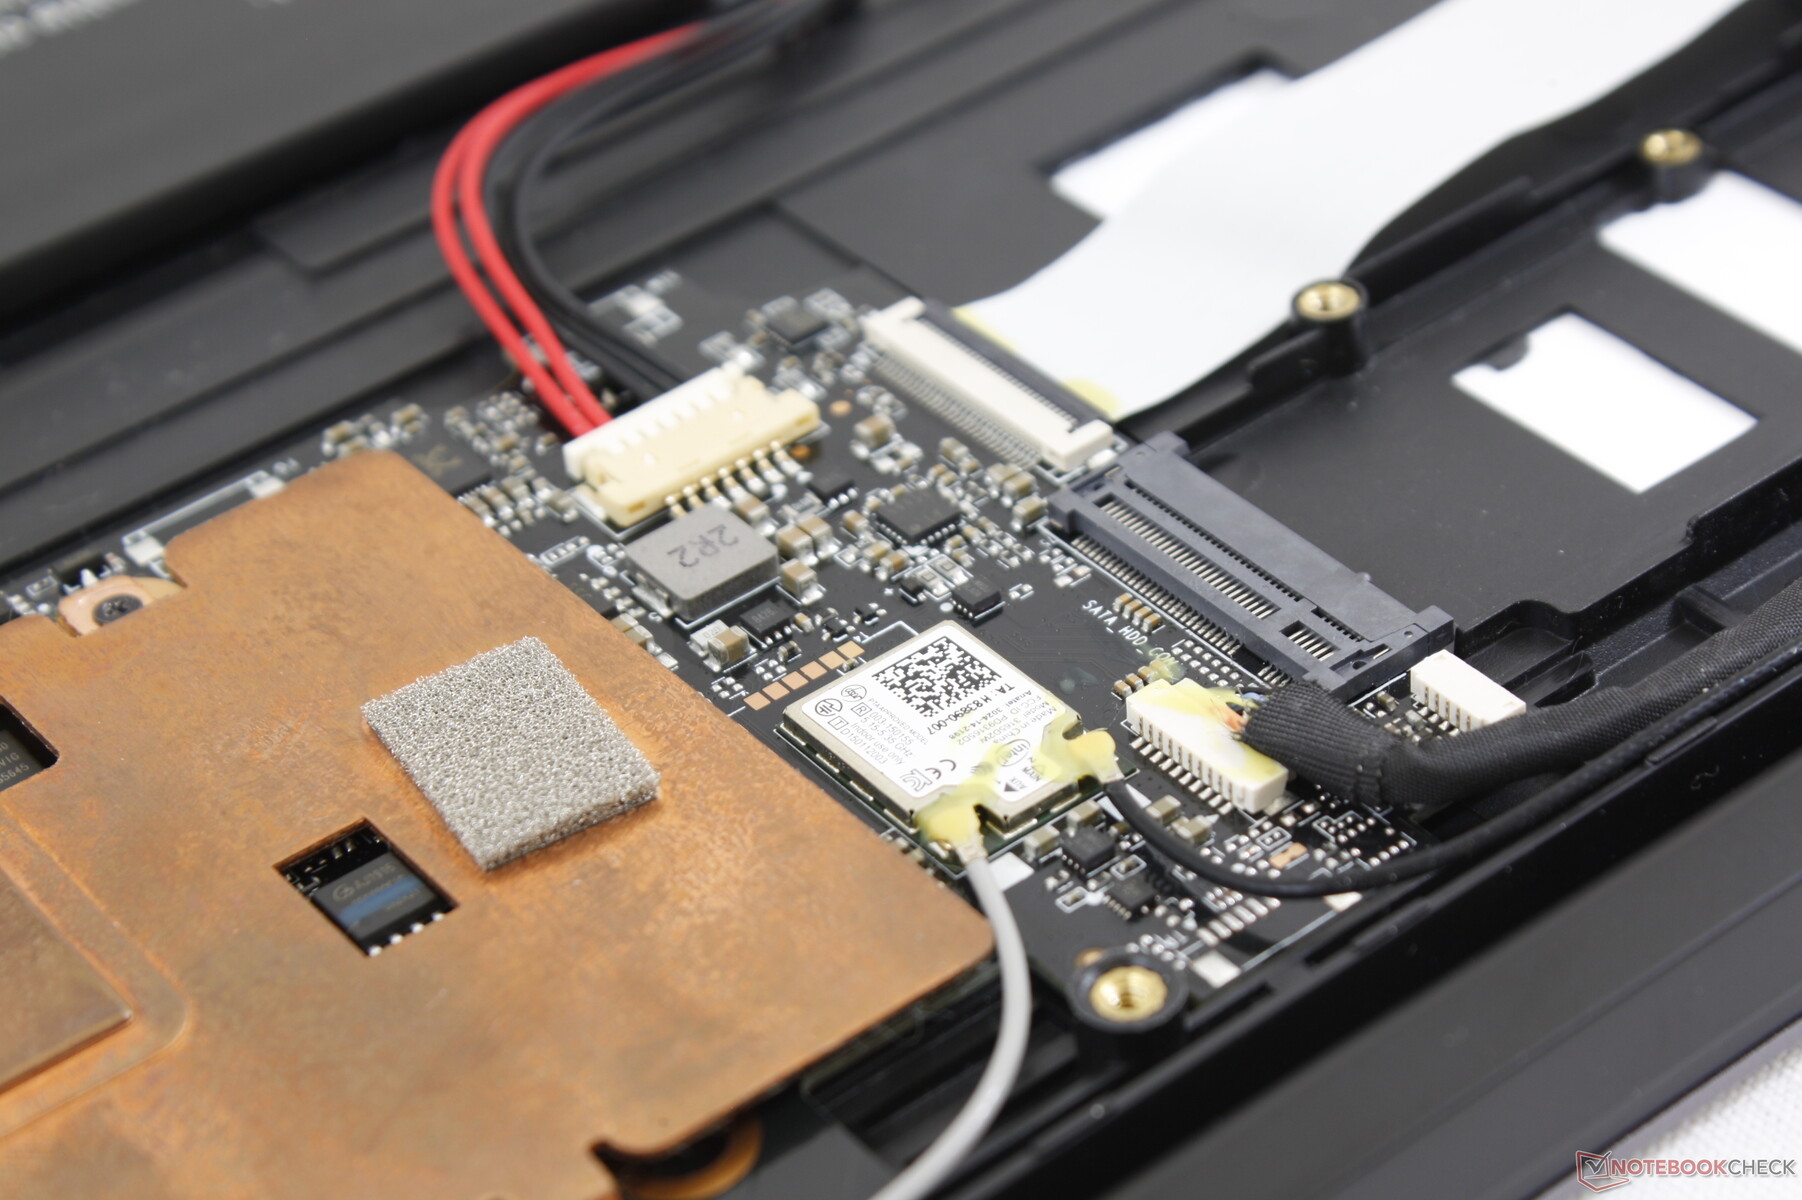
The bottom panel comes off easily with just a Philips screwdriver so long as you are careful around the sharp edges. Nearly all components are soldered and not upgradeable including the WLAN and RAM.
Accessories and Warranty
There are no extras in the box other than the AC adapter. While there is a one-year manufacturer warranty, the overseas shipping and handling will more than likely be a hassle for most users.
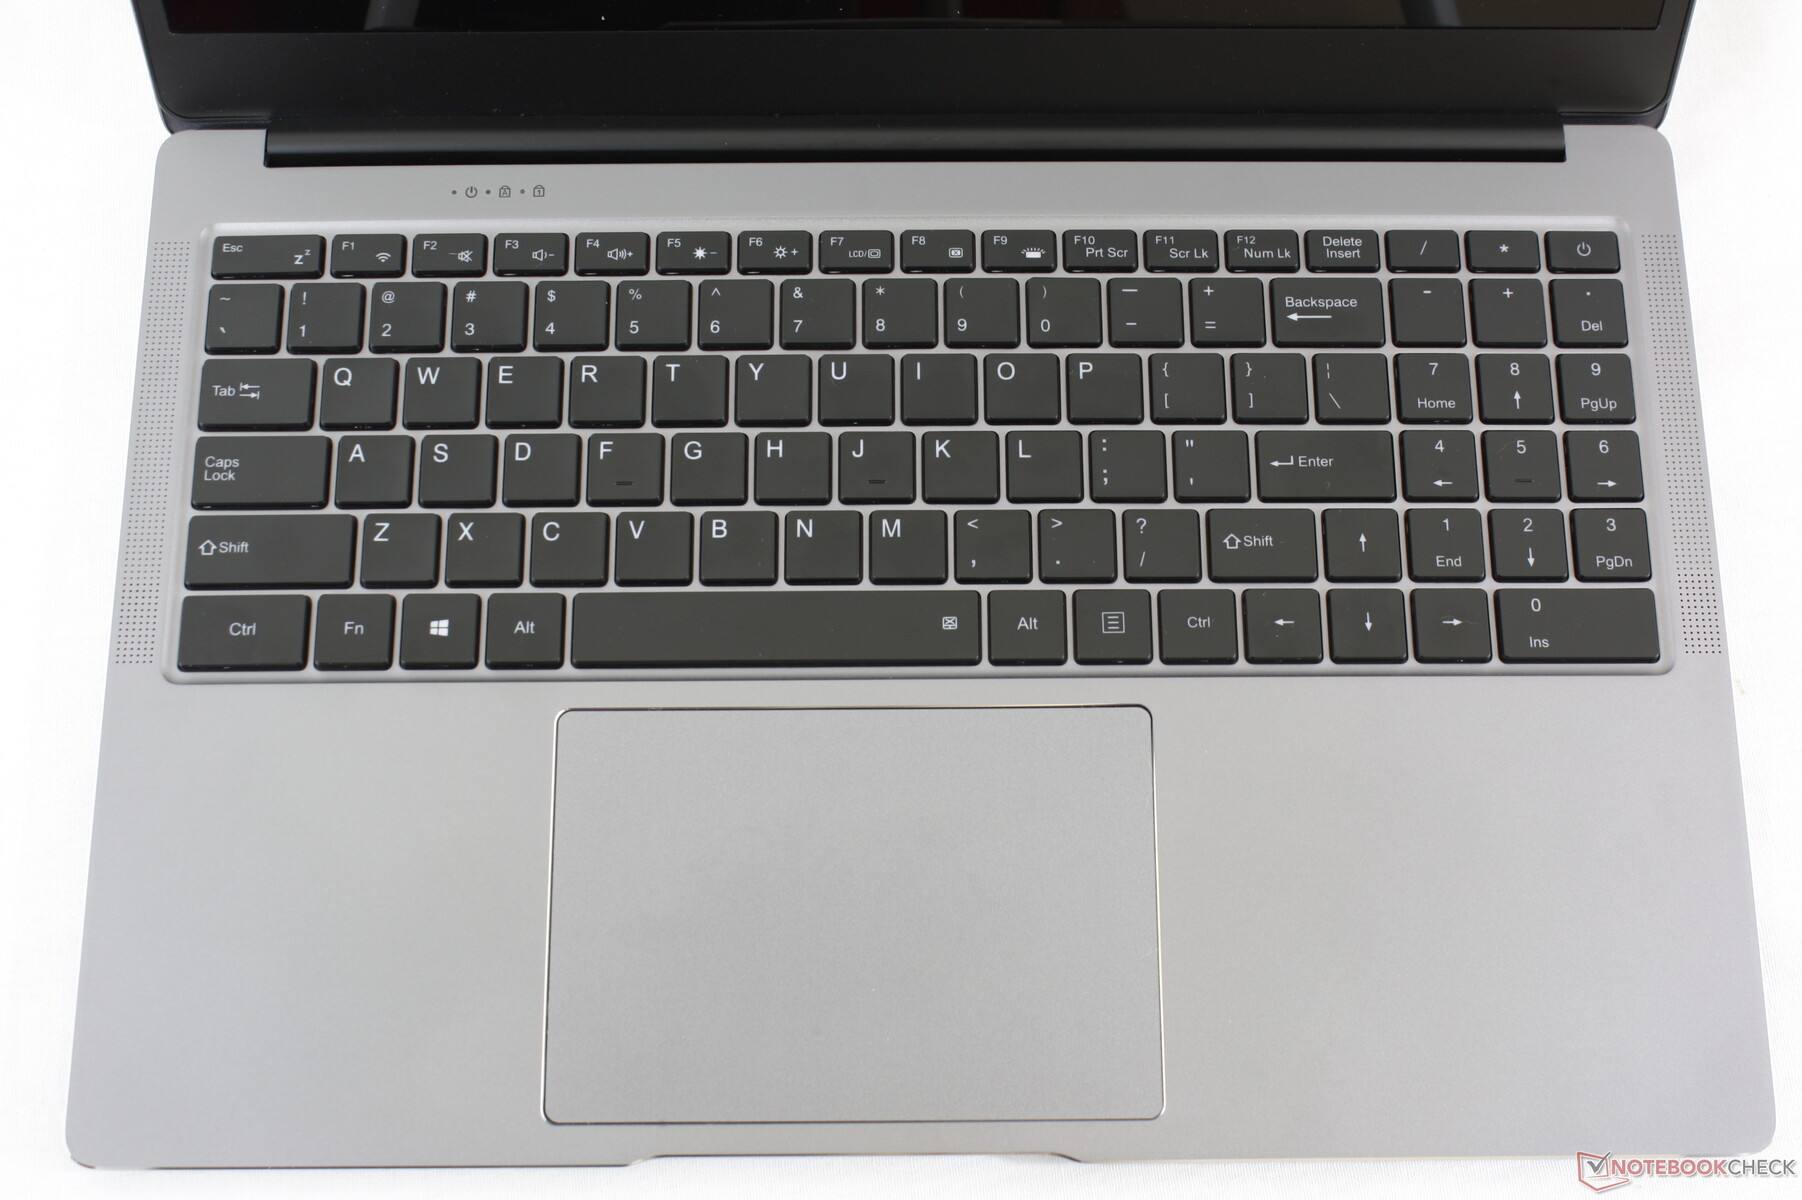
Input Devices
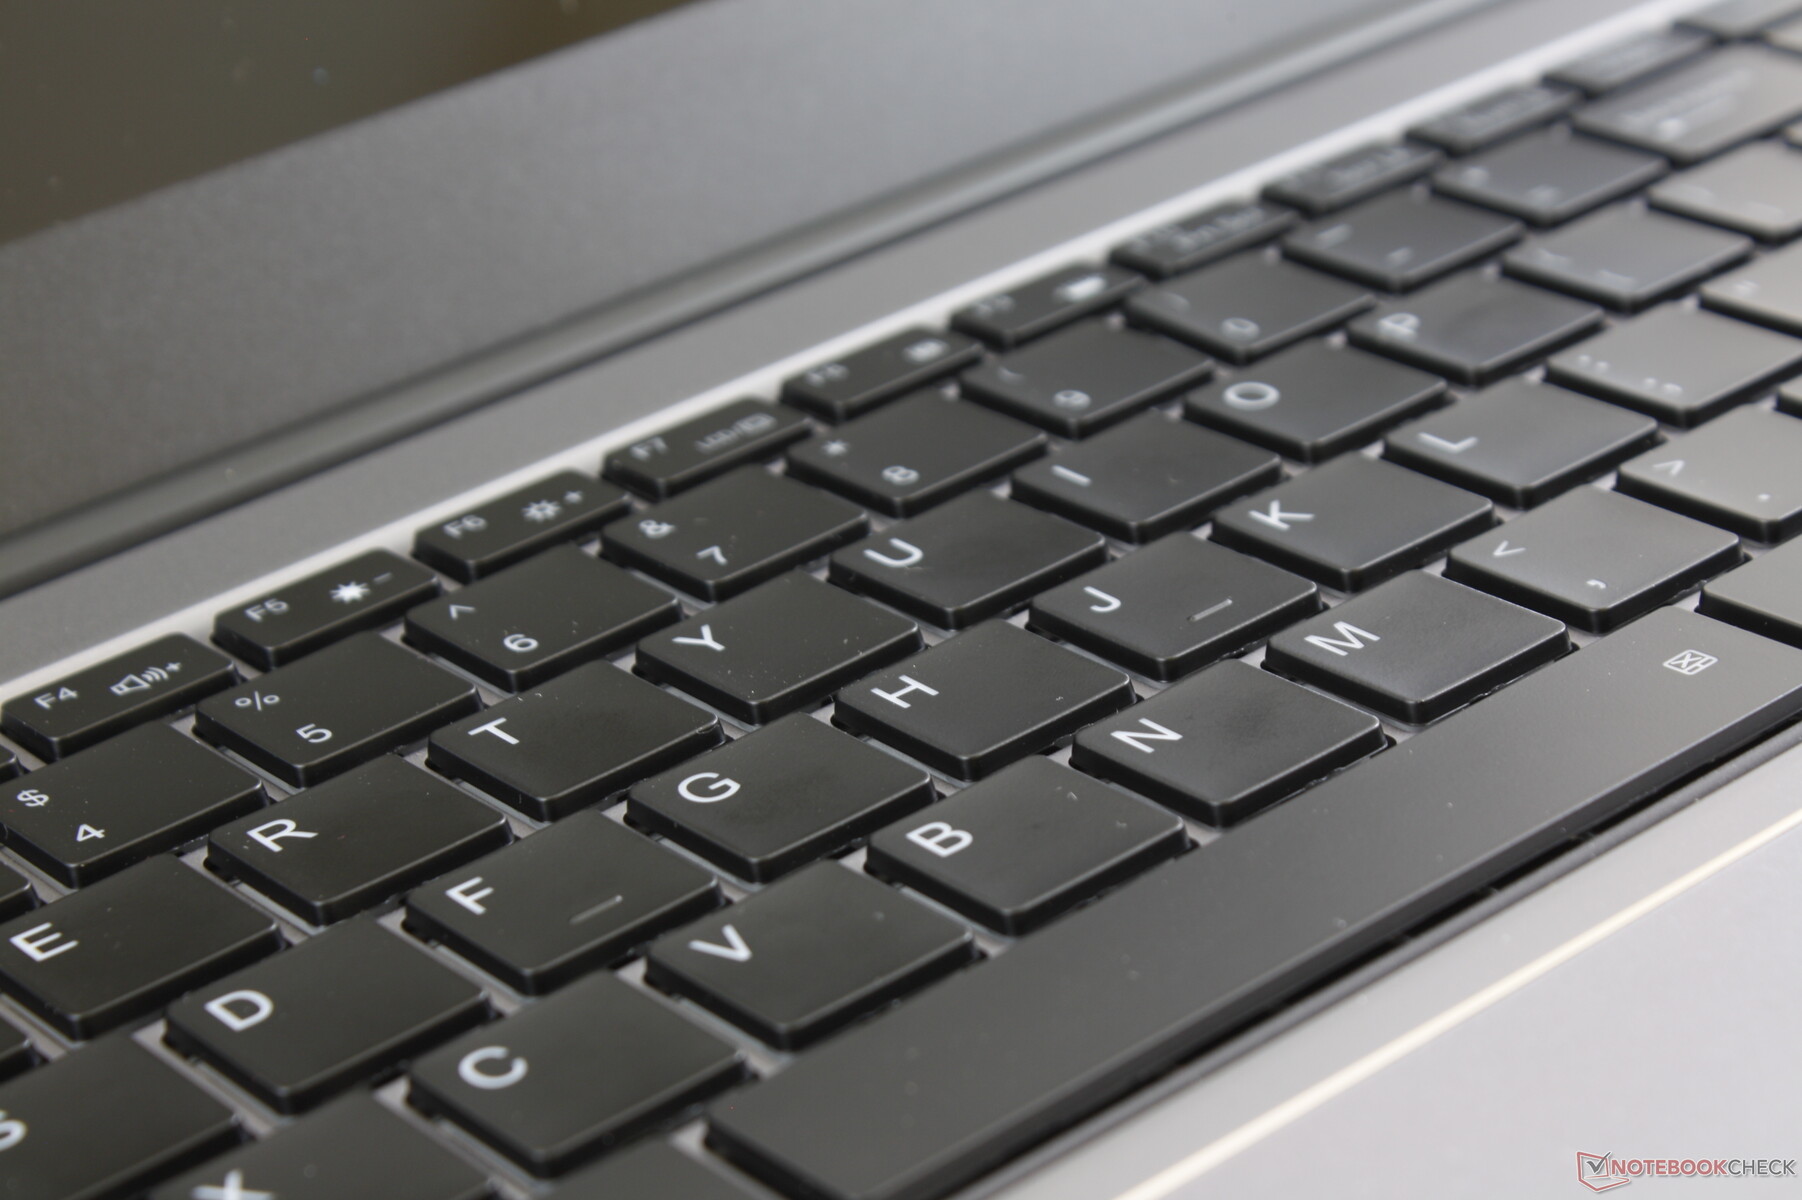
Keyboard
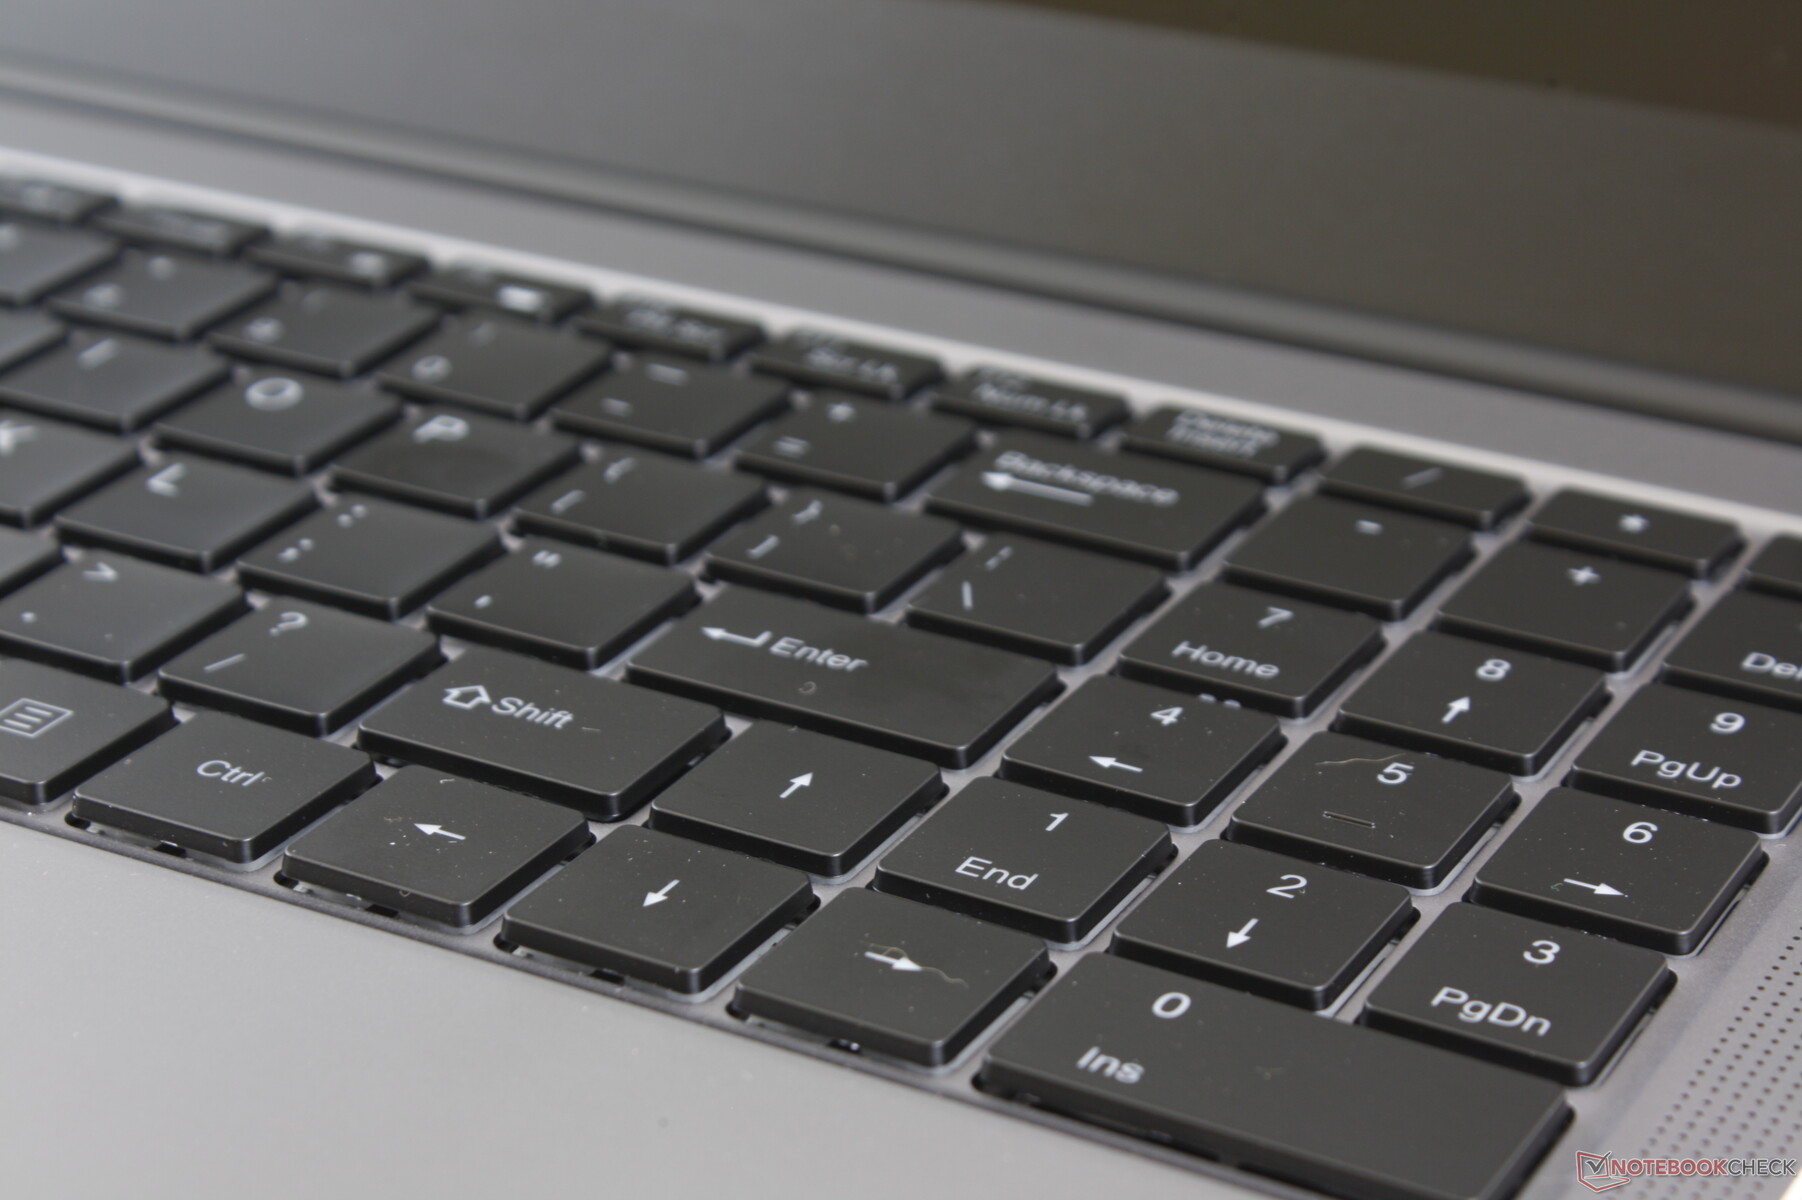
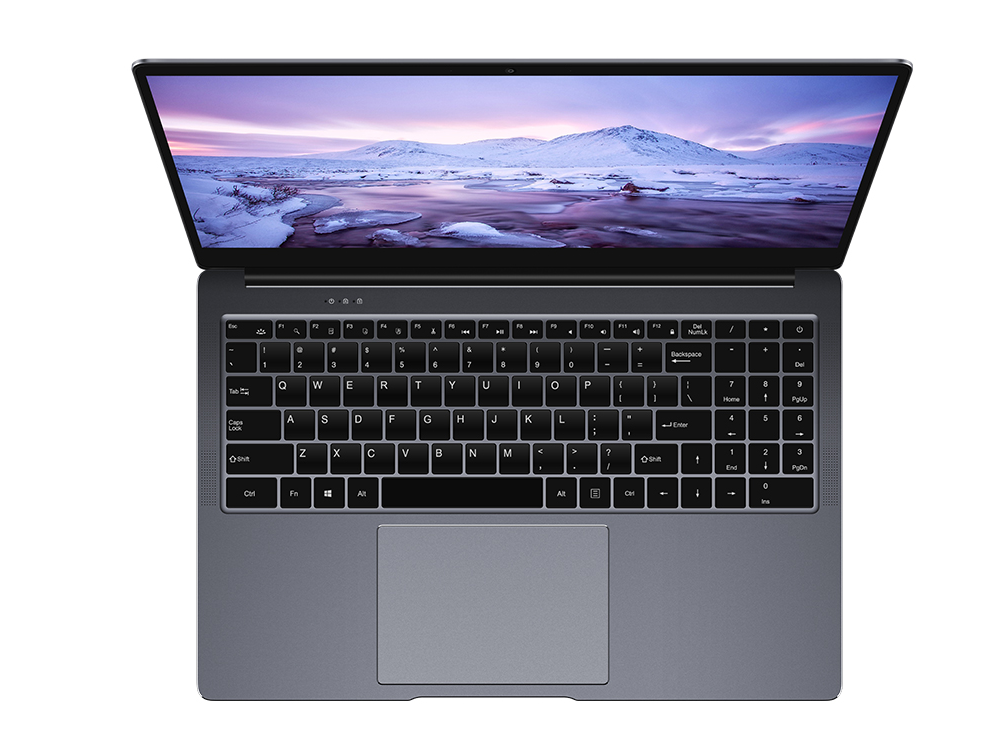
The backlit keyboard is easily one of the best aspects of the LapBook Plus. It offers firm feedback, deep travel for an Ultrabook, and low-moderate clatter not unlike the keyboard on the HP Spectre x360 15. We especially applaud the full-size NumPad and Arrow keys as these are usually much smaller or narrower than the main QWERTY keys on most other laptops like the Asus TUF FX505DT.
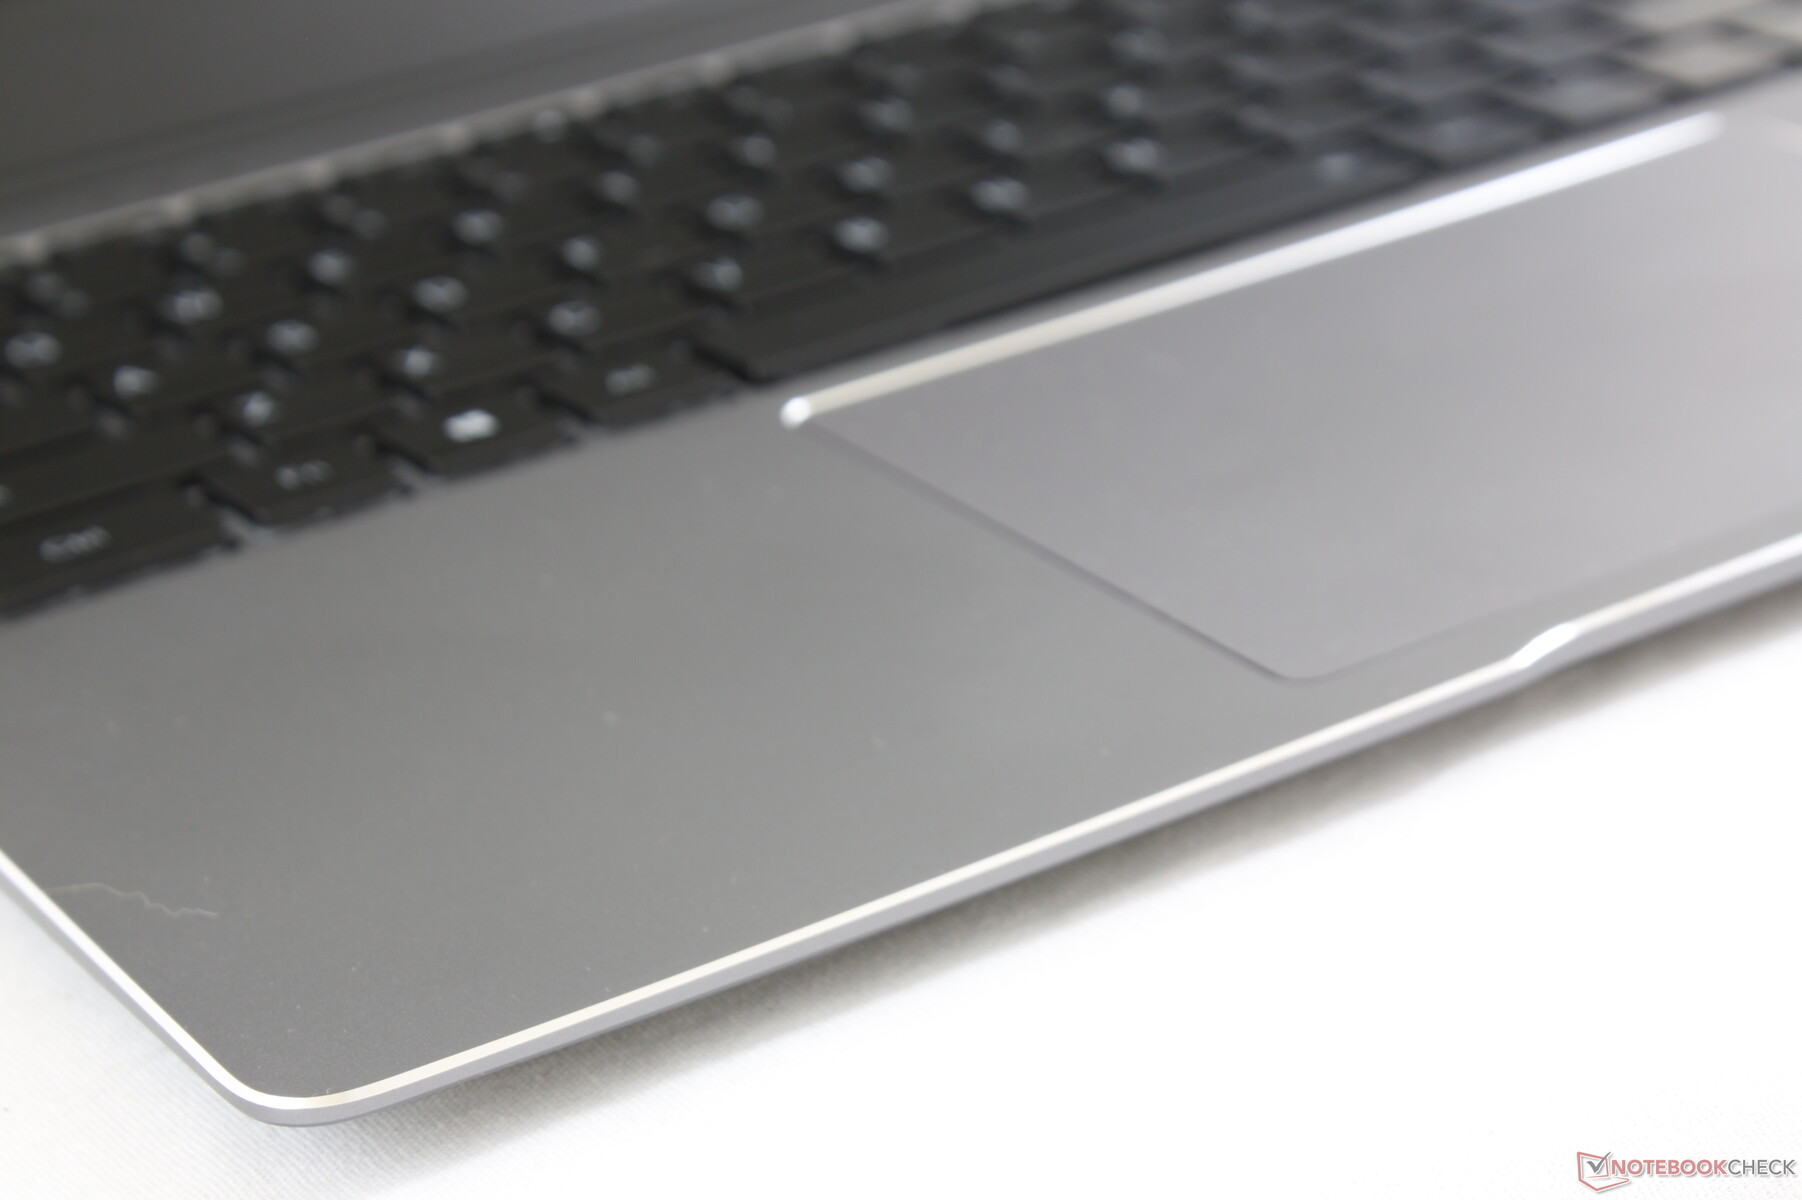
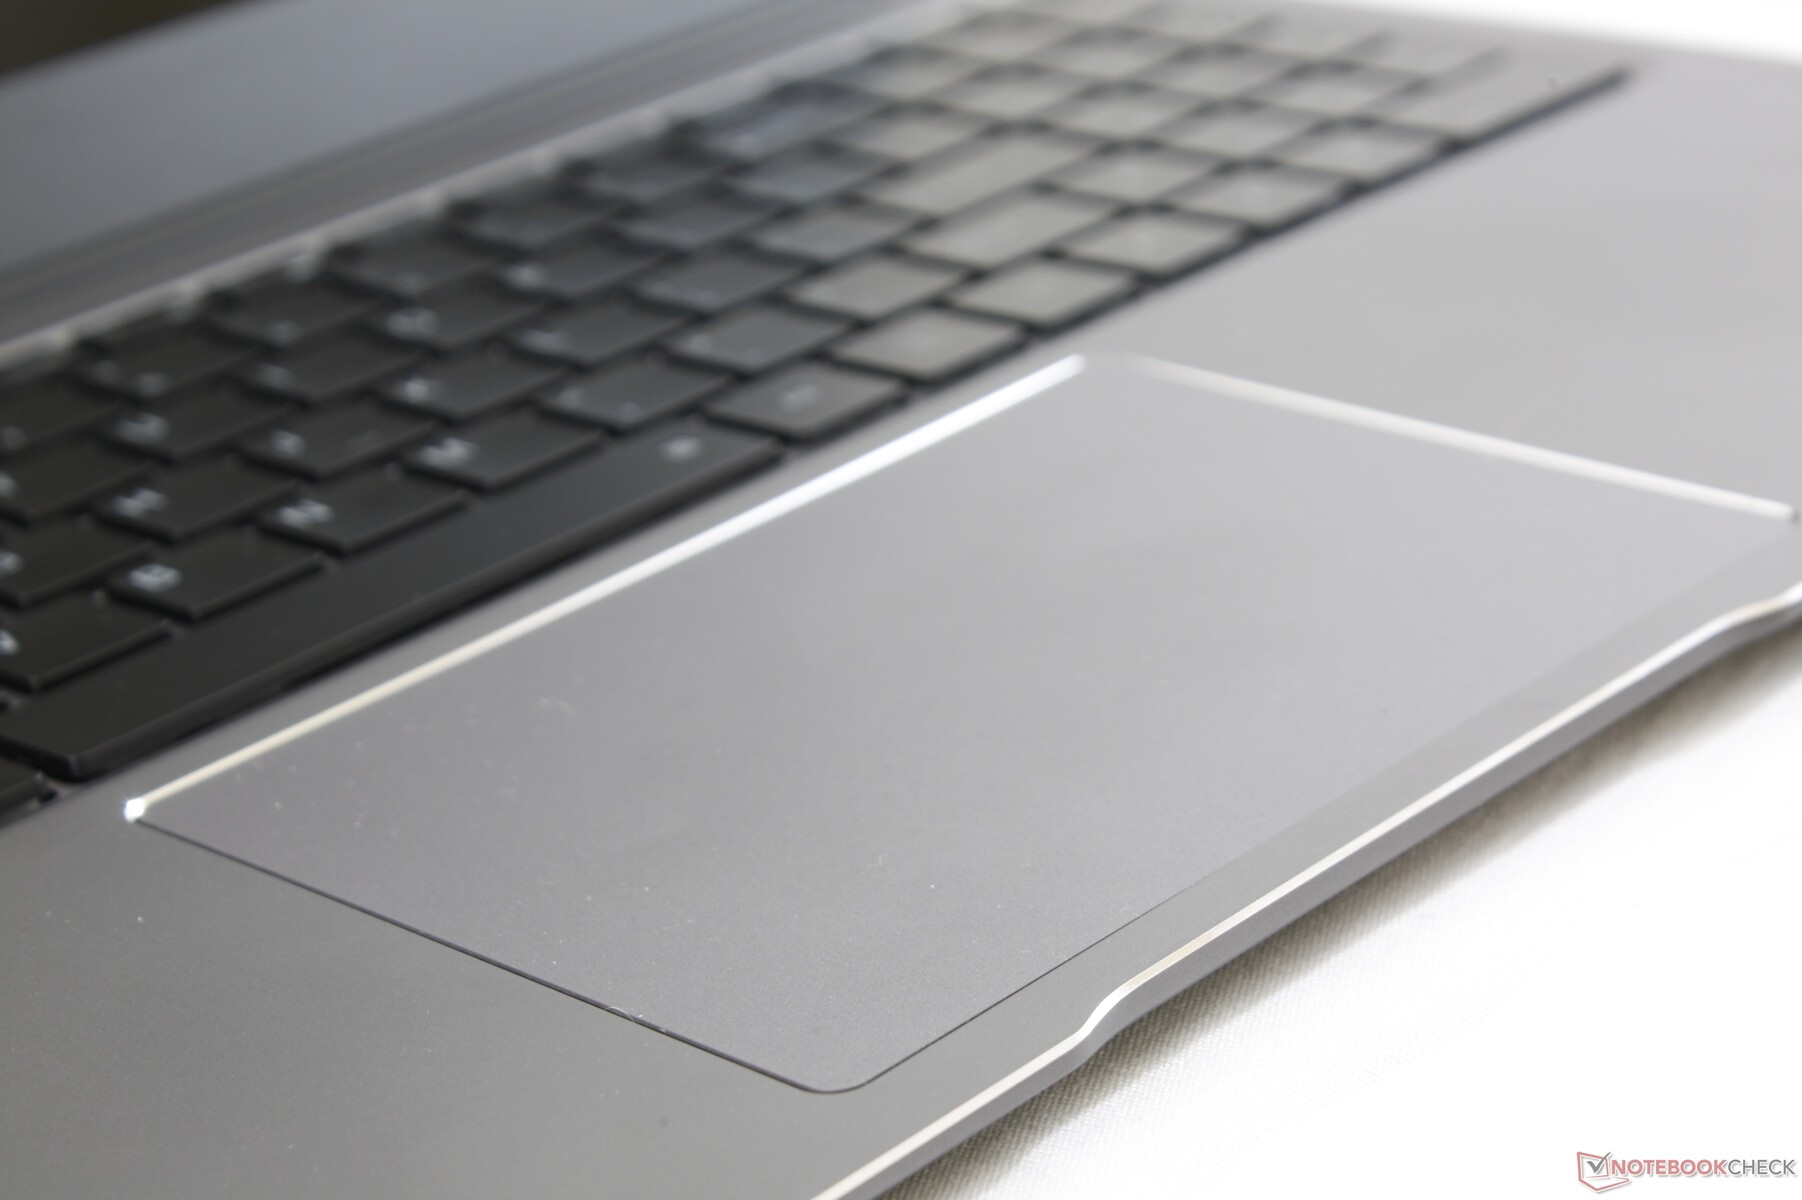
Touchpad
The large clickpad (13 x 9 cm) is unfortunately defective on our test unit. The cursor would frequently pause or jump for seemingly no reason to be essentially unusable. It's a shame because gliding is otherwise quite smooth when moving at medium-fast speeds on the slightly roughened surface.
Clicking on the firm clickpad produces a shallow and satisfying audible click. The main issue is that it takes quite a bit of effort to input a click and so it can become tiring very quickly when browsing or dragging and dropping.
Display
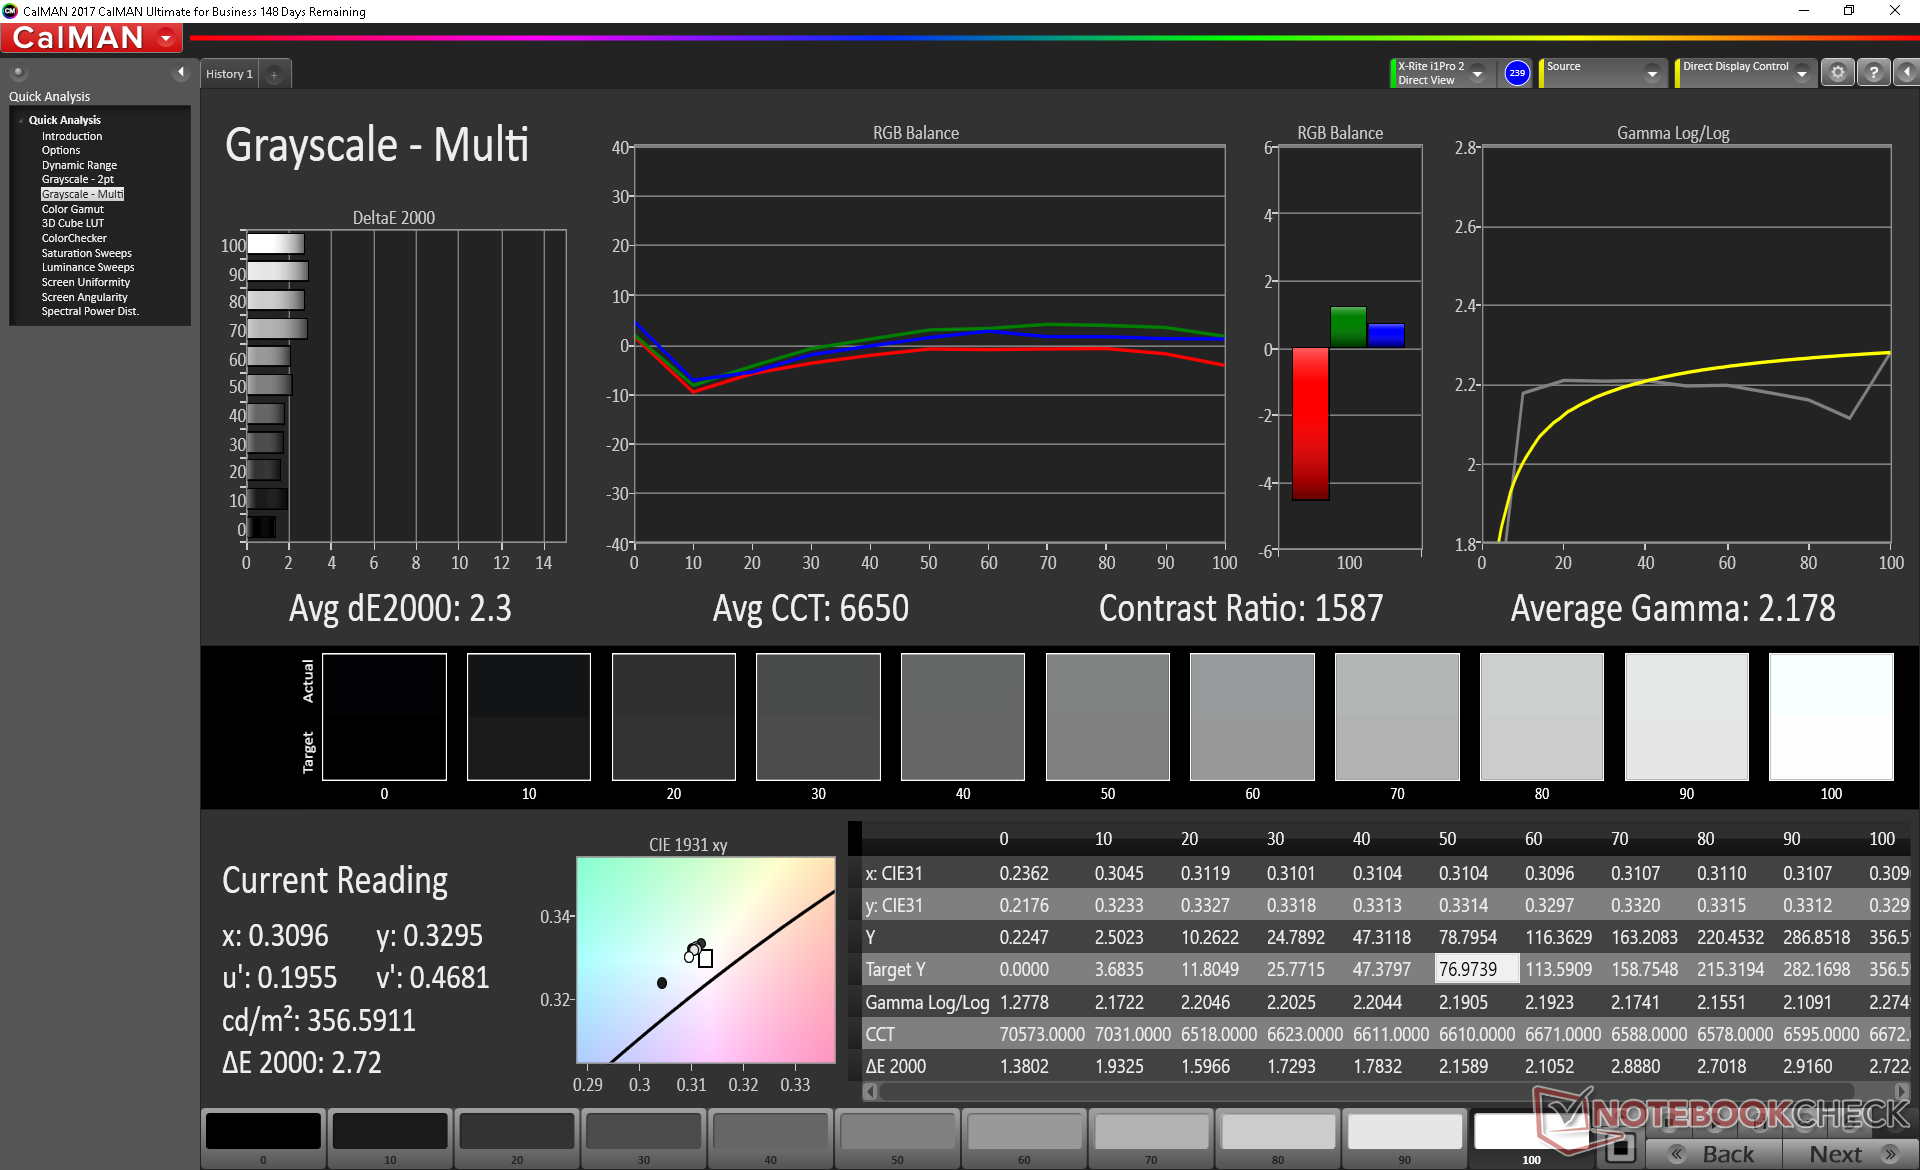
It's clear that Chuwi invested a lot on the 4K UHD display relative to the rest of the laptop. The high quality BOE NV156QUM-N51 IPS panel here can also be found on the Lenovo Yoga 730-15IKB that retails for four times the price. The visual experience between these two laptops are therefore very similar including the high contrast ratio of about 1000:1, average response times, and the respectable color coverage. The backlight in particular is brighter than any sub $500 laptop we've seen in this size category.
Pulse-width modulation is present on all brightness levels up to 99 percent which might impact users sensitive to onscreen flickering. The glossy overlay eliminates any graininess issues common on matte displays for crisp texts and images.


| |||||||||||||||||||||||||
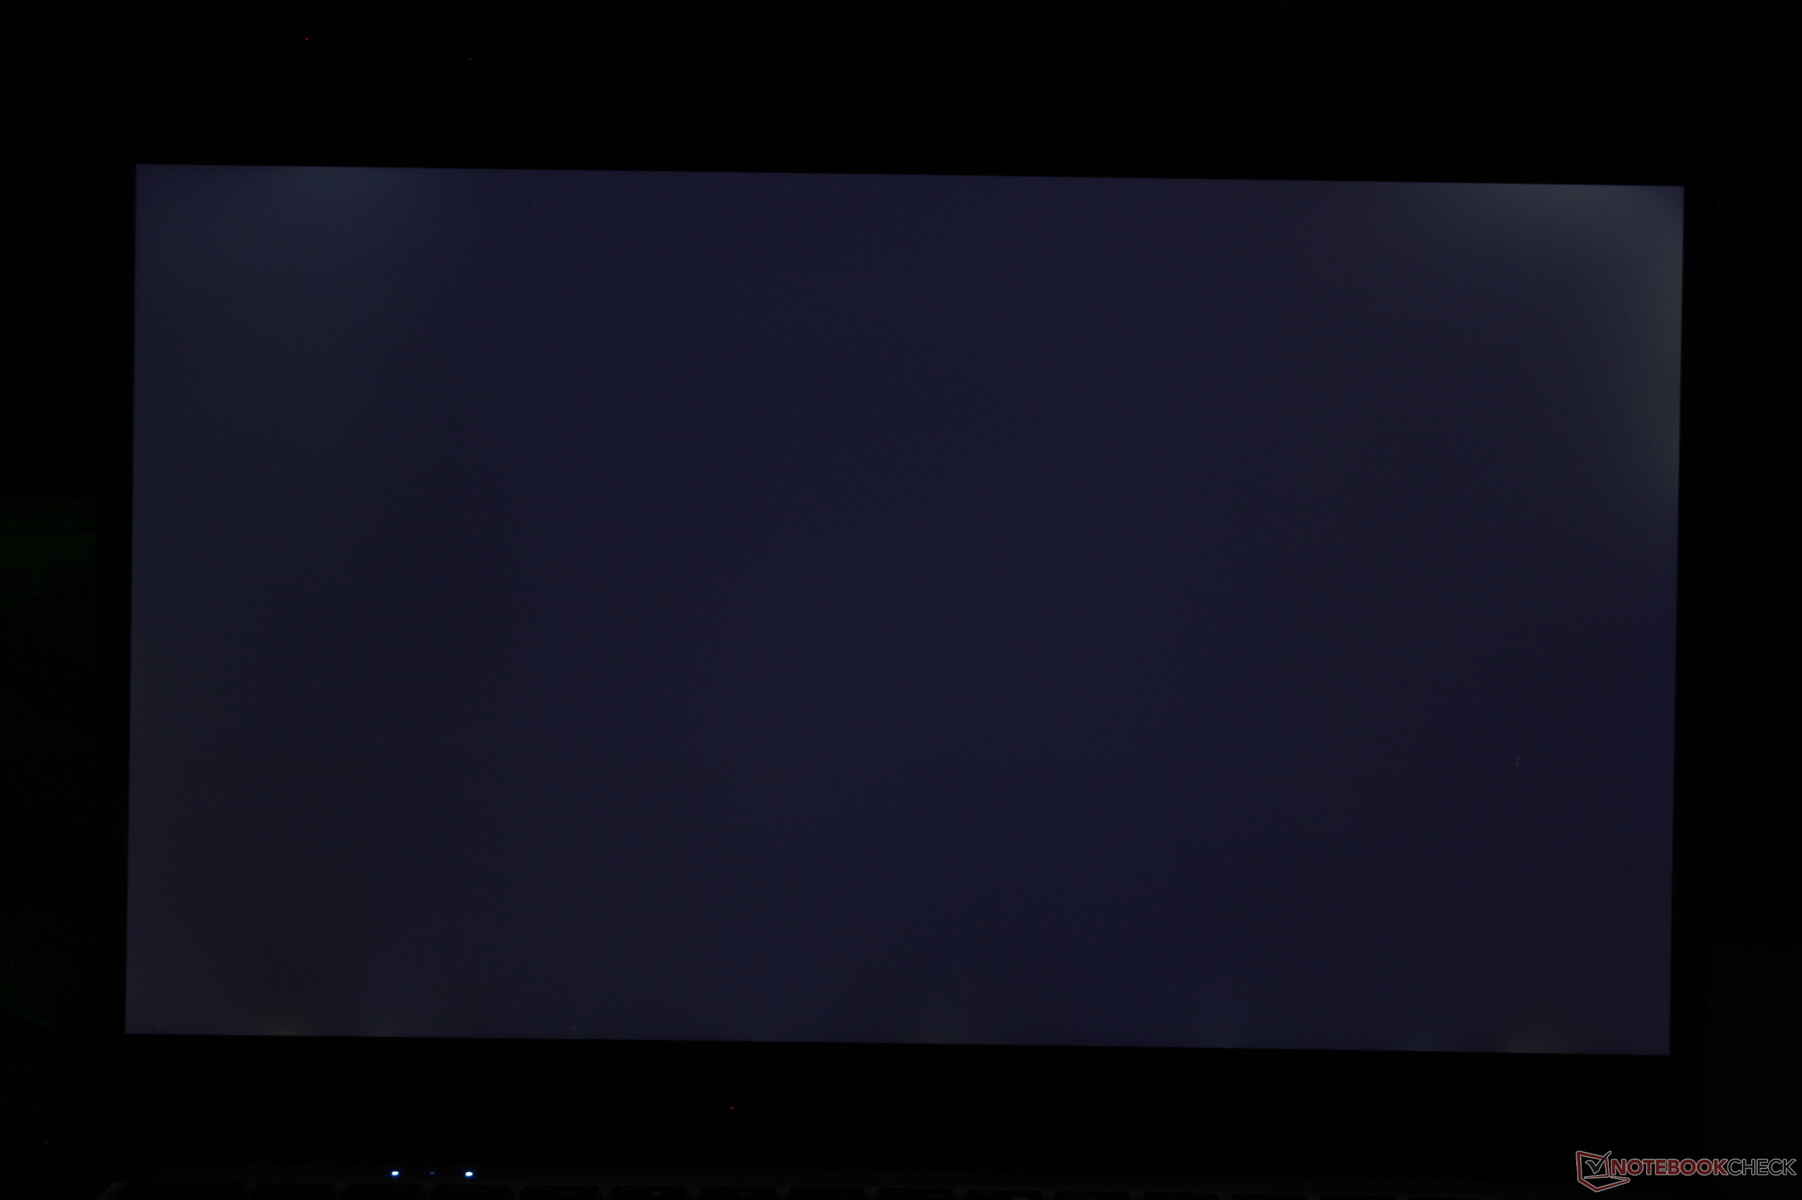
Brightness Distribution: 82 %
Center on Battery: 360.2 cd/m²
Contrast: 1092:1 (Black: 0.33 cd/m²)
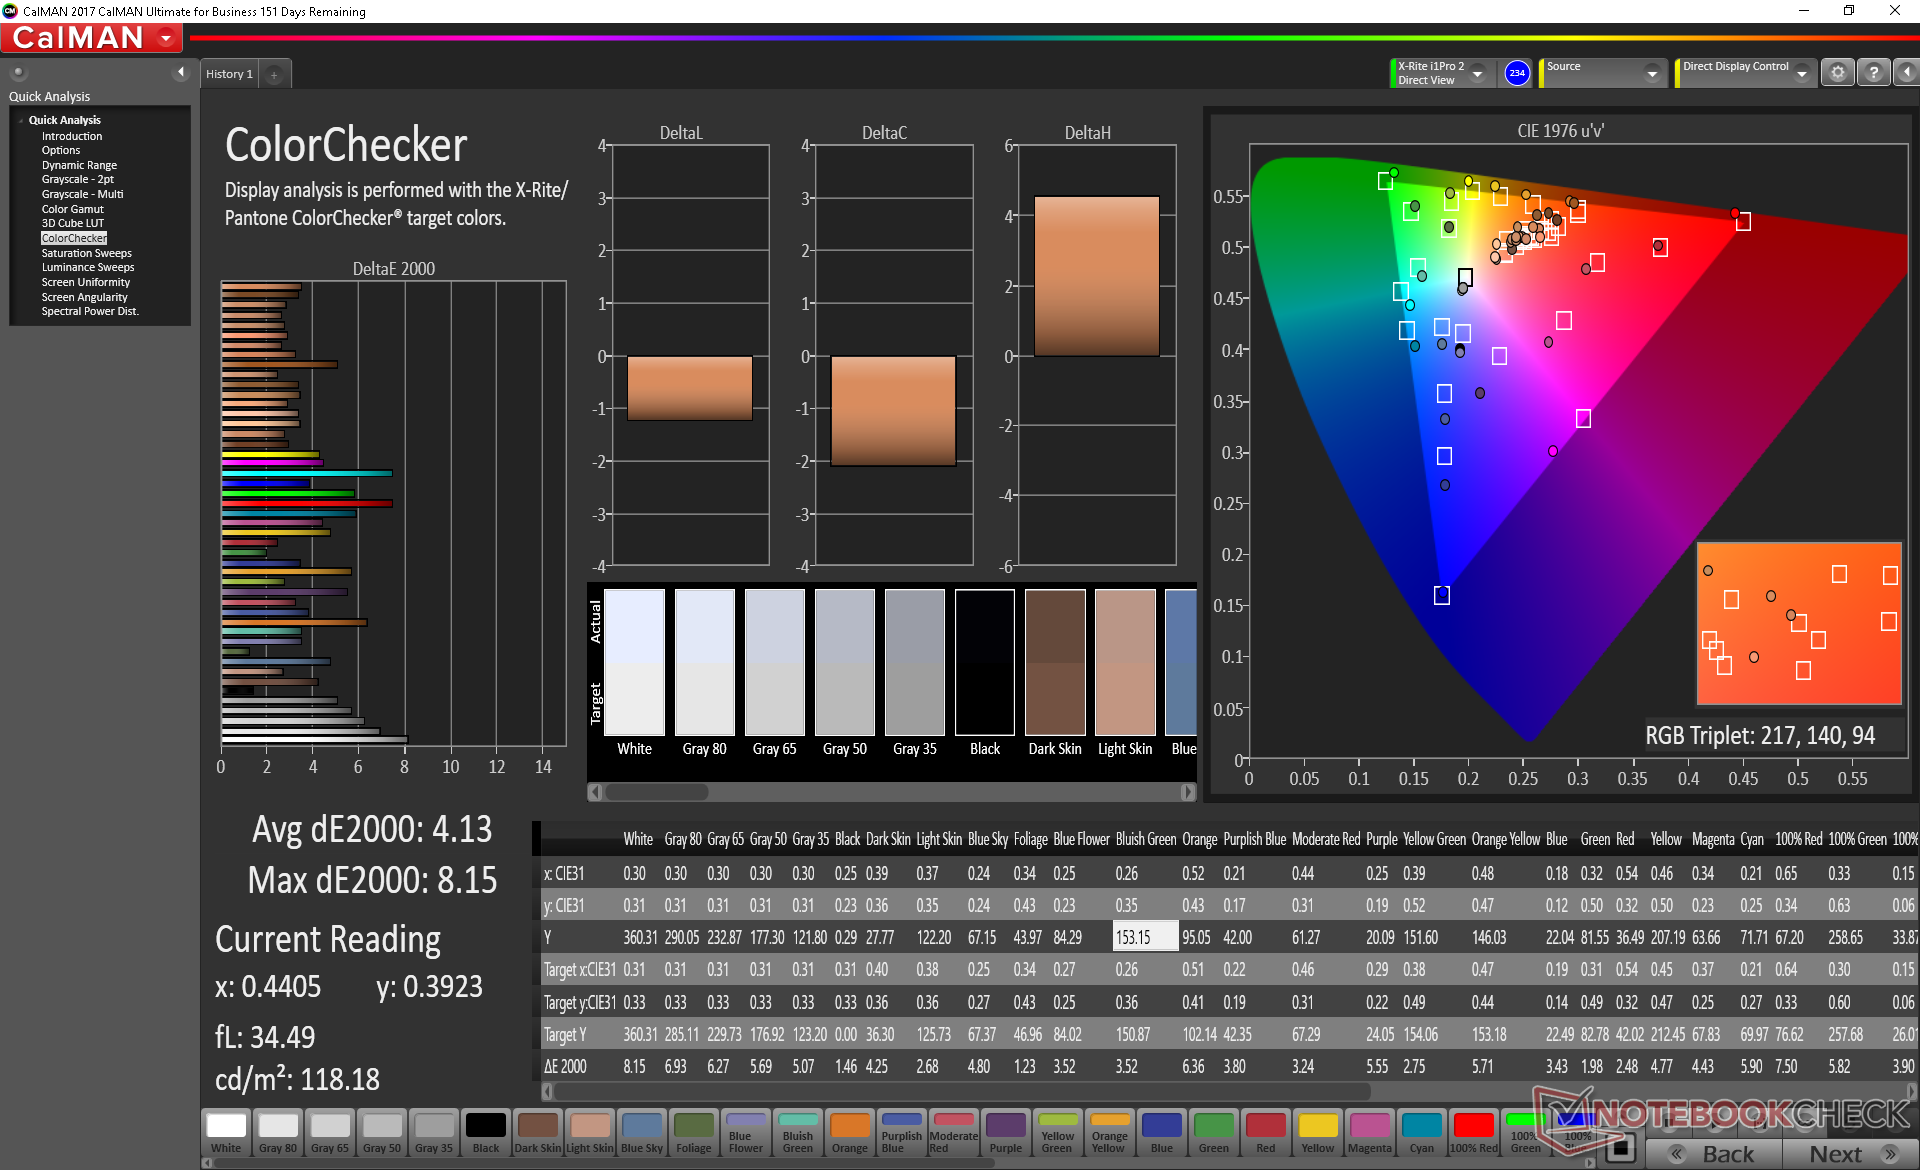
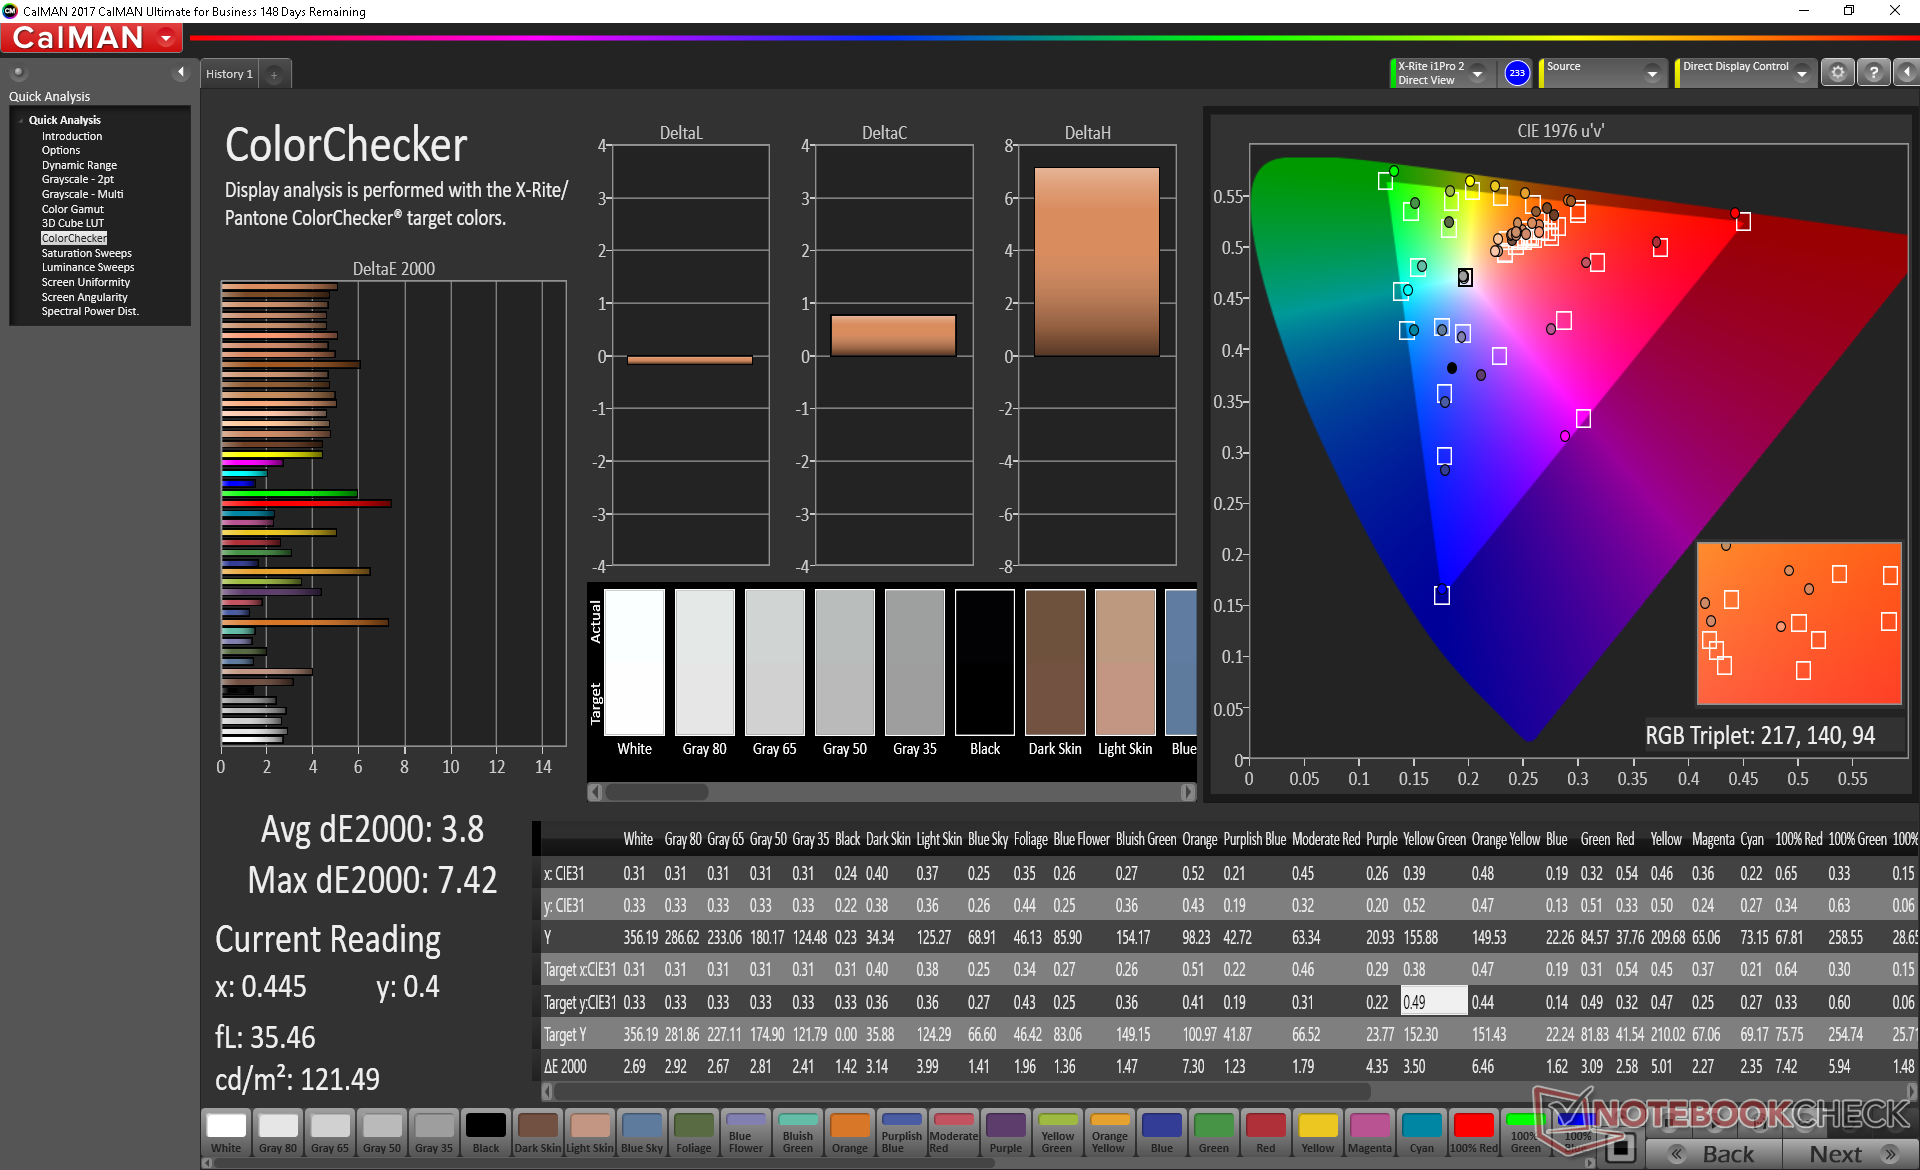
ΔE ColorChecker Calman: 4.13 | ∀{0.5-29.43 Ø4.71}
calibrated: 3.8
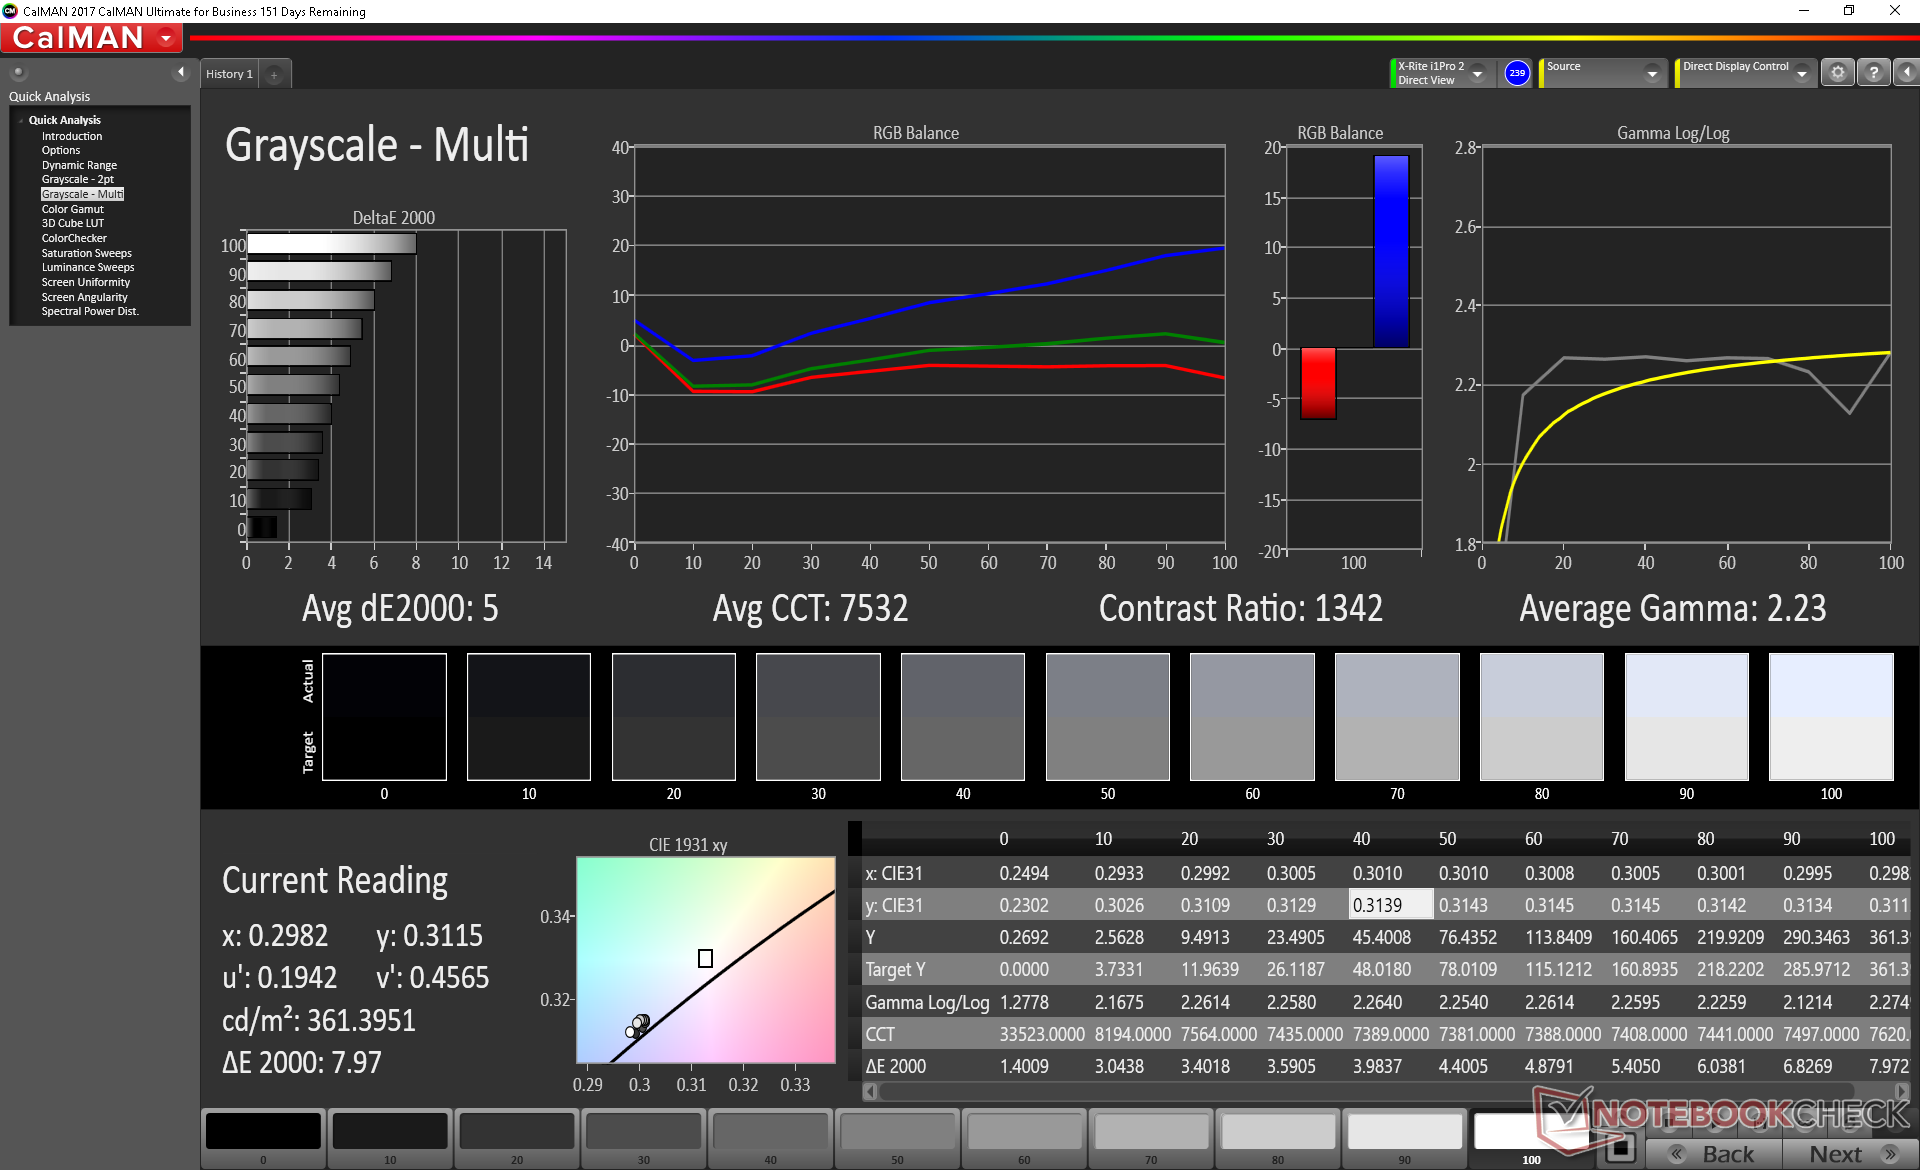
ΔE Greyscale Calman: 5 | ∀{0.09-98 Ø4.96}
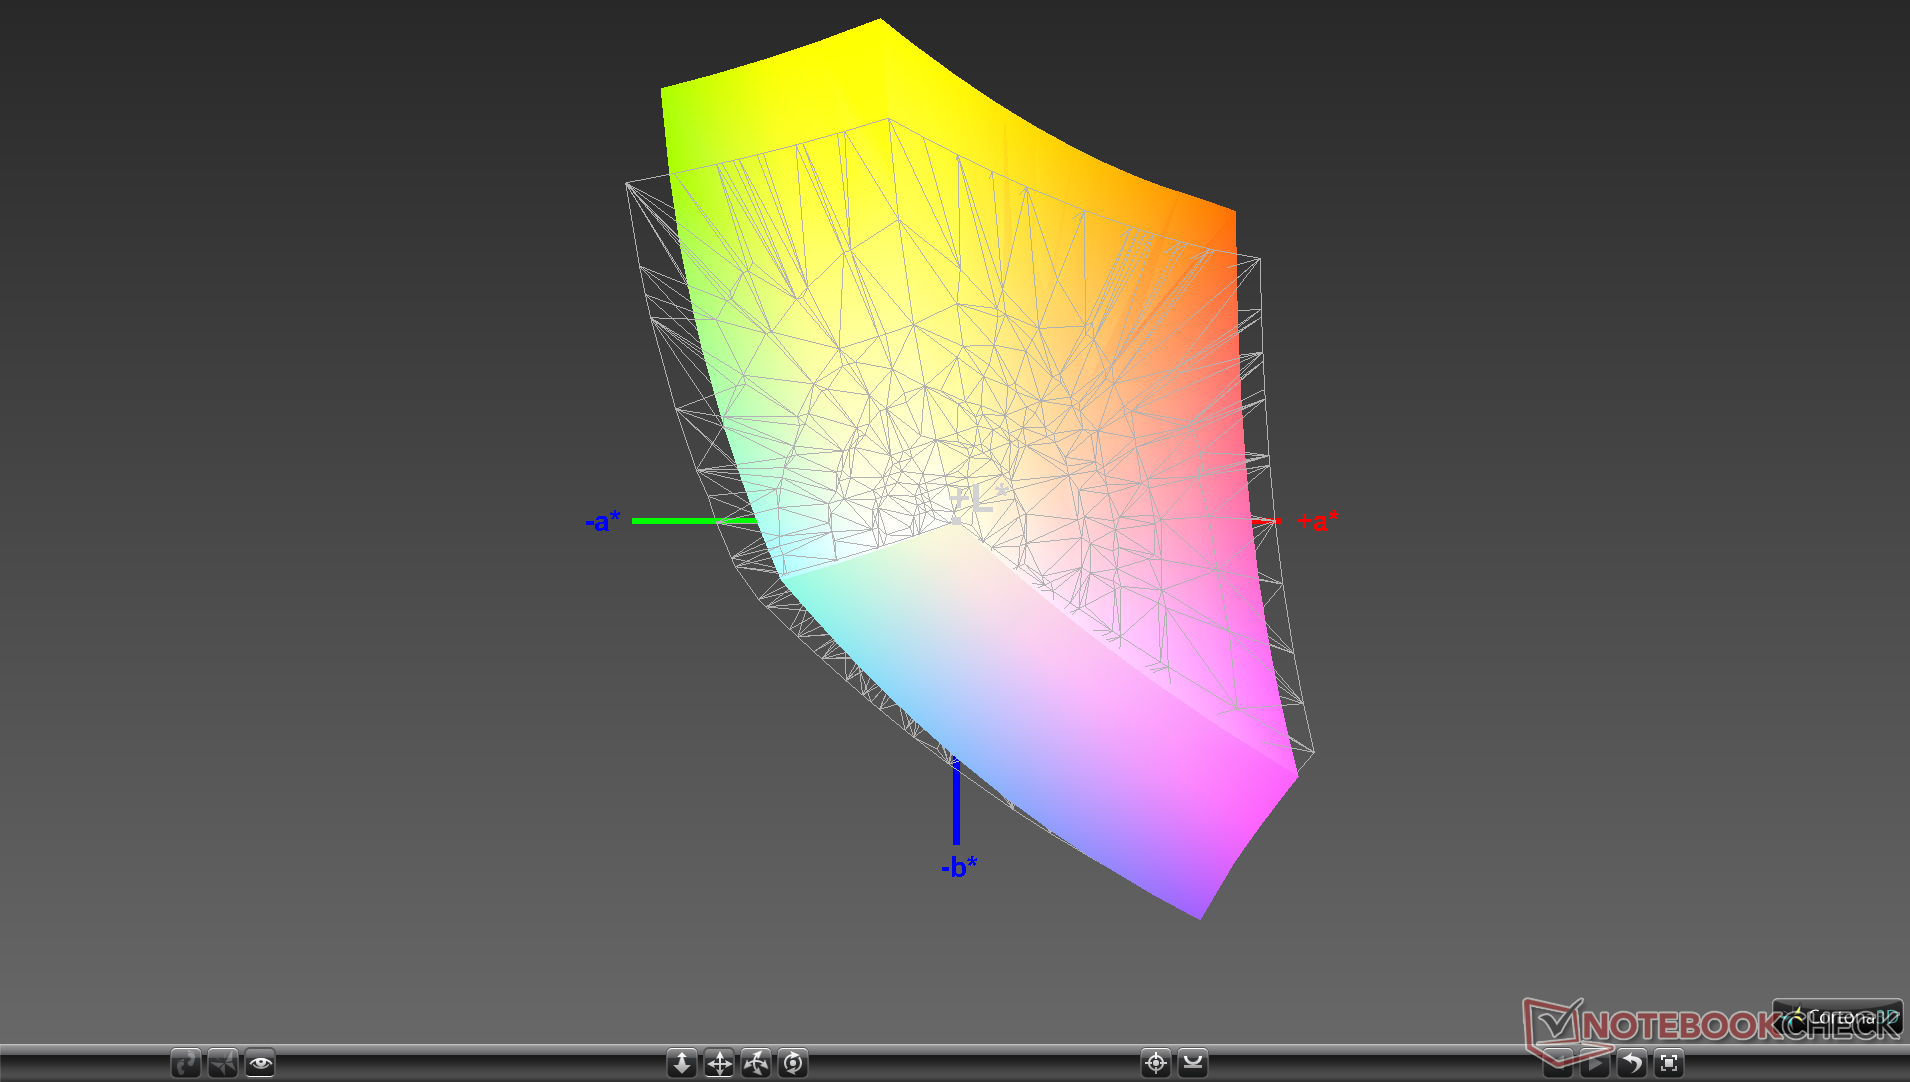
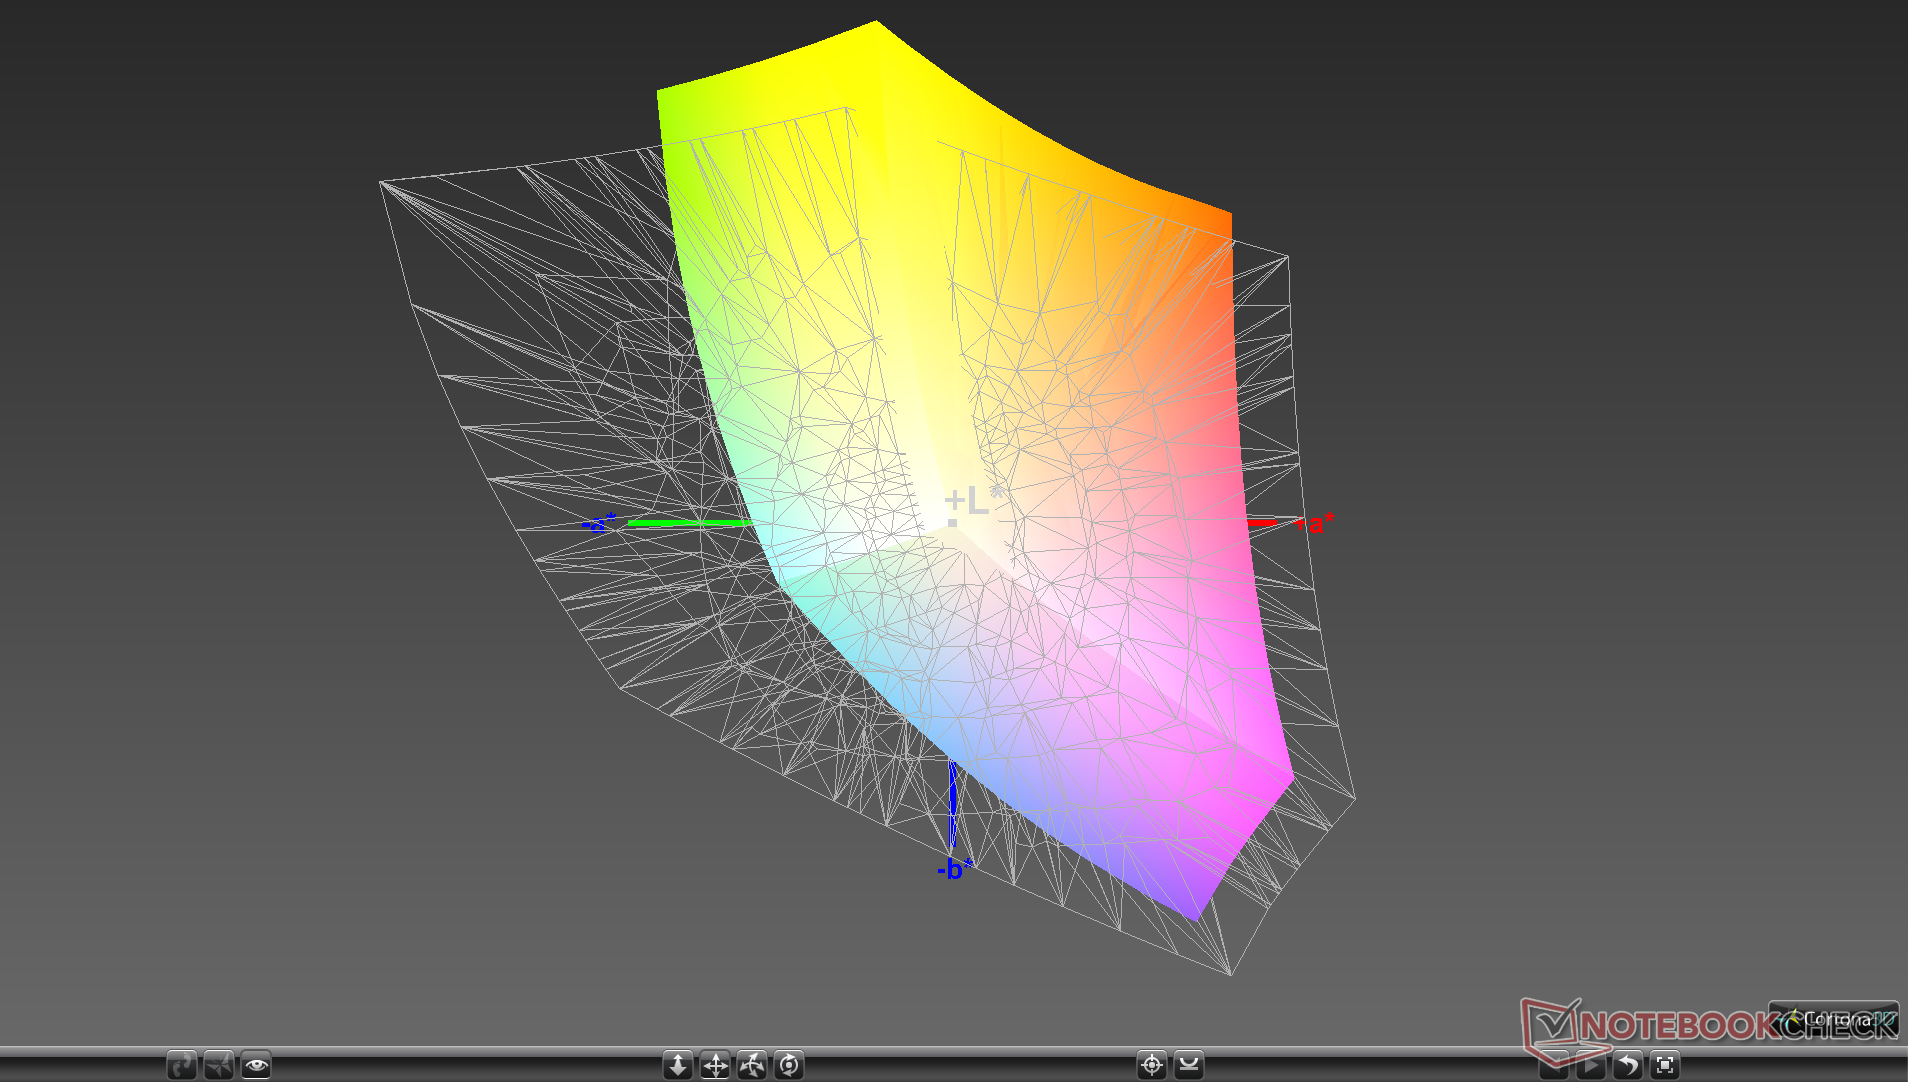
87.8% sRGB (Argyll 1.6.3 3D)
57.3% AdobeRGB 1998 (Argyll 1.6.3 3D)
64.5% AdobeRGB 1998 (Argyll 3D)
88.2% sRGB (Argyll 3D)
68.1% Display P3 (Argyll 3D)
Gamma: 2.23
CCT: 7532 K
| Chuwi LapBook Plus BOE NV156QUM-N51, IPS, 15.6", 3840x2160 | HP Pavilion 15-cs2019ng BOE080D, IPS, 15.6", 1920x1080 | Dell XPS 15 9570 i7 UHD LQ156D1, IPS, 15.6", 3840x2160 | Asus VivoBook S15 S530UN-BQ097T LP156WFC-SPD1, IPS LED, 15.6", 1920x1080 | Apple MacBook Pro 15 2018 (2.6 GHz, 560X) APPA040, IPS, 15.4", 2880x1800 | |
|---|---|---|---|---|---|
| Display | -0% | 17% | -38% | 31% | |
| Display P3 Coverage (%) | 68.1 | 67.2 -1% | 79.1 16% | 38.51 -43% | 98.7 45% |
| sRGB Coverage (%) | 88.2 | 88.1 0% | 98.8 12% | 57.9 -34% | 99.9 13% |
| AdobeRGB 1998 Coverage (%) | 64.5 | 64.4 0% | 79.2 23% | 39.79 -38% | 86.6 34% |
| Response Times | -12% | -22% | -2% | -16% | |
| Response Time Grey 50% / Grey 80% * (ms) | 40 ? | 43 ? -8% | 46.4 ? -16% | 38.8 ? 3% | 43.2 ? -8% |
| Response Time Black / White * (ms) | 25.2 ? | 29 ? -15% | 32 ? -27% | 26.8 ? -6% | 31.2 ? -24% |
| PWM Frequency (Hz) | 962 ? | 208 ? | 980 ? | 117000 ? | |
| Screen | 1% | 5% | -13% | 40% | |
| Brightness middle (cd/m²) | 360.2 | 320 -11% | 494 37% | 262 -27% | 520 44% |
| Brightness (cd/m²) | 337 | 293 -13% | 457 36% | 256 -24% | 492 46% |
| Brightness Distribution (%) | 82 | 86 5% | 88 7% | 90 10% | 88 7% |
| Black Level * (cd/m²) | 0.33 | 0.26 21% | 0.34 -3% | 0.21 36% | 0.39 -18% |
| Contrast (:1) | 1092 | 1231 13% | 1453 33% | 1248 14% | 1333 22% |
| Colorchecker dE 2000 * | 4.13 | 4.5 -9% | 5.2 -26% | 5.8 -40% | 1.2 71% |
| Colorchecker dE 2000 max. * | 8.15 | 8.81 -8% | 17.5 -115% | 14.3 -75% | 2.3 72% |
| Colorchecker dE 2000 calibrated * | 3.8 | 4.6 -21% | |||
| Greyscale dE 2000 * | 5 | 4.71 6% | 2.7 46% | 2.5 50% | 1.3 74% |
| Gamma | 2.23 99% | 2.45 90% | 2.1 105% | 1.99 111% | 2.18 101% |
| CCT | 7532 86% | 7085 92% | 7038 92% | 6528 100% | 6738 96% |
| Color Space (Percent of AdobeRGB 1998) (%) | 57.3 | 58 1% | 71.2 24% | 36.6 -36% | |
| Color Space (Percent of sRGB) (%) | 87.8 | 88 0% | 98.8 13% | 57.6 -34% | |
| Total Average (Program / Settings) | -4% /
-1% | 0% /
4% | -18% /
-17% | 18% /
29% |
* ... smaller is better
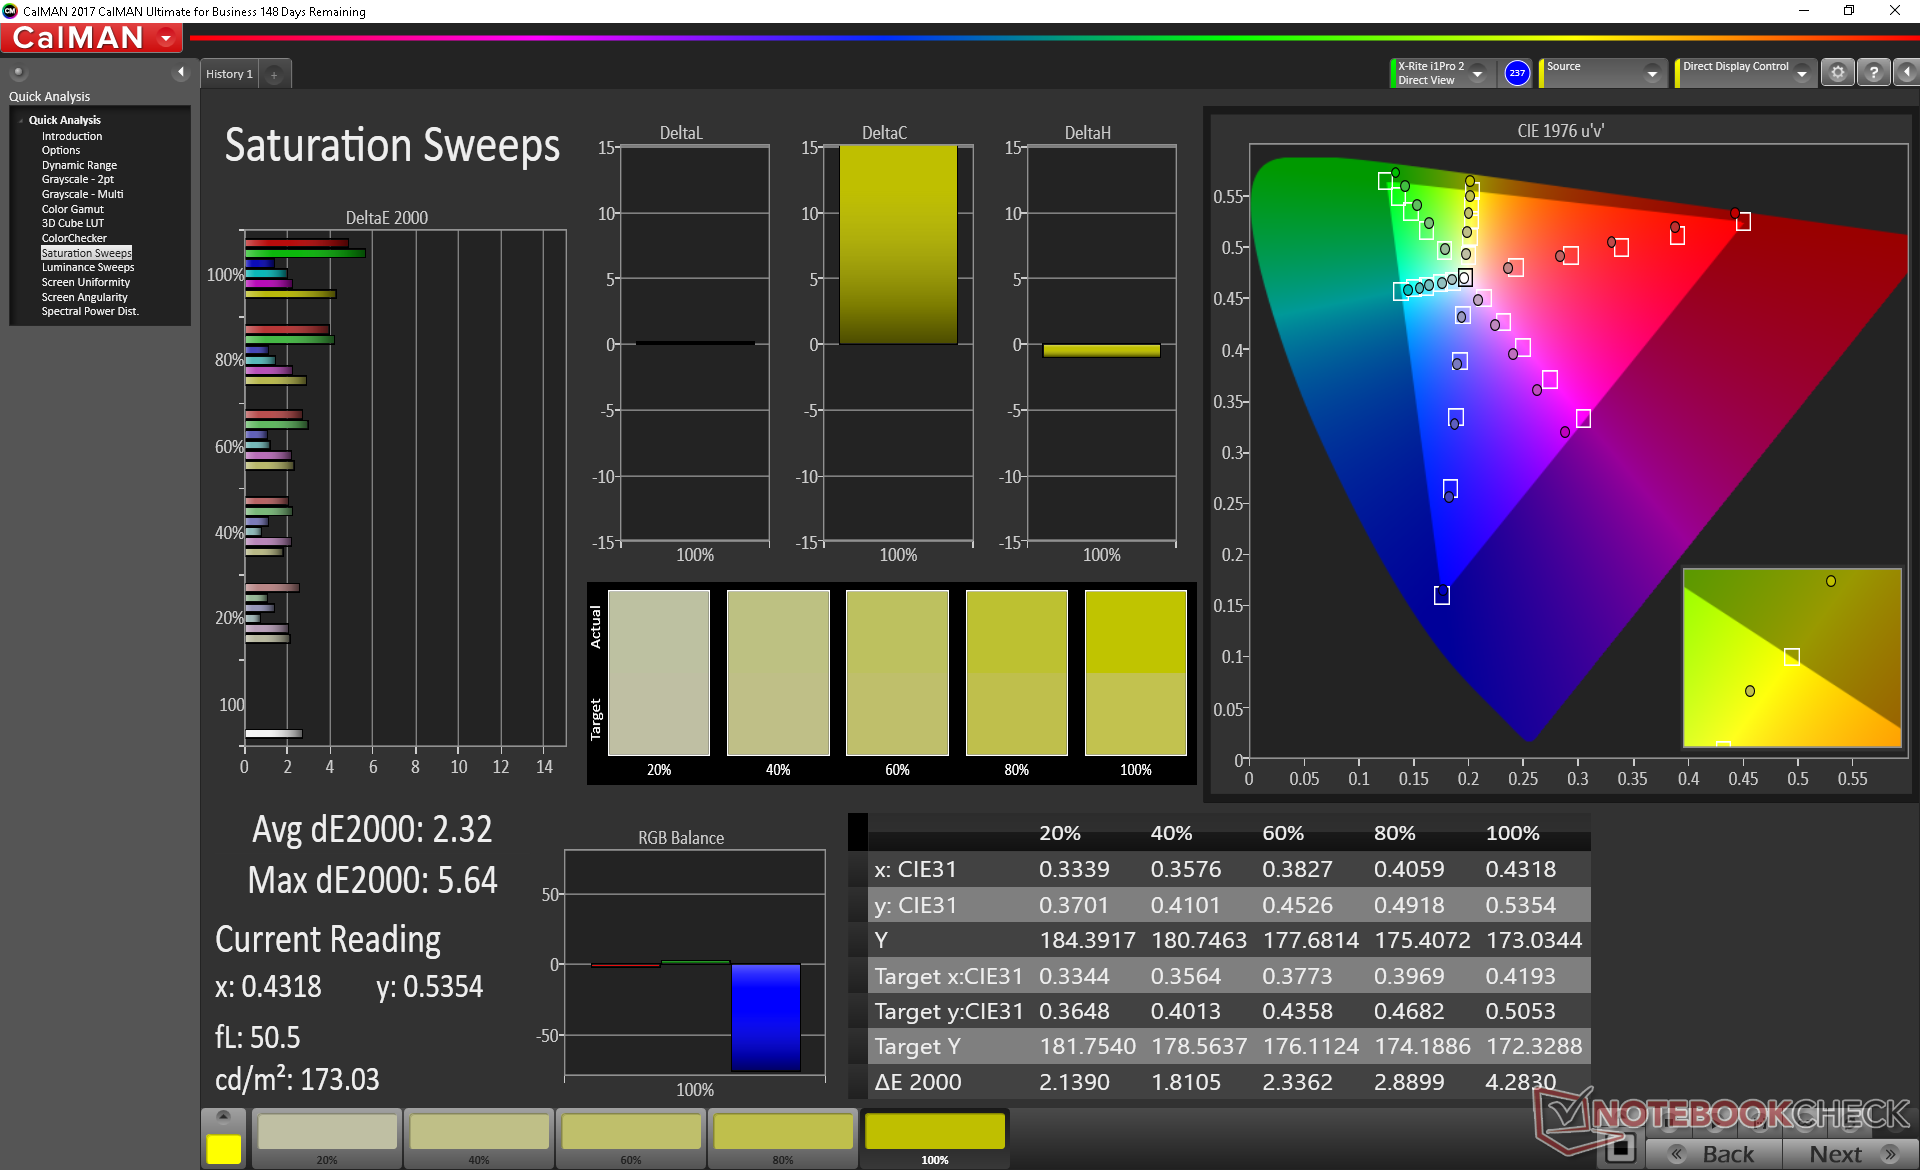
Color space covers approximately 88 percent of sRGB to be similar to many flagship Ultrabooks including the HP Spectre x360 13. There are no options for full AdobeRGB coverage unlike on the XPS 15 or ZenBook Pro 15 UX580.
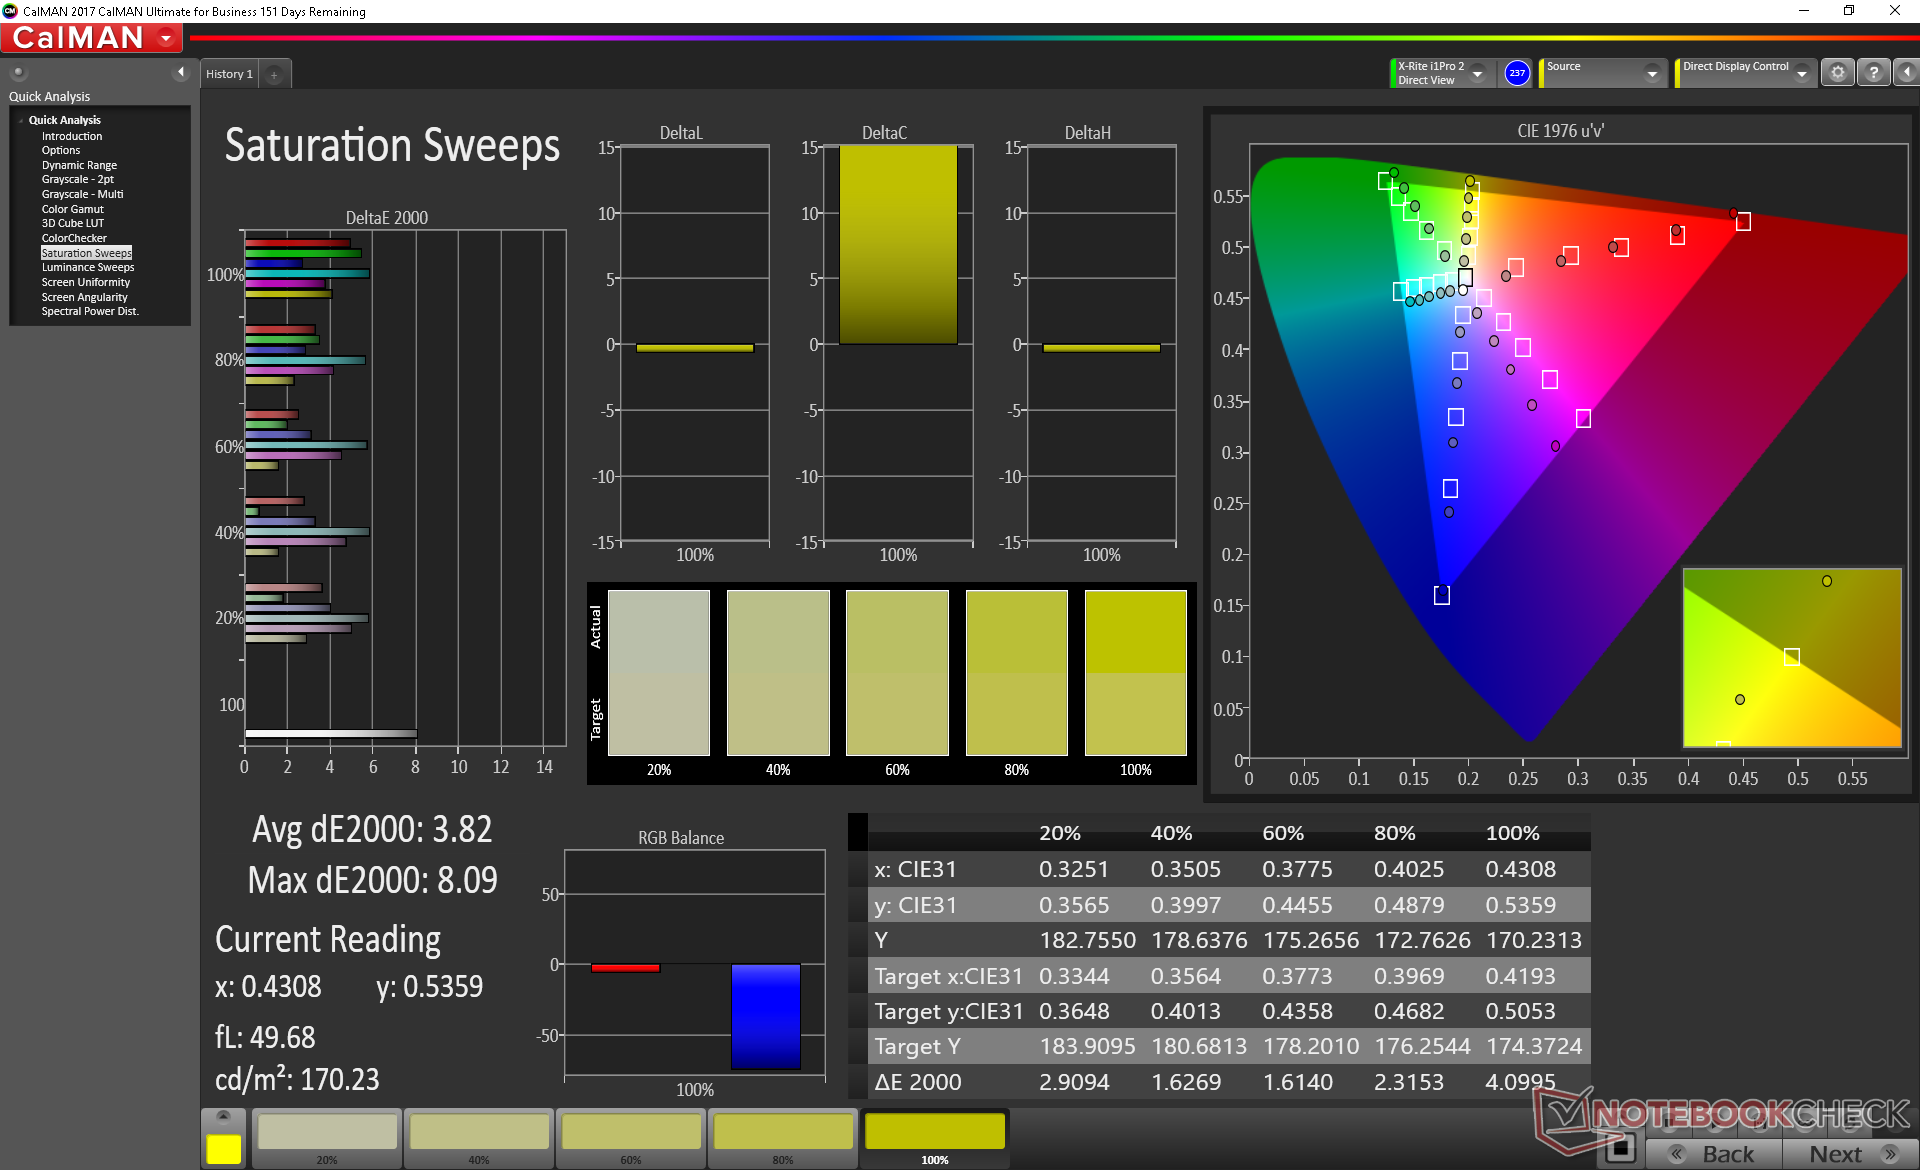
Further measurements with an X-Rite colorimeter reveal just average grayscale and an overly cool color temperature out of the box. Our calibration attempt improves both aspects for a more accurate display especially for colors at lower saturation levels. Green and Red are represented less accurately than other primary and secondary colors even after calibration.
Display Response Times
| ↔ Response Time Black to White | ||
|---|---|---|
| 25.2 ms ... rise ↗ and fall ↘ combined | ↗ 14 ms rise | 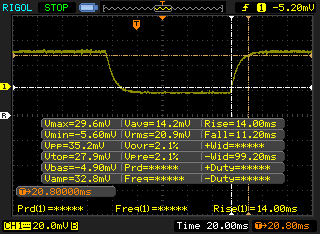 |
| ↘ 11.2 ms fall | ||
| The screen shows relatively slow response rates in our tests and may be too slow for gamers. In comparison, all tested devices range from 0.1 (minimum) to 240 (maximum) ms. » 61 % of all devices are better. This means that the measured response time is worse than the average of all tested devices (19.8 ms). | ||
| ↔ Response Time 50% Grey to 80% Grey | ||
| 40 ms ... rise ↗ and fall ↘ combined | ↗ 21.2 ms rise | 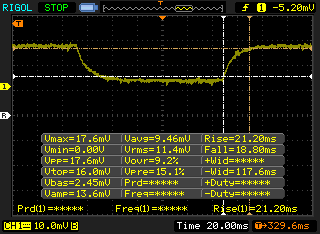 |
| ↘ 18.8 ms fall | ||
| The screen shows slow response rates in our tests and will be unsatisfactory for gamers. In comparison, all tested devices range from 0.165 (minimum) to 636 (maximum) ms. » 61 % of all devices are better. This means that the measured response time is worse than the average of all tested devices (31 ms). | ||
Screen Flickering / PWM (Pulse-Width Modulation)
| Screen flickering / PWM detected | 962 Hz | ≤ 99 % brightness setting | 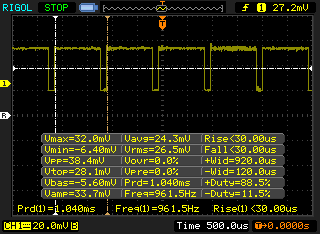 |
The display backlight flickers at 962 Hz (worst case, e.g., utilizing PWM) Flickering detected at a brightness setting of 99 % and below. There should be no flickering or PWM above this brightness setting. The frequency of 962 Hz is quite high, so most users sensitive to PWM should not notice any flickering. In comparison: 52 % of all tested devices do not use PWM to dim the display. If PWM was detected, an average of 7757 (minimum: 5 - maximum: 343500) Hz was measured. | |||
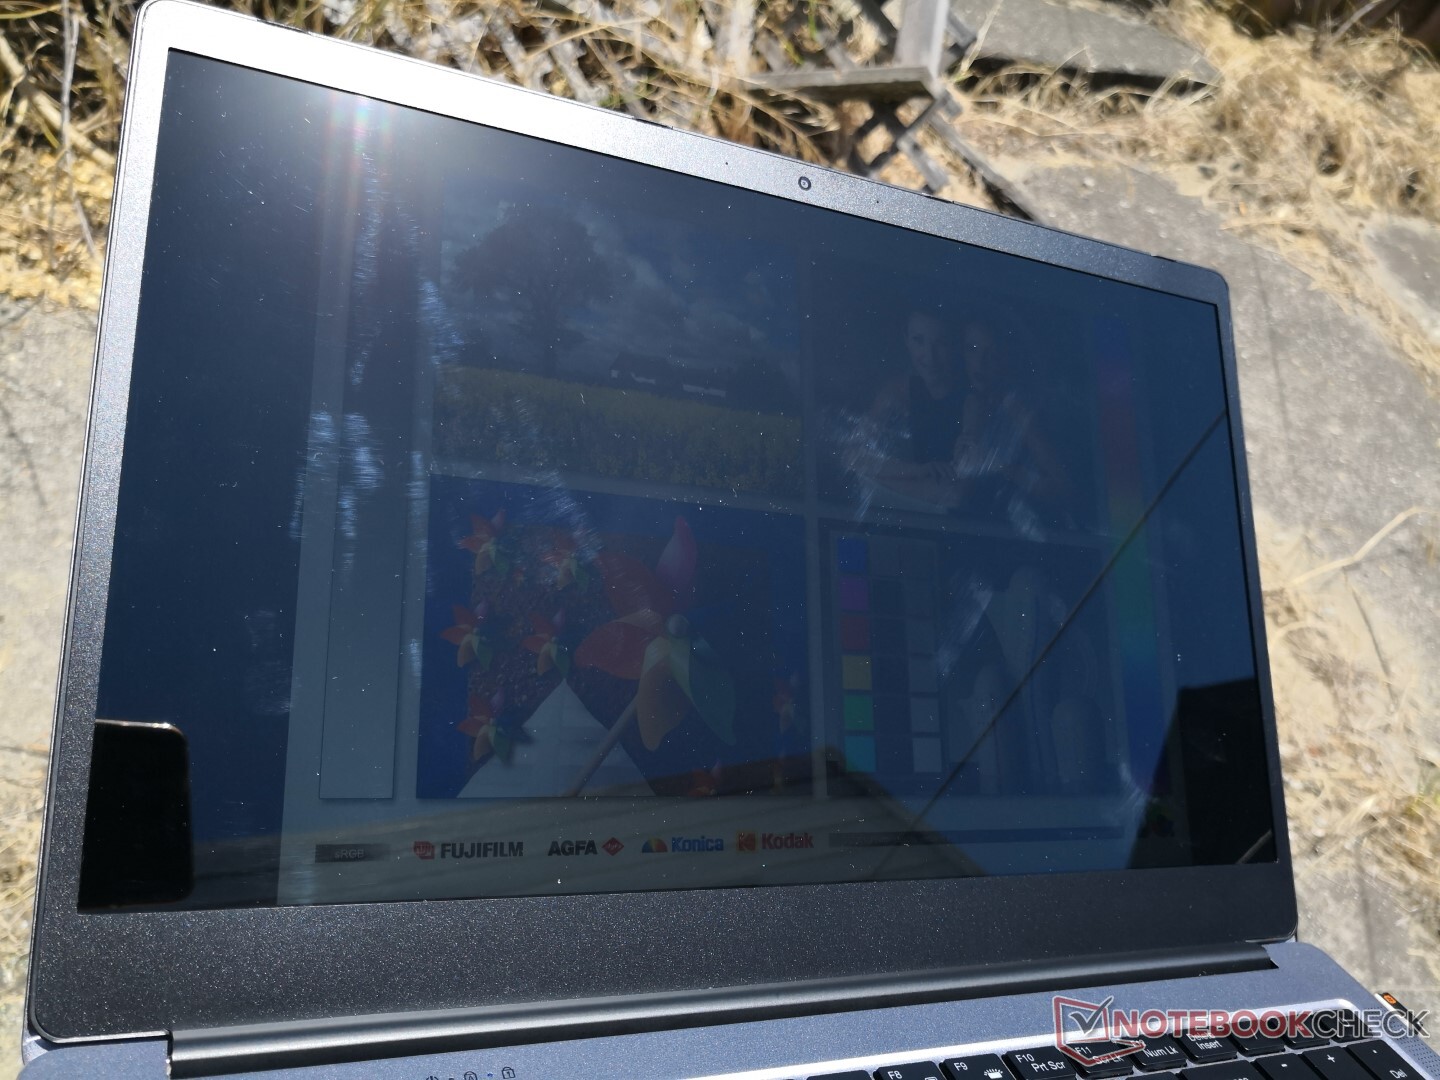
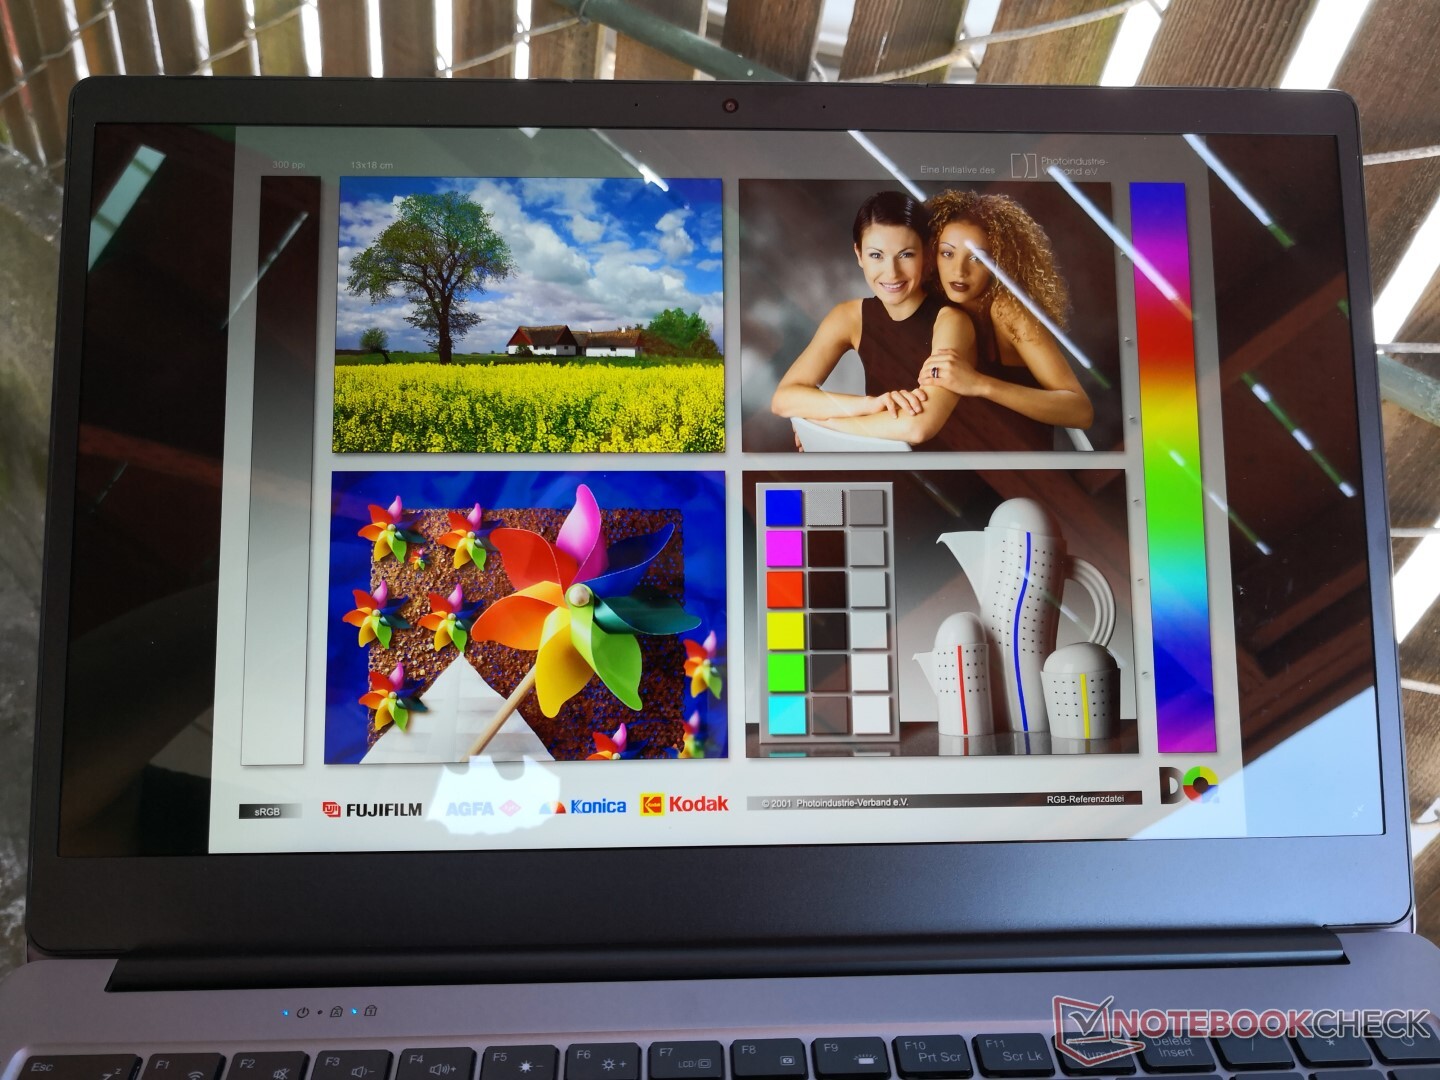
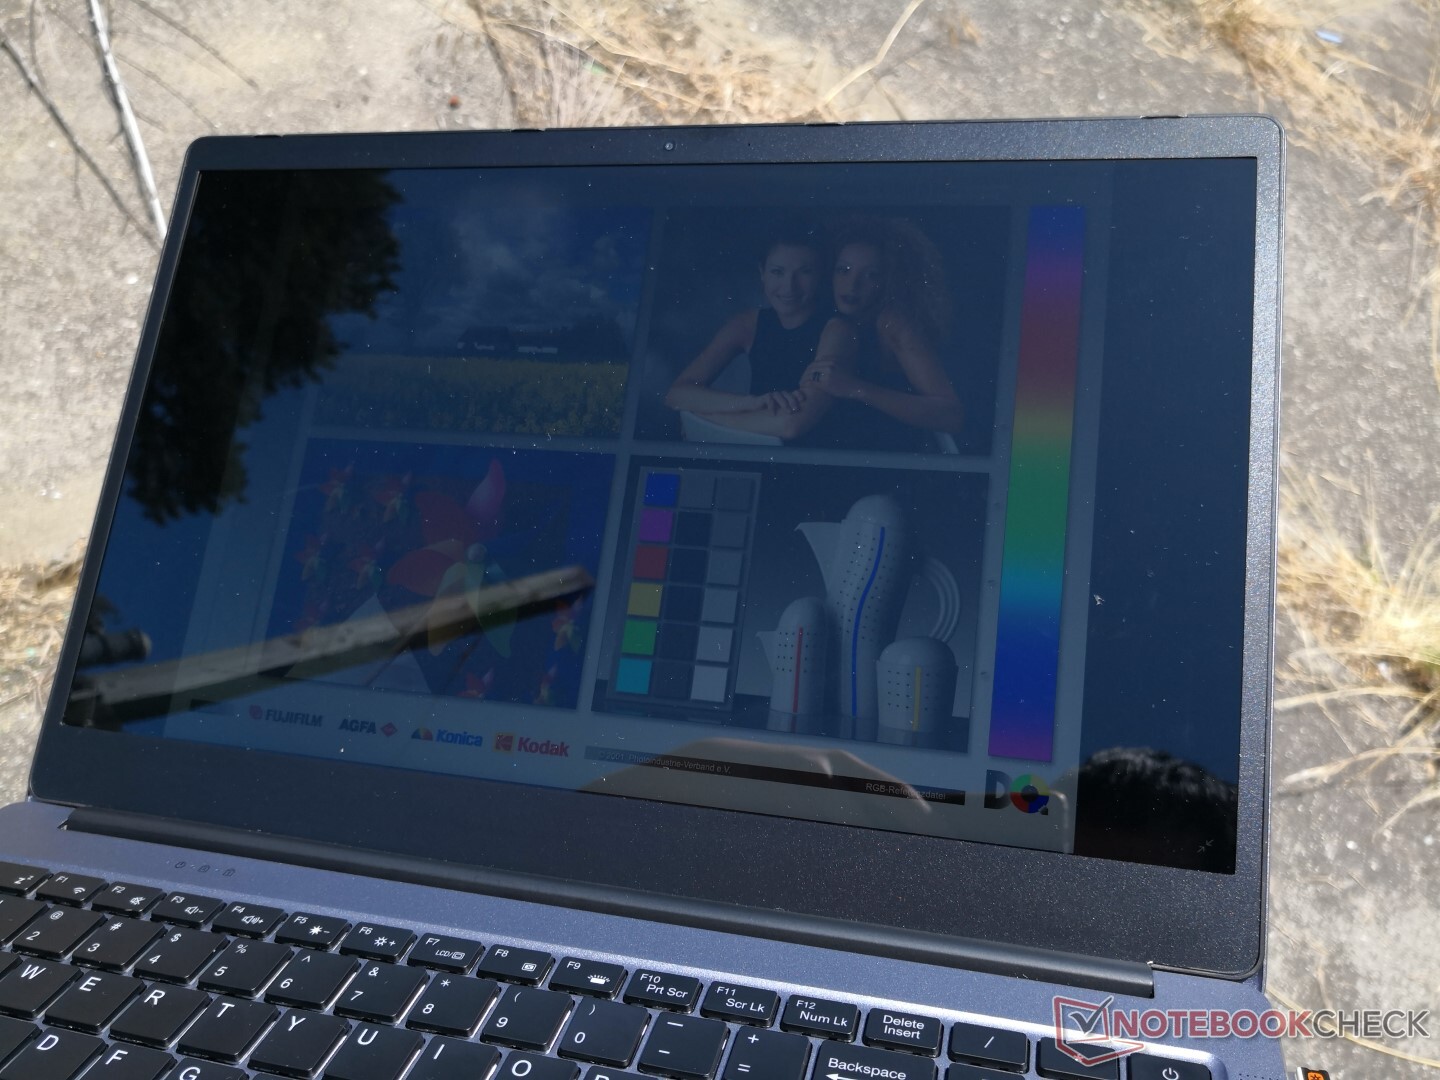
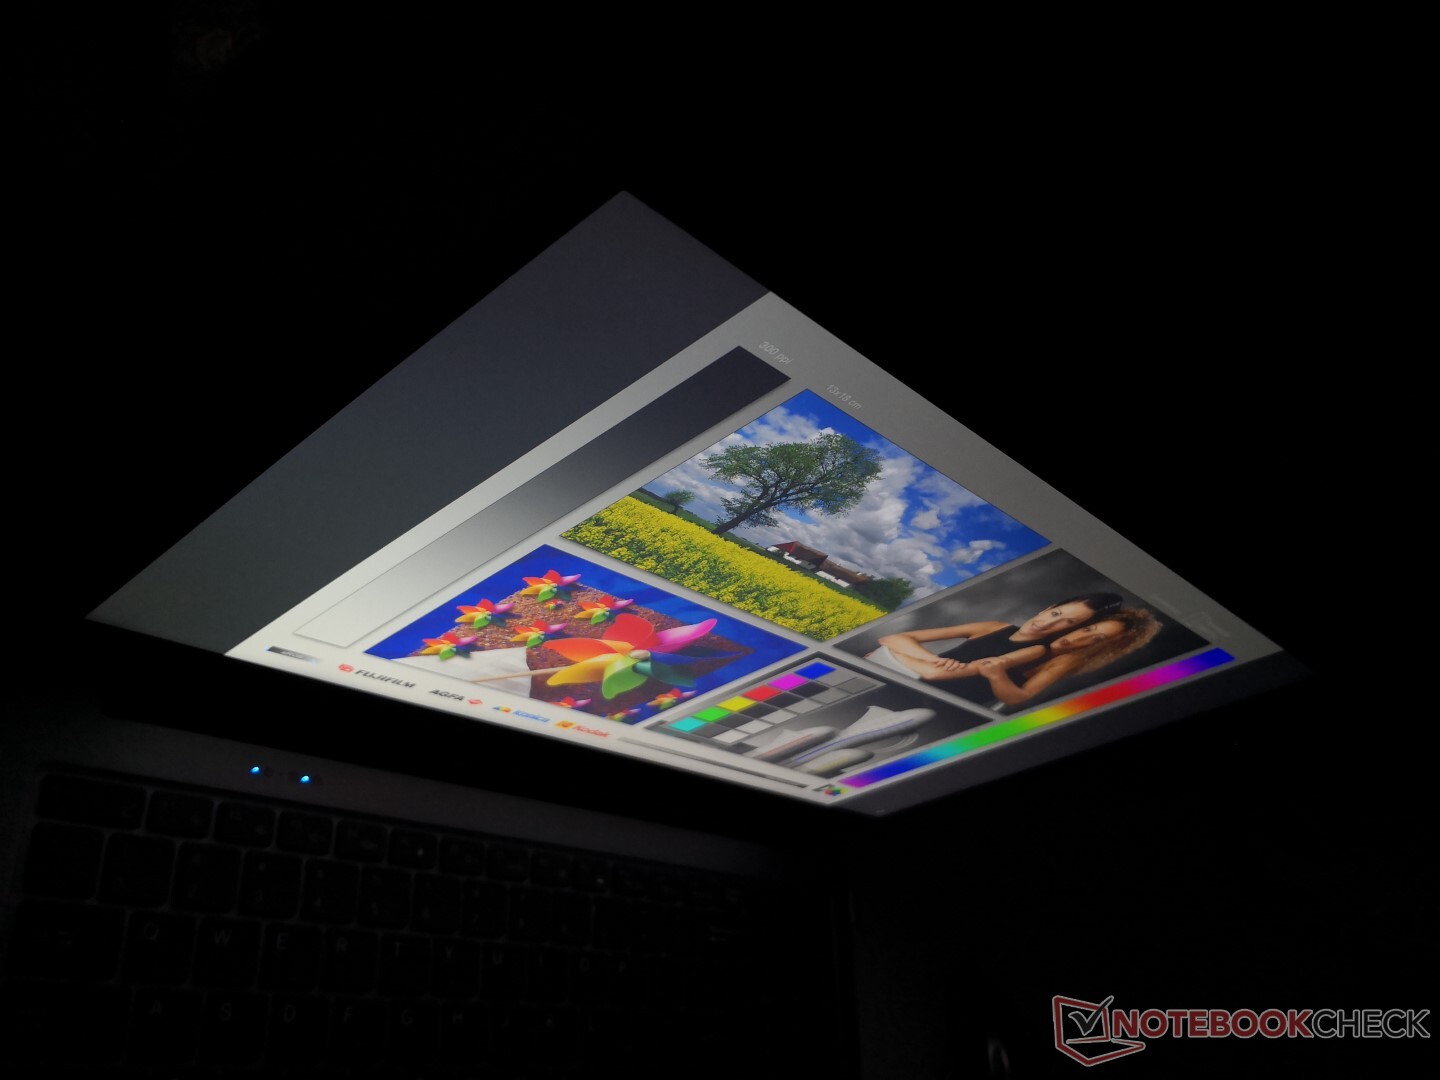
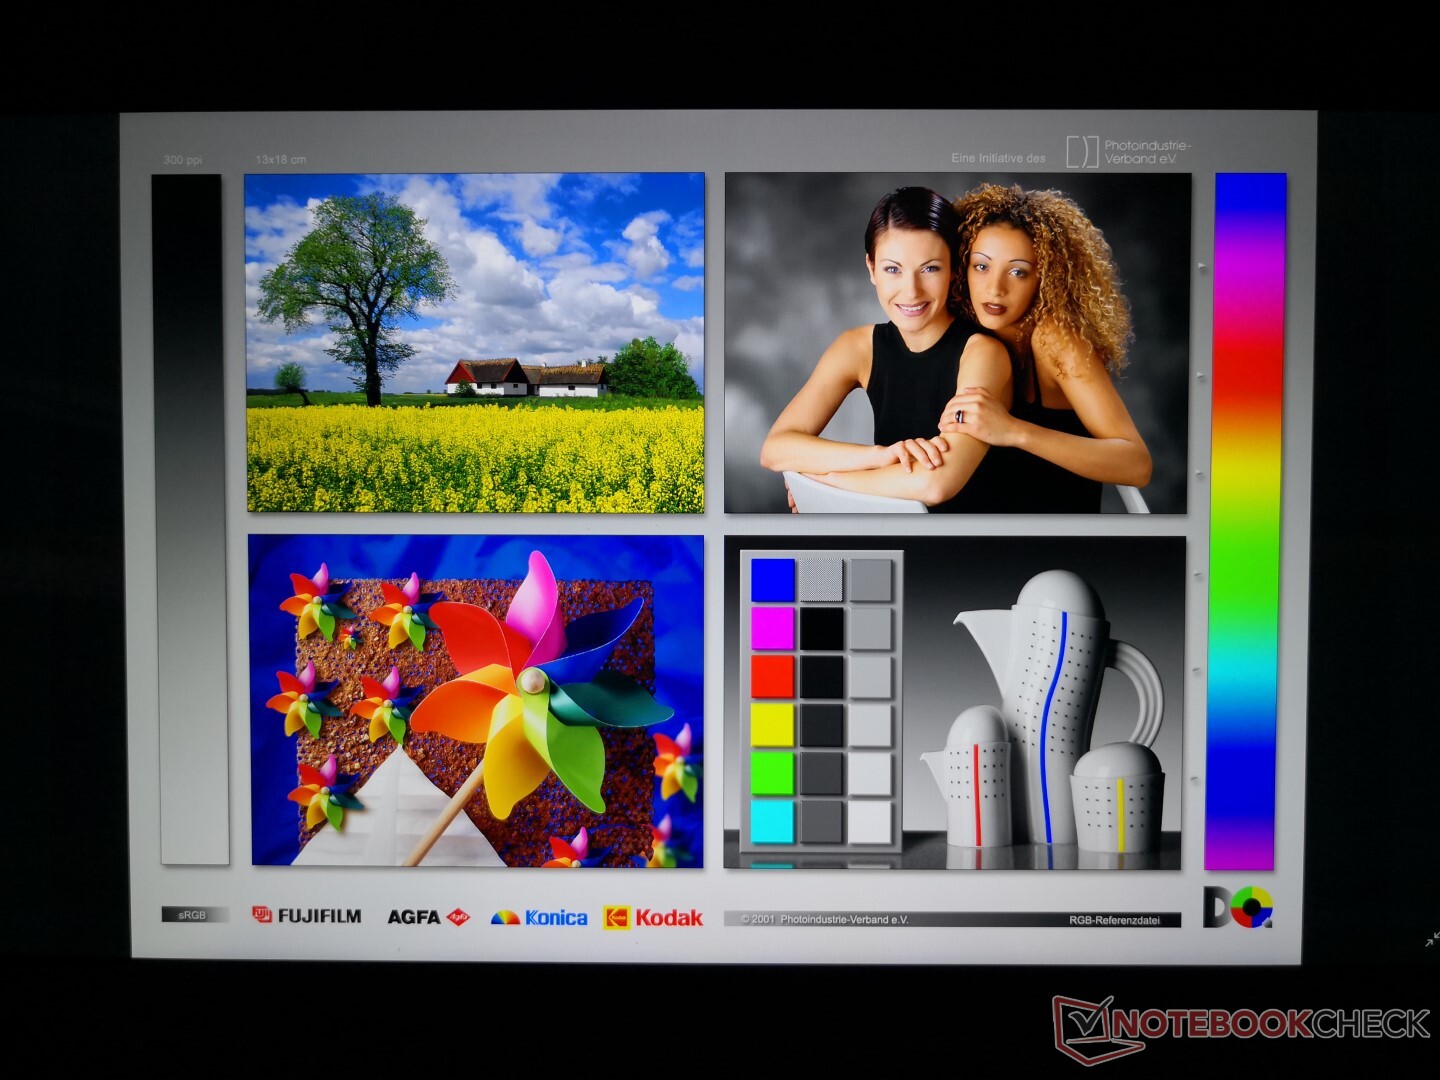
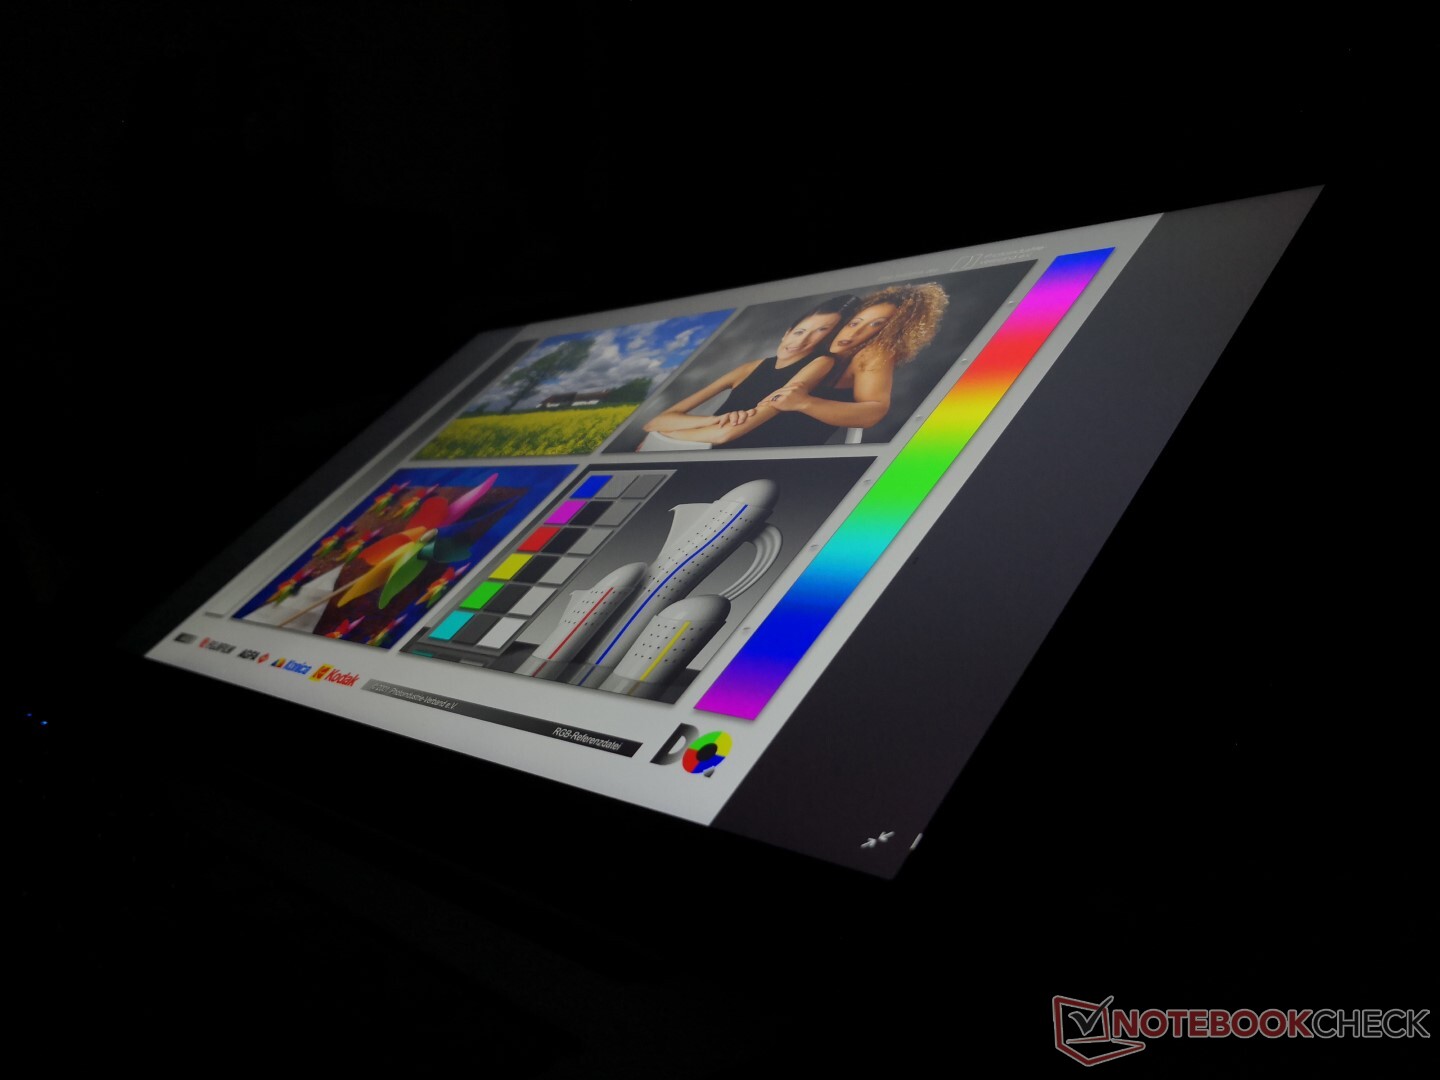
Outdoor visibility is decent when working under shade. Otherwise, anything brighter will accentuate glare and wash out colors. Be prepared to constantly adjust the display angle because of the glossy screen. Viewing angles are wide with some noticeable color and contrast degradation only if viewing from abnormally extreme angles.
Performance
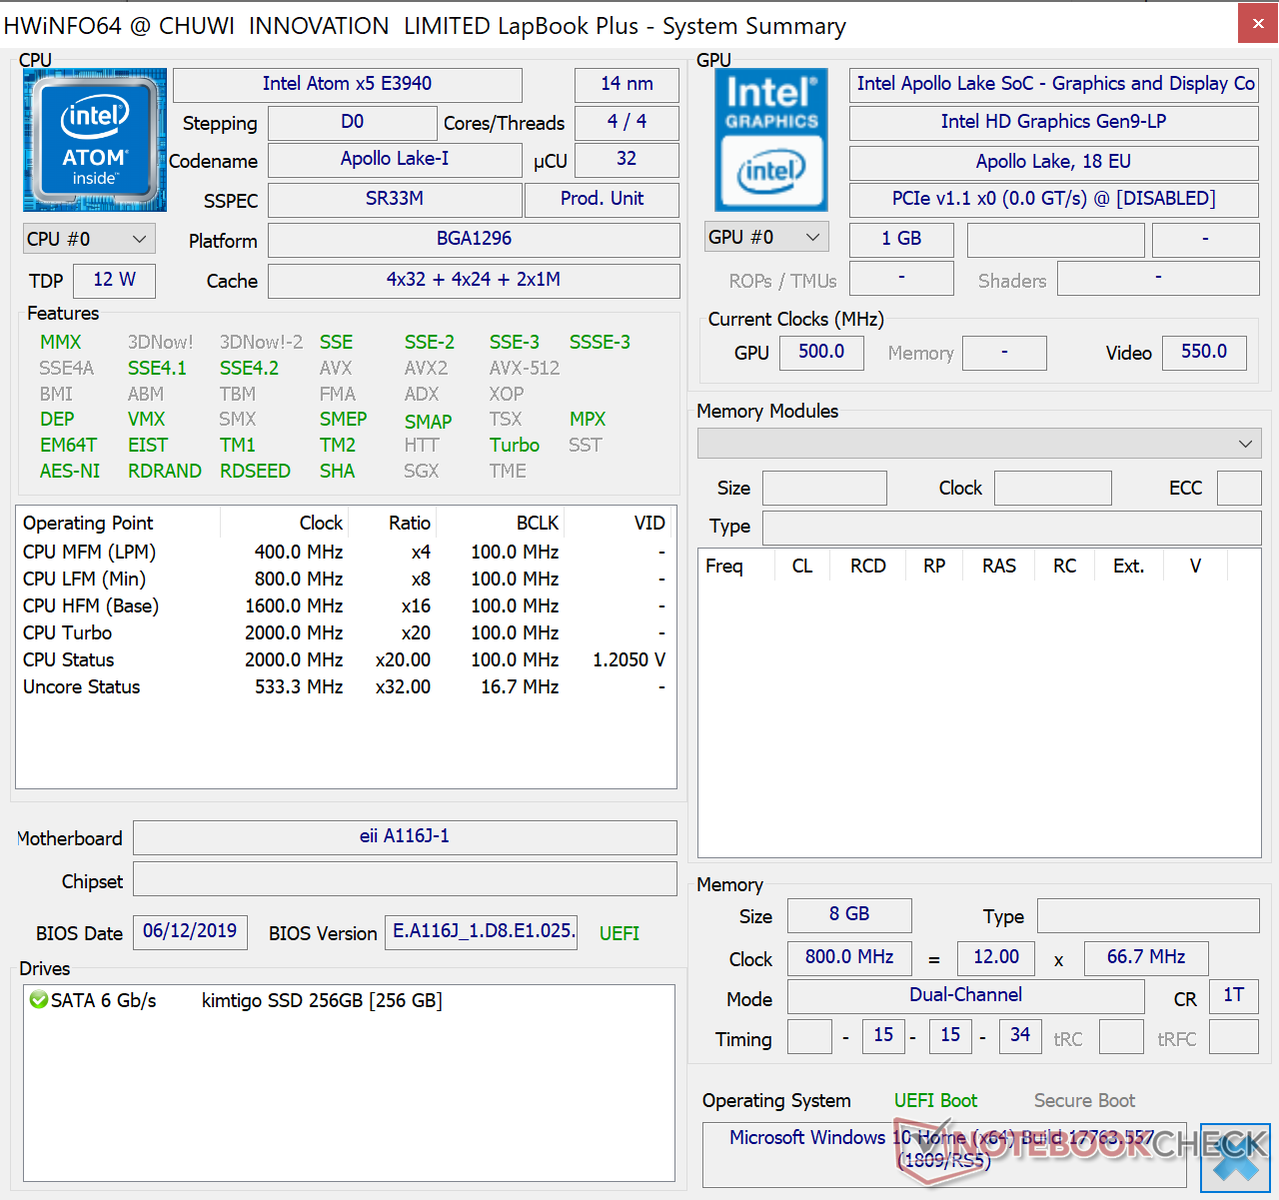
The quad-core Intel Apollo Lake Atom x7-E3950 is the only processor option available. This rare CPU is comparable in performance to the more common Cherry Trail Atom x5-Z8350 as found on cheap tablets and netbooks like the Asus Transformer Book or Lenovo IdeaPad Miix 310. Performance is significantly slower than anything from the Core ix series since Atom CPUs can be passively cooled.
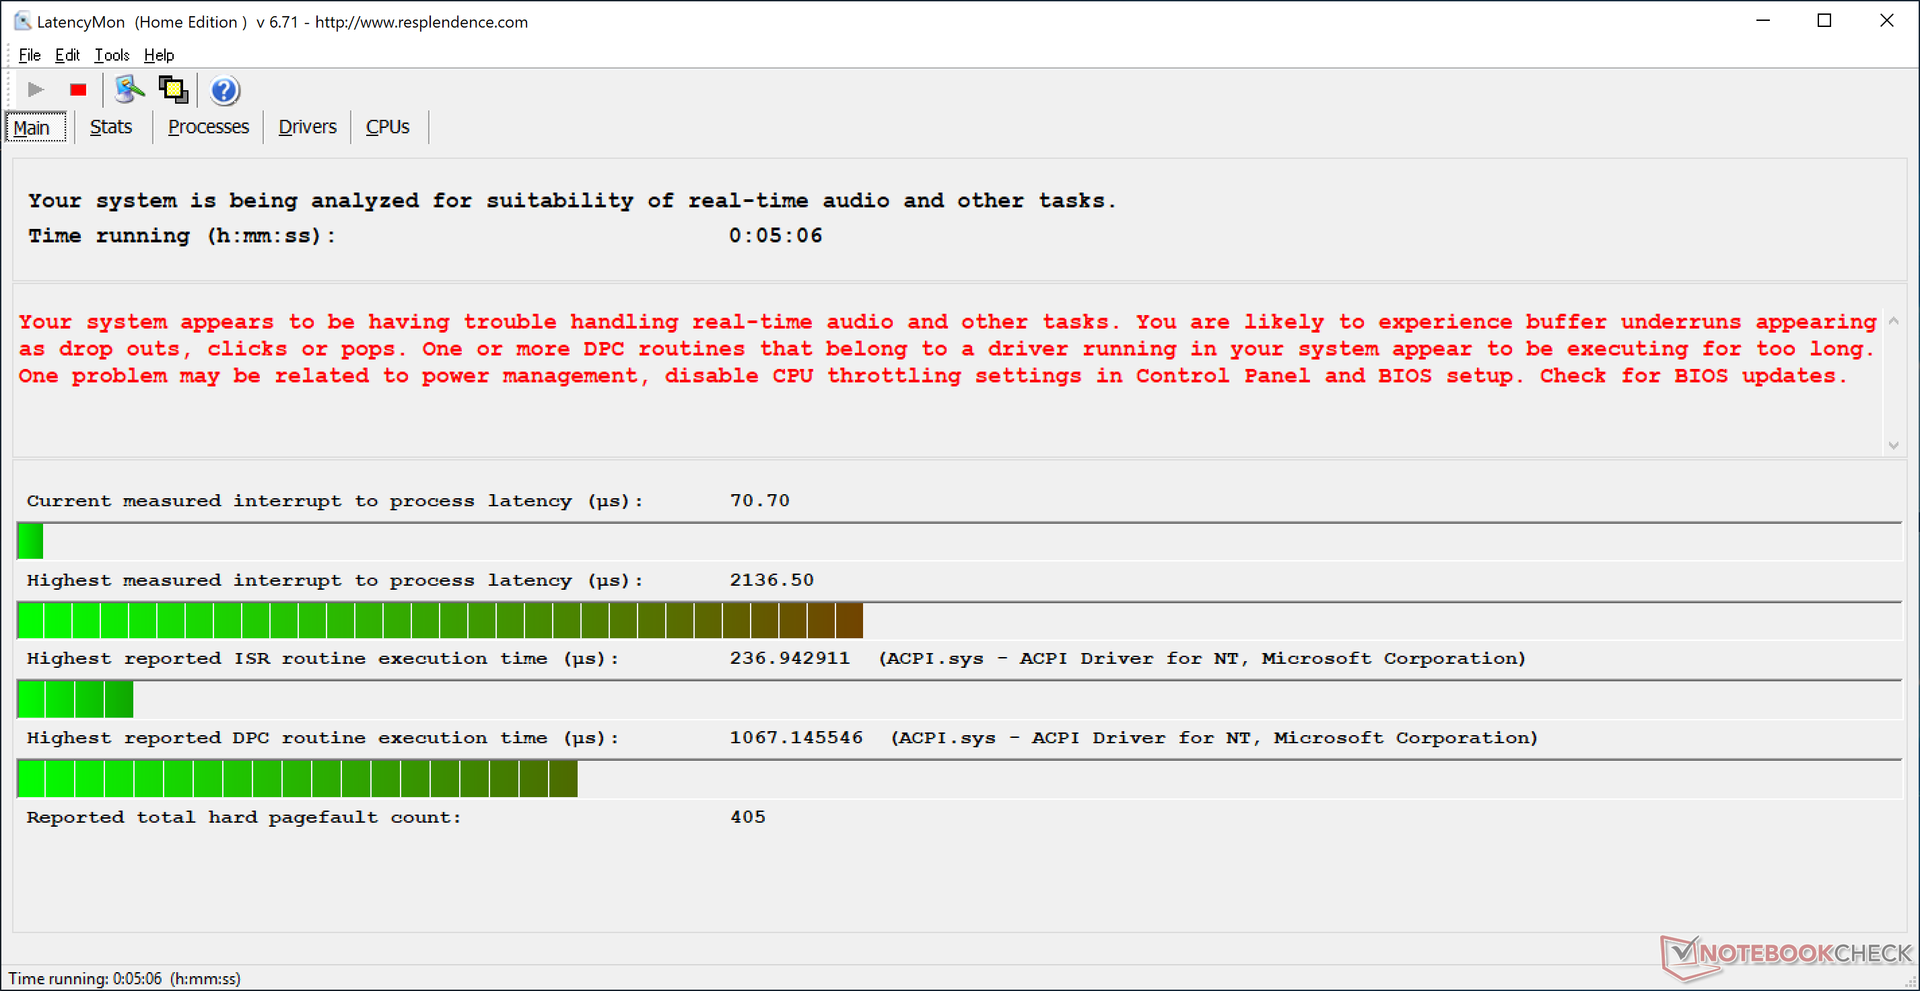
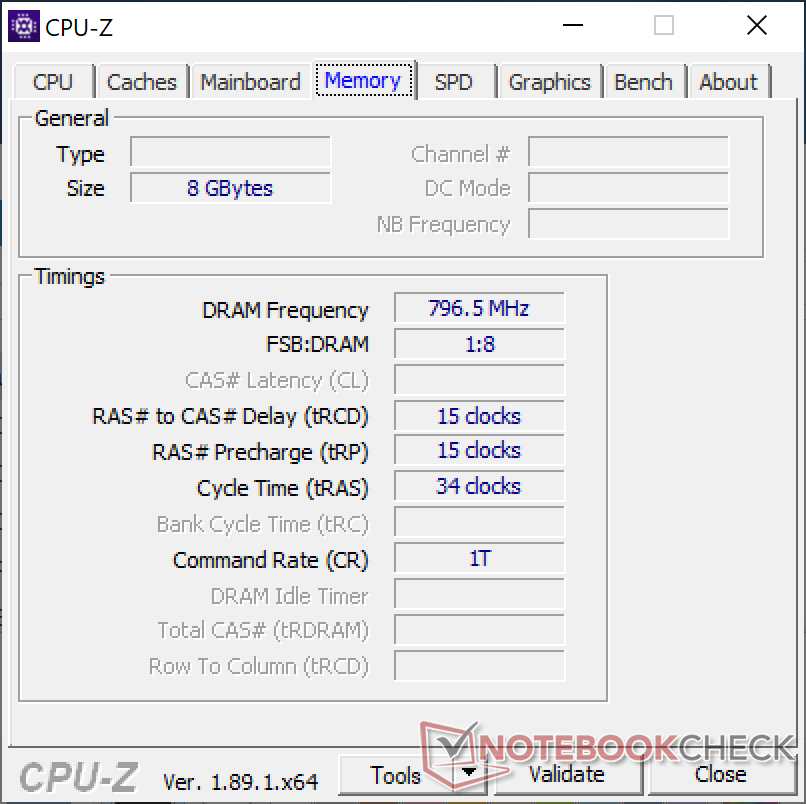
System RAM is fixed at 8 GB DDR4. LatencyMon shows issues handling real-time audio even when the wireless is disabled.
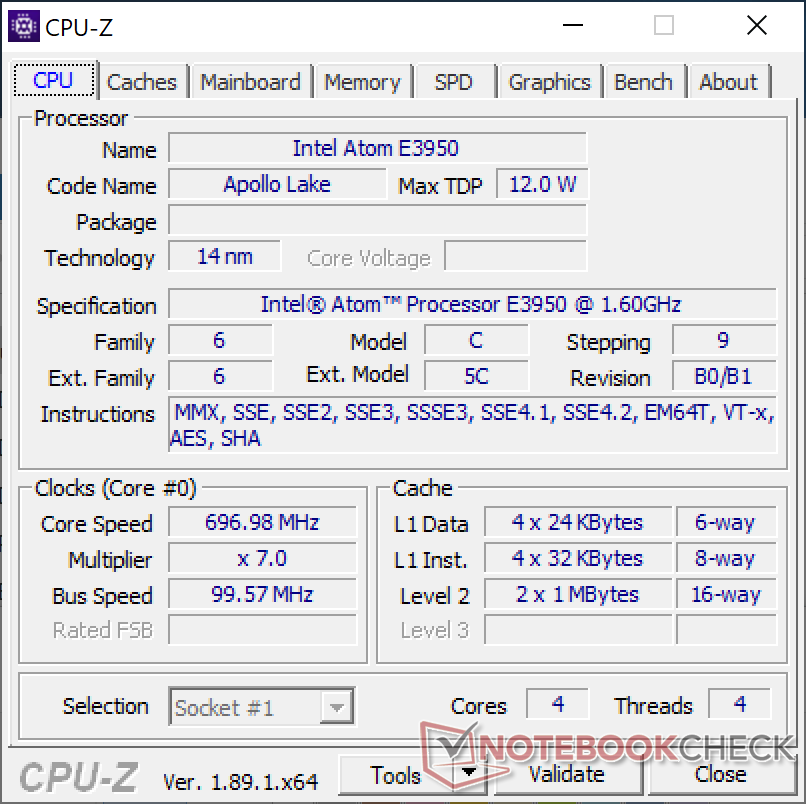

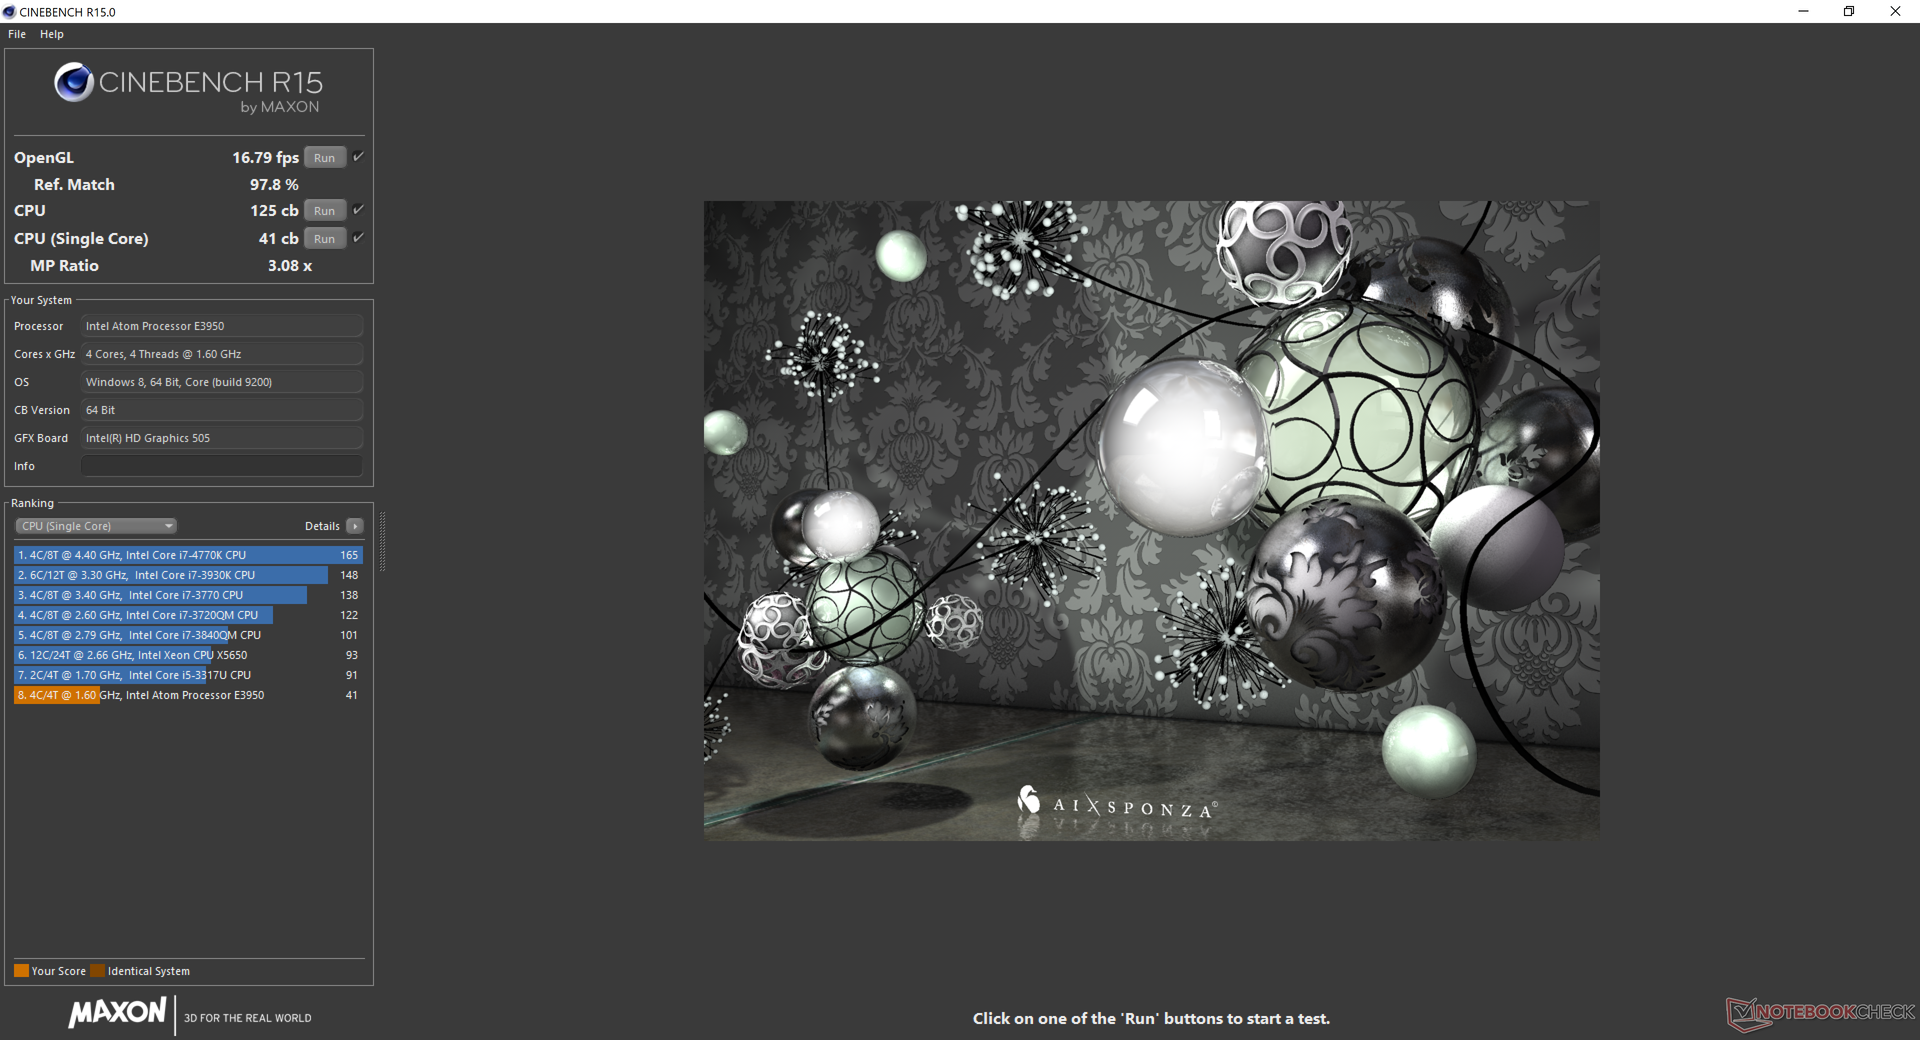
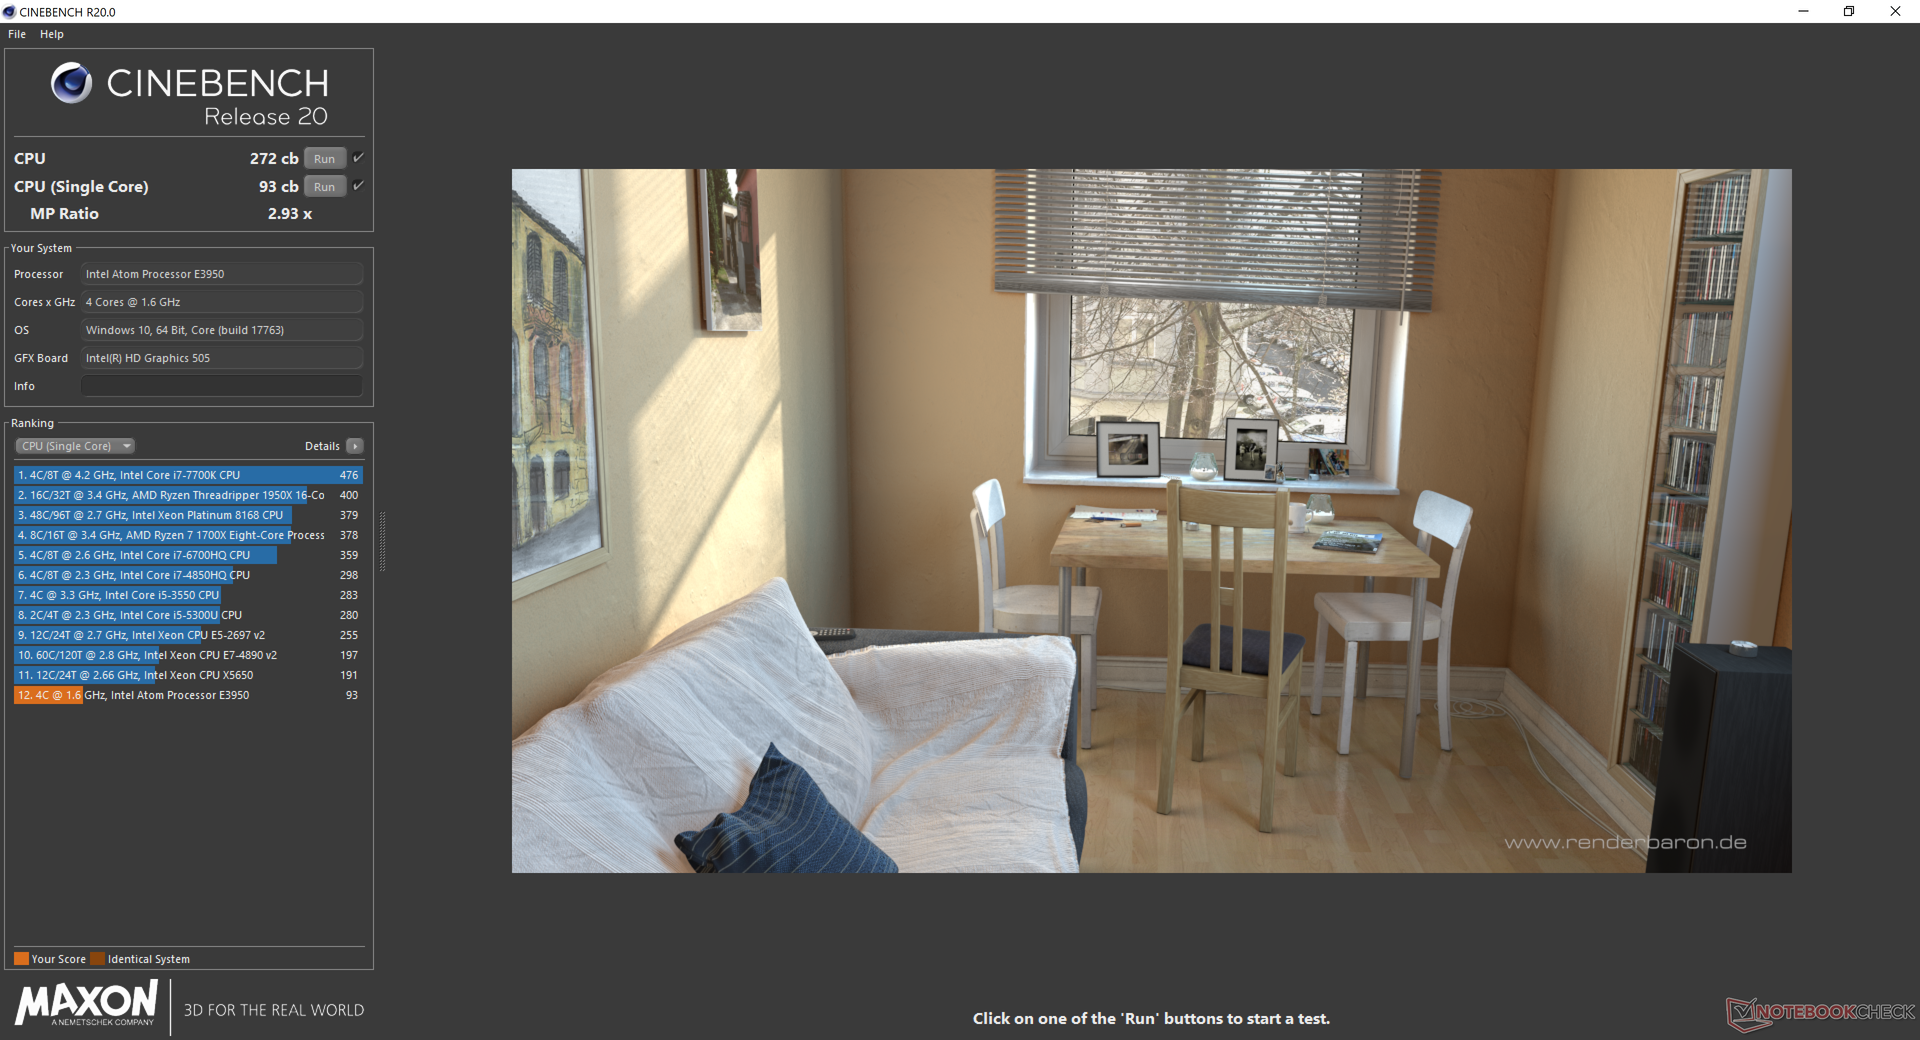
Processor
CPU performance from the quad-core Atom x7-E3950 is abysmally slow. Multi-thread performance is about 30 percent faster than the Atom x5-Z8350 in the Chuwi Hi10 Air, but overall performance is still some of the slowest for any modern laptop. Alternatives with Core i3, Celeron N4100, or even Core m are able to perform faster than what is offered here on the LapBook Plus.
See our dedicated page on the Atom x7-E3950 for more technical information and benchmarks.
| Cinebench R11.5 | |
| CPU Single 64Bit | |
| Acer Swift 3 SF314-55-31N8 | |
| Microsoft Surface Pro (2017) m3 | |
| Lenovo ThinkPad X1 Tablet | |
| Asus X555DA-BB11 | |
| Chuwi LapBook Plus | |
| Asus Transformer Book T200TA PL | |
| CPU Multi 64Bit | |
| Acer Swift 3 SF314-55-31N8 | |
| Microsoft Surface Pro (2017) m3 | |
| Lenovo ThinkPad X1 Tablet | |
| Asus X555DA-BB11 | |
| Chuwi LapBook Plus | |
| Asus Transformer Book T200TA PL | |
| Cinebench R10 | |
| Rendering Multiple CPUs 32Bit | |
| Acer Swift 3 SF314-55-31N8 | |
| Microsoft Surface Pro (2017) m3 | |
| Lenovo Tablet 10-20L3000KGE | |
| Asus X555DA-BB11 | |
| Asus Transformer Book T200TA PL | |
| Chuwi LapBook Plus | |
| Chuwi HeroBook 14 | |
| Trekstor SurfTab duo W3 | |
| HP x2 210 G1 | |
| Rendering Single 32Bit | |
| Acer Swift 3 SF314-55-31N8 | |
| Microsoft Surface Pro (2017) m3 | |
| Asus X555DA-BB11 | |
| Lenovo Tablet 10-20L3000KGE | |
| Chuwi LapBook Plus | |
| Asus Transformer Book T200TA PL | |
| Trekstor SurfTab duo W3 | |
| Chuwi HeroBook 14 | |
| HP x2 210 G1 | |
| wPrime 2.10 - 1024m | |
| Chuwi HeroBook 14 | |
| Chuwi LapBook Plus | |
| Asus Transformer Book T200TA PL | |
| Lenovo ThinkPad X1 Tablet | |
| Asus X555DA-BB11 | |
| Acer Swift 3 SF314-55-31N8 | |
* ... smaller is better
System Performance
PCMark results are consistently ahead of the HP x2 with the Atom x5-Z8350 but still far below the average multimedia laptop. The extremely low scores translate to slow launch times and even annoying delays in typing.
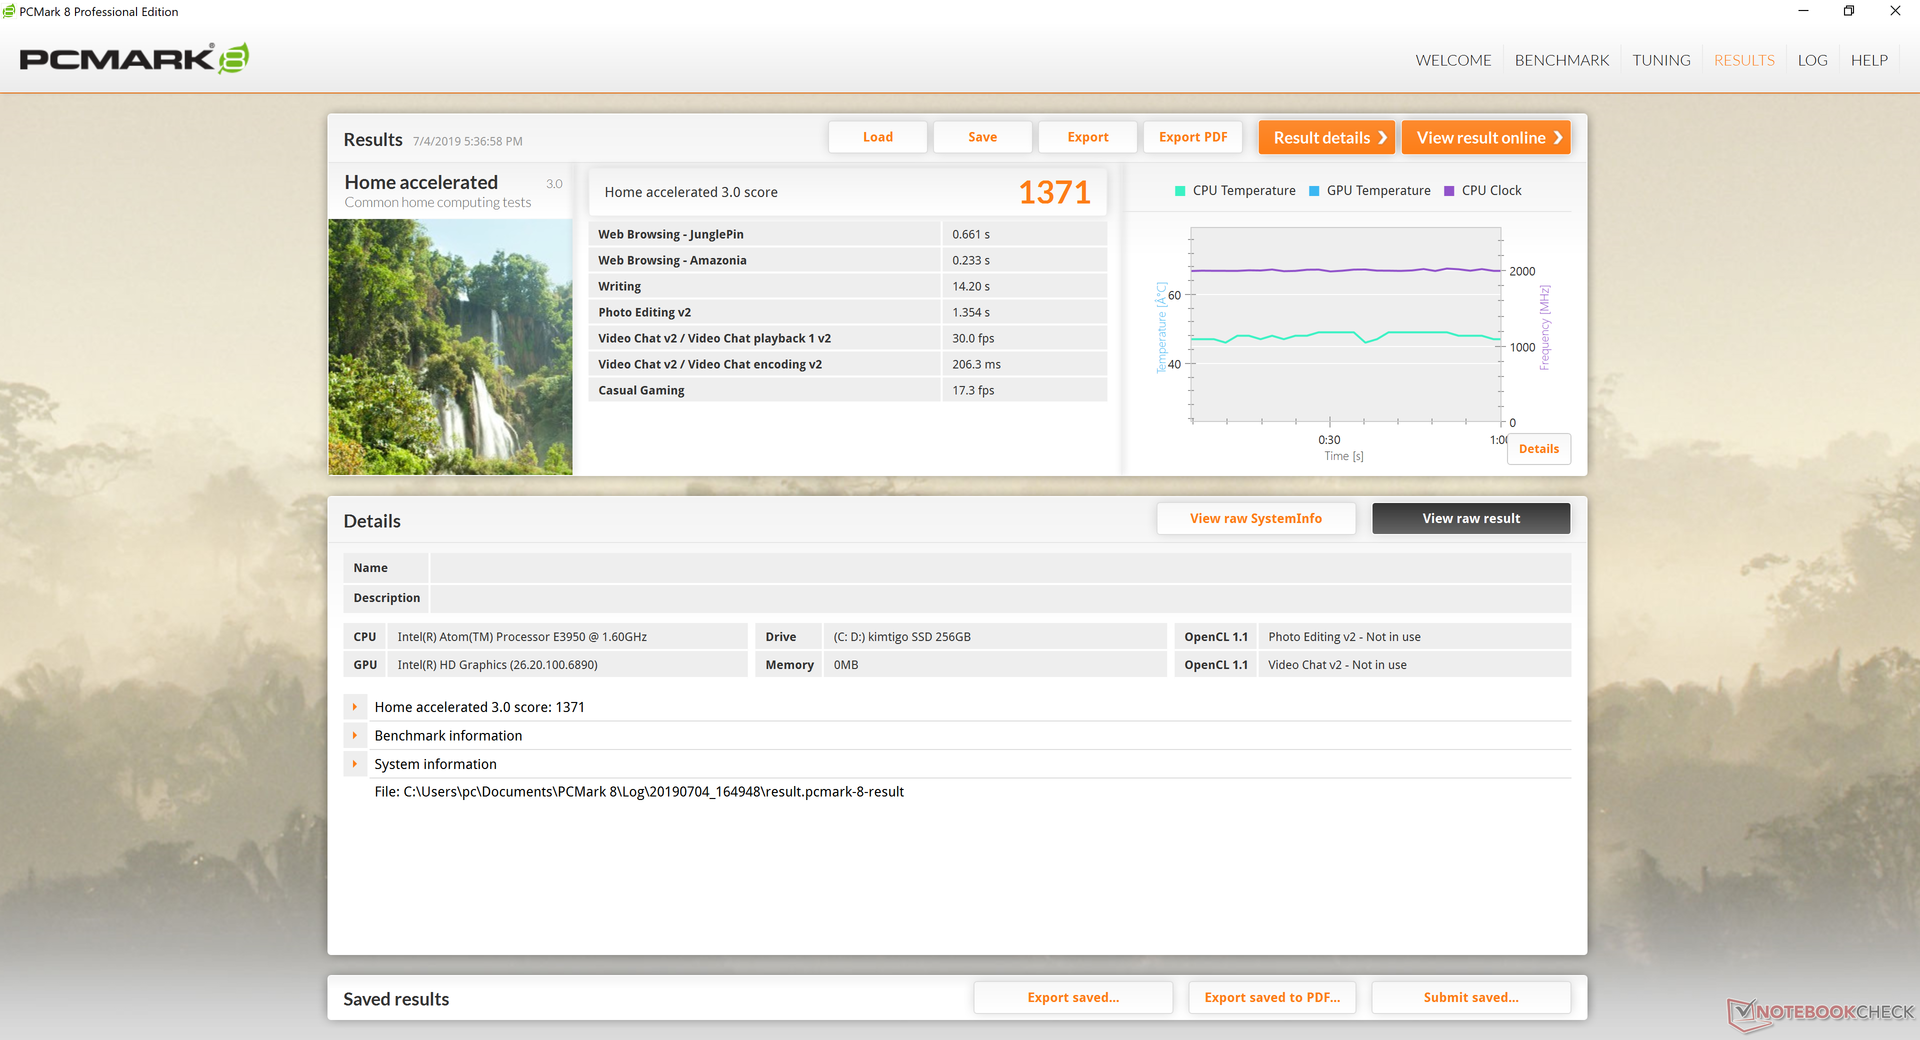
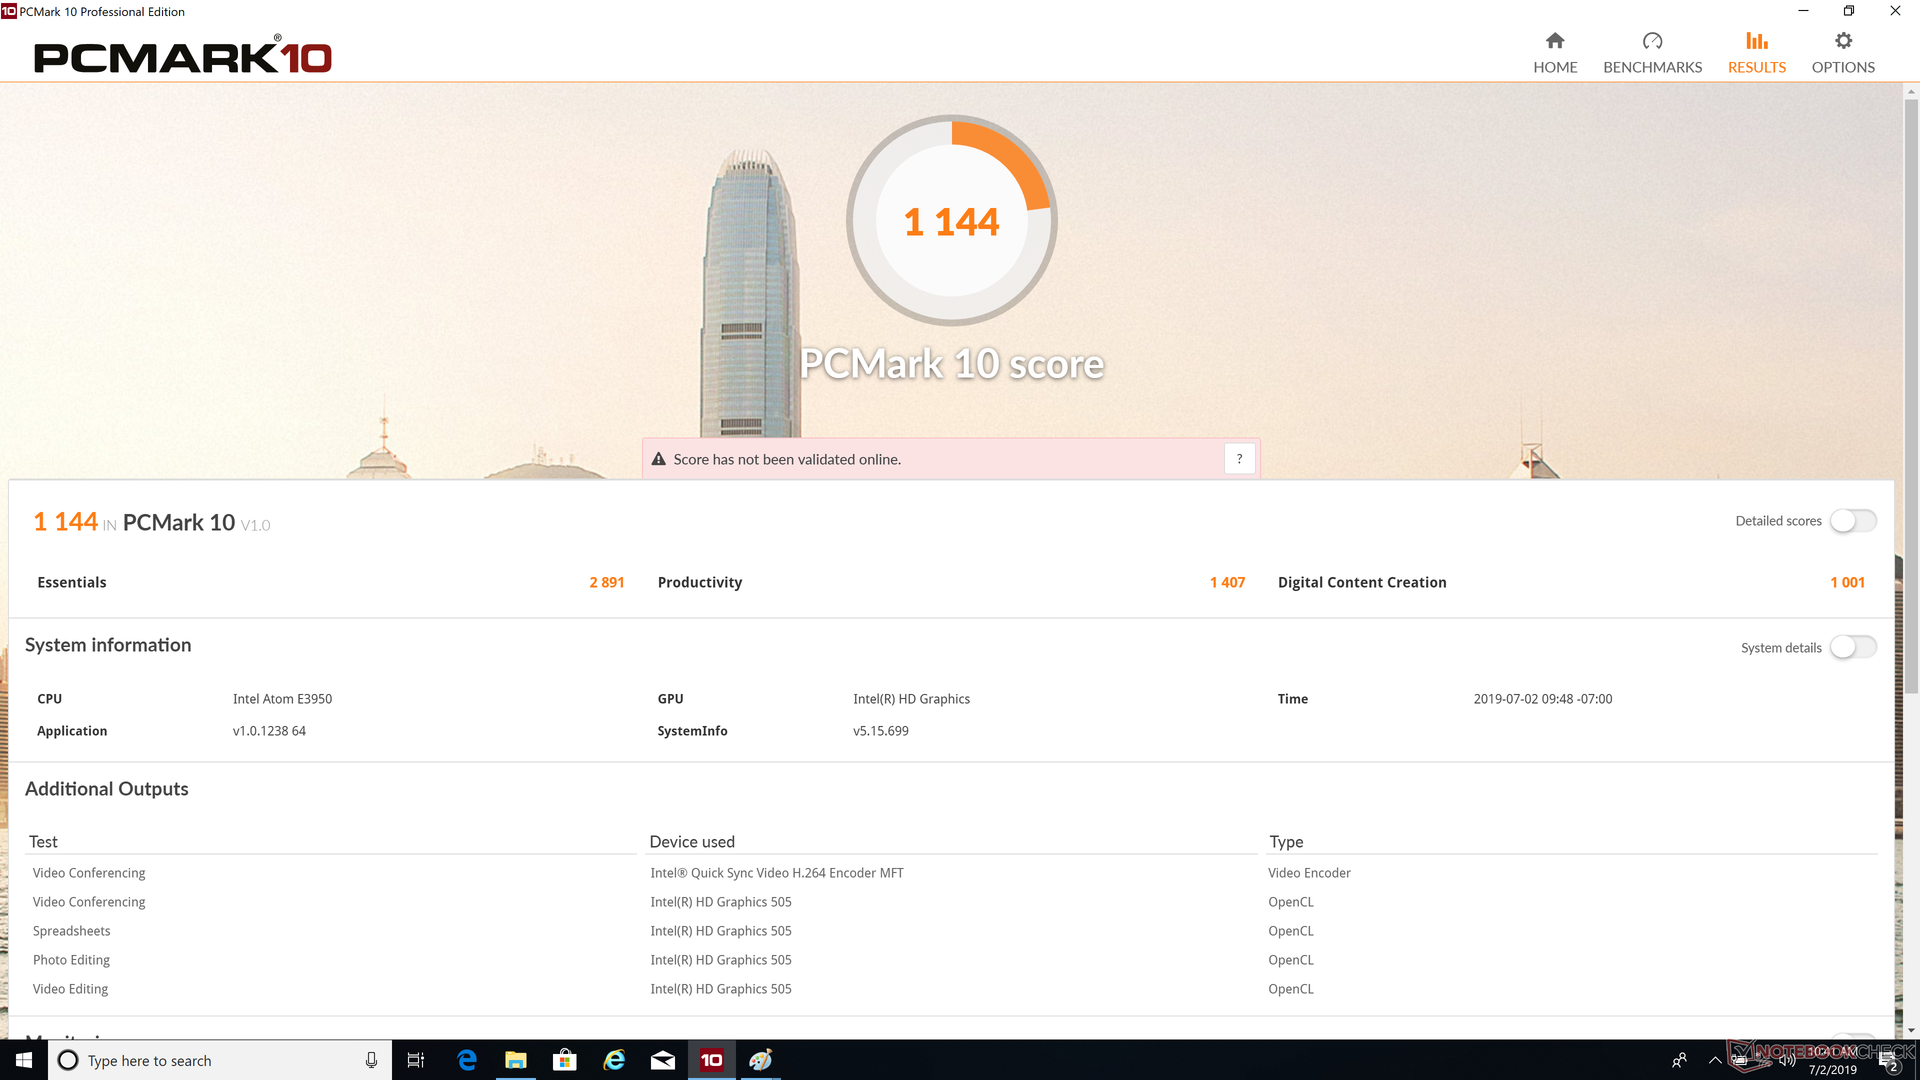
| PCMark 8 Home Score Accelerated v2 | 1371 points | |
| PCMark 10 Score | 1144 points | |
Help | ||
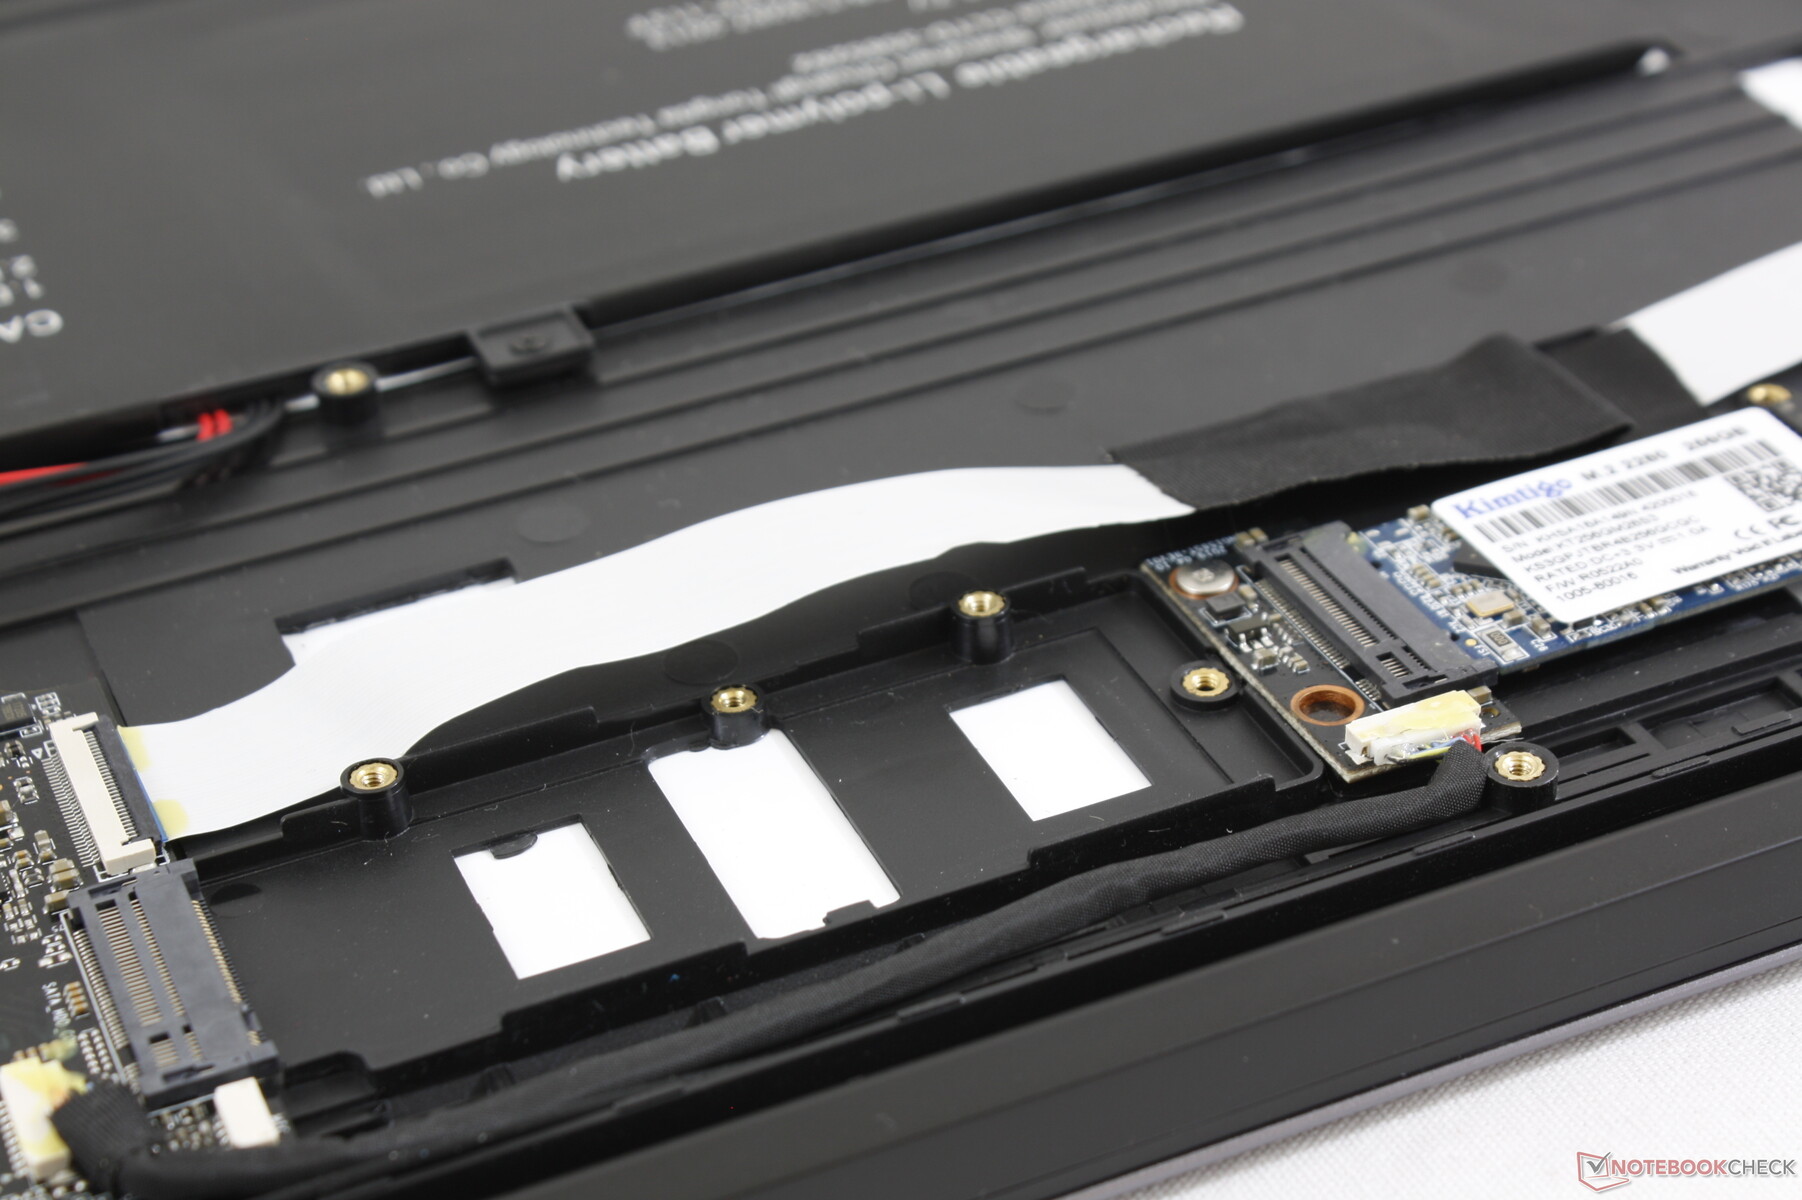
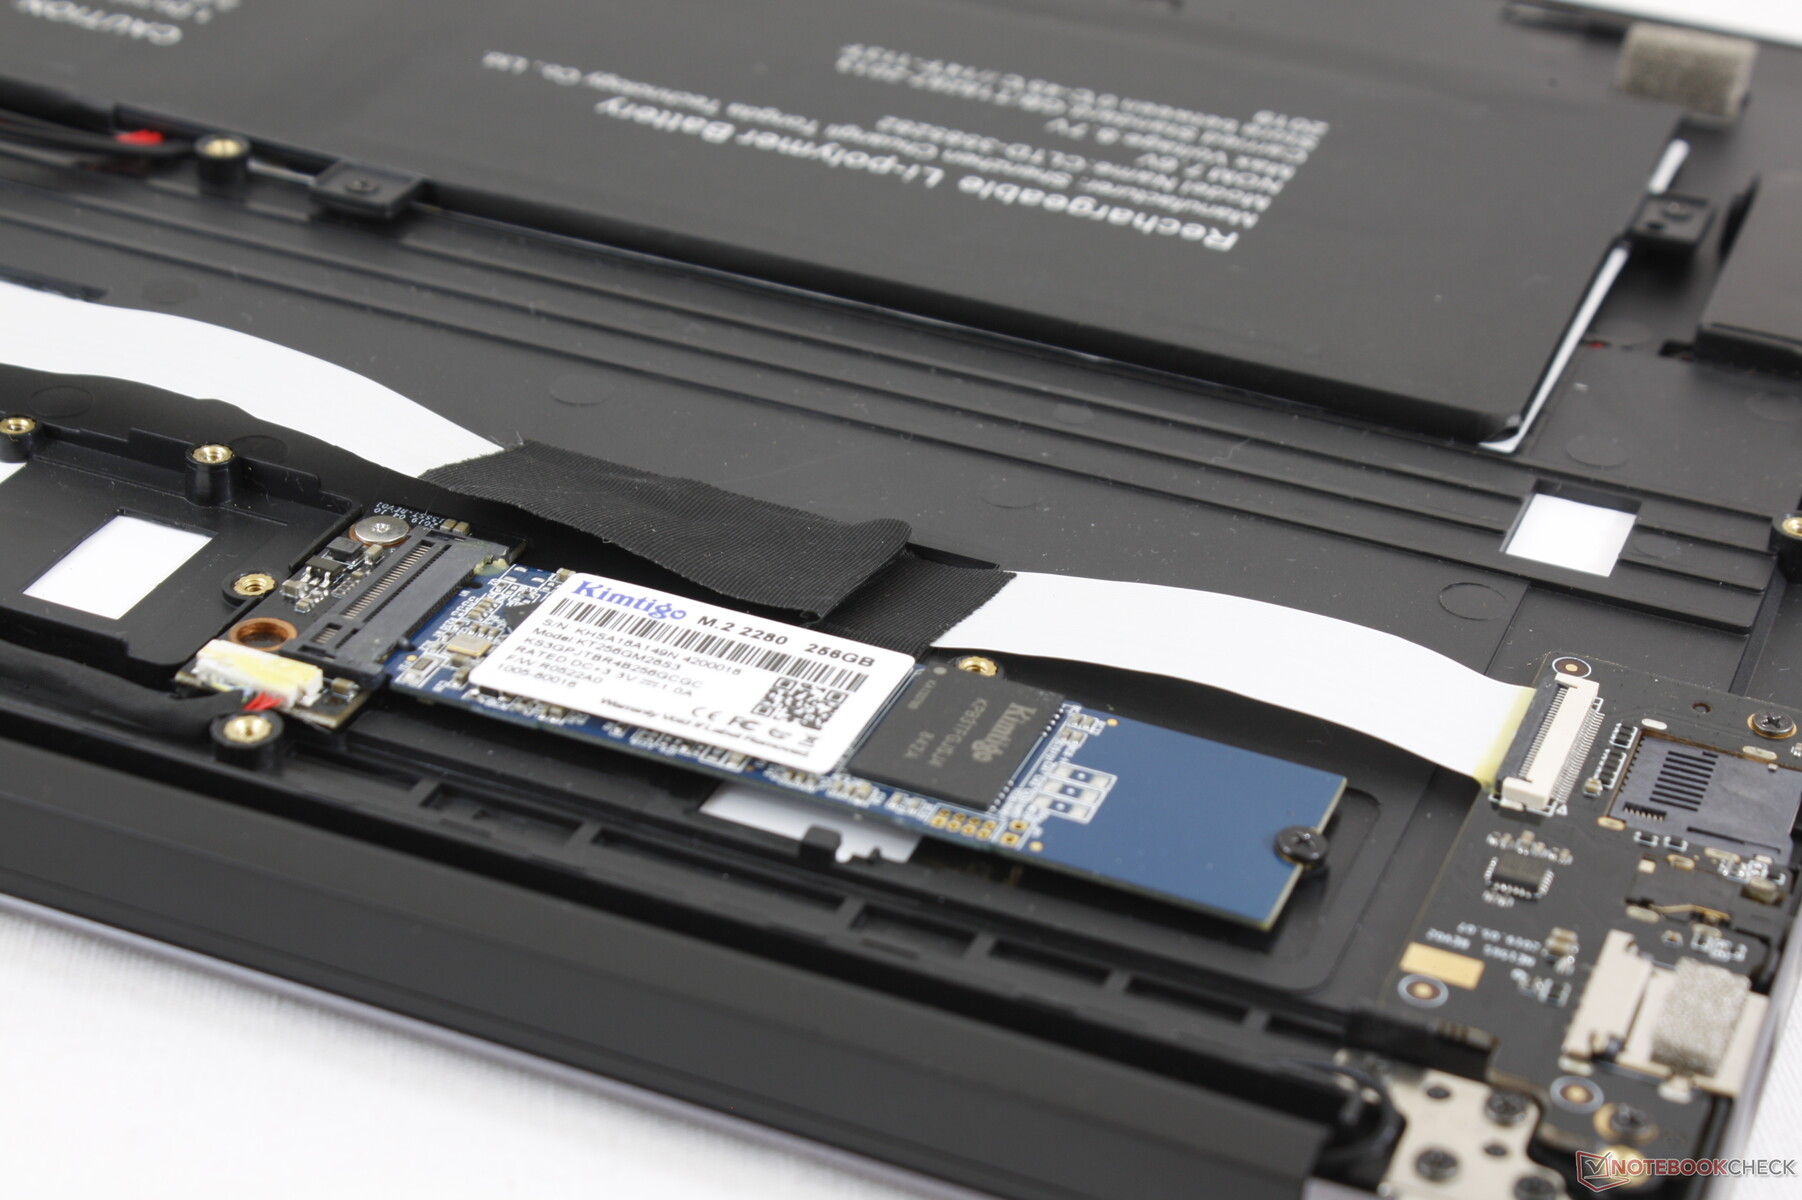
Storage Devices
An uncommon Kimtigo 256 GB M.2 SSD can be found on our test unit. While sequential read and write rates are standard for a SATA III SSD, its read and write rates of smaller 4K blocks are slower than usual. Thus, workloads involving large amounts of smaller files instead of larger ones will take much longer to complete including Windows Update software installations.
See our table of HDDs and SSDs for more benchmark comparisons.
| Chuwi LapBook Plus Kimtigo KT256GM28S3 | HP Pavilion 15-cs2019ng Toshiba KBG30ZMV256G | HP Spectre x360 15-df0126ng Toshiba XG5-P KXG50PNV2T04 | Asus VivoBook S15 S530UN-BQ097T SanDisk SD9SN8W256G1027 | Chuwi HeroBook 14 SanDisk DF4064 | |
|---|---|---|---|---|---|
| AS SSD | 263% | 344% | 111% | -65% | |
| Seq Read (MB/s) | 391.5 | 1153 195% | 2018 415% | 504 29% | 127.9 -67% |
| Seq Write (MB/s) | 419.4 | 736 75% | 773 84% | 202.7 -52% | 85.9 -80% |
| 4K Read (MB/s) | 7.36 | 46.51 532% | 24.62 235% | 27.67 276% | 9.33 27% |
| 4K Write (MB/s) | 15.16 | 114.1 653% | 92.8 512% | 51.1 237% | 10.77 -29% |
| 4K-64 Read (MB/s) | 139.4 | 618 343% | 845 506% | 373.6 168% | 27.59 -80% |
| 4K-64 Write (MB/s) | 137.7 | 461.4 235% | 957 595% | 173 26% | 8.6 -94% |
| Access Time Read * (ms) | 0.361 | 0.421 -17% | 0.147 59% | 0.365 -1% | 0.408 -13% |
| Access Time Write * (ms) | 0.462 | 0.233 50% | 0.057 88% | 0.603 -31% | 0.904 -96% |
| Score Read (Points) | 186 | 780 319% | 1071 476% | 452 143% | 50 -73% |
| Score Write (Points) | 195 | 649 233% | 1127 478% | 244 25% | 28 -86% |
| Score Total (Points) | 479 | 1822 280% | 2684 460% | 921 92% | 105 -78% |
| Copy ISO MB/s (MB/s) | 464.9 | 1652 255% | 810 74% | 59 -87% | |
| Copy Program MB/s (MB/s) | 77.7 | 328.5 323% | 332.5 328% | 15.61 -80% | |
| Copy Game MB/s (MB/s) | 162 | 700 332% | 557 244% | 37.2 -77% |
* ... smaller is better

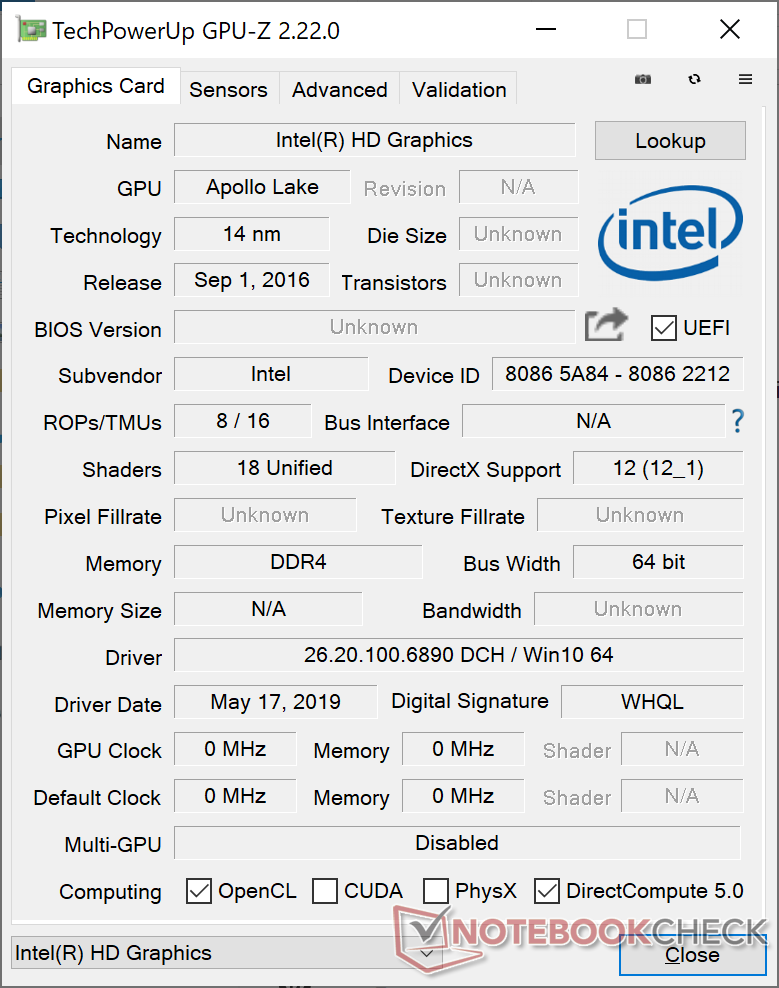
GPU Performance
Integrated Atom GPUs are more about streaming than gaming. We're able to play 4K UHD videos on YouTube at 60 FPS at a CPU utilization of around 50 to 60 percent. The catch is that everything else will slow to a crawl and so even the simplest of user inputs like fast forwarding, pausing, exiting, or resuming will have very long delays.
| 3DMark 06 Standard Score | 4884 points | |
| 3DMark Vantage P Result | 2744 points | |
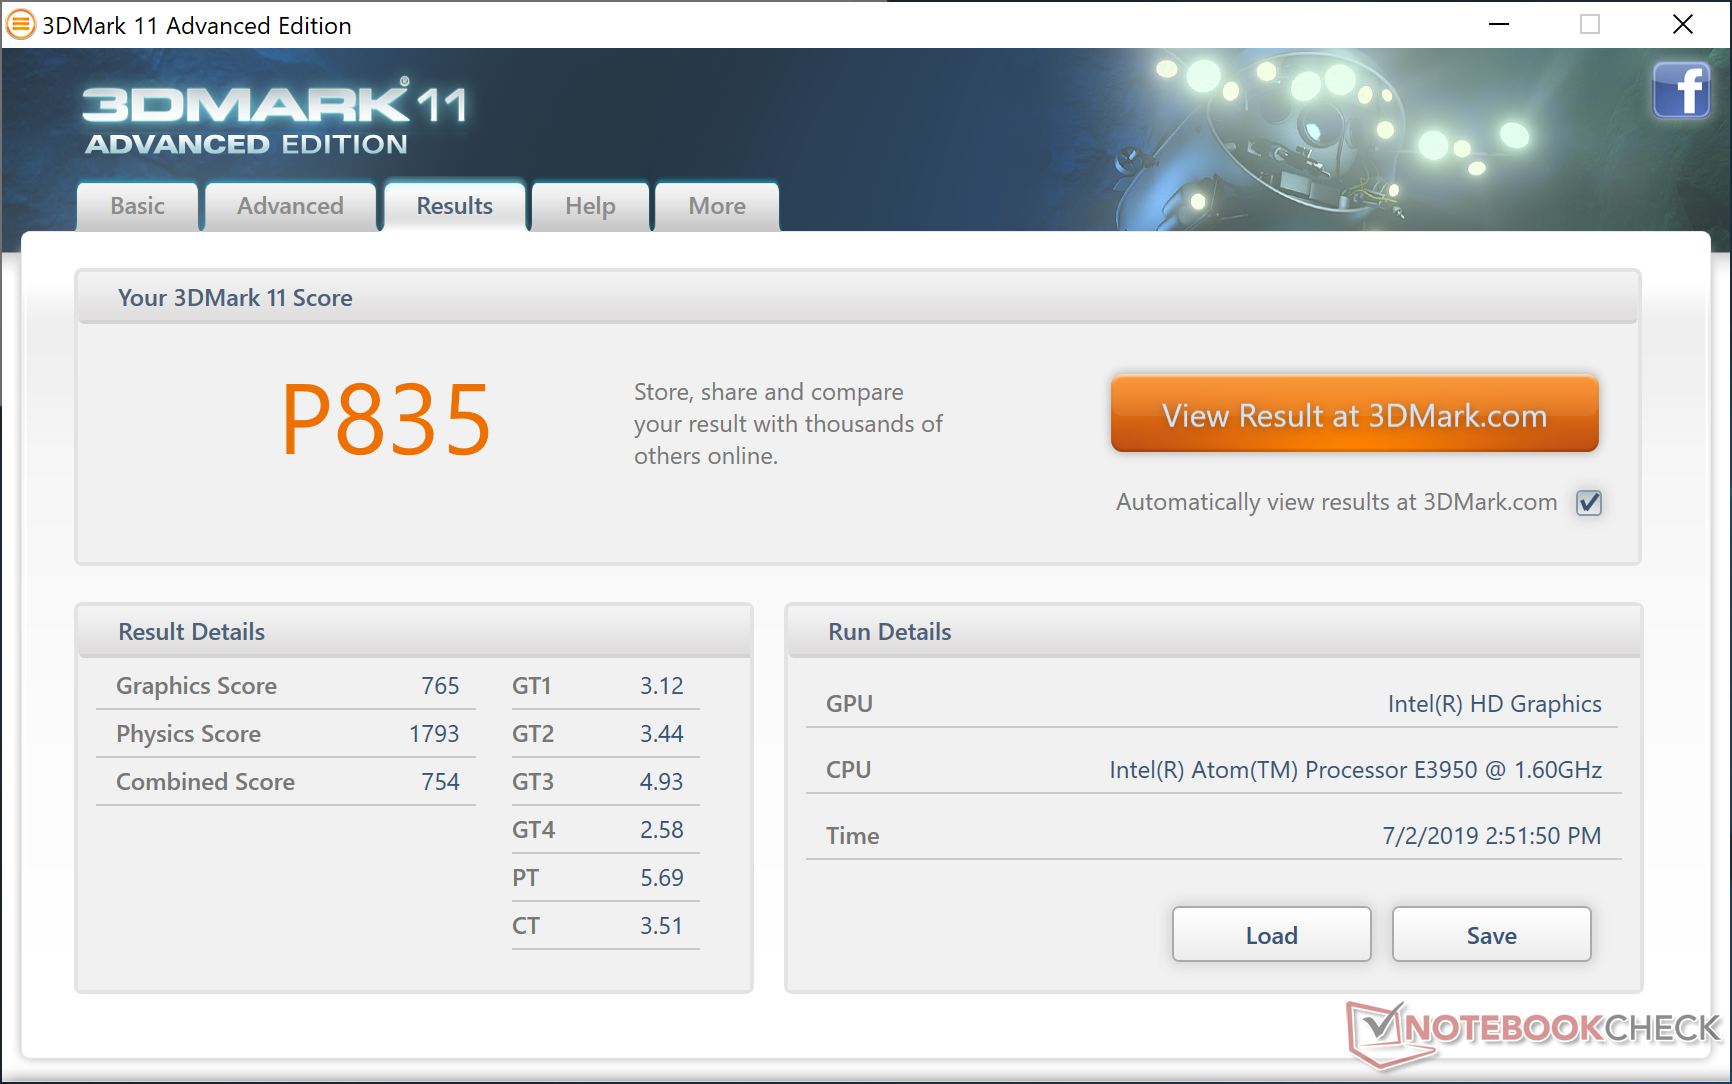
| 3DMark 11 Performance | 835 points | |
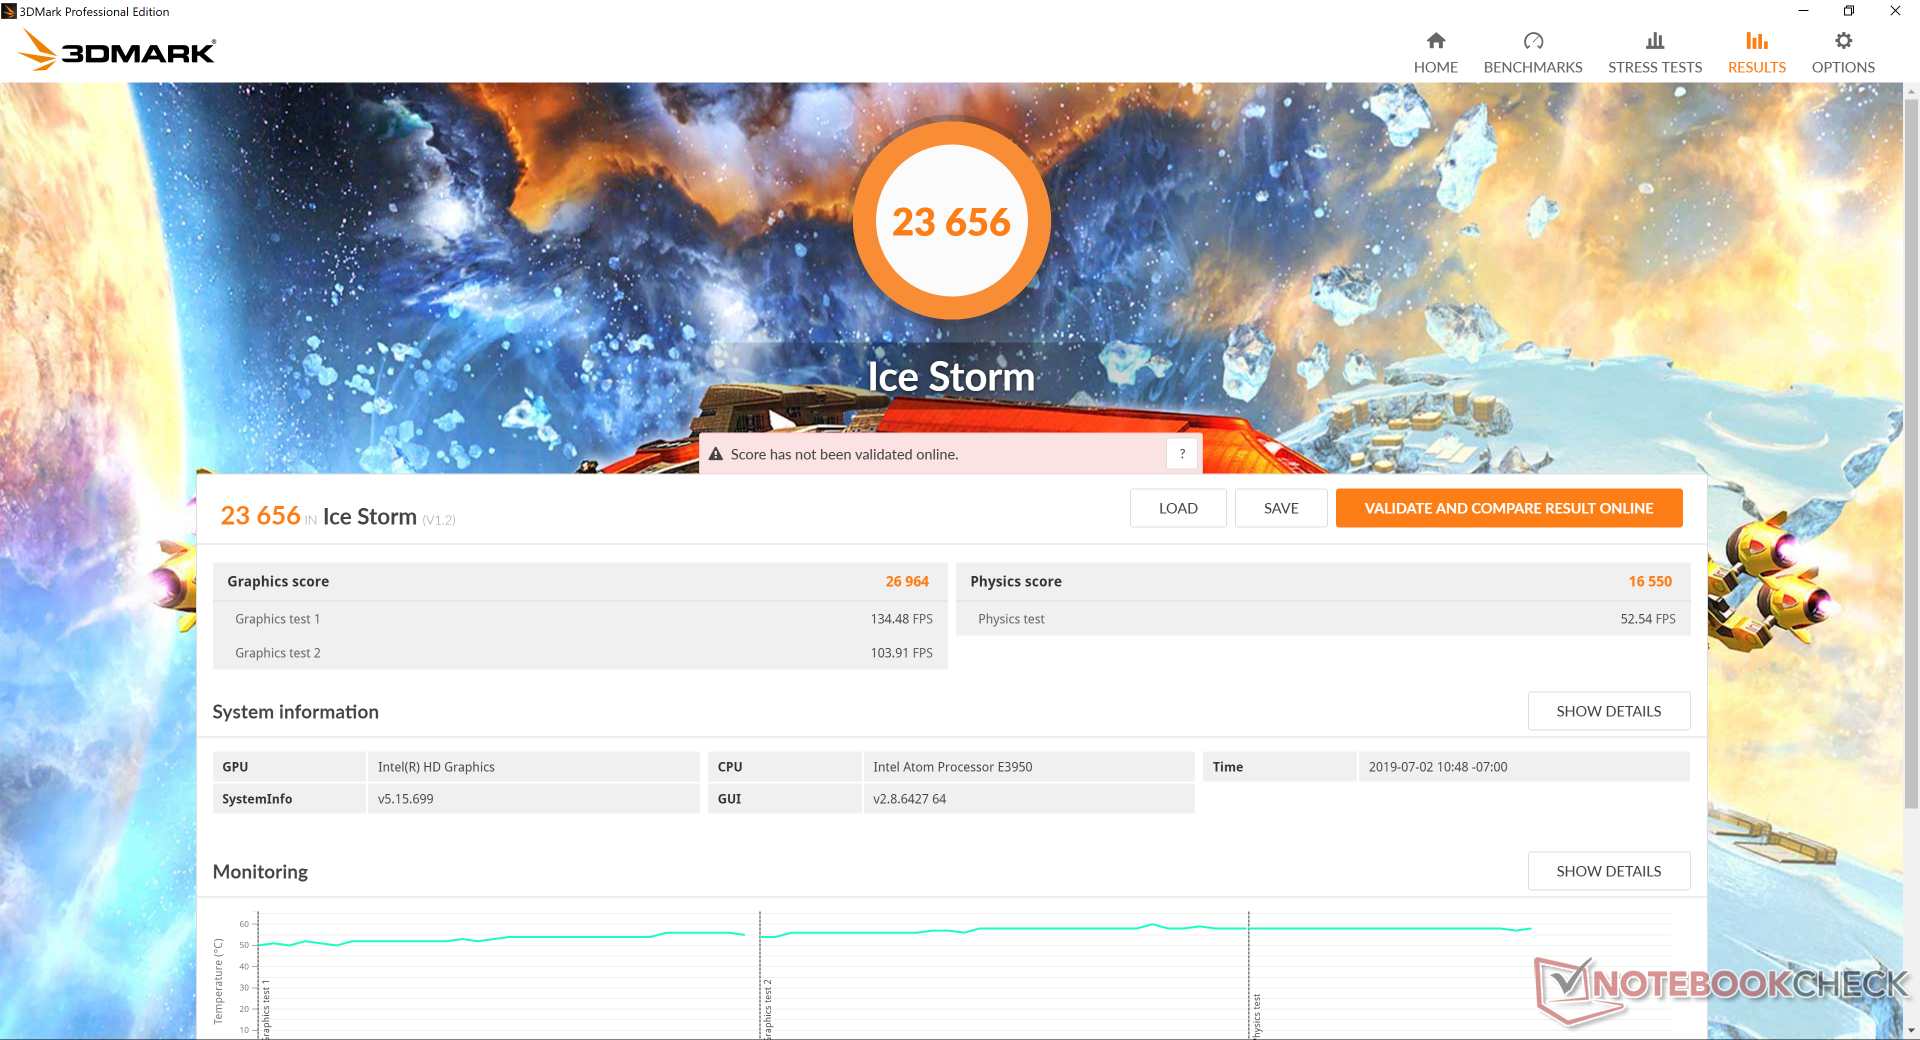
| 3DMark Ice Storm Standard Score | 23656 points | |
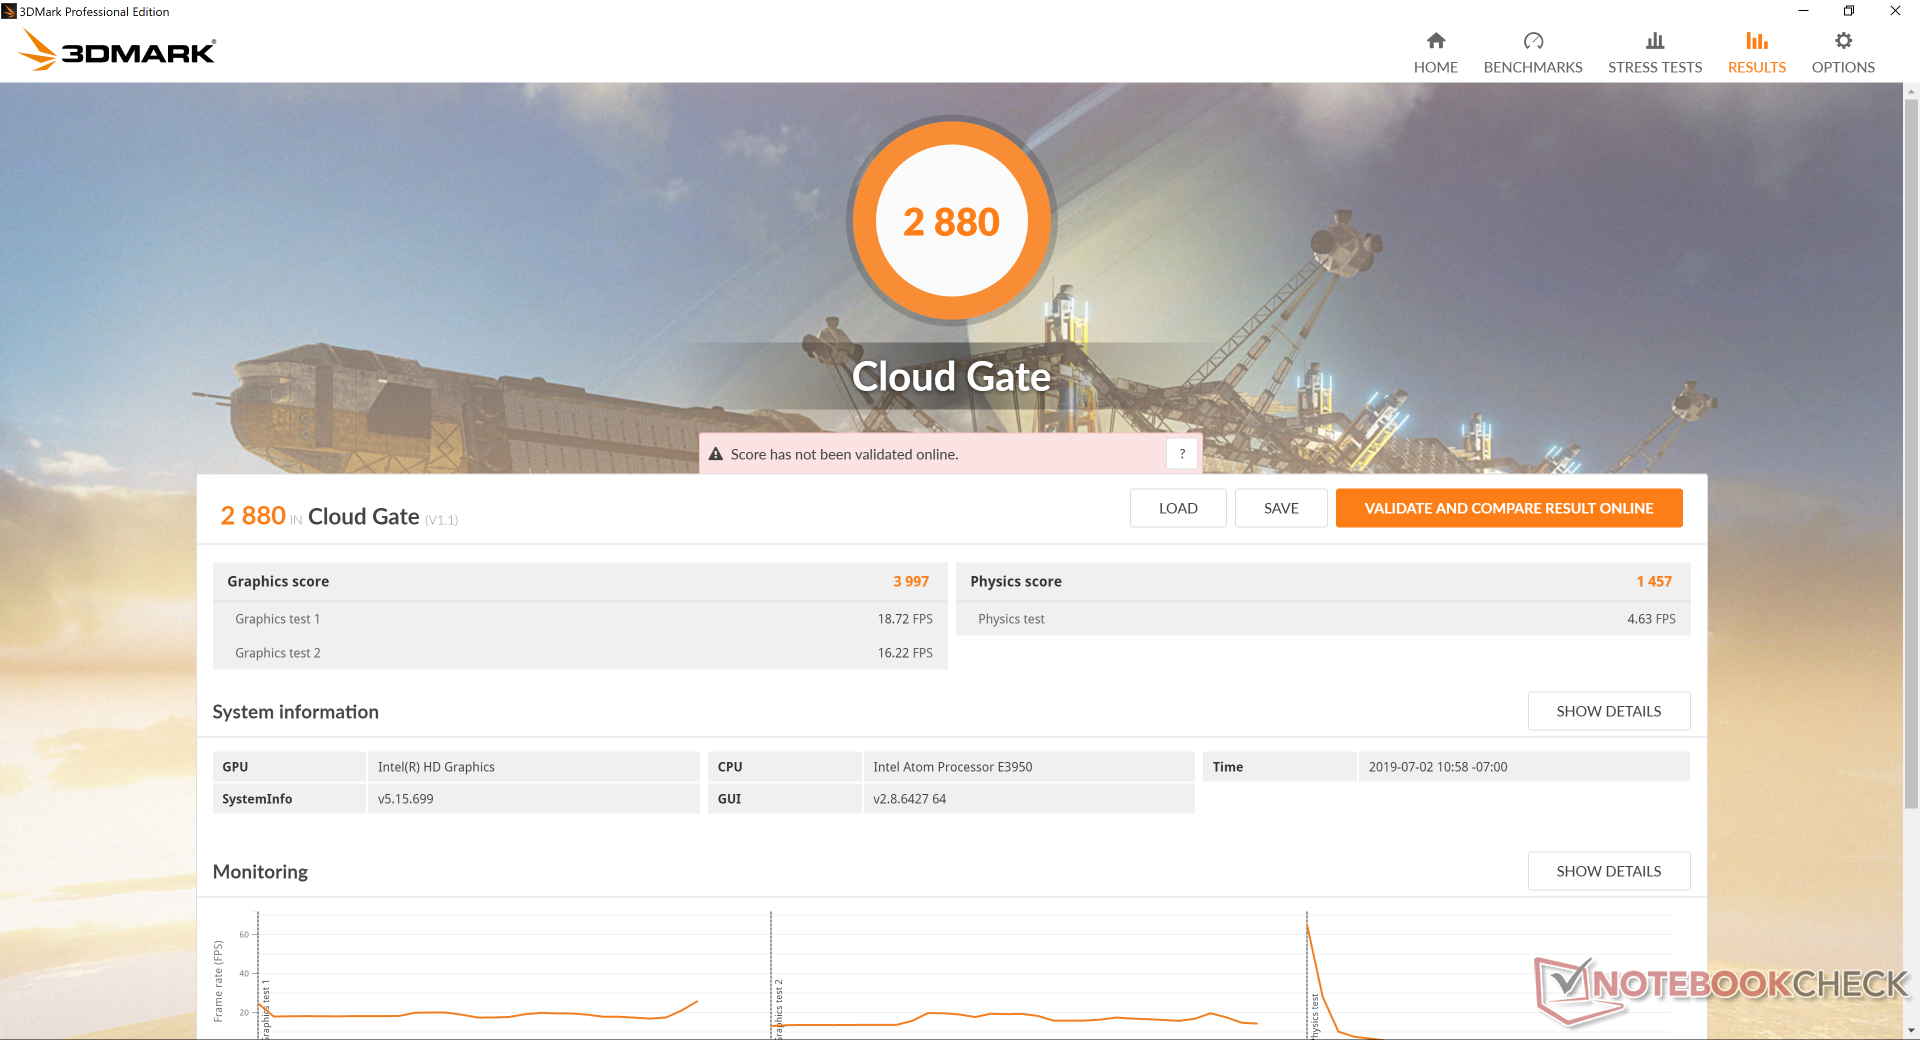
| 3DMark Cloud Gate Standard Score | 2880 points | |
| 3DMark Time Spy Score | 161 points | |
Help | ||
| low | med. | high | ultra | |
|---|---|---|---|---|
| Rocket League (2017) | 21.4 | 15.3 |
Emissions
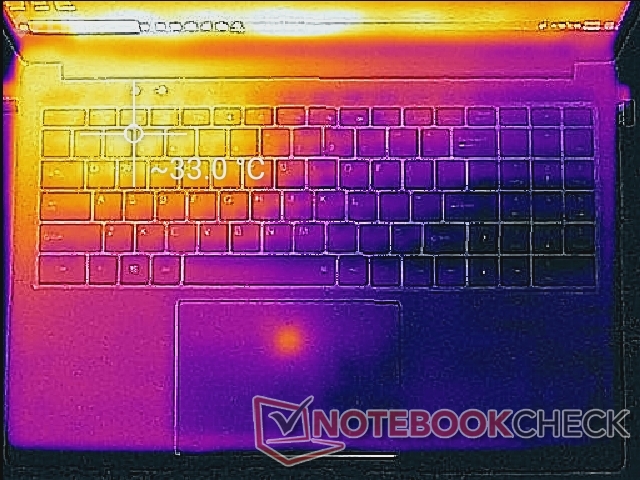
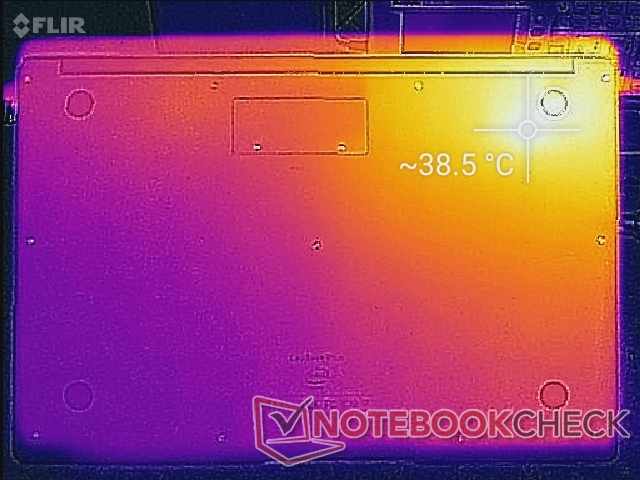
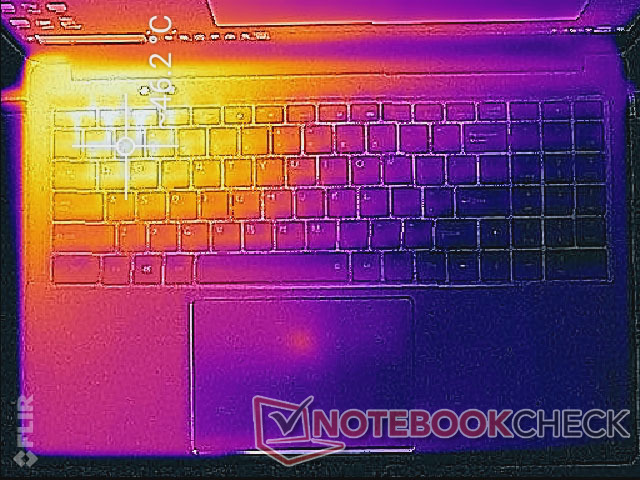
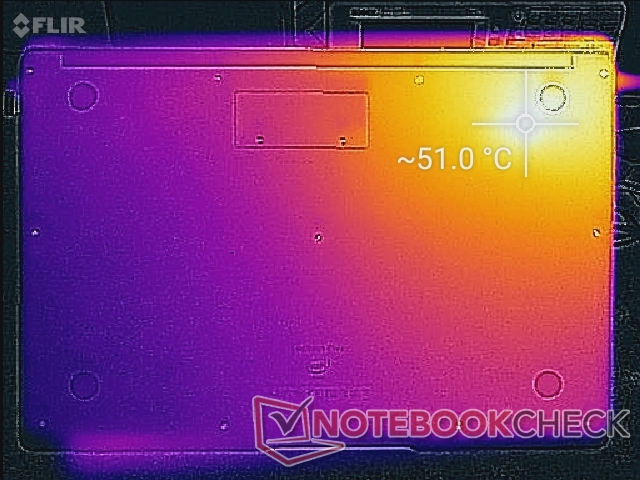
Temperature
Surface temperatures are cool around the palm rests, clickpad, and most of the keyboard. The hot spots are concentrated around the corner nearest the passively cooled CPU where temperatures can reach over 50 C when subjected to prolonged extreme processing stress.
Stress Test
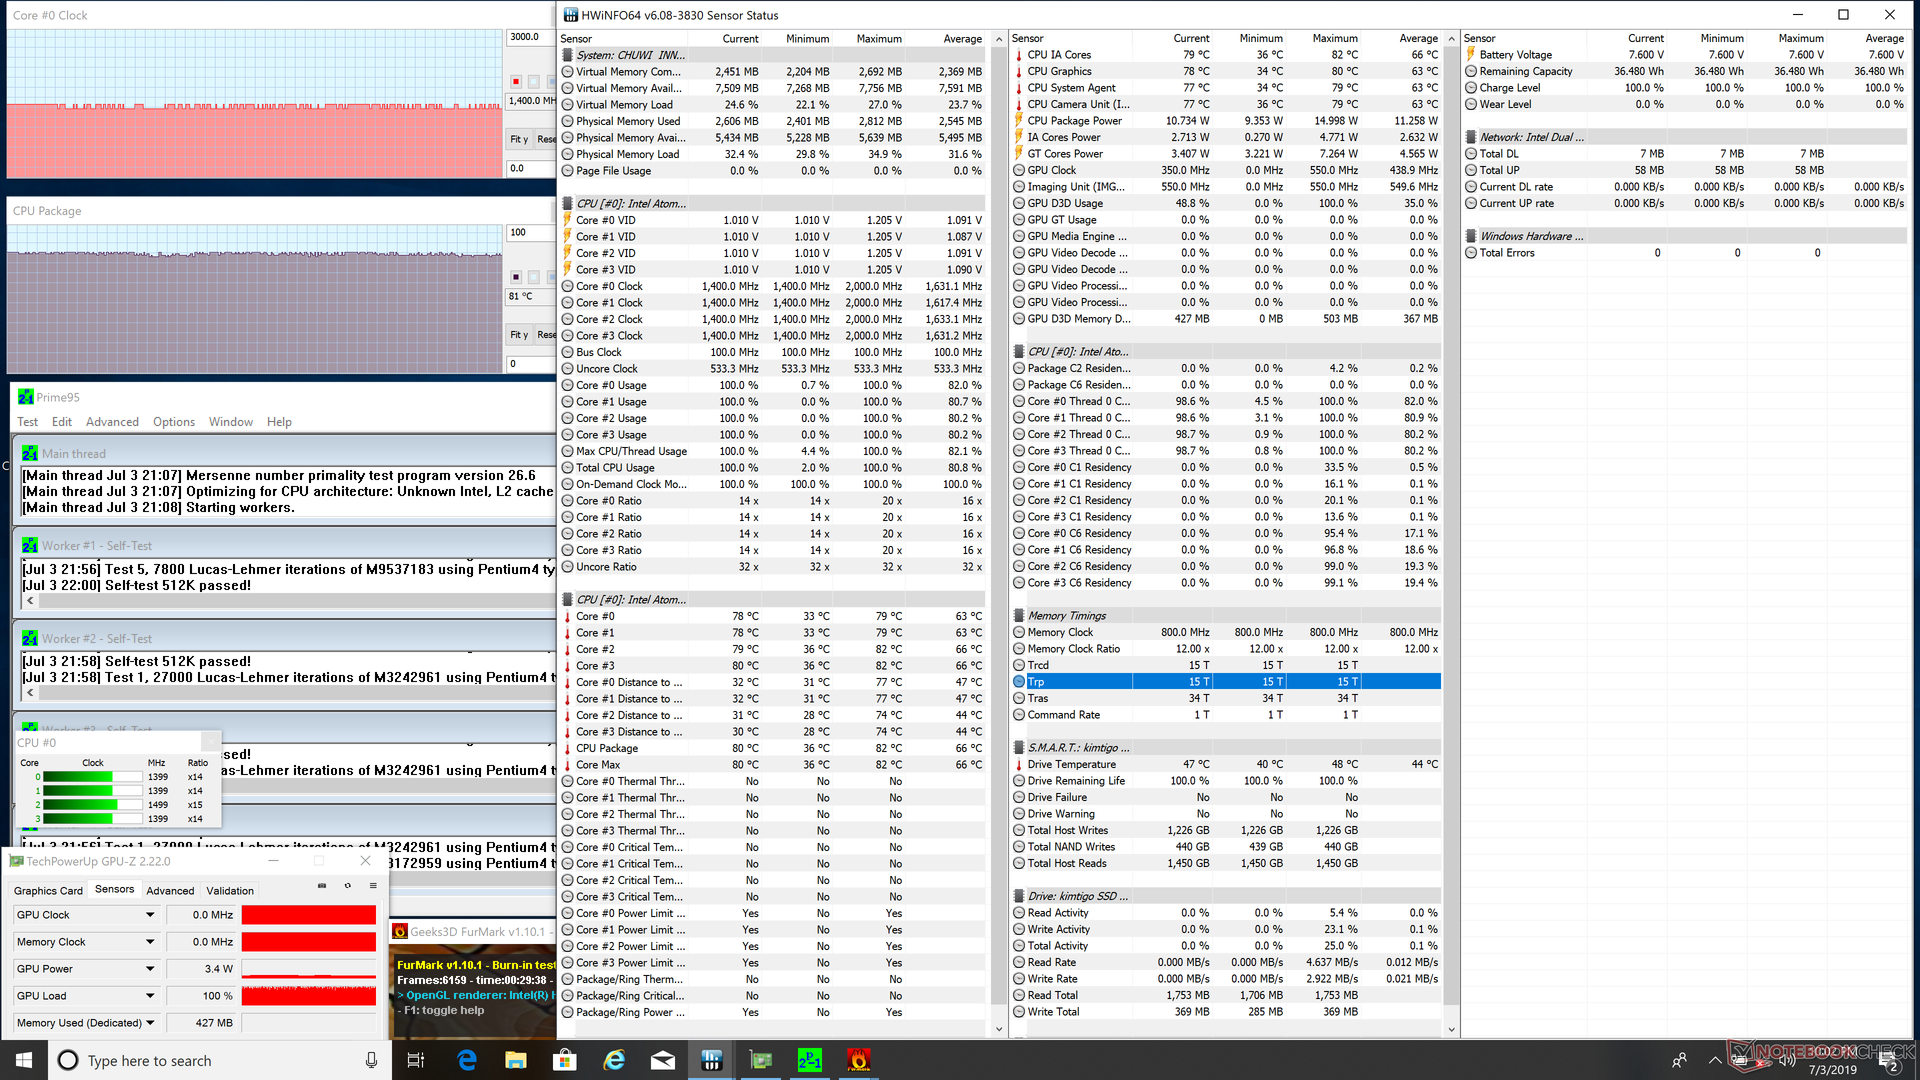
We stress the laptop to identify for any potential throttling or stability issues. When running Prime95, CPU clock rates jump to 1.9 GHz for the first few seconds before falling and stabilizing at 1.6 GHz. Core temperature eventually plateaus at about 81 C when under 100 percent utilization.
Running on batteries will not impact performance. 3DMark 11 results are nearly the same when running on batteries or on mains.
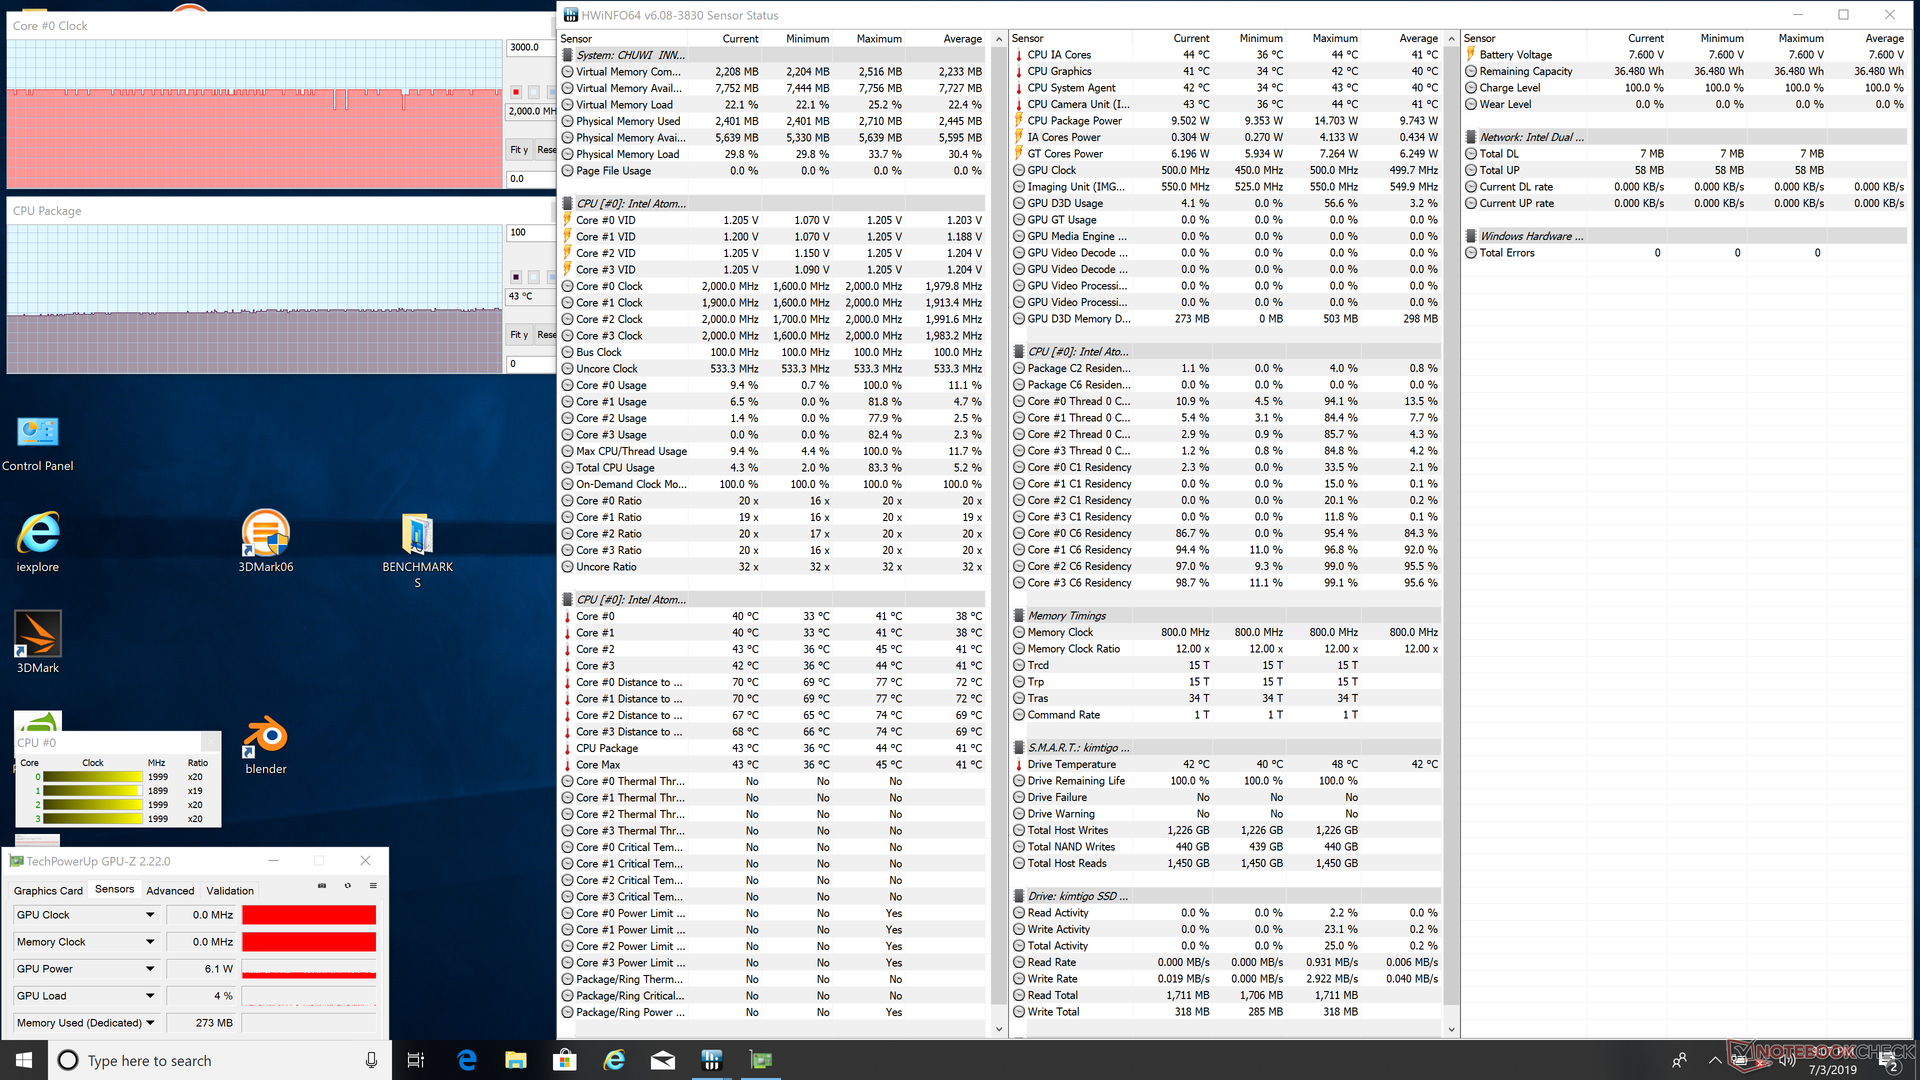
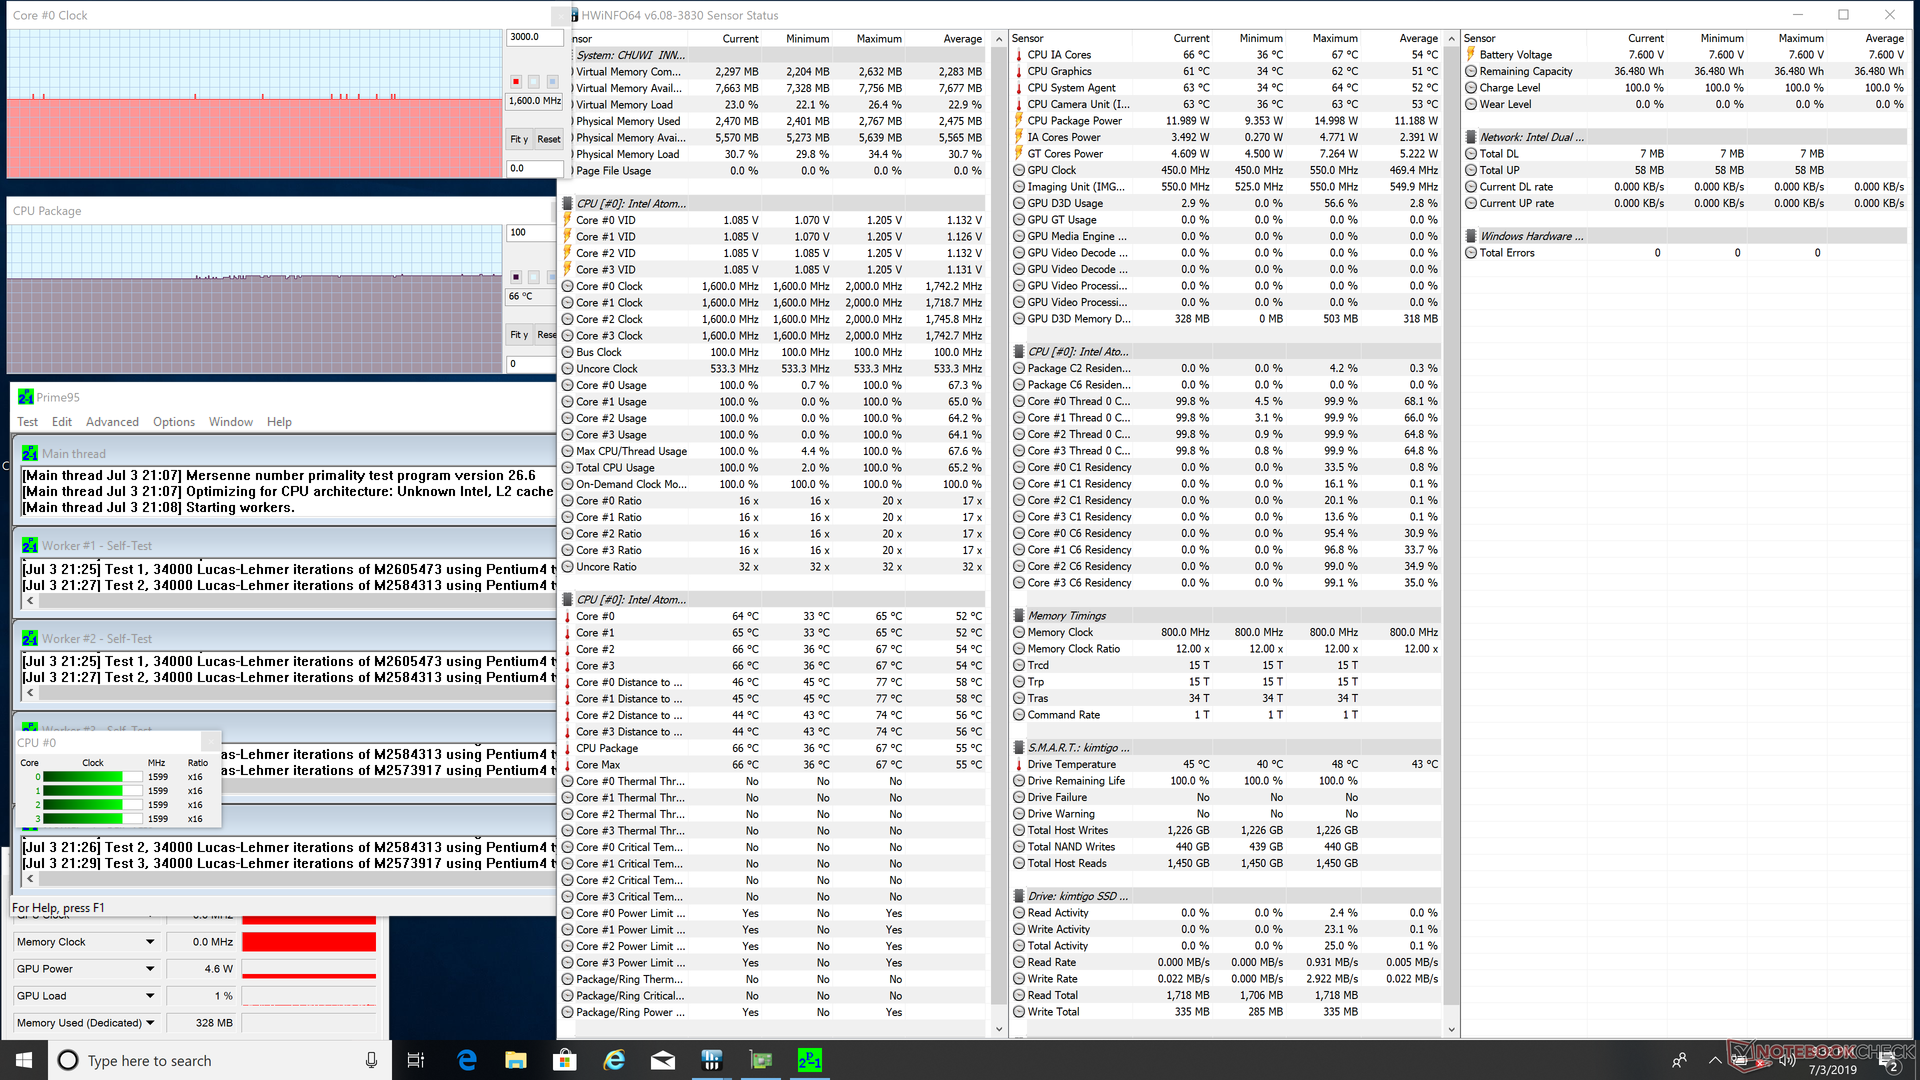
| CPU Clock (GHz) | GPU Clock (MHz) | Average CPU Temperature (°C) | |
| System Idle | -- | -- | 43 |
| Prime95 Stress | 1.6 | -- | 66 |
| Prime95 + FurMark Stress | ~1.4 | -- | 81 |
(-) The maximum temperature on the upper side is 46.2 °C / 115 F, compared to the average of 36.8 °C / 98 F, ranging from 21 to 71 °C for the class Multimedia.
(-) The bottom heats up to a maximum of 51 °C / 124 F, compared to the average of 39.1 °C / 102 F
(+) In idle usage, the average temperature for the upper side is 28.3 °C / 83 F, compared to the device average of 31.3 °C / 88 F.
(+) The palmrests and touchpad are reaching skin temperature as a maximum (33.6 °C / 92.5 F) and are therefore not hot.
(-) The average temperature of the palmrest area of similar devices was 28.7 °C / 83.7 F (-4.9 °C / -8.8 F).
Speakers
The stereo speakers are weak in volume with poor bass reproduction. Perhaps the latter is to be expected from a sub $500 laptop, but the low volume impacts the overall multimedia experience and it can make conference calls difficult to hear.

Chuwi LapBook Plus audio analysis
(-) | not very loud speakers (69.8 dB)
Bass 100 - 315 Hz
(-) | nearly no bass - on average 17.2% lower than median
(±) | linearity of bass is average (10.5% delta to prev. frequency)
Mids 400 - 2000 Hz
(+) | balanced mids - only 3.8% away from median
(±) | linearity of mids is average (13.8% delta to prev. frequency)
Highs 2 - 16 kHz
(+) | balanced highs - only 4.5% away from median
(±) | linearity of highs is average (12.6% delta to prev. frequency)
Overall 100 - 16.000 Hz
(-) | overall sound is not linear (35.5% difference to median)
Compared to same class
» 98% of all tested devices in this class were better, 0% similar, 1% worse
» The best had a delta of 5%, average was 17%, worst was 45%
Compared to all devices tested
» 94% of all tested devices were better, 1% similar, 5% worse
» The best had a delta of 4%, average was 23%, worst was 134%
Apple MacBook 12 (Early 2016) 1.1 GHz audio analysis
(+) | speakers can play relatively loud (83.6 dB)
Bass 100 - 315 Hz
(±) | reduced bass - on average 11.3% lower than median
(±) | linearity of bass is average (14.2% delta to prev. frequency)
Mids 400 - 2000 Hz
(+) | balanced mids - only 2.4% away from median
(+) | mids are linear (5.5% delta to prev. frequency)
Highs 2 - 16 kHz
(+) | balanced highs - only 2% away from median
(+) | highs are linear (4.5% delta to prev. frequency)
Overall 100 - 16.000 Hz
(+) | overall sound is linear (10.2% difference to median)
Compared to same class
» 7% of all tested devices in this class were better, 2% similar, 90% worse
» The best had a delta of 5%, average was 18%, worst was 53%
Compared to all devices tested
» 5% of all tested devices were better, 1% similar, 94% worse
» The best had a delta of 4%, average was 23%, worst was 134%
Energy Management
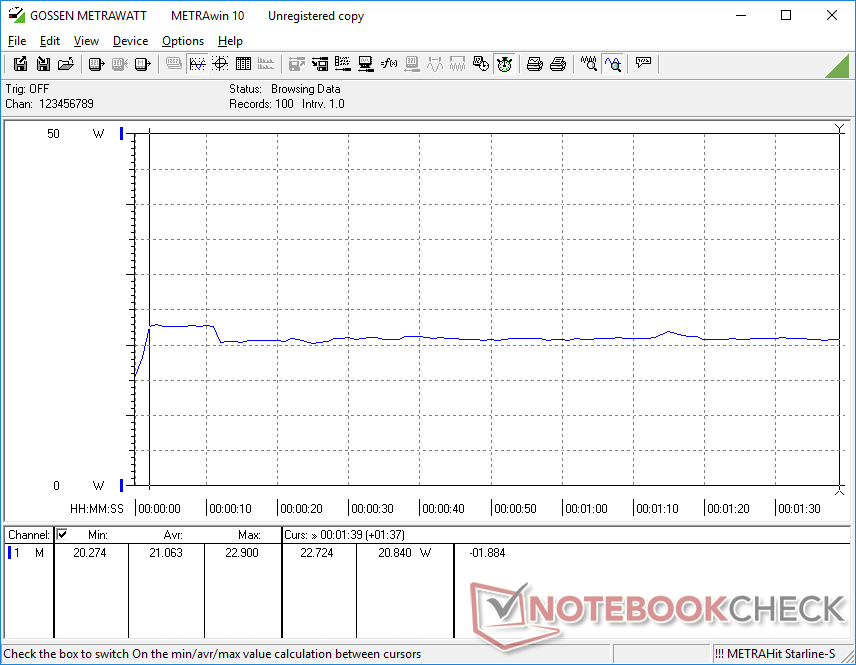
Power Consumption
The system draws 6 W to 11 W when idling on desktop depending on the brightness level and power profile. While efficient, it's not as efficient as we were anticipating from an Atom-powered laptop likely due to the brighter than average display and more demanding 4K UHD resolution. Running 3DMark 06 draws 21 W to be similar to a Core i5-powered Surface Pro 6.
The very small (~10 x 4.5 x 3 cm) 36 W AC adapter is more than enough to power and recharge the system simultaneously no matter the onscreen load.

| Off / Standby | |
| Idle | |
| Load |
|
Key:
min: | |
| Chuwi LapBook Plus x7-E3950, HD Graphics 505, Kimtigo KT256GM28S3, IPS, 3840x2160, 15.6" | HP Pavilion 15-cs2019ng i5-8265U, GeForce MX250, Toshiba KBG30ZMV256G, IPS, 1920x1080, 15.6" | Dell XPS 15 9570 i7 UHD i7-8750H, GeForce GTX 1050 Ti Max-Q, Toshiba XG5 KXG50ZNV512G, IPS, 3840x2160, 15.6" | Asus VivoBook S15 S530UN-BQ097T i5-8550U, GeForce MX150, SanDisk SD9SN8W256G1027, IPS LED, 1920x1080, 15.6" | HP Spectre x360 15-df0126ng i7-8750H, GeForce GTX 1050 Ti Max-Q, Toshiba XG5-P KXG50PNV2T04, IPS, 3840x2160, 15.6" | Microsoft Surface Pro 6, Core i5, 128 GB i5-8250U, UHD Graphics 620, Toshiba KBG30ZPZ128G, IPS, 2736x1834, 12.3" | |
|---|---|---|---|---|---|---|
| Power Consumption | -40% | -205% | -51% | -141% | -3% | |
| Idle Minimum * (Watt) | 6.6 | 4.9 26% | 9.48 -44% | 3.1 53% | 2.1 68% | 4.3 35% |
| Idle Average * (Watt) | 11.3 | 7.9 30% | 16.1 -42% | 6.3 44% | 6.7 41% | 8.7 23% |
| Idle Maximum * (Watt) | 11.7 | 10.1 14% | 16.9 -44% | 8.6 26% | 11.4 3% | 9.4 20% |
| Load Average * (Watt) | 21.1 | 60 -184% | 90.8 -330% | 56.4 -167% | 77.7 -268% | 24.5 -16% |
| Load Maximum * (Watt) | 20.2 | 38 -88% | 134.4 -565% | 62.7 -210% | 131.5 -551% | 36 -78% |
| Witcher 3 ultra * (Watt) | 45 |
* ... smaller is better
Battery Life
Battery life is short at just 3.5 hours of real-world WLAN use when set to 150 nits brightness (setting 4/10). In comparison, the Asus VivoBook S15 manages almost 6.5 hours when subjected to the same WLAN conditions. The very small 36 Wh internal battery is at least partly responsible for the wide discrepancy.
Recharging from empty to full capacity takes the full 2 hours.
| Chuwi LapBook Plus x7-E3950, HD Graphics 505, 36 Wh | HP Pavilion 15-cs2019ng i5-8265U, GeForce MX250, 41 Wh | Dell XPS 15 9570 i7 UHD i7-8750H, GeForce GTX 1050 Ti Max-Q, 97 Wh | HP Spectre x360 15-df0126ng i7-8750H, GeForce GTX 1050 Ti Max-Q, 84 Wh | Asus VivoBook S15 S530UN-BQ097T i5-8550U, GeForce MX150, 42 Wh | Apple MacBook Pro 15 2018 (2.6 GHz, 560X) i7-8850H, Radeon Pro 560X, 83 Wh | |
|---|---|---|---|---|---|---|
| Battery runtime | 43% | 174% | 151% | 86% | 191% | |
| WiFi v1.3 (h) | 3.5 | 5 43% | 9.6 174% | 8.8 151% | 6.5 86% | 10.2 191% |
| Reader / Idle (h) | 8 | 18.8 | ||||
| Load (h) | 1.3 | 1.3 | 2.3 | |||
| Witcher 3 ultra (h) | 1 | 1.5 |
Pros
Cons
Verdict
As slim and sexy as it may appear, performance is just too slow to recommend for anything more than a simple print server or emailing station. Even the simplest of actions like clicking and typing have noticeable delays to make the LapBook Plus a poor choice for multimedia, streaming, or browsing purposes.
To Chuwi's credit, the keyboard is actually quite good compared to other Ultrabooks and the 4K UHD display is unmatched at this price range. Unfortunately, these respectable qualities are of no practical use since they've been dragged down by one the slowest processors you can get on any laptop coming out this year.
A good-looking laptop trapped in Intel Atom purgatory. The very slow processor drags down what could have been a decent inexpensive Ultrabook. Users would be better off with a last generation Core i3 laptop for tangibly faster and more reliable performance.
Chuwi LapBook Plus
- 07/05/2019 v6 (old)
Allen Ngo
Price comparison
