Asus X555DA (A10-8700P, FHD) Laptop Review
The $400 to $500 USD price range is unsurprisingly home to some slow laptops. While this is not a major issue for the target audience, even we have standards on how slow a laptop can be before it becomes unacceptable and not recommendable. The X555DA and its AMD A10-8700P APU straddle that line with an under-performing processor and washed out 1080p display as our tests and measurements below will show.
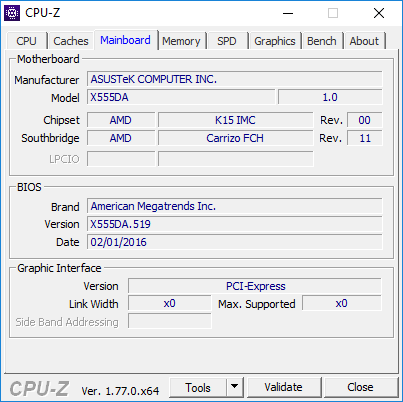
The X555DA retains the core chassis and design features of the older X555LD and X555LN Intel SKUs, so we recommend checking out our two existing review pages for more information on the hardware. Other AMD APUs are also available on the X555DA series including the slower A8-8600P and the faster FX-8800P.
Case
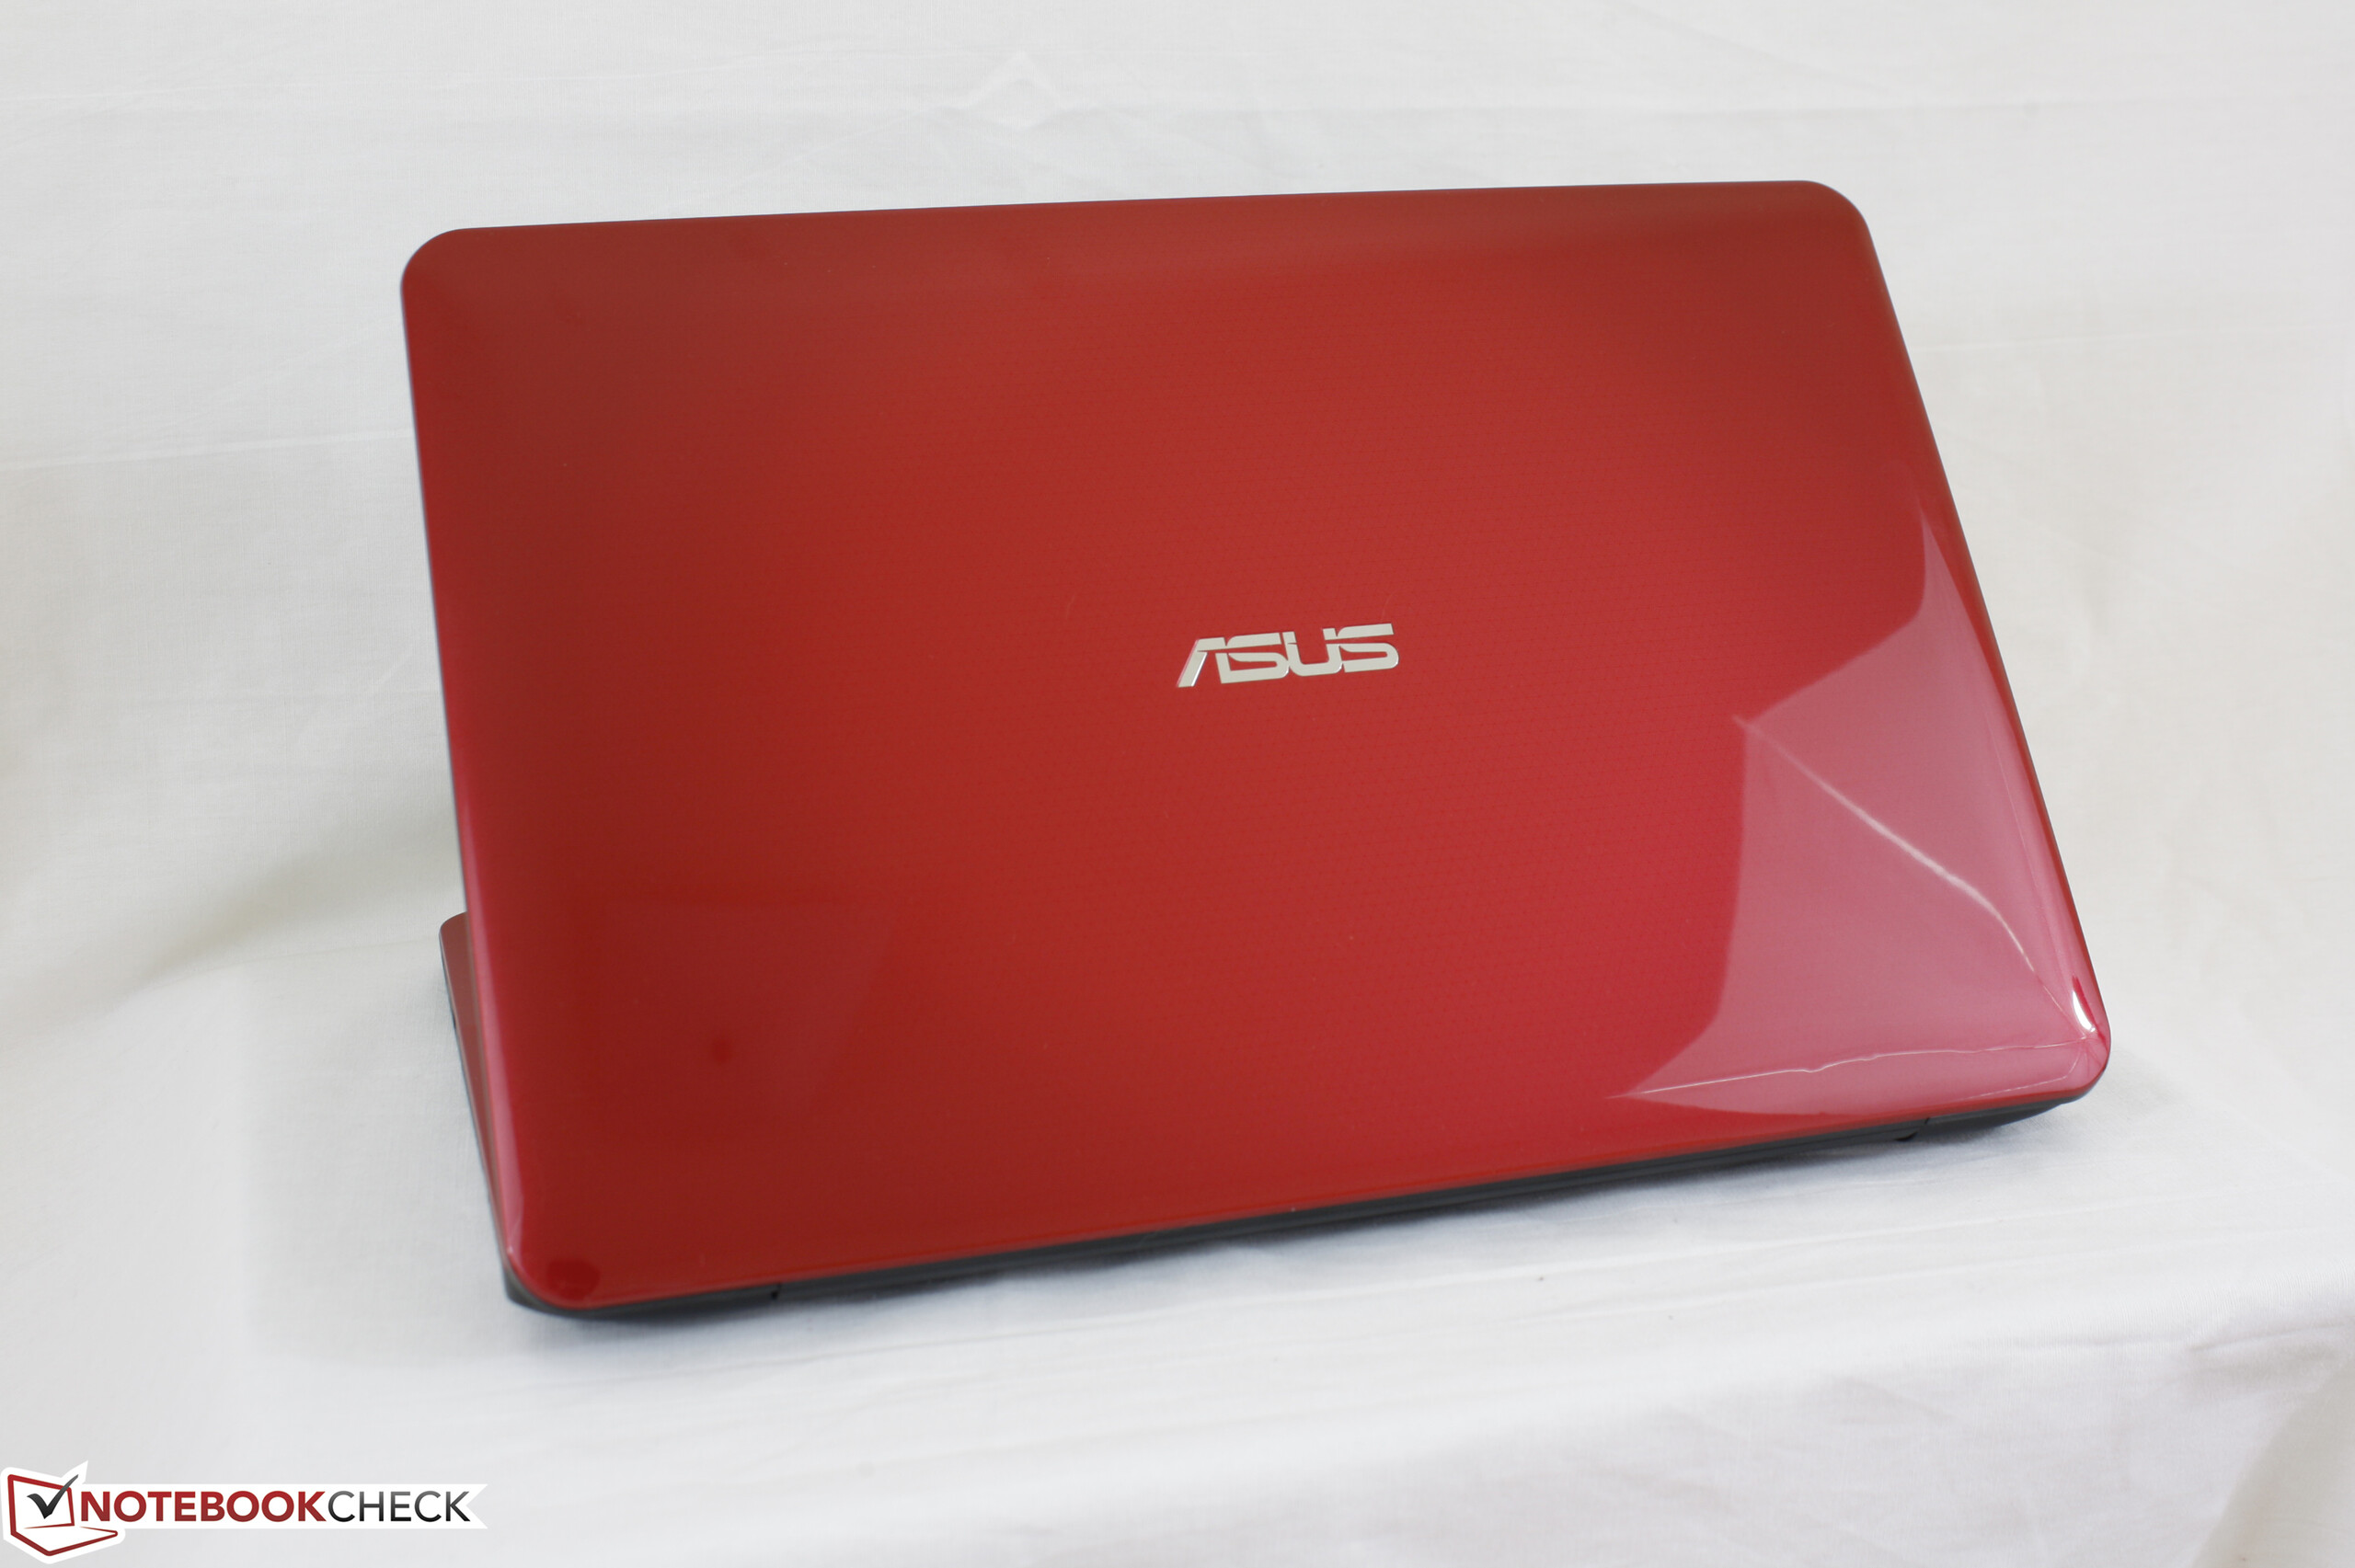
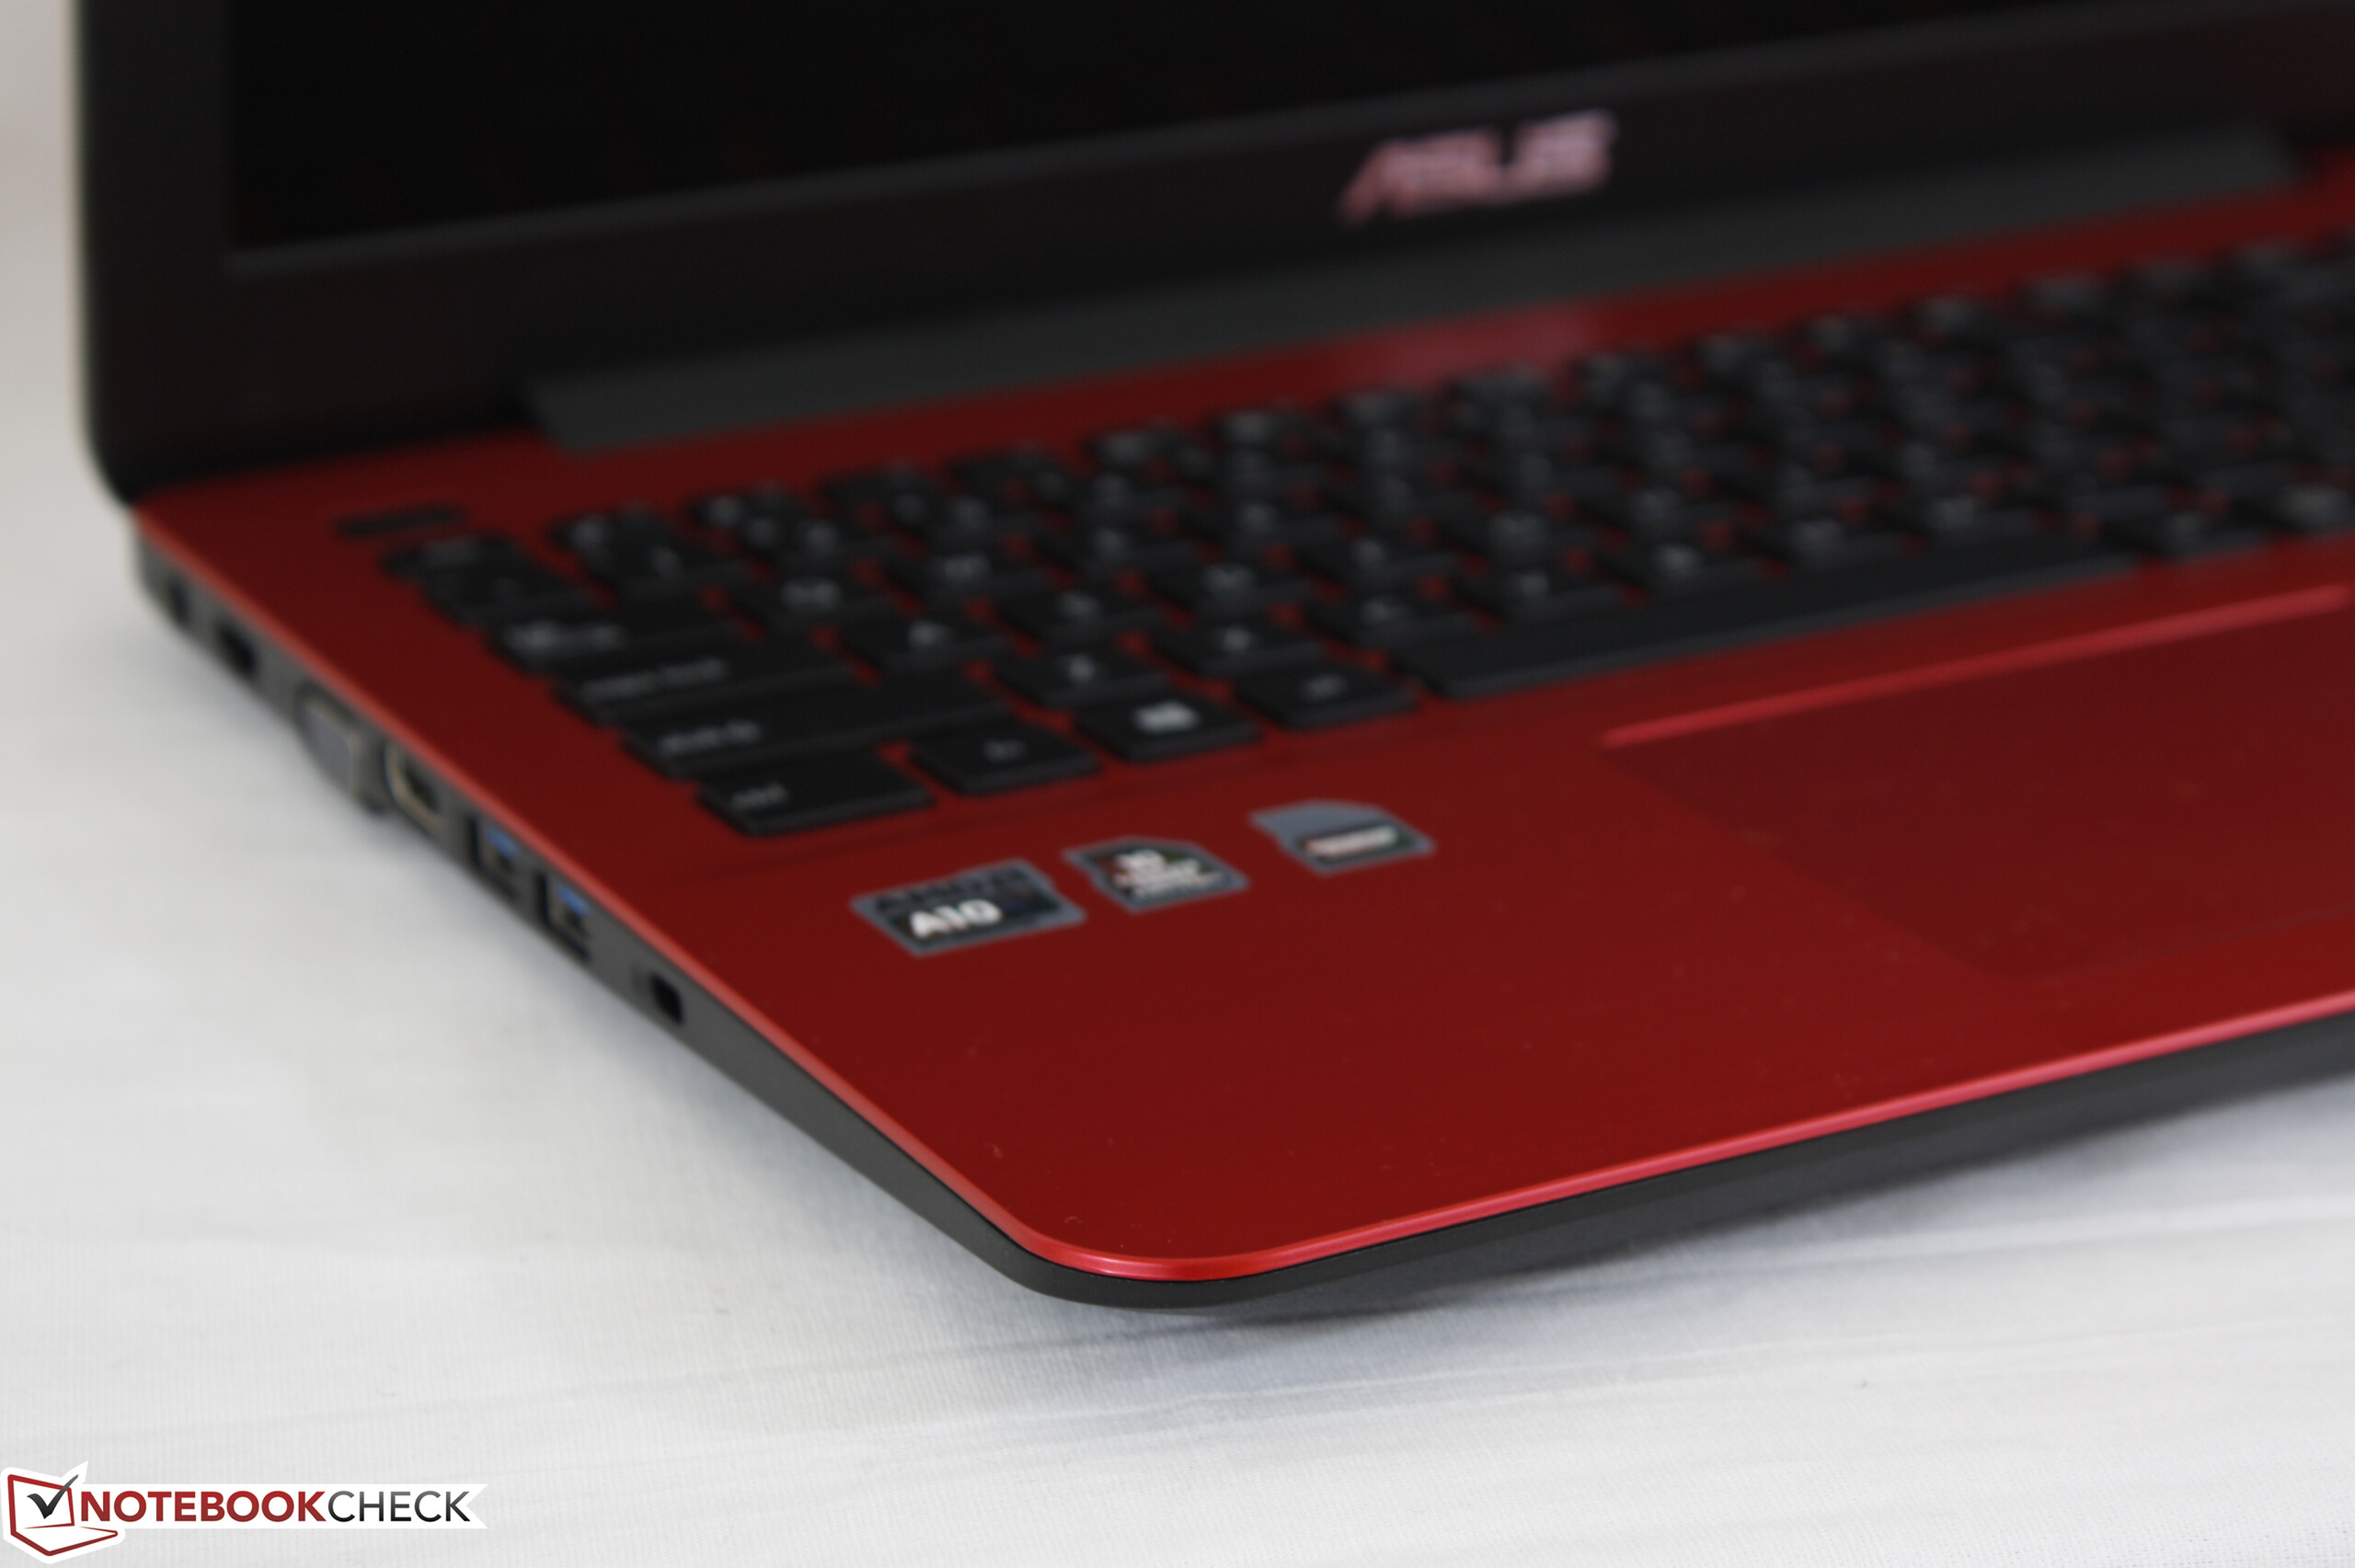
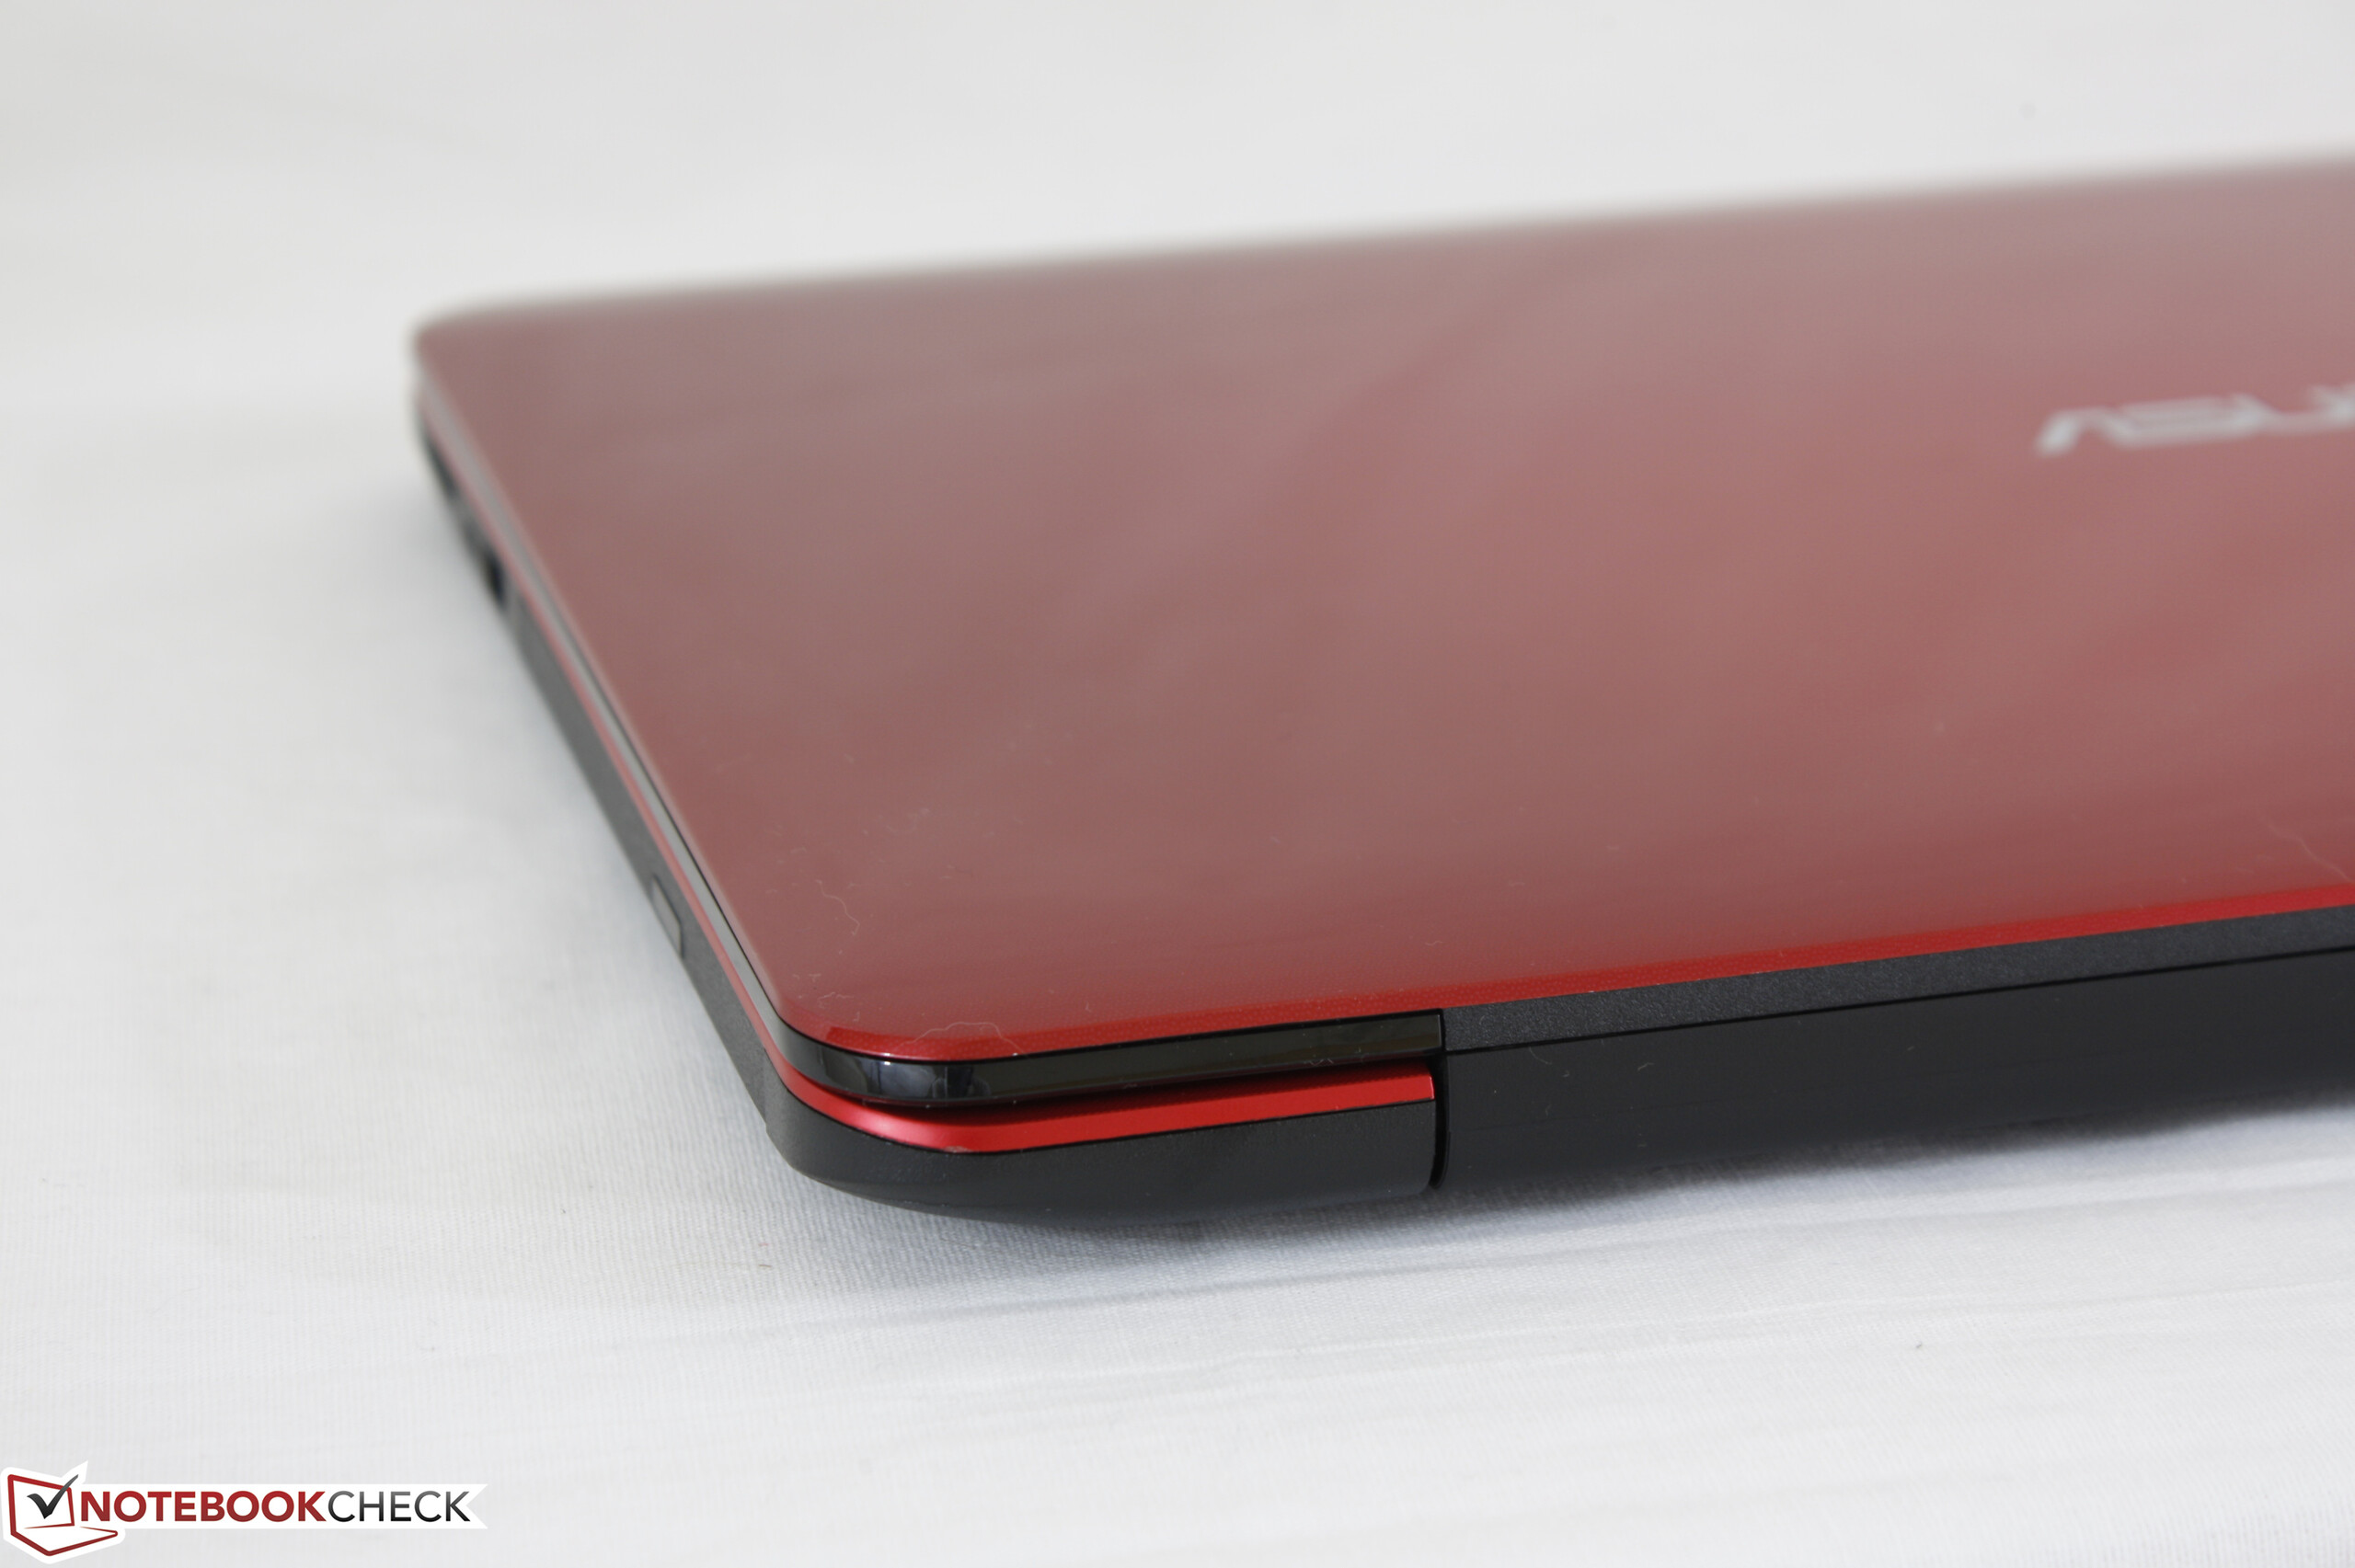
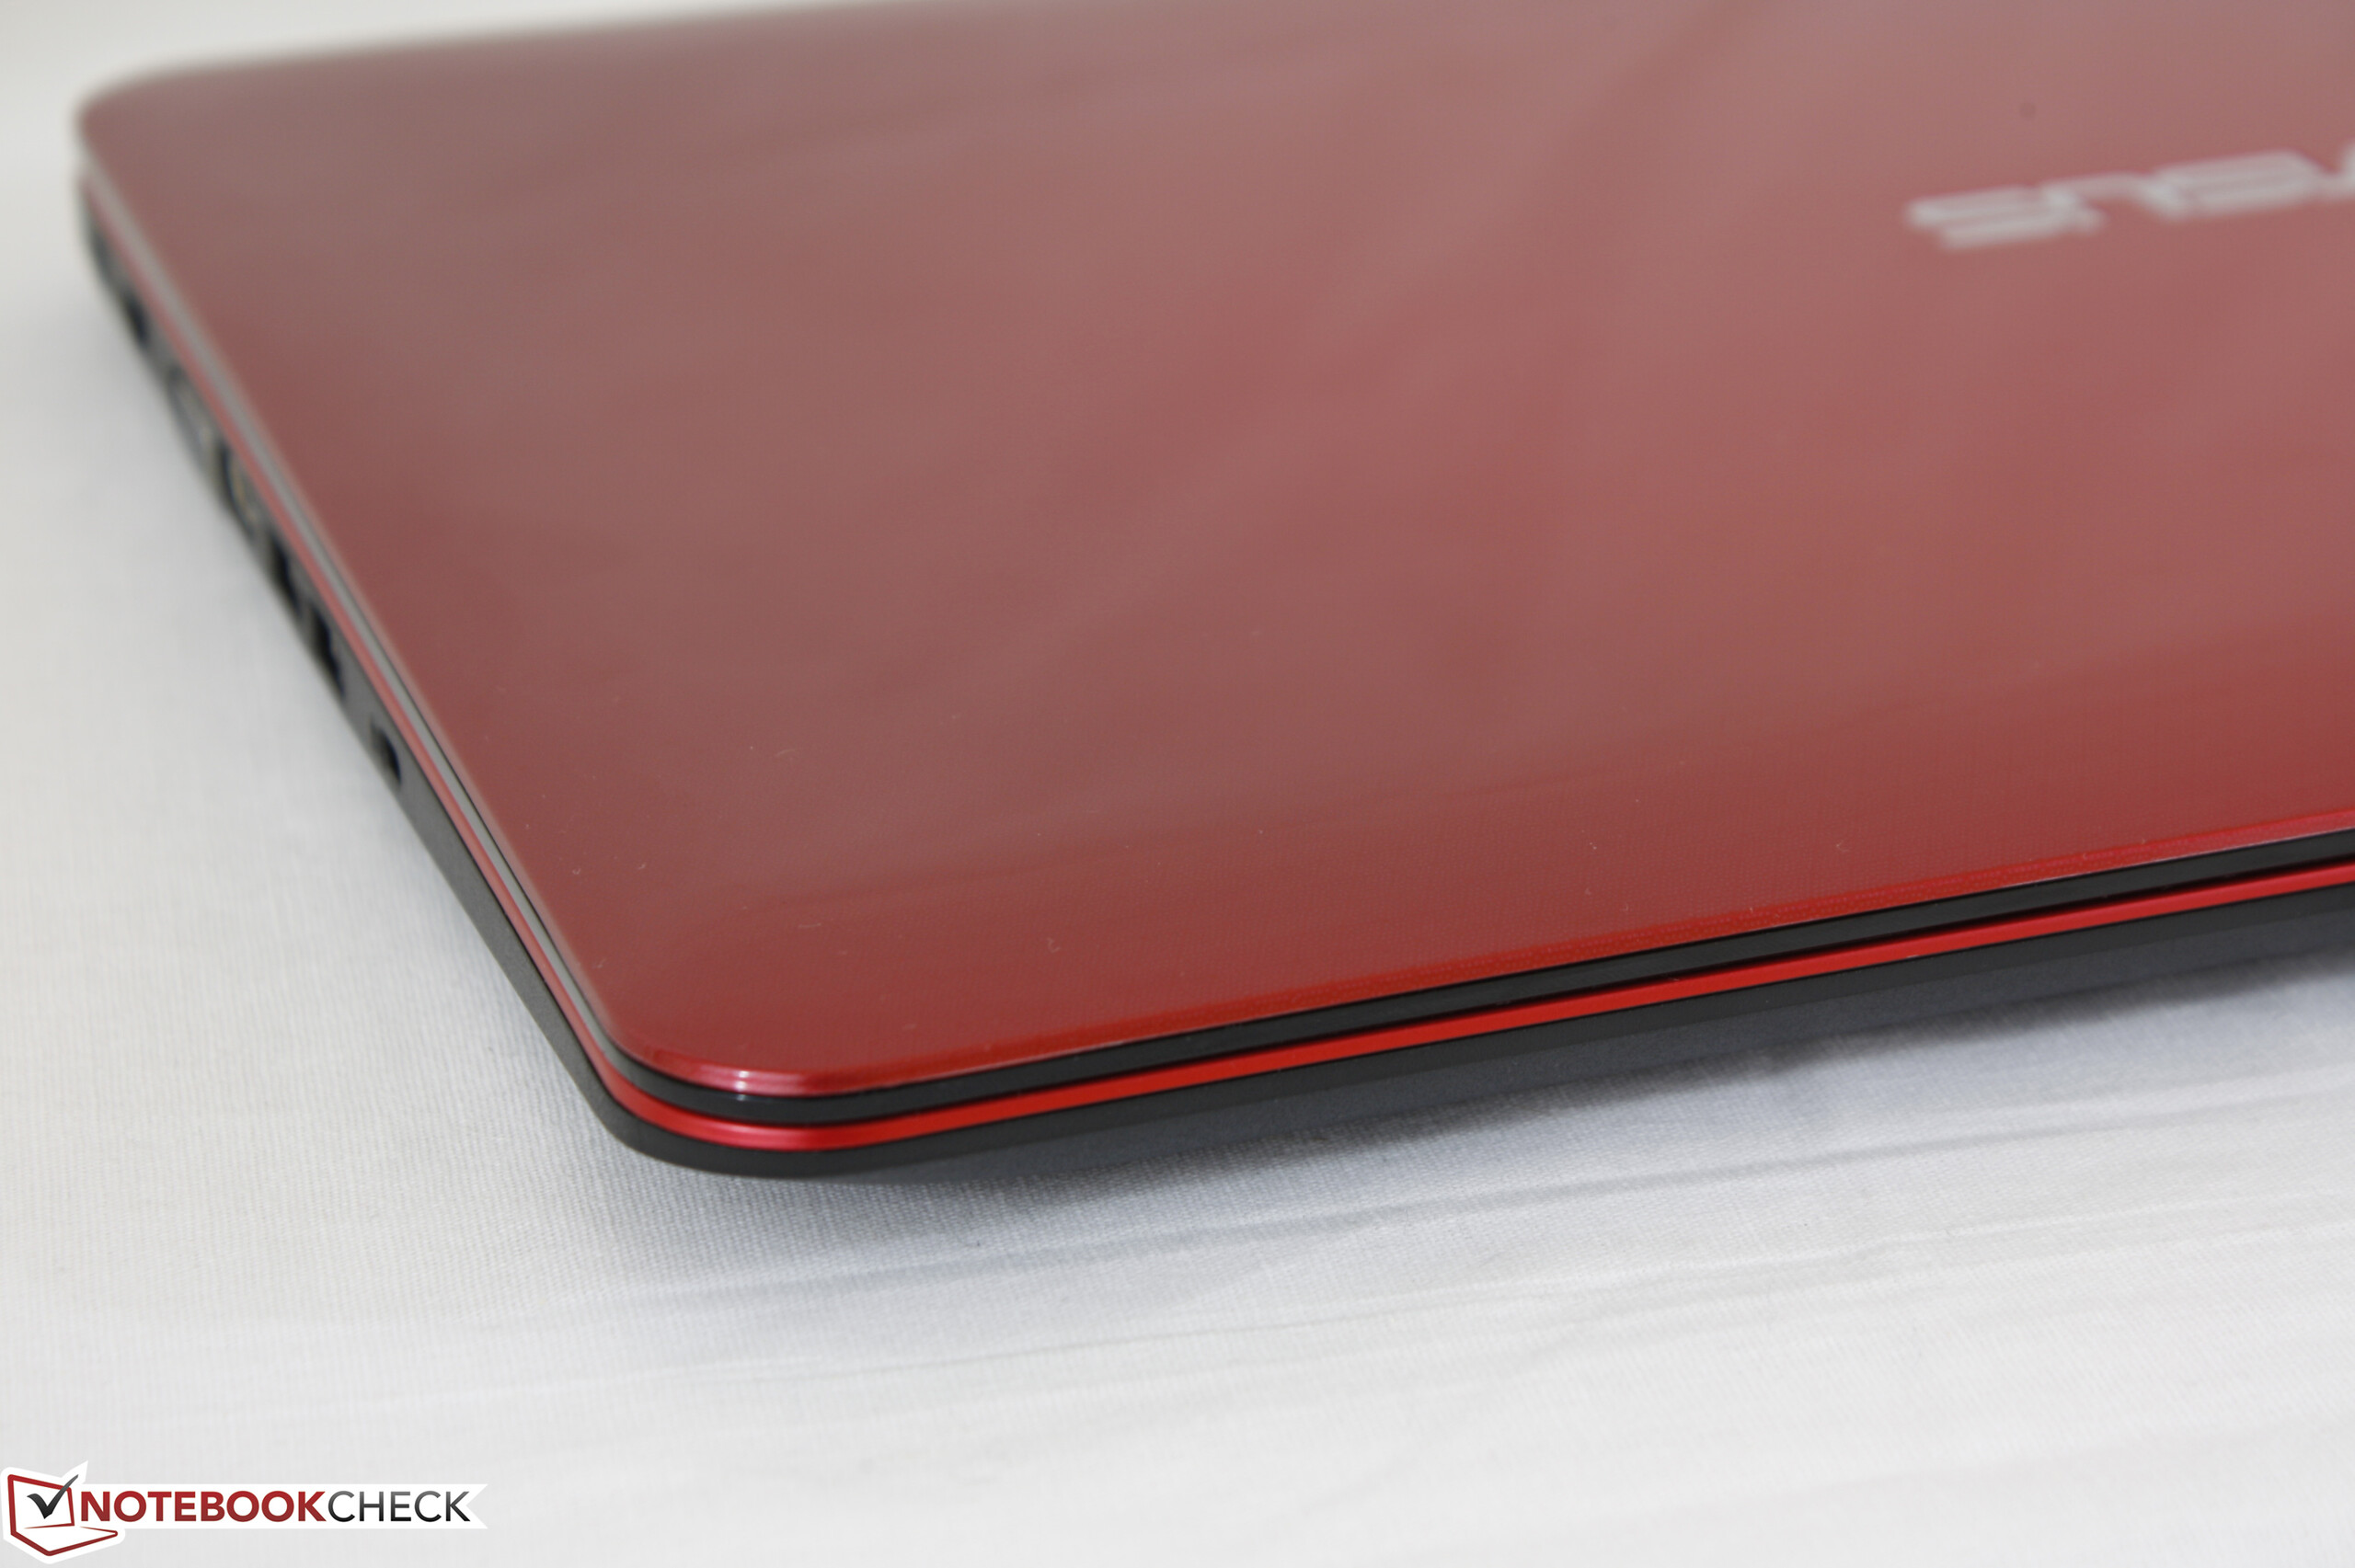
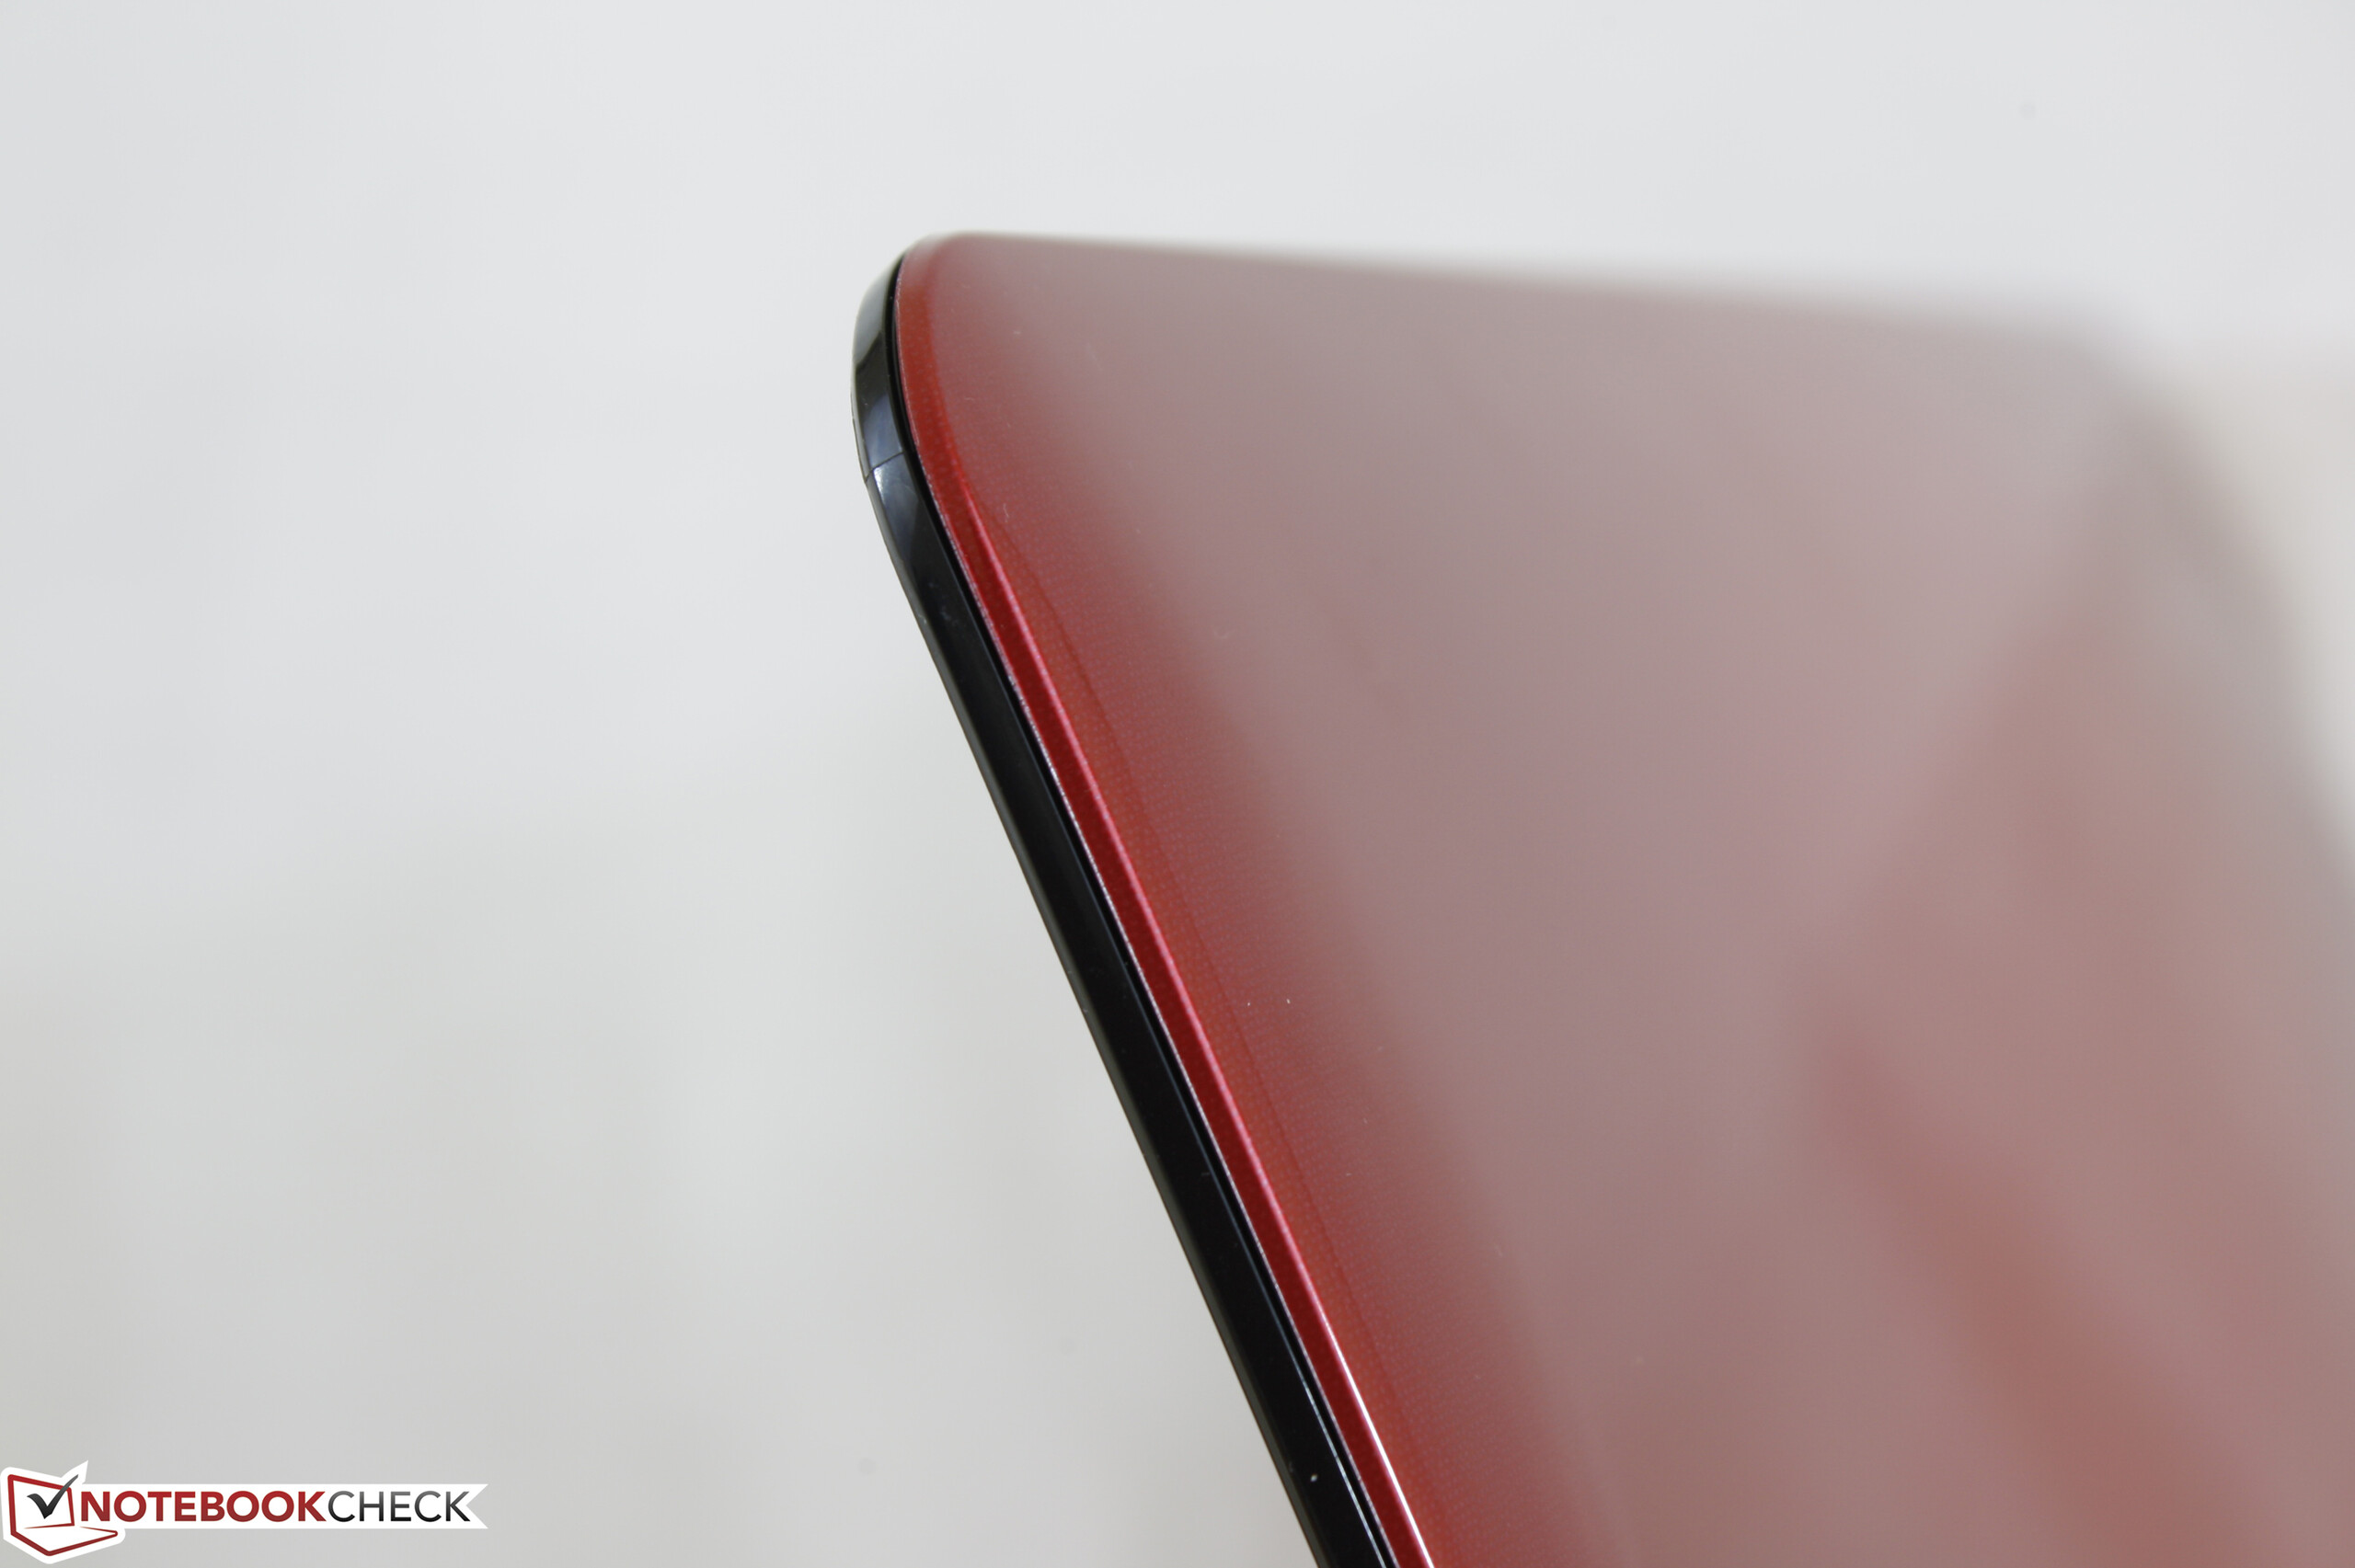
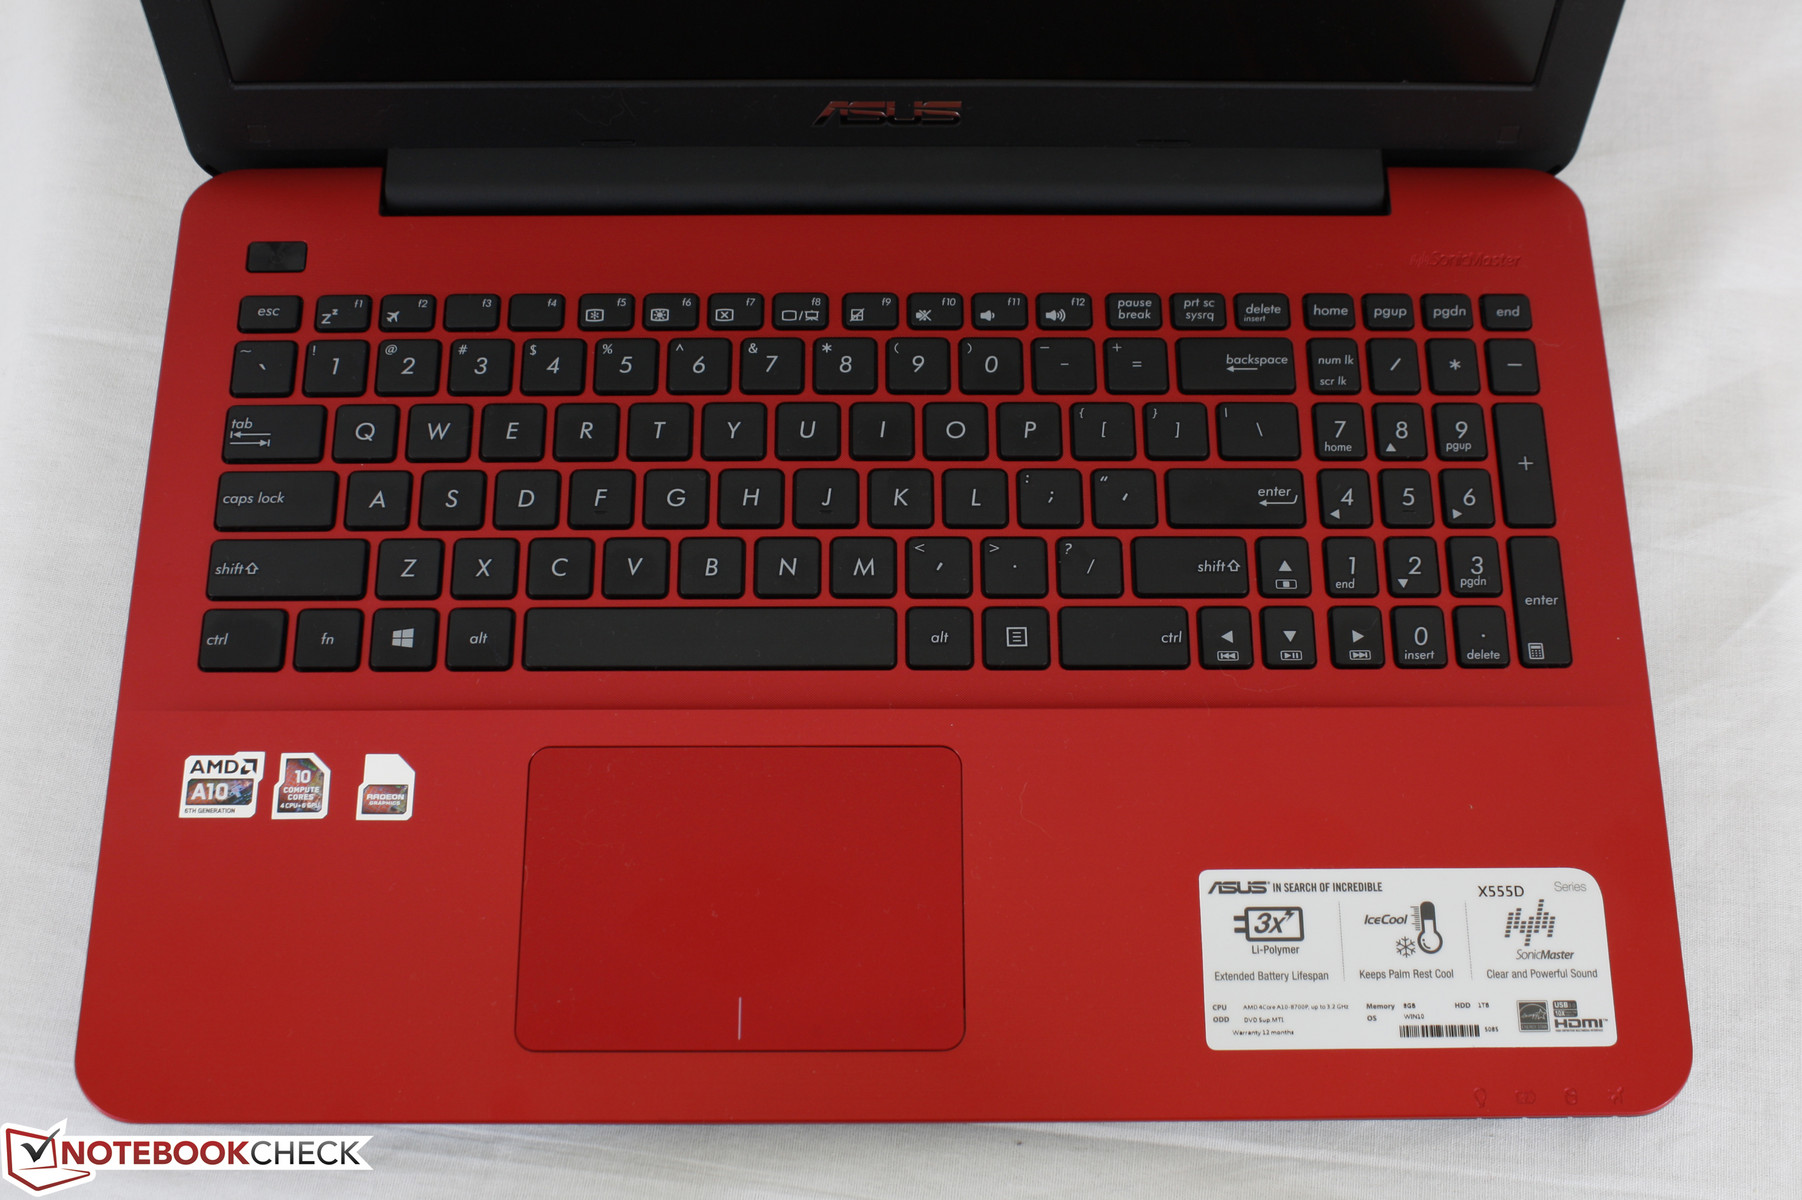
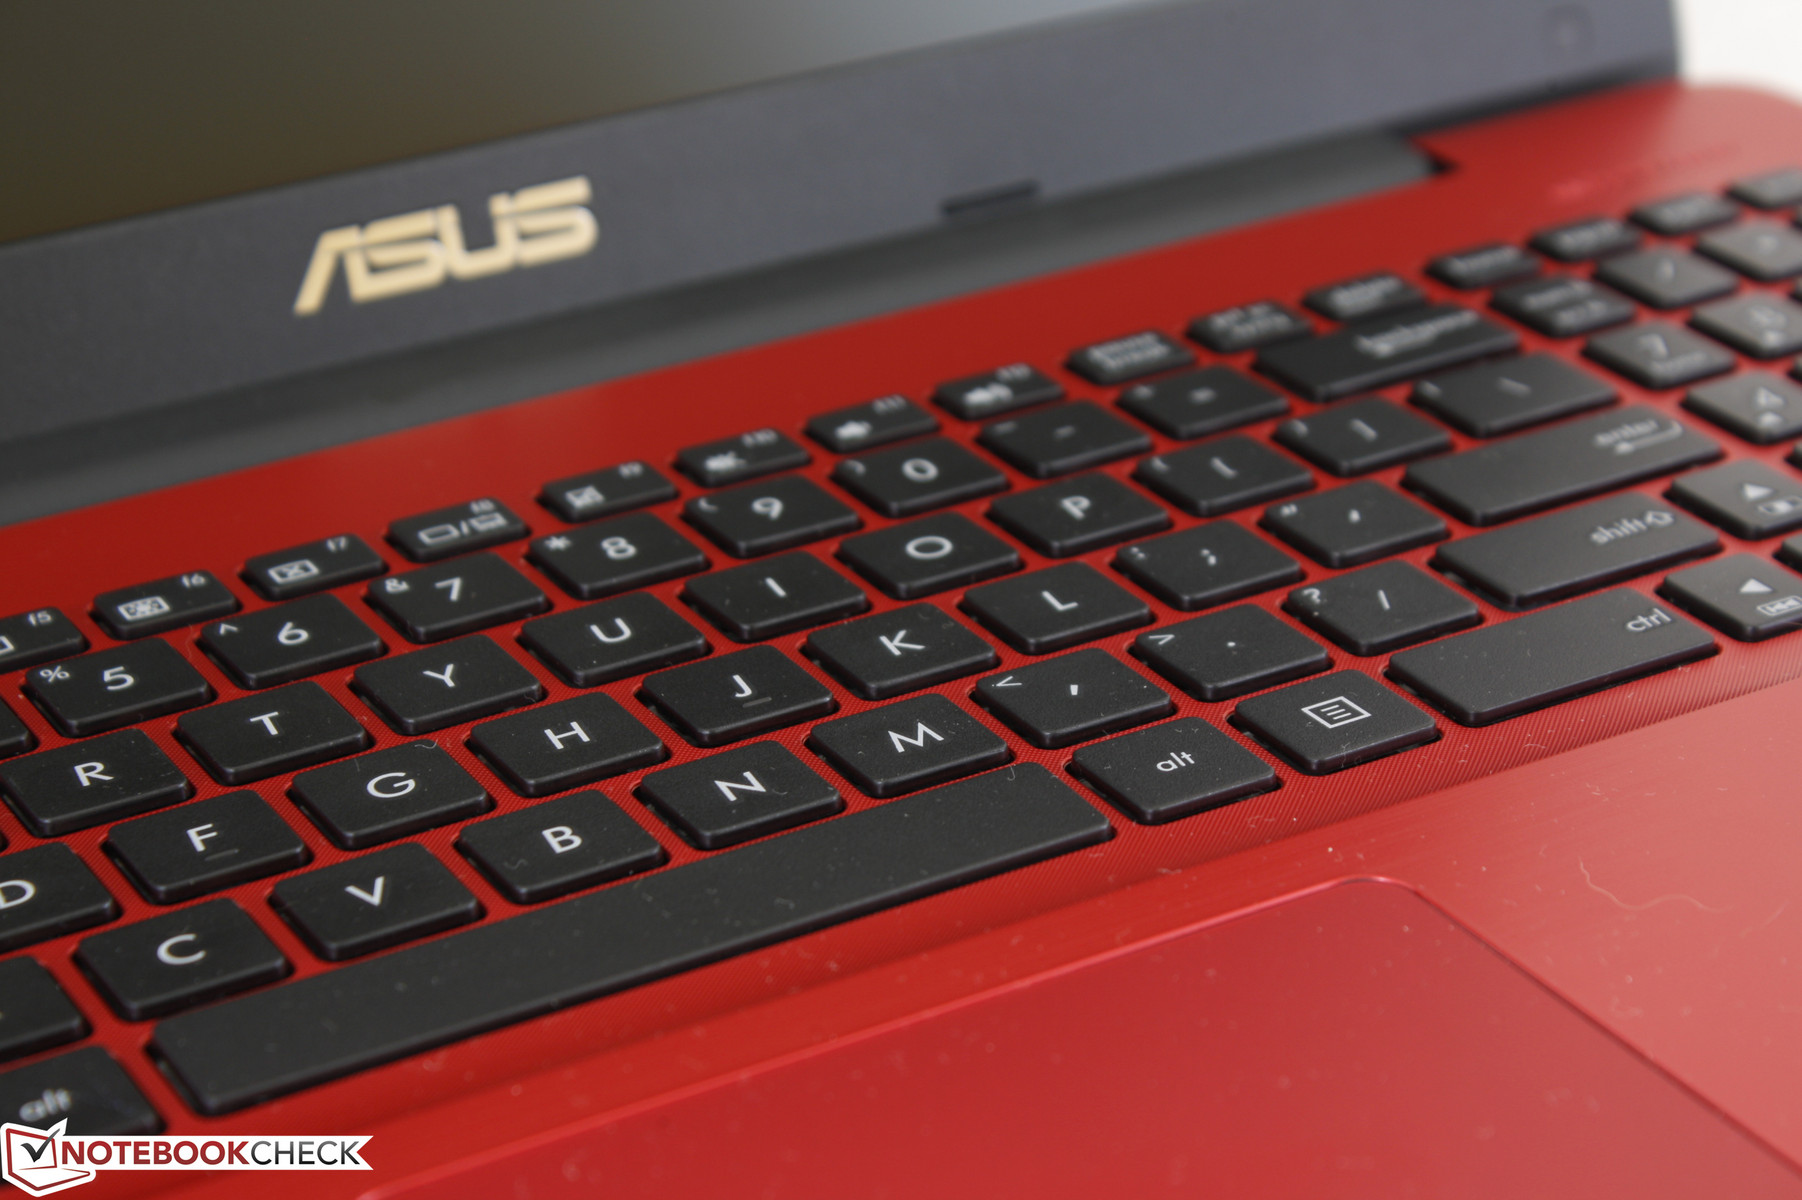
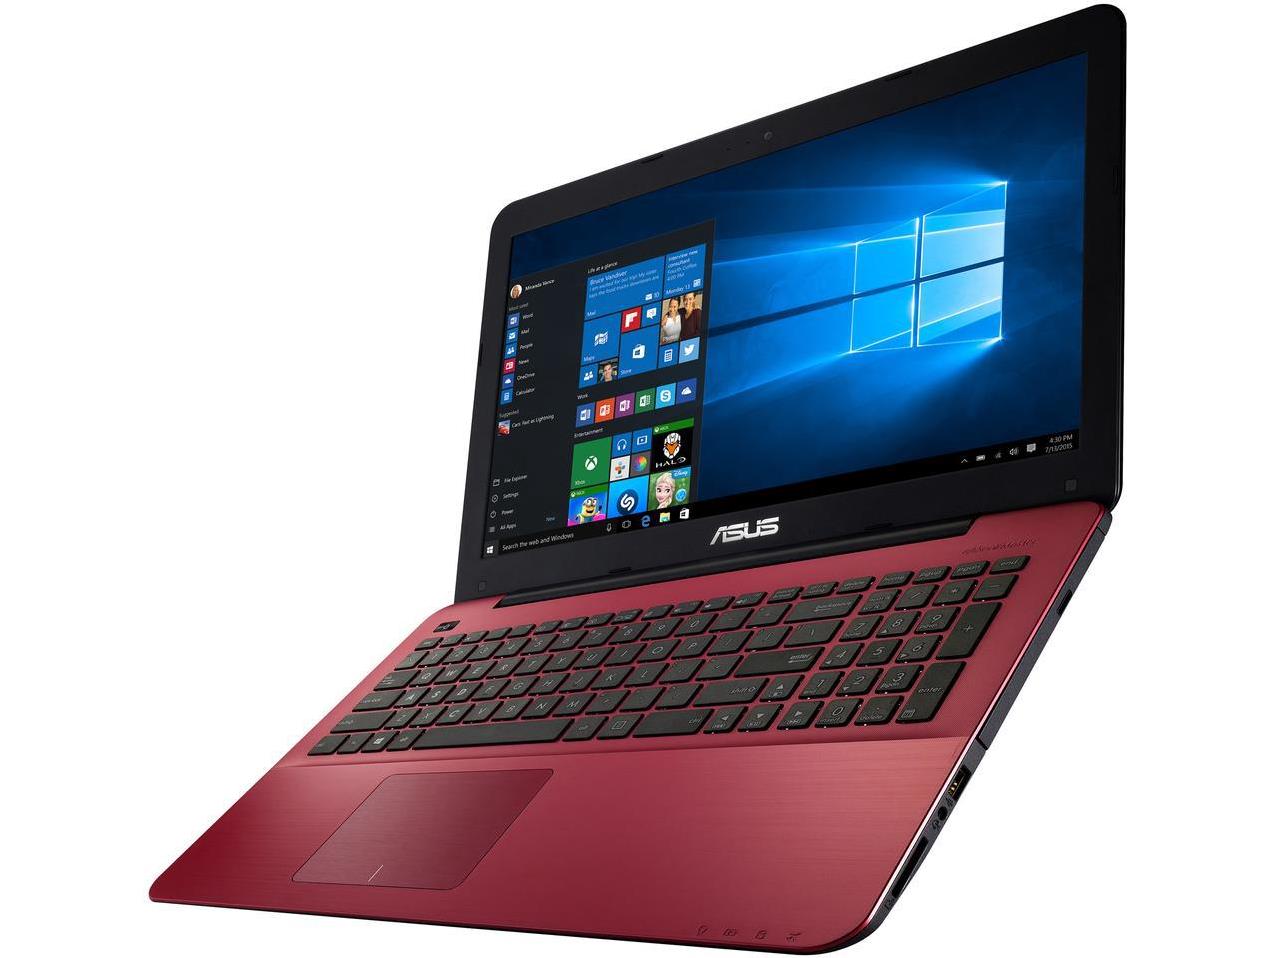
The case remains largely unchanged from the old X555LN with only minor visual updates. The plastic outer lid, for example, is now a glossy bright red with more rounded edges and corners. Other colors are available as well including green and gray with the same glossy sheen. While attractive when new and clean, the surface scratches easily and fingerprints accumulate very quickly.
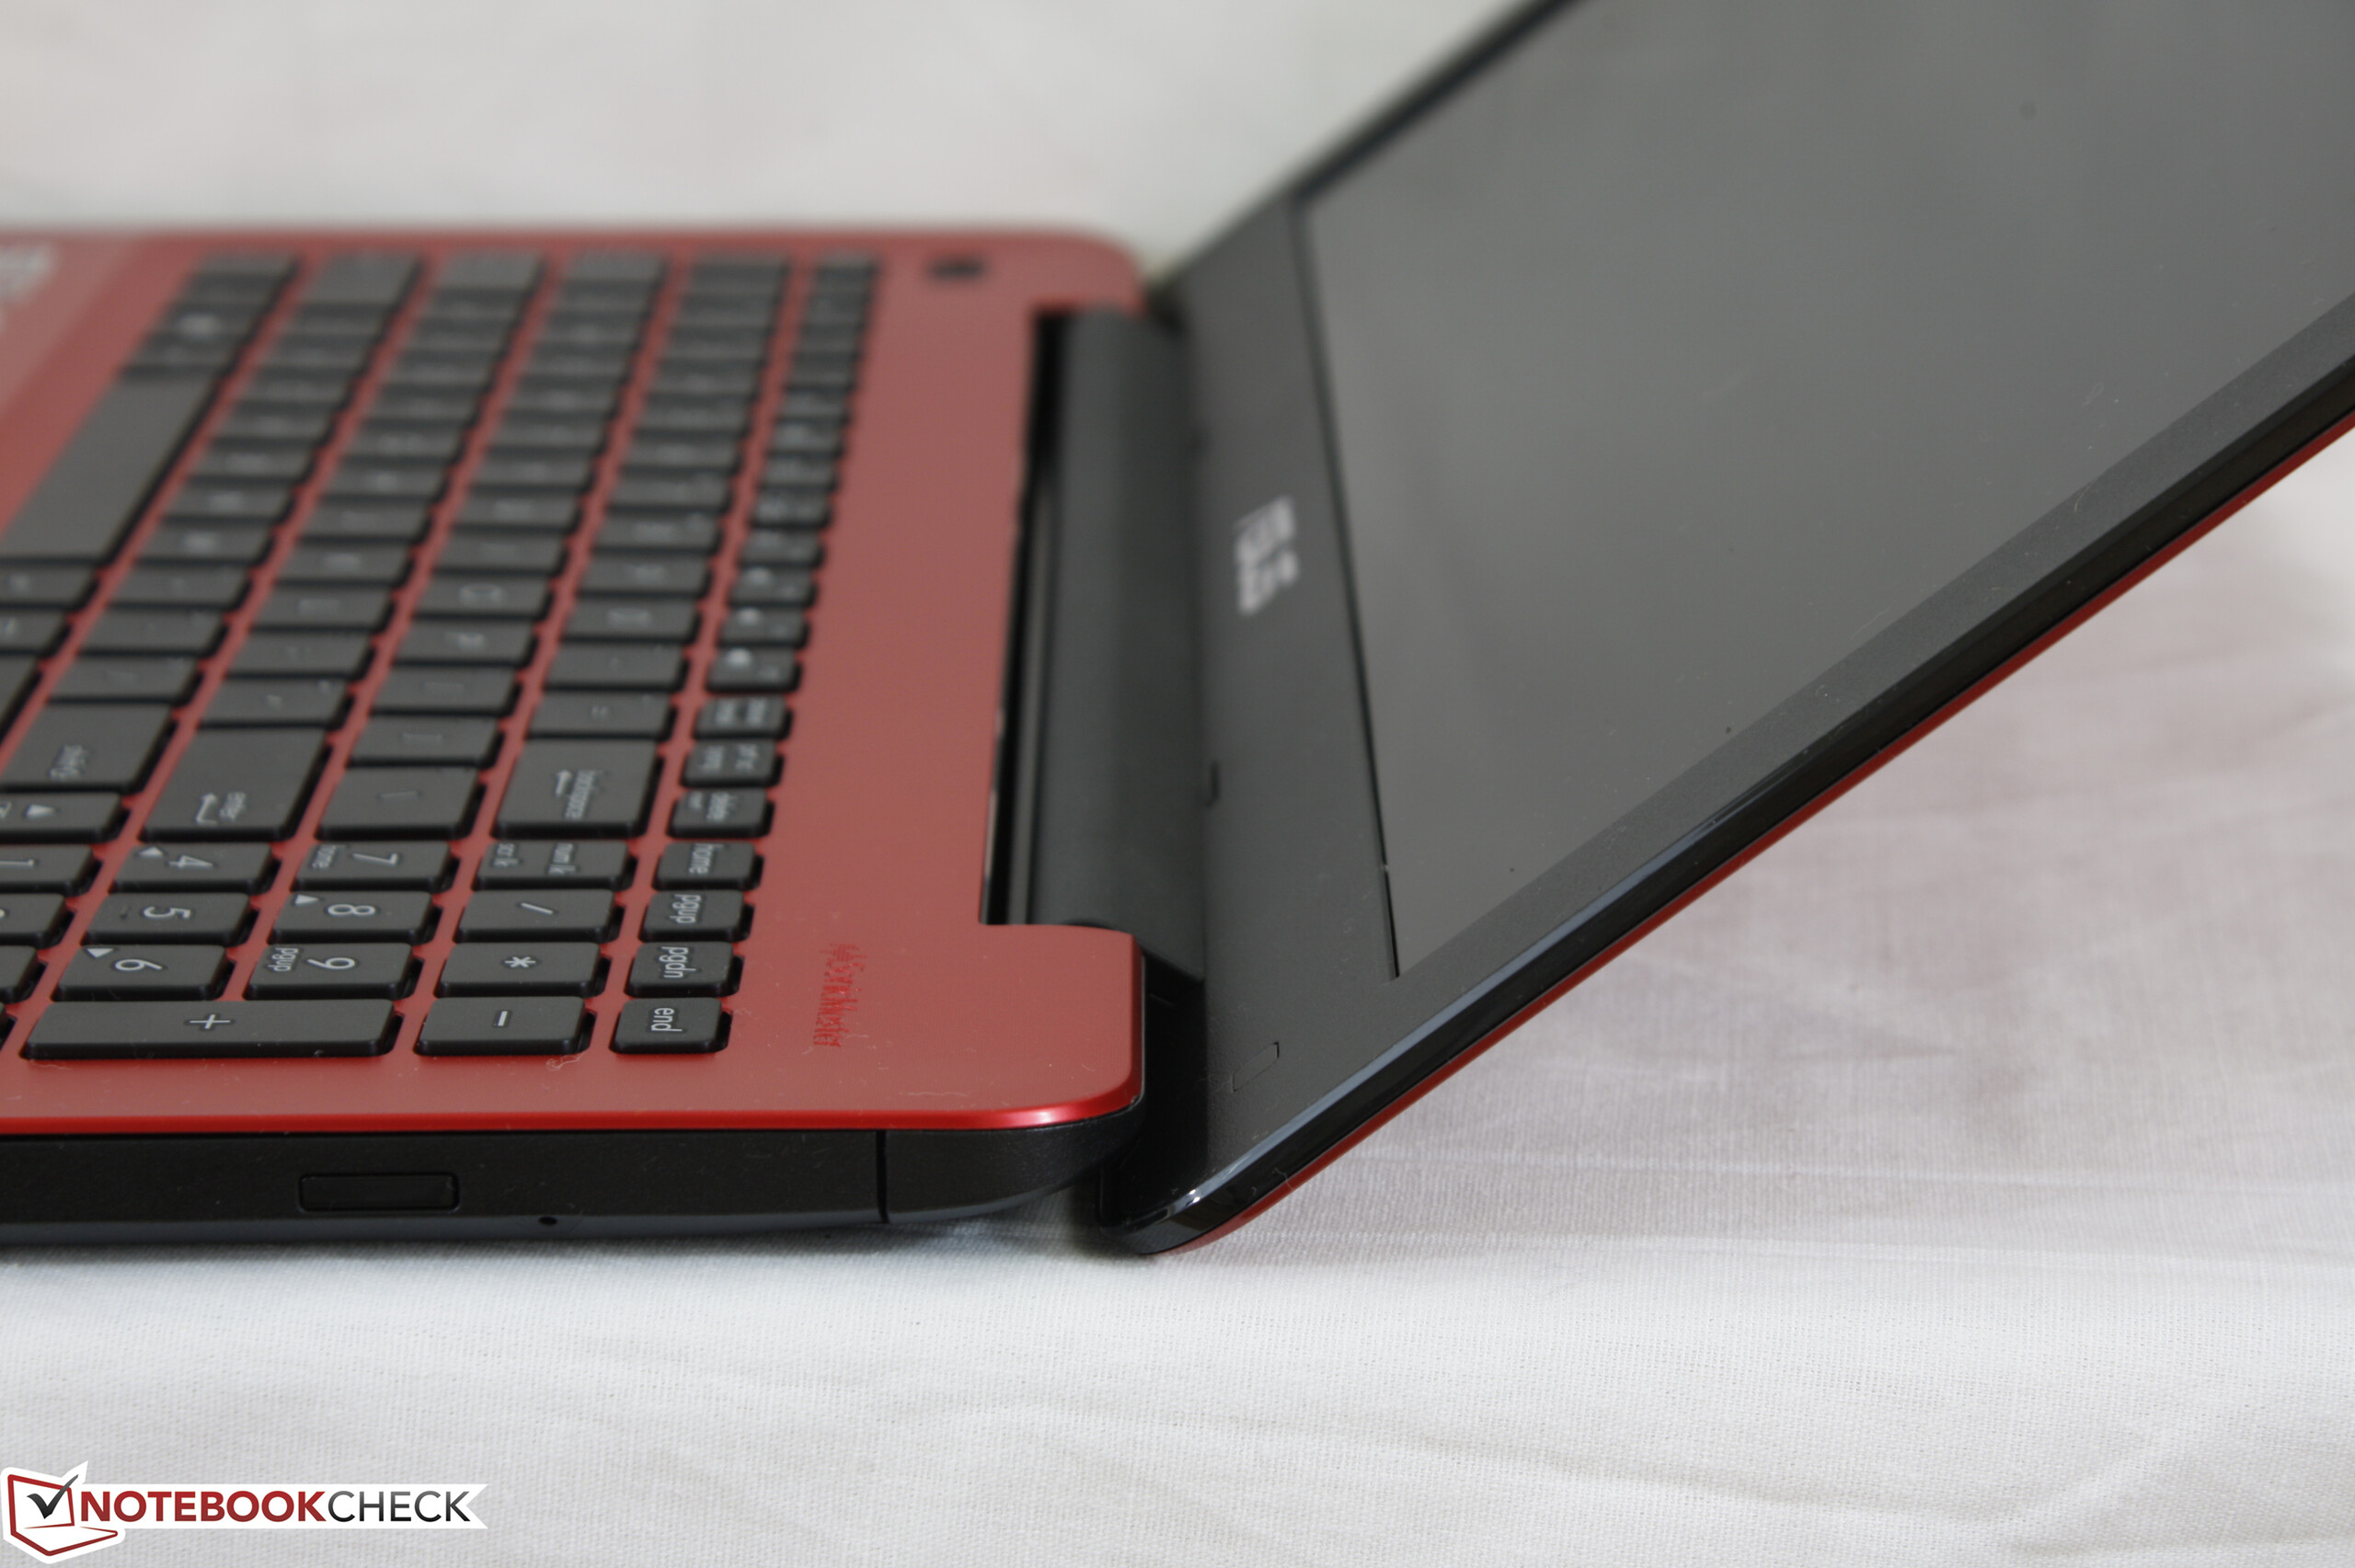
Case quality is average as the plastic base creaks only slightly when twisting or depressing its surfaces. The chassis is a bit weaker on its right half and NumPad area due to the hollow optical bay underneath. The lid is perhaps the most disappointing as it flexes easily and even creaks simply by opening or closing. Its outer surface warps easily to pressure and the bar hinge teeters for far too long when adjusting the angle of the display. While it's unrealistic to expect a very sturdy lid from a notebook in this price range, it's the one aspect of the chassis that could use the most improvement.
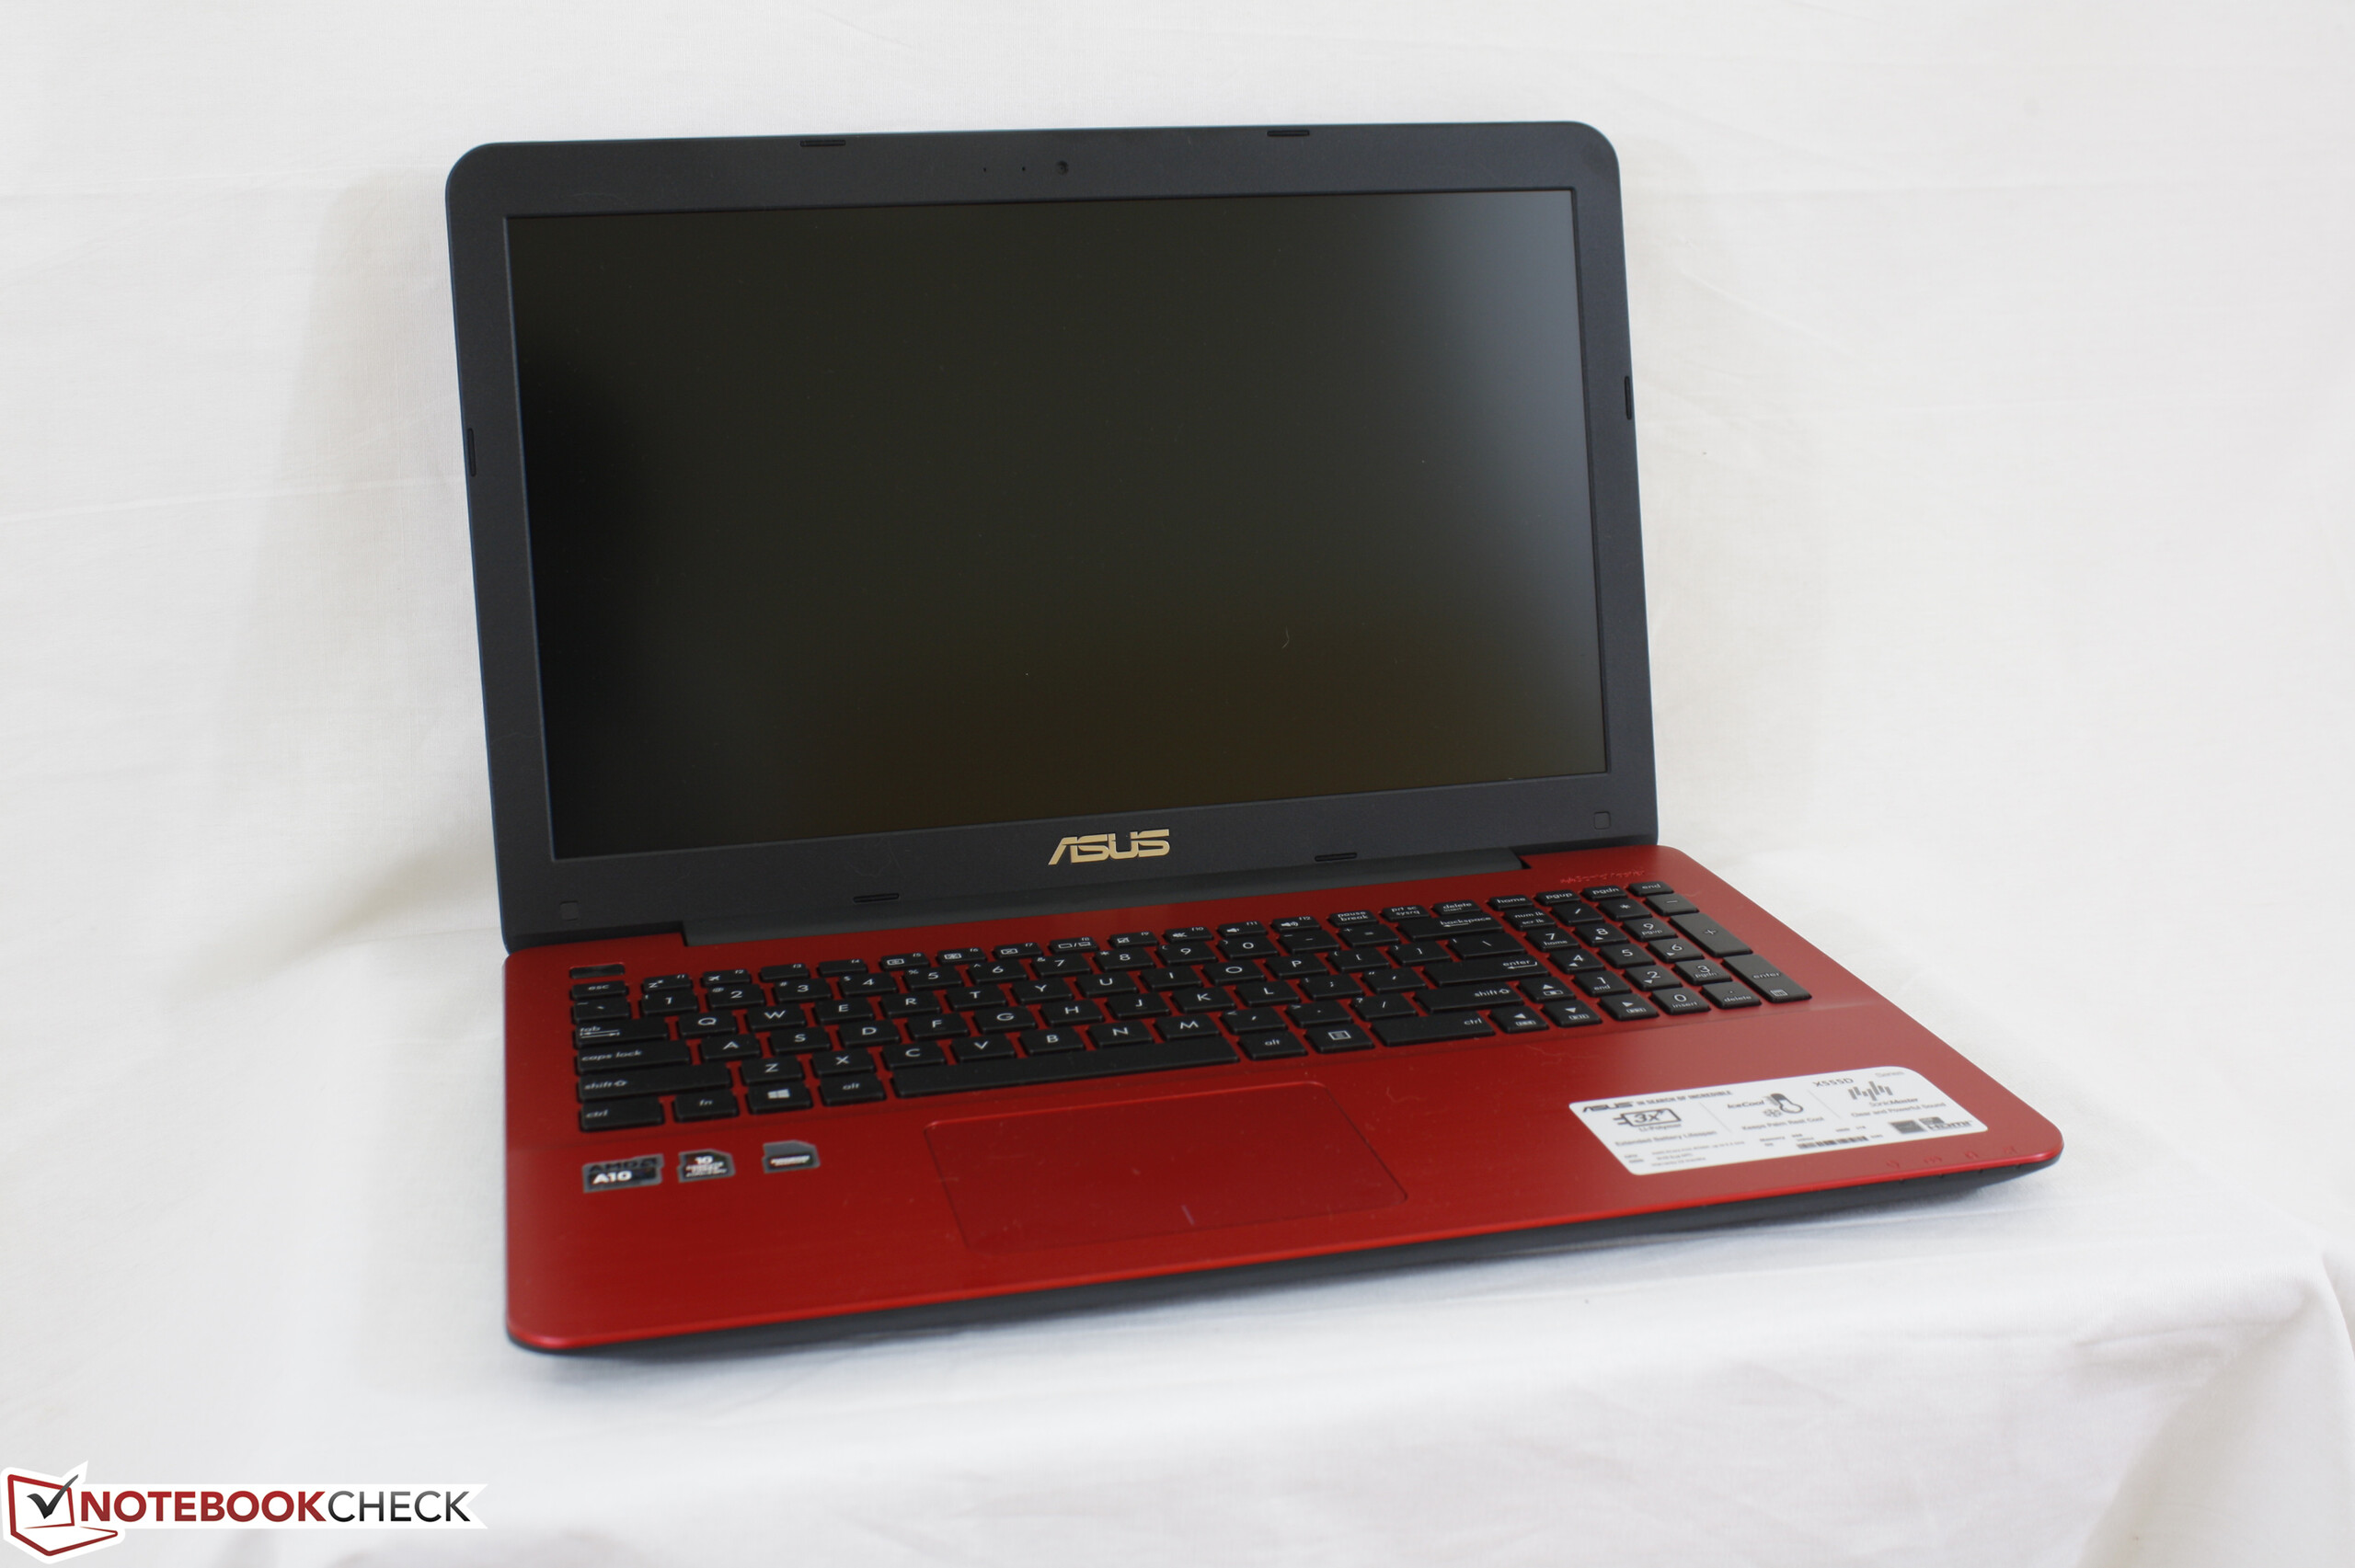
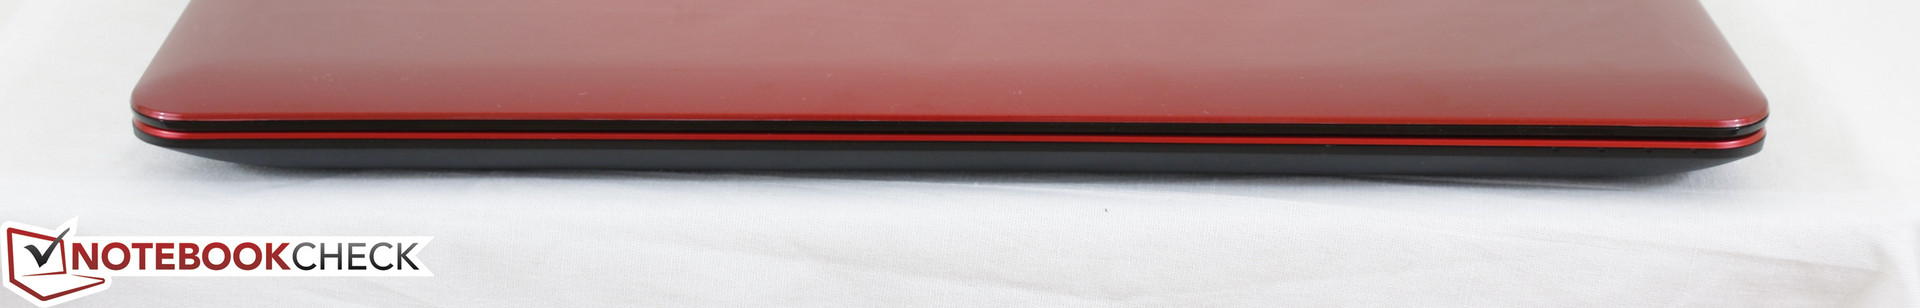
The X555DA is middle-of-the-road when it comes to size and weight as it is not significantly heavier nor thinner than other inexpensive alternatives. After all, its affordable chassis is not designed to be super-thin or lightweight like the flagship Zenbook series.
Connectivity
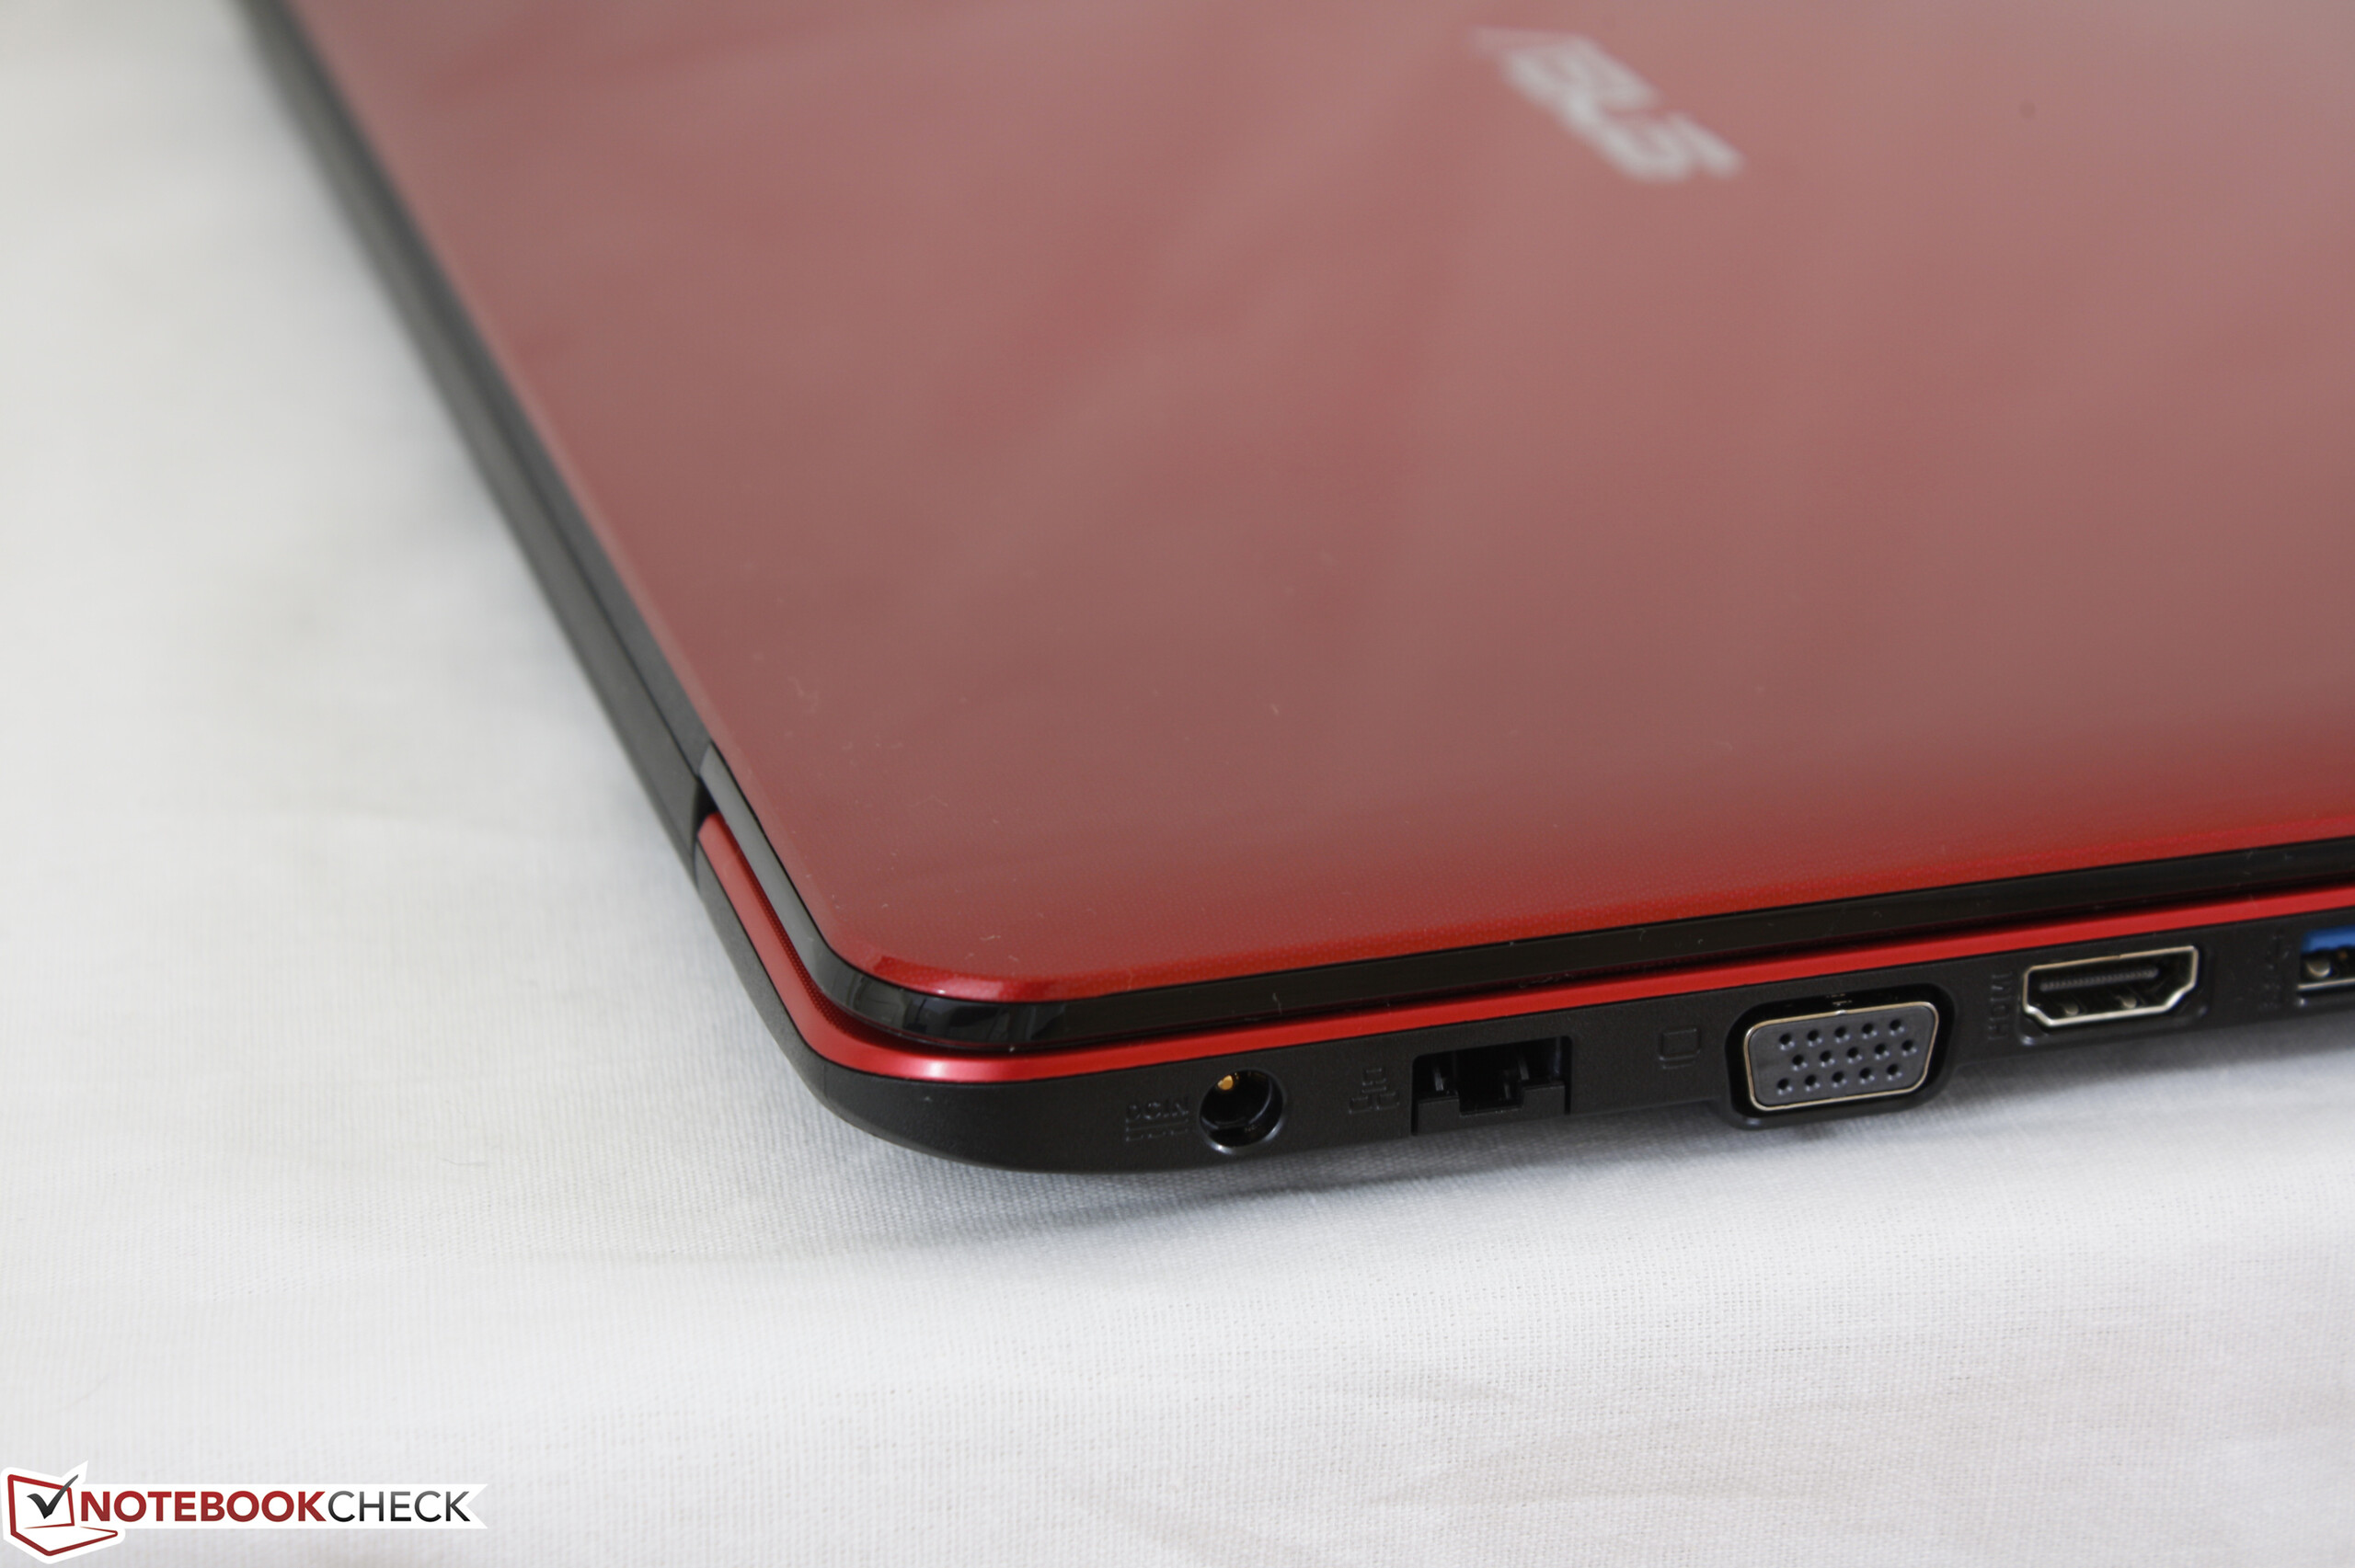
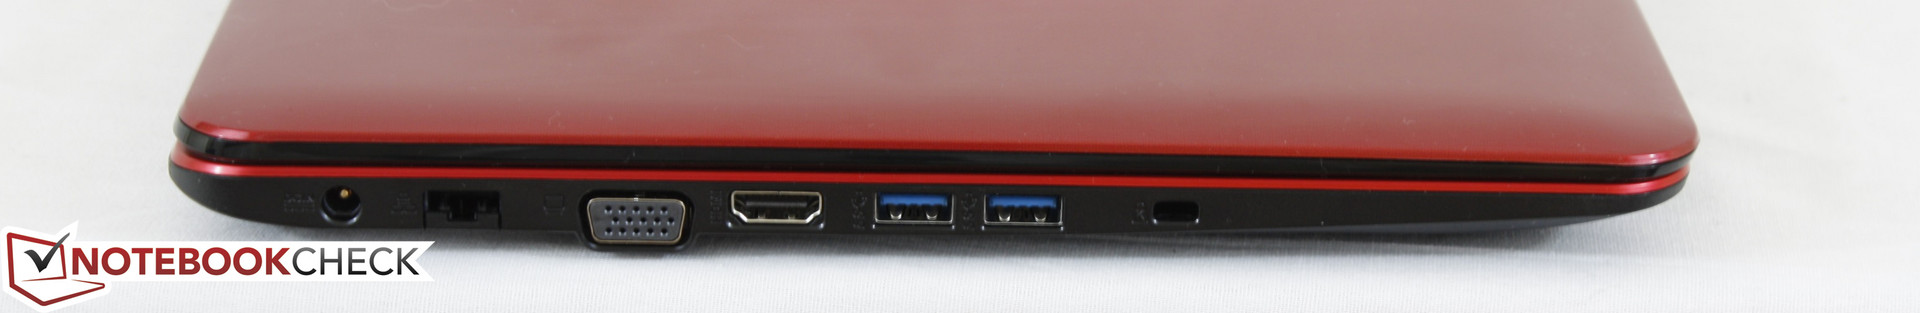
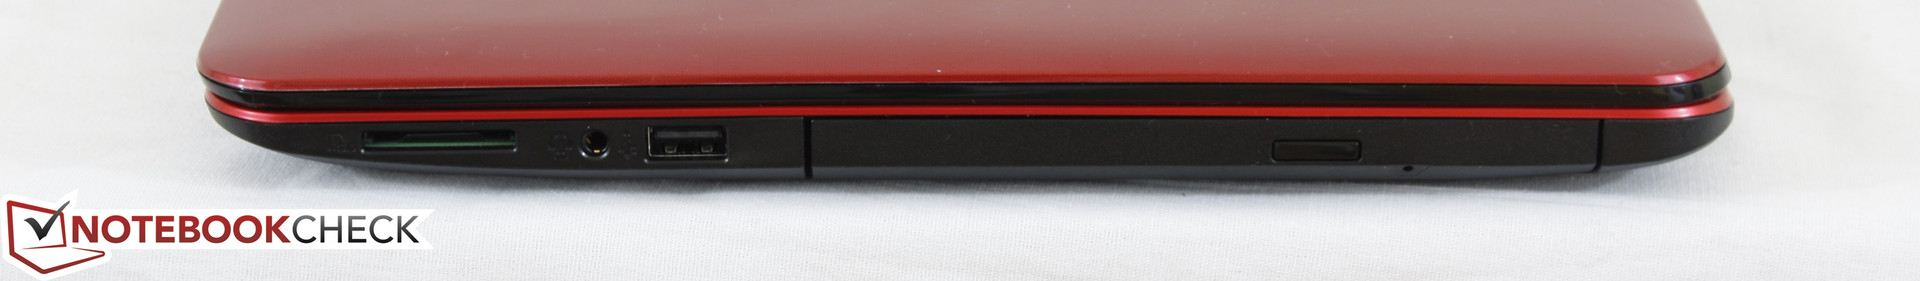
Available ports are identical to the 2014 X555LN. Ports are positioned close to the front of the side edges where they are easy to reach, but expect cables to take up valuable desk space as a result. Moving some features to the rear of the notebook, such as the Kensington Lock, would have benefited the Asus. USB Type-C is conspicuously missing as well.
SD Card Reader
The integrated card reader is slow with a transfer rate of just 25 MB/s from our Toshiba UHS-II test card. Transferring 1 GB worth of photos from the card to desktop will take about 41 seconds.
The card reader is not spring-loaded and is poorly positioned on the right edge of the notebook. About half of the SD card will protrude when fully inserted and it is easy to accidentally knock or bend the card during use.
| SD Card Reader | |
| average JPG Copy Test (av. of 3 runs) | |
| HP Pavilion 15t-X7P42AV | |
| Asus X555DA-BB11 | |
| Toshiba Satellite Pro R50-C-16V | |
| maximum AS SSD Seq Read Test (1GB) | |
| HP Pavilion 15t-X7P42AV | |
| Asus X555DA-BB11 | |
| Toshiba Satellite Pro R50-C-16V | |
Communication
The Realtek 8821AE WLAN adapter is an upgrade from the Atheros adapters on our previous X555 units as the X555DA supports 802.11ac networks. While transmit is slow at under 200 Mbps, the system can receive at a more respectable 341 Mbps as is common for a 1x1 WLAN module. We experienced no connectivity issues during our time with the Asus test unit.
Bluetooth 4.0 is integrated on our particular configuration, but is otherwise optional on the X555 series.
| Networking | |
| iperf3 transmit AX12 | |
| HP Pavilion 15t-X7P42AV | |
| Toshiba Satellite Pro R50-C-16V | |
| Asus X555DA-BB11 | |
| iperf3 receive AX12 | |
| HP Pavilion 15t-X7P42AV | |
| Asus X555DA-BB11 | |
| Toshiba Satellite Pro R50-C-16V | |
Accessories
The retail box includes no extras beyond the warranty card and AC adapter, so the out-of-box experience is as barebones as it gets. Carrying cases and external mice are available from Asus.
Maintenance
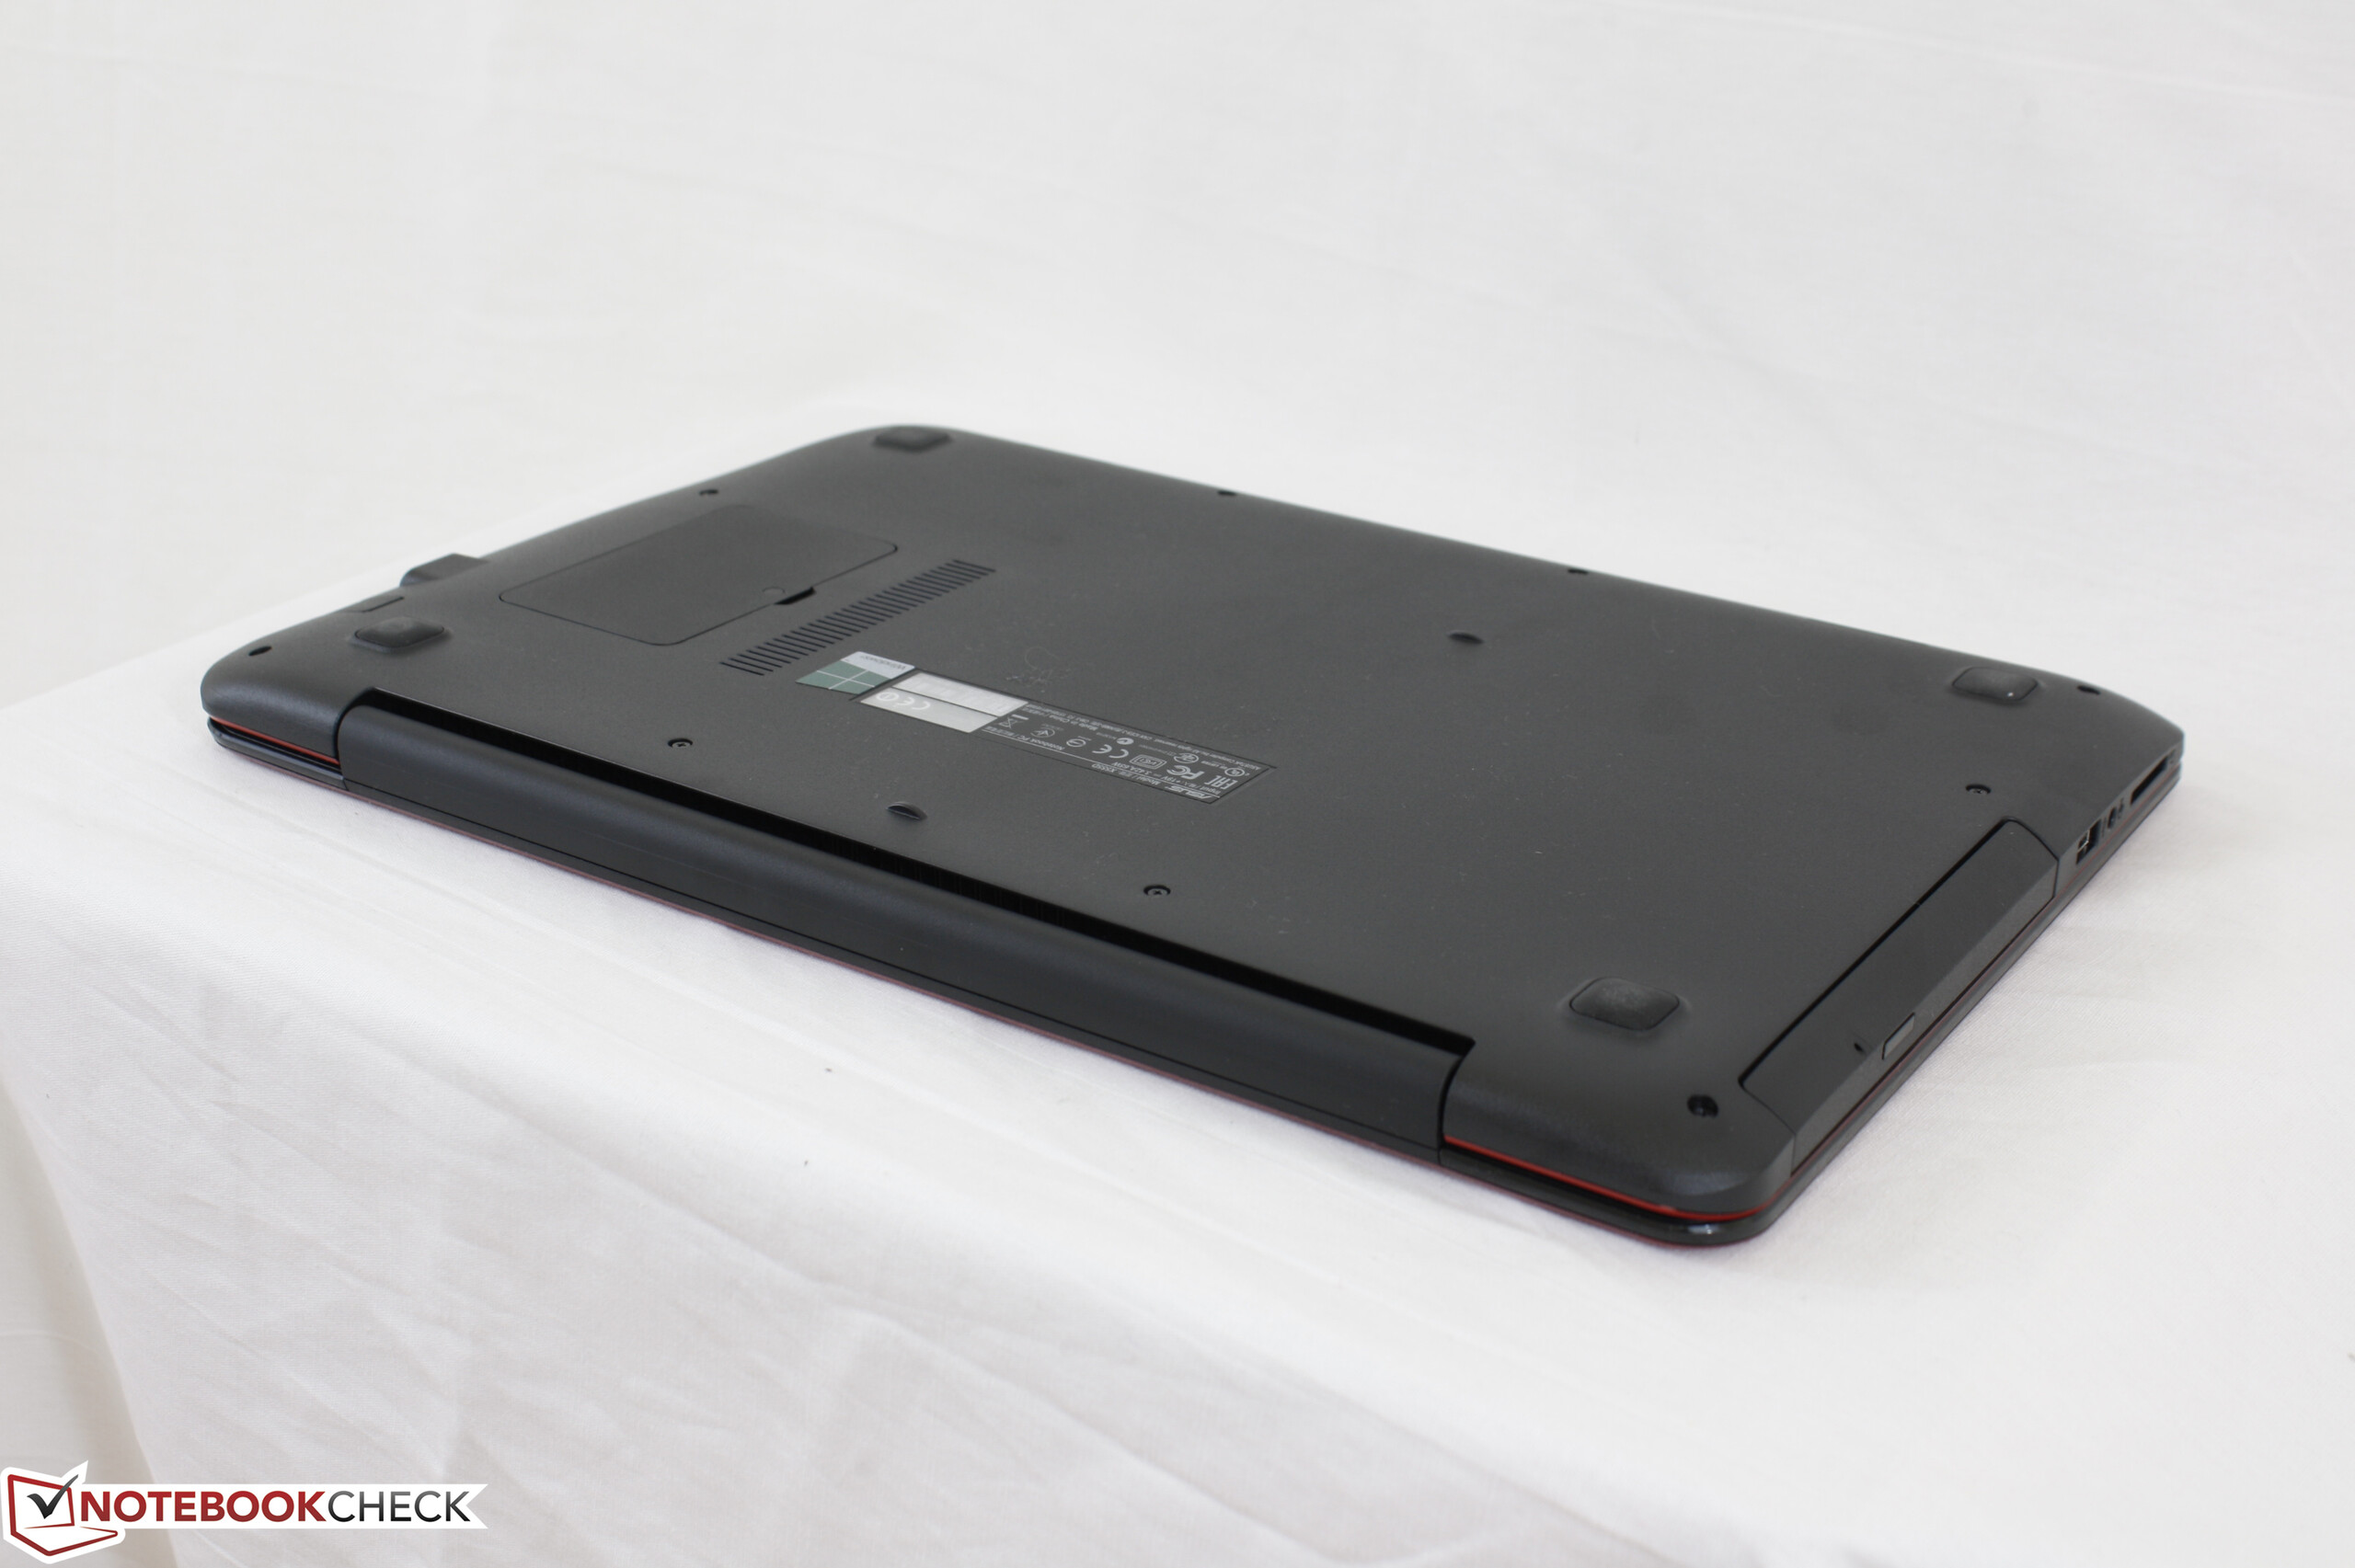
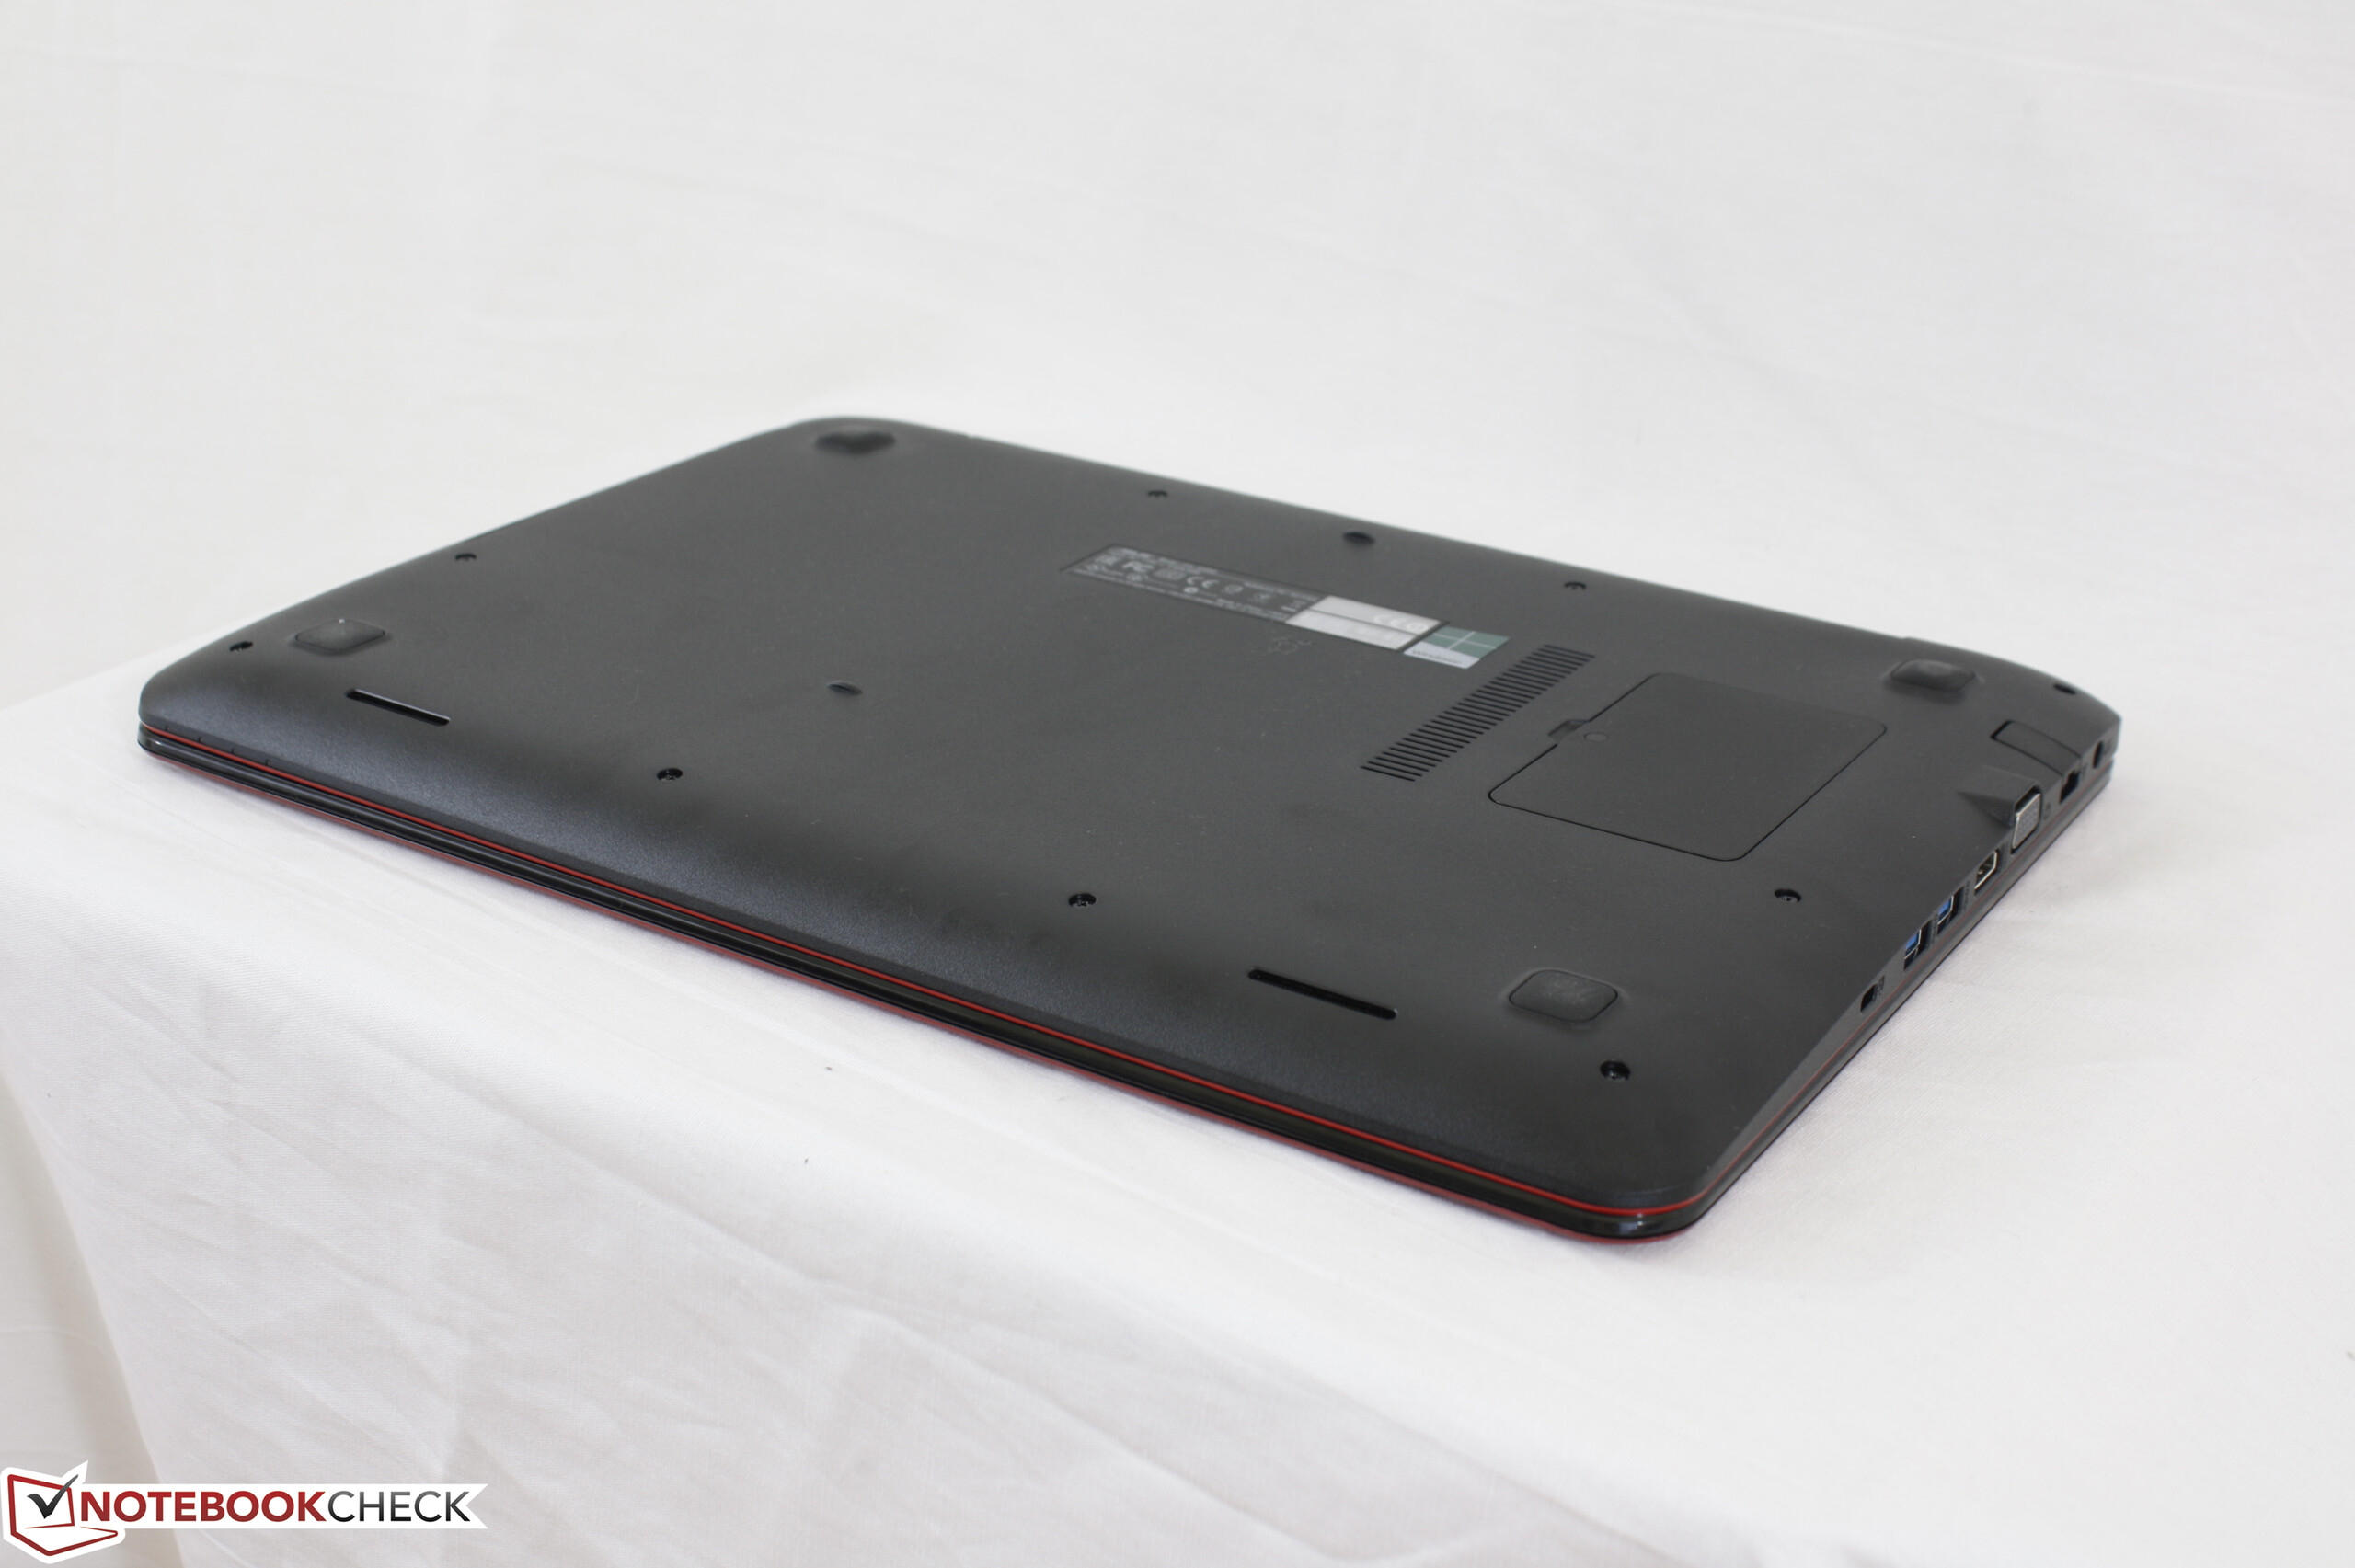
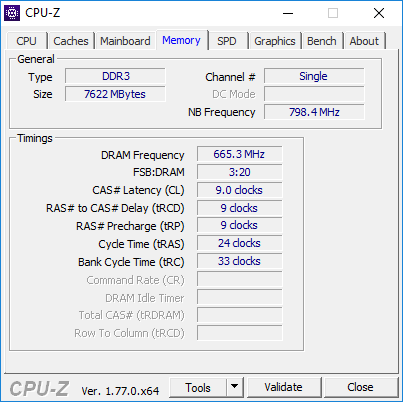
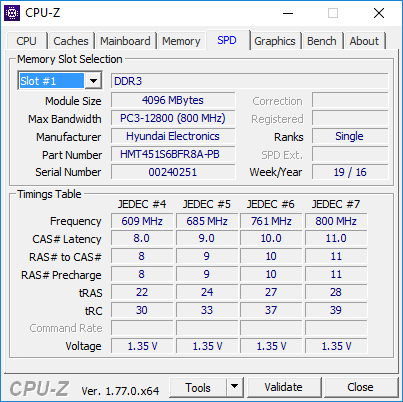
A small hatch is provided for quick access to the single DDR3 SODIMM slot if needed. Beyond this, the bottom panel cannot be easily removed as many core components are attached to this panel. Instead, users must pop off the keyboard base to reveal the motherboard, hard drive, and system fan. The keyboard base is attached to the bottom base with more ribbons, so accessibility is not as easy as it could have been.
Warranty
The standard one-year limited warranty applies to both the notebook and its internal battery. Dead pixels are covered over a certain minimum as described by Asus' official warranty card.
Input Devices
Keyboard
The plastic keyboard keys are slightly roughened in texture and do not wiggle or clatter significantly when pressed. Travel is shallow as expected, but feedback is soft mainly because the keyboard base warps easily to pressure especially towards its center. Simply typing will bend the area around the keys slightly, so the chassis could have benefited from a more rigid base to improve the typing experience. There are no backlight options as is common on budget laptops.
Touchpad
The trackpad (~10.5 x 7.3 cm) feels much more solid than the keyboard with its smooth glide and responsiveness. The onscreen cursor will not jitter even at low speeds and multi-touch controls are generally reliable. The integrated mouse keys are shallow in travel with firm auditory feedback when pressed. Travel could have been more rigid, however, as there is some "give" to the touchpad surface before the system will register a click.
It's worth noting that the trackpad on our test unit is not completely flat; its surface sinks slightly more on the left half than the right half. This doesn't appear to impact the functionality of the trackpad, but it has us questioning the quality control of this particular aspect of the X555DA series.
Display
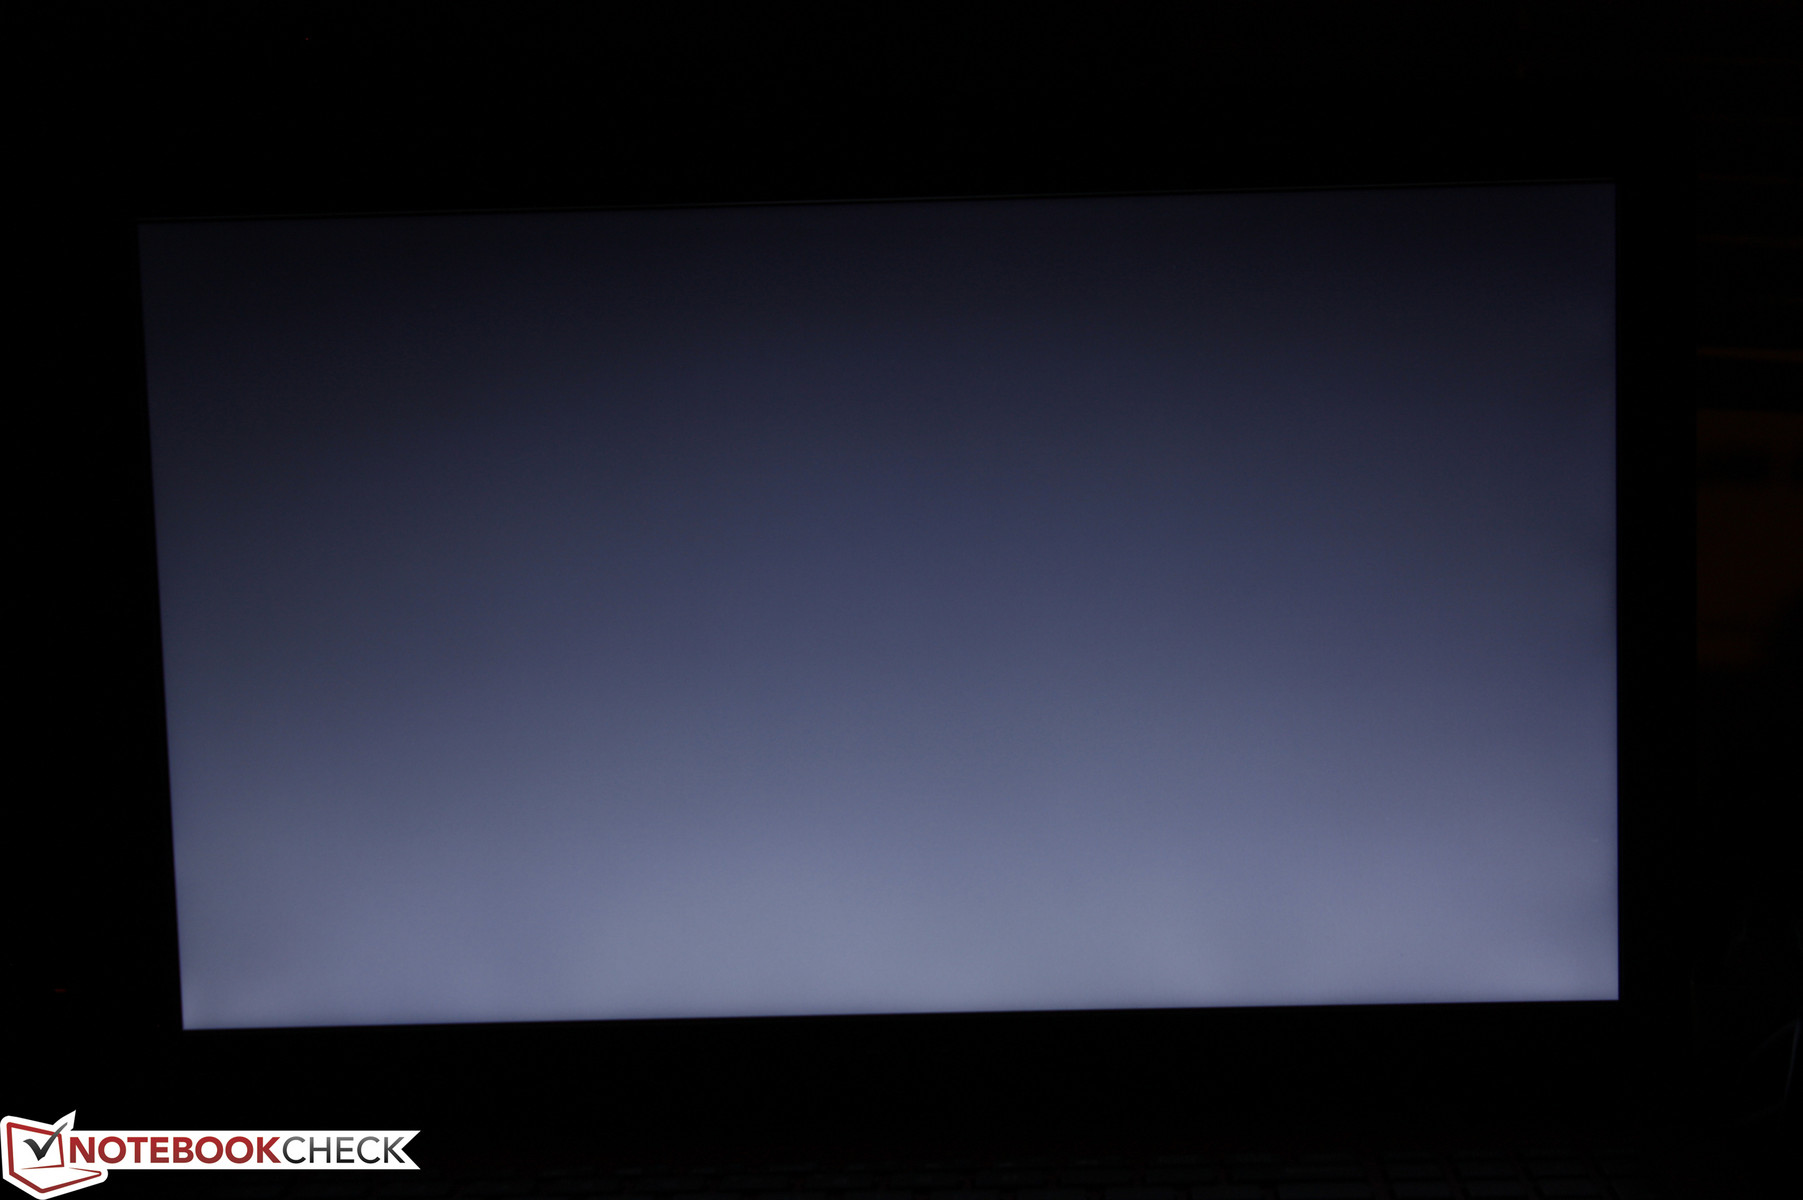
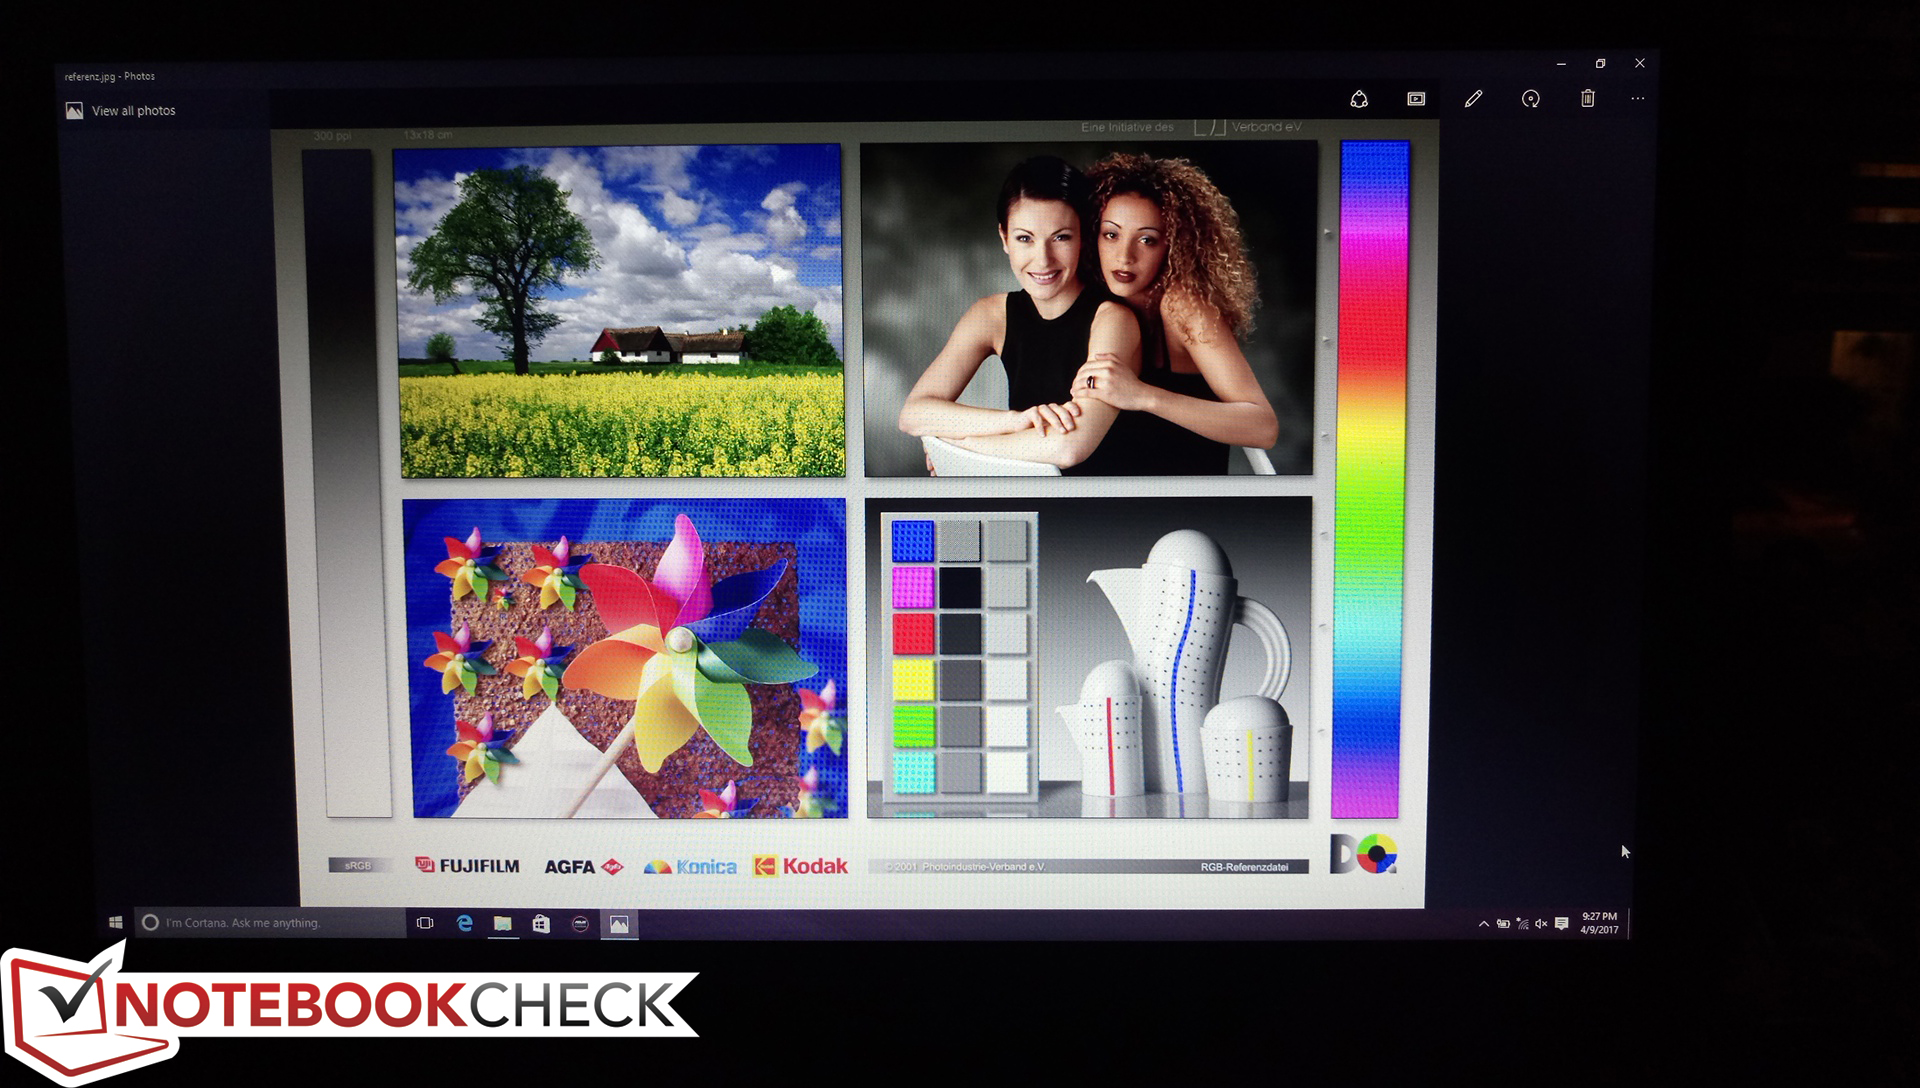
The 1080p panel on our X555DA is a stark improvement over the poor 768p panel on our older X555LN. Contrast and brightness are now more in line with what we expect from a notebook of this price range at around 500:1 and 230 nits, respectively. This AU Optronics B156HTN03.8 TN panel is common on many budget and mid-range 15.6-inch notebooks including the HP 250 G5 SP, Acer Aspire E5-574, and the TravelMate P257-M.
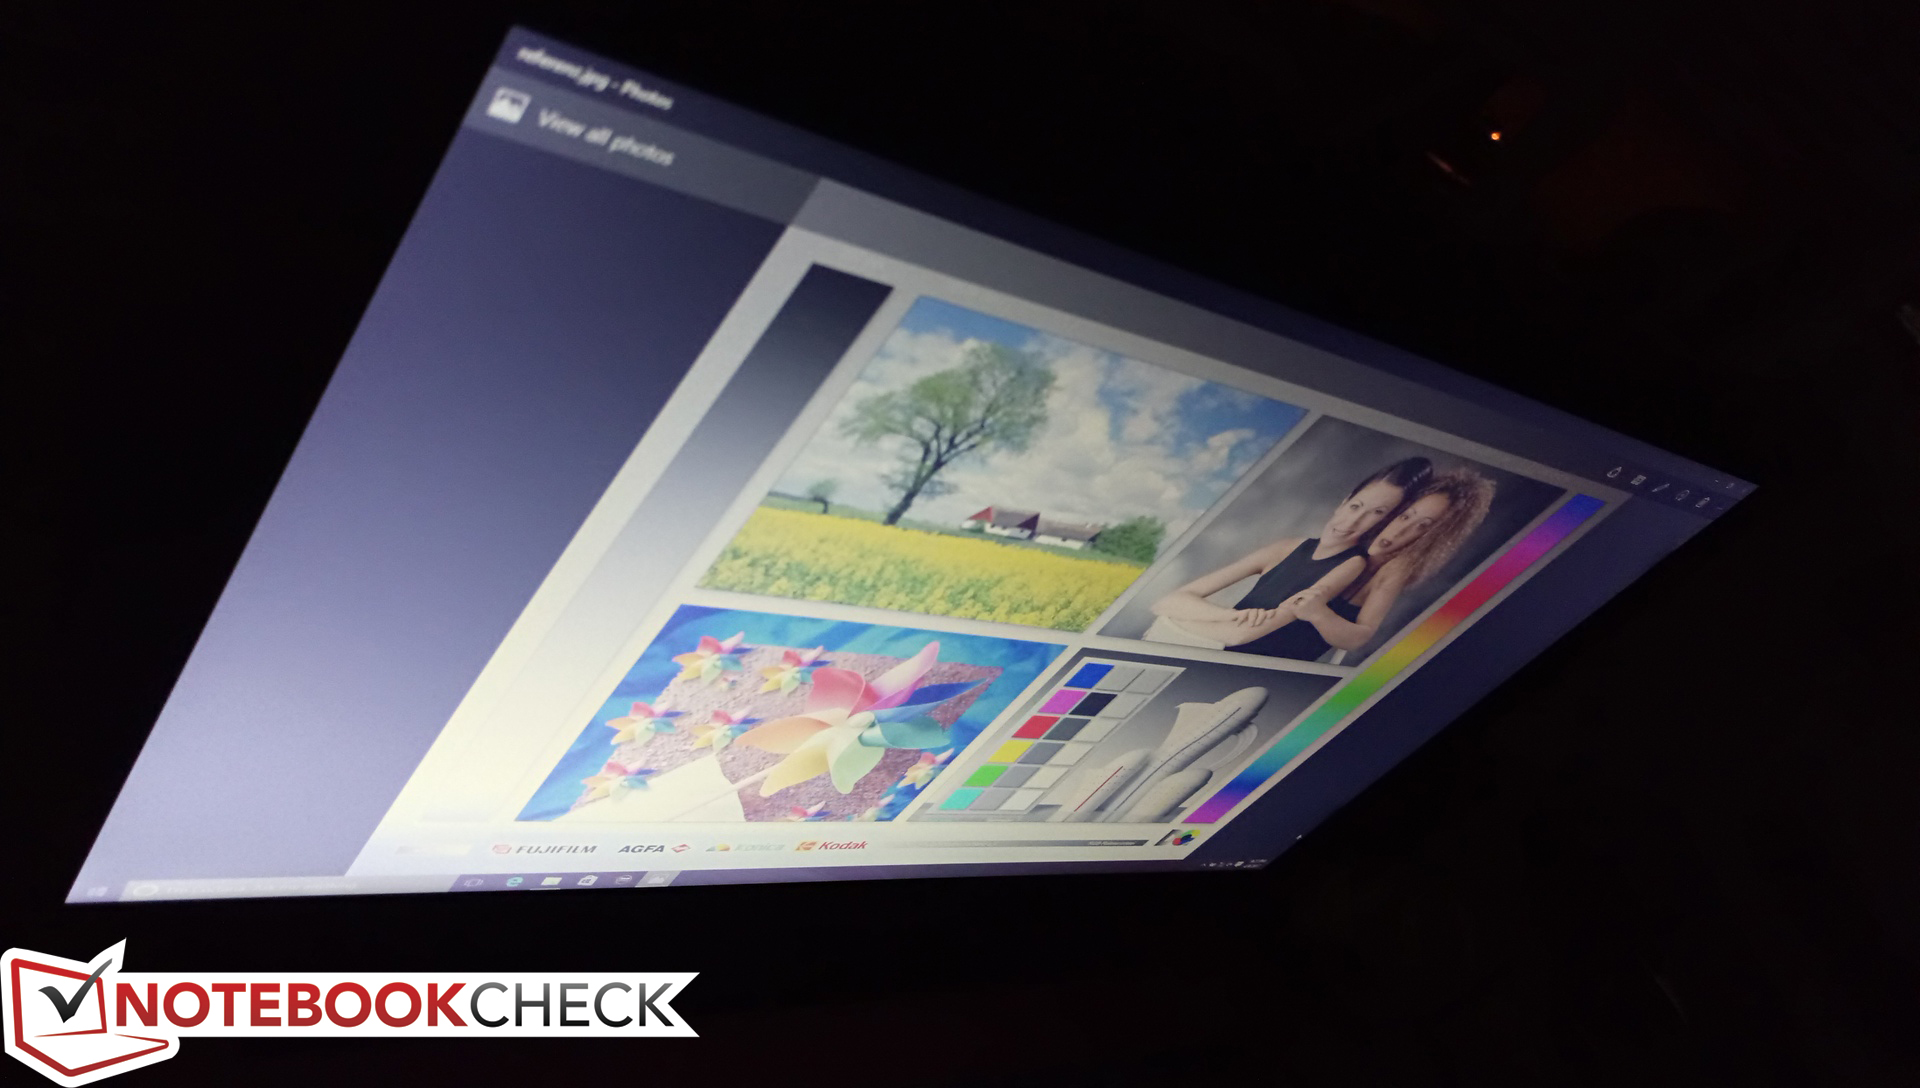
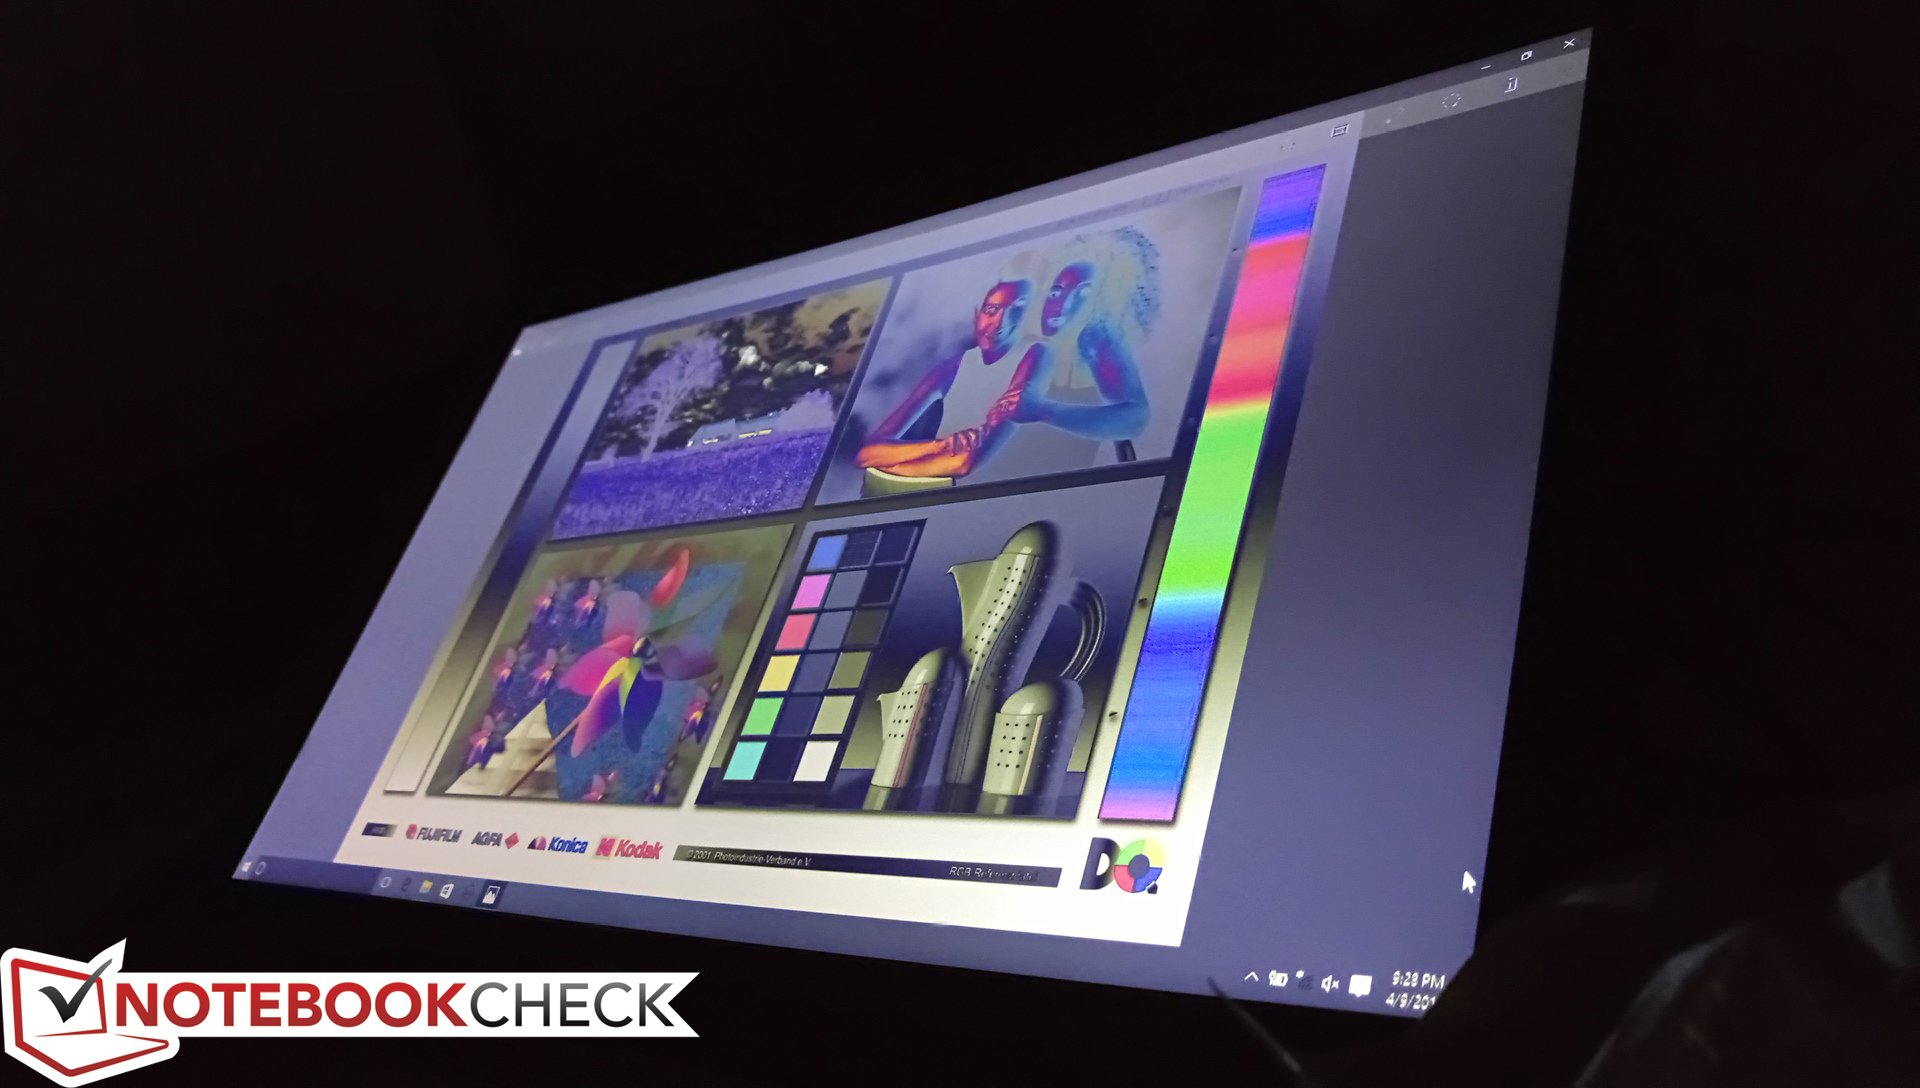
Subjectively, colors are muted and not nearly as vivid as the displays of most Ultrabooks. Contrast is still very weak and the backlight is sufficient only for indoor use. The low contrast and narrow color gamut make for an overall below average experience even if texts and images appear sharp resolution-wise.
| |||||||||||||||||||||||||
Brightness Distribution: 88 %
Center on Battery: 242.7 cd/m²
Contrast: 467:1 (Black: 0.52 cd/m²)
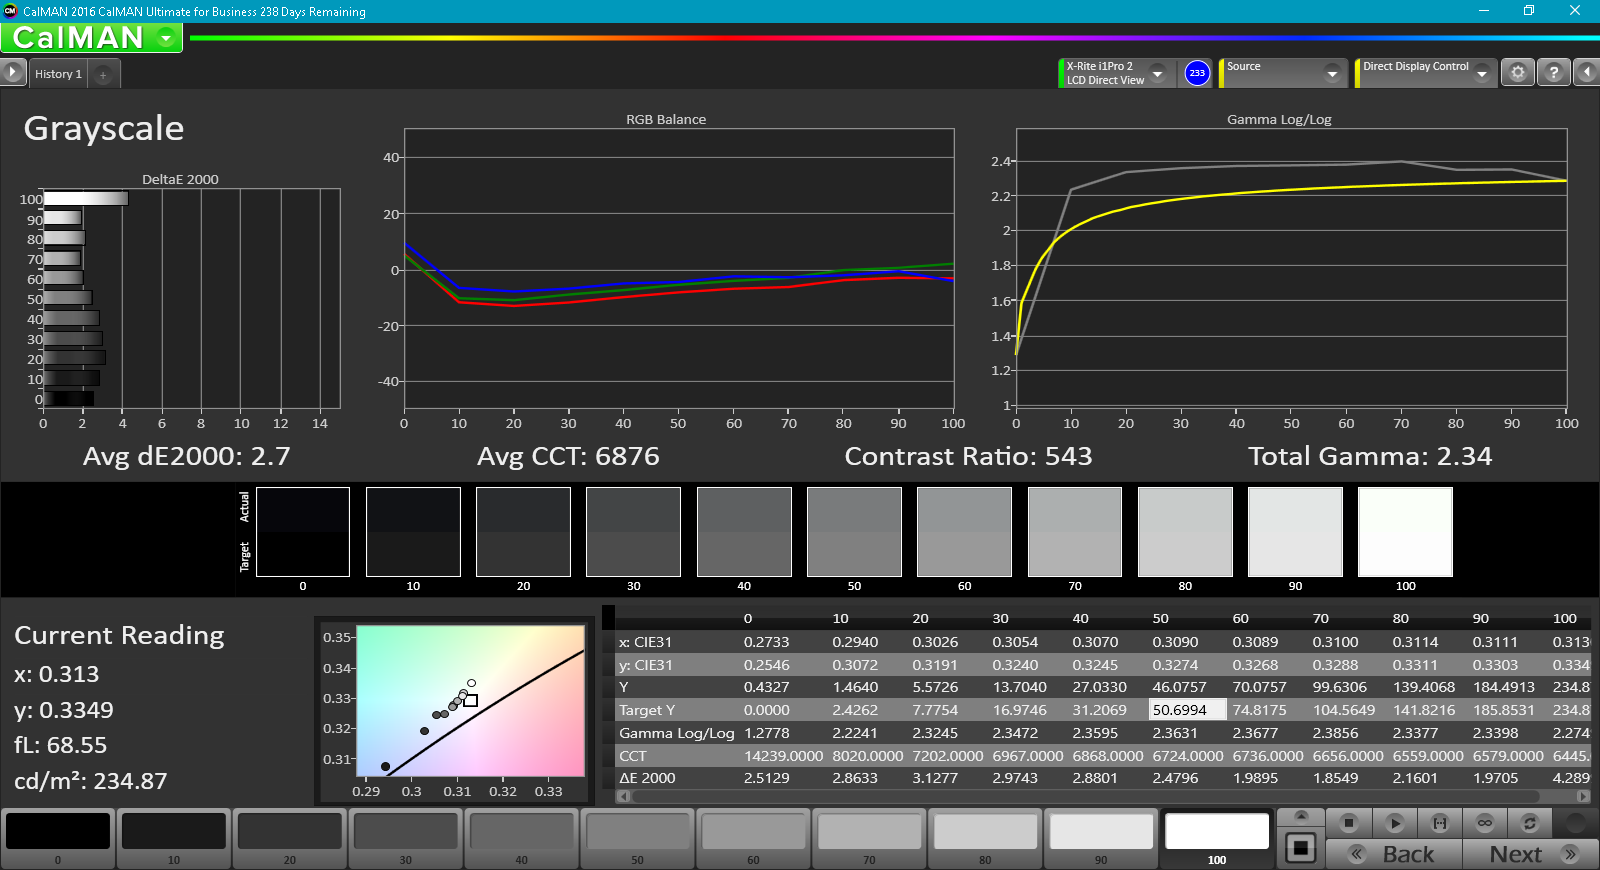
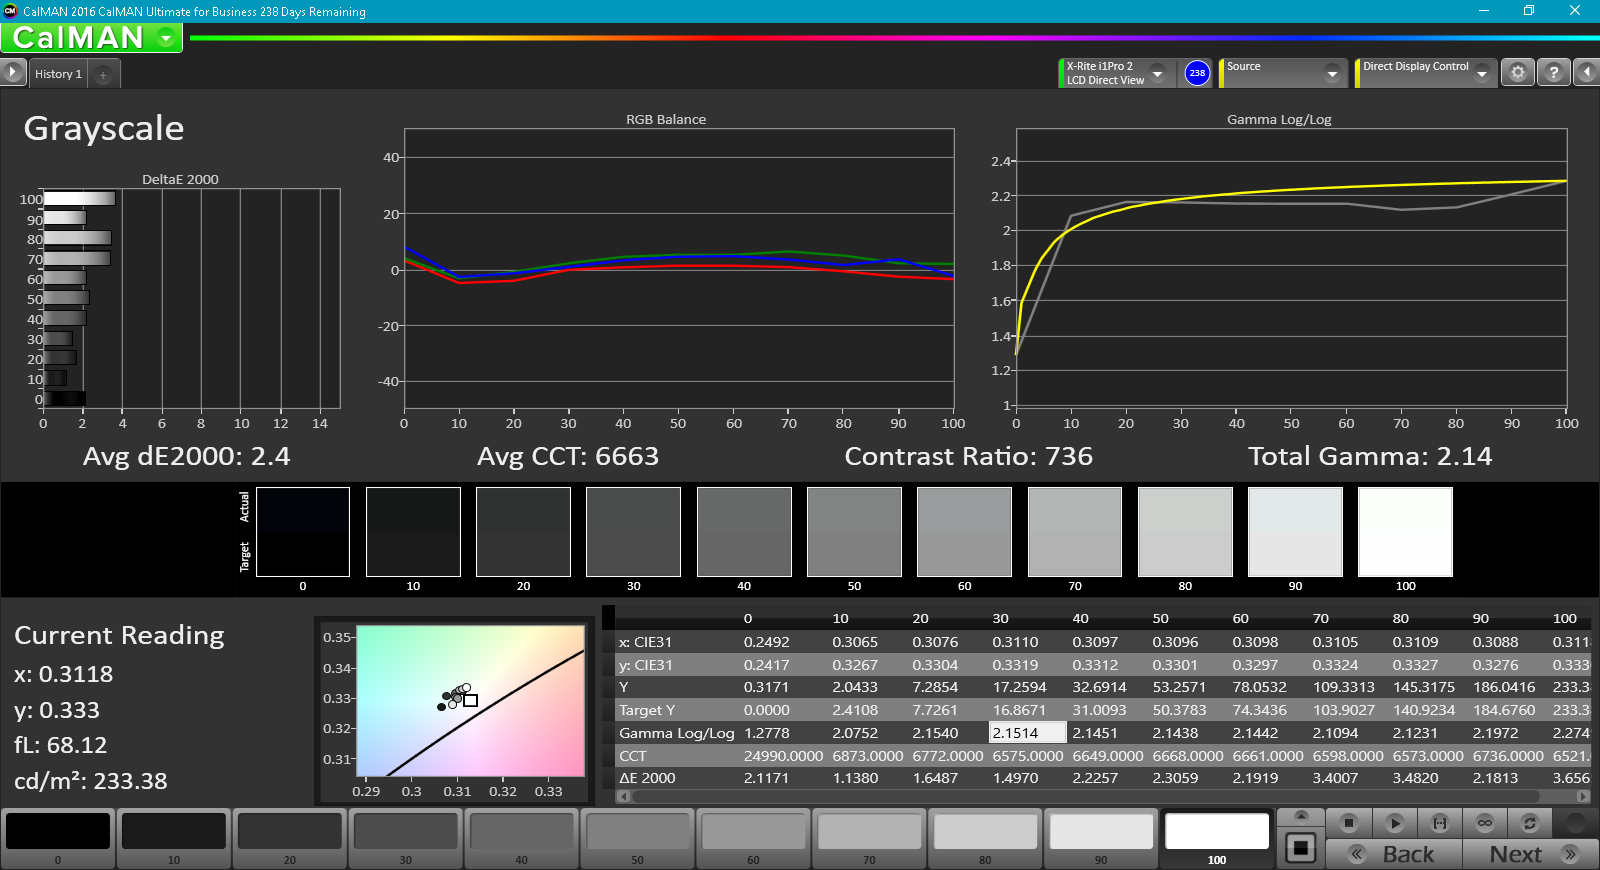
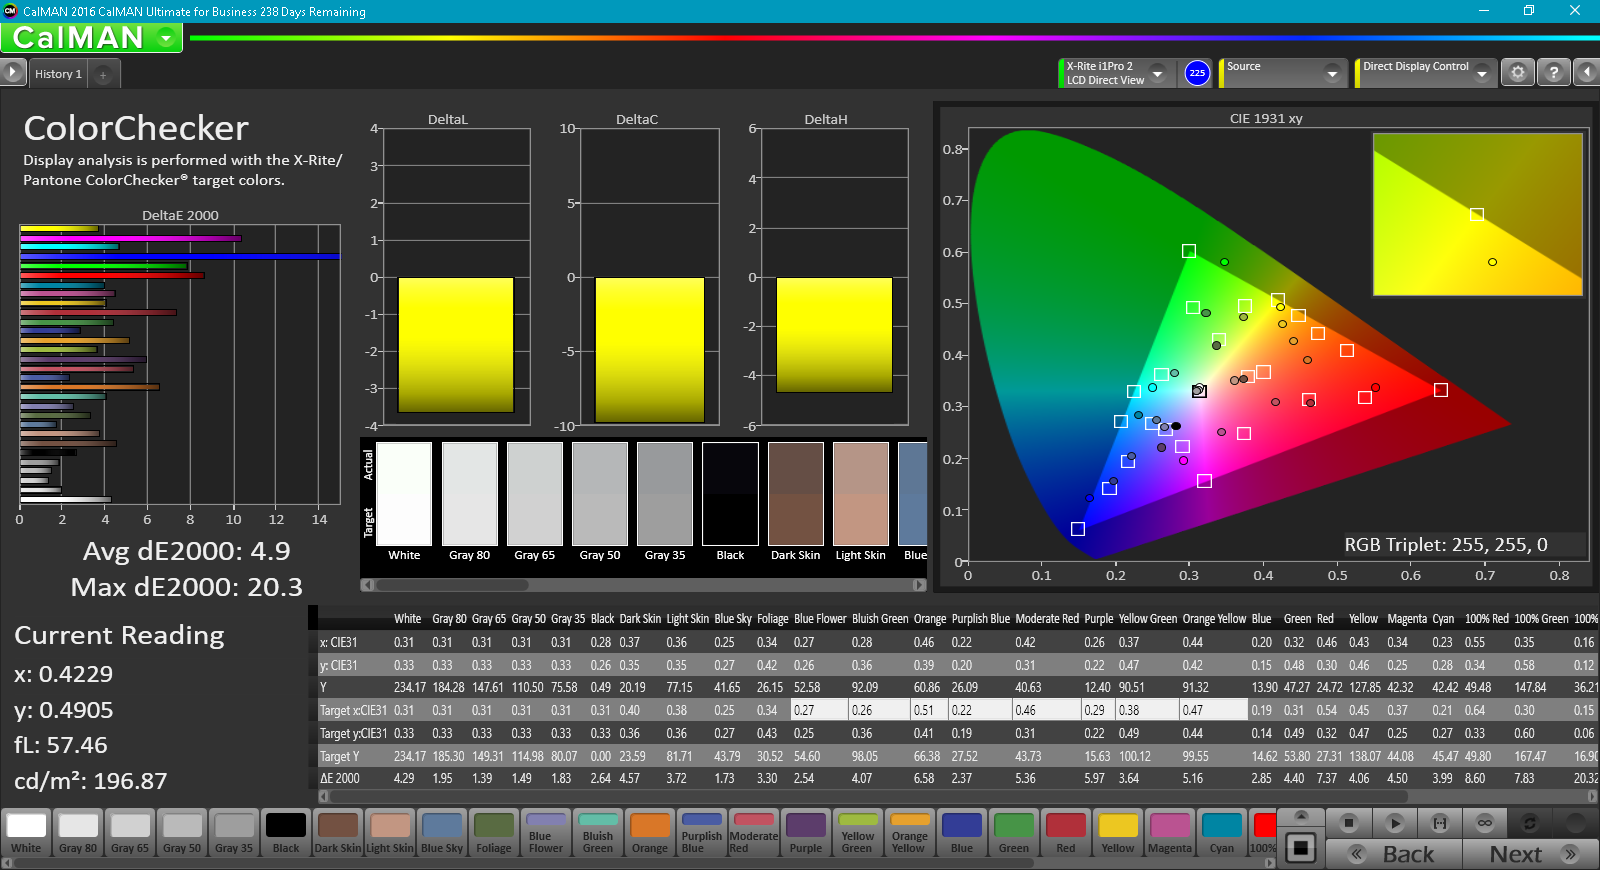
ΔE ColorChecker Calman: 4.9 | ∀{0.5-29.43 Ø4.71}
ΔE Greyscale Calman: 2.7 | ∀{0.09-98 Ø4.96}
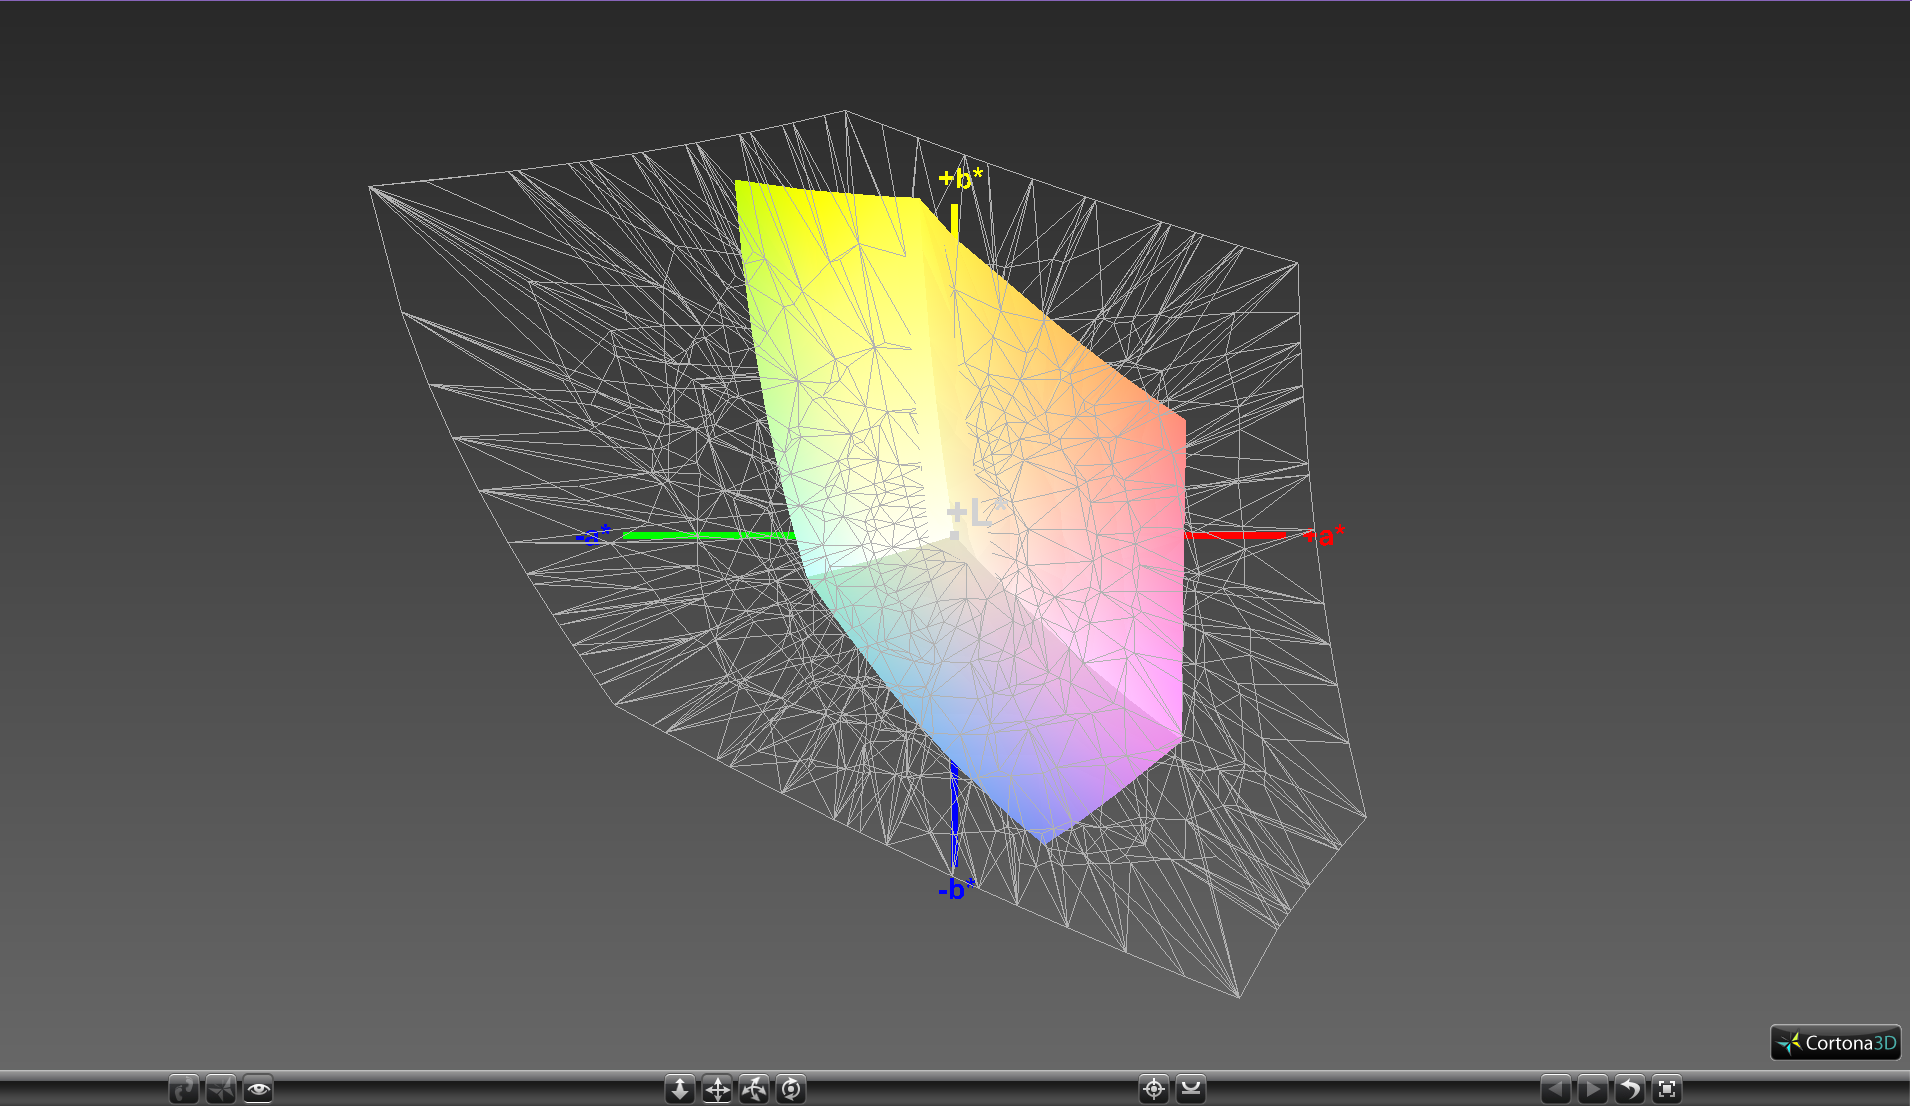
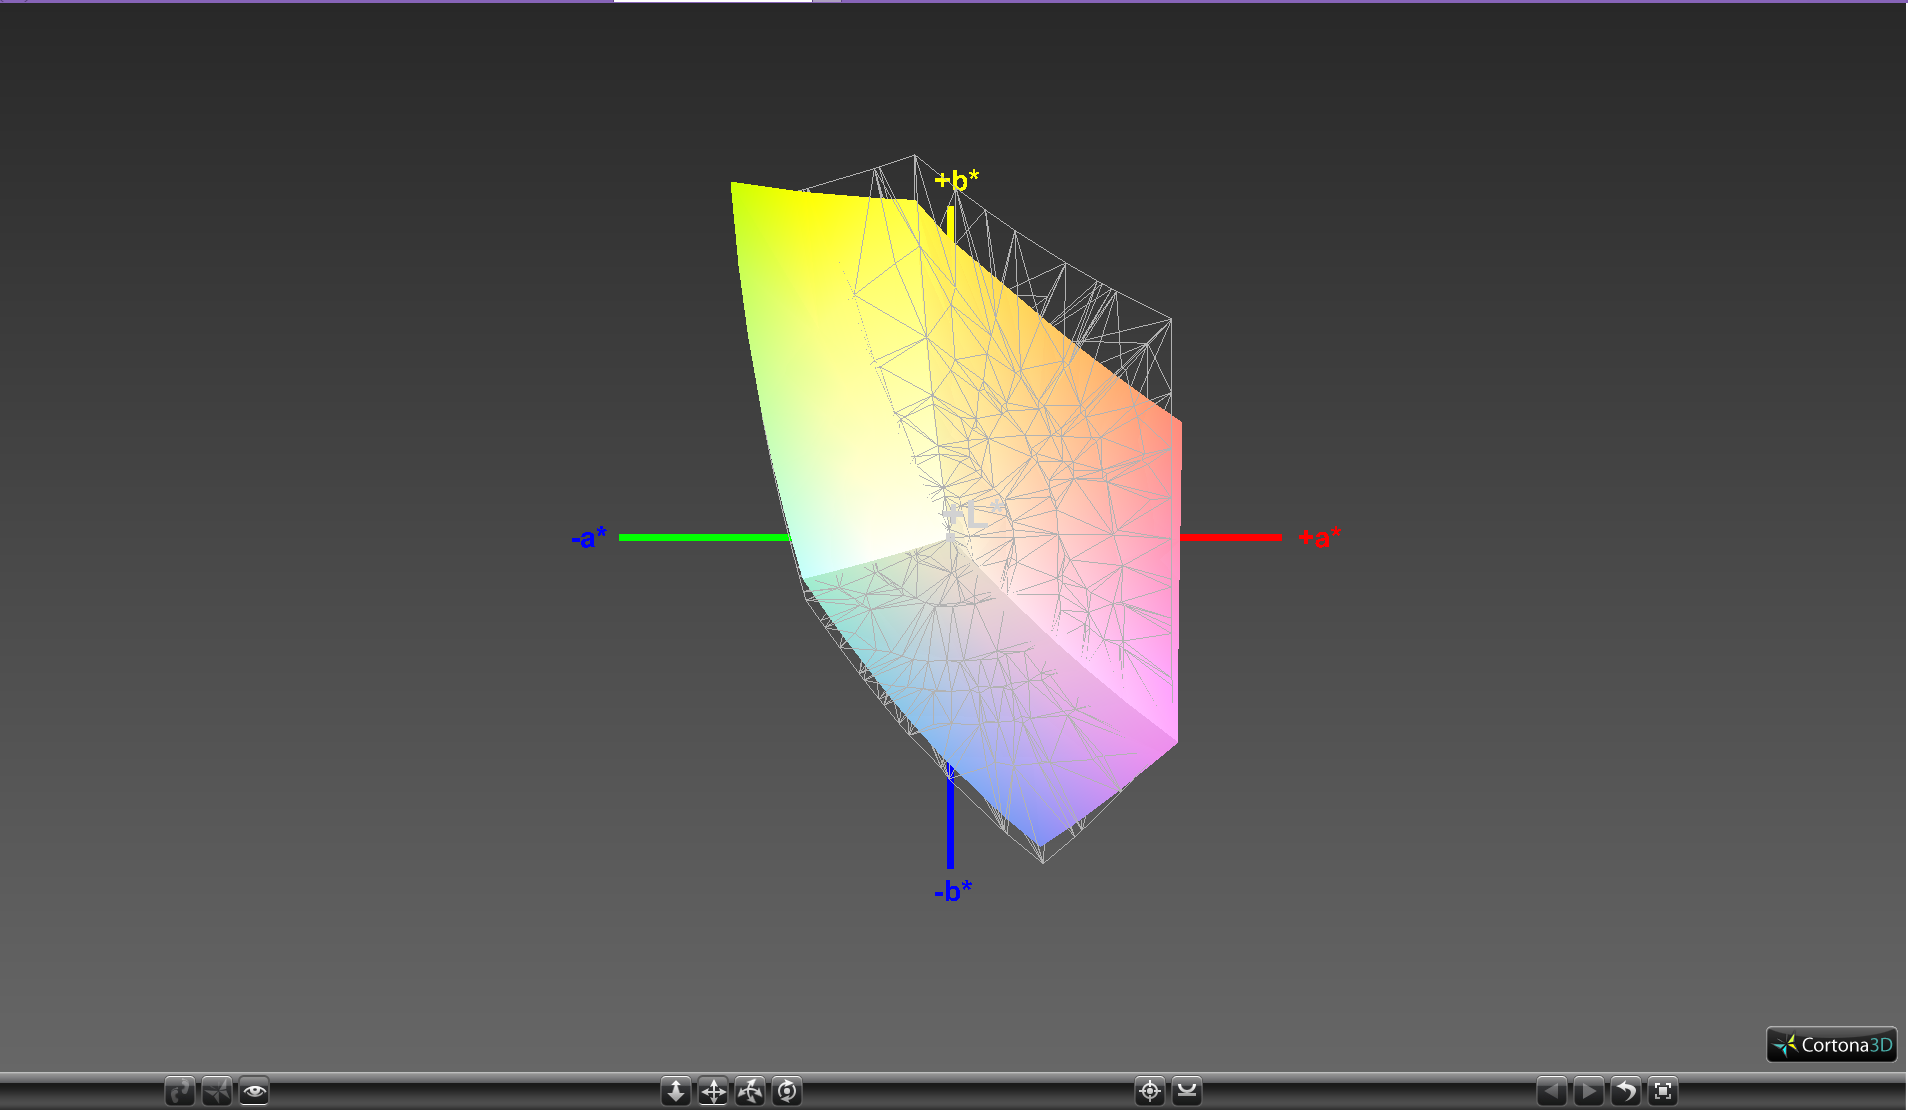
52.5% sRGB (Argyll 1.6.3 3D)
33.5% AdobeRGB 1998 (Argyll 1.6.3 3D)
36.29% AdobeRGB 1998 (Argyll 3D)
52.7% sRGB (Argyll 3D)
35.12% Display P3 (Argyll 3D)
Gamma: 2.34
CCT: 6876 K
| Asus X555DA-BB11 TN LED, 15.6", 1920x1080 | Toshiba Satellite Pro R50-C-16V Toshiba, TN LED, 15.6", 1366x768 | Lenovo Ideapad 110-15ACL 80TJ00H0GE BOE NT156WHM-N32, TN LED, 15.6", 1366x768 | HP Pavilion 15t-X7P42AV AU Optronics AUO41ED, IPS, 15.6", 1920x1080 | Asus X555LN-XO112H AU Optronics B156XW04 V6, TN LED, 15.6", 1366x768 | |
|---|---|---|---|---|---|
| Display | 16% | 6% | 8% | 41% | |
| Display P3 Coverage (%) | 35.12 | 40.6 16% | 37.39 6% | 38.03 8% | 49.95 42% |
| sRGB Coverage (%) | 52.7 | 61.2 16% | 56.2 7% | 56.5 7% | 73.9 40% |
| AdobeRGB 1998 Coverage (%) | 36.29 | 41.95 16% | 38.63 6% | 39.29 8% | 51.7 42% |
| Response Times | -39% | -21% | -14% | ||
| Response Time Grey 50% / Grey 80% * (ms) | 42 ? | 68 ? -62% | 58 -38% | 44.4 ? -6% | |
| Response Time Black / White * (ms) | 22.4 ? | 26 ? -16% | 23 -3% | 27.2 ? -21% | |
| PWM Frequency (Hz) | 217 ? | 200 ? | |||
| Screen | -40% | -32% | -7% | -86% | |
| Brightness middle (cd/m²) | 242.7 | 226 -7% | 253 4% | 209.7 -14% | 189 -22% |
| Brightness (cd/m²) | 232 | 217 -6% | 246 6% | 193 -17% | 184 -21% |
| Brightness Distribution (%) | 88 | 91 3% | 86 -2% | 75 -15% | 92 5% |
| Black Level * (cd/m²) | 0.52 | 0.58 -12% | 0.44 15% | 0.19 63% | 2.2 -323% |
| Contrast (:1) | 467 | 390 -16% | 575 23% | 1104 136% | 86 -82% |
| Colorchecker dE 2000 * | 4.9 | 9.84 -101% | 9.2 -88% | 7.8 -59% | 7.77 -59% |
| Colorchecker dE 2000 max. * | 20.3 | 16.77 17% | 17.68 13% | 24.1 -19% | |
| Greyscale dE 2000 * | 2.7 | 11.1 -311% | 11.05 -309% | 7.3 -170% | 8.82 -227% |
| Gamma | 2.34 94% | 2.35 94% | 2.55 86% | 2.39 92% | 2.43 91% |
| CCT | 6876 95% | 11979 54% | 11451 57% | 5771 113% | 9275 70% |
| Color Space (Percent of AdobeRGB 1998) (%) | 33.5 | 39 16% | 36 7% | 39.3 17% | 48 43% |
| Color Space (Percent of sRGB) (%) | 52.5 | 61 16% | 56 7% | 56.5 8% | |
| Total Average (Program / Settings) | -21% /
-29% | -16% /
-23% | -4% /
-5% | -23% /
-51% |
* ... smaller is better
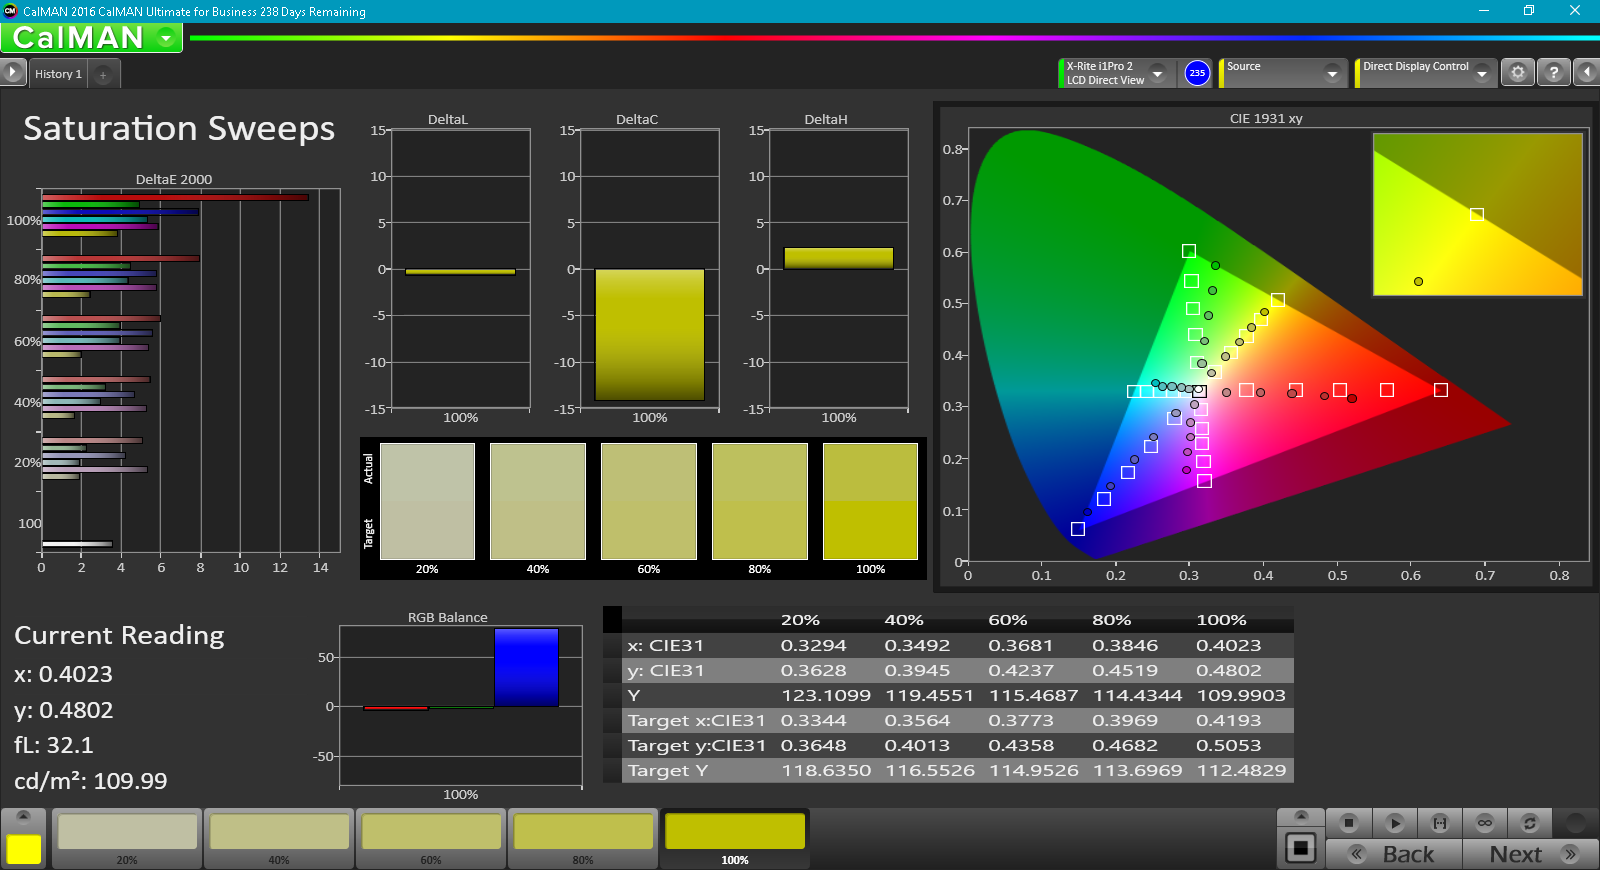
The crux of the X555DA panel is its very limited color space. At just over half of the sRGB standard, colors have very little depth and saturation. Even subjectively, images and video playback look quite poor with muddy grays and bland colors.
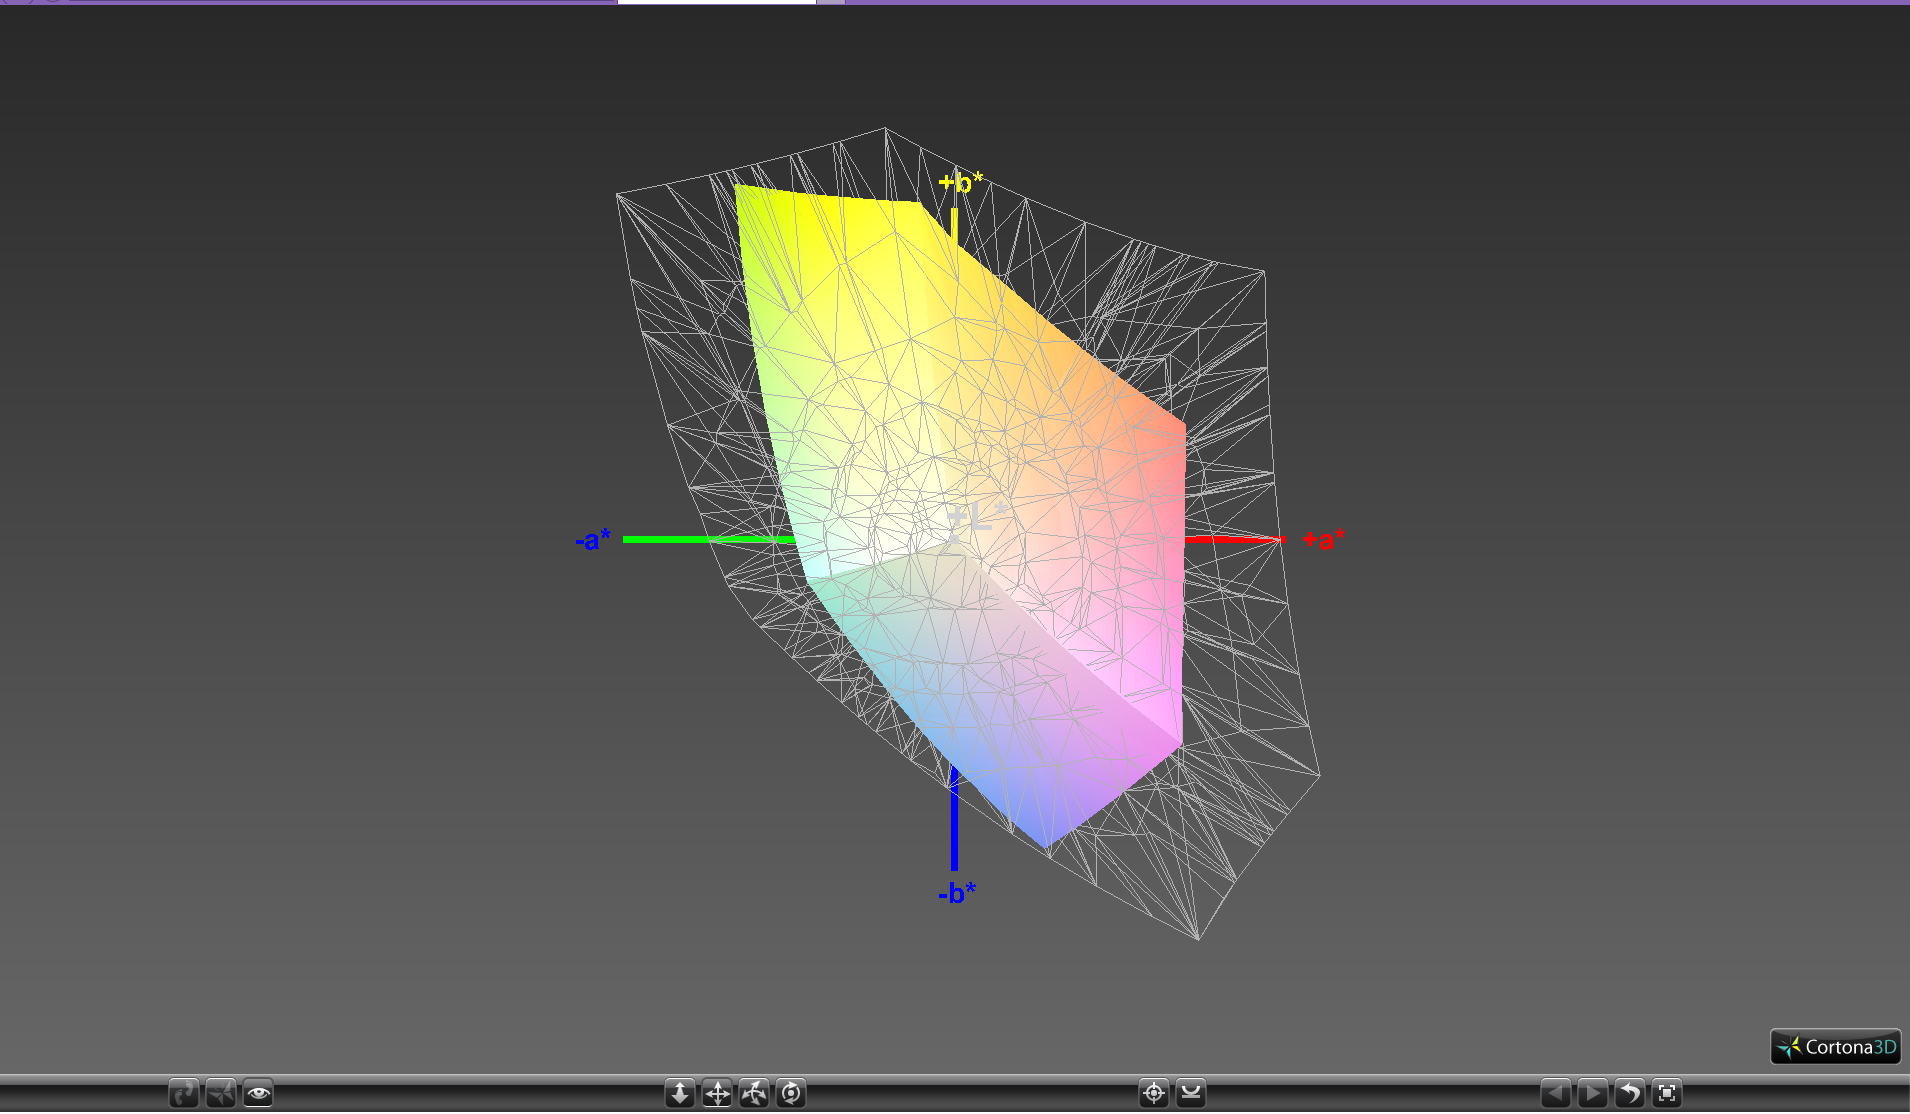
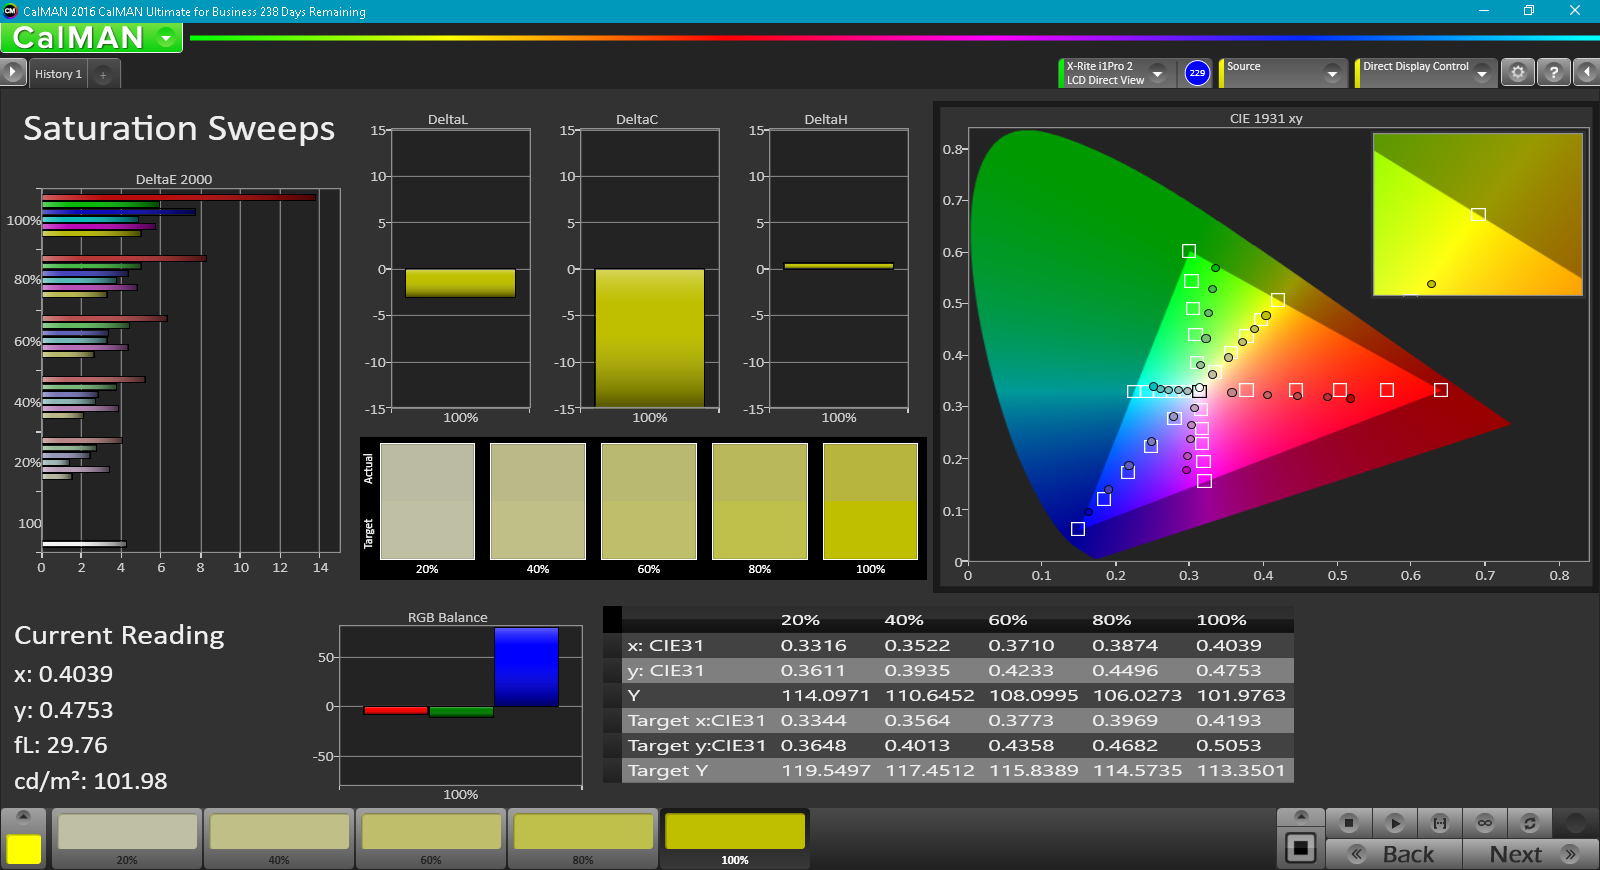
Further measurements with a X-Rite spectrophotometer reveal generally accurate colors and grayscale out of the box - a rarity amongst inexpensive notebooks. A calibration improves the display just marginally as shown by our results below. Regardless, colors still become more inaccurate the higher the saturation level due to the narrow sRGB gamut of the panel. Blue and Red in particular are extremely inaccurate with the latter being far too light and almost dark Pink or Maroon.

Display Response Times
| ↔ Response Time Black to White | ||
|---|---|---|
| 22.4 ms ... rise ↗ and fall ↘ combined | ↗ 14.4 ms rise | 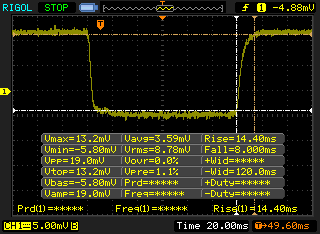 |
| ↘ 8 ms fall | ||
| The screen shows good response rates in our tests, but may be too slow for competitive gamers. In comparison, all tested devices range from 0.1 (minimum) to 240 (maximum) ms. » 51 % of all devices are better. This means that the measured response time is worse than the average of all tested devices (19.8 ms). | ||
| ↔ Response Time 50% Grey to 80% Grey | ||
| 42 ms ... rise ↗ and fall ↘ combined | ↗ 23.6 ms rise | 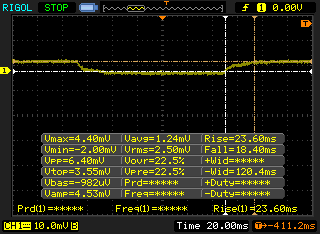 |
| ↘ 18.4 ms fall | ||
| The screen shows slow response rates in our tests and will be unsatisfactory for gamers. In comparison, all tested devices range from 0.165 (minimum) to 636 (maximum) ms. » 67 % of all devices are better. This means that the measured response time is worse than the average of all tested devices (30.9 ms). | ||
Screen Flickering / PWM (Pulse-Width Modulation)
| Screen flickering / PWM not detected | 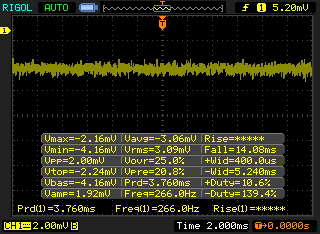 | ||
In comparison: 52 % of all tested devices do not use PWM to dim the display. If PWM was detected, an average of 7741 (minimum: 5 - maximum: 343500) Hz was measured. | |||
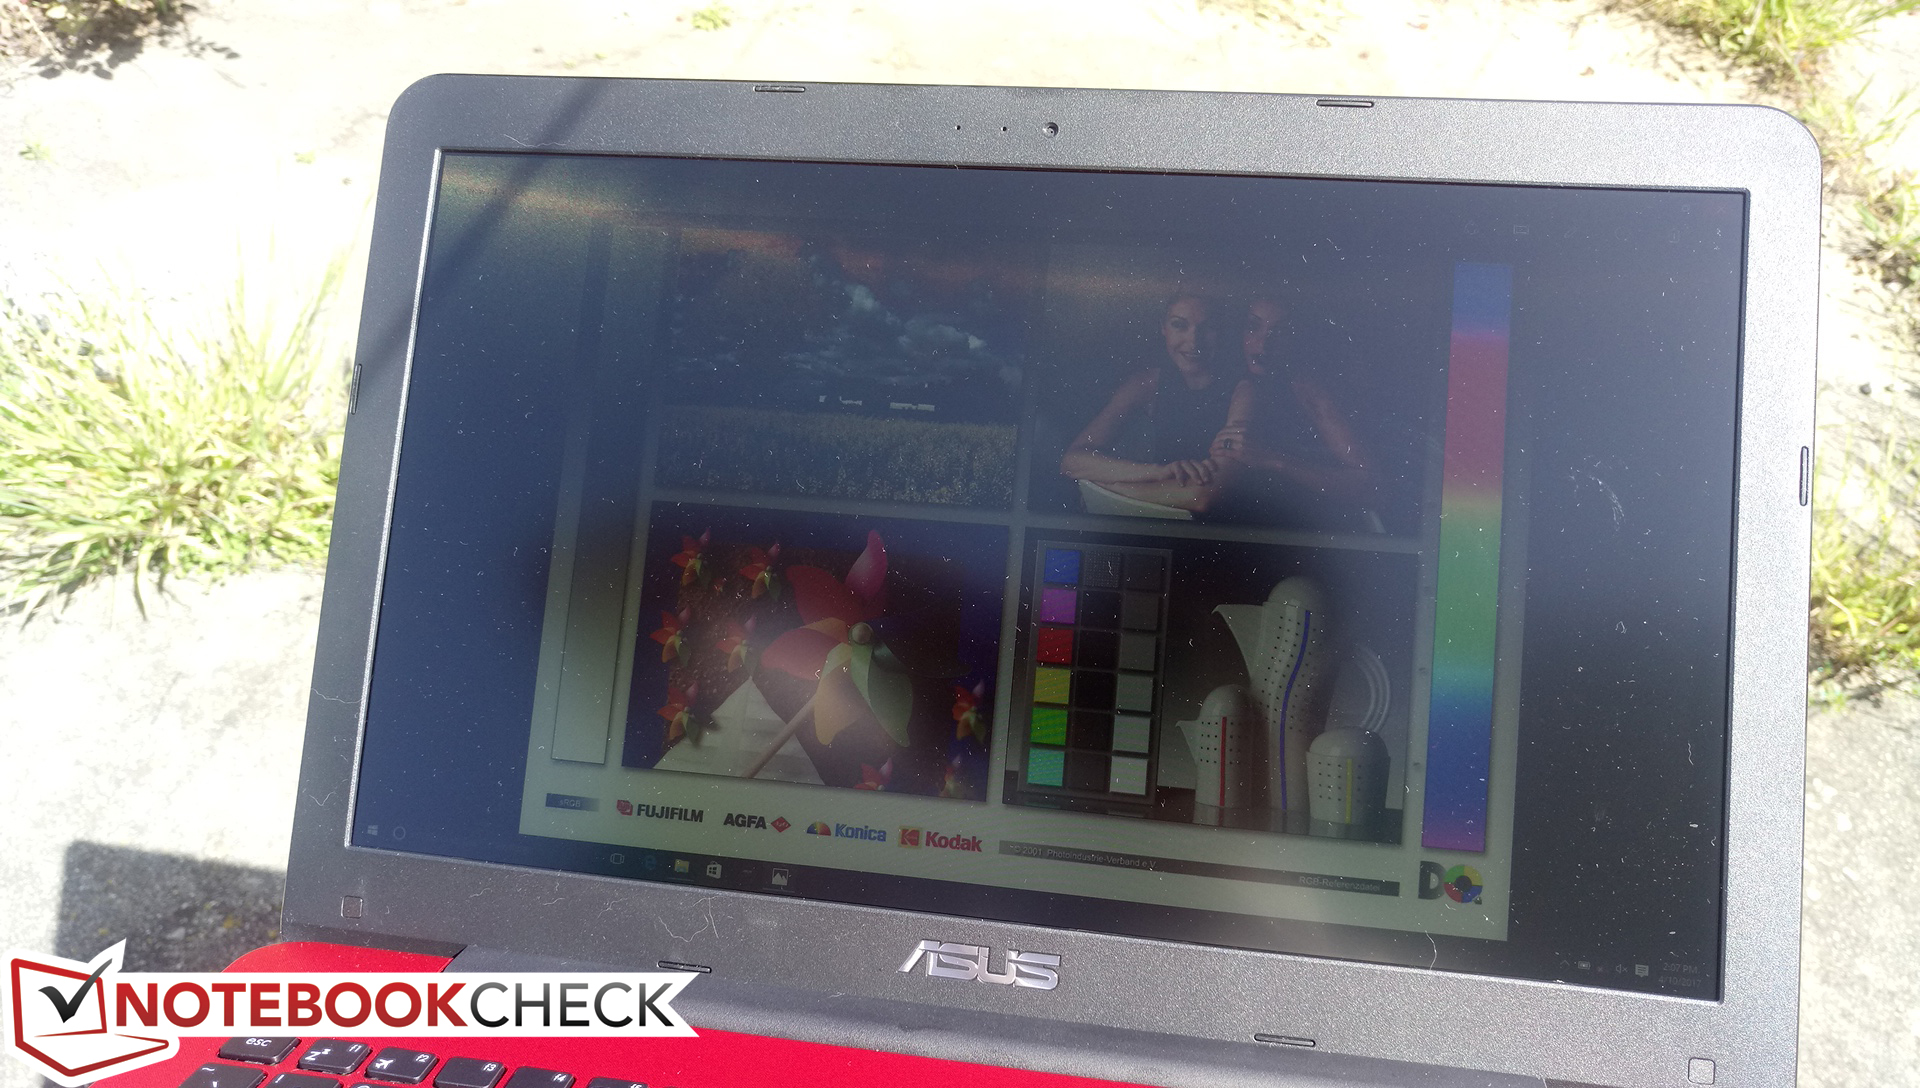
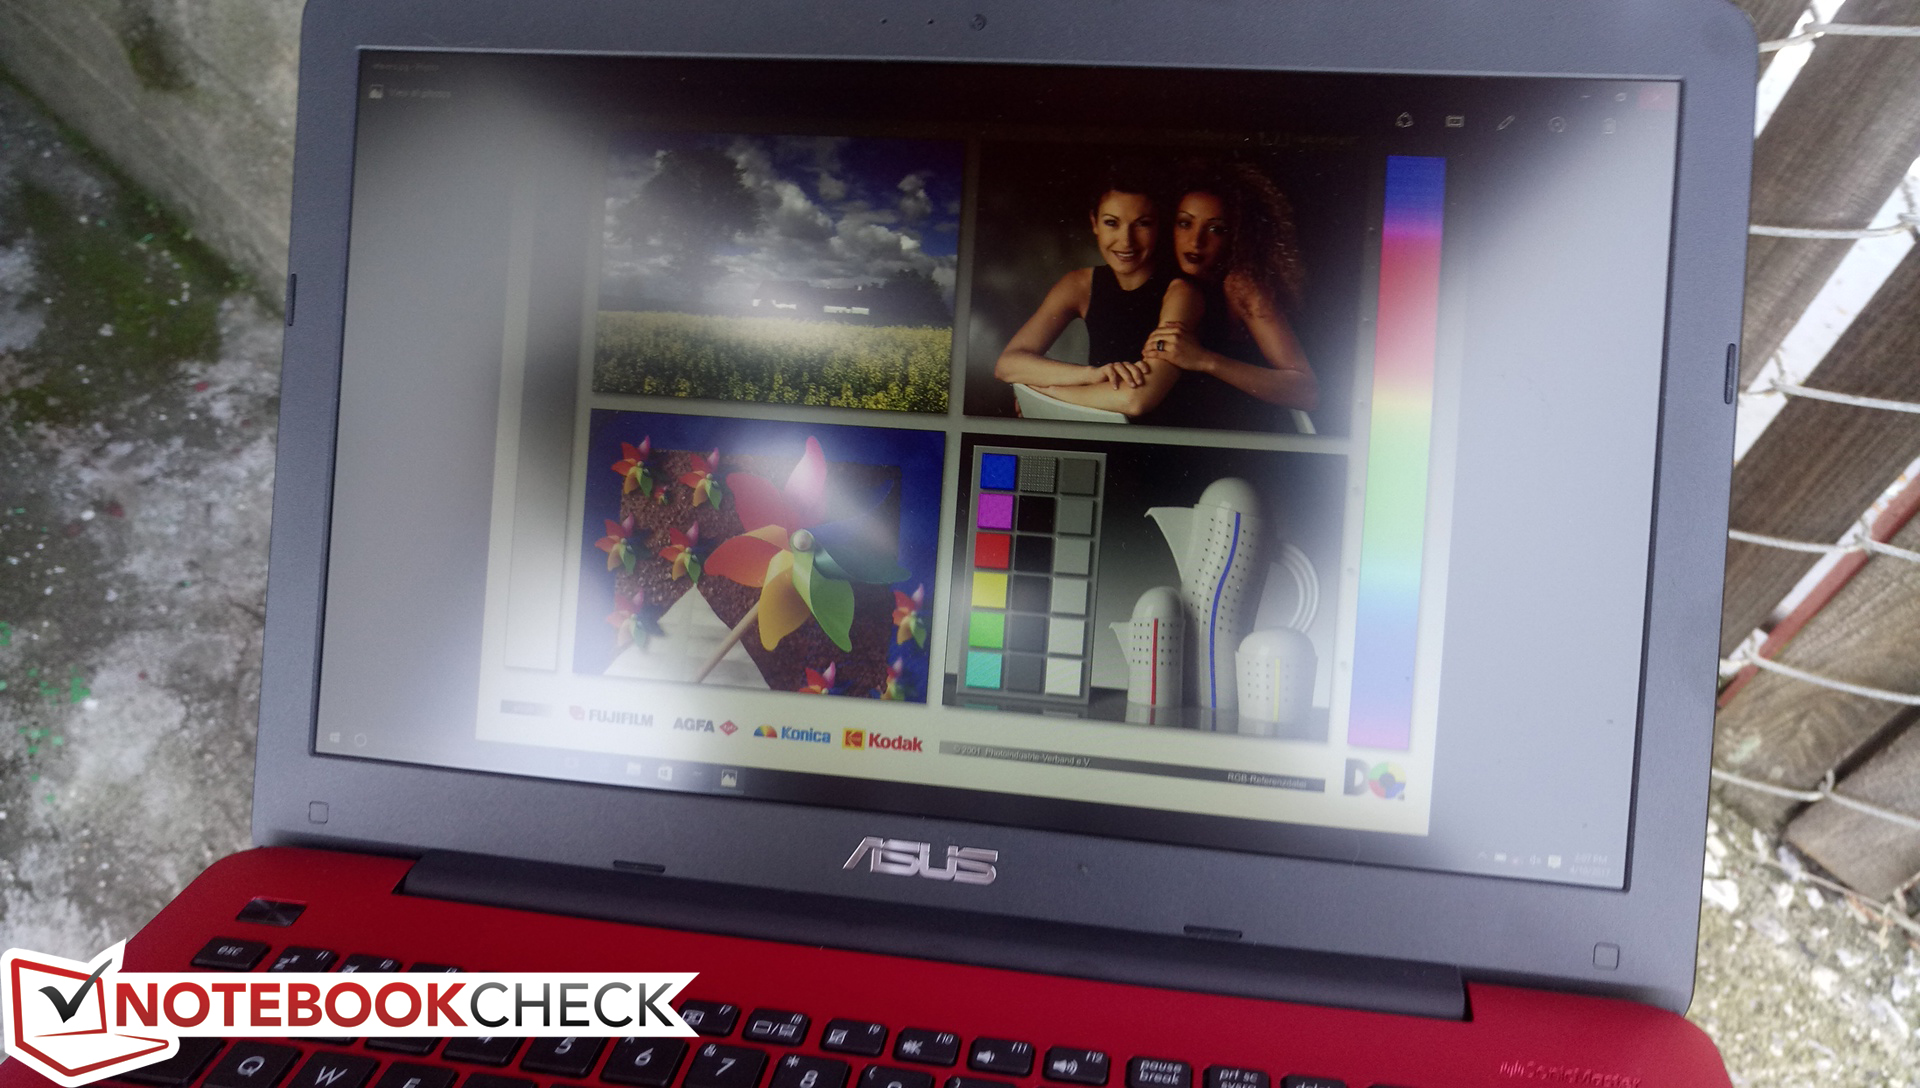
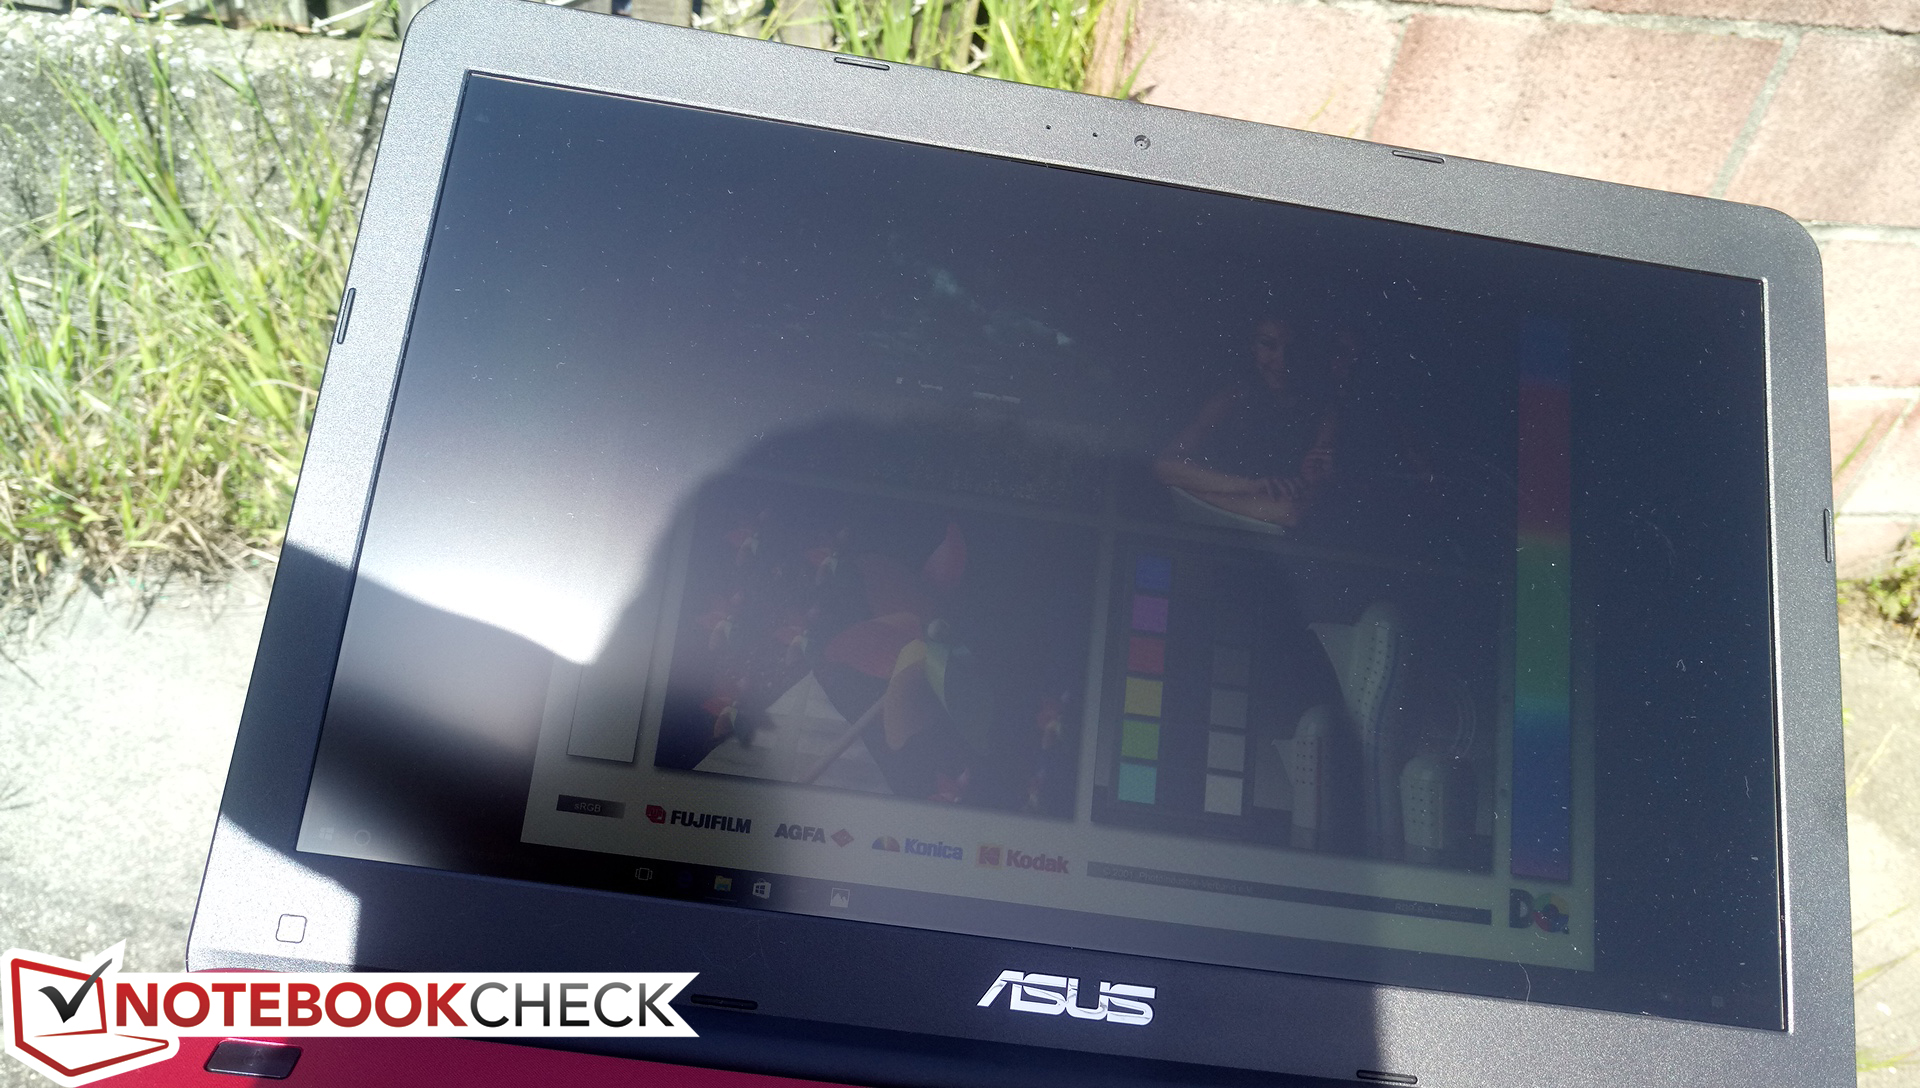
Outdoor visibility is subpar due to limited TN viewing angles and a relatively dim backlight. Colors become washed out even if under shade and with minimal glare. Nonetheless, these are all common characteristics of budget laptops.
Performance
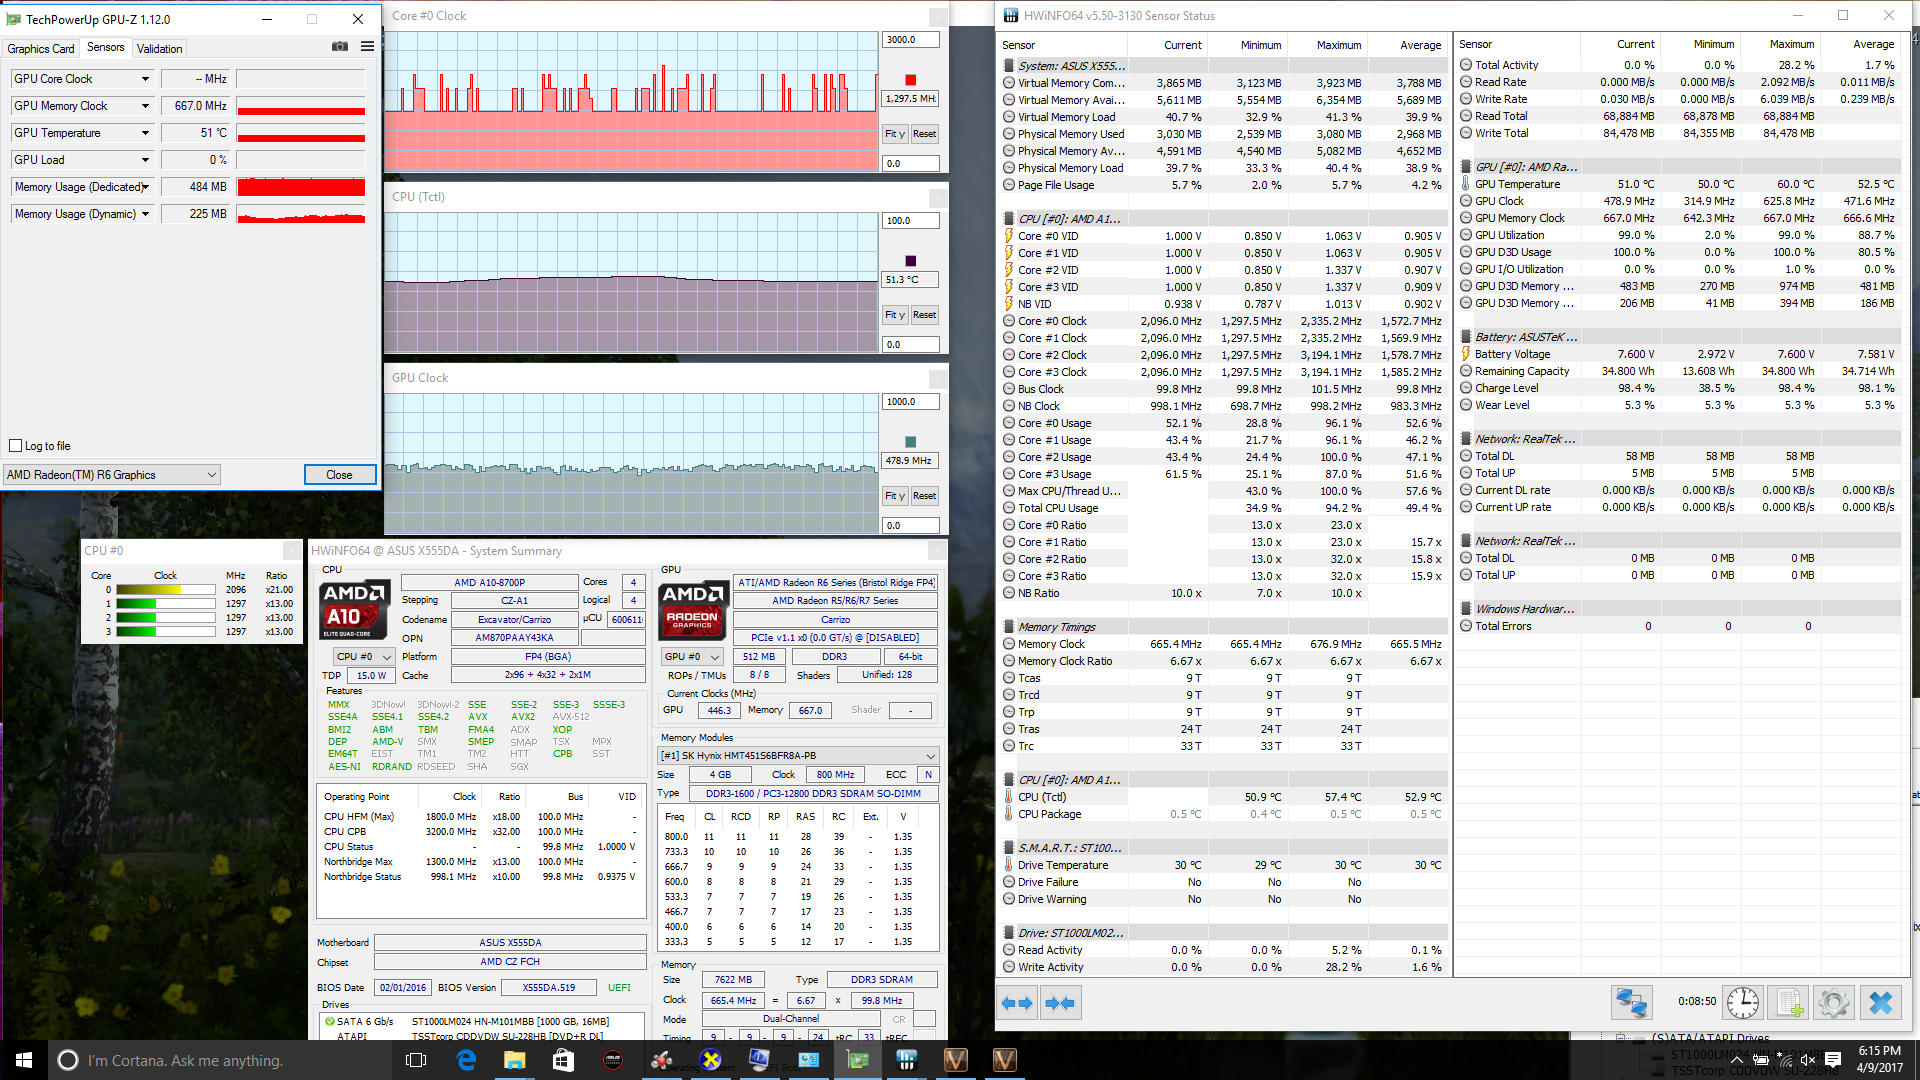
The Carrizo-based A10-8700P APU with integrated Radeon R6 graphics is AMD's mainstream solution for notebooks. Unfortunately, as the benchmarks below will show, "mainstream" in AMD terms is entry-level or slower when compared to the Intel ULV class of Core ix processors. The performance and heat disadvantages of the quad-core AMD APU can be partly attributed to its 28 nm silicon fabrication process compared to 22 nm or smaller on Intel CPUs.
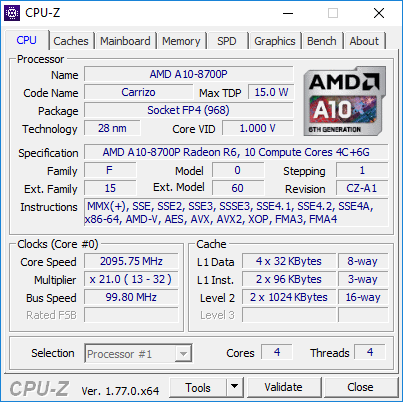

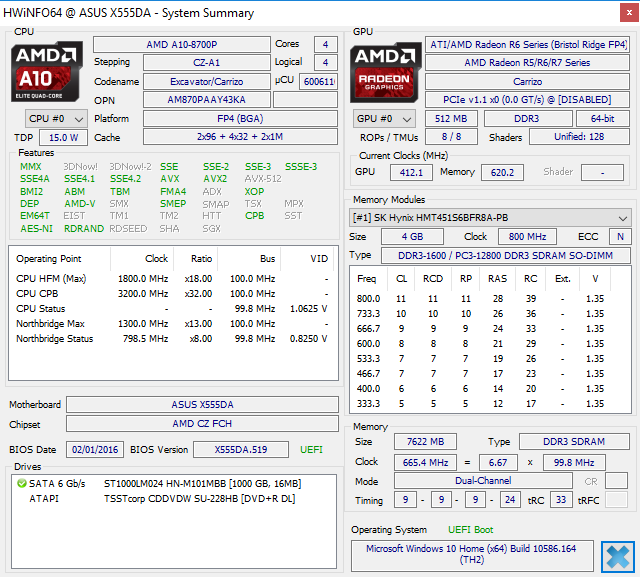

Processor
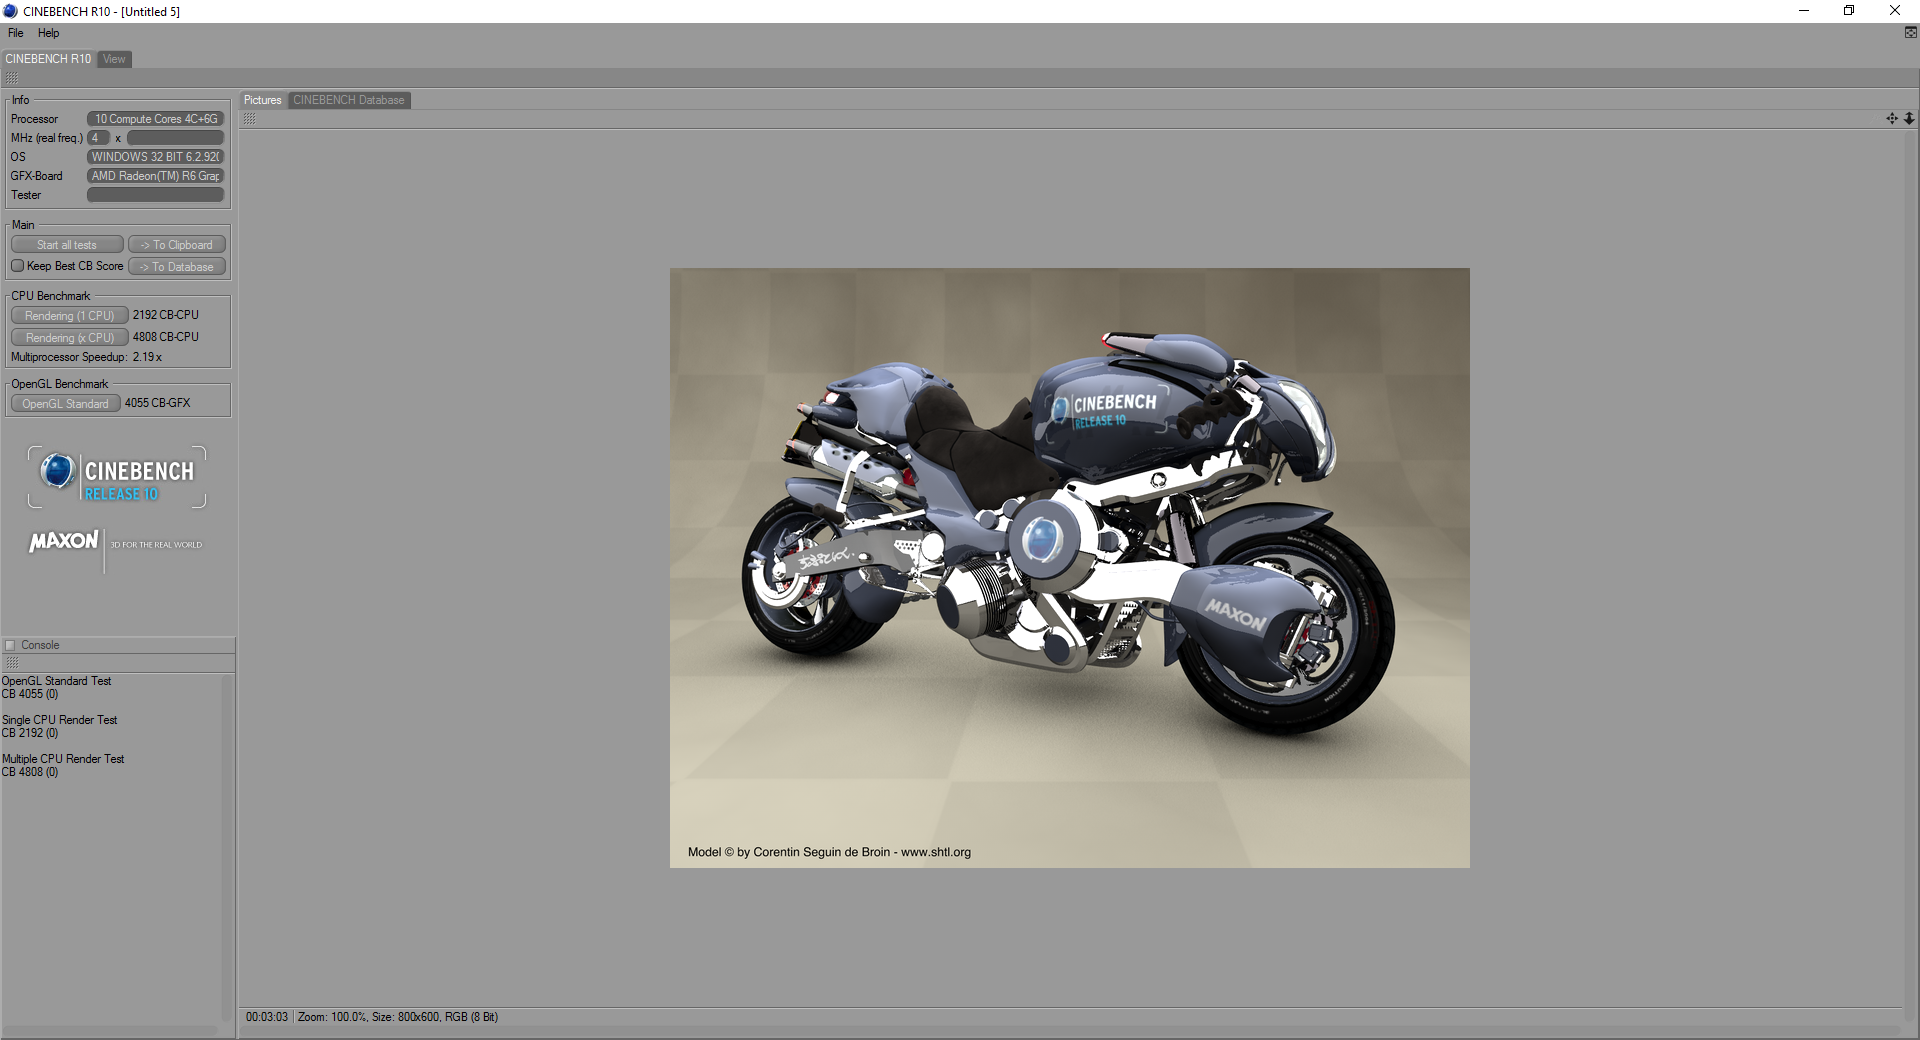
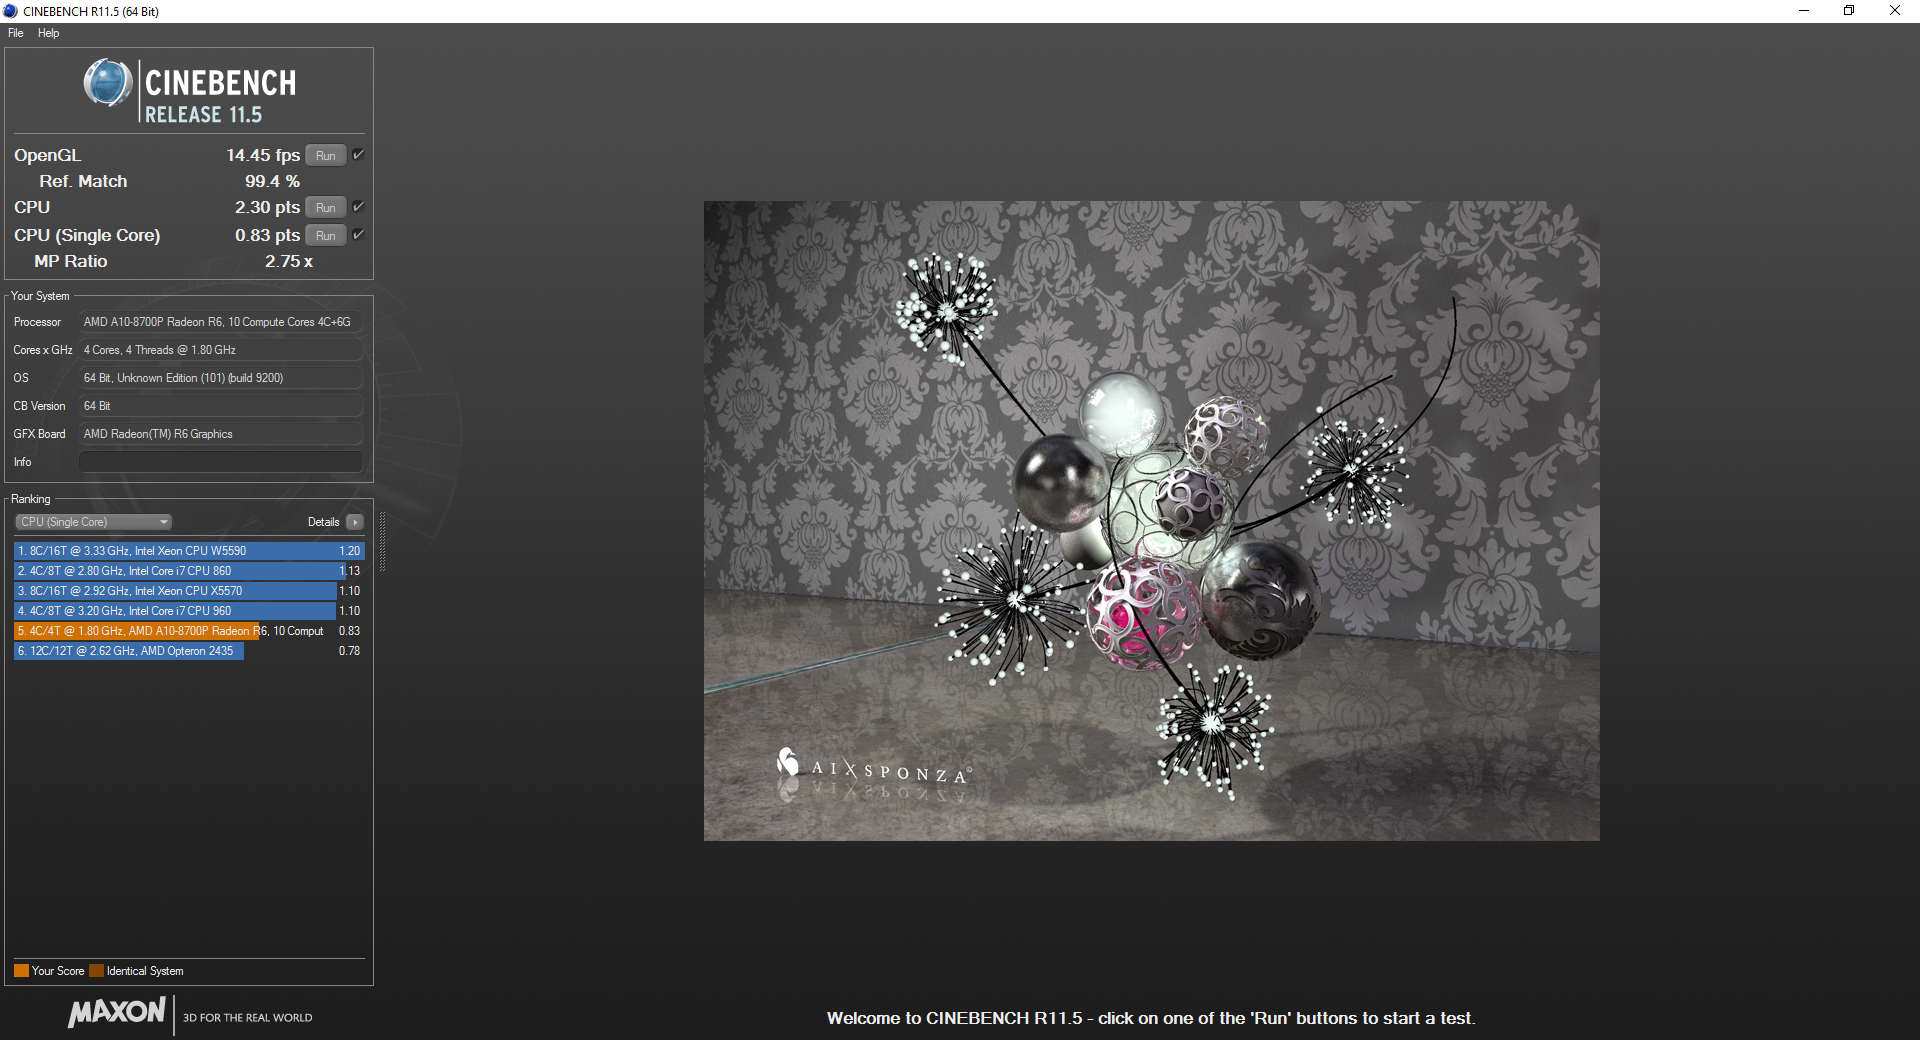
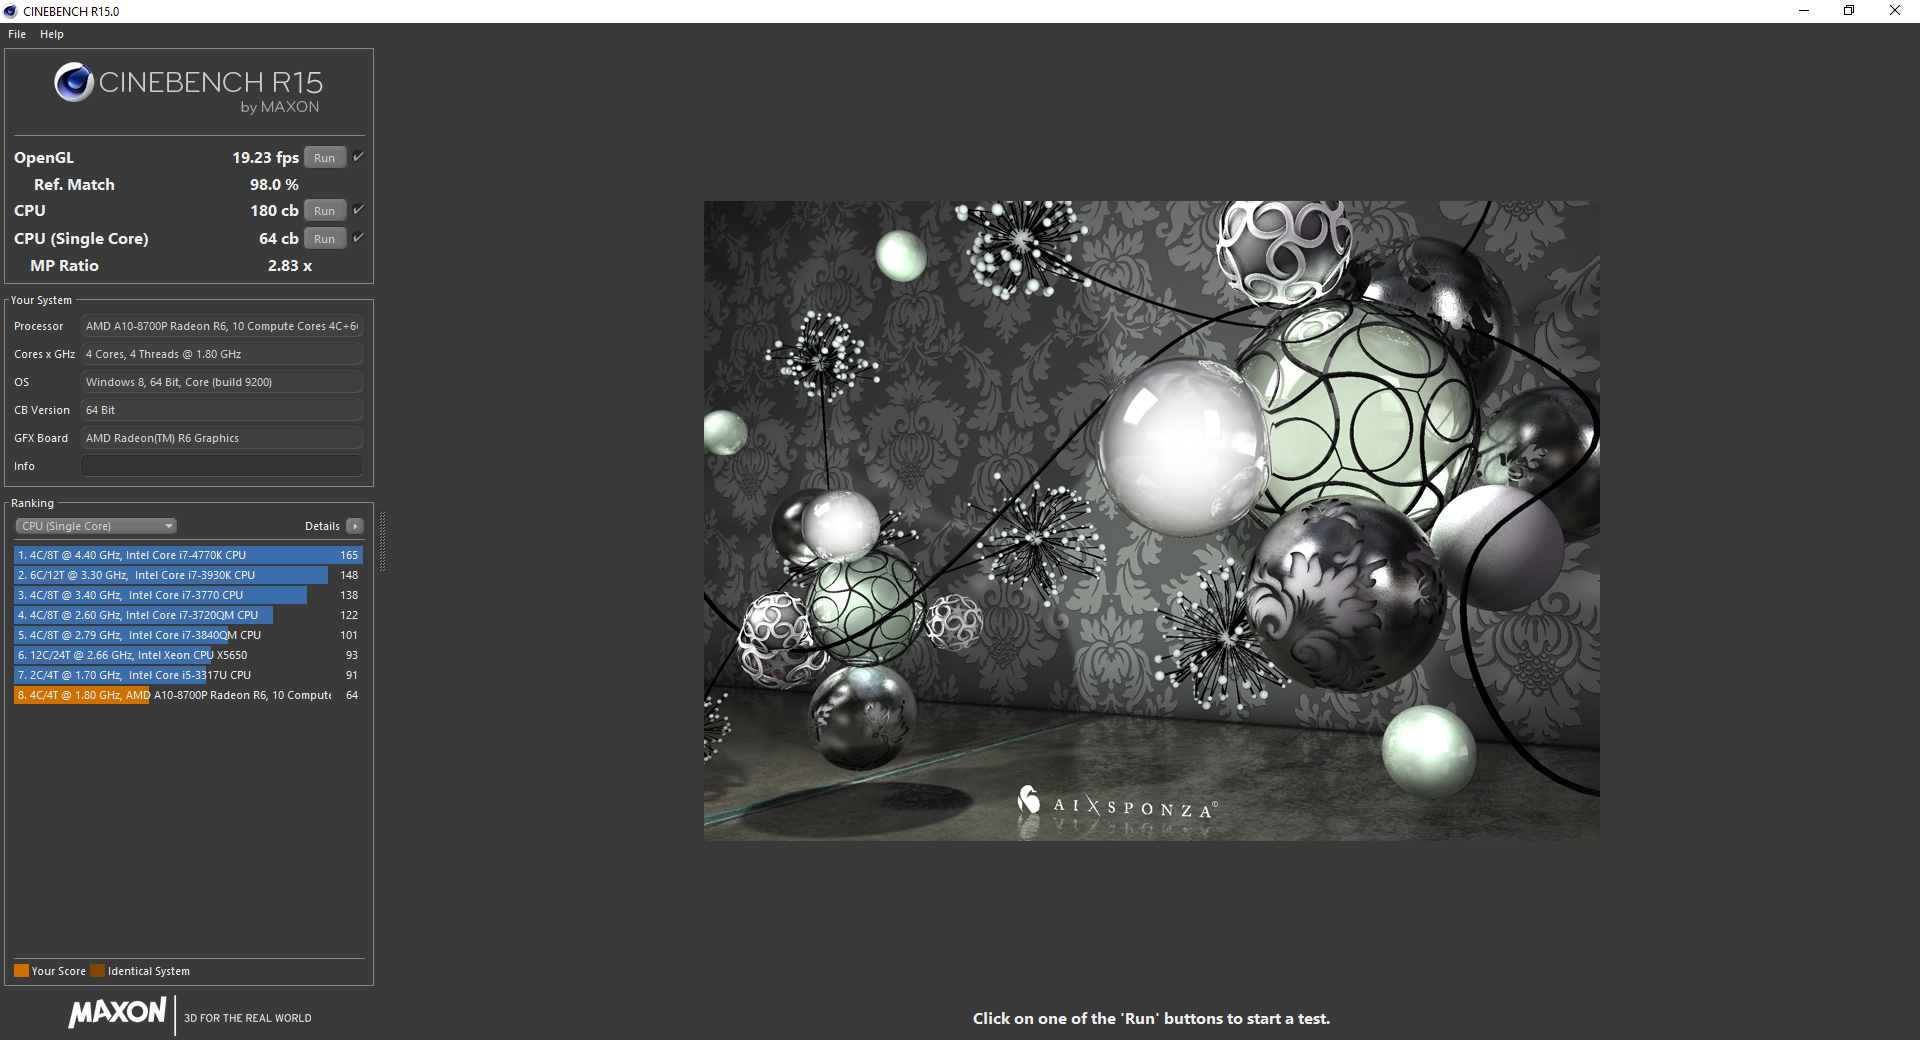
The A10-8700P occupies an awkward performance zone between the passively-cooled Intel Cherry Trail x5-Z8500 and the older Haswell i5-4200U. This makes the AMD processor very slow for general PC tasks but still at a level much higher than the Intel Atom. The entry-level Surface Pro 4 SKU with its Core m3-6Y30 CPU can still outperform our AMD APU in raw CPU tasks by as much as 15 to 40 percent according to CineBench benchmarks. This is made even more disappointing by the fact that the A10-8700P is a 12 W to 35 W cTDP APU compared to just 4.5 W for the Intel m3-6Y30.
To AMD's credit, the Asus system shows no signs of CPU performance throttling when running CineBench R15 Multi-Thread on a loop. The initial score of 180 points remains very steady after more than an hour of running the benchmark non-stop.
| wPrime 2.10 - 1024m | |
| Lenovo IdeaPad Z40-59422614 | |
| Microsoft Surface Pro 4, Core m3 | |
| Lenovo ThinkPad X1 Tablet | |
| Asus X555DA-BB11 | |
* ... smaller is better
System Performance
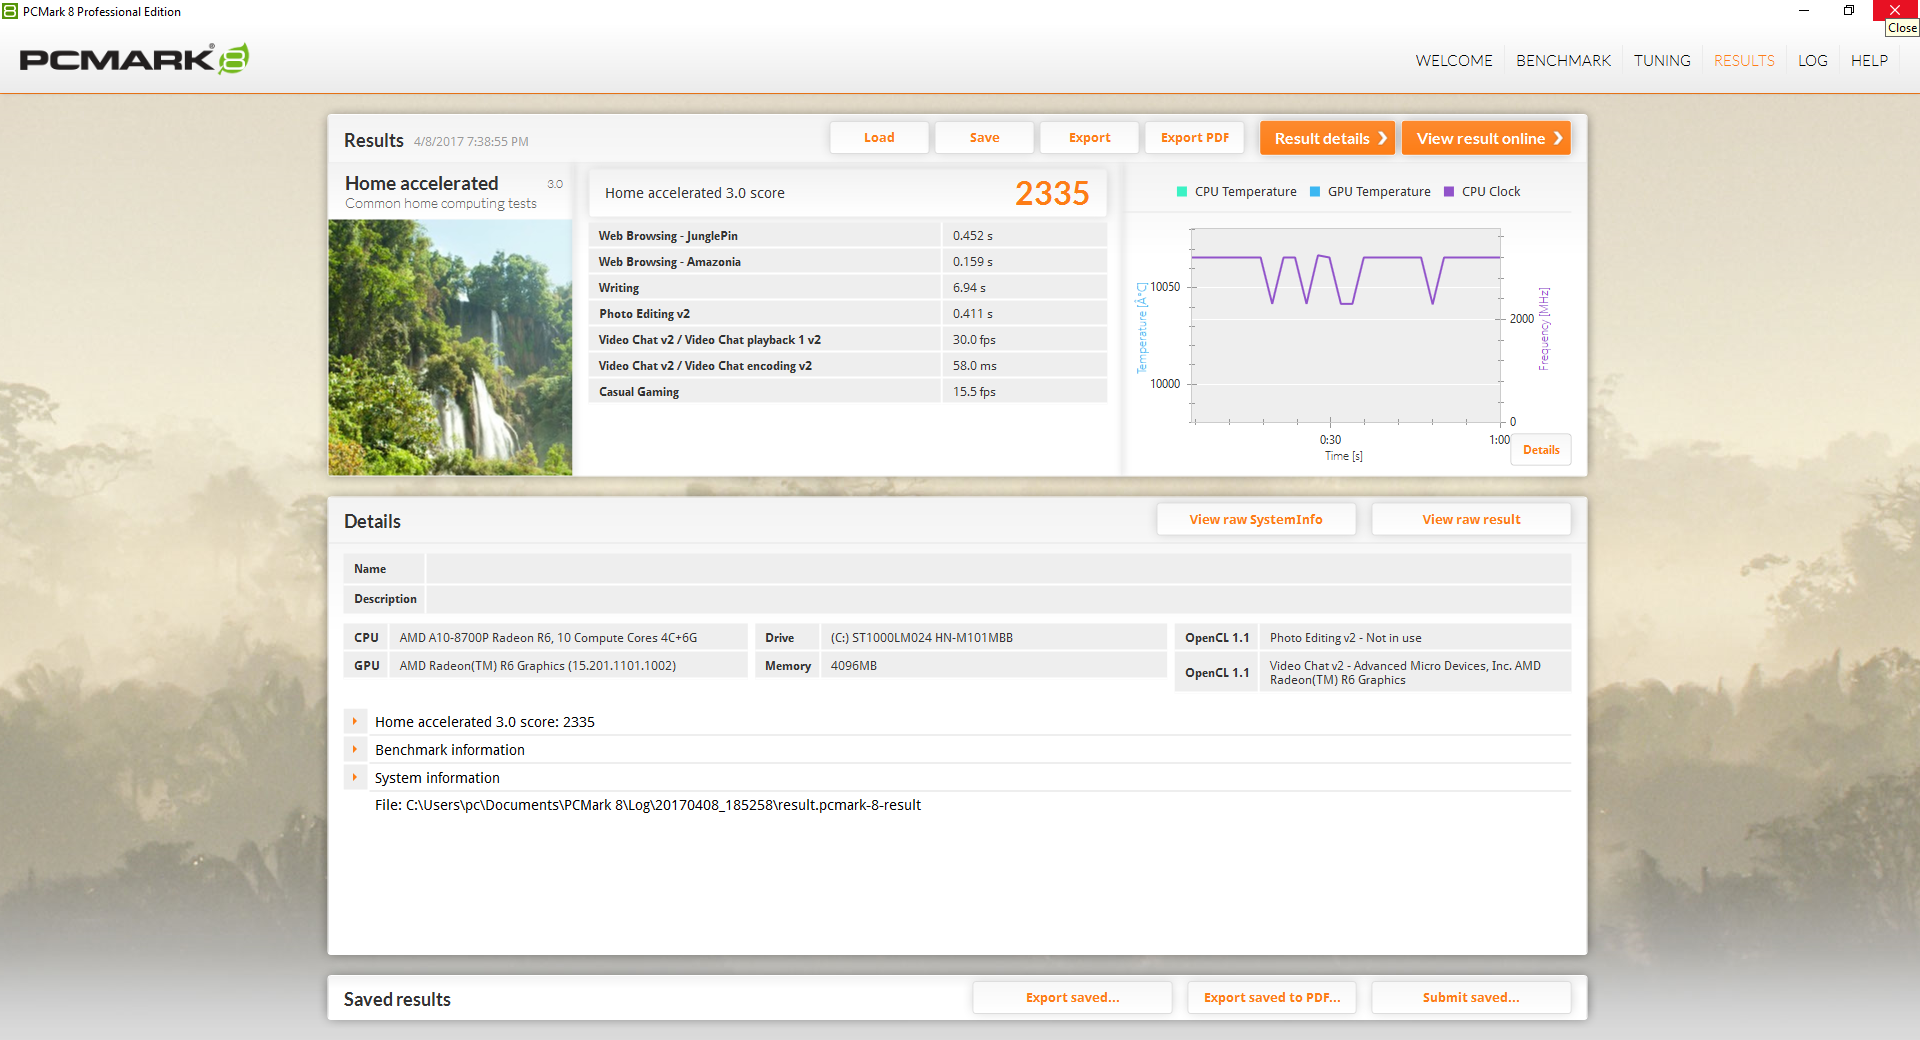
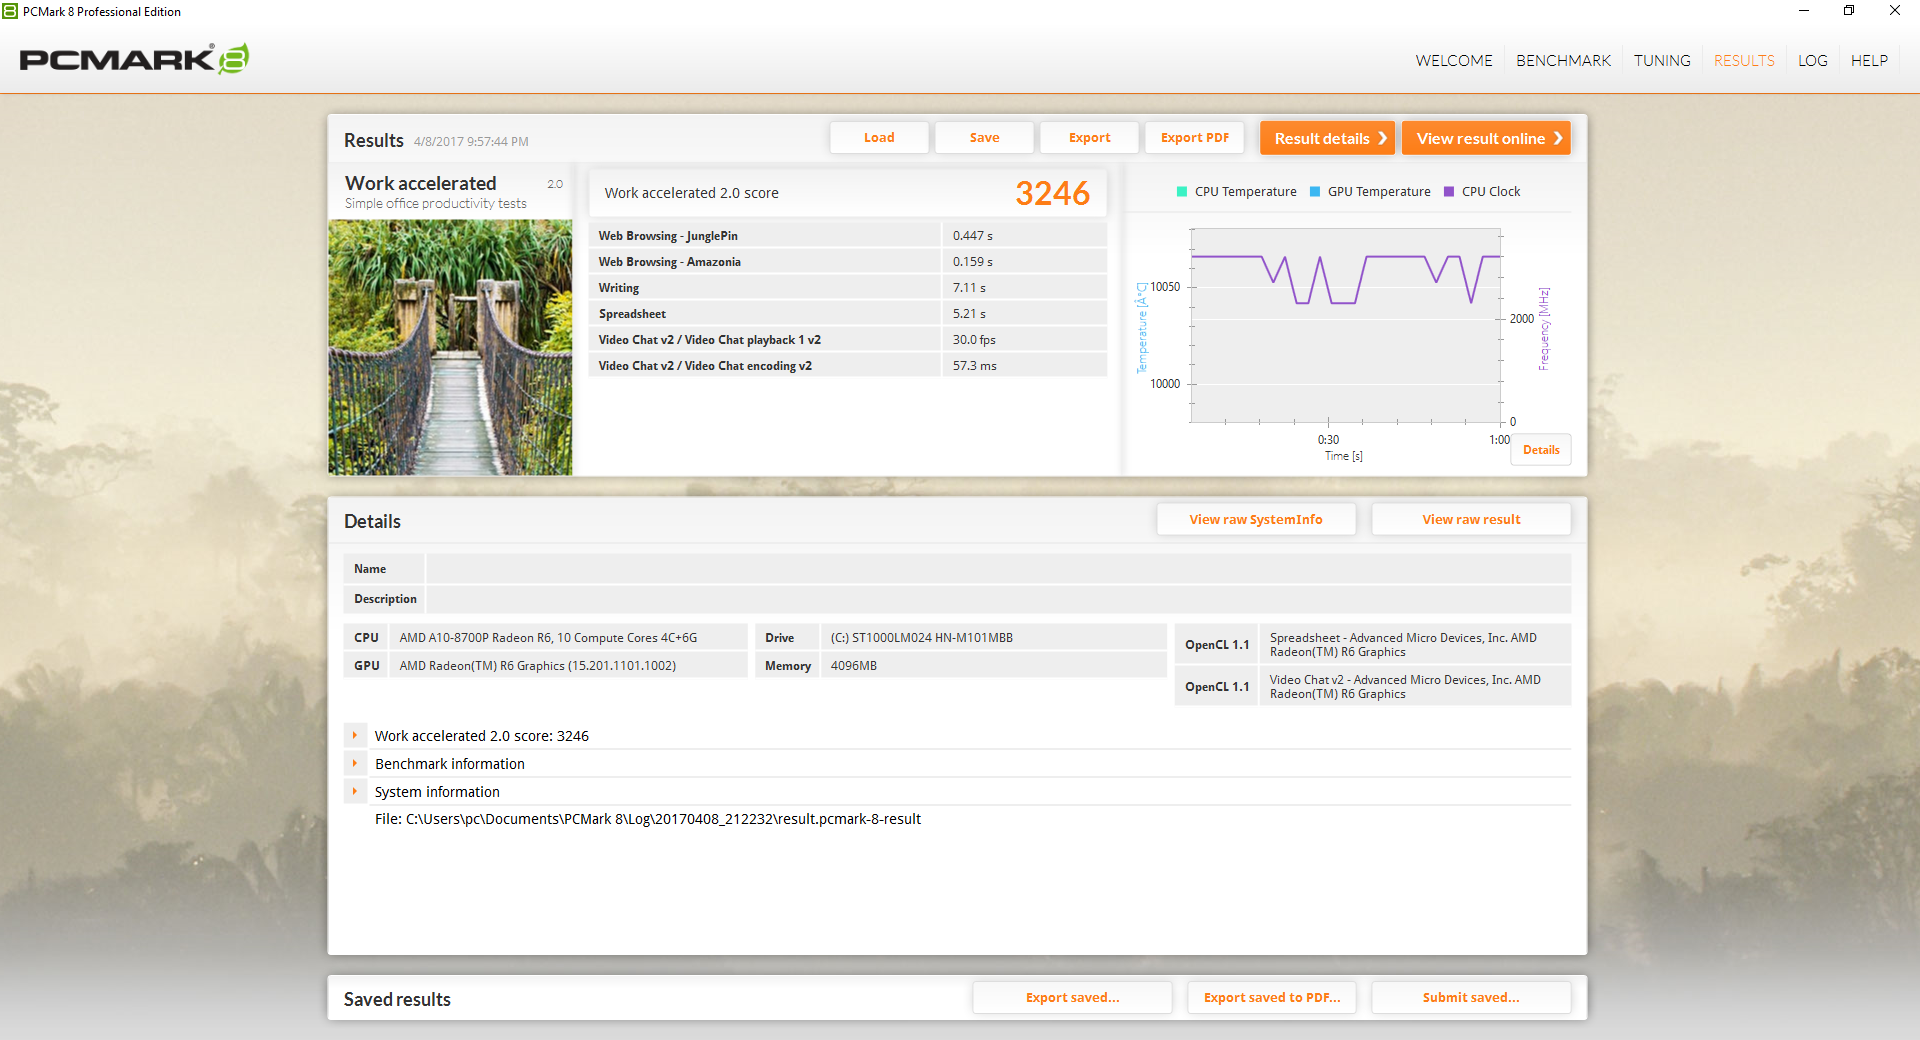
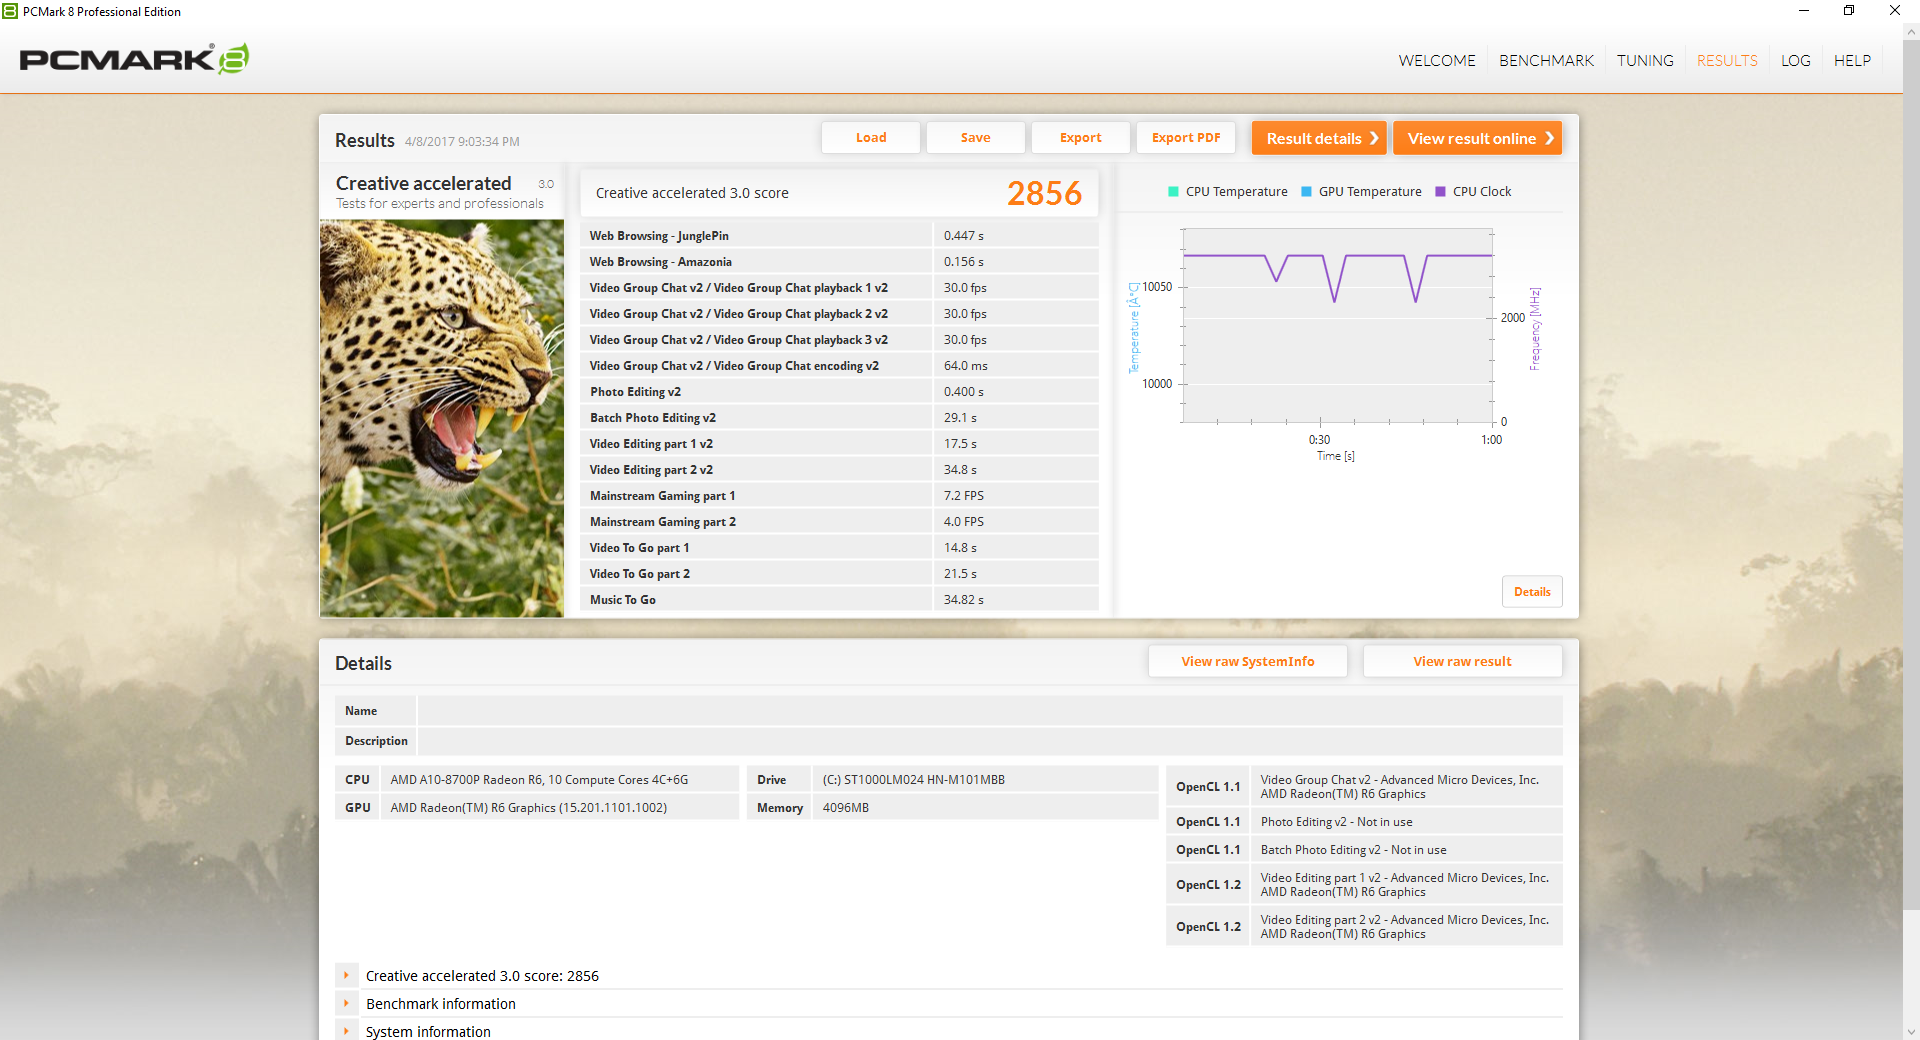
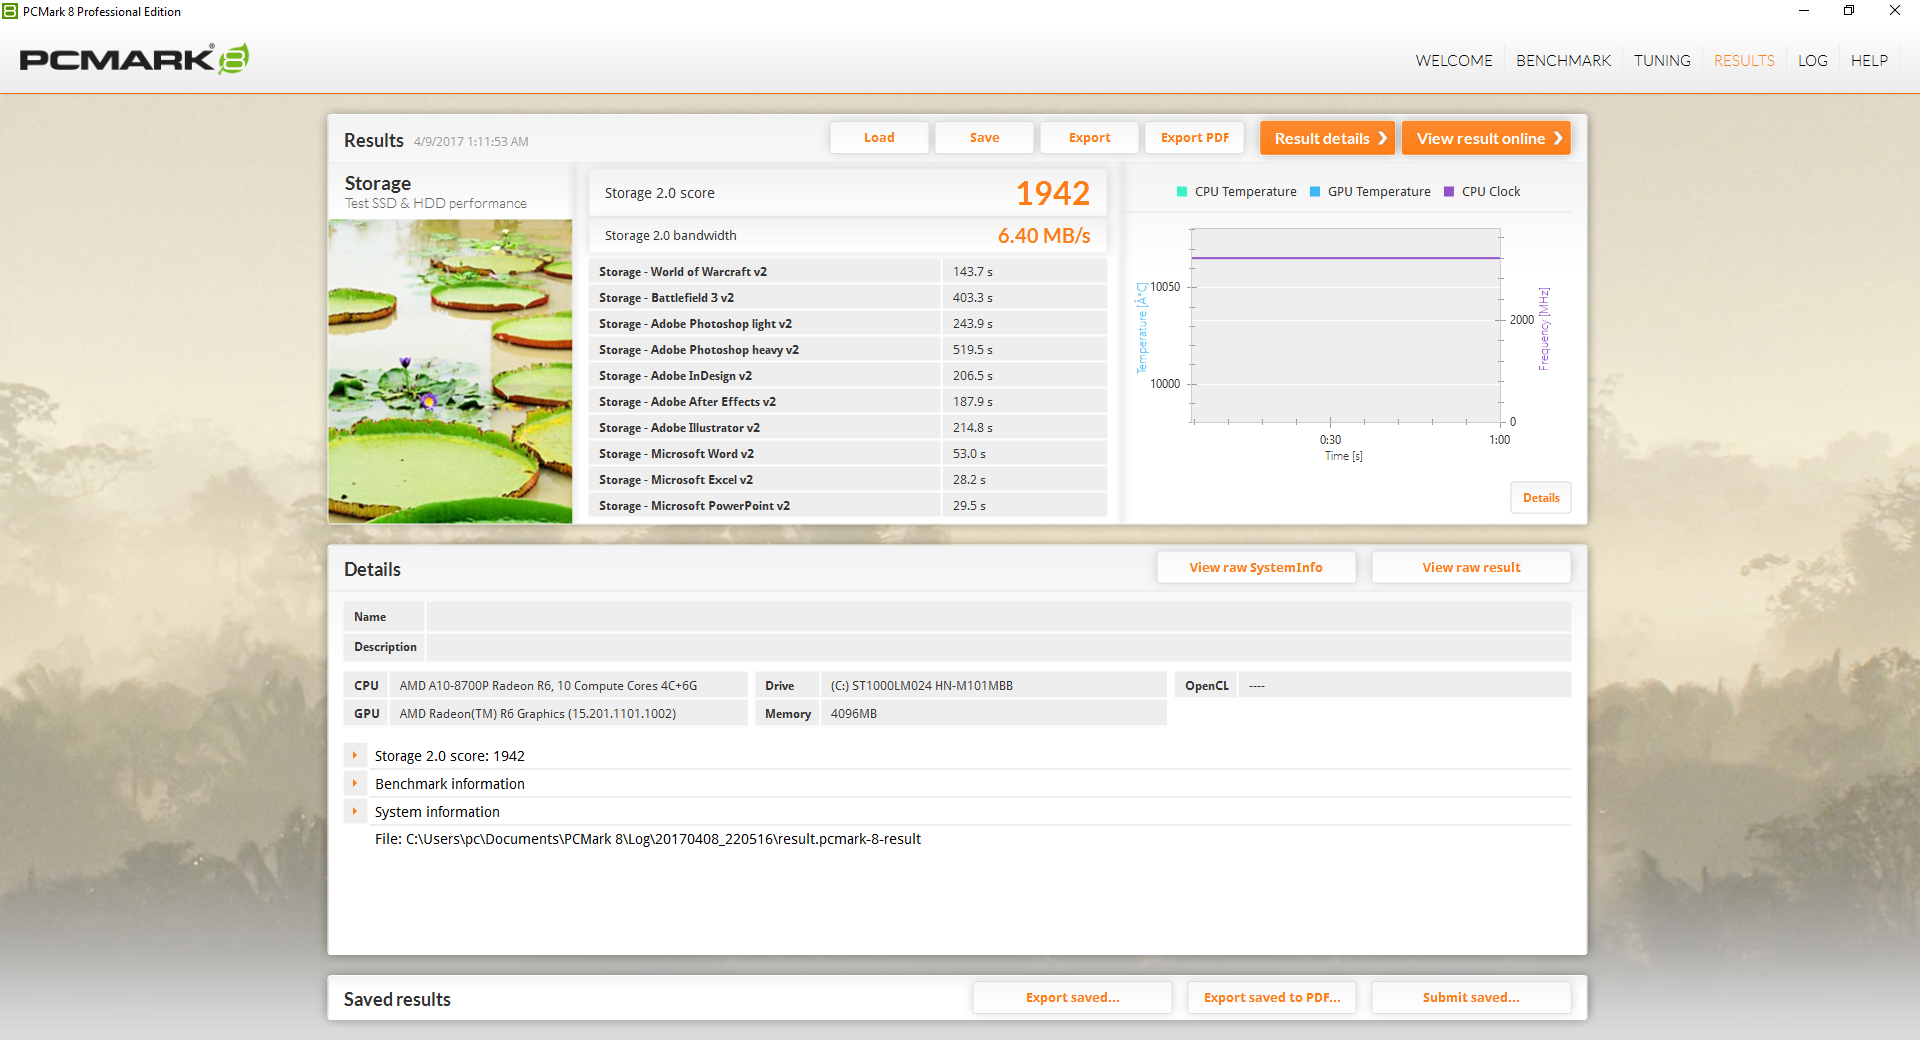
PCMark 8 ranks the X555DA behind inexpensive alternatives like the VivoBook F556 and the Toshiba Satellite Pro R50-C. The combination of a slow HDD and budget-grade AMD processor does the Asus system no favors.
We otherwise experienced no software or hardware related issues during our time with the unit. Subjectively, applications launch with a notable delay in contrast to today's Ultrabooks with instant primary SSD access.
| PCMark 8 | |
| Home Score Accelerated v2 | |
| HP Pavilion 15t-X7P42AV | |
| Asus Vivobook F556UQ-XO626D | |
| Toshiba Satellite Pro R50-C-16V | |
| Asus X555DA-BB11 | |
| Lenovo Ideapad 110-15ACL 80TJ00H0GE | |
| Work Score Accelerated v2 | |
| Asus Vivobook F556UQ-XO626D | |
| Toshiba Satellite Pro R50-C-16V | |
| Asus X555DA-BB11 | |
| HP Pavilion 15t-X7P42AV | |
| Creative Score Accelerated v2 | |
| HP Pavilion 15t-X7P42AV | |
| Asus Vivobook F556UQ-XO626D | |
| Toshiba Satellite Pro R50-C-16V | |
| Asus X555DA-BB11 | |
| PCMark 8 Home Score Accelerated v2 | 2335 points | |
| PCMark 8 Creative Score Accelerated v2 | 2856 points | |
| PCMark 8 Work Score Accelerated v2 | 3246 points | |
Help | ||
Storage Device
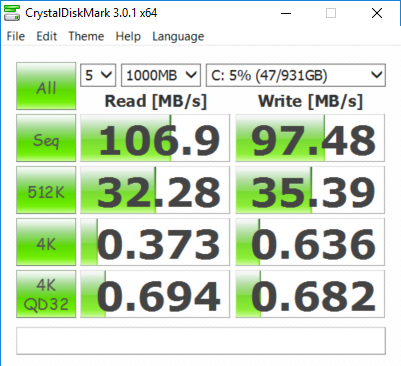
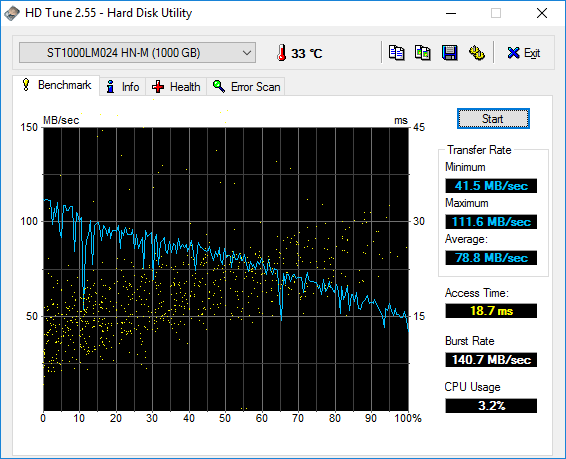
Our test unit is equipped with a single SATA III Seagate HDD with no other secondary internal storage options. Transfer rates average 78.8 MB/s according to HD Tune, which is average for a 5400 RPM drive and noticeably slower than most 7200 RPM HDDs where 95+ MB/s is common. The latest NVMe SSDs on newer Ultrabooks are over an order of a magnitude faster than what is offered here.
Upgrading the hard drive requires a Philips screwdriver and a flat edge, but the keyboard panel can be tricky to remove due to connecting ribbons underneath. The 2.5-inch slot accepts both 7 mm and 9.5 mm drives.
See our growing list of HDDs and SSDs for additional benchmarks and comparisons.
| Asus X555DA-BB11 Seagate Momentus SpinPoint M8 ST1000LM024 HN-M101MBB | Toshiba Satellite Pro R50-C-16V TOSHIBA MQ01ABD075 | Lenovo Ideapad 110-15ACL 80TJ00H0GE Seagate Mobile HDD 1TB ST1000LM035 | HP Pavilion 15t-X7P42AV Samsung CM871a MZNTY128HDHP | Asus X555LN-XO112H Toshiba MQ01ABF050 | |
|---|---|---|---|---|---|
| CrystalDiskMark 3.0 | -12% | -13% | 12908% | 28% | |
| Read Seq (MB/s) | 106.9 | 96.5 -10% | 92.1 -14% | 522 388% | 105.8 -1% |
| Write Seq (MB/s) | 97.5 | 77.9 -20% | 88.5 -9% | 476.6 389% | 104 7% |
| Read 512 (MB/s) | 32.28 | 20.82 -36% | 32.94 2% | 399.7 1138% | 35.72 11% |
| Write 512 (MB/s) | 35.39 | 19.83 -44% | 26.71 -25% | 185.4 424% | 44.85 27% |
| Read 4k (MB/s) | 0.373 | 0.342 -8% | 0.372 0% | 33.12 8779% | 0.47 26% |
| Write 4k (MB/s) | 0.636 | 0.836 31% | 0.283 -56% | 89.8 14019% | 1.044 64% |
| Read 4k QD32 (MB/s) | 0.694 | 0.595 -14% | 0.921 33% | 400.9 57667% | 0.894 29% |
| Write 4k QD32 (MB/s) | 0.682 | 0.706 4% | 0.473 -31% | 140.2 20457% | 1.099 61% |

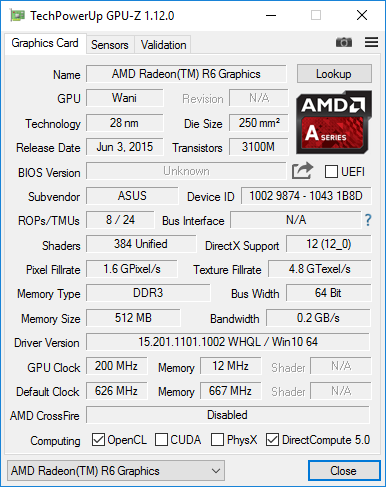
GPU Performance
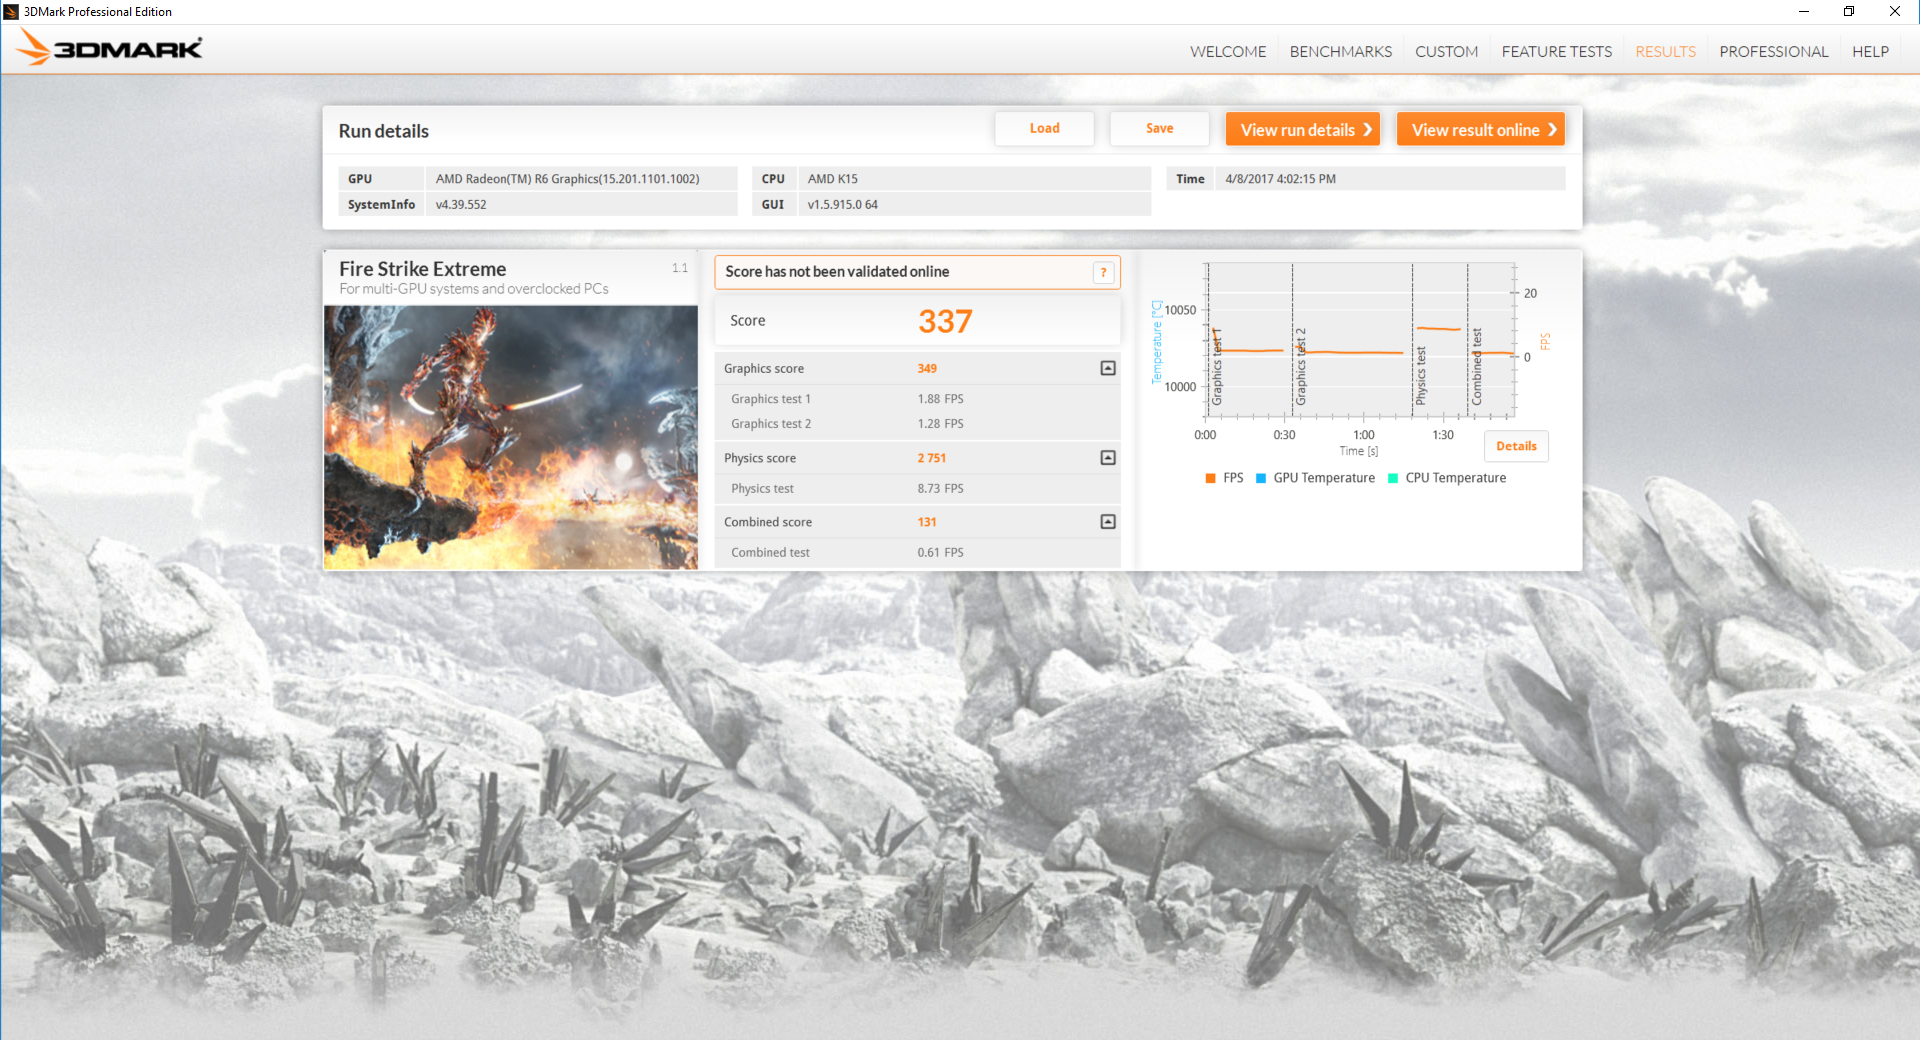
While CPU performance is well below the Haswell i5-4200U, GPU performance is more on par with the HD Graphics 520 as found on many Intel Skylake CPUs. The integrated Radeon R6 performs similarly to the basic GeForce 820M according to 3DMark benchmarks and is significantly ahead of the integrated HD Graphics of Atom CPUs. In an embarrassment to AMD, the HD Graphics 515 on the passively-cooled Surface Pro 4 SKU still comes out ahead in synthetic benchmarks.
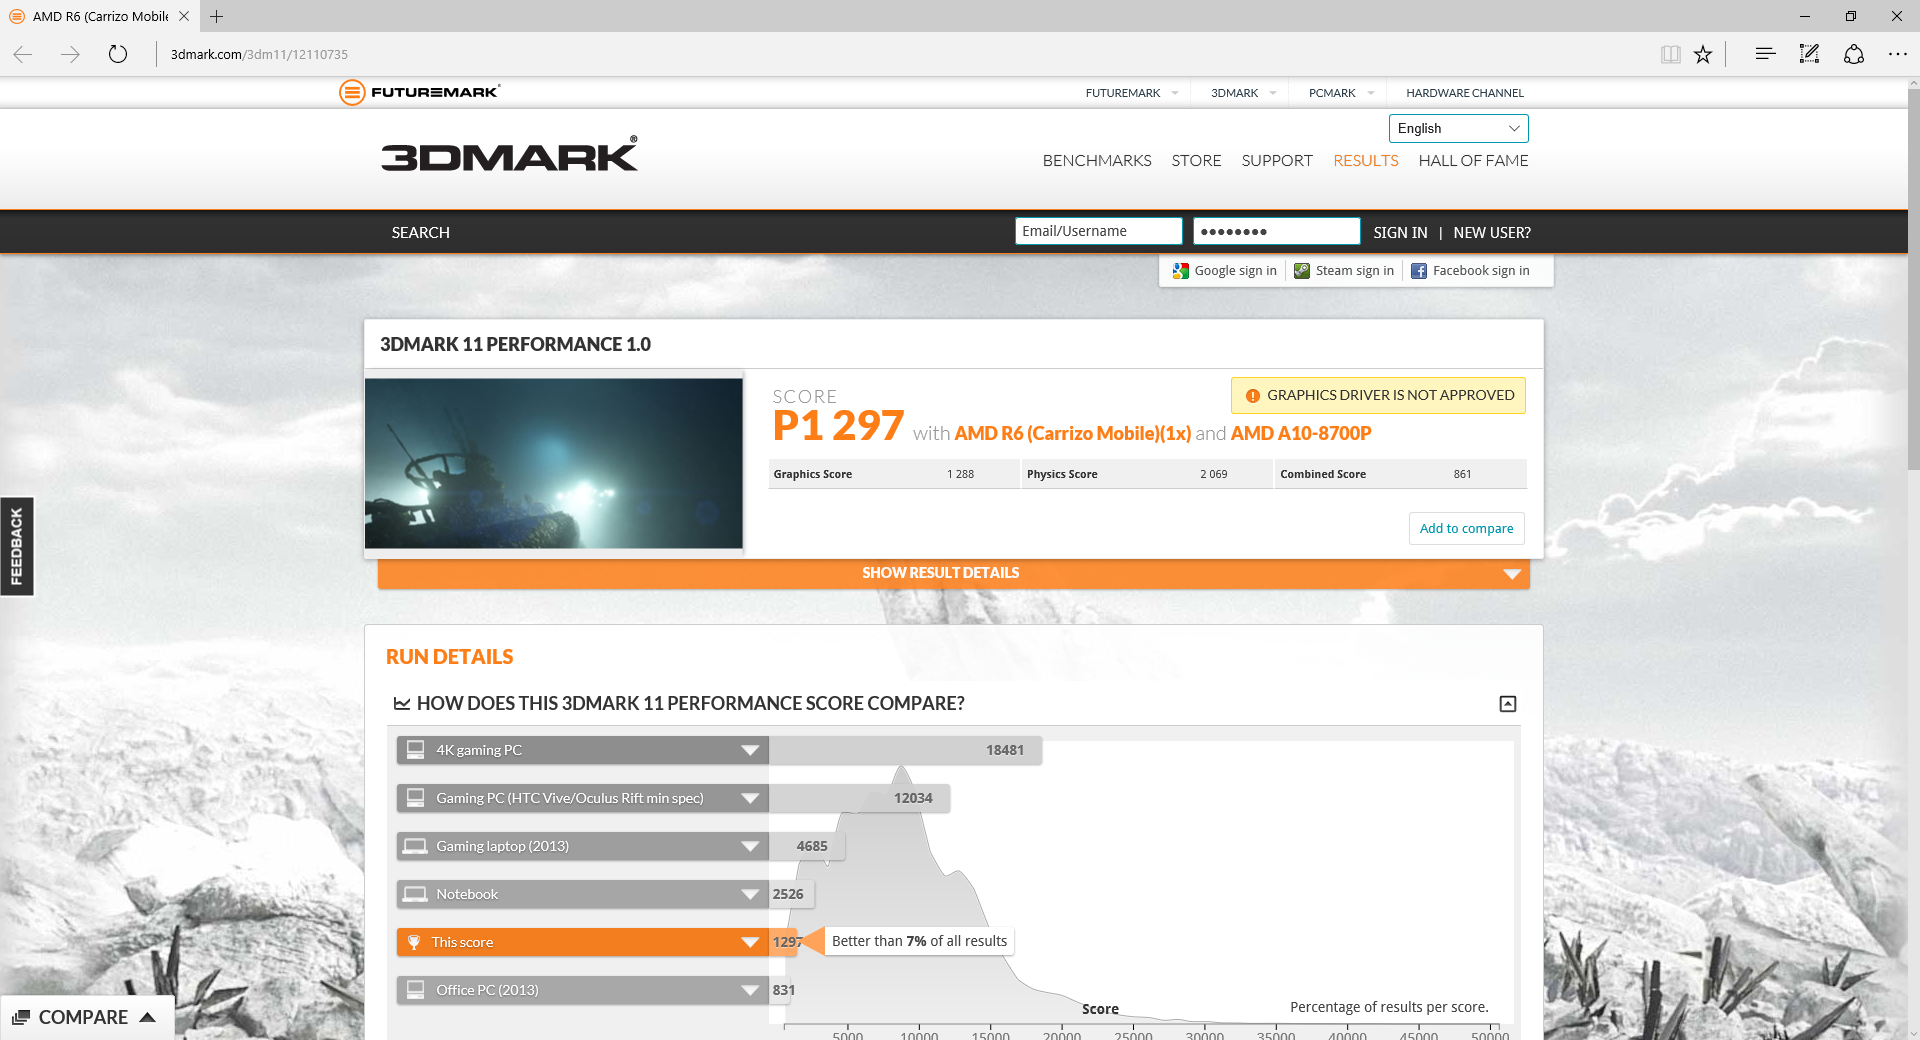
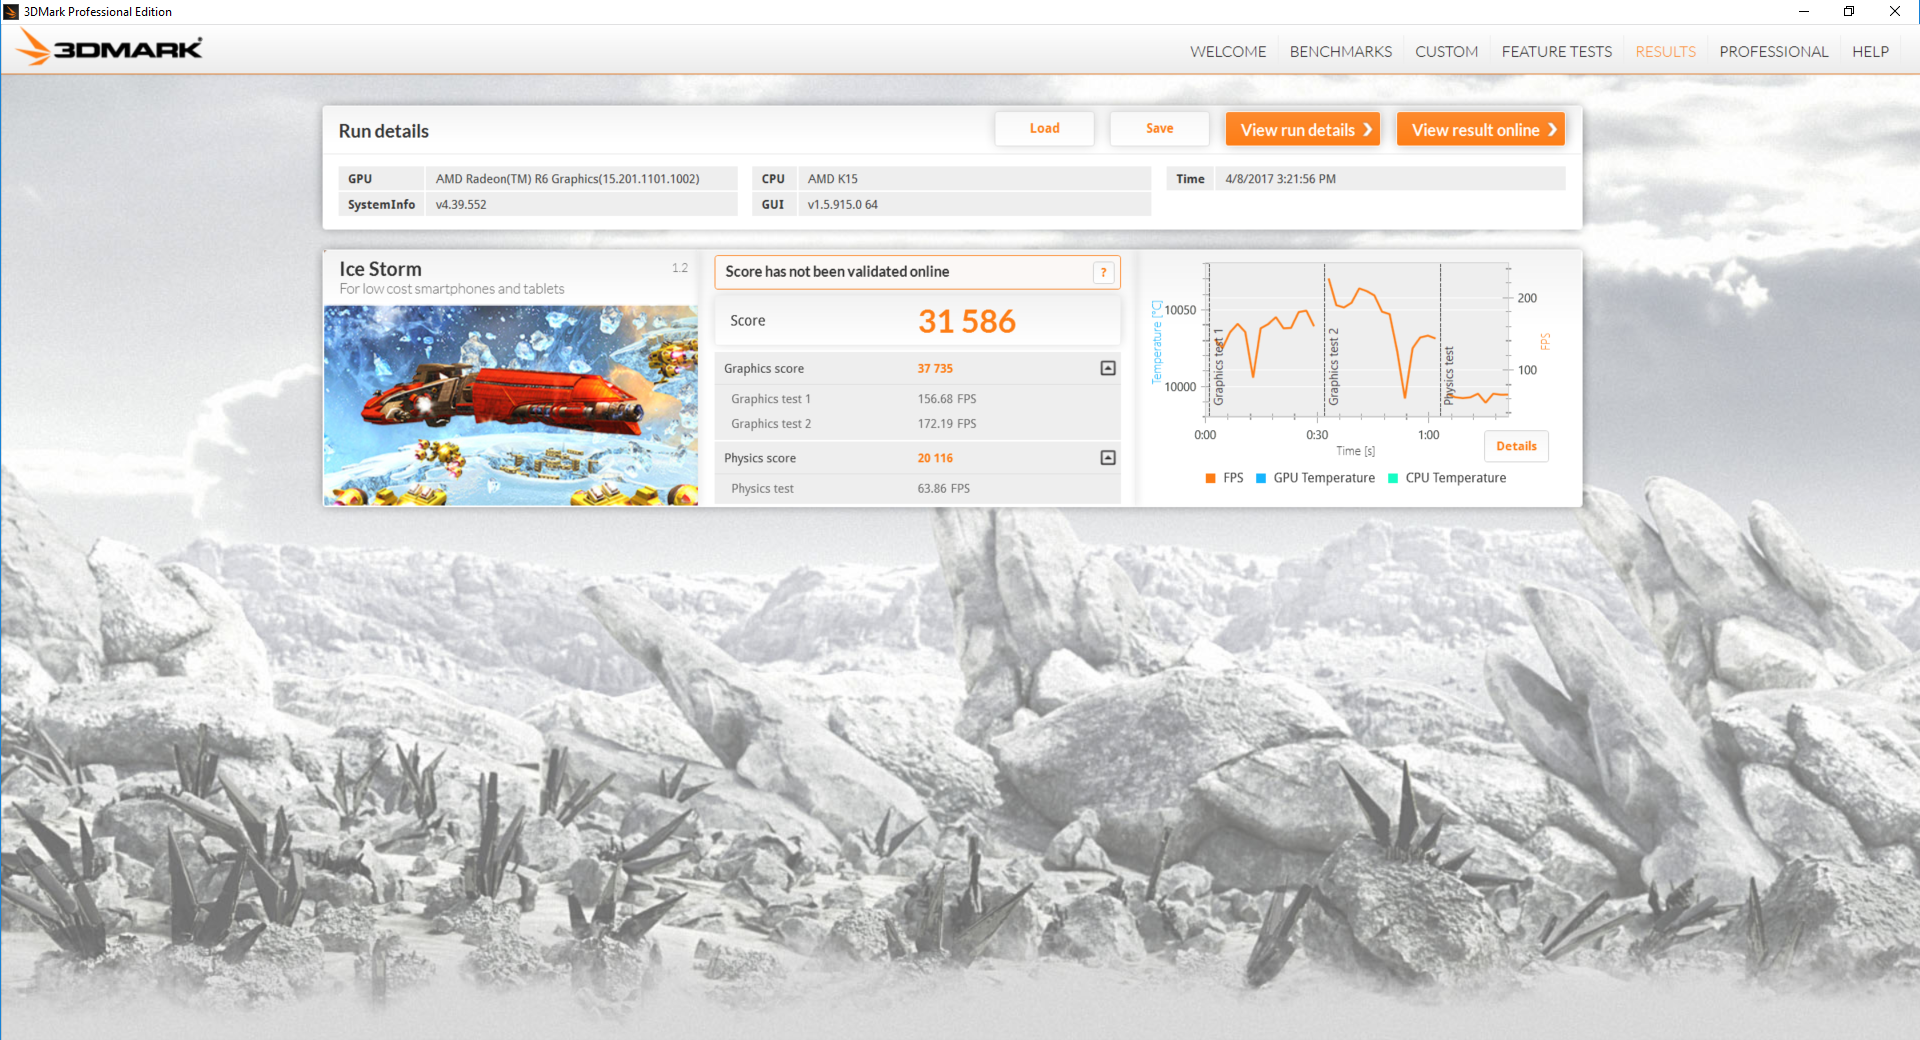
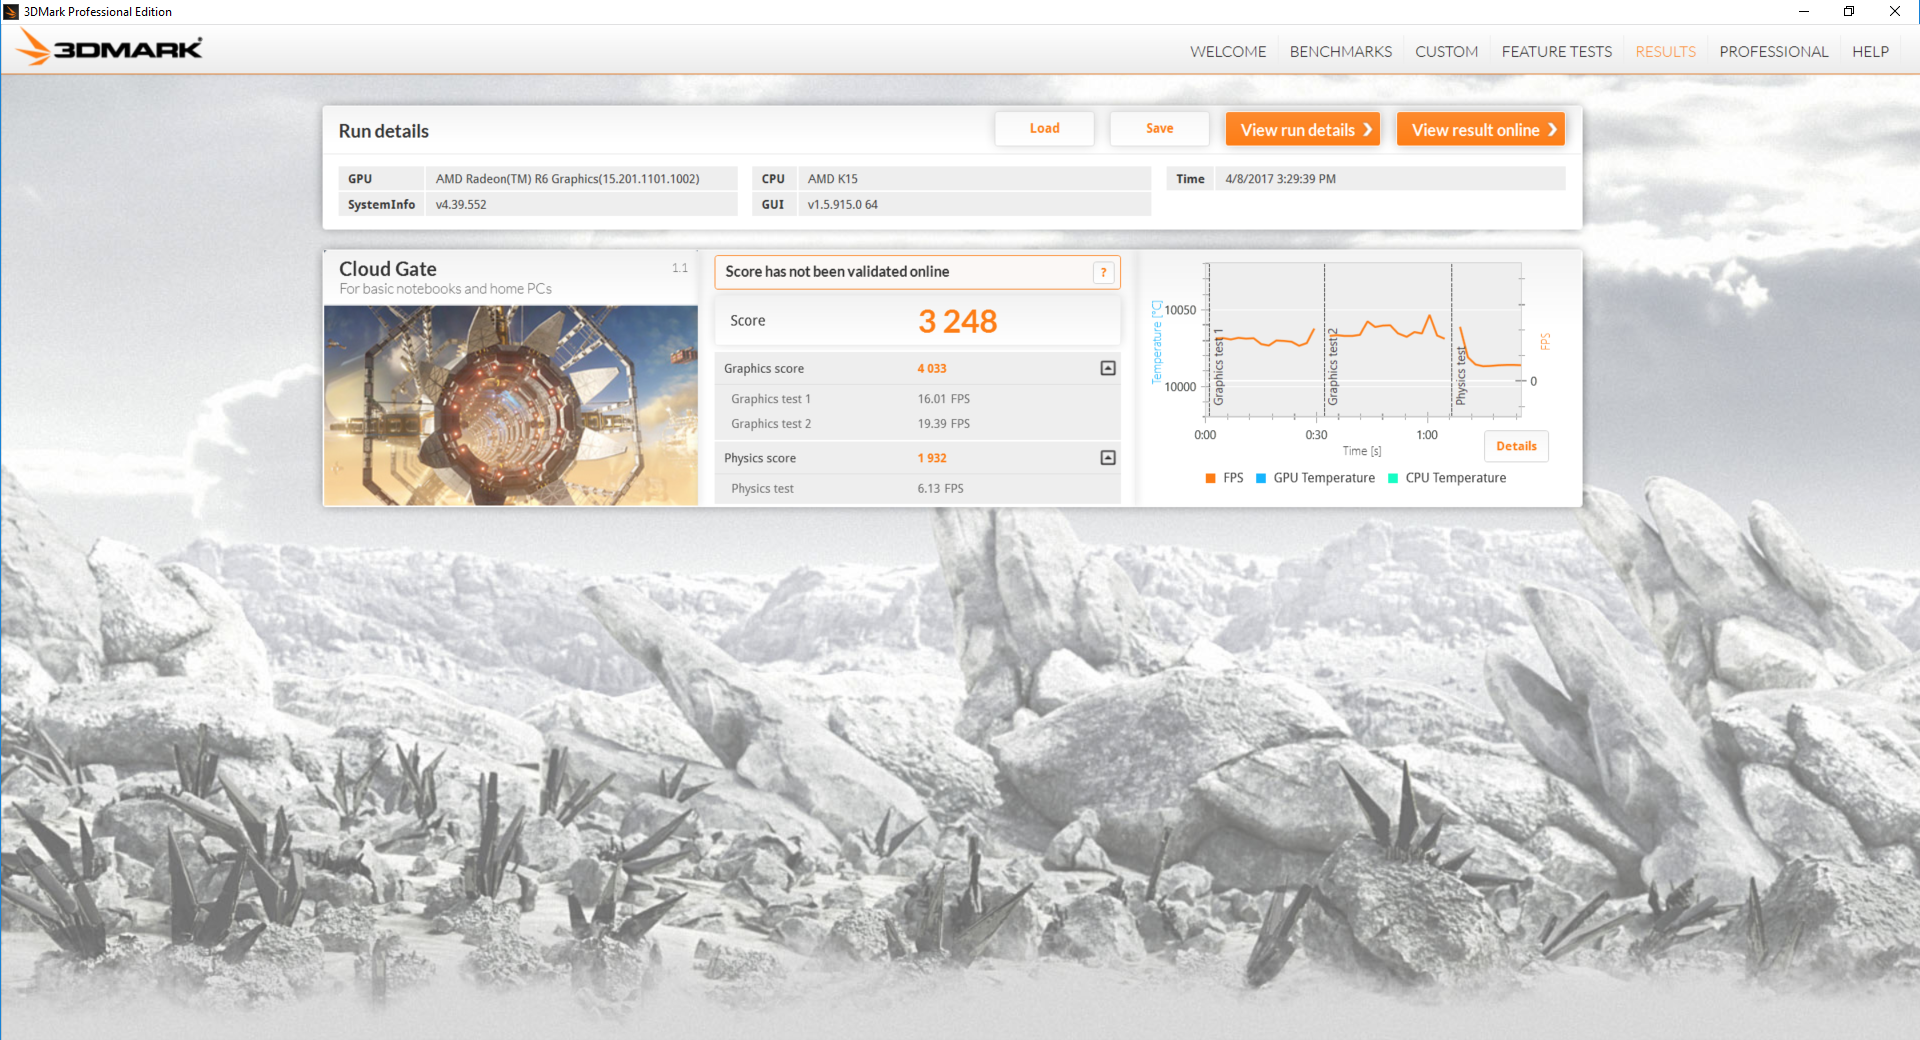
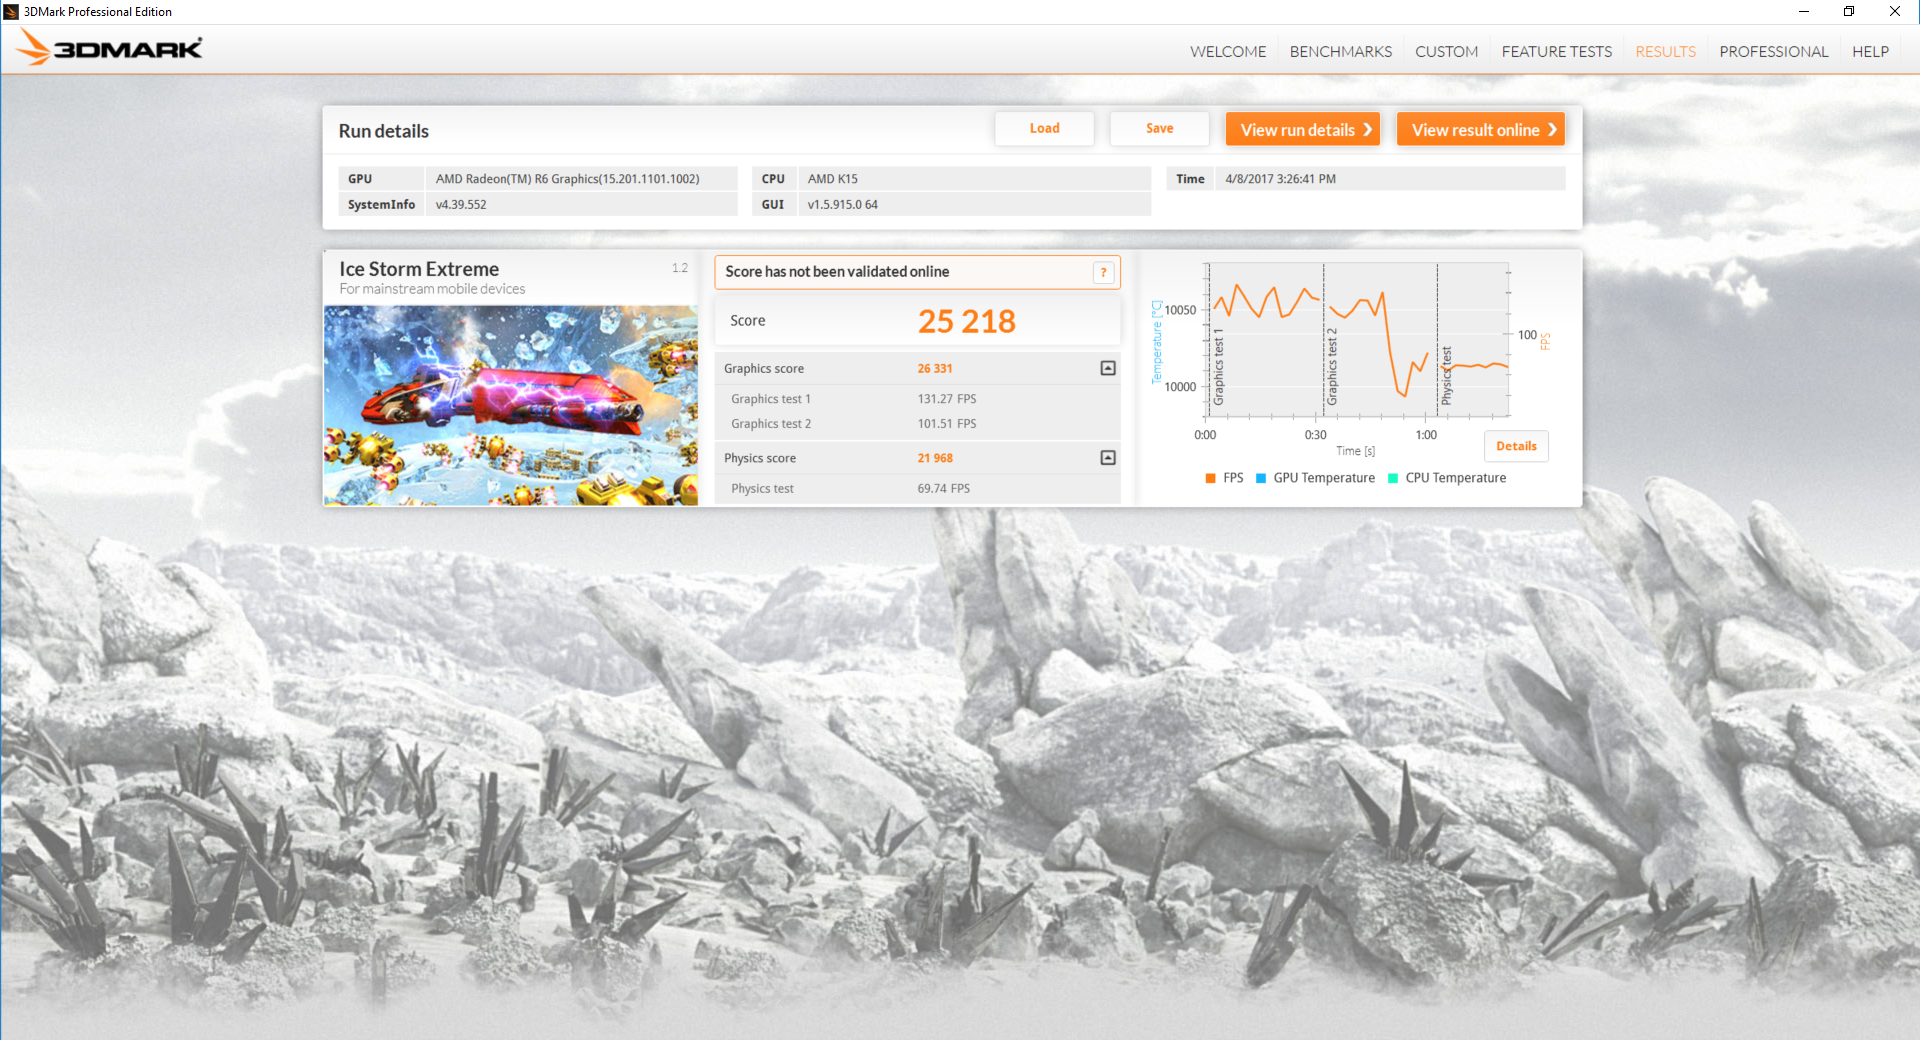
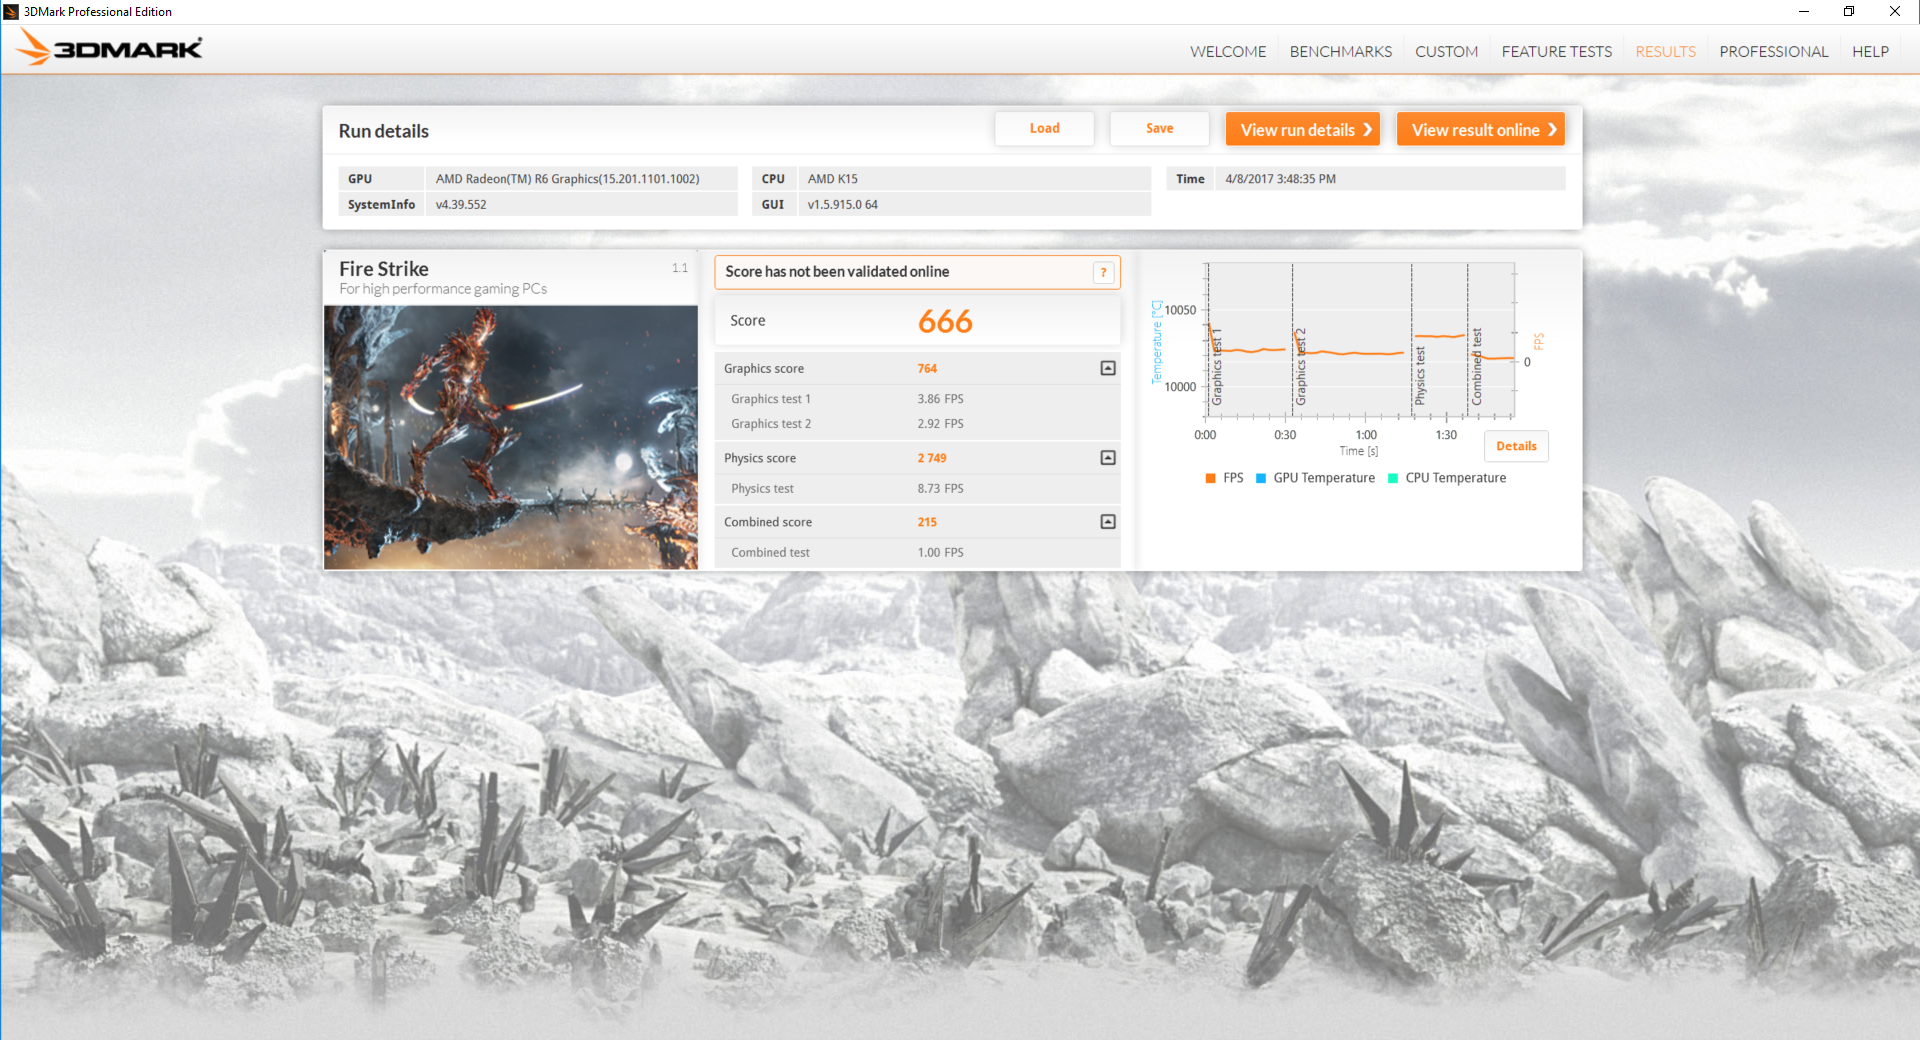
| 3DMark 11 Performance | 1297 points | |
| 3DMark Ice Storm Standard Score | 31586 points | |
| 3DMark Cloud Gate Standard Score | 3248 points | |
| 3DMark Fire Strike Score | 666 points | |
| 3DMark Fire Strike Extreme Score | 337 points | |
Help | ||
Gaming Performance
Gaming performance is slightly ahead of the HD Graphics 520 in the Toshiba Satellite Pro R50, but still far slower than the HD Graphics 620 in the ThinkPad L470. The Radeon R6 can barely push a solid 30 FPS when playing Dota 2 even on the lowest of graphical settings and resolutions, so users shouldn't expect any gaming capabilities with recent 3D titles. See our dedicated GPU page on the Radeon R6 Carrizo for more technical details and benchmarks.
4K video playback on YouTube is possible at 30 FPS with CPU usage hovering in the 50 to 60 percent range.
| low | med. | high | ultra | |
|---|---|---|---|---|
| BioShock Infinite (2013) | 36.3 | |||
| Dota 2 Reborn (2015) | 28.2 | |||
| Rise of the Tomb Raider (2016) | 17 |
Stress Test
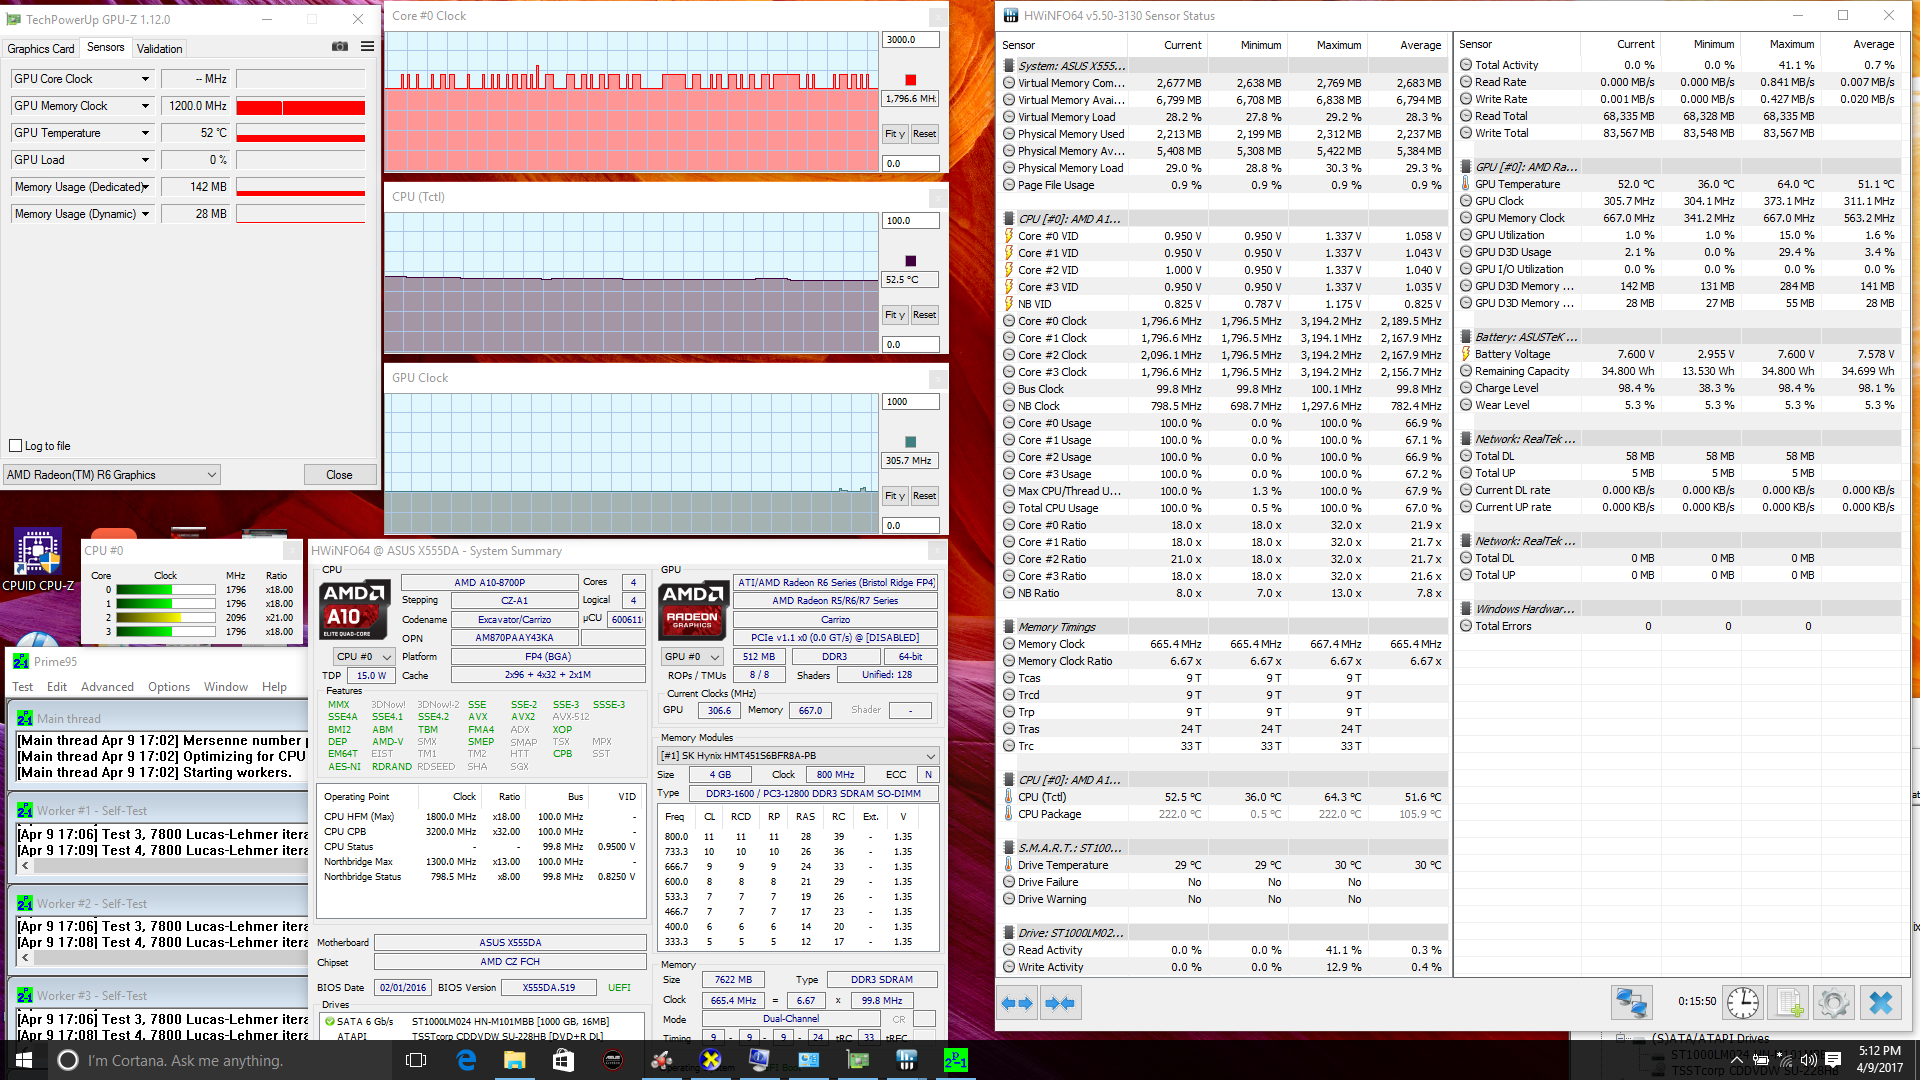
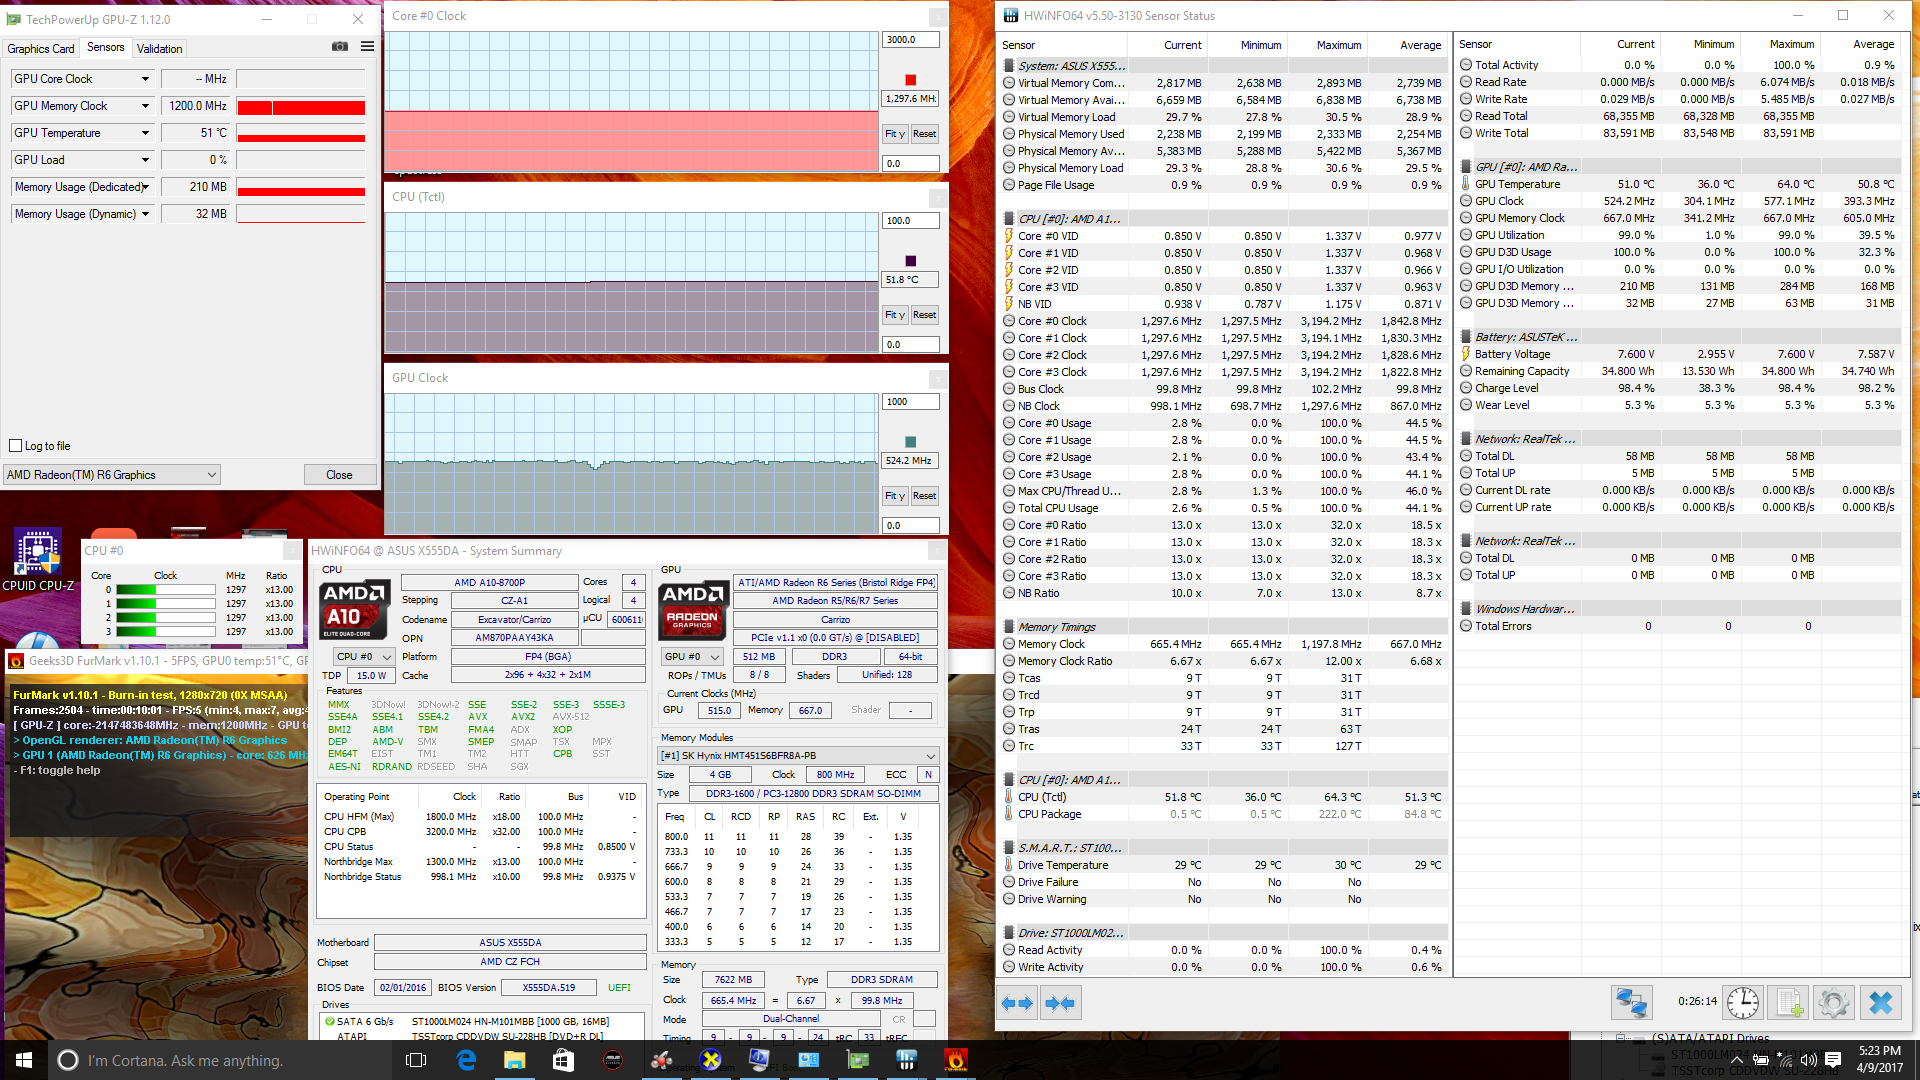
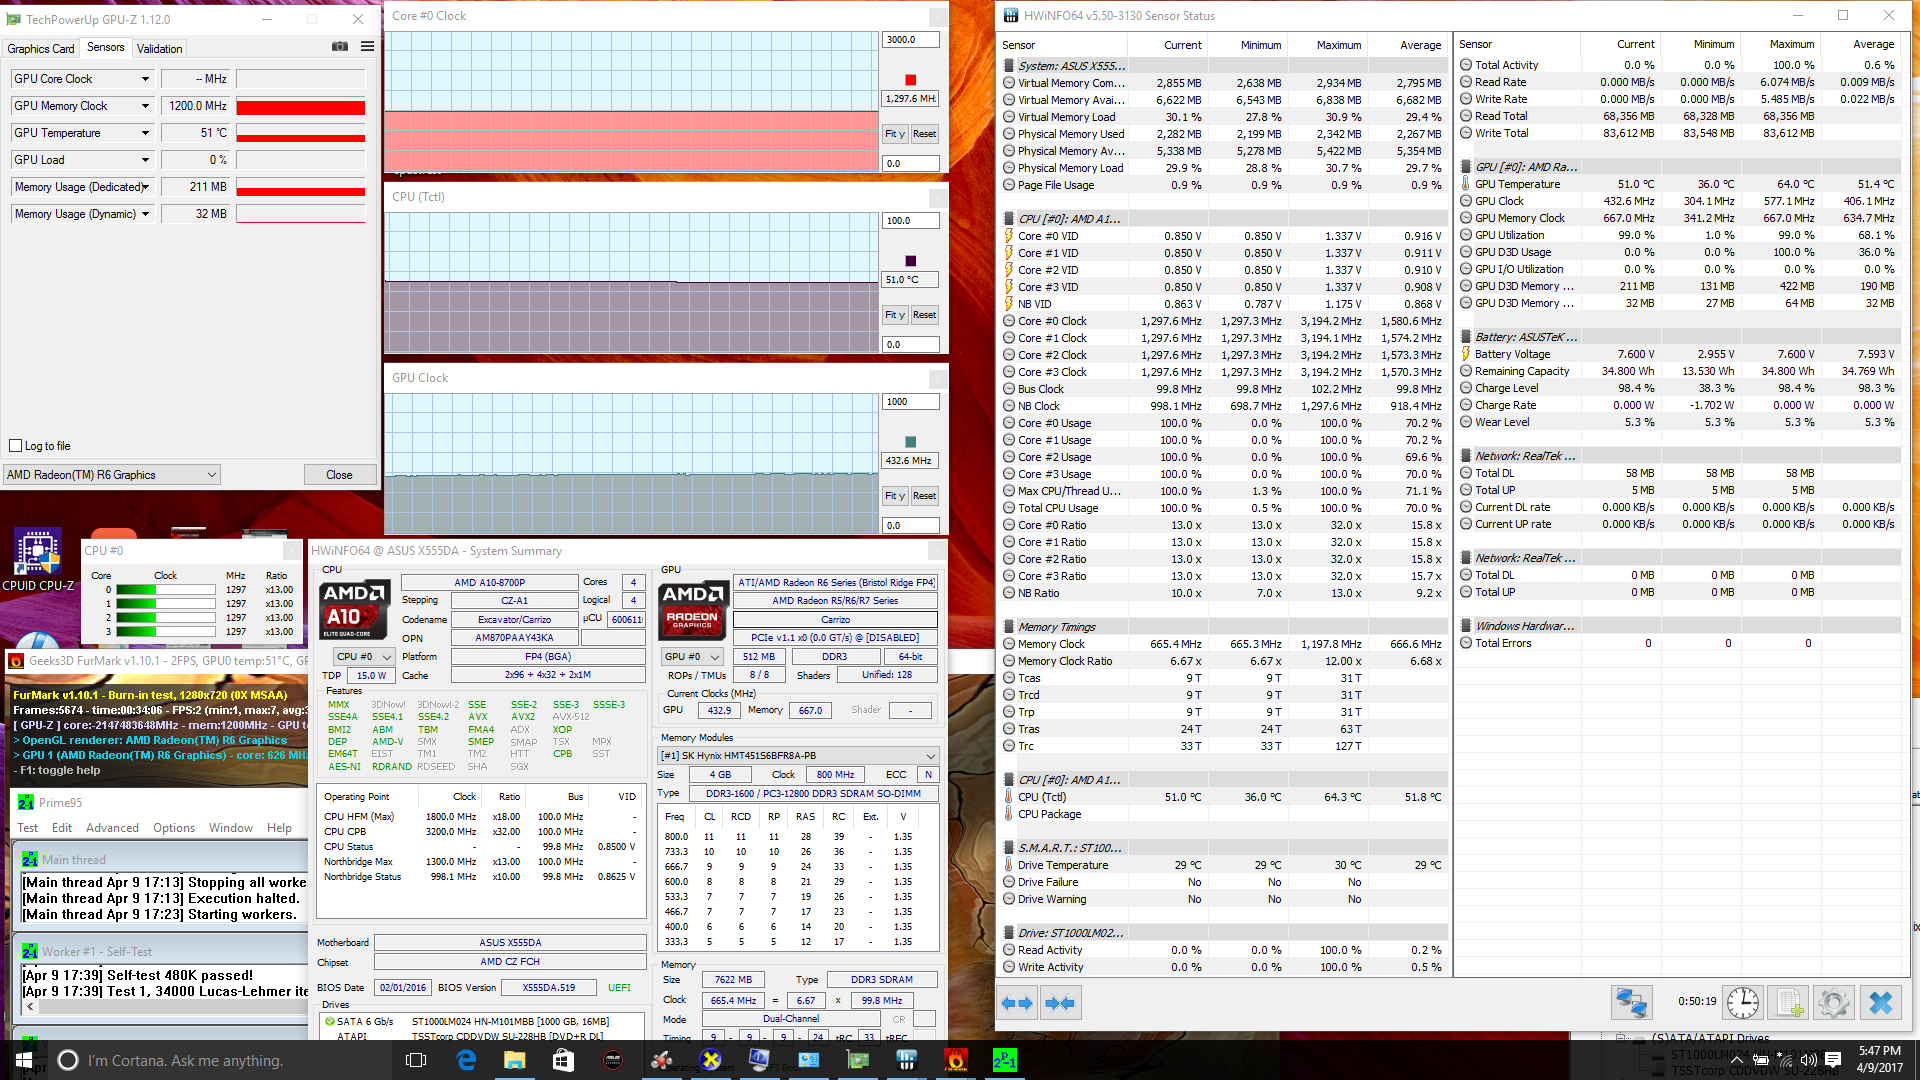
We stress the notebook with synthetic benchmarks to identify for any throttling or stability issues. When under Prime95 stress, the CPU can be observed alternating between its base 1.8 GHz and Turbo 2.1 GHz clock rates. While the CPU does not drop below the base clock rate, it's disappointing that it can neither maintain consistent Turbo clock rates. Running both Prime95 and FurMark will throttle the CPU and GPU to 1.3 GHz and 433 MHz, respectively. The CPU temperature ceiling appears to be very reserved at the low 50 C range no matter the processing load.
Running on battery power will not limit CPU or GPU power. A 3DMark 11 run on batteries returns Physics and Graphics scores of 2172 and 1350 points, respectively, compared to 2069 and 1288 points when on mains.
| CPU Clock (GHz) | GPU Clock (MHz) | Average CPU Temperature (°C) | |
| Prime95 Stress | 1.8 - 2.1 | -- | 52 |
| FurMark Stress | -- | 524 | 52 |
| Prime95 + FurMark Stress | 1.3 | 433 | 51 |
| Unigine Valley Stress | 1.3 - 2.1 | 479 | 51 |
Emissions
System Noise
The internal fan is always active no matter the onscreen load or system setting. What's worse is that it appears to pulsate in low ranges between 31.6 dB(A) and 32.4 dB(A) which makes an otherwise quiet machine more noticeable during use. A steady fan noise of 32.4 dB(A), for example, would have been preferable and less of an annoyance than a fan that is constantly changing in speeds.
More stressful conditions such as 3DMark or Prime95 will induce a louder fan noise in the 33.3 dB(A) to 35.5 dB(A) range. This is significantly quieter than the X555LN since the X555DA has no dedicated GPU to cool, so this is perhaps one area that the AMD SKU excels at. Nonetheless, similarly-sized competitors with Intel ULV solutions can run even quieter under similar conditions with less frequent pulsing.
Noise level
| Idle |
| 31.6 / 32 / 32.4 dB(A) |
| Load |
| 33.3 / 35.5 dB(A) |
 | ||
30 dB silent 40 dB(A) audible 50 dB(A) loud |
||
min: | ||
| Asus X555DA-BB11 Radeon R6 (Carrizo), A10-8700P, Seagate Momentus SpinPoint M8 ST1000LM024 HN-M101MBB | Toshiba Satellite Pro R50-C-16V HD Graphics 520, 6006U, TOSHIBA MQ01ABD075 | Lenovo Ideapad 110-15ACL 80TJ00H0GE Radeon R5 (Beema/Carrizo-L), A8-7410, Seagate Mobile HDD 1TB ST1000LM035 | HP Pavilion 15t-X7P42AV GeForce GTX 1050 Mobile, i7-7700HQ, Samsung CM871a MZNTY128HDHP | Asus X555LN-XO112H GeForce 840M, 4210U, Toshiba MQ01ABF050 | Asus Vivobook F556UQ-XO626D GeForce 940MX, 6198DU, Toshiba MQ01ABF050 | |
|---|---|---|---|---|---|---|
| Noise | 2% | 3% | -13% | -8% | -6% | |
| off / environment * (dB) | 28.9 | 30.4 -5% | 30.4 -5% | 29.3 -1% | 30.7 -6% | |
| Idle Minimum * (dB) | 31.6 | 31.8 -1% | 30.9 2% | 32.3 -2% | 31.7 -0% | 32 -1% |
| Idle Average * (dB) | 32 | 31.8 1% | 30.9 3% | 32.3 -1% | 31.7 1% | 32 -0% |
| Idle Maximum * (dB) | 32.4 | 31.8 2% | 31 4% | 32.4 -0% | 31.8 2% | 32.2 1% |
| Load Average * (dB) | 33.3 | 31.9 4% | 31.8 5% | 44.4 -33% | 40.8 -23% | 37.3 -12% |
| Load Maximum * (dB) | 35.5 | 31.8 10% | 31.9 10% | 49.2 -39% | 43.2 -22% | 42.6 -20% |
* ... smaller is better
Temperature
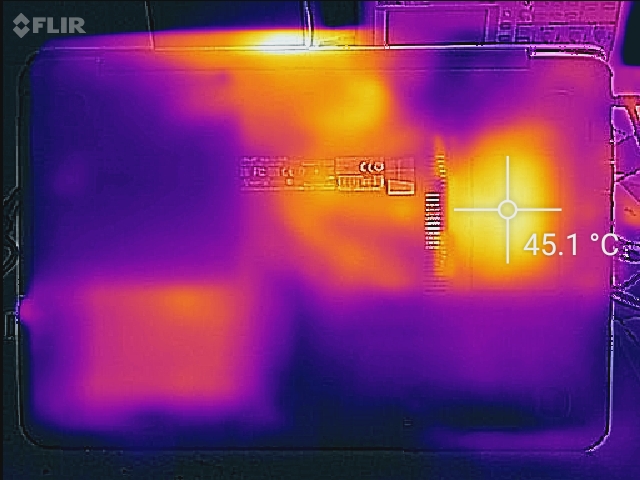
Surface temperatures when idling are flat across the palm rests and right-hand side of the notebook. Most of the QWERTY keys, however, will feel comparatively warmer at about 30 C compared to 23 C or 24 C on the palm rests. Not coincidentally, the processor and heat pipe are directly underneath this zone. Maximum load with both Prime95 and FurMark will induce a surface temperature of almost 37 C on the keyboard keys, which is still a comfortable range for typing and not any warmer than the Intel-based Toshiba Satellite Pro 50-C when under similar loads. Waste heat exhausts through the ventilation grilles on the rear of the unit as shown by the very warm 47 C hinge on our temperature maps below. The RAM module becomes especially warm when under load at about 45 C.
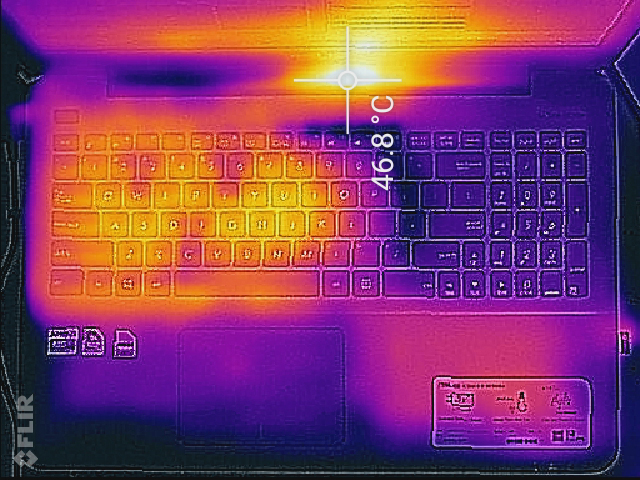
(+) The maximum temperature on the upper side is 36.8 °C / 98 F, compared to the average of 36.8 °C / 98 F, ranging from 21 to 71 °C for the class Multimedia.
(±) The bottom heats up to a maximum of 45 °C / 113 F, compared to the average of 39.2 °C / 103 F
(+) In idle usage, the average temperature for the upper side is 27 °C / 81 F, compared to the device average of 31.3 °C / 88 F.
(+) The palmrests and touchpad are cooler than skin temperature with a maximum of 30 °C / 86 F and are therefore cool to the touch.
(±) The average temperature of the palmrest area of similar devices was 28.7 °C / 83.7 F (-1.3 °C / -2.3 F).
Speakers
The internal stereo speakers offer poor bass and suffer from the "tin tan" quality commonly found on cheaper tablets and netbooks. Treble is exaggerated while lower frequencies are not represented nearly as well. One redeeming quality is that the speakers are loud when set to maximum volume with minimal reverberation, but balance suffers and quality becomes worse. Dedicated earphones are recommended if using the notebook for multimedia playback.
")


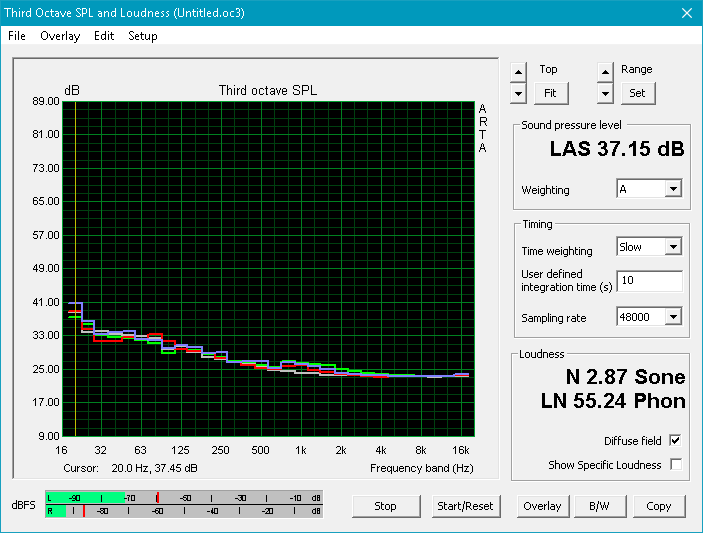
Asus X555DA-BB11 audio analysis
(±) | speaker loudness is average but good (76.4 dB)
Bass 100 - 315 Hz
(-) | nearly no bass - on average 21.4% lower than median
(±) | linearity of bass is average (13.5% delta to prev. frequency)
Mids 400 - 2000 Hz
(±) | reduced mids - on average 5.1% lower than median
(±) | linearity of mids is average (14.6% delta to prev. frequency)
Highs 2 - 16 kHz
(±) | higher highs - on average 7.2% higher than median
(±) | linearity of highs is average (14.6% delta to prev. frequency)
Overall 100 - 16.000 Hz
(±) | linearity of overall sound is average (29% difference to median)
Compared to same class
» 95% of all tested devices in this class were better, 1% similar, 4% worse
» The best had a delta of 5%, average was 17%, worst was 45%
Compared to all devices tested
» 87% of all tested devices were better, 2% similar, 11% worse
» The best had a delta of 4%, average was 23%, worst was 134%
Apple MacBook 12 (Early 2016) 1.1 GHz audio analysis
(+) | speakers can play relatively loud (83.6 dB)
Bass 100 - 315 Hz
(±) | reduced bass - on average 11.3% lower than median
(±) | linearity of bass is average (14.2% delta to prev. frequency)
Mids 400 - 2000 Hz
(+) | balanced mids - only 2.4% away from median
(+) | mids are linear (5.5% delta to prev. frequency)
Highs 2 - 16 kHz
(+) | balanced highs - only 2% away from median
(+) | highs are linear (4.5% delta to prev. frequency)
Overall 100 - 16.000 Hz
(+) | overall sound is linear (10.2% difference to median)
Compared to same class
» 7% of all tested devices in this class were better, 2% similar, 90% worse
» The best had a delta of 5%, average was 18%, worst was 53%
Compared to all devices tested
» 5% of all tested devices were better, 1% similar, 94% worse
» The best had a delta of 4%, average was 23%, worst was 134%
Frequency Comparison (Checkbox selectable!)
Graph 1: Pink Noise 100% Vol.; Graph 2: Audio off
Energy Management
Power Consumption
The outdated Carrizo platform is not nearly as efficient as even the older Asus X555LN with the ULV Haswell i5-4210U CPU. Idling on desktop will draw 8.3 W up to as much as 13 W when idling on the High Performance profile. 3DMark loads will demand about 31 W compared to 19 W on the Toshiba Satellite Pro with the HD Graphics 520 GPU or 35 W on the older Asus X555LN model with the superior GeForce 840M GPU.
Maximum load with both Prime95 and FurMark will draw 44 W from the small 65 W power adapter (7.5 x 7.5 x 3.0 cm).
| Off / Standby | |
| Idle | |
| Load |
|
Key:
min: | |
| Asus X555DA-BB11 A10-8700P, Radeon R6 (Carrizo), Seagate Momentus SpinPoint M8 ST1000LM024 HN-M101MBB, TN LED, 1920x1080, 15.6" | Toshiba Satellite Pro R50-C-16V 6006U, HD Graphics 520, TOSHIBA MQ01ABD075, TN LED, 1366x768, 15.6" | Lenovo Ideapad 110-15ACL 80TJ00H0GE A8-7410, Radeon R5 (Beema/Carrizo-L), Seagate Mobile HDD 1TB ST1000LM035, TN LED, 1366x768, 15.6" | HP Pavilion 15t-X7P42AV i7-7700HQ, GeForce GTX 1050 Mobile, Samsung CM871a MZNTY128HDHP, IPS, 1920x1080, 15.6" | Asus X555LN-XO112H 4210U, GeForce 840M, Toshiba MQ01ABF050, TN LED, 1366x768, 15.6" | |
|---|---|---|---|---|---|
| Power Consumption | 29% | 35% | -68% | 19% | |
| Idle Minimum * (Watt) | 8.3 | 6 28% | 5.4 35% | 8.29 -0% | 4.2 49% |
| Idle Average * (Watt) | 8.6 | 8.7 -1% | 6.8 21% | 8.9 -3% | 6.3 27% |
| Idle Maximum * (Watt) | 13.1 | 9.2 30% | 7.3 44% | 10.2 22% | 7.1 46% |
| Load Average * (Watt) | 31.2 | 18.6 40% | 21.1 32% | 77.1 -147% | 35.2 -13% |
| Load Maximum * (Watt) | 43.9 | 23.8 46% | 25.5 42% | 136.6 -211% | 49.2 -12% |
* ... smaller is better
Battery Life
Runtimes are very disappointing at just under 3 hours of real-world WLAN use when on the Balanced profile setting and on a screen brightness of 150 nits (setting 75/10). The Satellite Pro R50-C can last for over twice as long under the same conditions and even the Lenovo Ideapad 110 can outlast our Asus with a much smaller internal battery capacity. We recommend running on the Power Saver profile if only using the system for media playback or general word processing in order to extend battery life as much as possible.
Charging from near empty to full capacity will take just over two hours.
| Asus X555DA-BB11 A10-8700P, Radeon R6 (Carrizo), 37 Wh | Toshiba Satellite Pro R50-C-16V 6006U, HD Graphics 520, 44 Wh | Lenovo Ideapad 110-15ACL 80TJ00H0GE A8-7410, Radeon R5 (Beema/Carrizo-L), 24 Wh | HP Pavilion 15t-X7P42AV i7-7700HQ, GeForce GTX 1050 Mobile, 63.3 Wh | Asus X555LN-XO112H 4210U, GeForce 840M, 37 Wh | |
|---|---|---|---|---|---|
| Battery runtime | 103% | 17% | 100% | ||
| Reader / Idle (h) | 7.3 | 16 119% | |||
| WiFi v1.3 (h) | 2.9 | 5.9 103% | 3.4 17% | 6.5 124% | |
| Load (h) | 1.2 | 1.9 58% | |||
| WiFi (h) | 4.3 |
Pros
Cons
Verdict
The X555DA is a difficult recommendation especially when the older Intel-equipped X555LN or X555LD SKUs can outperform and outlast our AMD equivalent. Normally when the hardware is slower and cheaper, users are more likely to expect longer battery life and lower core temperatures to compensate. The X555DA is the worst of both worlds as both performance and battery life are below average.
Outside of the slow AMD APU, the Asus hardware suffers from its own series of issues. The lid and keyboard base flex too easily for our liking and the 1080p TN display has very poor color reproduction. Interested users will be better off with previously released ULV Broadwell or even Haswell notebooks than what Asus has to offer in this AMD SKU.
This notebook fails as an inexpensive primary consumer PC because of its short battery life, poor display, and slow performance. Intel alternatives dating as far back as three or four years will still give more bang for the buck on nearly every aspect there is to offer.
Asus X555DA-BB11
- 04/13/2017 v6 (old)
Allen Ngo
Price comparison
