Lenovo Tablet 10 (Celeron N4100, eMMC, LTE, WUXGA) Tablet Review

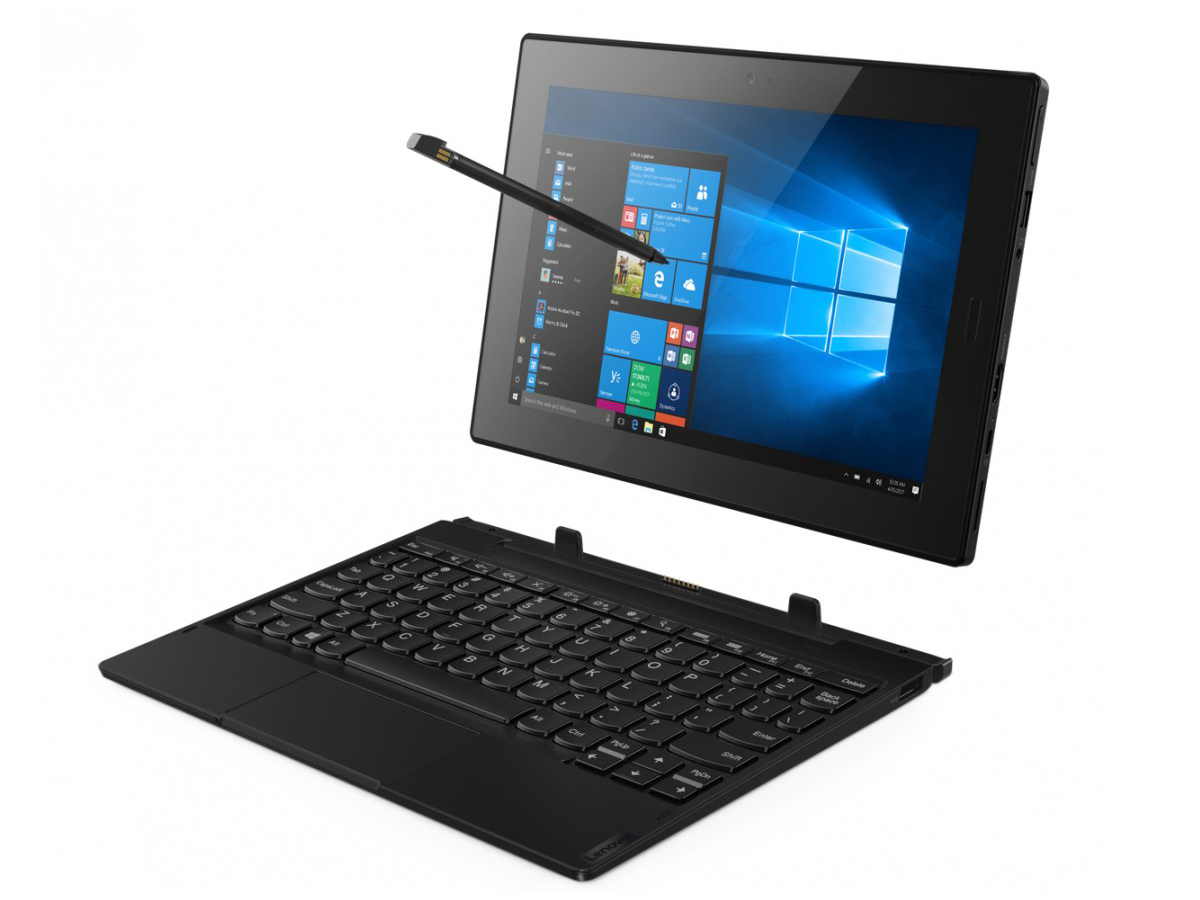
Lenovo’s Tablet 10 is a 10.1-inch Windows tablet aimed primarily at business users. It is powered by a Gemini Lake-based Celeron quad-core processor. Its main competitors are the Asus Transformer Book T102HA, the Huawei MediaPad M5 10.8 Pro, the Microsoft Surface Go, and the Apple iPad Pro 10.5.
Case
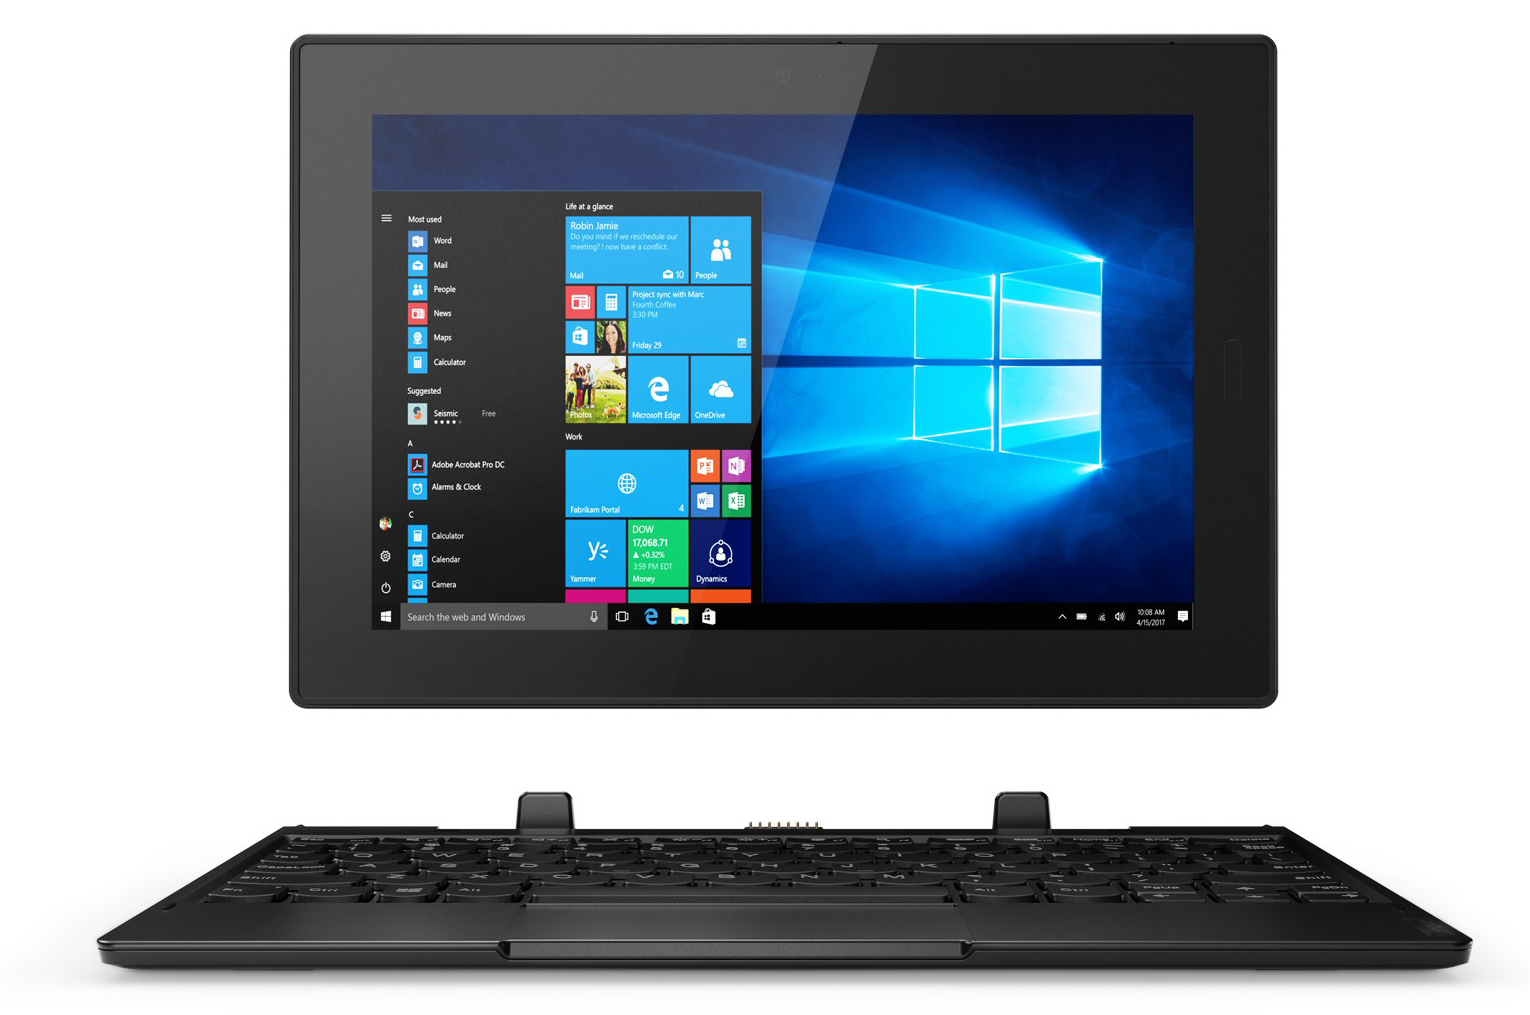
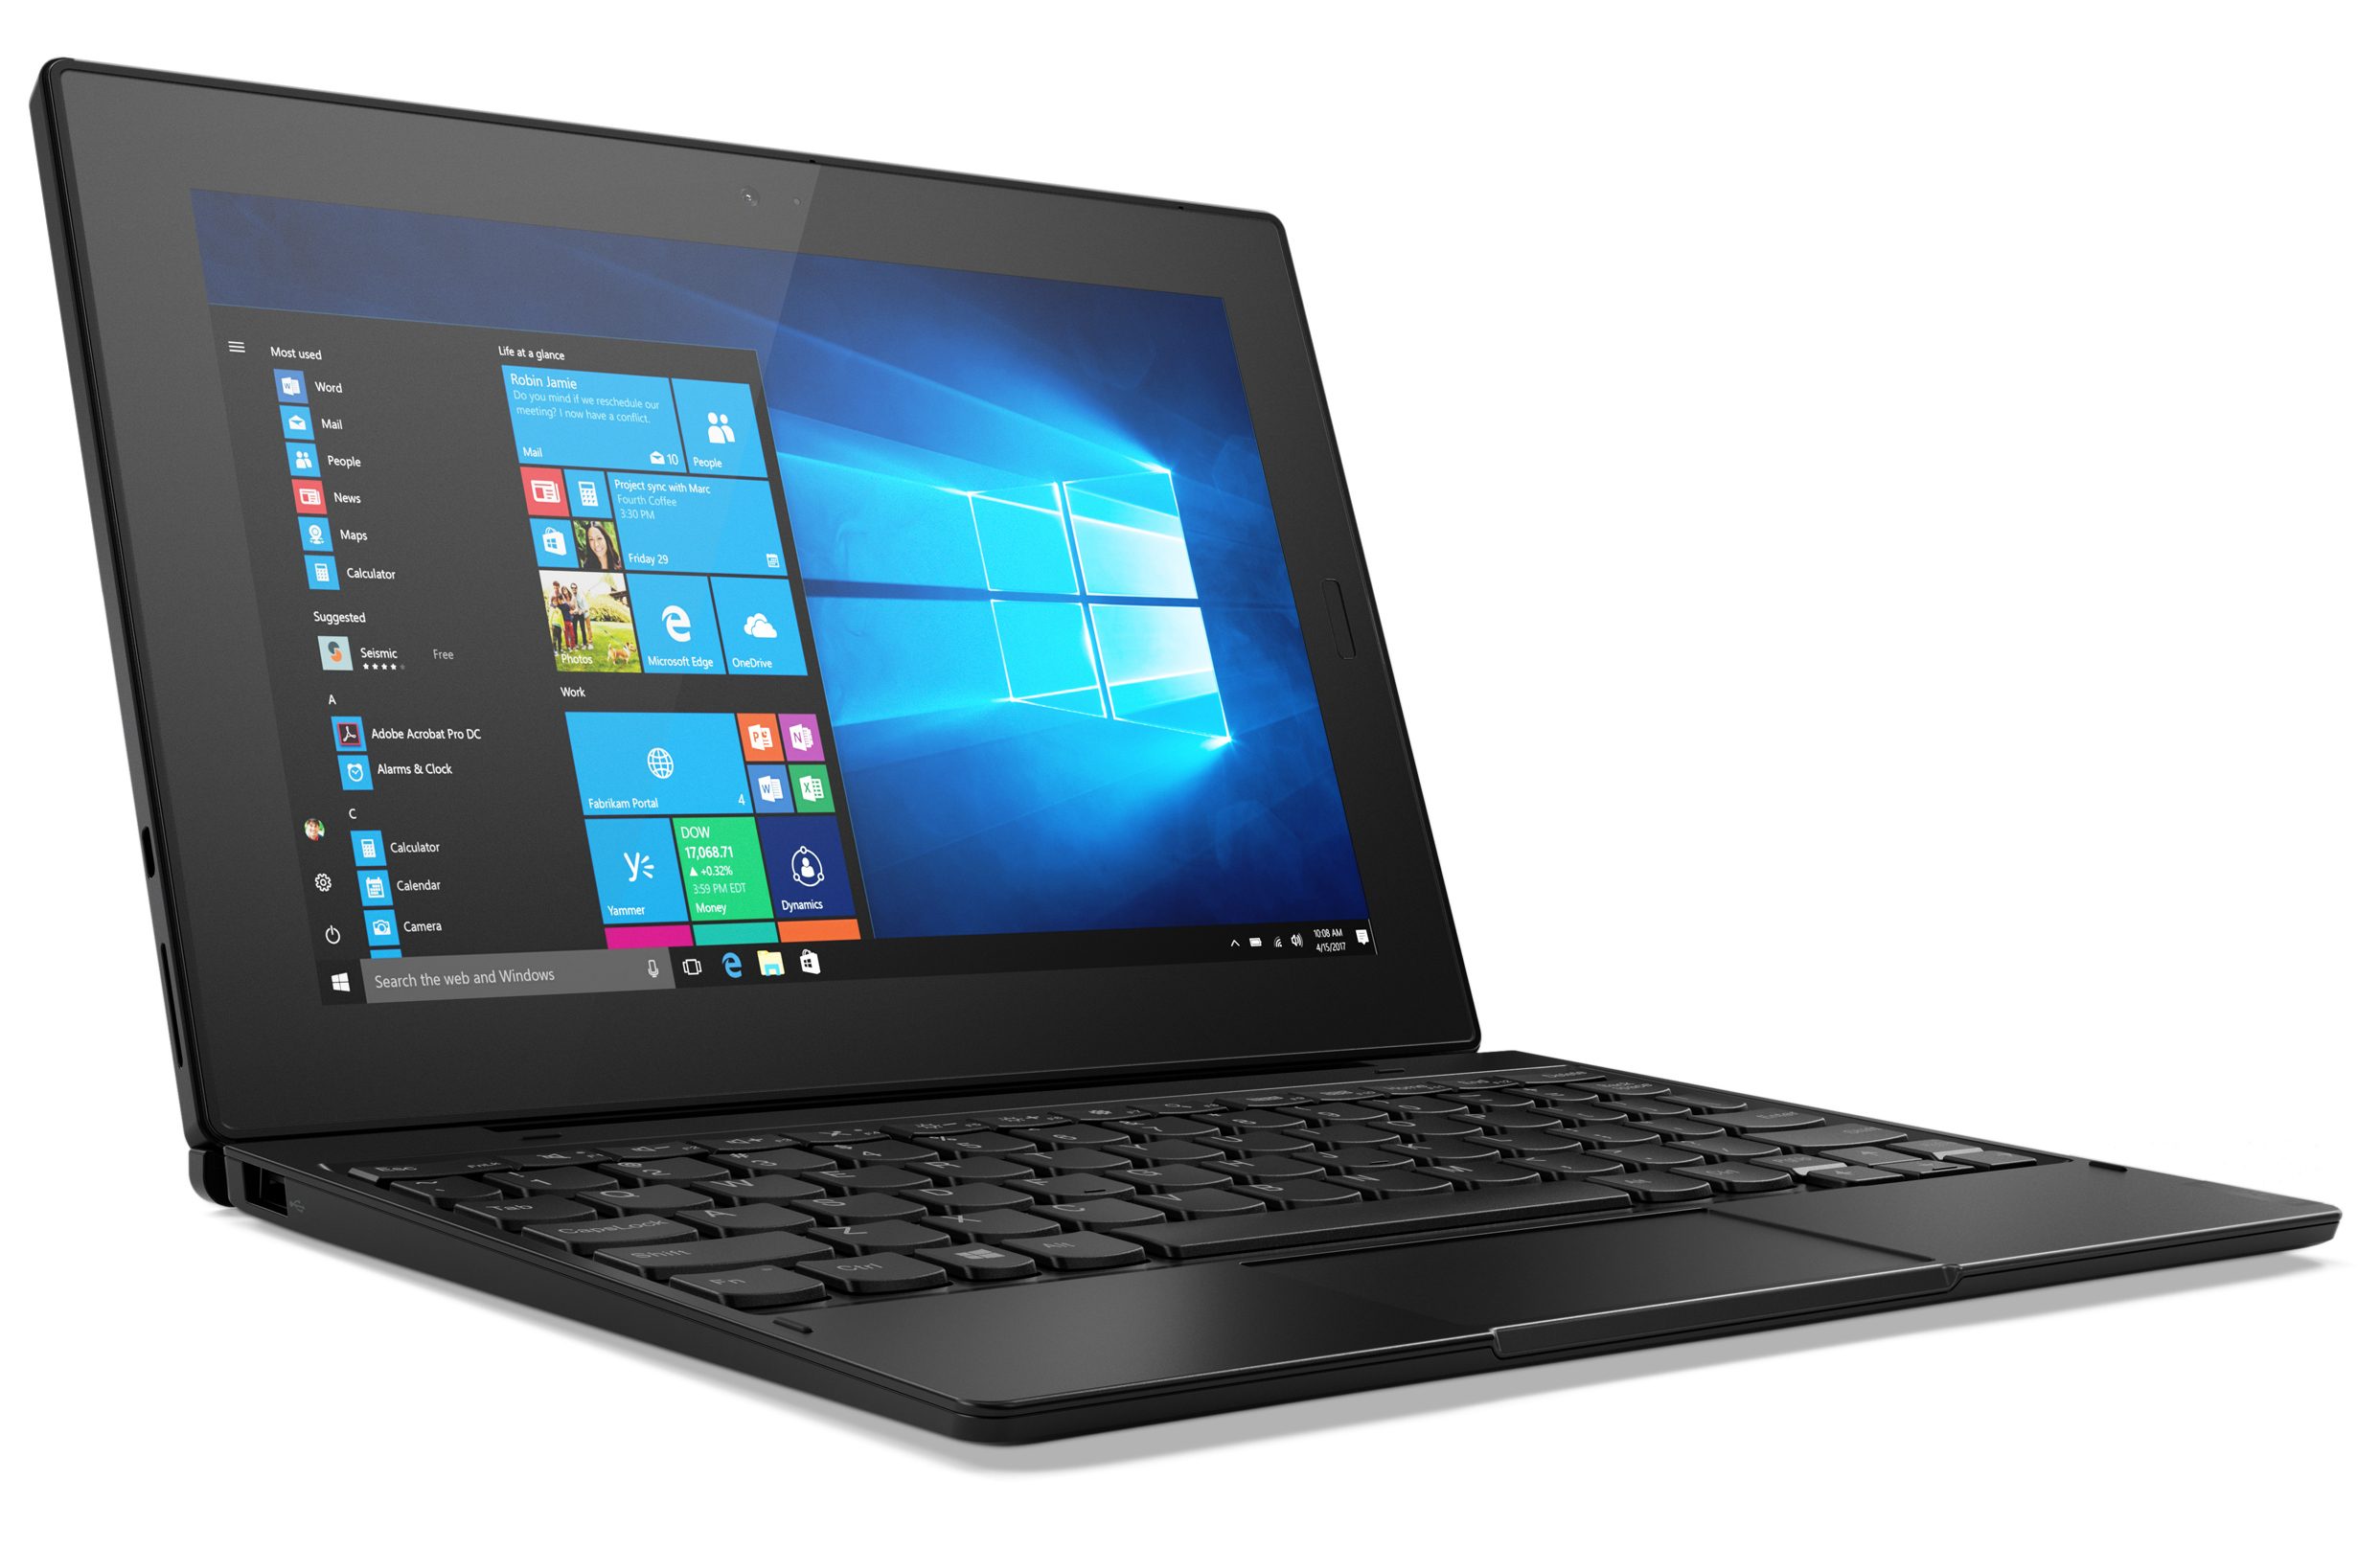
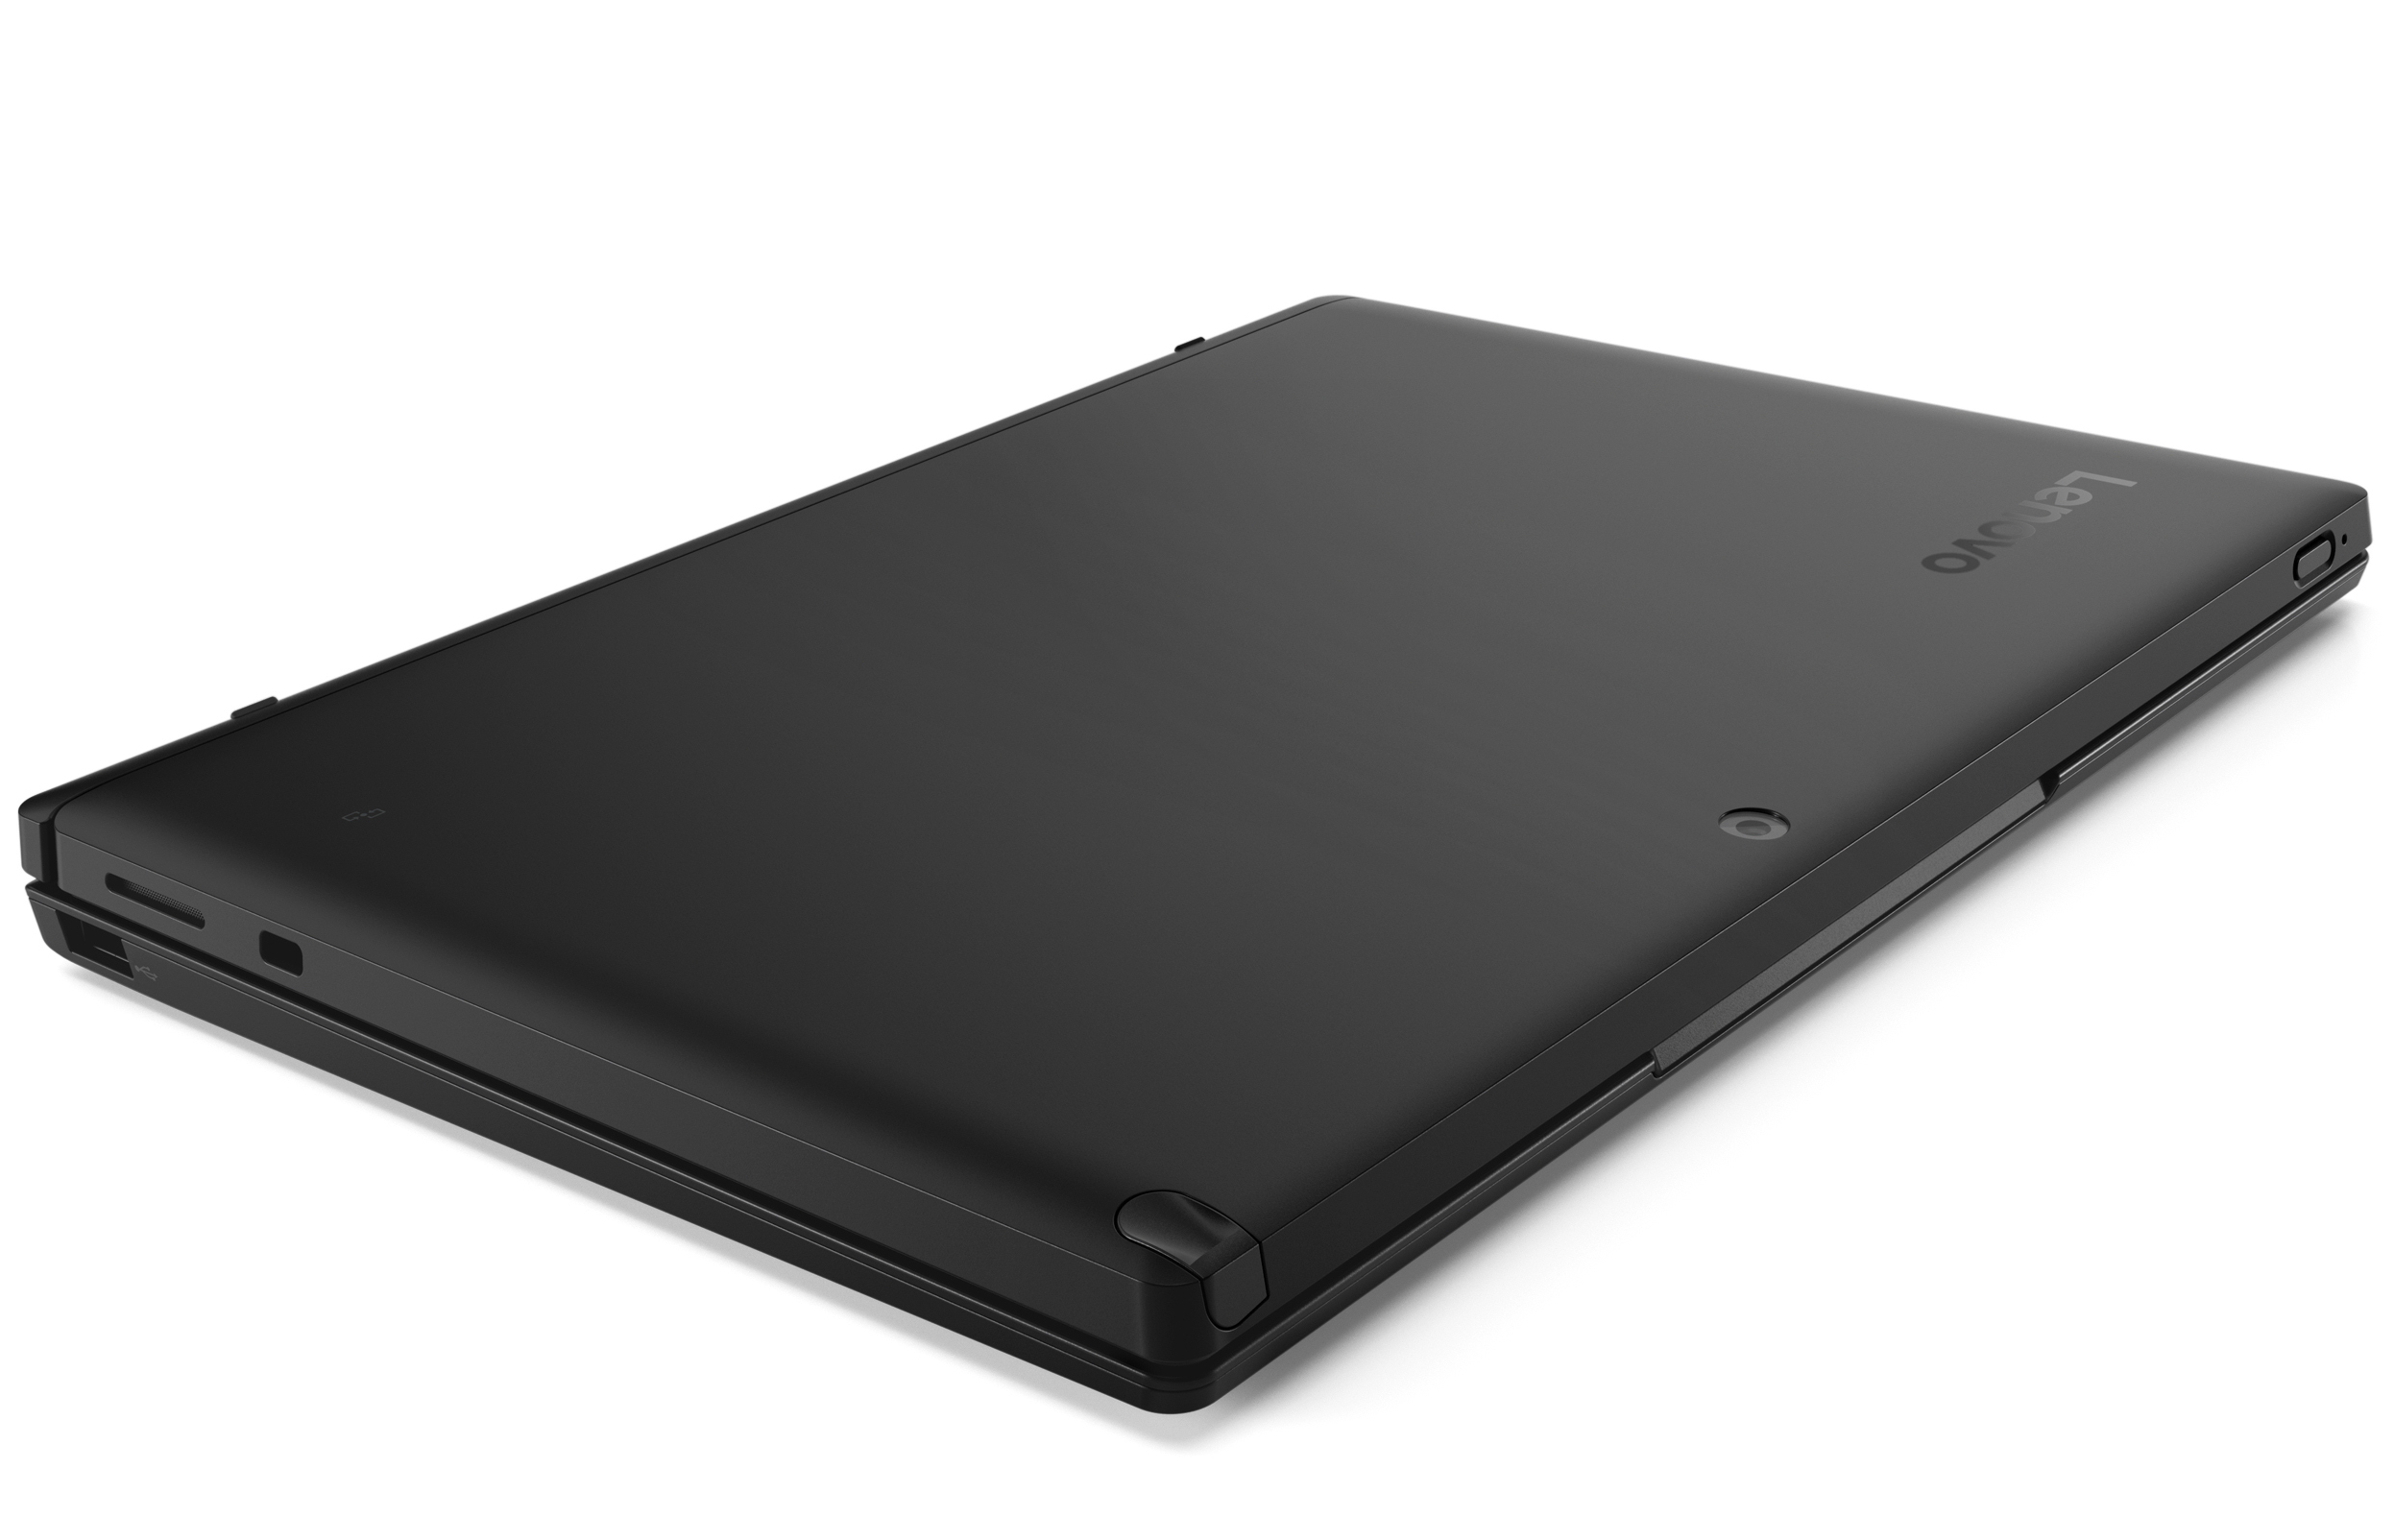
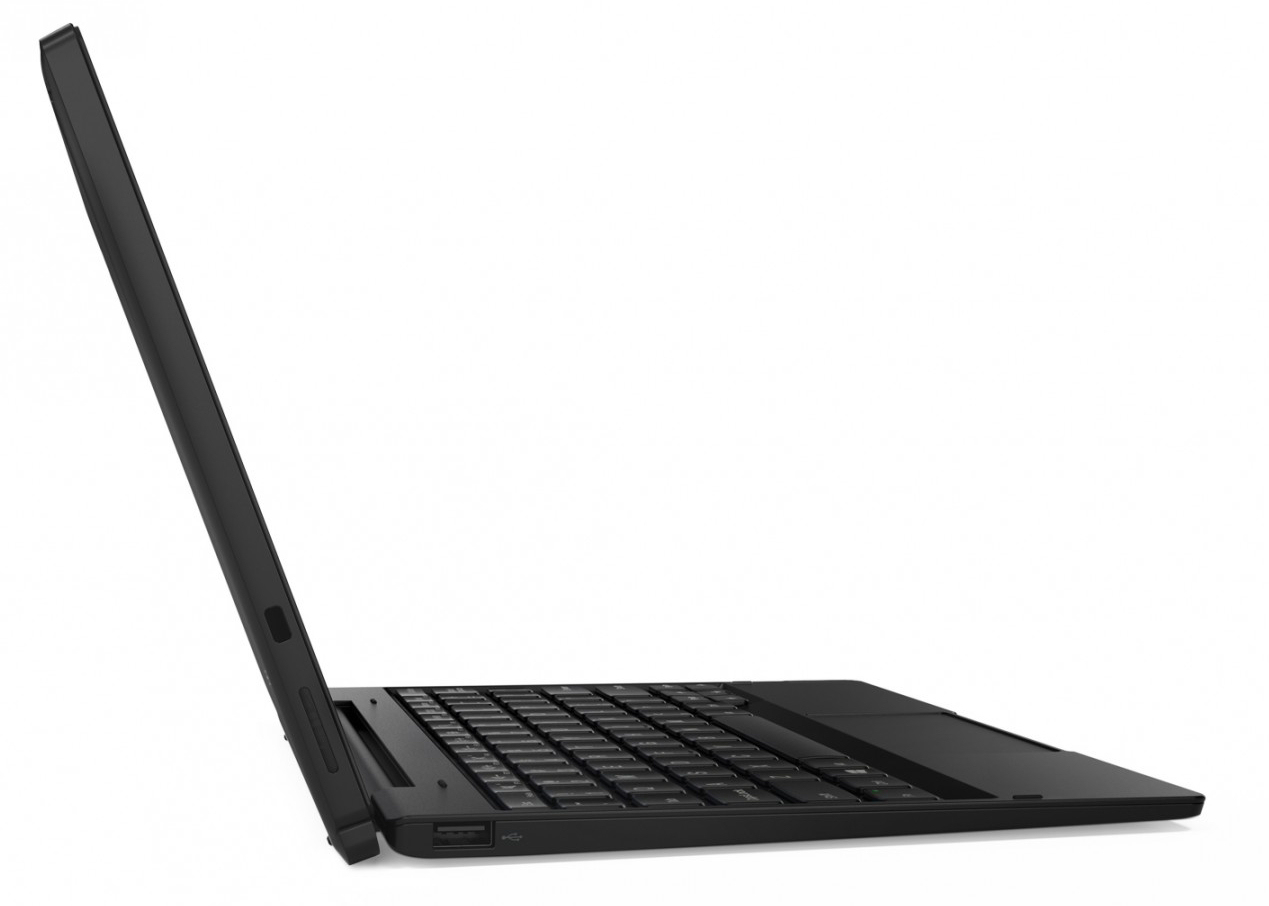
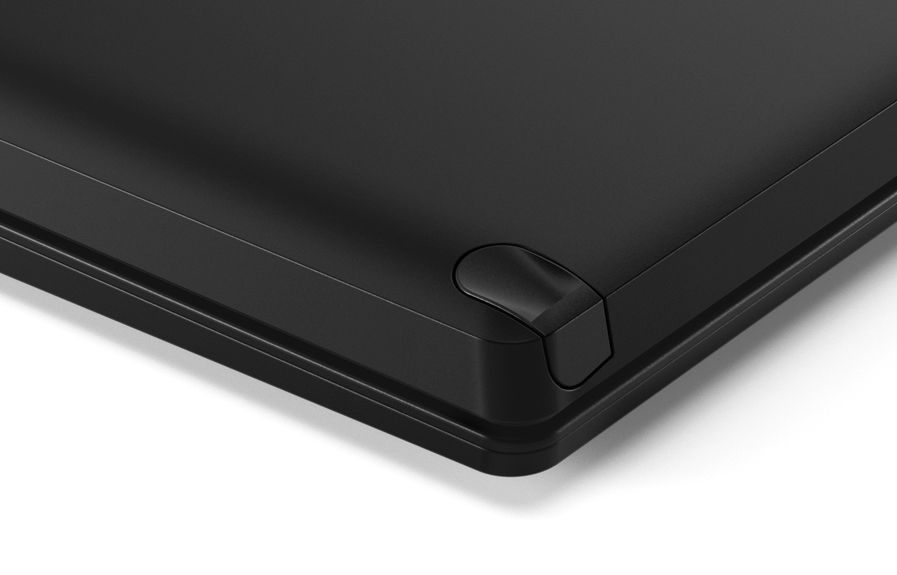
The tablet and keyboard dock are made entirely of black plastic. With its weight of 664 g (1.46 lbs) and a thickness of 10.6 mm (0.42 inches) it is both thicker and heavier than most of its competitors. Throw in the keyboard dock and the device tops out at 1.2 kg (2.65 lbs) and 22 mm (0.87 inches). The case was very well-made and robust; however, we found the keyboard dock to be somewhat flimsy and easy to warp.
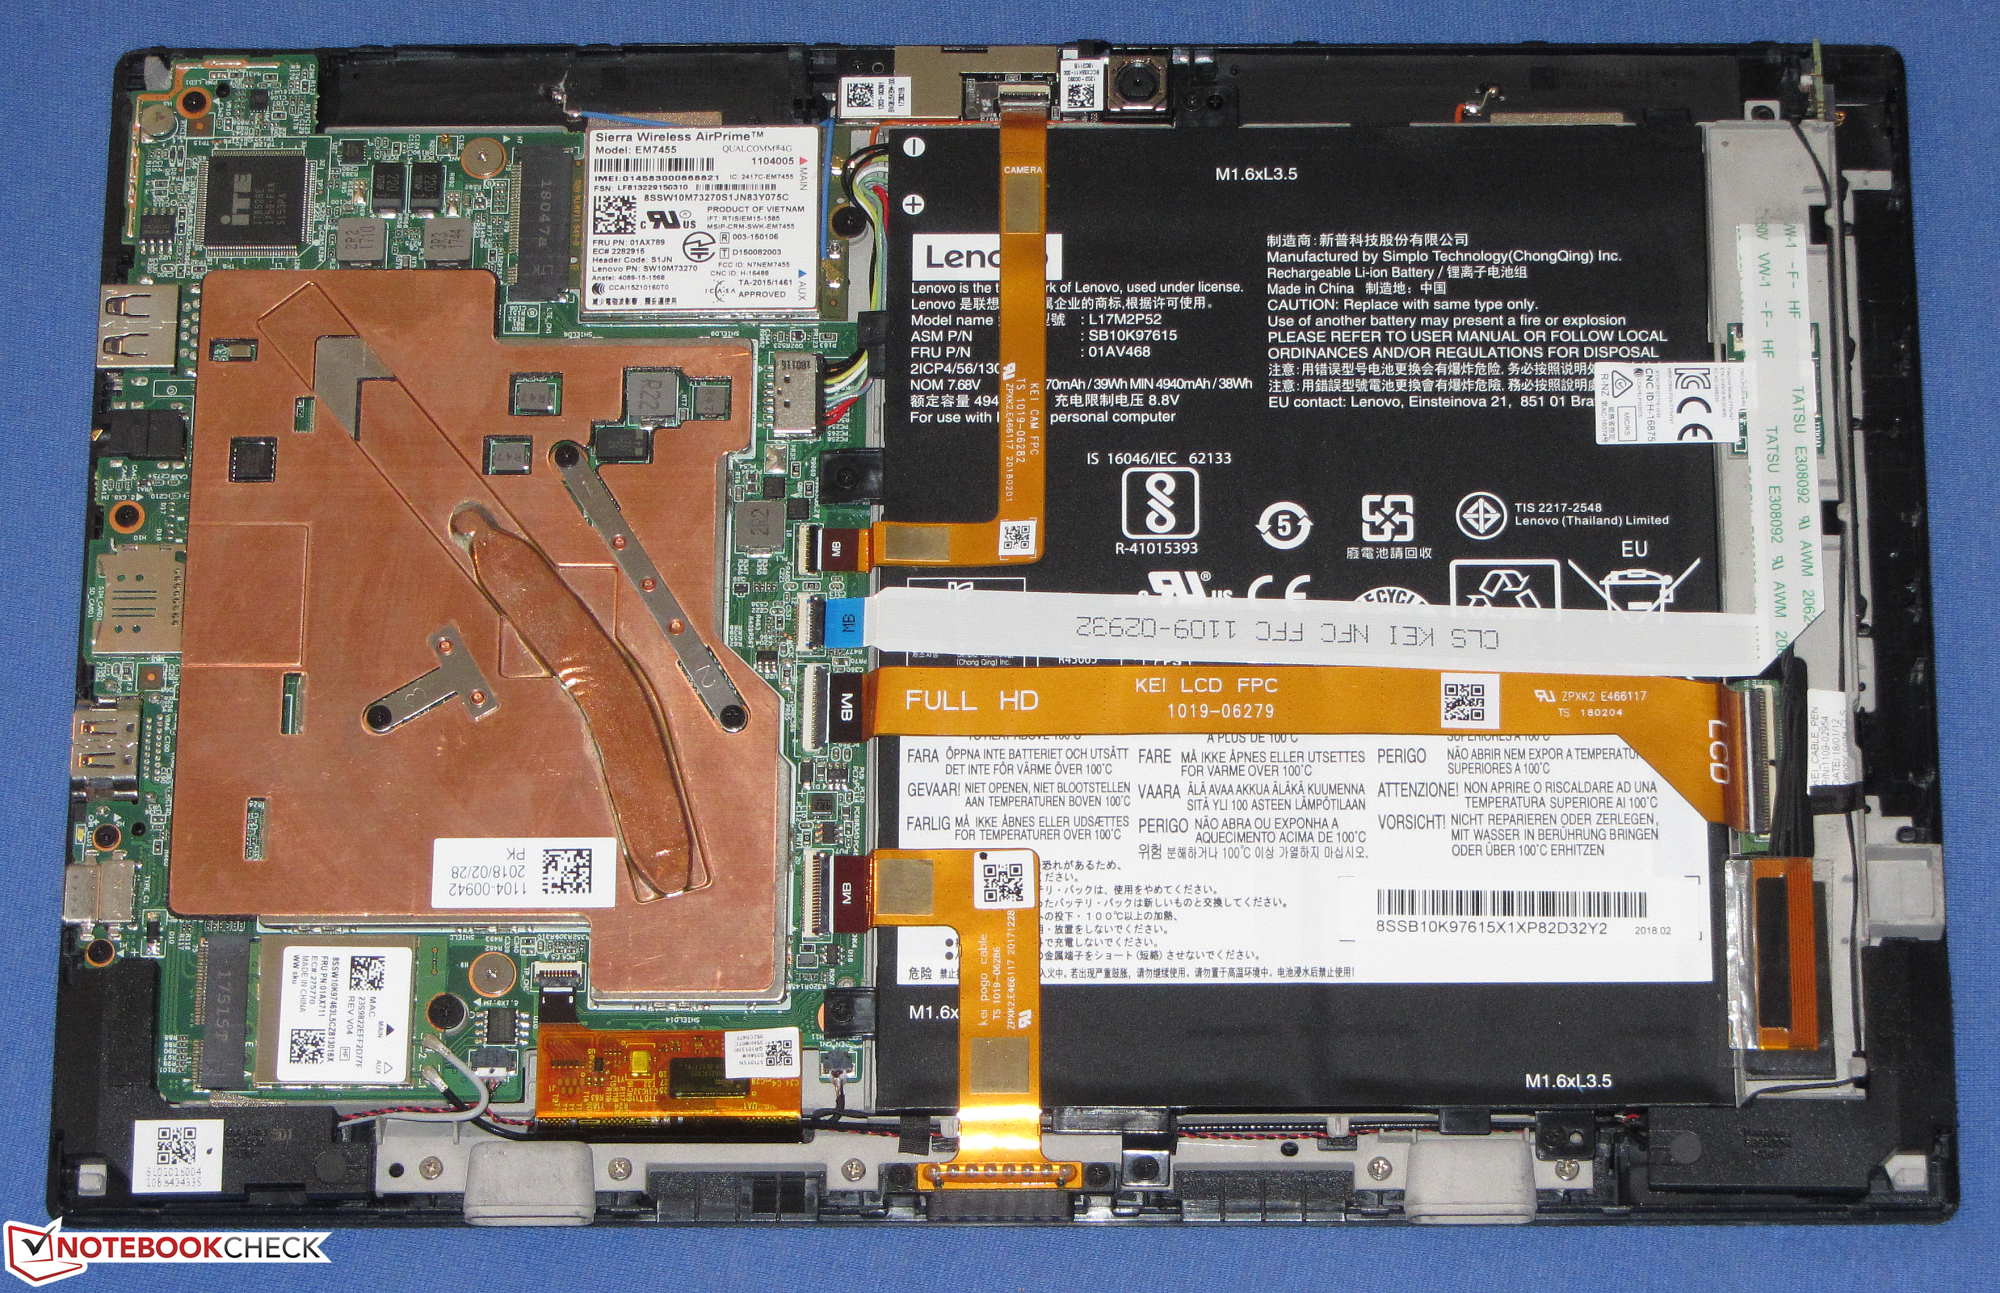
Maintenance is comparatively simple. The rear cover is neither screwed nor glued to the device but rather secured with clips. It can be easily removed. All you need is a thin spudger tool and some care in order to avoid damaging the display.
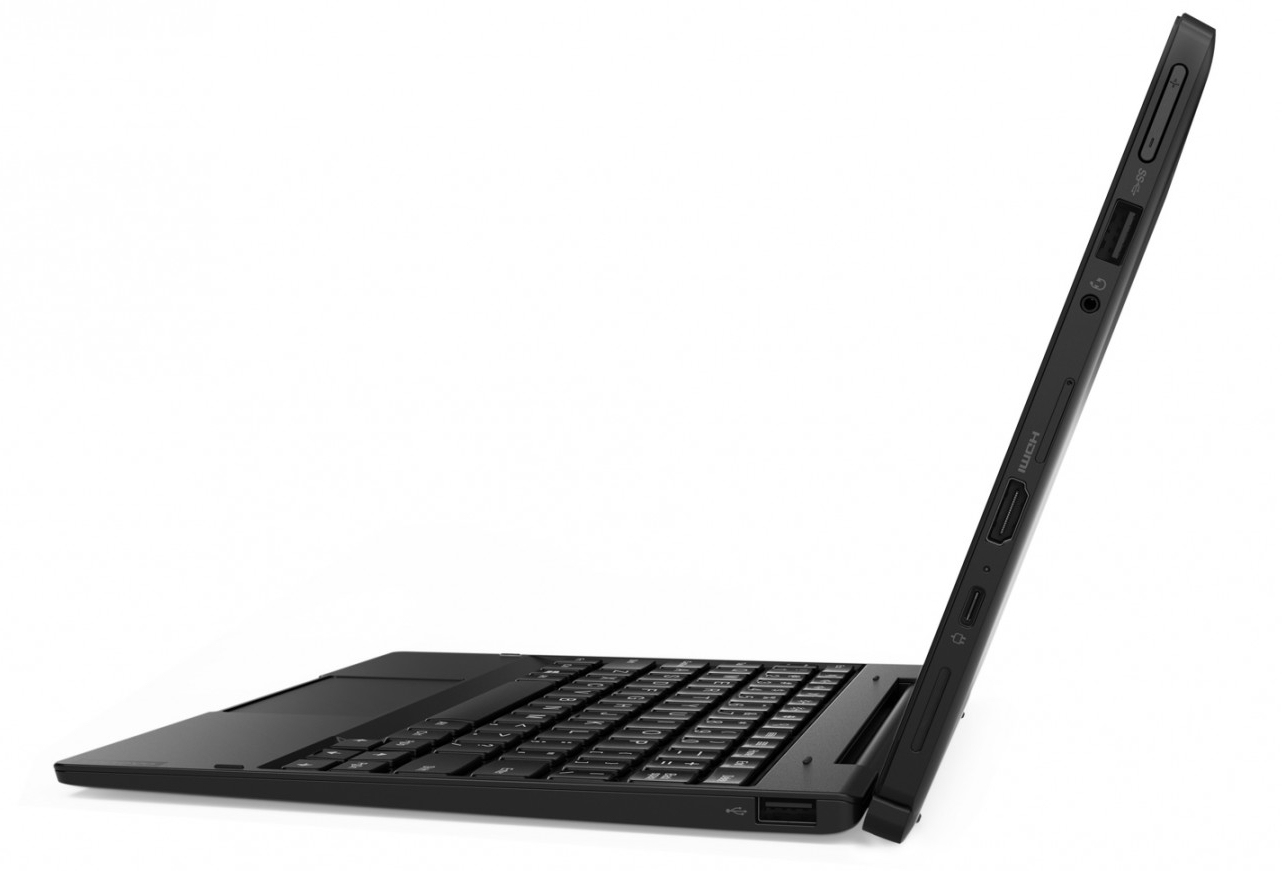
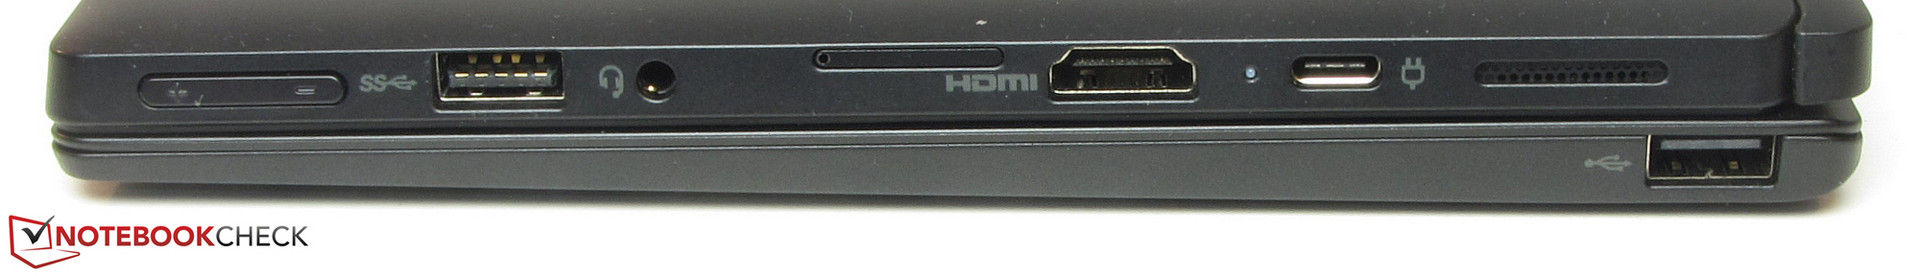
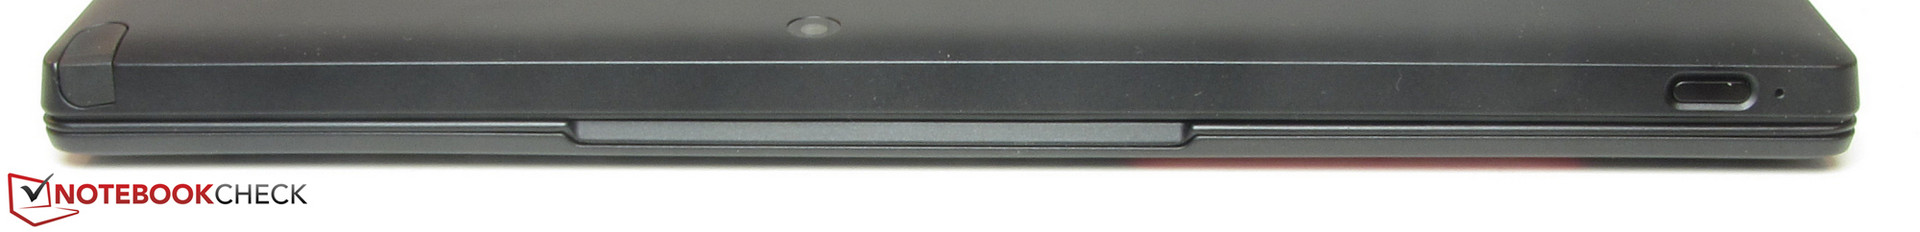
A benefit of the relatively thick case is port availability. There was enough space to incorporate a full-sized HDMI port, a USB Type-A port (USB 3.1 Gen 1), and a USB Type-C port (USB 3.1 Gen 1) that is also used for charging. Two additional USB Type-A ports can be found on the keyboard dock, however those are only connected via USB 2.0.
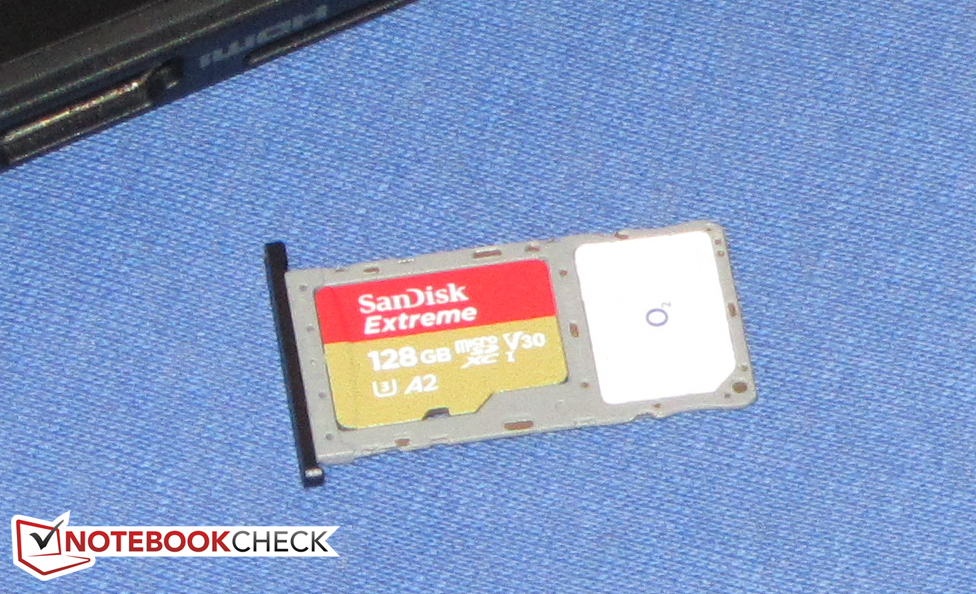
The built-in MicroSD card reader is fairly speedy and reached transfer rates of up to 72.9 MB/s while copying large blocks of data. Transferring 250 JPEG files of around 5 MB each resulted in a speed of 66 MB/s. All card readers are tested with our 64 GB Toshiba Exceria Pro M501 reference card.
The Wi-Fi modem is made by Realtek (8822BE) and supports 802.11 a/b/g/n/ac. It performed admirably under ideal conditions (no other Wi-Fi devices nearby, close distance between sender and receiver).
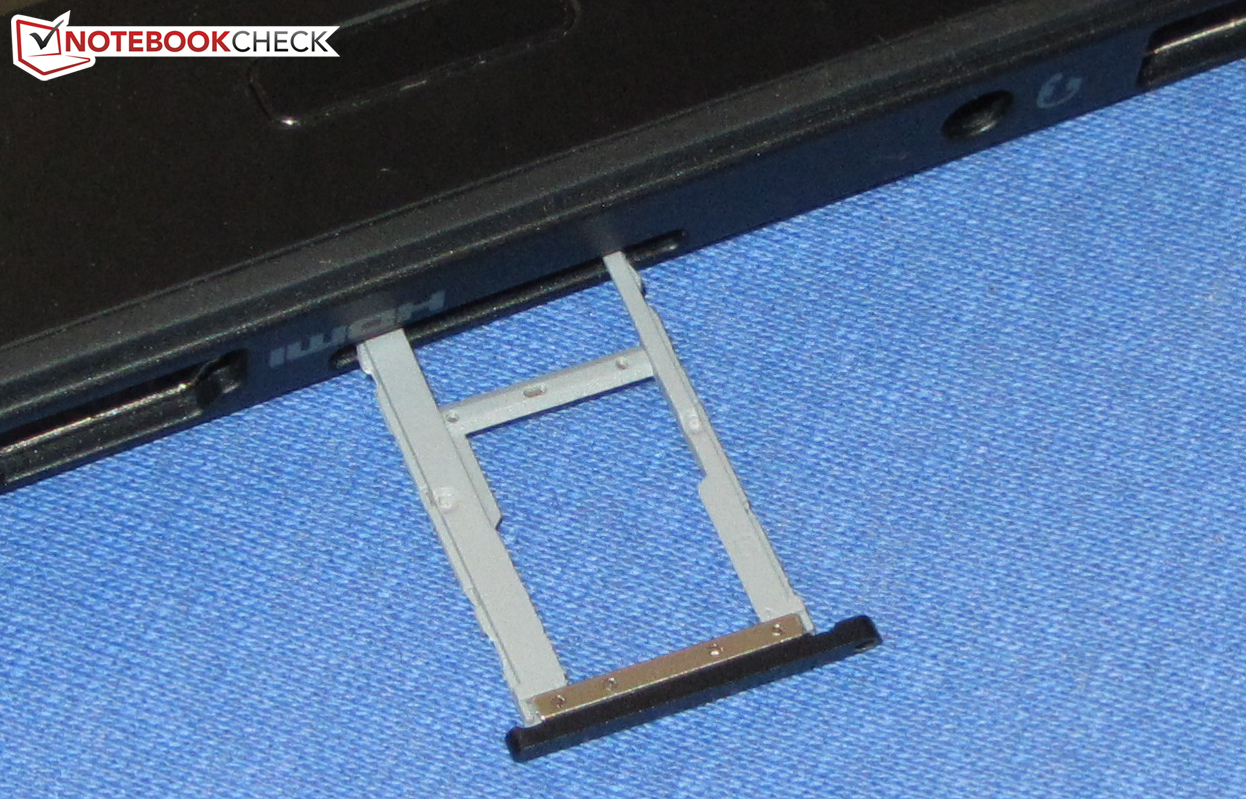
Our review unit was also equipped with an LTE modem and thus is capable of connecting to the Internet via cellular networks. This modem is optional. Not every Tablet 10 SKU is equipped accordingly. It requires a nano-SIM card.
Connectivity

| SD Card Reader | |
| average JPG Copy Test (av. of 3 runs) | |
| Microsoft Surface Go MHN-00003 (Toshiba Exceria Pro M501) | |
| Lenovo Tablet 10-20L3000KGE (Toshiba Exceria Pro M501) | |
| Asus Transformer Book T102HA-GR022T (Toshiba Exceria Pro M501 microSDXC 64GB) | |
| Average of class Tablet (10.2 - 79.2, n=44, last 2 years) | |
| maximum AS SSD Seq Read Test (1GB) | |
| Average of class Tablet (n=1last 2 years) | |
| Microsoft Surface Go MHN-00003 (Toshiba Exceria Pro M501) | |
| Lenovo Tablet 10-20L3000KGE (Toshiba Exceria Pro M501) | |
Input Devices
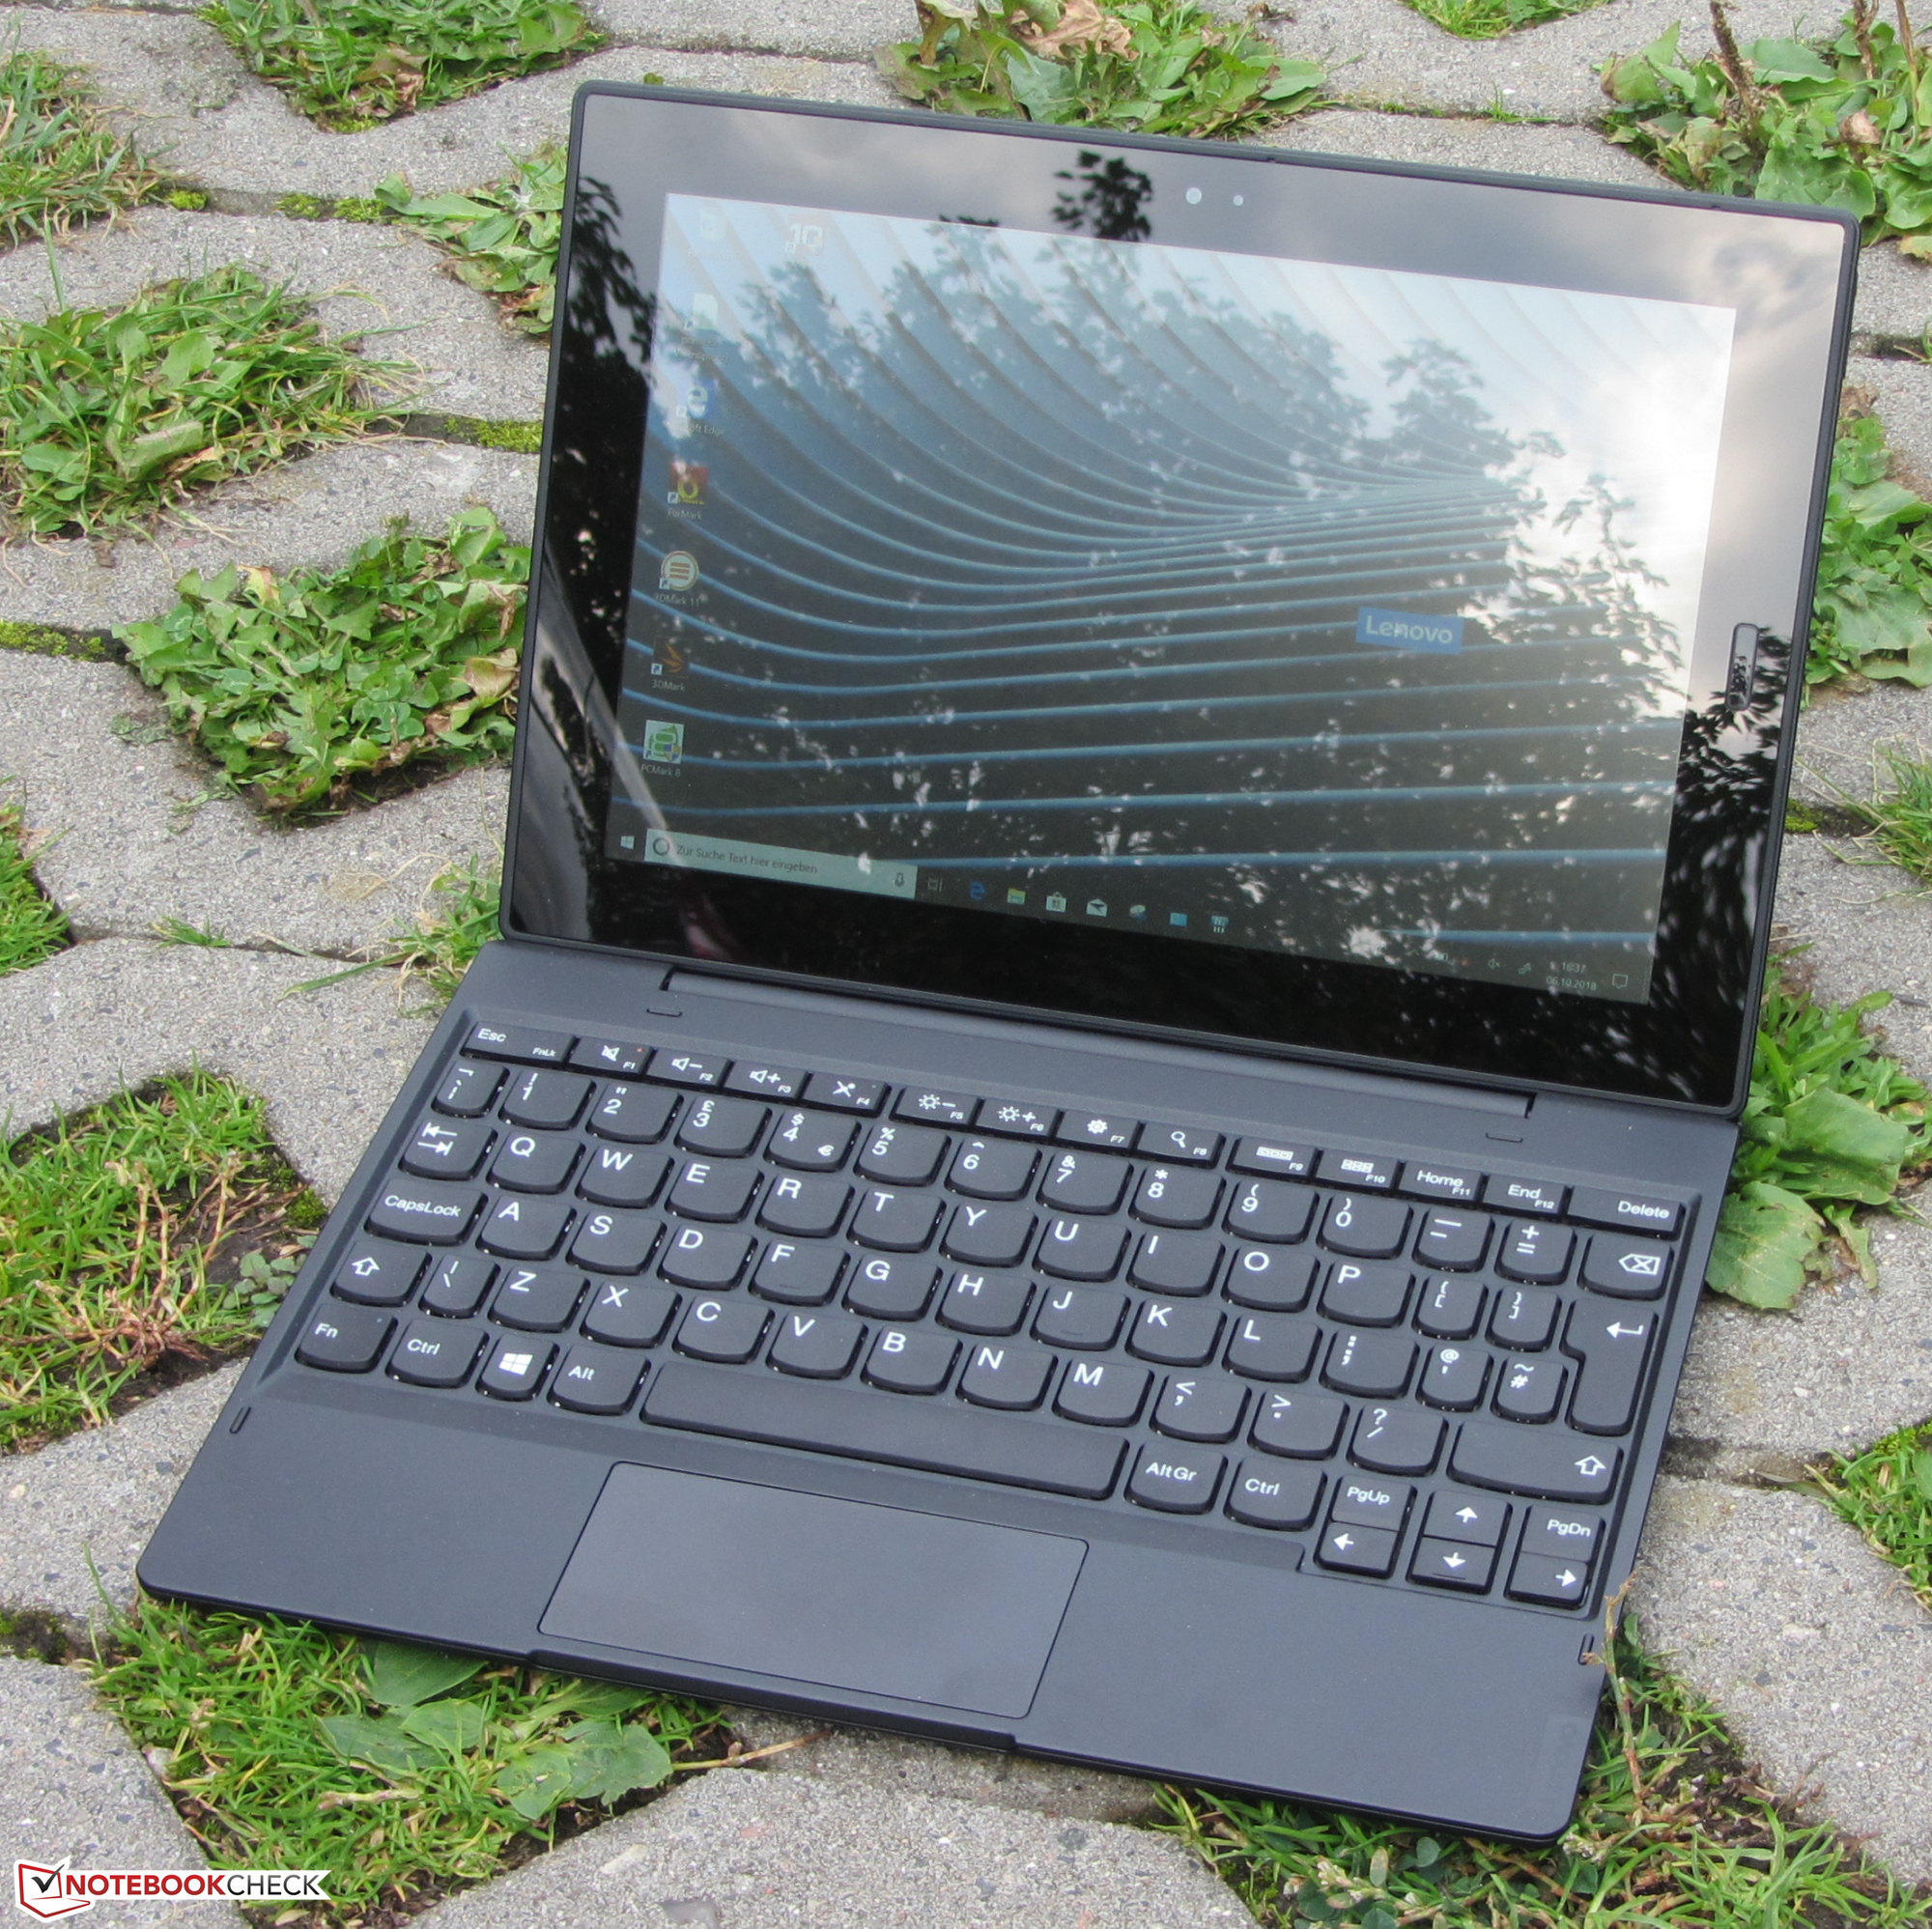
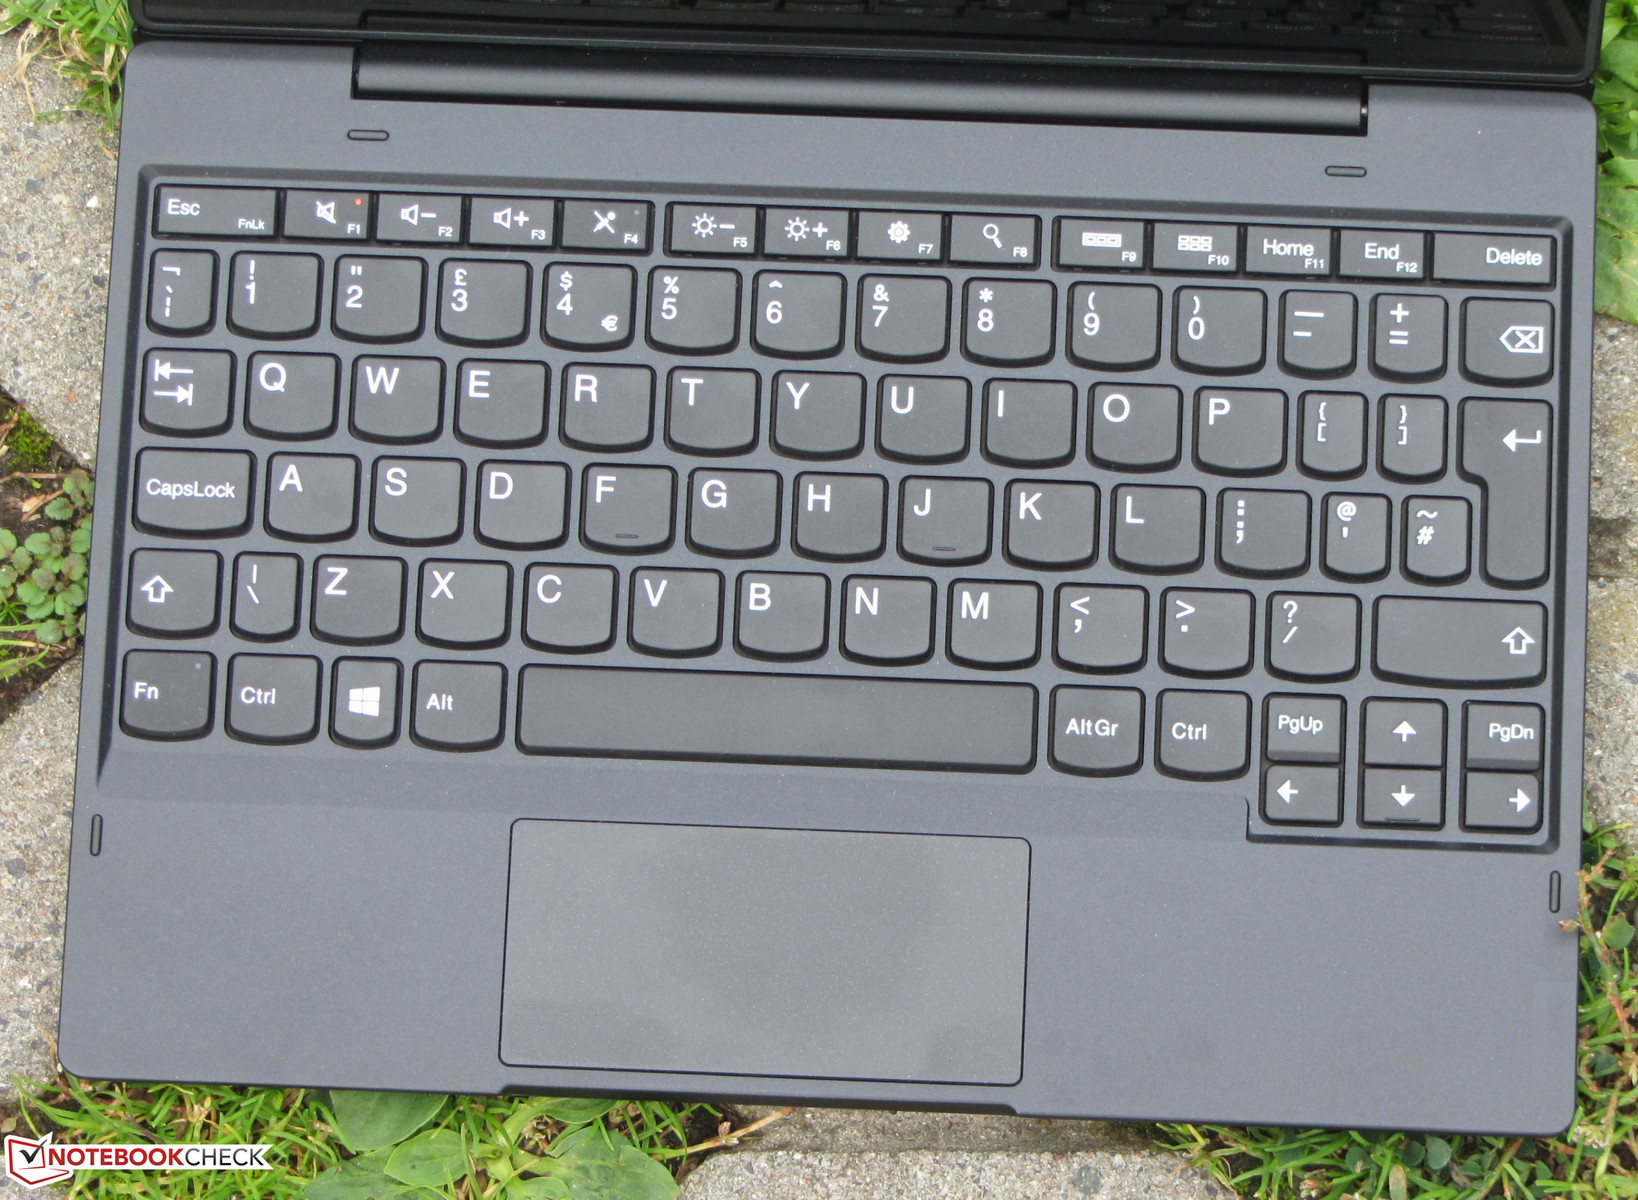
The included keyboard dock houses a chiclet-style keyboard with slightly roughened concave keys featuring a very distinct accentuation point. Feedback was decent in our opinion. Due to its construction the keyboard flexed a little bit while typing. This was not too annoying. All things considered the keyboard was decent and usable, albeit it lacked a backlight.
The multitouch-capable ClickPad measured in at 9 x 4.3 cm (3.54 x 1.7 inches). It was thus sufficiently large for gesture input. Its surface was very pleasant and smooth. The ClickPad detected input up to its edges. Key travel was short, but the accentuation point was well defined and audible.
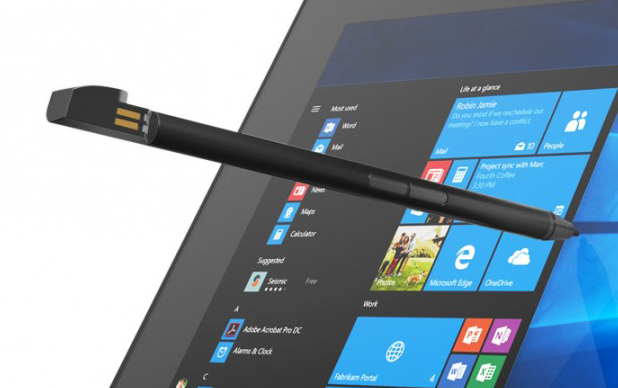
The touchscreen supports finger input as well as the included ActivePen stylus. The display is capable of detecting 10-point multitouch input and was very responsive. The stylus is stored inside the tablet. It featured two buttons and a non-replaceable battery, which is charged inside its slot.
Display
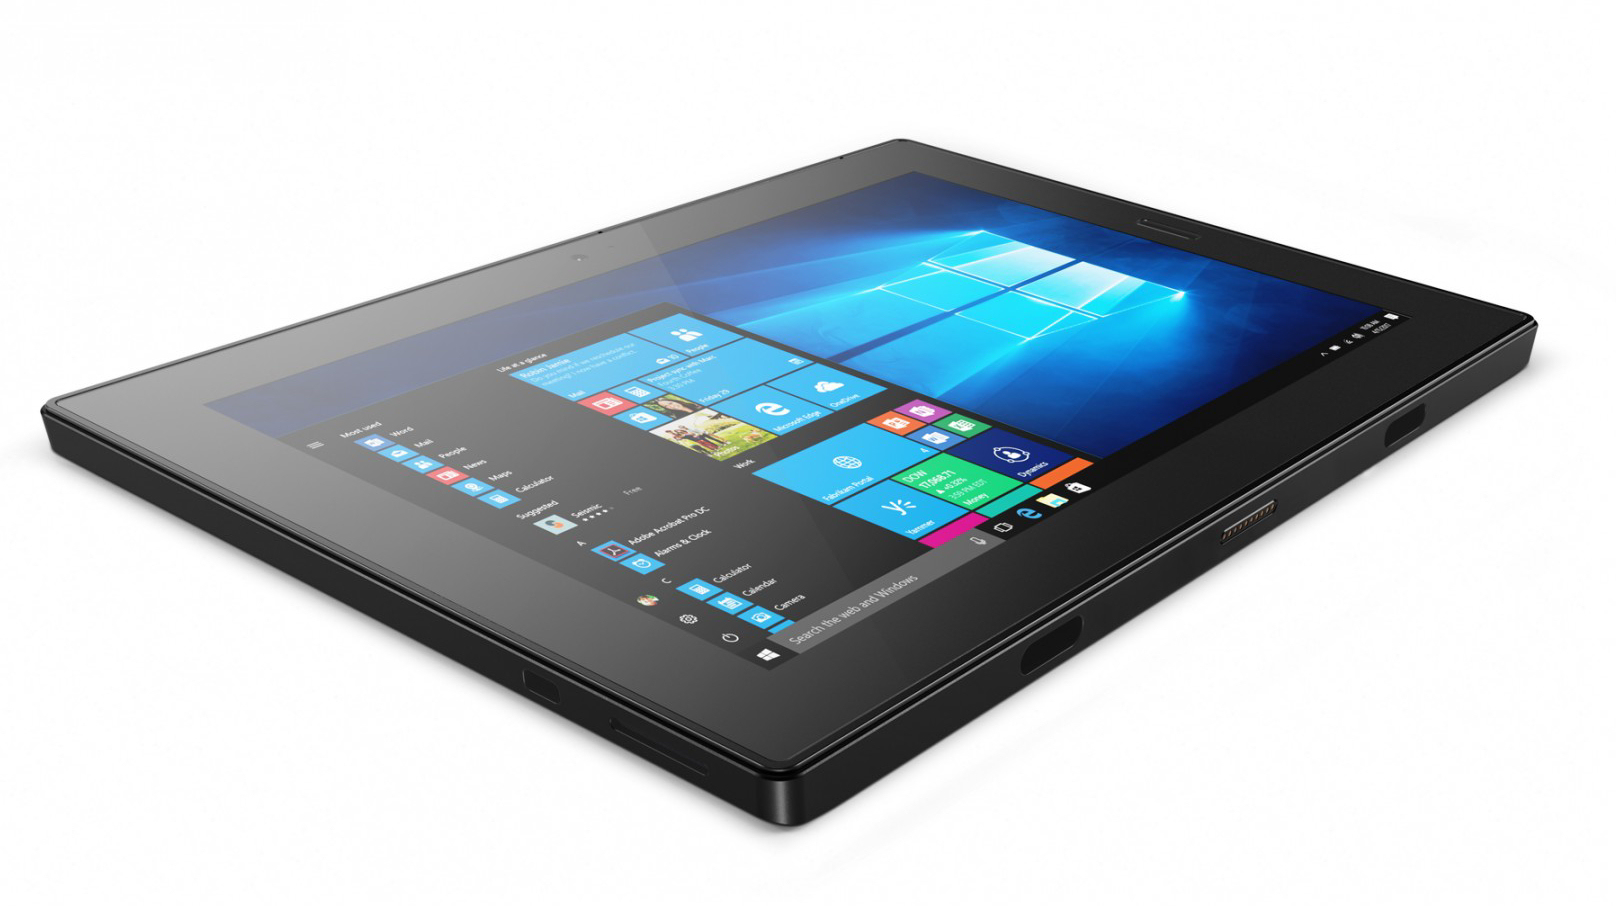
The 10.1-inch touchscreen display featured a native resolution of 1920x1200. Its contrast ratio was decent (923:1), but on the other hand the maximum brightness was mediocre at best (276.6 nits). A tablet at this price point with the added business pretense should have been much brighter. All of the competitors used for the sake of this comparison were brighter than the Tablet 10.
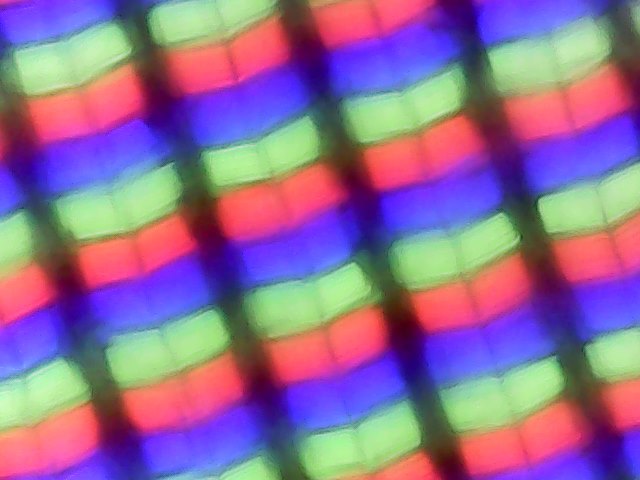
Unfortunately, at brightness levels of 90% and below the display showed PWM flickering at a low frequency of 198 Hz. This low frequency may cause headaches and/or sore eyes for sensitive users.
| |||||||||||||||||||||||||
Brightness Distribution: 87 %
Center on Battery: 272 cd/m²
Contrast: 923:1 (Black: 0.3 cd/m²)
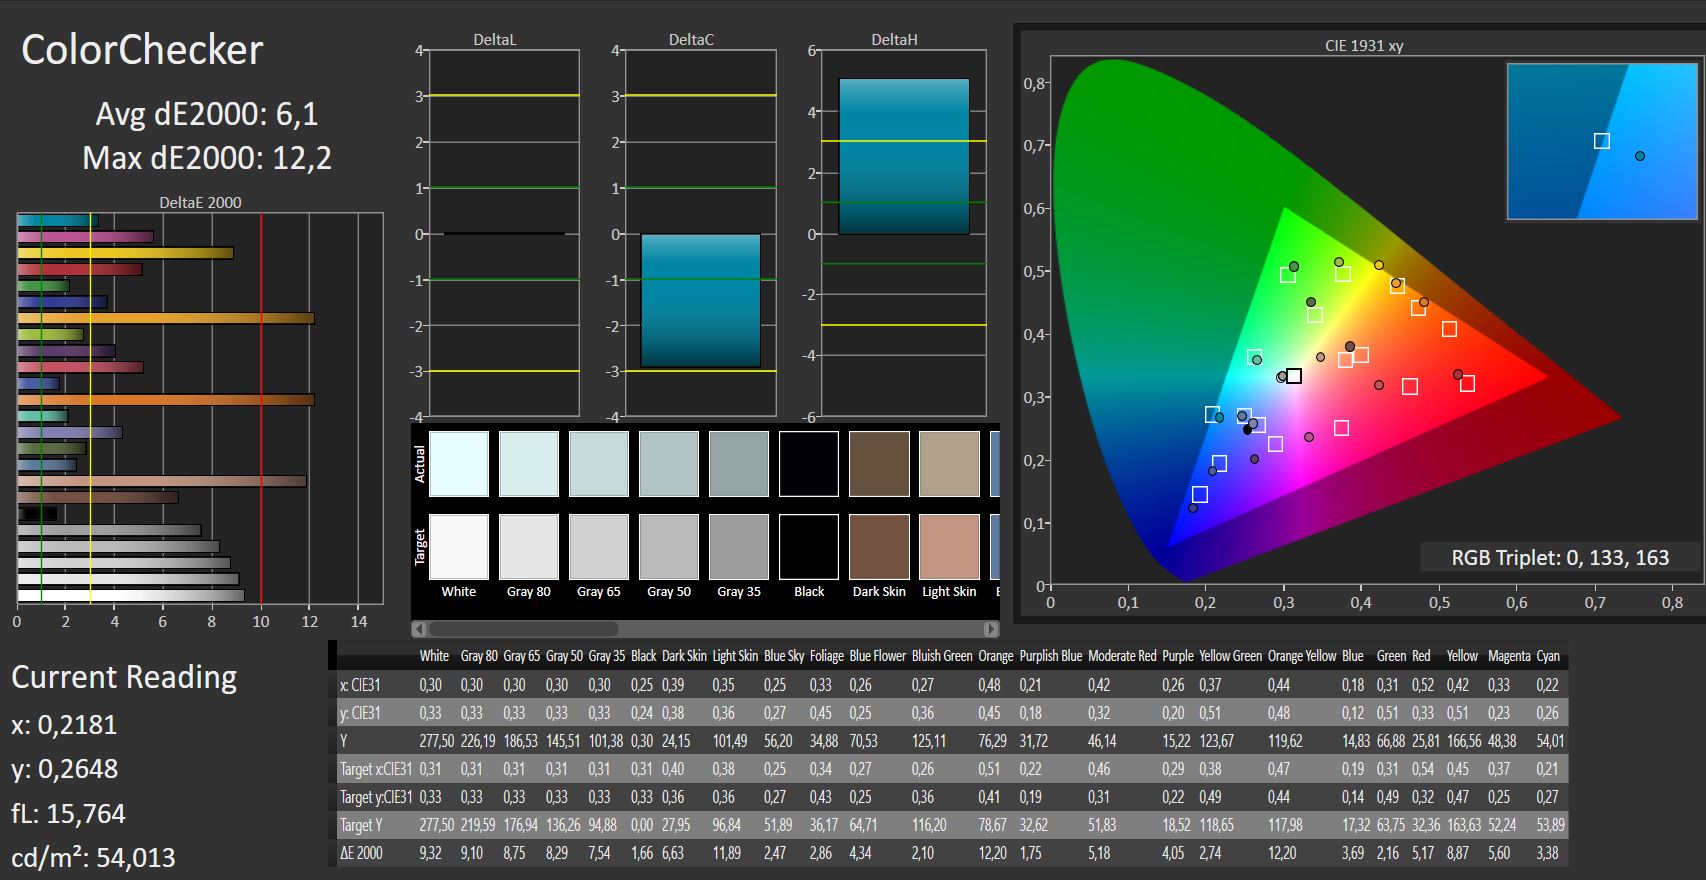
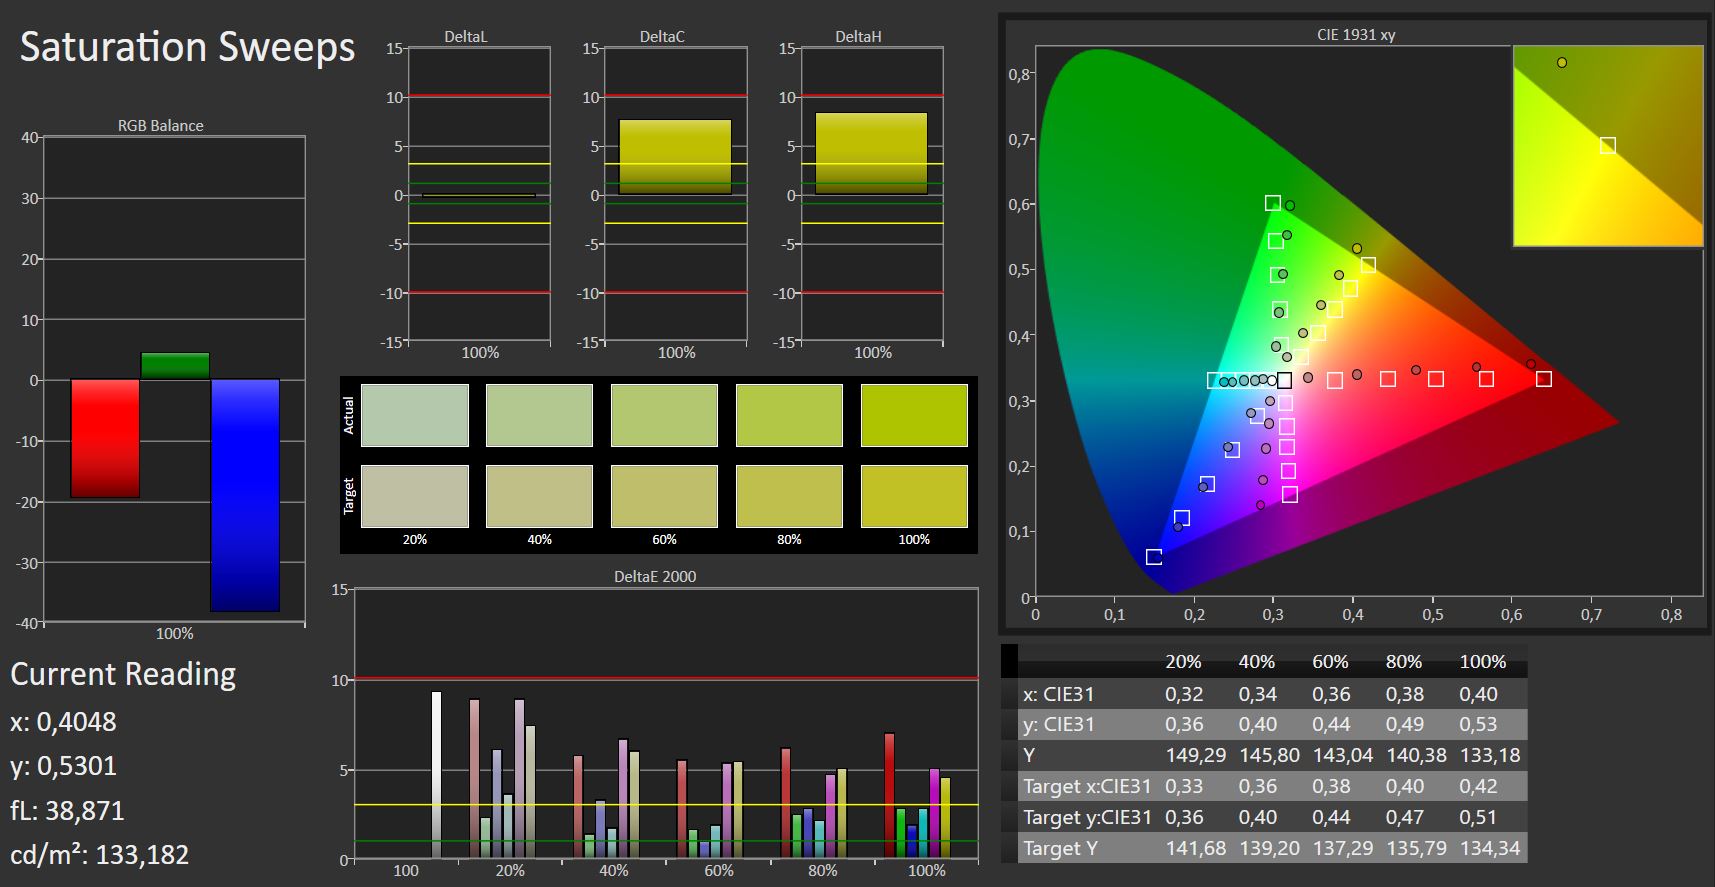
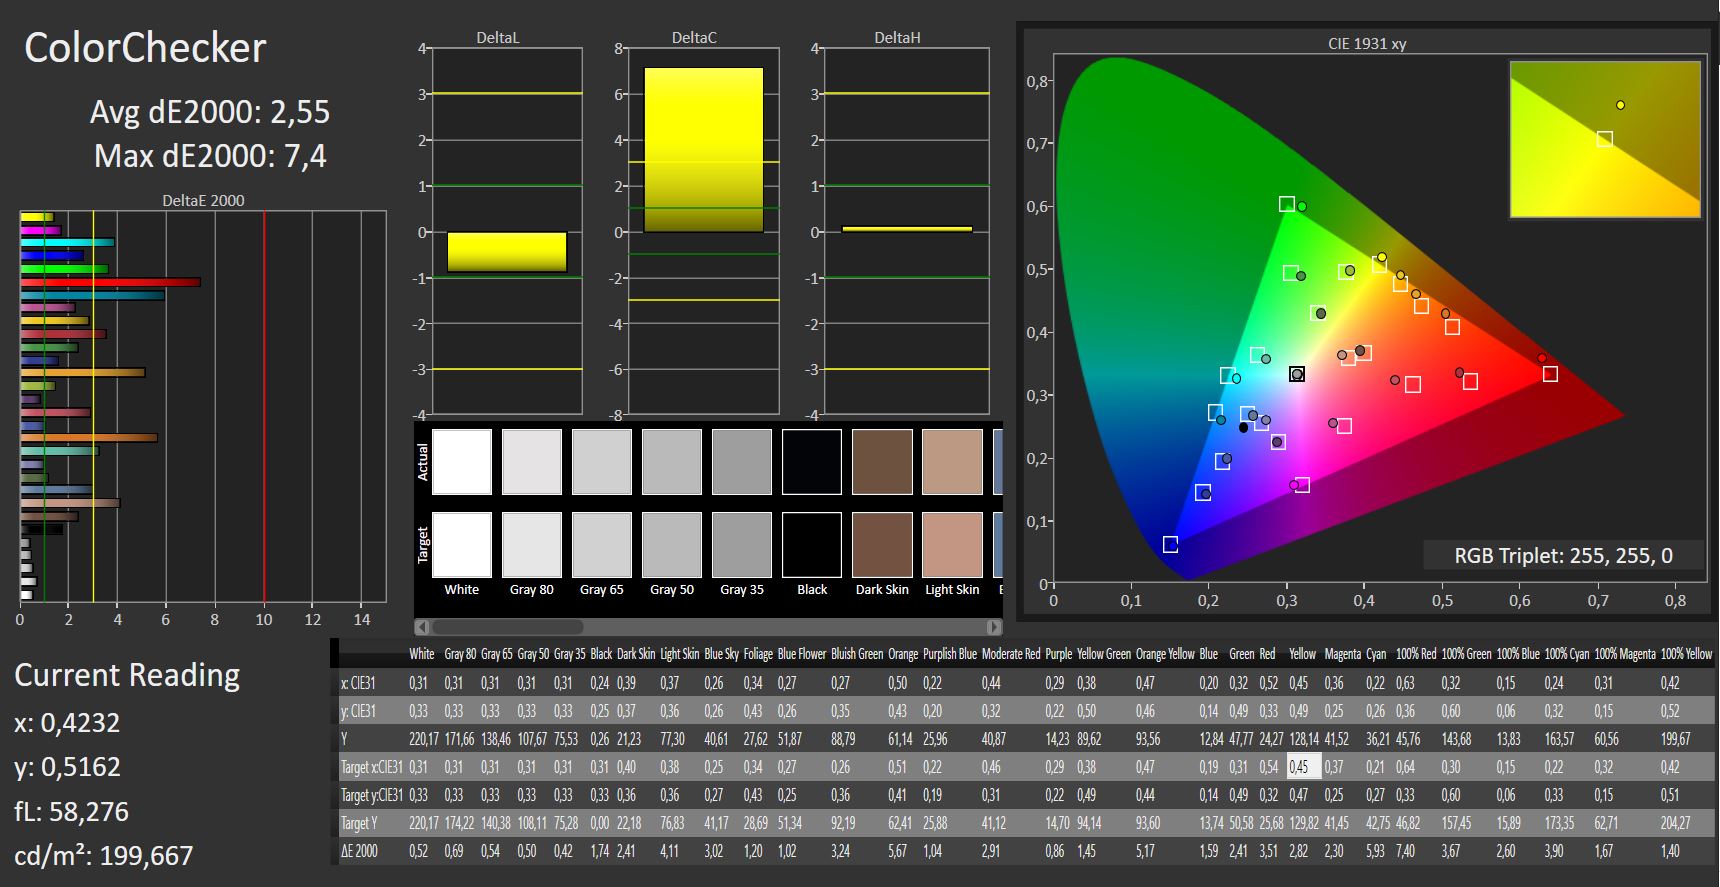
ΔE ColorChecker Calman: 6.1 | ∀{0.5-29.43 Ø4.72}
calibrated: 2.55
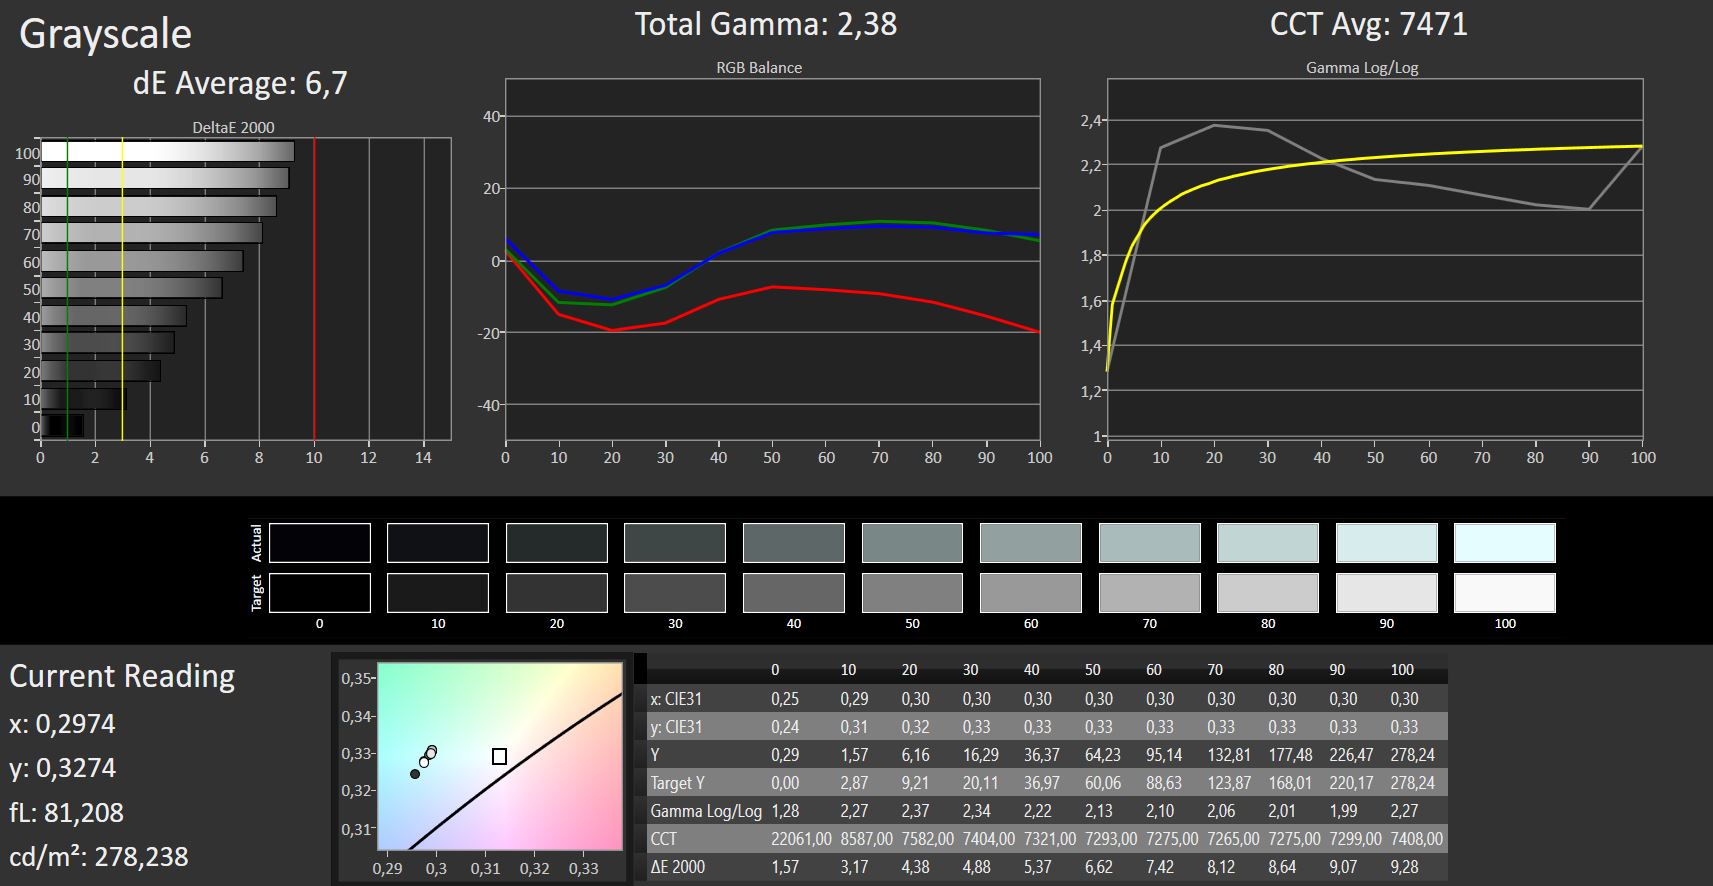
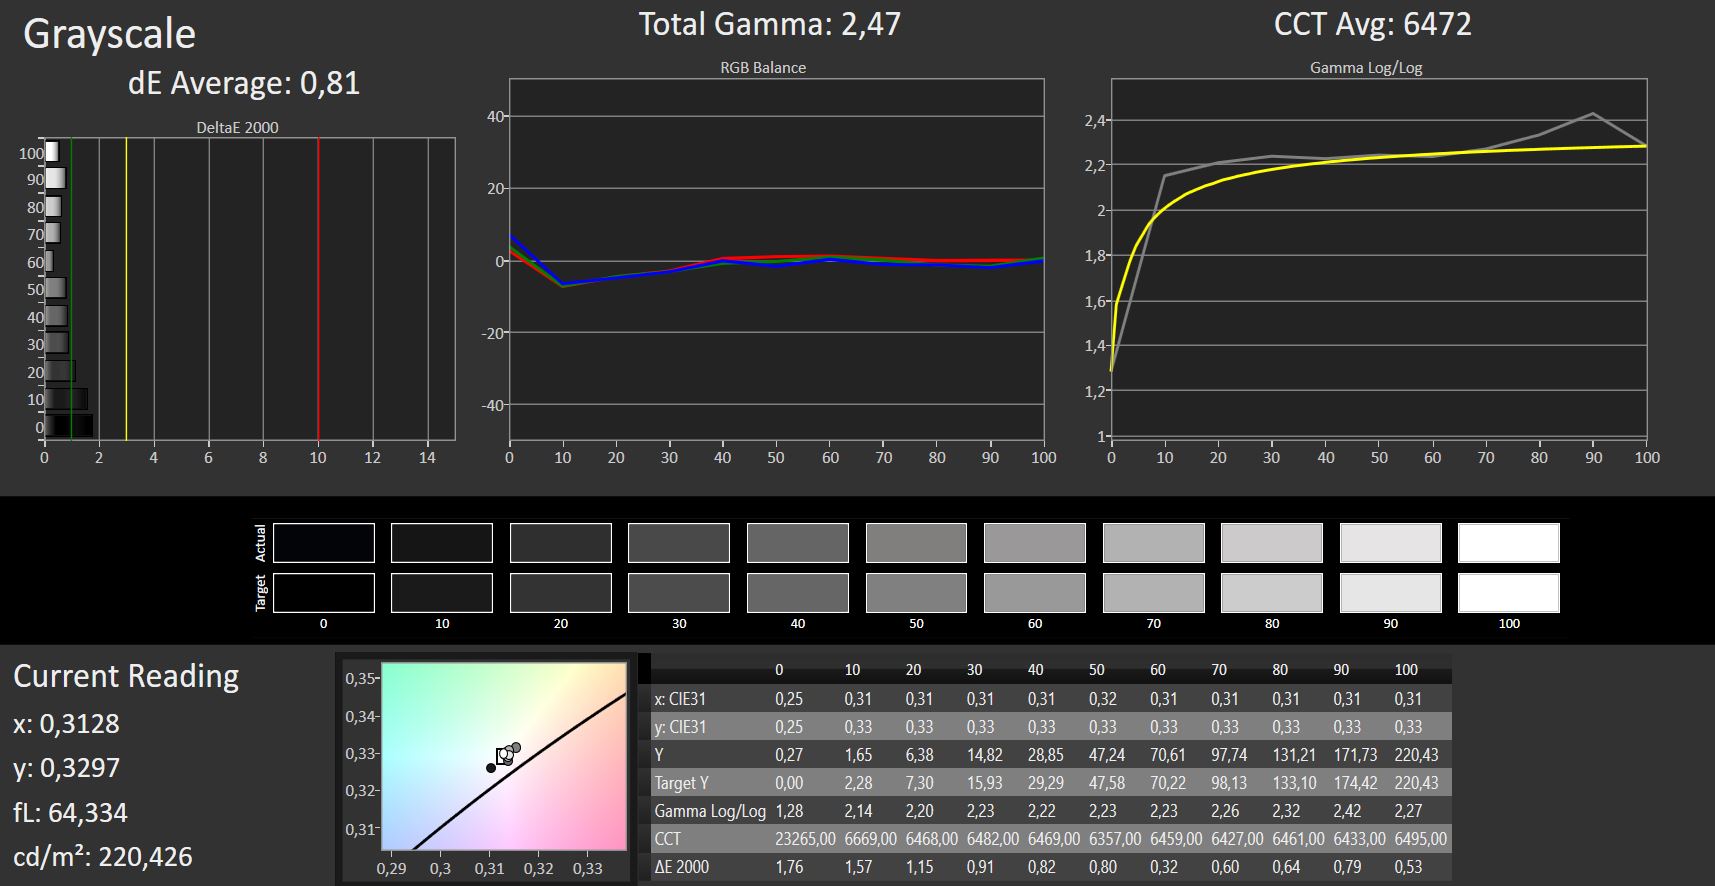
ΔE Greyscale Calman: 6.7 | ∀{0.09-98 Ø4.97}
81% sRGB (Argyll 1.6.3 3D)
52% AdobeRGB 1998 (Argyll 1.6.3 3D)
56.5% AdobeRGB 1998 (Argyll 3D)
81.8% sRGB (Argyll 3D)
54.7% Display P3 (Argyll 3D)
Gamma: 2.38
CCT: 7471 K
| Lenovo Tablet 10-20L3000KGE IPS, 1920x1200, 10.1" | Microsoft Surface Go MHN-00003 IPS, 1800x1200, 10" | Huawei MediaPad M5 10.8 Pro IPS, 2560x1600, 10.8" | Asus Transformer Book T102HA-GR022T IPS, 1280x800, 10.1" | Lenovo IdeaPad Miix 320-10ICR Pro LTE IPS, 1920x1200, 10.1" | Apple iPad Pro 10.5 2017 IPS, 2224x1668, 10.5" | |
|---|---|---|---|---|---|---|
| Display | 20% | -3% | -1% | |||
| Display P3 Coverage (%) | 54.7 | 66.5 22% | 53.4 -2% | 54.2 -1% | ||
| sRGB Coverage (%) | 81.8 | 97.5 19% | 76.9 -6% | 81.4 0% | ||
| AdobeRGB 1998 Coverage (%) | 56.5 | 67.5 19% | 55.3 -2% | 56 -1% | ||
| Response Times | -5% | 11% | 11% | 14% | 15% | |
| Response Time Grey 50% / Grey 80% * (ms) | 37 ? | 44 ? -19% | 40 ? -8% | 29 ? 22% | 32 ? 14% | 39.6 ? -7% |
| Response Time Black / White * (ms) | 28 ? | 25.6 ? 9% | 20 ? 29% | 28 ? -0% | 24 ? 14% | 17.6 ? 37% |
| PWM Frequency (Hz) | 198 ? | 1020 ? | 250 ? | 294 ? | 19000 ? | |
| Screen | 46% | -22% | 25% | -2% | 62% | |
| Brightness middle (cd/m²) | 277 | 456 65% | 384 39% | 530 91% | 251 -9% | 634 129% |
| Brightness (cd/m²) | 277 | 426 54% | 360 30% | 491 77% | 244 -12% | 625 126% |
| Brightness Distribution (%) | 87 | 88 1% | 84 -3% | 88 1% | 79 -9% | 87 0% |
| Black Level * (cd/m²) | 0.3 | 0.31 -3% | 0.8 -167% | 0.46 -53% | 0.33 -10% | 0.39 -30% |
| Contrast (:1) | 923 | 1471 59% | 480 -48% | 1152 25% | 761 -18% | 1626 76% |
| Colorchecker dE 2000 * | 6.1 | 1.3 79% | 6.83 -12% | 4.33 29% | 5.34 12% | 1.9 69% |
| Colorchecker dE 2000 max. * | 12.2 | 3 75% | 12.7 -4% | 7.32 40% | 9.91 19% | 3.9 68% |
| Colorchecker dE 2000 calibrated * | 2.55 | 1.1 57% | ||||
| Greyscale dE 2000 * | 6.7 | 1.4 79% | 7.5 -12% | 3.51 48% | 6.04 10% | 2.8 58% |
| Gamma | 2.38 92% | 2.24 98% | 2.199 100% | 2.36 93% | 3.23 68% | 2.26 97% |
| CCT | 7471 87% | 6687 97% | 8544 76% | 7007 93% | 7491 87% | 7027 93% |
| Color Space (Percent of AdobeRGB 1998) (%) | 52 | 62.3 20% | 50 -4% | 51 -2% | ||
| Color Space (Percent of sRGB) (%) | 81 | 96.8 20% | 77 -5% | 81 0% | ||
| Total Average (Program / Settings) | 20% /
35% | -6% /
-16% | 11% /
17% | 4% /
0% | 39% /
53% |
* ... smaller is better
Screen Flickering / PWM (Pulse-Width Modulation)
| Screen flickering / PWM detected | 198 Hz | ≤ 90 % brightness setting | 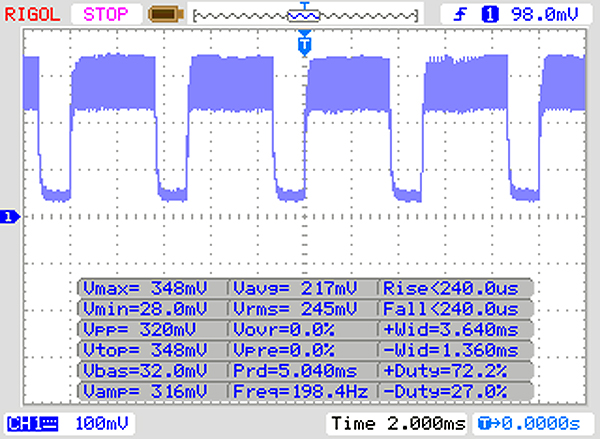 |
The display backlight flickers at 198 Hz (worst case, e.g., utilizing PWM) Flickering detected at a brightness setting of 90 % and below. There should be no flickering or PWM above this brightness setting. The frequency of 198 Hz is relatively low, so sensitive users will likely notice flickering and experience eyestrain at the stated brightness setting and below. In comparison: 52 % of all tested devices do not use PWM to dim the display. If PWM was detected, an average of 7781 (minimum: 5 - maximum: 343500) Hz was measured. | |||
Out of the box color accuracy was mediocre, and DeltaE 2000 deviation for colors was determined to be 6.1 (ideal: less than 3). The display suffered from a minor yet noticeable blue tint. We were able to improve upon color accuracy through calibration, and DeltaE deviation for colors was decreased to 2.55. Grays were much more balanced afterwards as well, and the blue tint was all but gone.
As usual, the resulting ICC profile can be found for download in the box above. Remember to make sure your particular unit is equipped with the exact same display as ours (manufacturer and model number). Otherwise your color accuracy might actually decrease instead of improving. Many manufacturers use different displays within one series.

Display Response Times
| ↔ Response Time Black to White | ||
|---|---|---|
| 28 ms ... rise ↗ and fall ↘ combined | ↗ 18 ms rise | 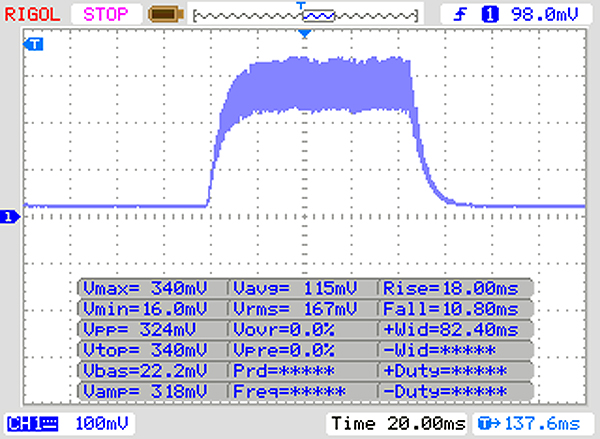 |
| ↘ 10 ms fall | ||
| The screen shows relatively slow response rates in our tests and may be too slow for gamers. In comparison, all tested devices range from 0.1 (minimum) to 240 (maximum) ms. » 71 % of all devices are better. This means that the measured response time is worse than the average of all tested devices (19.8 ms). | ||
| ↔ Response Time 50% Grey to 80% Grey | ||
| 37 ms ... rise ↗ and fall ↘ combined | ↗ 22 ms rise | 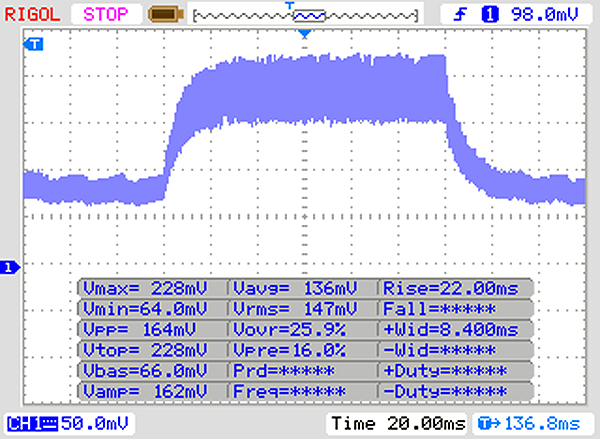 |
| ↘ 15 ms fall | ||
| The screen shows slow response rates in our tests and will be unsatisfactory for gamers. In comparison, all tested devices range from 0.165 (minimum) to 636 (maximum) ms. » 53 % of all devices are better. This means that the measured response time is worse than the average of all tested devices (31 ms). | ||
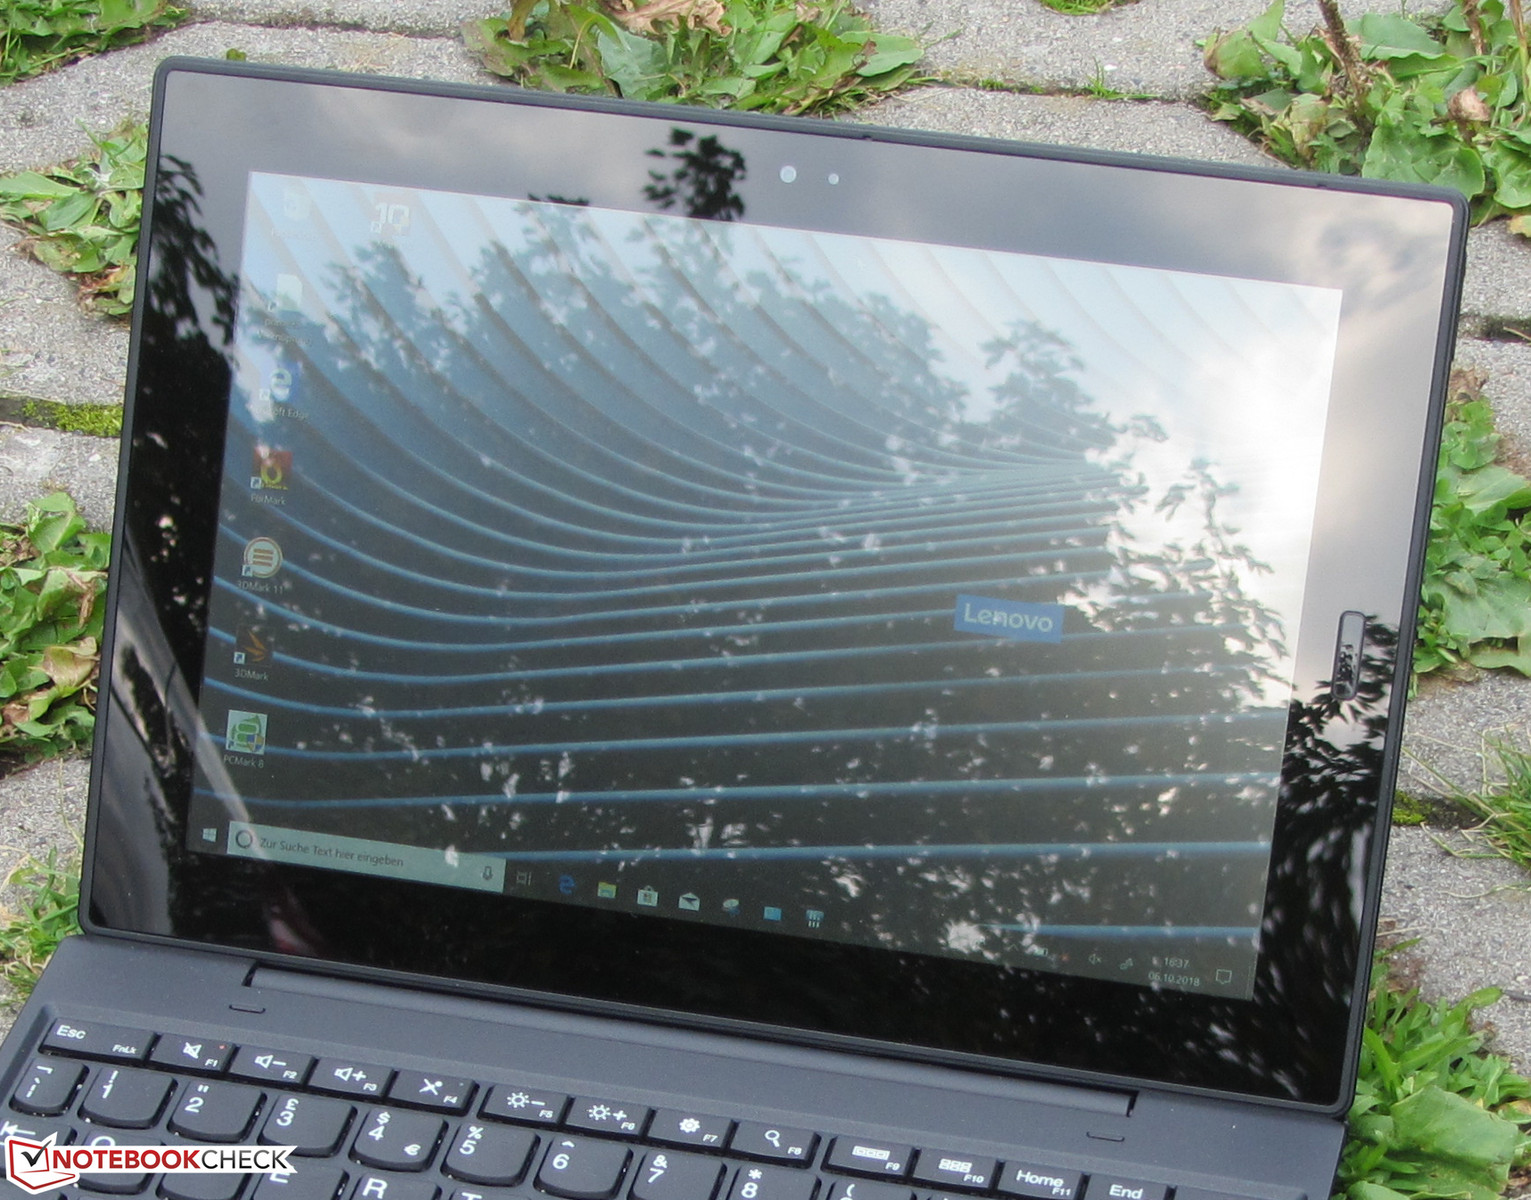
The tablet is equipped with an IPS panel with wide viewing angles. Accordingly, it can be read from all angles. The device was designed to be used primarily indoors as the combination of low display brightness and highly reflective display coating makes outdoor usage practically impossible.
Performance
The Lenovo Tablet 10 is a 10.1-inch Windows tablet. Its Celeron processor is powerful enough for office and Internet applications. Our review unit sold for around $600 plus tax. Other SKUs are available as well, and prices start at around $500.
Processor
Our tablet featured a Celeron N4100 quad-core processor based on the Gemini Lake platform. The CPU runs at a base clock speed of 1.1 GHz and turbo boosts up to 2.3 GHz or 2.4 GHz on all four cores or a single core, respectively. Thanks to its low TDP of just 6 W it can be cooled passively. During our Cinebench R15 multithread test the CPU ran at 2.3 GHz for a few seconds and clocked down to between 1.8 and 1.9 GHz afterwards. The single-thread test was completed at 2.3 GHz end-to-end.
Whether or not the device is capable of sustaining its turbo boost over long periods of load is determined by running the multi-thread part of the Cinebench R15 benchmark in a loop for 30 minutes. The score decreased between the first and second iteration but remained consistent afterwards. There were no further dips in performance, and the tablet was able to sustain a turbo boost of 1.8-1.9 GHz.
| Cinebench R10 | |
| Rendering Single 32Bit | |
| Microsoft Surface Go MHN-00003 | |
| Lenovo Tablet 10-20L3000KGE | |
| Average Intel Celeron N4100 (1664 - 2049, n=5) | |
| Rendering Multiple CPUs 32Bit | |
| Average Intel Celeron N4100 (4915 - 7123, n=5) | |
| Lenovo Tablet 10-20L3000KGE | |
| Microsoft Surface Go MHN-00003 | |
| Geekbench 3 | |
| 32 Bit Multi-Core Score | |
| Average Intel Celeron N4100 (4998 - 5085, n=2) | |
| Lenovo Tablet 10-20L3000KGE | |
| 32 Bit Single-Core Score | |
| Lenovo Tablet 10-20L3000KGE | |
| Average Intel Celeron N4100 (1623 - 1635, n=2) | |
| Geekbench 4.0 | |
| 64 Bit Multi-Core Score | |
| Lenovo Tablet 10-20L3000KGE | |
| Average Intel Celeron N4100 (5056 - 5189, n=2) | |
| 64 Bit Single-Core Score | |
| Lenovo Tablet 10-20L3000KGE | |
| Average Intel Celeron N4100 (1813 - 1837, n=2) | |
| Mozilla Kraken 1.1 - Total | |
| Huawei MediaPad M5 10.8 Pro (Chrome 68.0.3440.91) | |
| Lenovo Tablet 10-20L3000KGE (Edge 42) | |
| Average Intel Celeron N4100 (2561 - 3865, n=9) | |
| Microsoft Surface Go MHN-00003 (Edge 42.17134.1.0) | |
| Average of class Tablet (243 - 27101, n=66, last 2 years) | |
| Apple iPad Pro 10.5 2017 (Safari Mobile 10) | |
| Octane V2 - Total Score | |
| Average of class Tablet (763 - 138481, n=72, last 2 years) | |
| Apple iPad Pro 10.5 2017 (Safari Mobile 10) | |
| Microsoft Surface Go MHN-00003 (Edge 42.17134.1.0) | |
| Huawei MediaPad M5 10.8 Pro (Chrome 68.0.3440.91) | |
| Lenovo Tablet 10-20L3000KGE (Edge 42) | |
| Average Intel Celeron N4100 (10309 - 11852, n=5) | |
| JetStream 1.1 - 1.1 Total | |
| Apple iPad Pro 10.5 2017 (Safari Mobile 10) | |
| Lenovo Tablet 10-20L3000KGE (Edge 42) | |
| Average Intel Celeron N4100 (82.1 - 99.9, n=7) | |
| Microsoft Surface Go MHN-00003 (Edge 42.17134.1.0) | |
| Huawei MediaPad M5 10.8 Pro (Chrome 68.0.3440.91) | |
| Lenovo IdeaPad Miix 320-10ICR Pro LTE (Edge 38.14393.1066.0) | |
| Asus Transformer Book T102HA-GR022T | |
* ... smaller is better
System Performance
Overall, the system felt very balanced and smooth. We found no issues. The Celeron processor was powerful enough for office and Internet applications. The PCMark results further corroborated our initial impressions.
| PCMark 8 Home Score Accelerated v2 | 1892 points | |
| PCMark 8 Creative Score Accelerated v2 | 2119 points | |
| PCMark 8 Work Score Accelerated v2 | 2858 points | |
| PCMark 10 Score | 1627 points | |
Help | ||
Storage Devices
The 128 GB storage device is based on eMMC technology. 99 GB is user-accessible out of the box. The rest is taken up by the Windows installation and the recovery partition. Transfer rates were at a level expected of an eMMC storage device.

| Lenovo Tablet 10-20L3000KGE 128 GB eMMC Flash | Microsoft Surface Go MHN-00003 64 GB eMMC Flash | Asus Transformer Book T102HA-GR022T 128 GB eMMC Flash | Lenovo IdeaPad Miix 320-10ICR Pro LTE SanDisk DF4128 | Average 128 GB eMMC Flash | Average of class Tablet | |
|---|---|---|---|---|---|---|
| CrystalDiskMark 3.0 | 45% | -31% | -39% | -8% | ||
| Read Seq (MB/s) | 291 | 259.6 -11% | 139 -52% | 92.7 -68% | 184.8 ? -36% | |
| Write Seq (MB/s) | 110.4 | 122.4 11% | 54.1 -51% | 54.5 -51% | 86.4 ? -22% | |
| Read 512 (MB/s) | 206.8 | 190.6 -8% | 121 -41% | 68.6 -67% | 157.8 ? -24% | |
| Write 512 (MB/s) | 81.6 | 107.1 31% | 44.39 -46% | 39.86 -51% | 73.5 ? -10% | |
| Read 4k (MB/s) | 13.61 | 19.06 40% | 9.935 -27% | 6.705 -51% | 14.5 ? 7% | |
| Write 4k (MB/s) | 11.97 | 24.27 103% | 9.877 -17% | 8.555 -29% | 13.1 ? 9% | |
| Read 4k QD32 (MB/s) | 30.1 | 34.45 14% | 30.03 0% | 32.71 9% | 26.6 ? -12% | |
| Write 4k QD32 (MB/s) | 11.97 | 33.64 181% | 10.67 -11% | 11.5 -4% | 15.3 ? 28% |
GPU Performance
All things graphics are handled by Intel’s integrated UHD Graphics 600 GPU. It supports DirectX 12 and runs at speeds of up to 700 MHz. 3DMark benchmark results were at a level expected of this GPU. Unfortunately, Lenovo thwarted 3D performance somewhat by running the RAM in single-channel instead of dual-channel mode.
| 3DMark 11 Performance | 683 points | |
| 3DMark Ice Storm Standard Score | 22314 points | |
| 3DMark Cloud Gate Standard Score | 3265 points | |
| 3DMark Fire Strike Score | 441 points | |
Help | ||
Gaming Performance
Some games can be run smoothly on Lenovo’s 10.1-inch tablet, all of which were low-end less-demanding titles. They also required reduced resolutions and details in order to perform acceptably well. Casual games, such as those that can be found in the Microsoft Store, are usually playable.
| low | med. | high | ultra | |
|---|---|---|---|---|
| StarCraft 2 (2010) | 61.6 | 14.9 | 10.6 | |
| The Elder Scrolls V: Skyrim (2011) | 19.2 | 12.9 | 9.6 | |
| Anno 2070 (2011) | 38 | 18.5 | 12.2 | |
| Tomb Raider (2013) | 33 | 16.2 | 11.2 | |
| BioShock Infinite (2013) | 26.5 | 13.2 | 11.5 | 3.3 |
| GRID: Autosport (2014) | 66.8 | 18 | 12.5 | |
| Sims 4 (2014) | 77.8 | 17.7 | 10.2 | |
| Dirt Rally (2015) | 43.3 | 12.5 | 12.5 | |
| Dota 2 Reborn (2015) | 26.5 | 12.5 | ||
| World of Warships (2015) | 20 | 13.1 | ||
| Rainbow Six Siege (2015) | 17.1 | 10.8 | ||
| Overwatch (2016) | 5 | 3 | ||
| For Honor (2017) | 9.3 | 3 | ||
| Rocket League (2017) | 17.3 | 8.8 | ||
| Team Fortress 2 (2017) | 35.3 | 28.7 | ||
| Playerunknown's Battlegrounds (PUBG) (2017) | 5.5 | |||
| Middle-earth: Shadow of War (2017) | 9 | |||
| Final Fantasy XV Benchmark (2018) | 2.9 | |||
| X-Plane 11.11 (2018) | 5.9 | |||
| Far Cry 5 (2018) | 3 | |||
| F1 2018 (2018) | 12 | |||
| Shadow of the Tomb Raider (2018) | 4 | |||
| Forza Horizon 4 (2018) | 4 | |||
| Assassin´s Creed Odyssey (2018) | 4 |
Emissions
Noise Emissions
Given that the tablet was cooled passively and lacked a mechanical hard disk drive it was dead silent at all times.
Temperature
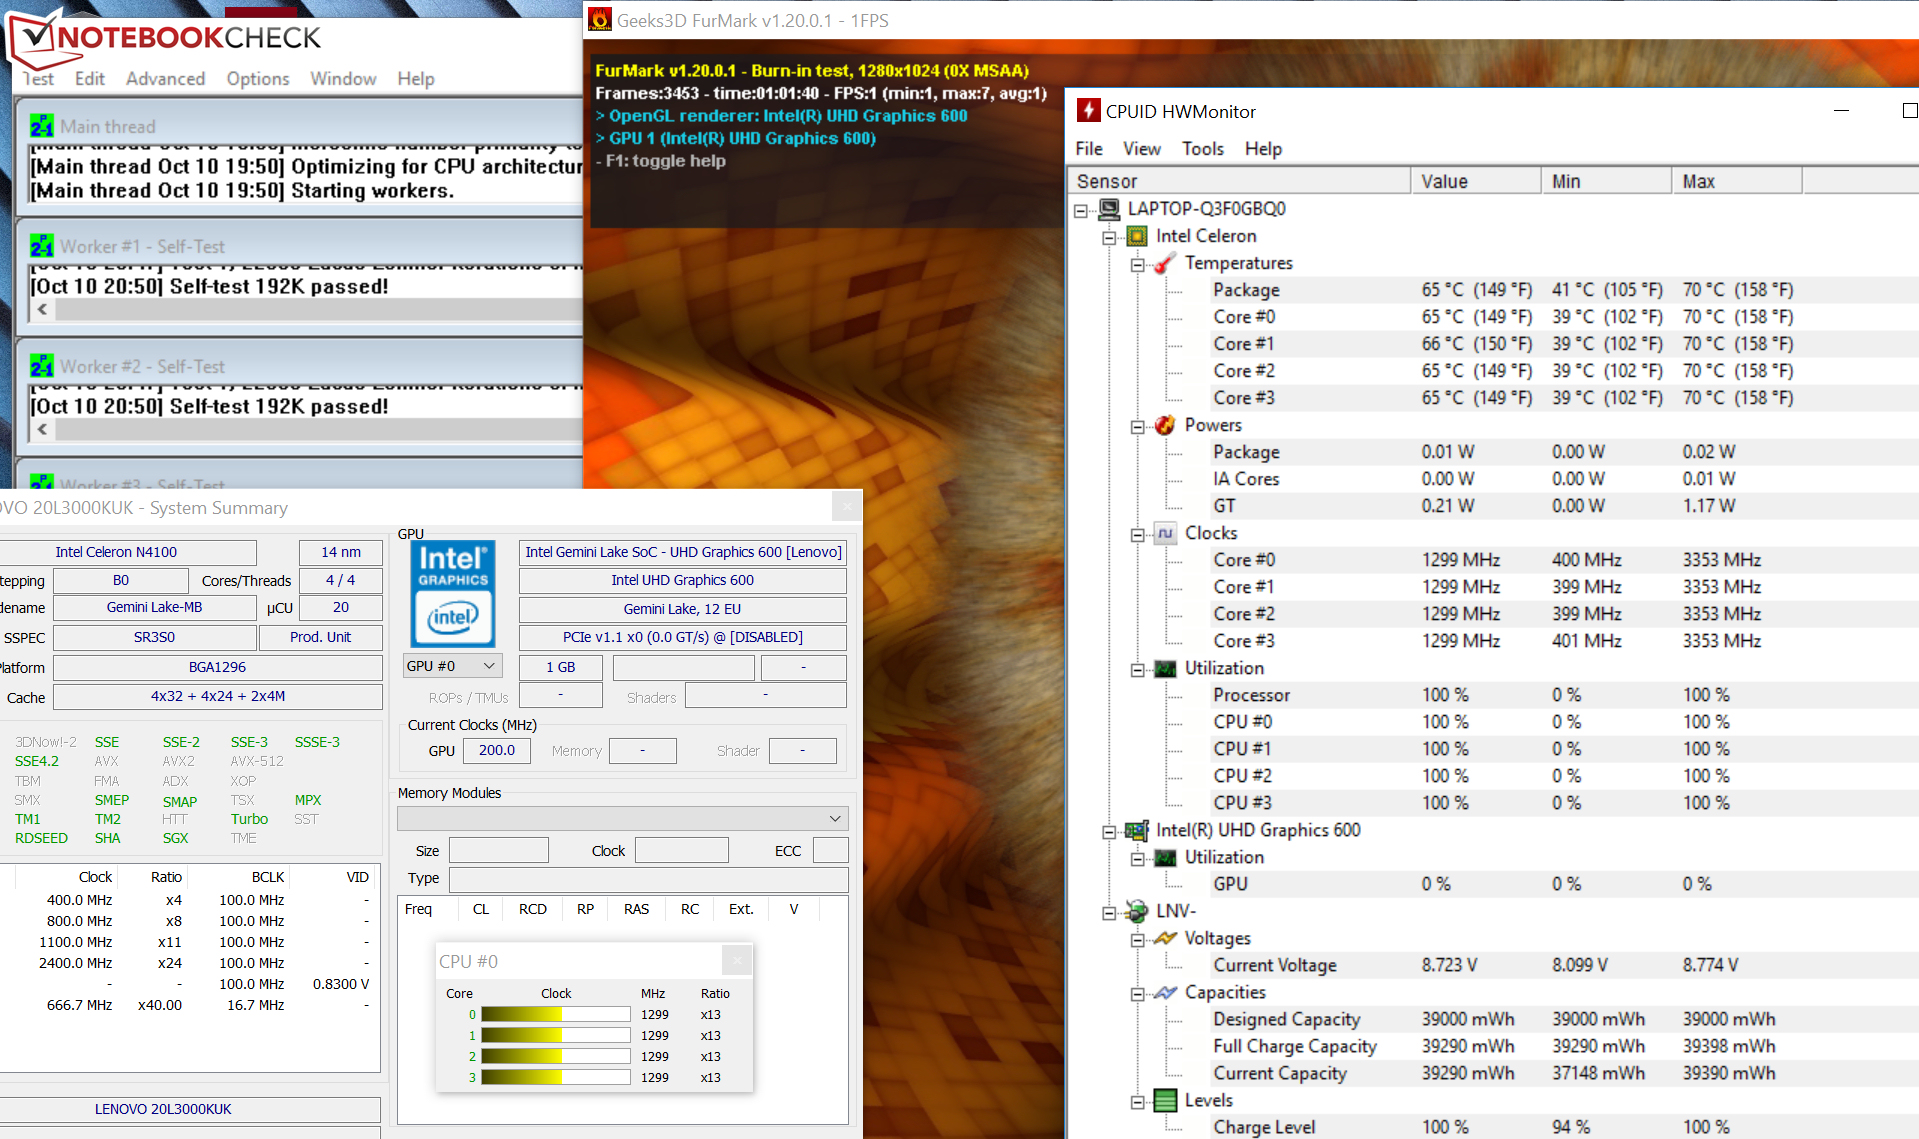
Our stress test (Prime95 and FurMark run simultaneously for at least a full hour) was completed identically on battery and mains. The CPU ran at a clock speed of between 1 and 1.6 GHz while the GPU ran at 100-250 MHz.
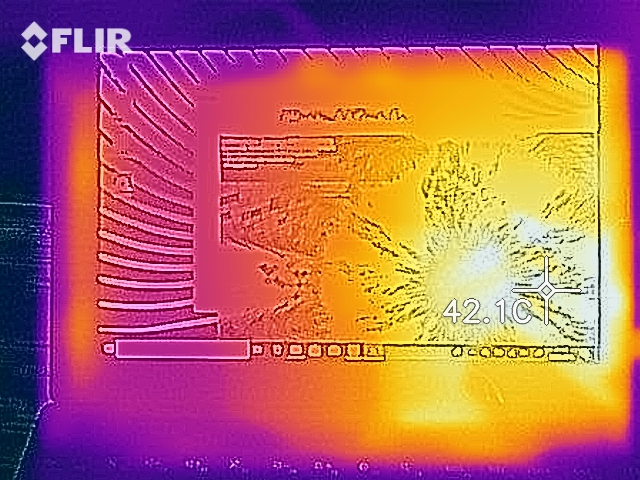
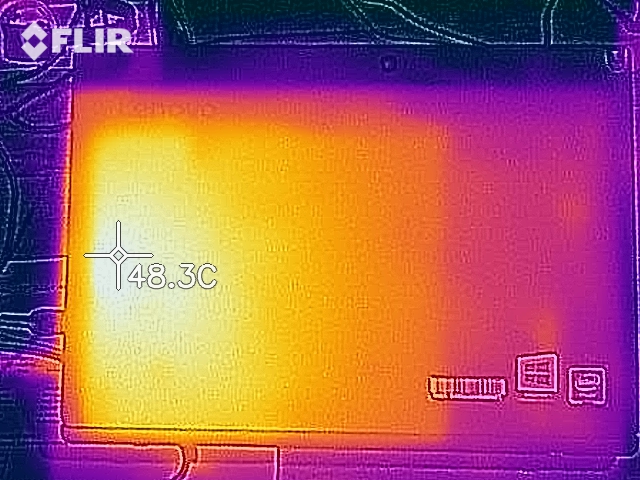
The tablet got fairly warm under full load. We found three hotspots exceeding the 40 °C threshold. However, it remained far from critical. Our stress test is an extreme load scenario that rarely ever occurs during everyday use. We use this test to determine whether or not a device is stable even at extreme loads. Temperatures were within acceptable levels during regular everyday use.
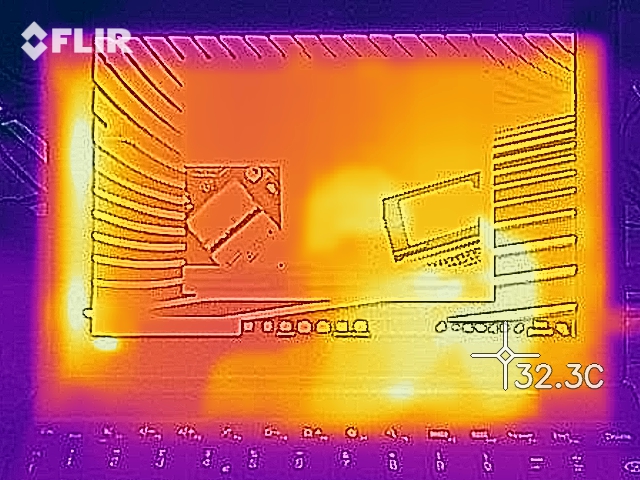
(+) The maximum temperature on the upper side is 37.3 °C / 99 F, compared to the average of 33.6 °C / 92 F, ranging from 20.7 to 53.2 °C for the class Tablet.
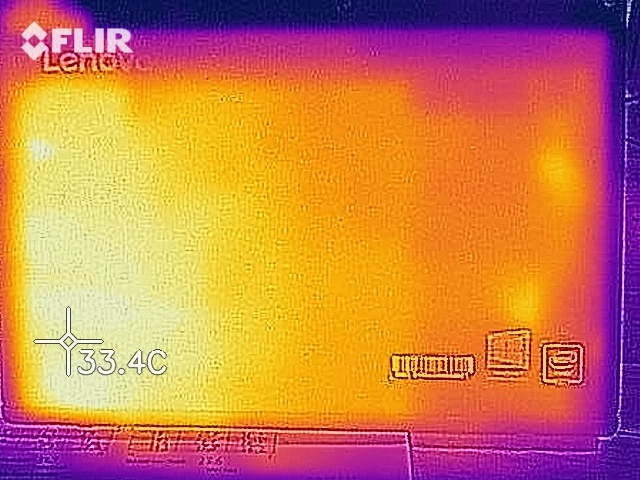
(±) The bottom heats up to a maximum of 44.4 °C / 112 F, compared to the average of 33.2 °C / 92 F
(+) In idle usage, the average temperature for the upper side is 26.6 °C / 80 F, compared to the device average of 30 °C / 86 F.
Speakers
The stereo speakers are located at the bottom on the left and right side of the tablet. They were somewhat decent but lacked bass. For an improved audio experience we recommend using headphones or external speakers.
Lenovo Tablet 10-20L3000KGE audio analysis
(-) | not very loud speakers (63.6 dB)
Bass 100 - 315 Hz
(-) | nearly no bass - on average 23% lower than median
(±) | linearity of bass is average (11.2% delta to prev. frequency)
Mids 400 - 2000 Hz
(+) | balanced mids - only 4.2% away from median
(±) | linearity of mids is average (11.4% delta to prev. frequency)
Highs 2 - 16 kHz
(+) | balanced highs - only 4.8% away from median
(±) | linearity of highs is average (7.7% delta to prev. frequency)
Overall 100 - 16.000 Hz
(-) | overall sound is not linear (30.4% difference to median)
Compared to same class
» 90% of all tested devices in this class were better, 3% similar, 7% worse
» The best had a delta of 7%, average was 20%, worst was 129%
Compared to all devices tested
» 89% of all tested devices were better, 3% similar, 9% worse
» The best had a delta of 4%, average was 24%, worst was 134%
Apple MacBook 12 (Early 2016) 1.1 GHz audio analysis
(+) | speakers can play relatively loud (83.6 dB)
Bass 100 - 315 Hz
(±) | reduced bass - on average 11.3% lower than median
(±) | linearity of bass is average (14.2% delta to prev. frequency)
Mids 400 - 2000 Hz
(+) | balanced mids - only 2.4% away from median
(+) | mids are linear (5.5% delta to prev. frequency)
Highs 2 - 16 kHz
(+) | balanced highs - only 2% away from median
(+) | highs are linear (4.5% delta to prev. frequency)
Overall 100 - 16.000 Hz
(+) | overall sound is linear (10.2% difference to median)
Compared to same class
» 7% of all tested devices in this class were better, 2% similar, 91% worse
» The best had a delta of 5%, average was 18%, worst was 53%
Compared to all devices tested
» 5% of all tested devices were better, 1% similar, 94% worse
» The best had a delta of 4%, average was 24%, worst was 134%
Power Consumption
The tablet was comparatively efficient regardless of load. When idle, the power meter read just 6.4 W, which increased to 17.3 W during our stress test (Prime95 and FurMark run simultaneously for at least a full hour). The power supply is rated at 45 W.
| Off / Standby | |
| Idle | |
| Load |
|
Key:
min: | |
Battery Life
Our Wi-Fi test simulates a load typical for browsing the web. The energy plan is set to “Balanced”, all power-saving features are disabled, and the display brightness is normalized to 150 nits. In this test, the Lenovo Tablet 10 lasted for 9:53 hours.
Pros
Cons
Verdict
Lenovo’s Tablet 10 is a 16:10 Windows tablet with a 10.1-inch display. Its design is rather dull and boring, and the premise behind its development was functionality instead of exuberance. Lenovo’s marketing touts the Tablet 10 as portable business device that can be taken anywhere you go. Consequently, a lower weight would have been desirable - at 664 g the Tablet 10 is rather clunky.
The Celeron N4100 processor performs about as well as previous generation (Haswell, Broadwell) Core i3 CPUs. Accordingly, it offers enough performance for office and Internet applications. Despite its passive cooling the CPU is capable of taking near full advantage of its turbo boost capabilities. Unfortunately, Lenovo opted for a single-channel RAM configuration instead of a dual-channel setup, thereby reducing overall performance somewhat. We would have expected more given the tablet’s high price point.
The Lenovo Tablet 10 is a well-made Windows tablet aimed primarily at business users. Its high price and relatively high weight render it rather unattractive for consumers.
The 10.1-inch touchscreen display featured a decent contrast ratio and wide viewing angles. Its brightness, however, was too low for a device this expensive. The touchscreen supports both finger and active stylus input.
The keyboard dock left a pretty decent impression. The keyboard was well usable in everyday scenarios. Unfortunately, it lacks a backlight. Battery life was decent. The tablet communicates with the outside world via Wi-Fi or a built-in LTE modem.
The USB-C charger was a positive surprise, as it allowed us to use the charger for other devices as well. Hence, if taking several devices on a road trip a single charger might suffice. In our opinion, the 12-month limited warranty is too short, and we would have expected a longer default warranty.
Lenovo Tablet 10-20L3000KGE
- 10/16/2018 v6 (old)
Sascha Mölck
Price comparison

