Chuwi at its Best: Chuwi MiniBook Netbook Review
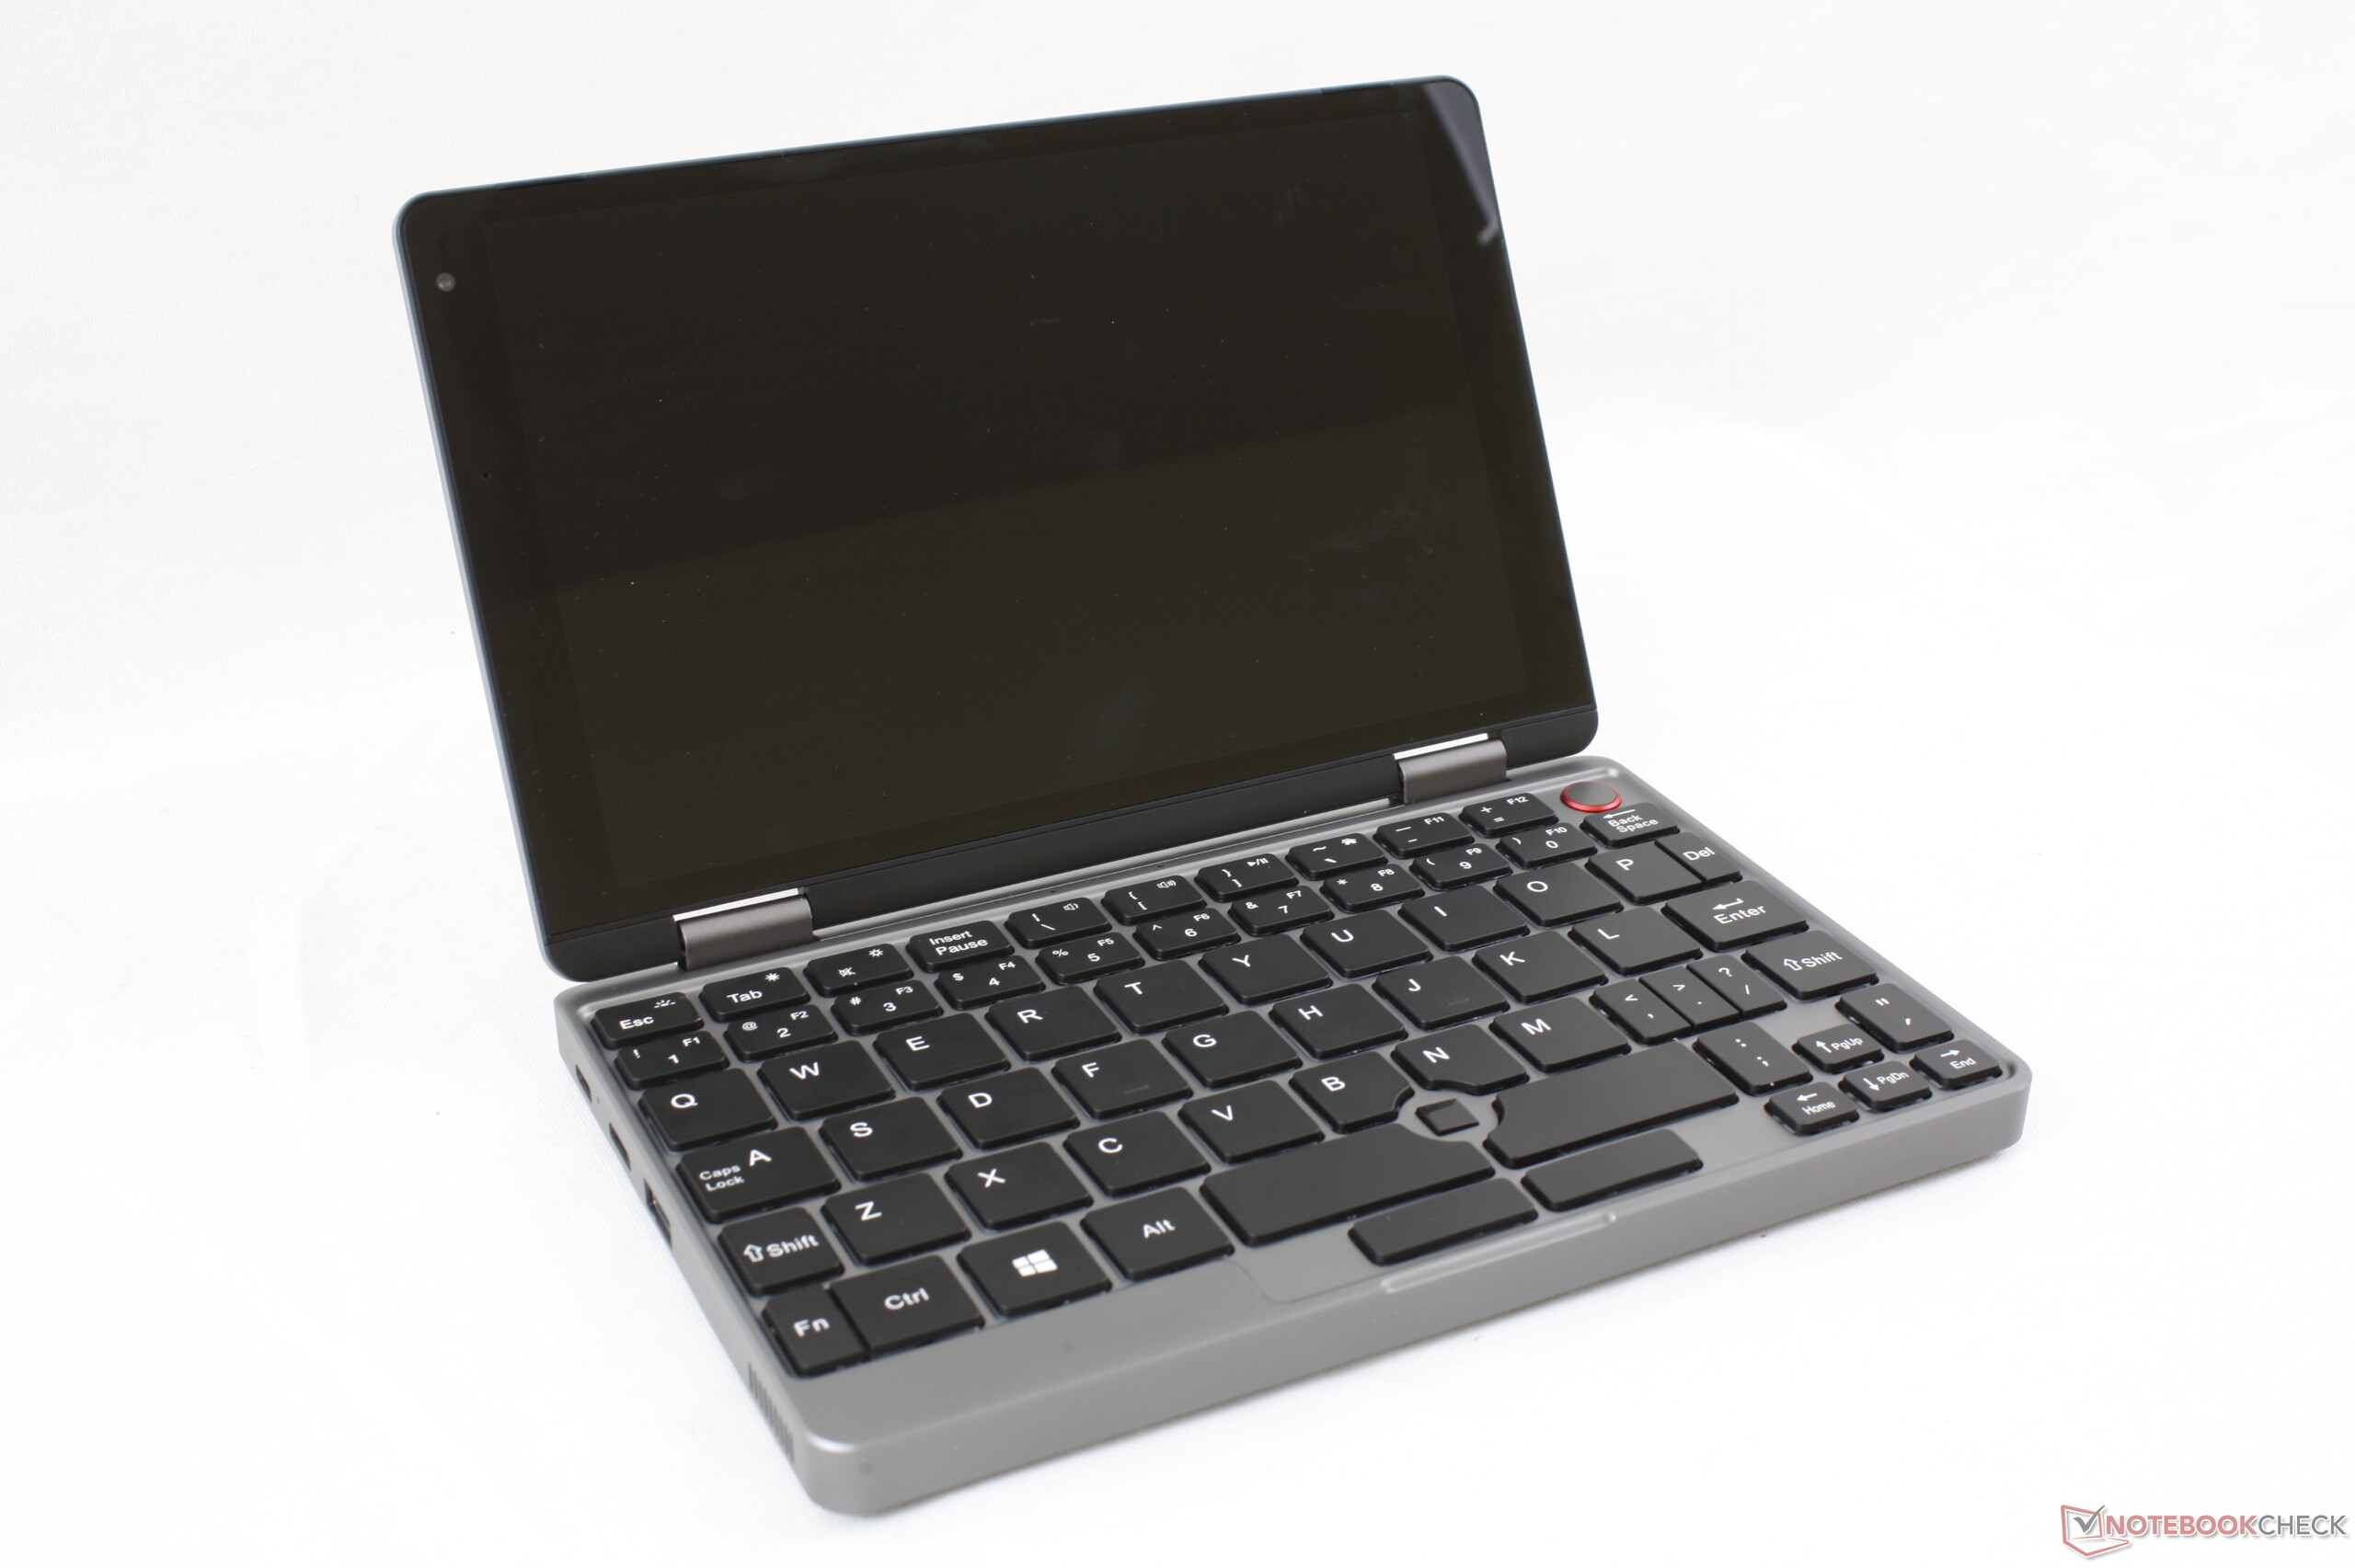
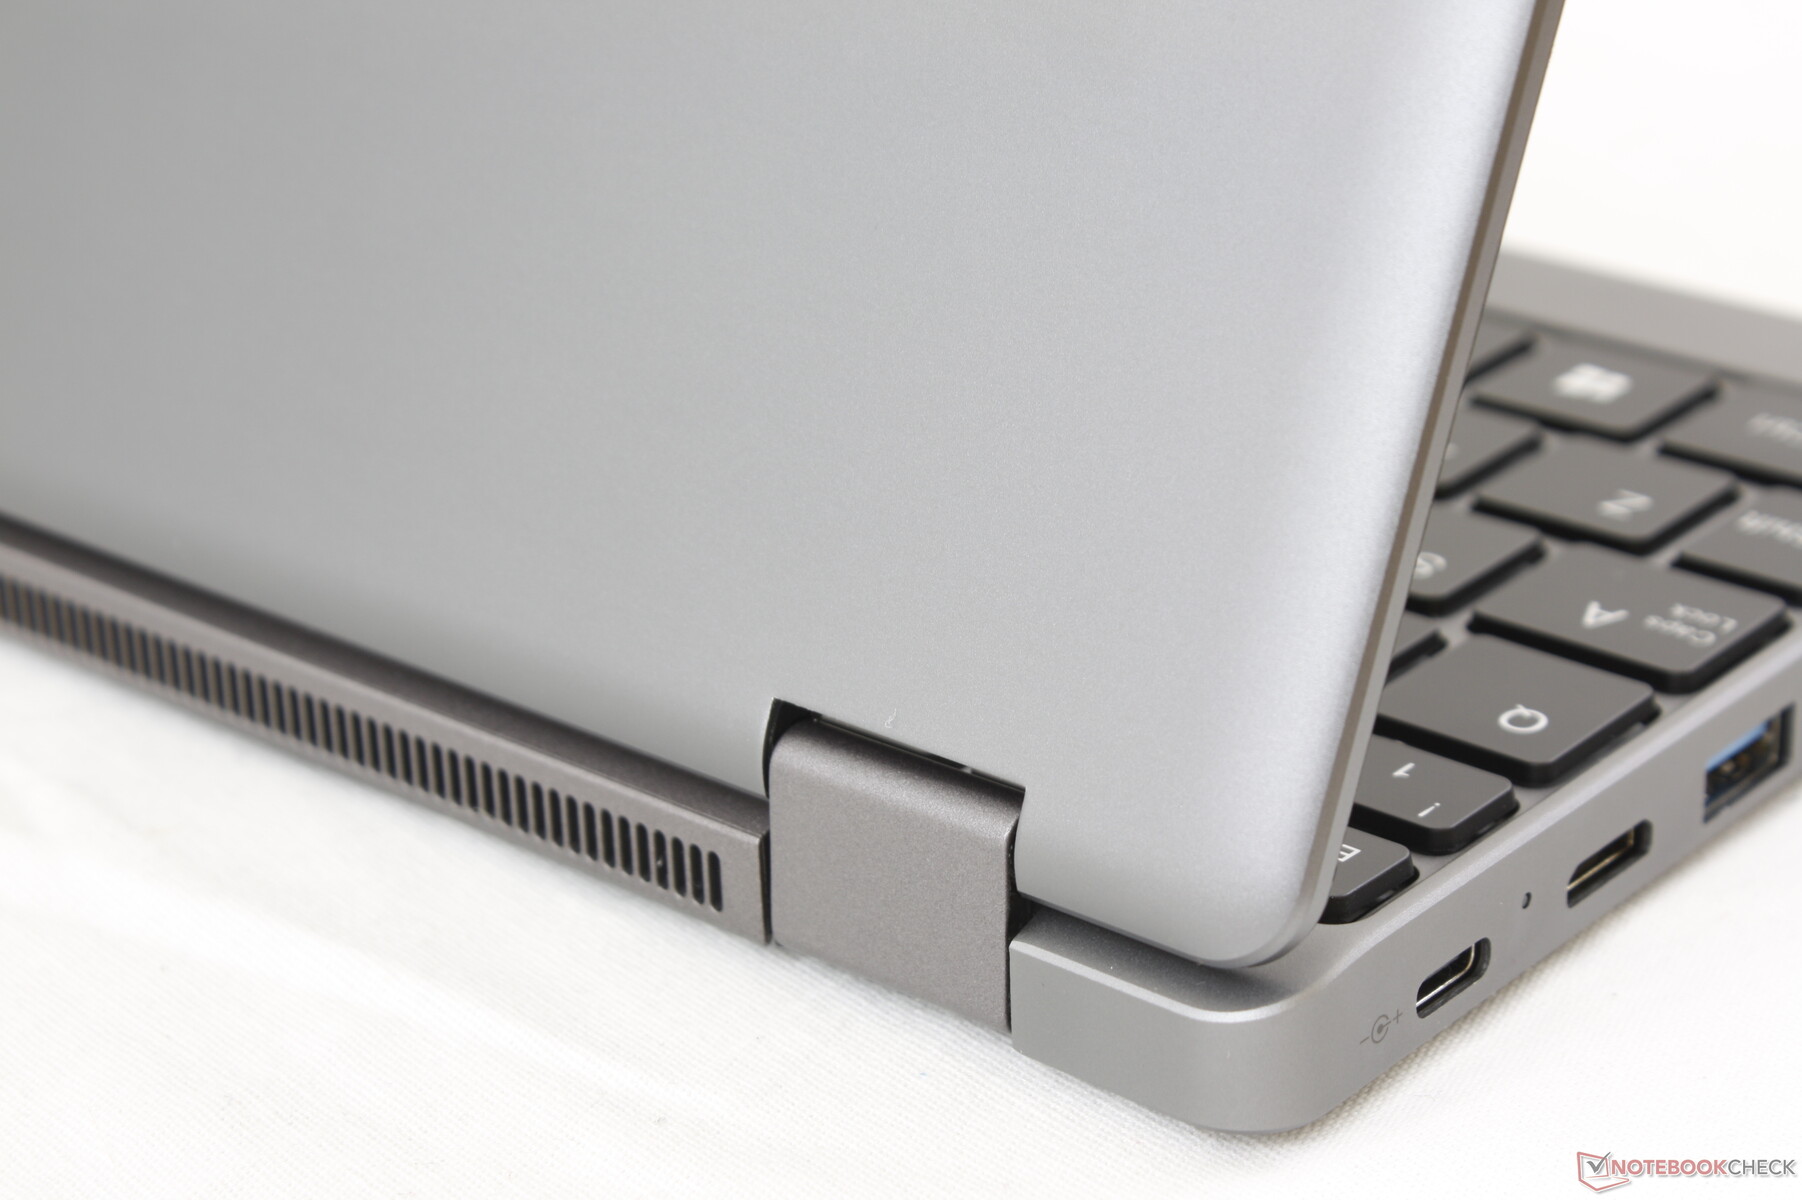
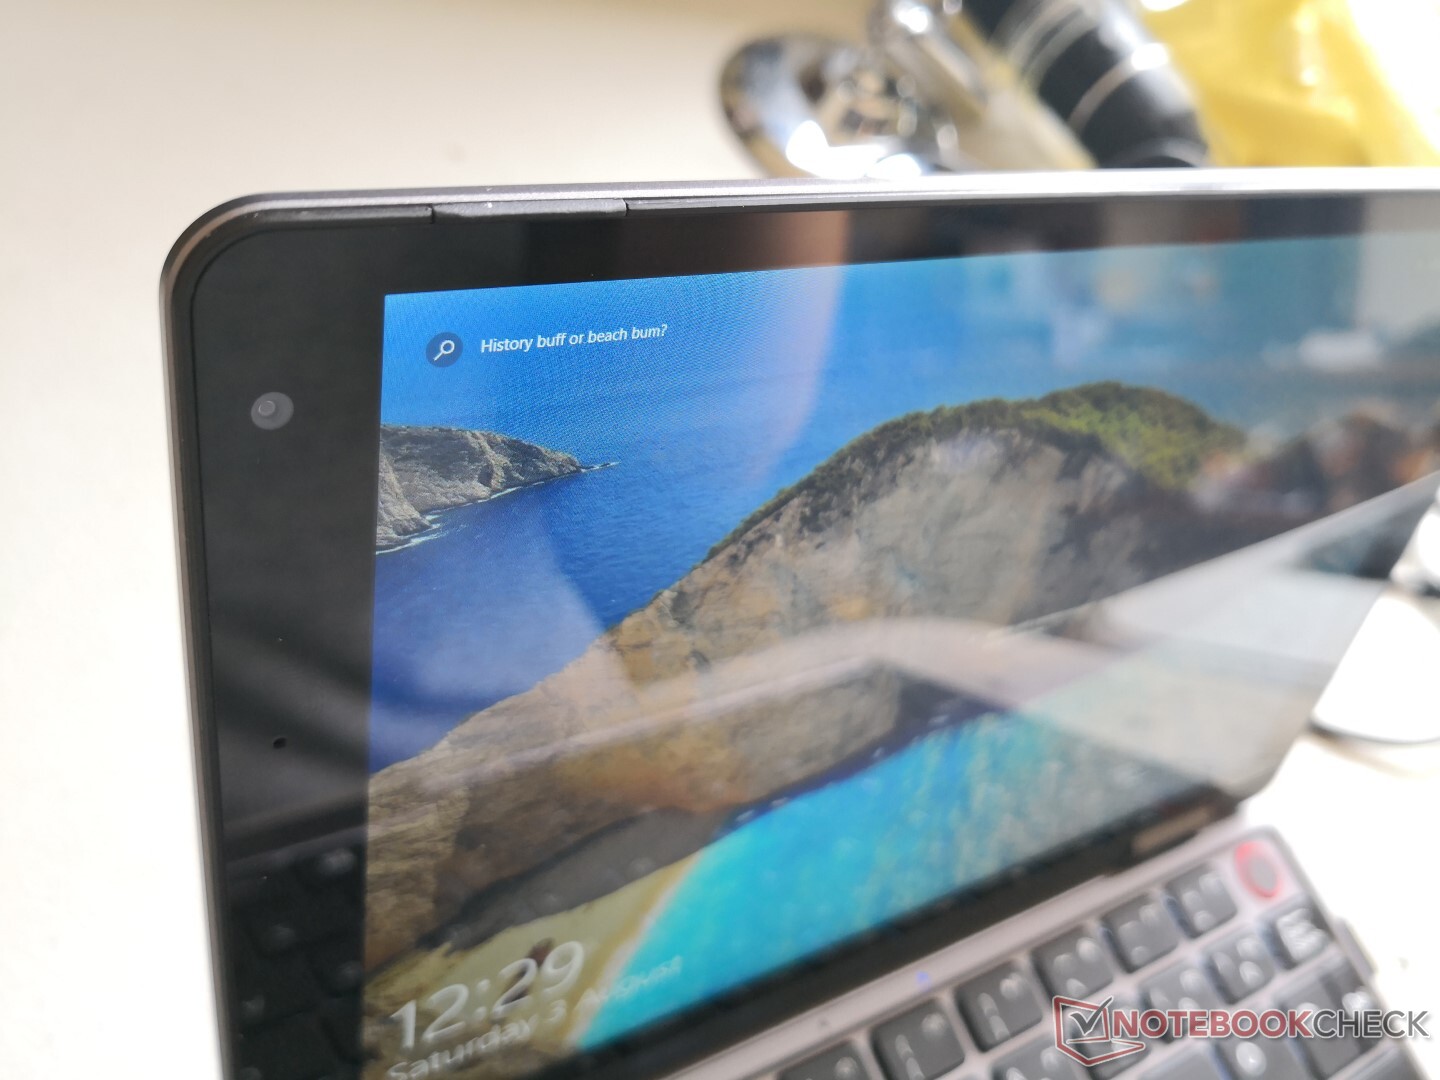
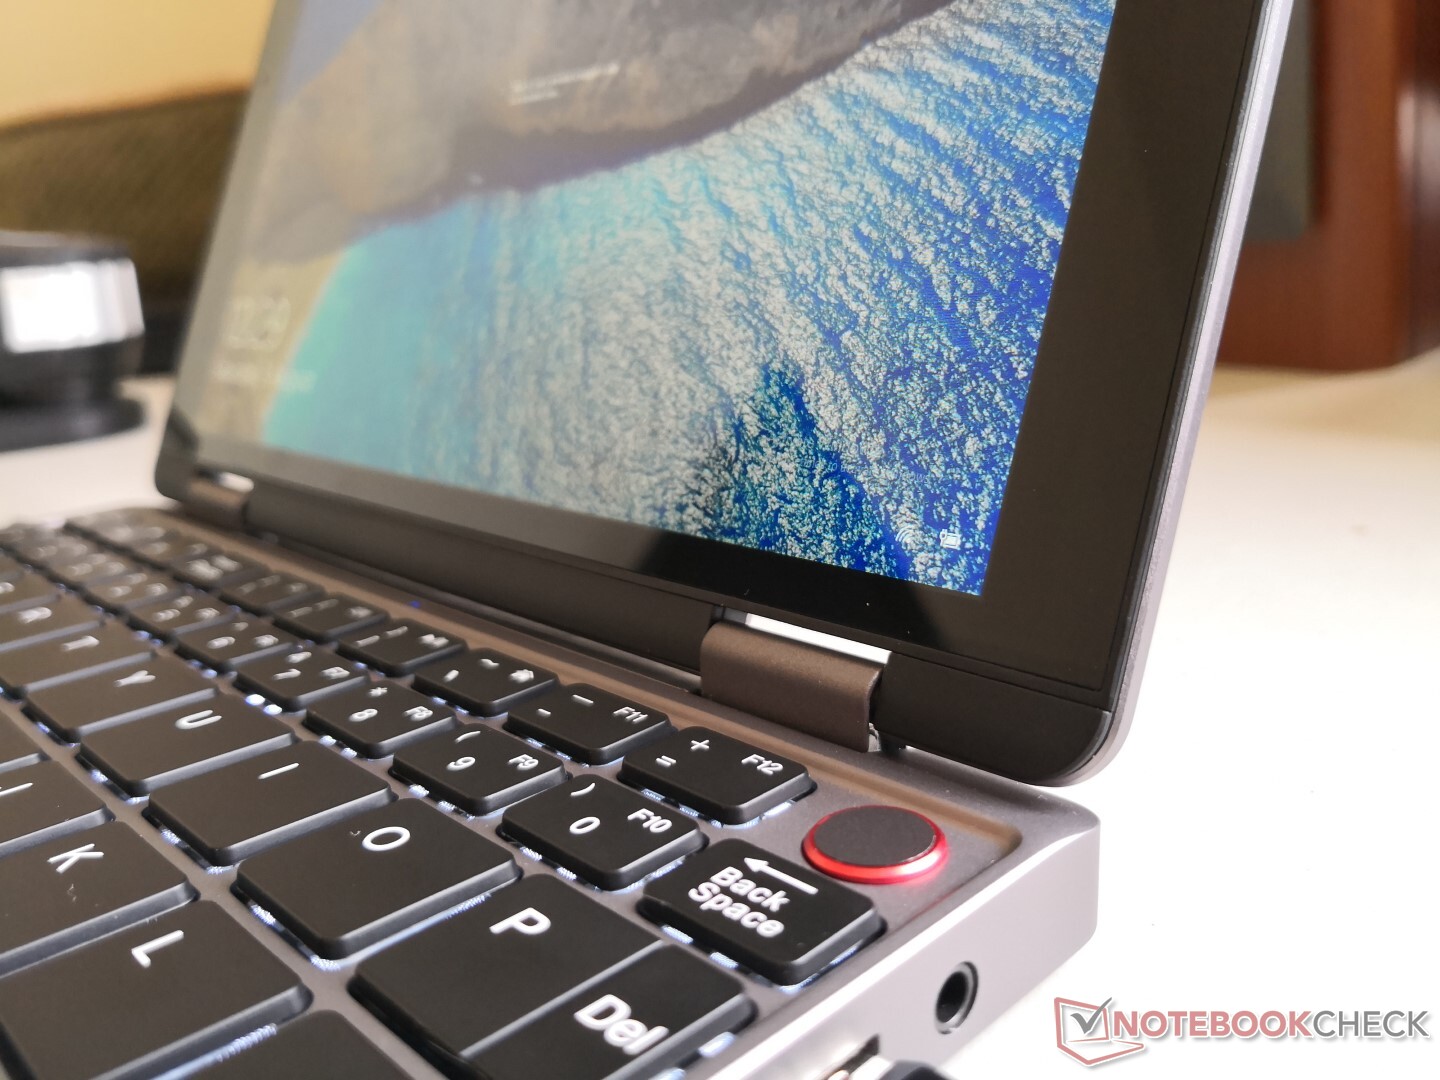
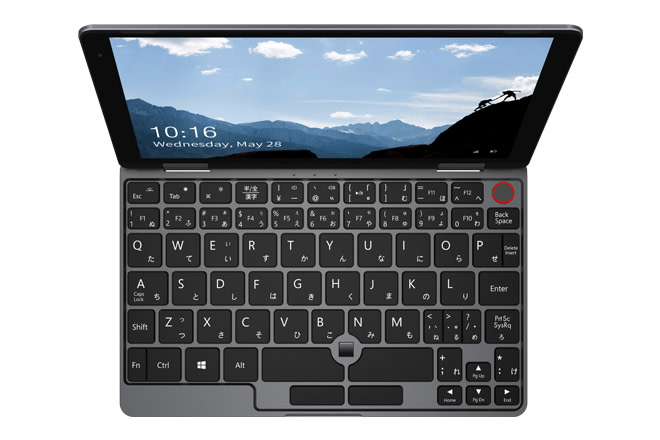
The Chuwi MiniBook is the Chinese OEM's latest IndieGogo project for users who want something even smaller and lighter than the typical 11-inch or 13-inch Ultrabook form factors. The UMPC in notable for its Lenovo Yoga-inspired 360-degree hinges, 16:10 1200p touchscreen, aluminum chassis, and expandable storage all in a compact 8-inch form factor.
The manufacturer plans to offer the MiniBook in two CPU configurations: Celeron N4100 and Core m3-8100Y for $429 and $529, respectively. Ports, RAM, and storage will be identical between both SKUs. The MiniBook is intended to compete against the MacBook Air, Surface Go, Lenovo Yoga Book, and the recent Topjoy Falcon.
More Chuwi reviews:
Case
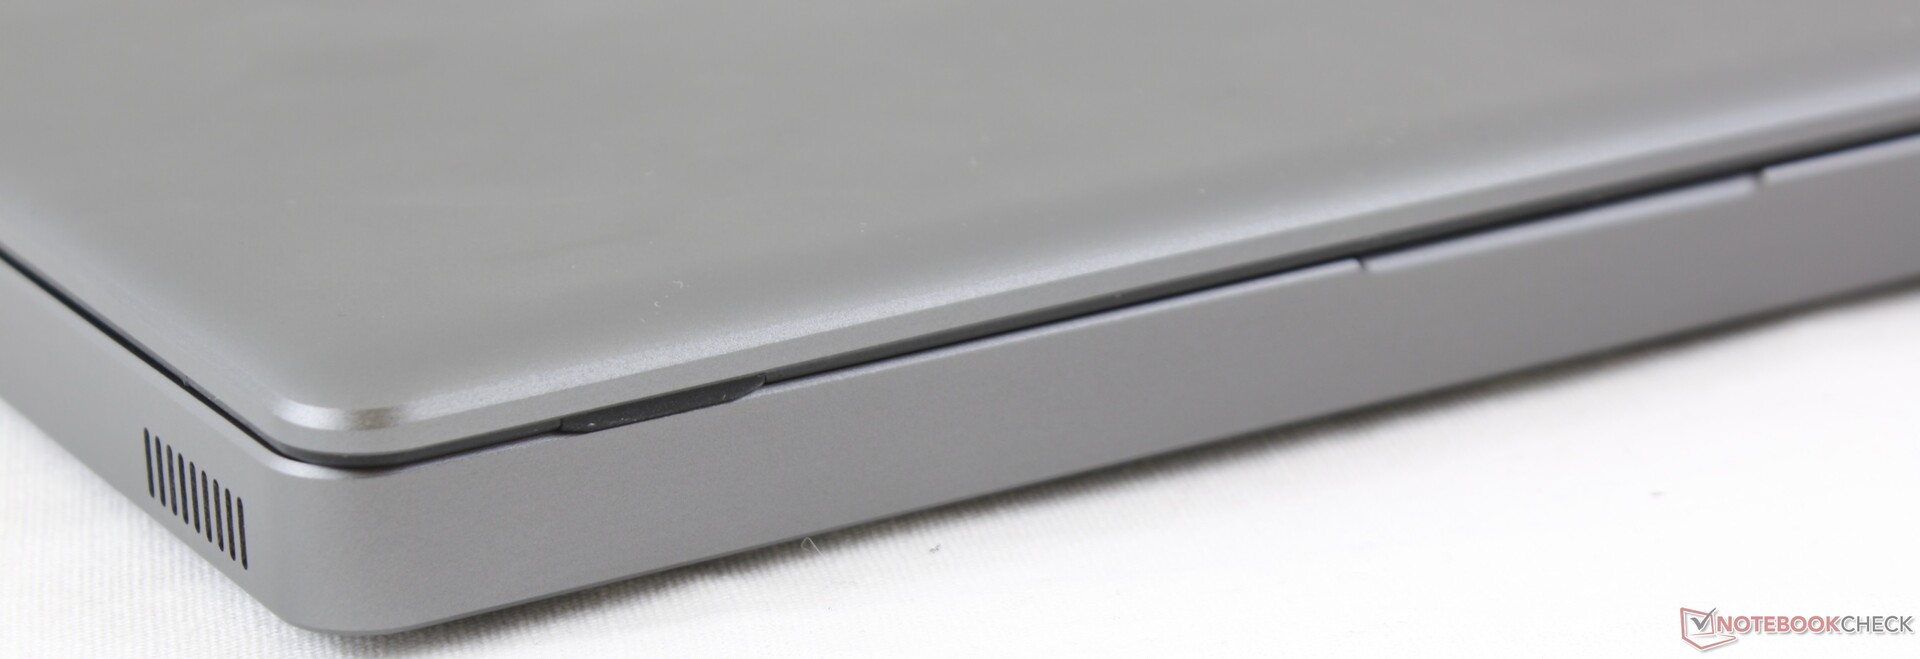
The aluminum alloy chassis feels a lot stronger and firmer than Chuwi's LapBook laptops. Whereas a LapBook sacrifices rigidity to be thin and sleek, the MiniBook is relatively thick with wider bezels for additional reinforcement. Creaking and flexing are minor even for the lid.
Overall dimensions and weight are very similar to the Topjoy Falcon and so many of our existing comments on the Falcon also apply here.
Connectivity
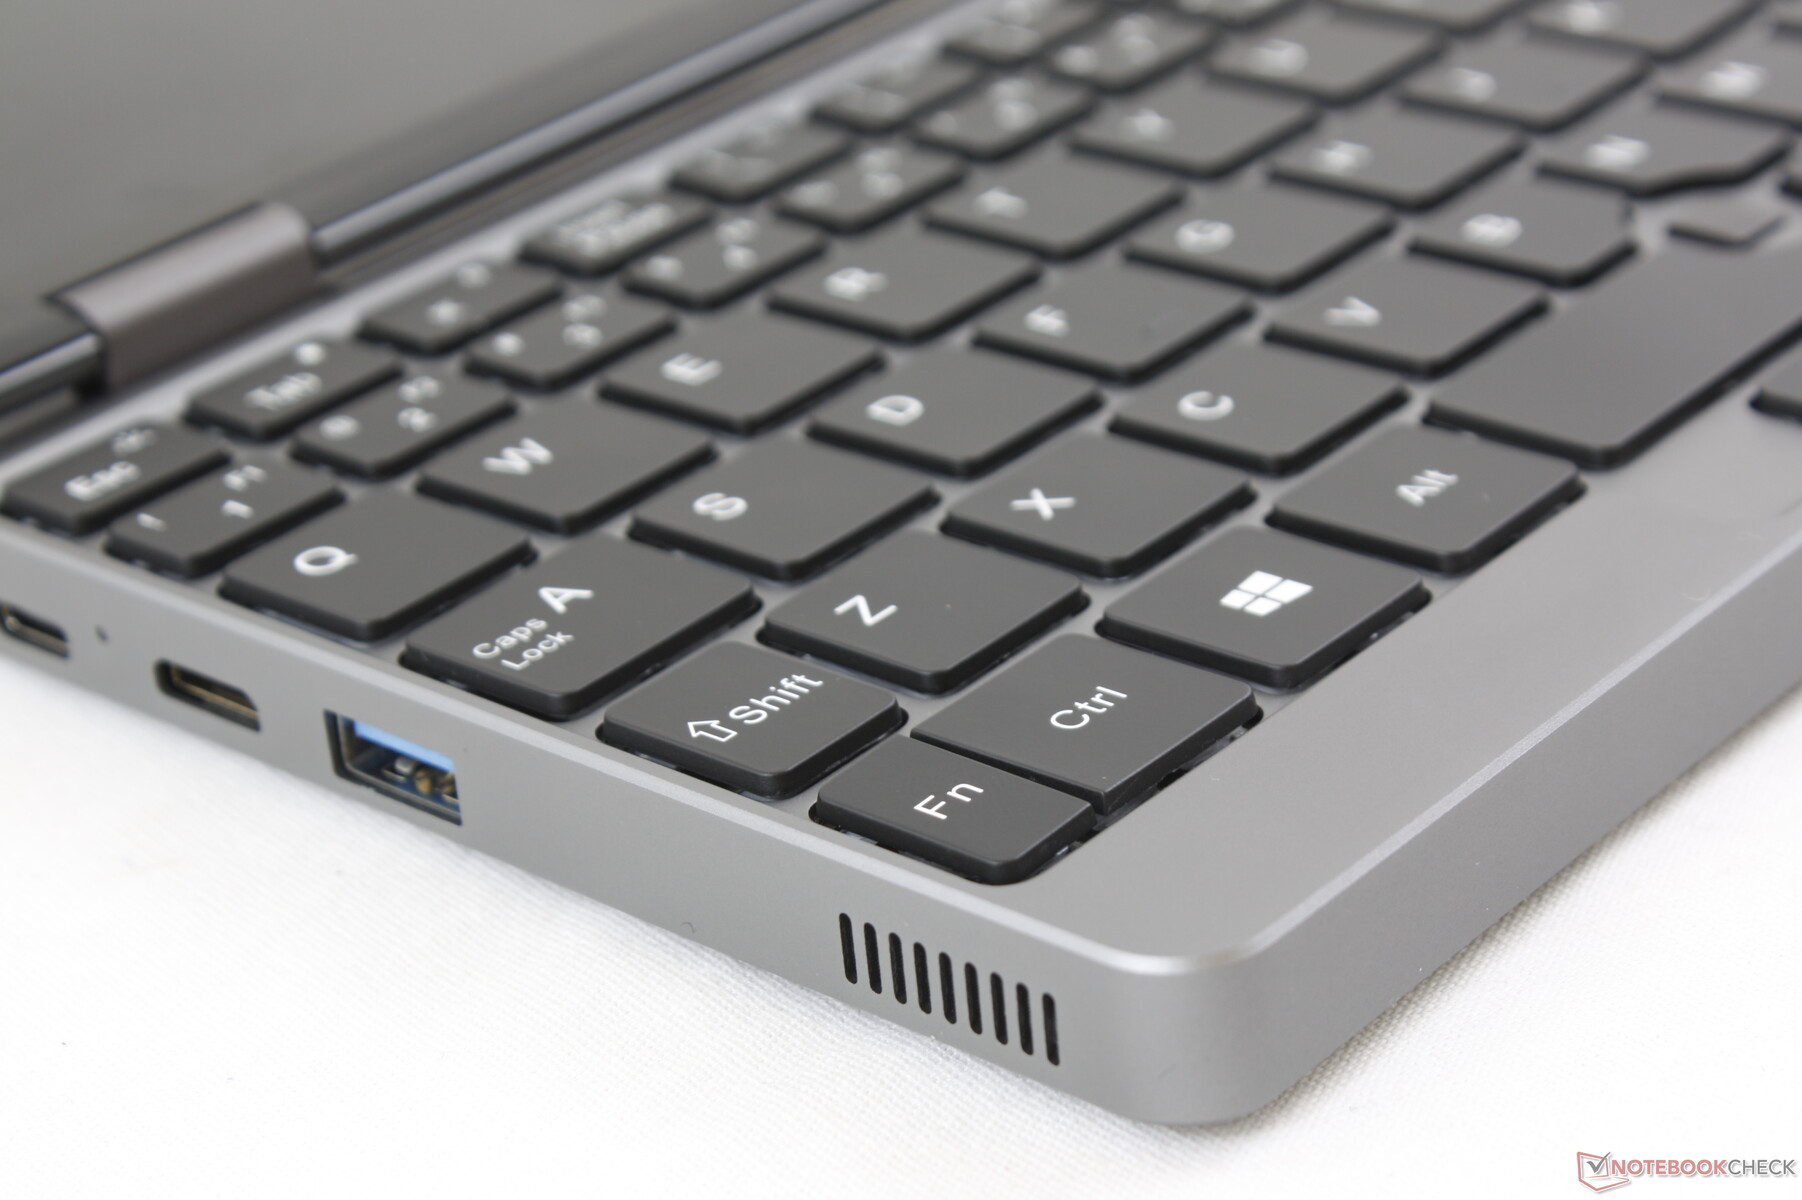
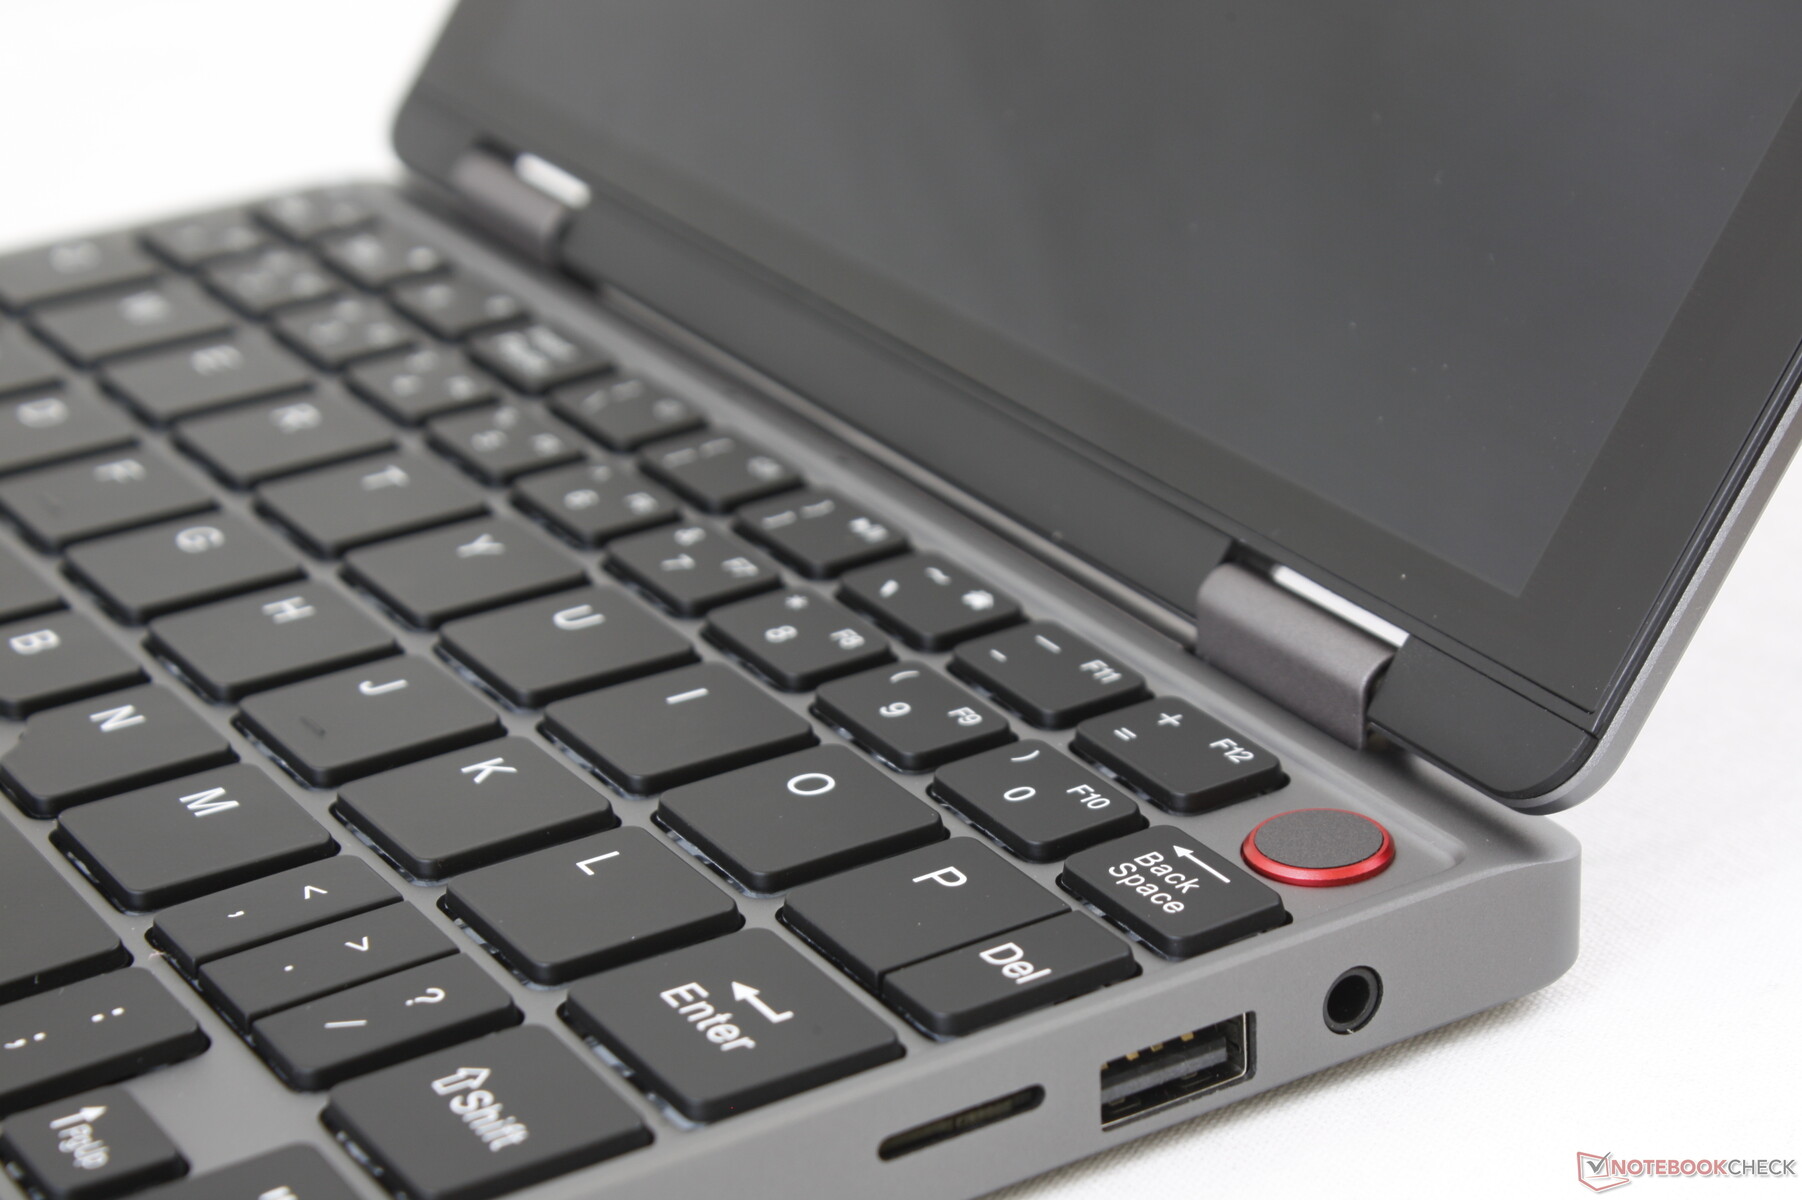
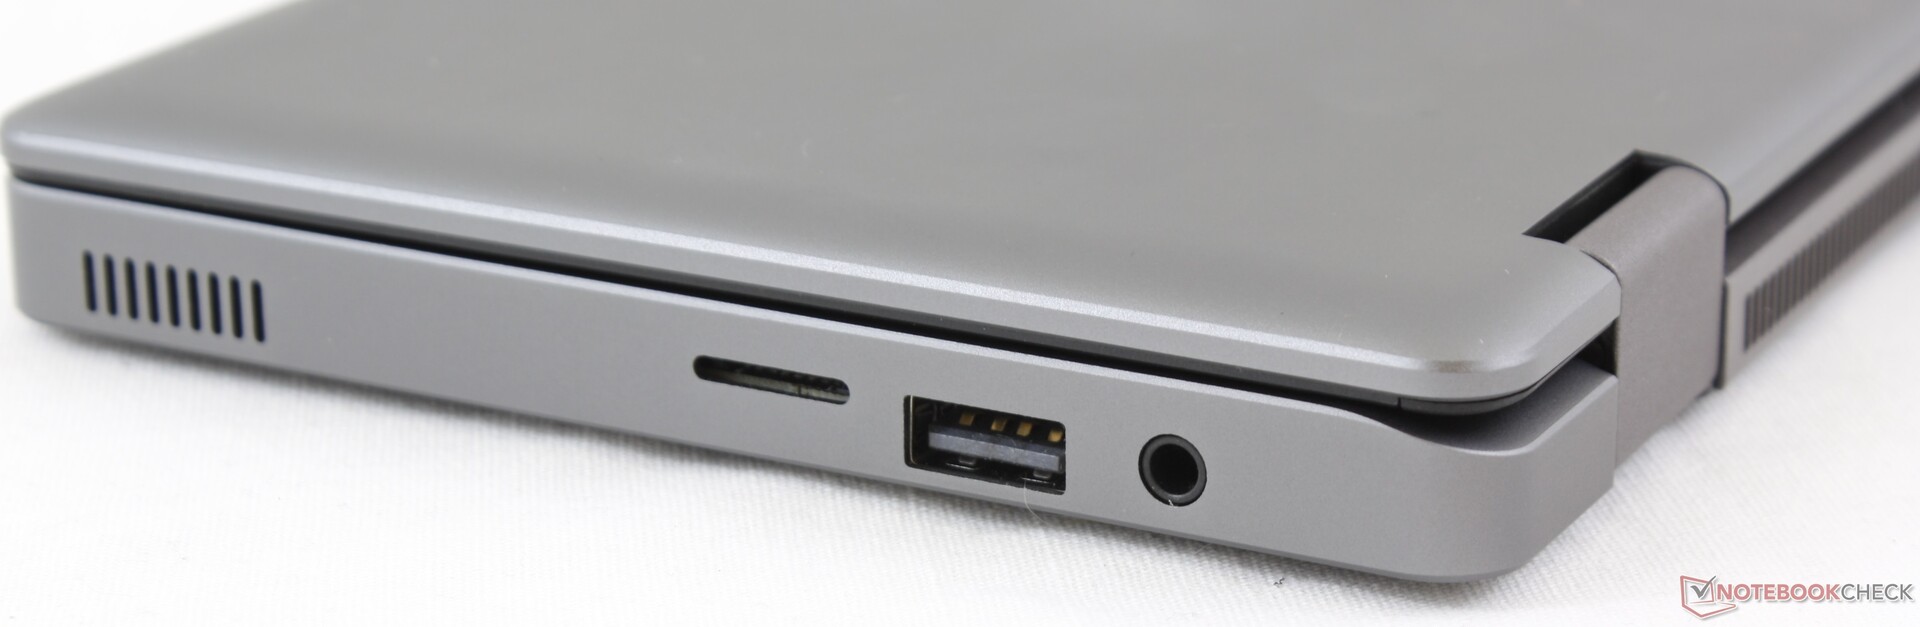
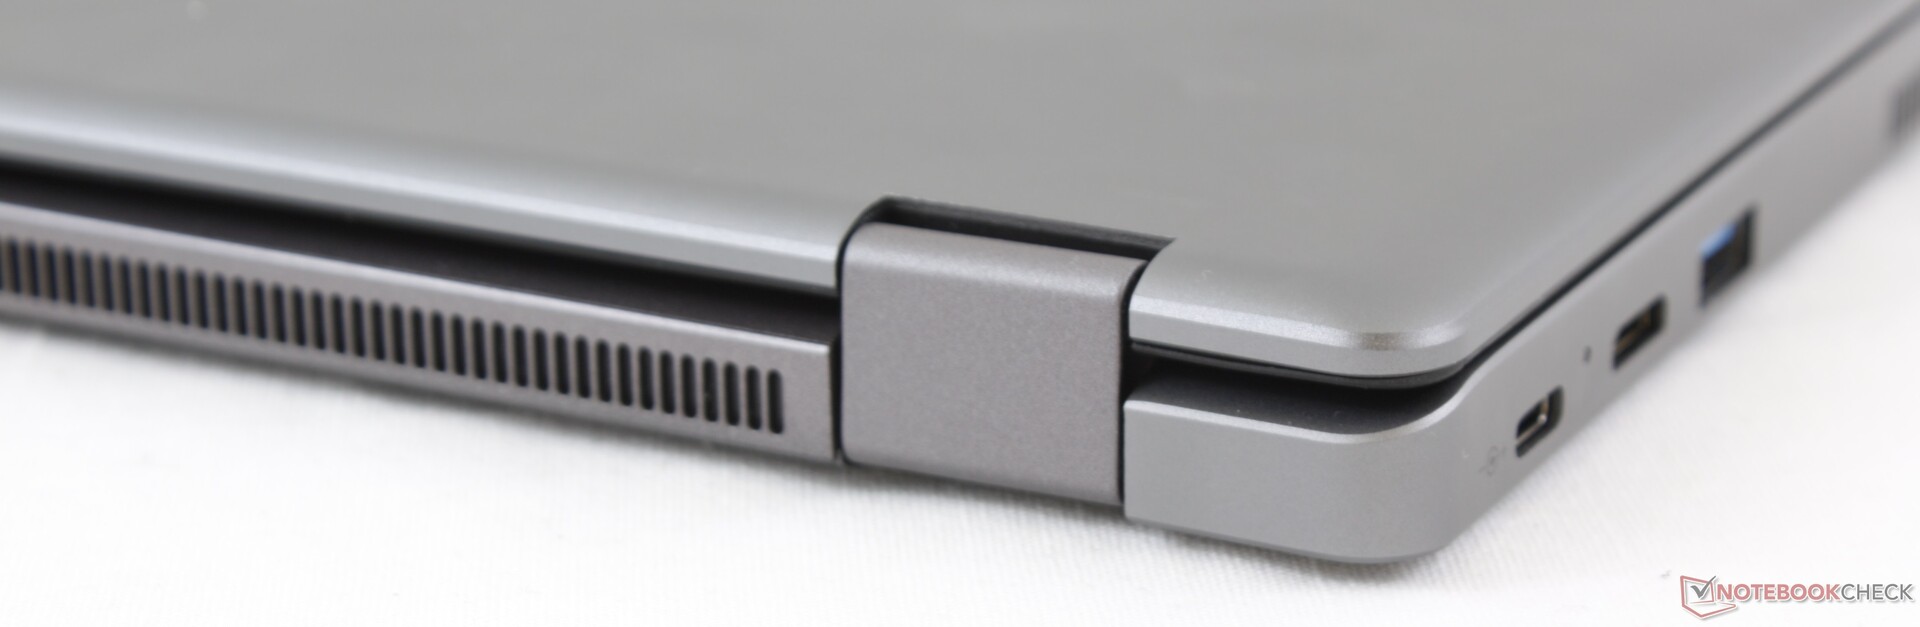
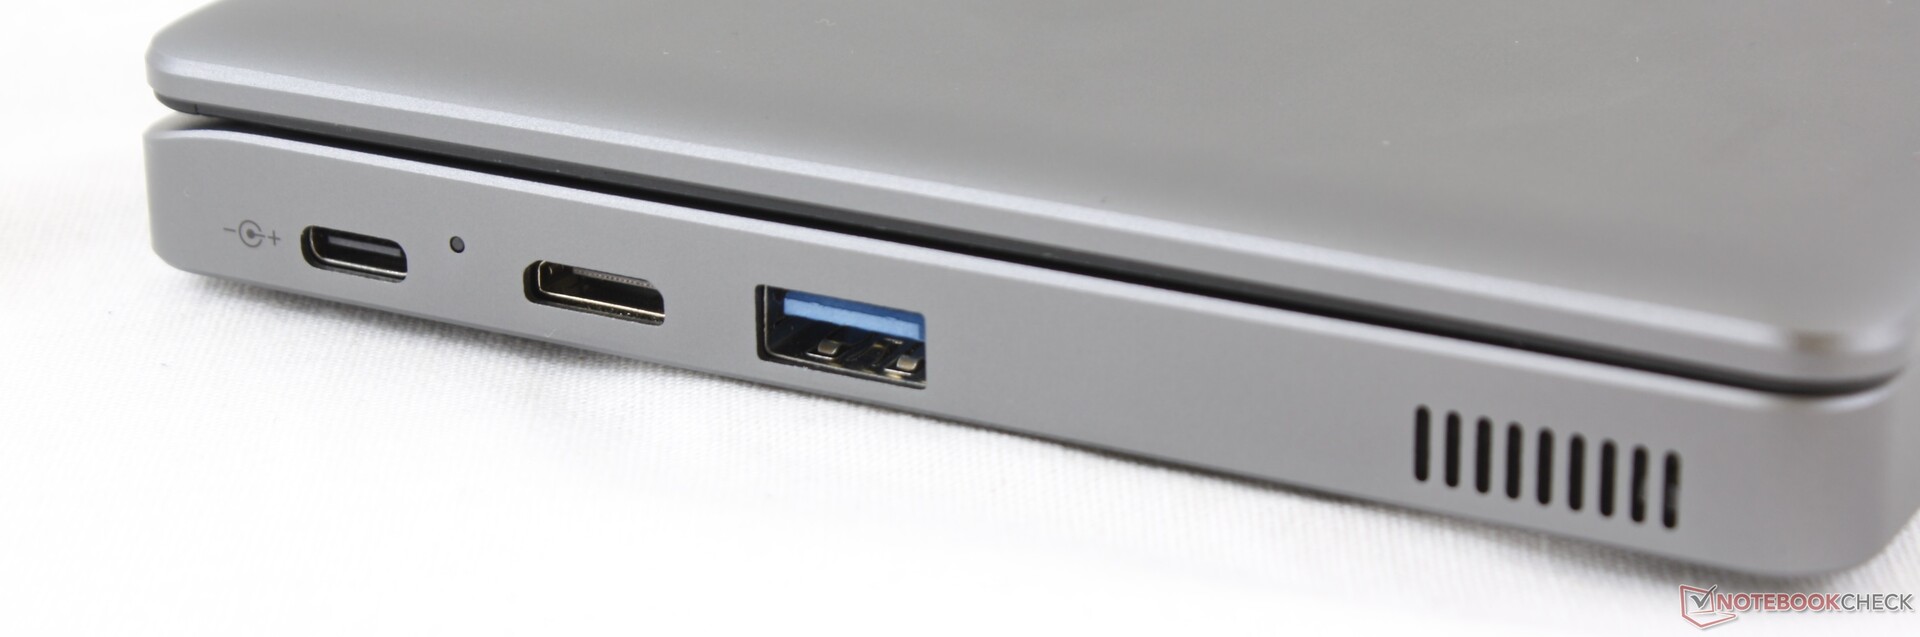
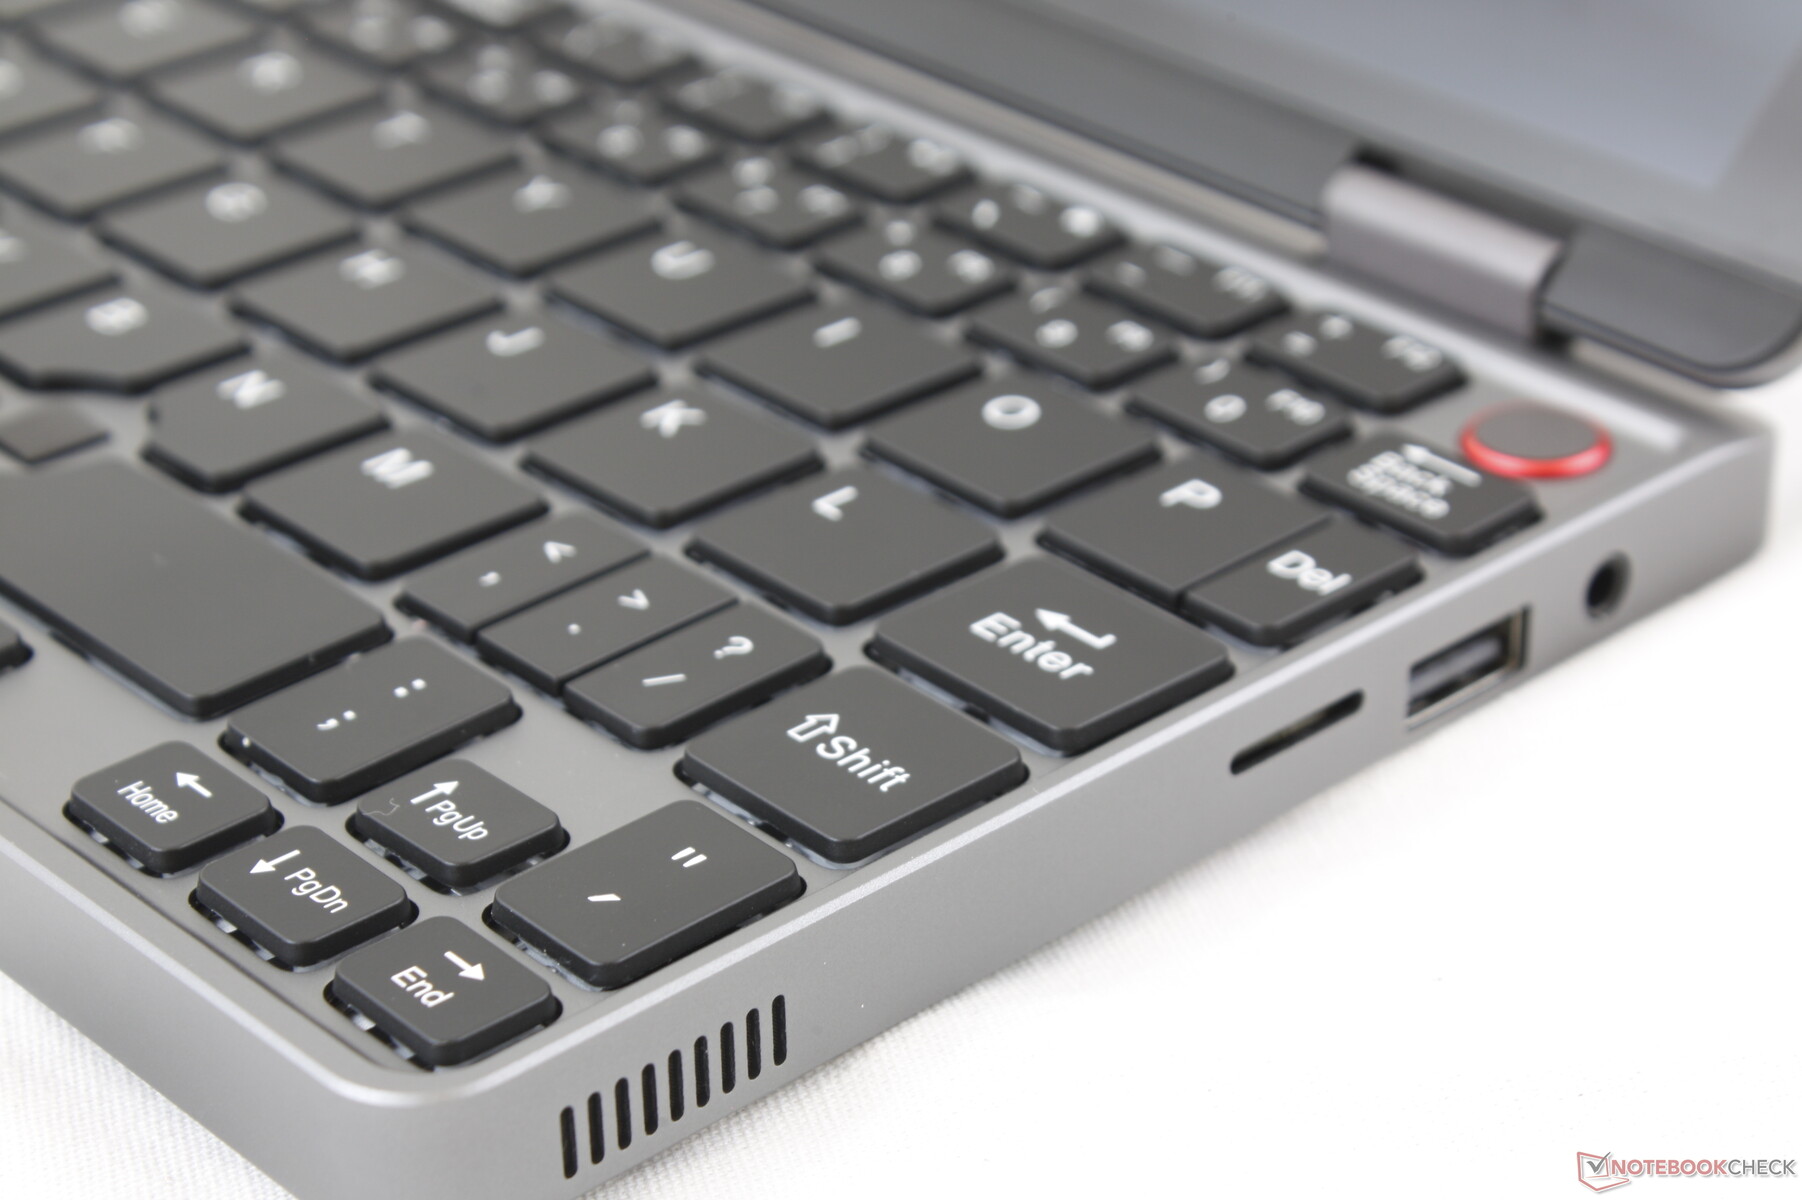
The six ports are evenly distributed along the left and right edges. Note that the system integrates mini-HDMI and a MicroSD reader instead of the more desirable full-size HDMI and full-size SD reader.
There are a couple of annoyances worth mentioning. Firstly, the right USB Type-A port is upside-down while the left USB Type-A port is right-side up. Secondly, the lone USB Type-C port is used for both charging and data meaning that you will not be able to recharge the system and plug in a USB Type-C accessory simultaneously.
SD Card Reader
Transfer rates are slow from the spring-loaded MicroSD card reader. Moving 1 GB of pictures from our UHS-II test card to desktop takes about 45 seconds compared to 7 seconds on the Dell XPS 13.
A fully inserted MicroSD sits flush against the edge for safe transporting. Ejecting can be difficult for larger fingers.
| SD Card Reader | |
| average JPG Copy Test (av. of 3 runs) | |
| Microsoft Surface Go MHN-00003 (Toshiba Exceria Pro M501) | |
| Chuwi MiniBook CWI526 (Toshiba Exceria Pro M501) | |
| maximum AS SSD Seq Read Test (1GB) | |
| Microsoft Surface Go MHN-00003 (Toshiba Exceria Pro M501) | |
| Lenovo Yoga Book C930 YB-J912F (Toshiba Exceria Pro M501 microSDXC 64GB) | |
| Chuwi MiniBook CWI526 (Toshiba Exceria Pro M501) | |
Communication
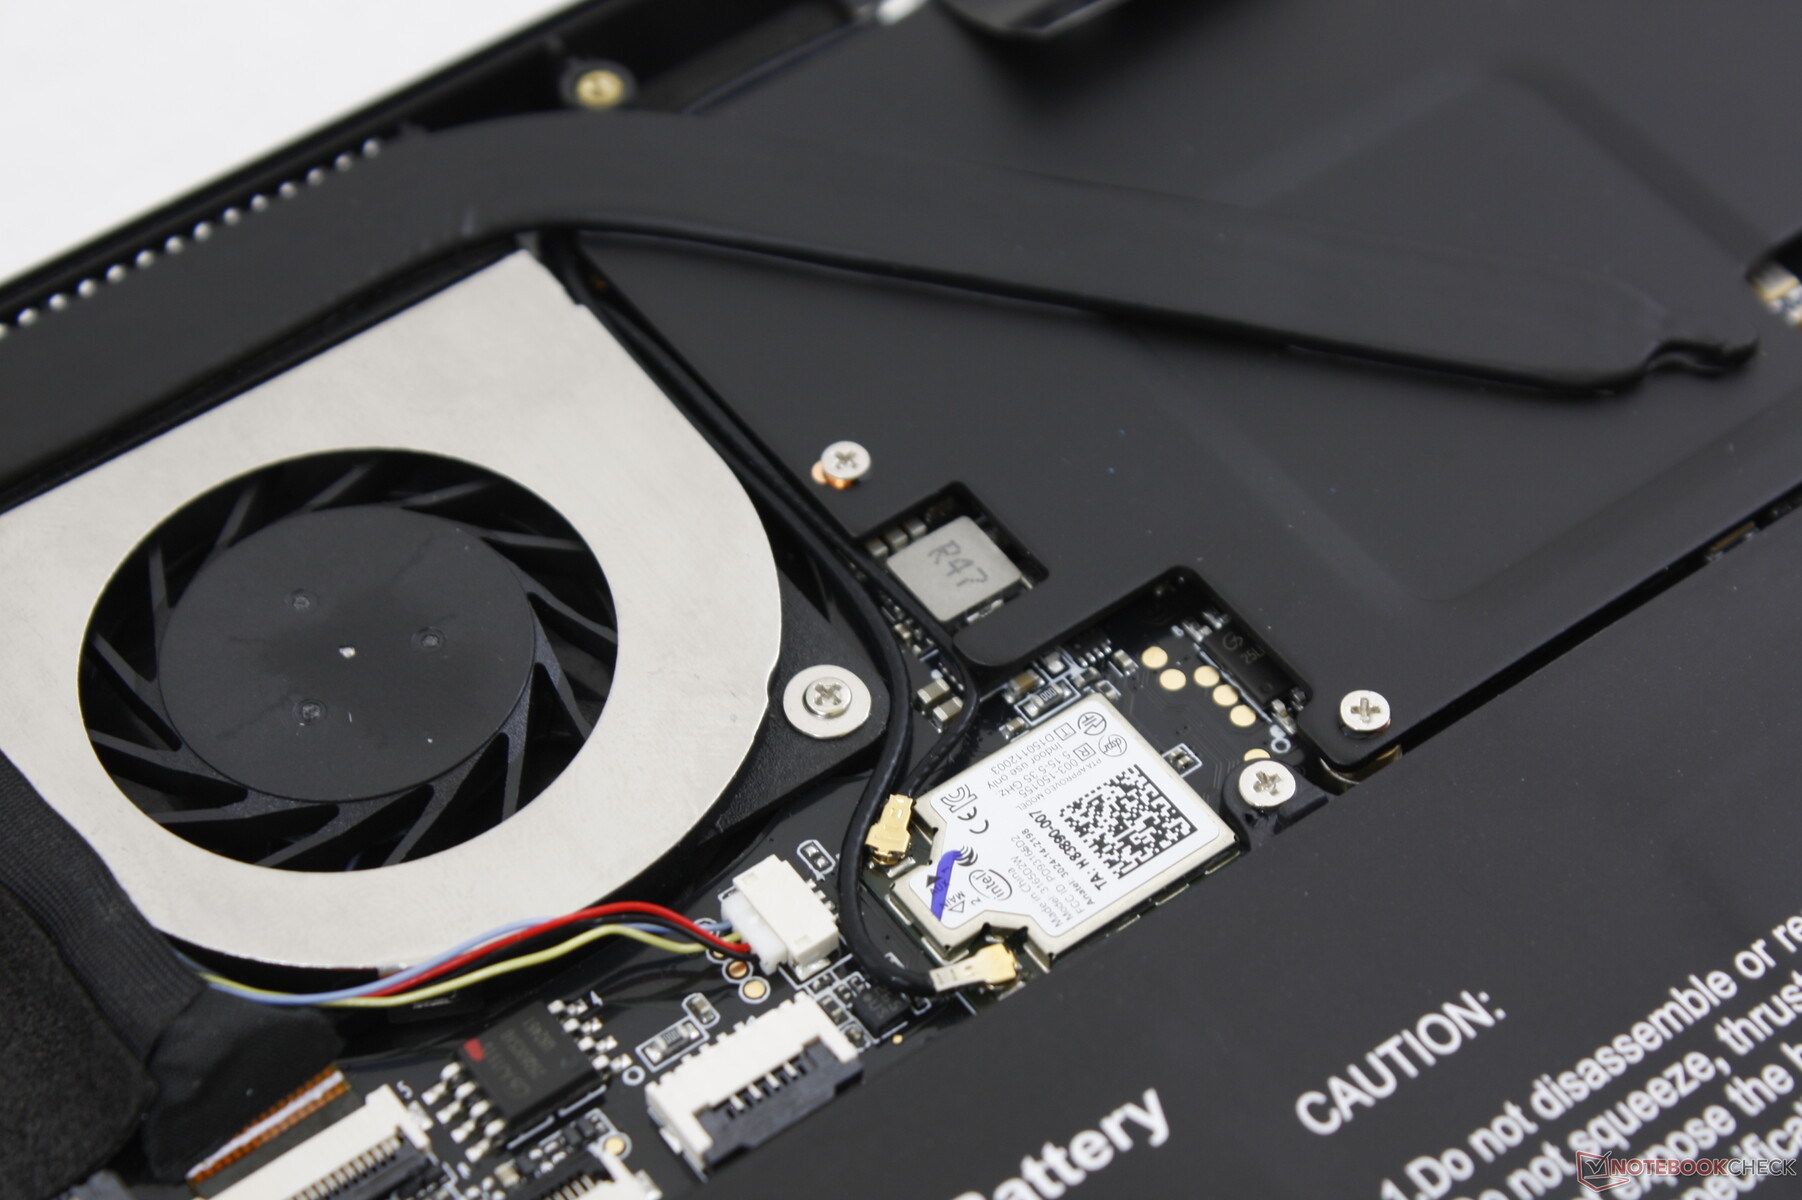
The 1x1 Intel 3165 is limited to a maximum of 433 Mbps compared to 1.73 Gbps on the costlier 2x2 Intel 8260. Nonetheless, performance is reliable and more than sufficient for the purposes of the MiniBook. Bluetooth 4.2 is integrated with no WAN features.
Maintenance
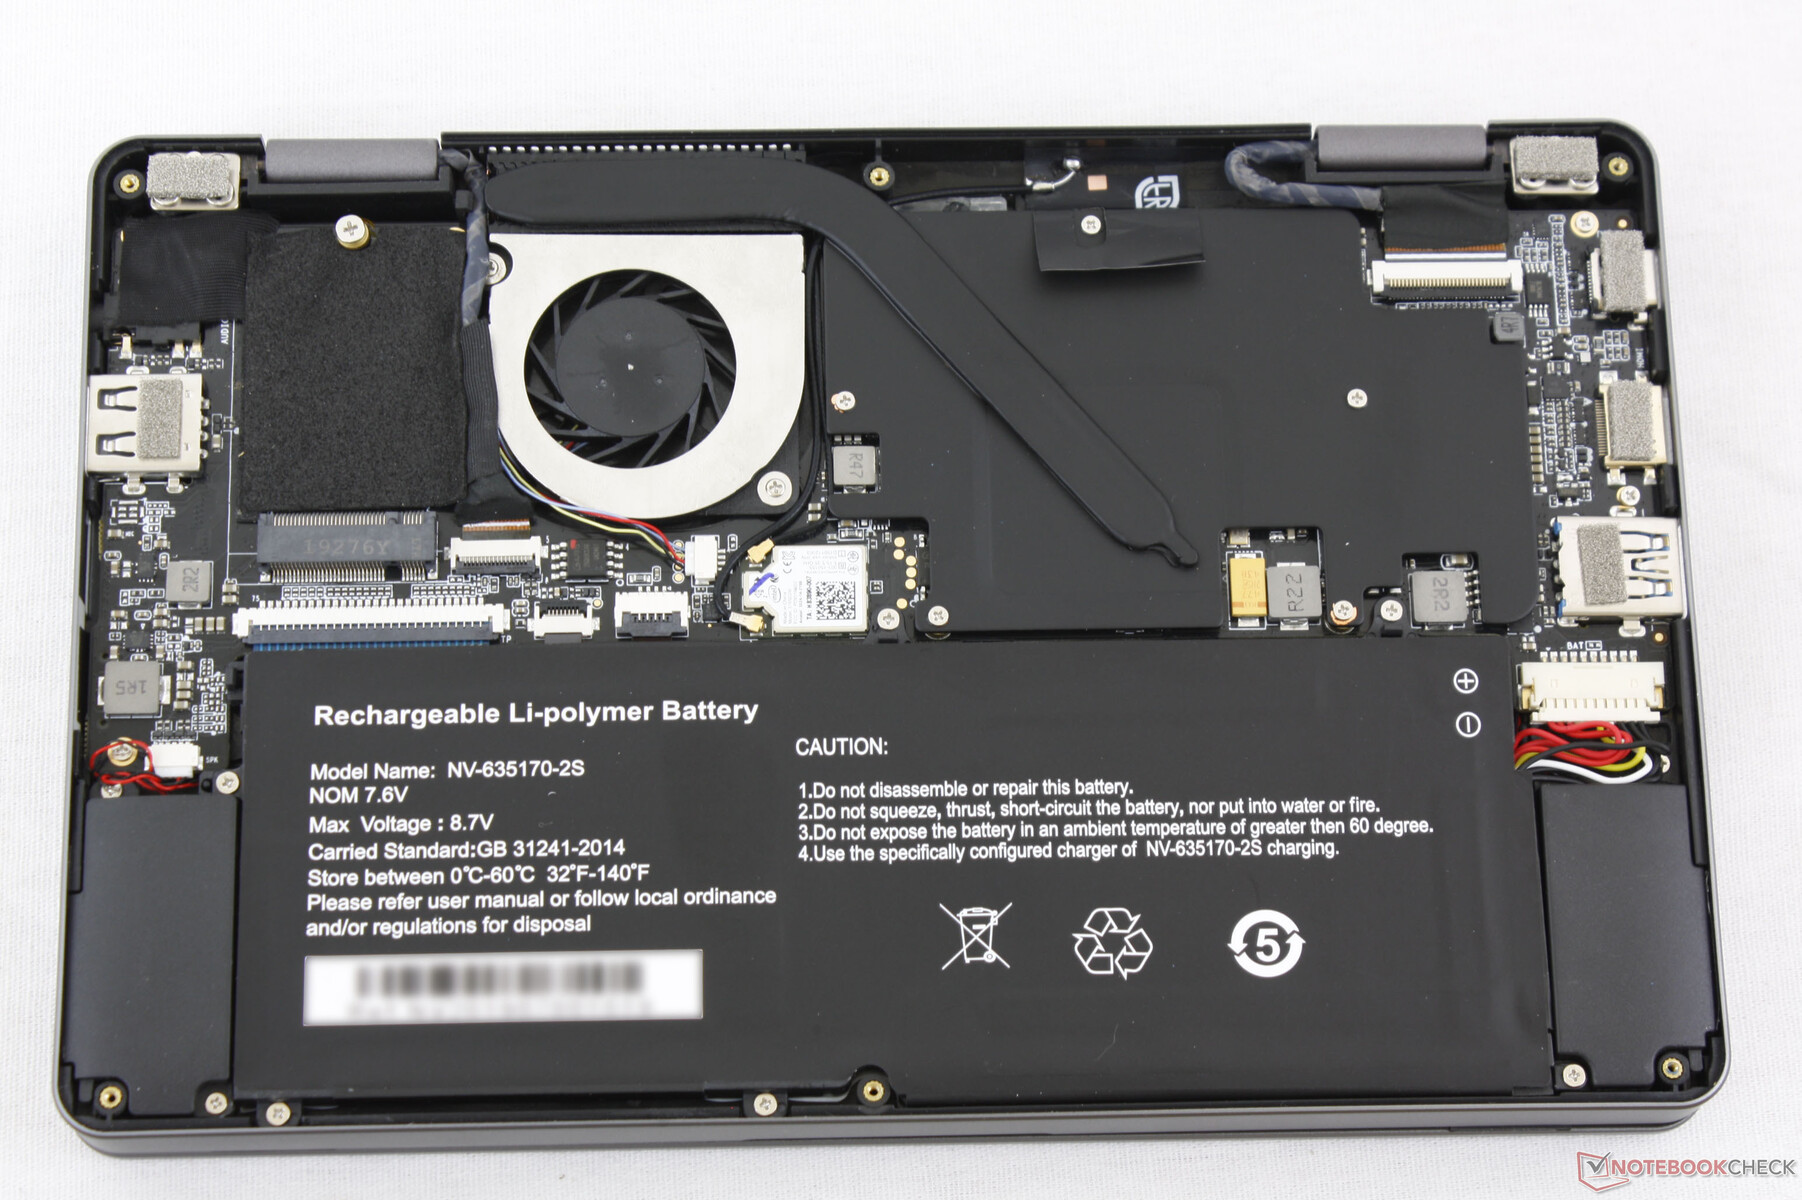
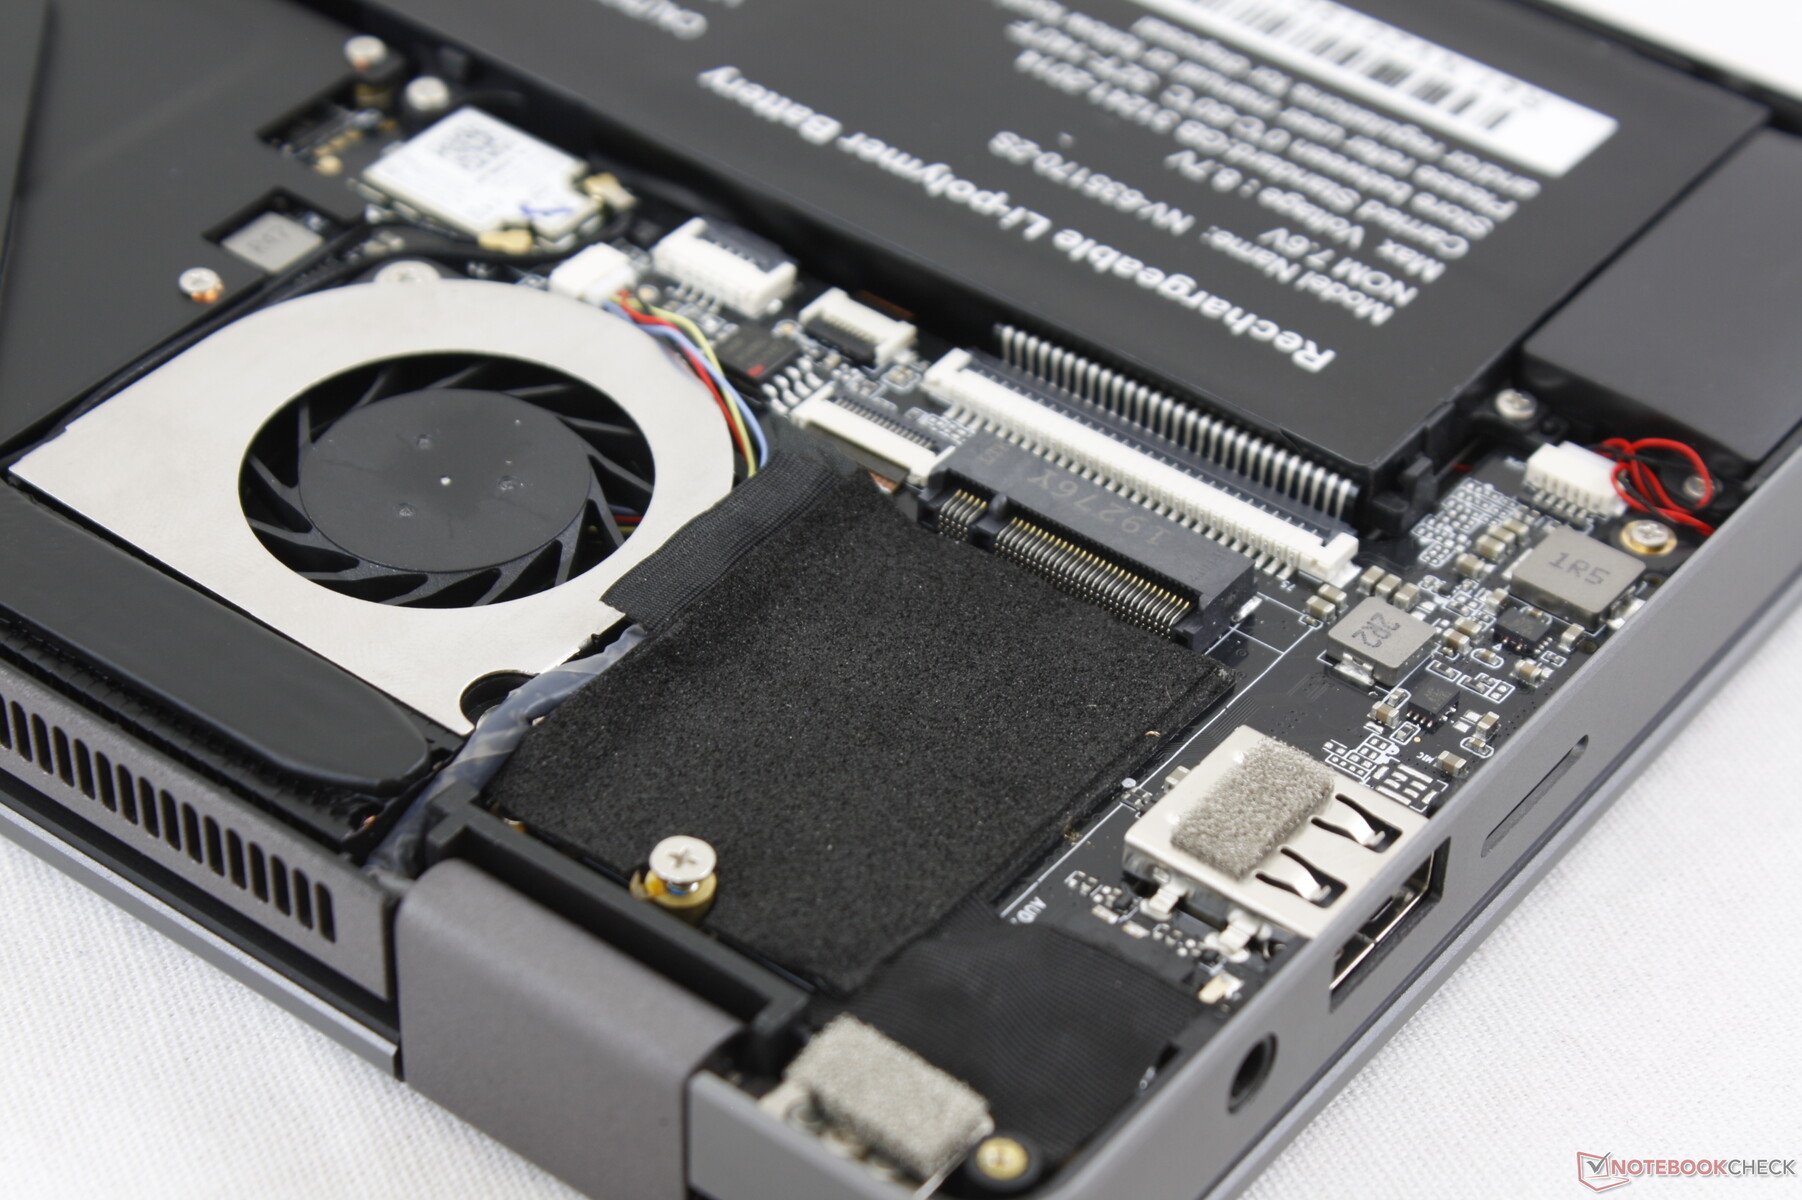
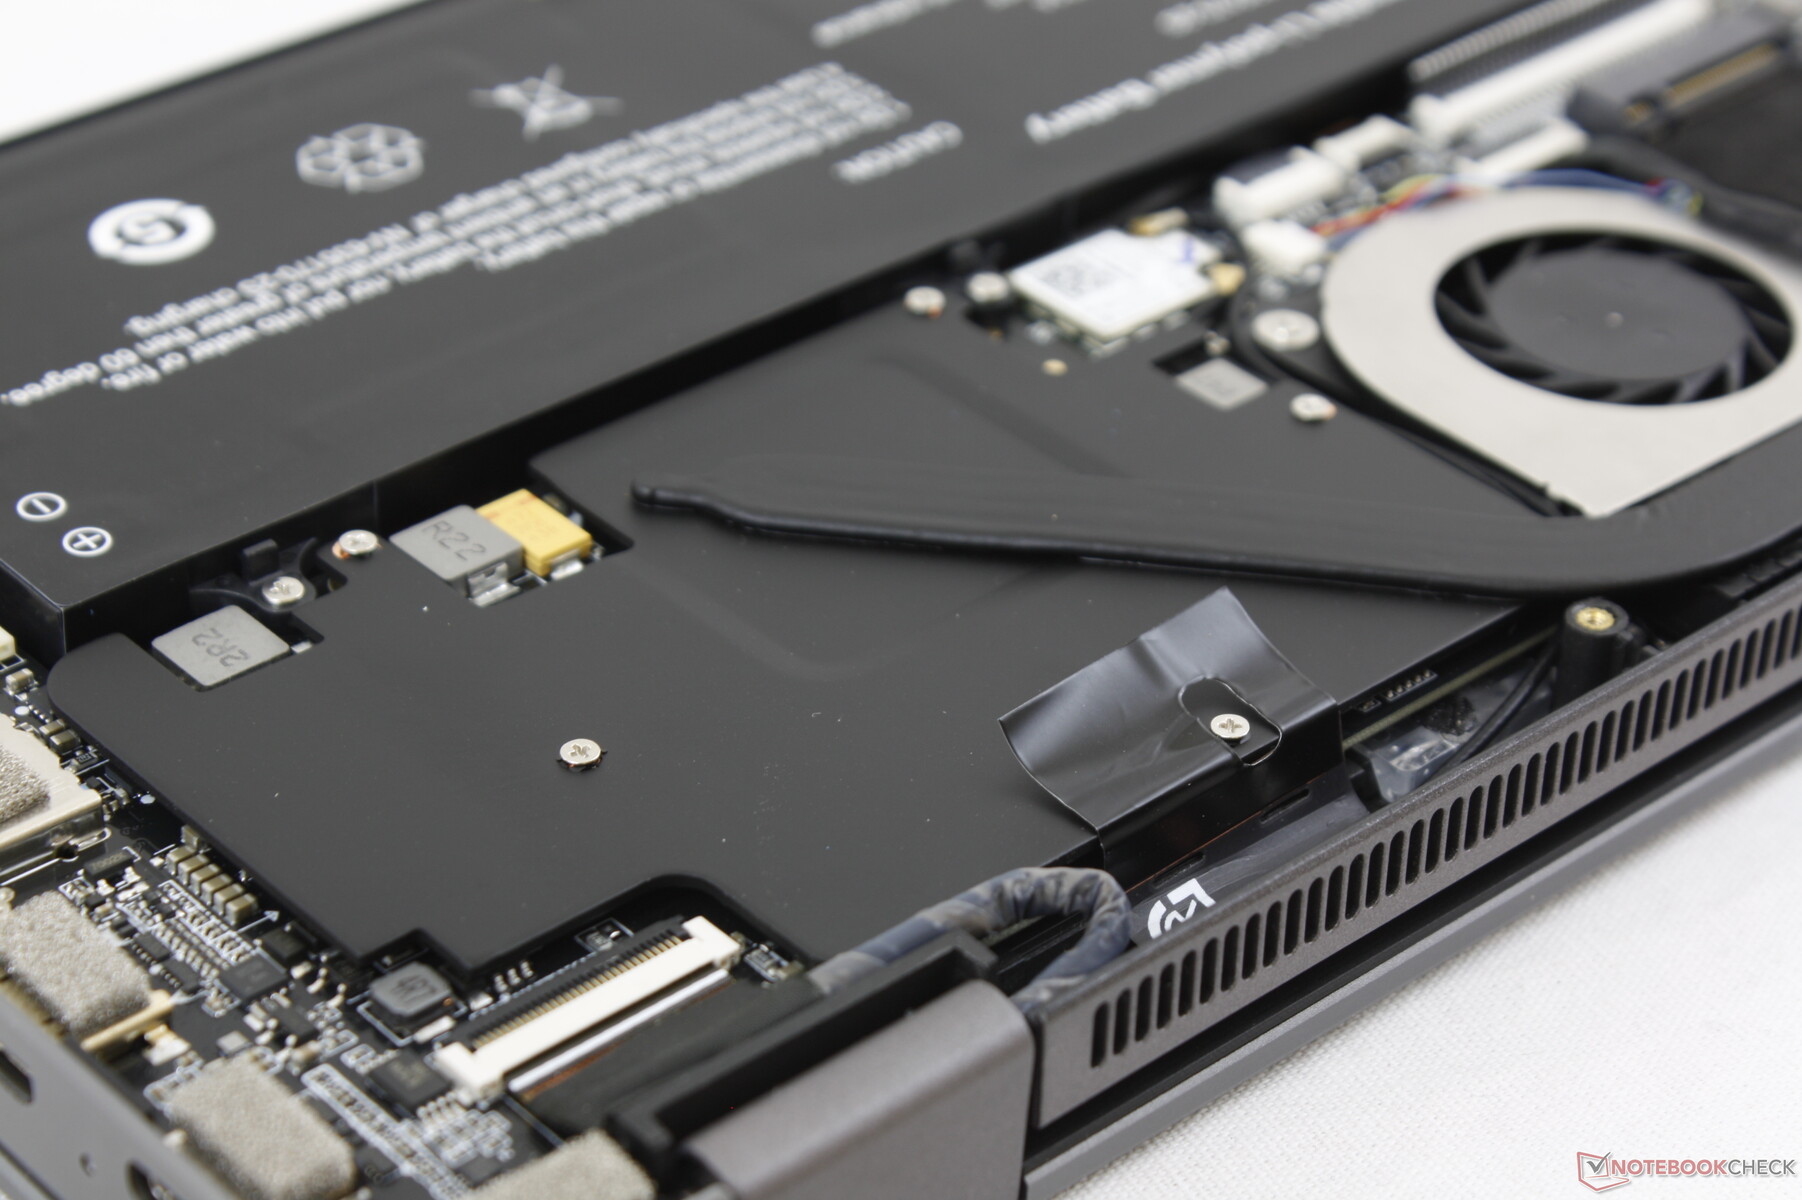
The bottom panel comes off easily after removing the seven Philips screws. While RAM and WLAN are soldered, users can still easily add a secondary SSD or service the battery.
Accessories and Warranty
There are no included extras in the box and it appears that the touchscreen will not be compatible with WACOM pens.
We expect the usual one-year limited manufacturer warranty at launch. Owners will likely have to pay for any shipping expenses out of pocket.
Input Devices
Keyboard
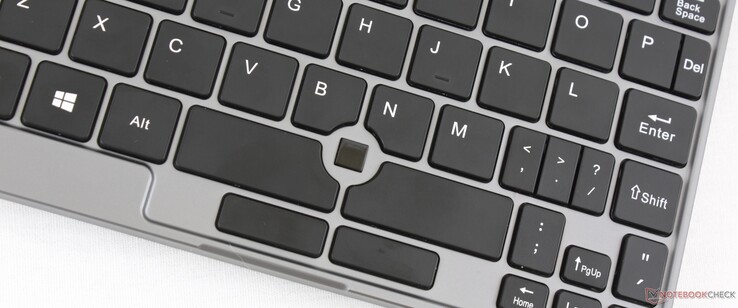
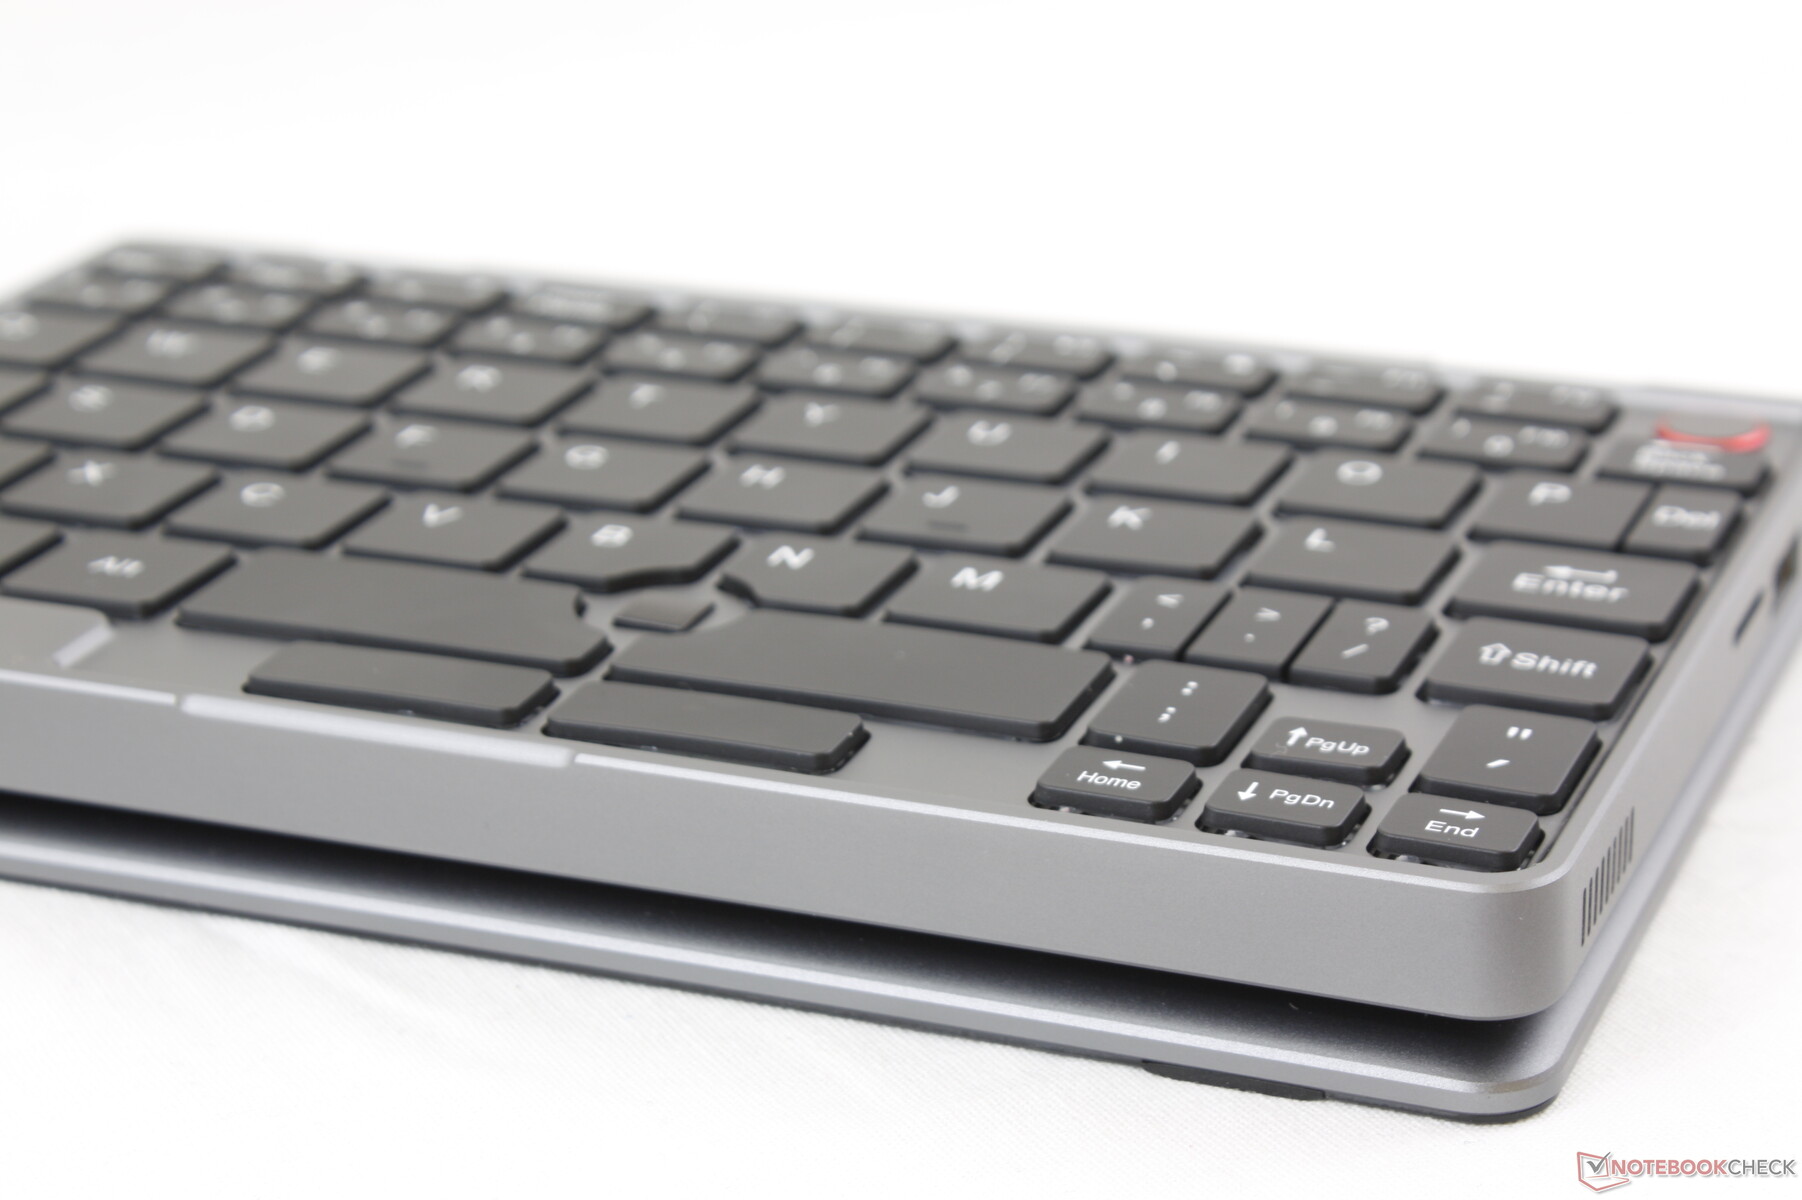
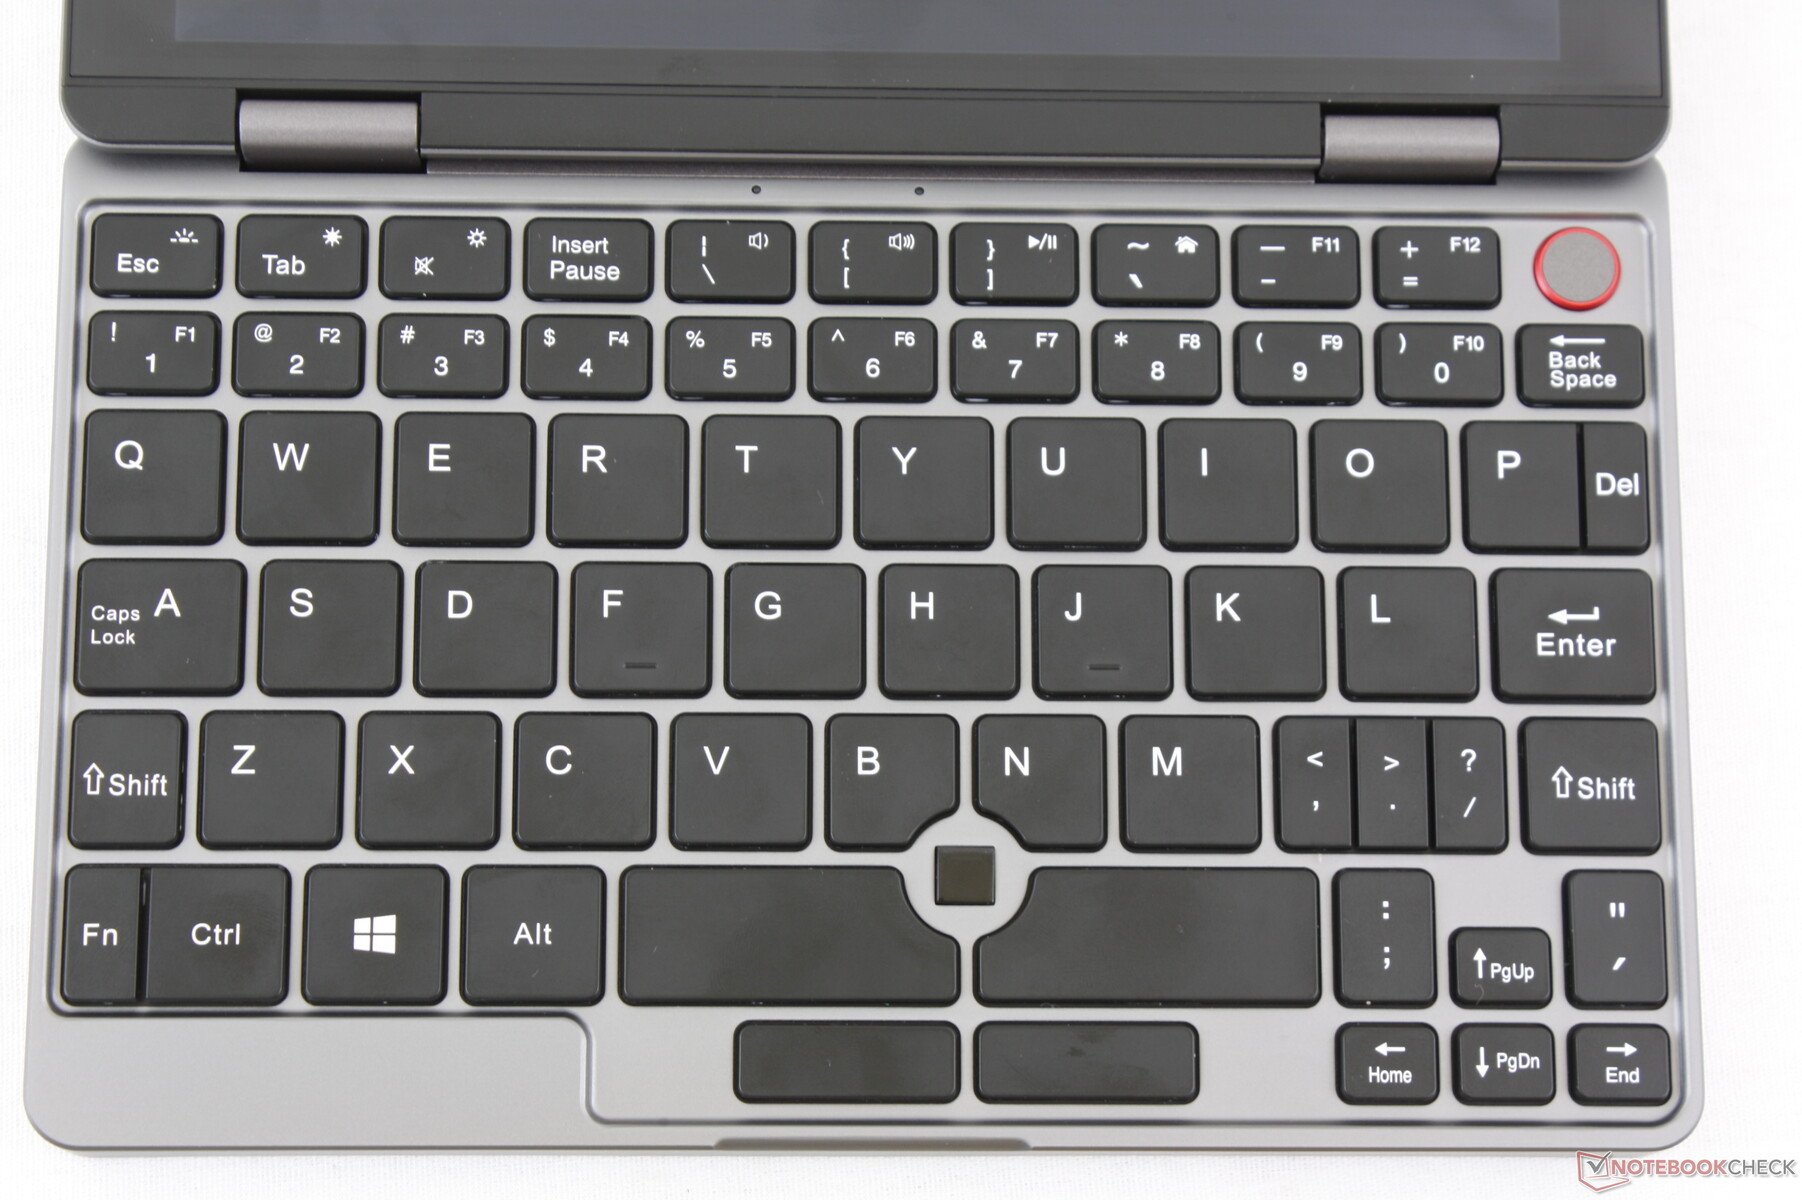
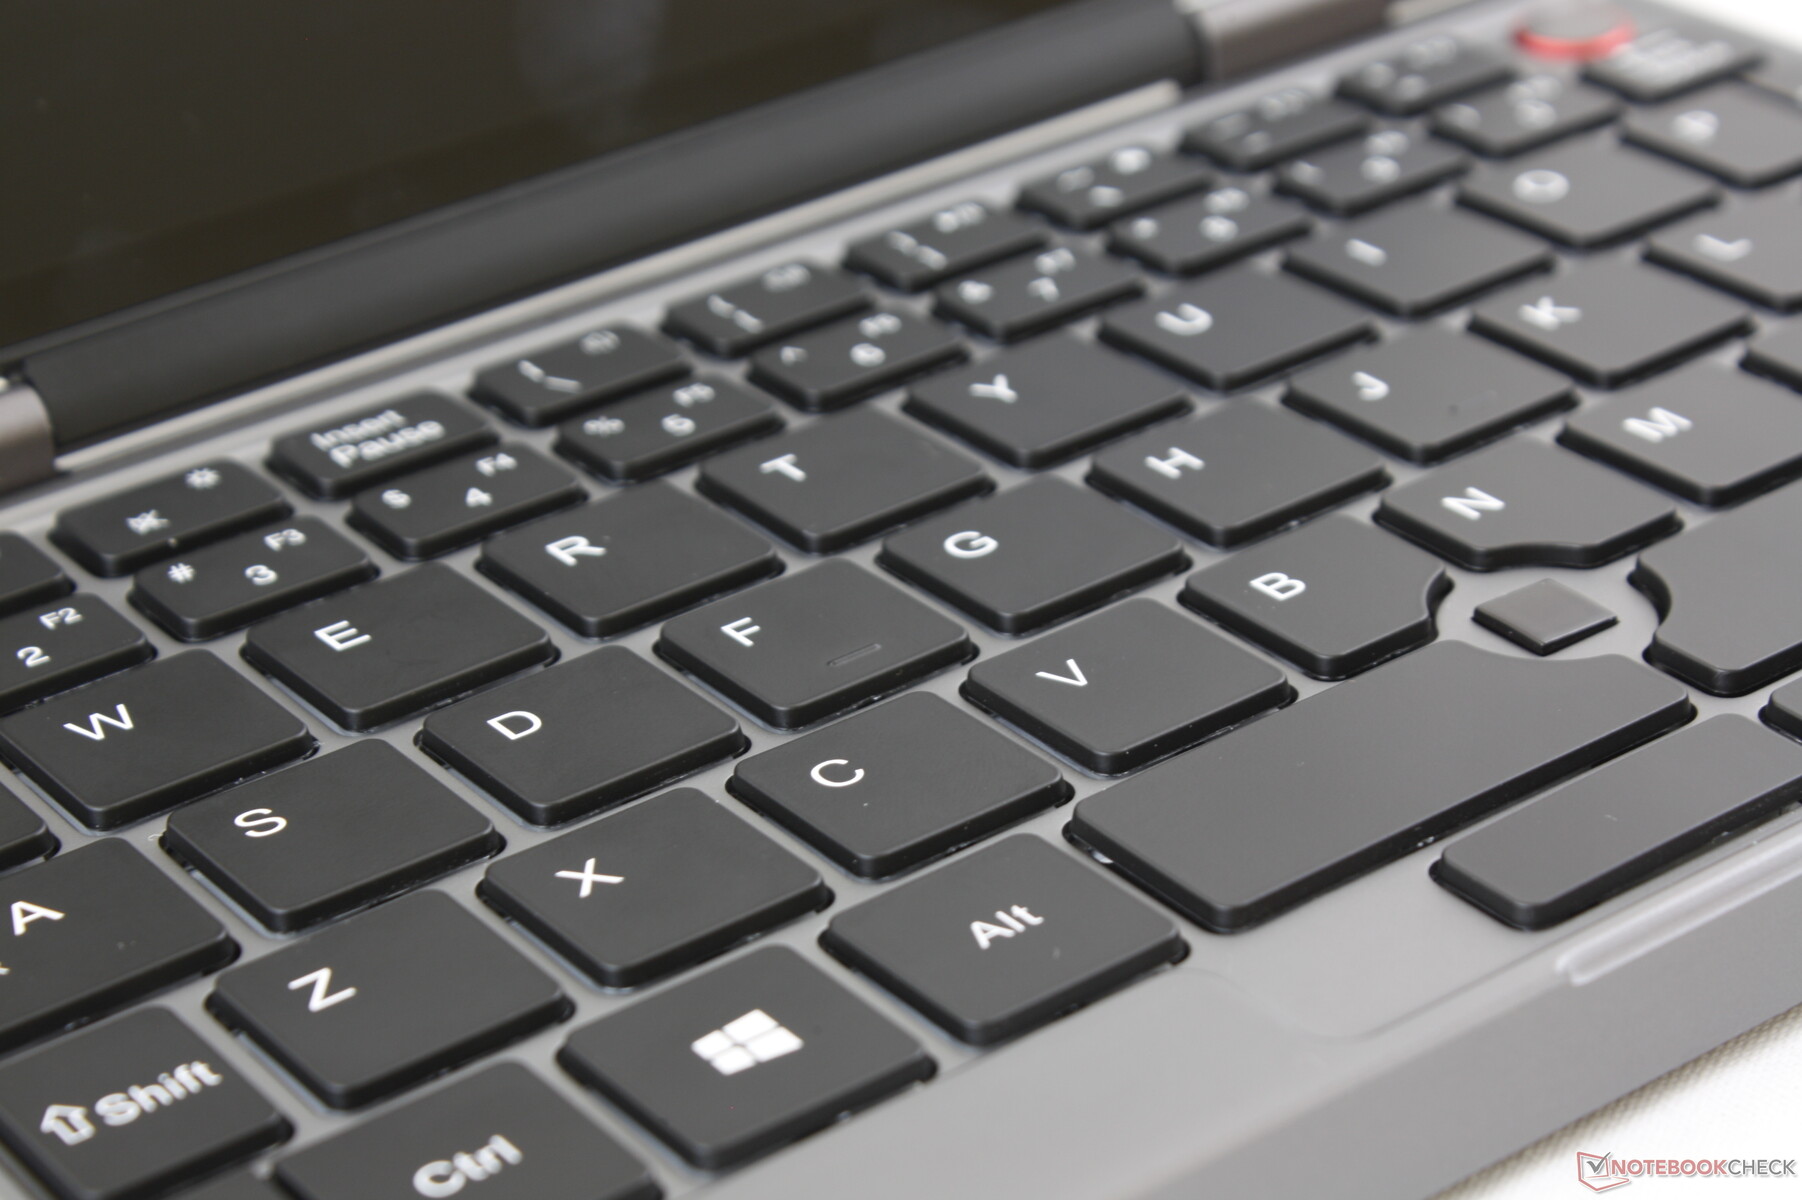
To our surprise, the backlit keyboard keys are crisp in feedback with relatively deep travel despite the low price and small size. Keyboard layout, however, is very unusual. All keys outside of the main full-size QWERTY keys are understandably small and even oddly shaped in order to fit the limited surface area available. It'll take at least a few days of typing before the layout becomes second nature.
Touchpad
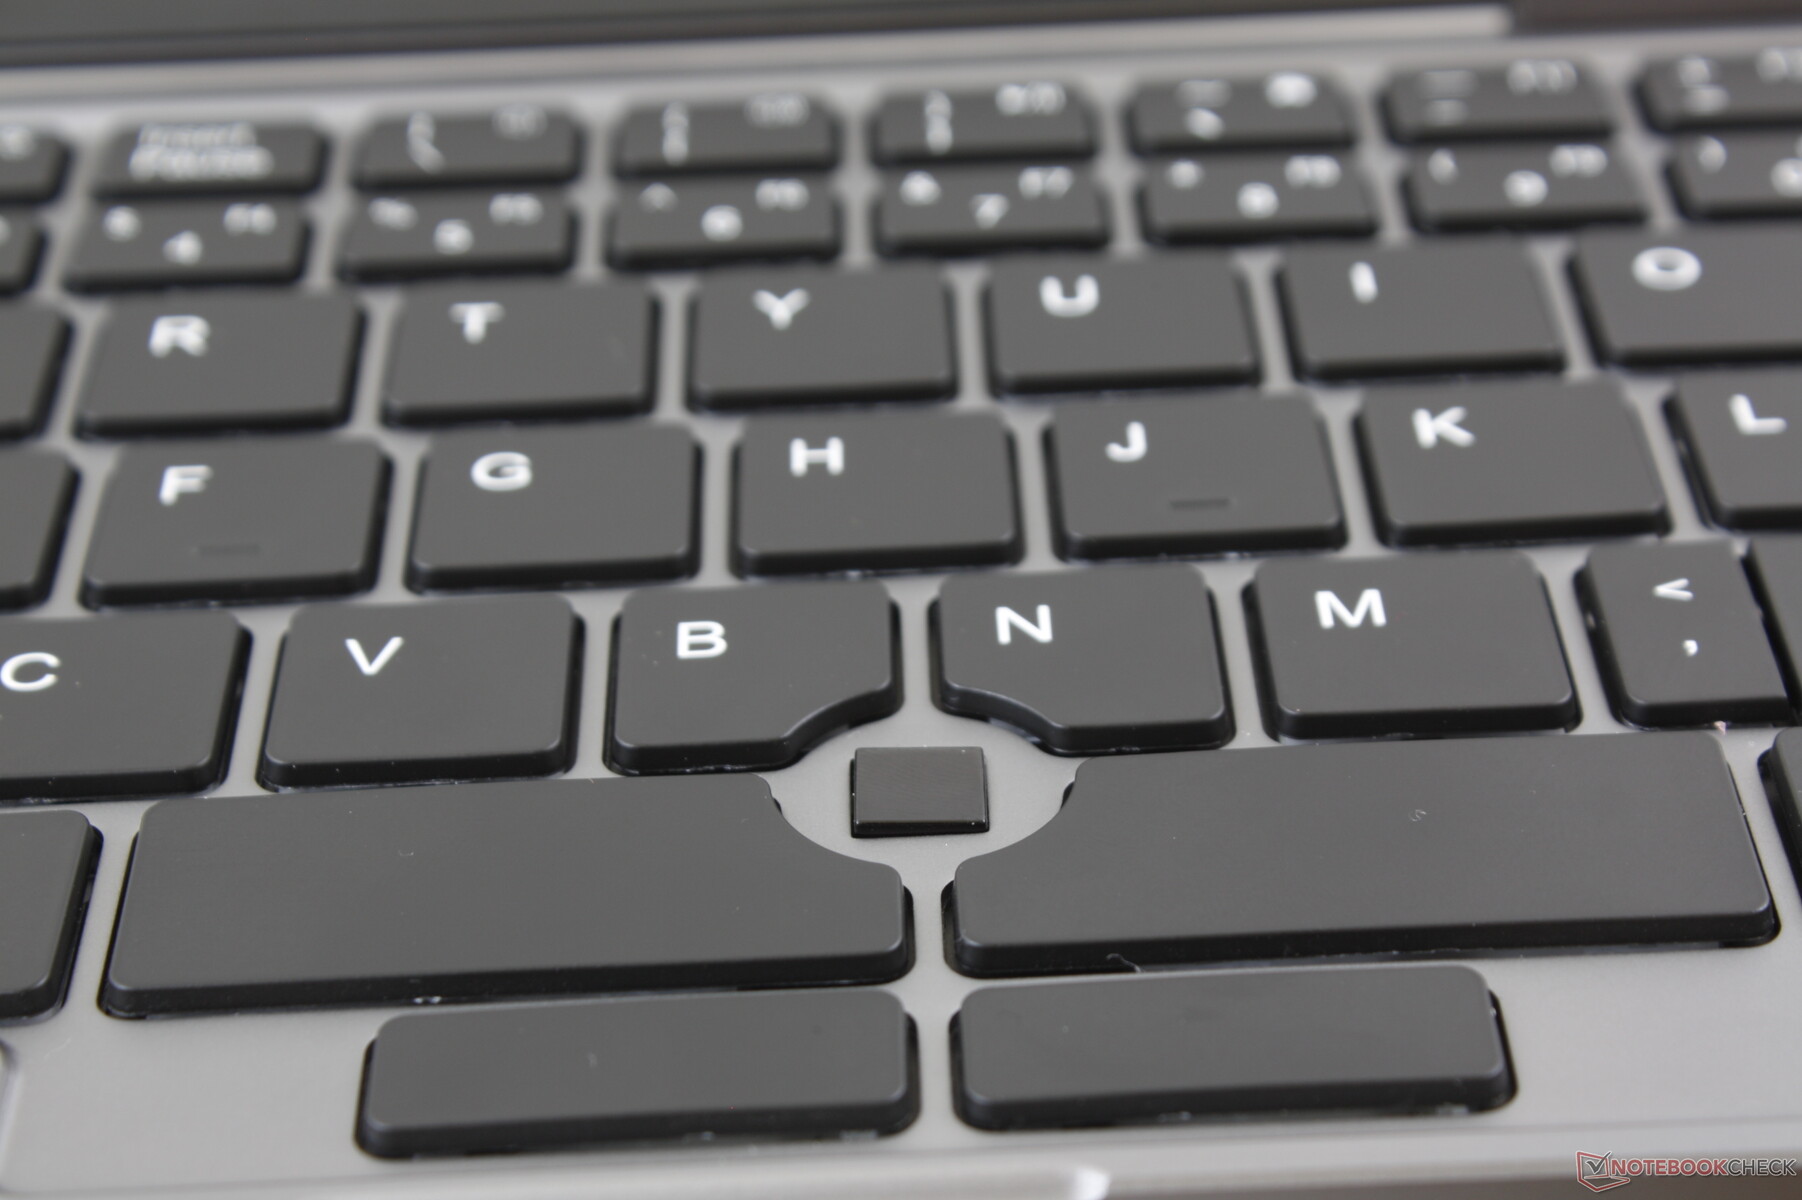
The MiniBook utilizes an OFN mouse much like on the Falcon. Unfortunately, the experience doesn't come close to an actual trackpad or even Lenovo's rubber TrackPoint. Slow precision movements are jittery to make clicking, dragging and dropping more difficult than it should be. We find it easier to simply tap the screen instead on many occasions. We recommend bringing along an external mouse for longer trips.
Display
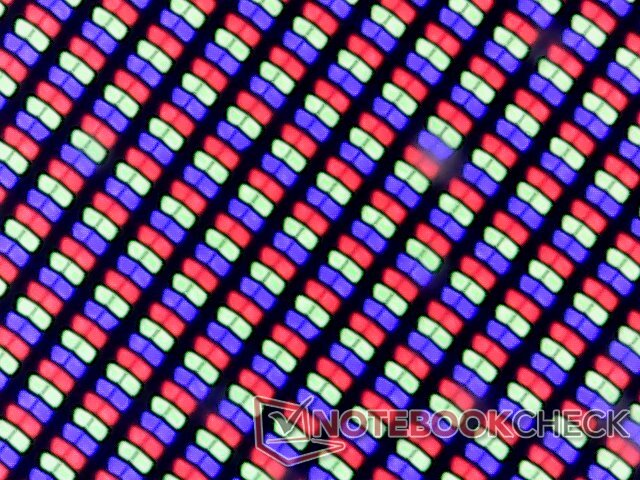
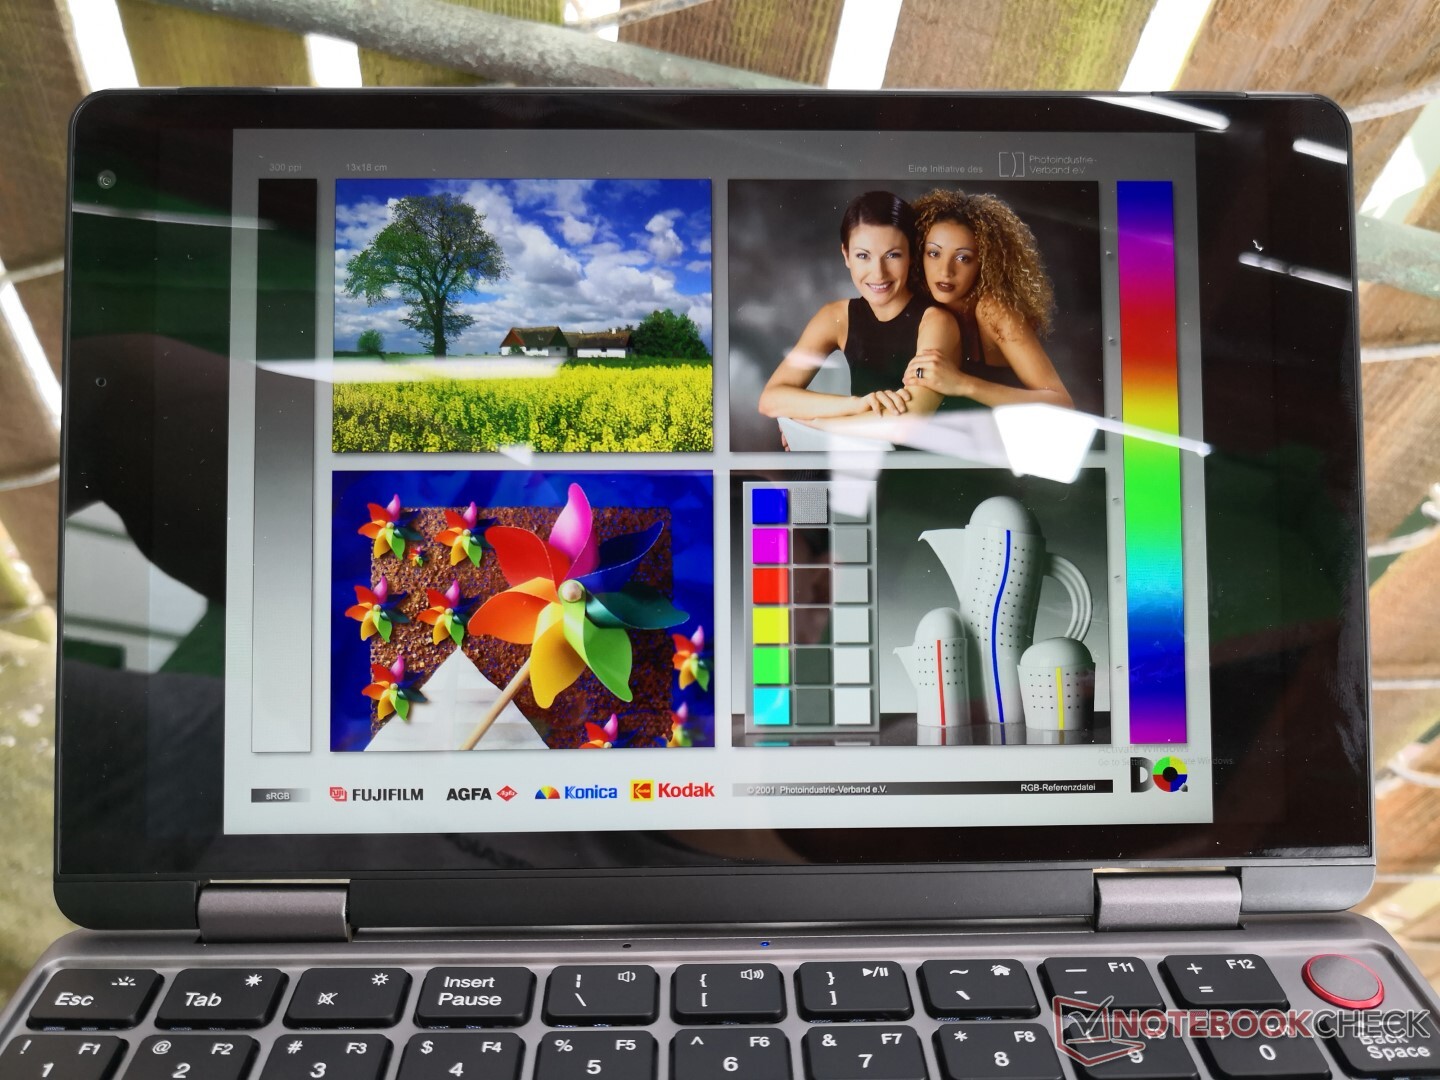
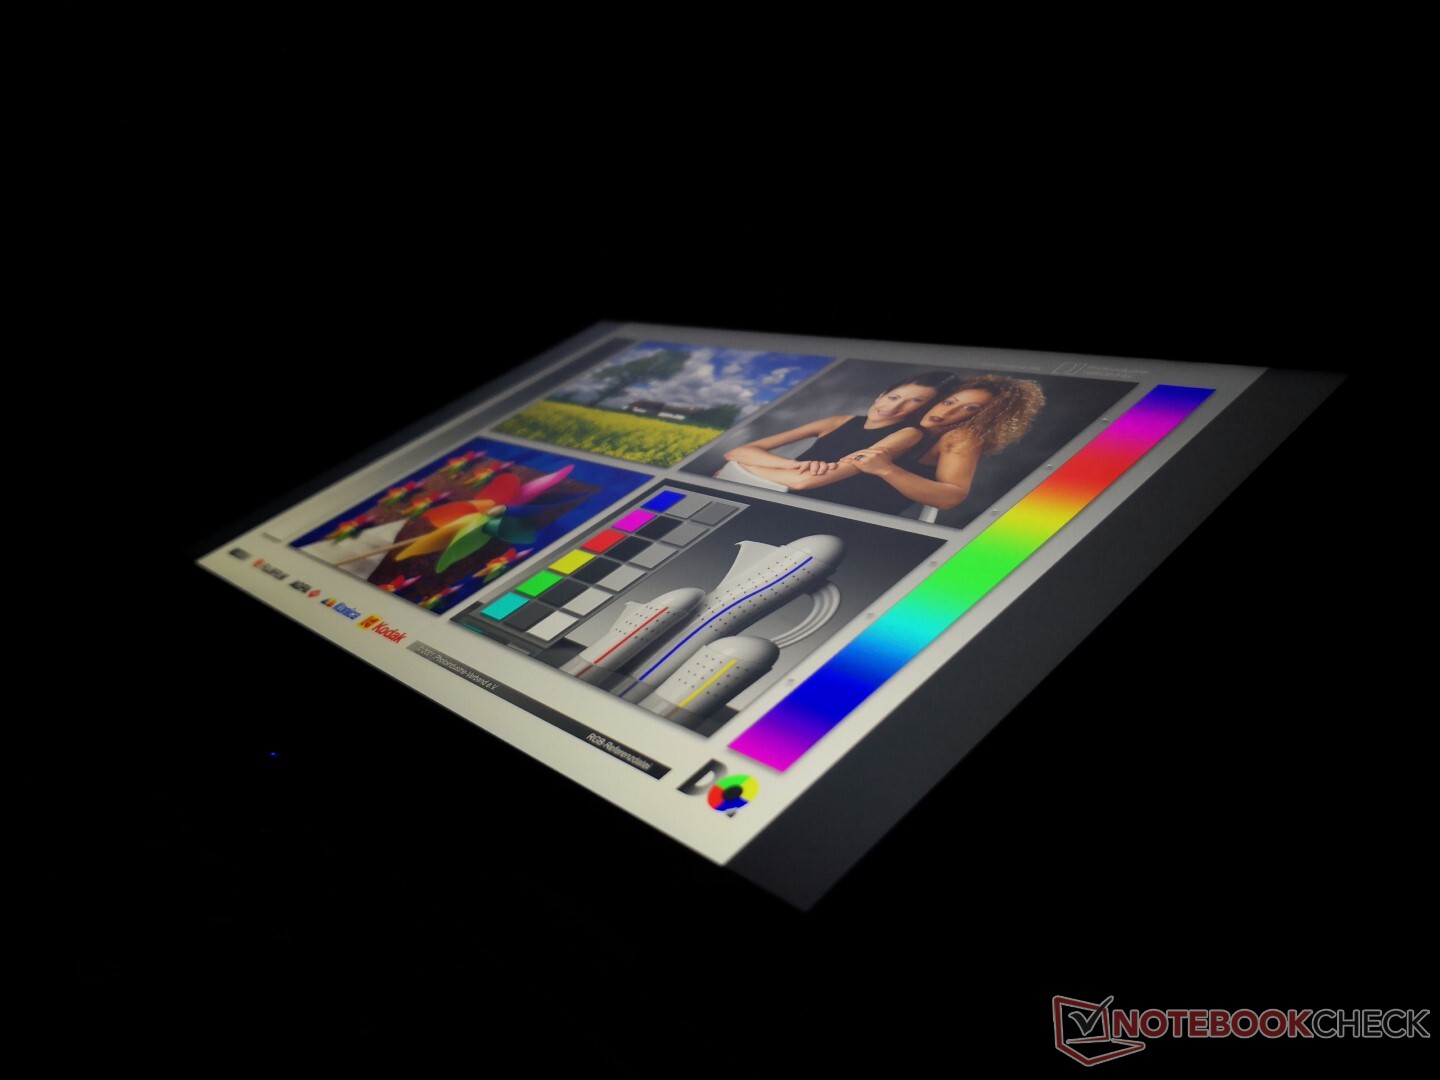
The MiniBook utilizes the same AU Optronics AUO17D8 controller and likely the same panel as on the competing 8-inch Topjoy Falcon. In a surprising twist, however, contrast is measurably higher on the MiniBook and the display is much brighter than the Falcon to be about as bright as the iPad Air 2019. The deep black levels, crisp glossy overlay, dense PPI, and deep colors all contribute to an impressive visual experience relative to the price.
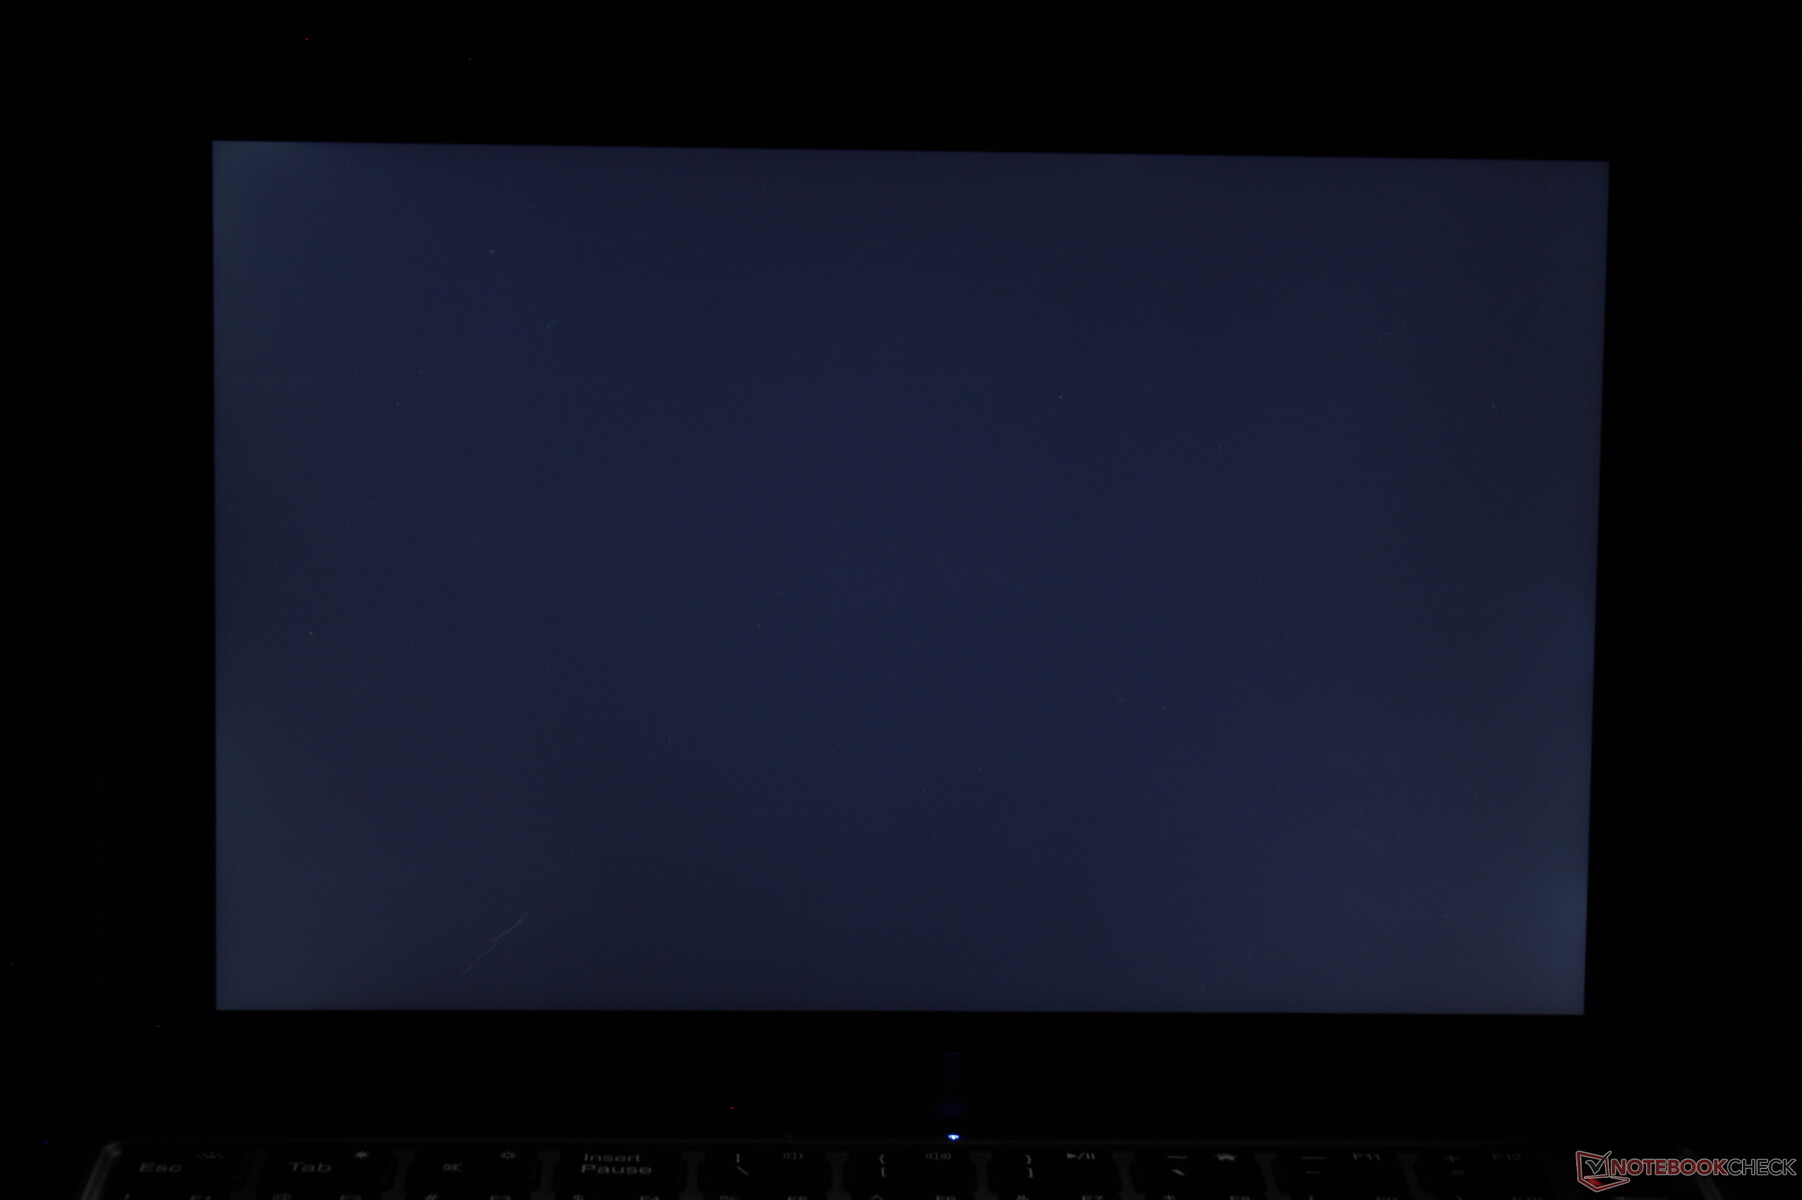
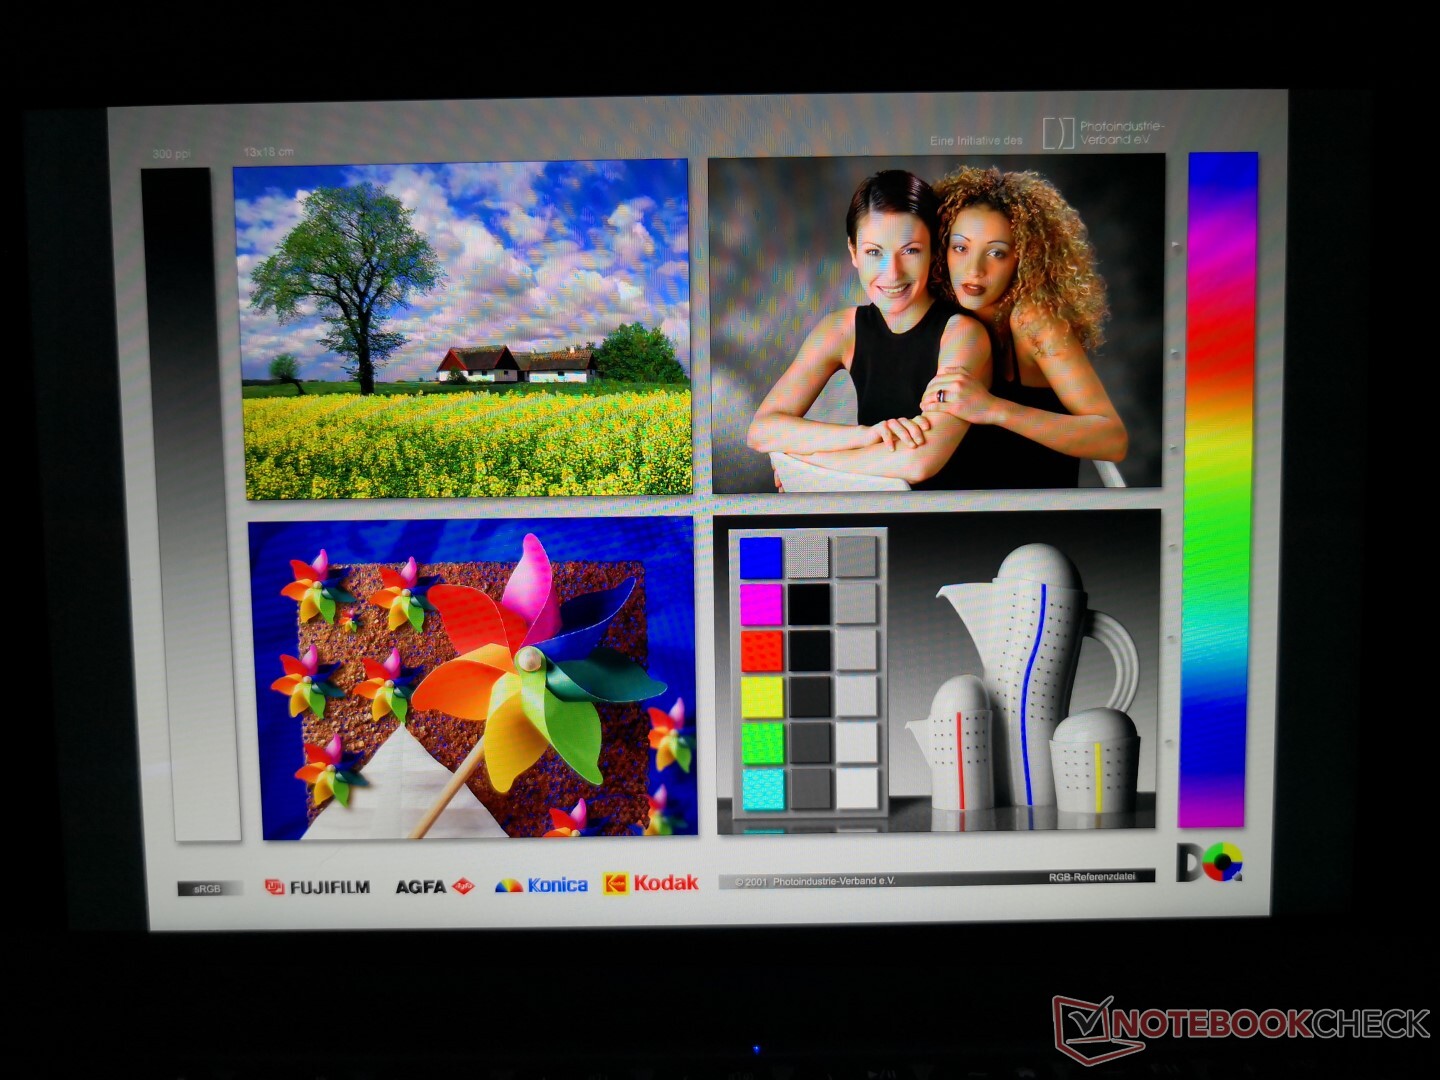
Our specific test unit exhibits slight-moderate uneven backlight bleeding as shown by our image below. It's only noticeable during boot up or video playback with black borders.
| |||||||||||||||||||||||||
Brightness Distribution: 86 %
Center on Battery: 507.7 cd/m²
Contrast: 1238:1 (Black: 0.41 cd/m²)
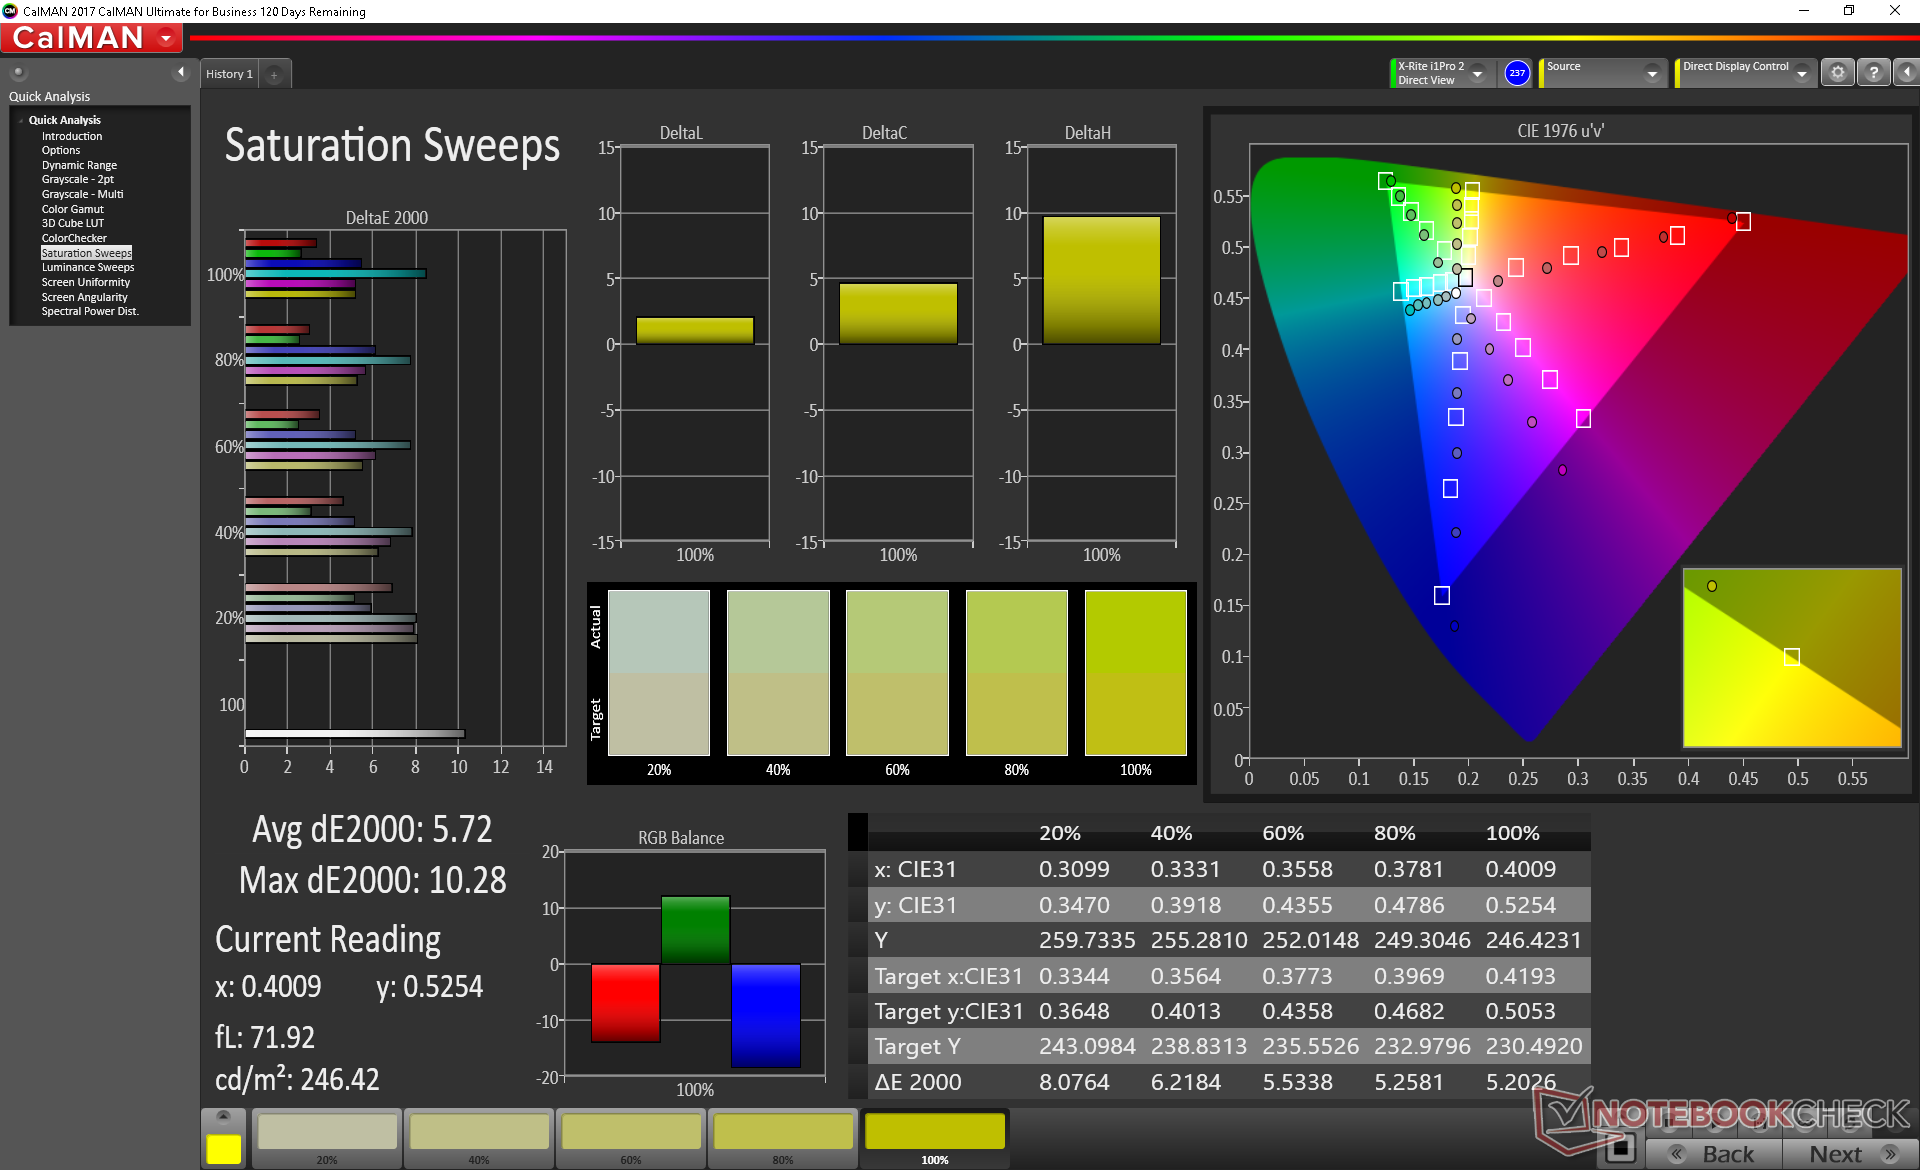
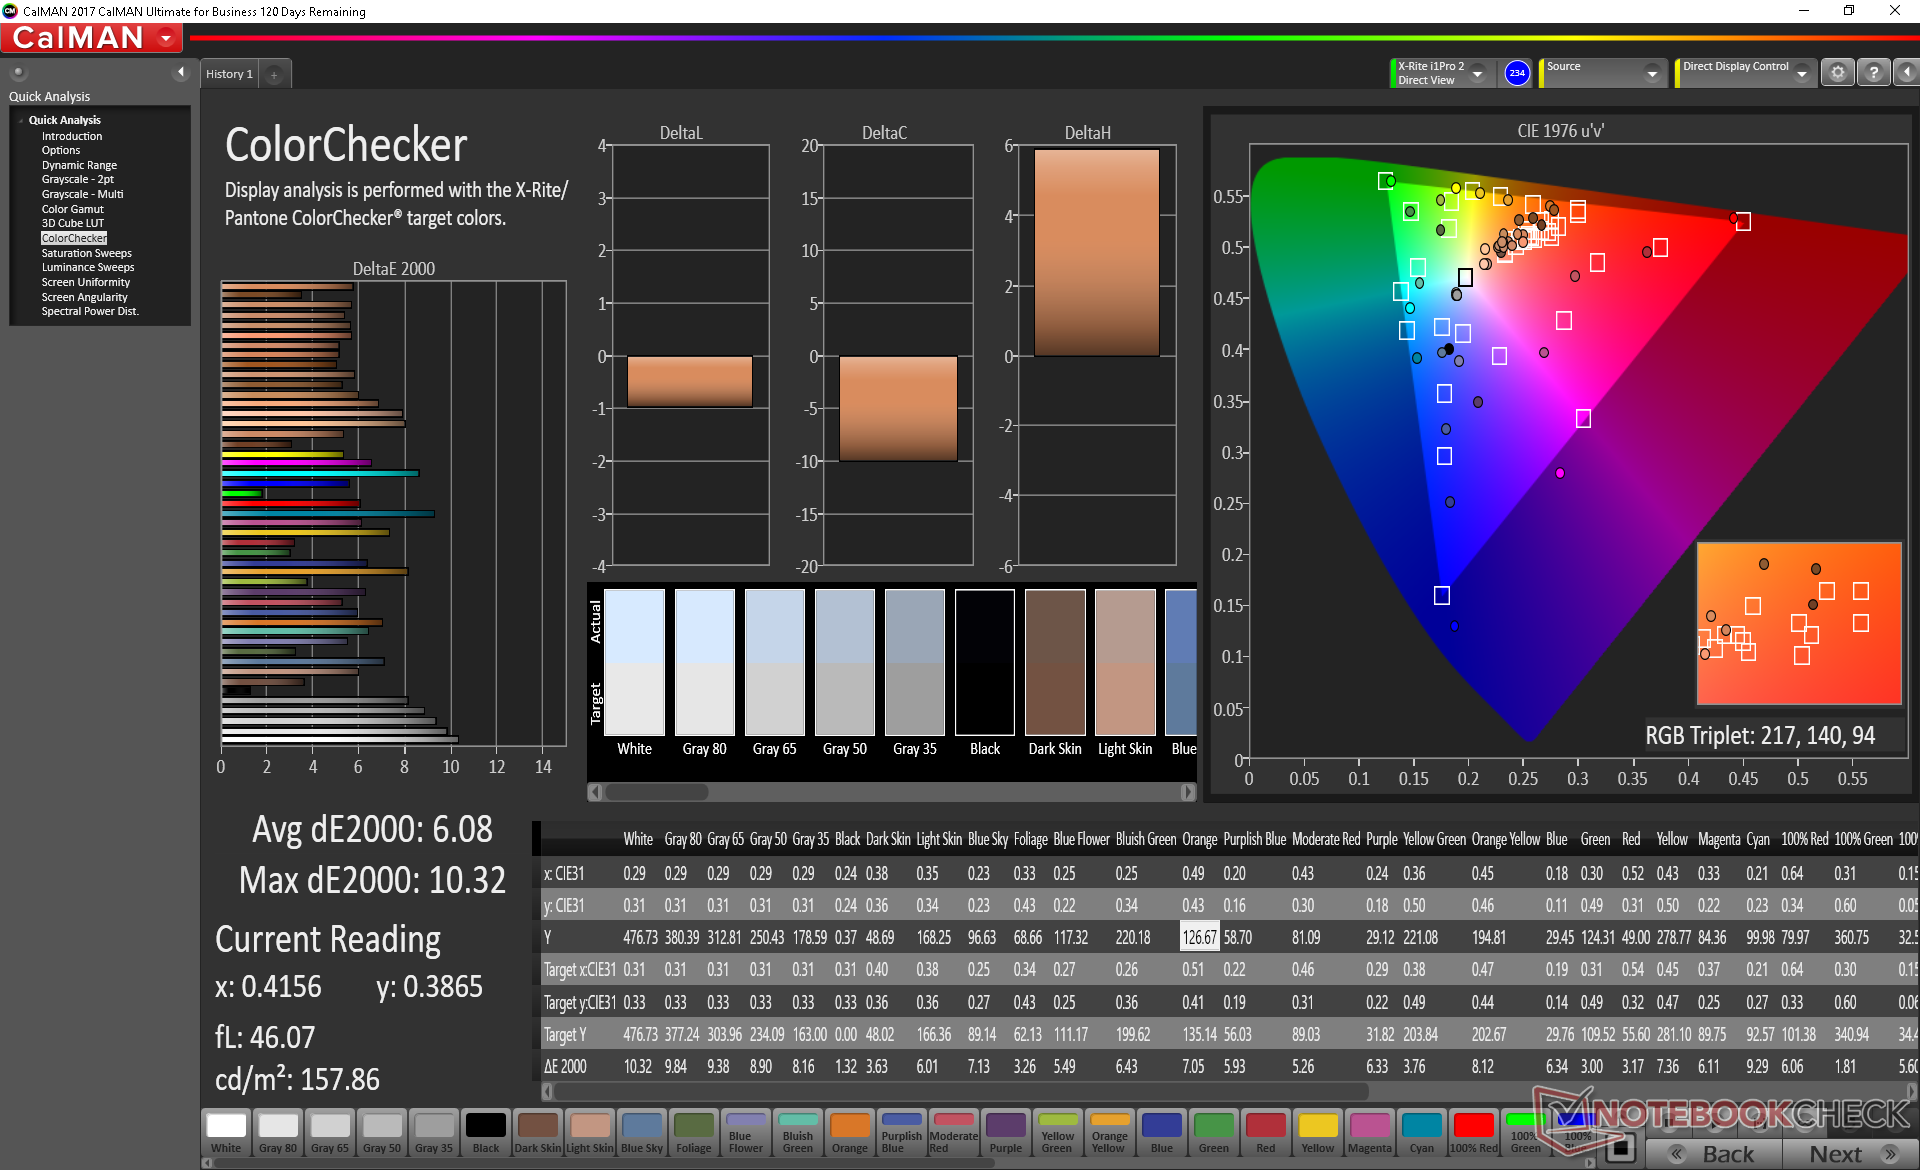
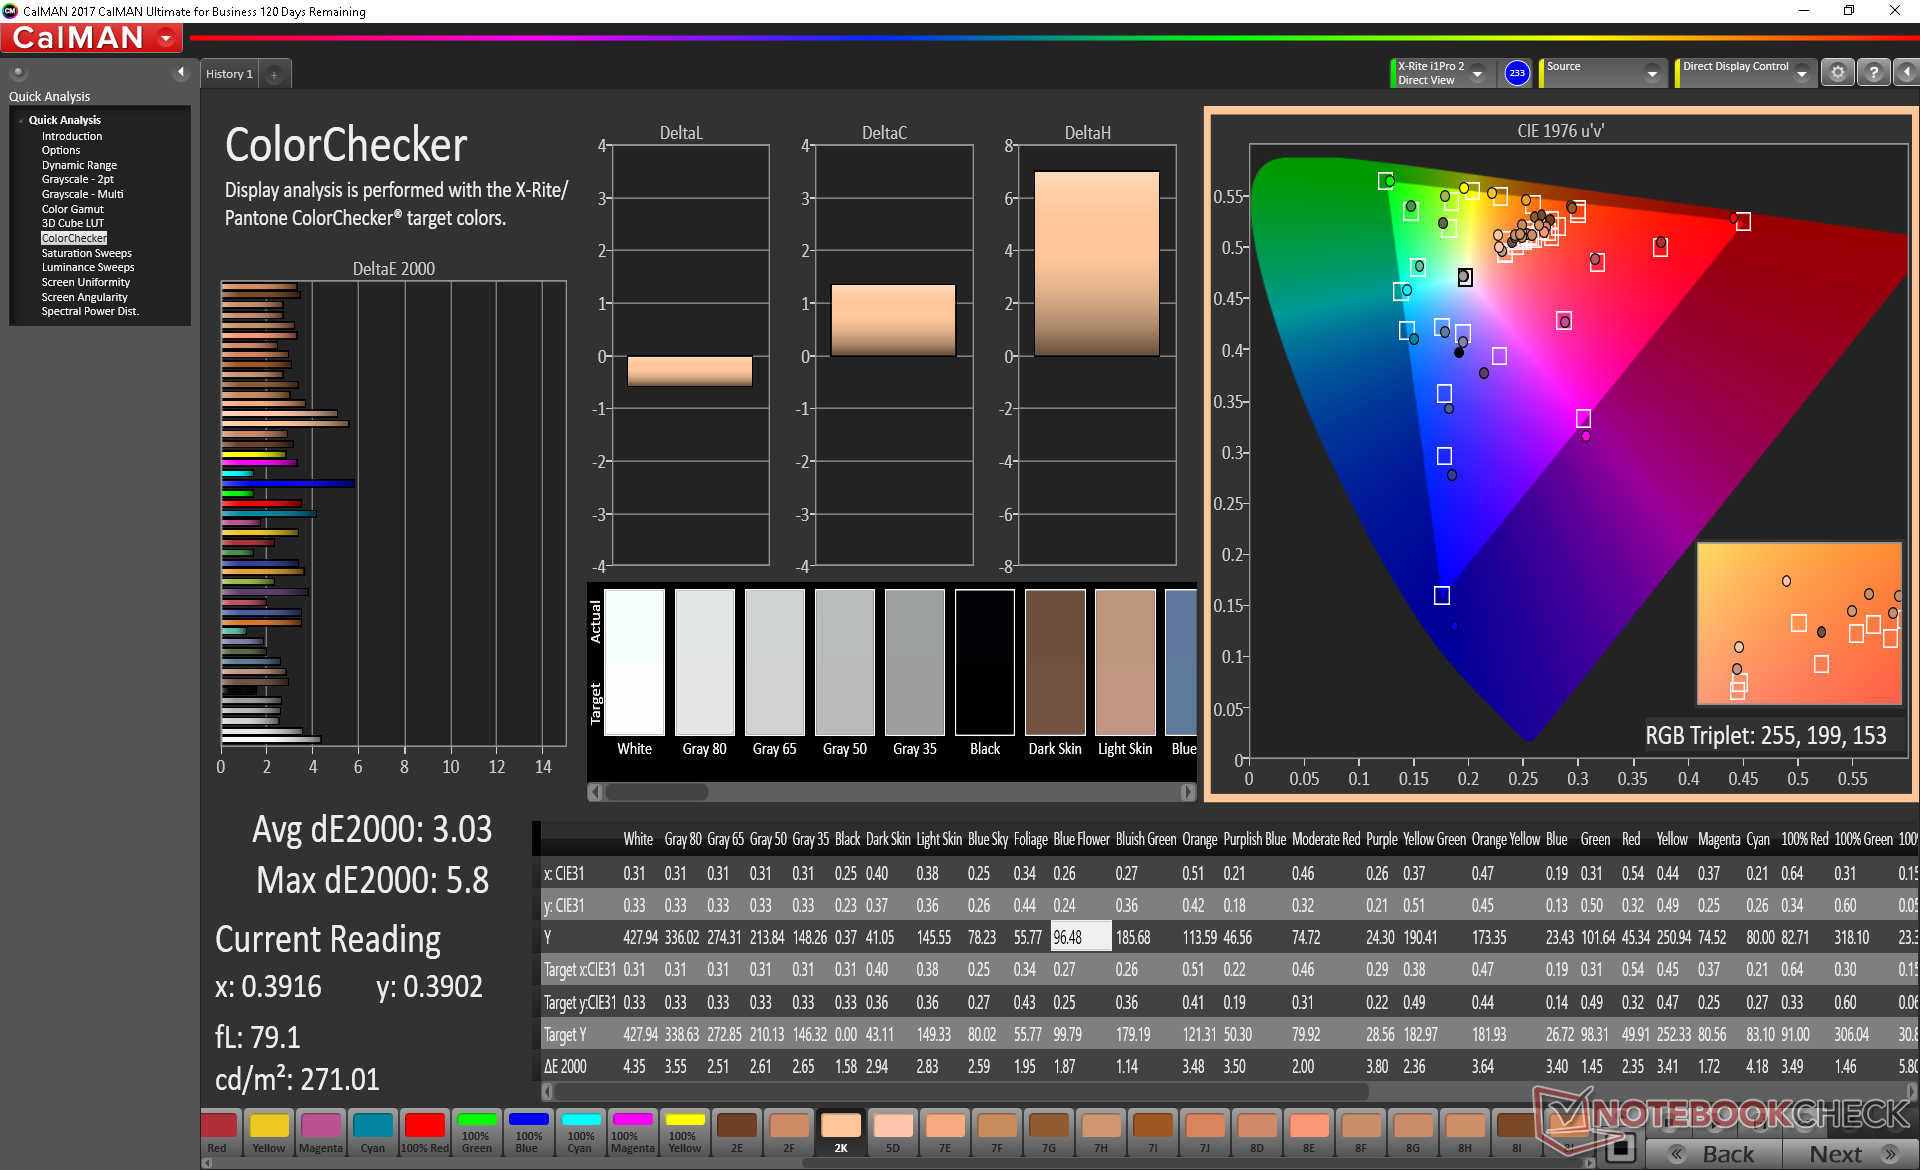
ΔE ColorChecker Calman: 6.08 | ∀{0.5-29.43 Ø4.73}
calibrated: 3.03
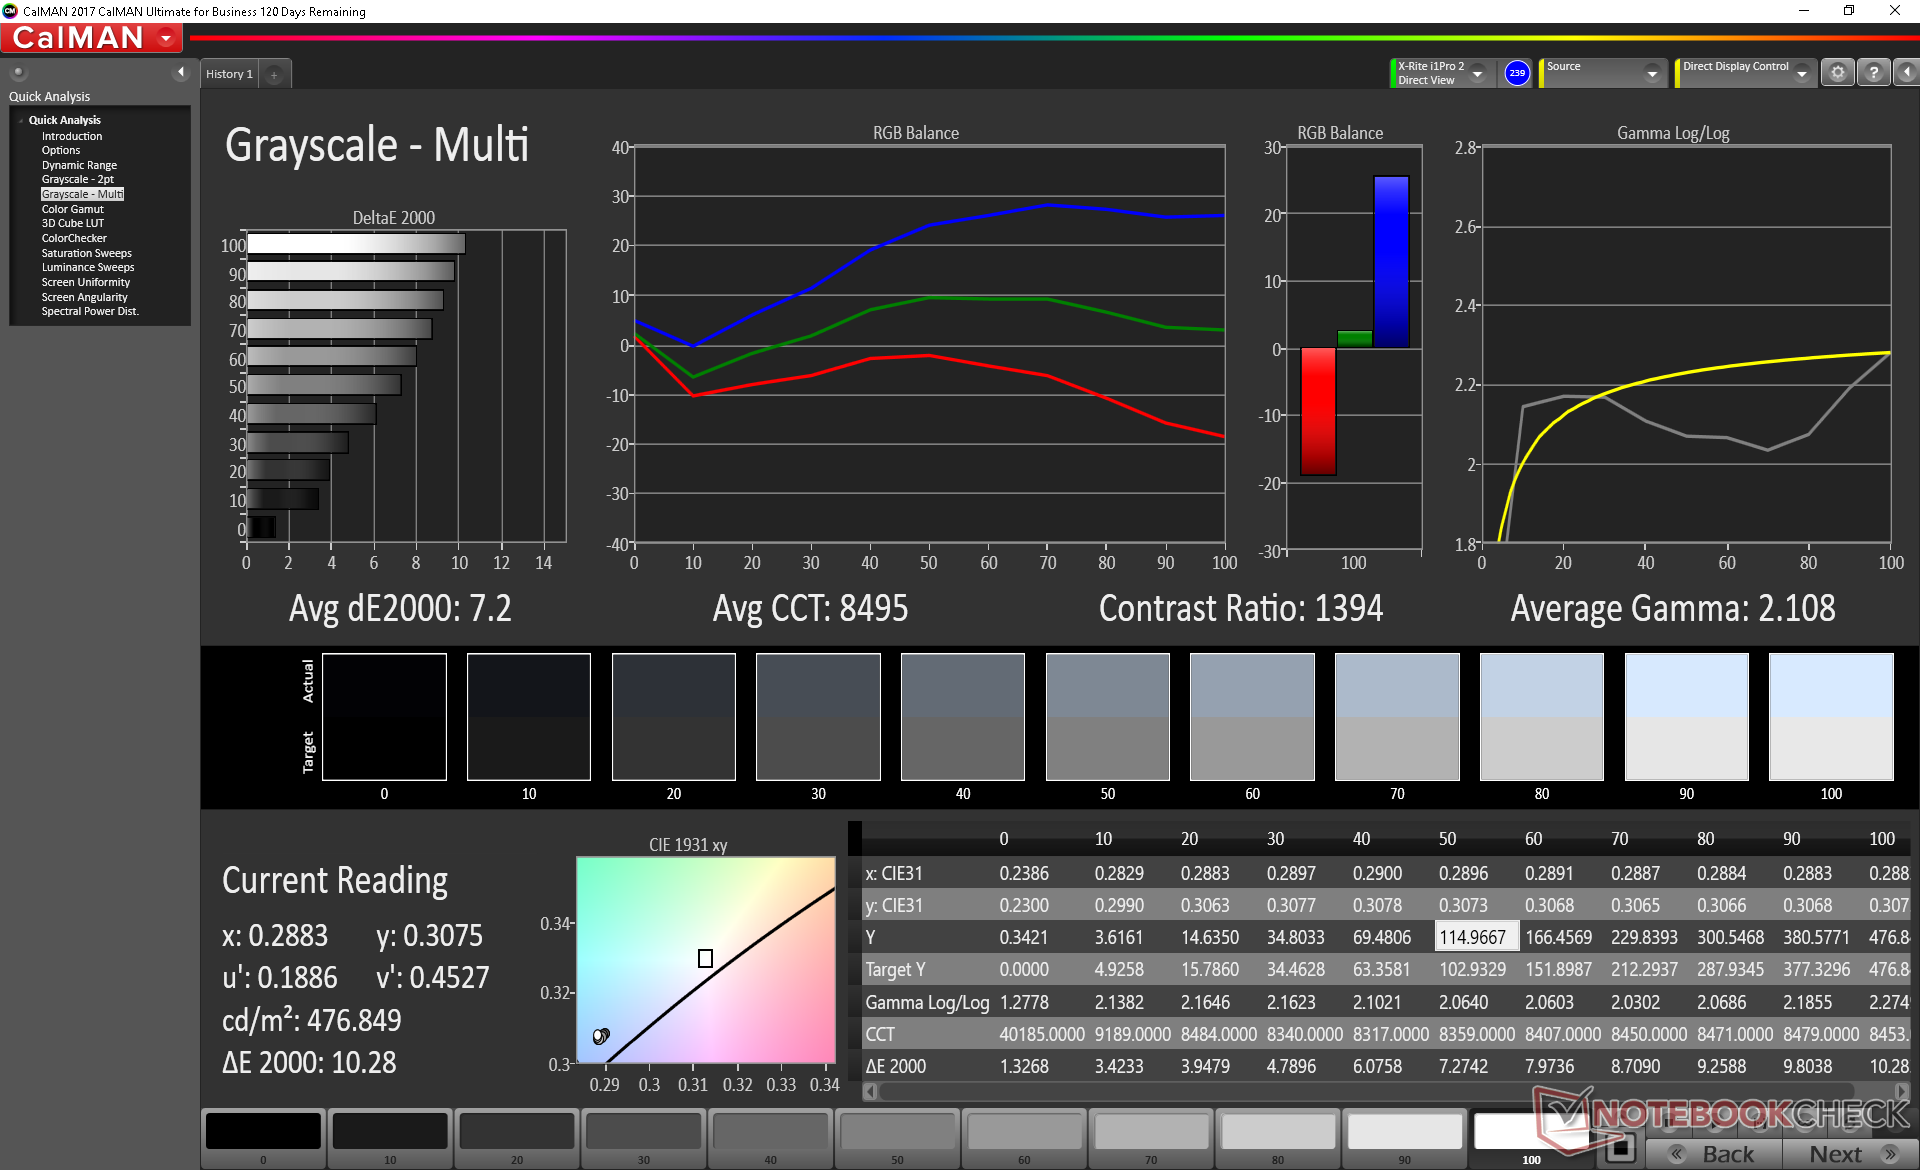
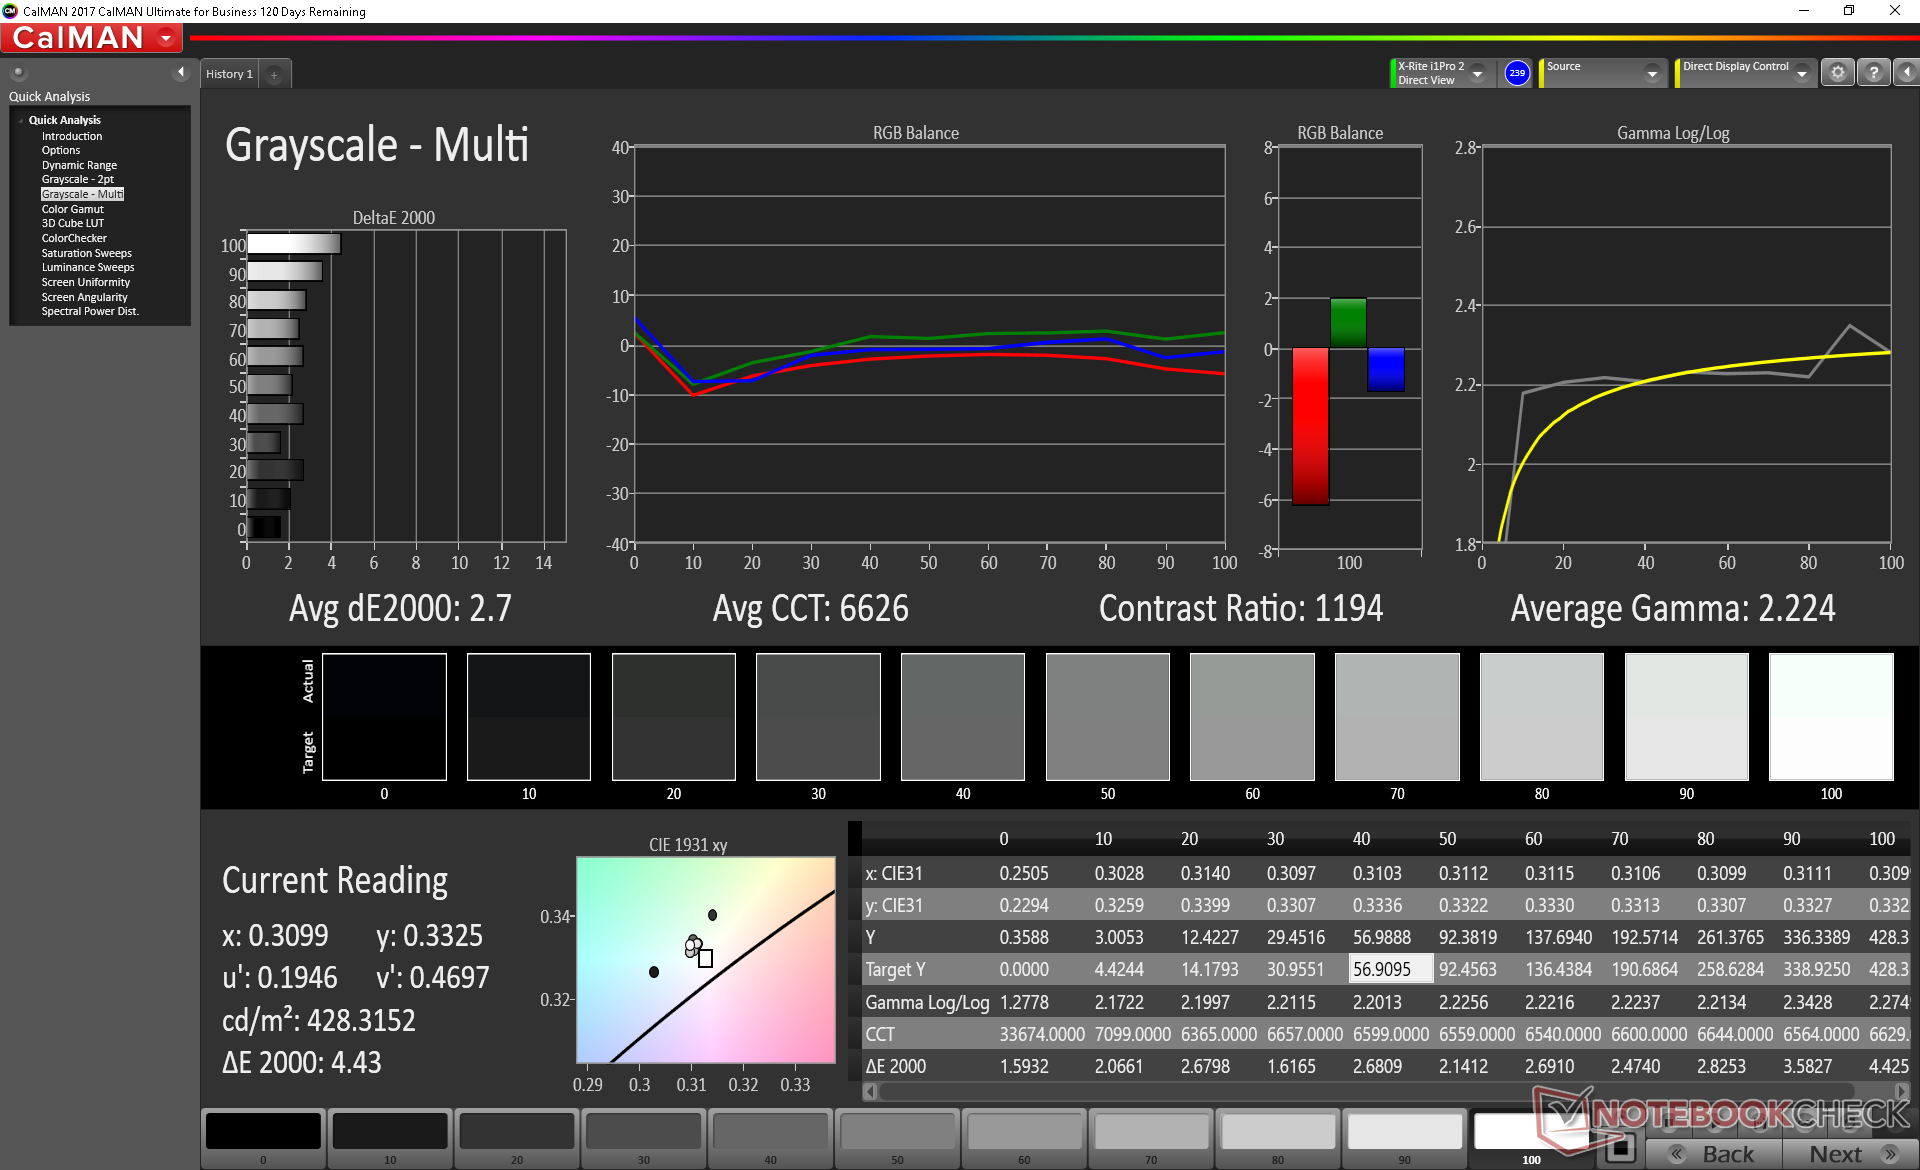
ΔE Greyscale Calman: 7.2 | ∀{0.09-98 Ø4.97}
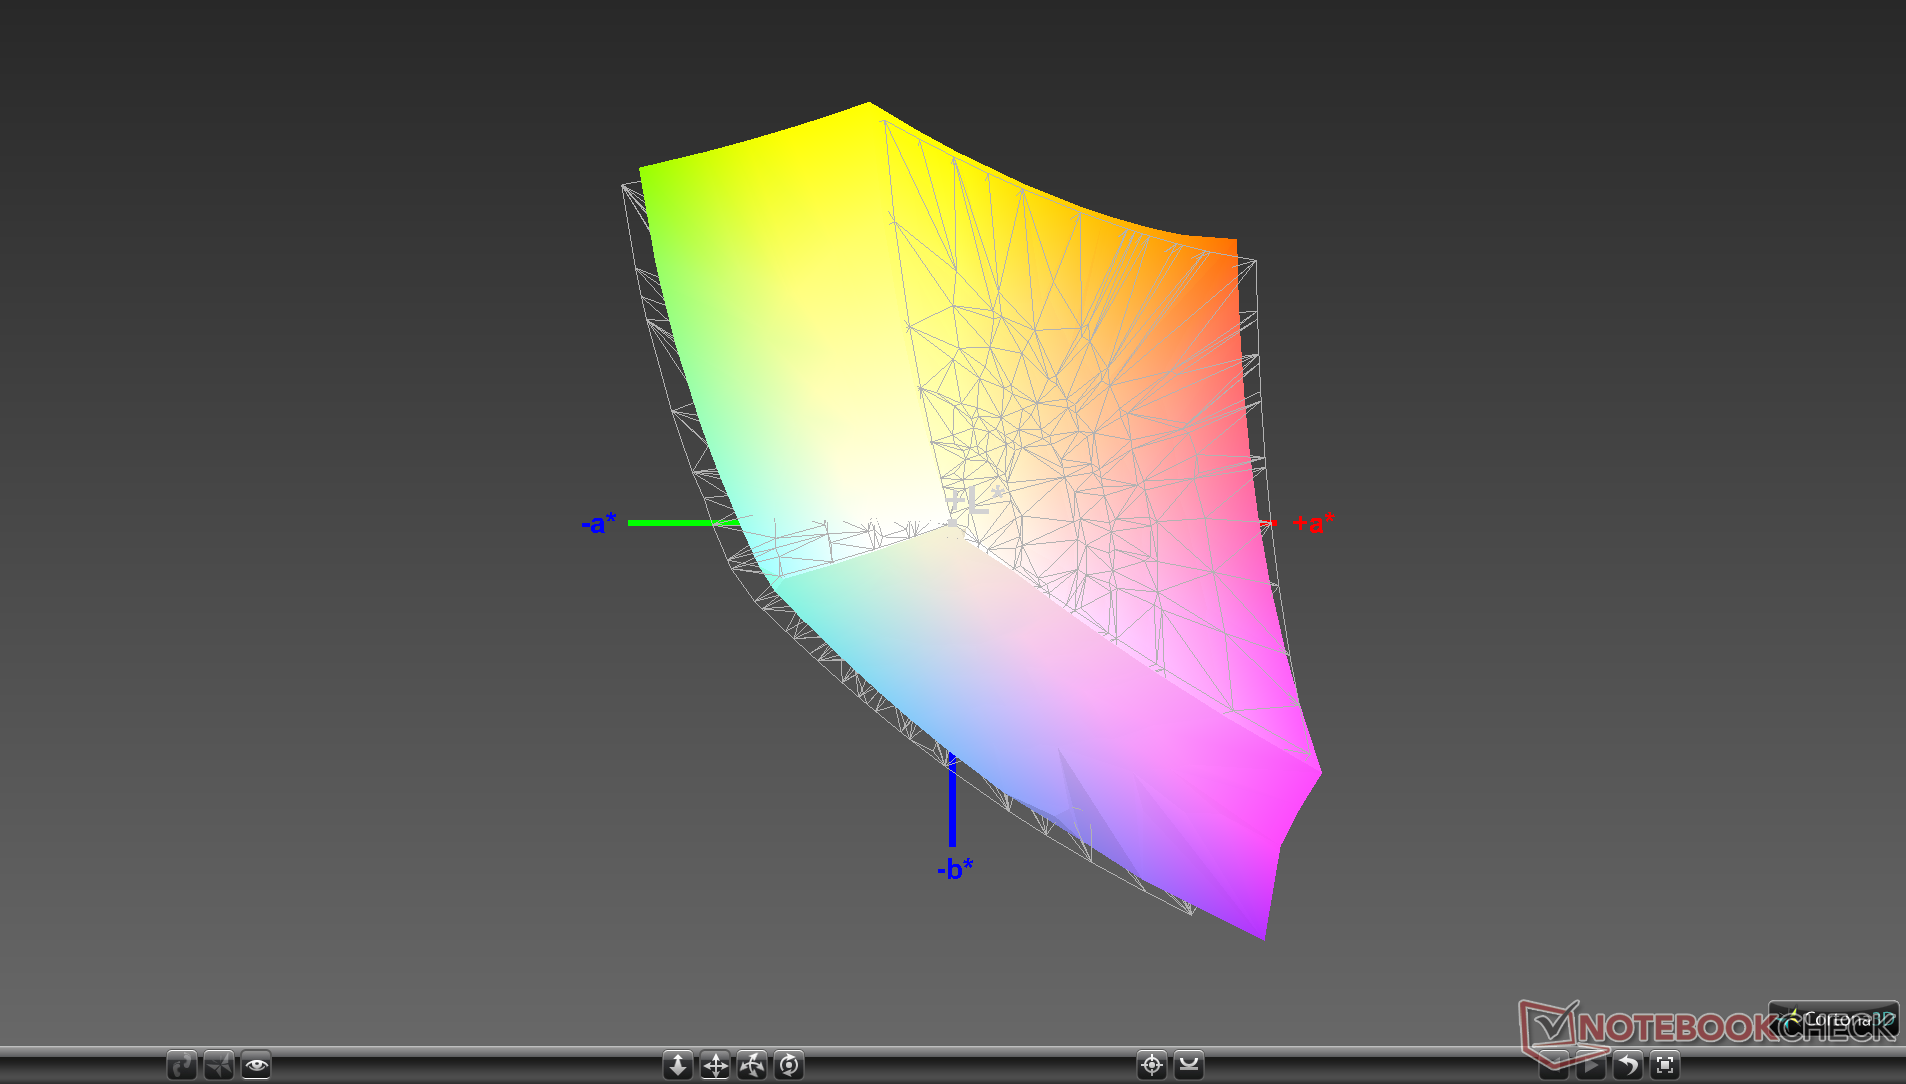
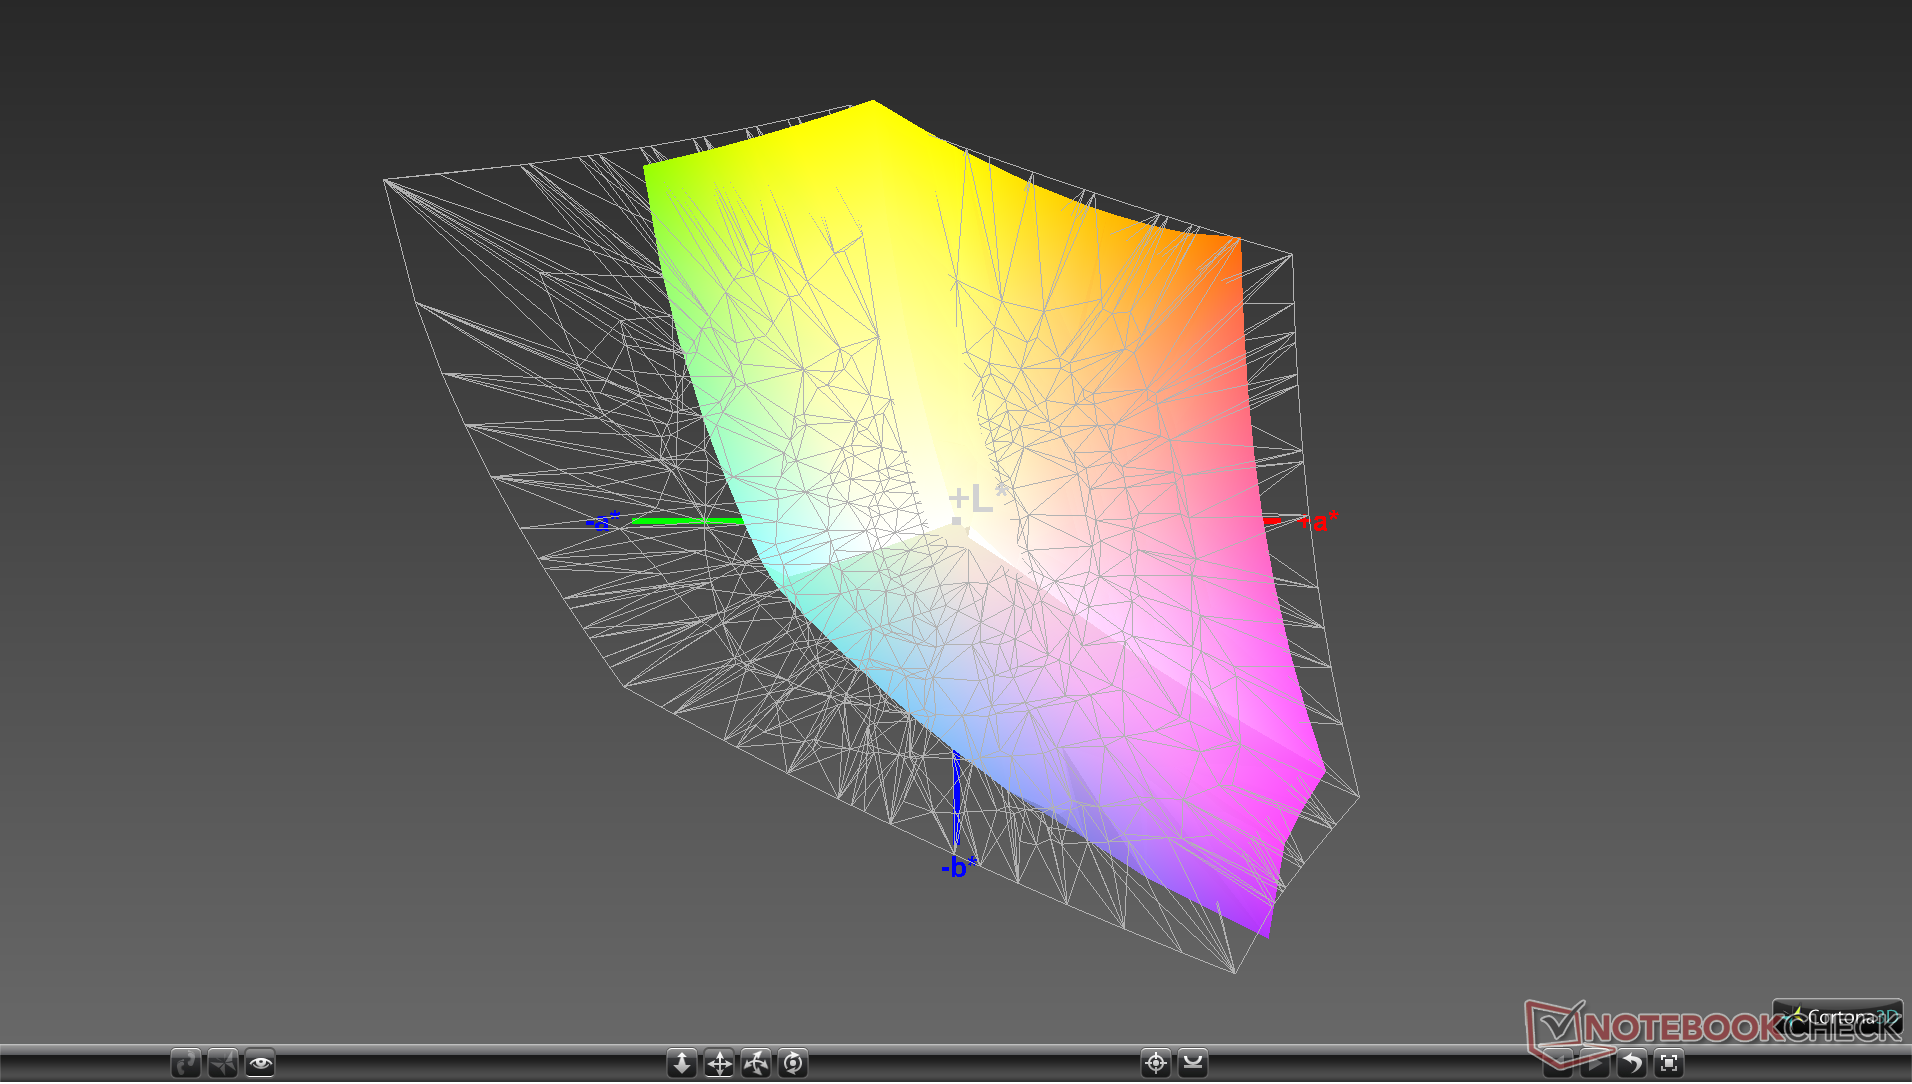
91.5% sRGB (Argyll 1.6.3 3D)
58.9% AdobeRGB 1998 (Argyll 1.6.3 3D)
64.9% AdobeRGB 1998 (Argyll 3D)
92.1% sRGB (Argyll 3D)
64.3% Display P3 (Argyll 3D)
Gamma: 2.11
CCT: 8495 K
| Chuwi MiniBook CWI526 AU Optronics AUO17D8, IPS, 8", 1920x1200 | Topjoy Falcon AUO17D8, IPS, 8", 1920x1200 | Huawei MediaPad M3 8.4 inch IPS, 8.4", 2560x1600 | Apple iPad Air 3 2019 IPS, 10.5", 2224x1668 | Lenovo Yoga Book C930 YB-J912F BOE 0765, IPS, 10.8", 2560x1660 | Microsoft Surface Go MHN-00003 Sharp SHP14A6, IPS, 10", 1800x1200 | |
|---|---|---|---|---|---|---|
| Display | 25% | 4% | ||||
| Display P3 Coverage (%) | 64.3 | 88.5 38% | 66.5 3% | |||
| sRGB Coverage (%) | 92.1 | 99.9 8% | 97.5 6% | |||
| AdobeRGB 1998 Coverage (%) | 64.9 | 83.2 28% | 67.5 4% | |||
| Response Times | -14% | -48% | -32% | -9% | -8% | |
| Response Time Grey 50% / Grey 80% * (ms) | 36 ? | 37 ? -3% | 59 ? -64% | 58 ? -61% | 43 ? -19% | 44 ? -22% |
| Response Time Black / White * (ms) | 27.2 ? | 33.6 ? -24% | 36 ? -32% | 28 ? -3% | 27 ? 1% | 25.6 ? 6% |
| PWM Frequency (Hz) | 200 ? | 1020 ? | ||||
| Screen | 2% | -4% | 25% | 8% | 30% | |
| Brightness middle (cd/m²) | 507.7 | 266 -48% | 460 -9% | 515 1% | 351 -31% | 456 -10% |
| Brightness (cd/m²) | 475 | 269 -43% | 445 -6% | 483 2% | 338 -29% | 426 -10% |
| Brightness Distribution (%) | 86 | 88 2% | 90 5% | 90 5% | 87 1% | 88 2% |
| Black Level * (cd/m²) | 0.41 | 0.34 17% | 0.45 -10% | 0.41 -0% | 0.23 44% | 0.31 24% |
| Contrast (:1) | 1238 | 782 -37% | 1022 -17% | 1256 1% | 1526 23% | 1471 19% |
| Colorchecker dE 2000 * | 6.08 | 3.6 41% | 6.2 -2% | 1.6 74% | 4.59 25% | 1.3 79% |
| Colorchecker dE 2000 max. * | 10.32 | 8.2 21% | 10.5 -2% | 4.4 57% | 9.81 5% | 3 71% |
| Colorchecker dE 2000 calibrated * | 3.03 | 2.7 11% | 3.26 -8% | 1.1 64% | ||
| Greyscale dE 2000 * | 7.2 | 3.6 50% | 6.5 10% | 2.8 61% | 5.2 28% | 1.4 81% |
| Gamma | 2.11 104% | 2.19 100% | 2.33 94% | 2.21 100% | 2.41 91% | 2.24 98% |
| CCT | 8495 77% | 6442 101% | 8056 81% | 6944 94% | 7712 84% | 6687 97% |
| Color Space (Percent of AdobeRGB 1998) (%) | 58.9 | 74 26% | 62.3 6% | |||
| Color Space (Percent of sRGB) (%) | 91.5 | 100 9% | 96.8 6% | |||
| Total Average (Program / Settings) | -6% /
-1% | -26% /
-13% | -4% /
14% | 8% /
9% | 9% /
21% |
* ... smaller is better
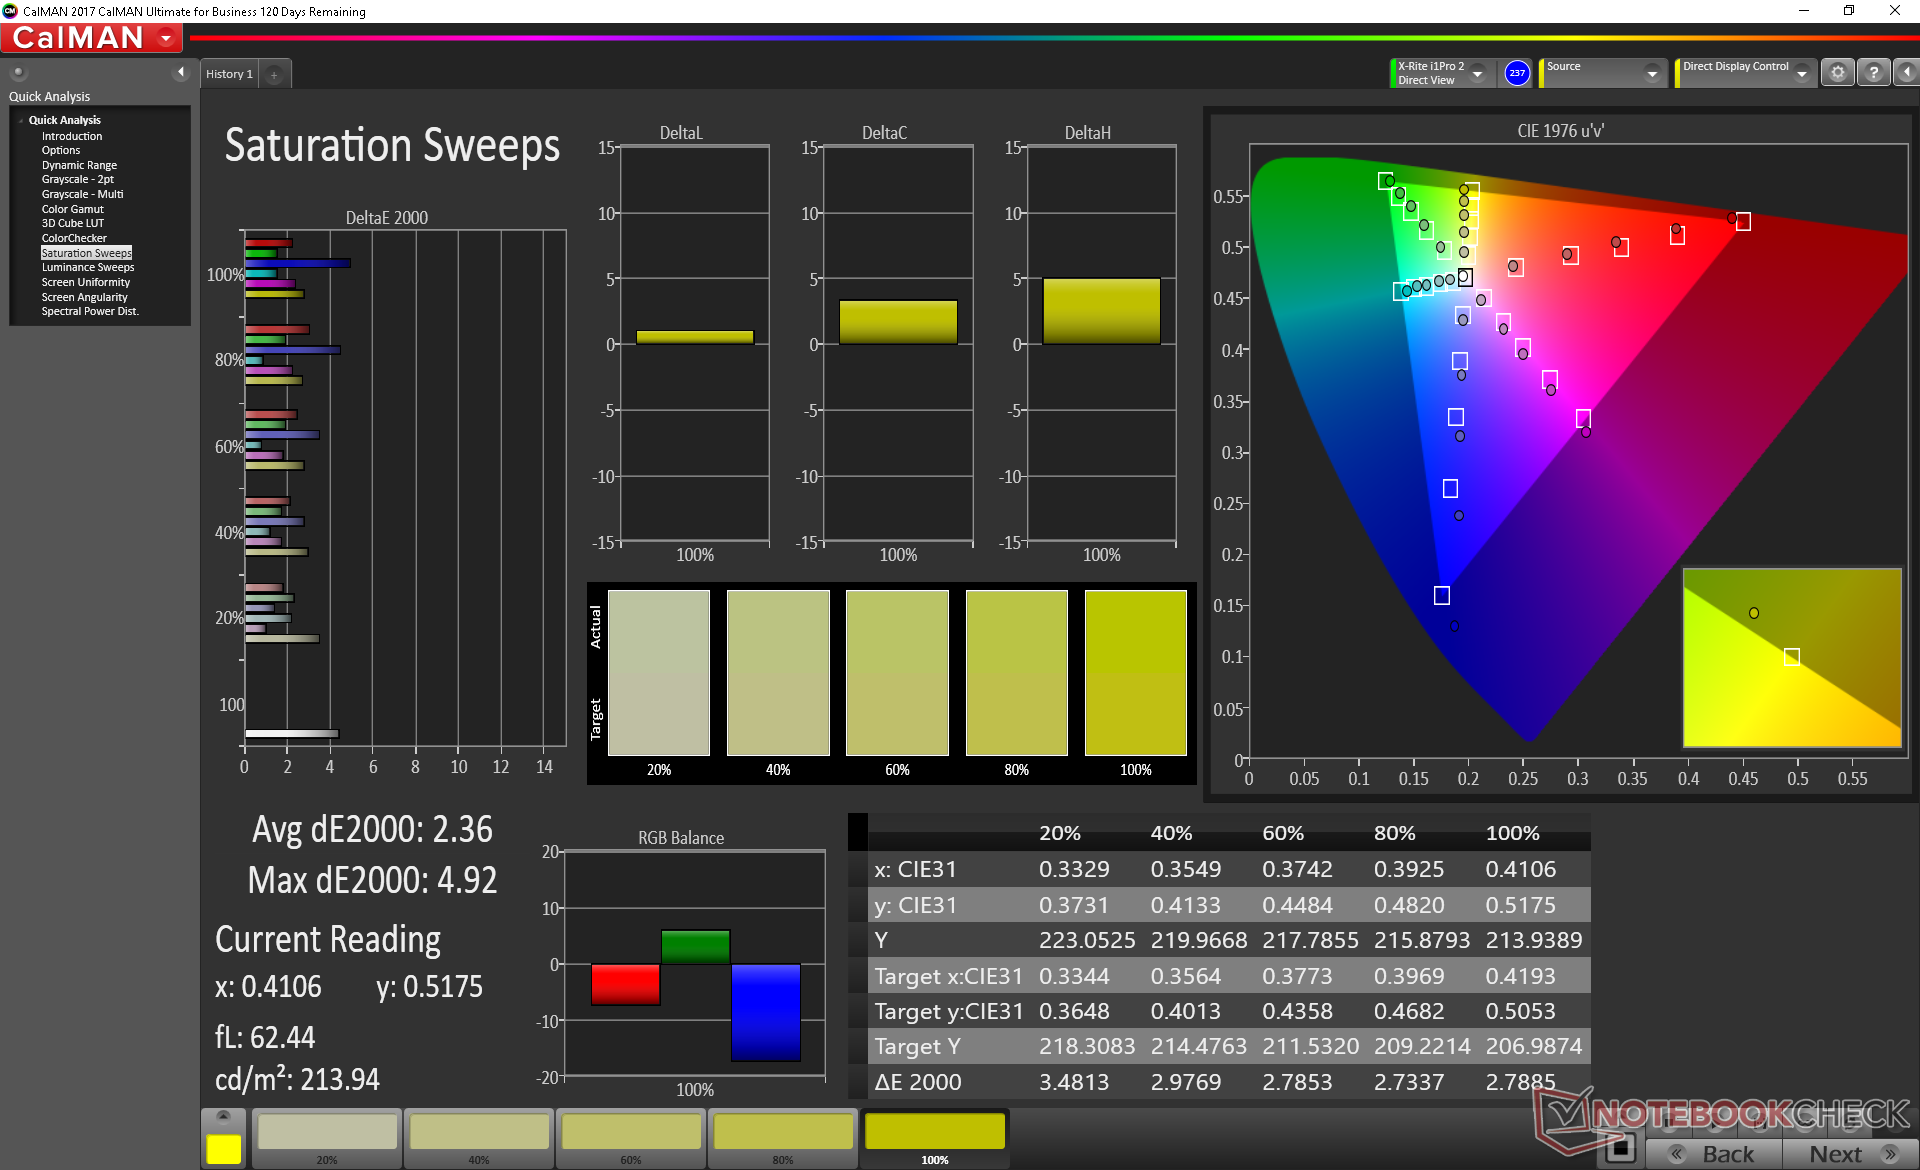
Color space is wide for its price range at about 90 percent of sRGB to be greater than most budget IPS panels where 60 percent sRGB is common. In other words, colors can be almost as deep and as accurate as flagship Ultrabooks costing over twice as much.
Further display measurements with an X-Rite colorimeter reveal very inaccurate grayscale and colors out of the box. Color temperature in particular is far too cool for a bluish tint. Fortunately, the wide gamut mentioned above means that the panel is capable of reproducing accurate grayscale and colors after calibration. Grayscale improves significantly from an average DeltaE value of 7.2 to 2.7. We recommend an end-user calibration to get the most out of the display. If not possible, then users can still download and apply our calibrated ICM profile above.
Display Response Times
| ↔ Response Time Black to White | ||
|---|---|---|
| 27.2 ms ... rise ↗ and fall ↘ combined | ↗ 18.8 ms rise | 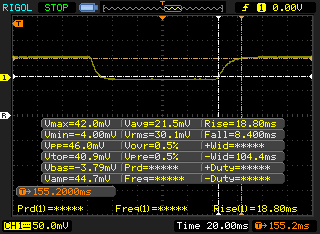 |
| ↘ 8.4 ms fall | ||
| The screen shows relatively slow response rates in our tests and may be too slow for gamers. In comparison, all tested devices range from 0.1 (minimum) to 240 (maximum) ms. » 69 % of all devices are better. This means that the measured response time is worse than the average of all tested devices (19.9 ms). | ||
| ↔ Response Time 50% Grey to 80% Grey | ||
| 36 ms ... rise ↗ and fall ↘ combined | ↗ 18.8 ms rise |  |
| ↘ 17.2 ms fall | ||
| The screen shows slow response rates in our tests and will be unsatisfactory for gamers. In comparison, all tested devices range from 0.165 (minimum) to 636 (maximum) ms. » 50 % of all devices are better. This means that the measured response time is worse than the average of all tested devices (31.1 ms). | ||
Screen Flickering / PWM (Pulse-Width Modulation)
| Screen flickering / PWM not detected | 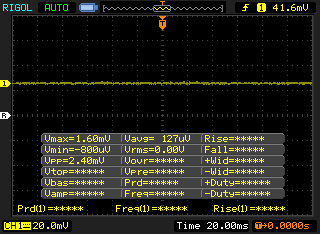 | ||
In comparison: 52 % of all tested devices do not use PWM to dim the display. If PWM was detected, an average of 7794 (minimum: 5 - maximum: 343500) Hz was measured. | |||
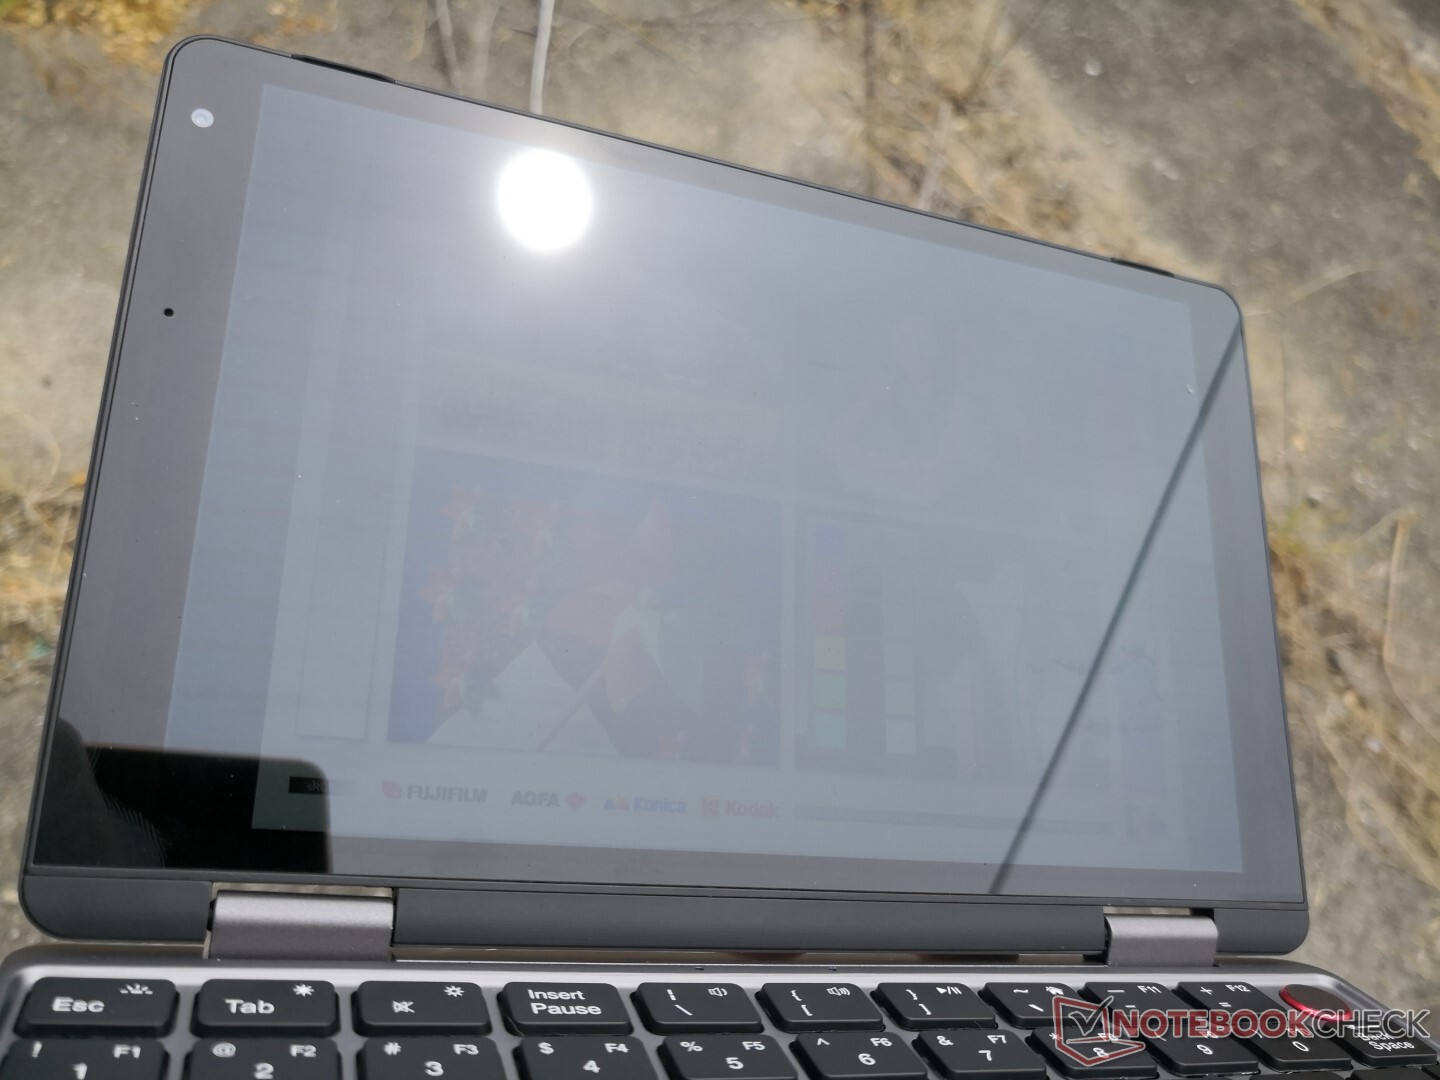
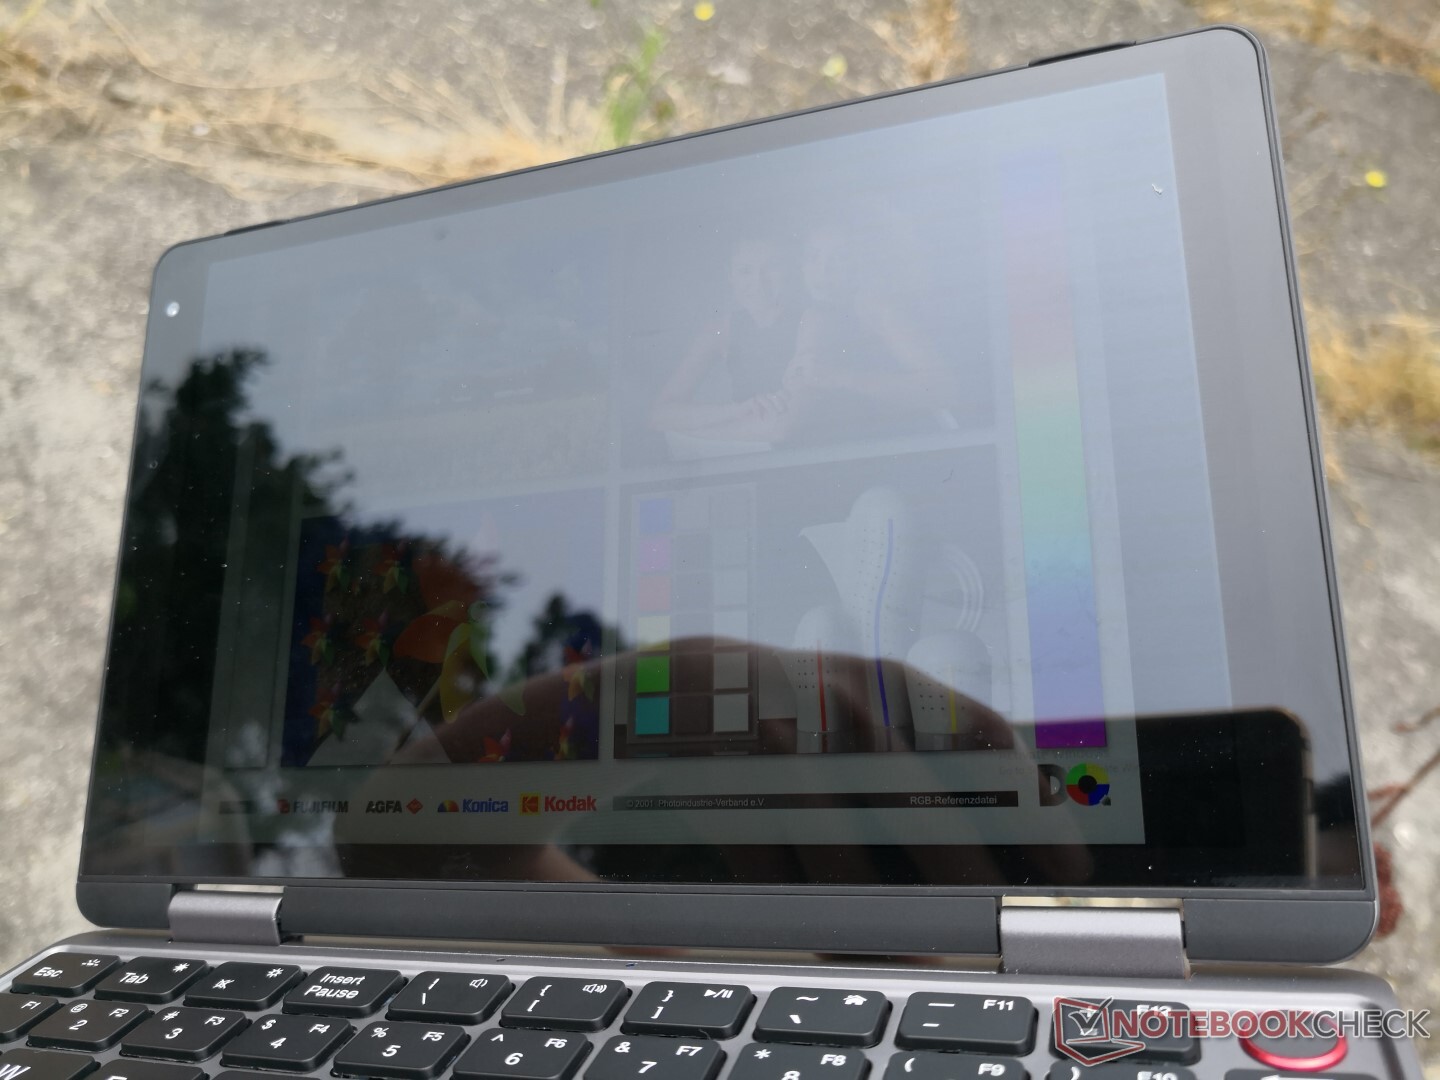
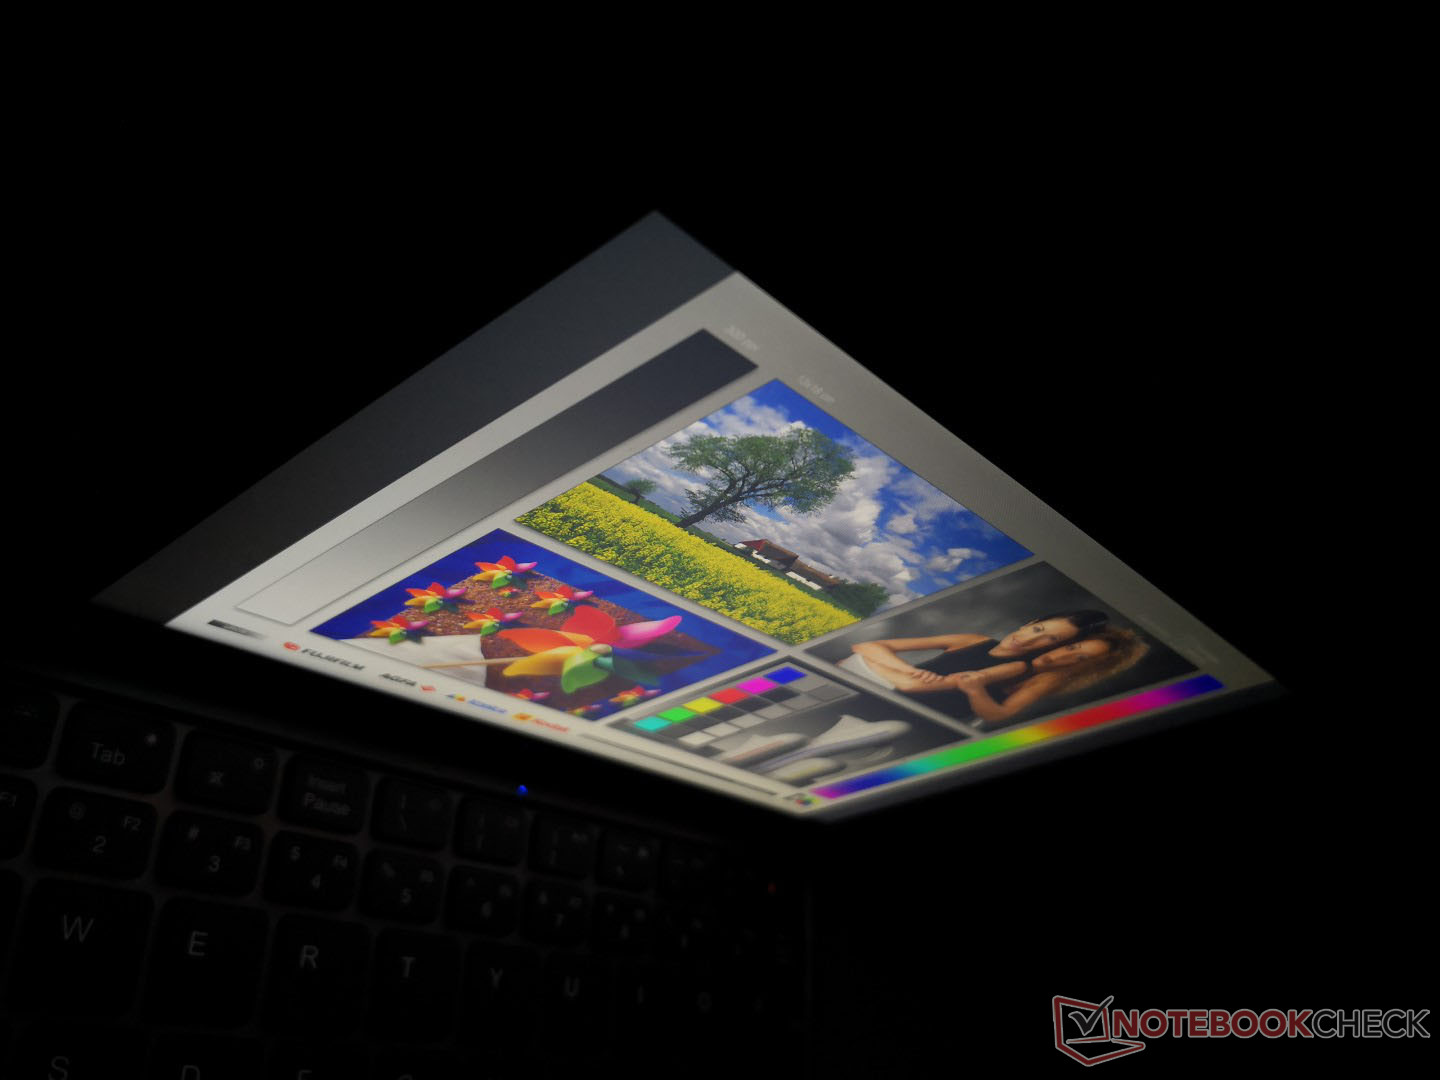
Outdoor visibility is good when under shade and only average when on a cloudy overcast day. The bright glossy display may be brighter than most Ultrabooks, but it's still not enough to overcome direct sunlight. We recommend a higher text scaling since the default PPI is dense and difficult to read. Viewing angles are wide with only slight changes to contrast and colors if viewing from extreme and unrealistic angles.
Performance
While an uncommon CPU, the Celeron N4100 can be found on a handful of inexpensive HTPCs or very low-power netbooks including the Lenovo IdeaPad 330 and Chuwi's own LapBook SE. The 6 W CPU is designed to be slightly above the Atom series but still well below even the most basic Core i3.
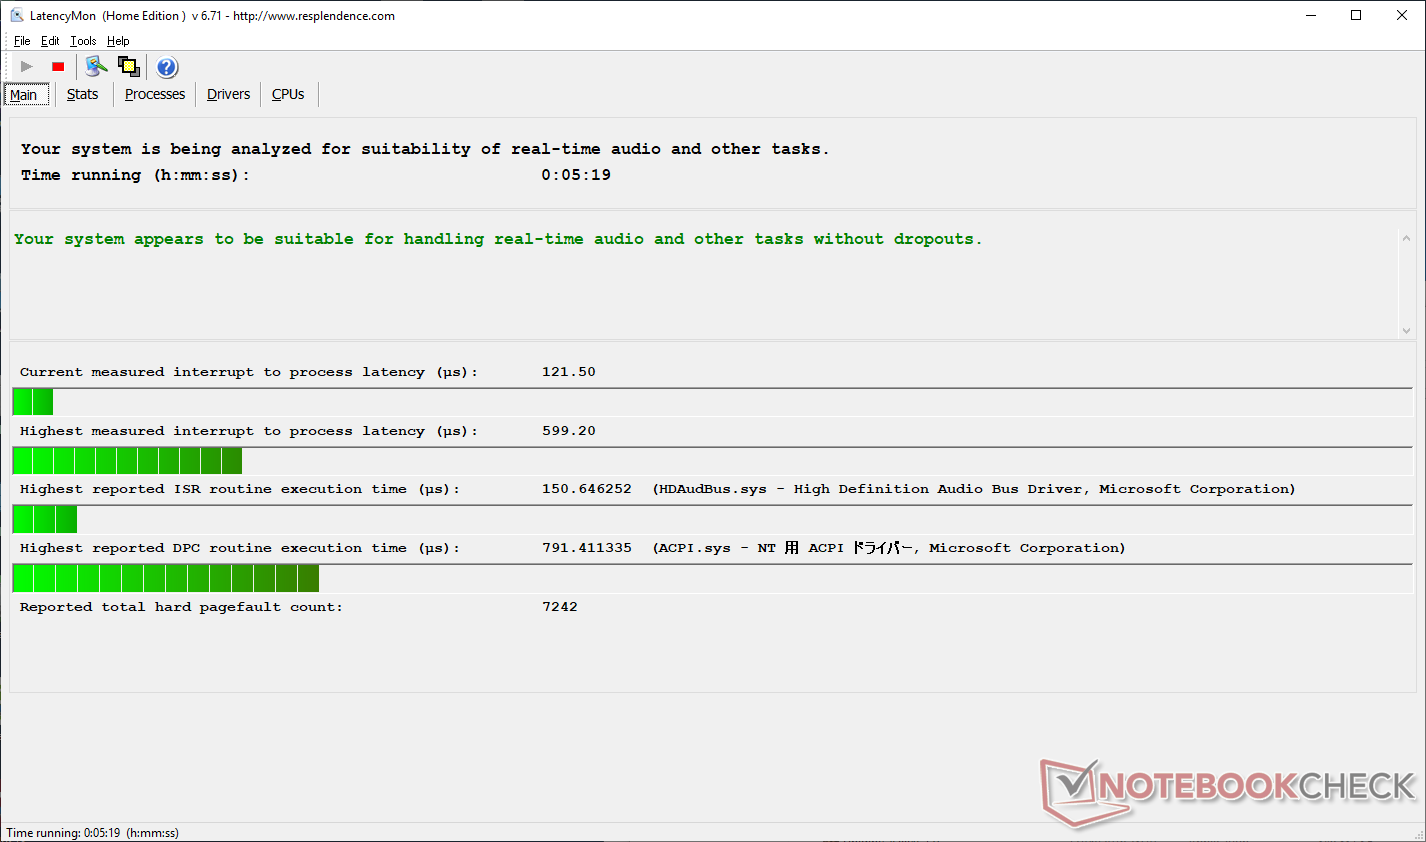
LatencyMon shows no DPC issues with real-time audio recording even with WLAN enabled.
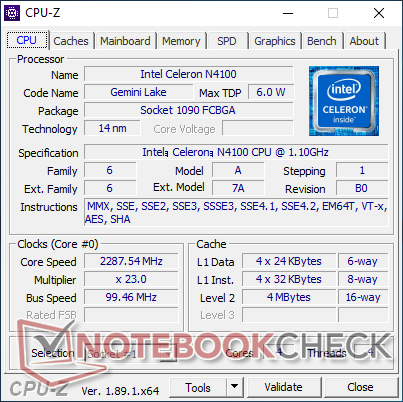
Processor
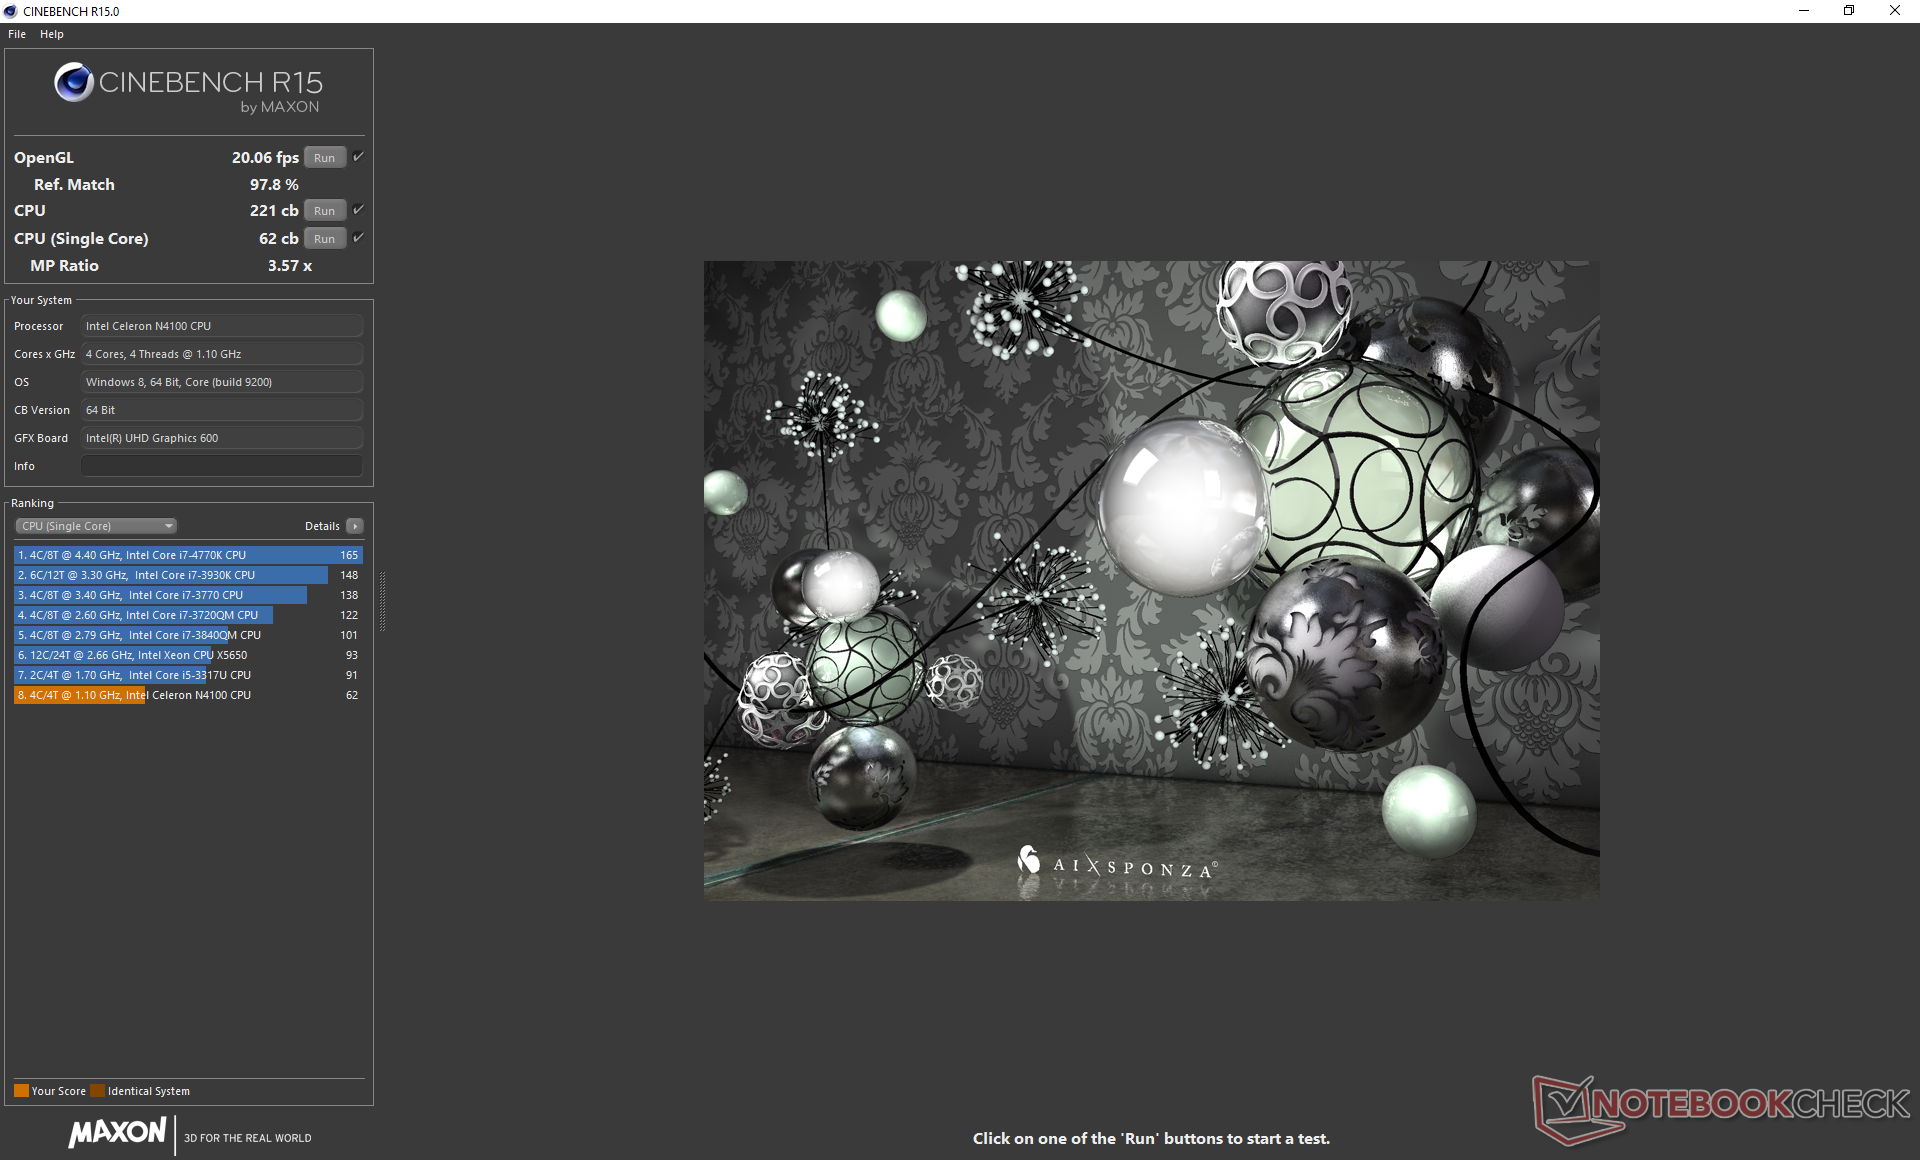
CPU performance is about 35 percent and 77 percent faster than the Microsoft Surface Go and LapBook Plus, respectively, in multi-threaded performance. Though still slow in general, even the smallest of performance advantages is appreciated because system responsiveness can be an issue for these low-power PCs. Running CineBench Multi-Thread in a loop shows no throttling issues over long periods.
See our dedicated page on the Celeron N4100 for more technical information and benchmark comparisons.
| Cinebench R10 | |
| Rendering Multiple CPUs 32Bit | |
| Asus VivoBook Flip 14 TP412UA-EC969T | |
| Average Intel Celeron N4100 (4915 - 7123, n=5) | |
| Microsoft Surface Go MHN-00003 | |
| Chuwi LapBook Plus | |
| Rendering Single 32Bit | |
| Asus VivoBook Flip 14 TP412UA-EC969T | |
| Microsoft Surface Go MHN-00003 | |
| Average Intel Celeron N4100 (1664 - 2049, n=5) | |
| Chuwi LapBook Plus | |
| wPrime 2.10 - 1024m | |
| Microsoft Surface Go MHN-00003 | |
| Chuwi LapBook Plus | |
| Average Intel Celeron N4100 (591 - 790, n=3) | |
* ... smaller is better
System Performance
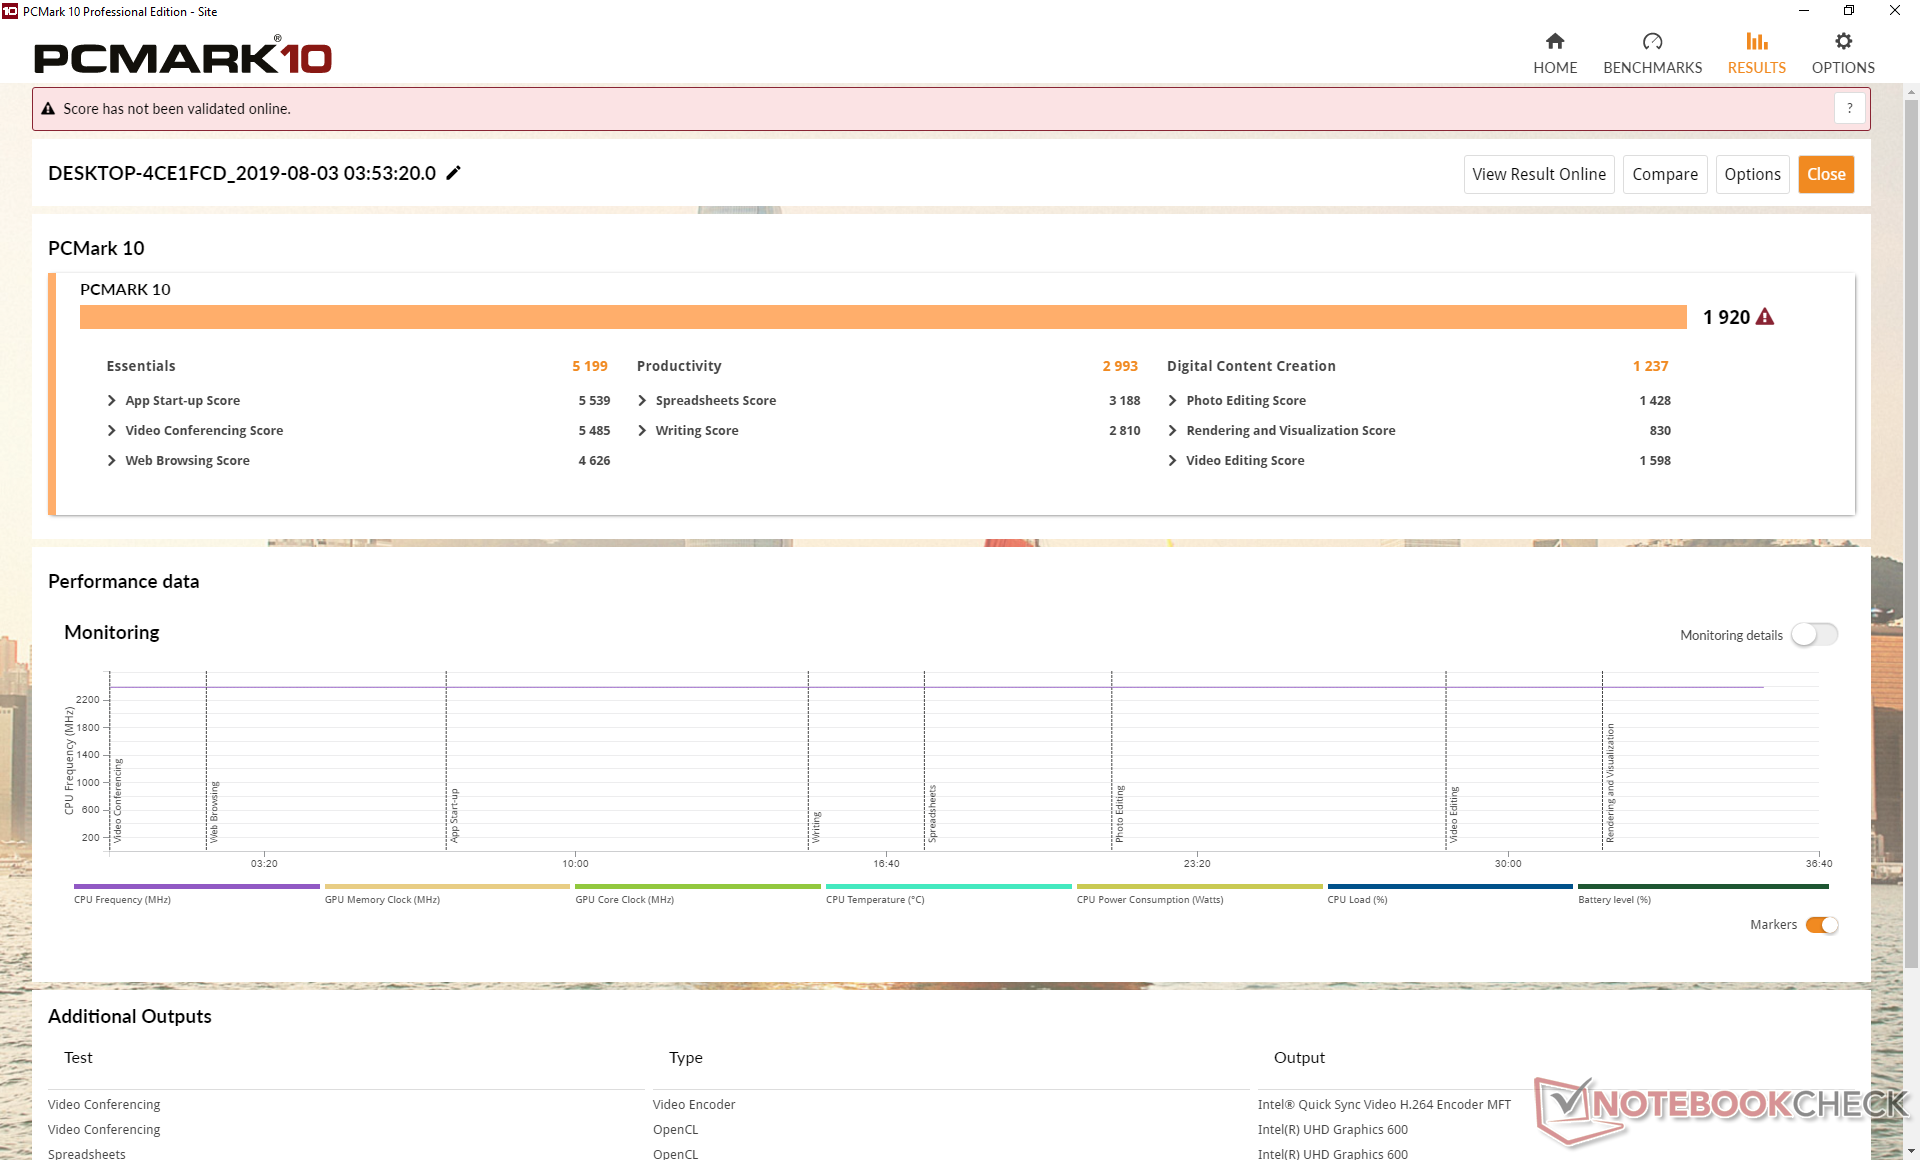
PCMark results are low as expected from a Celeron system. Nonetheless, the numbers are consistently higher than the average Celeron N4100 in our database by 5 to 20 percent meaning that the MiniBook is slightly faster than other systems equipped with the same CPU. The Chuwi LapBook Plus powered by the Atom x7-E3950 is significantly slower on all accounts.
We experienced no software or hardware issues during our time with the MiniBook. Windows was automatically set to Korean on our test unit, but this can be easily fixed in the language settings.
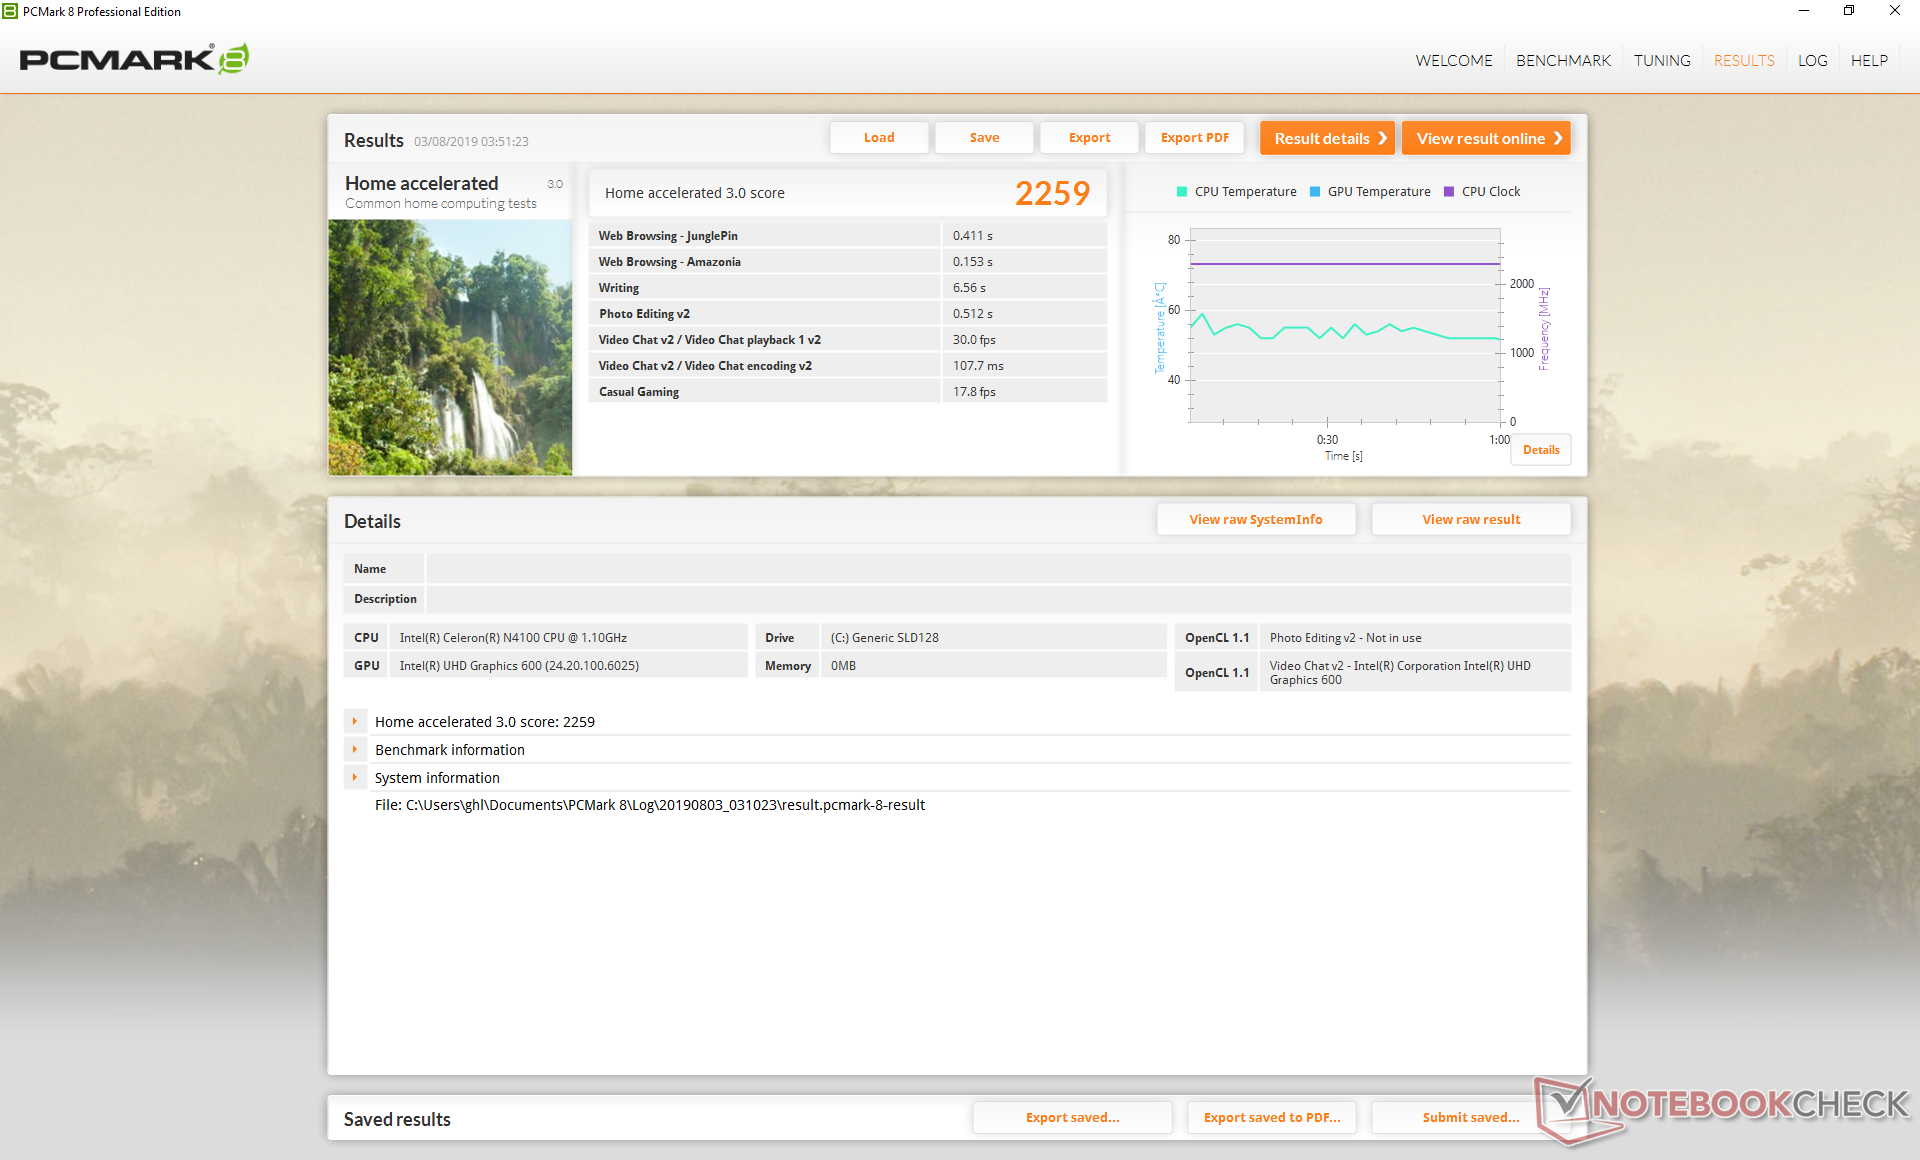
| PCMark 8 Home Score Accelerated v2 | 2259 points | |
| PCMark 10 Score | 1920 points | |
Help | ||
Storage Devices
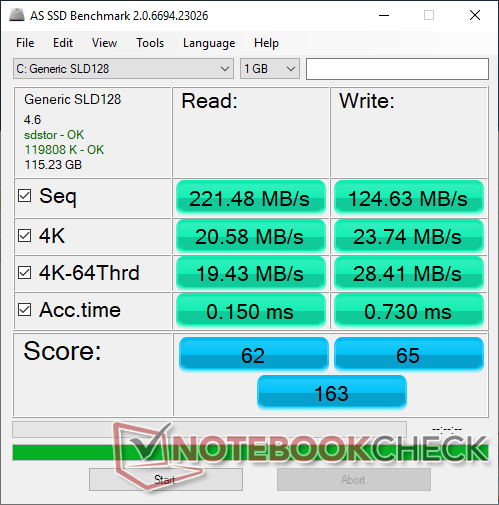
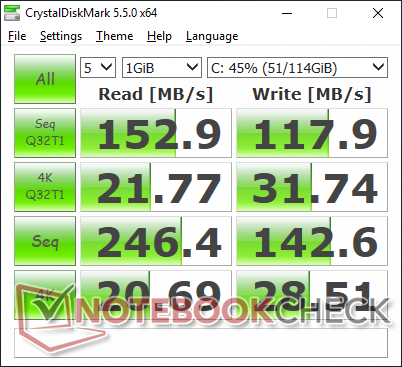
The MiniBook utilizes a soldered 128 GB eMMC 5.1 primary drive and a secondary M.2 2242 SATA expansion slot. Meanwhile, the Core m3 SKU promises M.2 NVMe SSD support. Sequential read and write rates are average at only 221 MB/s and 125 MB/s compared to ~500 MB/s on most SATA III SSDs. Still, the option to add a secondary drive is more than what we can say for most Ultrabooks and netbooks.
See our table of HDDs and SSDs for more benchmark comparisons.
| Chuwi MiniBook CWI526 128 GB eMMC Flash | Topjoy Falcon FORESEE 256GB | Lenovo Yoga Book C930 YB-J912F Toshiba KBG30ZMT256G | Microsoft Surface Go MHN-00003 64 GB eMMC Flash | Lenovo Flex 14IWL Samsung SSD PM981 MZVLB256HAHQ | |
|---|---|---|---|---|---|
| AS SSD | 155% | 558% | 19% | 1517% | |
| Seq Read (MB/s) | 221.5 | 472.2 113% | 1241 460% | 289.8 31% | 2533 1044% |
| Seq Write (MB/s) | 124.6 | 431.4 246% | 797 540% | 126.7 2% | 1438 1054% |
| 4K Read (MB/s) | 20.58 | 12.06 -41% | 43.38 111% | 18.29 -11% | 51.7 151% |
| 4K Write (MB/s) | 23.74 | 26.05 10% | 91.6 286% | 35.07 48% | 109.4 361% |
| 4K-64 Read (MB/s) | 19.43 | 87.9 352% | 582 2895% | 40.27 107% | 771 3868% |
| 4K-64 Write (MB/s) | 28.41 | 188 562% | 231.7 716% | 44.48 57% | 1268 4363% |
| Access Time Read * (ms) | 0.15 | 0.23 -53% | 0.057 62% | 0.151 -1% | 0.053 65% |
| Access Time Write * (ms) | 0.73 | 0.444 39% | 0.176 76% | 0.233 68% | 0.034 95% |
| Score Read (Points) | 62 | 147 137% | 749 1108% | 88 42% | 1076 1635% |
| Score Write (Points) | 65 | 257 295% | 403 520% | 92 42% | 1521 2240% |
| Score Total (Points) | 163 | 482 196% | 1526 836% | 225 38% | 3106 1806% |
| Copy ISO MB/s (MB/s) | 162.5 | 474 192% | 448.1 176% | 99.1 -39% | |
| Copy Program MB/s (MB/s) | 148.5 | 150 1% | 94.3 -36% | 44.34 -70% | |
| Copy Game MB/s (MB/s) | 159.9 | 344 115% | 254.5 59% | 76.5 -52% |
* ... smaller is better

GPU Performance
The integrated UHD Graphics 600 is not designed for gaming. In fact, the Bioshock Infinite benchmark would fail to launch at 768p and 1080p. Even the UHD Graphics 620, which is already poor at gaming, outperforms the UHD Graphics 600 by at least 100 percent in 3DMark benchmarks. The GPU is instead designed for smooth 1080p and 4K video streaming which works well on the MiniBook. Note that multi-tasking will be very slow whilst video streaming.
See our dedicated page on the UHD Graphics 600 for more technical information and benchmark comparison.
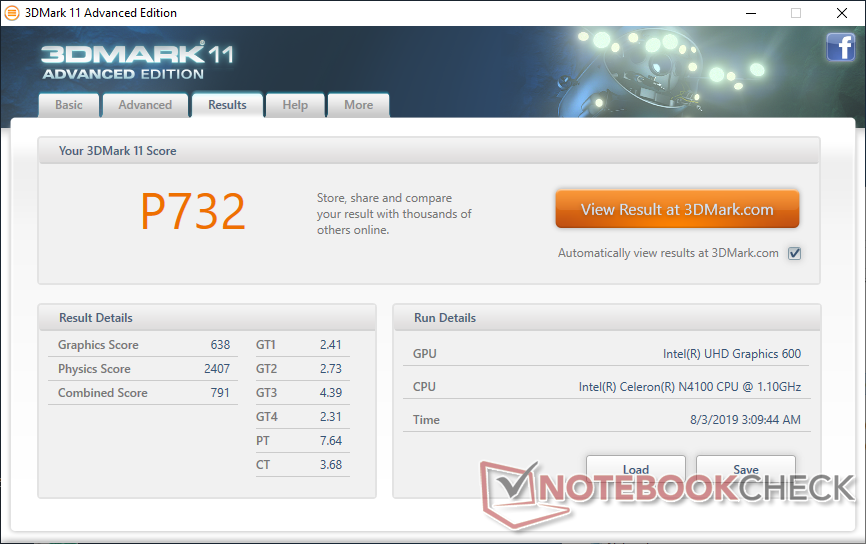
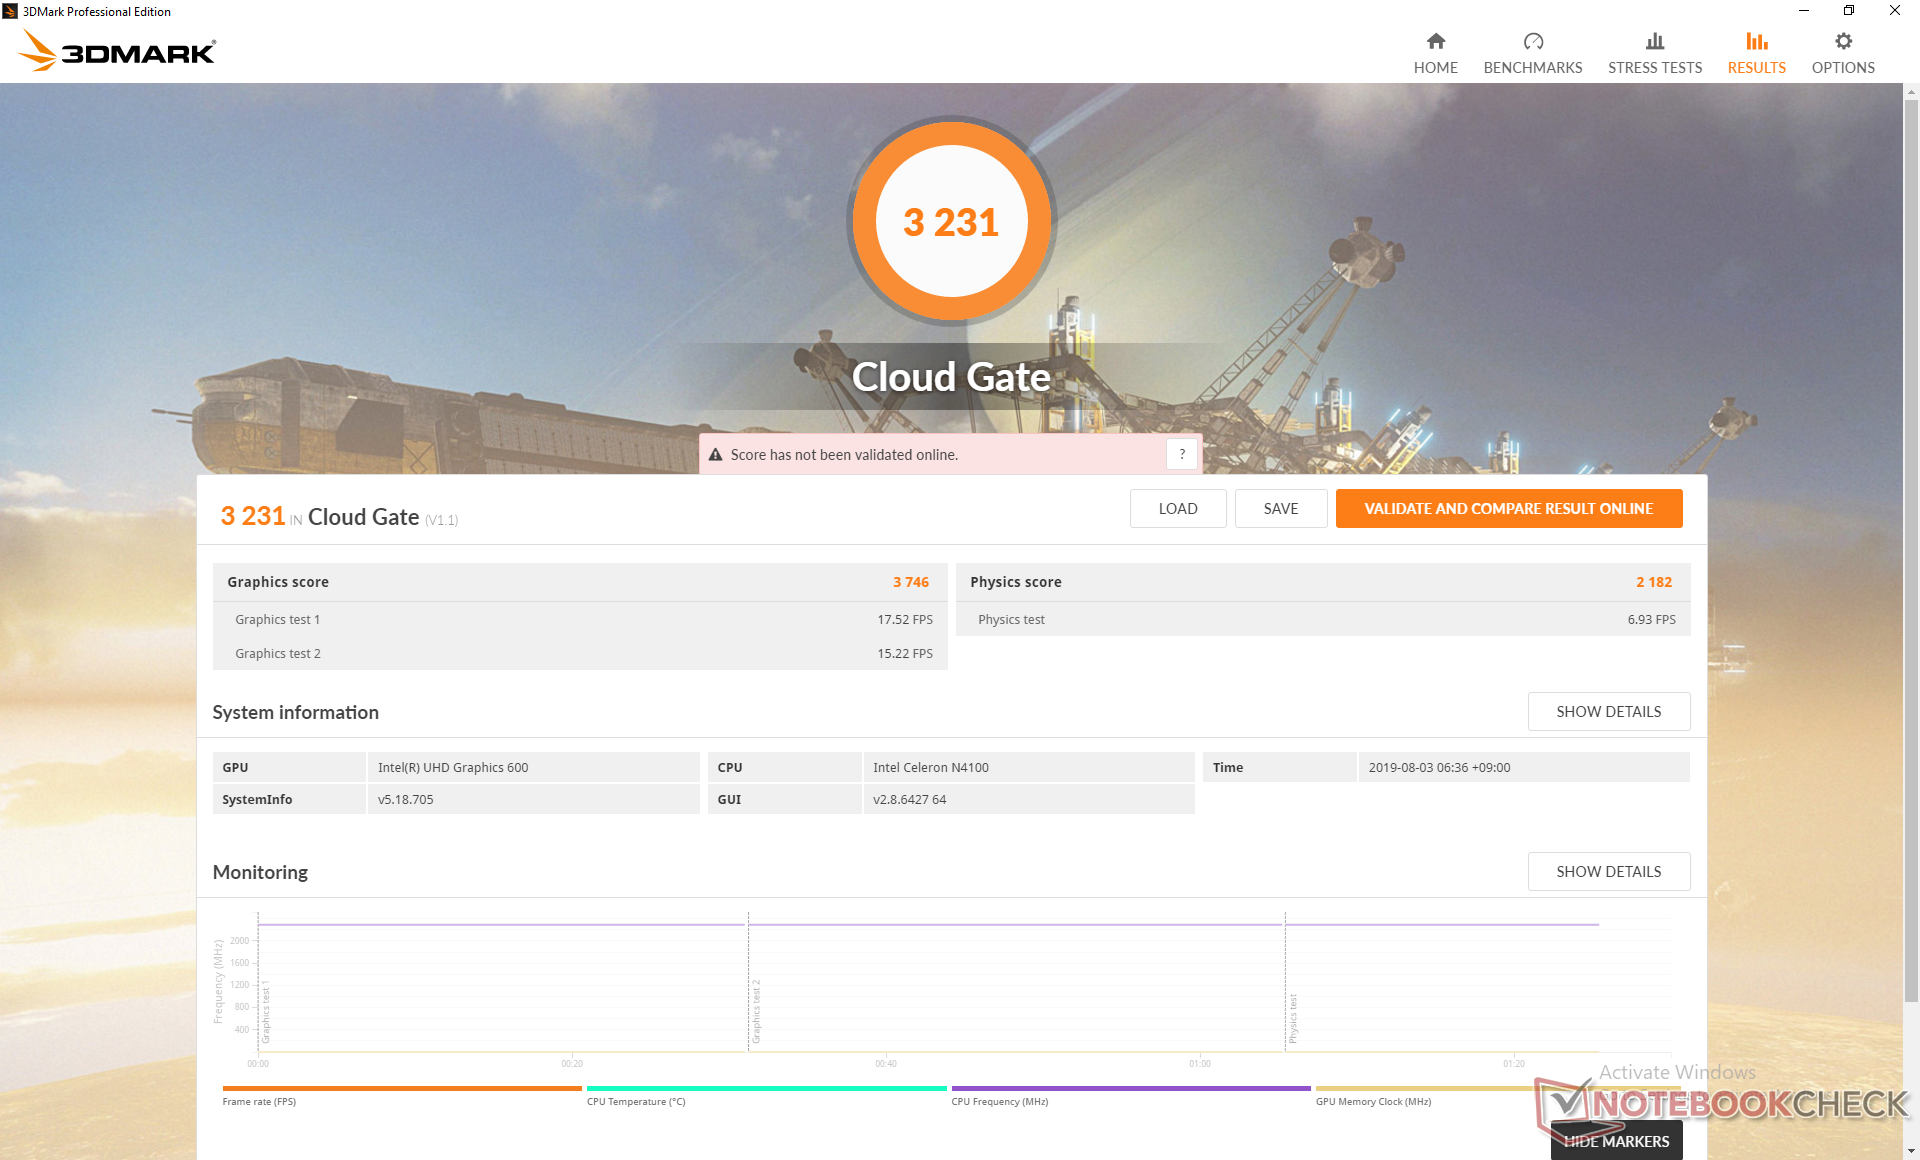
| 3DMark 11 Performance | 732 points | |
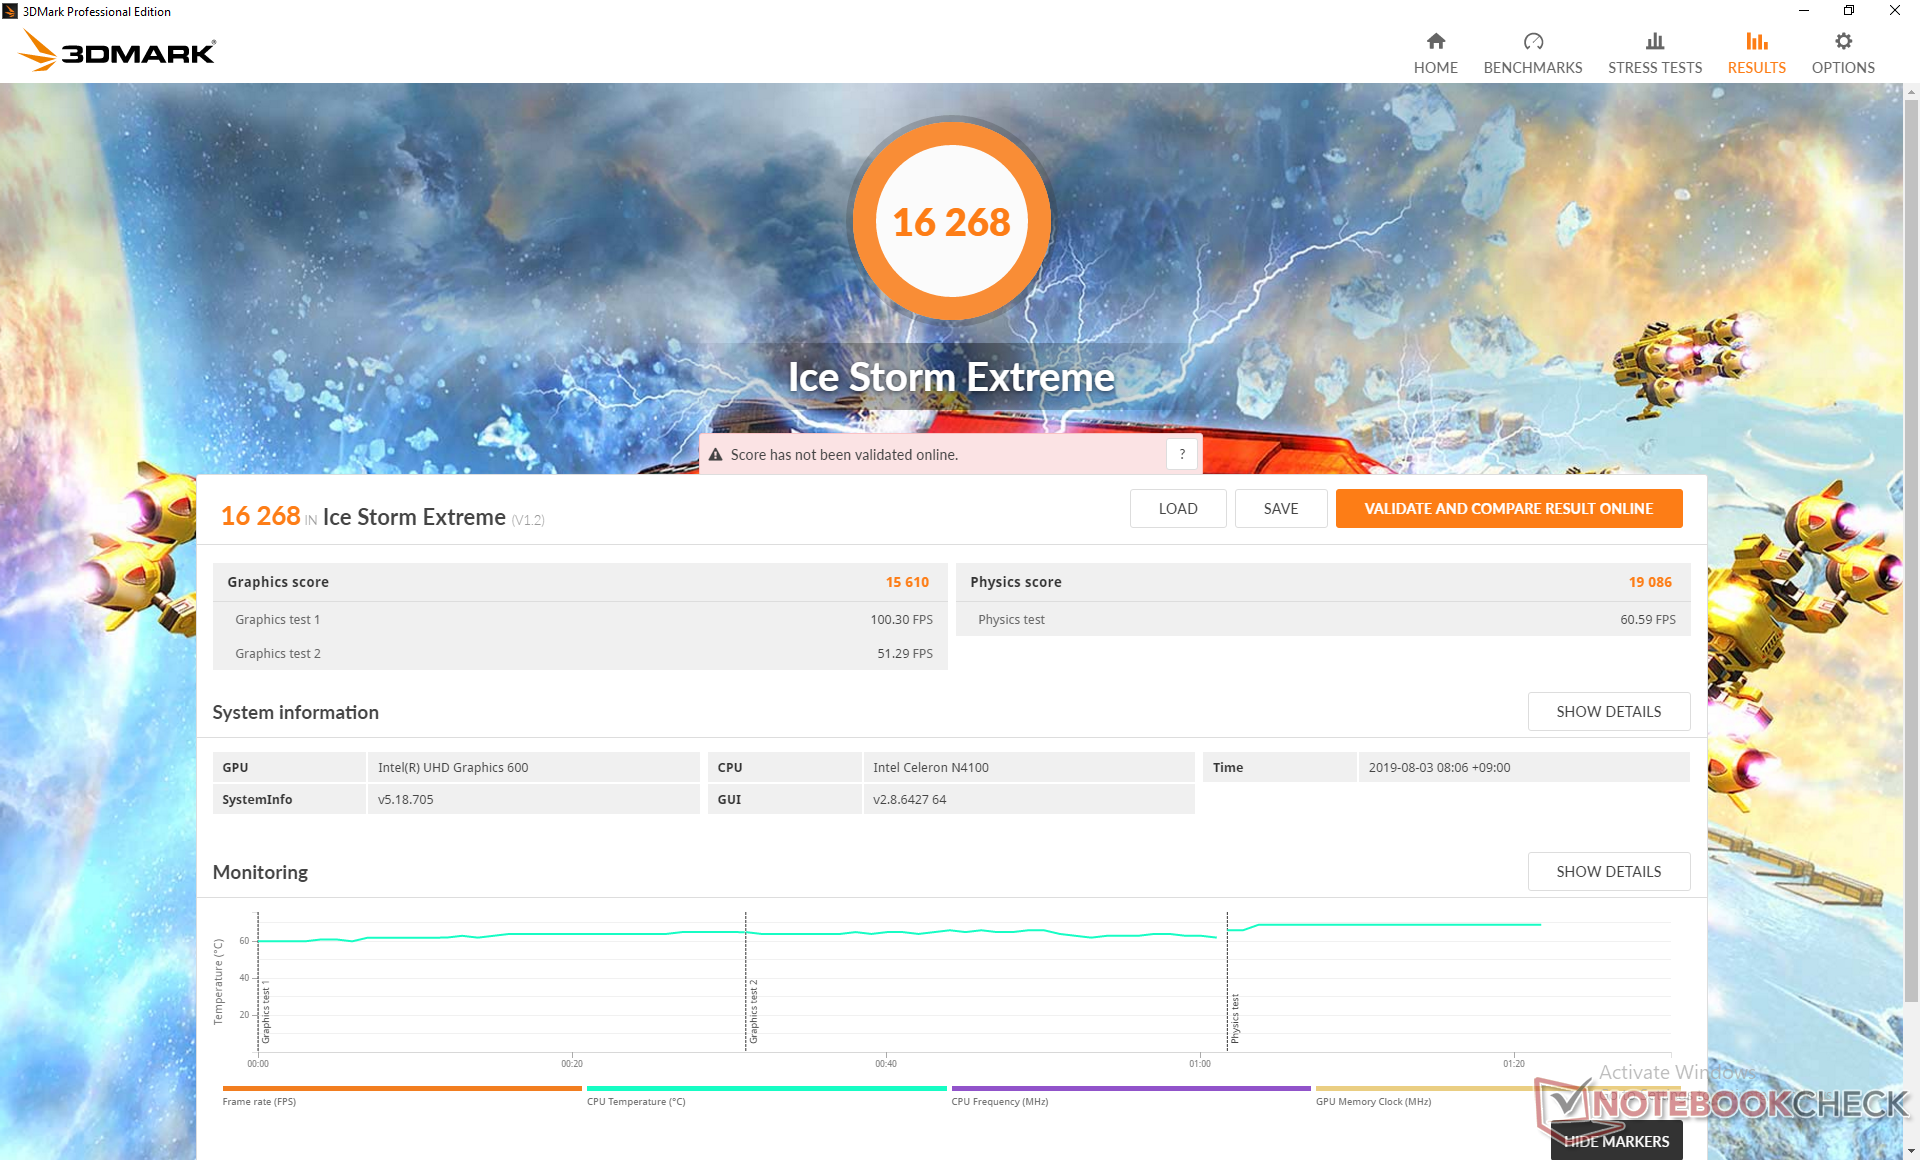
| 3DMark Ice Storm Standard Score | 24922 points | |
| 3DMark Cloud Gate Standard Score | 3231 points | |
Help | ||
| low | med. | high | ultra | |
|---|---|---|---|---|
| BioShock Infinite (2013) | 28.3 |
Emissions
System Noise
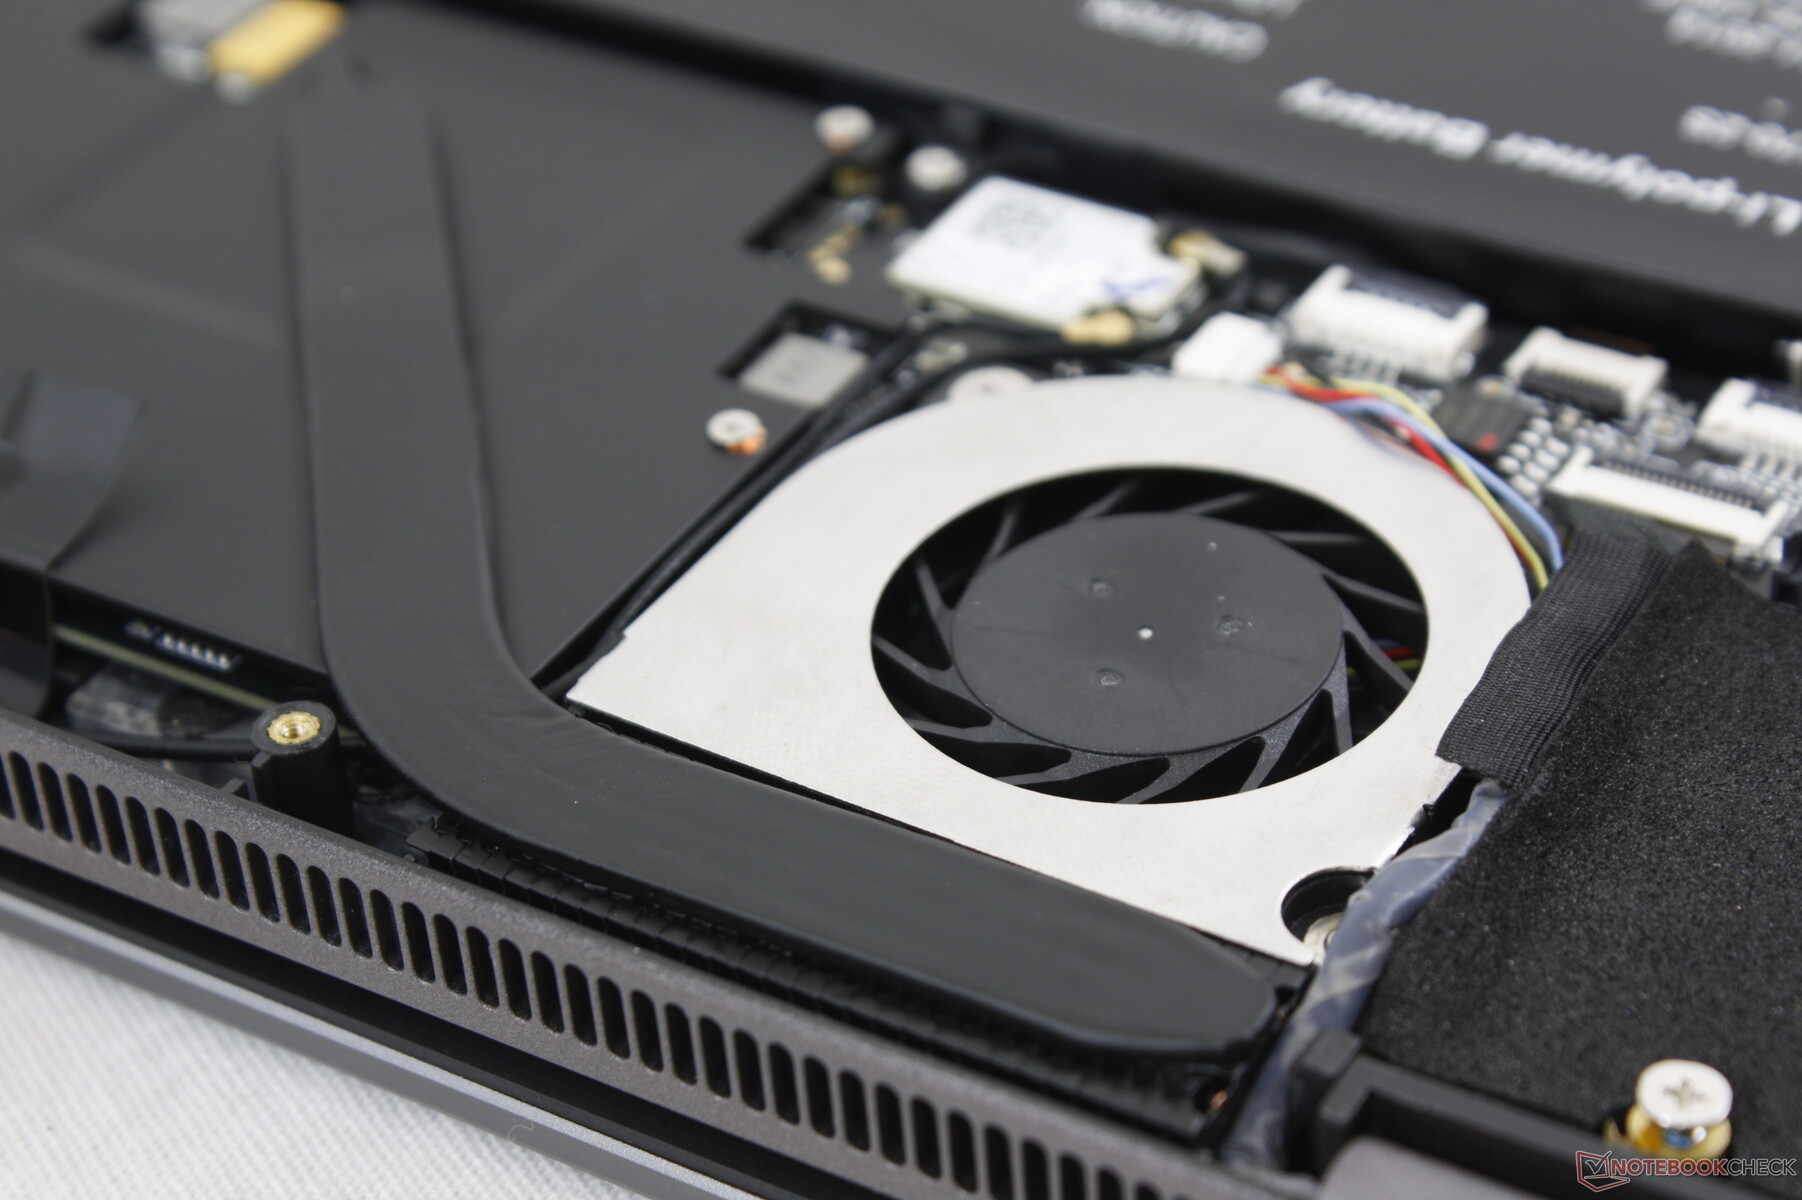
The 6 W CPU is not passively cooled unlike the majority of Atom-powered netbooks in the market. Fan noise is ever present on the MiniBook at a quiet 29.6 to 30 dB(A) against a background of 28.2 dB(A). It's essentially unnoticeable unless if in a completely silent room.
Extreme loads will bump fan noise up to 40.8 dB(A) to be even louder than some Ultrabooks like the Dell XPS 13. The sound frequency is higher-pitched than on most Ultrabooks as well because the fan is smaller in diameter. Thankfully, don't expect maximum RPM to occur often unless if you plan on running the CPU and GPU at 100 percent utilization for long periods.
Competing devices like the Falcon and Surface Go utilize passively cooled CPUs for slower performance than the MiniBook.
We're able to notice slight coil whine or electronic noise from our test unit.
| Chuwi MiniBook CWI526 UHD Graphics 600, Celeron N4100, 128 GB eMMC Flash | Topjoy Falcon UHD Graphics 605, Pentium N5000, FORESEE 256GB | Microsoft Surface Go MHN-00003 UHD Graphics 615, Pentium 4415Y, 64 GB eMMC Flash | Lenovo Flex 14IWL UHD Graphics 620, i5-8265U, Samsung SSD PM981 MZVLB256HAHQ | Dell XPS 13 9380 2019 UHD Graphics 620, i5-8265U, SK hynix PC401 HFS256GD9TNG | |
|---|---|---|---|---|---|
| Noise | 1% | -2% | |||
| off / environment * (dB) | 28.2 | 28.4 -1% | 30.4 -8% | ||
| Idle Minimum * (dB) | 29.6 | 28.4 4% | 30.4 -3% | ||
| Idle Average * (dB) | 29.6 | 28.4 4% | 30.4 -3% | ||
| Idle Maximum * (dB) | 30 | 29.1 3% | 30.4 -1% | ||
| Load Average * (dB) | 30 | 33.8 -13% | 31.7 -6% | ||
| Load Maximum * (dB) | 40.8 | 37.7 8% | 38.1 7% |
* ... smaller is better
Noise level
| Idle |
| 29.6 / 29.6 / 30 dB(A) |
| Load |
| 30 / 40.8 dB(A) |
 | ||
30 dB silent 40 dB(A) audible 50 dB(A) loud |
||
min: | ||
Temperature
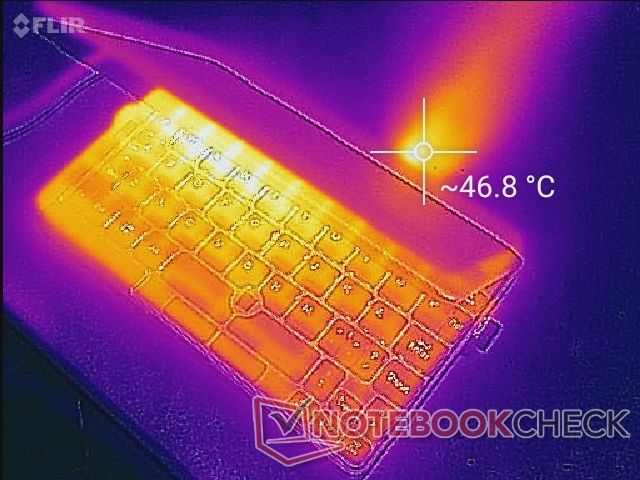
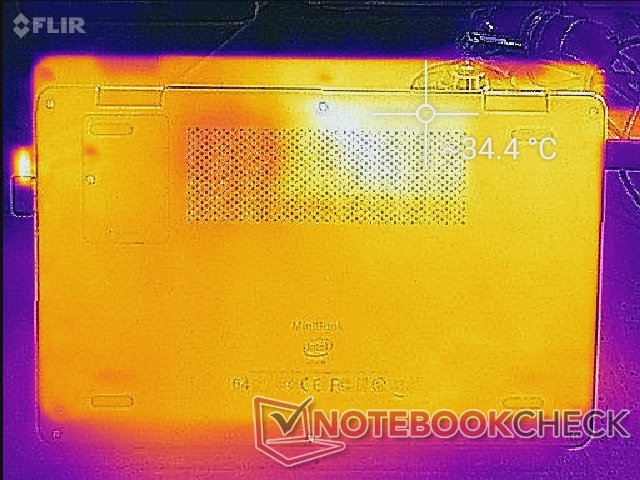
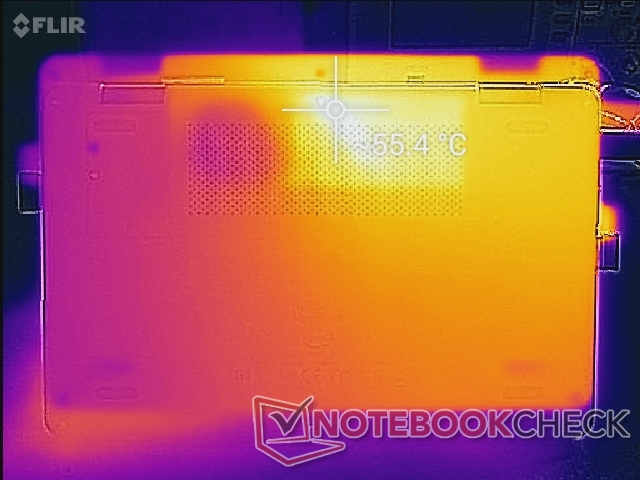
Surface temperatures are warmer than expected despite the active cooling solution likely due to the very compact form factor. Hot spots can become as warm as 50 C on both the bottom and top sides when subjected to extreme stress for long periods. Luckily, such temperatures will not occur during regular browsing or streaming workloads. It'll definitely still be warm, but not uncomfortably so.
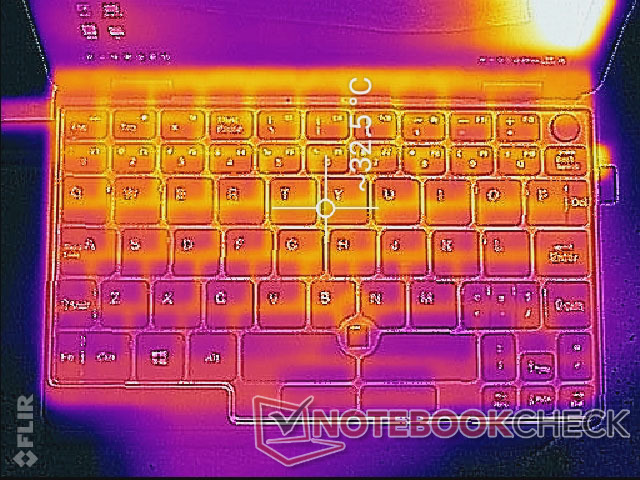
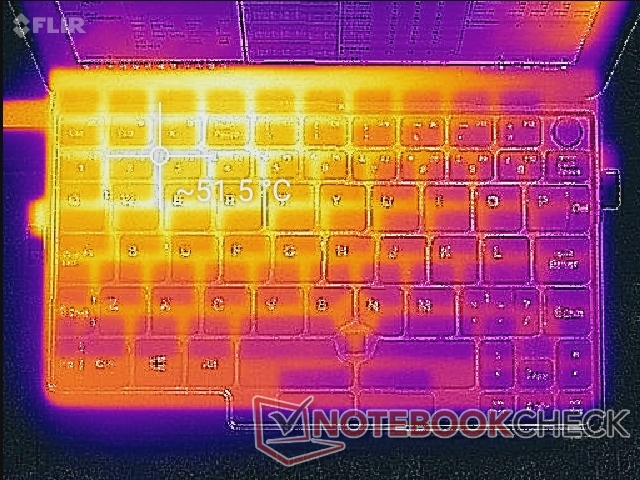
(-) The maximum temperature on the upper side is 51.4 °C / 125 F, compared to the average of 33.1 °C / 92 F, ranging from 21.6 to 53.2 °C for the class Netbook.
(-) The bottom heats up to a maximum of 55.4 °C / 132 F, compared to the average of 36.6 °C / 98 F
(+) In idle usage, the average temperature for the upper side is 31.3 °C / 88 F, compared to the device average of 29.8 °C / 86 F.
(-) The palmrests and touchpad can get very hot to the touch with a maximum of 41.2 °C / 106.2 F.
(-) The average temperature of the palmrest area of similar devices was 29.3 °C / 84.7 F (-11.9 °C / -21.5 F).
Stress Test
We stress the system with synthetic loads to identify for any potential throttling or stability issues. When running Prime95, the CPU remains stable at 2.3 GHz throughout compared to the 1.1 GHz base clock rate of a Celeron N4100. In other words, the system will not throttle even when fully stressed. Results are consistent with our CineBench loop test results above. Core temperature, however, can be very warm at the mid 80 C range which explains the loud fan noise and high surface temperatures when under such extreme conditions.
Running on batteries will not limit performance. 3DMark Cloud Gate on battery power returns nearly identical results when running on mains.
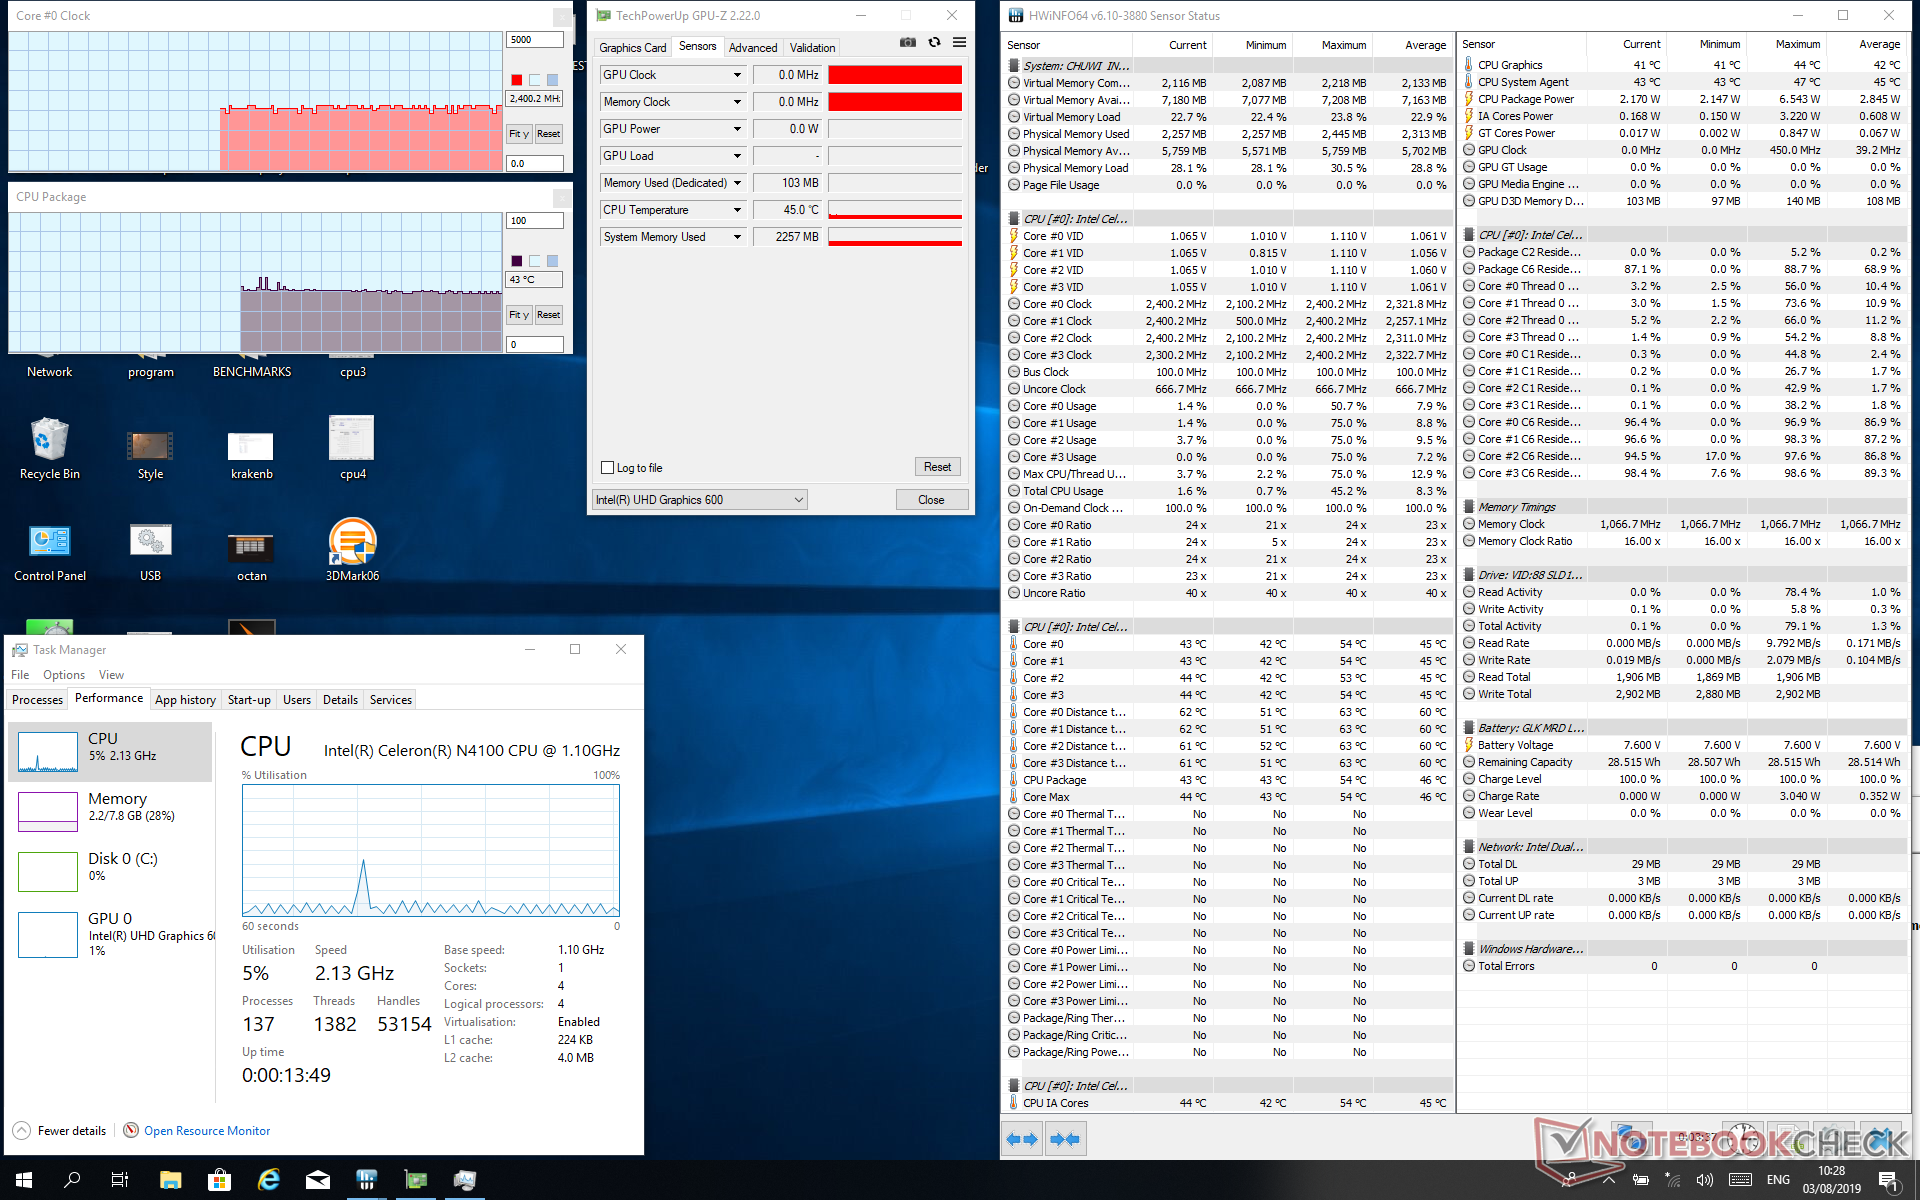
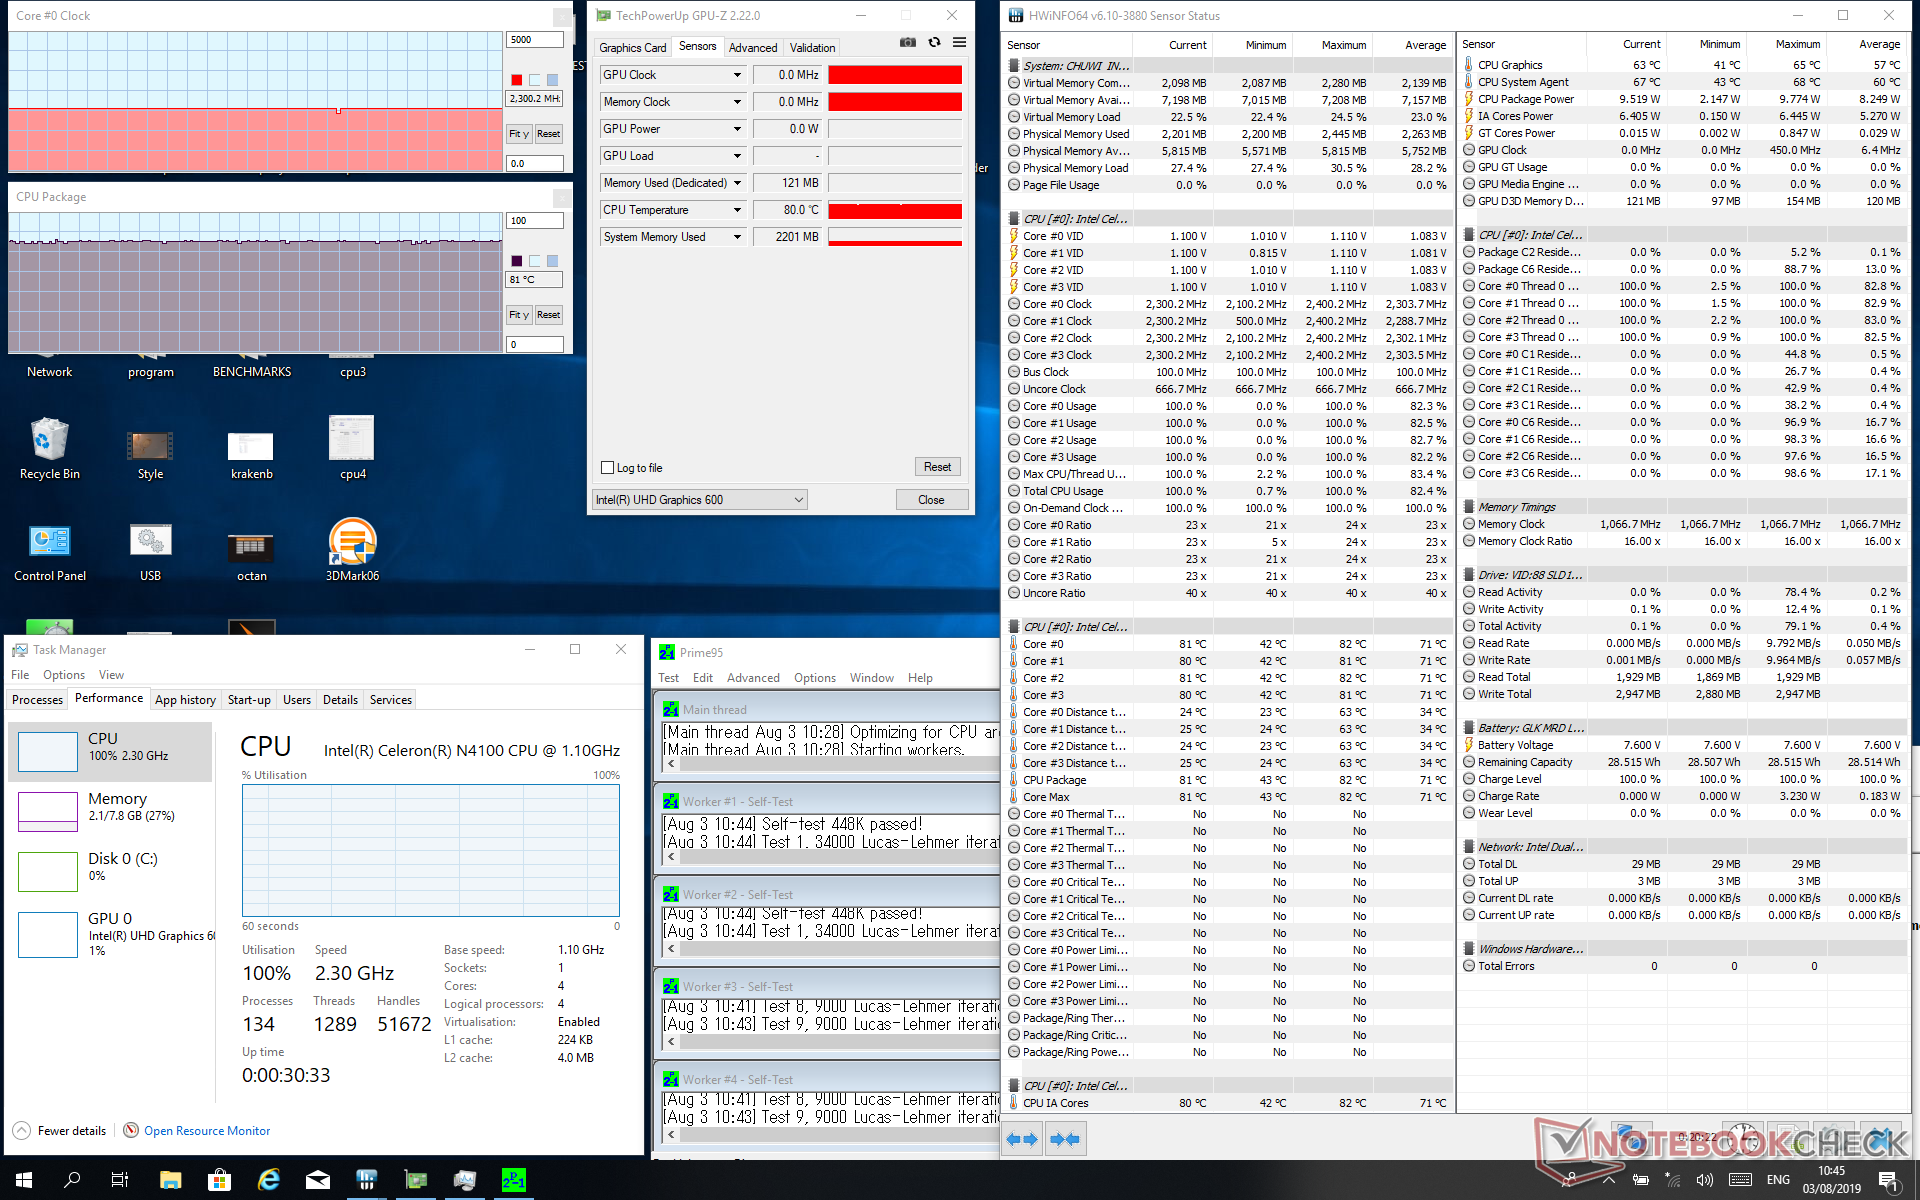
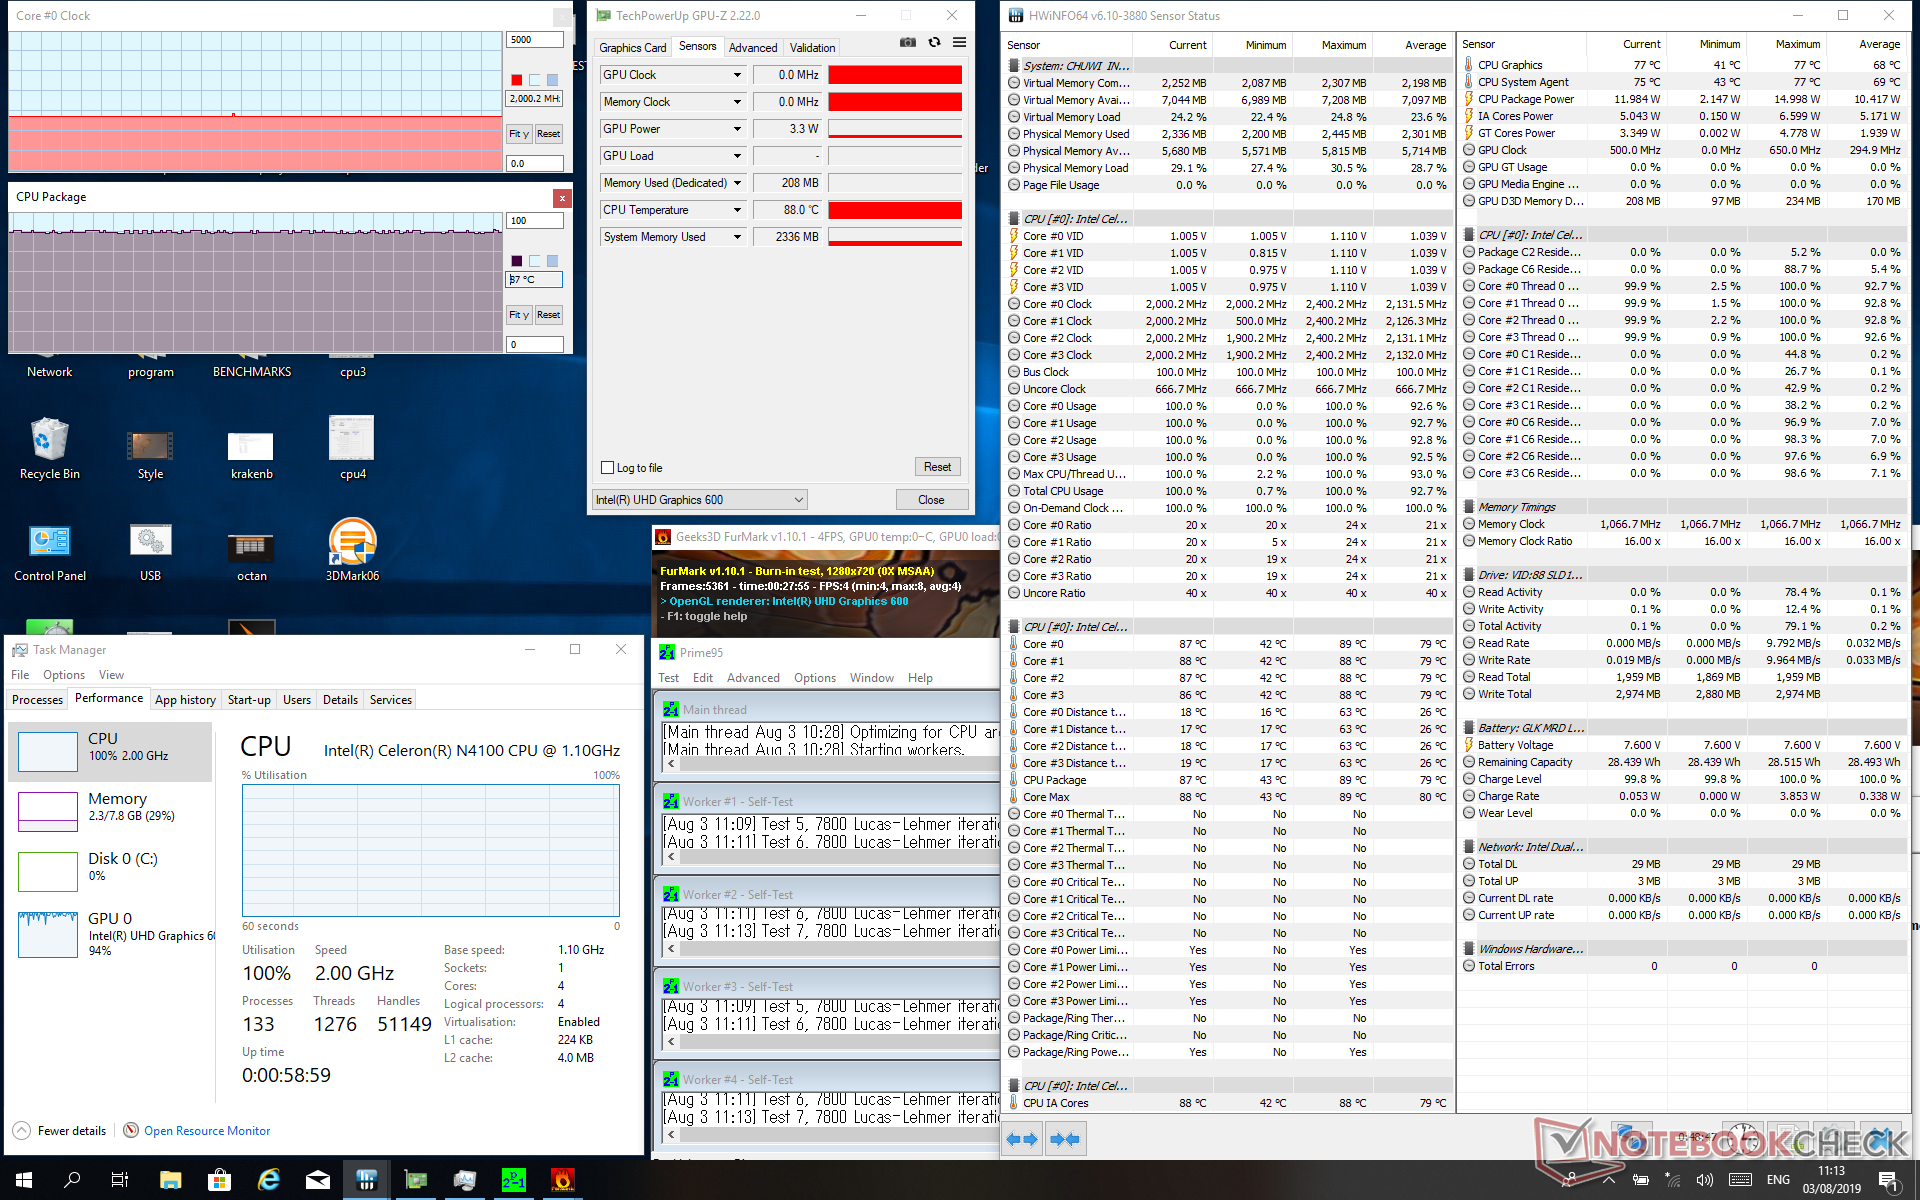
| CPU Clock (GHz) | GPU Clock (MHz) | Average CPU Temperature (°C) | |
| System Idle | -- | -- | 43 |
| Prime95 Stress | 2.3 | -- | 81 |
| Prime95 + FurMark Stress | 2.0 | -- | 87 |
Speakers
The integrated speakers are loud considering the size with no static or vibrations at maximum volume. Bass is very poor as one would expect. Our pink noise results show a steep roll off at about 500 Hz.


Chuwi MiniBook CWI526 audio analysis
(±) | speaker loudness is average but good (78.4 dB)
Bass 100 - 315 Hz
(-) | nearly no bass - on average 19.5% lower than median
(±) | linearity of bass is average (8.8% delta to prev. frequency)
Mids 400 - 2000 Hz
(±) | higher mids - on average 7.2% higher than median
(±) | linearity of mids is average (12.2% delta to prev. frequency)
Highs 2 - 16 kHz
(±) | higher highs - on average 5.1% higher than median
(±) | linearity of highs is average (8.9% delta to prev. frequency)
Overall 100 - 16.000 Hz
(-) | overall sound is not linear (35.2% difference to median)
Compared to same class
» 86% of all tested devices in this class were better, 14% similar, 0% worse
» The best had a delta of 14%, average was 25%, worst was 35%
Compared to all devices tested
» 93% of all tested devices were better, 1% similar, 6% worse
» The best had a delta of 4%, average was 24%, worst was 134%
Apple MacBook 12 (Early 2016) 1.1 GHz audio analysis
(+) | speakers can play relatively loud (83.6 dB)
Bass 100 - 315 Hz
(±) | reduced bass - on average 11.3% lower than median
(±) | linearity of bass is average (14.2% delta to prev. frequency)
Mids 400 - 2000 Hz
(+) | balanced mids - only 2.4% away from median
(+) | mids are linear (5.5% delta to prev. frequency)
Highs 2 - 16 kHz
(+) | balanced highs - only 2% away from median
(+) | highs are linear (4.5% delta to prev. frequency)
Overall 100 - 16.000 Hz
(+) | overall sound is linear (10.2% difference to median)
Compared to same class
» 7% of all tested devices in this class were better, 2% similar, 91% worse
» The best had a delta of 5%, average was 18%, worst was 53%
Compared to all devices tested
» 5% of all tested devices were better, 1% similar, 94% worse
» The best had a delta of 4%, average was 24%, worst was 134%
Energy Management
Power Consumption
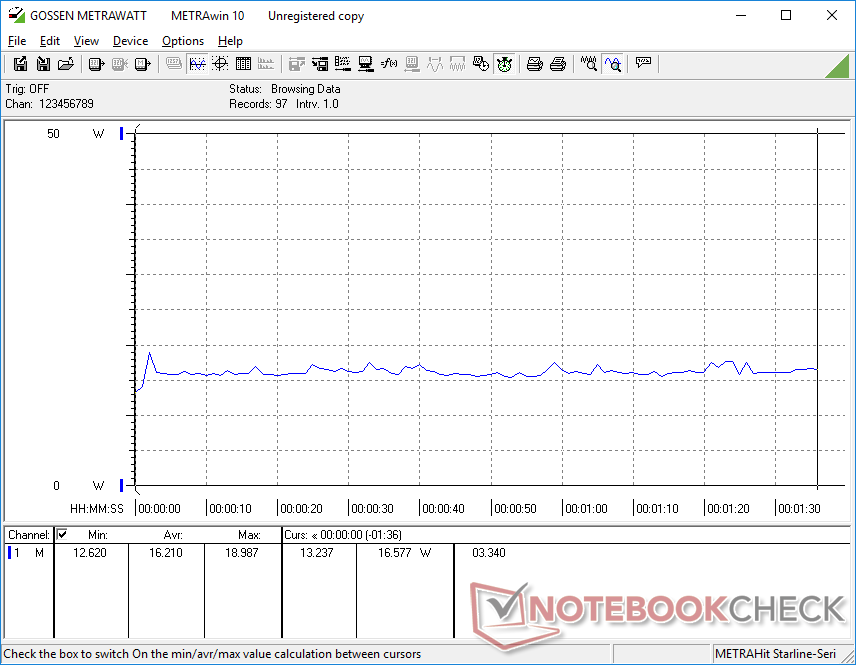
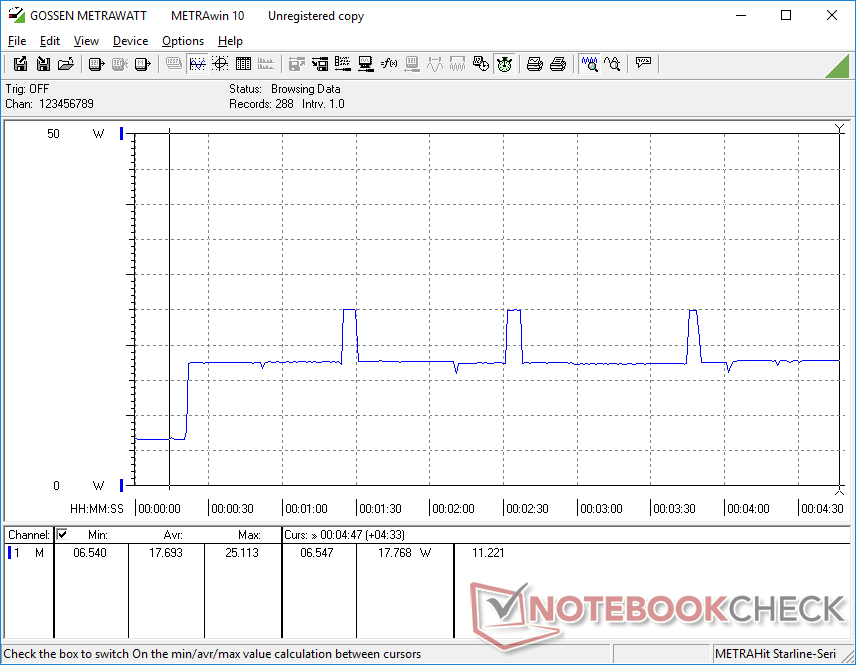
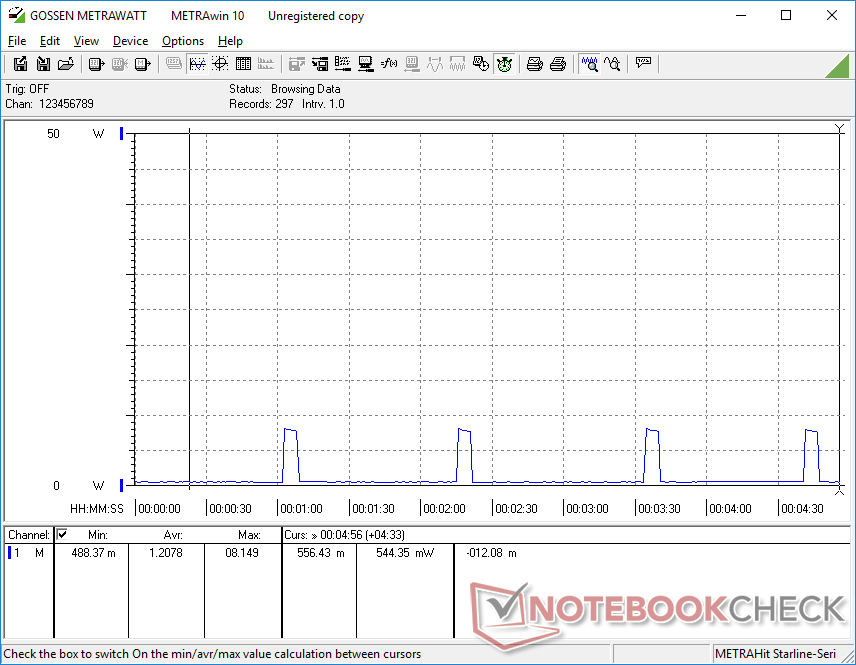
Idling on desktop draws between 3 W and 7 W depending on the brightness and power profile. Jumping from minimum brightness to maximum brightness will demand an additional 2.5 W. We're able to record a maximum consumption of 25.4 W from the small (~8 x 4.4 x 2.6 cm) 24 W AC adapter meaning that recharge rate will slow to a crawl when running extreme processing loads. This same AC adapter can be used to charge other USB Type-C devices from smartphones to tablets.
We noticed some strange power consumption behavior on our unit that's worth mentioning. Consumption would spike by 8 W for a couple of seconds every 1.5 minutes for seemingly no reason. This would occur when the system is in Sleep mode, when idling on desktop, and even when the system is completely turned off as shown by our power consumption graphs below. There is absolutely no reason why this should be occurring and we suspect that this could be due to software or hardware background activity.
| Off / Standby | |
| Idle | |
| Load |
|
Key:
min: | |
| Chuwi MiniBook CWI526 Celeron N4100, UHD Graphics 600, 128 GB eMMC Flash, IPS, 1920x1200, 8" | Topjoy Falcon Pentium N5000, UHD Graphics 605, FORESEE 256GB, IPS, 1920x1200, 8" | Huawei MediaPad M3 8.4 inch Kirin 950, Mali-T880 MP4, 32 GB eMMC Flash, IPS, 2560x1600, 8.4" | Apple iPad Air 3 2019 A12 Bionic, A12 Bionic GPU, 64 GB eMMC Flash, IPS, 2224x1668, 10.5" | Lenovo Yoga Book C930 YB-J912F i5-7Y54, HD Graphics 615, Toshiba KBG30ZMT256G, IPS, 2560x1660, 10.8" | Microsoft Surface Go MHN-00003 Pentium 4415Y, UHD Graphics 615, 64 GB eMMC Flash, IPS, 1800x1200, 10" | Lenovo Flex 14IWL i5-8265U, UHD Graphics 620, Samsung SSD PM981 MZVLB256HAHQ, IPS, 1920x1080, 14" | |
|---|---|---|---|---|---|---|---|
| Power Consumption | 34% | 52% | 29% | -24% | 6% | -125% | |
| Idle Minimum * (Watt) | 3.3 | 2.5 24% | 1.51 54% | 2.18 34% | 5.3 -61% | 2.88 13% | 9.4 -185% |
| Idle Average * (Watt) | 5.8 | 4 31% | 3.64 37% | 6.4 -10% | 6.9 -19% | 4.8 17% | 13.3 -129% |
| Idle Maximum * (Watt) | 6.4 | 4.1 36% | 3.68 43% | 6.43 -0% | 7.4 -16% | 7.5 -17% | 13.9 -117% |
| Load Average * (Watt) | 19 | 8.1 57% | 6.95 63% | 7.48 61% | 19.7 -4% | 16.9 11% | 39.7 -109% |
| Load Maximum * (Watt) | 25.4 | 19.6 23% | 9.11 64% | 10.65 58% | 30.5 -20% | 23.8 6% | 46.5 -83% |
* ... smaller is better
Battery Life
Runtimes are pretty good considering the small 26 Wh battery and questionable power consumption behavior noted above. Expect about 6.5 hours of real-world WLAN use when set to a display brightness of 150 nits (or 30 percent).
Recharging from empty to full capacity with the included USB Type-C adapter is slow at 2.5 hours. Other full-size Ultrabooks can fully recharge in about 1.5 hours.
| Chuwi MiniBook CWI526 Celeron N4100, UHD Graphics 600, 26.6 Wh | Topjoy Falcon Pentium N5000, UHD Graphics 605, 22 Wh | Huawei MediaPad M3 8.4 inch Kirin 950, Mali-T880 MP4, 19.5 Wh | Apple iPad Air 3 2019 A12 Bionic, A12 Bionic GPU, 30.8 Wh | Lenovo Yoga Book C930 YB-J912F i5-7Y54, HD Graphics 615, 36 Wh | Microsoft Surface Go MHN-00003 Pentium 4415Y, UHD Graphics 615, 28 Wh | Lenovo Flex 14IWL i5-8265U, UHD Graphics 620, 45 Wh | |
|---|---|---|---|---|---|---|---|
| Battery runtime | -14% | 40% | 89% | -3% | 15% | 60% | |
| WiFi v1.3 (h) | 6.5 | 5.6 -14% | 9.1 40% | 12.3 89% | 6.3 -3% | 7.5 15% | 10.4 60% |
| Reader / Idle (h) | 18.5 | 25 | 11.5 | 12.9 | 13.6 | ||
| Load (h) | 4.5 | 3.6 | 2.6 | 3 | 1.2 |
Pros
Cons
Verdict
We've checked out a wide selection of Chuwi products in the past and they all have these three qualities in common: sleek visual designs, cheap prices, and super-slow processors. The latter has been the bane of Chuwi laptops because they would look like expensive flagship Ultrabooks of 2019 but perform like netbooks from 2009. The MiniBook bucks the trend by balancing looks, price, and performance more diligently than existing Chuwi laptops. The compact chassis is rigid, the display is of high quality, and the Celeron CPU pairs well with this screen size in contrast to the 13-inch and 15-inch Chuwi LapBooks powered by even slower Atom CPUs. The display and keyboard keys in particular are surprisingly brighter and firmer than the Topjoy Falcon, respectively, for a higher quality feel.
The most annoying aspects of the MiniBook will be its unorthodox keyboard layout, inaccurate cursor input at slow speeds, and uneven hinge rigidity. These factors directly impact the user experience making the first few days of use an uphill learning curve before everything clicks.
Strong design, firm QWERTY keys, and a bright display are the highlights of the Chuwi MiniBook. The low-power Celeron CPU performs slightly faster than expected and it pairs well with the 8-inch netbook form factor as opposed to larger 13-inch or 15-inch LapBook Ultrabooks.
Chuwi MiniBook CWI526
- 08/05/2019 v6 (old)
Allen Ngo
Price comparison
