Apple iPad Air (2019) Tablet Review

Unlike its namesake predecessor, the iPad Air 2, the third generation of the iPad Air is not a top product in Apple's tablet segment, since this distinction continues to be reserved for the Pro models. This can also be seen in all areas, with the design being identical to the iPad Pro 10.5 from 2017 and also as there are some compromises in the remaining hardware and accessories.
The newest iPad Air is run by an A12 processor that is accompanied by 3 GB of working memory. In terms of the storage solution, buyers can choose between 64 and 256 GB of storage, with the smaller version costing 549 Euros (~$620; starting at $489 in the US) for the Wi-Fi model and the larger device costing 719 Euros (~$821; $638 in the US). The optional LTE modem costs an additional 140 Euros (~$158), so that the total can increase to 859 Euros (~$970; $769 in the US), which is also the base price of the iPad Pro 11 (64 GB, Wi-Fi only).
At around 550 Euros (~$621), the iPad Air (2019) primarily competes against the top Android models from Huawei and Samsung. It also offers pen and keyboard support, but neither of them are included in the price. While the comparison field is not particularly large, it is high-end and includes the Samsung Galaxy Tab S4, the Galaxy Tab S5e, and the Huawei MediaPad M5 10.8 Pro. In addition, we compare the Apple tablet with its in-house competitors.
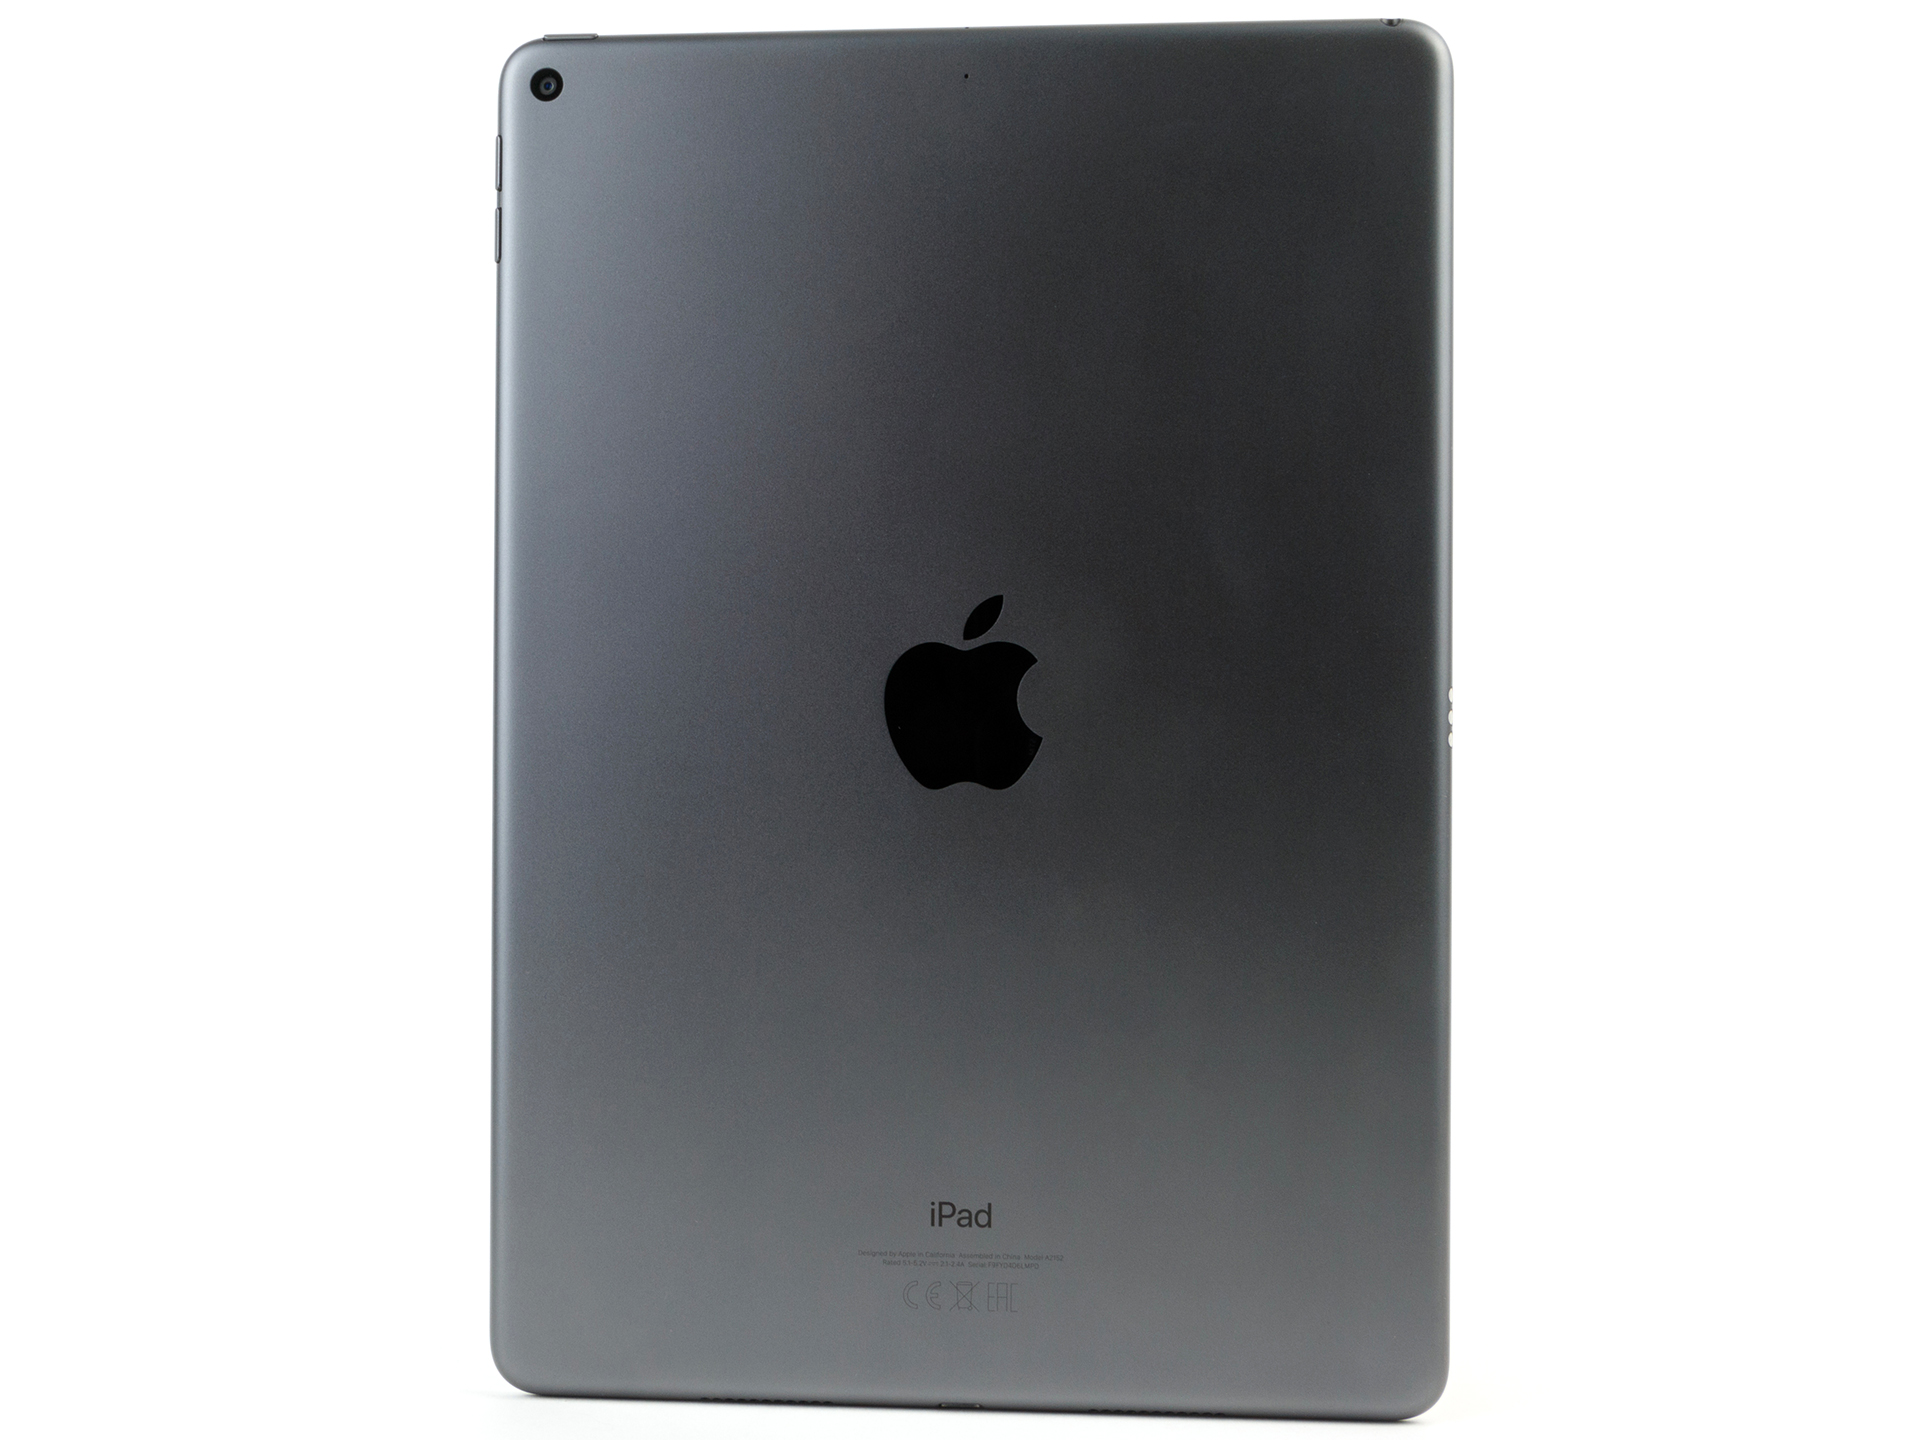
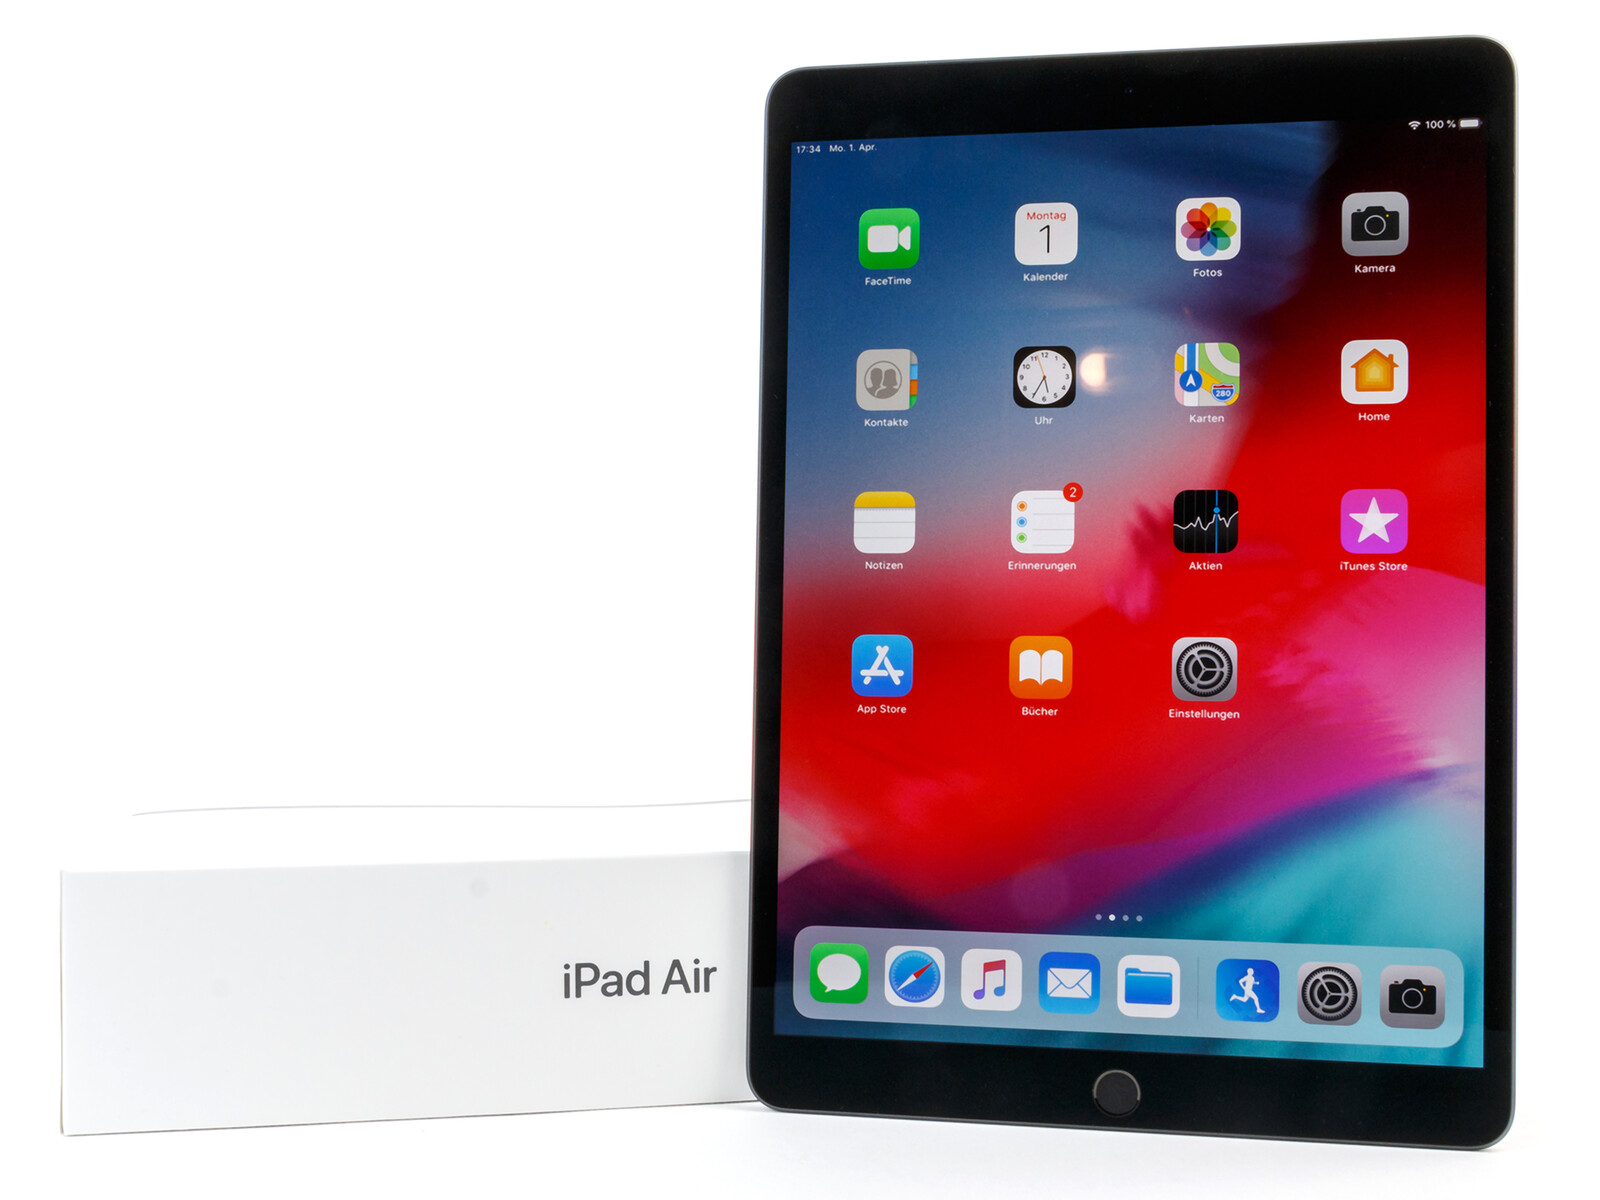
Case - iPad with aluminum unibody
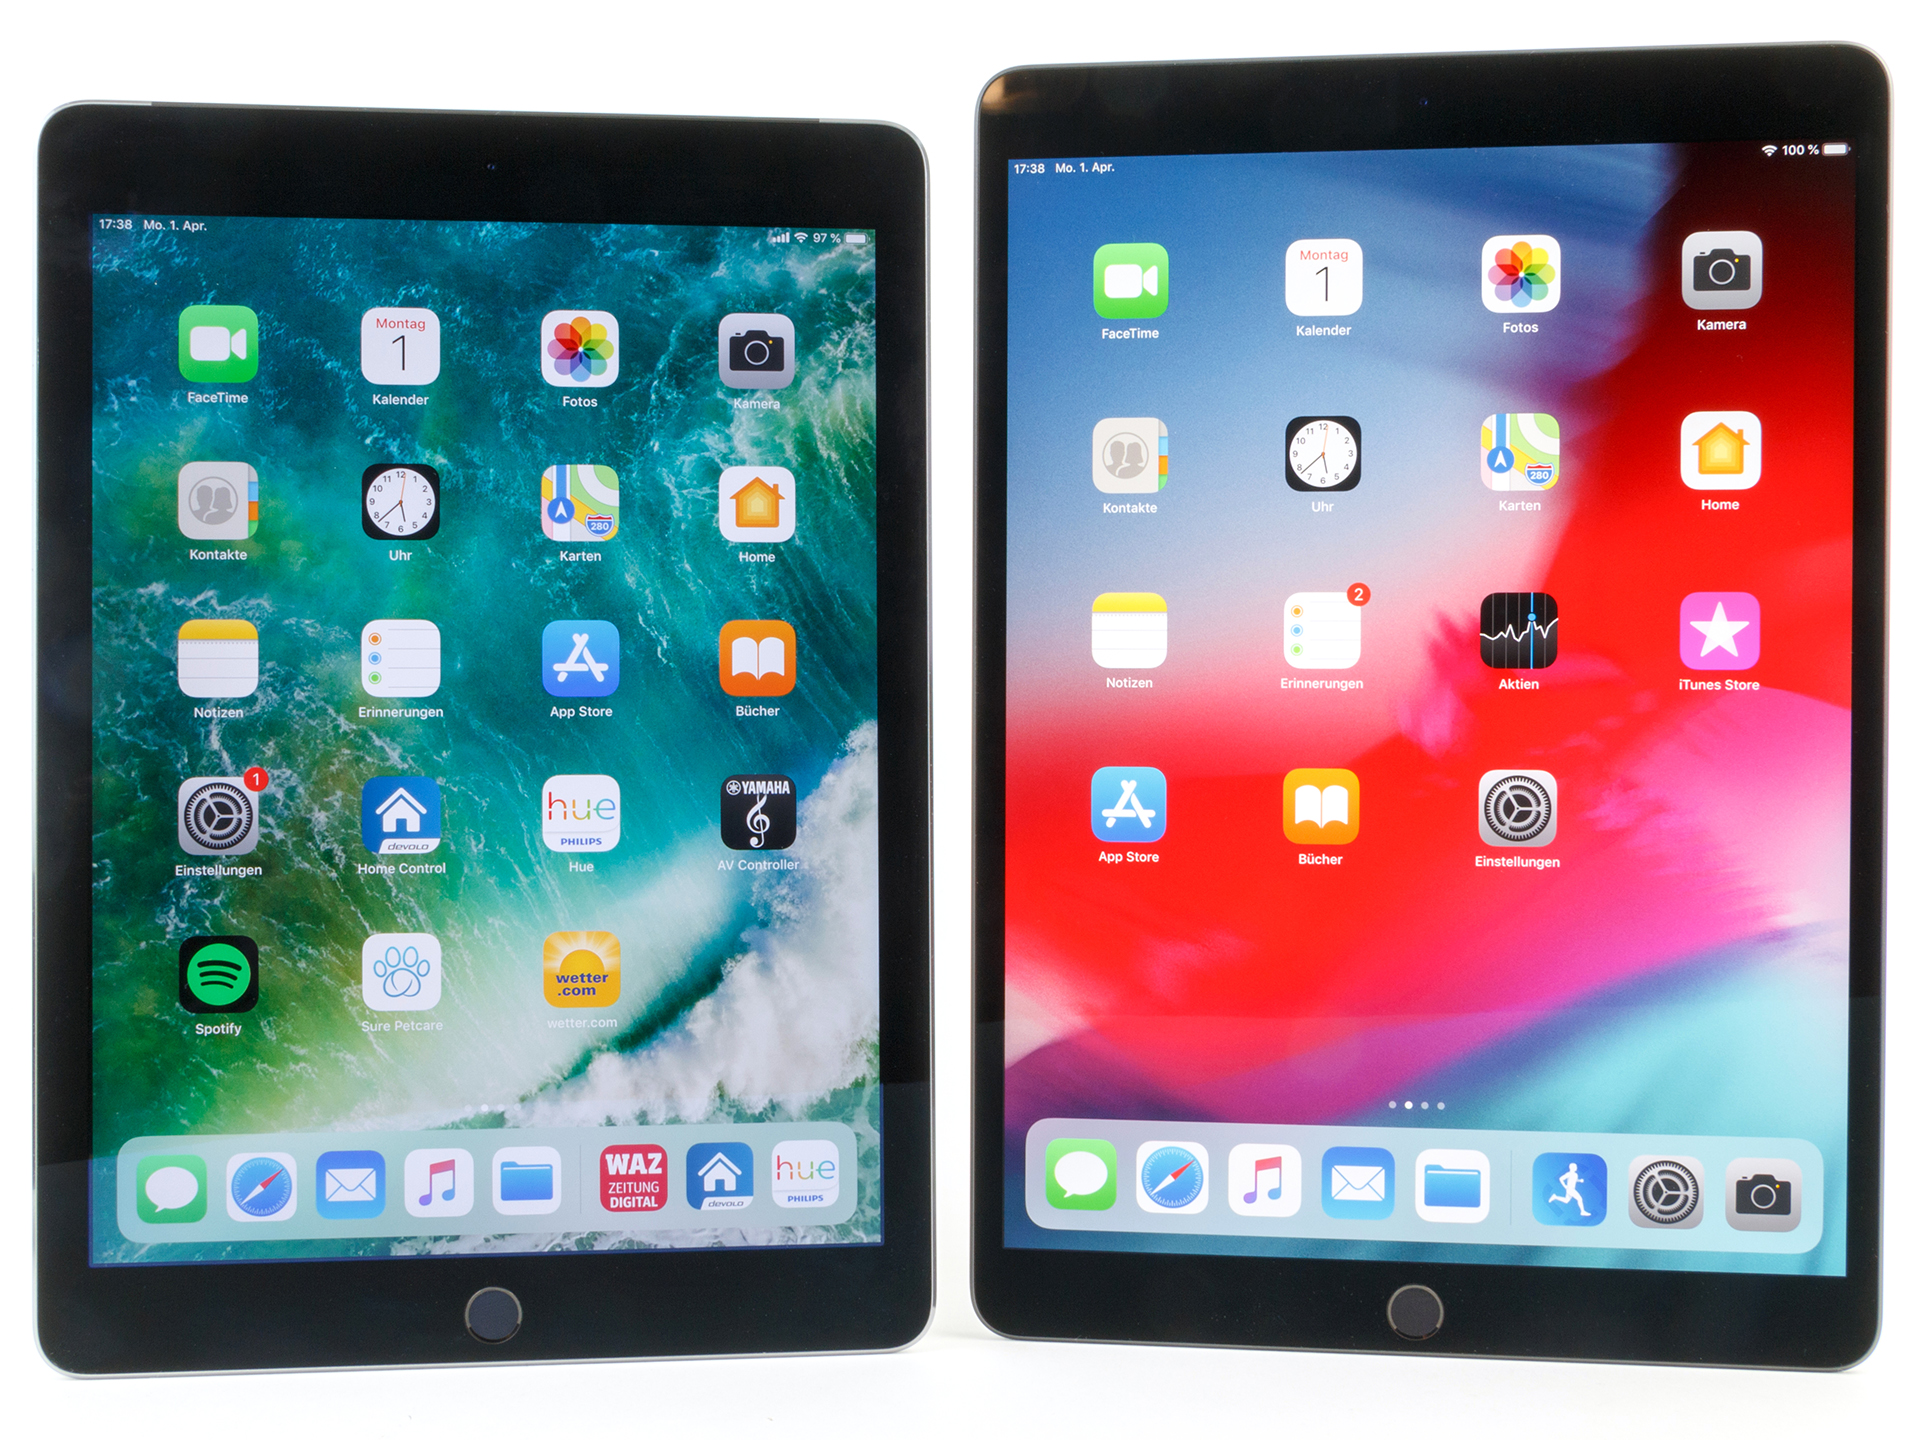
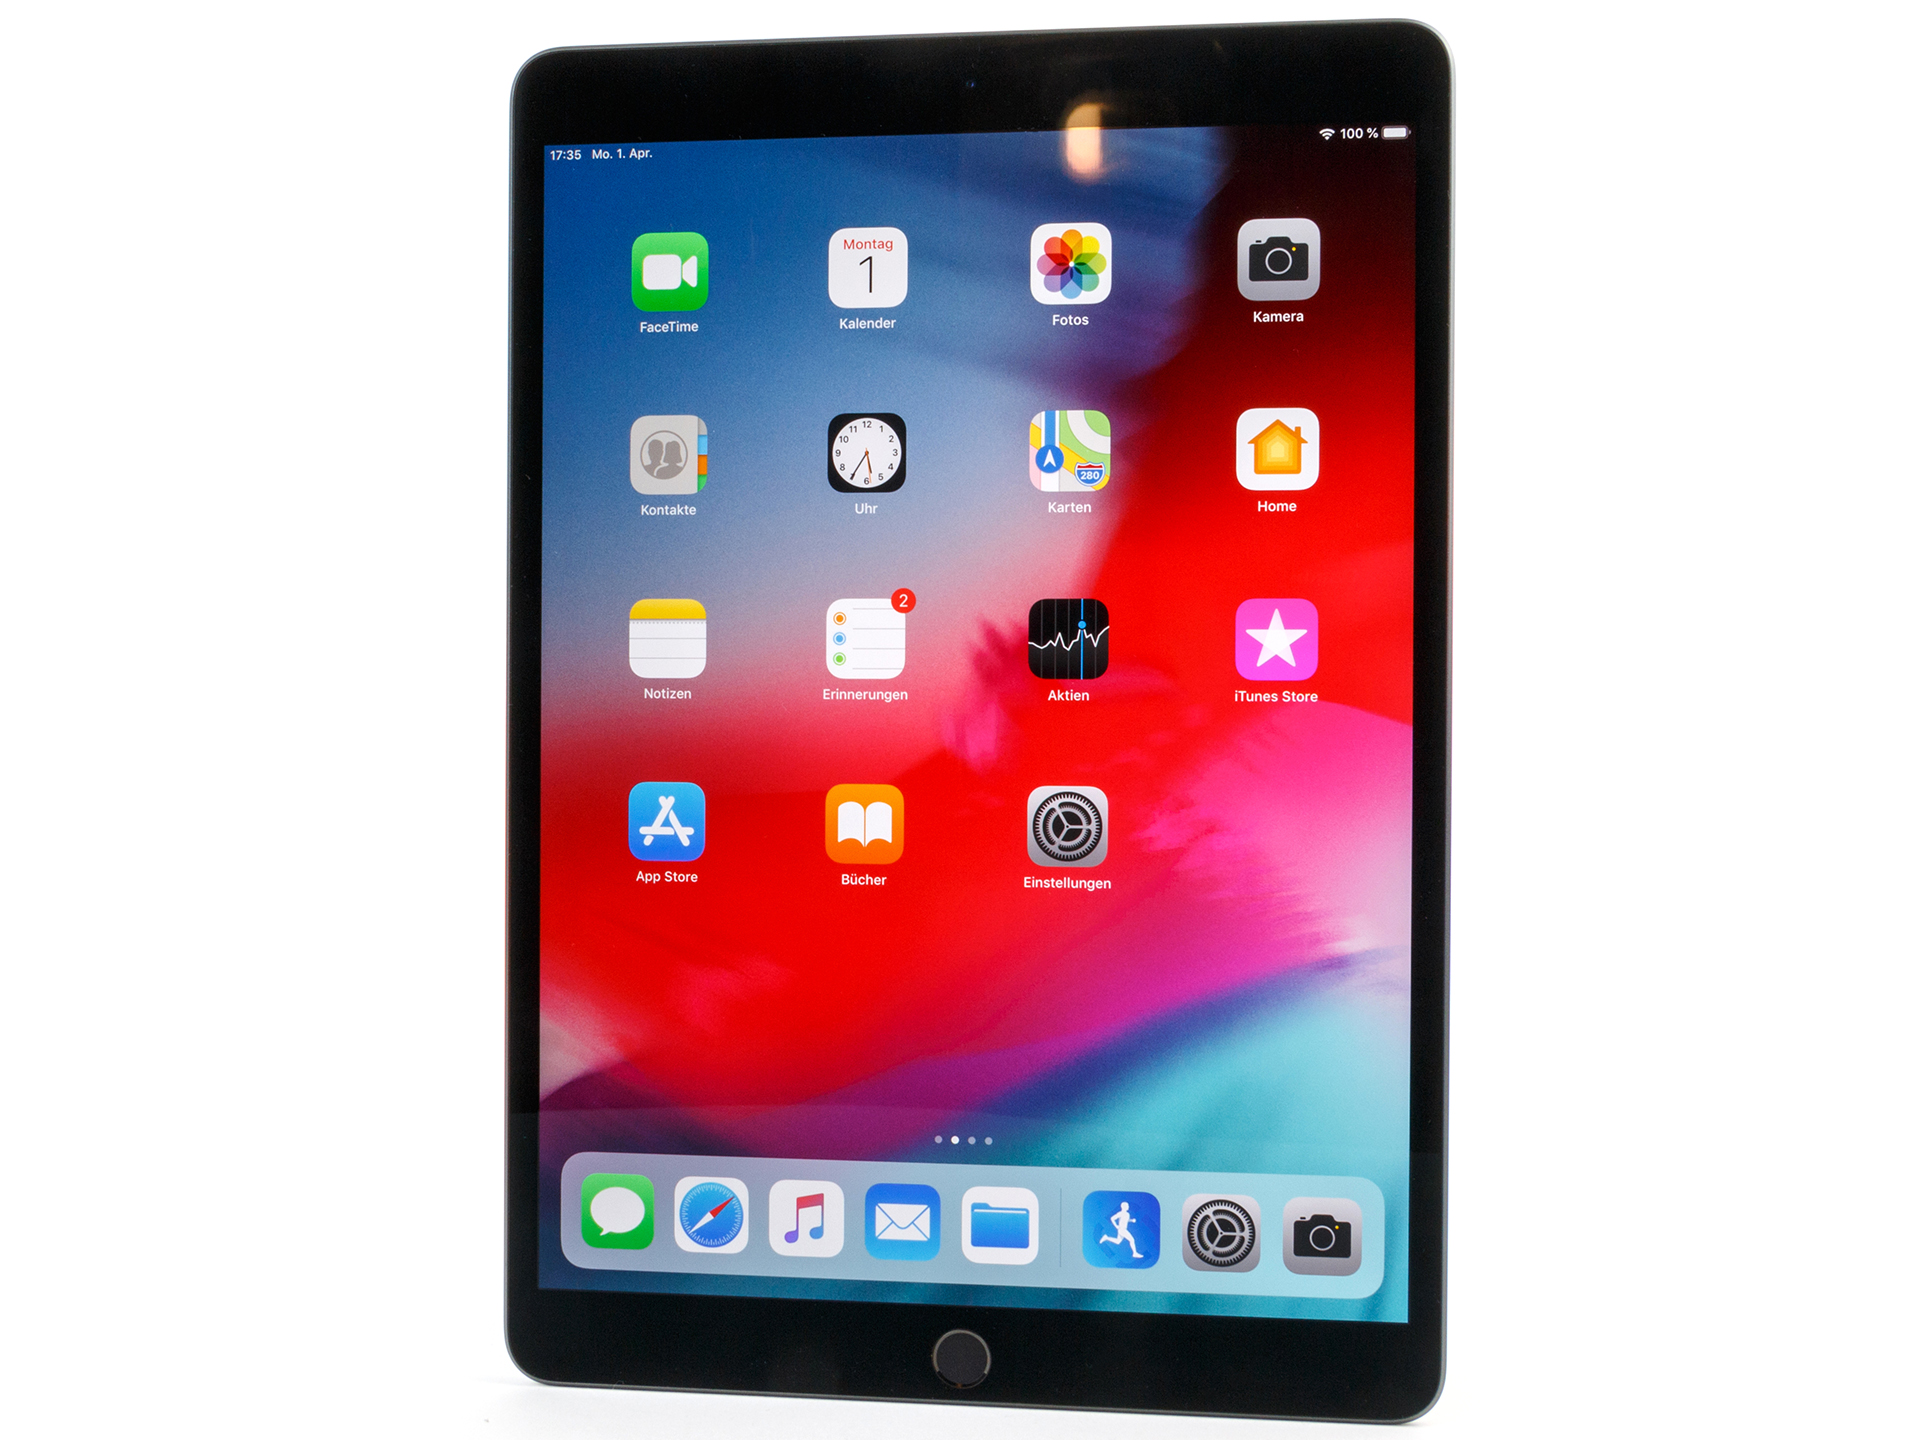
The Apple iPad Air (2019) is available in three color variants: silver, space gray, and gold. Externally it is almost a twin of the iPad Pro 10.5 and can only be distinguished by the missing speaker grills on the top edge and the lack of a camera hump, since the camera of the iPad Air is flush with the aluminum case. In terms of the lack of design elements compared to the 2017 Pro model, it reminds more of the Air 2, but it has a better display-to-surface ratio and a larger panel, giving it more display area.
The quality of the workmanship is very good. Due to the unibody design, there are hardly any transitions between materials and the tablet really feels great in the hands. Unfortunately, the aluminum and the glass surface turn out to be fingerprint magnets. Despite the grease-repellent coating, these surfaces are hard to clean. The gaps between the materials of the iPad Air 3 are very tight and even. When trying to twist it, the Apple tablet creaks easily, and pressure on the IPS display results in some slight wave-forming. Even some powerful pressure on the back can bring the same result. While the latter is rather unlikely in everyday operation, holding the iPad by the panel frame can actually result in some wave-forming on the screen.
The battery of the tablet is built-in and cannot be replaced by the user. In addition, there is no protection against dust or water.
Connections - Lightning instead of USB-C
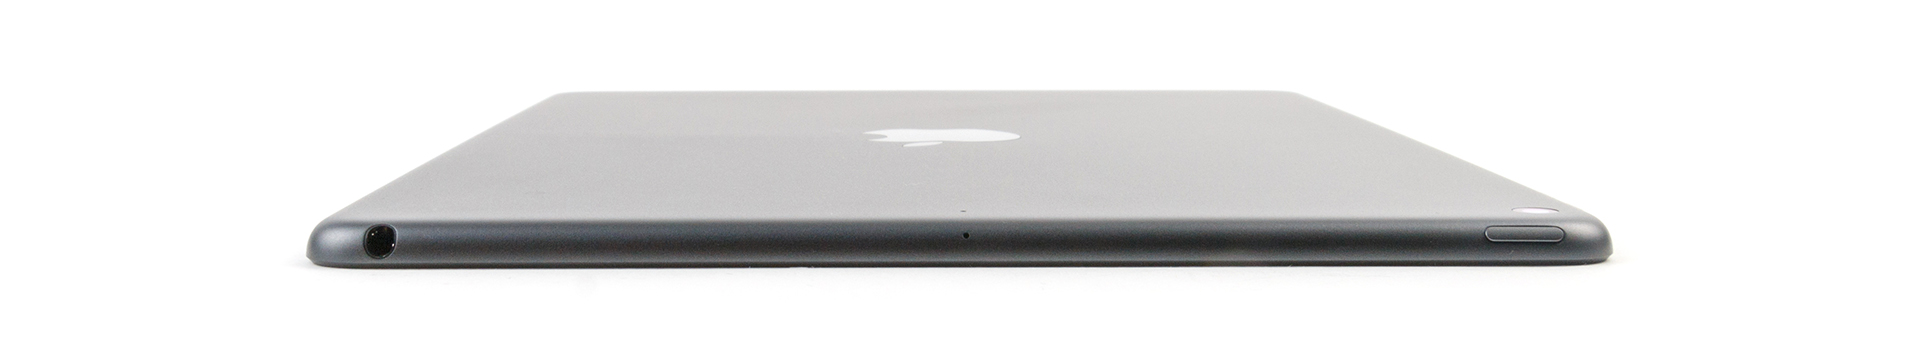
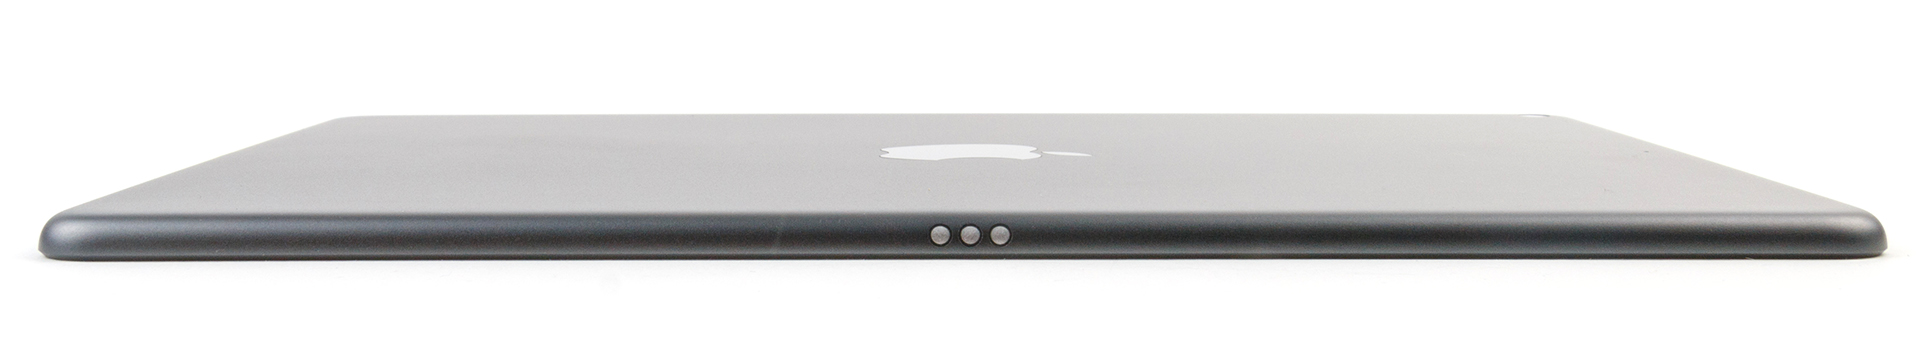
In contrast to the new Pro models, the iPad Air (2019) does not offer a USB-C connection but continues to have a Lightning port, which with the optional corresponding adapters can also support USB, HDMI, or card readers. While the display can also be operated by the first generation of the Apple Pencil, this is not included. You can also connect an optional keyboard cover via the Smart Connector.
While the iPad Air does not offer NFC, Bluetooth 5.0 is on board, and there also continues to be a full audio port (3.5 mm).
Software - The usual fare in the iPad Air
At the time of our test, the current iOS 12.2 is installed on the Apple iPad Air (2019), and due to Apple's exemplary update policy and the modern SoC, there should also be regular updates in the coming years.
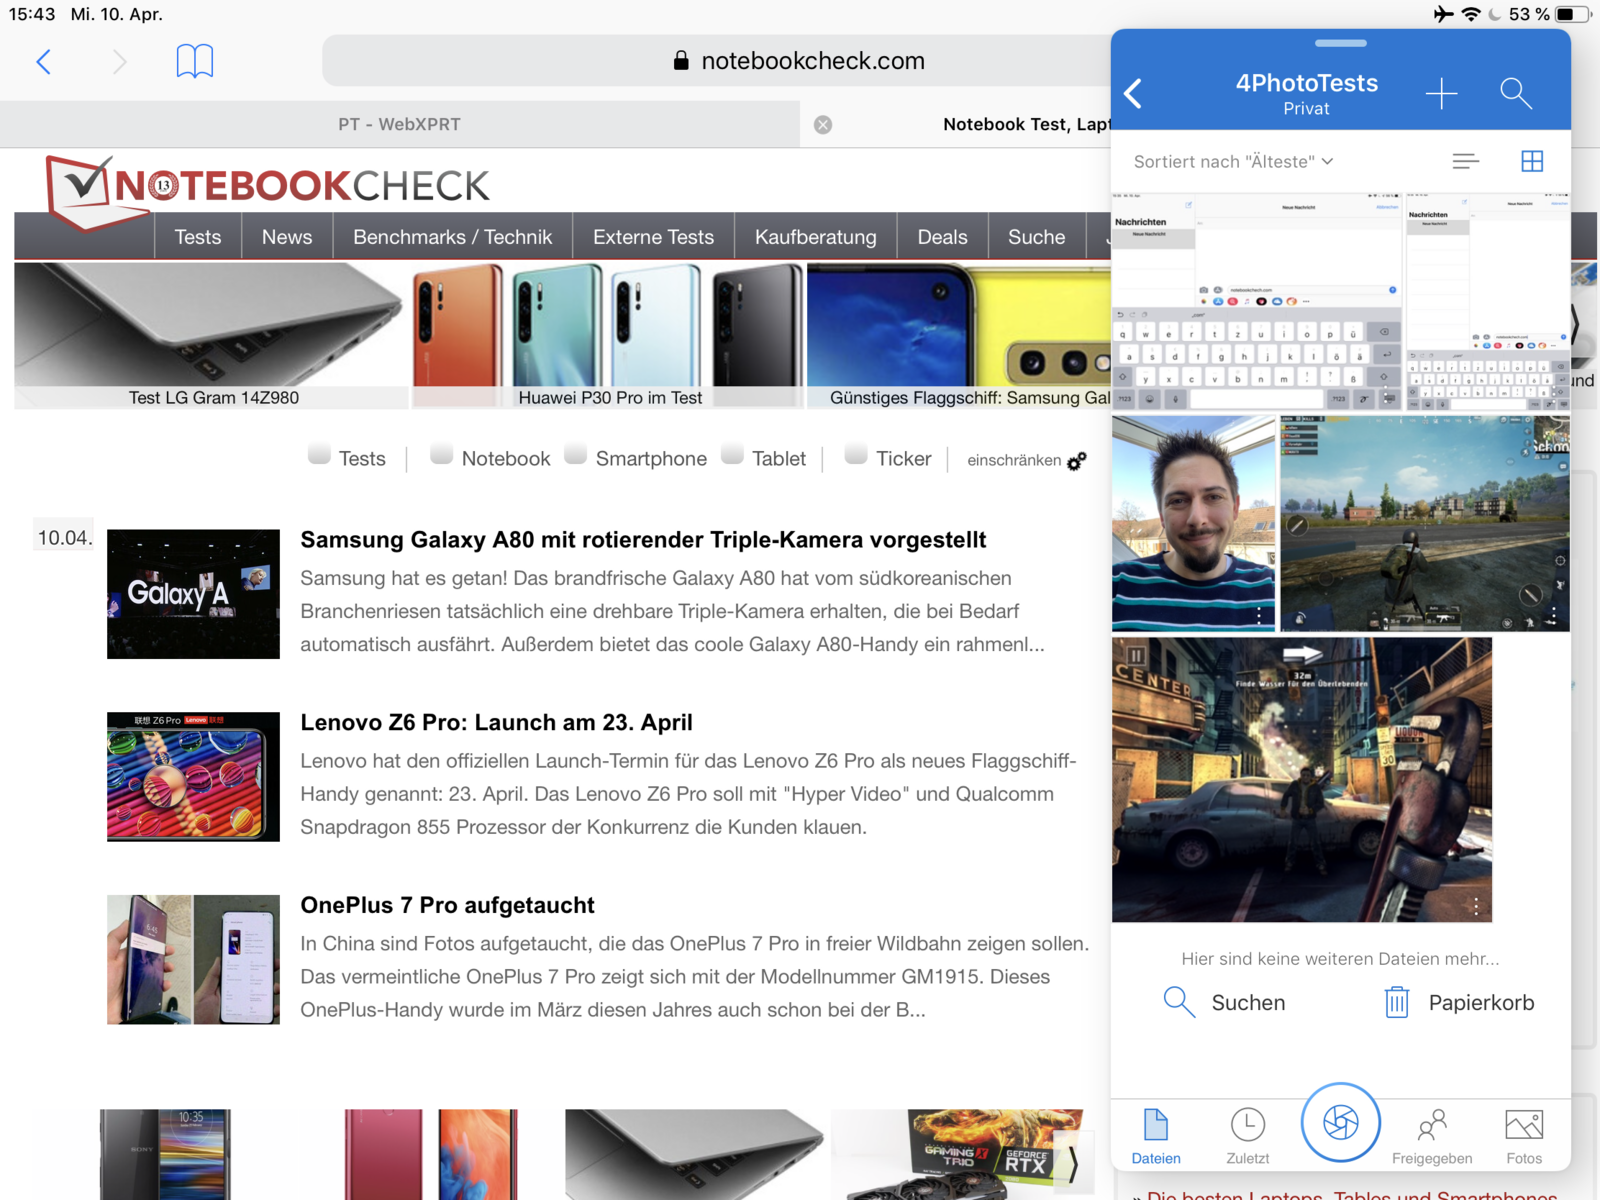
Like all the other Apple tablets, the iPad Air also offers multitasking, which works well in our test and only rarely causes some smaller stutters. On the other hand, the scaling of the operating system continues to leave a lot to be desired.
Communication and GPS - Fast WLAN in the iPad
The Apple iPad Air (2019) supports Wi-Fi 5 (IEEE-802.11a, b, g, n, ac) with MIMO antenna technology and thus uses the 2.4 as well as the 5.0 GHz networks. As the test with our Linksys EA8500 reference router shows, the transfer rates are at a very good level. The range is also good, and we were still able to maintain a stable connection across two floors, enabling us to surf the web quickly.
Optionally, the iPad Air is also available with LTE. With the tablet, users can then access mobile Internet at up to 1 Gb/s. The frequency band coverage is also very good and should be able to create a data connection in most countries of the world. In addition to the conventional nano-SIM slot, the LTE model also offers the option to use an eSIM.
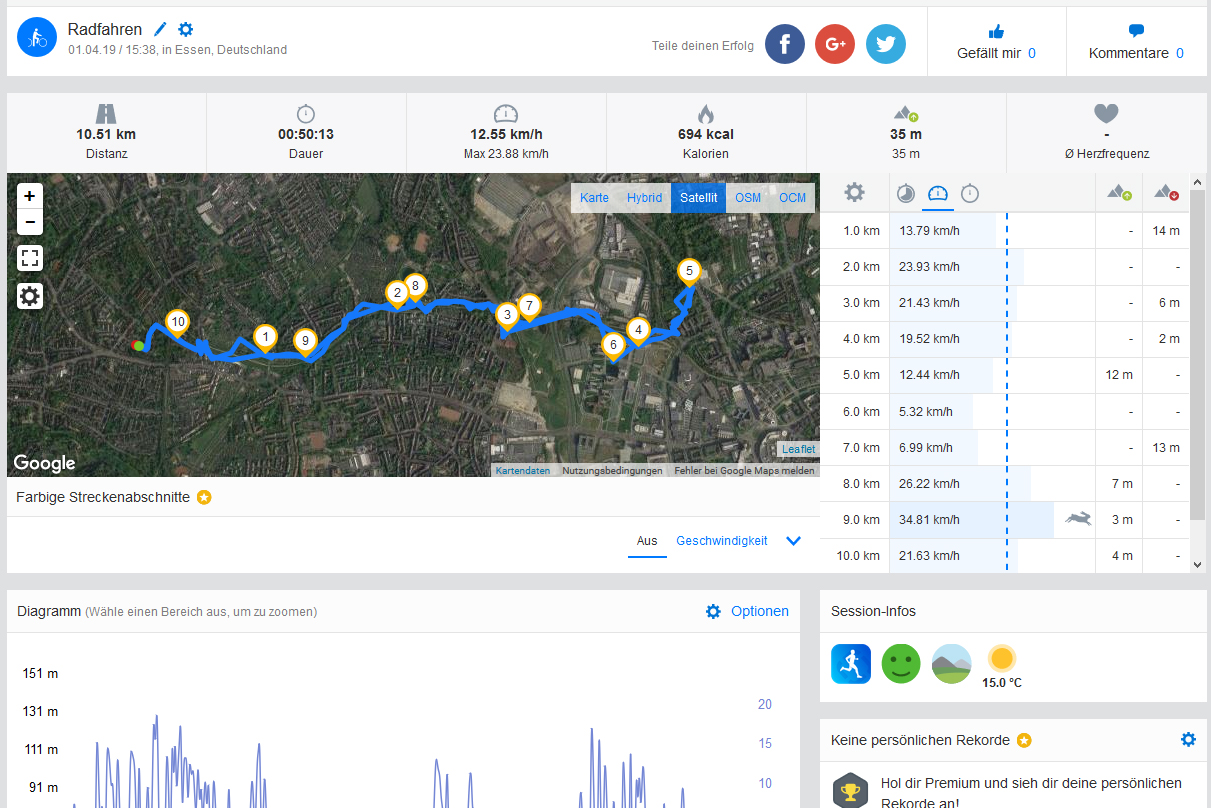
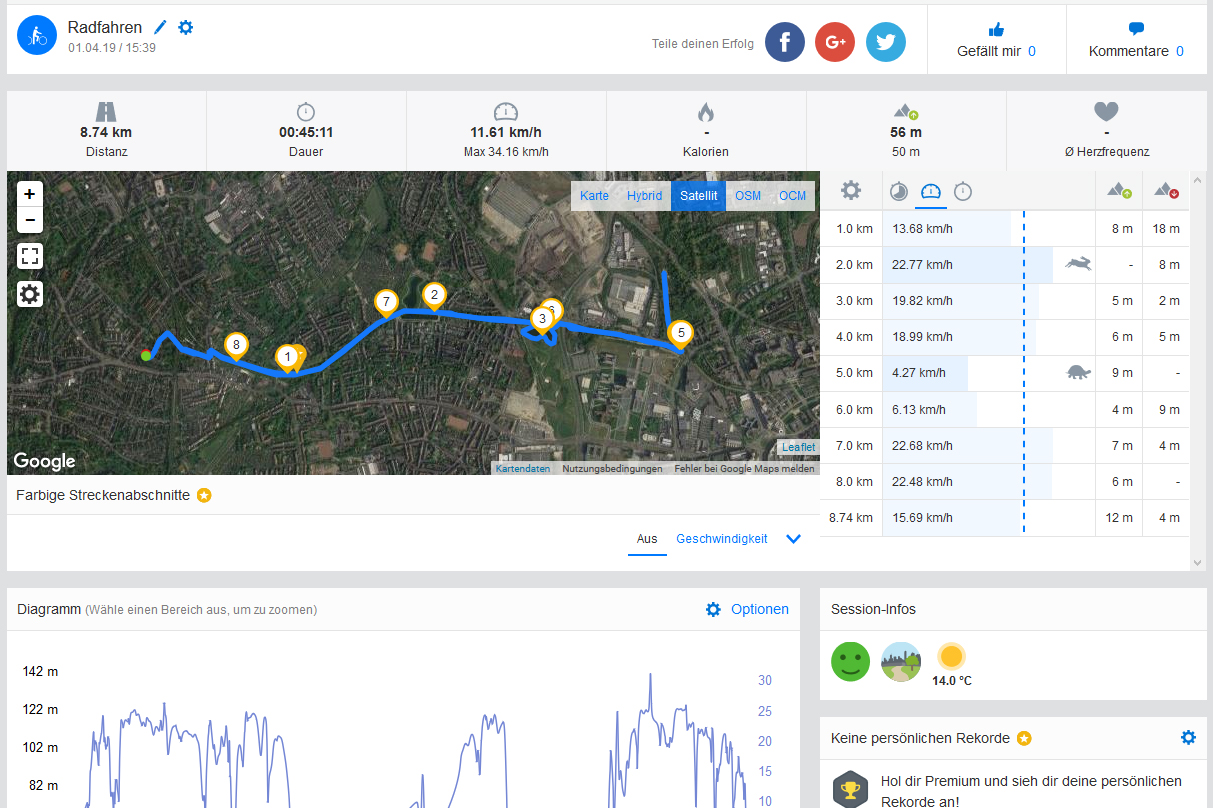
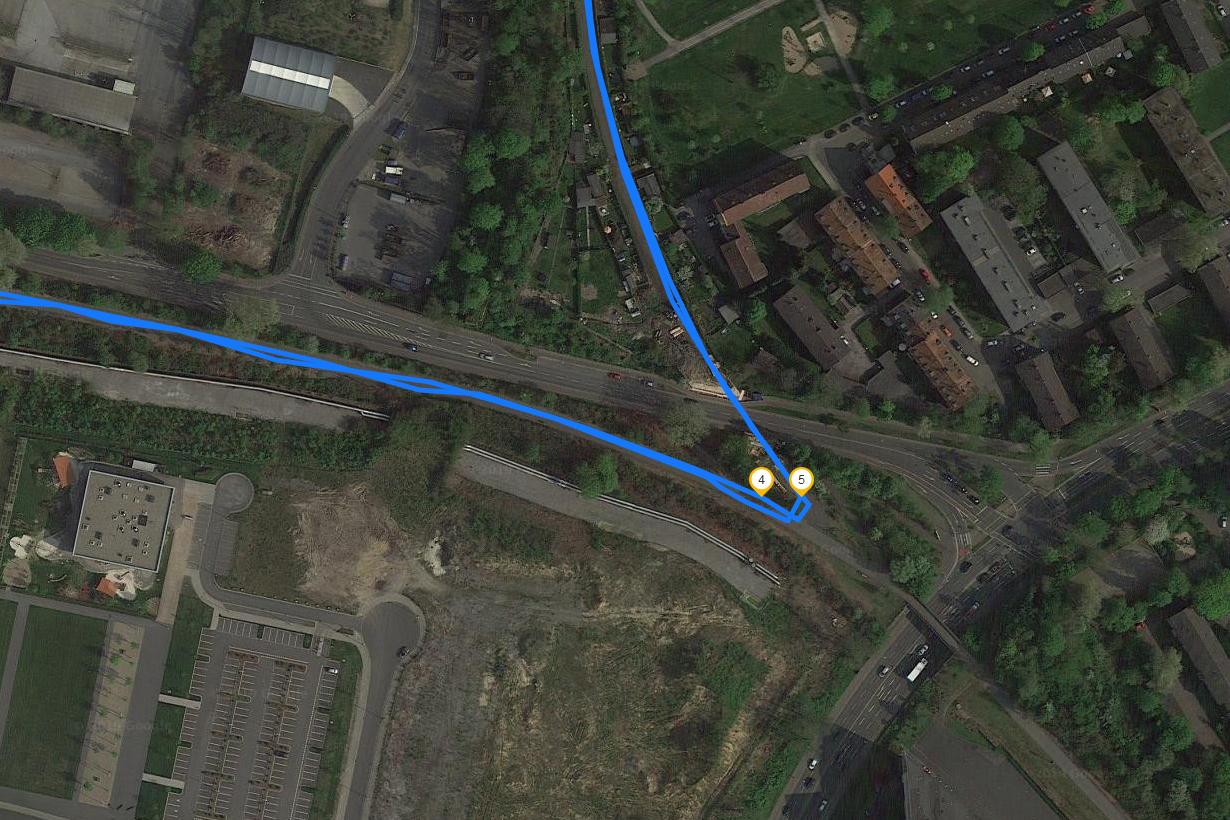
A-GPS and Glonass support are also limited to the model with the modem, so that when you have the pure Wi-Fi model as in our test unit, the tablet can only determine its location by using the digital compass, iBeacon micro-locating, and available WLAN networks. But we still tried it, and it clearly showed that this is not an option that is really workable for the road.
Cameras - Not modern but still usable

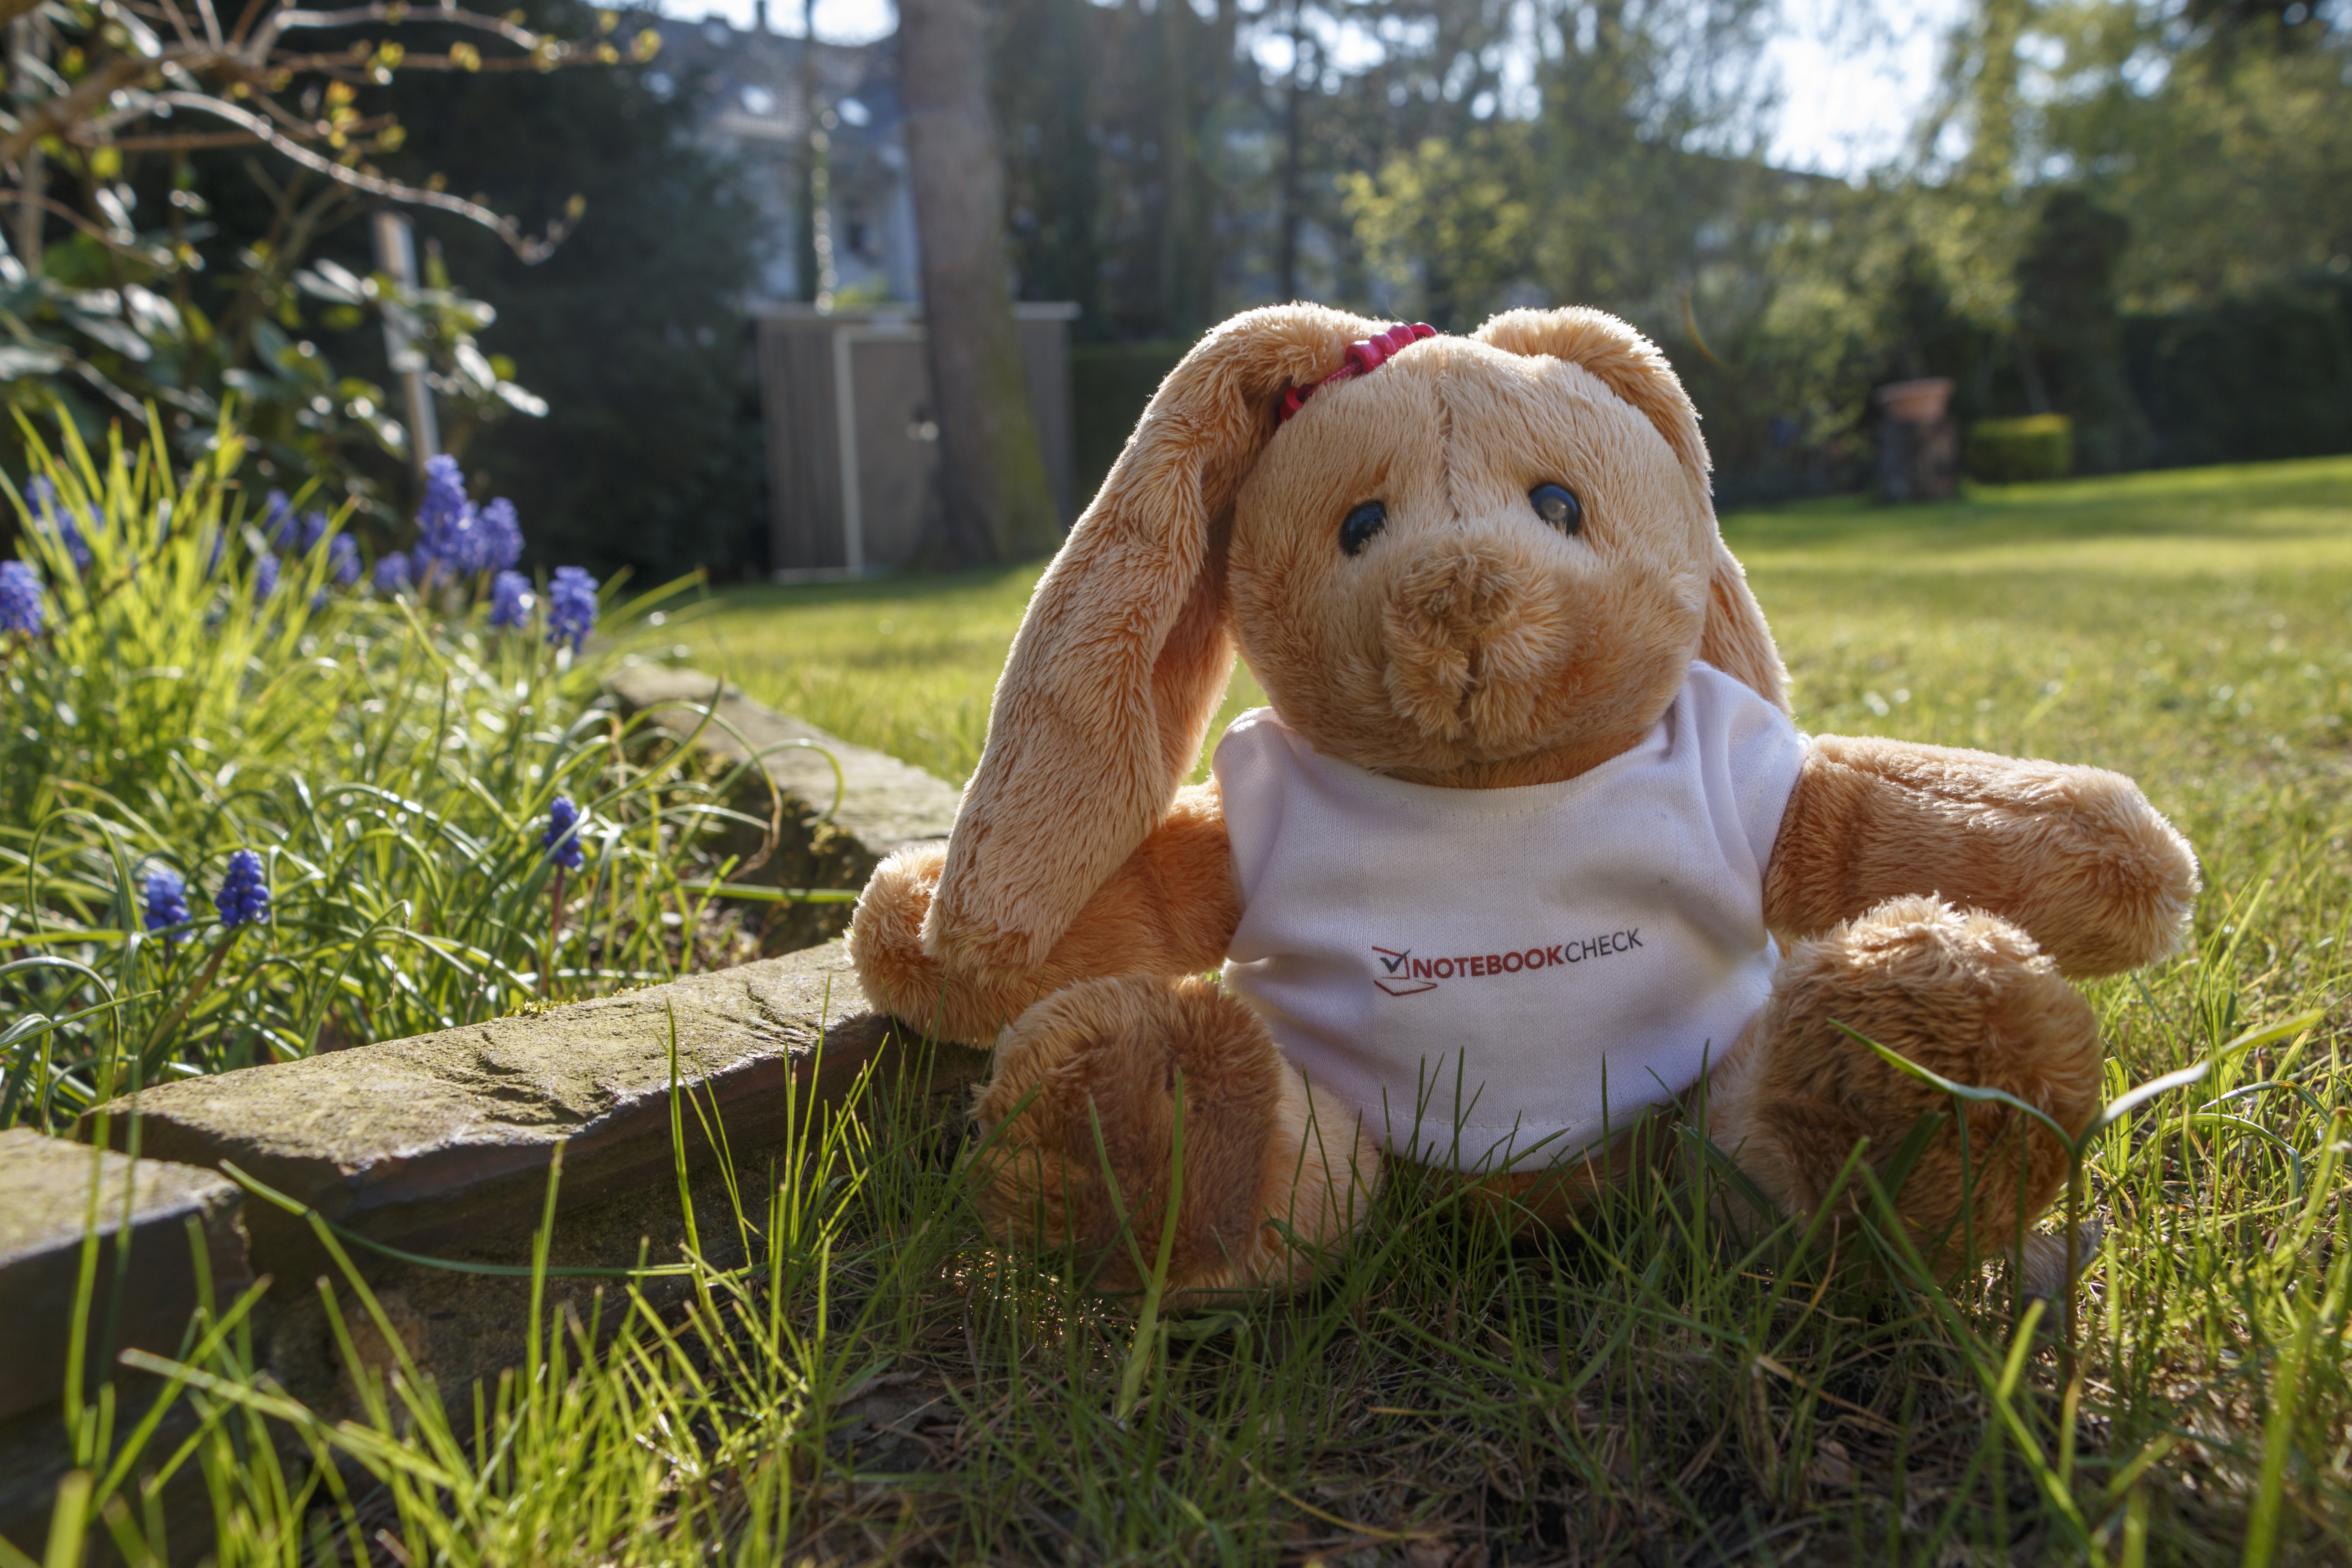
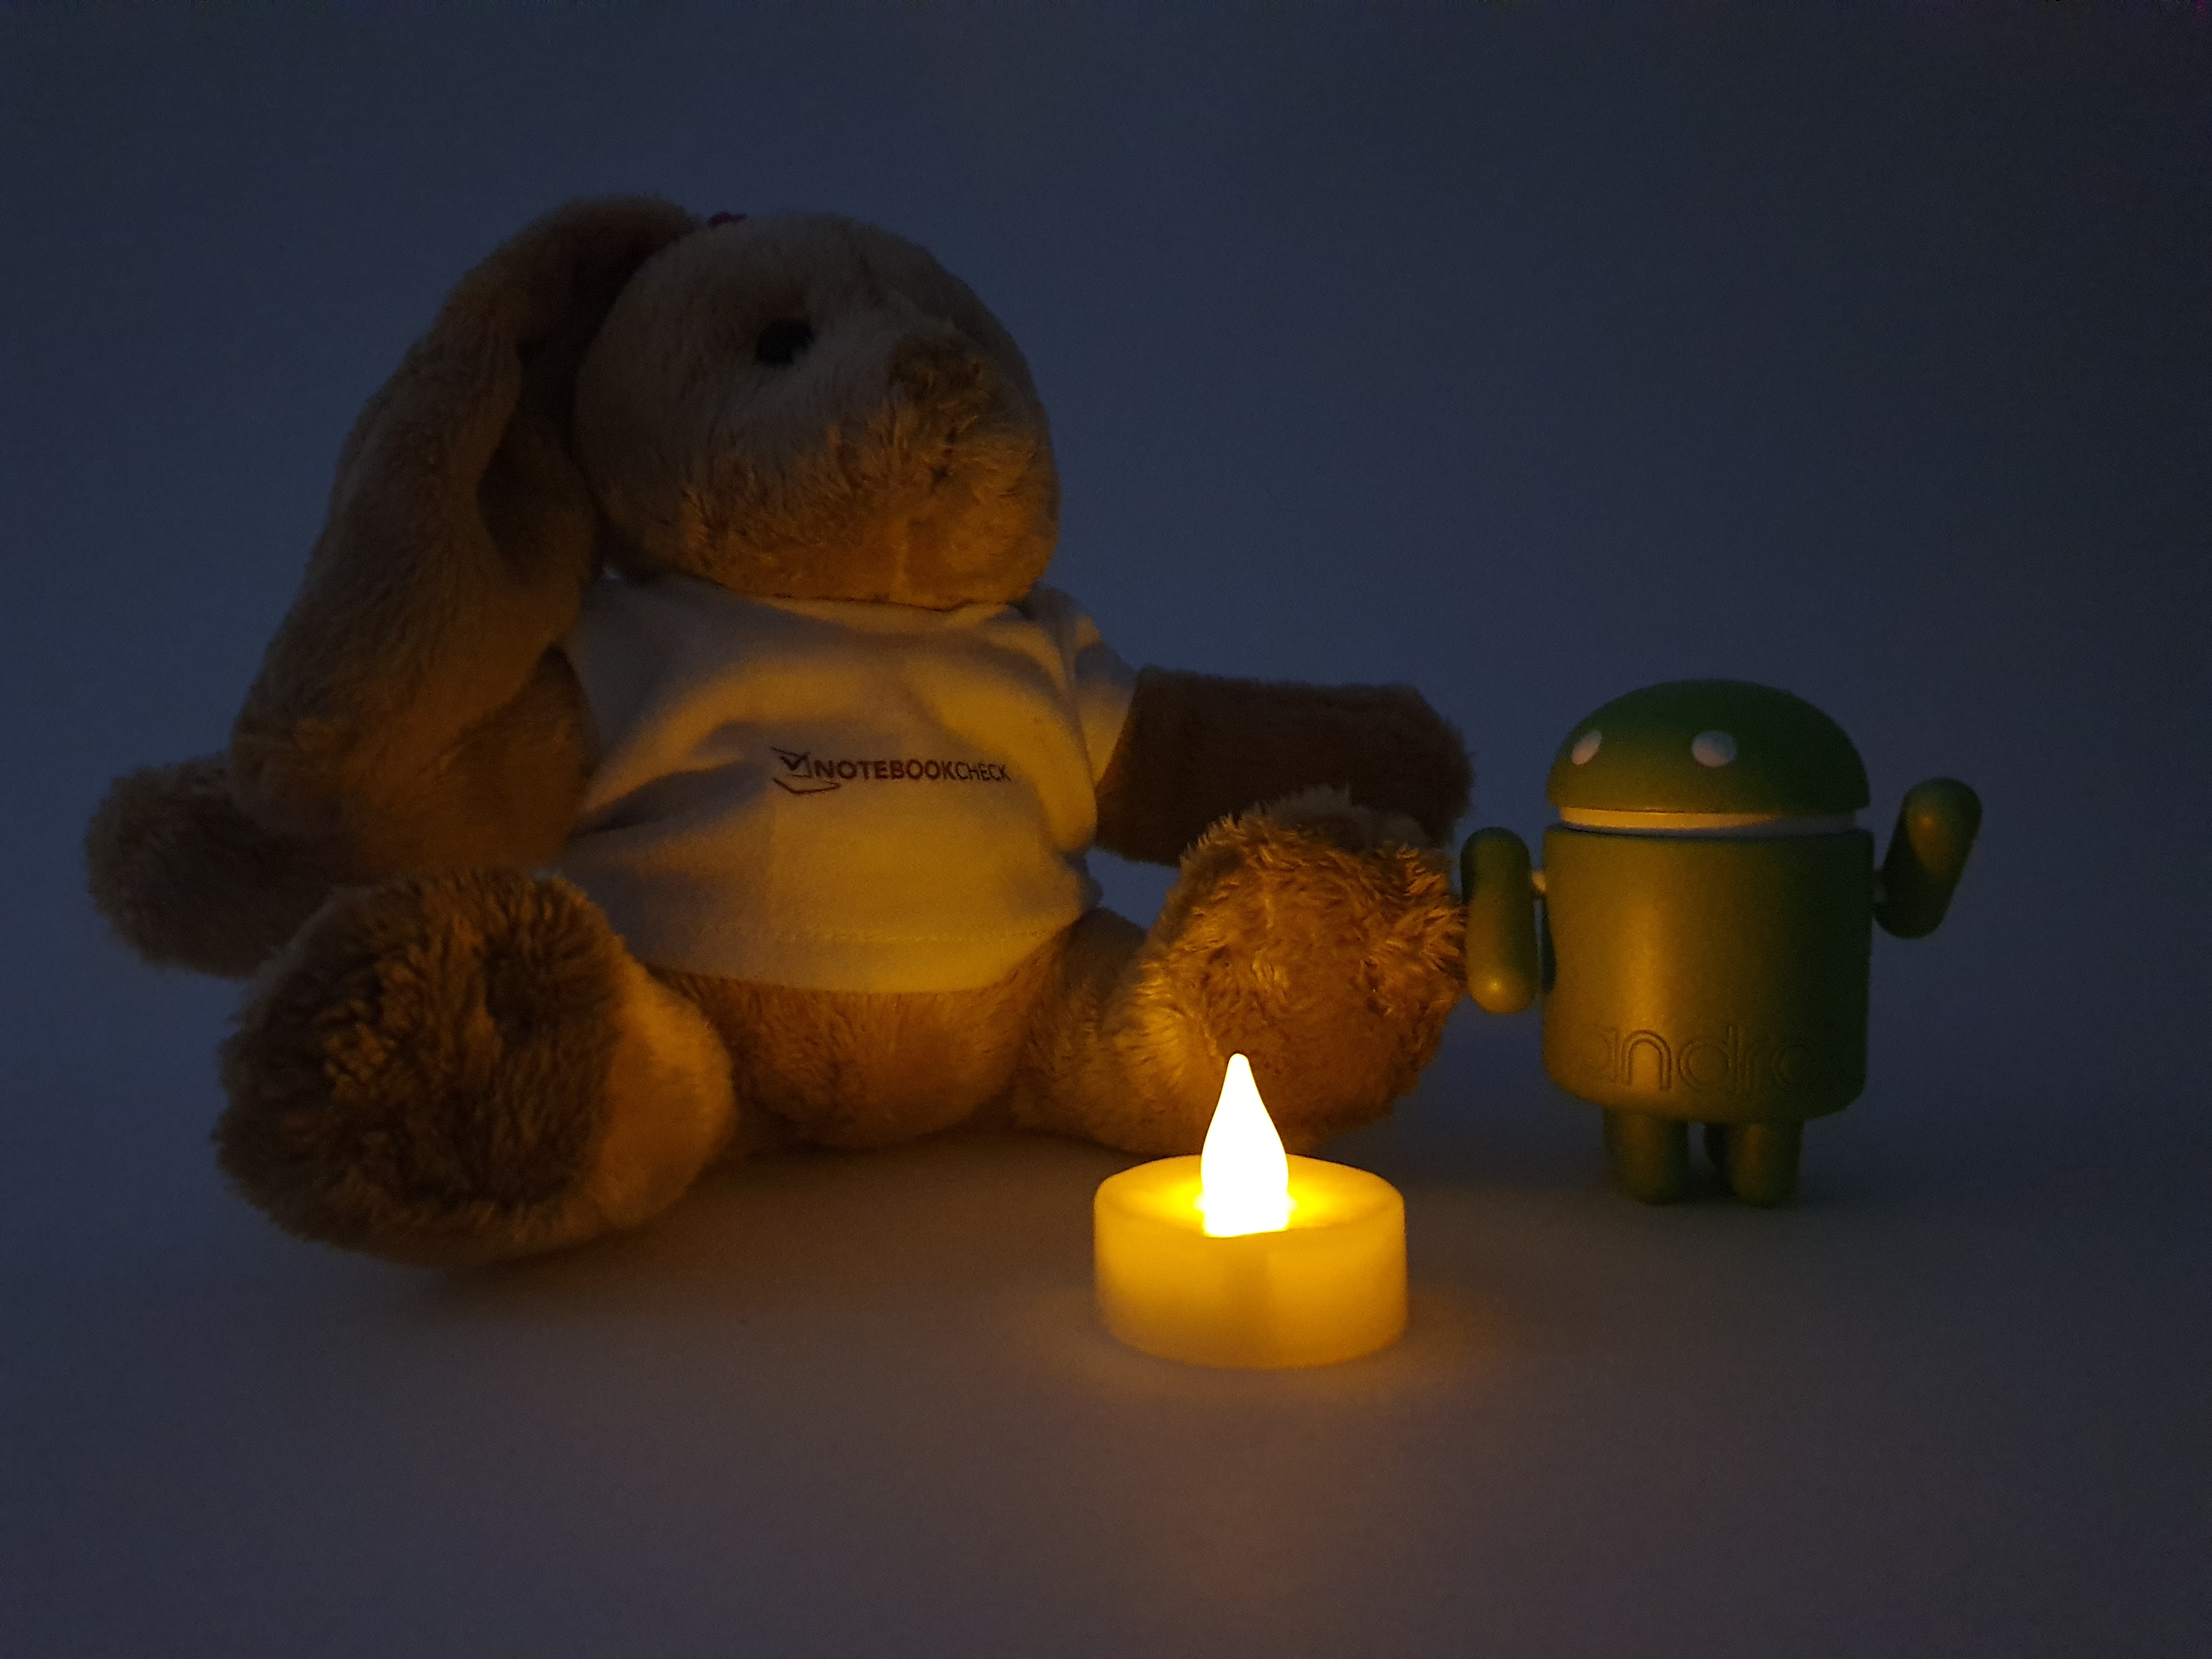
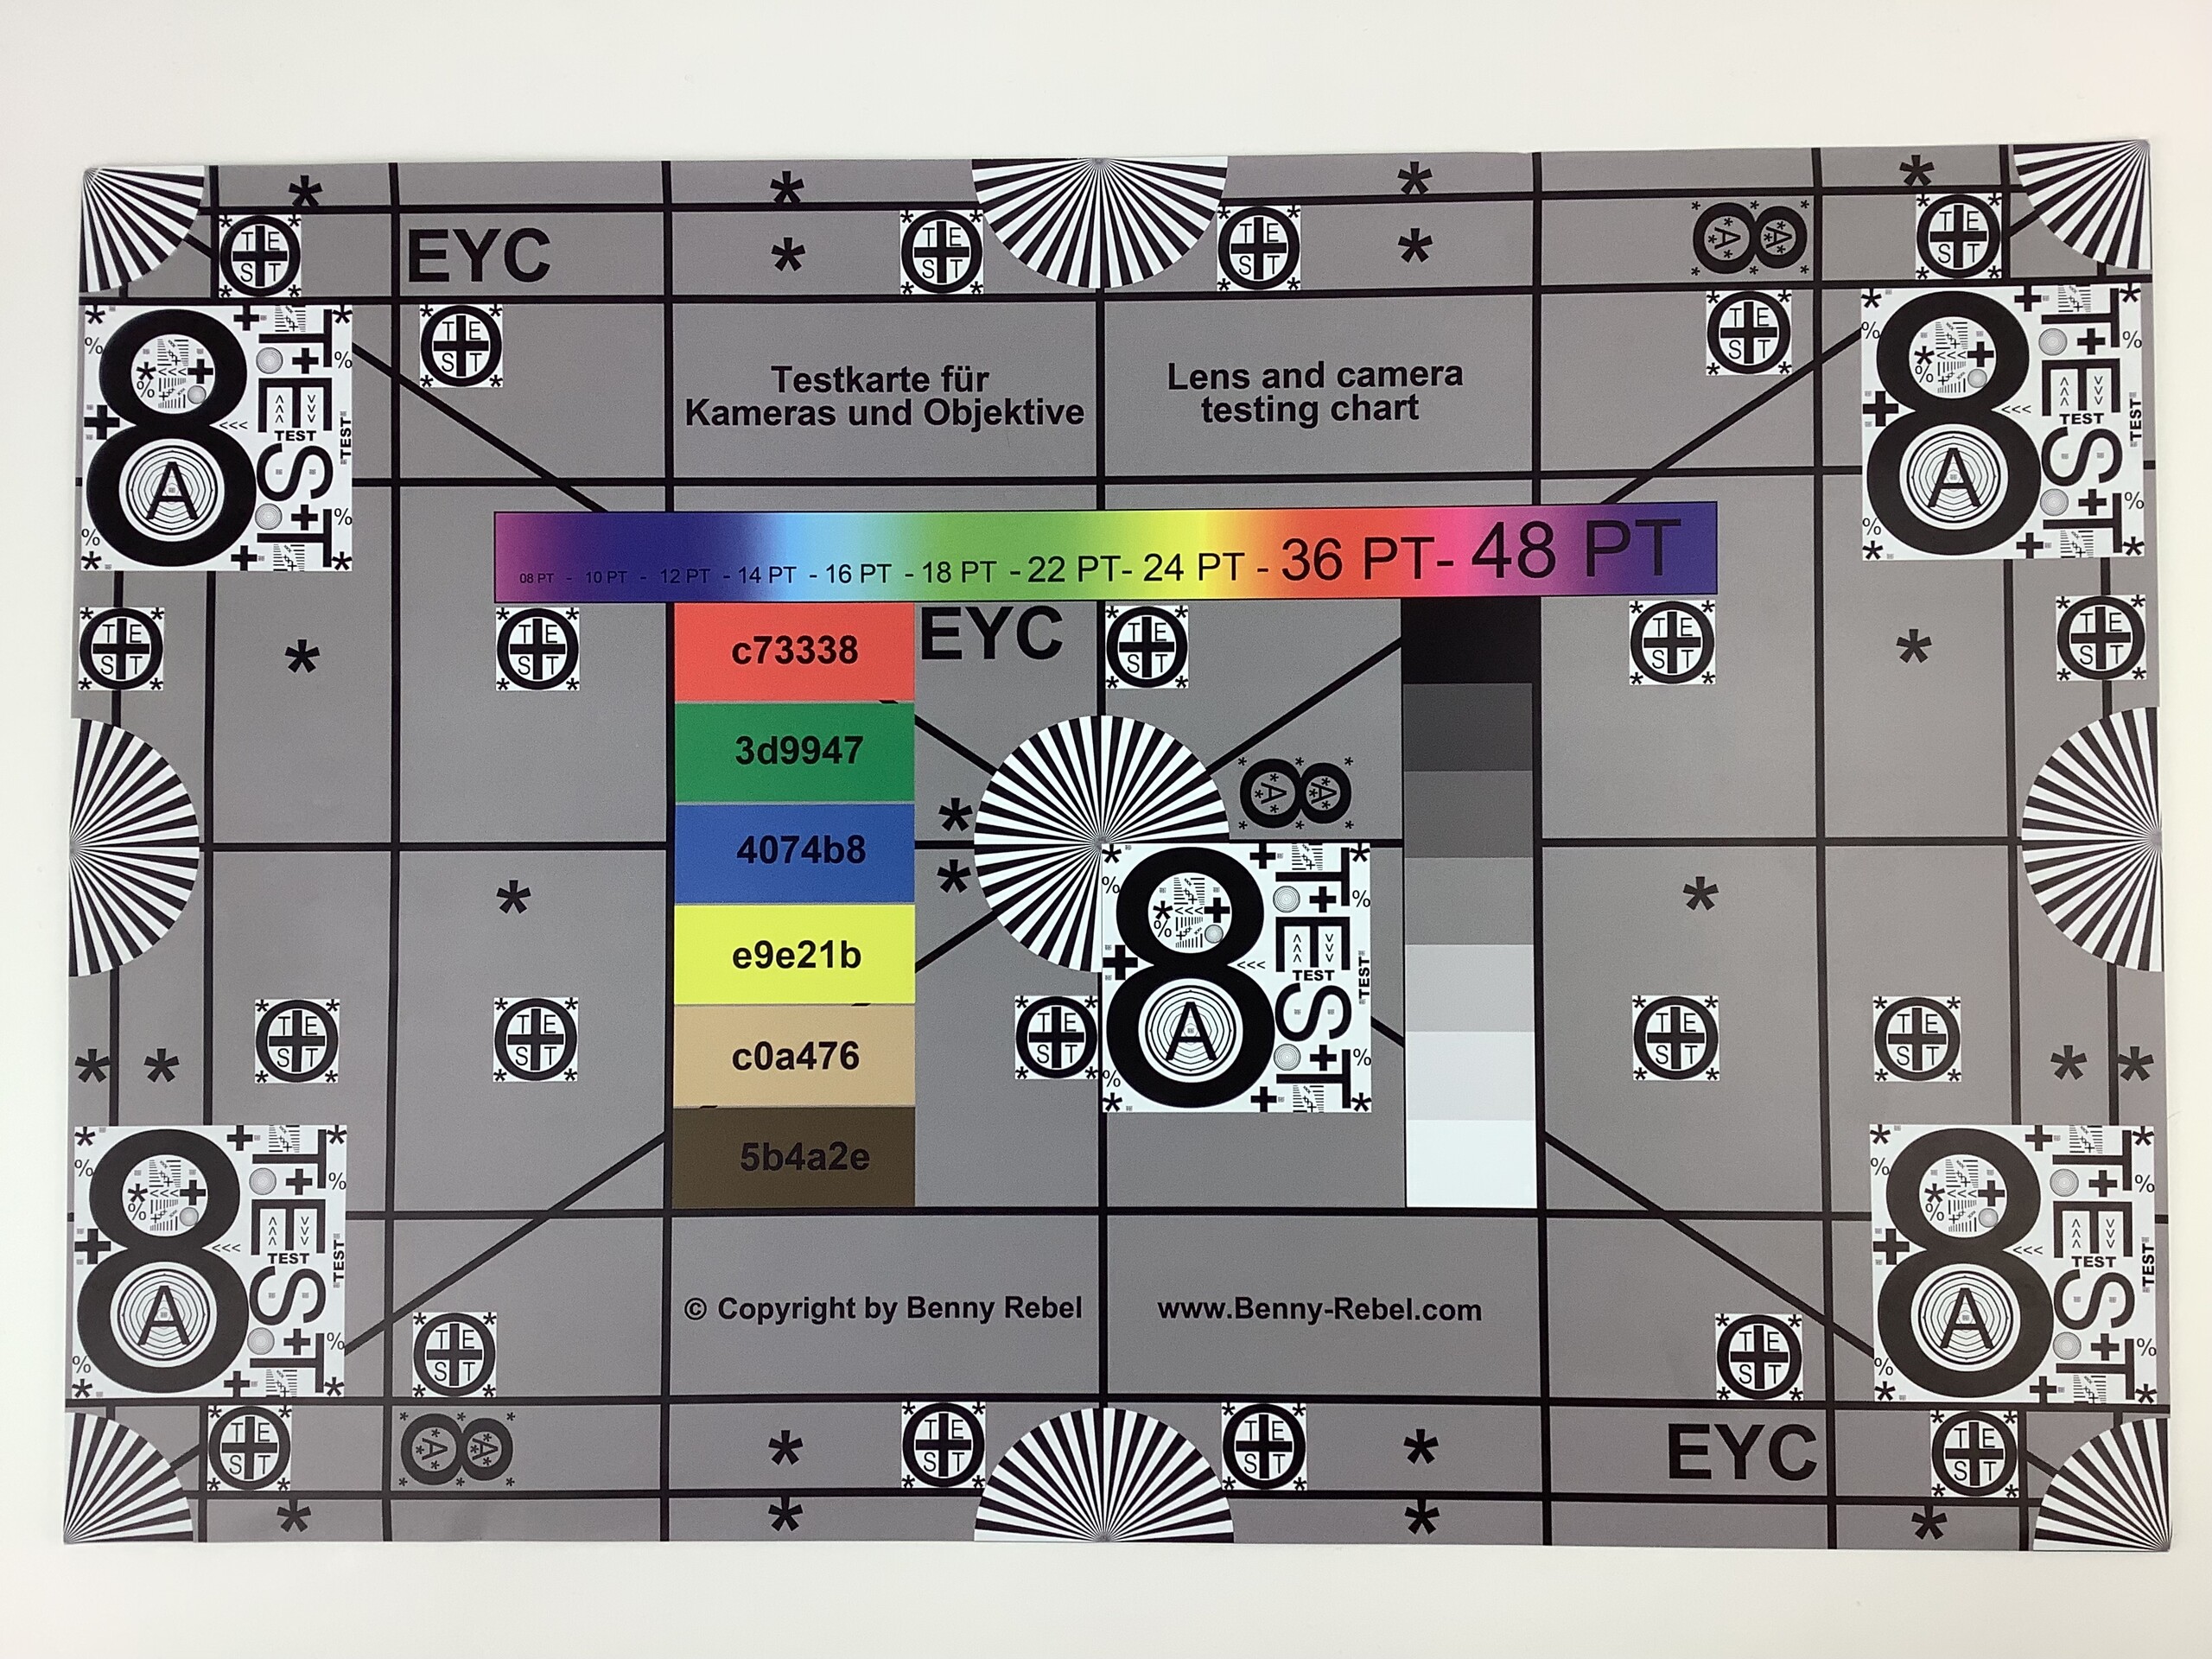
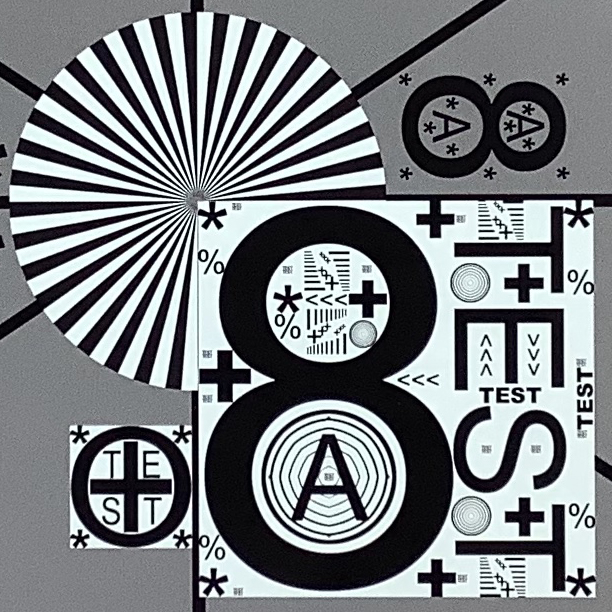
Like all the other current tablets from Apple, the iPad Air (2019) also uses a 7 MP camera (f/2.2) in front. However, it does not have a TrueDepth sensor, so that you have to make do without functions such as the portrait mode, Animoji, and Memoji. During the day, the recordings are fairly good, even if the auto-HDR function does not always work reliably.
The main camera appears to be identical to that of the iPad (2018) and probably also still comes from the remaining stocks of the iPhone 5S. It was a great camera at the time in 2013 but is far from modern photography according to the current standards. In daylight, the recordings succeed fairly well, offering a balanced image composition. Only in the slightly too poor details or the occasionally pixelated edges, the meager 8 MP becomes obvious. In weak surrounding light, the optics hit their limits and capitulate to darkness.
With both cameras, videos can be recorded in Full HD (1080p, 30 FPS) at best and offer a decent quality in good light conditions.


Accessories and Warranty - Only the absolutely necessary is included
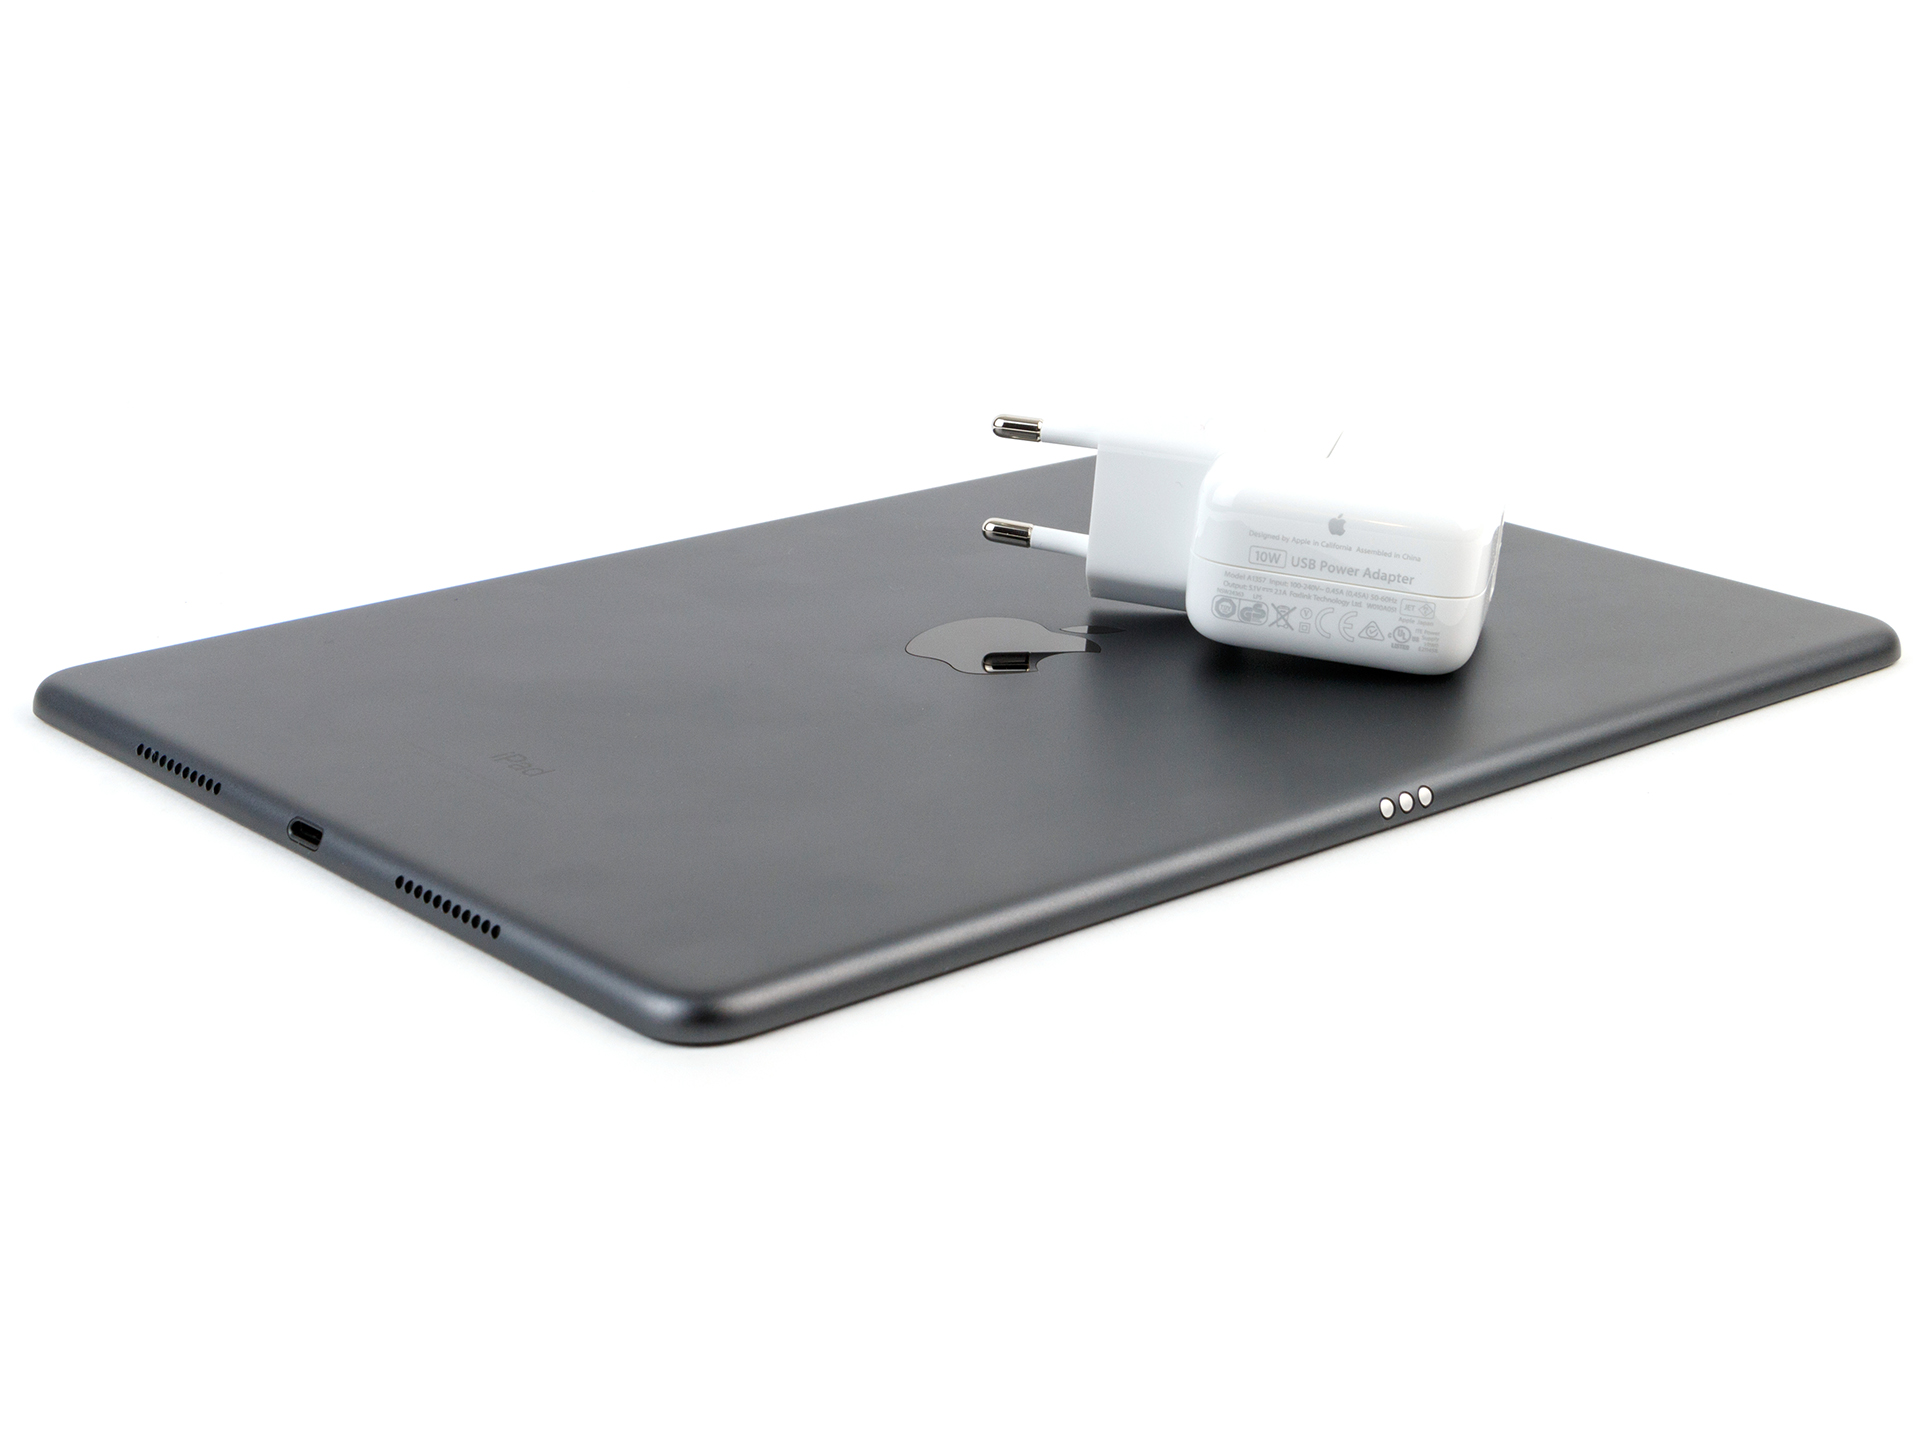
In addition to the tablet itself, the delivery of the Apple iPad Air (2019) only includes a relatively heavy charger (97 grams, 3.4 oz with cable; 5.1 V, 2.1 A) as well as a Lightning cable. The warranty period covers merely 12 months, which does not affect the (German) warranty period required by law.
With Apple Care+, you can order additional technical support and hardware protection, which includes the optional Apple Pencil. The insurance package costs a one-time payment of 79 Euros (~$89). In case of a repair, you have to pay an additional 49 Euro (~$55) flat rate for the iPad Air or 29 Euros (~$33) for the pen.
Ample accessories are available in the Apple Store. Besides the already mentioned Apple Pencil 1 (99 Euros, ~$112), you can also get a keyboard cover (179 Euros, ~$202) or a Smart Cover (55 Euros, ~$62).
Input Devices and Operation - Apple tablet with Touch ID
The capacitive touchscreen of the Apple iPad Air 3 works well as expected and transfers input and touch quickly and reliably. Like the iPad (2018), the newest sprout from Apple's tablet portfolio also supports input with the Apple Pencil. Thanks to the completely laminated display, the writing experience becomes even more natural.
In addition to the onscreen keyboard, the iPad Air now also allows you to connect an optional keyboard. Unfortunately, we had no access to a keyboard during the test, but the quality and typing experience should be similar to those of the older models.
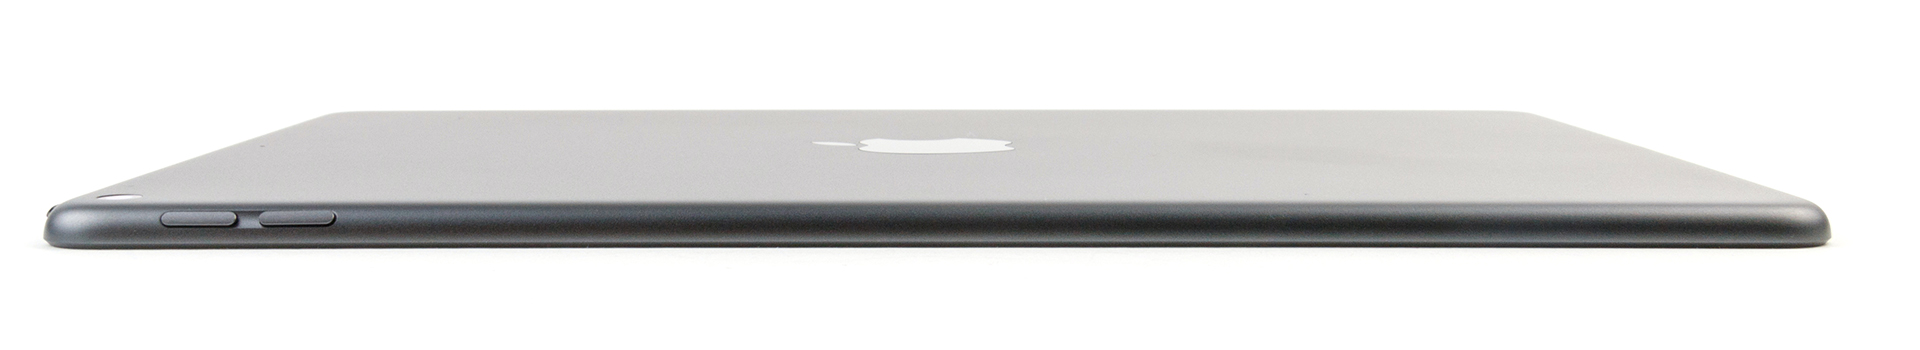
The keys for volume control and the power button sit tightly inside their frames and offer a short and precise stroke. You can also find Touch ID in the iPad Air. Anyone skeptical about Face ID or planning to use the tablet with the whole family should be pleased about this, but from a technical point of view, it is a small step backwards. The fingerprint sensor itself works reliably and unlocks the tablet quickly.
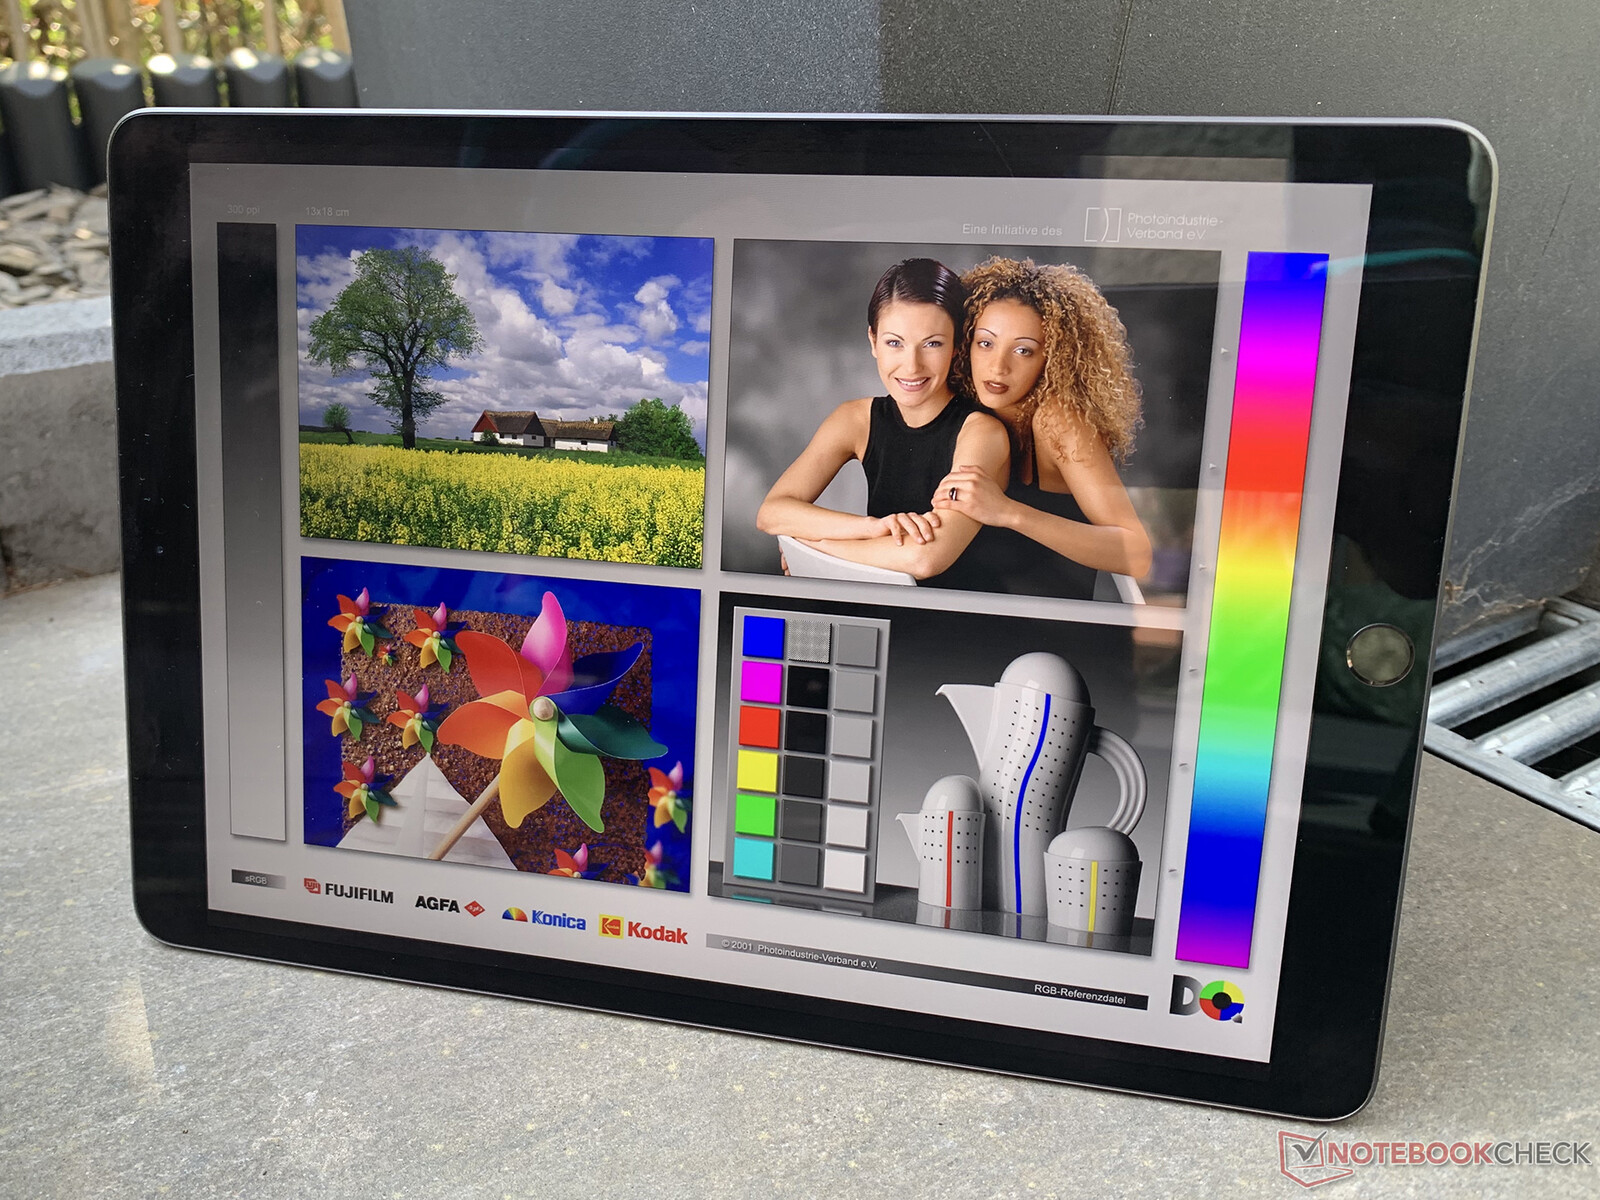
Display - An IPS panel with some minor negative points compared to the Pro model
The Apple iPad Air (2019) has a 10.5-inch IPS display that offers a resolution of 2224x1668 pixels and a good pixel density of 265 ppi. Due to the size and technical specifications, the panel is very similar to that of the iPad Pro 10.5, but we can see some basic differences in our measurements.
In terms of brightness, the iPad Air does not achieve the excellent values of the 2017 model. While it still is at a good level with an average of 483 cd/m², it remains significantly below the Pro 10.5, which offers 625 cd/m². The measurements of our test unit with the brightness sensor activated and an even distribution of bright and dark areas (APL 50) are at a similar level.
Although the iPad Air and the iPad (2018) are at the same brightness level, our test unit turns out significantly darker in the measurement of the black value, which leads to a good contrast ratio.
| |||||||||||||||||||||||||
Brightness Distribution: 90 %
Center on Battery: 515 cd/m²
Contrast: 1256:1 (Black: 0.41 cd/m²)
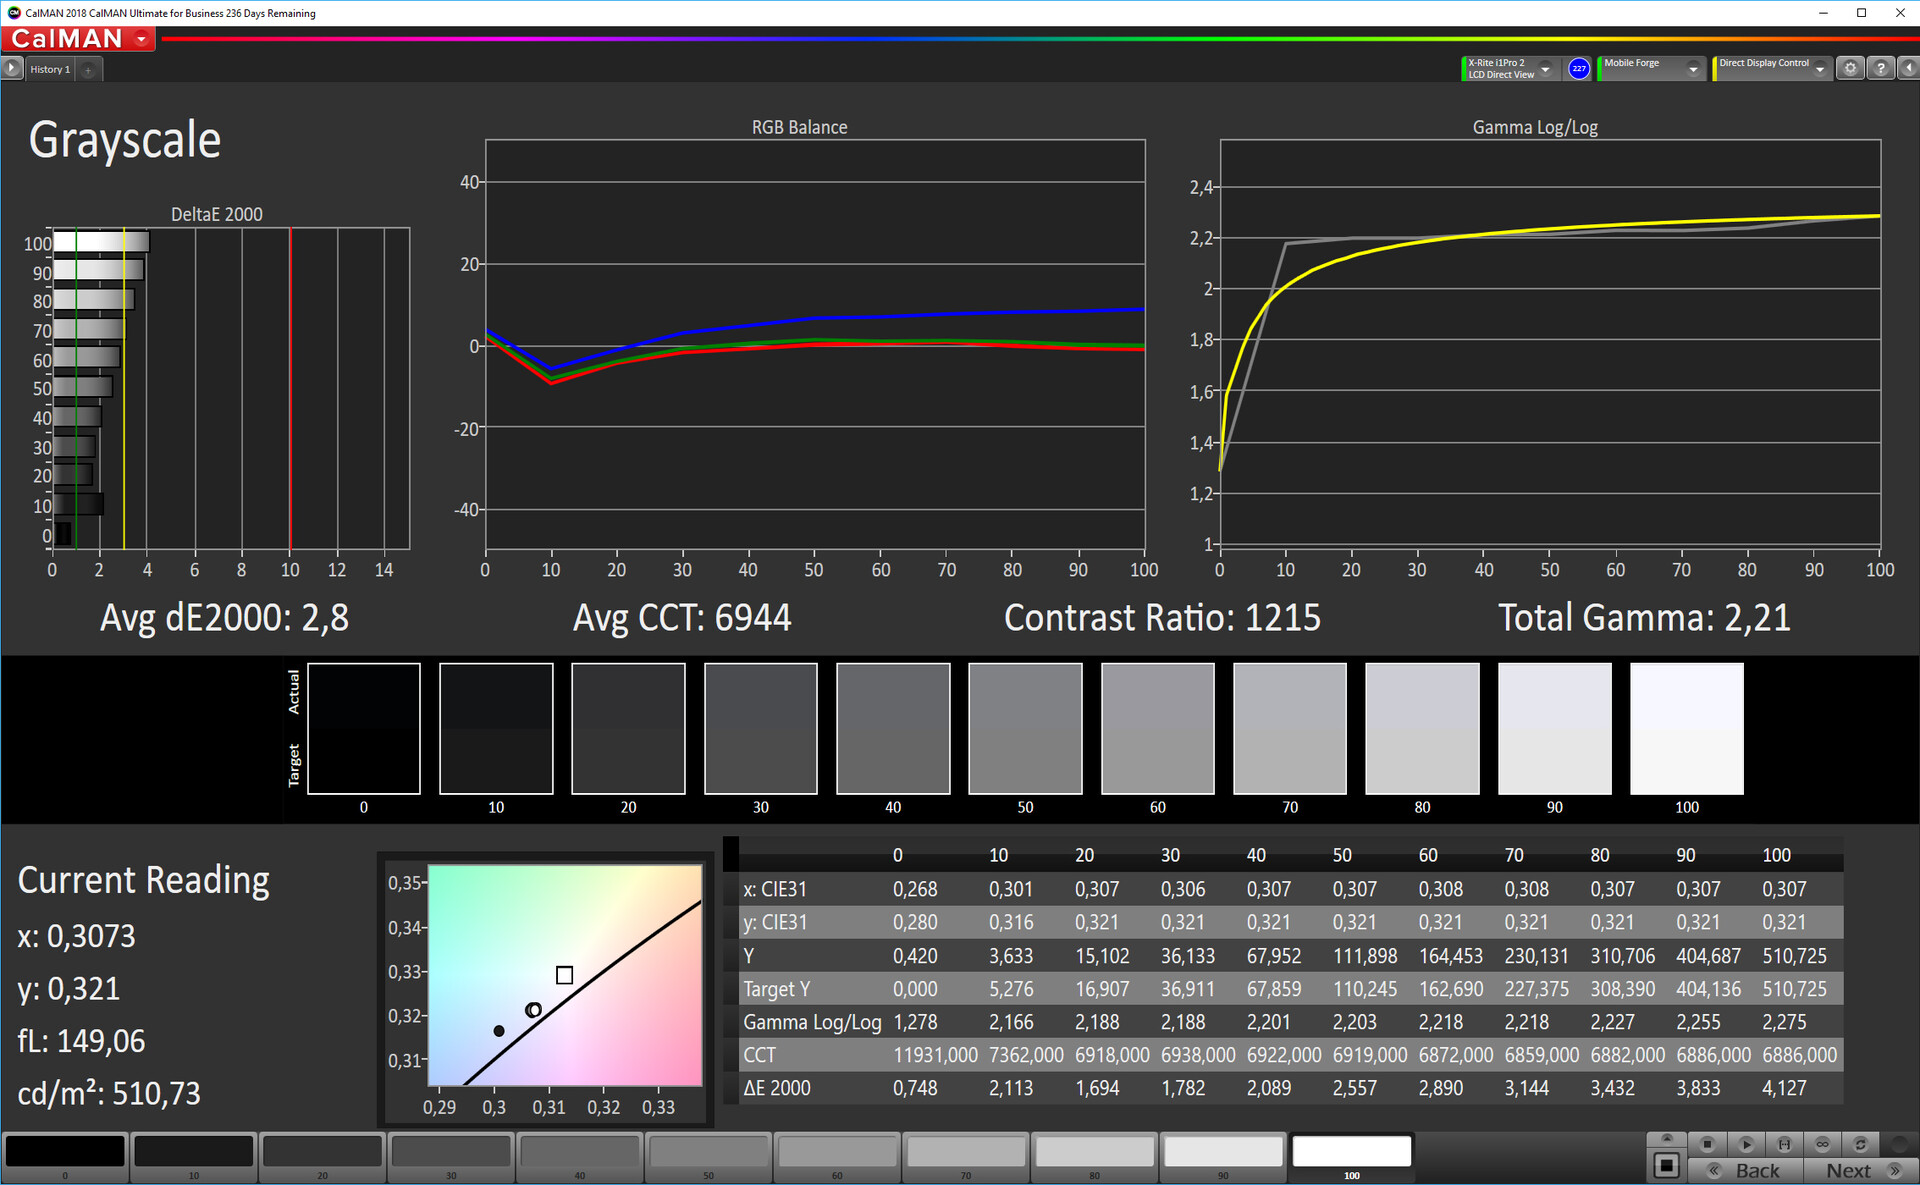
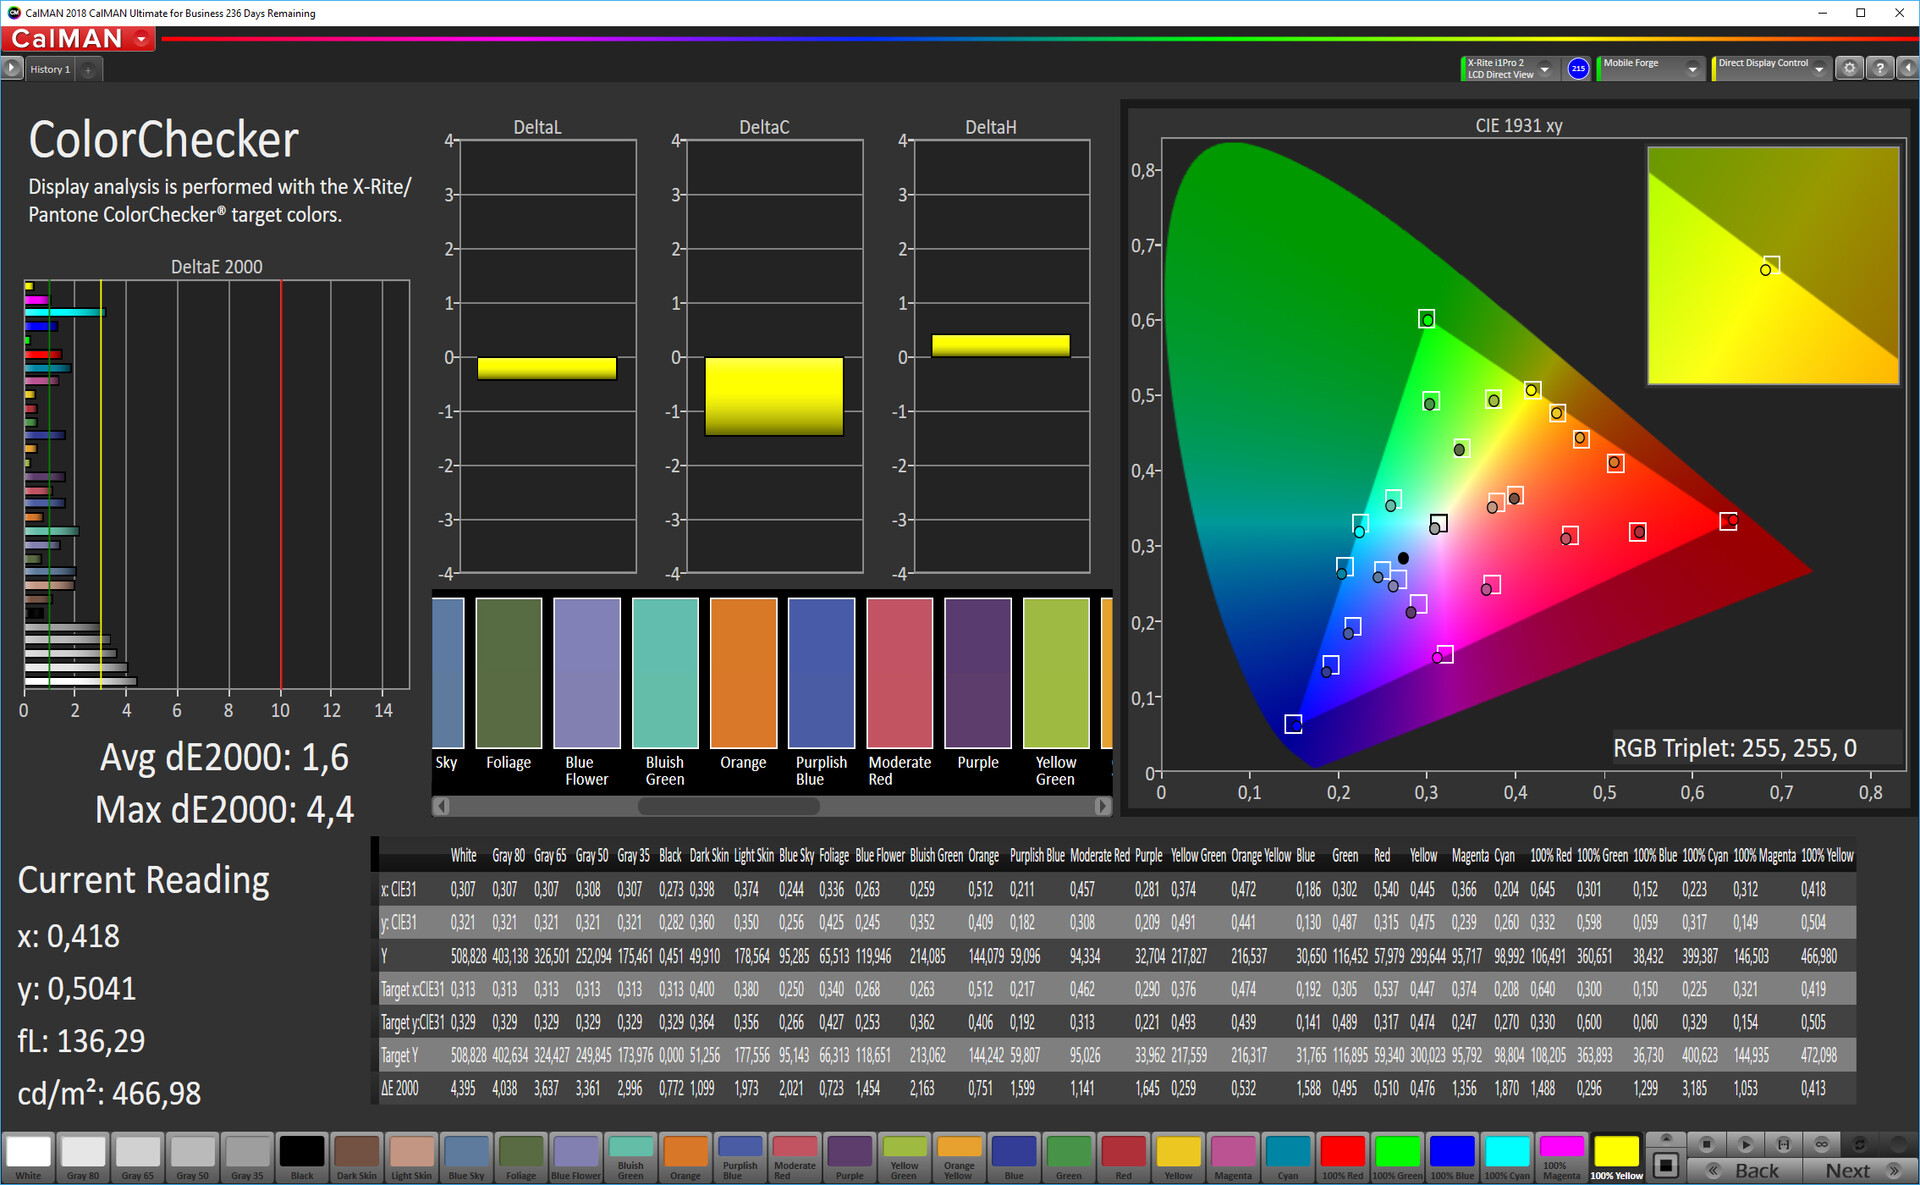
ΔE ColorChecker Calman: 1.6 | ∀{0.5-29.43 Ø4.73}
ΔE Greyscale Calman: 2.8 | ∀{0.09-98 Ø4.97}
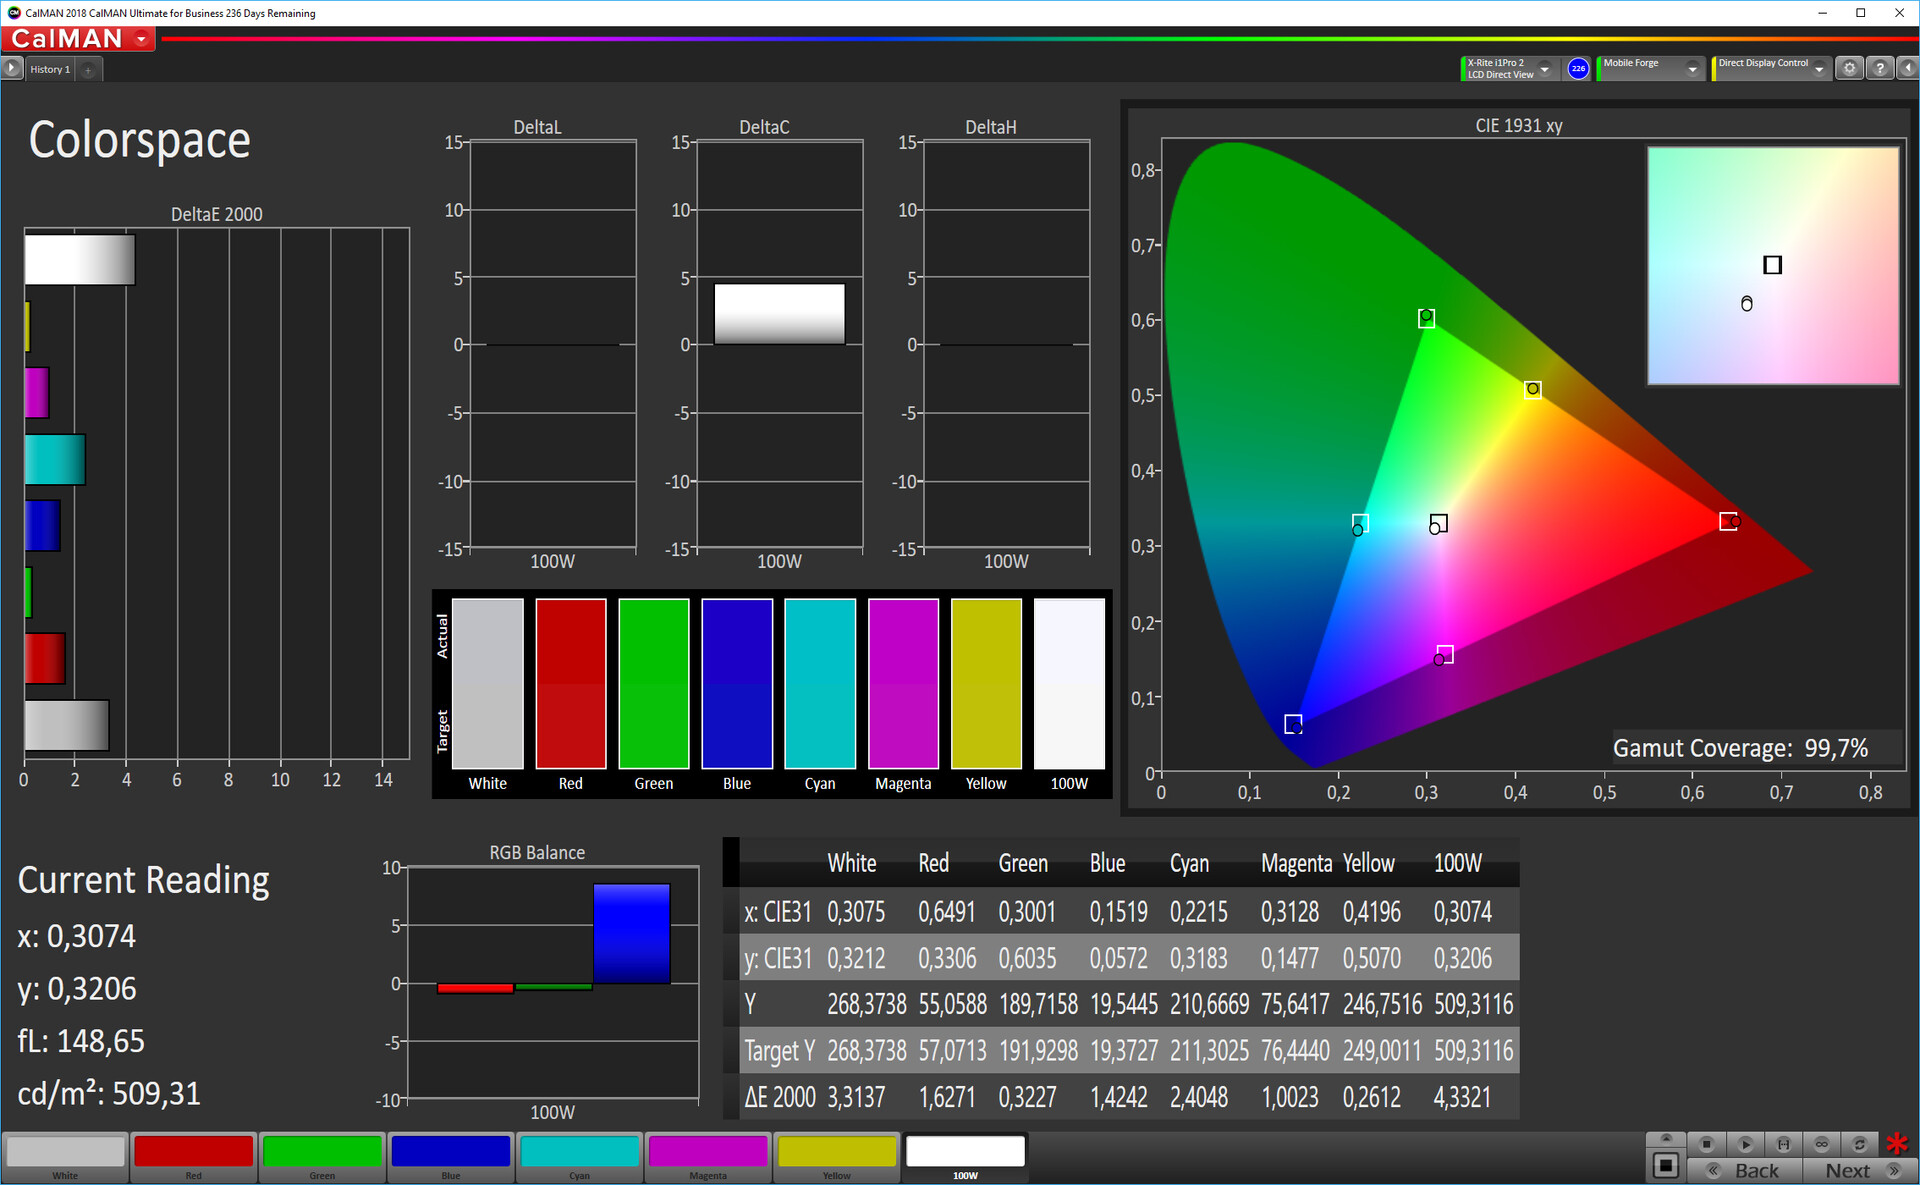
99.7% sRGB (Calman 2D)
Gamma: 2.21
CCT: 6944 K
| Apple iPad Air 3 2019 IPS, 2224x1668, 10.5" | Apple iPad Air 2 2014 IPS, 2048x1536, 9.7" | Apple iPad 6 2018 IPS, 2048x1536, 9.7" | Apple iPad Pro 10.5 2017 IPS, 2224x1668, 10.5" | Huawei MediaPad M5 10.8 Pro IPS, 2560x1600, 10.8" | Samsung Galaxy Tab S4 Super AMOLED, 2560x1600, 10.5" | |
|---|---|---|---|---|---|---|
| Screen | -27% | 6% | 9% | -112% | -12% | |
| Brightness middle (cd/m²) | 515 | 423 -18% | 530 3% | 634 23% | 384 -25% | 474 -8% |
| Brightness (cd/m²) | 483 | 427 -12% | 513 6% | 625 29% | 360 -25% | 477 -1% |
| Brightness Distribution (%) | 90 | 92 2% | 92 2% | 87 -3% | 84 -7% | 91 1% |
| Black Level * (cd/m²) | 0.41 | 0.61 -49% | 0.61 -49% | 0.39 5% | 0.8 -95% | |
| Contrast (:1) | 1256 | 693 -45% | 869 -31% | 1626 29% | 480 -62% | |
| Colorchecker dE 2000 * | 1.6 | 2.86 -79% | 1.2 25% | 1.9 -19% | 6.83 -327% | 2.5 -56% |
| Colorchecker dE 2000 max. * | 4.4 | 3.2 27% | 3.9 11% | 12.7 -189% | 5.8 -32% | |
| Greyscale dE 2000 * | 2.8 | 2.37 15% | 1 64% | 2.8 -0% | 7.5 -168% | 2.1 25% |
| Gamma | 2.21 100% | 2.43 91% | 2.28 96% | 2.26 97% | 2.199 100% | 2.08 106% |
| CCT | 6944 94% | 6941 94% | 6588 99% | 7027 93% | 8544 76% | 6281 103% |
| Color Space (Percent of AdobeRGB 1998) (%) | 88 |
* ... smaller is better
Screen Flickering / PWM (Pulse-Width Modulation)
| Screen flickering / PWM not detected | 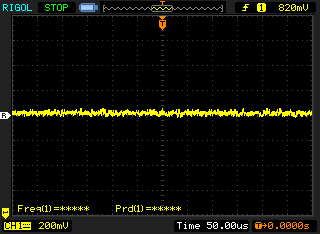 | ||
In comparison: 52 % of all tested devices do not use PWM to dim the display. If PWM was detected, an average of 7810 (minimum: 5 - maximum: 343500) Hz was measured. | |||
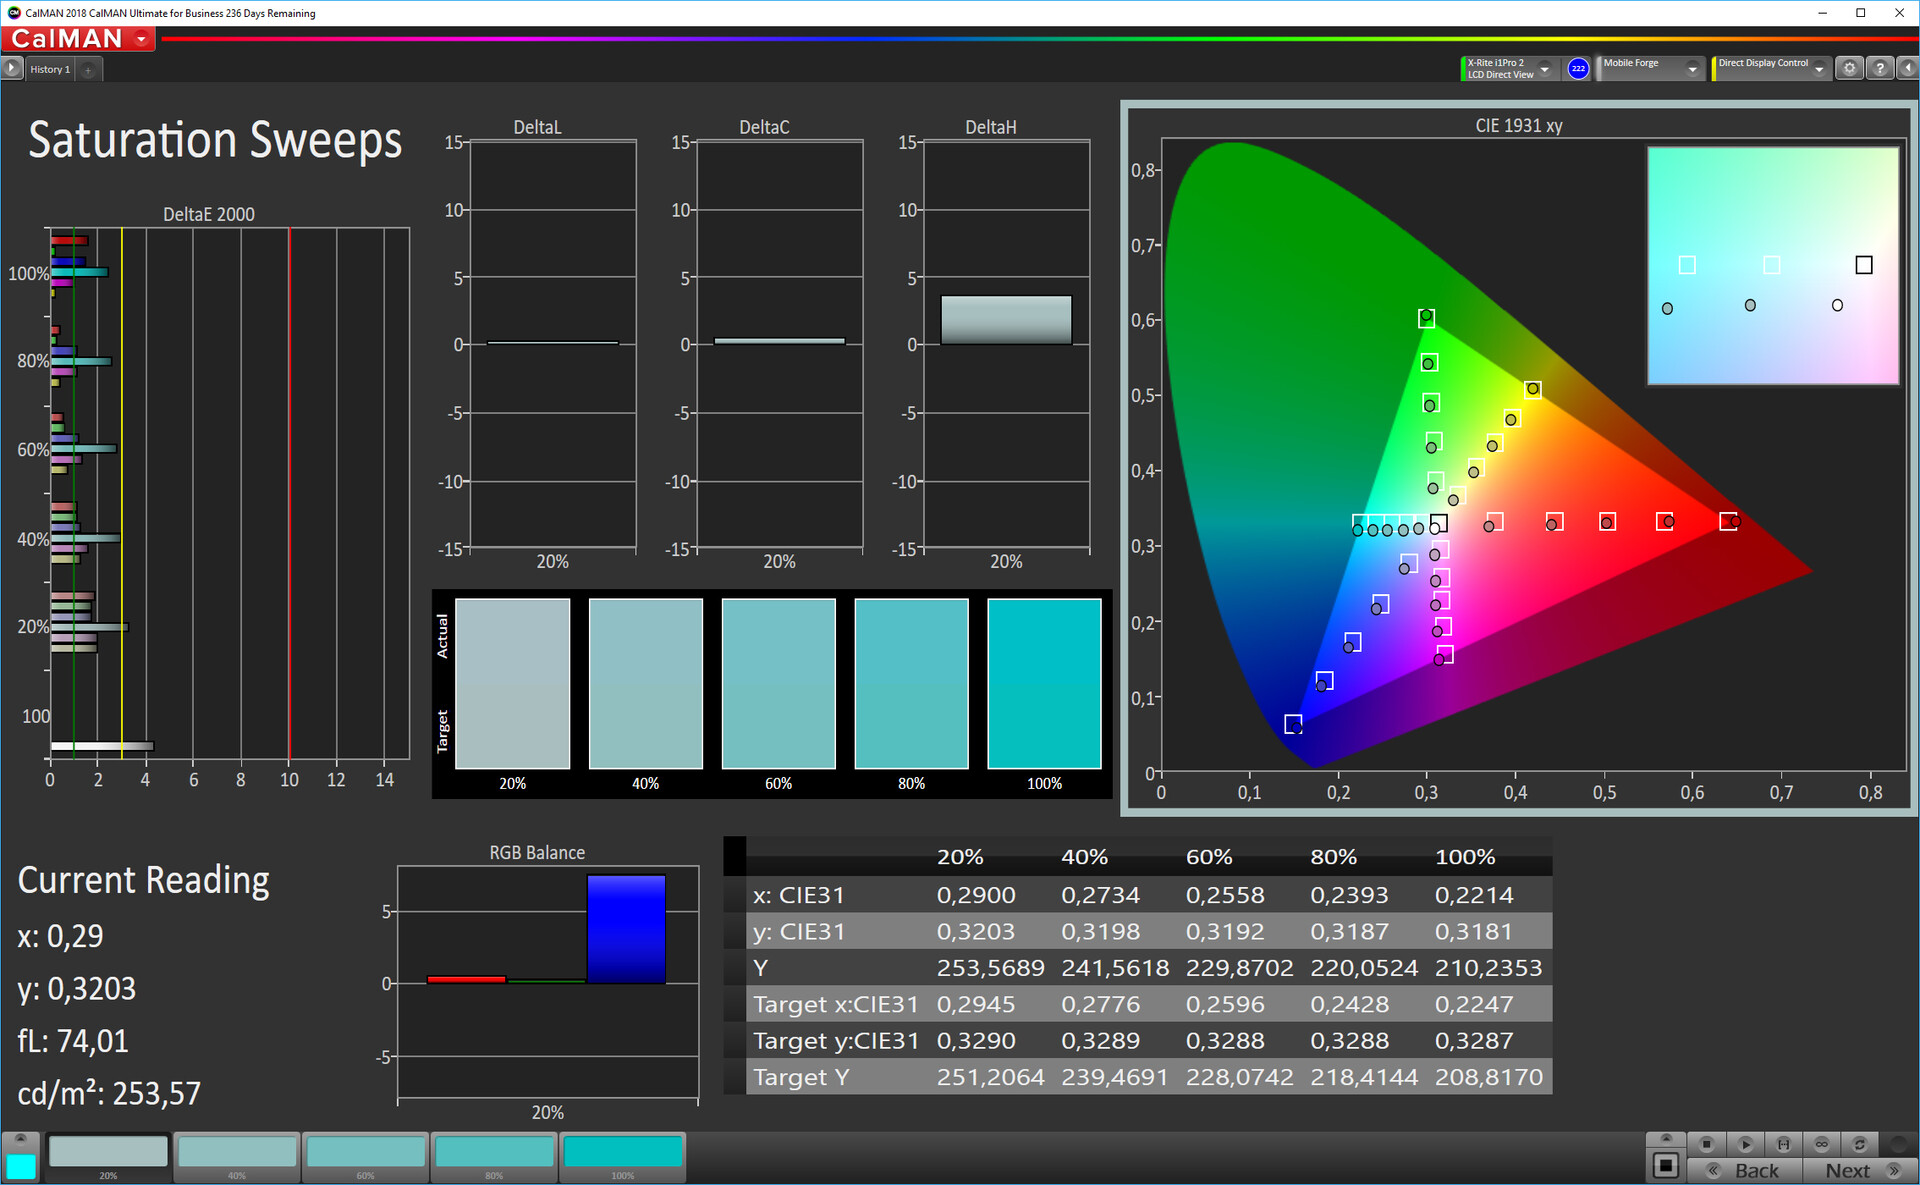
We evaluate the accuracy of the color reproduction with a photo spectrometer and the CalMAN analysis software. As before with other Apple products, we were unable to entice the tablet in our measurements to target the larger DCI-P3 color space, which should be supported according to Apple.
In the sRGB color-space measurements, the iPad Air distinguishes itself with a natural color reproduction that hardly shows any visible deviations. Only the grayscale shows a slightly increased blue tint, although this does not interfere in everyday operation. As soon as the True Tone control is activated, this also disappears.
Display Response Times
| ↔ Response Time Black to White | ||
|---|---|---|
| 28 ms ... rise ↗ and fall ↘ combined | ↗ 10.4 ms rise | 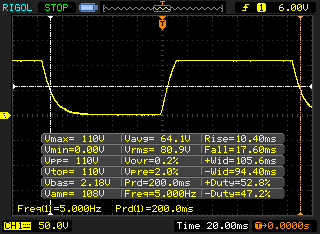 |
| ↘ 17.6 ms fall | ||
| The screen shows relatively slow response rates in our tests and may be too slow for gamers. In comparison, all tested devices range from 0.1 (minimum) to 240 (maximum) ms. » 71 % of all devices are better. This means that the measured response time is worse than the average of all tested devices (19.9 ms). | ||
| ↔ Response Time 50% Grey to 80% Grey | ||
| 58 ms ... rise ↗ and fall ↘ combined | ↗ 27.6 ms rise | 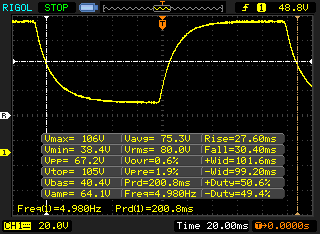 |
| ↘ 30.4 ms fall | ||
| The screen shows slow response rates in our tests and will be unsatisfactory for gamers. In comparison, all tested devices range from 0.165 (minimum) to 636 (maximum) ms. » 94 % of all devices are better. This means that the measured response time is worse than the average of all tested devices (31.1 ms). | ||
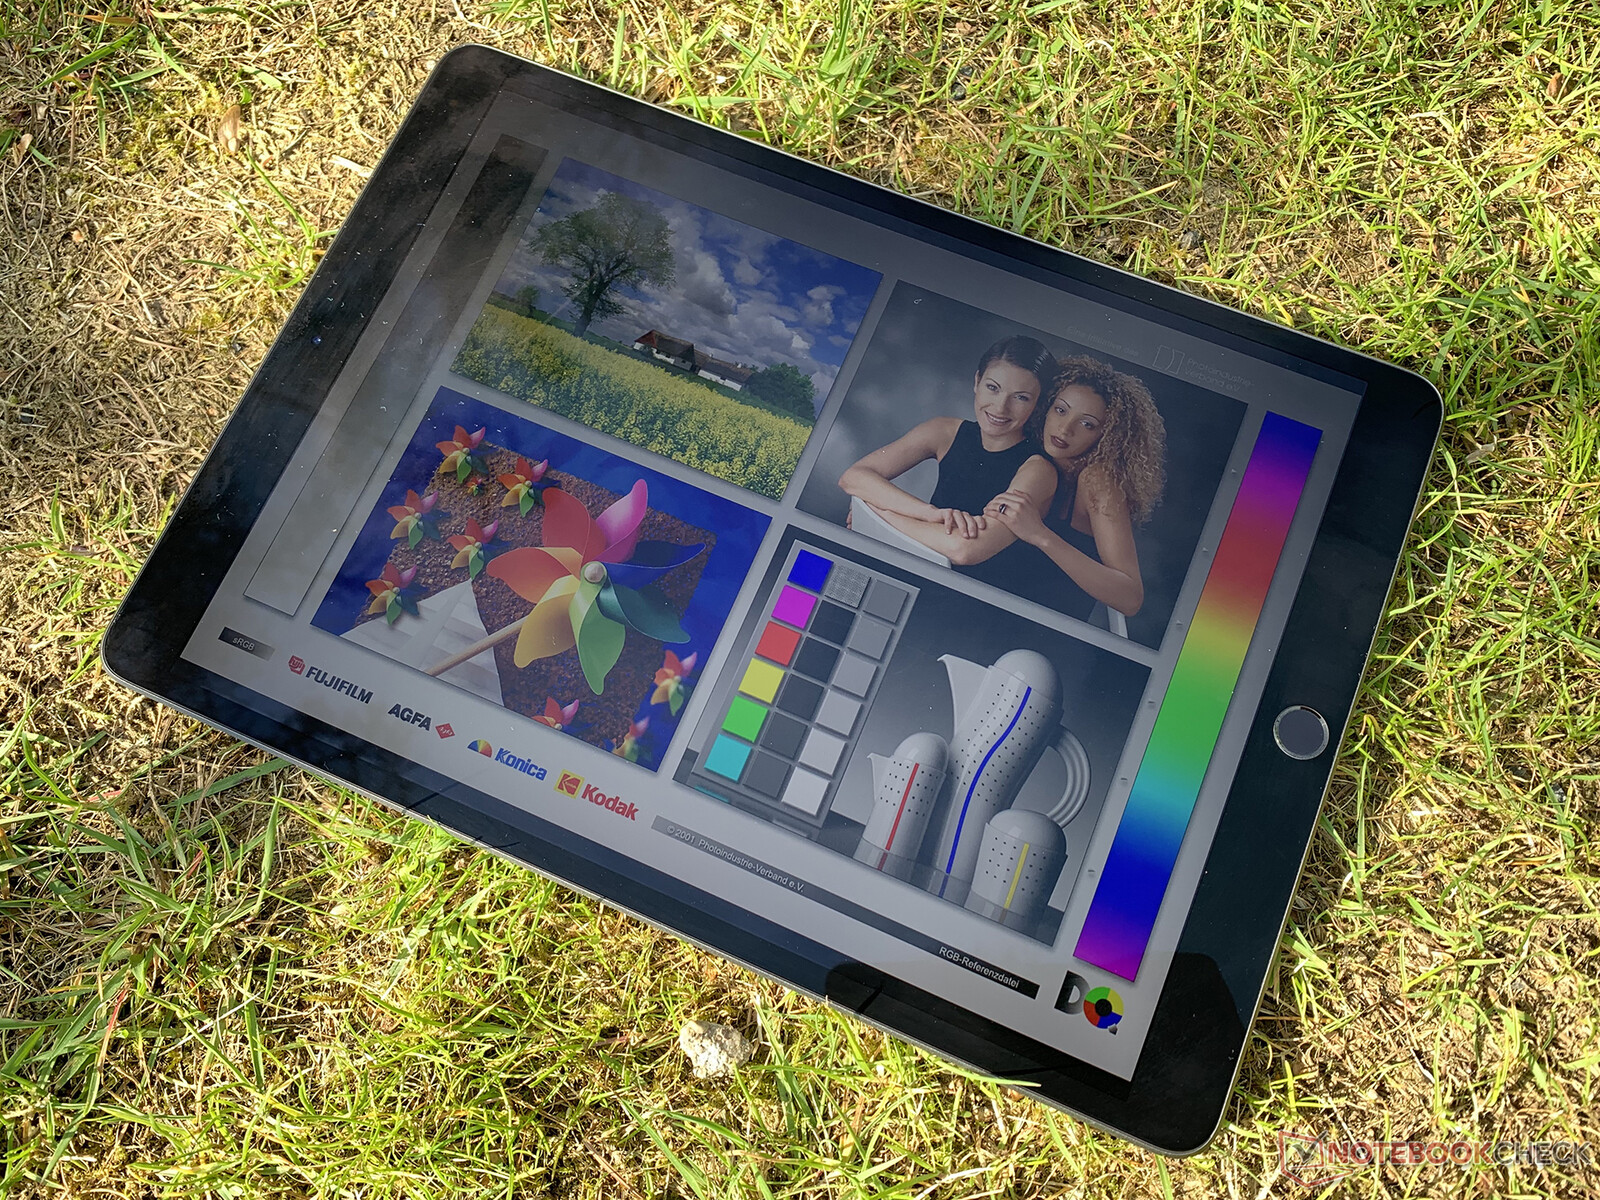
Outdoors, the fully laminated display of the Air tablet distinguishes itself compared to the iPad (2018), since it struggles less with reflections and also benefits from the stronger contrast ratio. However, its usage is limited in strong sunlight.
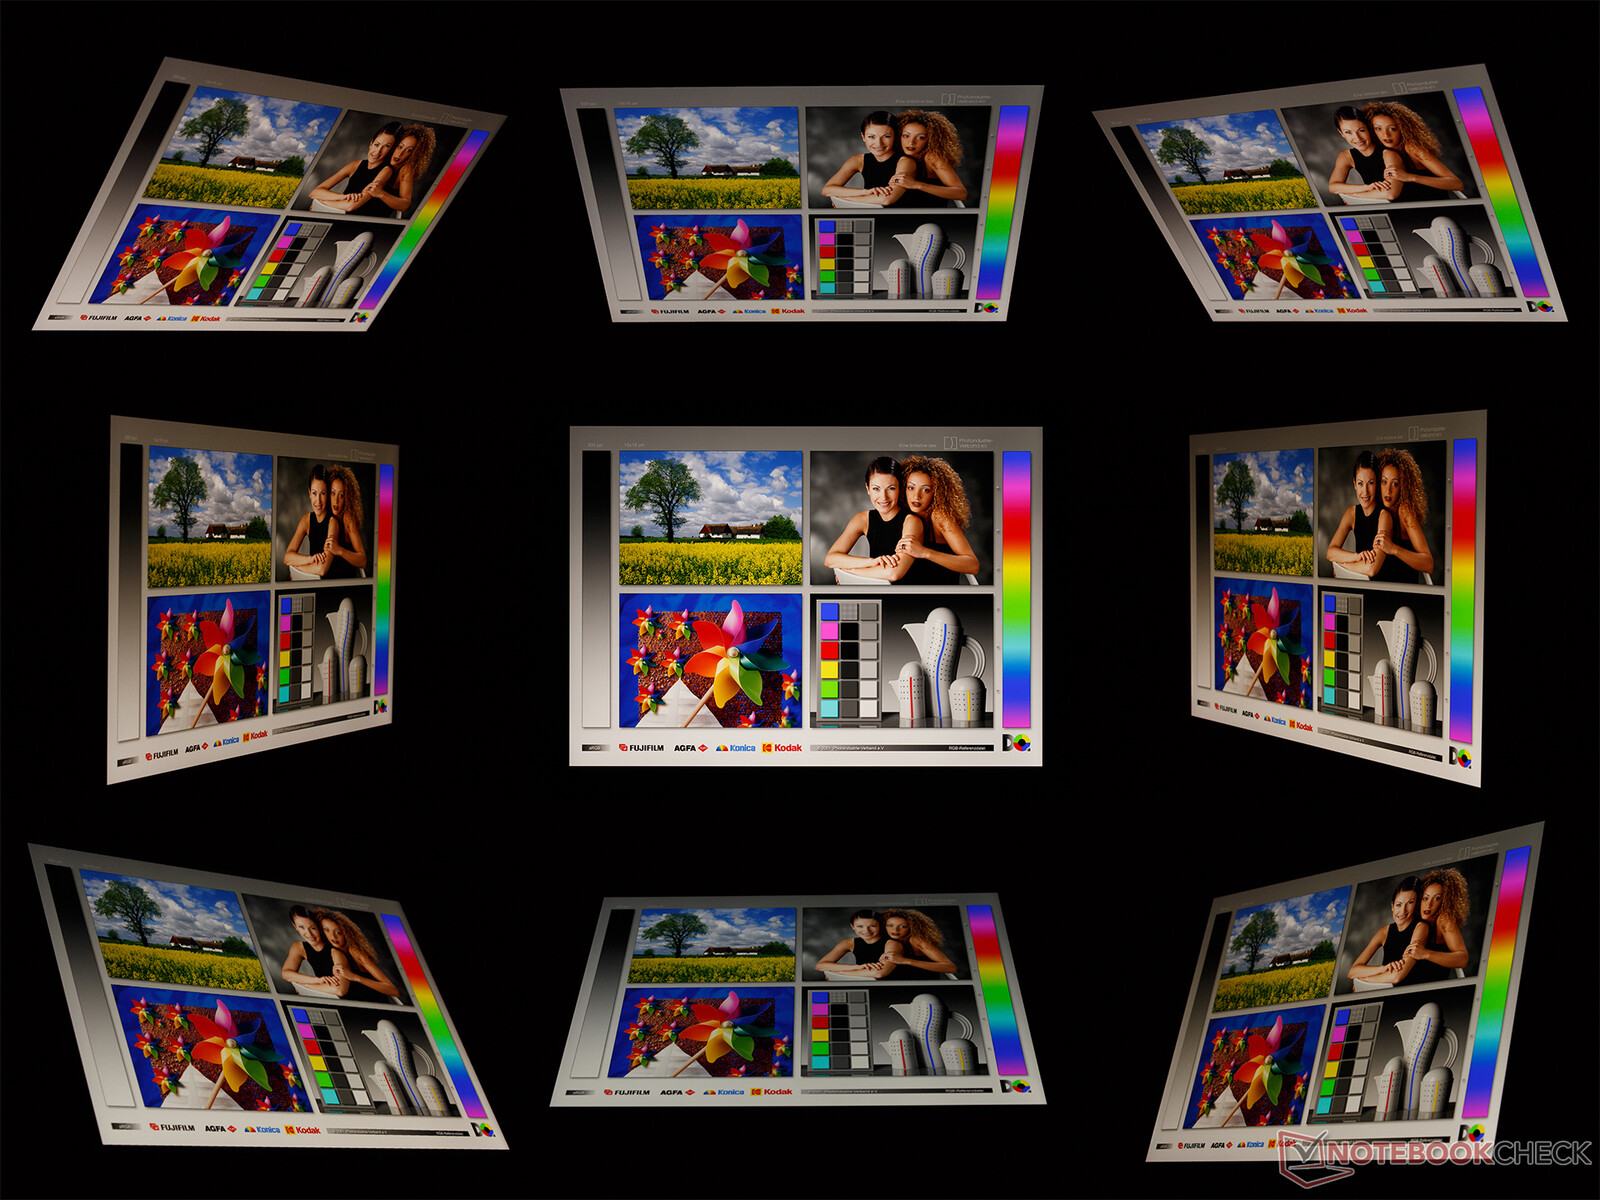
The viewing-angle stability of the Apple iPad Air is really good. While the displayed contents get a warmer tint at steep viewing angles, there are no color inversions. Likewise, we did not observe any glow effect and only a very slight clouding at the panel edge when it was completely dark.
Performance - A lot of power in the iPad Air
The Apple iPad Air (2019) is run by the in-house A12 Bionic processor, which is supported by 3 GB of LPDDR4x working memory. The SoC is already well-known from iPhones and ensures an incredibly strong performance that is currently only surpassed by the A12X in the iPad Pro models.
In the benchmarks, the tablet places in front of the comparison field, without being surpassed or relegated into second place in any of the benchmarks. While information on the internal storage is not further specified by Apple, it operates at the same speed in the Passmark Mobile benchmark as those in the iPhones.
| AnTuTu v7 - Total Score | |
| Apple iPad Air 3 2019 | |
| Average Apple A12 Bionic (302955 - 370545, n=4) | |
| Samsung Galaxy Tab S4 | |
| Huawei MediaPad M5 10.8 Pro | |
| Apple iPad 6 2018 | |
| Basemark ES 3.1 / Metal - offscreen Overall Score | |
| Average of class Tablet (255 - 5784, n=7, last 2 years) | |
| Apple iPad Air 3 2019 | |
| Average Apple A12 Bionic (2407 - 2873, n=6) | |
| Apple iPad 6 2018 | |
| Apple iPad Air 2 2014 | |
Surfing the web works smoothly in the iPad Air and does not represent any challenge to the Apple tablet. In the benchmarks, it also remains in first place without competition in this area.
| Jetstream 2 - 2.0 Total | |
| Average of class Tablet (35.8 - 395, n=61, last 2 years) | |
| Average Apple A12 Bionic (108.4 - 123.8, n=4) | |
| Apple iPad Air 3 2019 (Safari Mobile 12) | |
| WebXPRT 3 - Overall | |
| Average of class Tablet (108 - 480, n=12, last 2 years) | |
| Average Apple A12 Bionic (155 - 166, n=6) | |
| Apple iPad Air 3 2019 (Safari Mobile 12) | |
| Apple iPad 6 2018 (Safari Mobile 10) | |
| Samsung Galaxy Tab S4 (Samsung Browser 8.0) | |
| Huawei MediaPad M5 10.8 Pro (Chrome 68.0.3440.91) | |
| Speedometer 2.0 - Result 2.0 | |
| Average of class Tablet (2.59 - 790, n=40, last 2 years) | |
| Average Apple A12 Bionic (123 - 139, n=4) | |
| Apple iPad Air 3 2019 (Safari Mobile 12) | |
| Apple iPad 6 2018 (IOS 12.1.1) | |
| Octane V2 - Total Score | |
| Average of class Tablet (763 - 138481, n=76, last 2 years) | |
| Average Apple A12 Bionic (41367 - 43280, n=6) | |
| Apple iPad Air 3 2019 (Safari Mobile 12) | |
| Apple iPad Pro 10.5 2017 (Safari Mobile 10) | |
| Apple iPad 6 2018 (Safari Mobile 11.3) | |
| Samsung Galaxy Tab S4 (Samsung Browser 8.0) | |
| Huawei MediaPad M5 10.8 Pro (Chrome 68.0.3440.91) | |
| Apple iPad Air 2 2014 (Safari 9.0 Mobile) | |
| Mozilla Kraken 1.1 - Total | |
| Huawei MediaPad M5 10.8 Pro (Chrome 68.0.3440.91) | |
| Samsung Galaxy Tab S4 (Samsung Browser 8.0) | |
| Apple iPad Air 2 2014 (Safari 9.0 Mobile) | |
| Average of class Tablet (243 - 27101, n=69, last 2 years) | |
| Apple iPad 6 2018 (Safari Mobile 11.3) | |
| Apple iPad Pro 10.5 2017 (Safari Mobile 10) | |
| Apple iPad Air 3 2019 (Safari Mobile 12) | |
| Average Apple A12 Bionic (603 - 653, n=6) | |
* ... smaller is better
Games - A lot of potential but also very unwieldy
The Apple A12 GPU ensures a lot of graphics power and allows playing all the games from the App Store without any problems, without having to resort to any compromises. We looked at several games more closely with our GameBench partner and did not run into any real limitations here. The demanding PUBG Mobile game shows itself mostly stable in terms of the frame rates at the highest resolution, and we were only able to notice a few micro stutters in the beginning.
However, we perceived the size and weight of the tablet as a shortcoming during gaming. If you hold it in your hands, it can become very heavy in the long run. Anyone who simply wants less display area should take a look at the iPad Mini 5, which has the same SoC but is significantly more manageable. The speakers produce a fairly powerful sound and the sensors work without a hitch.


PUBG Mobile
Dead Trigger 2
Emissions - An iPad with an audio port
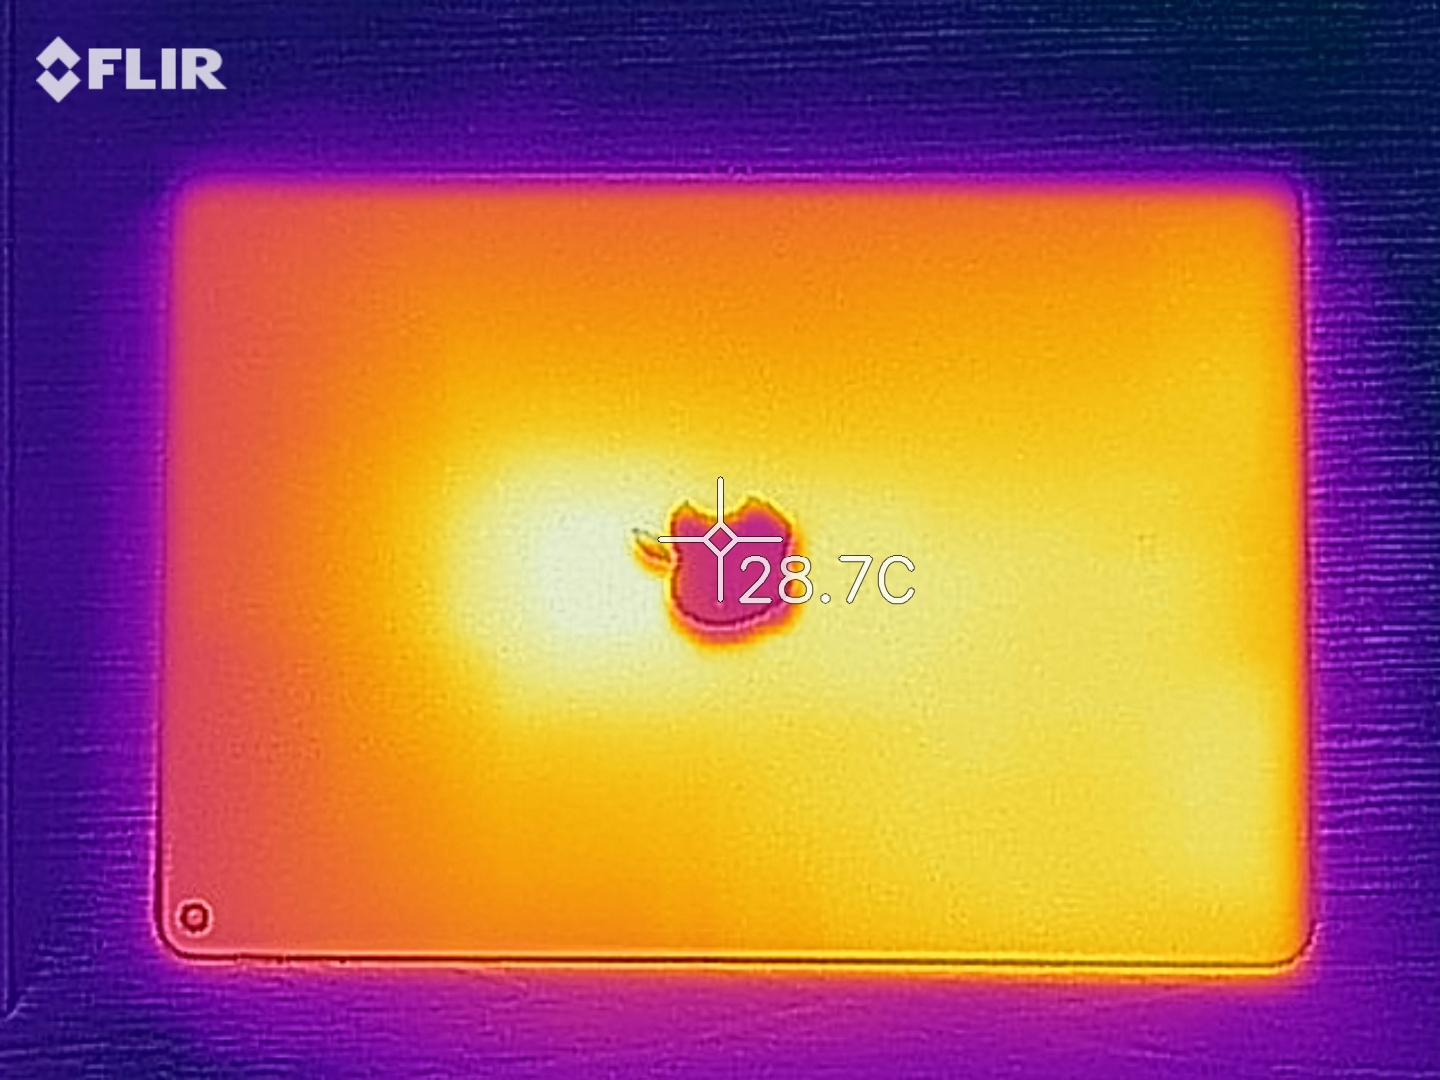
Temperatures
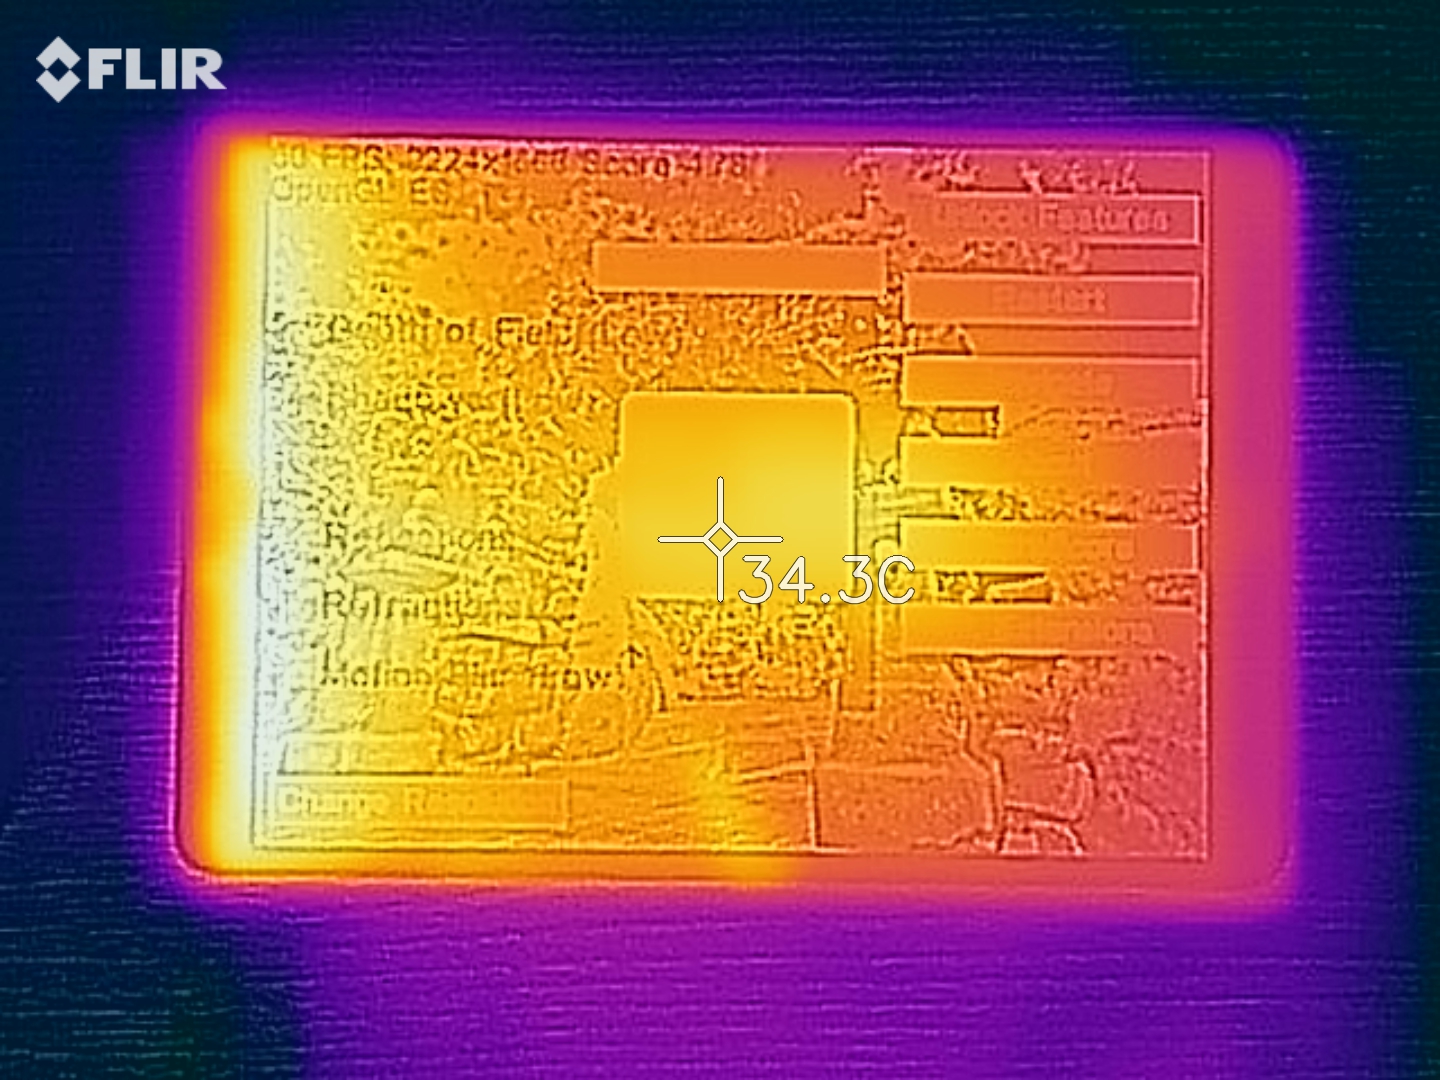
The surface temperatures of the Apple iPad Air (2019) give no reason for concern at any time and even under constant load only rise to a maximum of 36.1 °C (97 °F), remaining at a similar level (35.9 °C, 96.6 °F) at the hotspot in a contact measurement.
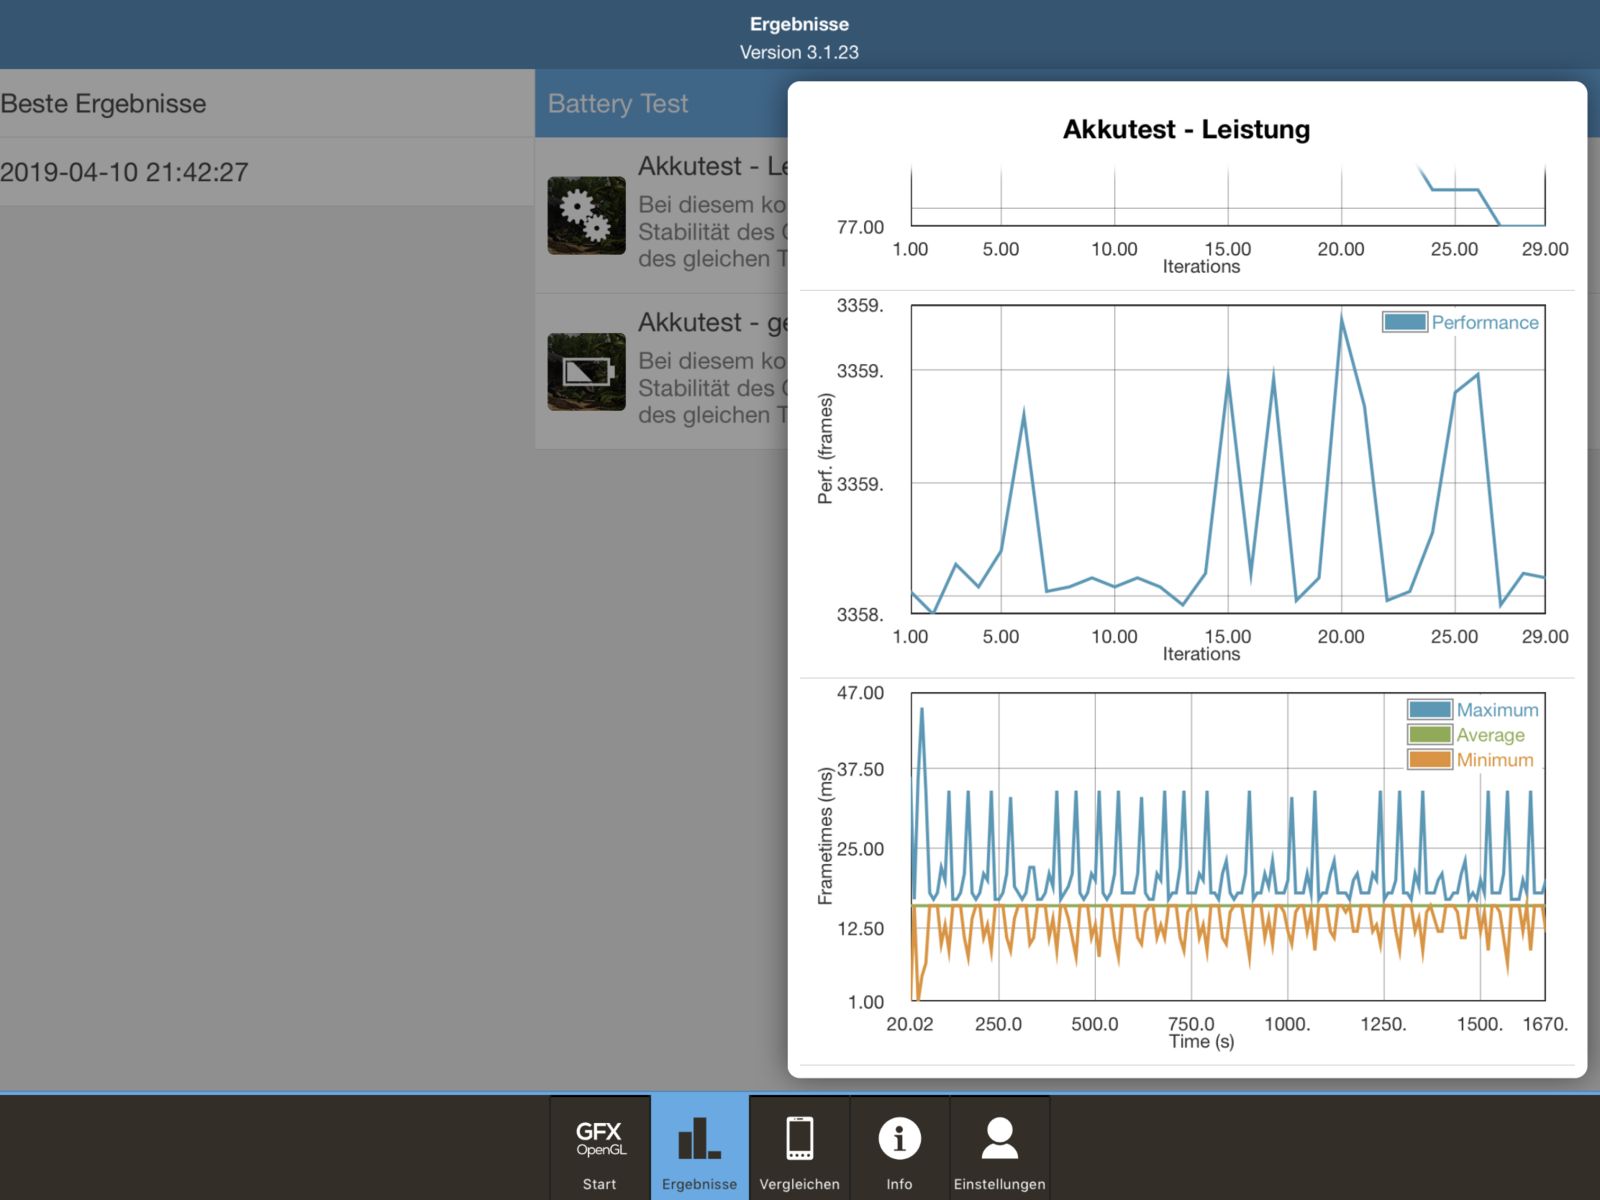
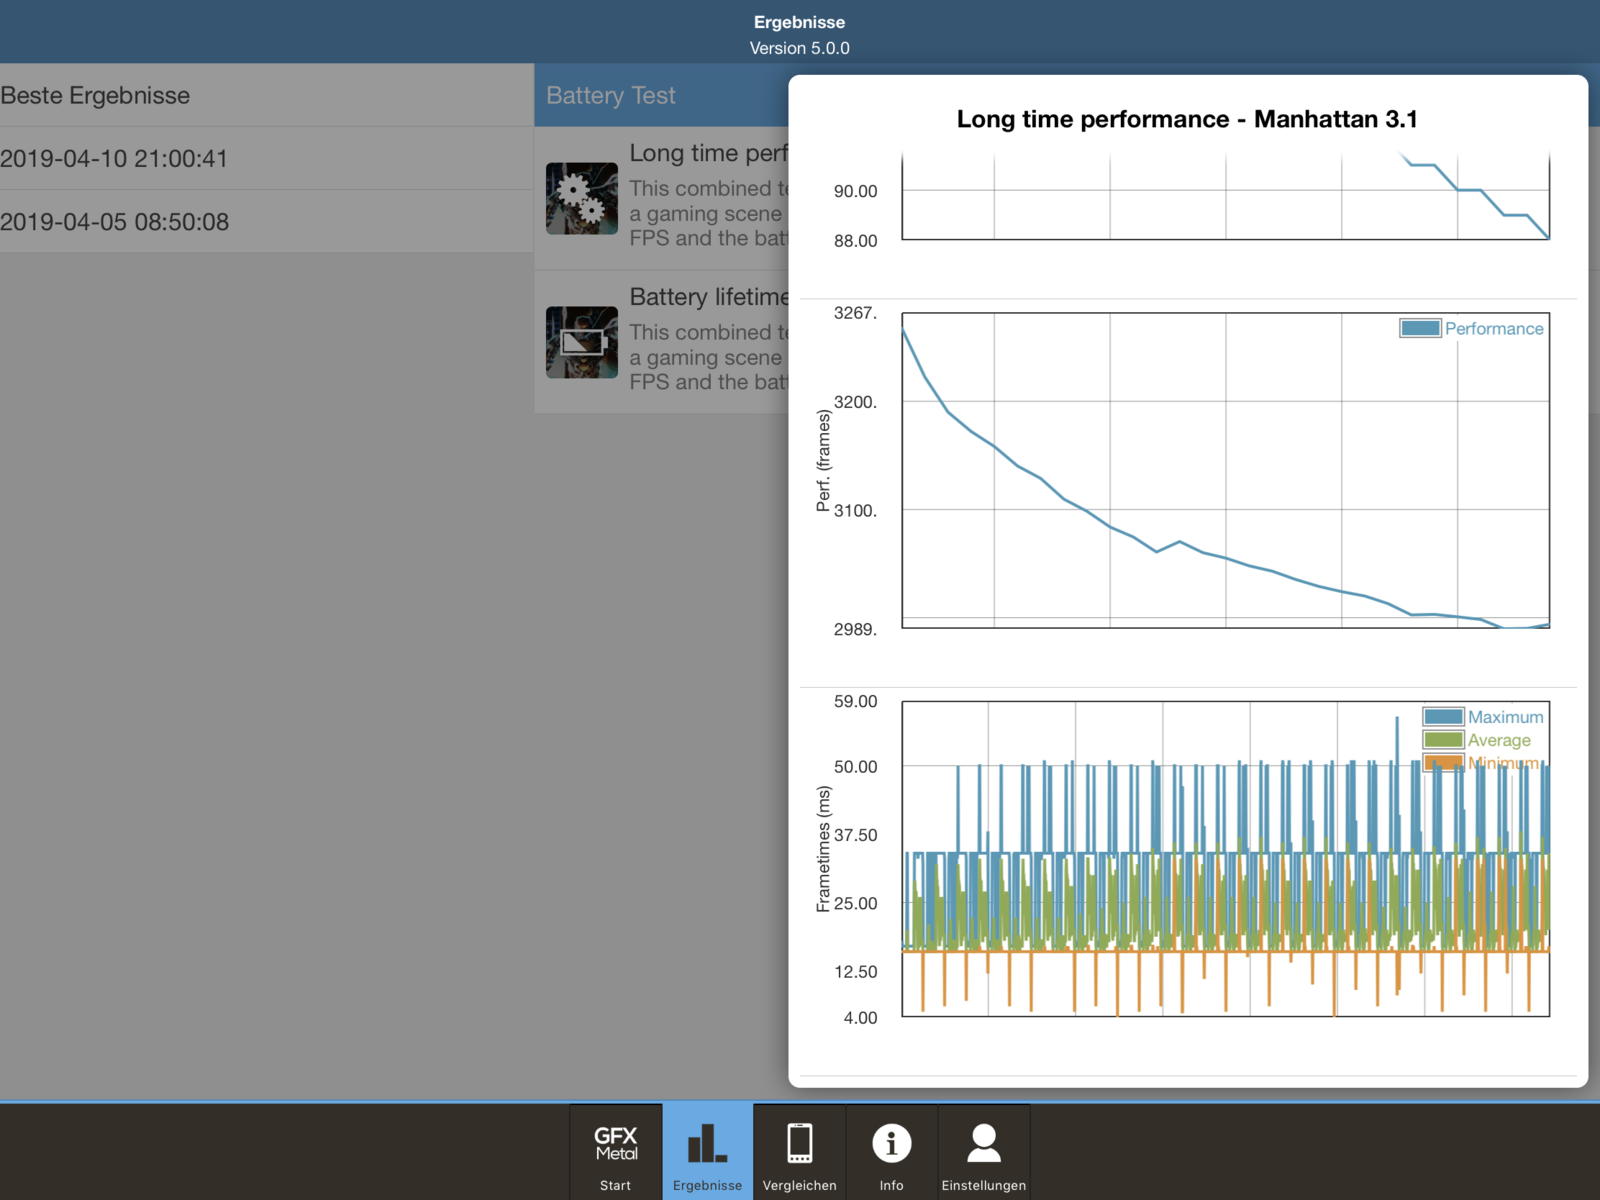
We evaluate the behavior of the SoC during constant load with the GFXBench battery test, during which the corresponding benchmark scenario is repeated 30 times. In the older T-Rex test, the Apple tablet has no problems, delivering a constant performance until the end. However, in the Manhattan test, which uses the Metal API under iOS, things look different, and the performance of the SoC drops almost continuously, losing almost 10%.
(+) The maximum temperature on the upper side is 36.1 °C / 97 F, compared to the average of 33.6 °C / 92 F, ranging from 20.7 to 53.2 °C for the class Tablet.
(+) The bottom heats up to a maximum of 34.7 °C / 94 F, compared to the average of 33.2 °C / 92 F
(+) In idle usage, the average temperature for the upper side is 30.5 °C / 87 F, compared to the device average of 30 °C / 86 F.
Speakers
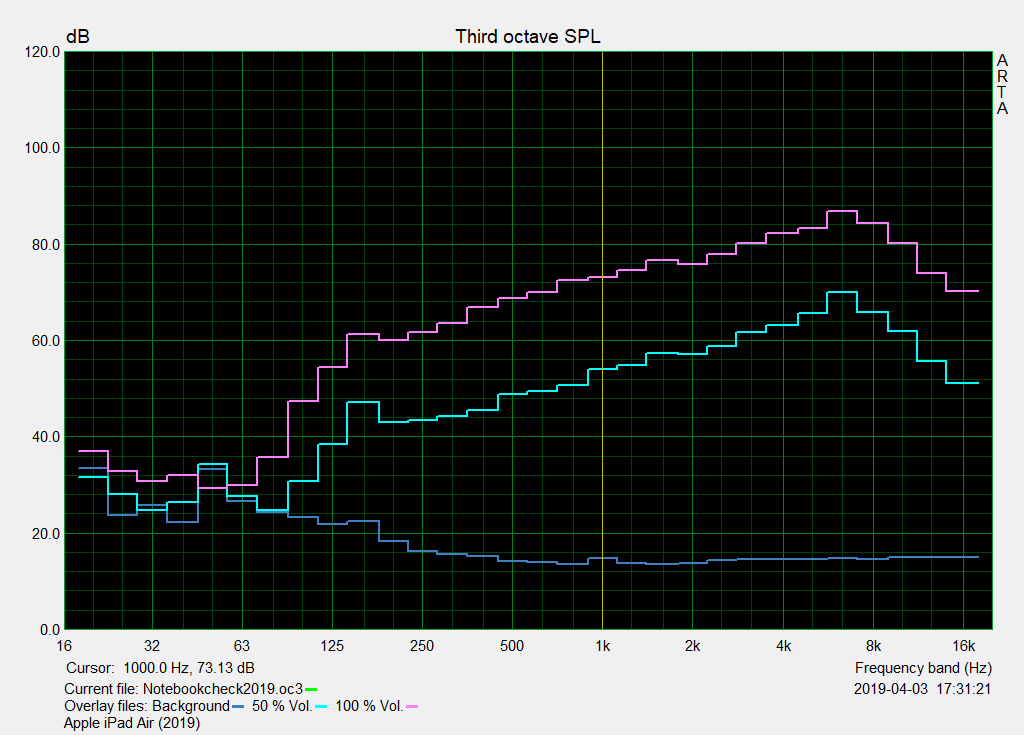
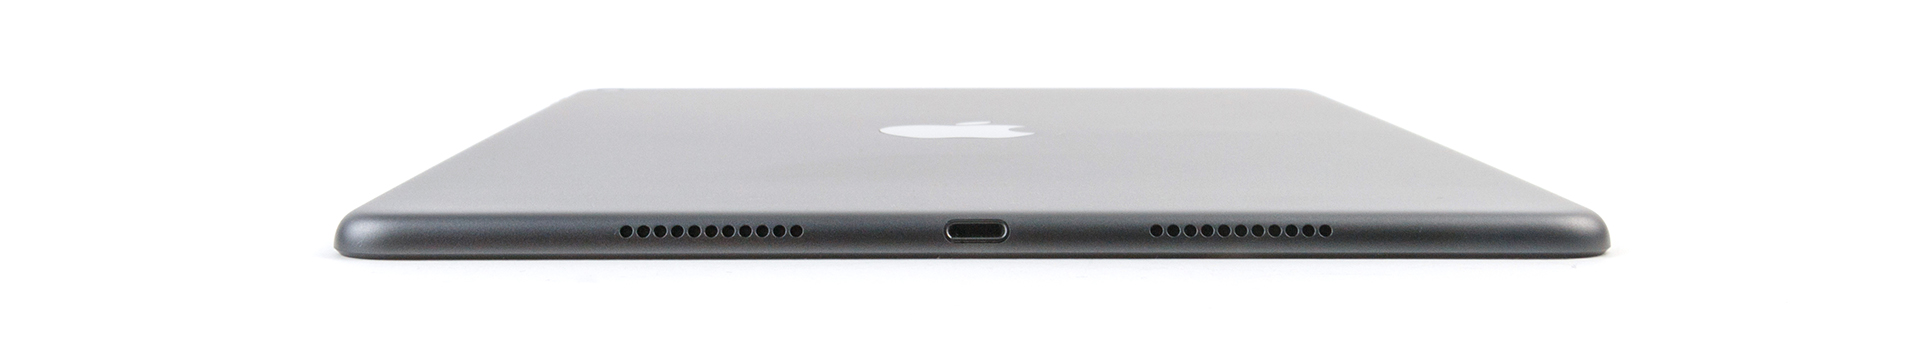
The two speakers of the Apple iPad Air (2019) are positioned on both sides of the Lightning connection and produce a relatively saturated sound. However, we cannot really speak about stereo sound here, but the second speaker serves to still produce sound when the other one happens to be covered in portrait mode.
The reproduction of the mids is particularly positive and even the lower mids are still audible. While the upper bass range is still present, it is hardly audible. While we experience the sound reproduction as quite pleasant with surprising depth in our test, the high tones are a bit too strong, causing them to be very present and bringing a tinny sound at high volumes.
Those who want to use external speakers can either use Bluetooth or the 3.5 mm audio port. The latter can be recommended for music lovers, since it offers a wider sound spectrum, provided you use the corresponding sound sources.
Apple iPad Air 3 2019 audio analysis
(+) | speakers can play relatively loud (92.5 dB)
Bass 100 - 315 Hz
(-) | nearly no bass - on average 15.9% lower than median
(±) | linearity of bass is average (8.5% delta to prev. frequency)
Mids 400 - 2000 Hz
(+) | balanced mids - only 3% away from median
(+) | mids are linear (3% delta to prev. frequency)
Highs 2 - 16 kHz
(±) | higher highs - on average 8.2% higher than median
(+) | highs are linear (4.3% delta to prev. frequency)
Overall 100 - 16.000 Hz
(+) | overall sound is linear (14.8% difference to median)
Compared to same class
» 32% of all tested devices in this class were better, 4% similar, 65% worse
» The best had a delta of 7%, average was 20%, worst was 129%
Compared to all devices tested
» 20% of all tested devices were better, 4% similar, 76% worse
» The best had a delta of 4%, average was 24%, worst was 134%
Apple iPad Pro 10.5 2017 audio analysis
(+) | speakers can play relatively loud (84.6 dB)
Bass 100 - 315 Hz
(±) | reduced bass - on average 10.4% lower than median
(±) | linearity of bass is average (12.3% delta to prev. frequency)
Mids 400 - 2000 Hz
(±) | higher mids - on average 5.8% higher than median
(+) | mids are linear (4.3% delta to prev. frequency)
Highs 2 - 16 kHz
(±) | higher highs - on average 6.6% higher than median
(±) | linearity of highs is average (7% delta to prev. frequency)
Overall 100 - 16.000 Hz
(±) | linearity of overall sound is average (16.1% difference to median)
Compared to same class
» 37% of all tested devices in this class were better, 6% similar, 58% worse
» The best had a delta of 7%, average was 20%, worst was 129%
Compared to all devices tested
» 26% of all tested devices were better, 5% similar, 69% worse
» The best had a delta of 4%, average was 24%, worst was 134%
Power Management - A long battery life and slow charging
Power Consumption
The power consumption of the iPad Air (2019) is surprisingly high during idle operation, particularly when compared to the iPad Pro 10.5, which has a brighter display. Under load, the two Apple tablets are at a relatively similar level. The Galaxy Tab S4 shows itself to be more energy-efficient in all scenarios, but has to be content with a smaller battery.
The bulky charger turns out to be a slight annoyance, since its power capacity is sized very tight and it needs a lot of time (about 6.5 hours) to completely recharge the tablet. In addition, the modular charger develops relatively high surface temperatures. Under load, we measured up to 41.4 °C (106.2 °F). While this is still no reason for concern, the charger might get really hot in summer when temperatures are high.
| Off / Standby | |
| Idle | |
| Load |
|
Key:
min: | |
| Apple iPad Air 3 2019 8134 mAh | Apple iPad Pro 10.5 2017 8134 mAh | Apple iPad 6 2018 mAh | Samsung Galaxy Tab S4 7300 mAh | Huawei MediaPad M5 10.8 Pro 7500 mAh | Apple iPad Air 2 2014 mAh | |
|---|---|---|---|---|---|---|
| Power Consumption | 6% | -27% | 32% | -19% | 14% | |
| Idle Minimum * (Watt) | 2.18 | 1.44 34% | 2.2 -1% | 1.76 19% | 3.3 -51% | 1.2 45% |
| Idle Average * (Watt) | 6.4 | 6.12 4% | 7.8 -22% | 4.22 34% | 4.2 34% | 5.1 20% |
| Idle Maximum * (Watt) | 6.43 | 6.14 5% | 7.9 -23% | 4.25 34% | 7 -9% | 5.4 16% |
| Load Average * (Watt) | 7.48 | 8.55 -14% | 12.6 -68% | 4.52 40% | 10.4 -39% | 7.9 -6% |
| Load Maximum * (Watt) | 10.65 | 10.62 -0% | 12.8 -20% | 7.35 31% | 13.8 -30% | 11.1 -4% |
* ... smaller is better
Battery Life
The battery life turns out to be very good and is even longer than what the manufacturer specified. Compared to the two Android competitors, the Apple tablet lasts slightly longer, but both of the Android devices also have smaller batteries.
Our tests with an adjusted display brightness (150 cd/m²) offer the best comparison. In the WLAN test, the iPad Air (2019) lasts for more than 12 hours, which is slightly longer than the comparison field. In the video loop, the Galaxy Tab S4 is able to last slightly longer.
For a tablet, the iPad Air offers a really good battery life, regardless of the usage scenario. Only the long charging times are annoying, but they can be shortened by using a more powerful charger.
| Apple iPad Air 3 2019 8134 mAh | Apple iPad Pro 10.5 2017 8134 mAh | Apple iPad 6 2018 mAh | Samsung Galaxy Tab S4 7300 mAh | Huawei MediaPad M5 10.8 Pro 7500 mAh | Apple iPad Air 2 2014 mAh | |
|---|---|---|---|---|---|---|
| Battery runtime | 4% | -9% | -7% | -8% | -10% | |
| Reader / Idle (h) | 25 | 33.9 36% | 20.5 -18% | 20.9 -16% | 22.7 -9% | |
| H.264 (h) | 11.4 | 10.5 -8% | 12.3 8% | 10.5 -8% | 9.4 -18% | |
| WiFi v1.3 (h) | 12.3 | 11.6 -6% | 11.9 -3% | 8.3 -33% | 11.2 -9% | |
| Load (h) | 3.6 | 3.3 -8% | 3.1 -14% | 4.1 14% | 3.7 3% | 3.5 -3% |
| WiFi (h) | 10.5 |
Pros
Cons
Verdict - The iPad Air as an artificial stopgap
While the Apple iPad Air (2019) positions itself between the iPad Pro 11 and the iPad (2018), it directly competes against the current high-end Android tablets in terms of the price. In contrast to the entry-level iPad, it offers a larger, completely laminated display, more storage, and it has a more powerful SoC for an additional premium of 200 Euros (~$226).
In terms of technology, Apple has delivered another great tablet that does not have any real faults and uses the technology proven in previous years. However, for users the model portfolio becomes harder to grasp with this, which is made even more difficult by there being several Pencil generations simultaneously.
The Apple iPad Air (2019) combines a modern SoC with proven technology.
The main complaints about the tablet are probably the sparseness of the included accessories and their additional costs, and the long charging times. However, this hardly matters in everyday operation. With the low entry-level price, Touch ID, and its audio port, the iPad Air is still an attractive product.
Apple iPad Air 3 2019
- 09/16/2019 v7 (old)
Daniel Schmidt
Price comparison

