Cheaper than Android? Apple iPad Air 11 (2025) with M3 power for under $600 review
price-performance benchmark?
With its 11-inch screen, the Apple iPad Air 2025 promises impressive performance thanks to the Apple M3. And this at a price starting at less than $600. Would we perhaps even recommend it more than expensive Android flagships? Read our review to find out.Florian Schmitt, 👁 Florian Schmitt (translated by Daisy Dickson) Published 🇩🇪 🇫🇷 ...
Verdict on the Apple iPad Air 11 (2025) Gen 7
Apple's seventh-generation iPad Air 11 is once again a premium tablet which likely represents the mid-range for the company. Even so, it has a lot of processor power that no Android tablet can currently compete with. The high-quality apps included and its focus on data protection and sustainability additionally make the tablet attractive.
One major innovation is Apple Intelligence, which is also available on other iPads, but which we were able to test here in Europe for the first time. Most of the functions work quickly and correctly—in part thanks to the integration of the tried-and-tested and feature-rich ChatGPT. However, Apple still needs to work on some AI functions, such as cutting out unwanted people from photos, where Google has sometimes already proven to be further ahead.
If you want to use the Apple iPad Air 11 (2025) for professional work, you should bear in mind that it is a device with iPadOS. Even if version 18 finally has a built-in calculator, apps that you know and love from MacOS are missing or simply aren't as practical as on Apple's desktop system. It's best to try out iPadOS before relying on it fully.
There aren't many noticeable improvements compared to the predecessor model, apart from its better keyboard dock and its processor's slightly higher performance. Its graphics unit even delivers slightly a little less power in some cases, as it has one core fewer.
As a result of its entry-level price—which is quite low by Apple standards—and in view of its extremely high performance, the Apple iPad Air 11 (2025) is actually a good offer if you can make do with its compact 10.86-inch screen. However, if you want an OLED screen or more storage, then Android is still cheaper.
Pros
Cons
Price and availability
The iPad Air 11 2025 is available to purchase from lots of retailers.
Online, you can currently buy it from Amazon for $549, for example.
Table of Contents
- Verdict on the Apple iPad Air 11 (2025) Gen 7
- Specifications
- Case – Is the iPad waterproof?
- Connectivity – How much storage does the iPad Air 11 have?
- Software – Trying out Apple Intelligence for the first time
- Communication and GNSS – The iPad Air 11 has WiFi 6E
- Cameras – Good tablet cameras
- Accessories and warranty – Improved accessories for the iPad
- Input devices and operation – Still with a 60-Hz display
- Display – Only around 500 nits
- Performance – Impressive power without fans
- Games – An experience with compromises
- Emissions – The iPad Air 11 is throttled
- Battery life – Barely through the day
- Notebookcheck total rating
Apple's iPads aren't exactly known for their low prices. The iPad Air 11 (2025) isn't even the cheapest tablet from the manufacturer, but the 2025 edition comes with the Apple M3 and plenty of power.
From a price standpoint, it can keep up with some of the more expensive Android tablets—so it may actually be Apple's best tablet in terms of value for money. After the 13-inch model, it's now the iPad Air 11 (2025)'s turn to face our test course and we are excited to see the result. Let's go.
Specifications
Case – Is the iPad waterproof?
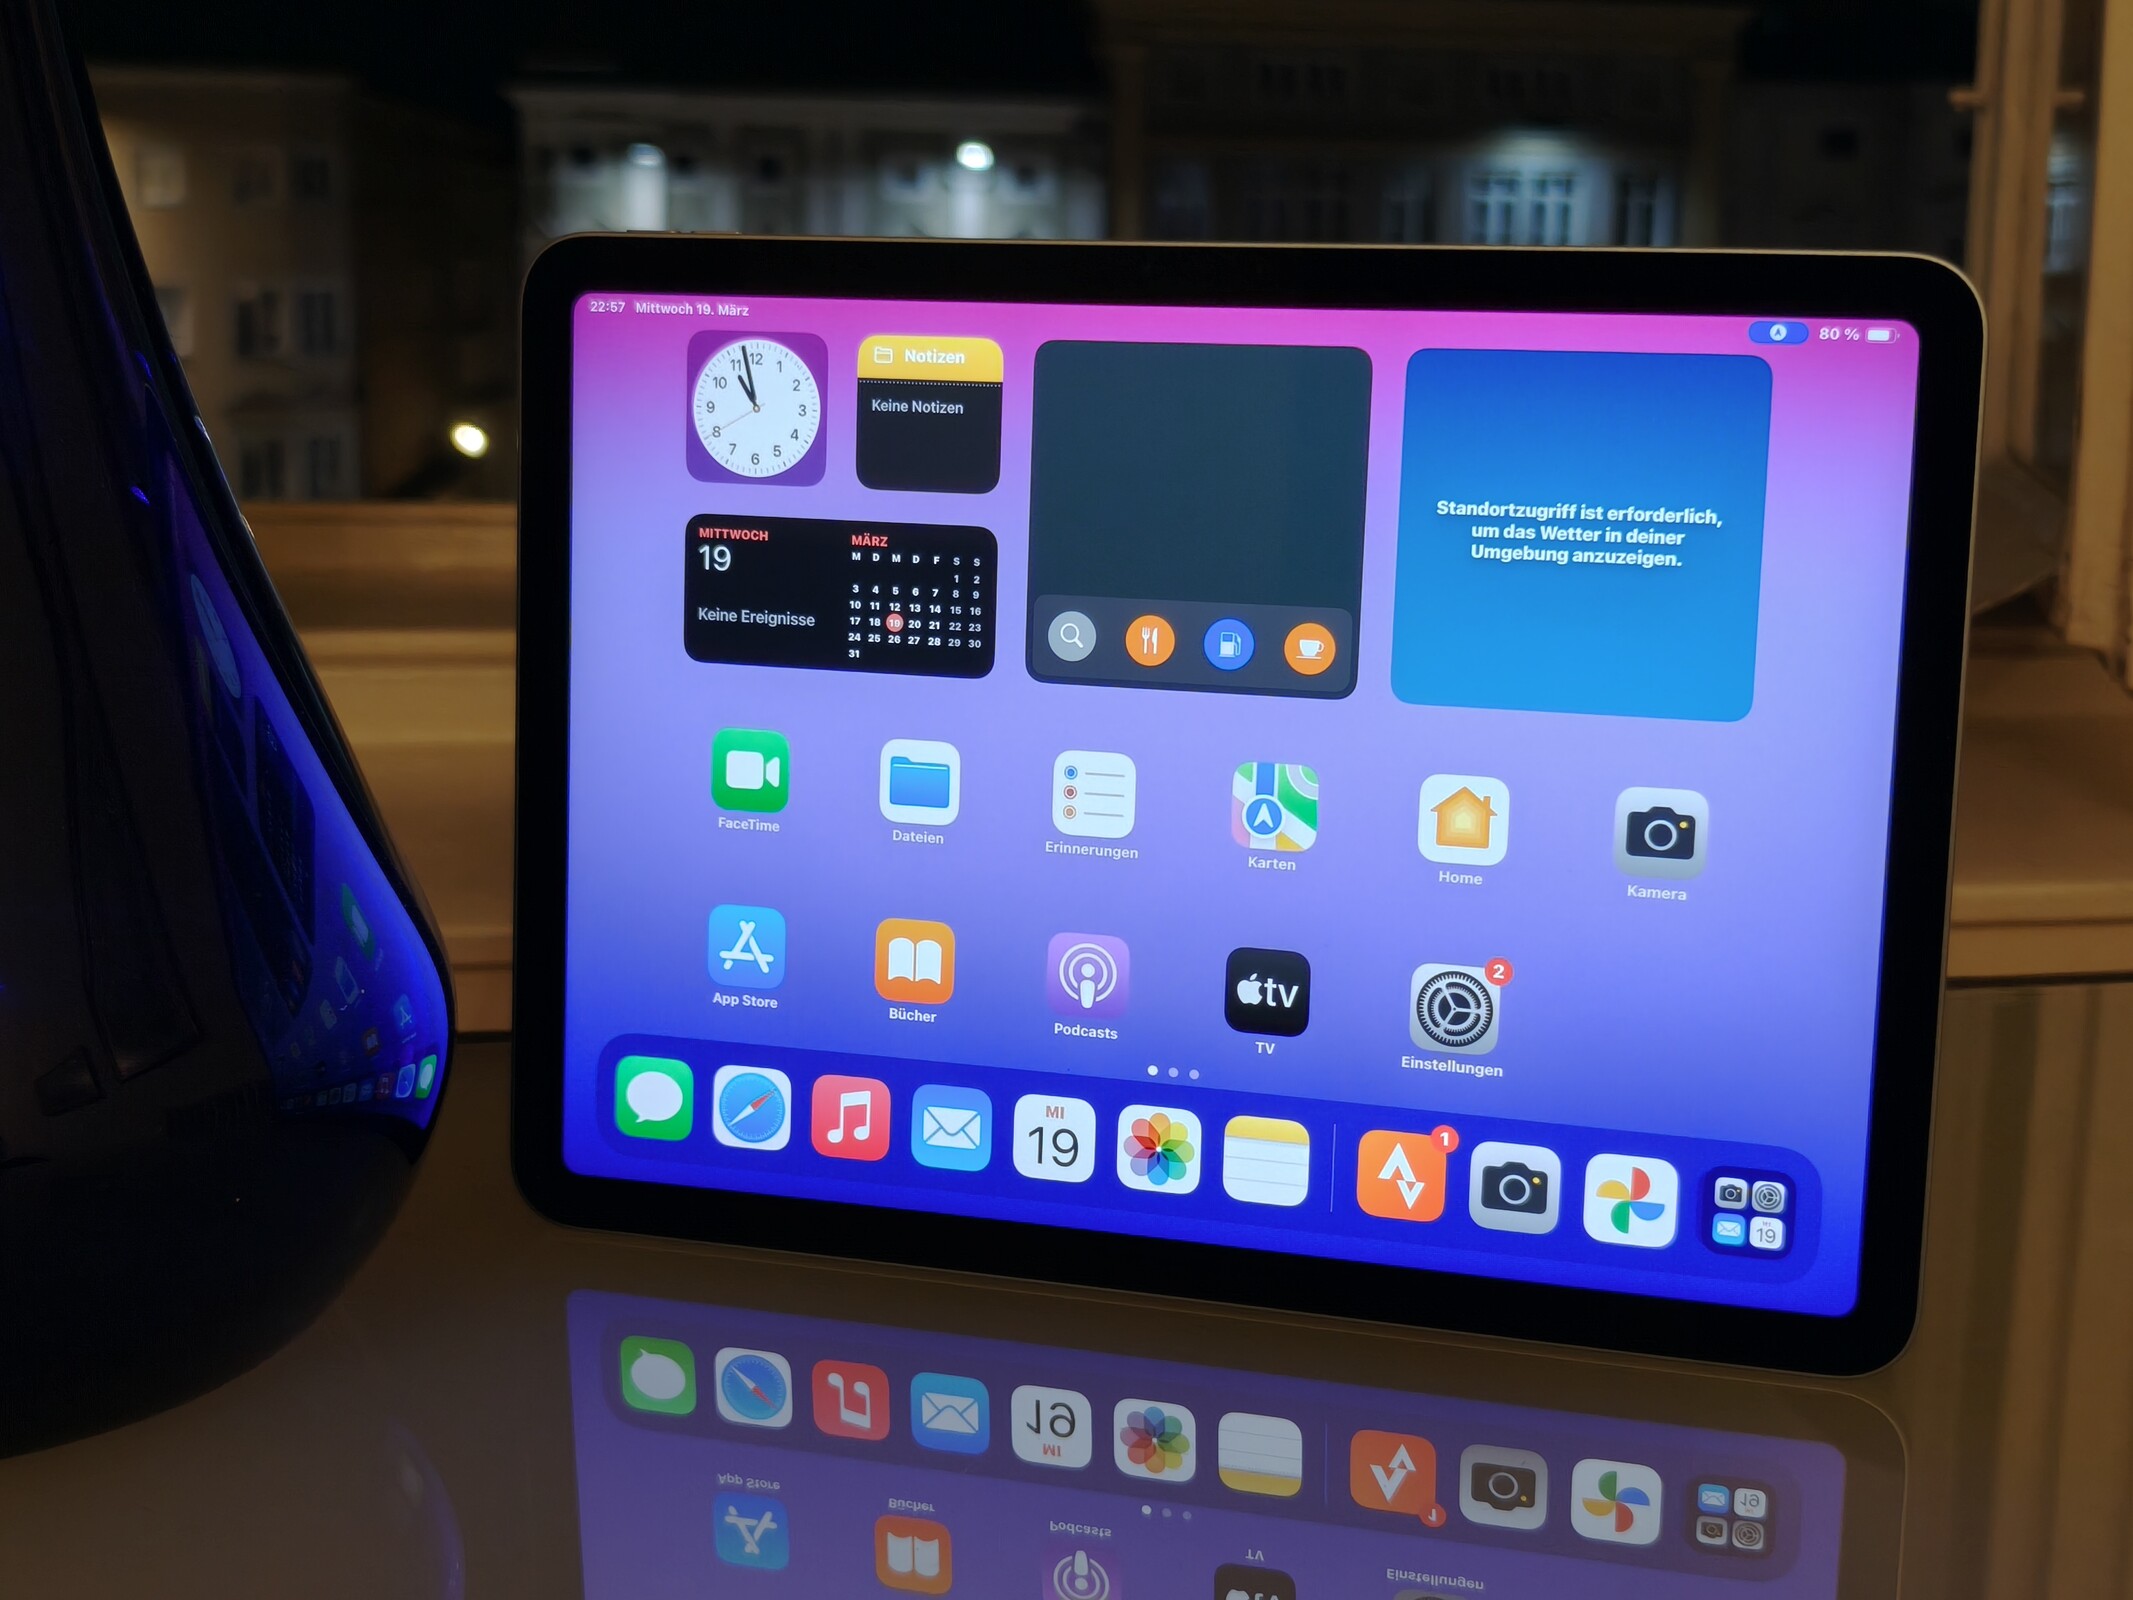
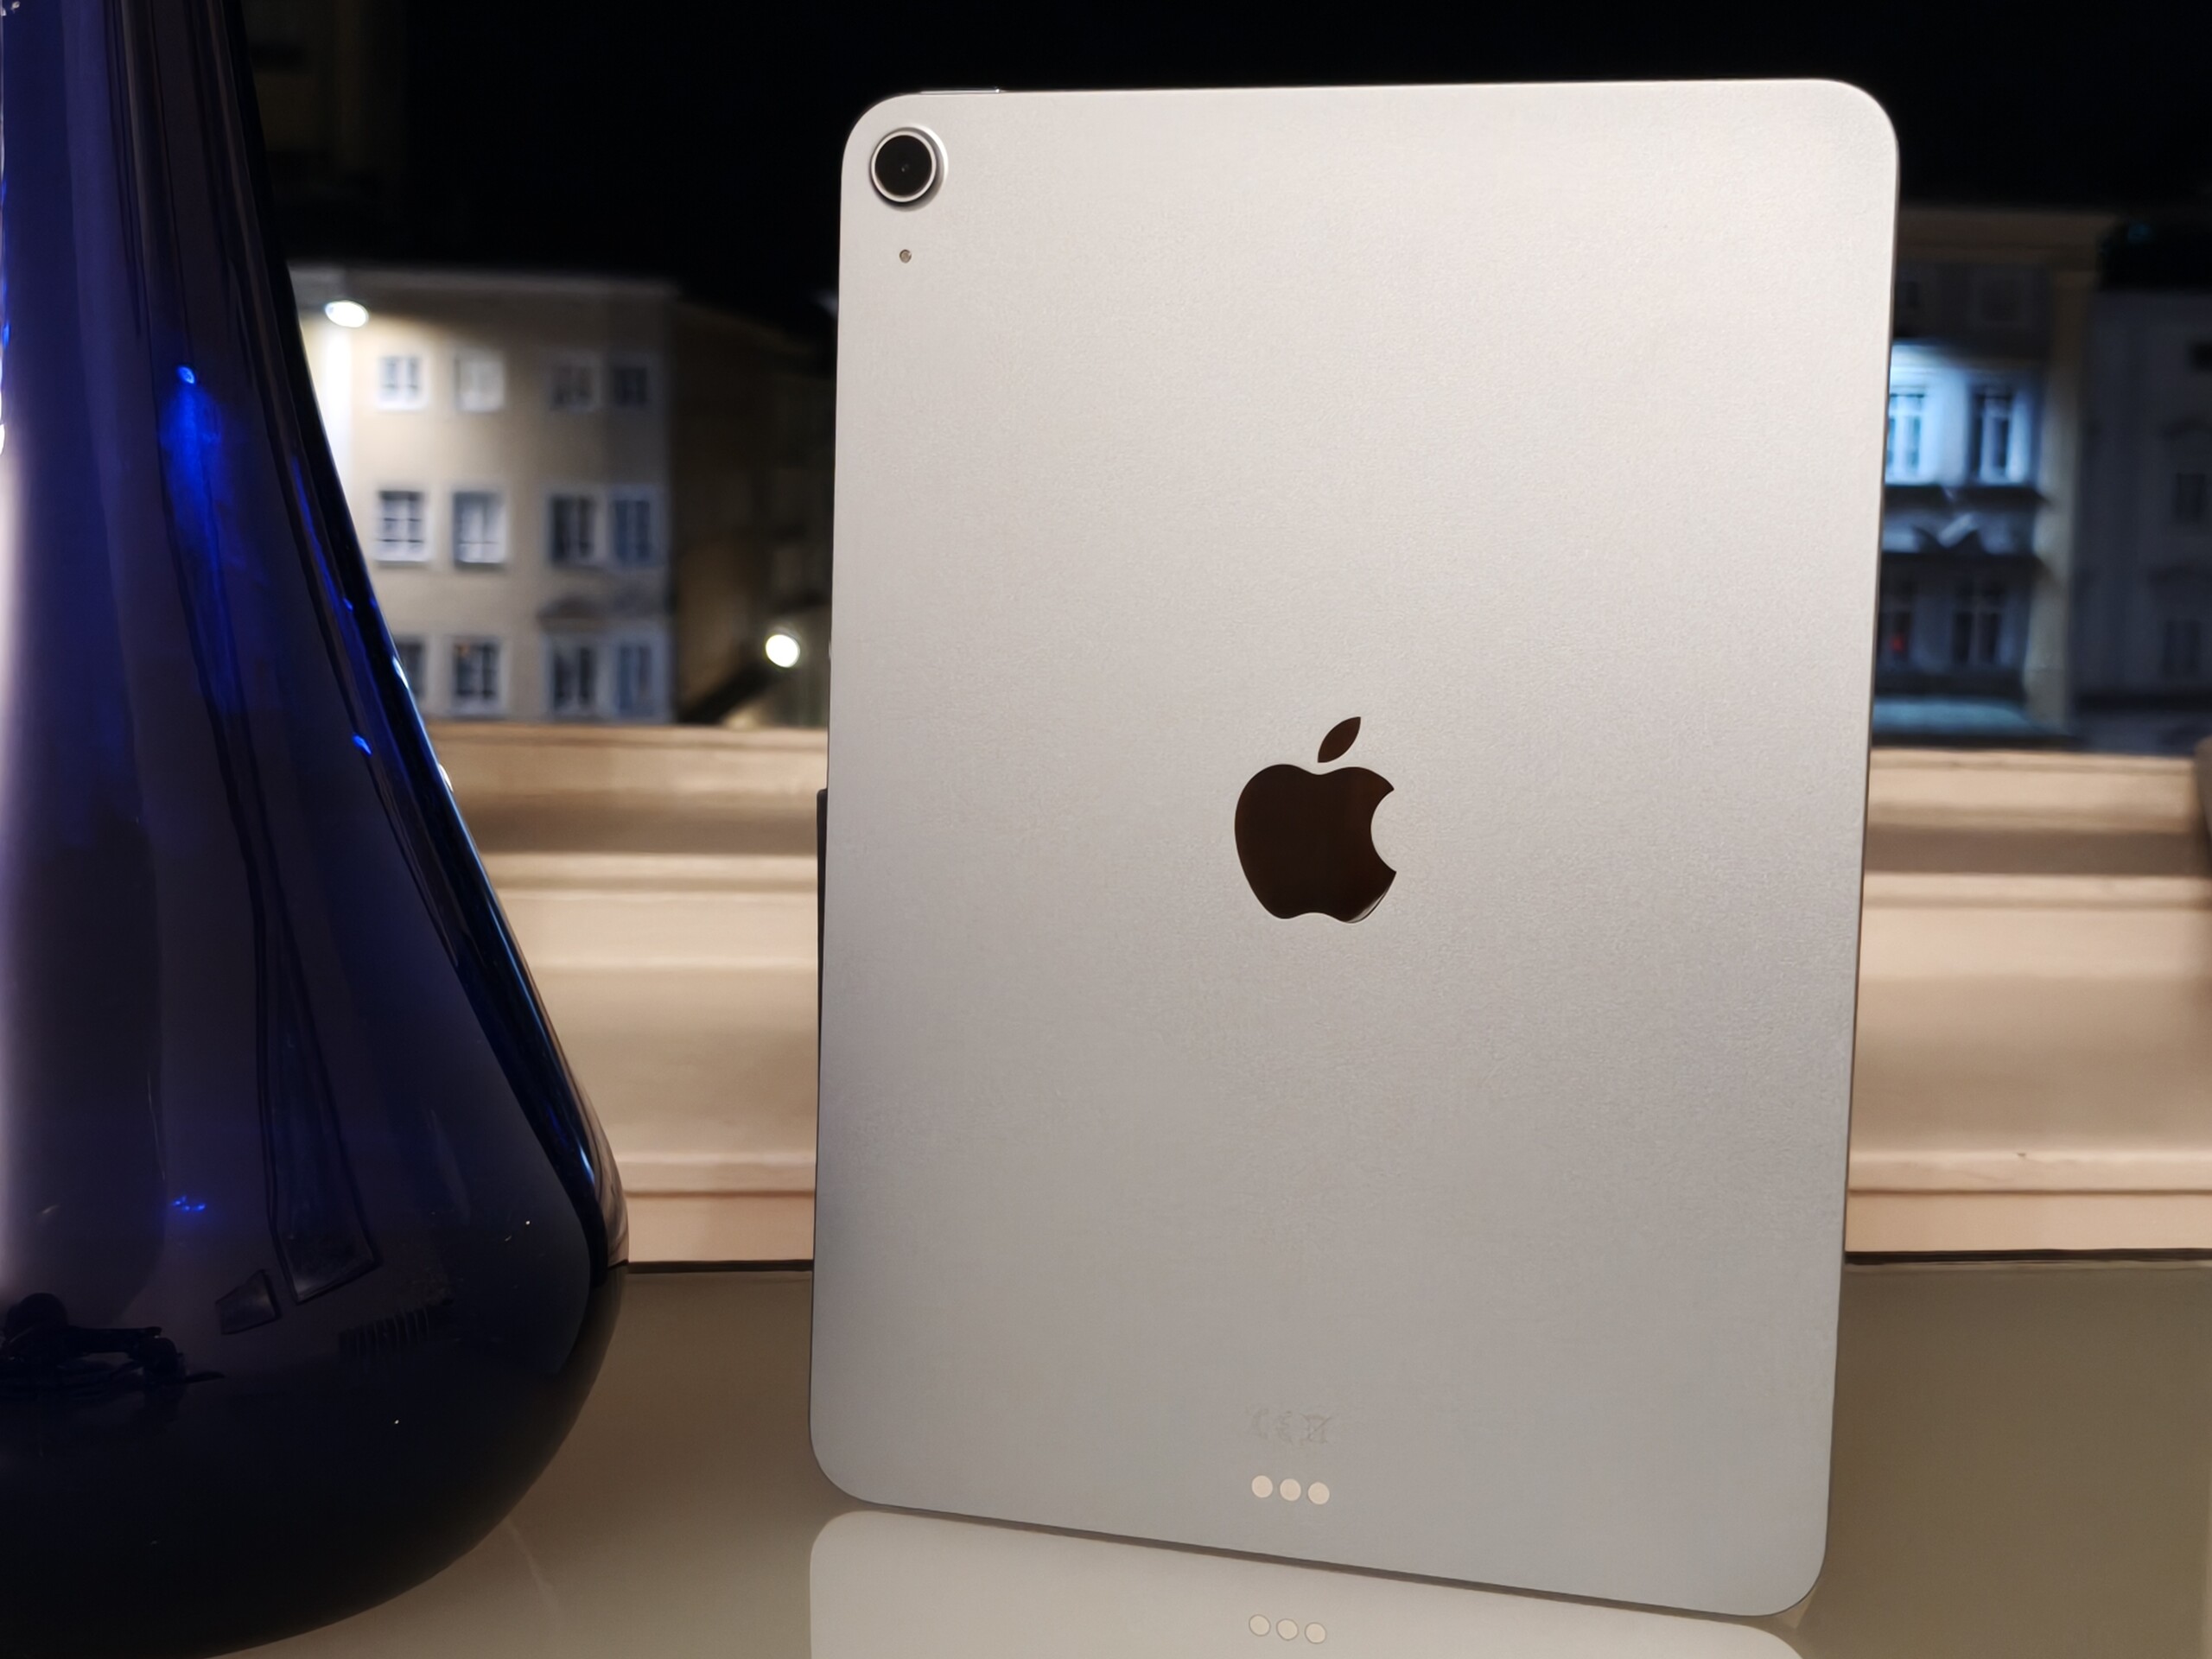
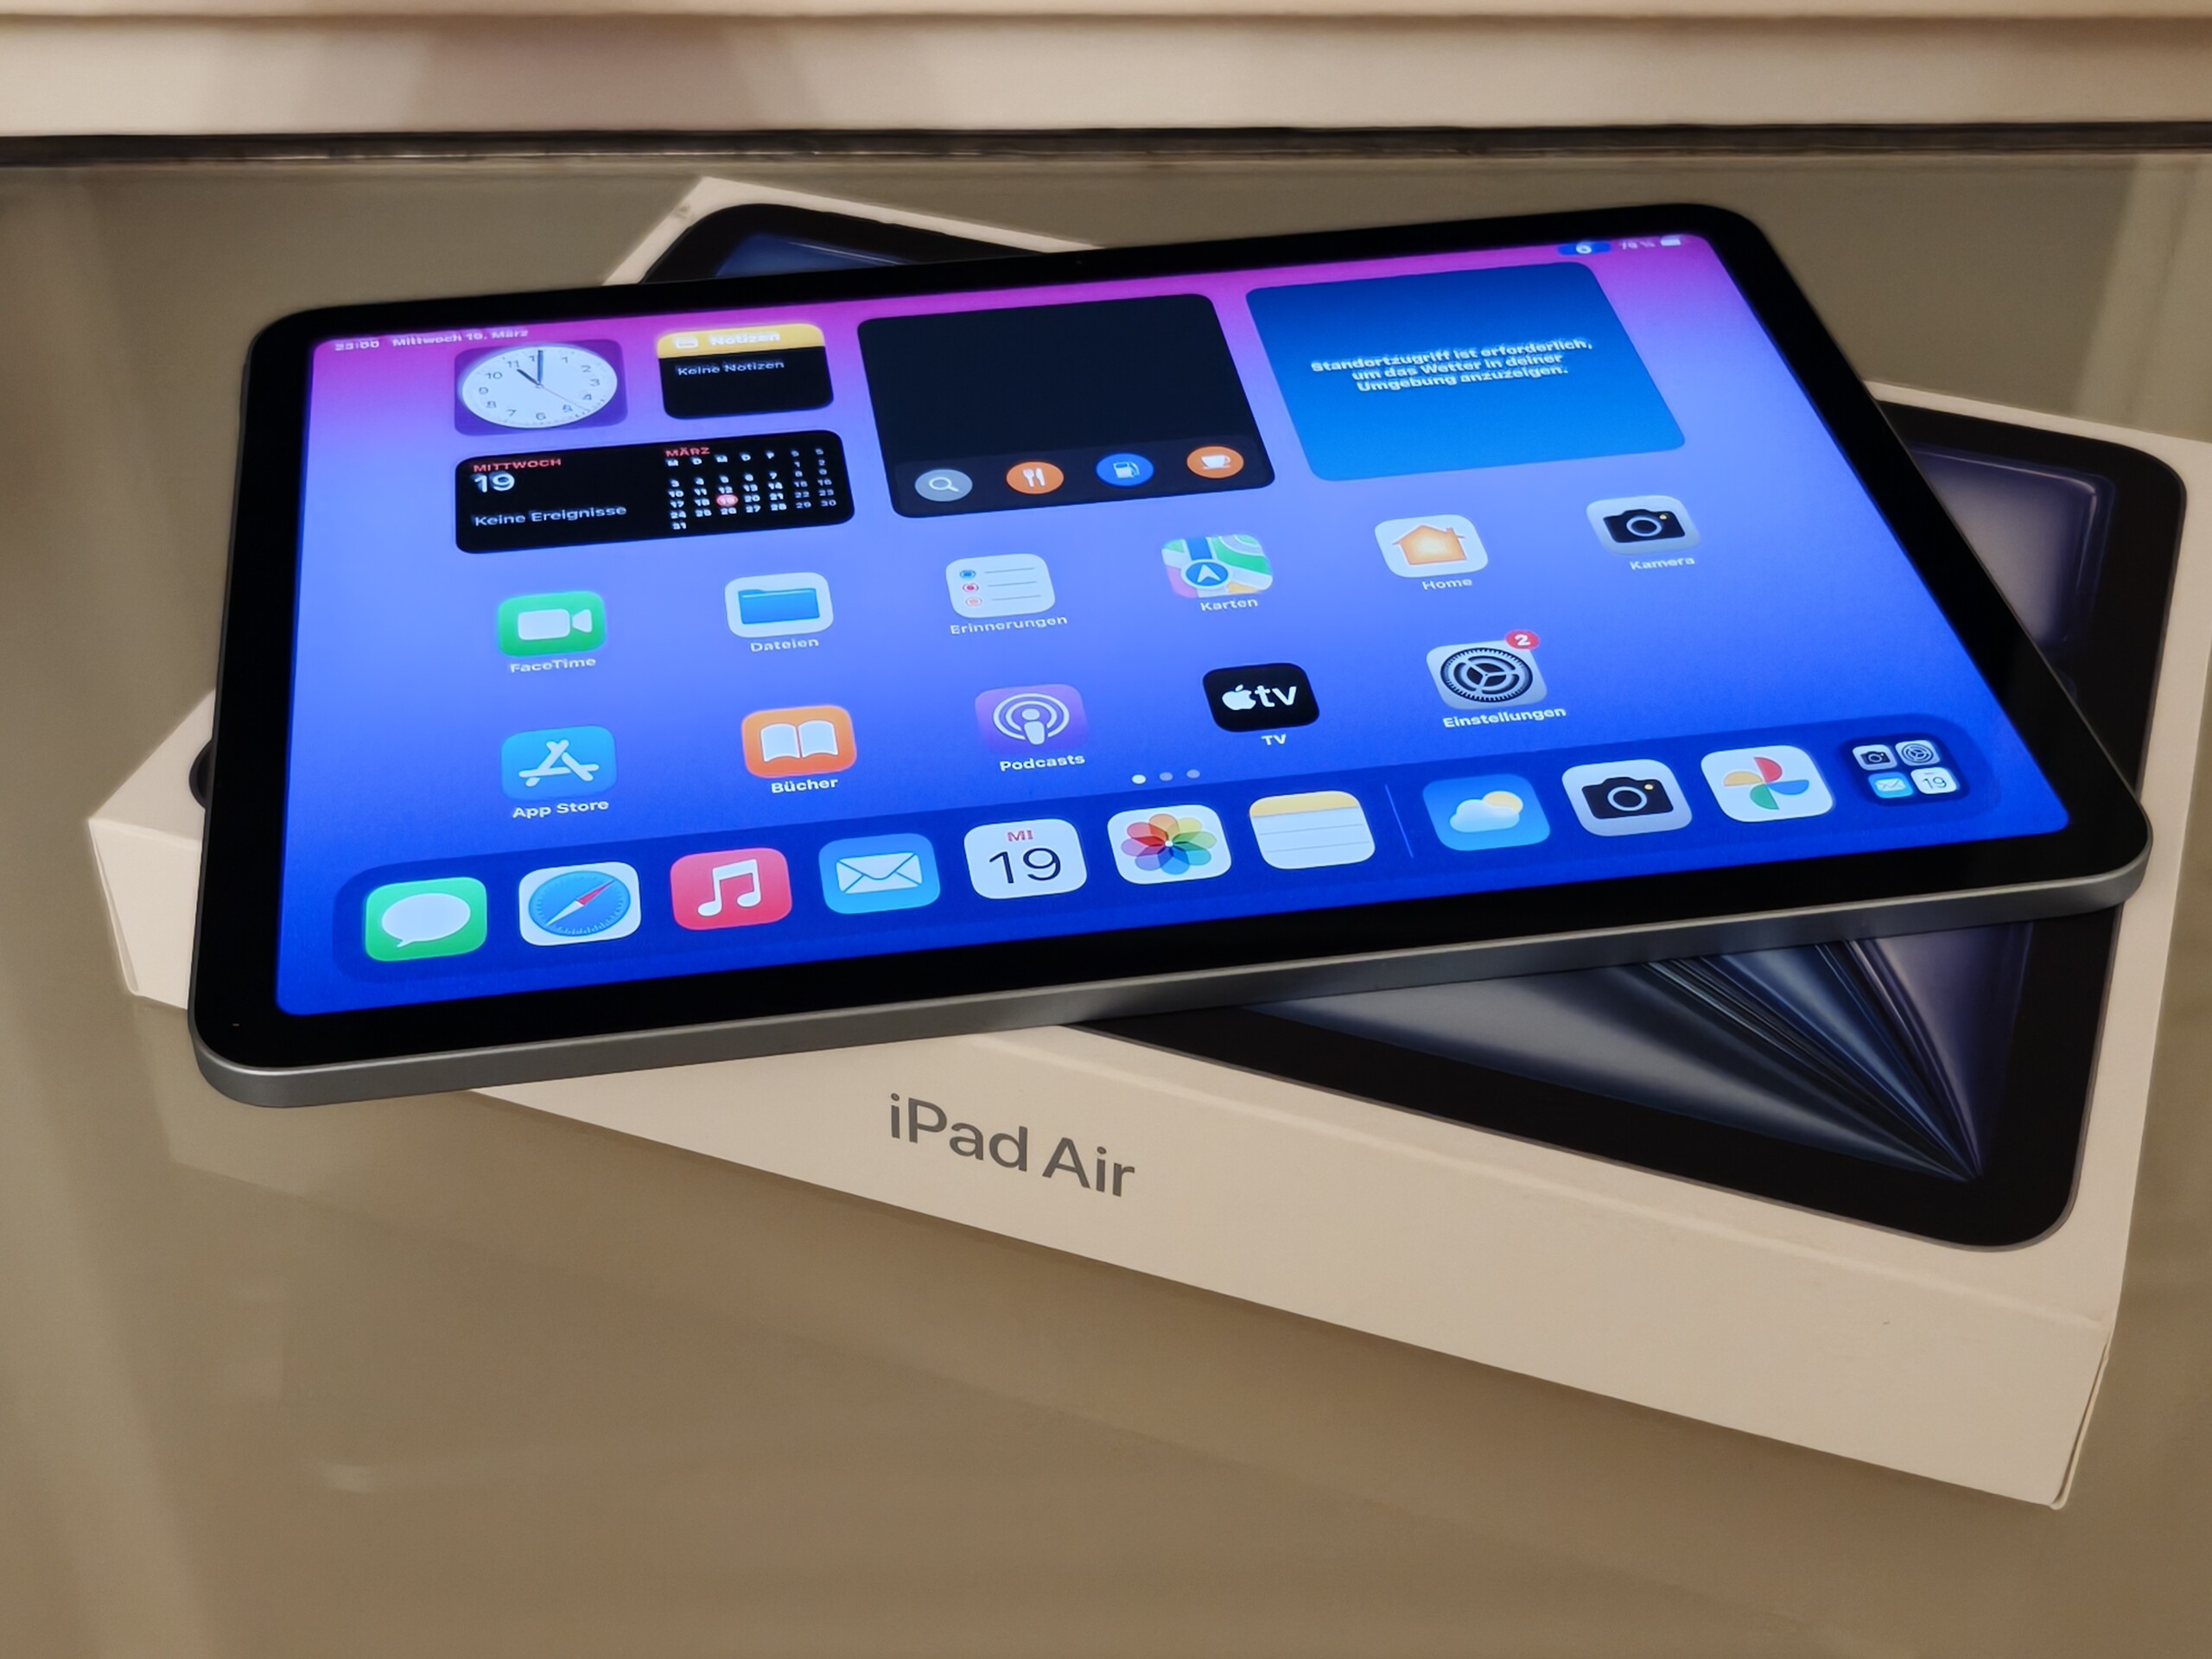
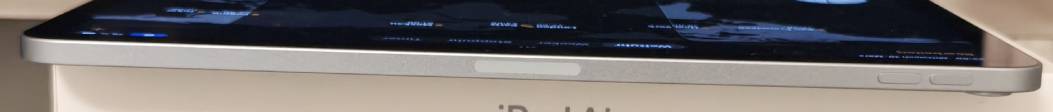
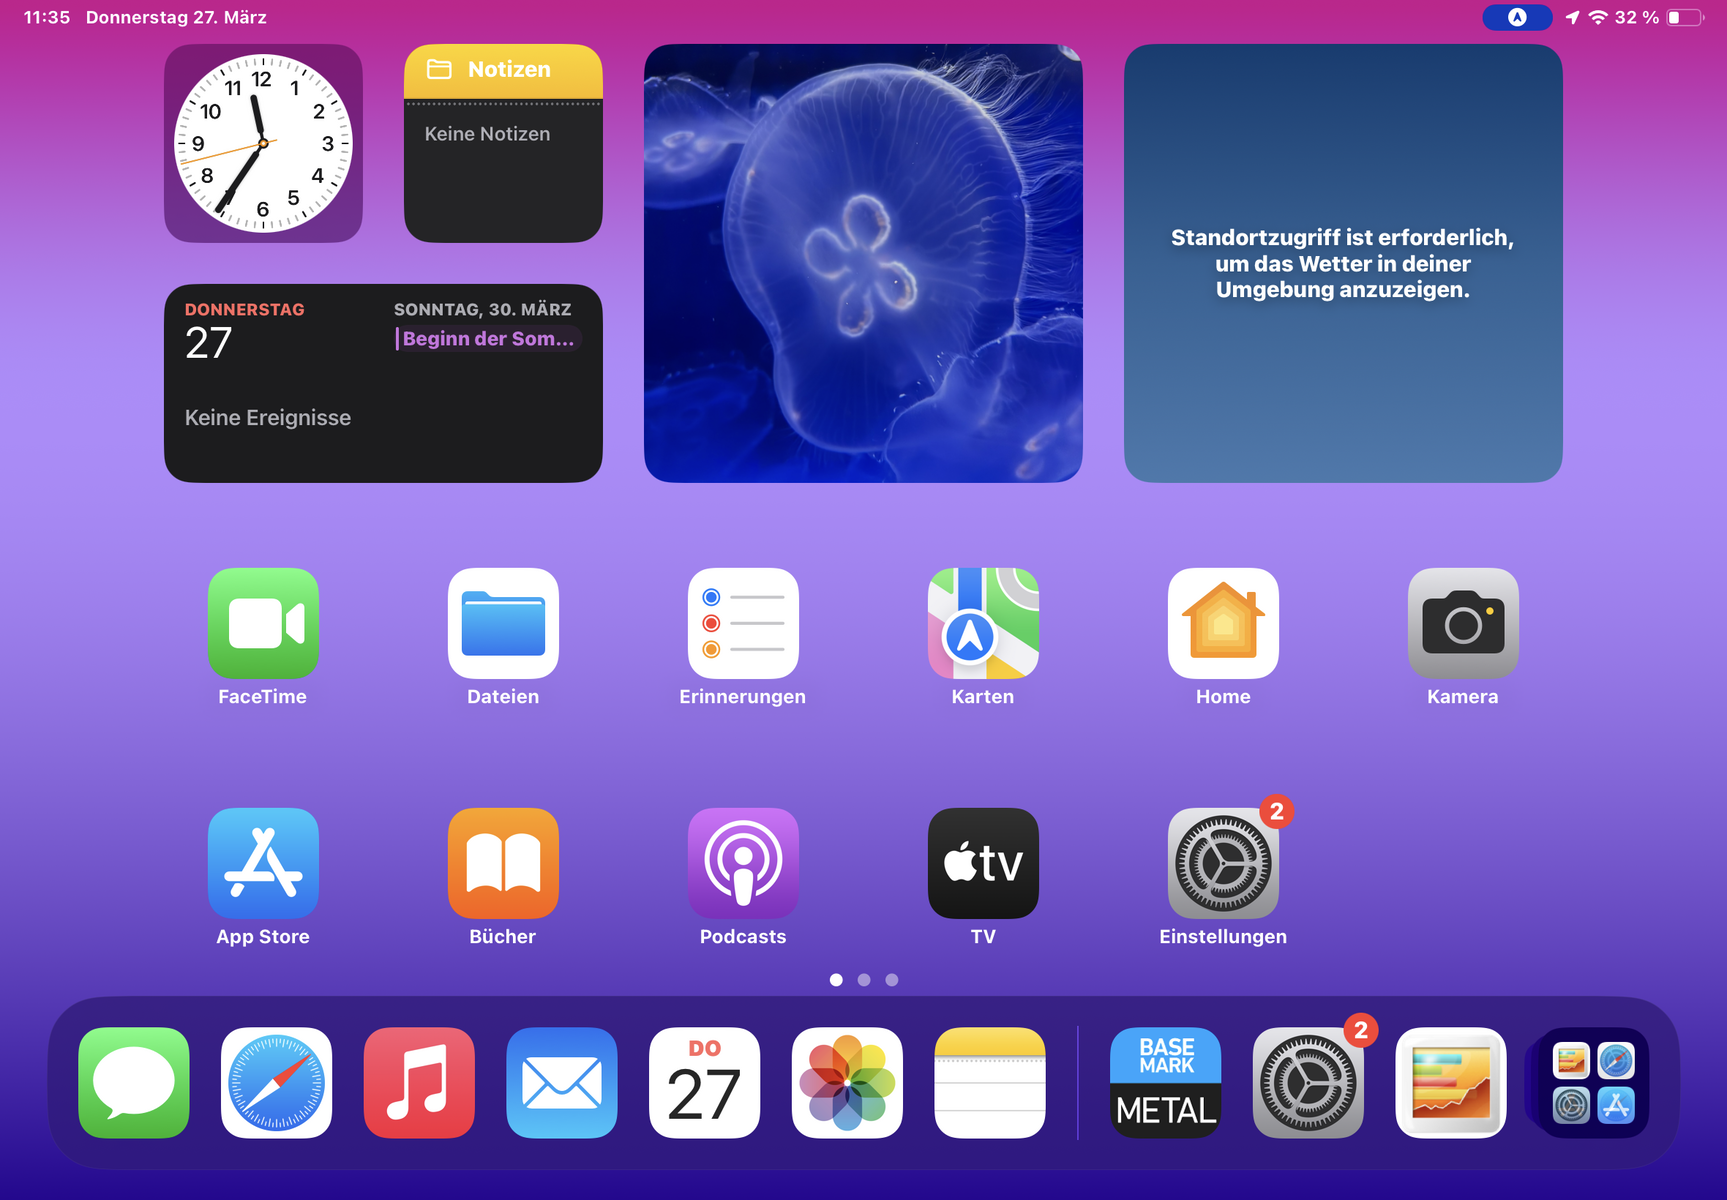
We hardly have anything more to say about Apple's build quality and the materials the manufacturer has chosen: The 11-inch iPad Air 2025 also features an aluminum unibody case and it feels great.
The tablet feels nice to hold and, at 460 grams, it doesn't feel too heavy even after long periods of time. The bezels around its screen aren't too wide, making the front look modern, yet they effectively prevent you from accidentally activating the touchscreen. Even so, the Apple iPad Air 13 (2025) looks even more stylish in this respect, as its edges are similarly wide but with a larger screen area.
The available color variants include soft pastel shades, so the tablet blends in well in any environment. A few splashes of water are usually not a problem for the device, but like all iPads, the iPad Air 11 (2025) is generally not protected against water or dust.

Connectivity – How much storage does the iPad Air 11 have?
The 11-inch model is much more affordable than the iPad Air 13 (2025). The prices haven't changed compared to the previous model:
- 8 GB RAM, 128 GB ROM: $599 (WiFi) / $749 (WiFi + Cellular)
- 8 GB RAM, 256 GB ROM: $699 (WiFi) / $849 (WiFi + Cellular)
- 8 GB RAM, 512 GB ROM: $899 (WiFi) / $1,049 (WiFi + Cellular)
- 8 GB RAM, 1 TB ROM: $1,099 (WiFi) / $1,249 (WiFi + Cellular)
As you can see, updates to the iPad's mass storage are still disproportionately expensive.
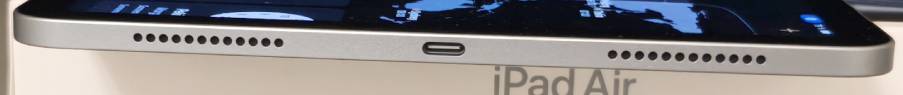
Apple has included a fast USB port with a data transfer rate of up to 10 GBit/s. It can also output screen signals up to a resolution of 6,016 x 3,384 pixels at a frame rate of 60Hz.
NFC is available, but you can still only use Apple Pay as a mobile payment service.


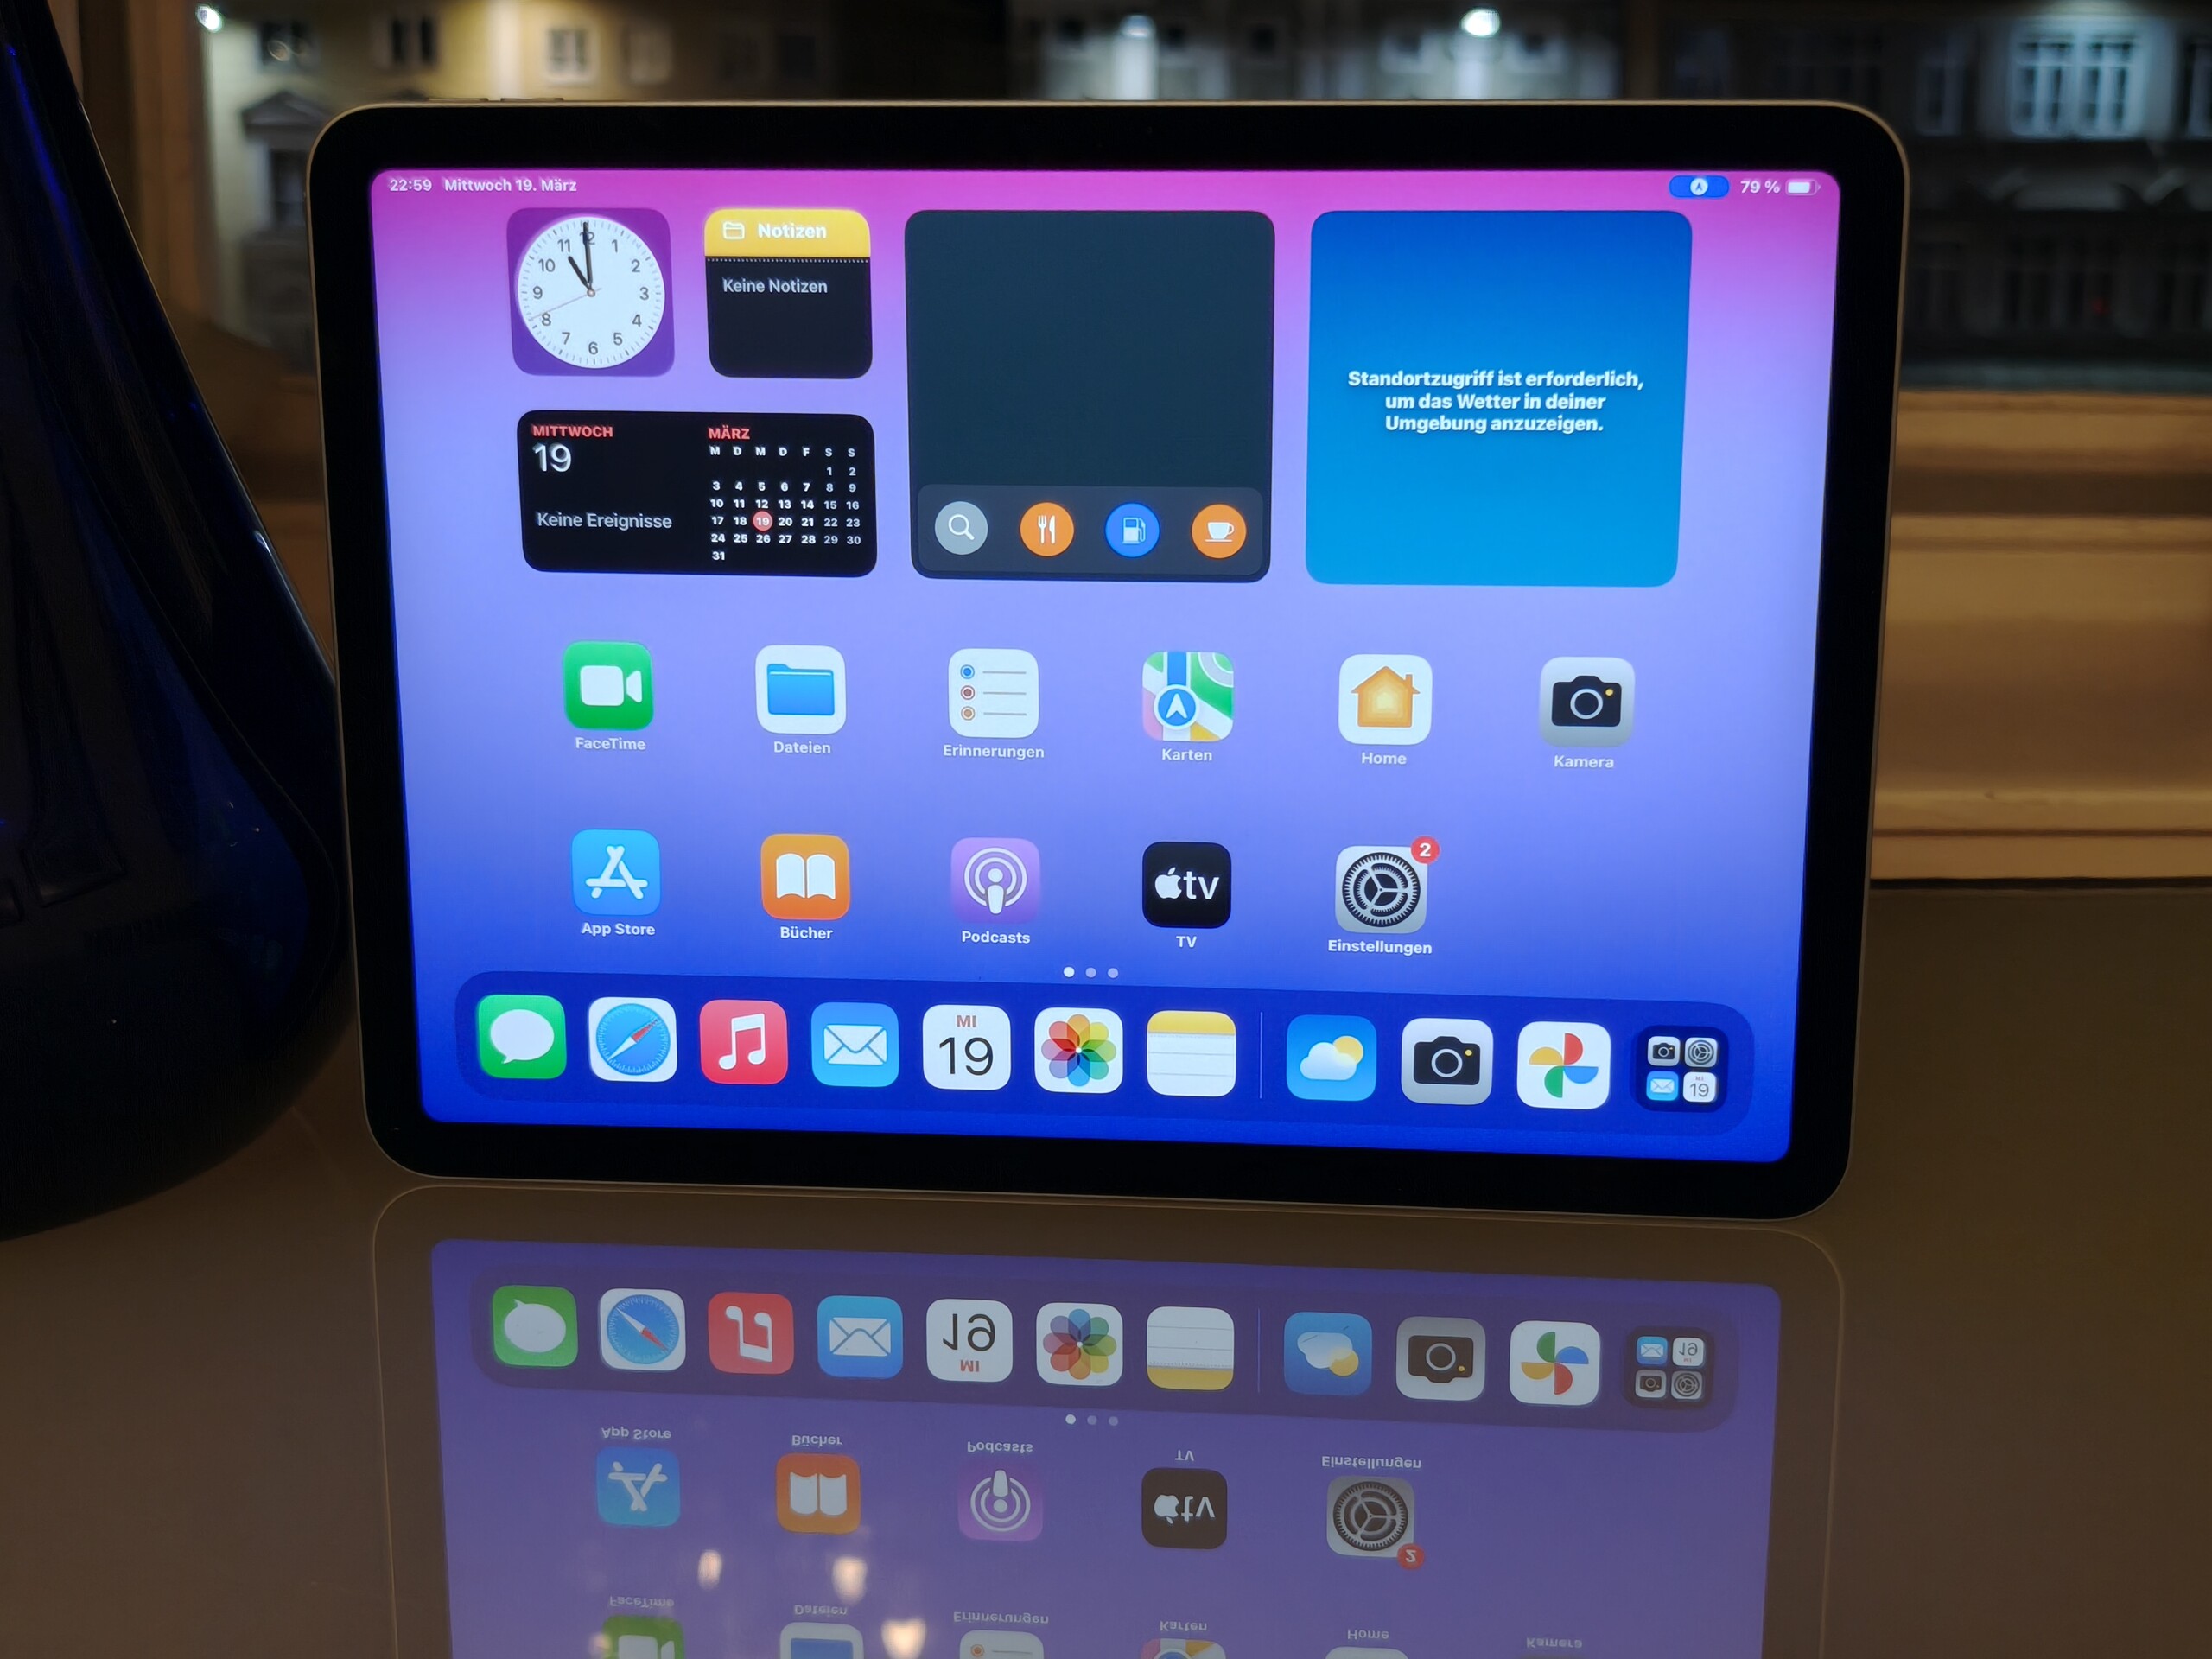
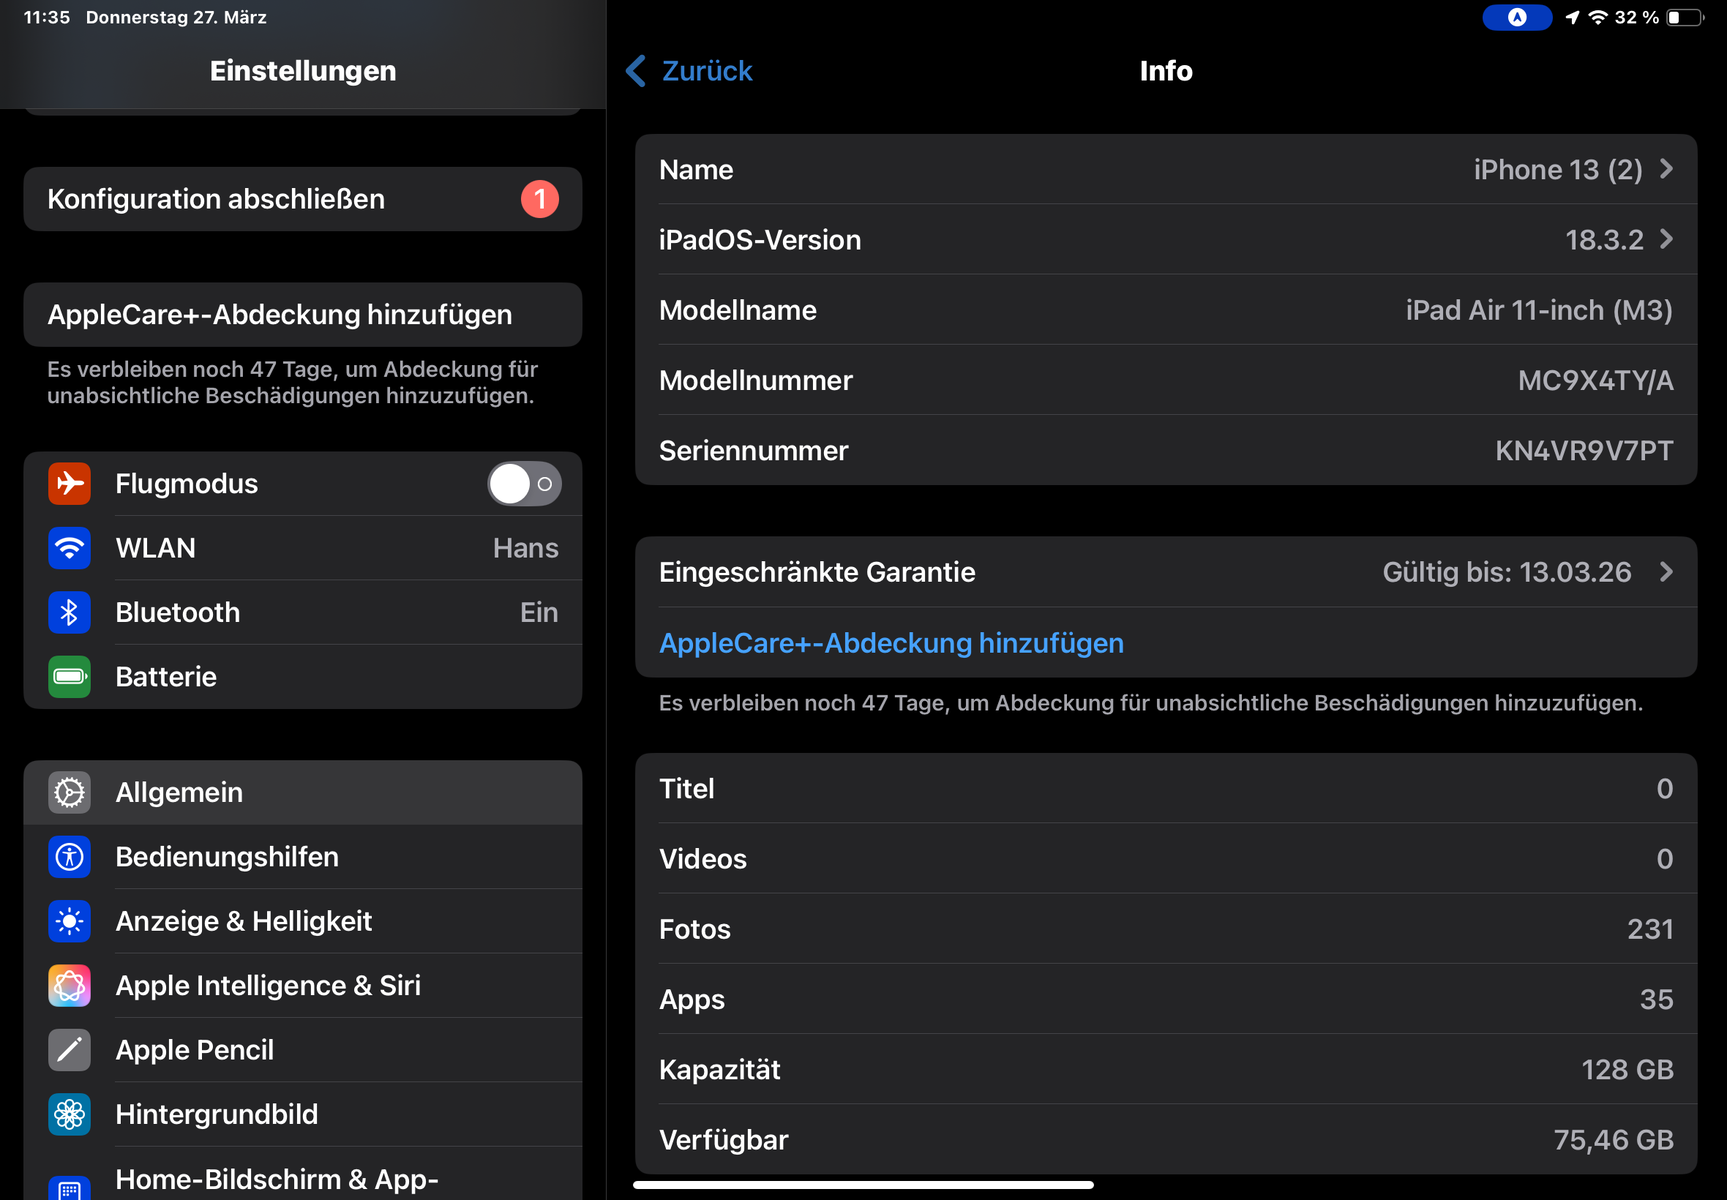
Software – Trying out Apple Intelligence for the first time
During our test, the tablet was updated to iPadOS 18.4, which brought one long-awaited innovation in particular: the activation of Apple Intelligence in Europe. You can now have your texts proofread or reworded directly on the iPad Air 11, generate images, create emojis from faces and then insert them into messages and, above all, Siri has been revised and now feels much more like a truly modern AI assistant.
Apple attaches great importance to data protection and emphasizes that many of its AI processes take place on the device and that when something is transmitted to the server and processed there, it should be end-to-end encrypted. Also a good aspect: Lots of the functions are currently available free of charge, only the integrated ChatGPT (which can also be switched off) limits daily use without a paid subscription.
Apple doesn't officially state how long new software versions for the iPad Air will be available. However, iPadOS 18 still supports 6-year-old devices, so we can assume a long support period.
Sustainability
Apple has shown great commitment to sustainability. For example, the CO2 footprint over the product's service life is precisely specified to help you compare different products: In this case, 76 kg was determined for the smallest storage configuration. A comprehensive environmental report on the product is also available on Apple's website.
The manufacturer has already gone so far as to use only recycled aluminum for the tablet's case, and many other minerals are now also recycled.
Furthermore, Apple has its own website for self-repair and where you can order spare parts. However, this is not yet possible for iPads.
Communication and GNSS – The iPad Air 11 has WiFi 6E
WiFi 6E is once again the fastest standard that the Apple iPad Air with an 11-inch screen supports for WiFi networks. This provides access to the 6 GHz band.
During our test using the Asus ROG Rapture AXE11000 reference router, our test device managed up to 1,554 MBit/s when downloading and over 1,100 MBit/s when uploading. As a result, it should be able to fully utilize most internet lines. Minor drops in its transfer rates were visible during our test and were also repeated. But overall, its data rates were quite stable.
We tested a WLAN-only model, but tablets with 5G support are also available. In this case, however, it only supports eSIMs; the iPad Air doesn't have a slot for physical SIM cards. Our test device cannot be located via satellite and can only determine its approximate location via known Wi-Fi networks. Exact positioning, including for navigation purposes, is reserved for the 5G models.
| Networking | |
| iperf3 transmit AXE11000 | |
| Huawei MatePad 12 X | |
| Xiaomi Pad 7 Pro | |
| Average Wi-Fi 6E (227 - 1810, n=66) | |
| Average of class Tablet (10.5 - 1801, n=65, last 2 years) | |
| iperf3 receive AXE11000 | |
| Average Wi-Fi 6E (442 - 1787, n=68) | |
| Xiaomi Pad 7 Pro | |
| Huawei MatePad 12 X | |
| Average of class Tablet (40.2 - 1857, n=65, last 2 years) | |
| iperf3 transmit AXE11000 6GHz | |
| Average Wi-Fi 6E (229 - 1888, n=84) | |
| Average of class Tablet (330 - 2357, n=30, last 2 years) | |
| Apple iPad Air 11 2025 | |
| OnePlus Pad 2 | |
| Apple iPad Air 11 2024 | |
| iperf3 receive AXE11000 6GHz | |
| OnePlus Pad 2 | |
| Average of class Tablet (291 - 2349, n=30, last 2 years) | |
| Apple iPad Air 11 2025 | |
| Average Wi-Fi 6E (598 - 1874, n=84) | |
| Apple iPad Air 11 2024 | |
Cameras – Good tablet cameras

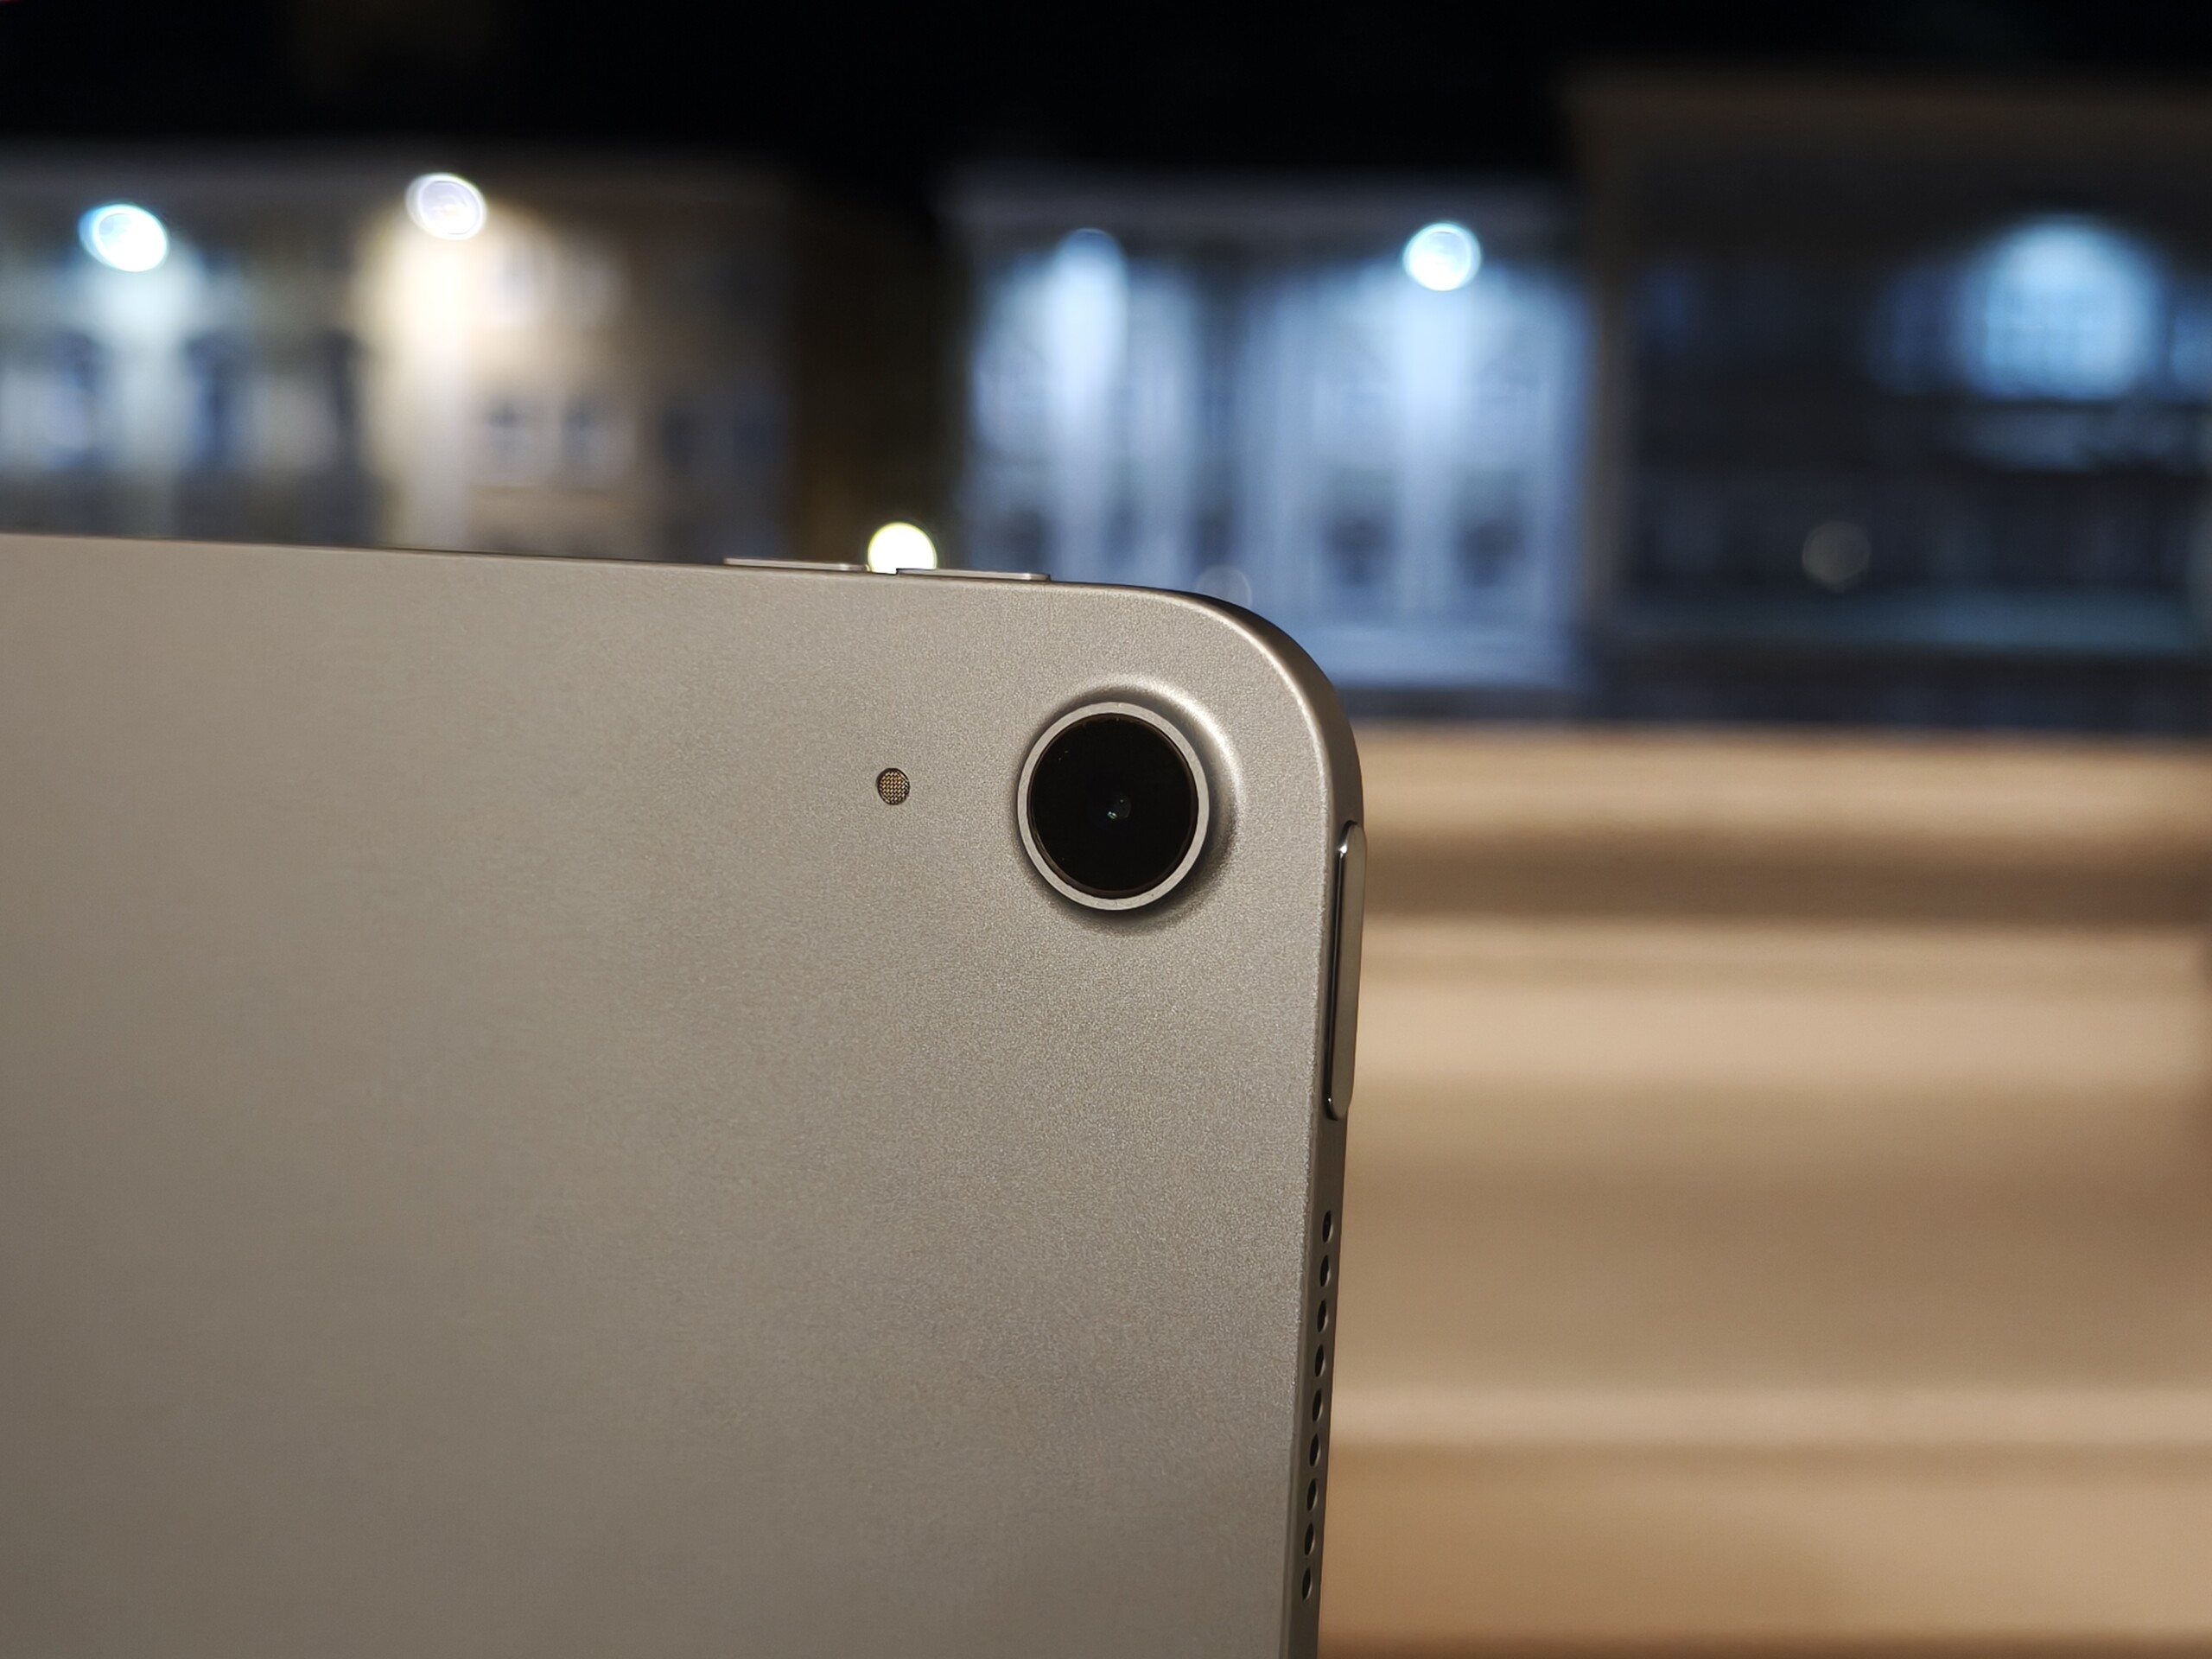
The iPad Air 11 (2025)'s camera features have remained unchanged: both the front and back have a 12-megapixel camera.
At first glance, there are hardly any noticeable differences compared to the previous generation: Objects in focus look natural, but the artificial bokeh effect shows some slight inaccuracies. In terms of detail, the camera can't compete with top-of-the-range smartphones, which offer a higher level of detail and sharpness. Even so, the iPad's image quality is still very good for a tablet.
Its weaknesses become more apparent in low light: dark areas aren't sufficiently brightened, and details were no longer recognizable at an illumination level of 1 lux in our test lab.
You can record videos in 4K at up to 60 frames per second. The fast and unobtrusive autofocus, as well as the videos' good sharpness, are impressive.
The front-facing camera delivers decent selfies, whose average sharpness only becomes noticeable on closer inspection.
Image comparison
Choose a scene and navigate within the first image. One click changes the position on touchscreens. One click on the zoomed-in image opens the original in a new window. The first image shows the scaled photograph of the test device.
Main camera plantMain camera surroundingsMain camera low light


Accessories and warranty – Improved accessories for the iPad
The iPad Air 11 only comes with a USB cable—no other accessories are included. If you need a charger, you will need to purchase one separately.
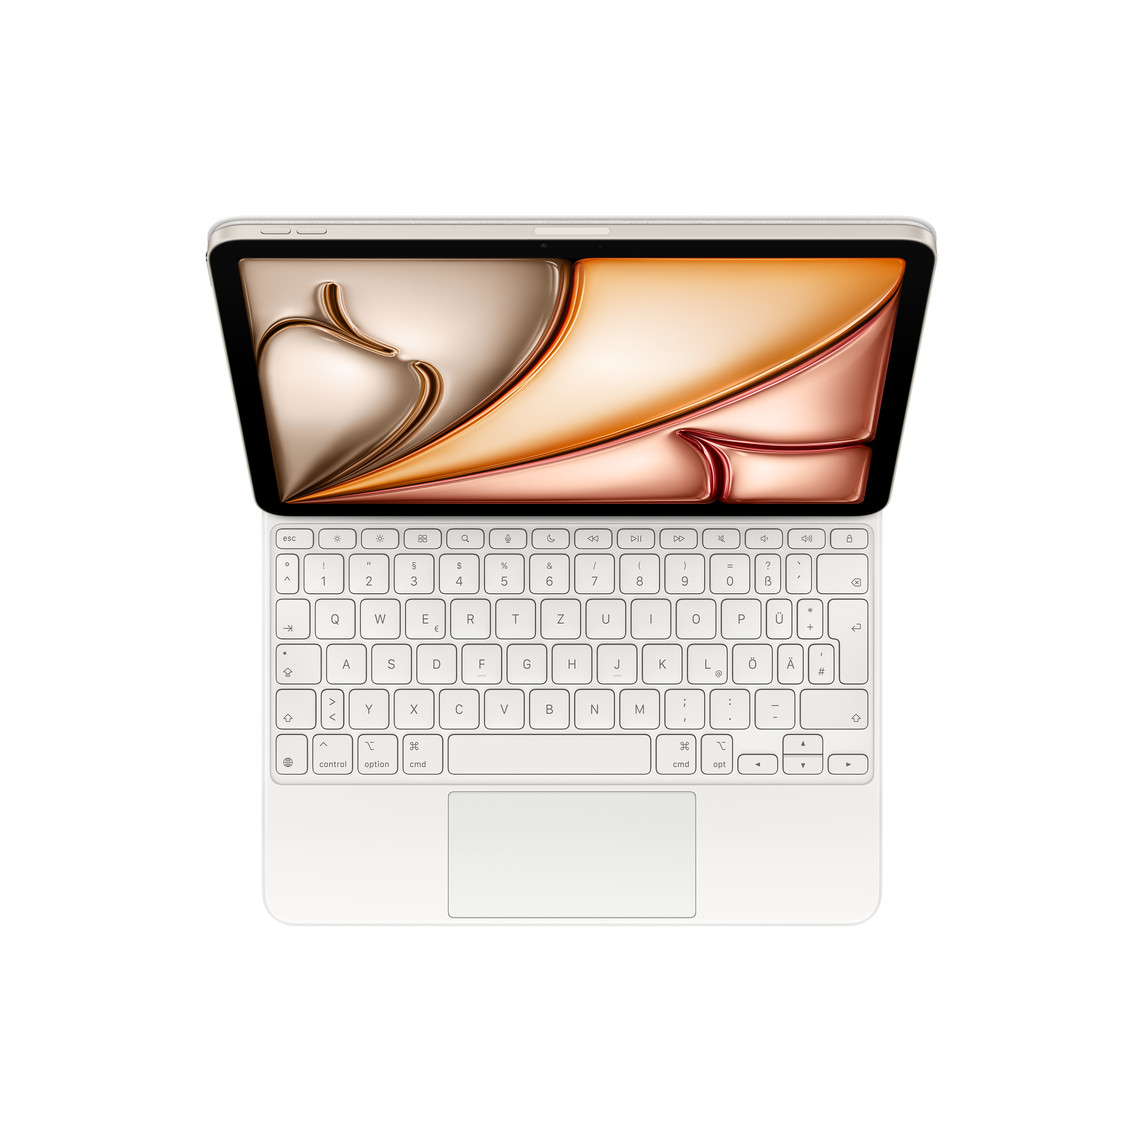
The improved Magic Keyboard, which is available for $269, is magnetically attached to the iPad Air 11 and has its own USB-C port. There are 14 new function keys for controlling media and display brightness.
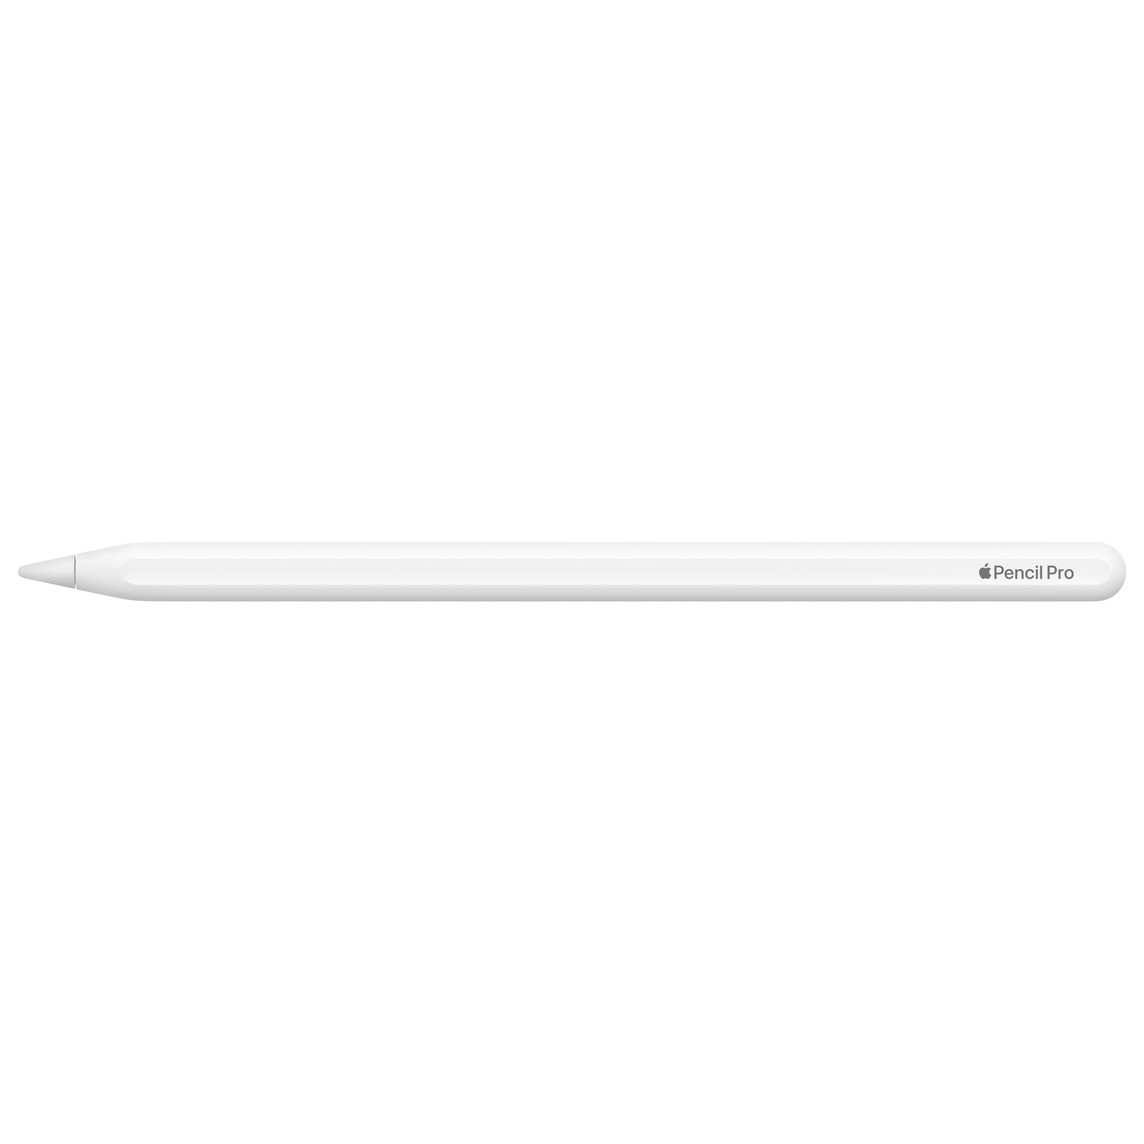
Users can continue to use the Apple Pencil or Apple Pencil Pro, both of which attach magnetically to the device.
The Apple tablet is covered by a one-year warranty. For more comprehensive protection, you can purchase AppleCare+, either for $3.99 per month or $39.99 a year until canceled. This package covers an unlimited number of accidental damages, with a small deductible per claim.
Input devices and operation – Still with a 60-Hz display
The iPad Air 11 (2025) features a precise touchscreen that is responsive right into the corners. However, Apple has once again gone for a 60 Hz display, which means that other tablets with higher refresh rates sometimes appear smoother when making inputs.
Instead of Face ID, the iPad Air has a reliable fingerprint sensor integrated into its standby button.
Display – Only around 500 nits
There are clear differences between the iPad Air 11 (2025) and its 13-inch counterpart when it comes to its display: the 11-inch model has a slightly lower resolution of 2,360 x 1,640 pixels, but has a pixel density of 265 PPI like its big sister model as a result of its smaller screen, so a very sharp display.
Both models use an IPS screen with a maximum refresh rate of 60 Hz, but the iPad Air 11 has a 3:2 aspect ratio, which is well-suited toward documents and displays less wide edges on modern movies than the iPad Air 13's 4:3 panel.
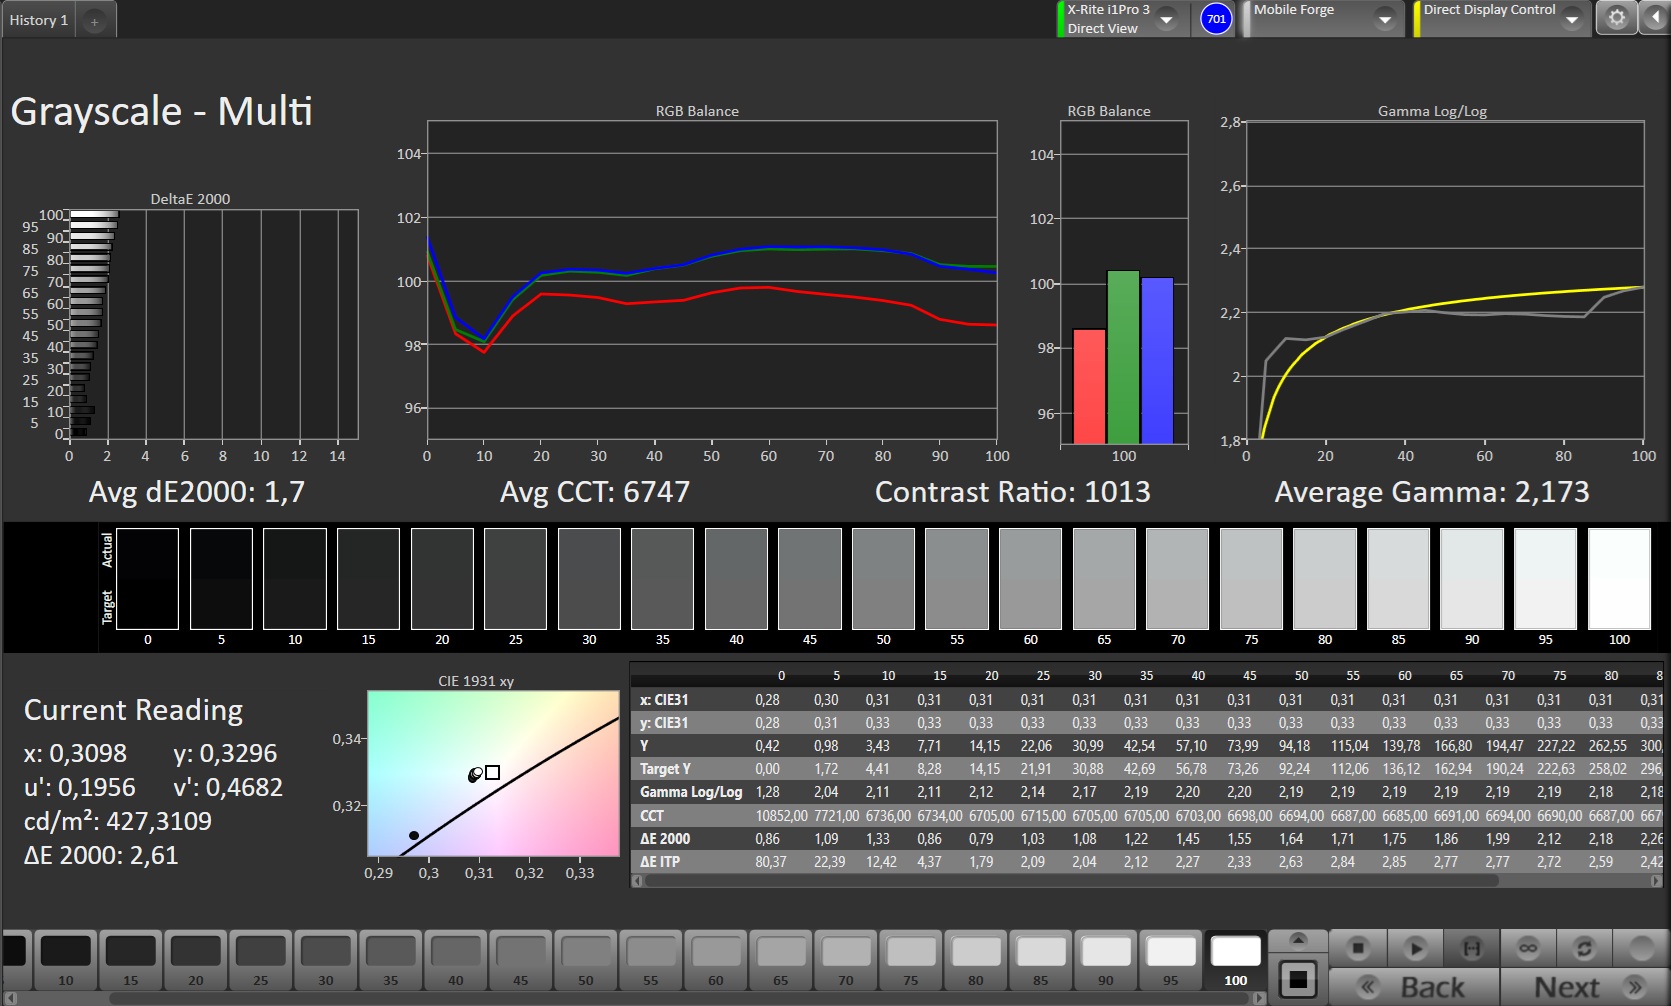
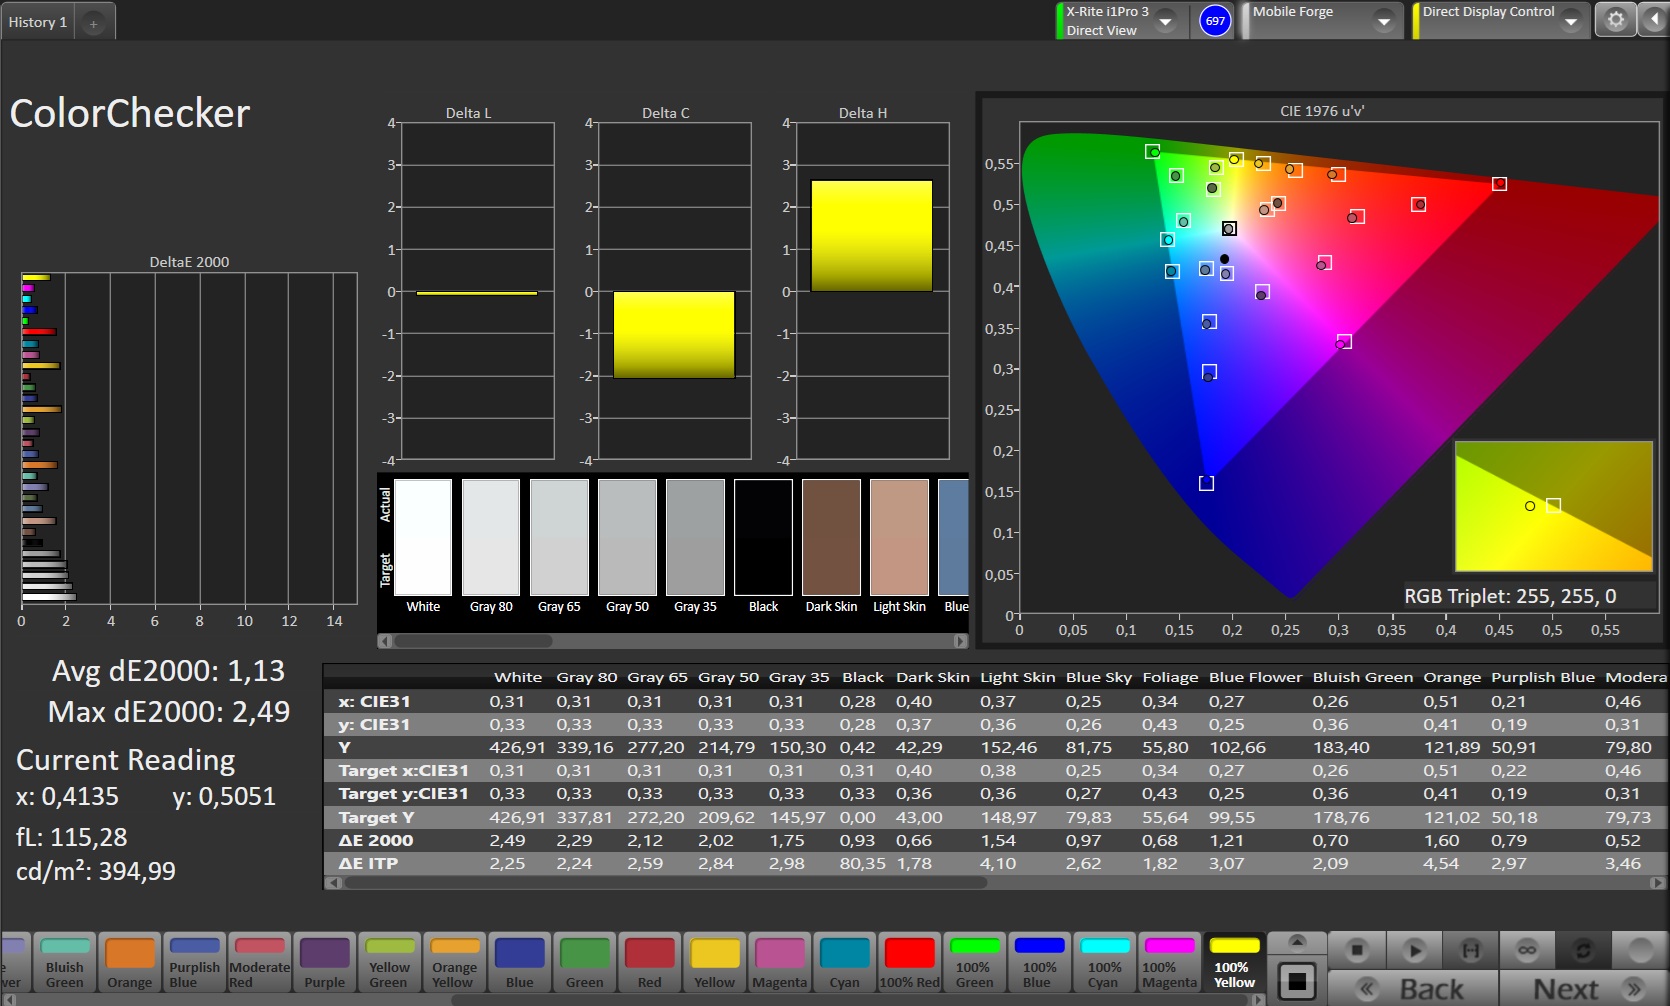
The display doesn't use PWM, but you'll have to accept a few compromises in terms of its brightness compared to the 13-inch model: On average, we noted a maximum brightness of below 500 cd/m², making the tablet primarily suitable for use in indoor areas that aren't too bright.
Although HDR protocols are supported, the display isn't ideal due to its comparatively low brightness.
| |||||||||||||||||||||||||
Brightness Distribution: 93 %
Center on Battery: 508 cd/m²
Contrast: 1016:1 (Black: 0.5 cd/m²)
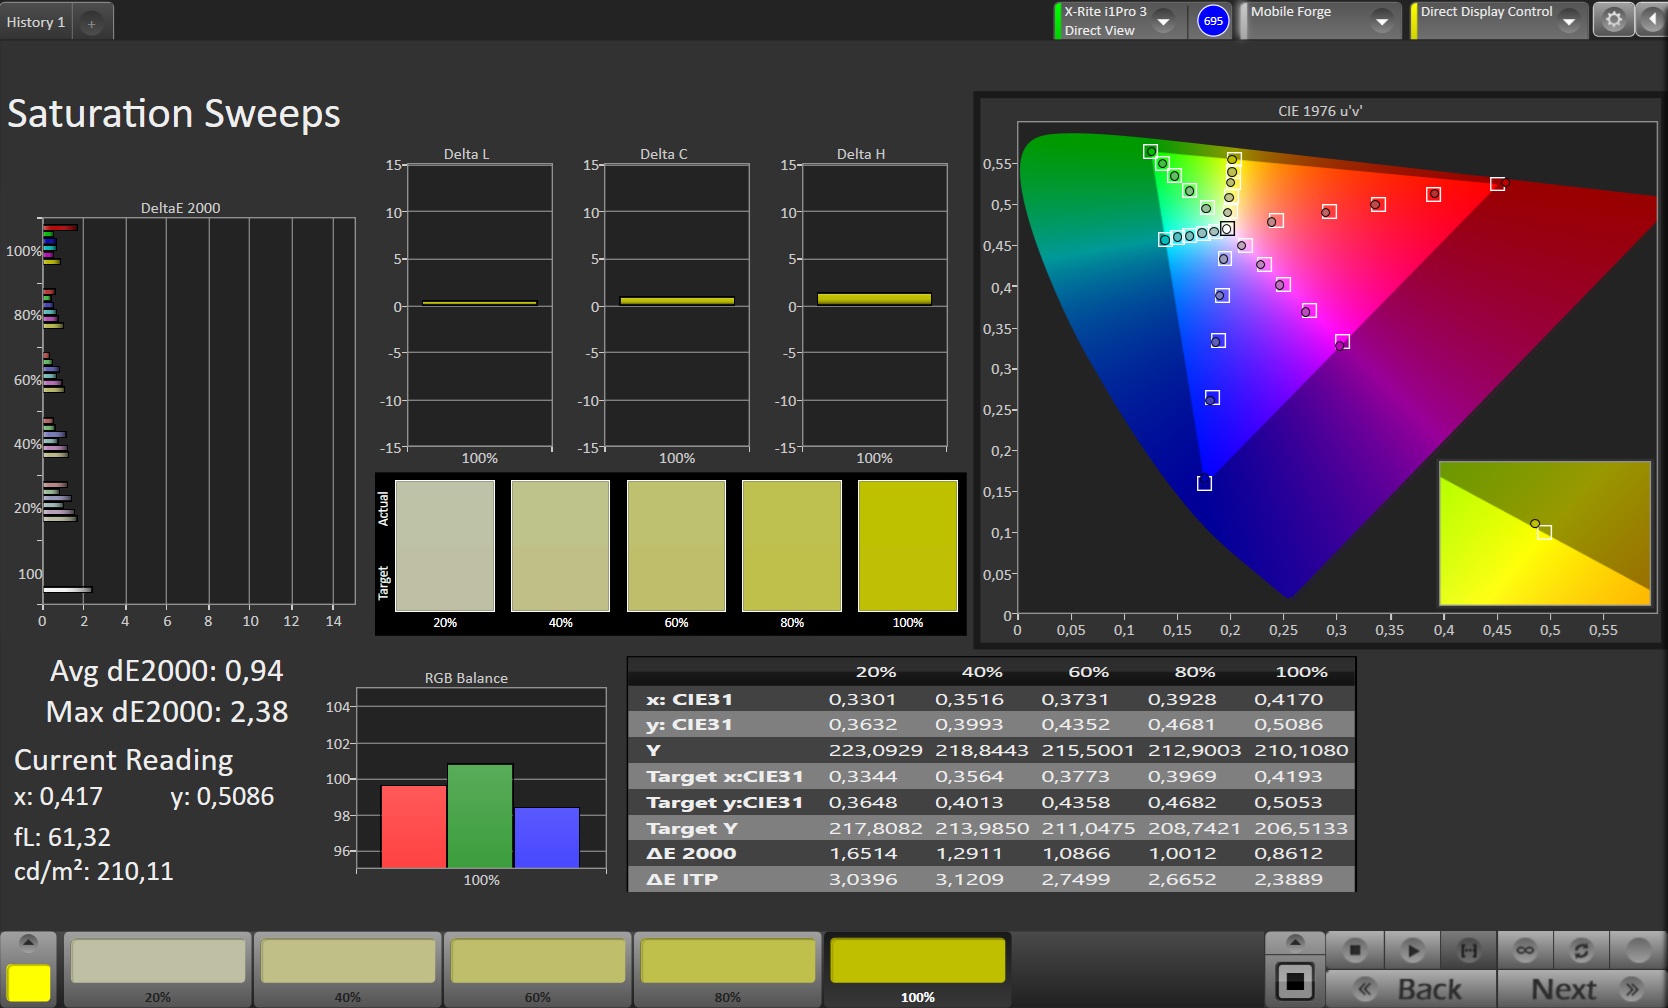
ΔE ColorChecker Calman: 1.13 | ∀{0.5-29.43 Ø4.71}
ΔE Greyscale Calman: 1.7 | ∀{0.09-98 Ø4.96}
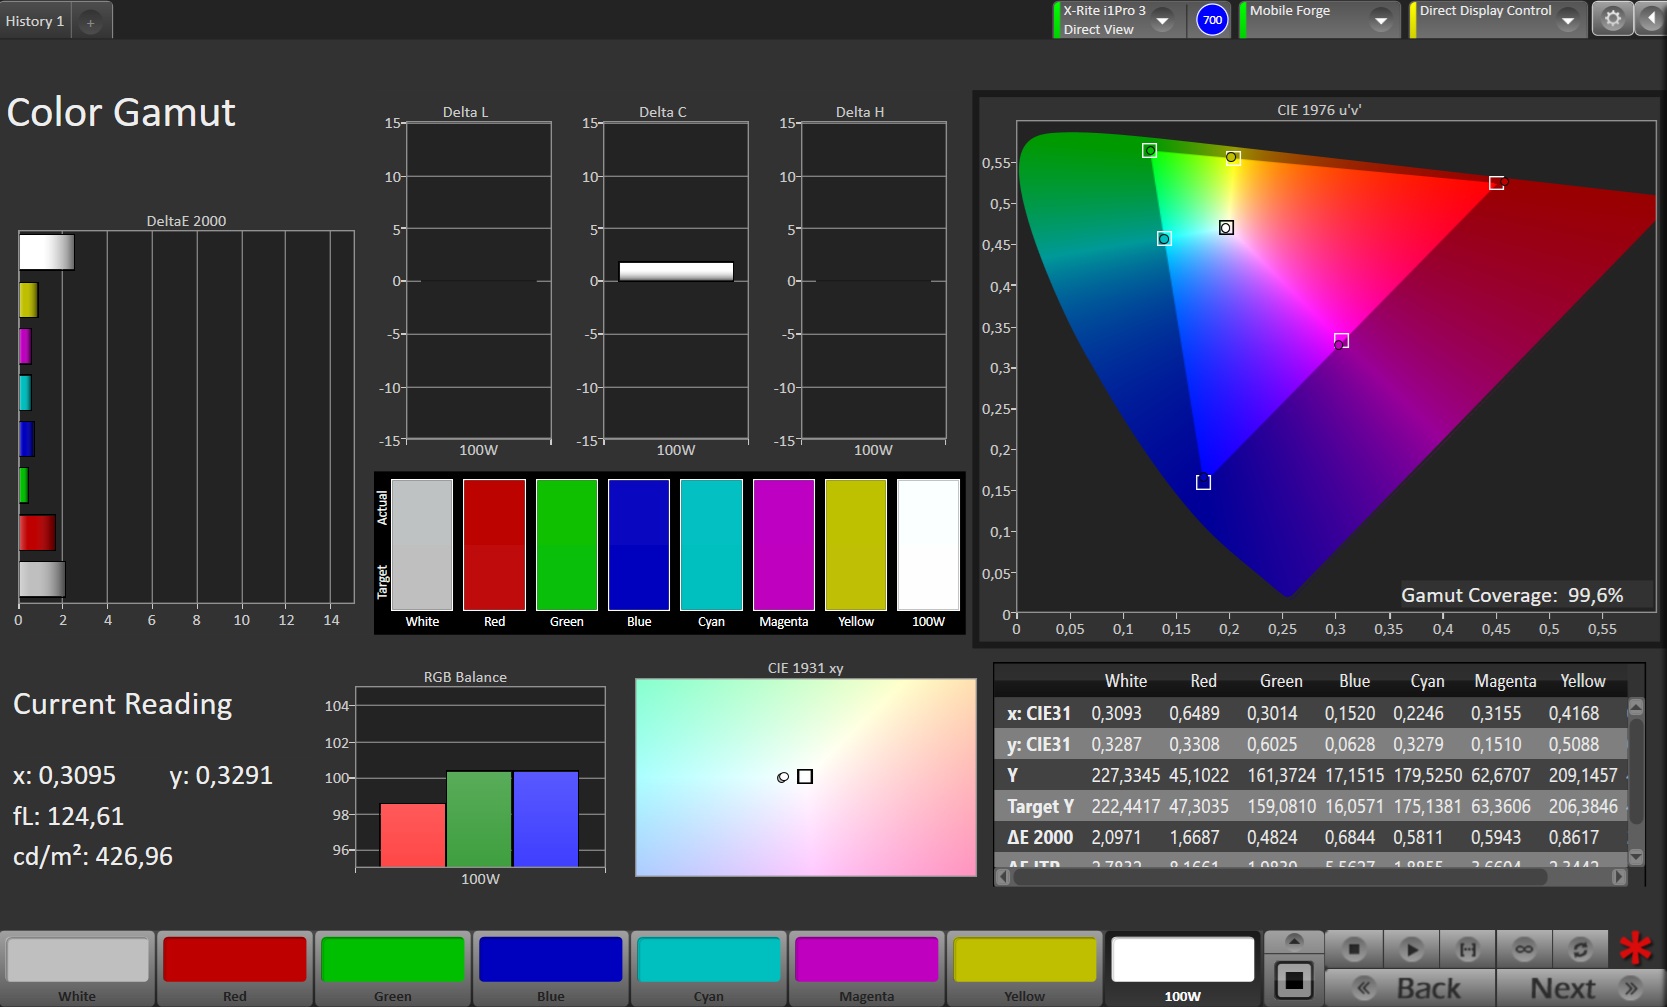
99.6% sRGB (Calman 2D)
Gamma: 2.173
CCT: 6747 K
| Apple iPad Air 11 2025 IPS, 2360x1640, 10.9" | Apple iPad Air 11 2024 IPS, 2360x1640, 10.9" | Xiaomi Pad 7 Pro IPS, 3200x2136, 11.2" | OnePlus Pad 2 IPS, 3000x2120, 12.1" | Huawei MatePad 12 X IPS, 2800x1840, 12" | |
|---|---|---|---|---|---|
| Screen | -7% | -7% | 1% | -80% | |
| Brightness middle (cd/m²) | 508 | 506 0% | 776 53% | 833 64% | 1032 103% |
| Brightness (cd/m²) | 497 | 474 -5% | 750 51% | 771 55% | 991 99% |
| Brightness Distribution (%) | 93 | 87 -6% | 91 -2% | 84 -10% | 87 -6% |
| Black Level * (cd/m²) | 0.5 | 0.4 20% | 0.58 -16% | 0.45 10% | 0.92 -84% |
| Contrast (:1) | 1016 | 1265 25% | 1338 32% | 1851 82% | 1122 10% |
| Colorchecker dE 2000 * | 1.13 | 1.48 -31% | 1.6 -42% | 1.79 -58% | 3.8 -236% |
| Colorchecker dE 2000 max. * | 2.49 | 3.12 -25% | 4.5 -81% | 4.01 -61% | 8.6 -245% |
| Greyscale dE 2000 * | 1.7 | 2.3 -35% | 2.5 -47% | 3 -76% | 6.5 -282% |
| Gamma | 2.173 101% | 2.204 100% | 2.23 99% | 2.254 98% | 2.18 101% |
| CCT | 6747 96% | 6954 93% | 6892 94% | 6419 101% | 7197 90% |
* ... smaller is better
Screen Flickering / PWM (Pulse-Width Modulation)
| Screen flickering / PWM not detected | 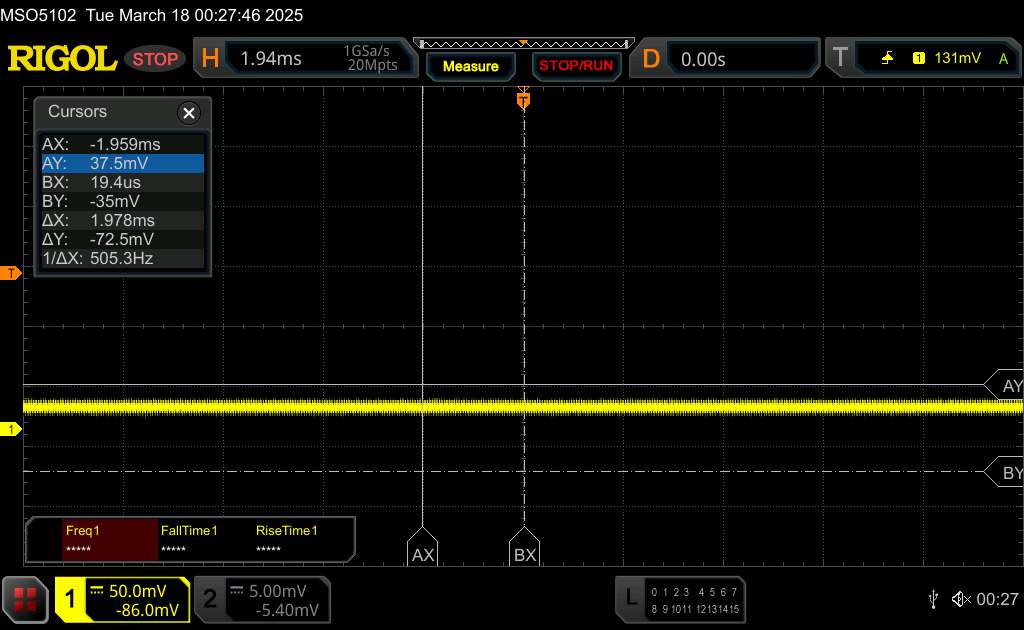 | ||
In comparison: 52 % of all tested devices do not use PWM to dim the display. If PWM was detected, an average of 7757 (minimum: 5 - maximum: 343500) Hz was measured. | |||
Its display shows colors very accurately and there is no color cast visible to the naked eye.
Display Response Times
| ↔ Response Time Black to White | ||
|---|---|---|
| 28.1 ms ... rise ↗ and fall ↘ combined | ↗ 12.8 ms rise | 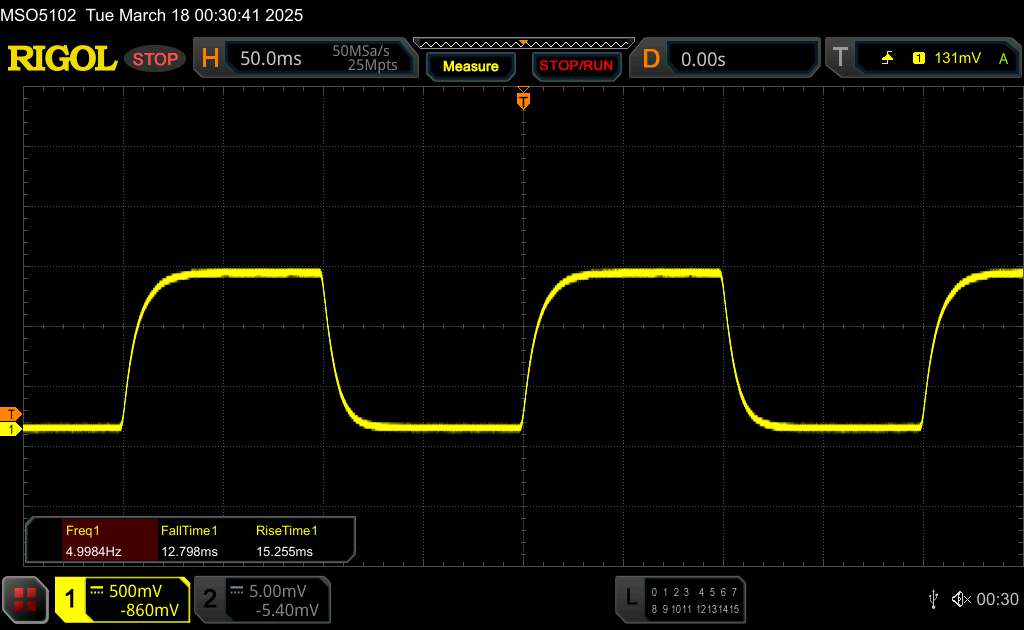 |
| ↘ 15.3 ms fall | ||
| The screen shows relatively slow response rates in our tests and may be too slow for gamers. In comparison, all tested devices range from 0.1 (minimum) to 240 (maximum) ms. » 75 % of all devices are better. This means that the measured response time is worse than the average of all tested devices (19.8 ms). | ||
| ↔ Response Time 50% Grey to 80% Grey | ||
| 38.9 ms ... rise ↗ and fall ↘ combined | ↗ 19.2 ms rise | 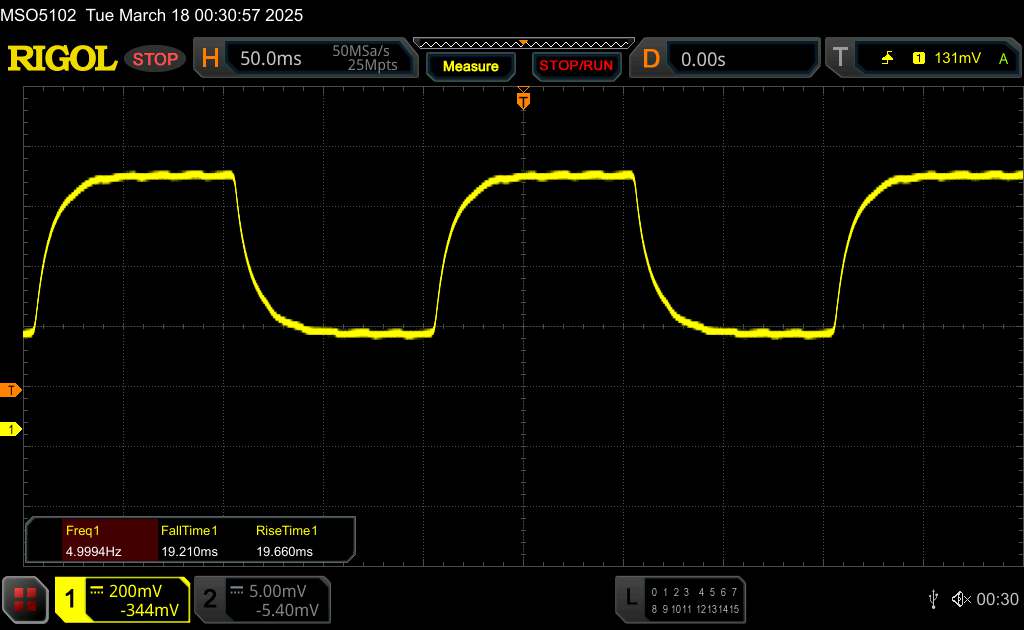 |
| ↘ 19.7 ms fall | ||
| The screen shows slow response rates in our tests and will be unsatisfactory for gamers. In comparison, all tested devices range from 0.165 (minimum) to 636 (maximum) ms. » 59 % of all devices are better. This means that the measured response time is worse than the average of all tested devices (31 ms). | ||
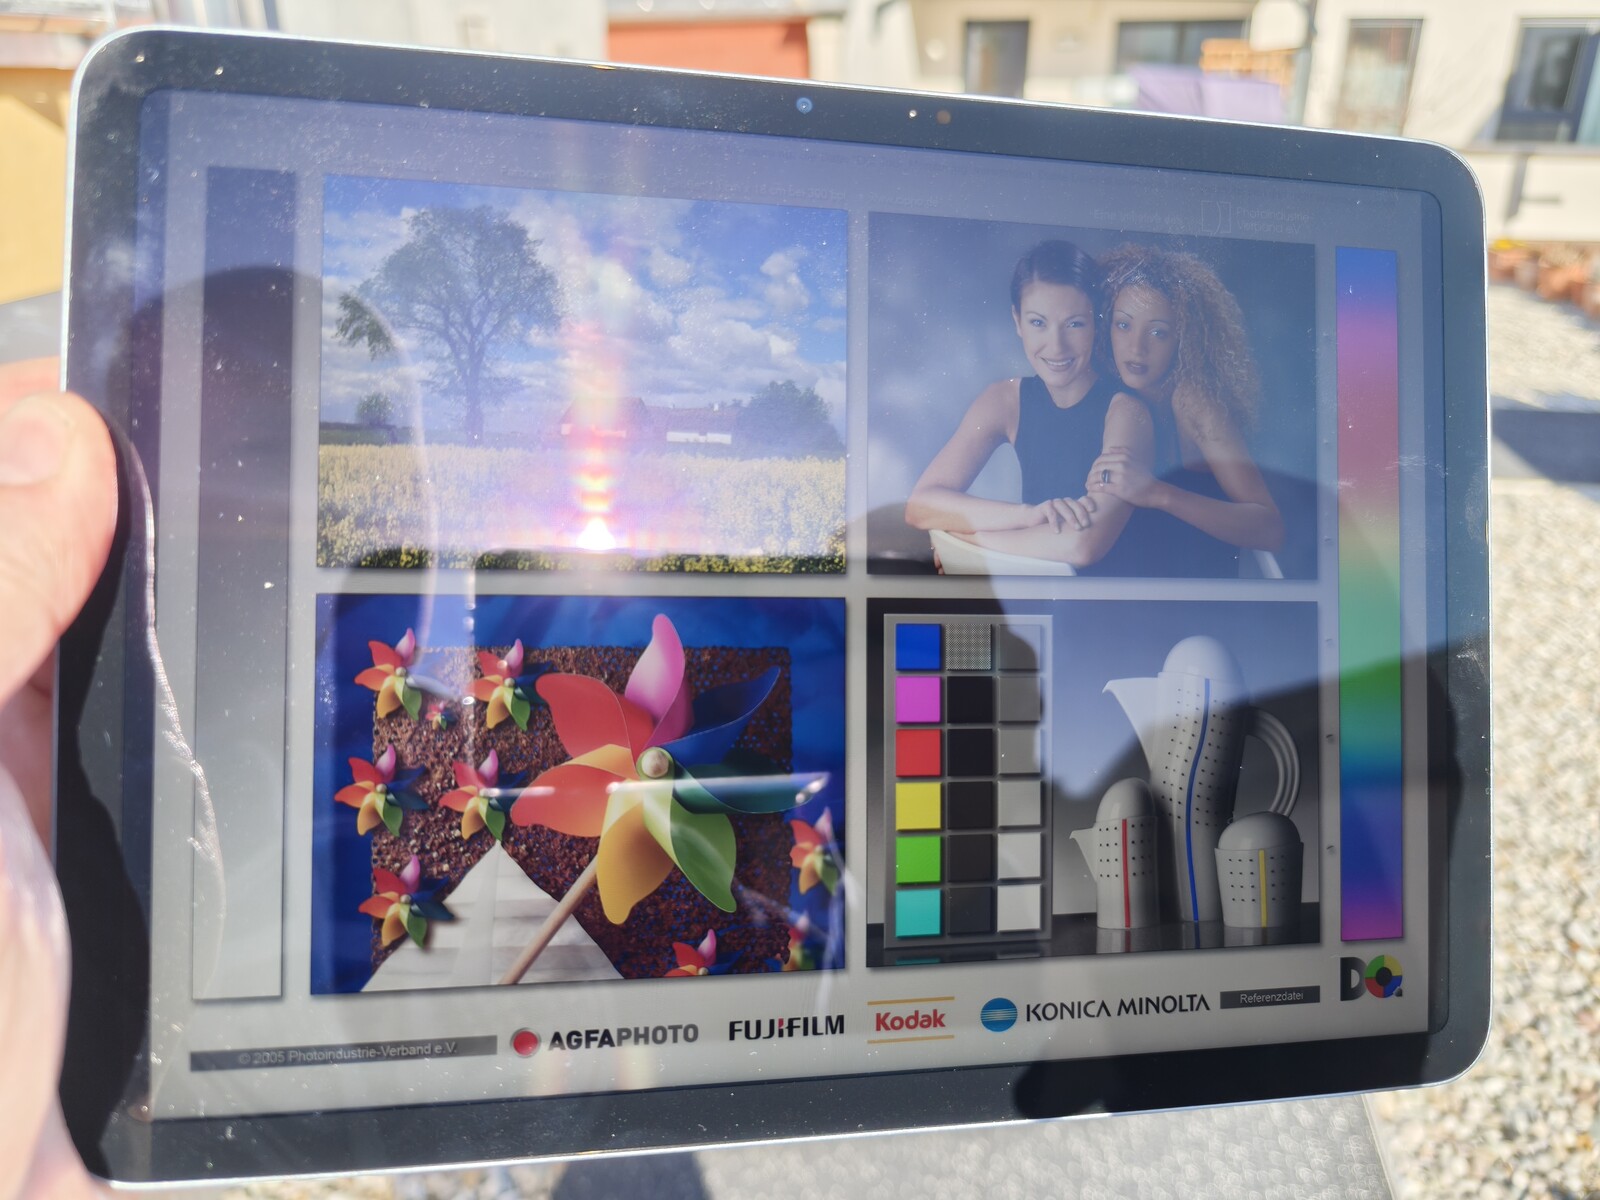
Clear reflections become visible outdoors, but the screen's content is still reasonably recognizable. Working in the shade or indoors is more relaxed.
We have nothing negative to say about its viewing angles from the sides.

Performance – Impressive power without fans
The Apple M3 SoC is the clear highlight of the 7th generation iPad Air.
Thanks to its high performance, even very demanding tasks can be carried out on the iPad Air 11 (2025). Apple will have problems justifying the extra charge for the Apple M4 inside the iPad Pro. Local calculations for Apple Intelligence were also performed very quickly during our test.
The gap to the Apple M2 in last year's iPad Air 11 could be seen in the benchmarks, but is hardly noticeable during everyday use.
| Geekbench AI | |
| Single Precision TensorFlow NNAPI 1.1 | |
| Average of class Tablet (243 - 1065, n=4, last 2 years) | |
| Huawei MatePad 12 X | |
| OnePlus Pad 2 | |
| Half Precision TensorFlow NNAPI 1.1 | |
| Average of class Tablet (227 - 981, n=4, last 2 years) | |
| Huawei MatePad 12 X | |
| OnePlus Pad 2 | |
| Quantized TensorFlow NNAPI 1.1 | |
| Average of class Tablet (508 - 1693, n=4, last 2 years) | |
| Huawei MatePad 12 X | |
| OnePlus Pad 2 | |
| Single Precision Core ML Neural Engine 1.2 | |
| Apple iPad Air 11 2025 | |
| Average Apple M3 (4158 - 4164, n=2) | |
| Average of class Tablet (3575 - 4164, n=4, last 2 years) | |
| Half Precision Core ML Neural Engine 1.2 | |
| Apple iPad Air 11 2025 | |
| Average Apple M3 (7042 - 30723, n=2) | |
| Average of class Tablet (6923 - 30723, n=4, last 2 years) | |
| Quantized Core ML Neural Engine 1.2 | |
| Apple iPad Air 11 2025 | |
| Average Apple M3 (5678 - 34342, n=2) | |
| Average of class Tablet (5648 - 34342, n=4, last 2 years) | |
Apple has saved money on the device's GPU, only activating 9 cores as opposed to the 10 cores that were activated in the iPad Air 11 2024's GPU. This was actually noticeable in some benchmarks and the newer iPad fell slightly behind in some cases.
In practice, however, you still get a very powerful GPU that keeps the vast majority of Android competitors at bay.
GFXBench (DX / GLBenchmark) 2.7: T-Rex Onscreen | 1920x1080 T-Rex Offscreen
GFXBench 3.0: on screen Manhattan Onscreen OGL | 1920x1080 1080p Manhattan Offscreen
GFXBench 3.1: on screen Manhattan ES 3.1 Onscreen | 1920x1080 Manhattan ES 3.1 Offscreen
GFXBench: on screen Car Chase Onscreen | 1920x1080 Car Chase Offscreen | on screen Aztec Ruins High Tier Onscreen | 2560x1440 Aztec Ruins High Tier Offscreen | on screen Aztec Ruins Normal Tier Onscreen | 1920x1080 Aztec Ruins Normal Tier Offscreen | 3840x2160 4K Aztec Ruins High Tier Offscreen
| 3DMark / Wild Life Extreme Unlimited | |
| Apple iPad Air 11 2024 | |
| Apple iPad Air 11 2025 | |
| OnePlus Pad 2 | |
| Xiaomi Pad 7 Pro | |
| Huawei MatePad 12 X | |
| 3DMark / Wild Life Extreme | |
| Apple iPad Air 11 2024 | |
| Apple iPad Air 11 2025 | |
| OnePlus Pad 2 | |
| Xiaomi Pad 7 Pro | |
| Huawei MatePad 12 X | |
| 3DMark / Solar Bay Score | |
| OnePlus Pad 2 | |
| Apple iPad Air 11 2024 | |
| Apple iPad Air 11 2025 | |
| Xiaomi Pad 7 Pro | |
| 3DMark / Solar Bay Unlimited Score | |
| Apple iPad Air 11 2025 | |
| OnePlus Pad 2 | |
| Apple iPad Air 11 2024 | |
| Xiaomi Pad 7 Pro | |
| 3DMark / Steel Nomad Light Unlimited Score | |
| Apple iPad Air 11 2025 | |
| OnePlus Pad 2 | |
| Xiaomi Pad 7 Pro | |
| 3DMark / Steel Nomad Light Score | |
| Apple iPad Air 11 2025 | |
| OnePlus Pad 2 | |
| Xiaomi Pad 7 Pro | |
| GFXBench (DX / GLBenchmark) 2.7 / T-Rex Onscreen | |
| Xiaomi Pad 7 Pro | |
| Apple iPad Air 11 2024 | |
| Huawei MatePad 12 X | |
| Apple iPad Air 11 2025 | |
| GFXBench (DX / GLBenchmark) 2.7 / T-Rex Offscreen | |
| Apple iPad Air 11 2024 | |
| Apple iPad Air 11 2025 | |
| Xiaomi Pad 7 Pro | |
| Huawei MatePad 12 X | |
| GFXBench 3.0 / Manhattan Onscreen OGL | |
| Xiaomi Pad 7 Pro | |
| Apple iPad Air 11 2024 | |
| Apple iPad Air 11 2025 | |
| Huawei MatePad 12 X | |
| GFXBench 3.0 / 1080p Manhattan Offscreen | |
| Apple iPad Air 11 2025 | |
| Apple iPad Air 11 2024 | |
| Xiaomi Pad 7 Pro | |
| Huawei MatePad 12 X | |
| GFXBench 3.1 / Manhattan ES 3.1 Onscreen | |
| Apple iPad Air 11 2024 | |
| Apple iPad Air 11 2025 | |
| Xiaomi Pad 7 Pro | |
| Huawei MatePad 12 X | |
| GFXBench 3.1 / Manhattan ES 3.1 Offscreen | |
| Apple iPad Air 11 2024 | |
| Apple iPad Air 11 2025 | |
| Xiaomi Pad 7 Pro | |
| Huawei MatePad 12 X | |
| GFXBench / Car Chase Onscreen | |
| Apple iPad Air 11 2024 | |
| Apple iPad Air 11 2025 | |
| Xiaomi Pad 7 Pro | |
| Huawei MatePad 12 X | |
| GFXBench / Car Chase Offscreen | |
| Apple iPad Air 11 2024 | |
| Apple iPad Air 11 2025 | |
| Xiaomi Pad 7 Pro | |
| Huawei MatePad 12 X | |
| GFXBench / Aztec Ruins High Tier Onscreen | |
| Apple iPad Air 11 2024 | |
| Apple iPad Air 11 2025 | |
| OnePlus Pad 2 | |
| Xiaomi Pad 7 Pro | |
| Huawei MatePad 12 X | |
| GFXBench / Aztec Ruins High Tier Offscreen | |
| OnePlus Pad 2 | |
| Apple iPad Air 11 2024 | |
| Apple iPad Air 11 2025 | |
| Xiaomi Pad 7 Pro | |
| Huawei MatePad 12 X | |
| GFXBench / Aztec Ruins Normal Tier Onscreen | |
| Apple iPad Air 11 2024 | |
| Apple iPad Air 11 2025 | |
| OnePlus Pad 2 | |
| Xiaomi Pad 7 Pro | |
| Huawei MatePad 12 X | |
| GFXBench / Aztec Ruins Normal Tier Offscreen | |
| Apple iPad Air 11 2024 | |
| Apple iPad Air 11 2025 | |
| OnePlus Pad 2 | |
| Xiaomi Pad 7 Pro | |
| Huawei MatePad 12 X | |
| GFXBench / 4K Aztec Ruins High Tier Offscreen | |
| Apple iPad Air 11 2024 | |
| Apple iPad Air 11 2025 | |
| OnePlus Pad 2 | |
| Xiaomi Pad 7 Pro | |
| Huawei MatePad 12 X | |
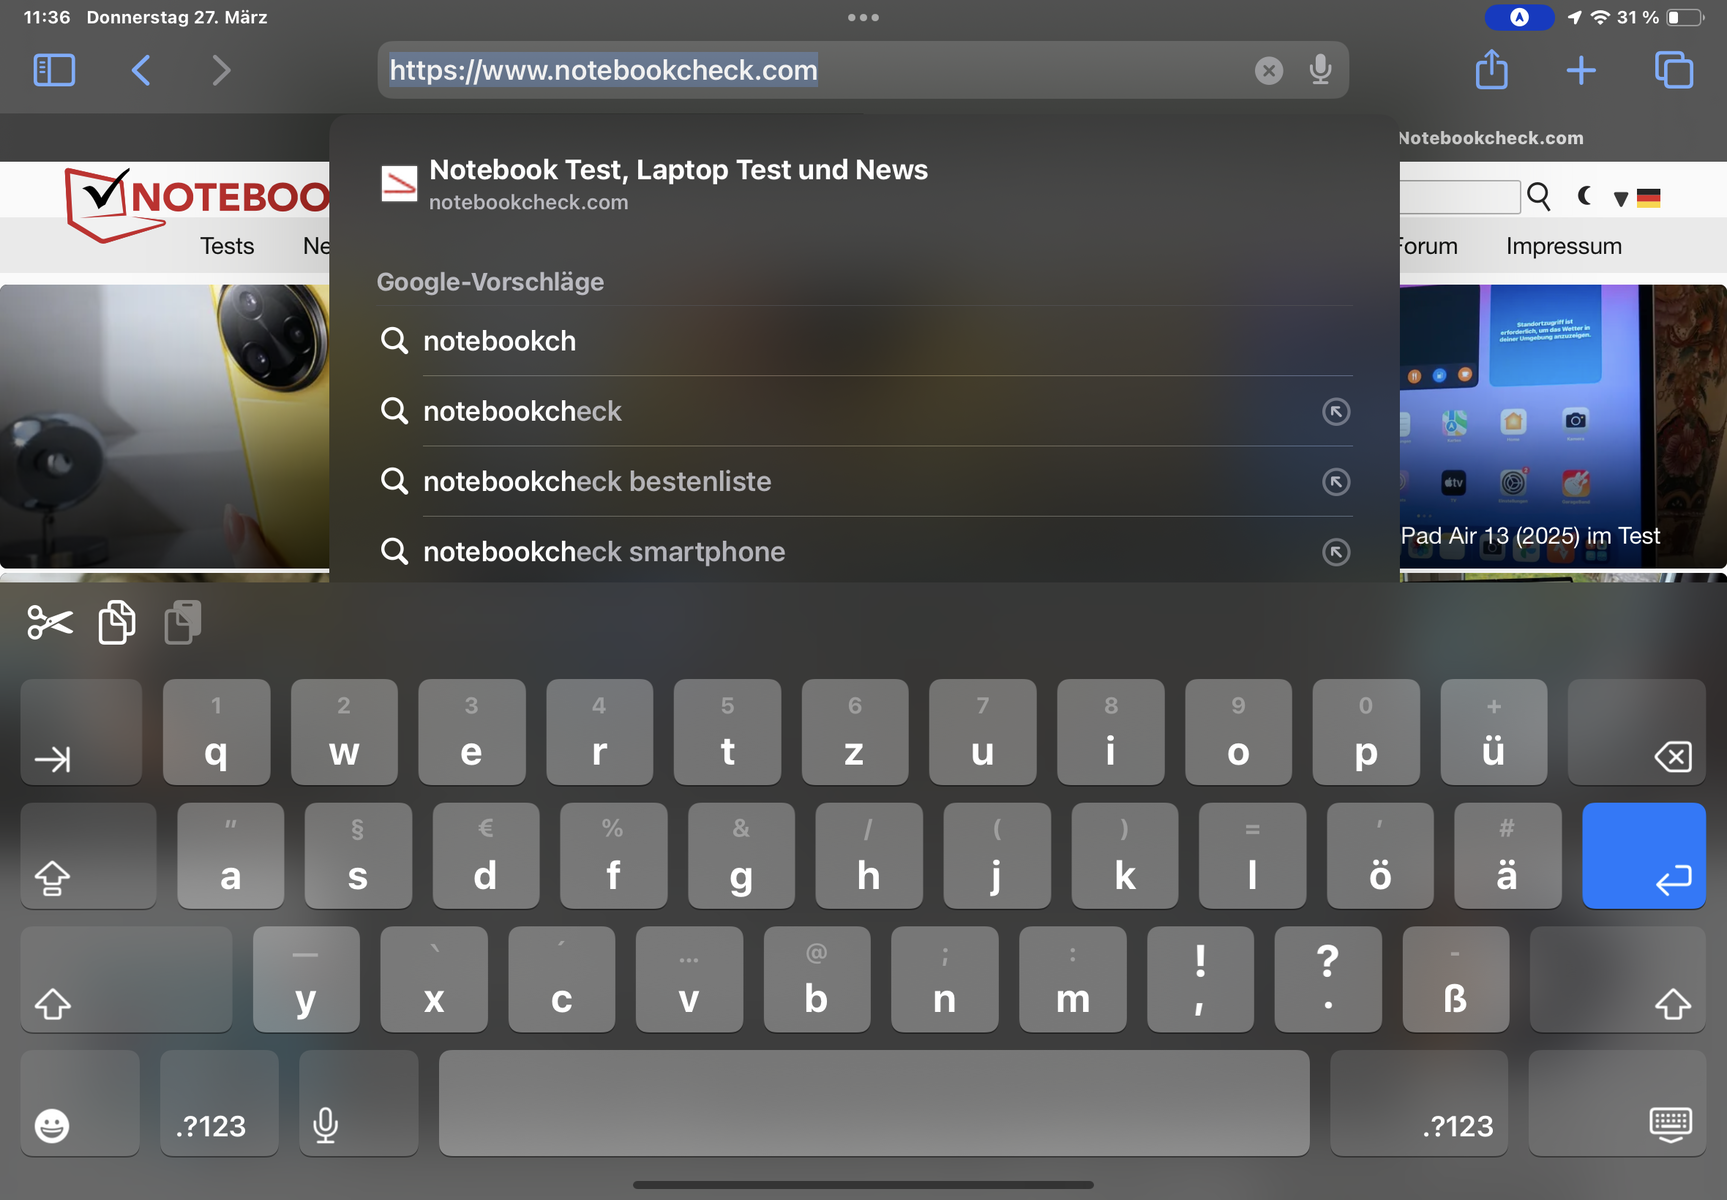
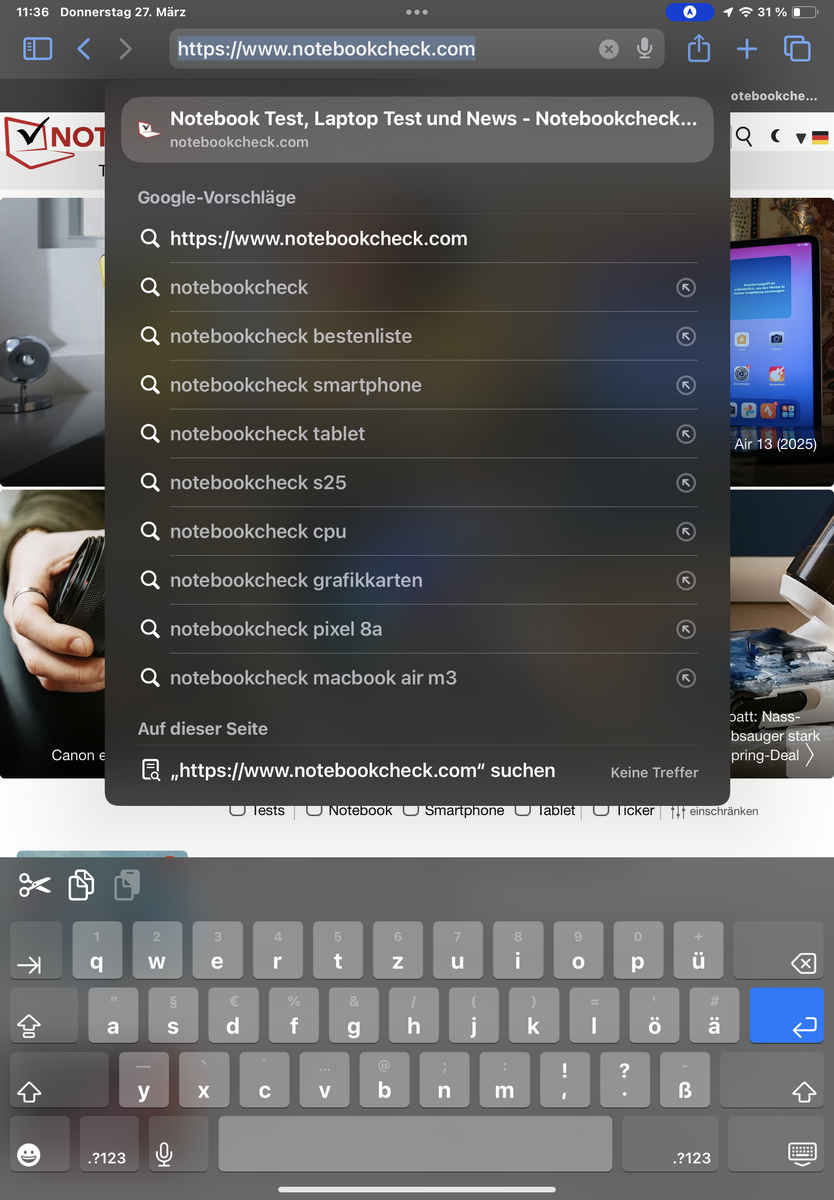
Surfing the web has actually become a little faster, but this is certainly in part thanks to the new Safari version.
Overall, you won't face any waiting times in the browser if you have a good internet connection—even large websites make images available immediately while scrolling.
| Speedometer 2.0 - Result 2.0 | |
| Average Apple M3 (548 - 674, n=5) | |
| Apple iPad Air 11 2025 (Safari 18) | |
| Apple iPad Air 11 2024 (Safari 17) | |
| Apple iPad Air 11 2024 | |
| Average of class Tablet (6.8 - 790, n=33, last 2 years) | |
| Speedometer 3 - Score 3.0 | |
| Apple iPad Air 11 2025 (Safari 18) | |
| Average Apple M3 (33.9 - 34.4, n=2) | |
| Apple iPad Air 11 2024 (Safari 17) | |
| Average of class Tablet (1.25 - 49.1, n=49, last 2 years) | |
| Xiaomi Pad 7 Pro (Chrome 132) | |
| Huawei MatePad 12 X (Huawei Browswer 15) | |
| Octane V2 - Total Score | |
| Average Apple M3 (92645 - 98093, n=5) | |
| Apple iPad Air 11 2025 (Safari 18) | |
| Apple iPad Air 11 2024 (Safari 17) | |
| Xiaomi Pad 7 Pro (Chrome 132) | |
| Average of class Tablet (1633 - 138481, n=71, last 2 years) | |
| OnePlus Pad 2 (Chrome 128) | |
| Huawei MatePad 12 X (Huawei Browswer 15) | |
| Mozilla Kraken 1.1 - Total | |
| Average of class Tablet (243 - 16233, n=65, last 2 years) | |
| Huawei MatePad 12 X (Huawei Browswer 15) | |
| Xiaomi Pad 7 Pro (Chrome 132) | |
| Apple iPad Air 11 2024 (Safari 17) | |
| Average Apple M3 (323 - 373, n=5) | |
| Apple iPad Air 11 2025 (Safari 18) | |
* ... smaller is better
Apple has again gone for a memory module that combines NVMe storage and RAM to increase system efficiency.
Although there are no direct benchmarks for the storage speed supported by Apple's mobile operating system, we were able to measure short loading times and fast data transfers during our test.
Games – An experience with compromises
Gaming is limited to a maximum of 60fps, as the tablet's display doesn't support a higher frame rate than this. Lots of demanding games hit this rate, but at very high settings there may be some brief FPS drops. PUBG Mobile is limited to 40fps in the highest settings.
The device's touchscreen and position sensor work reliably. The display's size is better suited for gaming than the iPad Air 13, as the controls on the touchscreen are easier to reach. However, it's even easier with a connected gamepad.
We tested the frame rates using the GameBench software.


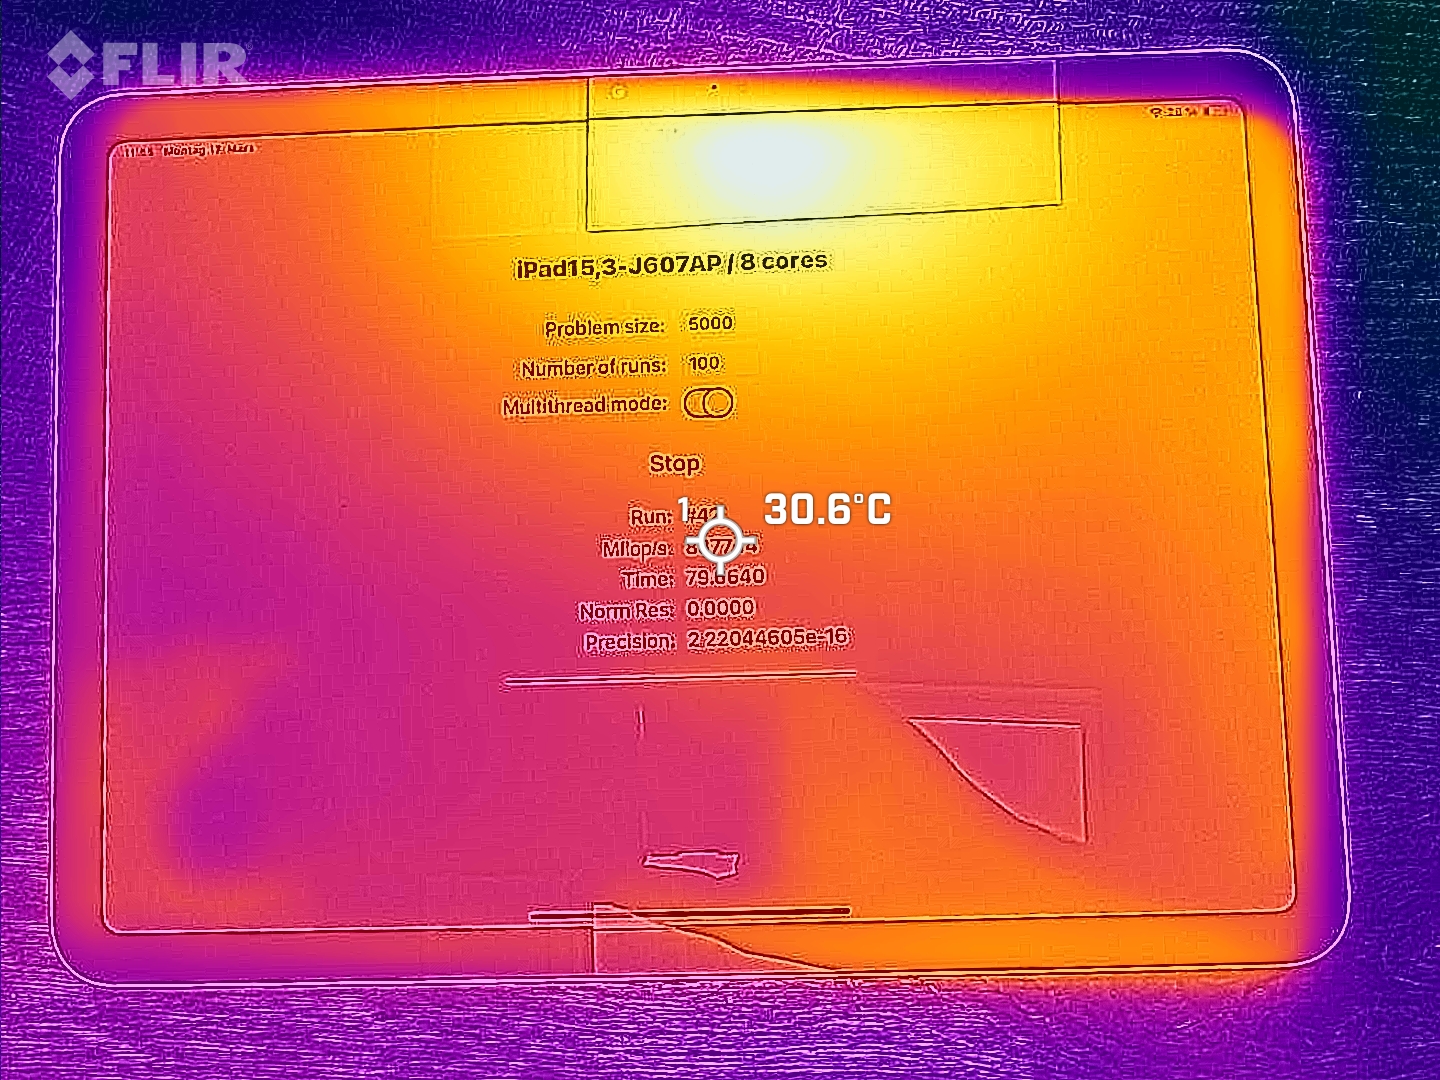
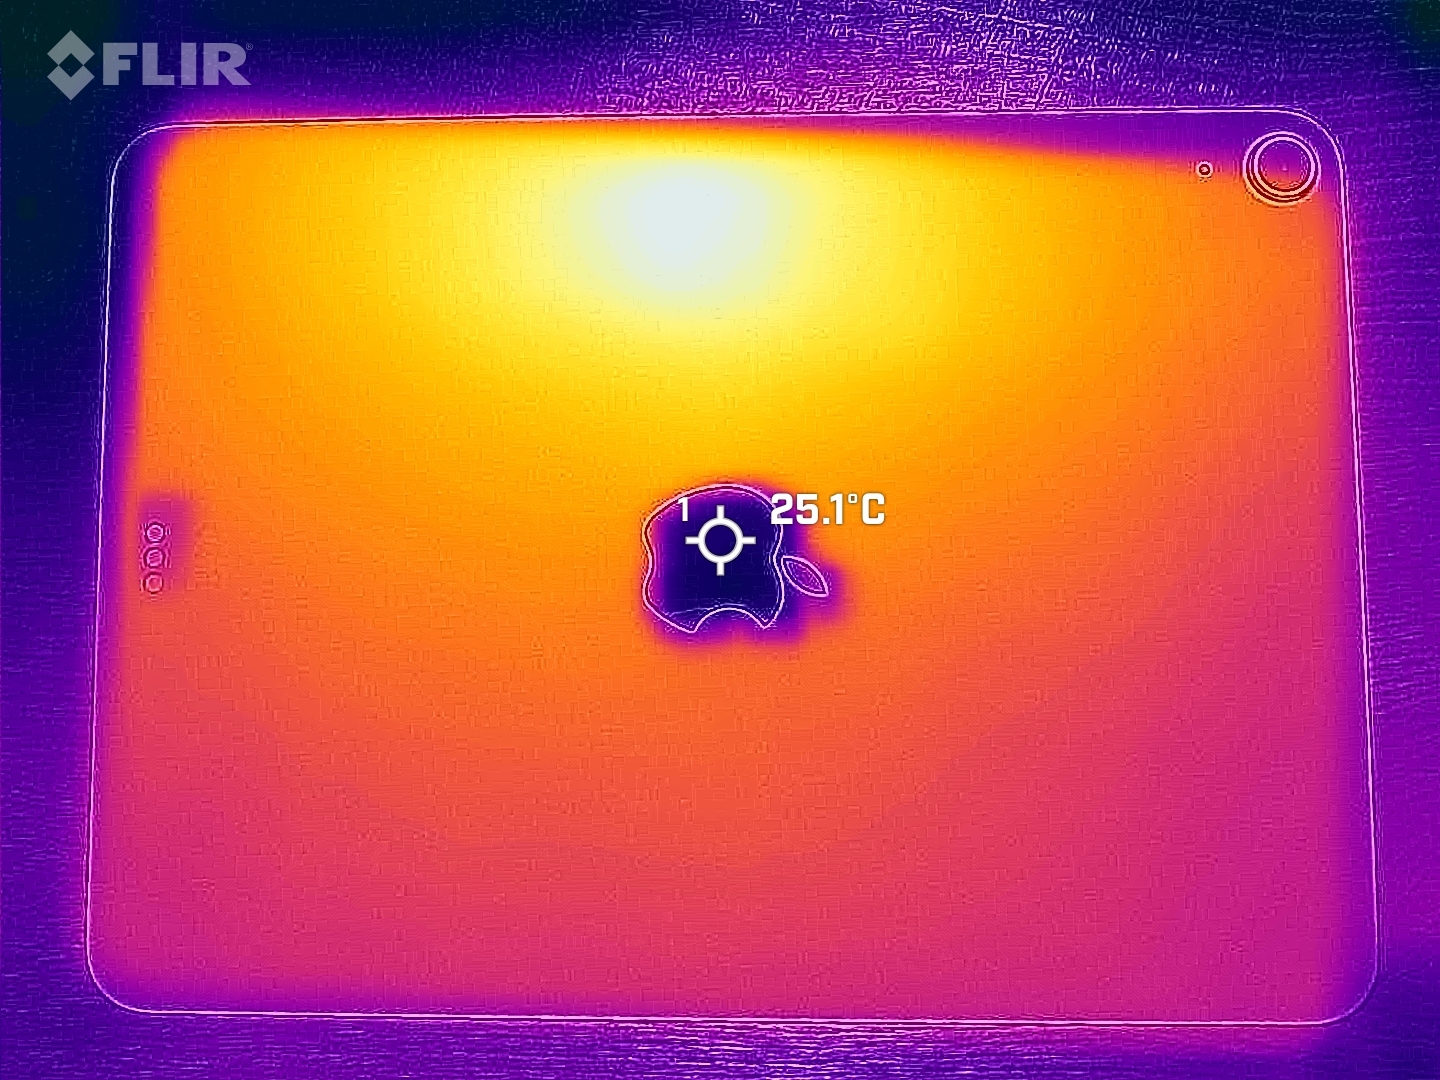
Emissions – The iPad Air 11 is throttled
Temperature
The iPad Air 11 (2025) heats up slightly more than its bigger brother, which makes sense: as neither requires a fan, the larger surface area of the iPad Air 13 allows better distribution of waste heat. Even the 11-inch iPad Air doesn't get excessively hot after long periods of use, which is impressive considering the chip's performance.
However, the SoC is throttled significantly more than in the iPad Air 13 (2025): According to the 3DMark stress tests, you can expect up to 24% performance losses under prolonged high load.
(+) The maximum temperature on the upper side is 35.2 °C / 95 F, compared to the average of 33.7 °C / 93 F, ranging from 20.7 to 53.2 °C for the class Tablet.
(±) The bottom heats up to a maximum of 41.8 °C / 107 F, compared to the average of 33.2 °C / 92 F
(+) In idle usage, the average temperature for the upper side is 22.3 °C / 72 F, compared to the device average of 30 °C / 86 F.
3DMark stress test
| 3DMark | |
| Wild Life Stress Test Stability | |
| Apple iPad Air 11 2024 | |
| Huawei MatePad 12 X | |
| Xiaomi Pad 7 Pro | |
| OnePlus Pad 2 | |
| Wild Life Extreme Stress Test | |
| Huawei MatePad 12 X | |
| Xiaomi Pad 7 Pro | |
| OnePlus Pad 2 | |
| Apple iPad Air 11 2025 | |
| Apple iPad Air 11 2024 | |
| Solar Bay Stress Test Stability | |
| Xiaomi Pad 7 Pro | |
| Apple iPad Air 11 2024 | |
| OnePlus Pad 2 | |
| Apple iPad Air 11 2025 | |
| Steel Nomad Light Stress Test Stability | |
| Xiaomi Pad 7 Pro | |
| OnePlus Pad 2 | |
| Apple iPad Air 11 2025 | |
Speakers
The smaller iPad Air is fitted with two speakers. Their volume is acceptable for medium-sized rooms—the sound is warm and tends to be neutral, but there is no real bass. The clear low mids, which even produce perceptible vibrations when placed on a hard surface, are a positive highlight.
USB-C and Bluetooth 5.3 are available for audio output. However, support for wireless audio codecs is limited to Apple's AAC and SBC, which is less good in terms of sound quality.
Apple iPad Air 11 2025 audio analysis
(±) | speaker loudness is average but good (78.4 dB)
Bass 100 - 315 Hz
(±) | reduced bass - on average 10.2% lower than median
(±) | linearity of bass is average (13.3% delta to prev. frequency)
Mids 400 - 2000 Hz
(+) | balanced mids - only 3.5% away from median
(±) | linearity of mids is average (9.3% delta to prev. frequency)
Highs 2 - 16 kHz
(+) | balanced highs - only 4% away from median
(±) | linearity of highs is average (9.3% delta to prev. frequency)
Overall 100 - 16.000 Hz
(+) | overall sound is linear (14.7% difference to median)
Compared to same class
» 31% of all tested devices in this class were better, 4% similar, 65% worse
» The best had a delta of 7%, average was 20%, worst was 129%
Compared to all devices tested
» 19% of all tested devices were better, 4% similar, 77% worse
» The best had a delta of 4%, average was 23%, worst was 134%
Huawei MatePad 12 X audio analysis
(+) | speakers can play relatively loud (87.2 dB)
Bass 100 - 315 Hz
(±) | reduced bass - on average 10.4% lower than median
(±) | linearity of bass is average (7.1% delta to prev. frequency)
Mids 400 - 2000 Hz
(+) | balanced mids - only 2.4% away from median
(+) | mids are linear (4.8% delta to prev. frequency)
Highs 2 - 16 kHz
(+) | balanced highs - only 1.9% away from median
(+) | highs are linear (2.6% delta to prev. frequency)
Overall 100 - 16.000 Hz
(+) | overall sound is linear (8.4% difference to median)
Compared to same class
» 1% of all tested devices in this class were better, 1% similar, 98% worse
» The best had a delta of 7%, average was 20%, worst was 129%
Compared to all devices tested
» 2% of all tested devices were better, 1% similar, 97% worse
» The best had a delta of 4%, average was 23%, worst was 134%
Battery life – Barely through the day
Power consumption
The Apple iPad Air 11 (2025) is just as energy-hungry as its predecessor. This means that not too much power is required from its battery or the power outlet under very low or light loads, but significantly more power is needed under high workloads: We measured a maximum of up to 16.8 watts, which is exactly the same value as its predecessor.
Apple remains true to its 20 watt maximum charging power, and the iPad's charging time of 2:15 hours for a full cycle is fine.
| Off / Standby | |
| Idle | |
| Load |
|
Key:
min: | |
| Apple iPad Air 11 2025 mAh | Apple iPad Air 11 2024 mAh | Xiaomi Pad 7 Pro 8850 mAh | Huawei MatePad 12 X 10100 mAh | Average Apple M3 | Average of class Tablet | |
|---|---|---|---|---|---|---|
| Power Consumption | -7% | 40% | -97% | -112% | -8% | |
| Idle Minimum * (Watt) | 1.6 | 1.5 6% | 0.75 53% | 4.66 -191% | 2 ? -25% | 2.21 ? -38% |
| Idle Average * (Watt) | 2.8 | 3.6 -29% | 1.5 46% | 9.06 -224% | 8.6 ? -207% | 4.01 ? -43% |
| Idle Maximum * (Watt) | 4.7 | 4.6 2% | 1.56 67% | 9.17 -95% | 9.16 ? -95% | 4.4 ? 6% |
| Load Average * (Watt) | 11.4 | 12.8 -12% | 7.92 31% | 11.9 -4% | 26 ? -128% | 8.92 ? 22% |
| Load Maximum * (Watt) | 16.8 | 16.8 -0% | 16.5 2% | 11.97 29% | 34.6 ? -106% | 14.4 ? 14% |
* ... smaller is better
Power consumption: Geekbench (150 cd/m²)
Power consumption: GFXbench (150 cd/m²)
Runtimes
The Apple iPad Air 11 2025 lasted a few minutes longer than its predecessor in our runtime tests, but you'll hardly notice this during everyday use. Android tablets delivered significantly more endurance at times.
11:43 hours in our Wi-Fi test is just enough for a day in the office or on the couch, but there aren't many reserves left. Just under 13 hours of movies or series on a single charge is enough for a long-distance flight.
| Apple iPad Air 11 2025 mAh | Apple iPad Air 11 2024 mAh | Xiaomi Pad 7 Pro 8850 mAh | OnePlus Pad 2 9510 mAh | Huawei MatePad 12 X 10100 mAh | |
|---|---|---|---|---|---|
| Battery runtime | -3% | 50% | 23% | 45% | |
| Reader / Idle (h) | 25.6 | 25.1 -2% | |||
| H.264 (h) | 12.9 | 12.8 -1% | |||
| WiFi v1.3 (h) | 11.7 | 11.4 -3% | 17.6 50% | 14.4 23% | 17 45% |
| Load (h) | 3.7 | 3.5 -5% |
Notebookcheck total rating
 review")
The Apple iPad Air 11 2025 is Apple's best offer if you want a lot of performance at the lowest possible price.
However, if you can get the predecessor for even less, then you can also go for that model without needing to make any major sacrifices.
Apple iPad Air 11 2025
- 04/07/2025 v8
Florian Schmitt
 Total Sustainability Score:
 Possible alternatives compared
Image | Model / Review | Price | Weight | Drive | Display |
|---|---|---|---|---|---|
1. 87.4%  | Apple iPad Air 11 2025 Apple M3 ⎘ Apple M3 9-Core GPU ⎘ 8 GB Memory, 128 GB NVMe | Amazon: List Price: 699€ | 460 g | 128 GB NVMe | 10.86" 2360x1640 265 PPI IPS |
2. 90% v7 (old)  | Apple iPad Air 11 2024 Apple M2 ⎘ Apple M2 10-Core GPU ⎘ 8 GB Memory, 128 GB NVMe | Amazon: List Price: 699€ | 462 g | 128 GB NVMe | 10.86" 2360x1640 265 PPI IPS |
3. 86.5%  | Xiaomi Pad 7 Pro Qualcomm Snapdragon 8s Gen 3 ⎘ Qualcomm Adreno 735 ⎘ 12 GB Memory, 256 GB UFS 4.x | Amazon: 1. $342.00 XIAOMI Pad 7 Ai WiFi Version... 2. $375.00 XIAOMI Pad 8 Ai WiFi Version... 3. $348.79 XIAOMI Pad 7 Ai WiFi Version... List Price: 450€ | 500 g | 256 GB UFS 4.0 Flash | 11.20" 3200x2136 344 PPI IPS |
4. 86.1%  | OnePlus Pad 2 Qualcomm Snapdragon 8 Gen 3 ⎘ Qualcomm Adreno 750 ⎘ 12 GB Memory, 256 GB UFS 3.1 | Amazon: $1,060.00 List Price: 549€ | 584 g | 256 GB UFS 3.1 Flash | 12.10" 3000x2120 304 PPI IPS |
5. 83%  | Huawei MatePad 12 X HiSilicon Kirin 9000W ⎘ HiSilicon Maleoon 910 ⎘ 12 GB Memory, 256 GB UFS 3.1 | Amazon: List Price: 649€ | 555 g | 256 GB UFS 3.1 Flash | 12.00" 2800x1840 279 PPI IPS |
Transparency
The selection of devices to be reviewed is made by our editorial team. The test sample was provided to the author as a loan by the manufacturer or retailer for the purpose of this review. The lender had no influence on this review, nor did the manufacturer receive a copy of this review before publication. There was no obligation to publish this review. As an independent media company, Notebookcheck is not subjected to the authority of manufacturers, retailers or publishers.
This is how Notebookcheck is testing
Every year, Notebookcheck independently reviews hundreds of laptops and smartphones using standardized procedures to ensure that all results are comparable. We have continuously developed our test methods for around 20 years and set industry standards in the process. In our test labs, high-quality measuring equipment is utilized by experienced technicians and editors. These tests involve a multi-stage validation process. Our complex rating system is based on hundreds of well-founded measurements and benchmarks, which maintains objectivity. Further information on our test methods can be found here.

