Apple iPad Air 5 2022 Review: Many Yays, Few Nays
The iPad Air, internal code name iPad 13,16, is Apple’s mid-range tablet and positioned between the entry-level iPad 9 and the high-end iPad Pro 11" 3. Gen, and thanks to the very same M1 chip they put in the Pro last year the differences between the latter two are getting fewer and fewer. For the current generation, the benefits of the Pro include a 120 Hz display, Face ID, and a better camera. If you find the 10-inch form factor too restrictive Apple has you covered with their smaller iPad Mini 6 and their larger iPad Pro 12.9 with Mini LED display.
The most popular non-Apple Windows and Android tablets are the Samsung Galaxy Tab A8, Galaxy Tab S8, Galaxy Tab S7 FE, Xiaomi Pad 5, Xiaomi Pad 5 Pro, Lenovo Tab M10 Plus, and Surface Pro 8. We would like to highlight Samsung’s Galaxy Tab series in particular as these stand out and are the iPad’s main competitors with Samsung holding a solid 2nd place in the tablet market segment (source: Statista).
Potential Competitors in Comparison
Rating | Date | Model | Weight | Height | Size | Resolution | Price |
|---|---|---|---|---|---|---|---|
| 91.7 % v7 (old) | 03 / 2022 | Apple iPad Air 5 2022 M1, M1 8-Core GPU | 461 g | 6.1 mm | 10.90" | 2360x1640 | |
| 81 % v7 (old) | 02 / 2022 | Samsung Galaxy Tab A8 2022 T618, Mali-G52 MP2 | 508 g | 6.9 mm | 10.50" | 1920x1200 | |
| 85.8 % v7 (old) | 08 / 2021 | Samsung Galaxy Tab S7 FE 5G SD 750G 5G, Adreno 619 | 608 g | 6.3 mm | 12.40" | 2560x1600 | |
| 88.7 % v7 (old) | 11 / 2021 | Xiaomi Pad 5 Pro SD 870, Adreno 650 | 515 g | 6.85 mm | 11.00" | 2560x1600 | |
| 87.6 % v7 (old) | 12 / 2021 | Xiaomi Pad 5 SD 860, Adreno 640 | 511 g | 6.85 mm | 11.00" | 2560x1600 | |
| 83.4 % v7 (old) | 10 / 2021 | Lenovo Yoga Tab 11 Helio G90T, Mali-G76 MP4 | 655 g | 7.9 mm | 11.00" | 2000x1200 | |
| 84.1 % v7 (old) | 11 / 2021 | Lenovo Tab P11 Plus Helio G90T, Mali-G76 MP4 | 490 g | 7.5 mm | 11.00" | 2000x1200 | |
| 76.8 % v7 (old) | 01 / 2019 | Lenovo Tab M10 SD 450, Adreno 506 | 480 g | 8.1 mm | 10.10" | 1920x1200 | |
| 88.5 % v7 (old) | 10 / 2021 | Apple iPad 2021 A13 Bionic, A13 Bionic GPU | 487 g | 7.5 mm | 10.20" | 2160x1620 | |
| 90.7 % v7 (old) | 10 / 2021 | Apple iPad Mini 6 A15, A15 GPU 5-Core | 297 g | 6.3 mm | 8.30" | 2266x1488 | |
| 92.6 % v7 (old) | 06 / 2021 | Apple iPad Pro 11 2021 M1, M1 8-Core GPU | 468 g | 5.9 mm | 11.00" | 2388x1668 | |
| 91.3 % v7 (old) | 06 / 2021 | Apple iPad Pro 12.9 2021 A2378 M1, M1 8-Core GPU | 682 g | 6.4 mm | 12.90" | 2732x2048 | |
| 90.7 % v7 (old) | 11 / 2020 | Apple iPad Air 4 2020 A14, A14 Bionic GPU | 458 g | 6.1 mm | 10.90" | 2360x1640 | |
| 89.1 % v7 (old) | 11 / 2021 | Microsoft Surface Pro 8, i7-1185G7 i7-1185G7, Iris Xe G7 96EUs | 891 g | 8.5 mm | 13.00" | 2880x1920 | |
| 88.5 % v7 (old) | 03 / 2021 | Microsoft Surface Pro 7 Plus i5-1135G7, Iris Xe G7 80EUs | 796 g | 8.5 mm | 12.30" | 2736x1824 |
Case
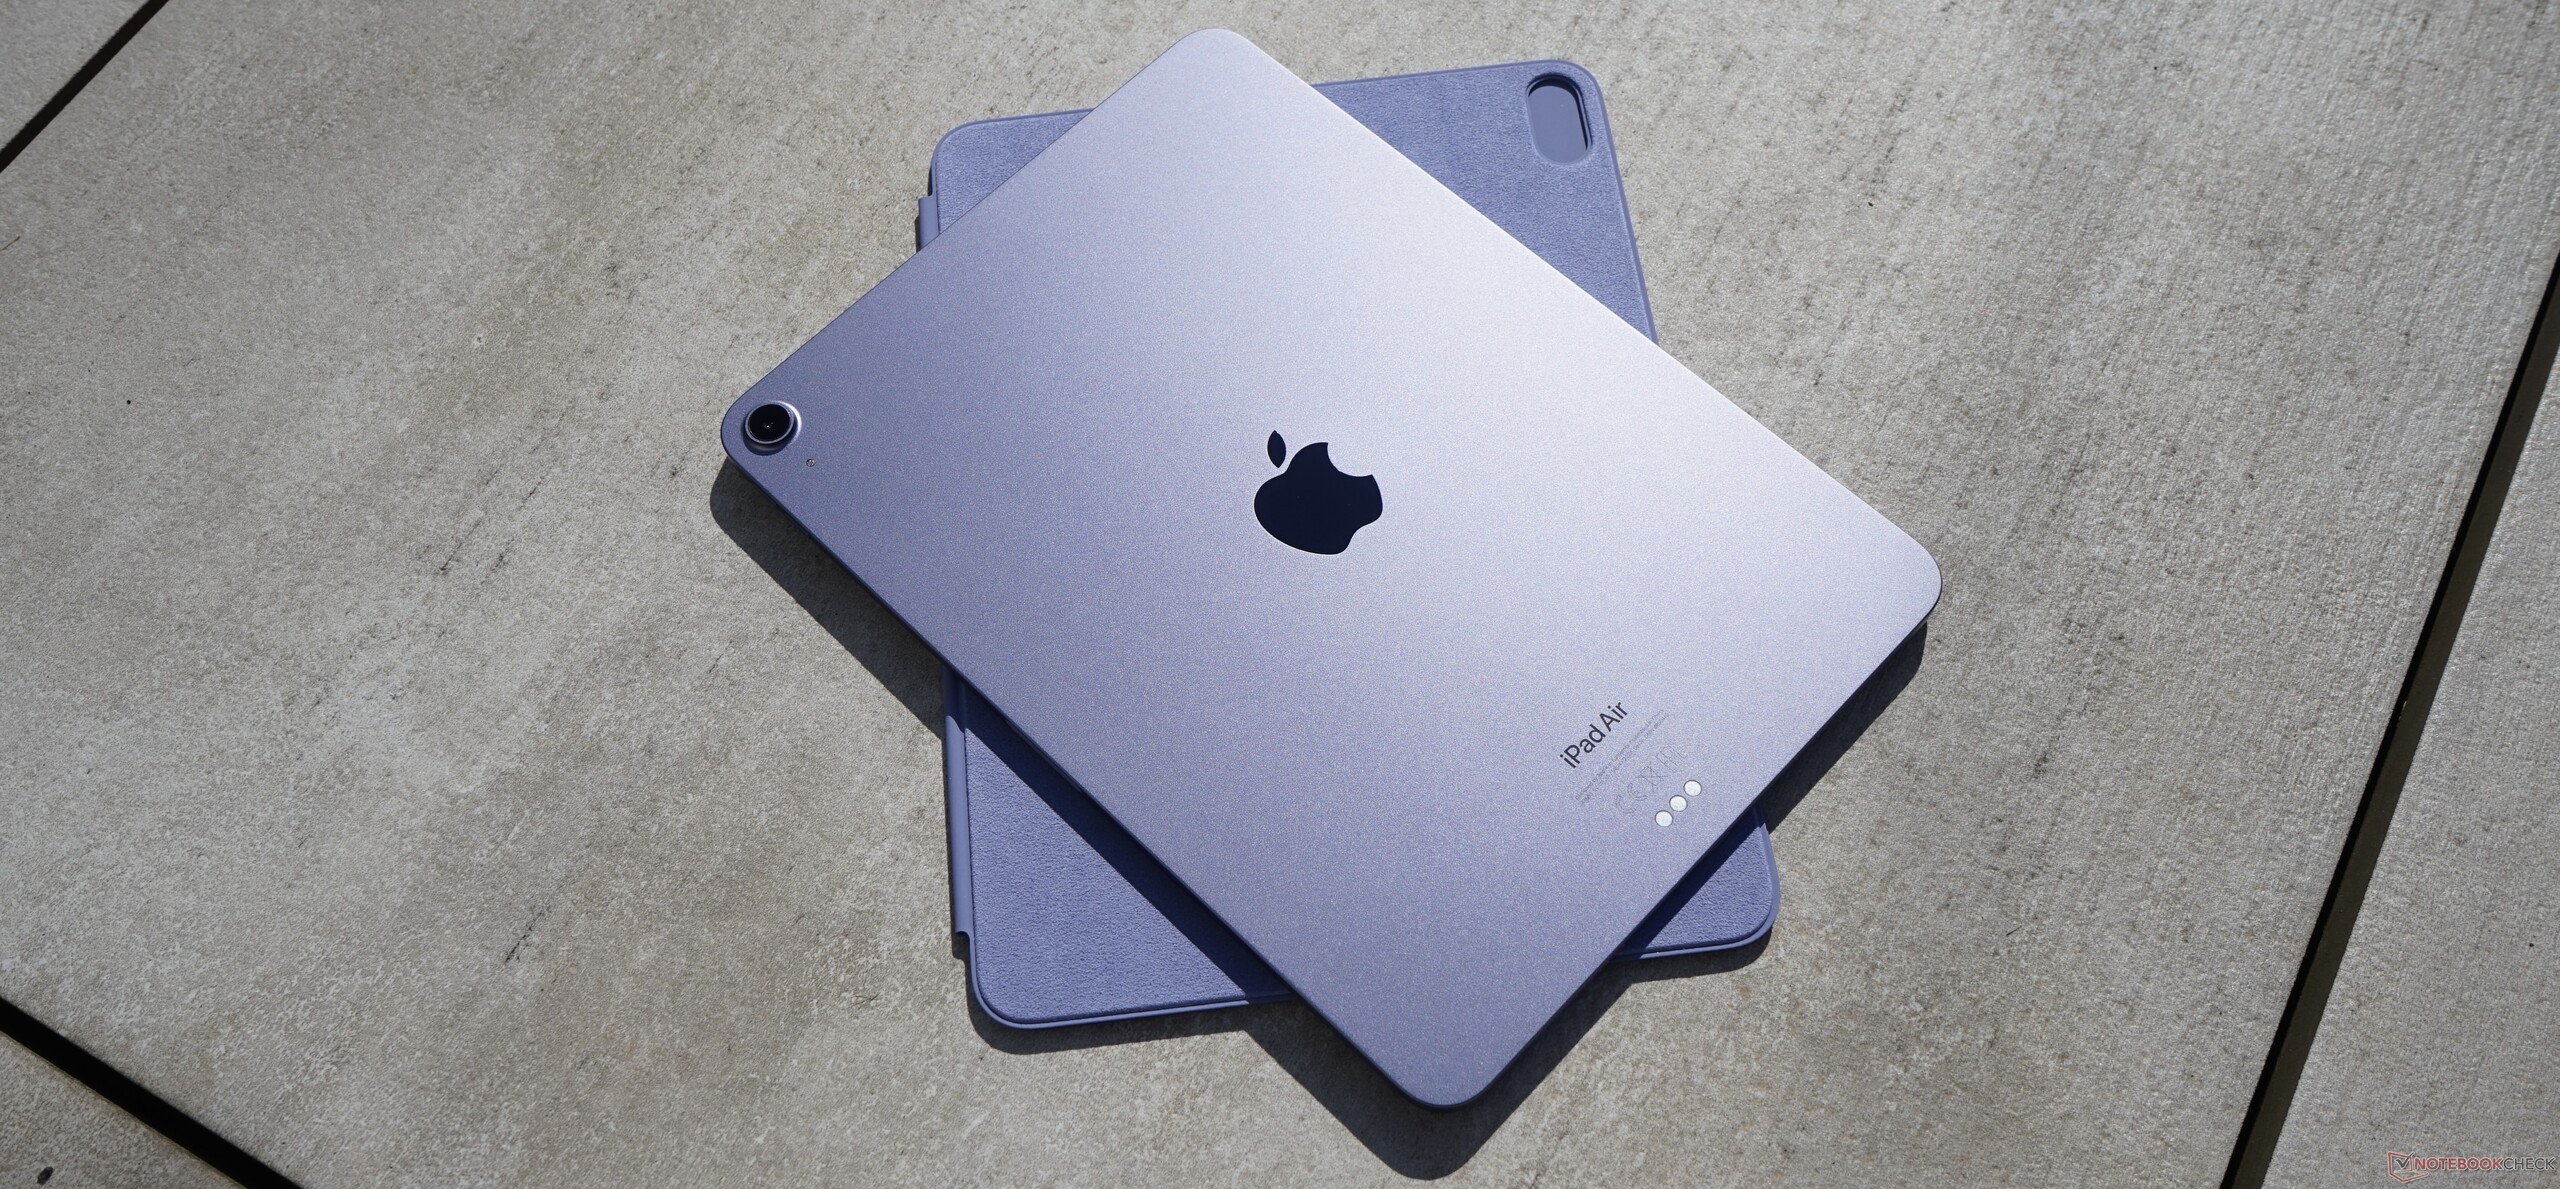
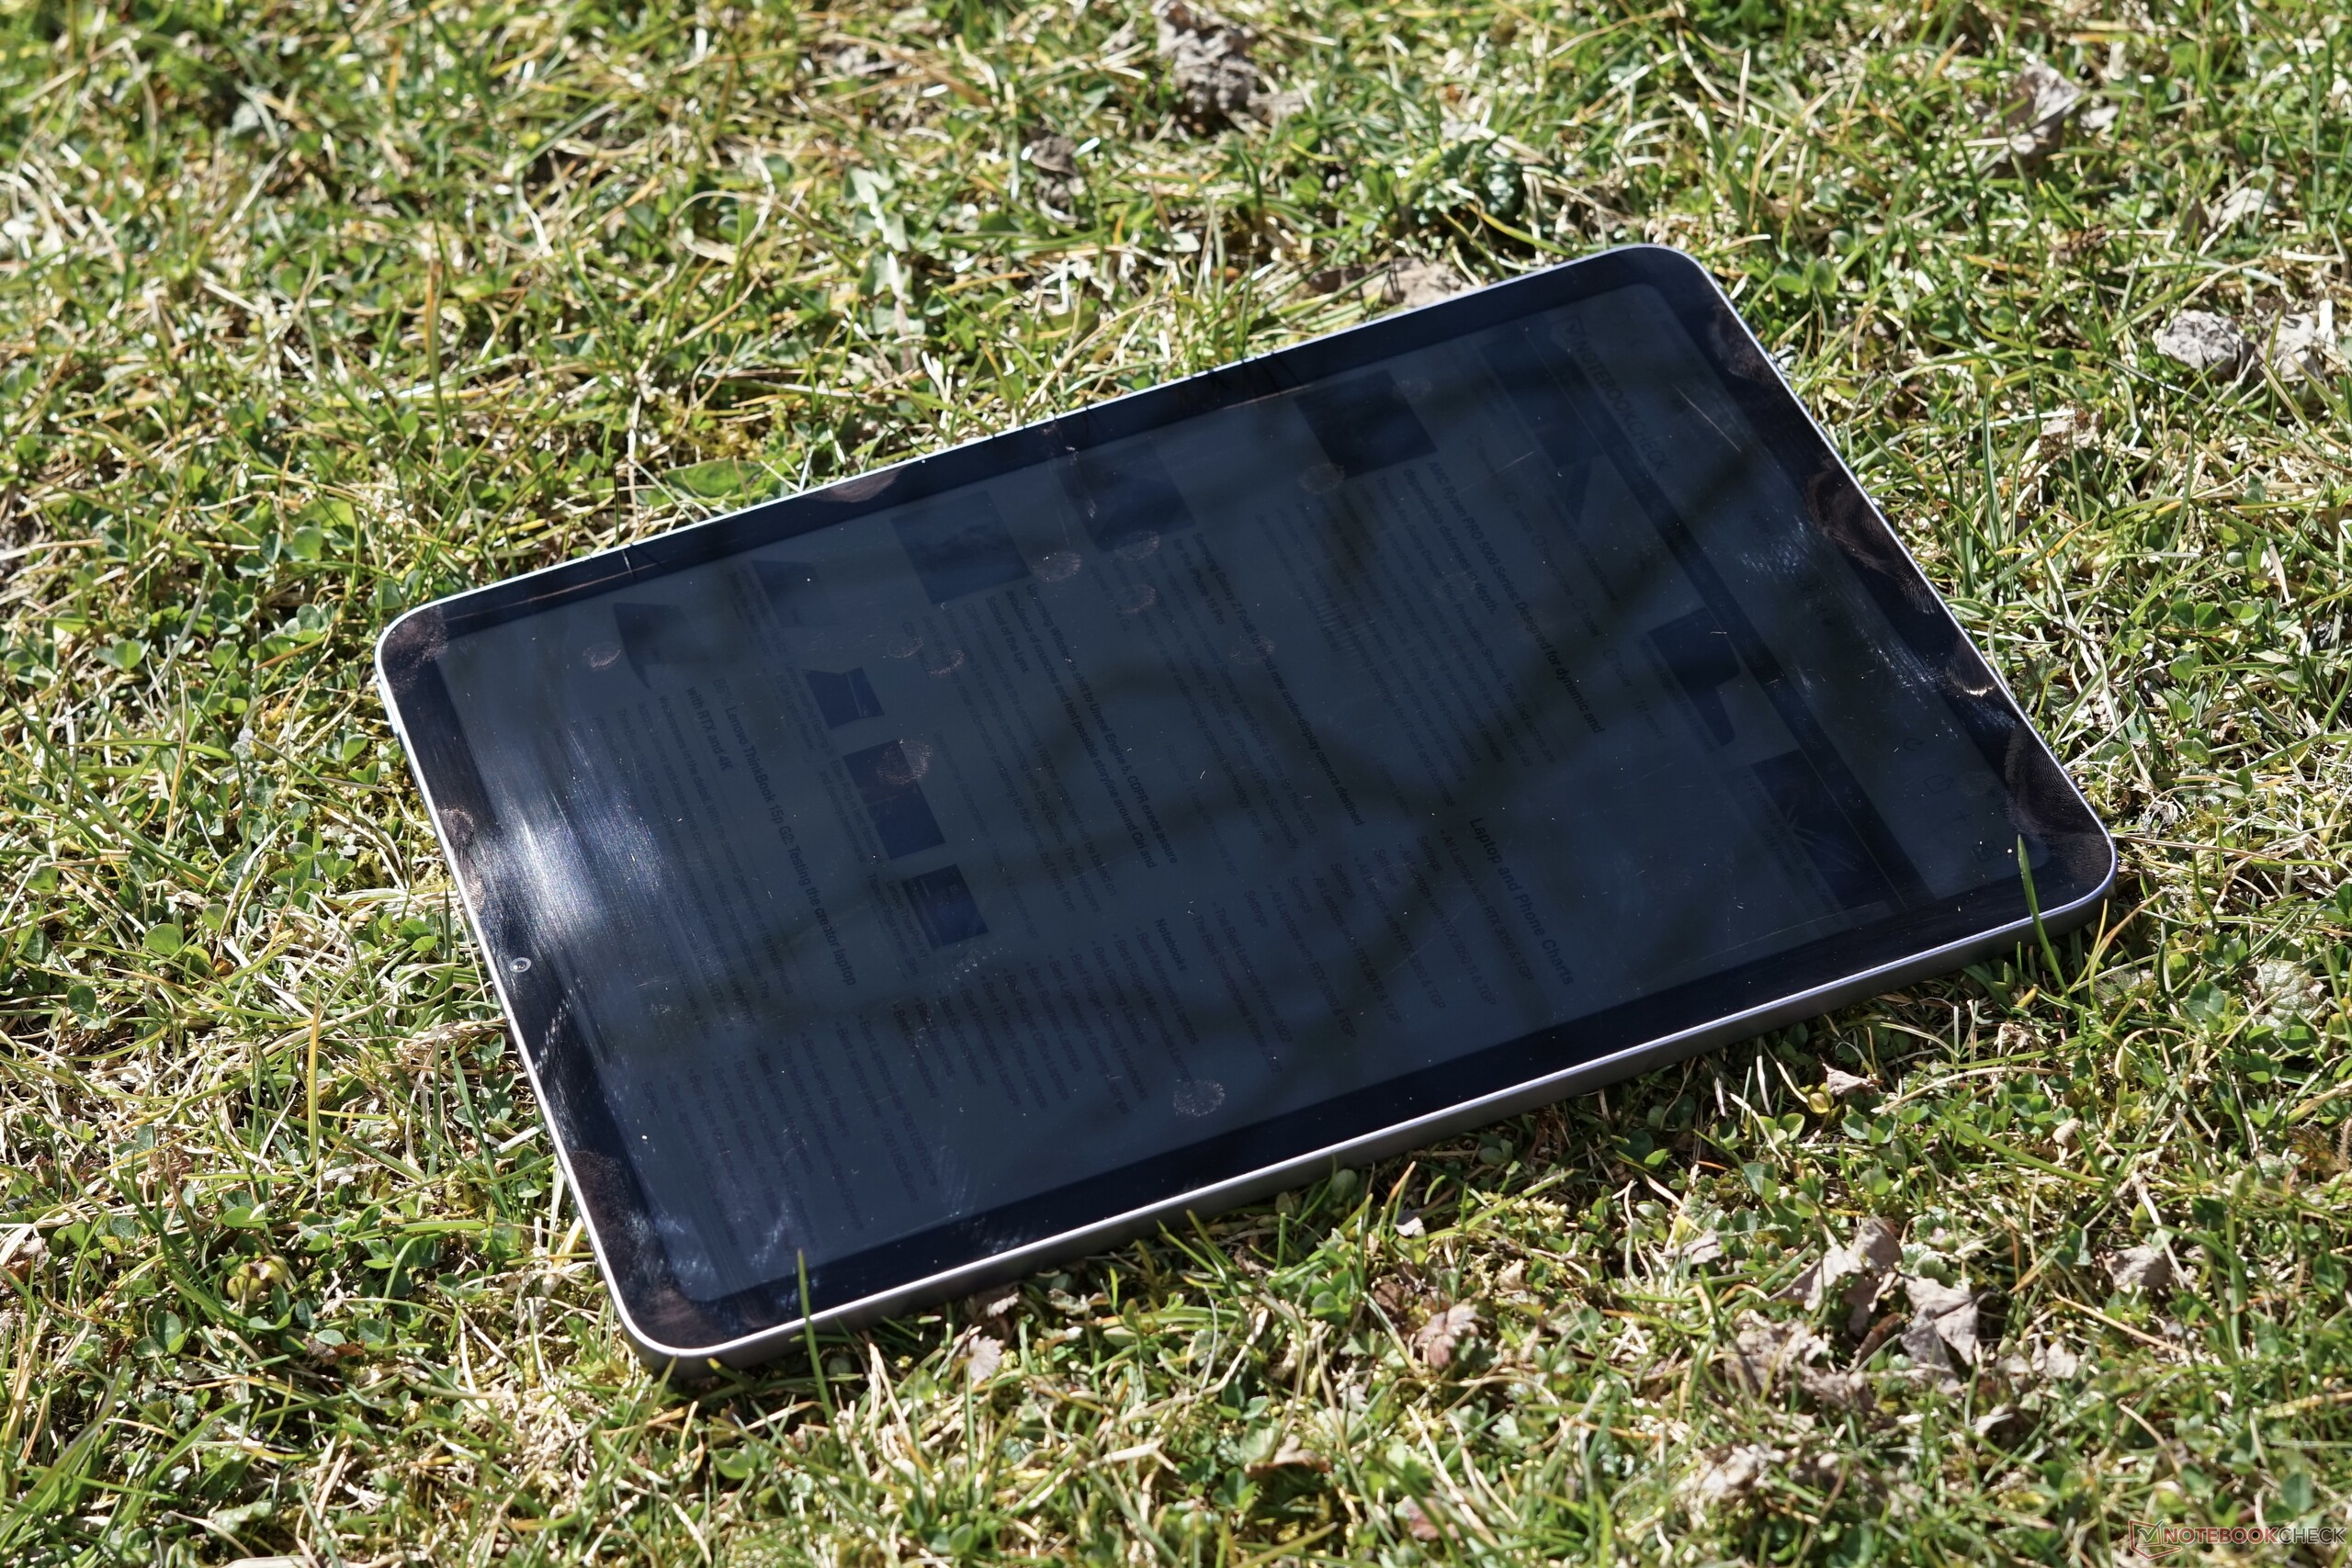
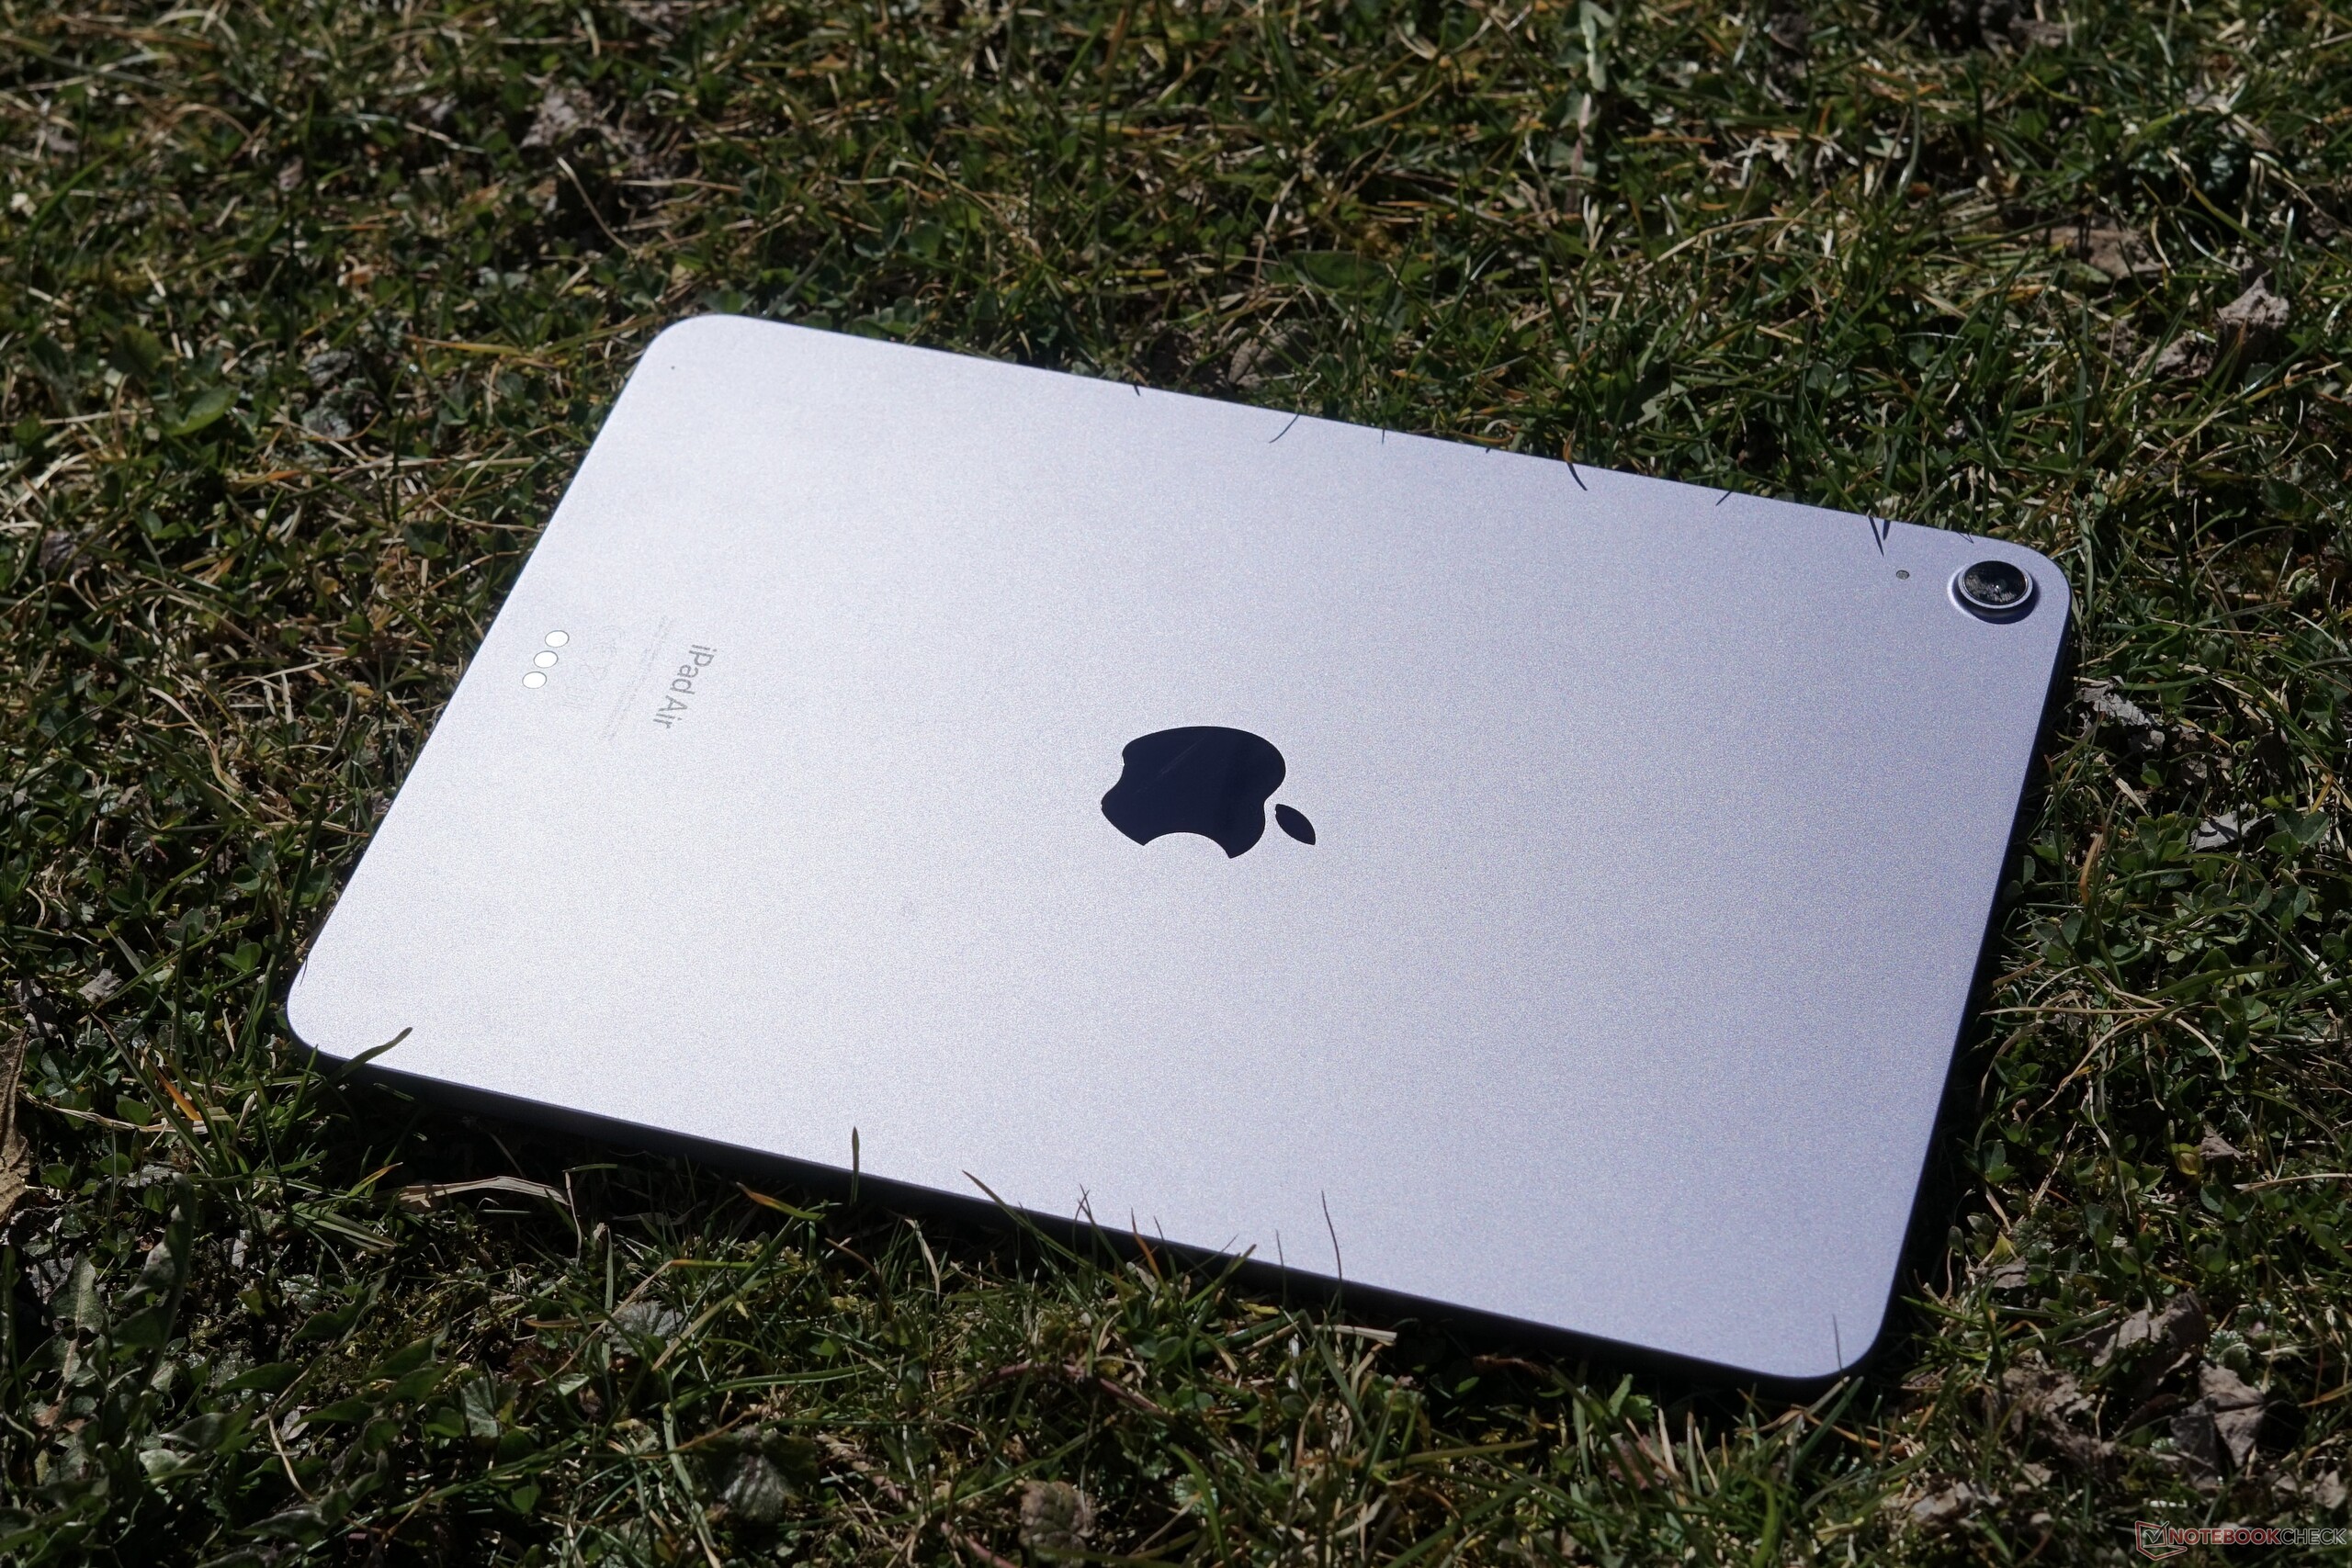
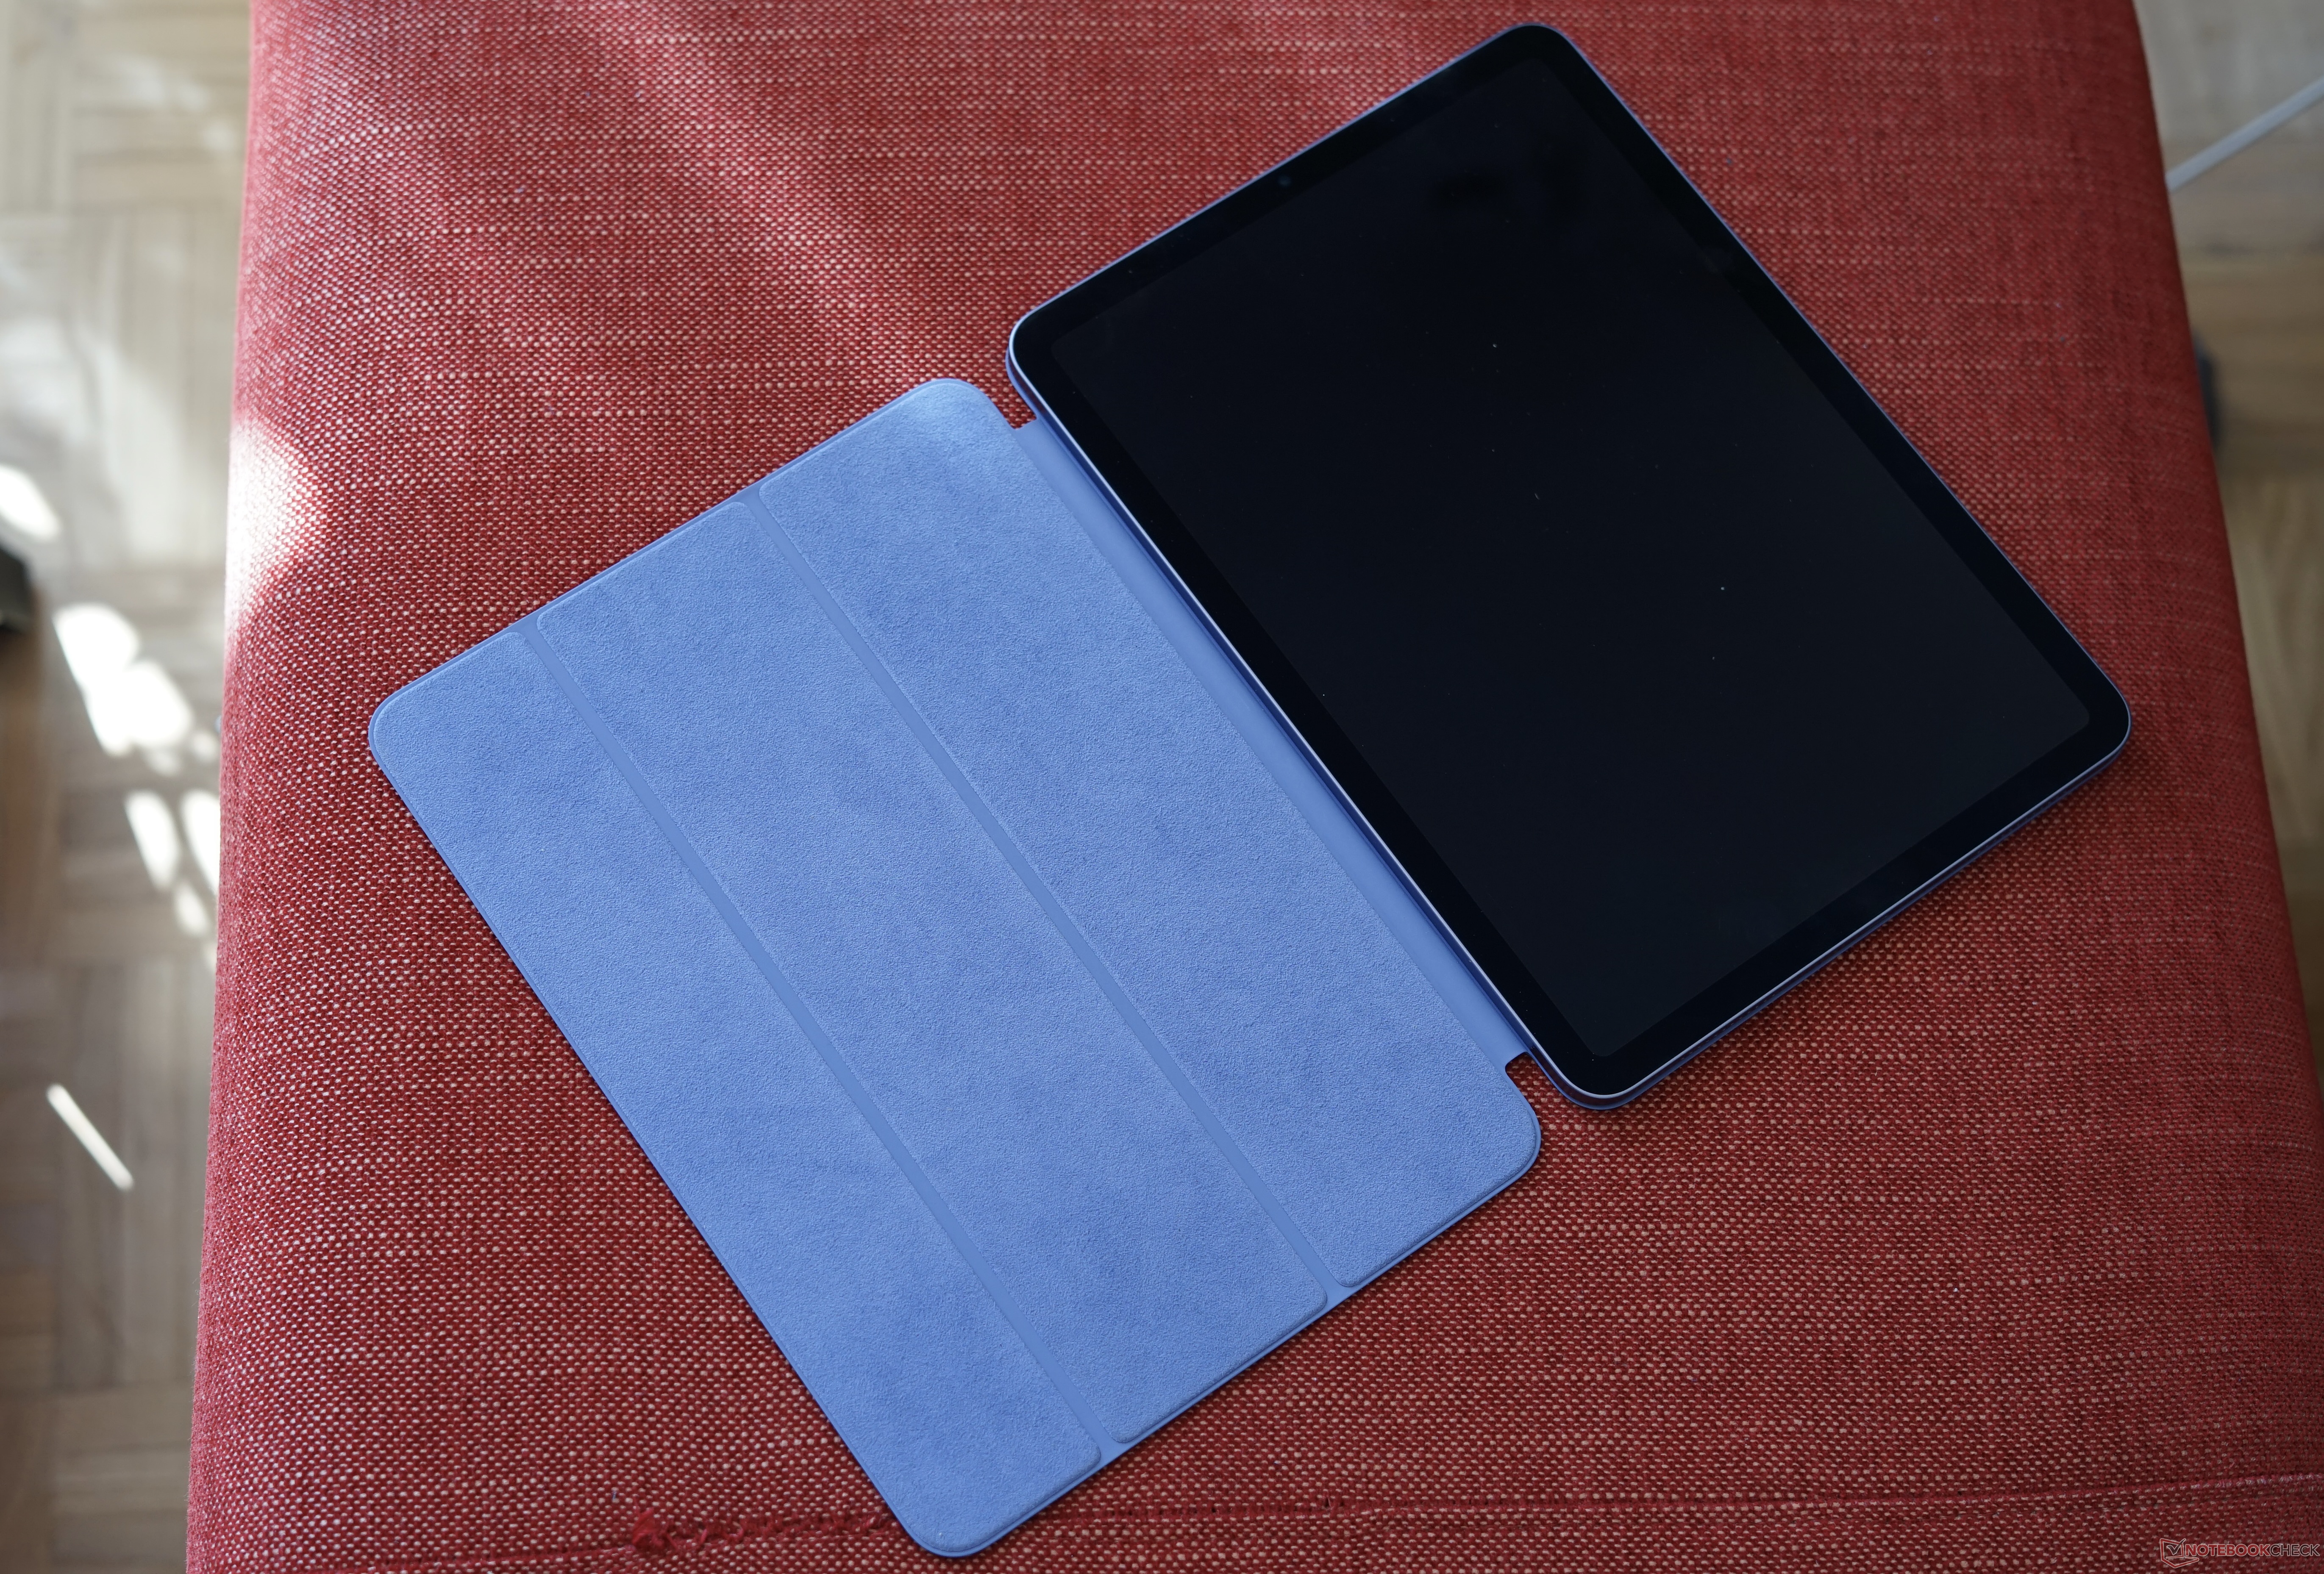
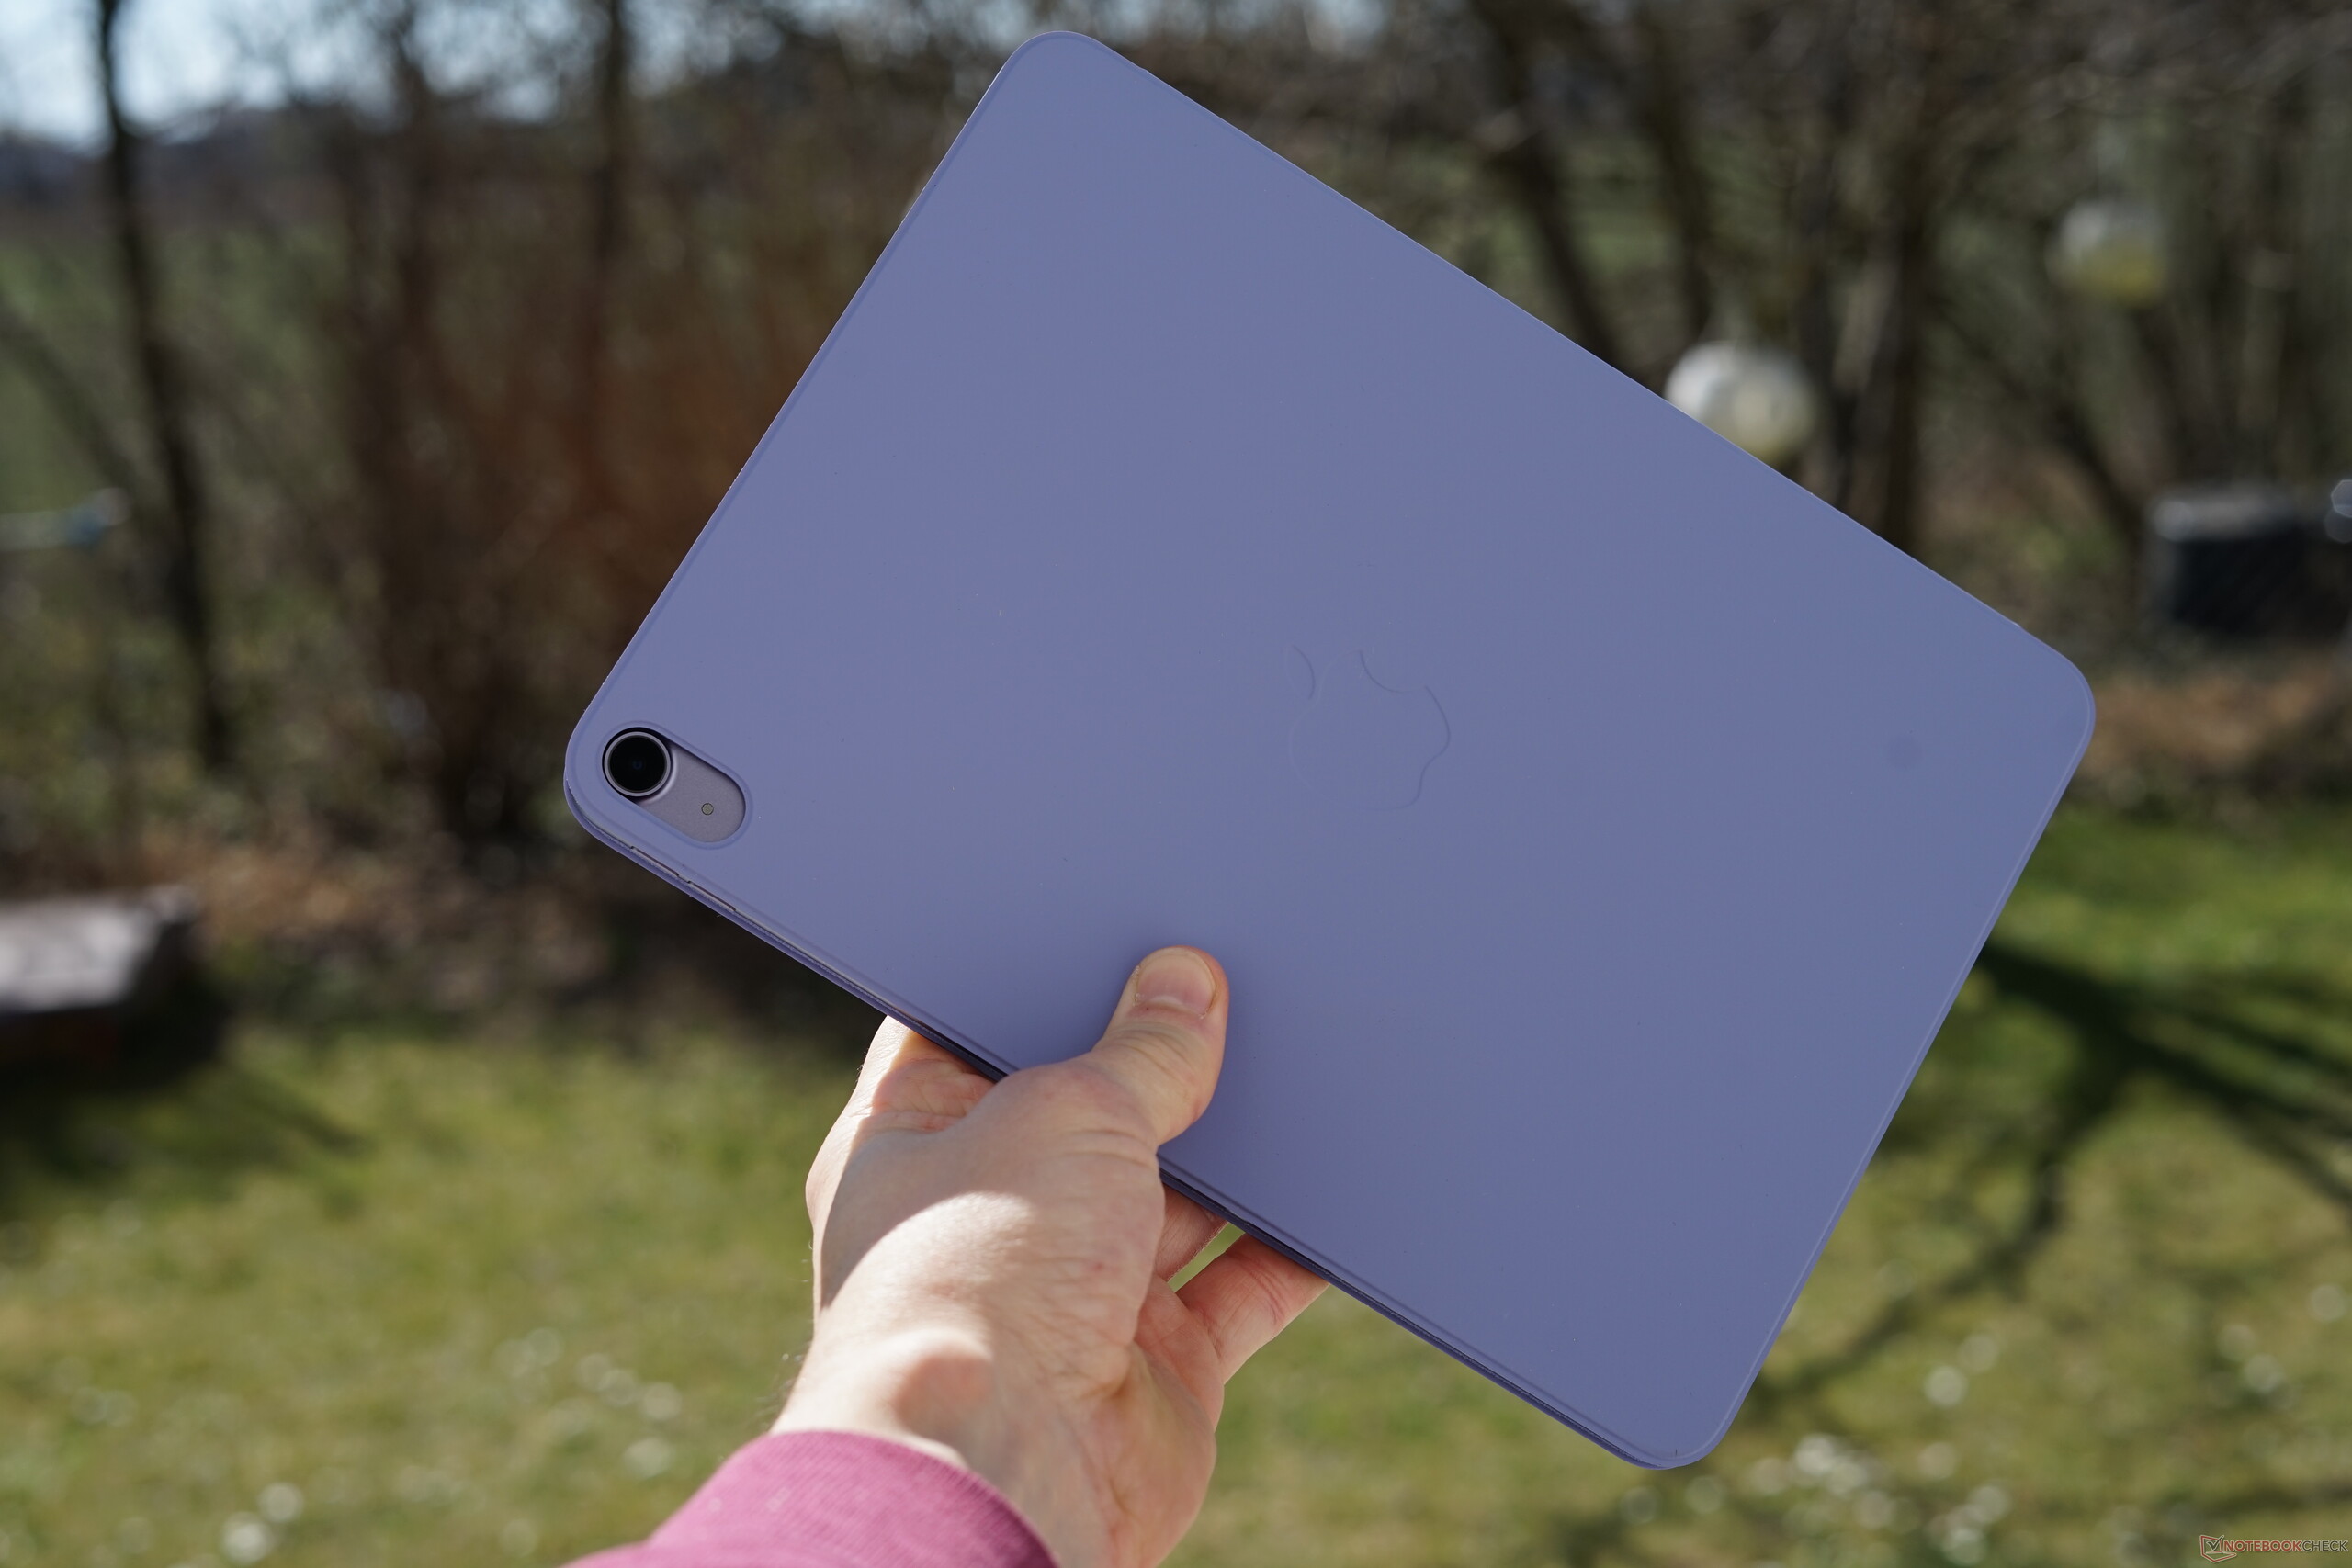
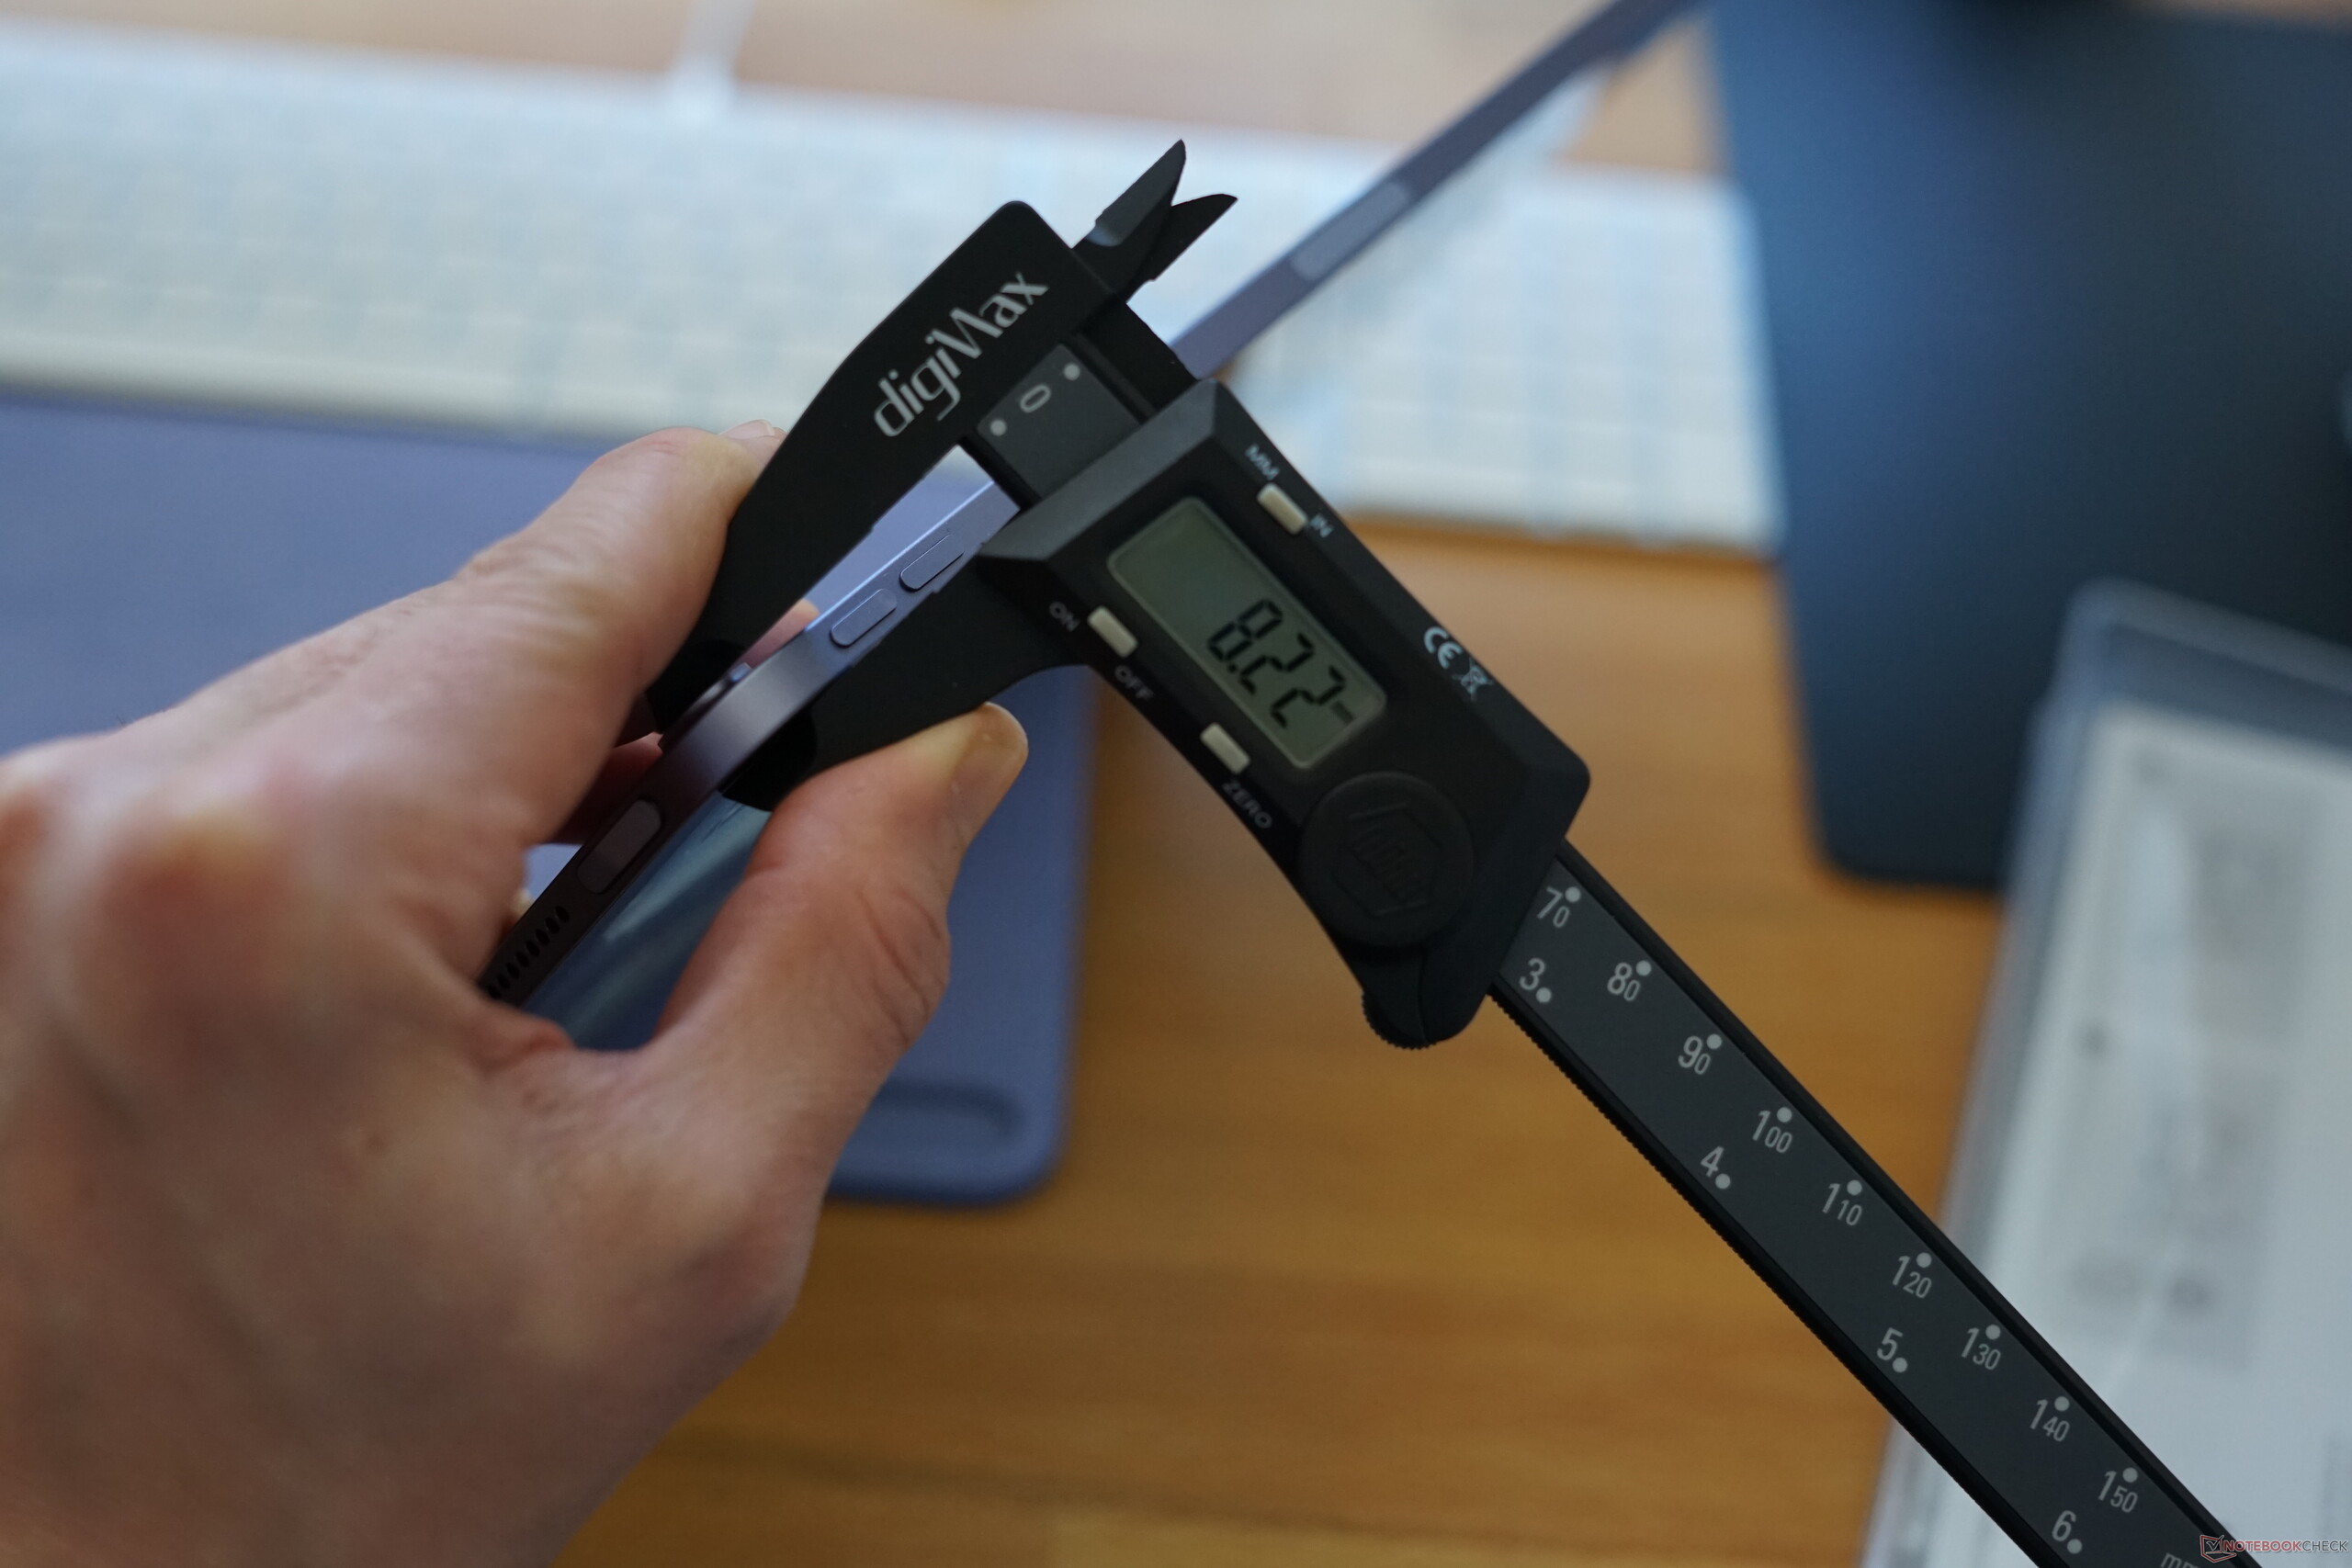
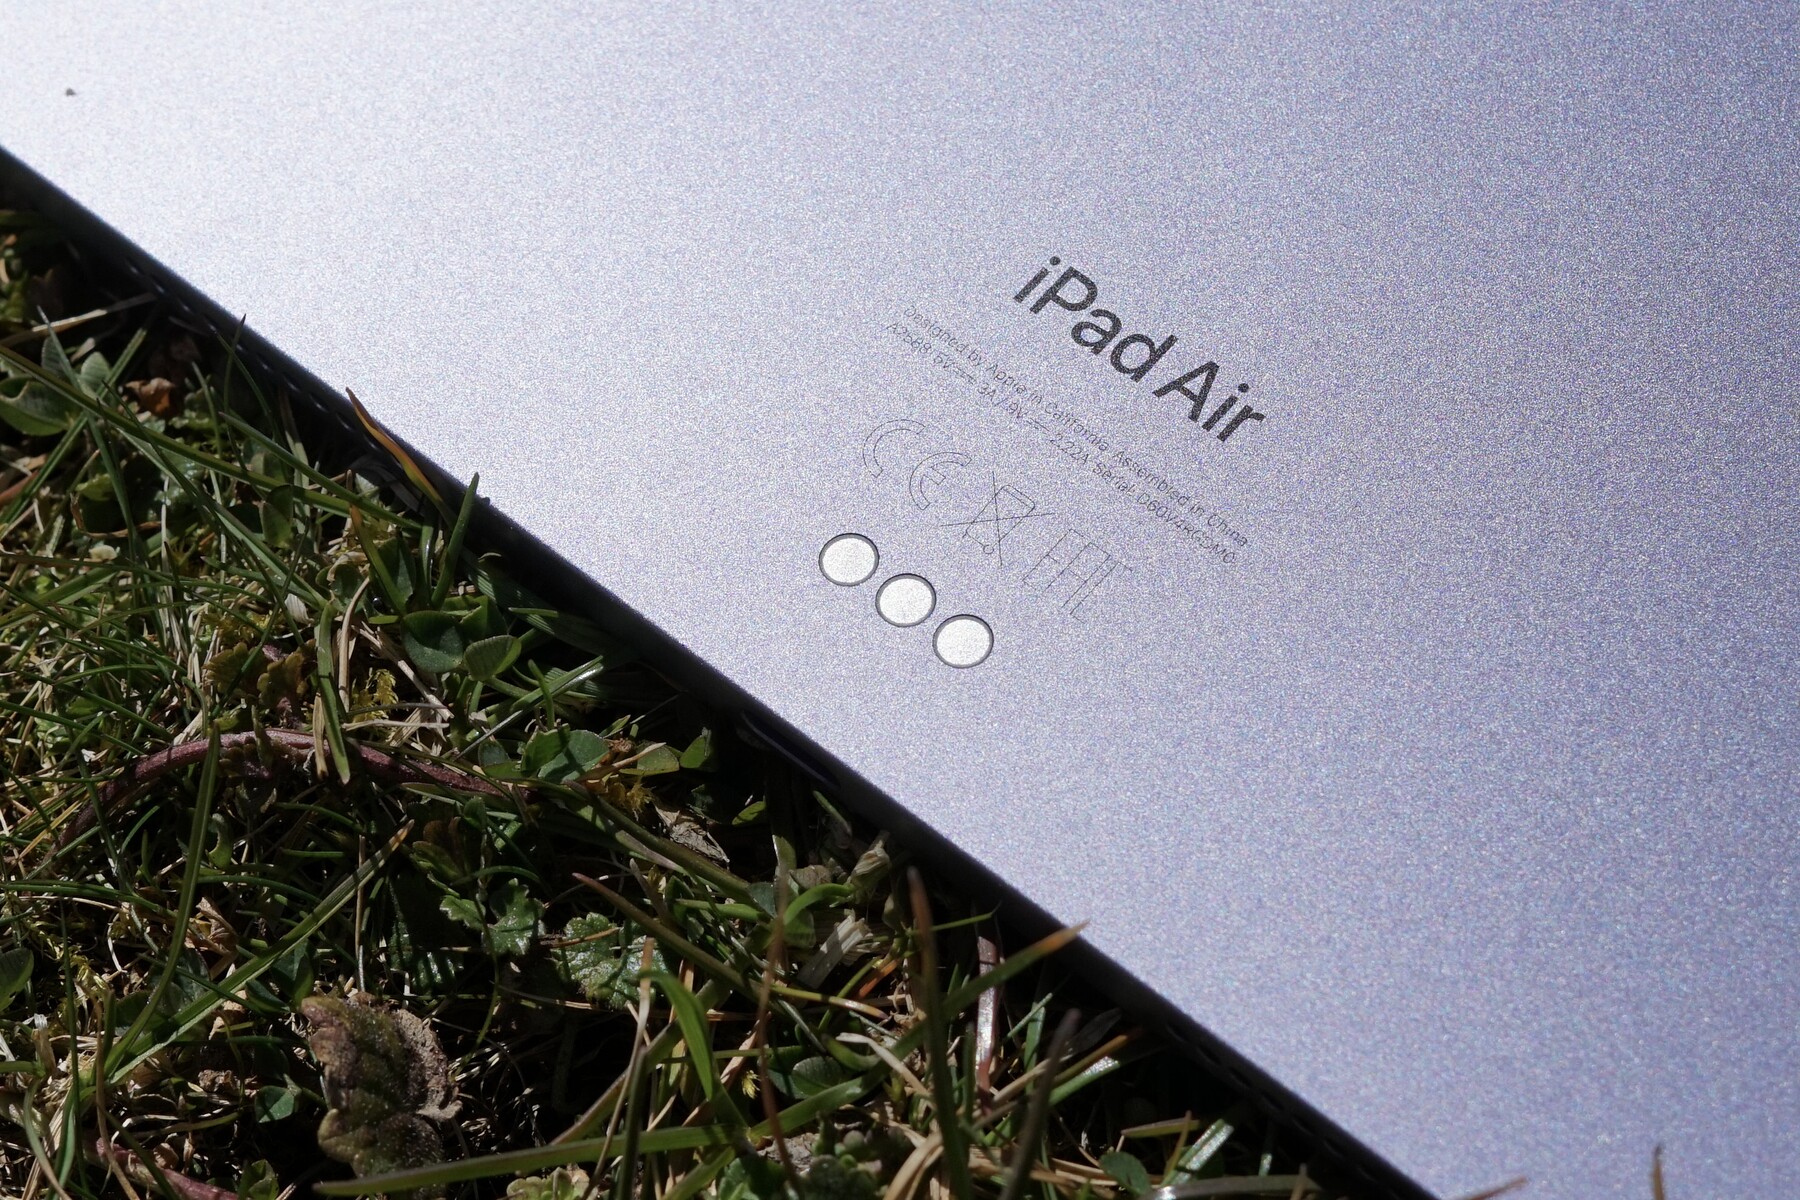
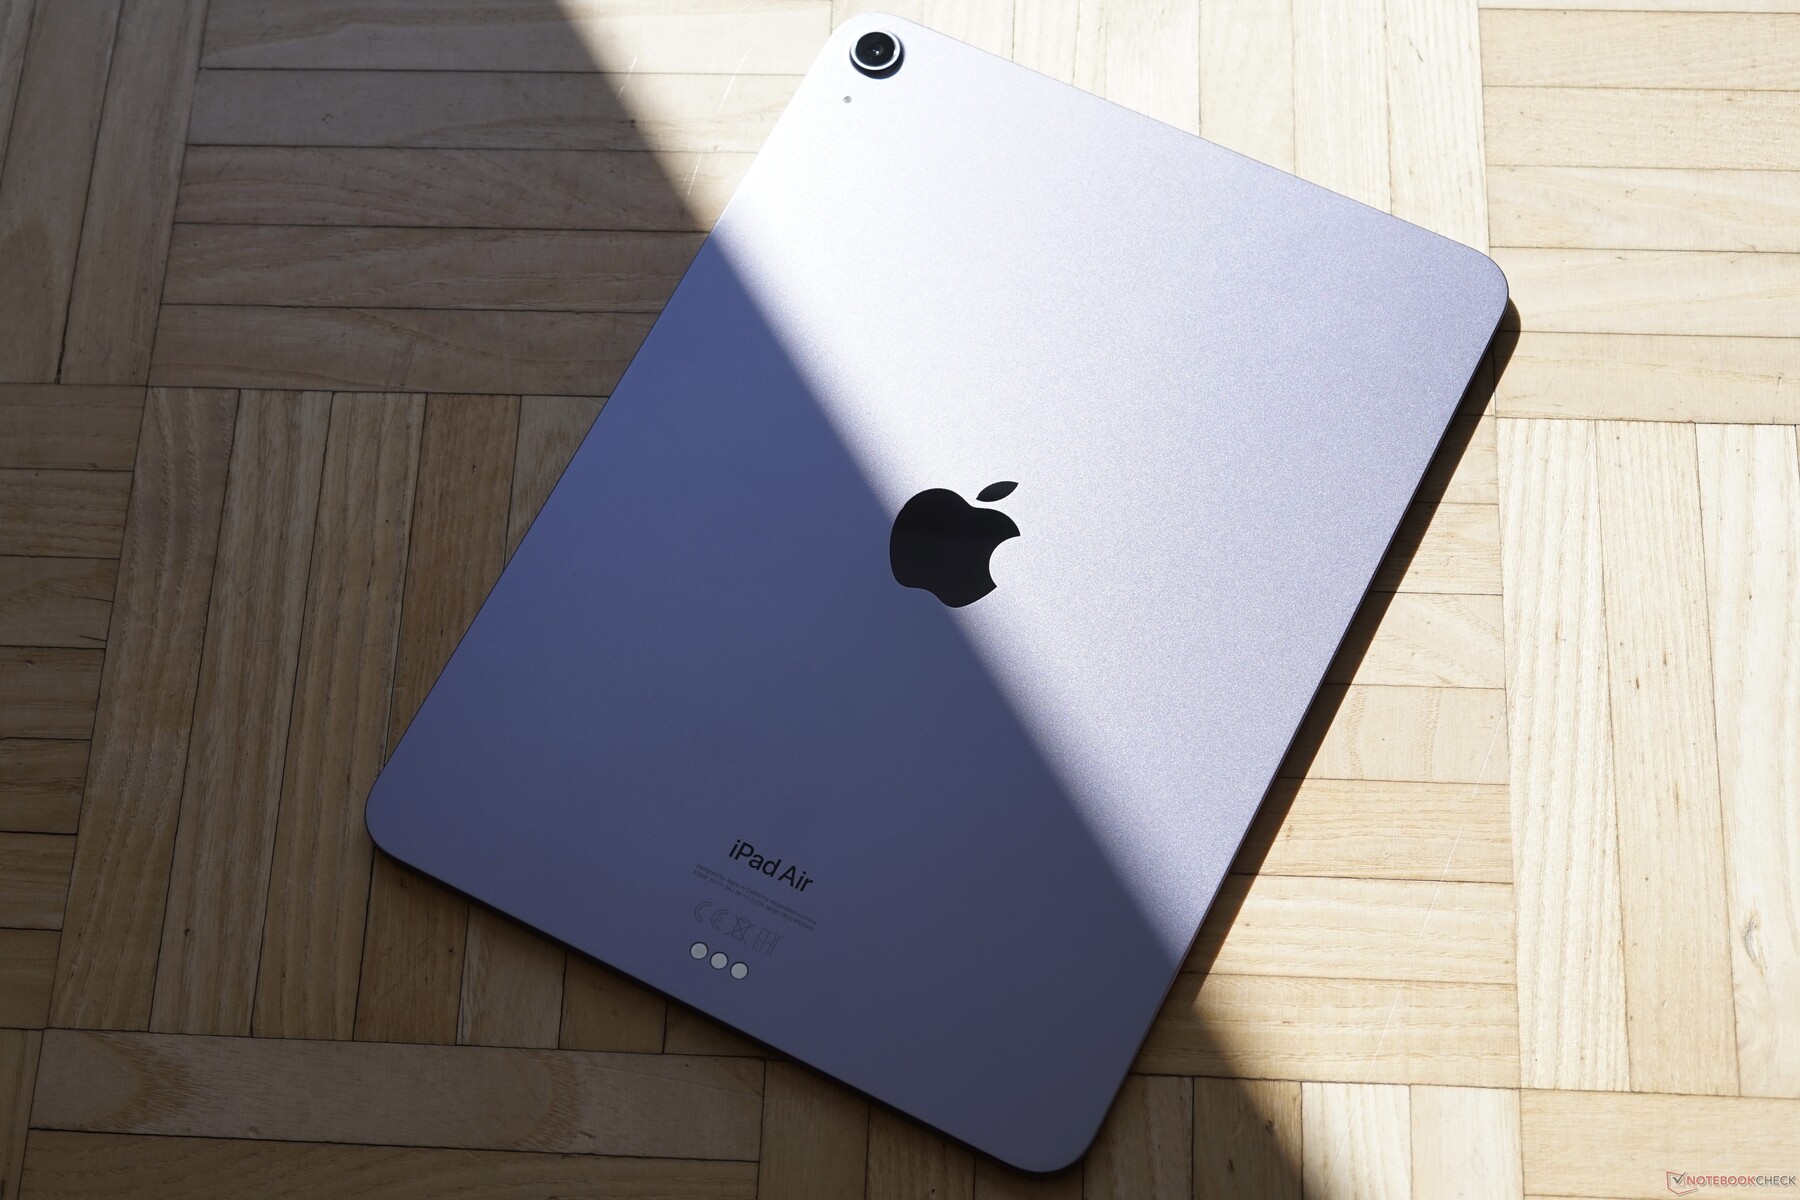
The iPad Air 5’s aluminum case remained unchanged for the 2022 model year. As before, we find a high-quality unibody tablet made of recycled aluminum. The only difference over last year are the colors, some of which have changed slightly. The new line-up includes Space Gray, Pink, Purple, Blue, and Starlight. Our review model was clad in the new purple color.
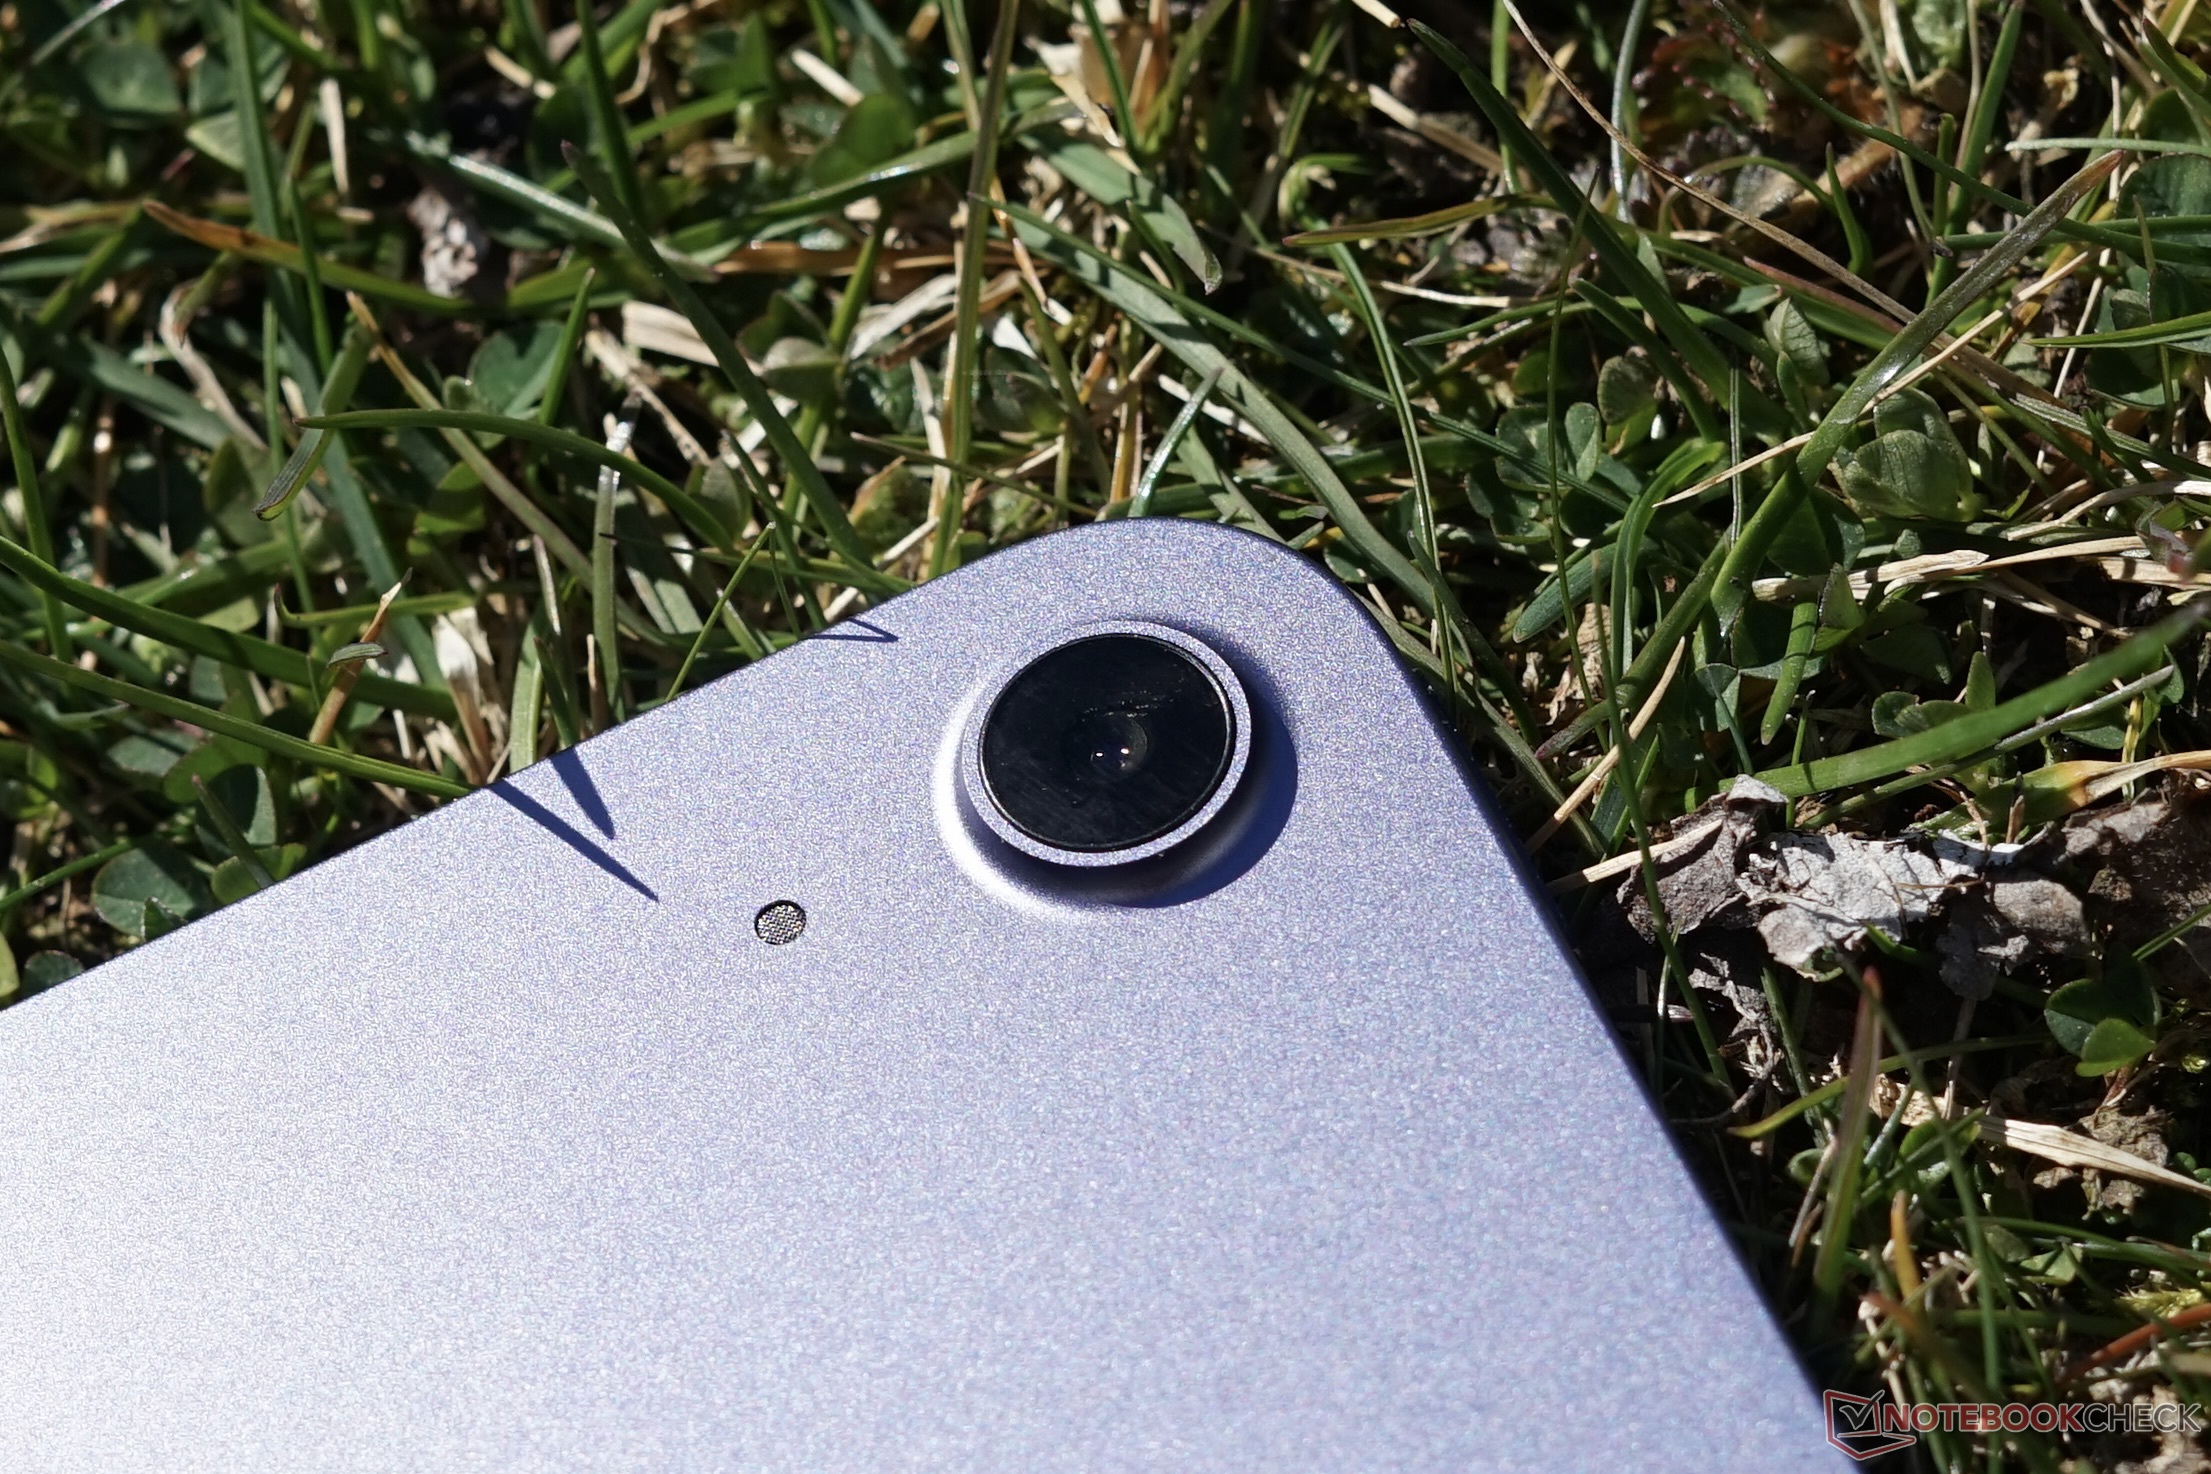
With 6.1 mm (0.24 inches) the 2022 model is exactly as thick as its two immediate predecessors. Unfortunately, the camera continues to protrude quite significantly from the case and sticks out by a whopping 2.1 mm (0.08 inches) resulting in a rather wobbly user experience when placed face-up on a flat surface, such as a table. This, however, can be completely eliminated by installing a case that compensates for the protrusion. A minor difference can be seen in the weight with the 2022 model weighing in at an extra 3 g (0.11 oz), most likely courtesy of the new M1 chip.
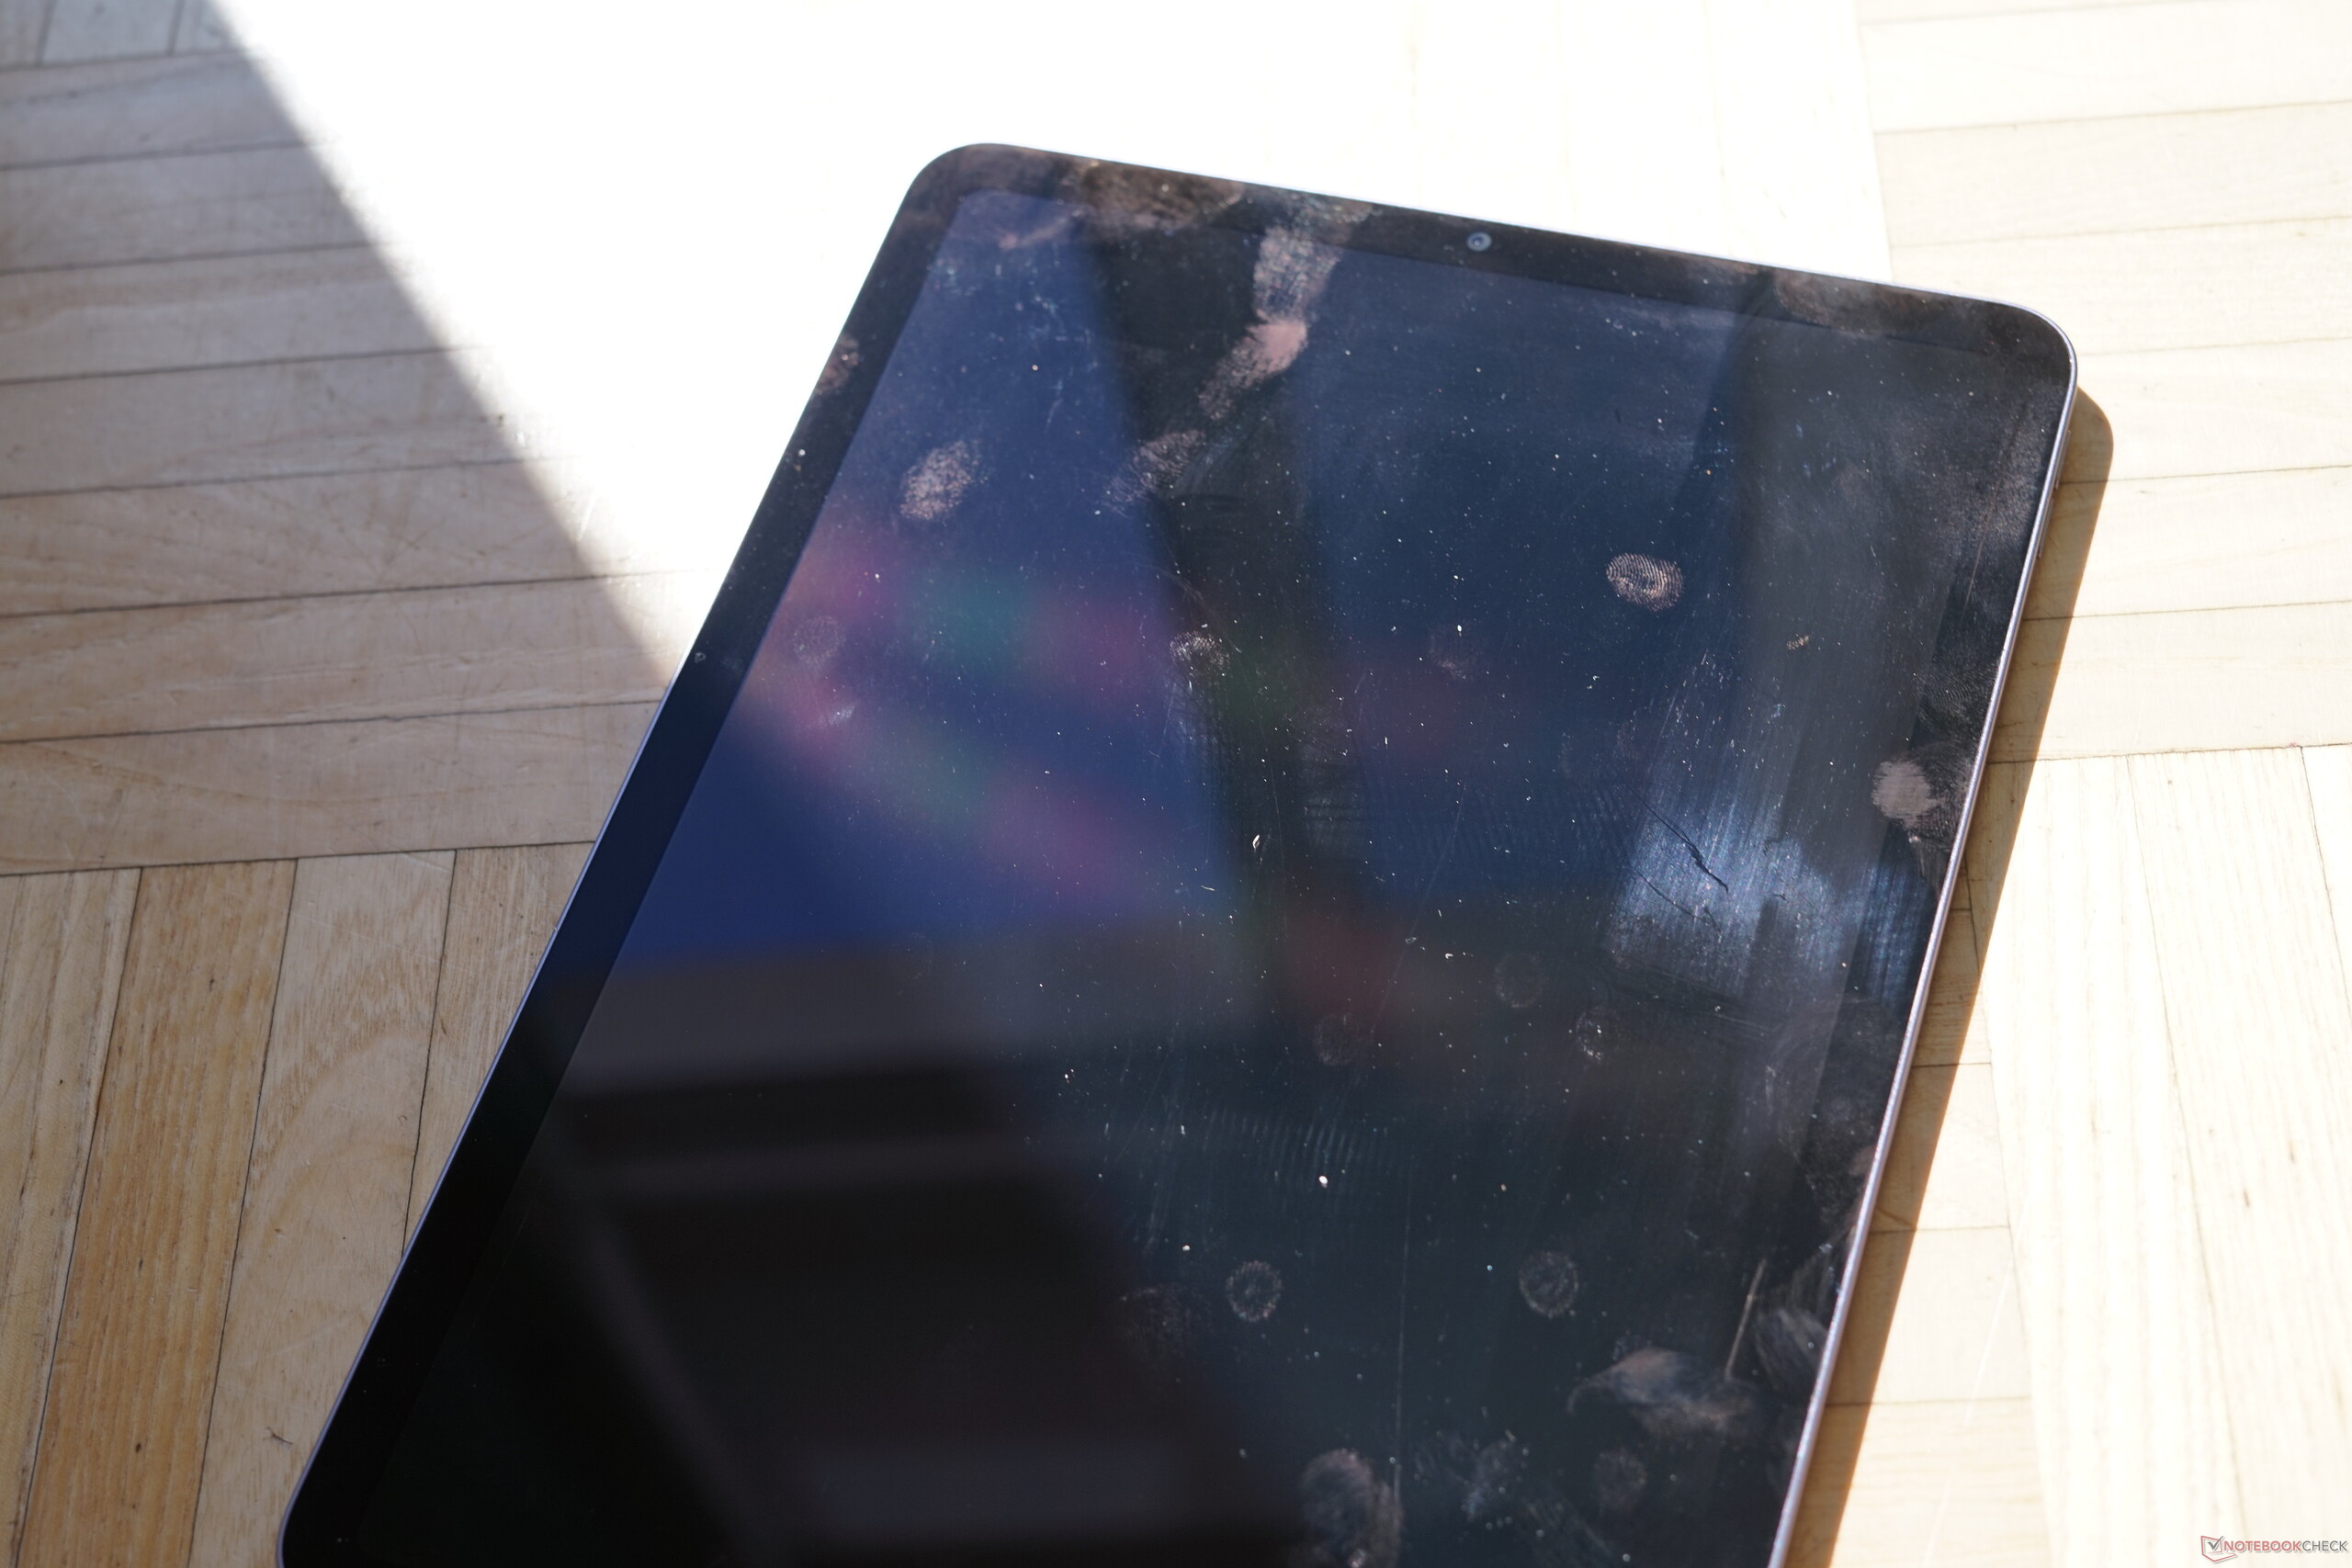
Build quality is excellent, and the aluminum surface not only has a great touch and feel but it is also virtually impervious to fingerprints. The device remained completely silent during our attempts to warp it out of shape but did suffer from minor distortions with pressure applied to the display. All panel gaps are tight and consistent.
As with previous devices Apple’s focus is on sustainability. In addition to recycled aluminum the new iPad Air also contains recycled tin for the solder joints as well as recycled rare earths for its speakers. The box is a mix of recycled wood fiber and new wood from sustainably managed forests. As of today, Apple still plans to be 100 percent carbon neutral by 2030.

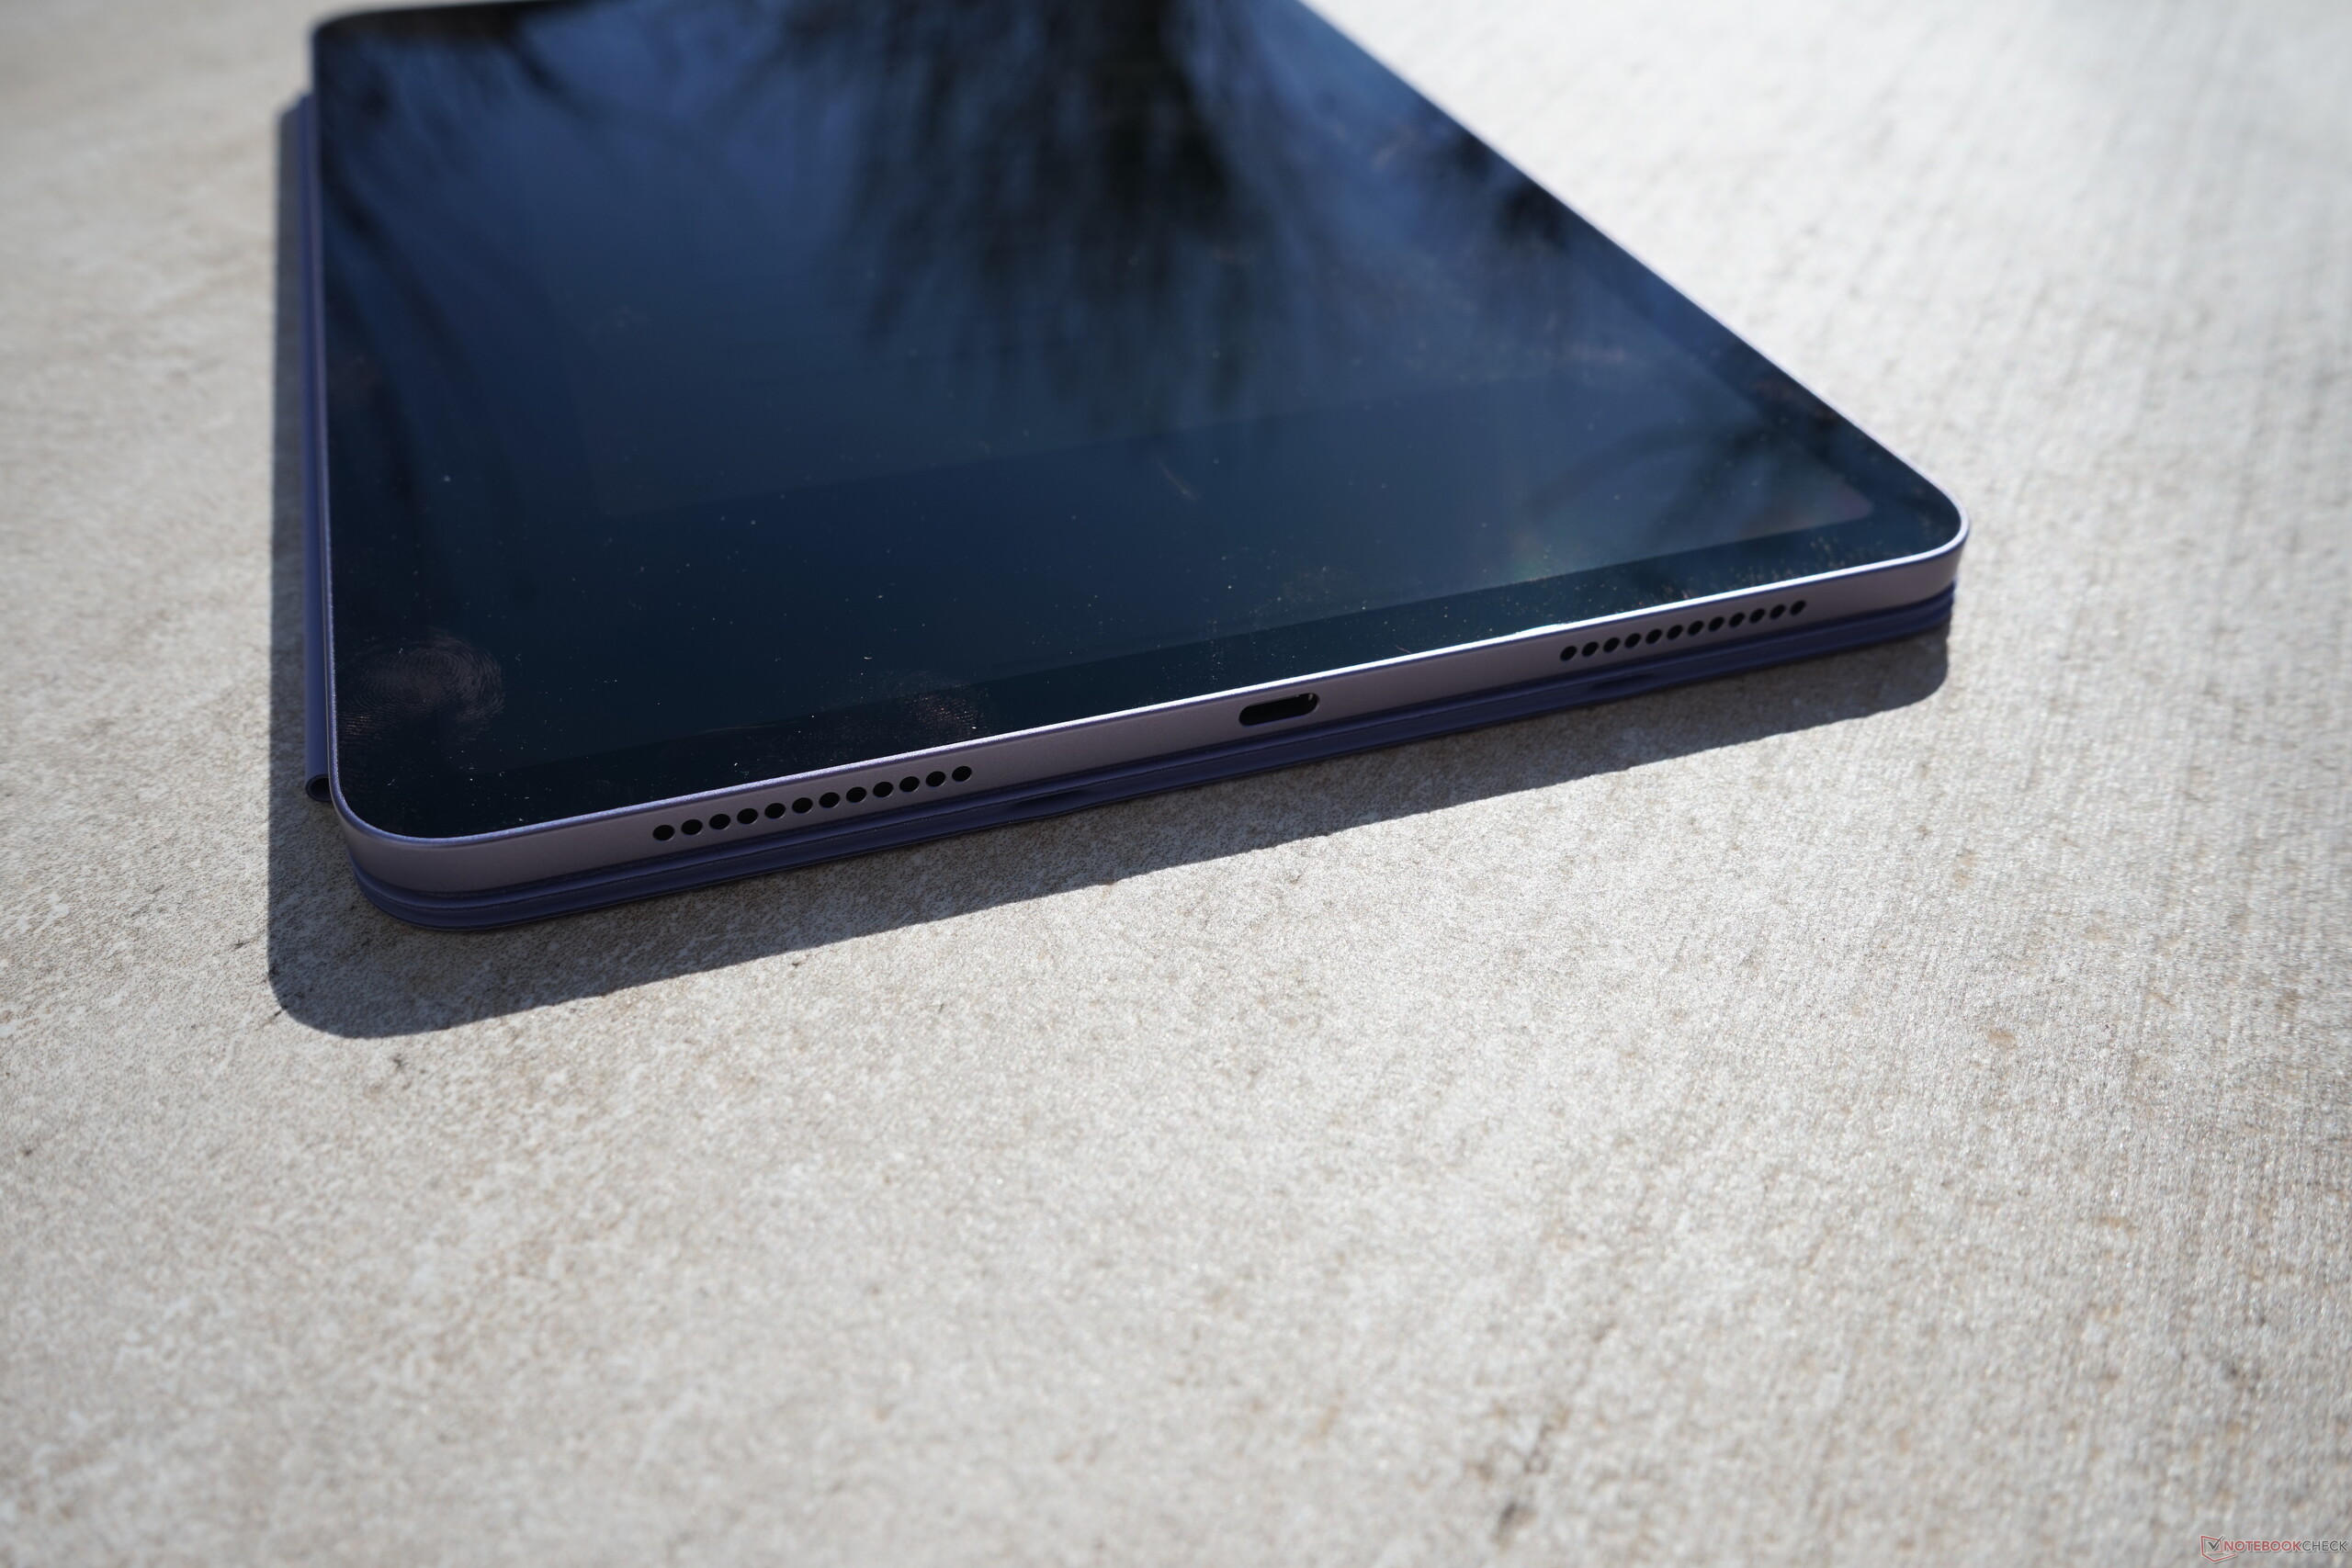
Connectivity
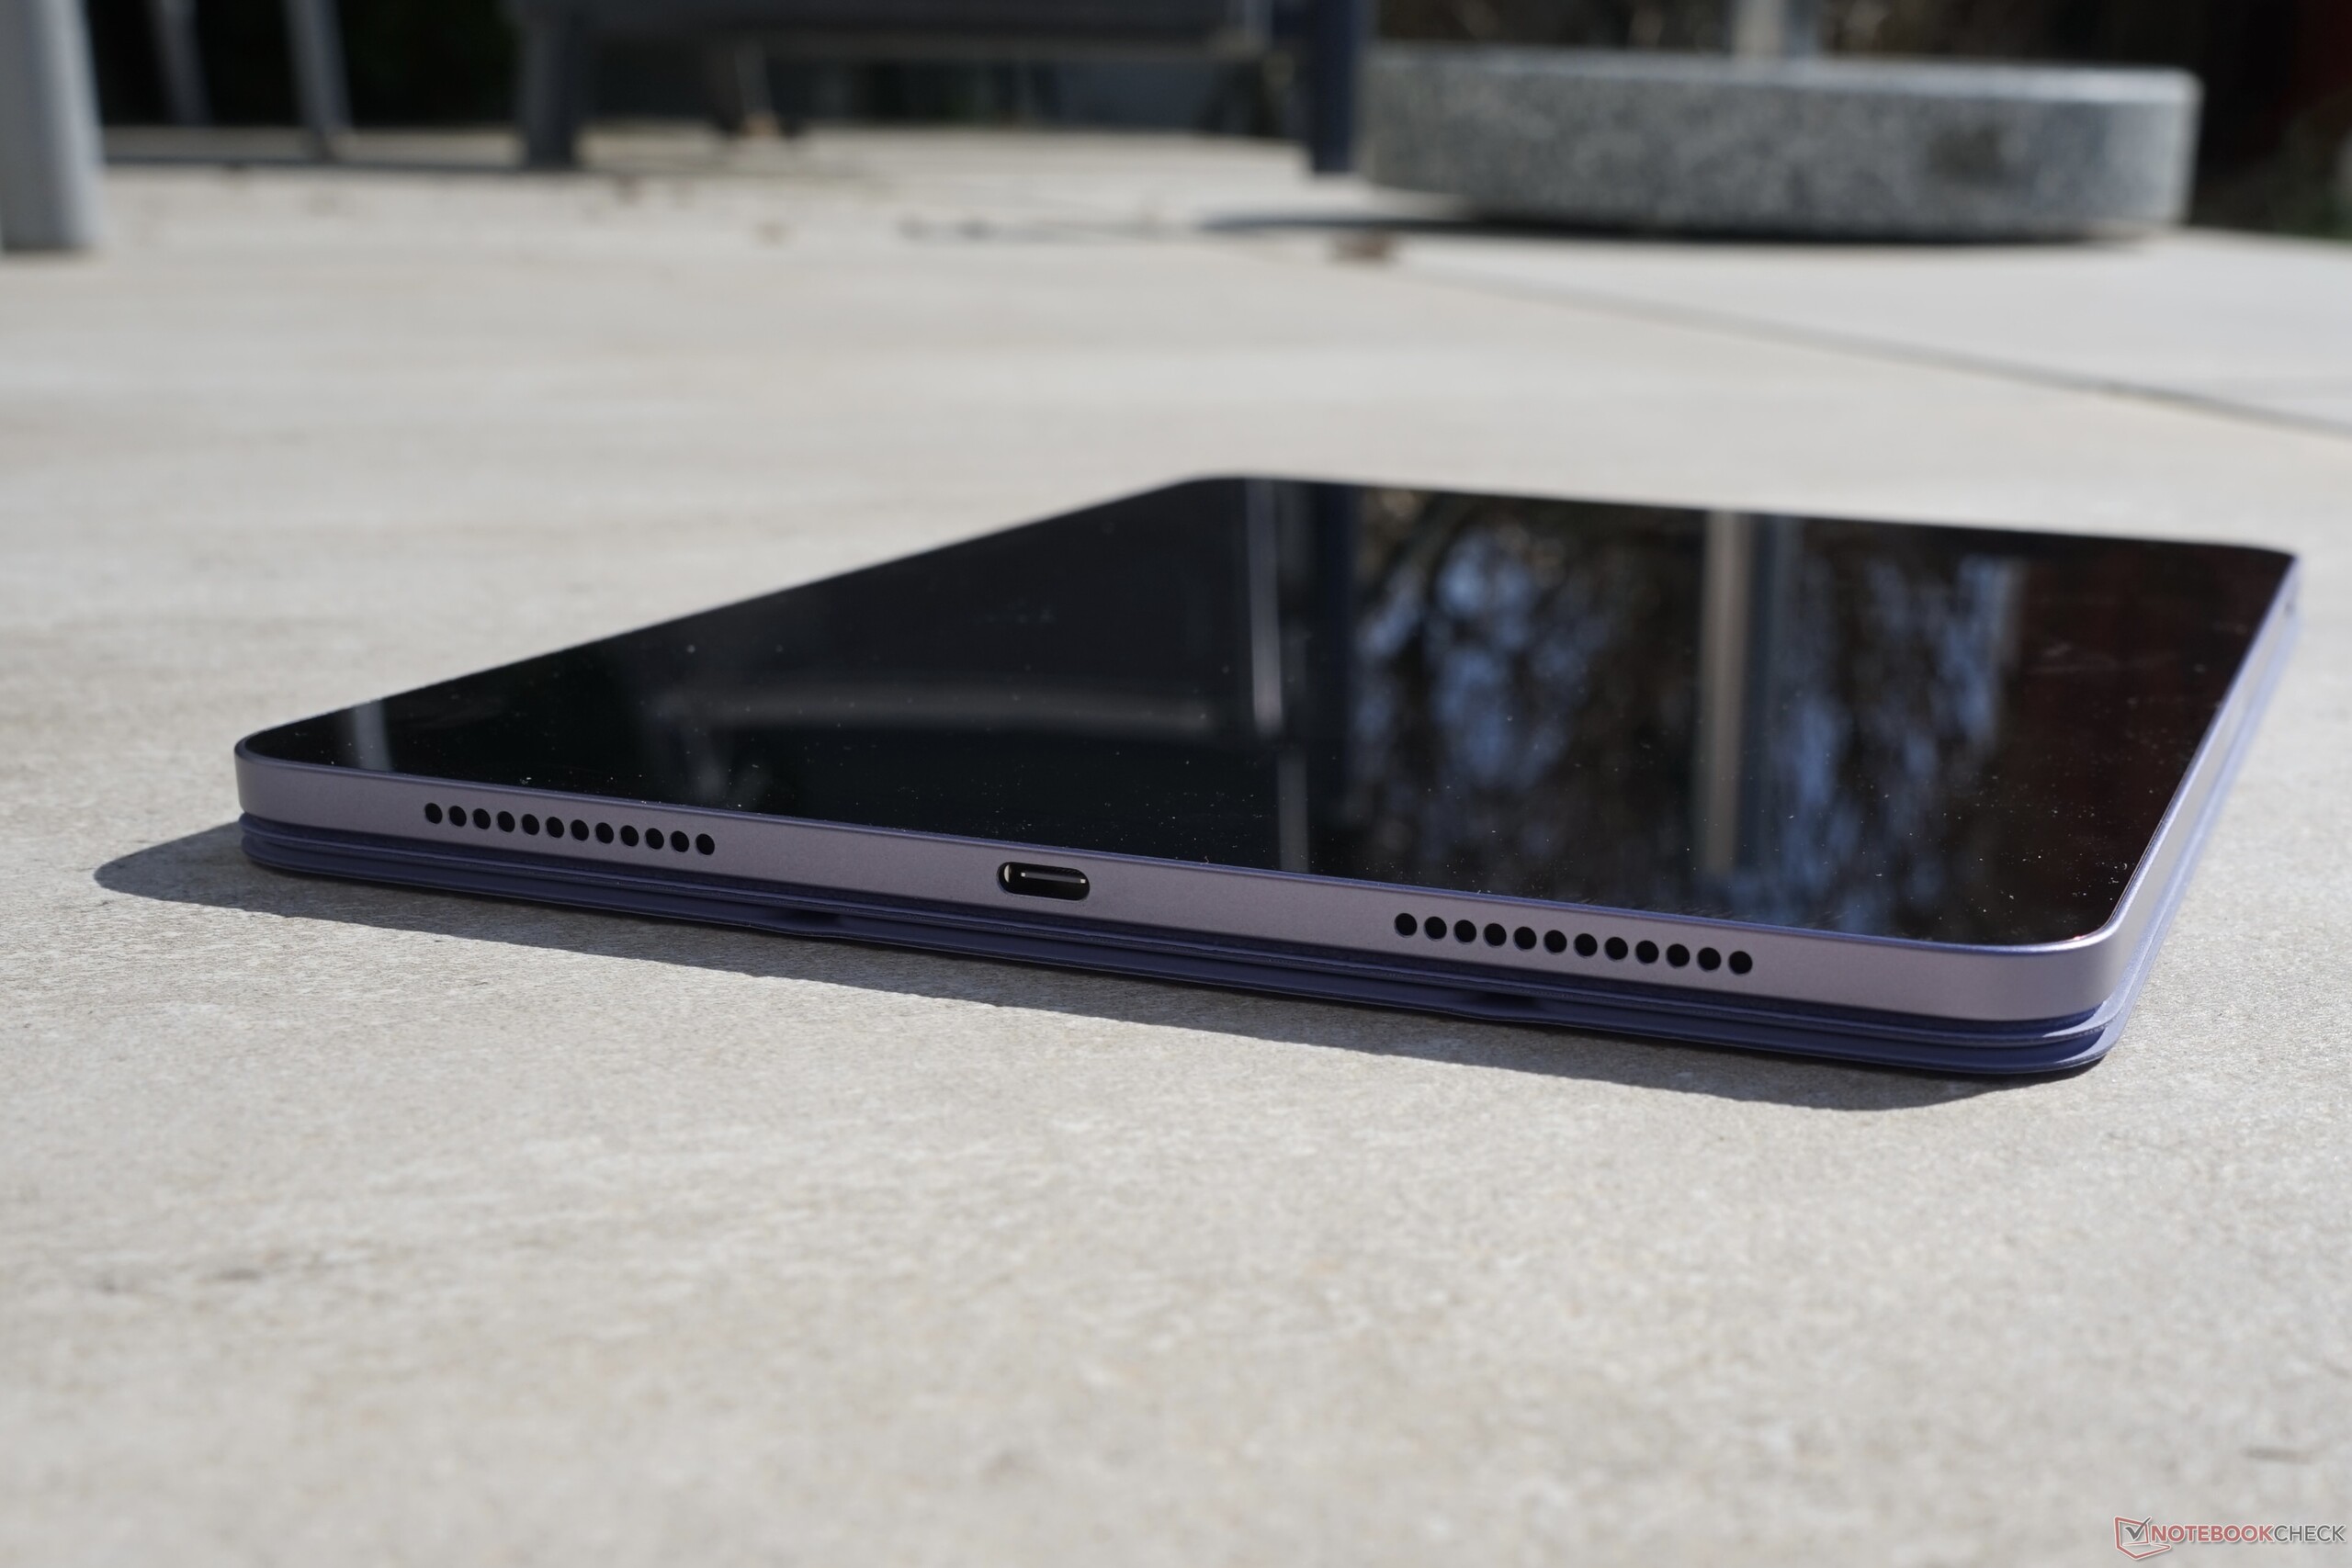
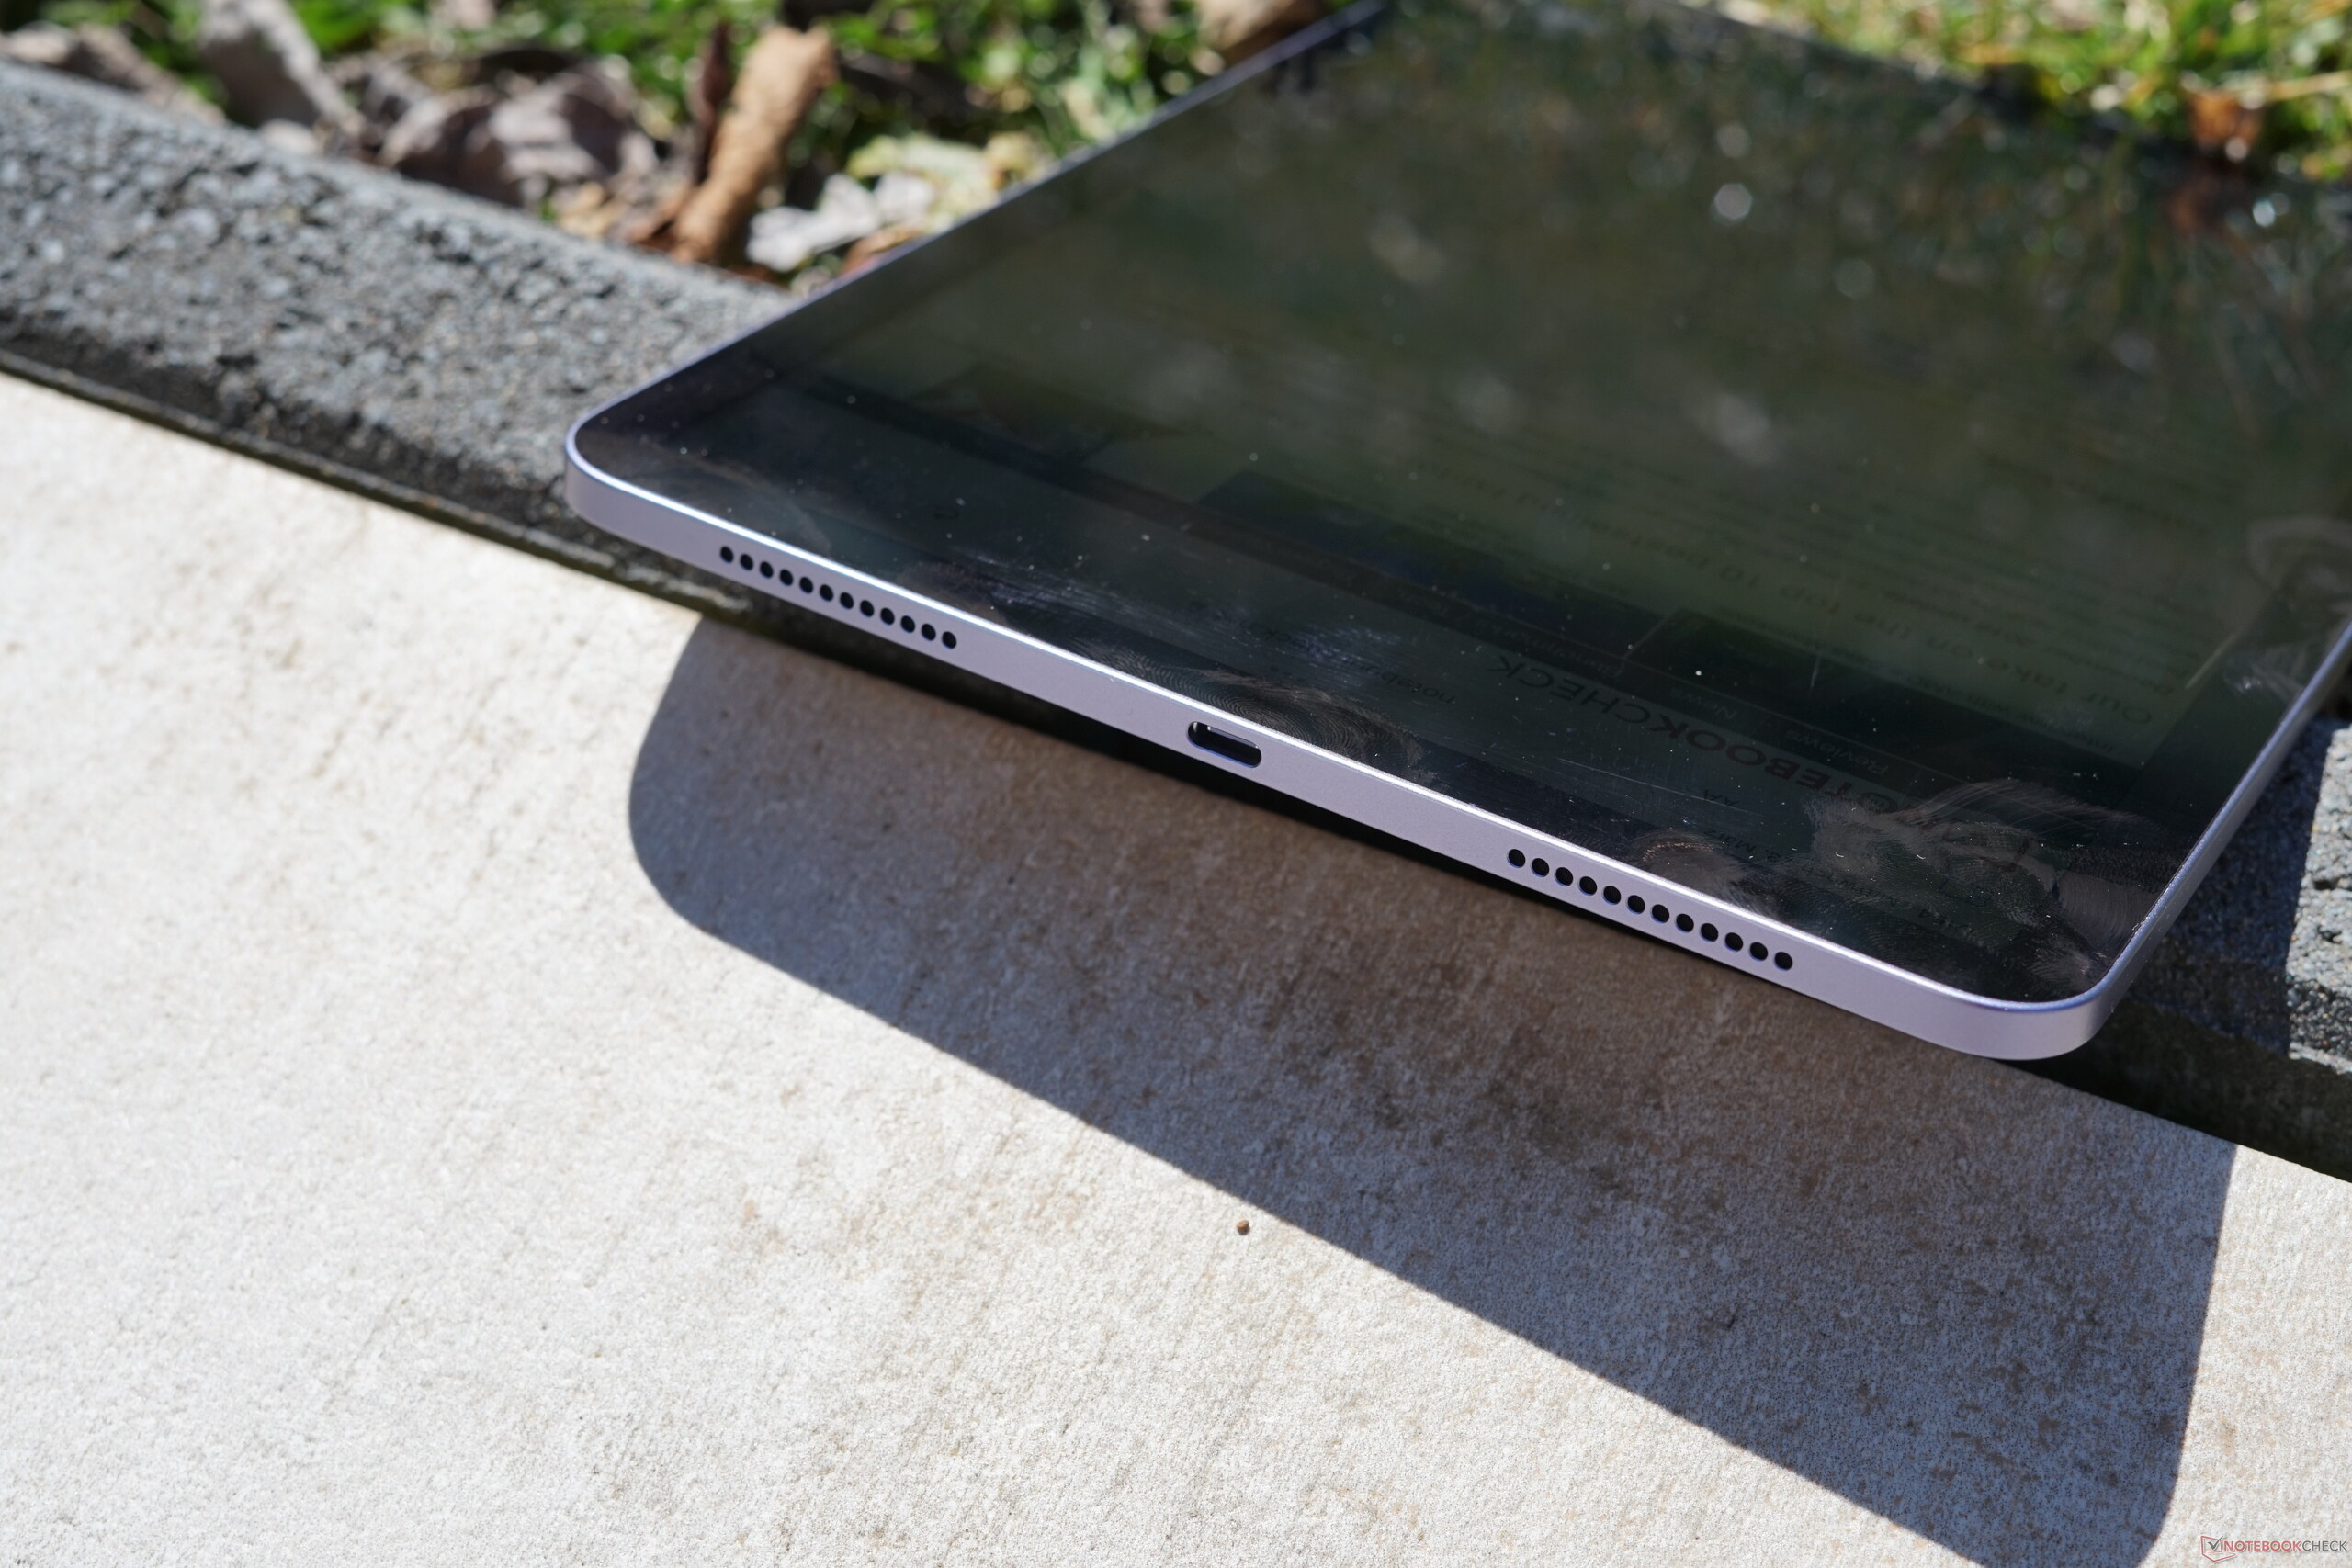
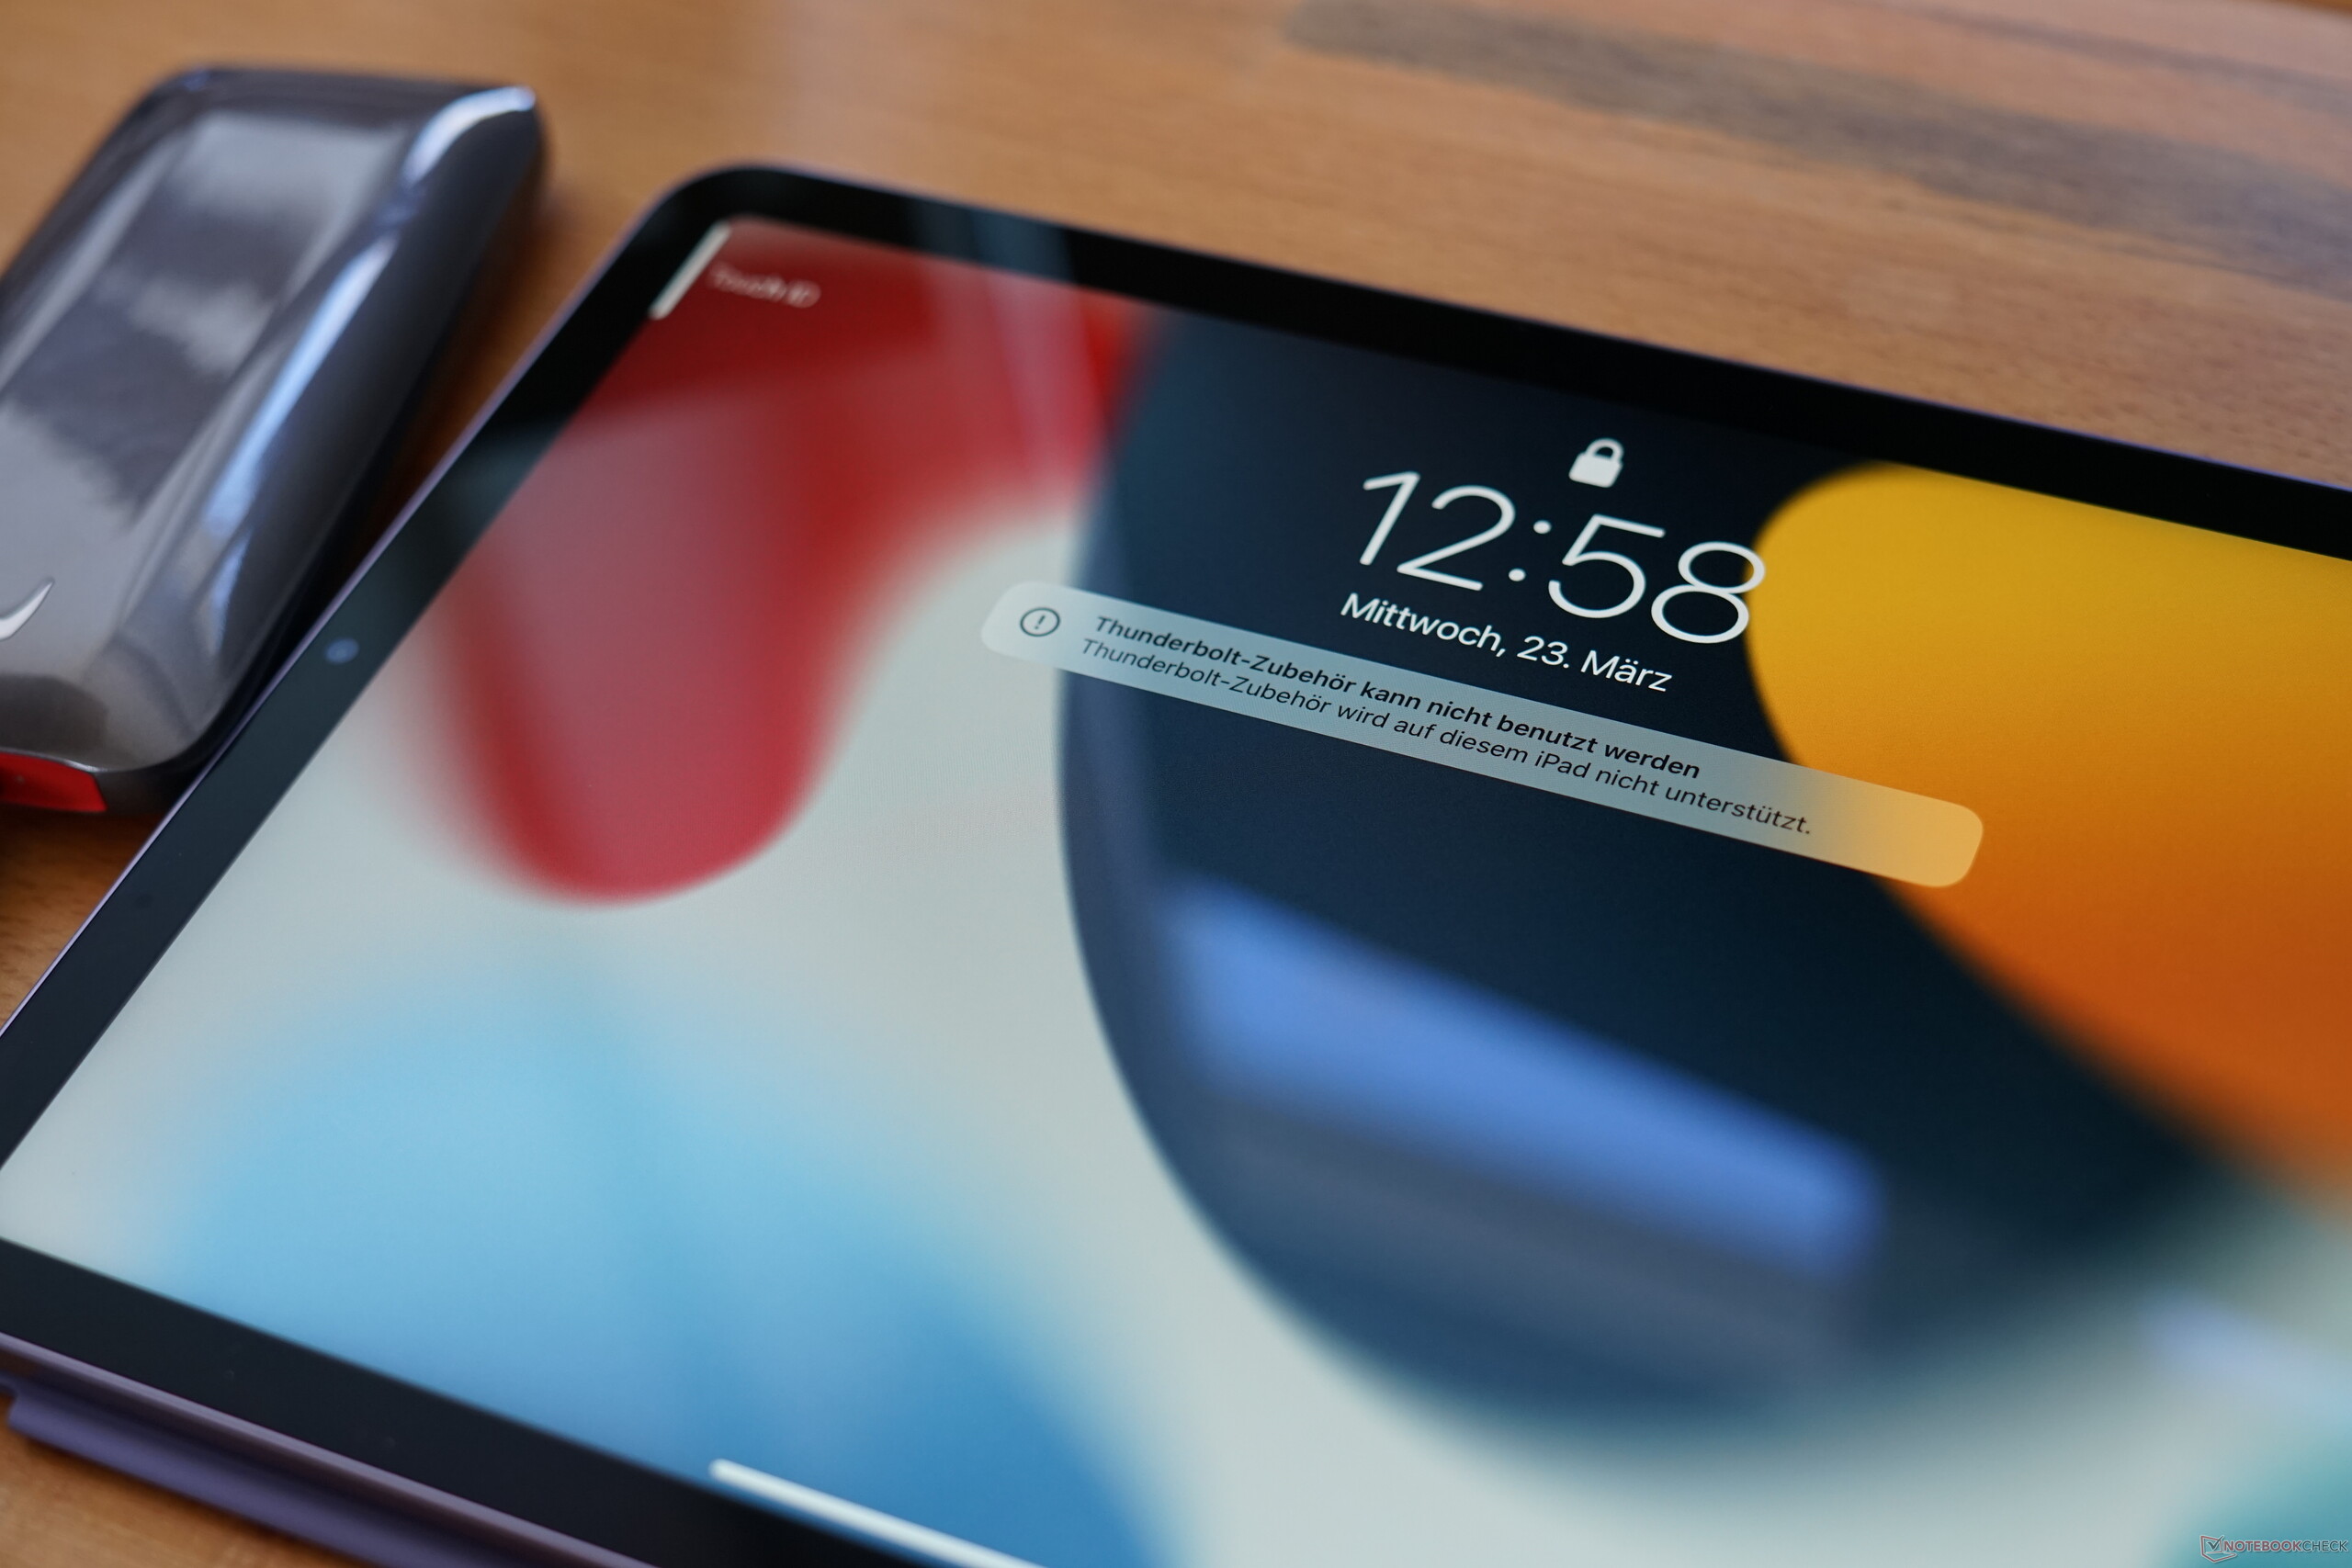
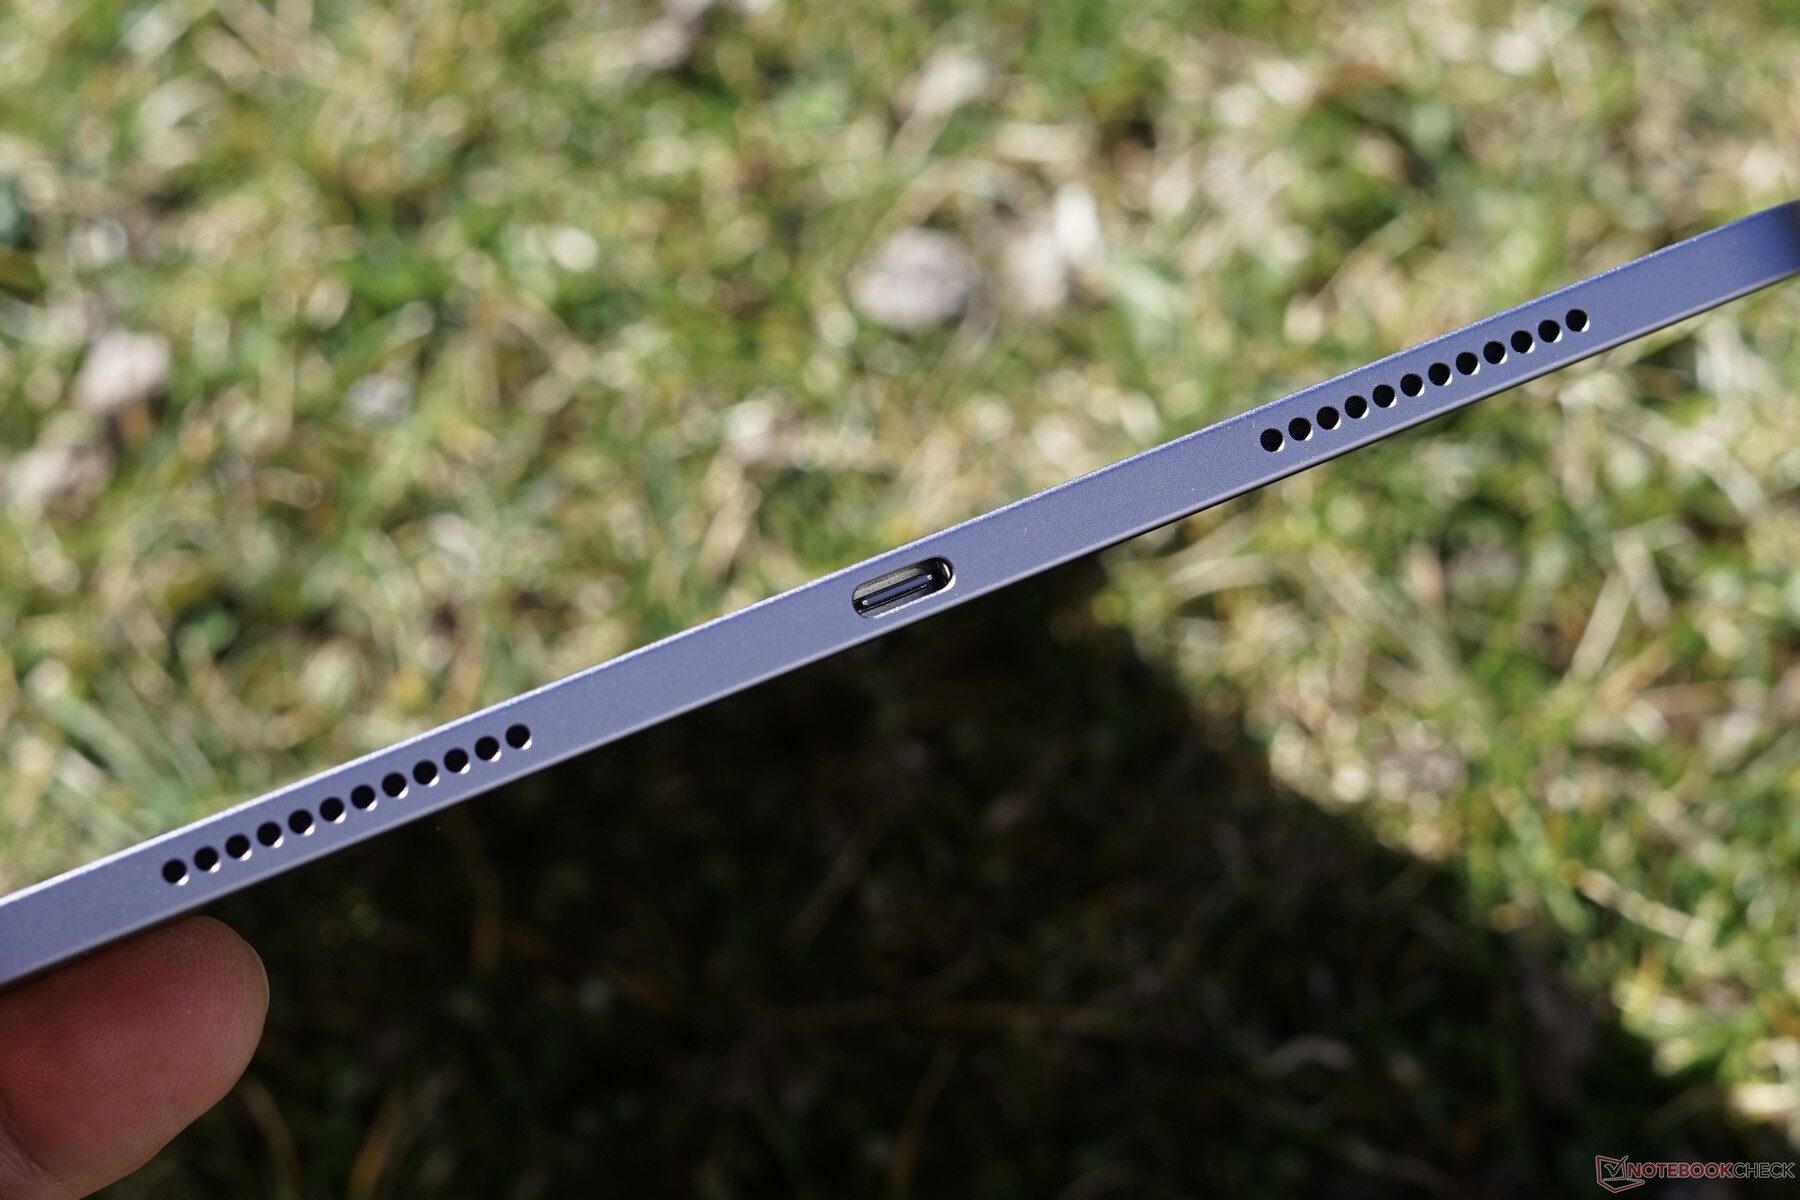
As before, the iPad Air 5 remains a staunch minimalist when it comes to connectivity. The only ports to be found on the device are the USB-C port at the bottom and the Smart Connector for the Magic Keyboard at the rear. And while the USB-C port does unfortunately not support the Thunderbolt protocol its performance has doubled from 5 to 10 Gbps according to Apple, thanks to the M1 chip. Like its predecessor and the Pro-series, the 2022 iPad Air also comes with the well-known magnetic wireless charging port for the Apple Pencil 2.
A 3.5-mm audio jack for connecting wired headphones is nowhere to be found, and neither is a USB-C dongle. This, however, can be purchased separately.
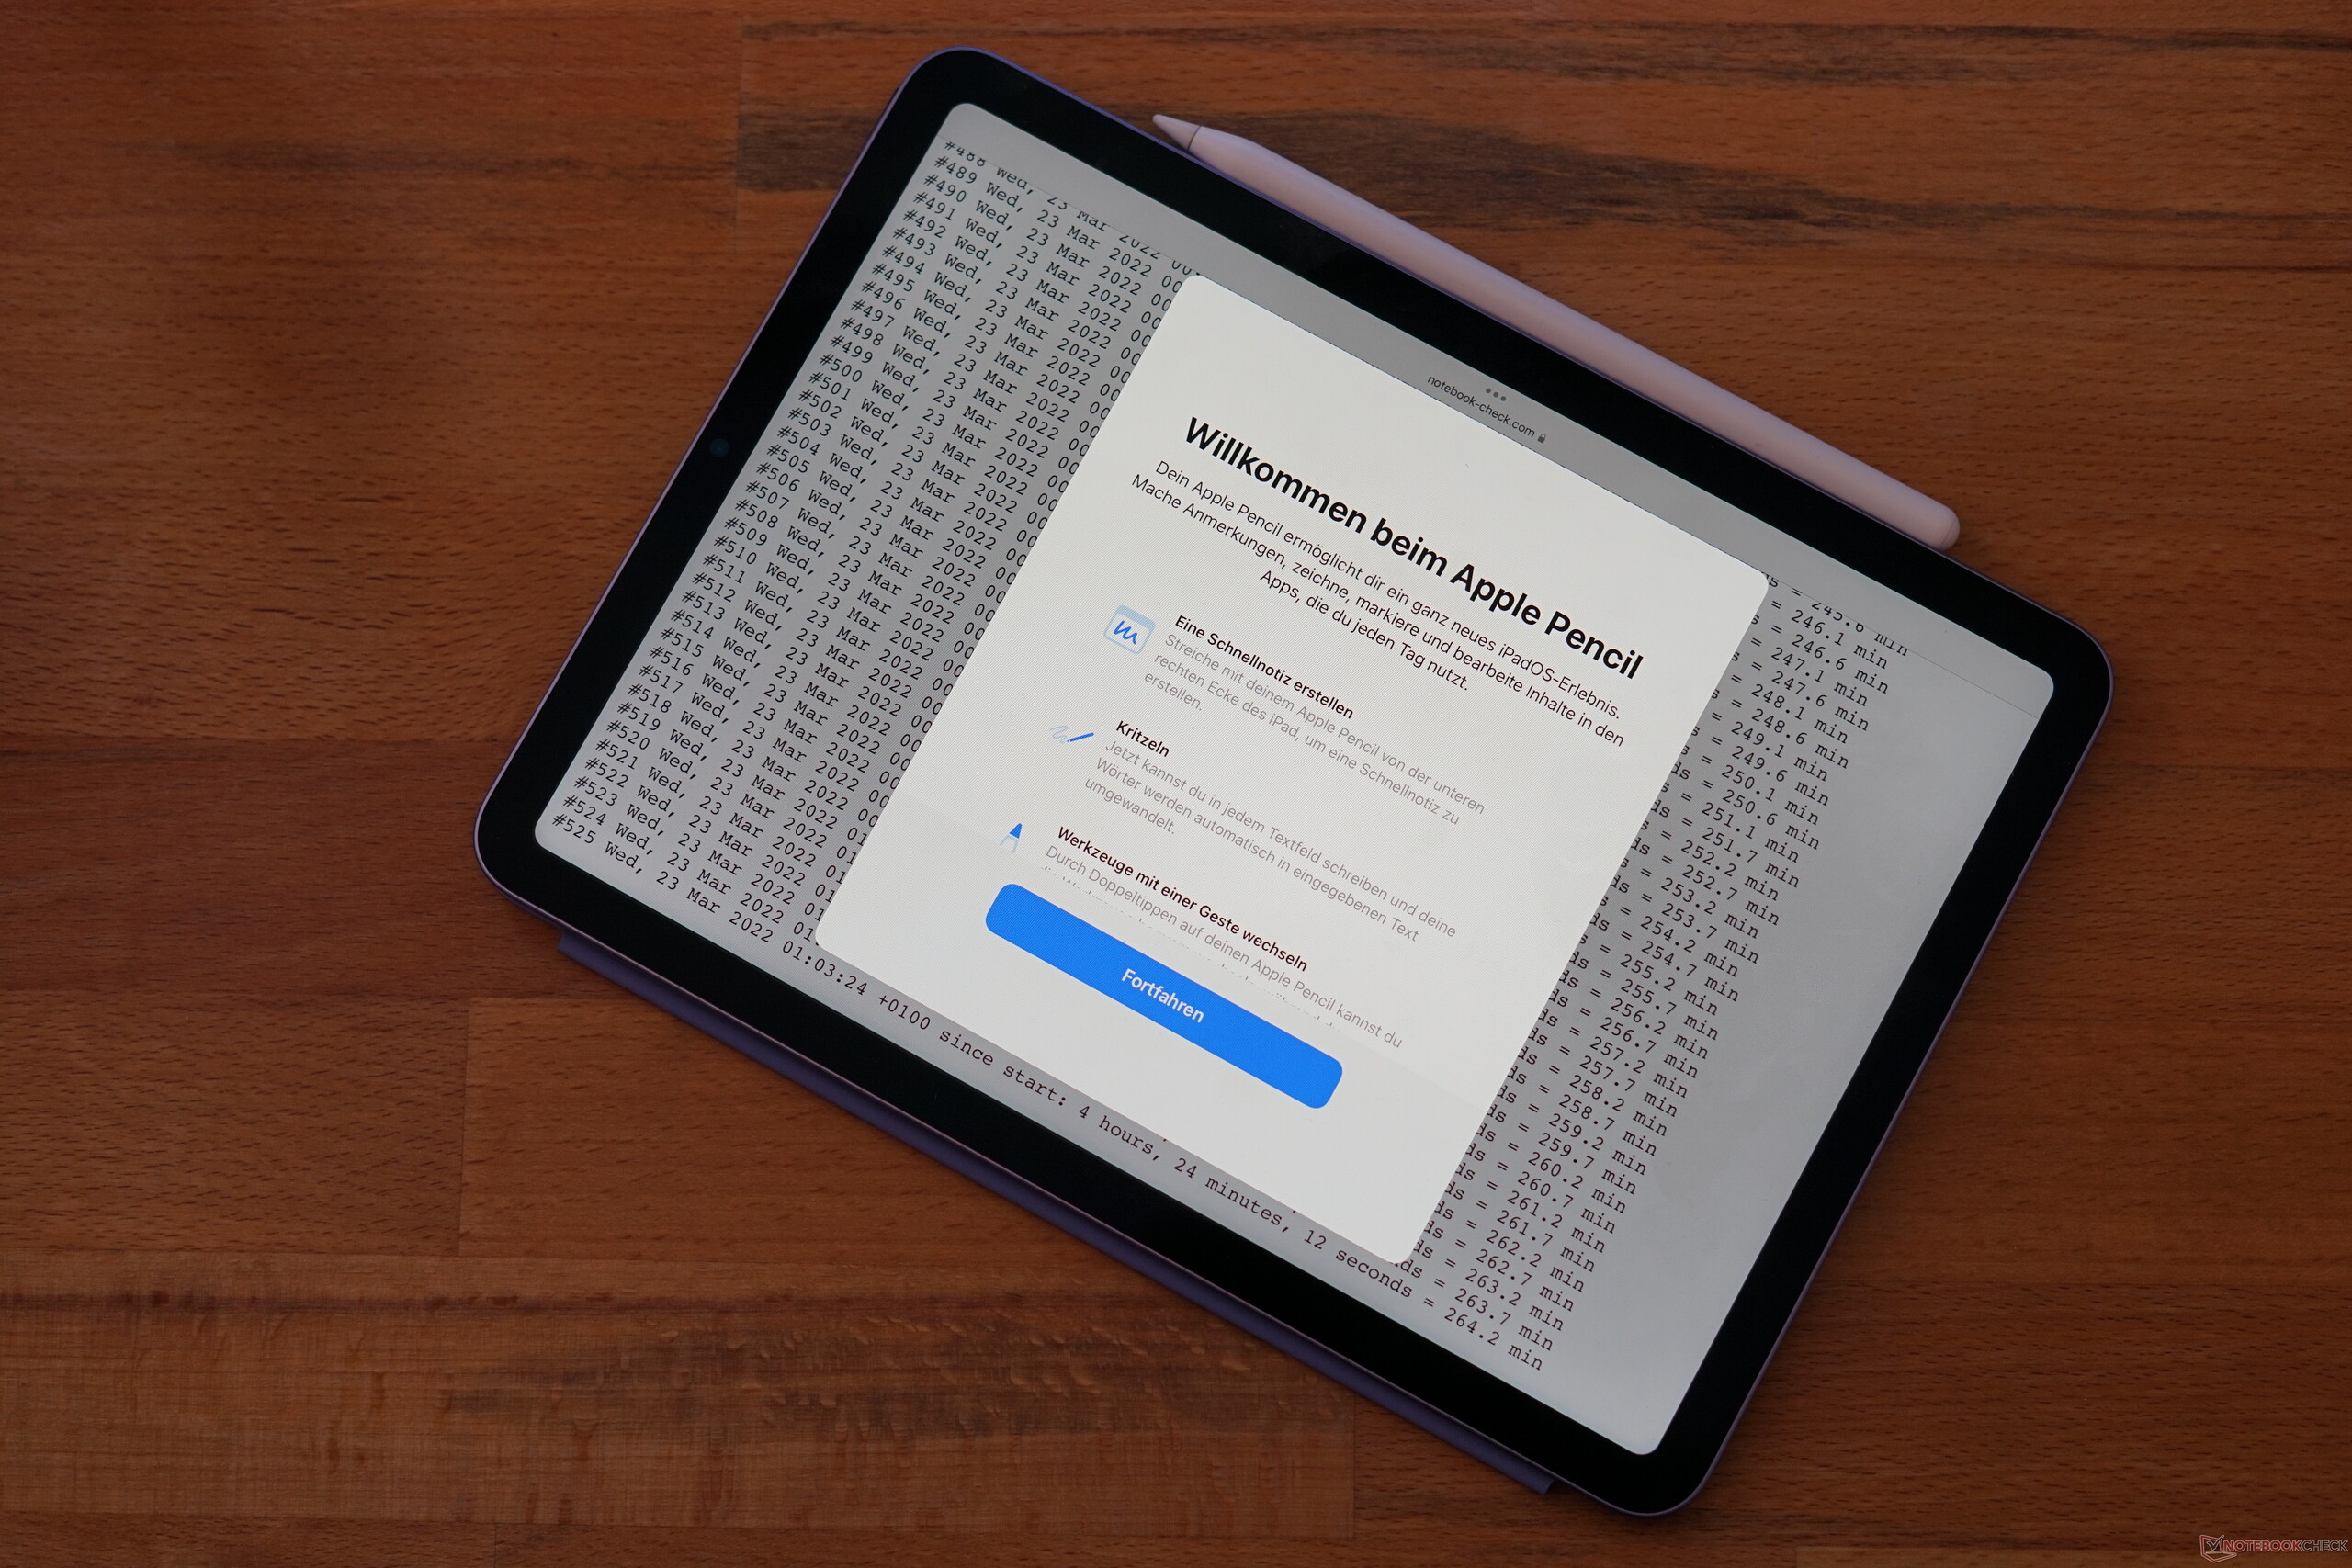
Software
At the time of writing, our review unit came preloaded with iPadOS 15.4. Thanks to the fast M1 processor and a total of 8 GB of RAM we expect many years of updates to come.
As before iPadOS lacks various features that would make it much better suited for professional use, such as a full-fledged file manager or more versatile multitasking capabilities. On the flip side it is ideal for entertainment and media consumption. Usability is a breeze, and the device remained smooth at all times. The App Store contains a huge number of specialized apps for the iPad, and unlike with the larger iPad Pro 12.9 or the smaller iPad Mini you can expect apps to be properly optimized for the iPad Air’s display size and resolution.
Communication and GNSS
One of the iPad Air 5’s new features is its optional 5G modem (iPad Air model A2589) without support for mmWave. Our review unit did not have this optional 5G modem installed and thus came without cellular and GPS support. In return, it is a few ounces lighter and obviously also quite a bit cheaper.
The built-in Wi-Fi modem does not support the current 6 GHz Wi-Fi 6E standard. Accordingly, wireless connectivity is limited to 2.4 and 5 GHz Wi-Fi 6 with HT80 and MIMO. Bluetooth support is limited to version 5.0.
While the 2022 iPad Air performed slightly better in our Wi-Fi test than its predecessor, the iPad Air 4 running iOS 14, there is some room for improvement. Microsoft’s Surface Pro 8 is a prime example of what would have potentially been achievable at the time of writing. We had no issues with range and the quality of our wireless signal, and the iPad Air turned out to be very reliable in this regard.
Cameras
In terms of cameras only the front-facing one has been upgraded. At the rear, we find the exact same 12 MP camera with an aperture of f/1.8 as before, the very same that is also featured on the iPhone SE. According to Apple, the only difference between the iPad Air and the iPhone SE and iPhone 8 is that the iPad’s camera system features a lens with 5 elements whereas both iPhones feature a lens made up of 6 individual elements. We found the camera to take decent photos in daylight and to be adequate and good enough for digitizing documents. However, in terms of overall image quality it cannot hold a candle to more modern iPhones, especially with fading light.
As mentioned above the front-facing camera has been upgraded and is now the same unit we already know from the iPad Pro and iPad Mini. It features a 12 MP sensor with an aperture of f/2.4 and an ultra-wide lens with a 122° field of view. This allows for Center Stage functionality, which follows you around during video calls and can automatically zoom in and out if required. While this feature works very well most of the time we found video quality to be slightly subpar due to the cropped image.


In bright light both our test and our color chart were captured very accurately by the iPad Air’s rear-facing camera.


Accessories and Warranty
Unlike current iPhones the iPad continues to come with a charger. Unfortunately, it is only rated at 20 W and thus incapable of charging the tablet at its maximum charging rate of 31 W.
Like all Apple products the iPad Air 5 comes with a 12 months limited warranty that includes phone support.
Input Devices & Handling
The iPad Air 5’s capacitive touchscreen is very fast and accurate. We did however notice a slight difference between the iPad Air’s 60 Hz and the iPad Pro’s 120 Hz display. If you prefer a different keyboard layout than what comes preinstalled by Apple you can opt for an alternative keyboard in the App Store.
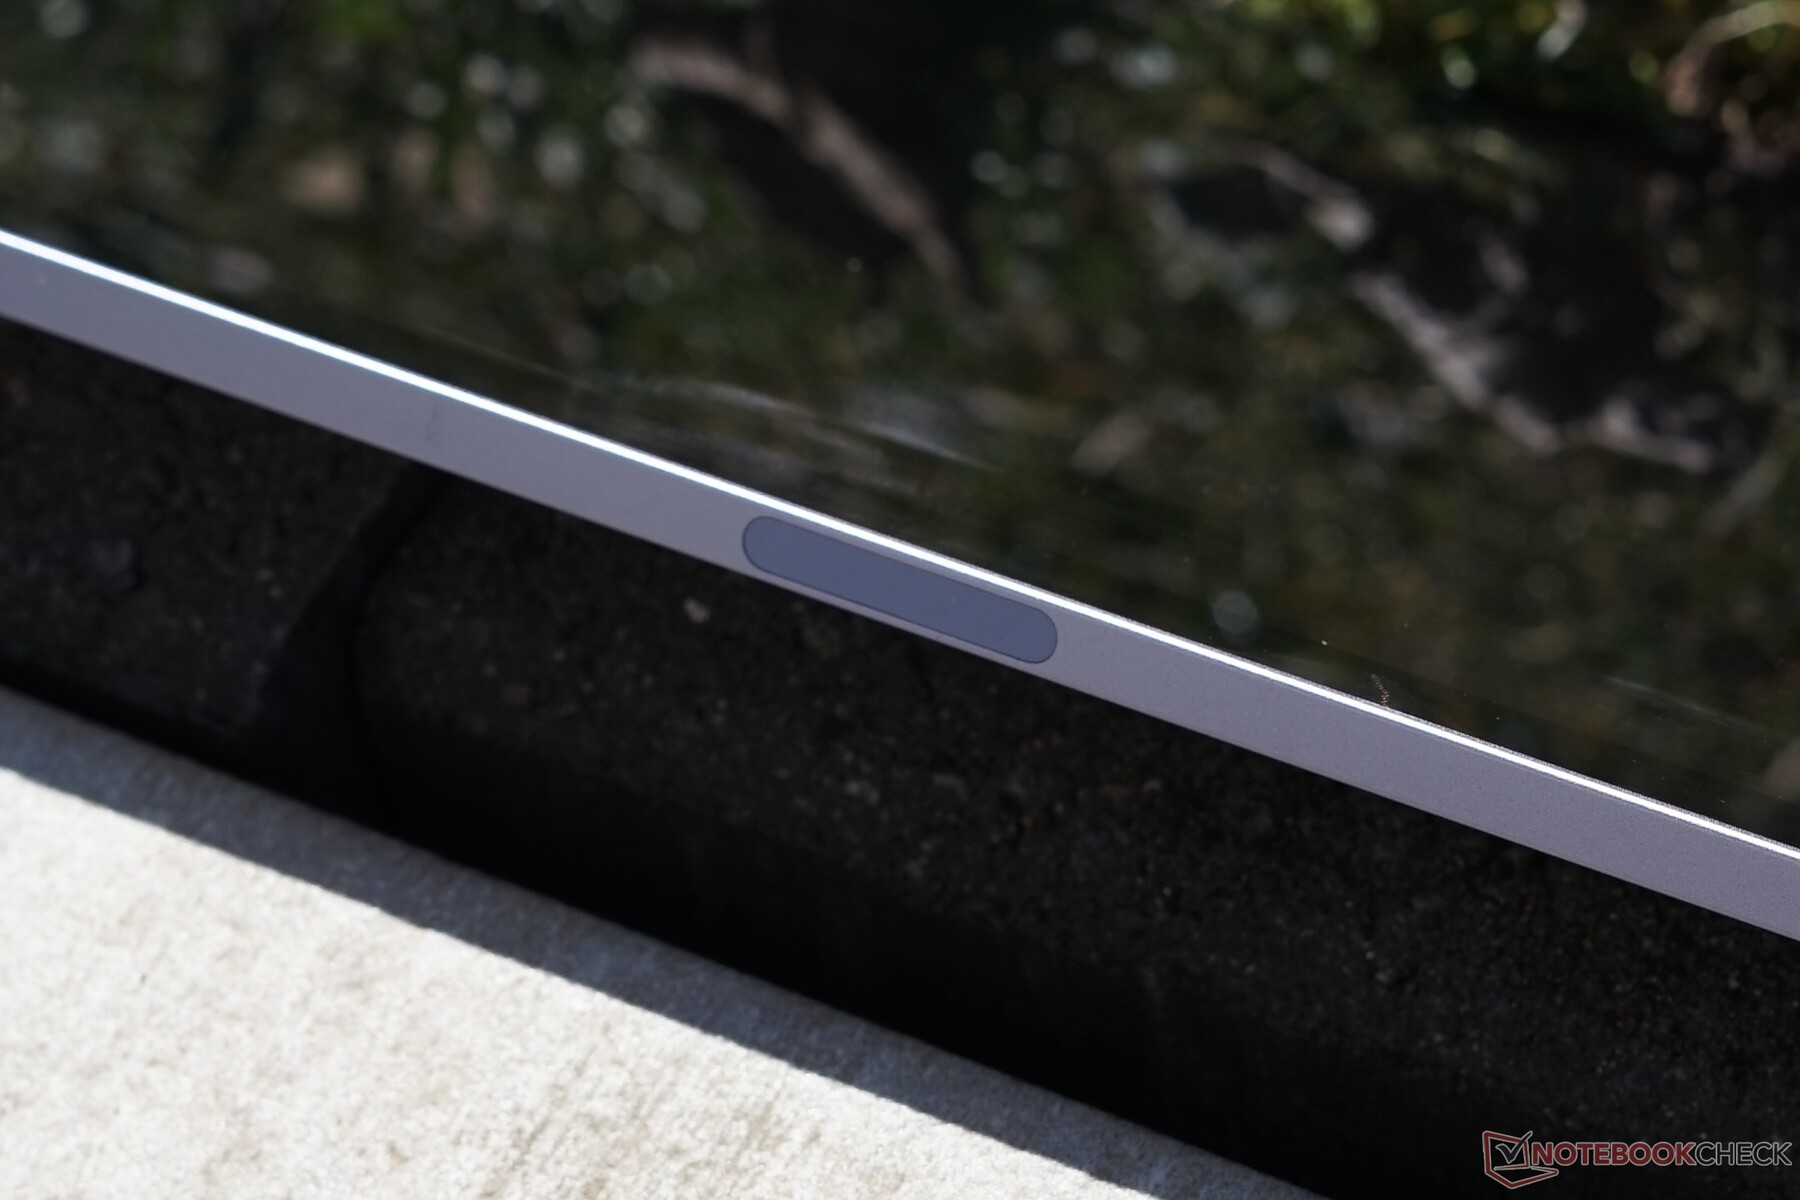
Touch ID, which is integrated into the side-mounted power button, felt good and worked flawlessly in our tests. Both reliability and performance were top notch. Nevertheless, we very much prefer Face ID as implemented by the iPad Pro and find it to be much more convenient.
If you are an Apple Pencil user, you will find it to feel nicer and better than on the iPad 8. The pencil is incredibly accurate and perfectly suited for taking notes and sketches.
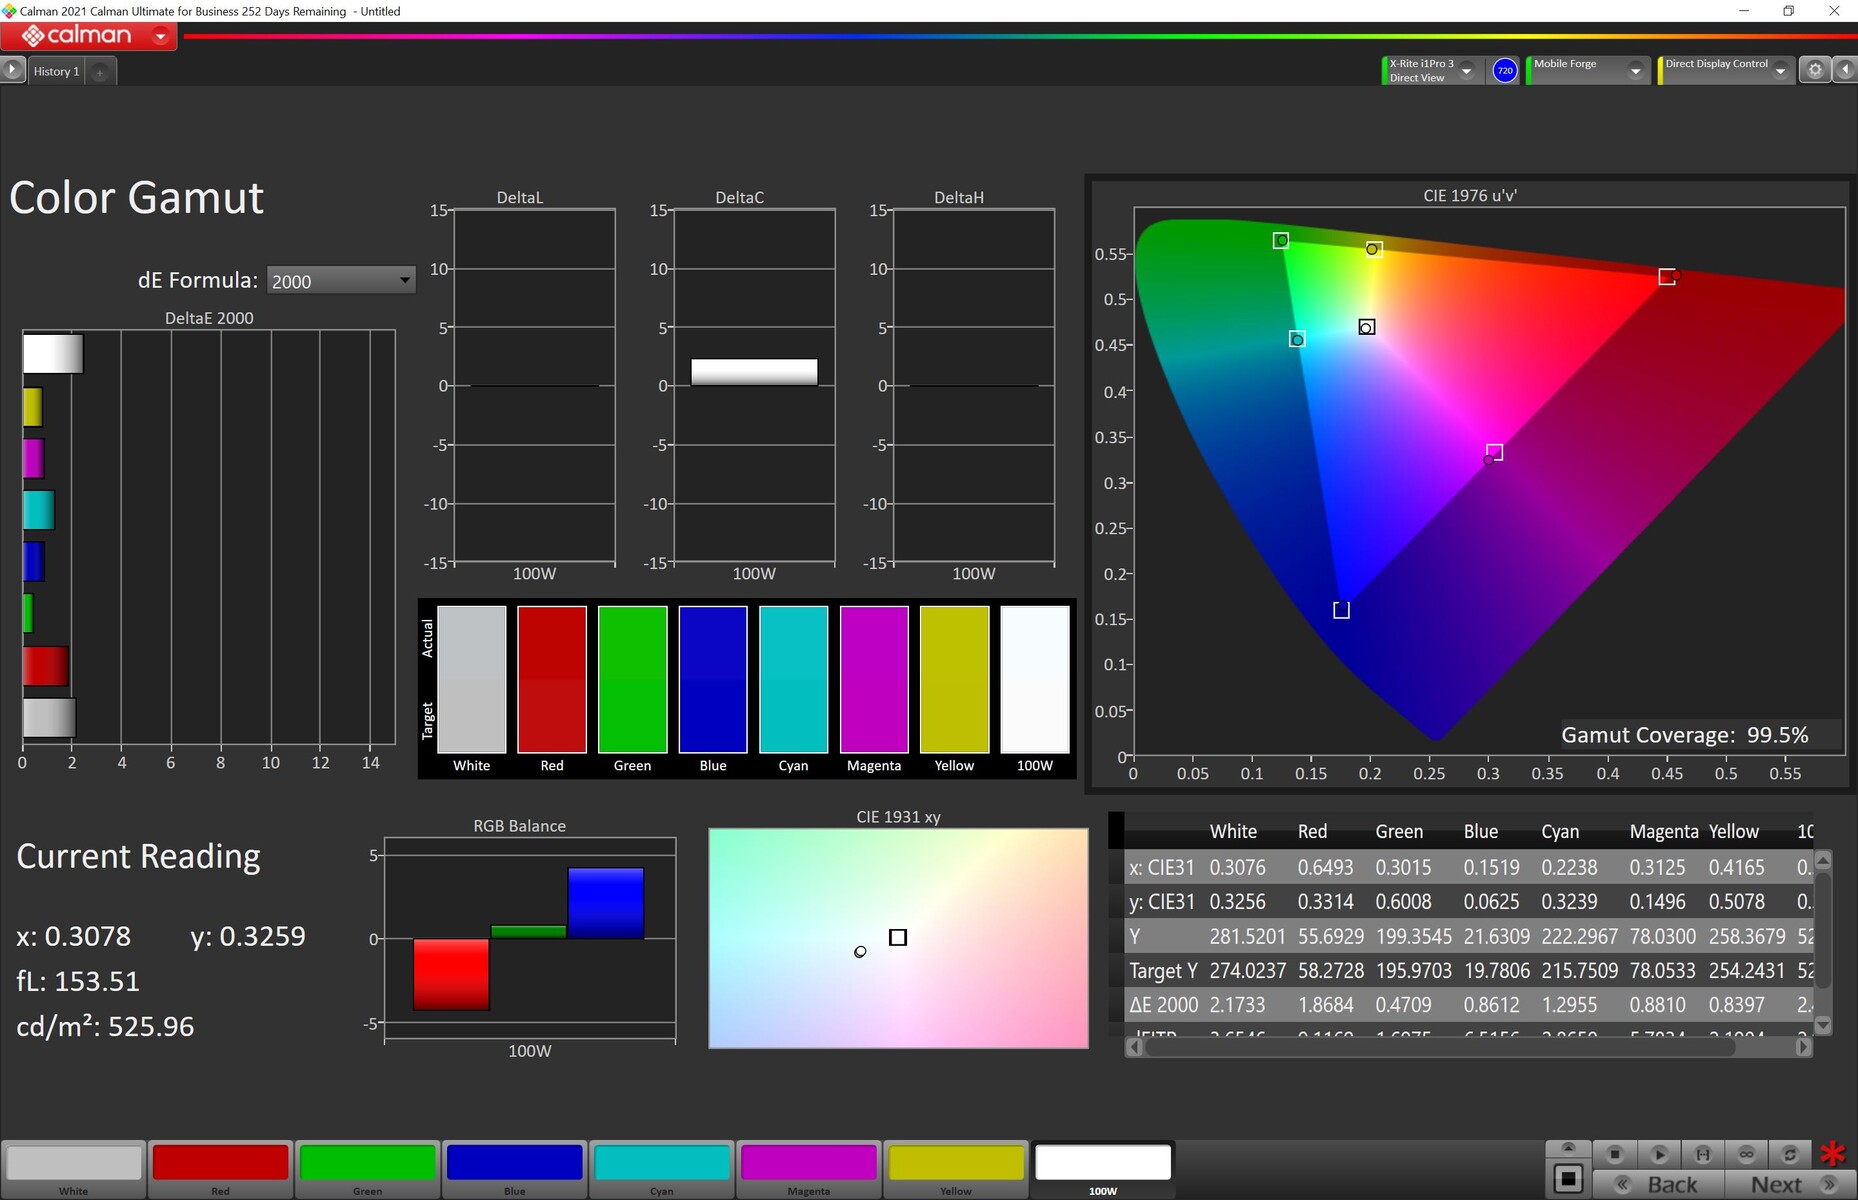
Display
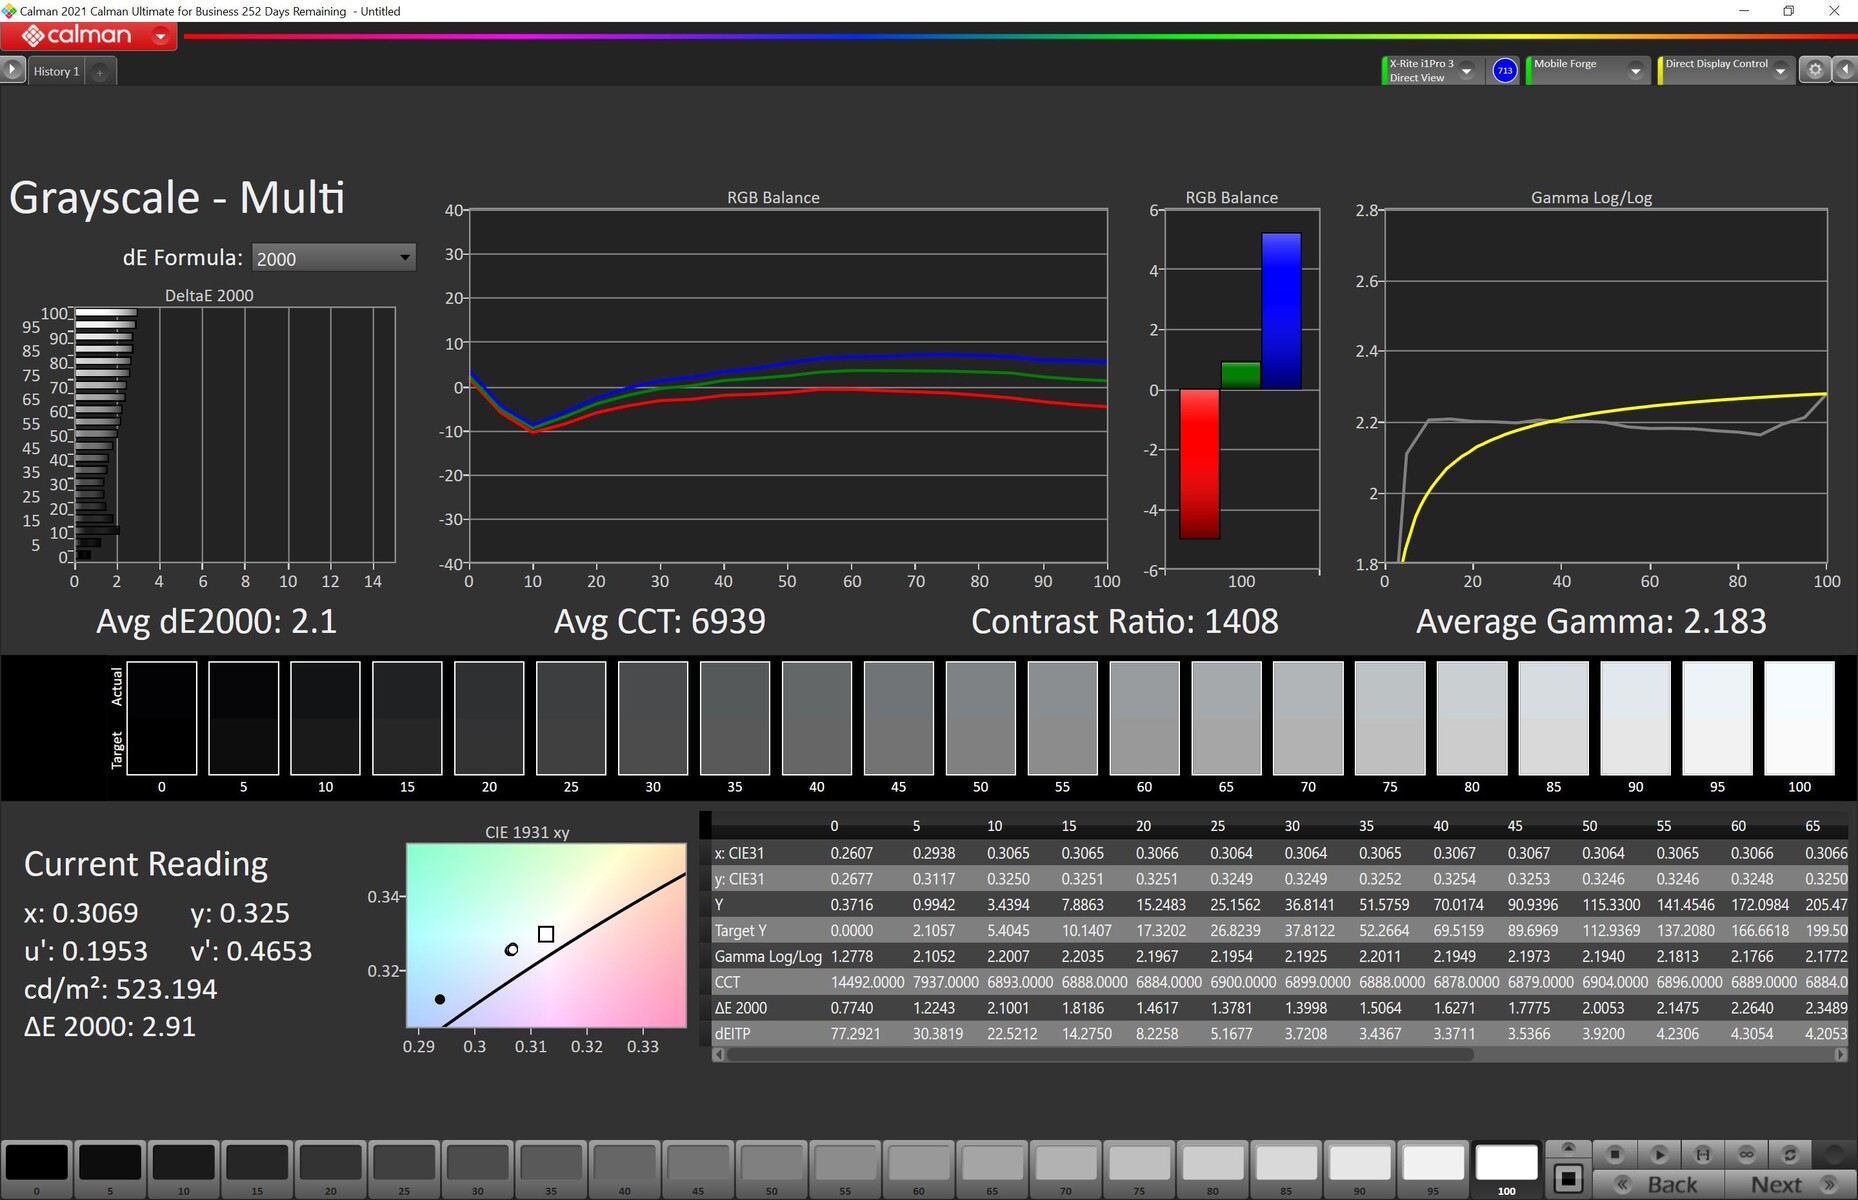
Like many other aspects the display remained unchanged as well. Accordingly, we find the same 10.9-inch IPS panel running at a native resolution of 2360 x 1640 pixels with a maximum brightness of 500 nits. Keep in mind that maximum brightness depends on ambient light, and we were only able to measure a maximum of 444 nits at 100 % brightness in darker surroundings with less ambient light.
The iPad Air supports True Tone, which not only automatically adjusts display brightness via the built-in ambient light sensor but also color temperature in order to achieve a balanced and ideal color representation.
On a very positive note, we found absolutely no evidence of PWM for brightness regulation. However, it seems like currently (iPadOS 16.5) Apple uses temporal dithering to increase the number of colors that can be shown (see slow motion 240fps video below).
| |||||||||||||||||||||||||
Brightness Distribution: 86 %
Center on Battery: 529 cd/m²
Contrast: 1430:1 (Black: 0.37 cd/m²)
ΔE ColorChecker Calman: 1.35 | ∀{0.5-29.43 Ø4.71}
ΔE Greyscale Calman: 2.1 | ∀{0.09-98 Ø4.96}
99.5% sRGB (Calman 2D)
Gamma: 2.183
CCT: 6939 K
| Apple iPad Air 5 2022 IPS, 2360x1640, 10.9" | Apple iPad 2021 IPS, 2160x1620, 10.2" | Apple iPad Pro 11 2021 IPS, 2388x1668, 11" | Apple iPad Air 4 2020 IPS, 2360x1640, 10.9" | Samsung Galaxy Tab S7 FE 5G LCD IPS, 2560x1600, 12.4" | |
|---|---|---|---|---|---|
| Screen | -20% | -7% | -3% | -21% | |
| Brightness middle (cd/m²) | 529 | 507 -4% | 627 19% | 509 -4% | 619 17% |
| Brightness (cd/m²) | 490 | 491 0% | 598 22% | 486 -1% | 593 21% |
| Brightness Distribution (%) | 86 | 90 5% | 88 2% | 93 8% | 91 6% |
| Black Level * (cd/m²) | 0.37 | 0.5 -35% | 0.44 -19% | 0.39 -5% | 0.22 41% |
| Contrast (:1) | 1430 | 1014 -29% | 1425 0% | 1305 -9% | 2814 97% |
| Colorchecker dE 2000 * | 1.35 | 1.7 -26% | 1.6 -19% | 1.3 4% | 2.6 -93% |
| Colorchecker dE 2000 max. * | 2.45 | 3.9 -59% | 3.5 -43% | 2.8 -14% | 6.6 -169% |
| Greyscale dE 2000 * | 2.1 | 2.4 -14% | 2.5 -19% | 2.2 -5% | 4 -90% |
| Gamma | 2.183 101% | 2.25 98% | 2.25 98% | 2.21 100% | 2.17 101% |
| CCT | 6939 94% | 6923 94% | 6969 93% | 6833 95% | 6973 93% |
| Color Space (Percent of AdobeRGB 1998) (%) | 99.3 |
* ... smaller is better
Screen Flickering / PWM (Pulse-Width Modulation)
| Screen flickering / PWM not detected | 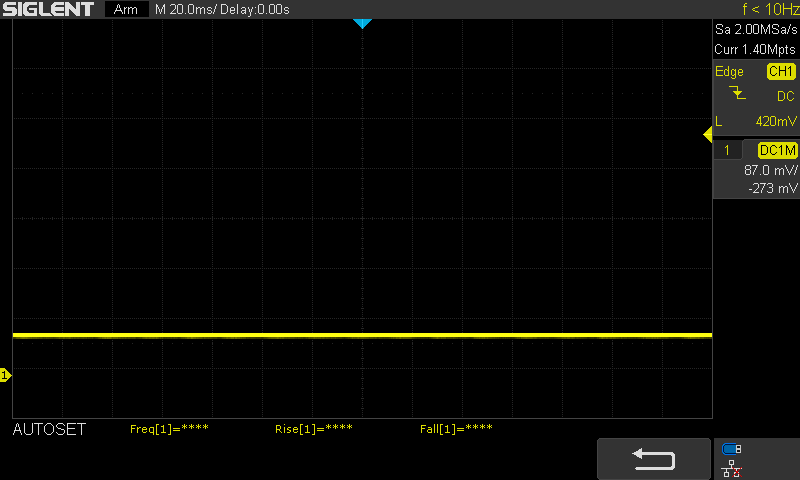 | ||
In comparison: 52 % of all tested devices do not use PWM to dim the display. If PWM was detected, an average of 7754 (minimum: 5 - maximum: 343500) Hz was measured. | |||
Thanks to its low black level of just 0.37 nits the display manages a very good contrast ratio of nearly 1500:1. That is of course as long as you do not compare it to OLED panel’s or the 12.9 iPad Pro’s Mini LED panel against which it is unable to compete.
With True Tone disabled we found the iPad Air’s color accuracy in the sRGB color space as set by the MobileForge app to be comparable to its predecessor. In other words: very good. Only the slightly larger 11” iPad Pro was even more accurate.


Display Response Times
| ↔ Response Time Black to White | ||
|---|---|---|
| 30.1 ms ... rise ↗ and fall ↘ combined | ↗ 15.9 ms rise | 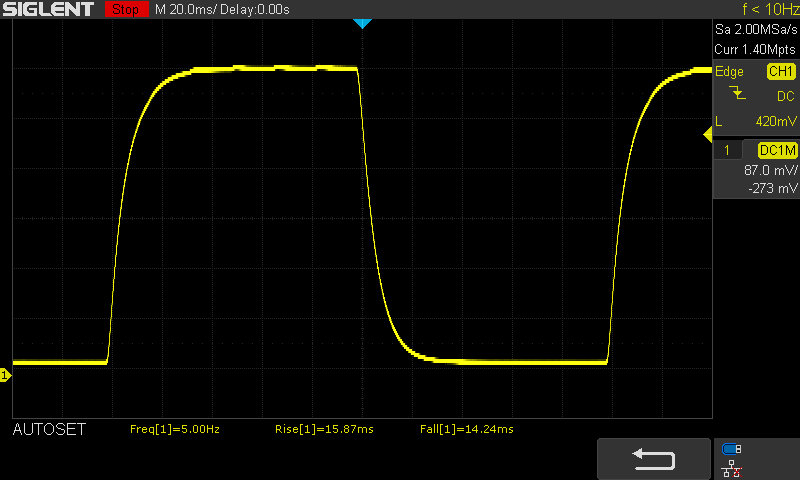 |
| ↘ 14.2 ms fall | ||
| The screen shows slow response rates in our tests and will be unsatisfactory for gamers. In comparison, all tested devices range from 0.1 (minimum) to 240 (maximum) ms. » 82 % of all devices are better. This means that the measured response time is worse than the average of all tested devices (19.8 ms). | ||
| ↔ Response Time 50% Grey to 80% Grey | ||
| 24.9 ms ... rise ↗ and fall ↘ combined | ↗ 11.6 ms rise | 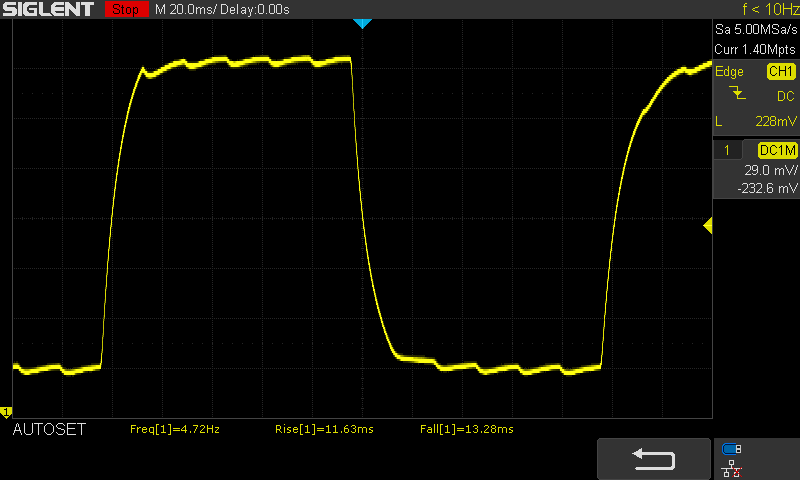 |
| ↘ 13.3 ms fall | ||
| The screen shows good response rates in our tests, but may be too slow for competitive gamers. In comparison, all tested devices range from 0.165 (minimum) to 636 (maximum) ms. » 35 % of all devices are better. This means that the measured response time is better than the average of all tested devices (31 ms). | ||
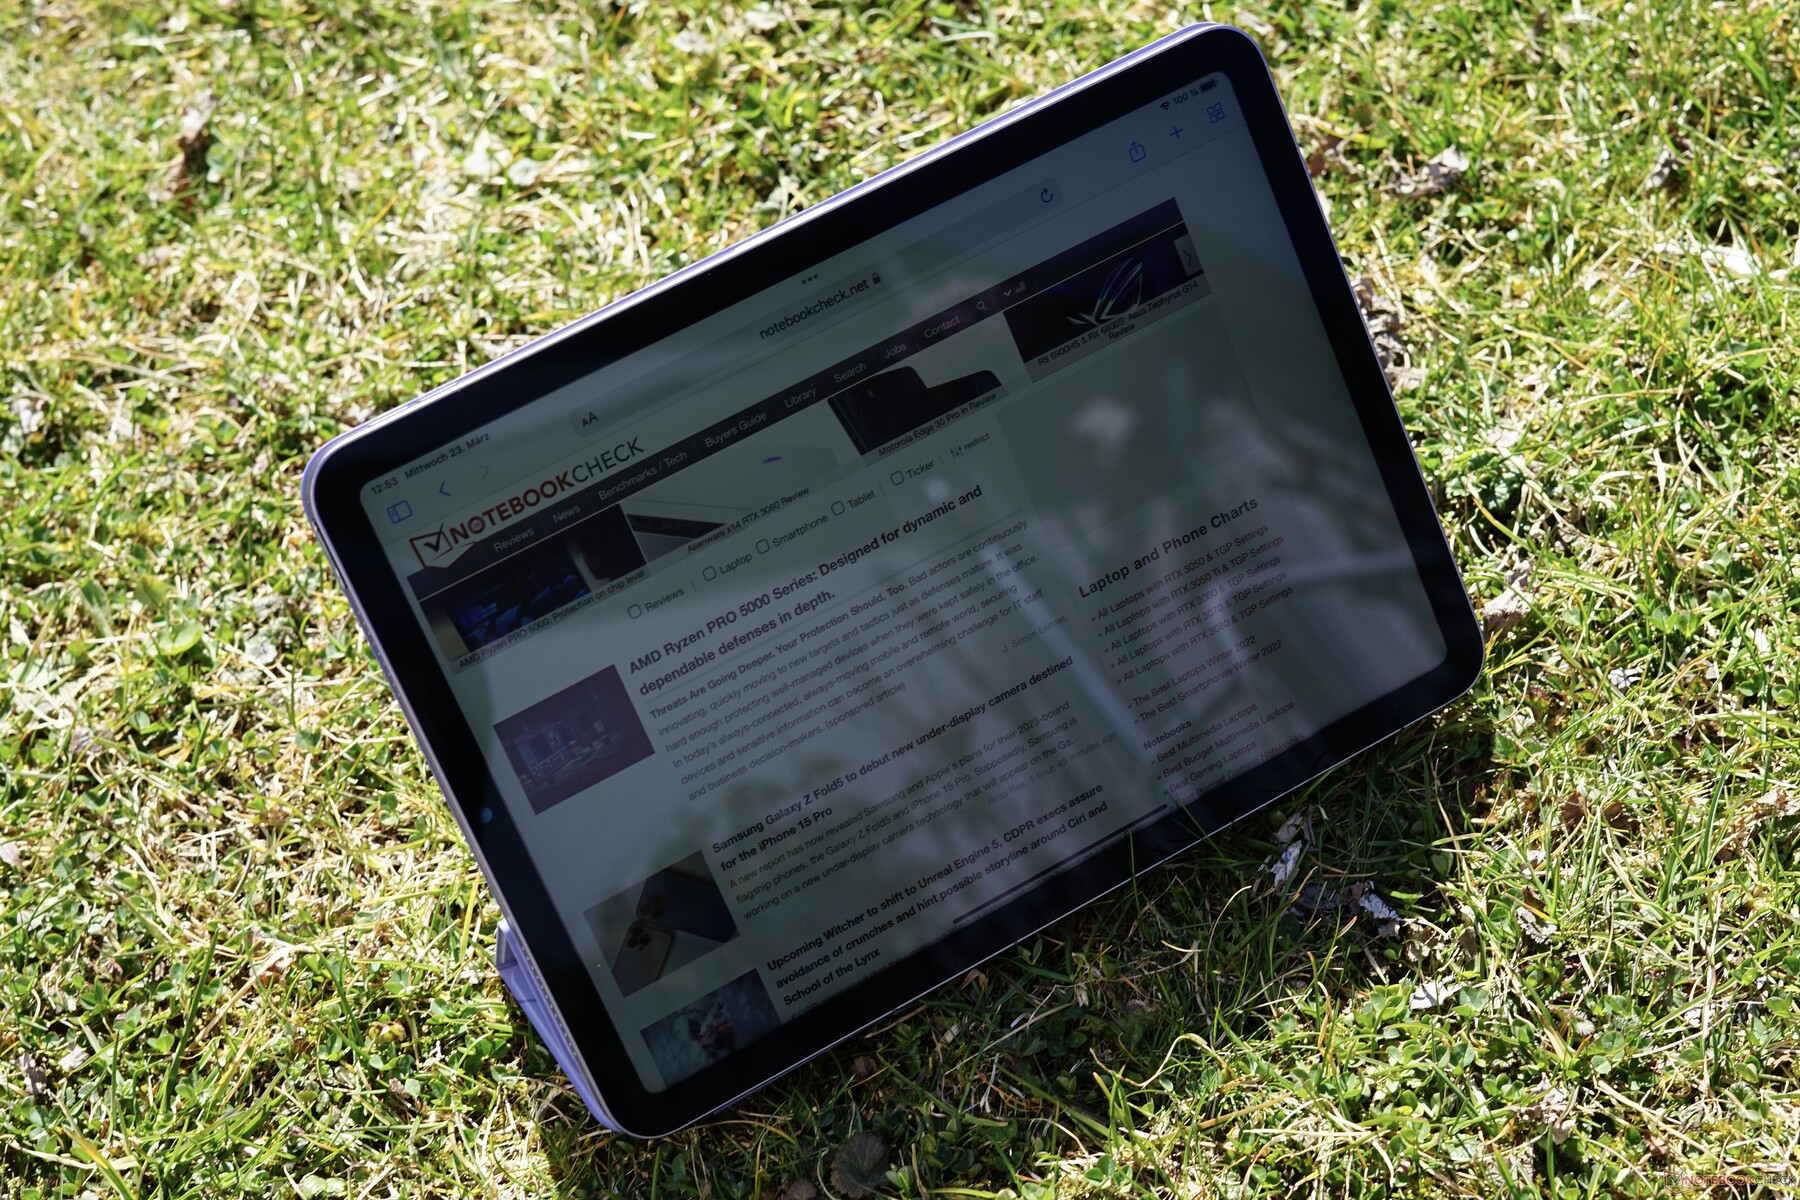
Outdoor usability was decent overall. However, it turned out to be rather challenging to use in direct sunlight despite its relatively low level of reflections and its high brightness of 500 nits. Compare that to the iPhone 13's up to 830 nits.
As is expected of an IPS panel the iPad Air’s viewing angles were very good with a very minor decrease in brightness and a significant red shift at extreme angles. We found no evidence of ghosting or backlight bleeding.

Performance
Thanks to Apple’s M1 SoC the iPad Air 5 offers more than enough performance for all things you may throw at it, and it is also capable of easily outgunning all of its Android competitors. Performance is identical and not throttled when compared to the more expensive iPad Pro.
The M1 chip comes with four efficiency cores (Icestorm) and four performance cores (Firestorm). Its maximum clock speed is 3.2 GHz, and it comes with an Apple-developed 8-core GPU, 8 GB of LPDDR4X unified memory that is shared between CPU and GPU, and a 16-core neural engine used for among other things to perform OCR in photos.
In our CPU benchmarks, the new iPad Air performed virtually identical to the iPad Pro or even MacBook Air with the same M1 chip. It is therefore very likely that it is clocked very similarly if not identically to those two. It easily outperformed all Android tablets and even the Core i7-powered Surface Pro 8. Compared to its immediate predecessor it performed slightly faster in the Geekbench single-core test and significantly faster in the multi-core test.
In our GPU tests, it performed very similar to the more expensive Pro models as well. Given that it outperformed the entry-level 7-core GPU MacBook Air M1 we can safely assume that all 8 GPU cores are enabled on the iPad Air. Once again, the 2022 iPad Air outperformed both its immediate predecessor as well as all of its Android-based competitors by significant margins.
GFXBench (DX / GLBenchmark) 2.7: T-Rex Onscreen | 1920x1080 T-Rex Offscreen
GFXBench 3.0: on screen Manhattan Onscreen OGL | 1920x1080 1080p Manhattan Offscreen
GFXBench 3.1: on screen Manhattan ES 3.1 Onscreen | 1920x1080 Manhattan ES 3.1 Offscreen
GFXBench: on screen Car Chase Onscreen | 1920x1080 Car Chase Offscreen | on screen Aztec Ruins High Tier Onscreen | 2560x1440 Aztec Ruins High Tier Offscreen | on screen Aztec Ruins Normal Tier Onscreen | 1920x1080 Aztec Ruins Normal Tier Offscreen
| 3DMark / Wild Life Extreme Unlimited | |
| Apple iPad Pro 12.9 2021 A2378 | |
| Apple iPad Pro 11 2021 | |
| Average Apple M1 (4144 - 4997, n=5) | |
| Apple MacBook Air 2020 M1 Entry | |
| Apple iPad Air 5 2022 | |
| Average of class Tablet (122 - 11105, n=81, last 2 years) | |
| Apple iPad Mini 6 | |
| Apple iPad Air 4 2020 | |
| Apple iPad 2021 | |
| Xiaomi Pad 5 Pro | |
| Xiaomi Pad 5 | |
| Lenovo Tab P11 Plus | |
| Lenovo Yoga Tab 11 | |
| Samsung Galaxy Tab S7 FE 5G | |
| Samsung Galaxy Tab A8 2022 | |
| GFXBench (DX / GLBenchmark) 2.7 / T-Rex Onscreen | |
| Microsoft Surface Pro 7 Plus | |
| Apple iPad Pro 11 2021 | |
| Apple iPad Pro 12.9 2021 A2378 | |
| Xiaomi Pad 5 Pro | |
| Xiaomi Pad 5 | |
| Average Apple M1 (60 - 120, n=6) | |
| Average of class Tablet (22 - 165, n=57, last 2 years) | |
| Apple MacBook Air 2020 M1 Entry | |
| Apple iPad Mini 6 | |
| Apple iPad 2021 | |
| Apple iPad Air 5 2022 | |
| Lenovo Tab P11 Plus | |
| Lenovo Yoga Tab 11 | |
| Samsung Galaxy Tab S7 FE 5G | |
| Apple iPad Air 4 2020 | |
| Samsung Galaxy Tab A8 2022 | |
| Lenovo Tab M10 | |
| GFXBench (DX / GLBenchmark) 2.7 / T-Rex Offscreen | |
| Apple MacBook Air 2020 M1 Entry | |
| Average Apple M1 (557 - 670, n=6) | |
| Apple iPad Pro 12.9 2021 A2378 | |
| Apple iPad Pro 11 2021 | |
| Apple iPad Air 5 2022 | |
| Apple iPad Mini 6 | |
| Average of class Tablet (24 - 886, n=57, last 2 years) | |
| Apple iPad Air 4 2020 | |
| Apple iPad 2021 | |
| Microsoft Surface Pro 7 Plus | |
| Xiaomi Pad 5 Pro | |
| Xiaomi Pad 5 | |
| Lenovo Yoga Tab 11 | |
| Lenovo Tab P11 Plus | |
| Samsung Galaxy Tab S7 FE 5G | |
| Samsung Galaxy Tab A8 2022 | |
| Lenovo Tab M10 | |
| GFXBench / Aztec Ruins High Tier Onscreen | |
| Apple iPad Pro 11 2021 | |
| Apple iPad Air 5 2022 | |
| Average Apple M1 (25.3 - 75, n=8) | |
| Apple iPad Mini 6 | |
| Apple MacBook Air 2020 M1 Entry | |
| Apple iPad Pro 12.9 2021 A2378 | |
| Apple iPad Air 4 2020 | |
| Apple iPad 2021 | |
| Microsoft Surface Pro 7 Plus | |
| Average of class Tablet (3.1 - 94, n=82, last 2 years) | |
| Xiaomi Pad 5 Pro | |
| Xiaomi Pad 5 | |
| Lenovo Tab P11 Plus | |
| Lenovo Yoga Tab 11 | |
| Samsung Galaxy Tab S7 FE 5G | |
| Samsung Galaxy Tab A8 2022 | |
| GFXBench / Aztec Ruins High Tier Offscreen | |
| Average Apple M1 (60.9 - 81.7, n=9) | |
| Apple MacBook Air 2020 M1 Entry | |
| Apple iPad Pro 11 2021 | |
| Apple iPad Pro 12.9 2021 A2378 | |
| Apple iPad Air 5 2022 | |
| Microsoft Surface Pro 7 Plus | |
| Average of class Tablet (2 - 134, n=82, last 2 years) | |
| Apple iPad Mini 6 | |
| Apple iPad Air 4 2020 | |
| Apple iPad 2021 | |
| Xiaomi Pad 5 Pro | |
| Xiaomi Pad 5 | |
| Samsung Galaxy Tab S7 FE 5G | |
| Lenovo Tab P11 Plus | |
| Lenovo Yoga Tab 11 | |
| Samsung Galaxy Tab A8 2022 | |
| GFXBench / Aztec Ruins Normal Tier Onscreen | |
| Apple iPad Pro 11 2021 | |
| Apple iPad Pro 12.9 2021 A2378 | |
| Average Apple M1 (40.1 - 102, n=8) | |
| Apple MacBook Air 2020 M1 Entry | |
| Apple iPad Air 5 2022 | |
| Apple iPad Mini 6 | |
| Microsoft Surface Pro 7 Plus | |
| Apple iPad 2021 | |
| Average of class Tablet (5.2 - 301, n=82, last 2 years) | |
| Apple iPad Air 4 2020 | |
| Xiaomi Pad 5 Pro | |
| Xiaomi Pad 5 | |
| Lenovo Tab P11 Plus | |
| Lenovo Yoga Tab 11 | |
| Samsung Galaxy Tab S7 FE 5G | |
| Samsung Galaxy Tab A8 2022 | |
| GFXBench / Aztec Ruins Normal Tier Offscreen | |
| Average Apple M1 (149 - 216, n=9) | |
| Apple MacBook Air 2020 M1 Entry | |
| Apple iPad Pro 11 2021 | |
| Apple iPad Pro 12.9 2021 A2378 | |
| Apple iPad Air 5 2022 | |
| Microsoft Surface Pro 7 Plus | |
| Apple iPad Mini 6 | |
| Average of class Tablet (5.6 - 323, n=82, last 2 years) | |
| Apple iPad Air 4 2020 | |
| Apple iPad 2021 | |
| Xiaomi Pad 5 Pro | |
| Xiaomi Pad 5 | |
| Samsung Galaxy Tab S7 FE 5G | |
| Lenovo Tab P11 Plus | |
| Lenovo Yoga Tab 11 | |
| Samsung Galaxy Tab A8 2022 | |
GFXBench (DX / GLBenchmark) 2.7: T-Rex Onscreen | 1920x1080 T-Rex Offscreen
GFXBench 3.0: on screen Manhattan Onscreen OGL | 1920x1080 1080p Manhattan Offscreen
GFXBench 3.1: on screen Manhattan ES 3.1 Onscreen | 1920x1080 Manhattan ES 3.1 Offscreen
GFXBench: on screen Car Chase Onscreen | 1920x1080 Car Chase Offscreen | on screen Aztec Ruins High Tier Onscreen | 2560x1440 Aztec Ruins High Tier Offscreen | on screen Aztec Ruins Normal Tier Onscreen | 1920x1080 Aztec Ruins Normal Tier Offscreen
In our browser benchmarks Apple devices powered by their own in-house Safari browser have been immensely powerful for a very long time, and the 2022 iPad Air is no exception. Browsing the web is an immensely joyful and pleasant experience with the new iPad Air.
| Jetstream 2 - 2.0 Total | |
| Apple MacBook Air 2020 M1 Entry (Safari 15.1) | |
| Apple MacBook Air 2020 M1 Entry (Safari 14.0.1) | |
| Microsoft Surface Pro 8, i7-1185G7 (Edge 95) | |
| Apple iPad Air 5 2022 (Safari 15) | |
| Apple iPad Pro 12.9 2021 A2378 (Safari 14.1.1) | |
| Average Apple M1 (175.4 - 191.3, n=8) | |
| Apple iPad Pro 11 2021 (Safari 14.1) | |
| Apple iPad Mini 6 (Safari 15) | |
| Average of class Tablet (35.8 - 420, n=55, last 2 years) | |
| Apple iPad Air 4 2020 (Safari Mobile 14) | |
| Apple iPad 2021 (Safari 15) | |
| Xiaomi Pad 5 Pro (Chrome 94.0.4606.85) | |
| Xiaomi Pad 5 (Chrome 96.0.4664.45) | |
| Samsung Galaxy Tab S7 FE 5G (Chrome91) | |
| Samsung Galaxy Tab A8 2022 (Chrome 94.0.4606.85) | |
| Lenovo Yoga Tab 11 | |
| Lenovo Tab P11 Plus (Chrome 94) | |
| JetStream 1.1 - 1.1 Total | |
| Apple iPad Air 5 2022 (Safari 15) | |
| Apple MacBook Air 2020 M1 Entry (Safari 15.1) | |
| Apple MacBook Air 2020 M1 Entry (Safari 14.0.1) | |
| Average Apple M1 (402 - 436, n=7) | |
| Apple iPad Pro 12.9 2021 A2378 | |
| Apple iPad Pro 11 2021 (Safari 14.1) | |
| Apple iPad Mini 6 (Safari 15) | |
| Apple iPad Air 4 2020 (Safari Mobile 14) | |
| Apple iPad 2021 (Safari 15) | |
| Xiaomi Pad 5 Pro (Chrome 94.0.4606.85) | |
| Xiaomi Pad 5 (Chrome 96.0.4664.45) | |
| Samsung Galaxy Tab S7 FE 5G (Chrome91) | |
| Lenovo Tab P11 Plus (Chrome 94) | |
| Lenovo Yoga Tab 11 (Chrome93) | |
| Samsung Galaxy Tab A8 2022 (Chrome 94.0.4606.85) | |
| Lenovo Tab M10 (Chrome 71.0.3578.99) | |
| WebXPRT 3 - Overall | |
| Apple MacBook Air 2020 M1 Entry (Safari 15.1) | |
| Apple MacBook Air 2020 M1 Entry (Safari 14.0.1) | |
| Average of class Tablet (168 - 520, n=10, last 2 years) | |
| Average Apple M1 (216 - 304, n=8) | |
| Apple iPad Air 5 2022 (Safari 15) | |
| Microsoft Surface Pro 8, i7-1185G7 (Chrome 82) | |
| Apple iPad Mini 6 (Safari 15) | |
| Apple iPad Pro 12.9 2021 A2378 (Safari 14.1.1) | |
| Apple iPad Pro 11 2021 | |
| Apple iPad 2021 (Safari 15) | |
| Microsoft Surface Pro 7 Plus (Chrome 82) | |
| Apple iPad Air 4 2020 (Safari Mobile 14) | |
| Xiaomi Pad 5 Pro (Chrome 94.0.4606.85) | |
| Xiaomi Pad 5 (Chrome 96.0.4664.45) | |
| Samsung Galaxy Tab S7 FE 5G (Chrome91) | |
| Samsung Galaxy Tab A8 2022 (Chrome 94.0.4606.85) | |
| Lenovo Tab P11 Plus (Chrome 94) | |
| Lenovo Yoga Tab 11 (Chrome93) | |
| Lenovo Tab M10 (Chrome 71.0.3578.99) | |
| Speedometer 2.0 - Result 2.0 | |
| Apple MacBook Air 2020 M1 Entry (Safari 15.1) | |
| Apple MacBook Air 2020 M1 Entry (Safari 14.0.1) | |
| Apple iPad Air 5 2022 (Safari 15) | |
| Average of class Tablet (6.8 - 790, n=33, last 2 years) | |
| Apple iPad Mini 6 (Safari 15) | |
| Average Apple M1 (209 - 265, n=8) | |
| Apple iPad Pro 12.9 2021 A2378 (Safari 14.1.1) | |
| Apple iPad Pro 11 2021 (Safari 14.1) | |
| Apple iPad Air 4 2020 (Safari Mobile 14) | |
| Microsoft Surface Pro 8, i7-1185G7 (Edge 95) | |
| Apple iPad 2021 (Safari 15) | |
| Xiaomi Pad 5 Pro (Chrome 94.0.4606.85) | |
| Xiaomi Pad 5 (Chrome 96.0.4664.45) | |
| Samsung Galaxy Tab S7 FE 5G (Chrome91) | |
| Lenovo Yoga Tab 11 (Chrome93) | |
| Samsung Galaxy Tab A8 2022 (Chrome 94.0.4606.85) | |
| Lenovo Tab P11 Plus (Chrome 94) | |
| Octane V2 - Total Score | |
| Apple iPad Air 5 2022 (Safari 15) | |
| Microsoft Surface Pro 8, i7-1185G7 (Edge 95) | |
| Apple MacBook Air 2020 M1 Entry (Safari 15.1.1) | |
| Apple MacBook Air 2020 M1 Entry (Safari 14.0.1) | |
| Average Apple M1 (62055 - 66974, n=8) | |
| Apple iPad Pro 11 2021 (Safari 14.1) | |
| Apple iPad Pro 12.9 2021 A2378 (Safari 14.1.1) | |
| Apple iPad Air 4 2020 (Safari Mobile 14) | |
| Apple iPad Mini 6 (Safari 15) | |
| Average of class Tablet (1633 - 138481, n=71, last 2 years) | |
| Apple iPad 2021 (Safari 15) | |
| Xiaomi Pad 5 Pro (Chrome 94.0.4606.85) | |
| Xiaomi Pad 5 (Chrome 96.0.4664.45) | |
| Samsung Galaxy Tab S7 FE 5G (Chrome91) | |
| Lenovo Tab P11 Plus (Chrome 94) | |
| Lenovo Yoga Tab 11 (Chrome93) | |
| Samsung Galaxy Tab A8 2022 (Chrome 94.0.4606.85) | |
| Lenovo Tab M10 (Chrome 71.0.3578.99) | |
| Mozilla Kraken 1.1 - Total | |
| Lenovo Tab M10 (Chrome 71.0.3578.99) | |
| Lenovo Yoga Tab 11 (Chrome93) | |
| Samsung Galaxy Tab A8 2022 (Chrome 94.0.4606.85) | |
| Lenovo Tab P11 Plus (Chrome 94) | |
| Samsung Galaxy Tab S7 FE 5G (Chrome91) | |
| Average of class Tablet (243 - 16233, n=65, last 2 years) | |
| Xiaomi Pad 5 (Chrome 96.0.4664.45) | |
| Xiaomi Pad 5 Pro (Chrome 94.0.4606.85) | |
| Microsoft Surface Pro 7 Plus (Chrome 82) | |
| Microsoft Surface Pro 8, i7-1185G7 (Chrome 82) | |
| Apple iPad 2021 (Safari 15) | |
| Apple iPad Air 5 2022 (Safari 15) | |
| Apple iPad Pro 12.9 2021 A2378 (Safari 14.1.1) | |
| Apple MacBook Air 2020 M1 Entry (Safari 14.0.1) | |
| Apple MacBook Air 2020 M1 Entry (Safari 15.1) | |
| Apple iPad Pro 11 2021 (Safari 14.1) | |
| Average Apple M1 (418 - 516, n=8) | |
| Apple iPad Air 4 2020 (Safari Mobile 14) | |
| Apple iPad Mini 6 (Safari 15) | |
* ... smaller is better
As before, the entry-level SKU comes with 64 GB of storage. In our PassMark benchmarks it managed 514 MB/s read and 221 MB/s write performance and was thus significantly slower than the 128 GB entry-level iPad Pro (900 / 467 MB/s) but slightly faster than the 64 GB iPhone 11 Pro Max (388 / 58 MB/s).
Gaming
Its fast GPU turns the iPad Air 5 into a great gaming device with excellent performance. We were unable to find a single game that was limited by the iPad Air’s GPU, and most ran at a consistent 60 FPS throughout the entire test. PUBG is the notable exception as it is limited to just 40 FPS even on lowest settings.
| Geekbench ML | |
| 0.5 TensorFlow Lite NNAPI / Core ML | |
| Apple iPad Air 5 2022 | |
| Average Apple M1 (2601 - 2743, n=3) | |
| 0.5 TensorFlow Lite GPU | |
| Apple iPad Air 5 2022 | |
| Average Apple M1 (2855 - 2868, n=3) | |
| 0.5 TensorFlow Lite CPU 0.5 | |
| Average Apple M1 (945 - 1041, n=3) | |
| Apple iPad Air 5 2022 | |
Emissions
Noise Emissions
As before the iPad Air is passively cooled without a fan. Accordingly, it does not emit any noise under load, and we found no evidence of coil whine or other electrical noises either.
Temperature
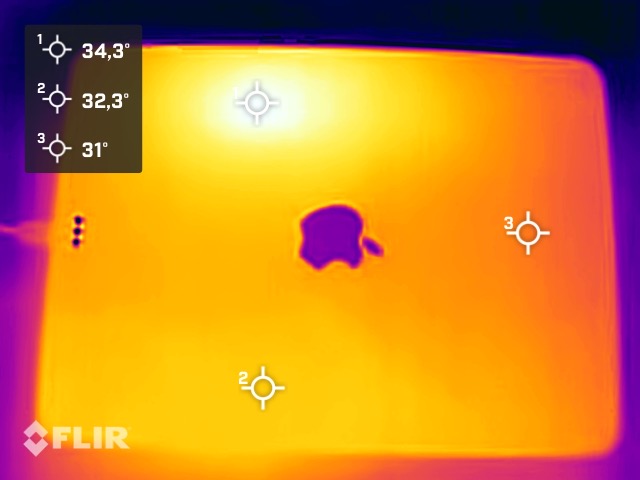
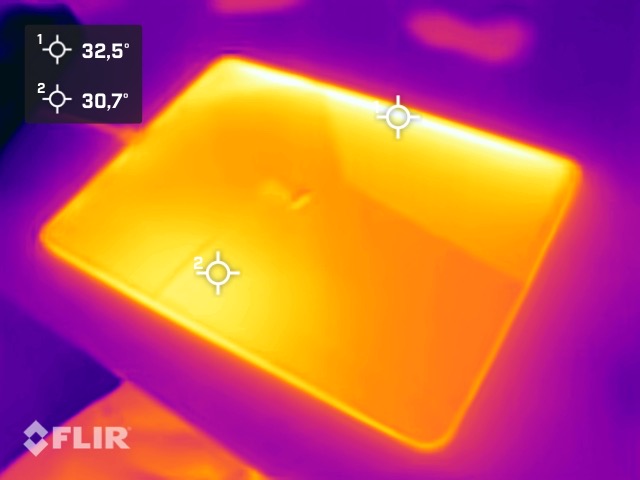
Its powerful M1 SoC makes itself felt through the Air’s surface temperatures. With a maximum of 35 °C the 2022 model became slightly warmer than its predecessor. Having said that the Air’s surface temperatures remained within an acceptable and nowhere near critical range.
The price you pay for these low temperatures is thermal throttling under sustained load. As can be witnessed in our 3DMark Wild Life stress test performance decreases significantly after the first run and continues to drop for a total of five iterations after which it remains consistent throughout the remainder of the test. Keep in mind that even when thermal throttled the 2022 iPad Air performed much better than its non-throttling predecessor.
3DMark Wild Life Stress Test
(+) The maximum temperature on the upper side is 33 °C / 91 F, compared to the average of 33.7 °C / 93 F, ranging from 20.7 to 53.2 °C for the class Tablet.
(+) The bottom heats up to a maximum of 35 °C / 95 F, compared to the average of 33.2 °C / 92 F
(+) In idle usage, the average temperature for the upper side is 25.4 °C / 78 F, compared to the device average of 30 °C / 86 F.
Speakers
The speakers remained unchanged, and the iPad Air 5 continues to feature the exact same stereo speaker setup as its predecessor despite a total of four speaker grilles on the device. Overall sound performance is very well-balanced although the four iPad Pro speakers performed even better. They are also not as easily covered with your hands as the iPad Air’s.
If you intend to use headphones, you can connect these either wirelessly via Bluetooth or wired via the Air’s USB-C port. The iPad Air does not have a headphone jack. If you want to connect traditional headphones to the iPad Air you will need a USB-C dongle to do so.
Apple iPad Air 5 2022 audio analysis
(+) | speakers can play relatively loud (84.8 dB)
Bass 100 - 315 Hz
(±) | reduced bass - on average 11.1% lower than median
(±) | linearity of bass is average (11.4% delta to prev. frequency)
Mids 400 - 2000 Hz
(+) | balanced mids - only 2.8% away from median
(+) | mids are linear (3.1% delta to prev. frequency)
Highs 2 - 16 kHz
(±) | higher highs - on average 6.2% higher than median
(+) | highs are linear (5.5% delta to prev. frequency)
Overall 100 - 16.000 Hz
(+) | overall sound is linear (12.4% difference to median)
Compared to same class
» 19% of all tested devices in this class were better, 4% similar, 77% worse
» The best had a delta of 7%, average was 20%, worst was 129%
Compared to all devices tested
» 11% of all tested devices were better, 2% similar, 87% worse
» The best had a delta of 4%, average was 23%, worst was 134%
Apple iPad Pro 11 2021 audio analysis
(+) | speakers can play relatively loud (83.5 dB)
Bass 100 - 315 Hz
(±) | reduced bass - on average 11.1% lower than median
(±) | linearity of bass is average (13.2% delta to prev. frequency)
Mids 400 - 2000 Hz
(+) | balanced mids - only 4% away from median
(+) | mids are linear (4.6% delta to prev. frequency)
Highs 2 - 16 kHz
(+) | balanced highs - only 2.2% away from median
(+) | highs are linear (5.2% delta to prev. frequency)
Overall 100 - 16.000 Hz
(+) | overall sound is linear (11.4% difference to median)
Compared to same class
» 13% of all tested devices in this class were better, 3% similar, 84% worse
» The best had a delta of 7%, average was 20%, worst was 129%
Compared to all devices tested
» 7% of all tested devices were better, 2% similar, 90% worse
» The best had a delta of 4%, average was 23%, worst was 134%
Apple iPad 2021 audio analysis
(+) | speakers can play relatively loud (91.9 dB)
Bass 100 - 315 Hz
(-) | nearly no bass - on average 19.7% lower than median
(+) | bass is linear (6.8% delta to prev. frequency)
Mids 400 - 2000 Hz
(+) | balanced mids - only 4.9% away from median
(+) | mids are linear (4.4% delta to prev. frequency)
Highs 2 - 16 kHz
(±) | higher highs - on average 7.7% higher than median
(+) | highs are linear (3.6% delta to prev. frequency)
Overall 100 - 16.000 Hz
(±) | linearity of overall sound is average (16.4% difference to median)
Compared to same class
» 38% of all tested devices in this class were better, 5% similar, 57% worse
» The best had a delta of 7%, average was 20%, worst was 129%
Compared to all devices tested
» 27% of all tested devices were better, 6% similar, 67% worse
» The best had a delta of 4%, average was 23%, worst was 134%
Energy Management
Power Consumption
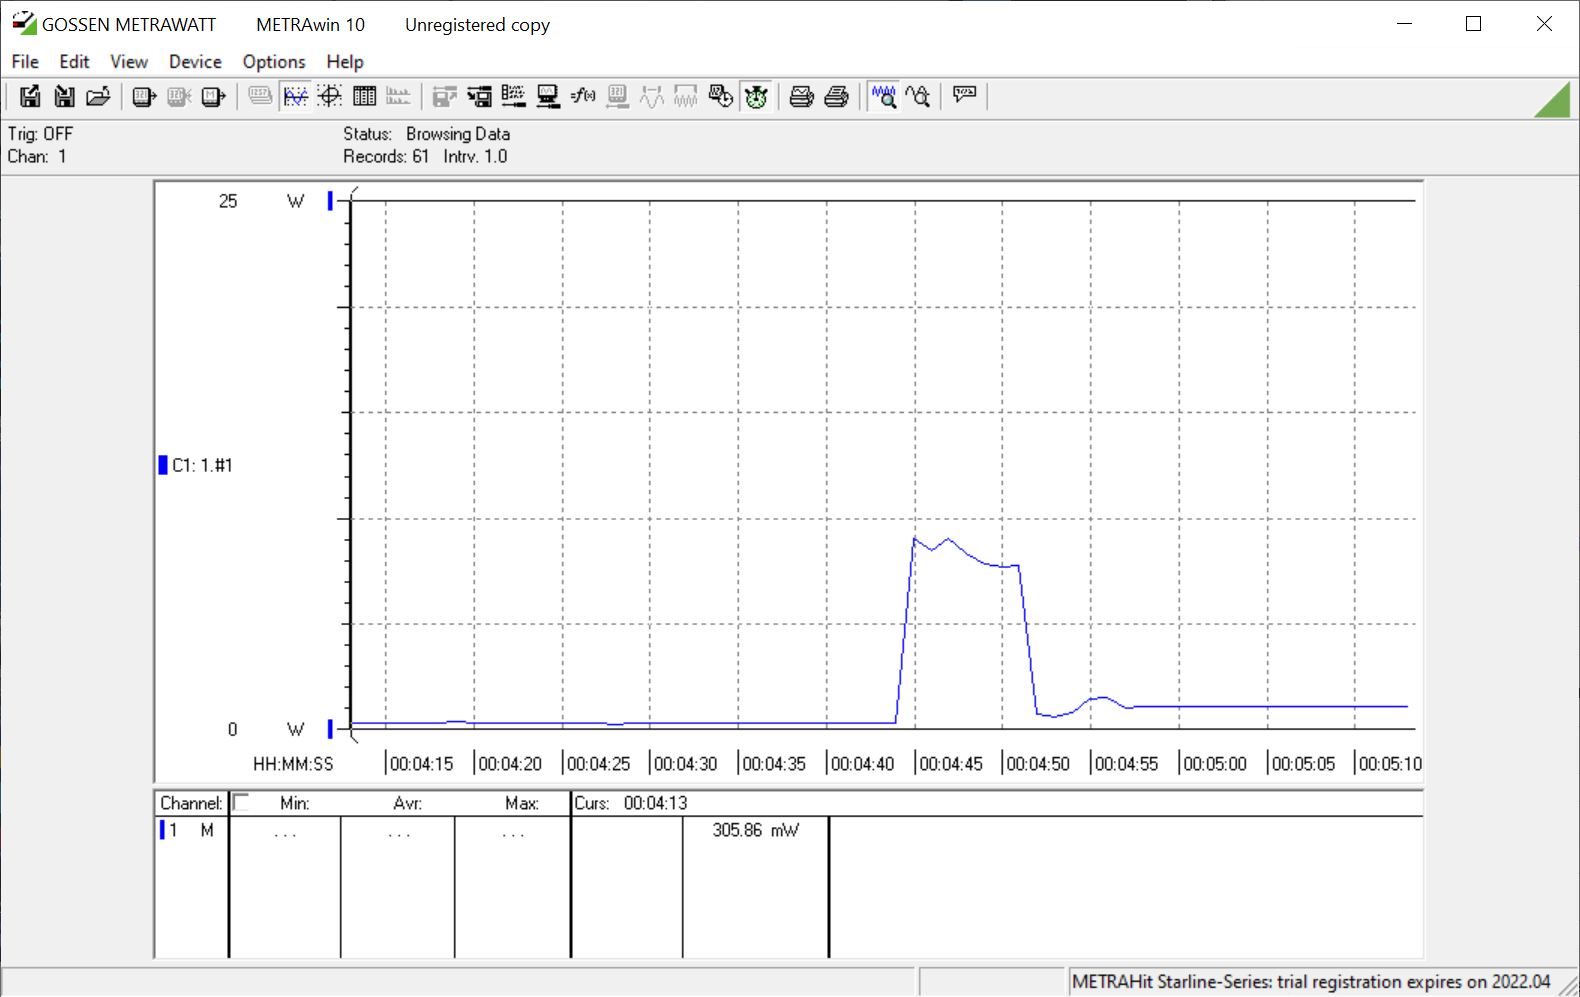
Despite its powerful M1 processor the Air’s power consumption was comparable to its predecessor’s. The only discrepancy was the new Air’s much higher powered-off vs. standby power consumption (see graph).
| Off / Standby | |
| Idle | |
| Load |
|
Key:
min: | |
| Apple iPad Air 5 2022 mAh | Samsung Galaxy Tab A8 2022 7040 mAh | Samsung Galaxy Tab S7 FE 5G 10090 mAh | Xiaomi Pad 5 Pro 8600 mAh | Xiaomi Pad 5 8720 mAh | Lenovo Yoga Tab 11 7700 mAh | Lenovo Tab P11 Plus 7700 mAh | Lenovo Tab M10 4850 mAh | Apple iPad 2021 8686 mAh | Apple iPad Mini 6 5177 mAh | Apple iPad Pro 11 2021 7538 mAh | Apple iPad Pro 12.9 2021 A2378 mAh | Apple iPad Air 4 2020 mAh | Microsoft Surface Pro 8, i7-1185G7 mAh | Microsoft Surface Pro 7 Plus mAh | |
|---|---|---|---|---|---|---|---|---|---|---|---|---|---|---|---|
| Power Consumption | 31% | 22% | 30% | 32% | 50% | 47% | 42% | 7% | 36% | 21% | -16% | 8% | -211% | -215% | |
| Idle Minimum * (Watt) | 1.65 | 1.19 28% | 1.06 36% | 1.14 31% | 0.99 40% | 1.2 27% | 1.4 15% | 0.98 41% | 1.3 21% | 1.1 33% | 1.01 39% | 1.8 -9% | 1.3 21% | 3.9 -136% | 5.5 -233% |
| Idle Average * (Watt) | 8.1 | 4.63 43% | 6.25 23% | 4.3 47% | 4.2 48% | 1.5 81% | 1.6 80% | 4.45 45% | 7.5 7% | 2.2 73% | 6.2 23% | 9.6 -19% | 7.89 3% | 8.5 -5% | 9.1 -12% |
| Idle Maximum * (Watt) | 9.4 | 4.68 50% | 6.3 33% | 4.31 54% | 4.22 55% | 1.9 80% | 1.9 80% | 4.51 52% | 7.58 19% | 4.2 55% | 6.23 34% | 9.8 -4% | 7.91 16% | 9.8 -4% | 10.8 -15% |
| Load Average * (Watt) | 9.5 | 7.27 23% | 8.76 8% | 8.09 15% | 7.88 17% | 4.9 48% | 5.3 44% | 5.78 39% | 10.03 -6% | 6.7 29% | 8.99 5% | 12.2 -28% | 9.28 2% | 48 -405% | 39.2 -313% |
| Load Maximum * (Watt) | 10.4 | 9.17 12% | 9.54 8% | 10.32 1% | 10.63 -2% | 8.8 15% | 8.7 16% | 7.18 31% | 10.91 -5% | 11.4 -10% | 9.89 5% | 12.6 -21% | 10.78 -4% | 63 -506% | 62.5 -501% |
| Witcher 3 ultra * (Watt) | 41.5 |
* ... smaller is better
Power Consumption: Geekbench (150 cd/m²)
Power Consumption: GFXBench (150 cd/m²)
Battery Life
Battery life suffered slightly from the powerful M1 chip compared to the Air’s predecessor, particularly under load (gaming) where the battery lasted significantly shorter. Keep in mind that the 2022 Air’s performance is much higher in return. Some games can be tuned for longer battery life, for example by limiting the maximum frame rate, while others will require a reduced display brightness in order to optimize battery life. The latter became glaringly obvious in our Wi-Fi test where the device ran only half as long on full brightness. All things considered battery life is nothing to write home about, and the iPad Air is only able to shove the Surface Pro 8 aside while most of its Android competitors run circles around it. This, however, turned out to be less relevant in the real world where the battery still managed to last long enough to require a charge only every couple of days.
| Apple iPad Air 5 2022 mAh | Samsung Galaxy Tab A8 2022 7040 mAh | Samsung Galaxy Tab S7 FE 5G 10090 mAh | Xiaomi Pad 5 Pro 8600 mAh | Apple iPad 2021 8686 mAh | Apple iPad Pro 11 2021 7538 mAh | Apple iPad Air 4 2020 mAh | Microsoft Surface Pro 8, i7-1185G7 mAh | |
|---|---|---|---|---|---|---|---|---|
| Battery runtime | -1% | 48% | 24% | 13% | 22% | 34% | -51% | |
| WiFi v1.3 (h) | 10.8 | 11.3 5% | 17 57% | 15.4 43% | 13.4 24% | 13.7 27% | 11.7 8% | 7.6 -30% |
| Load (h) | 4.1 | 3.8 -7% | 5.7 39% | 4.3 5% | 4.2 2% | 4.8 17% | 6.5 59% | 1.2 -71% |
| Reader / Idle (h) | 32.9 | 41.4 | 50.2 | 38.2 | 38 | 34 | ||
| H.264 (h) | 13.7 | 20.8 | 16.8 | 15 | 15.5 | 11.2 | 10.1 |
Using the included 20 W charger the iPad Air can be charged from near empty to full in 2:32 hours. Using a more powerful charger will allow the iPad Air to be charged with up to 32.4 W, and we were able to save a total of 21 minutes by using our MacBook Pro 16 M1 Pro’s 140 W power supply instead.
Pros
Cons
Verdict – The Power of M1 is in the Air
By integrating the M1 SoC into the iPad Air Apple managed to close the gap between the Air and the Pro. Overall performance is superb and should last for many years to come. At the time of writing there were practically no apps that pushed the M1 to its limits. Paired with the Magic Keyboard and Pencil 2 the iPad Air can be used for so much more than just media consumption. However, the limitations of iPadOS and the small display still apply.
The remaining hardware is as good as ever. Case, display, and speakers leave almost nothing to be desired.
Until Apple refreshes the iPad Pro (M2?) the 2022 iPad Air will probably be the better choice for many users. The Pro’s 120 Hz display may be slightly smoother, Face ID may be more convenient, and the speakers may be a bit better but at the end of the day the price makes the difference. On the other side of the spectrum is the new iPad 9 compared to which the 2022 iPad Air is in a whole different league. The same is true for its Android competitors, which the Air handily outperformed without breaking a sweat while at the same time offering a much better software ecosystem. In return, you lose some flexibility (re: walled garden).
If you prefer an Android tablet we suggest taking a closer look at the Xiaomi Pad 5 Pro, Pad 5, Huawei MatePad 11, and Samsung Galaxy Tab S7 FE. Those are the best currently available Android-based tablets on our top list.
Price and Availability
Apple iPad Air 5 2022
- 03/25/2022 v7 (old)
Klaus Hinum
Price comparison
