
Conclusion on the Apple iPad Air 13 M4
Apple's 8th generation iPad Air 13 cuts a fine figure. This is mainly due to the incredibly fast Apple M4: you don't get much more power even in a top-class tablet and the iPad Air is usually sufficient even for very demanding tasks.
In everyday use, you get absolutely smooth operation, only the 60 Hz screen is now noticeably outdated and creates a minimal but noticeable lag between input and response on the screen.
The fact that the price of the tablet has fallen in Europe compared to its predecessor is pleasing, but the Apple iPad Air 13 is not really cheap fun in 2026 either.
Other points of criticism include the slow charging speed, the few Bluetooth audio codecs available and the short warranty period.
Otherwise, however, the iPad Air 13 is a very interesting alternative to the iPad Pro, with which you can save a lot of money. In terms of performance, however, there is hardly any loss in everyday use.
Pros
Cons
Price and availability
At the time of testing, the smallest memory variant was available for less than 800 Euros (~$940) on the Internet, for example from our loaner notebooksbiliiger.de.
Table of Contents
- Conclusion on the Apple iPad Air 13 M4
- Specifications
- Housing and features - another high-quality unibody
- Communication and operation - Fast WiFi 7
- Software and sustainability - Presumably long updates
- Cameras - No change
- Display - PWM-free and colorful
- Performance, emissions and battery life - brute power
- Notebookcheck overall rating
- Possible alternatives in comparison
Specifications
Housing and features - another high-quality unibody
There are hardly any changes to the chassis this year either: the dimensions are identical to its predecessor, as is the weight.
There is also a high-quality unibody chassis, optionally in space gray, blue, purple or polar star, a light beige. The tablet is protected against dust and water to IP42, but this is not enough for really dirty or wet environments.
The fast USB port with 10 GBit/s data throughput returns. It offers the option of connecting a maximum of two external displays (up to 6,016 x 3,384, 60Hz).
The following memory variants are available:
- 12 GB RAM, 128 GB ROM: 849 Euros (WiFi) / 1019 Euros (WiFi + Cellular)(~$997/~$1197)
- 12 GB RAM, 256 GB ROM: 979 Euros (WiFi) / 1149 Euros (WiFi + Cellular)(~$1150/~$1350)
- 12 GB RAM, 512 GB ROM: 1229 Euros (WiFi) / 1399 Euros (WiFi + Cellular)(~$1444/~$1643)
- 12 GB RAM, 1 TB ROM: 1479 Euros (WiFi) / 1649 Euros (WiFi + Cellular)(~$1737/~$1937)
All variants have been reduced in price by 100 Euros (~$118) in Europe when compared with the predecessor. 12 GB RAM is also always on board.


Communication and operation - Fast WiFi 7
The iPad Air 13 can now set up WiFi networks according to the WiFi 7 standard and, in the test with our reference router, the Asus ROG Rapture GT-BE19000, is also as fast as an arrow with up to 1,791 MBit/s and very stable connections.
For the 5G variant, there is a new Apple modem called C1X, which offers 4x4 MIMO for 5G and LTE. Only eSIMs are compatible.
The touchscreen is reliable, but as the screen can still only display 60 frames per second, operation is not quite as smooth as on high-end tablets.
The Apple Pencil and Pencil Pro are supported again and offer fine pressure levels and precise recognition without lag.
| Networking | |
| Apple iPad Air 13 M4 2026 | |
| iperf3 receive RT-BE96U WiFi7 | |
| iperf3 transmit RT-BE96U WiFi7 | |
| Apple iPad Air 13 2025 | |
| iperf3 transmit AXE11000 6GHz | |
| iperf3 receive AXE11000 6GHz | |
| Samsung Galaxy Tab S10 FE | |
| iperf3 transmit AXE11000 6GHz | |
| iperf3 receive AXE11000 6GHz | |
| Huawei MatePad 12 X 2025 | |
| iperf3 transmit AXE11000 | |
| iperf3 receive AXE11000 | |
| Honor MagicPad 3 | |
| iperf3 transmit AXE11000 | |
| iperf3 receive AXE11000 | |
| Average 802.11 a/b/g/n/ac/ax/be | |
| iperf3 transmit AXE11000 | |
| iperf3 receive AXE11000 | |
| iperf3 transmit AXE11000 6GHz | |
| iperf3 receive AXE11000 6GHz | |
| iperf3 receive RT-BE96U WiFi7 | |
| iperf3 transmit RT-BE96U WiFi7 | |
| Average of class Tablet | |
| iperf3 transmit AXE11000 | |
| iperf3 receive AXE11000 | |
| iperf3 transmit AXE11000 6GHz | |
| iperf3 receive AXE11000 6GHz | |
| iperf3 receive RT-BE96U WiFi7 | |
| iperf3 transmit RT-BE96U WiFi7 | |
Software and sustainability - Presumably long updates
iPadOS 26 is the latest version of the operating system and is pre-installed. Apple does not promise any updates, but based on previous devices, it is safe to assume at least six years of updates.
In terms of sustainability, Apple compares favorably to other manufacturers, with its comprehensive information and high recycling rates.
Cameras - No change

There is a 12-megapixel camera on the front and back. These take decent photos, but are hardly competitive compared to modern smartphones.
Nothing has changed here in terms of the features, so we refer you to the test of the iPad Air 13 2025 to the test.
Image comparison
Choose a scene and navigate within the first image. One click changes the position on touchscreens. One click on the zoomed-in image opens the original in a new window. The first image shows the scaled photograph of the test device.
Main camera plantmain camera environmentmain camera low light


Display - PWM-free and colorful
At over 600 cd/m², the IPS screen of the iPad Air 13 is bright enough for indoor use and can also be used outdoors. Only in very bright environments do strong reflections overlay the screen content.
The 4:3 format is practical for everyday use, and the screen's resolution is very high.
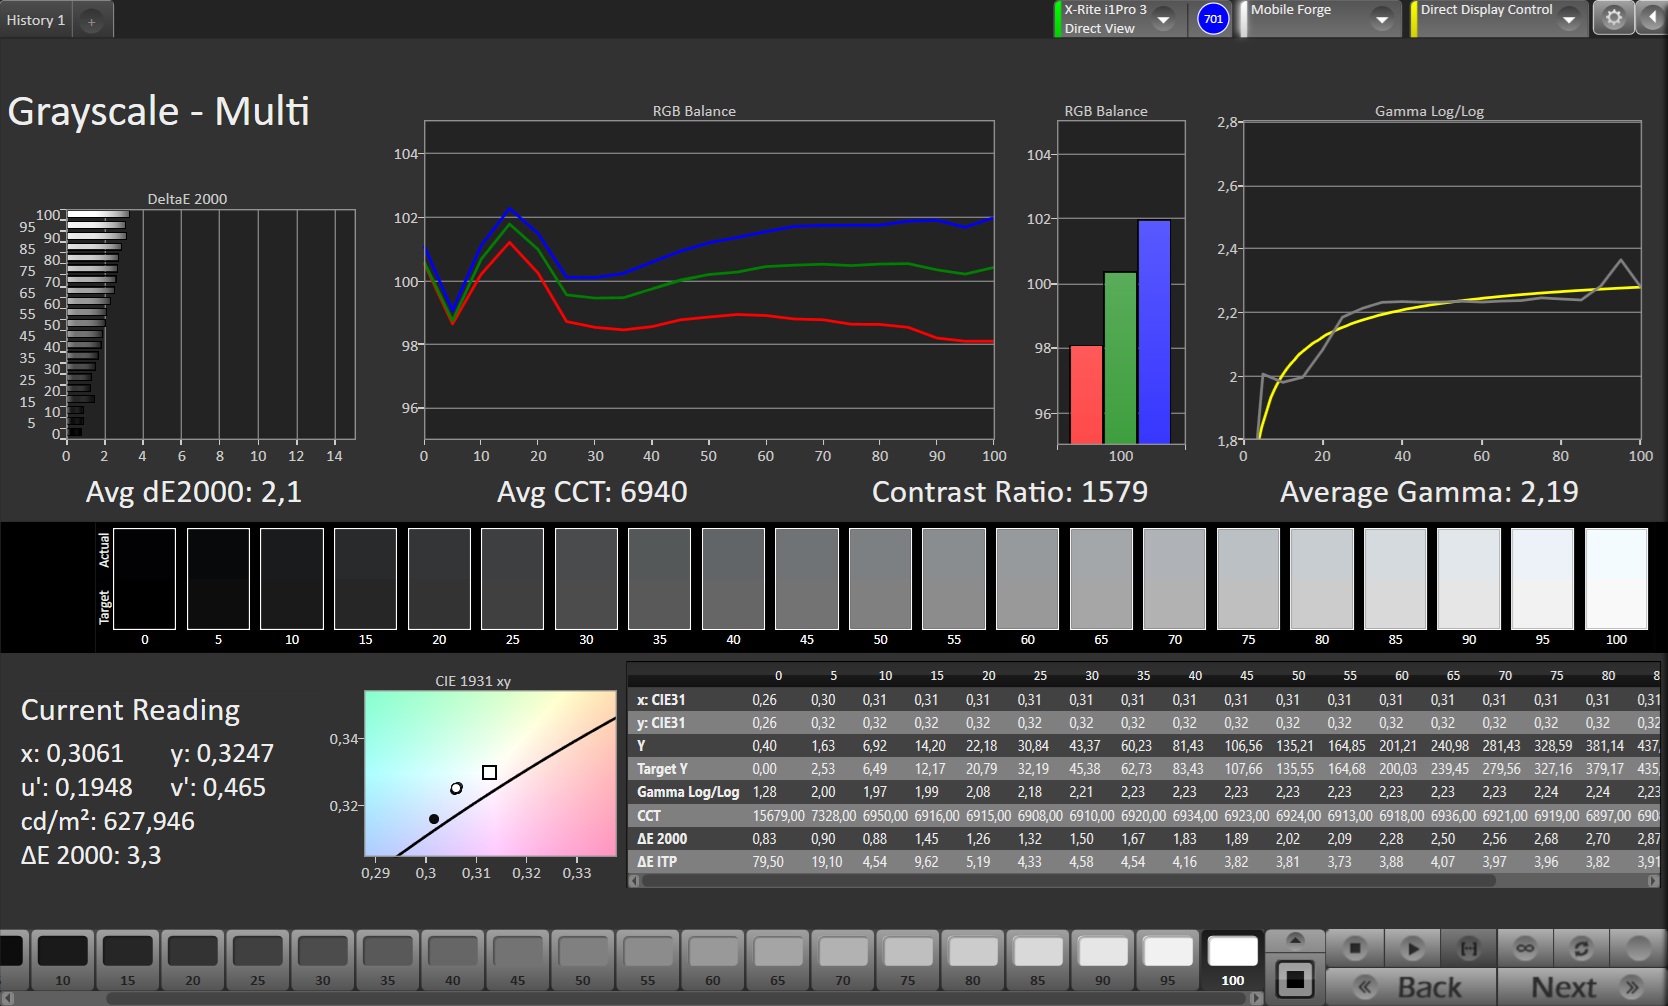
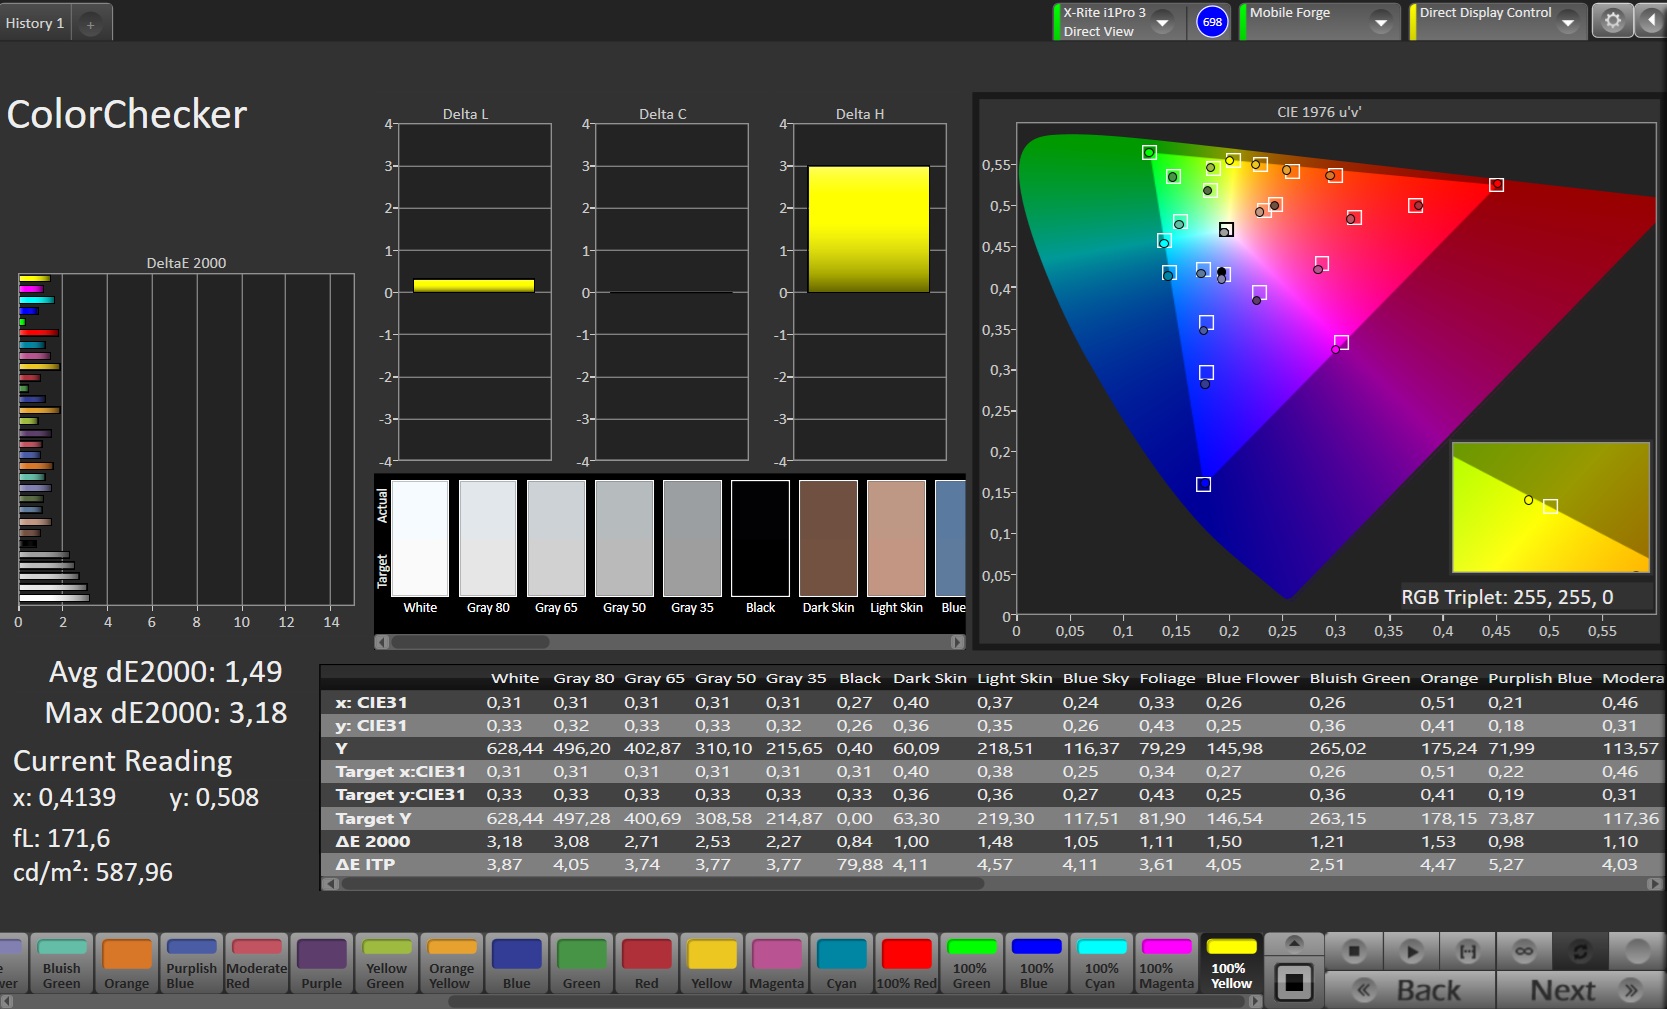
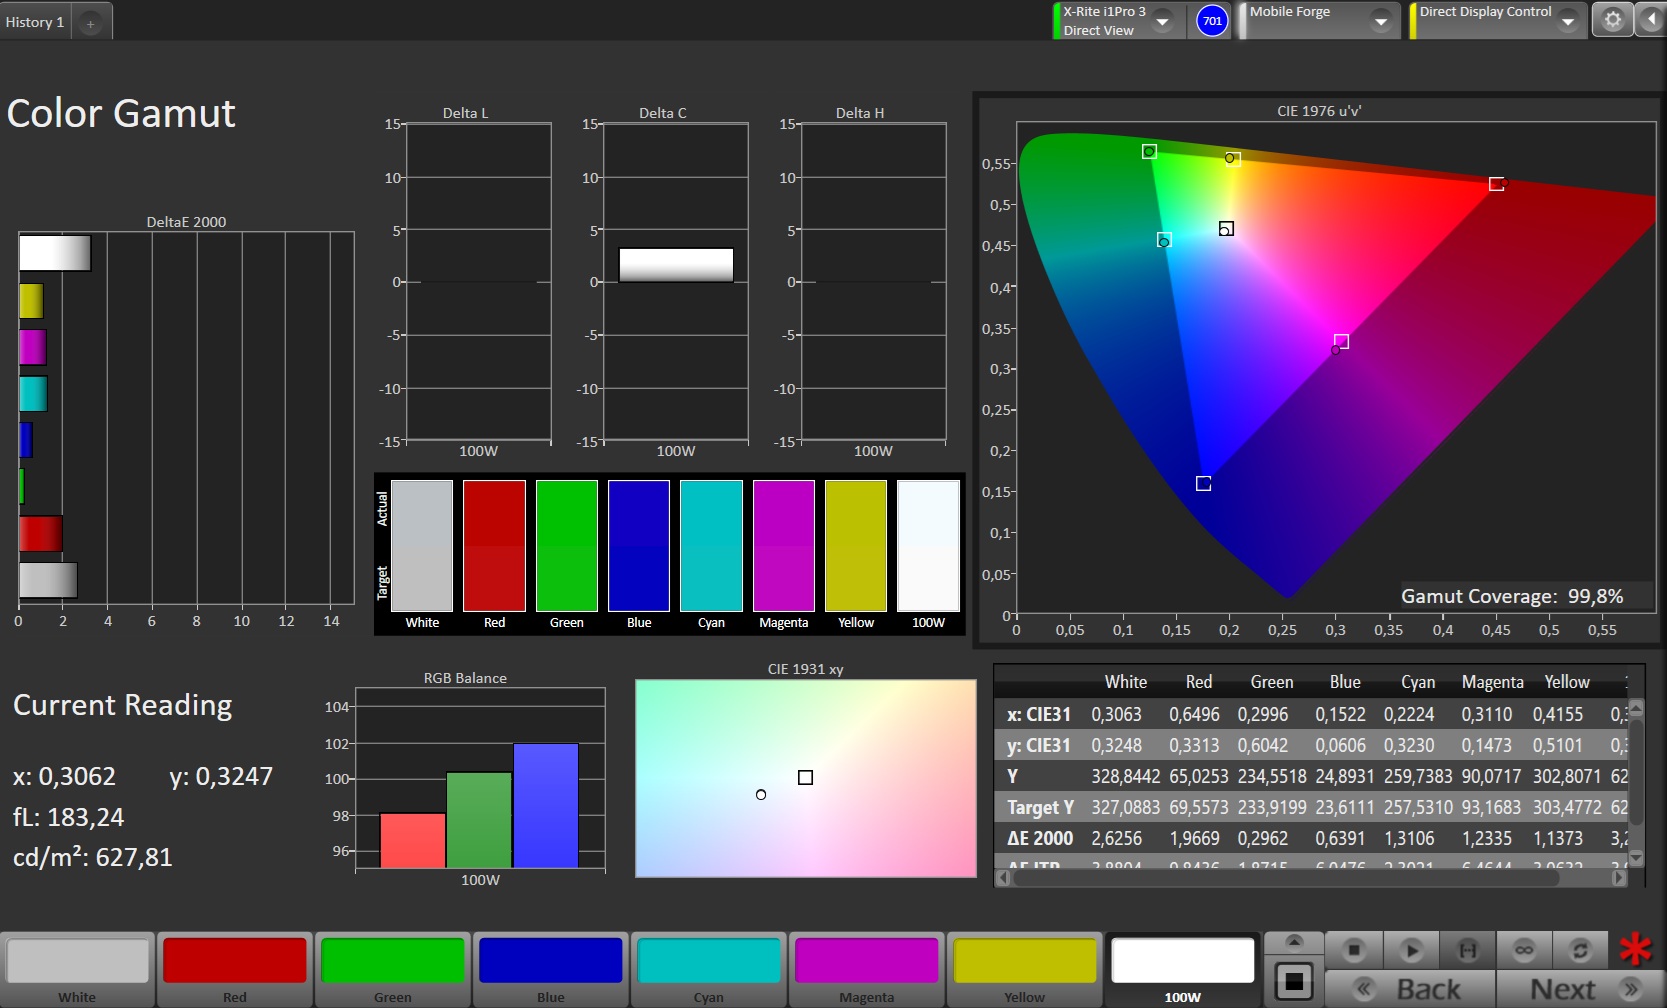
The color accuracy is impressive and there is no PWM flickering. We already criticized the slow 60 Hz panel last year as no longer up to date, and unfortunately nothing has changed here either.
| |||||||||||||||||||||||||
Brightness Distribution: 96 %
Center on Battery: 625 cd/m²
Contrast: 1563:1 (Black: 0.4 cd/m²)
ΔE ColorChecker Calman: 1.49 | ∀{0.5-29.43 Ø4.71}
ΔE Greyscale Calman: 2.1 | ∀{0.09-98 Ø4.96}
99.8% sRGB (Calman 2D)
Gamma: 2.19
CCT: 6940 K
| Apple iPad Air 13 M4 2026 IPS, 2732x2048, 12.9" | Apple iPad Air 13 2025 IPS, 2732x2048, 12.9" | Samsung Galaxy Tab S10 FE IPS, 2304x1440, 10.9" | Huawei MatePad 12 X 2025 LCD, 2800x1840, 12" | Honor MagicPad 3 LCD, 3200x2136, 13.3" | |
|---|---|---|---|---|---|
| Screen | -10% | 1% | -67% | -61% | |
| Brightness middle (cd/m²) | 625 | 607 -3% | 663 6% | 970 55% | 753 20% |
| Brightness (cd/m²) | 613 | 576 -6% | 617 1% | 906 48% | 706 15% |
| Brightness Distribution (%) | 96 | 87 -9% | 84 -12% | 90 -6% | 86 -10% |
| Black Level * (cd/m²) | 0.4 | 0.5 -25% | 0.39 2% | 0.87 -117% | 1.23 -208% |
| Contrast (:1) | 1563 | 1214 -22% | 1700 9% | 1115 -29% | 612 -61% |
| Colorchecker dE 2000 * | 1.49 | 1.52 -2% | 1.47 1% | 3.6 -142% | 2.3 -54% |
| Colorchecker dE 2000 max. * | 3.18 | 3.5 -10% | 4.14 -30% | 8.2 -158% | 5.9 -86% |
| Greyscale dE 2000 * | 2.1 | 2.2 -5% | 1.4 33% | 6.1 -190% | 4.2 -100% |
| Gamma | 2.19 100% | 2.197 100% | 2.199 100% | 2.25 98% | 2.27 97% |
| CCT | 6940 94% | 6929 94% | 6730 97% | 7149 91% | 7391 88% |
* ... smaller is better
| Display / APL18 Peak Brightness | |
| Huawei MatePad 12 X 2025 | |
| Honor MagicPad 3 | |
| Apple iPad Air 13 M4 2026 | |
| Display / HDR Peak Brightness | |
| Huawei MatePad 12 X 2025 | |
| Honor MagicPad 3 | |
| Apple iPad Air 13 M4 2026 | |
Screen Flickering / PWM (Pulse-Width Modulation)
| Screen flickering / PWM not detected |  | ||
In comparison: 52 % of all tested devices do not use PWM to dim the display. If PWM was detected, an average of 7747 (minimum: 5 - maximum: 343500) Hz was measured. | |||
Display Response Times
| ↔ Response Time Black to White | ||
|---|---|---|
| 19.5 ms ... rise ↗ and fall ↘ combined | ↗ 5 ms rise | 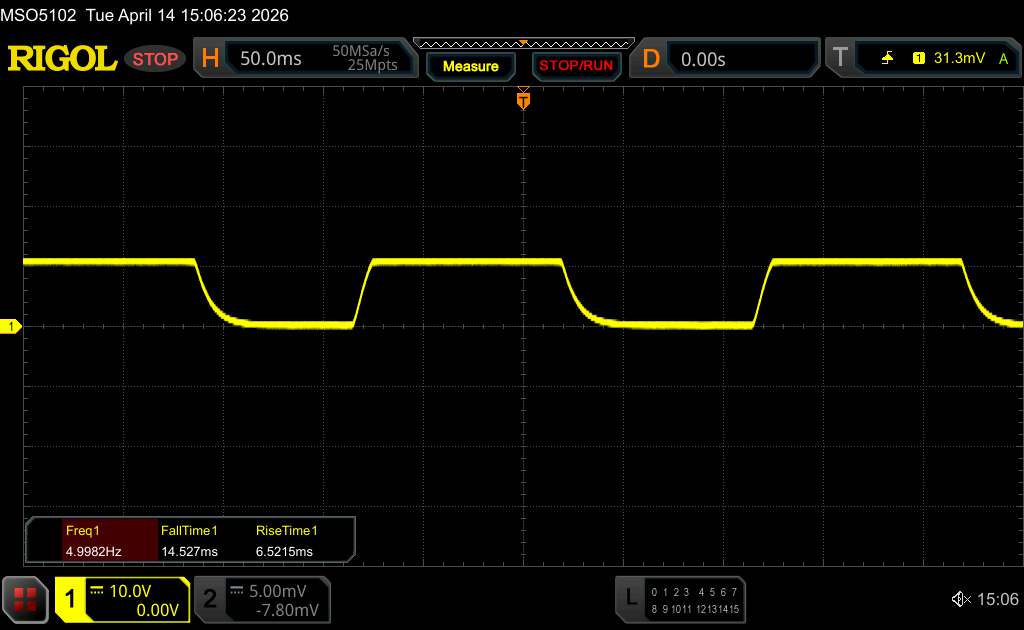 |
| ↘ 14.5 ms fall | ||
| The screen shows good response rates in our tests, but may be too slow for competitive gamers. In comparison, all tested devices range from 0.1 (minimum) to 240 (maximum) ms. » 43 % of all devices are better. This means that the measured response time is similar to the average of all tested devices (19.8 ms). | ||
| ↔ Response Time 50% Grey to 80% Grey | ||
| 18.8 ms ... rise ↗ and fall ↘ combined | ↗ 4.6 ms rise | 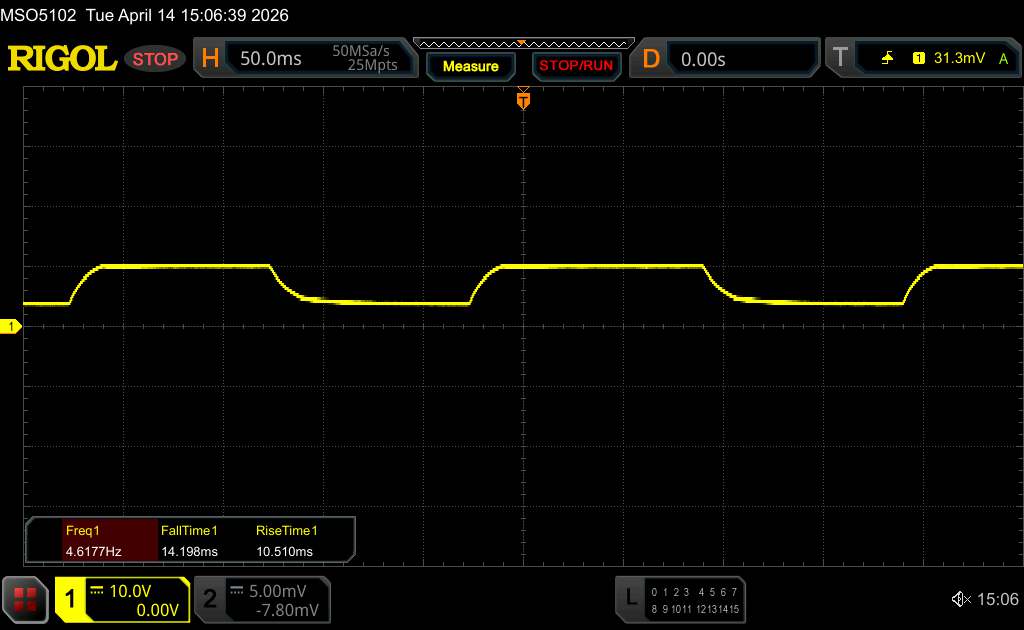 |
| ↘ 14.2 ms fall | ||
| The screen shows good response rates in our tests, but may be too slow for competitive gamers. In comparison, all tested devices range from 0.165 (minimum) to 636 (maximum) ms. » 32 % of all devices are better. This means that the measured response time is better than the average of all tested devices (31 ms). | ||
Performance, emissions and battery life - brute power
The Apple-M4 processor with eight cores offers even more power than the M3 in last year's iPad Air. This provides absolute top performance in a tablet that can keep up with even the most expensive Android tablets.
In everyday use, the iPad Air runs absolutely smoothly and even very demanding tasks can be completed without any problems. Games are no problem, only the 60 Hz display limits an even smoother display.
However, the SoC does throttle significantly after prolonged load and in some cases loses almost 40% of its performance. This is hardly noticeable during operation due to the high output power.
The stereo speakers can get reasonably loud and sound warm and balanced. However, there are only a few Bluetooth audio codecs available for the wireless connection of speakers or headphones.
The battery can deliver just under 37 watt-hours of power, allowing it to achieve a decent runtime of over 13 hours in our WLAN test. Android tablets can sometimes achieve significantly more. However, the battery power should be sufficient for a day on the sofa.
You need to allow over 2 hours for a full charge.
| GFXBench | |
| on screen Aztec Ruins Normal Tier Onscreen | |
| Apple iPad Air 13 2025 | |
| Honor MagicPad 3 | |
| Average of class Tablet (5.2 - 301, n=81, last 2 years) | |
| Samsung Galaxy Tab S10 FE | |
| Huawei MatePad 12 X 2025 | |
| 1920x1080 Aztec Ruins Normal Tier Offscreen | |
| Apple iPad Air 13 2025 | |
| Honor MagicPad 3 | |
| Average of class Tablet (5.6 - 323, n=81, last 2 years) | |
| Huawei MatePad 12 X 2025 | |
| Samsung Galaxy Tab S10 FE | |
| on screen Aztec Ruins High Tier Onscreen | |
| Apple iPad Air 13 2025 | |
| Honor MagicPad 3 | |
| Average of class Tablet (3.1 - 94, n=81, last 2 years) | |
| Samsung Galaxy Tab S10 FE | |
| Huawei MatePad 12 X 2025 | |
| 2560x1440 Aztec Ruins High Tier Offscreen | |
| Honor MagicPad 3 | |
| Apple iPad Air 13 2025 | |
| Average of class Tablet (2 - 134, n=81, last 2 years) | |
| Huawei MatePad 12 X 2025 | |
| Samsung Galaxy Tab S10 FE | |
| 3840x2160 4K Aztec Ruins High Tier Offscreen | |
| Honor MagicPad 3 | |
| Apple iPad Air 13 2025 | |
| Average of class Tablet (0.81 - 56, n=81, last 2 years) | |
| Huawei MatePad 12 X 2025 | |
| Samsung Galaxy Tab S10 FE | |
| Jetstream 2 - 2.0 Total | |
| Apple iPad Air 13 M4 2026 | |
| Average Apple M4 8-Core (351 - 351, n=2) | |
| Apple iPad Air 13 2025 | |
| Huawei MatePad 12 X 2025 | |
| Average of class Tablet (35.8 - 420, n=55, last 2 years) | |
(+) The maximum temperature on the upper side is 38.8 °C / 102 F, compared to the average of 33.7 °C / 93 F, ranging from 20.7 to 53.2 °C for the class Tablet.
(+) The bottom heats up to a maximum of 38 °C / 100 F, compared to the average of 33.2 °C / 92 F
(+) In idle usage, the average temperature for the upper side is 22.9 °C / 73 F, compared to the device average of 30 °C / 86 F.
3DMark Stress Tests
| 3DMark | |
| Wild Life Stress Test Stability | |
| Honor MagicPad 3 | |
| Samsung Galaxy Tab S10 FE | |
| Huawei MatePad 12 X 2025 | |
| Wild Life Extreme Stress Test | |
| Samsung Galaxy Tab S10 FE | |
| Honor MagicPad 3 | |
| Apple iPad Air 13 2025 | |
| Apple iPad Air 13 M4 2026 | |
| Solar Bay Stress Test Stability | |
| Honor MagicPad 3 | |
| Apple iPad Air 13 M4 2026 | |
| Apple iPad Air 13 2025 | |
| Steel Nomad Light Stress Test Stability | |
| Samsung Galaxy Tab S10 FE | |
| Huawei MatePad 12 X 2025 | |
| Apple iPad Air 13 2025 | |
| Honor MagicPad 3 | |
| Apple iPad Air 13 M4 2026 | |
Apple iPad Air 13 M4 2026 audio analysis
(±) | speaker loudness is average but good (76.4 dB)
Bass 100 - 315 Hz
(±) | reduced bass - on average 6% lower than median
(-) | bass is not linear (18.8% delta to prev. frequency)
Mids 400 - 2000 Hz
(±) | higher mids - on average 5.9% higher than median
(±) | linearity of mids is average (8.8% delta to prev. frequency)
Highs 2 - 16 kHz
(+) | balanced highs - only 3.6% away from median
(±) | linearity of highs is average (9.8% delta to prev. frequency)
Overall 100 - 16.000 Hz
(±) | linearity of overall sound is average (16.8% difference to median)
Compared to same class
» 41% of all tested devices in this class were better, 4% similar, 55% worse
» The best had a delta of 7%, average was 20%, worst was 129%
Compared to all devices tested
» 30% of all tested devices were better, 8% similar, 63% worse
» The best had a delta of 4%, average was 23%, worst was 134%
Honor MagicPad 3 audio analysis
(+) | speakers can play relatively loud (85 dB)
Bass 100 - 315 Hz
(+) | good bass - only 3.9% away from median
(±) | linearity of bass is average (10.1% delta to prev. frequency)
Mids 400 - 2000 Hz
(+) | balanced mids - only 2.9% away from median
(+) | mids are linear (3.5% delta to prev. frequency)
Highs 2 - 16 kHz
(+) | balanced highs - only 4.1% away from median
(+) | highs are linear (5.4% delta to prev. frequency)
Overall 100 - 16.000 Hz
(+) | overall sound is linear (7.2% difference to median)
Compared to same class
» 0% of all tested devices in this class were better, 0% similar, 99% worse
» The best had a delta of 7%, average was 20%, worst was 129%
Compared to all devices tested
» 1% of all tested devices were better, 0% similar, 99% worse
» The best had a delta of 4%, average was 23%, worst was 134%
| Apple iPad Air 13 M4 2026 9705 mAh | Apple iPad Air 13 2025 mAh | Samsung Galaxy Tab S10 FE 8000 mAh | Huawei MatePad 12 X 2025 10100 mAh | Honor MagicPad 3 12450 mAh | |
|---|---|---|---|---|---|
| Battery runtime | -1% | -5% | 7% | 69% | |
| Reader / Idle (h) | 25.7 | 25.5 -1% | 24.8 -4% | ||
| WiFi v1.3 (h) | 13.4 | 13.2 -1% | 14.8 10% | 14.3 7% | 22.6 69% |
| Load (h) | 5.1 | 5 -2% | 4.1 -20% | ||
| H.264 (h) | 13.8 | 16.1 |
Notebookcheck overall rating
Sure, the iPad Pro offers more prestige and some Android tablets last longer.
But when it comes to a lot of power for not quite as much money, the Apple iPad Air 13 with M4 processor is unbeatable.

Apple iPad Air 13 M4 2026
- 04/20/2026 v8
Florian Schmitt
 Total Sustainability Score:
 Possible alternatives in comparison
Image | Model / Review | Price | Weight | Drive | Display |
|---|---|---|---|---|---|
1. 87.1%  | Apple iPad Air 13 M4 2026 Apple M4 8-Core ⎘ Apple M4 9-Core GPU ⎘ 12 GB Memory, 128 GB NVMe | Amazon: List Price: 849€ | 616 g | 128 GB NVMe | 12.90" 2732x2048 265 PPI IPS |
2. 87.4%  | Apple iPad Air 13 2025 Apple M3 ⎘ Apple M3 9-Core GPU ⎘ 8 GB Memory, 128 GB NVMe | Amazon: List Price: 949€ | 616 g | 128 GB NVMe | 12.90" 2732x2048 265 PPI IPS |
3. 81.6%  | Samsung Galaxy Tab S10 FE Samsung Exynos 1580 ⎘ Samsung Xclipse 540 ⎘ 12 GB Memory, 256 GB UFS 3.1 | Amazon: List Price: 779€ | 497 g | 256 GB UFS 3.1 Flash | 10.90" 2304x1440 249 PPI IPS |
4. 83.2%  | Huawei MatePad 12 X 2025 HiSilicon Kirin T92 ⎘ HiSilicon Maleoon 920 ⎘ 12 GB Memory, 256 GB UFS 4.x | Amazon: List Price: 649€ | 555 g | 256 GB UFS 4.0 Flash | 12.00" 2800x1840 279 PPI LCD |
5. 85.9%  | Honor MagicPad 3 Qualcomm Snapdragon 8 Gen 3 ⎘ Qualcomm Adreno 750 ⎘ 16 GB Memory, 512 GB UFS 3.1 | Amazon: 1. $684.00 Honor MagicPad3 Wi-Fi Tablet... 2. $468.13 Samsung Galaxy Tab S10 FE+ 1... 3. $342.50 XIAOMI Pad 7 Ai WiFi Version... List Price: 700€ | 595 g | 512 GB UFS 3.1 Flash | 13.30" 3200x2136 289 PPI LCD |
Transparency
The selection of devices to be reviewed is made by our editorial team. The test sample was provided to the author as a loan by the manufacturer or retailer for the purpose of this review. The lender had no influence on this review, nor did the manufacturer receive a copy of this review before publication. There was no obligation to publish this review. As an independent media company, Notebookcheck is not subjected to the authority of manufacturers, retailers or publishers.
This is how Notebookcheck is testing
Every year, Notebookcheck independently reviews hundreds of laptops and smartphones using standardized procedures to ensure that all results are comparable. We have continuously developed our test methods for around 20 years and set industry standards in the process. In our test labs, high-quality measuring equipment is utilized by experienced technicians and editors. These tests involve a multi-stage validation process. Our complex rating system is based on hundreds of well-founded measurements and benchmarks, which maintains objectivity. Further information on our test methods can be found here.

