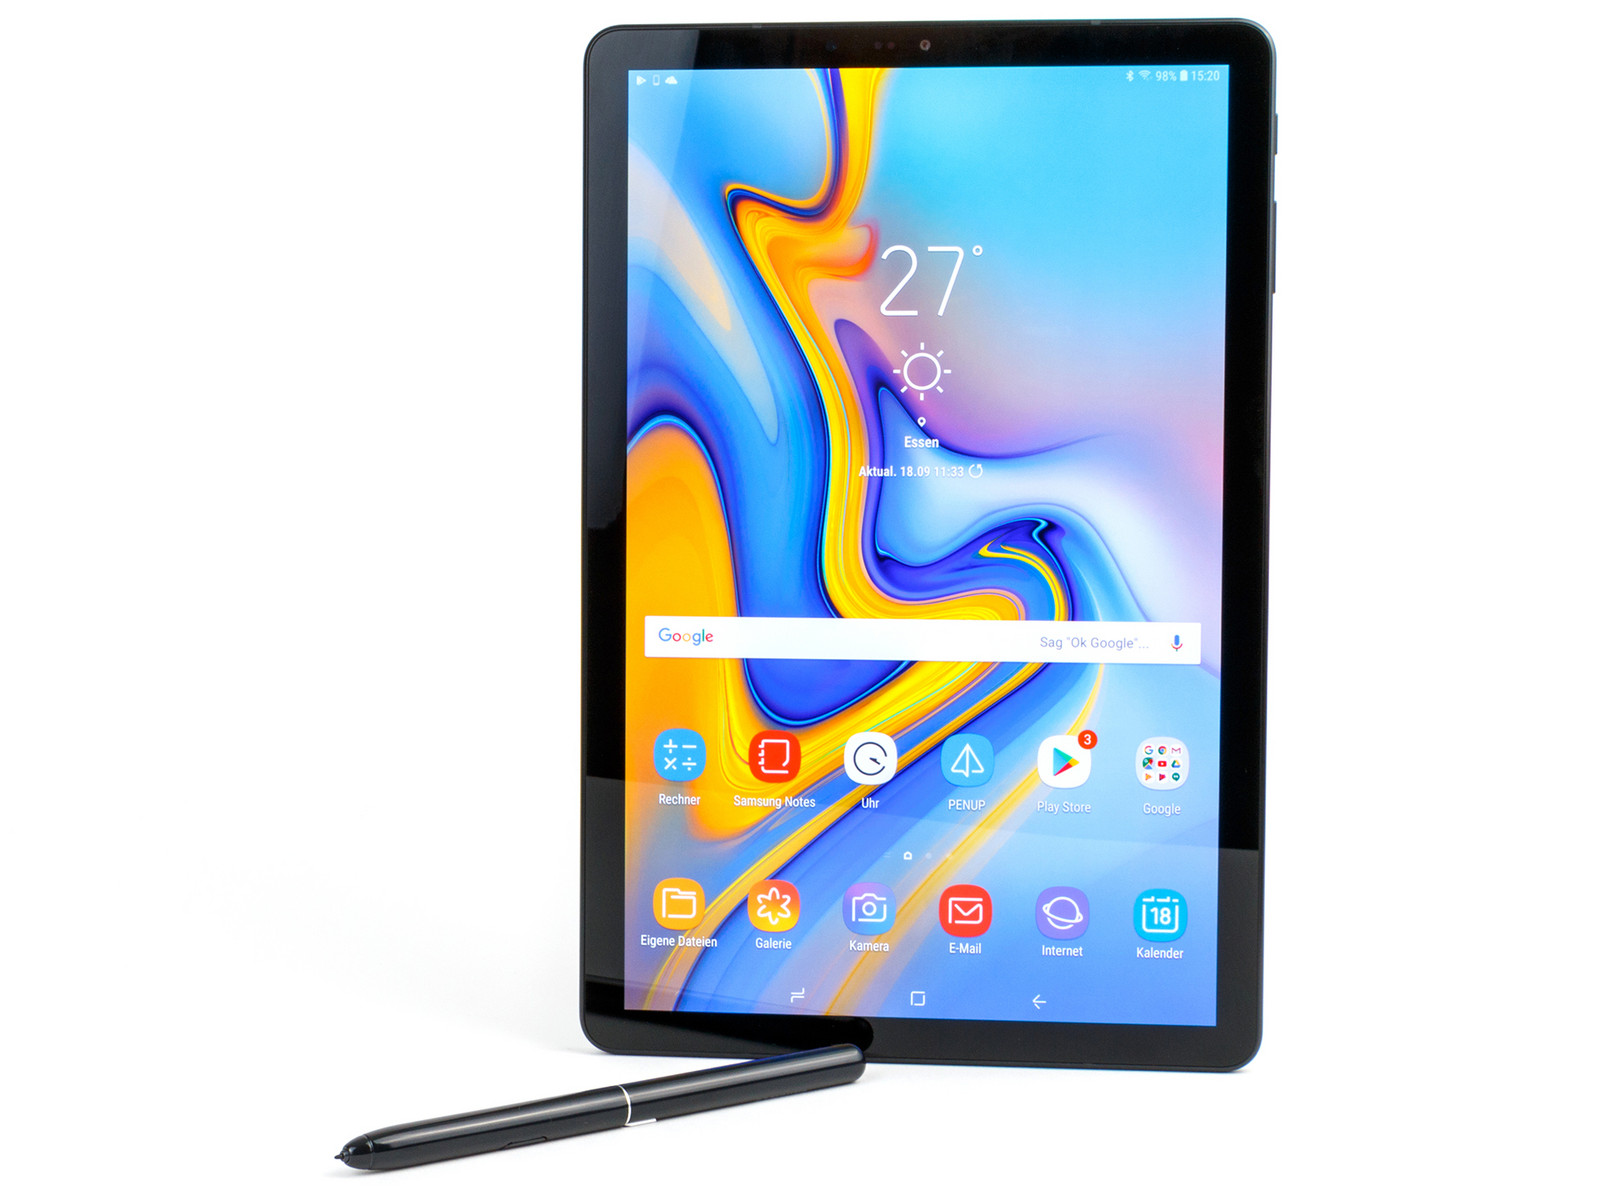
Samsung Galaxy Tab S4 Tablet Review
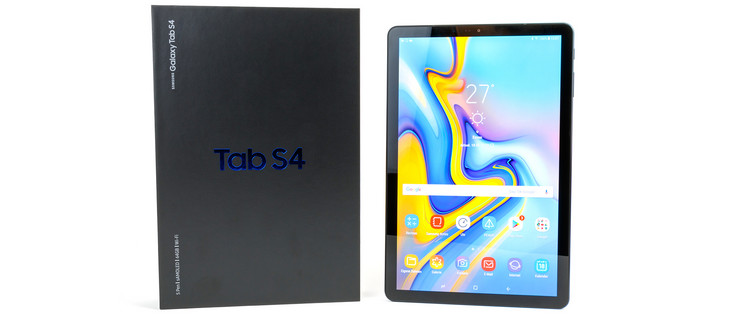
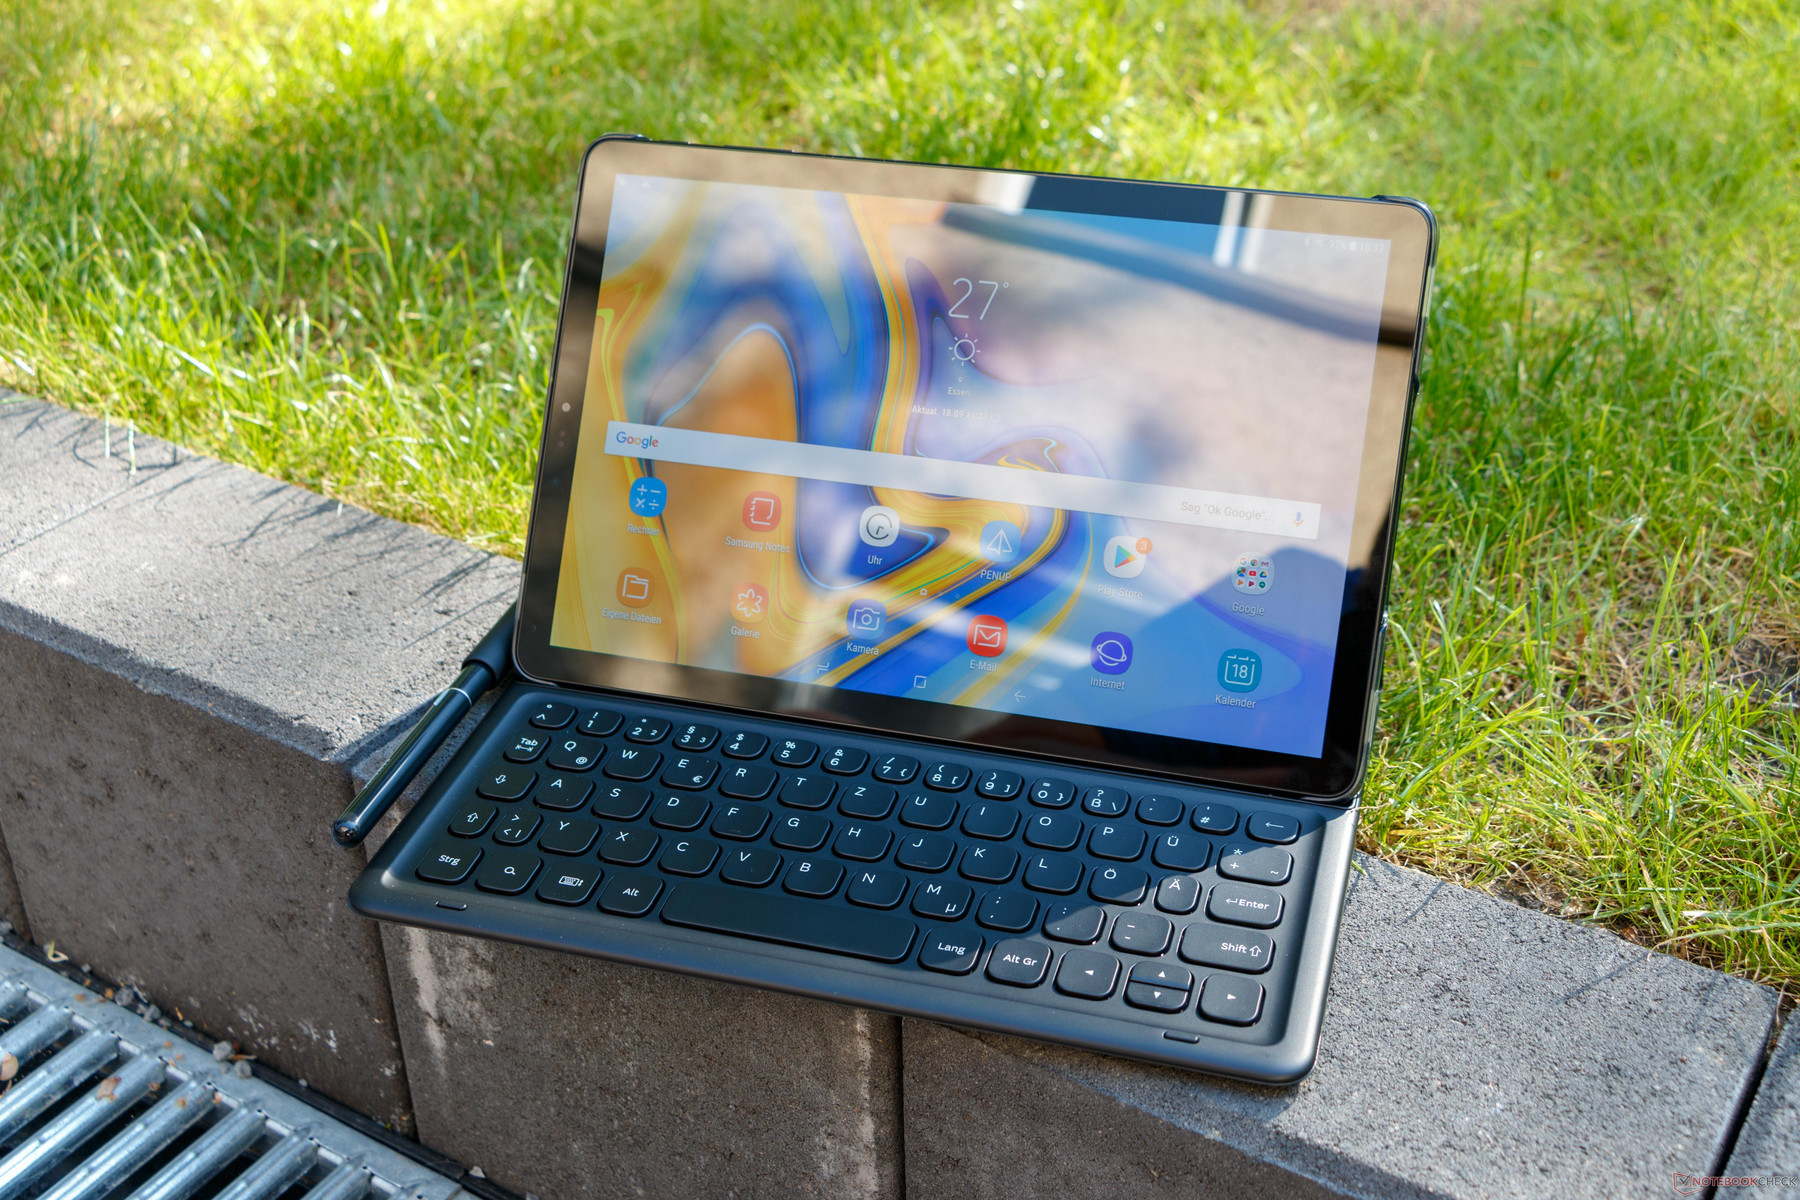
Samsung relaunched its reworked Galaxy Tab S series last year and has concentrated on largely technical refinements for its new Galaxy Tab S4. Samsung has altered the device’s form factor and switched from a 4:3 to a 16:10 aspect ratio, underlining its ambitions as a multimedia tablet. The display of the Tab S4, which is both Super AMOLED and HDR, has a larger 10.5-inch size too thanks to its narrower bezels.
The device is equipped with a Qualcomm Snapdragon 835 SoC, which should provide high system performance. However, it is last year’s flagship chip; most new mobile devices are equipped with a Snapdragon 845 SoC. The Tab S4 has 4 GB of RAM, 64 GB of internal storage and a 7,300 mAh battery. Moreover, there is microSD card expansion and a USB 3.1 Type-C port. Samsung has added DeX mode too. Our test device is the Wi-Fi version that carries the model name SM-T830 and currently costs $649.99 (£599). There is also an LTE version that costs $729.99 (£649), the model name for which is SM-T835.
If you are searching for Android tablets with similar features, then we would recommend considering the Samsung Galaxy Tab S3 or the Huawei MediaPad M5 10.8 Pro. However, the iPad Pro 10.5 and iPad Pro 12.9 are more compelling offerings with their pen support and optional keyboard covers. We will principally compare the Galaxy Tab S4 against these four devices, but we will also include some cheaper tablets to broaden our comparison tables.
Case
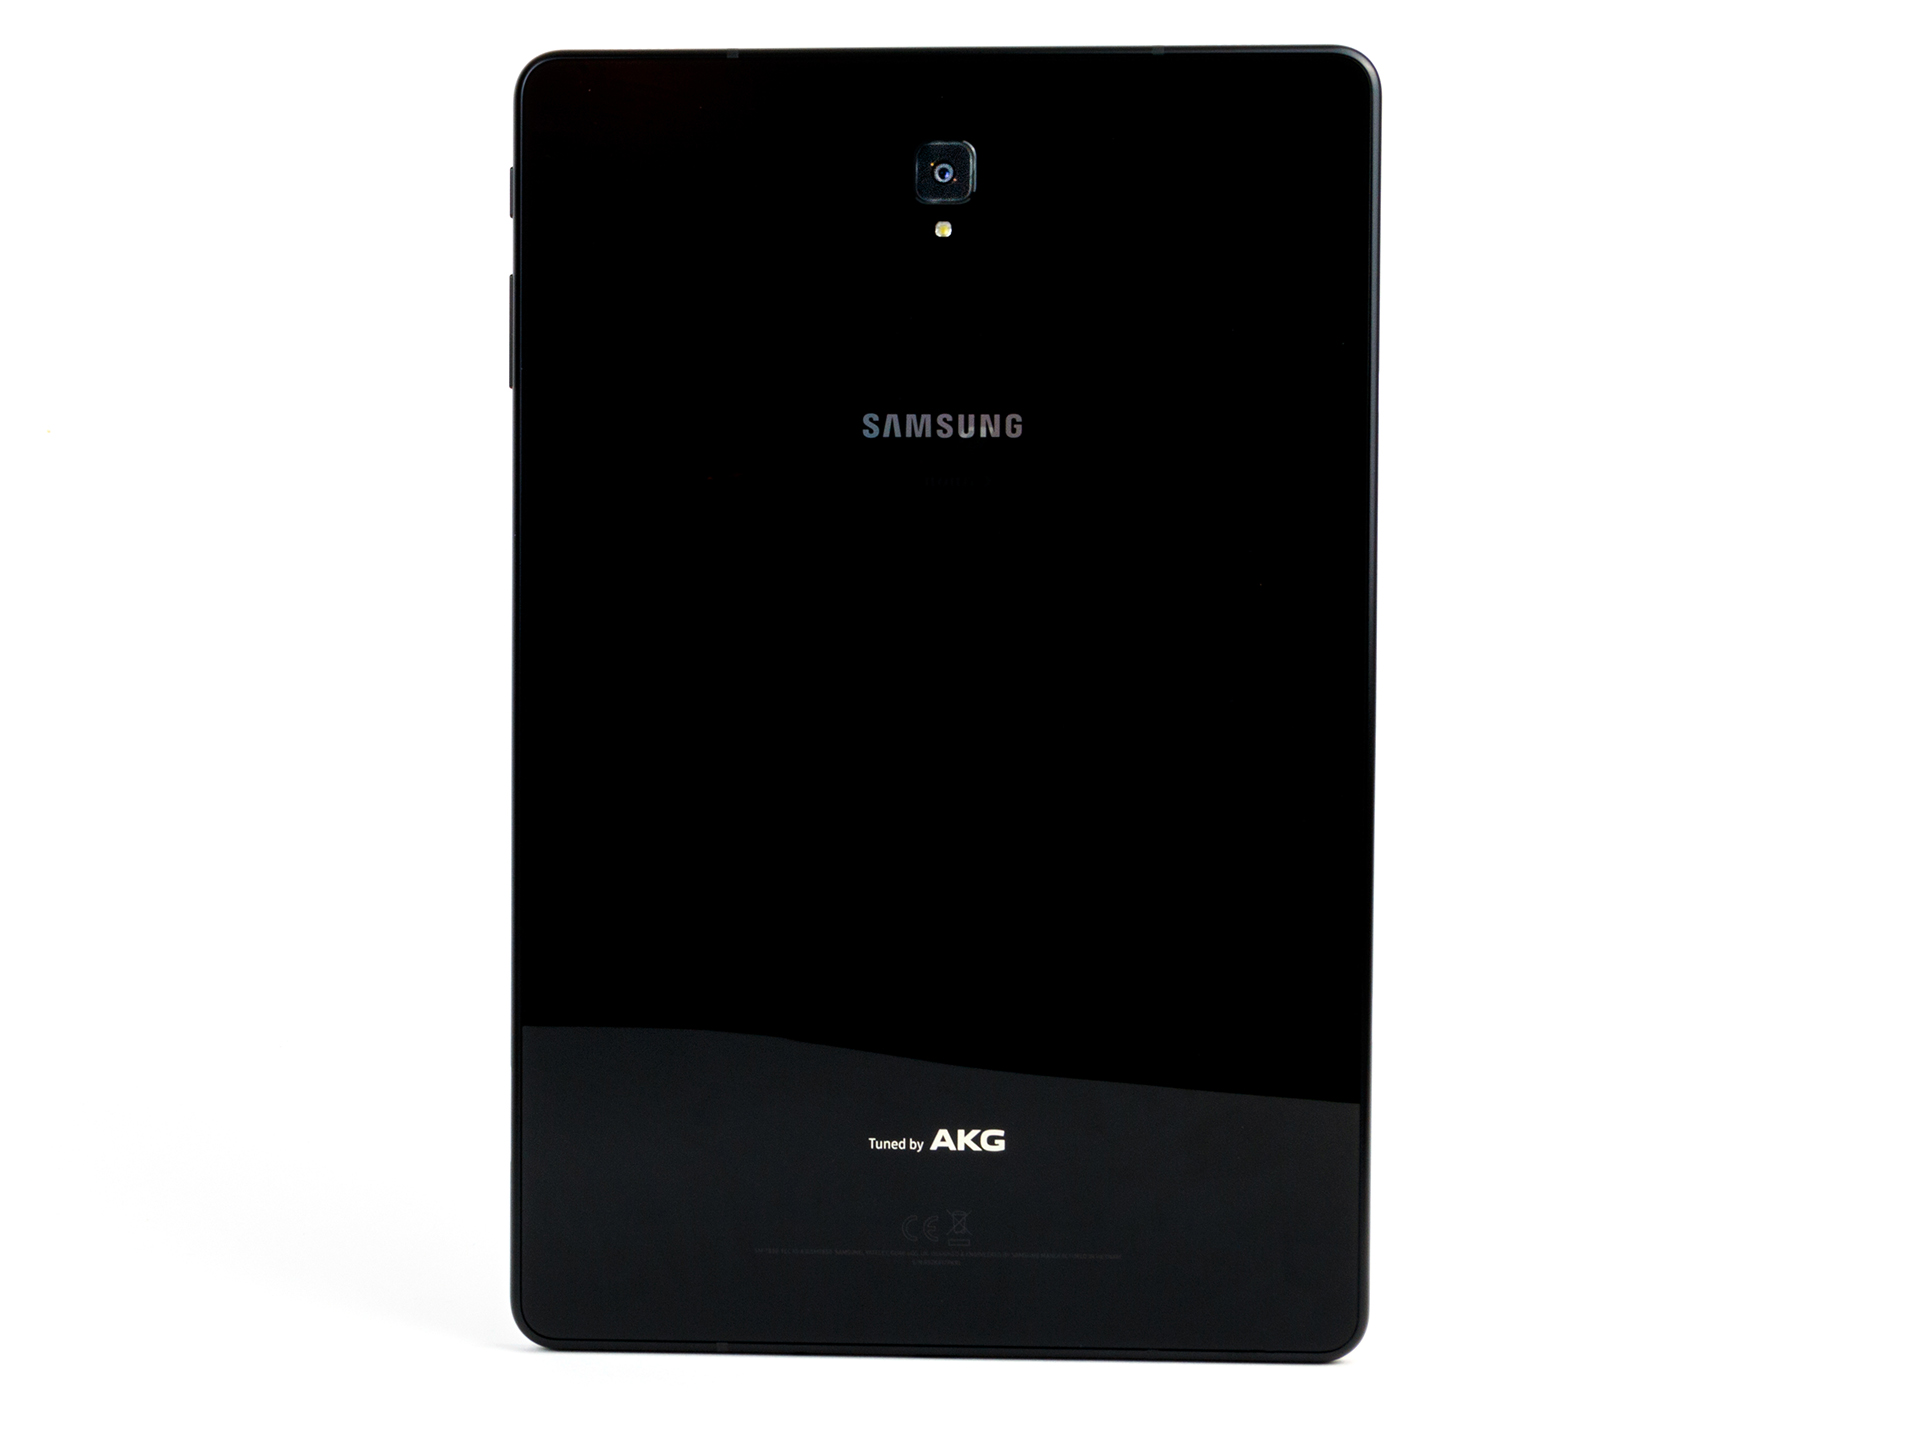
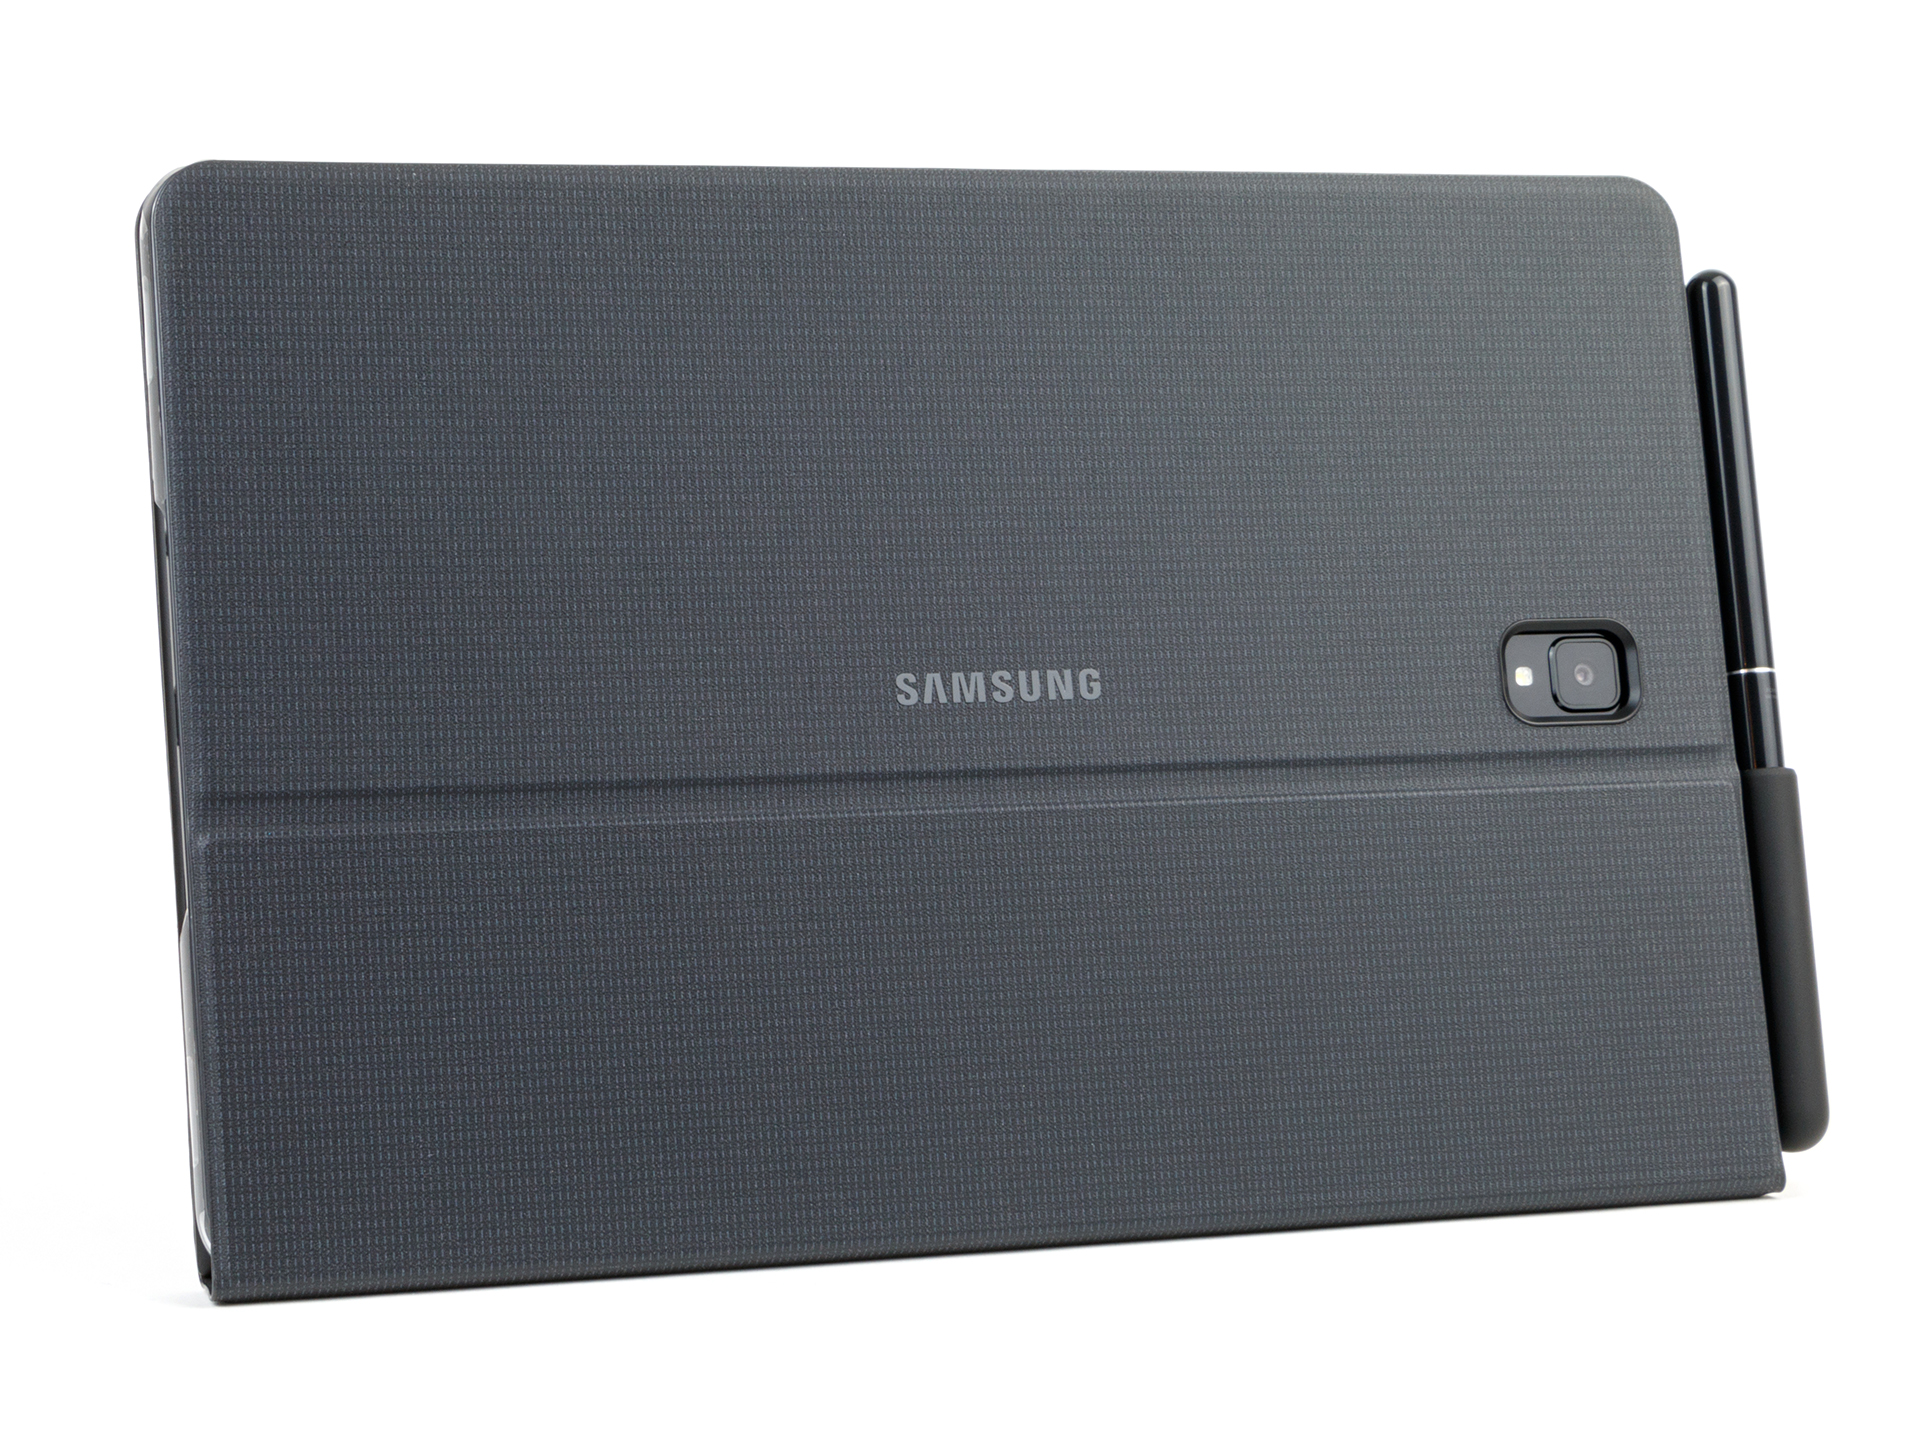
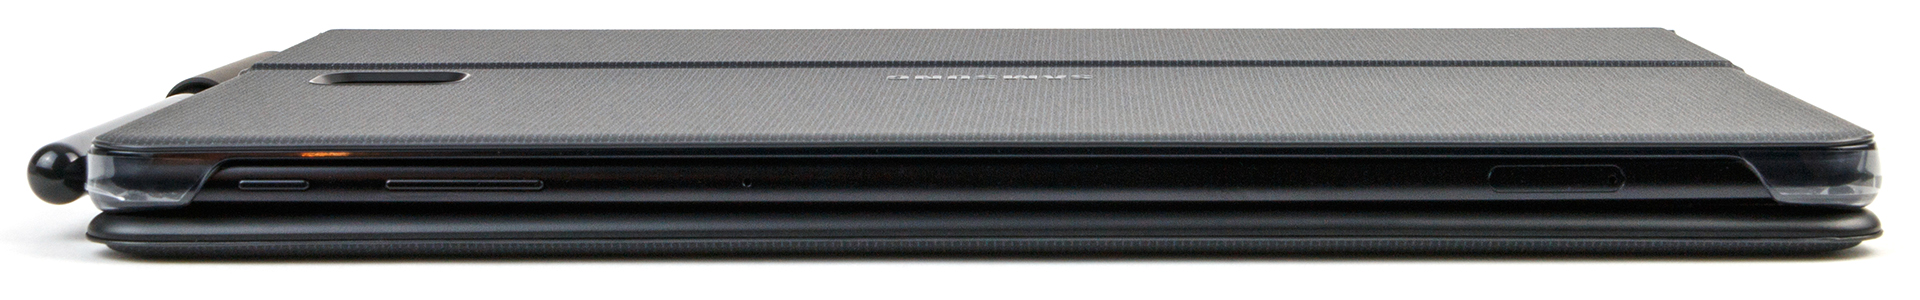
The Tab S4 is slightly thicker than its predecessor but the difference is only noticeable when comparing the two side-by-side. The Tab S4 is 7 mm (0.04-inches) thick and feels good in the hand. Samsung currently sells the device in either black or grey.
Our test device is well-built while the gaps between materials are even and tight. However, the device is easy to twist, and we could get the display to deform with little effort. While the Tab S4 lacks the rigidity of Samsung’s premium smartphones, we applied more pressure than the device would typically see in daily use.
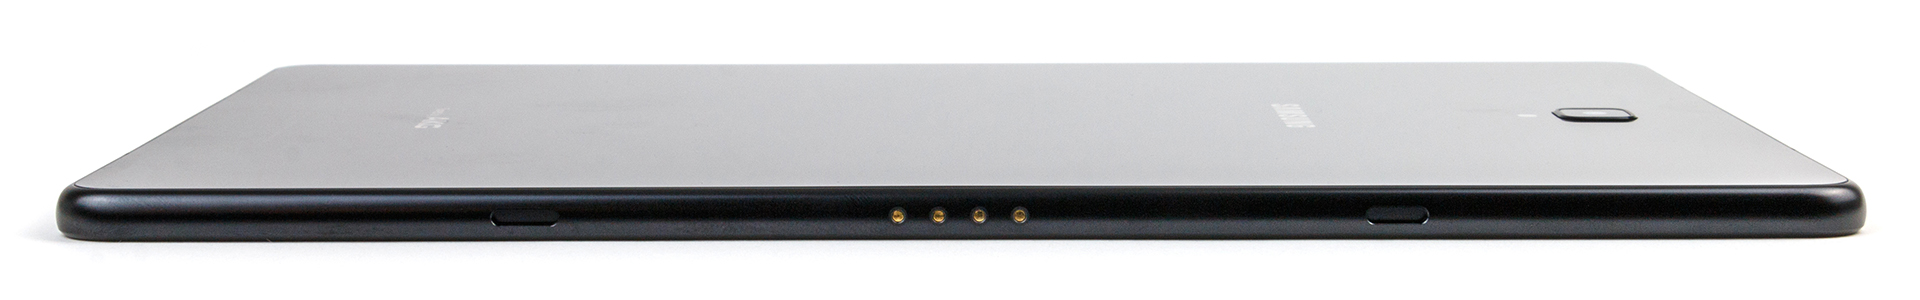
The card slot sits flush with our test device’s frame and contains a microSD card slot; the LTE version has an additional slot for a nano-SIM. The tablet, unfortunately, lacks any certified IP rating against dust or water and while the glass surfaces look stylish, they are prone to picking up fingerprints.

Connectivity
The Tab S4 supports up to 400-GB microSD cards according to Samsung, specifically, SD, SDHC and SDXC cards. We expect that the device also unofficially supports higher capacity cards, which all use the SDXC standard. The Tab S4 can only format microSD cards as external storage and will only save applications to its internal memory by default; this can be changed in Developer Options though. Samsung sells the Tab S4 with 64 GB of internal storage in most regions but also sells a 256 GB Wi-Fi version in the United States for an additional $100.
The tablet has a USB 3.1 Type-C port that supports both USB On-The-Go (OTG) and wired video output. The Tab S4 mainly uses the latter feature with its DeX mode to project onto an external display, but the device also supports wired or wireless display mirroring should you need to use it. The Tab S4 achieves the latter with either Miracast or Wi-Fi Direct.
Samsung has not included an NFC chip, but the company has equipped the device with a Bluetooth 5.0 supporting modem.


Software
Our test device arrived running Android 8.1 Oreo, on top of which Samsung adds its Samsung UI, which we have already seen on other Samsung devices. Disappointingly, our test device currently has June 1, 2018, Android security patches installed, which would be outdated for a device at any price let alone one that costs nearly $650. Samsung has announced that it would update security patches every three months, but the company has not adhered to this promise with our test device at least. We expect to see an Android 9 Pie update sometime next year, but Samsung has not yet communicated its update schedule.
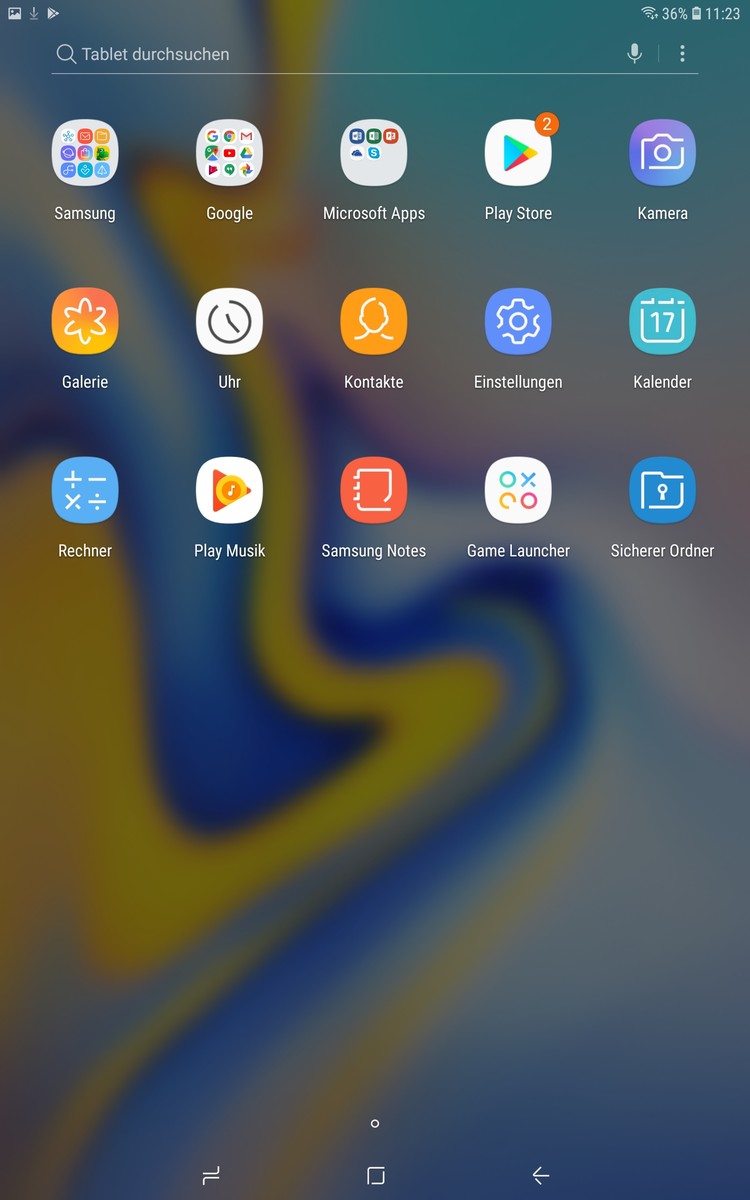
The Tab S4 includes numerous Samsung apps and its Galaxy App Store, but fortunately, there are few preinstalled third-party apps. We could only disable these apps though; we were not able to uninstall them. There are also multi-user account management controls should you wish to give people a dedicated user account.
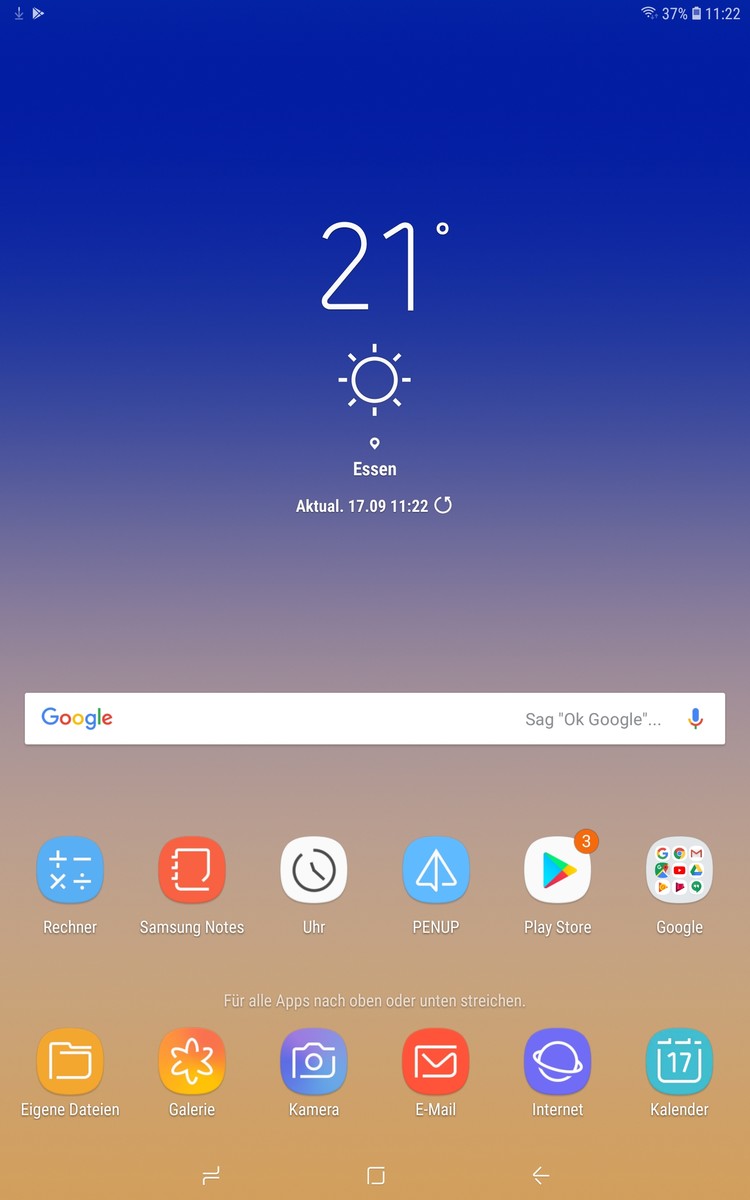
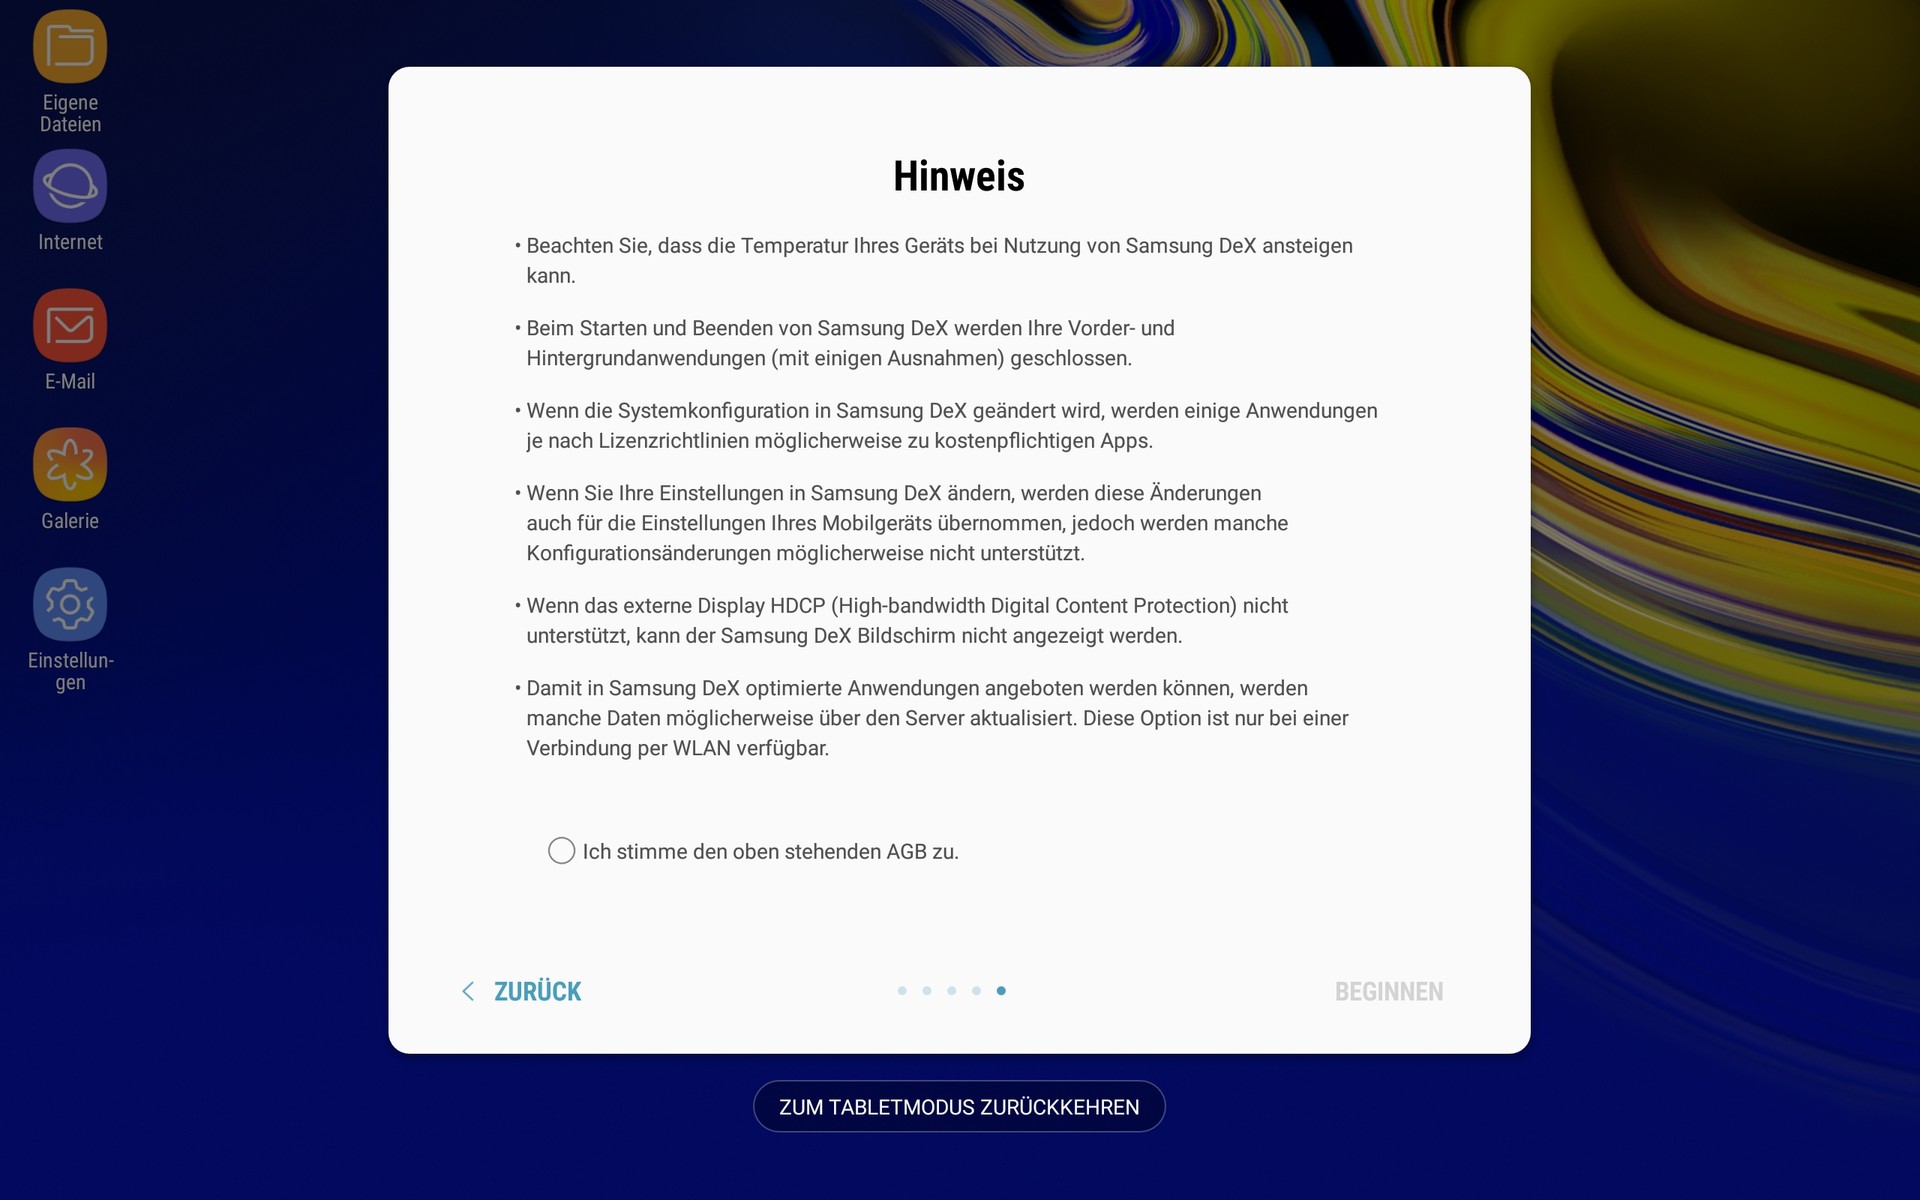
Samsung includes DeX support too, a feature that the company has previously reserved for use with its premium Galaxy smartphones and a DeX pad or a supported docking station. The Tab S4 can simply switch to DeX mode on demand, which gives the tablet a real laptop feeling when used with the optional keyboard. DeX is particularly useful for multitasking as it functions like that of a desktop OS rather than the split-screen mode that Android and iOS currently support.
Unfortunately, DeX does not work with multiple user accounts, while the S Pen is only of limited use. We could take notes with the pen and use it for inputs, but the physical shortcut menu button does not work in DeX mode.
Communication & GPS
The Tab S4 supports all modern Wi-Fi standards including IEEE 802.11 a/b/g/n/ac Wi-Fi and 2.4 or 5.0 GHz networks. The Wi-Fi modem has a 2x2 MIMO antenna, which provides better reception and improved transmission speeds than cheaper modems. Our test device impressed in iperf3 Client transmission Wi-Fi tests when tested with our Linksys EA 8500 reference router, but it fell short of our expectations in the receive speed test. Transmission speeds remained consistent throughout testing though, while our test device also has decent Wi-Fi range. The Tab S4 supports Bluetooth 5.0 as mentioned earlier, and there is an LTE version should you need an Internet connection on the go.
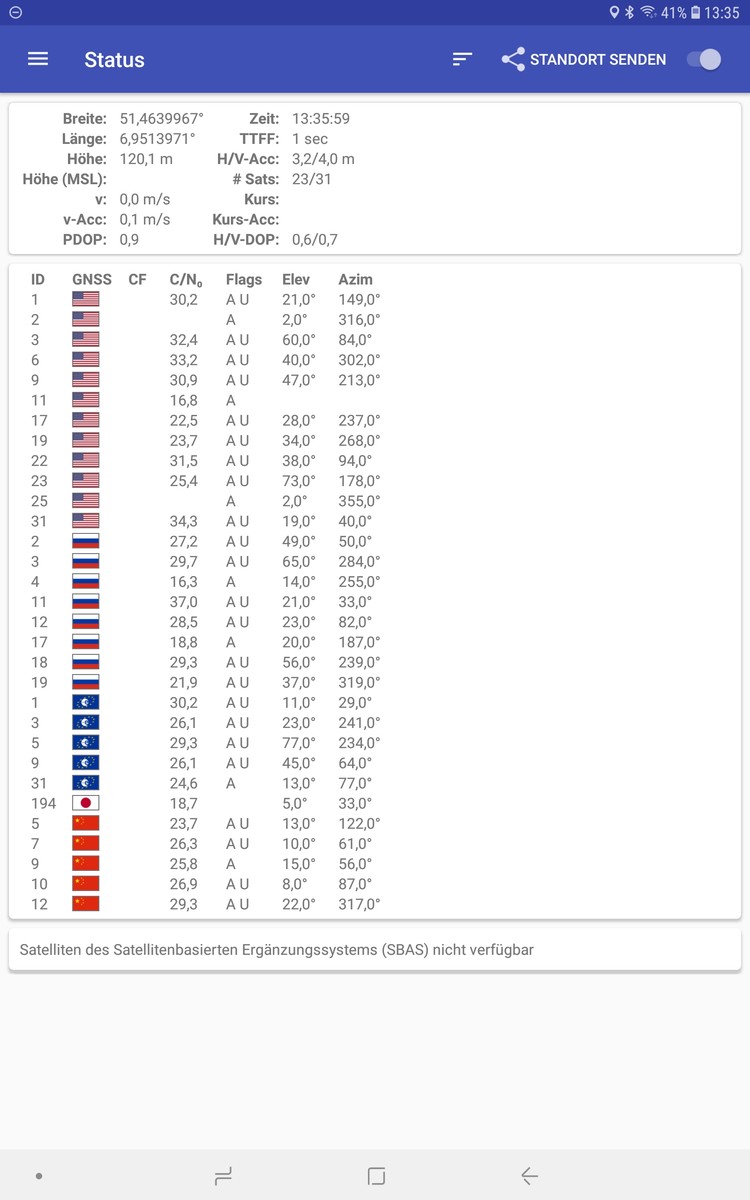
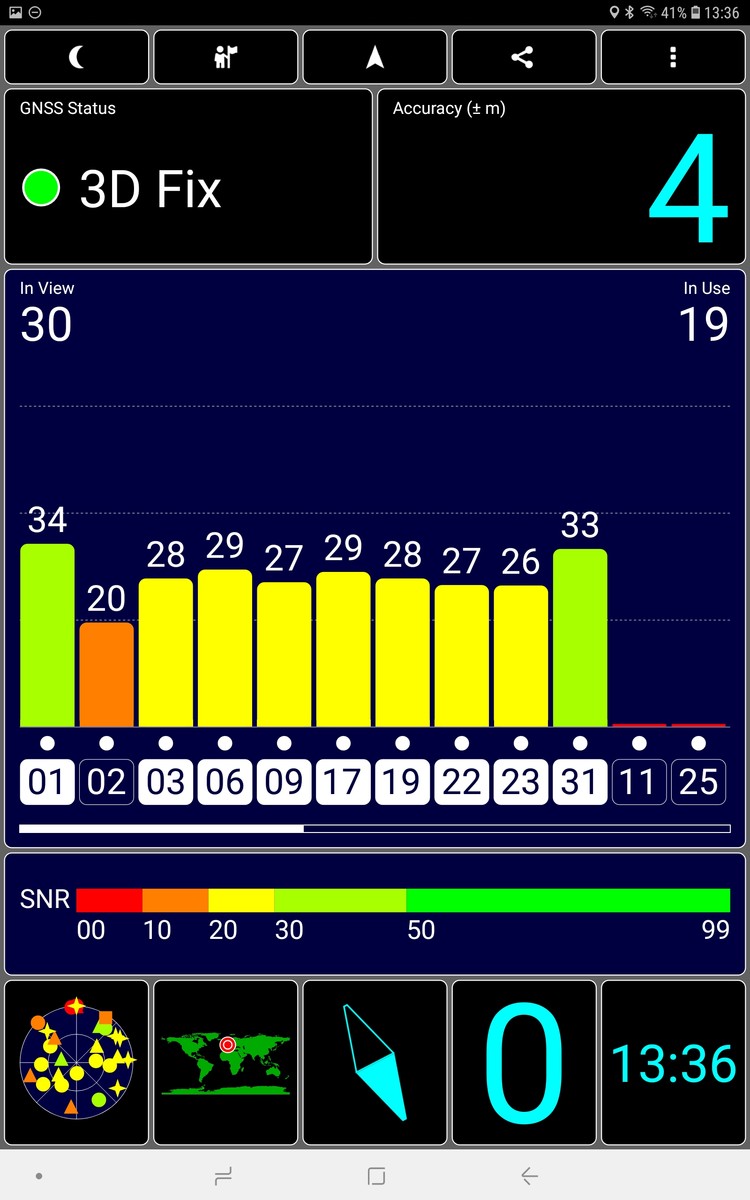
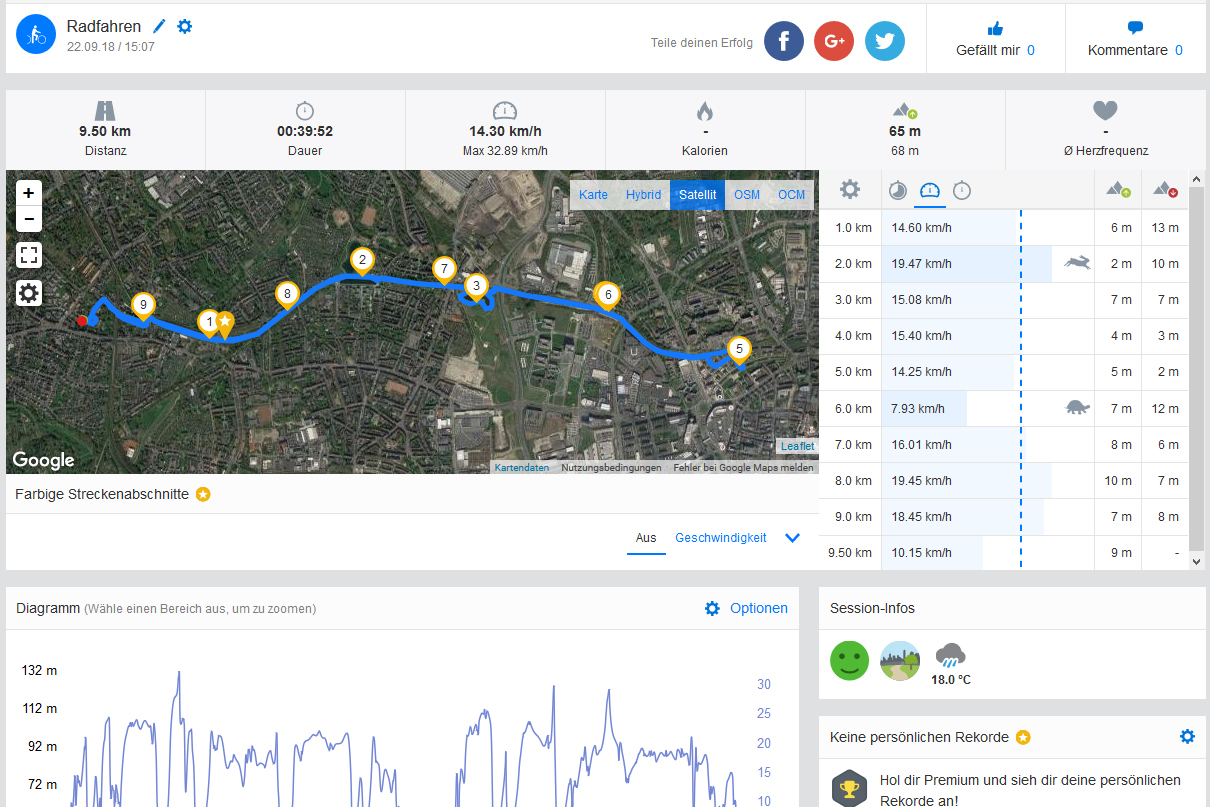
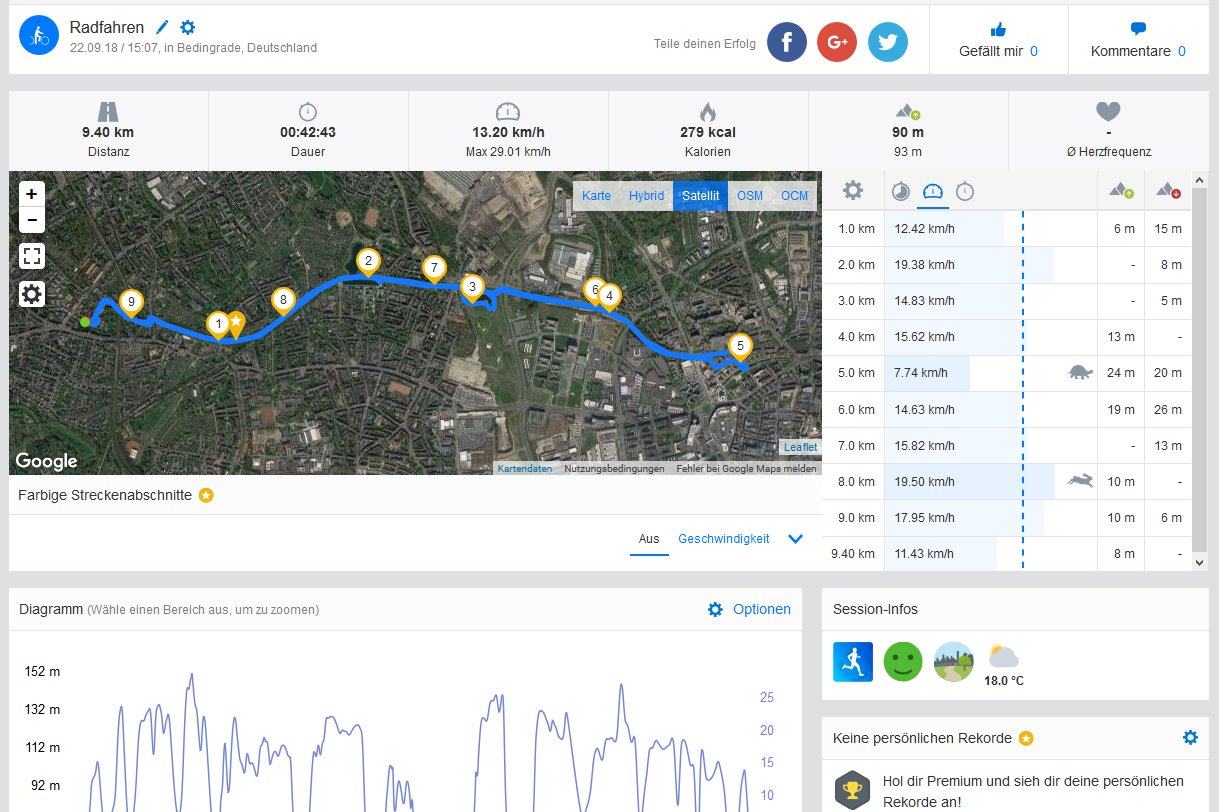
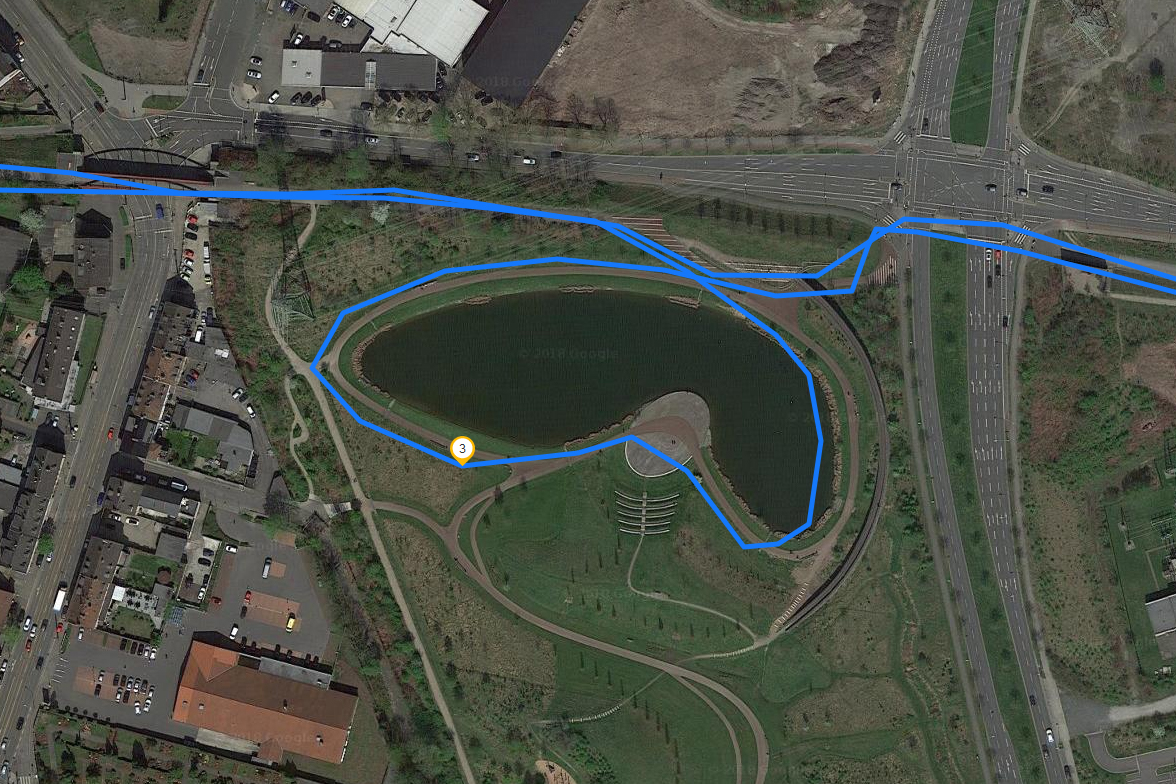
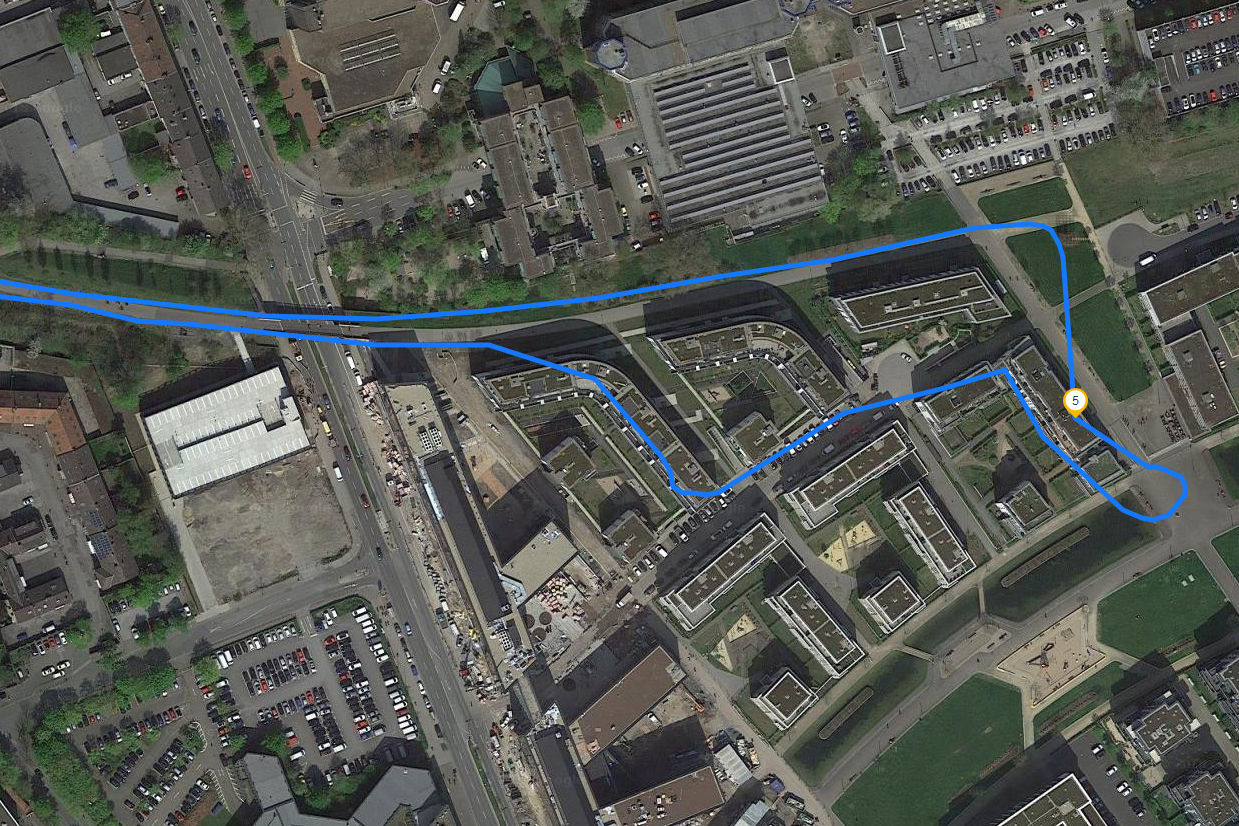
The Tab S4 supports up to five satellite networks and achieved a fast satfix when tested outside, although it needed a few extra seconds to settle on a GPS accuracy of up to four metres. Both the Wi-Fi and LTE versions have a dedicated GPS receiver; some manufacturers reserve GPS functionality for LTE versions of their tablets.
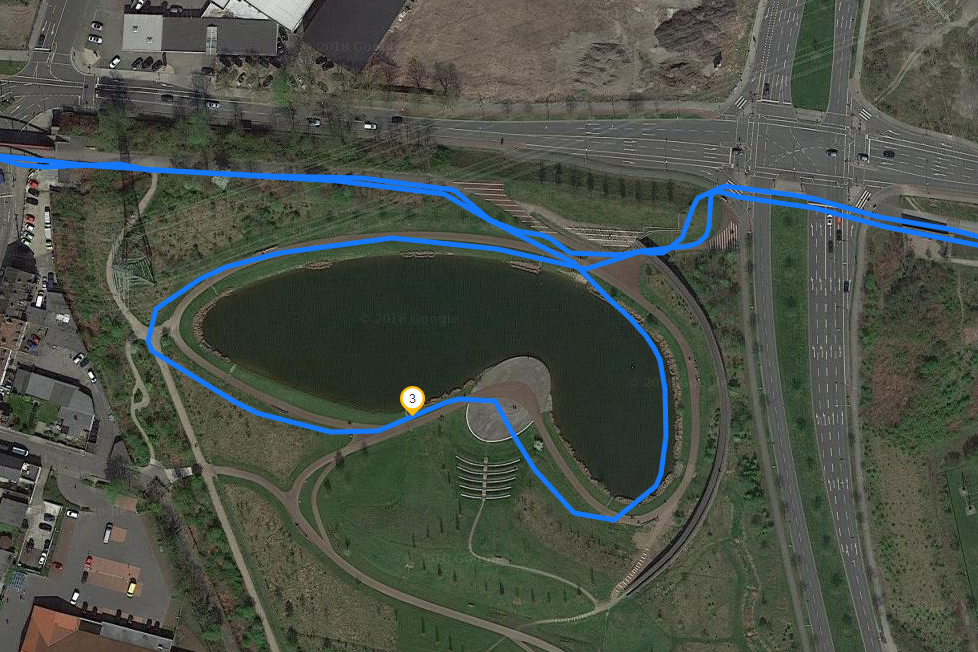
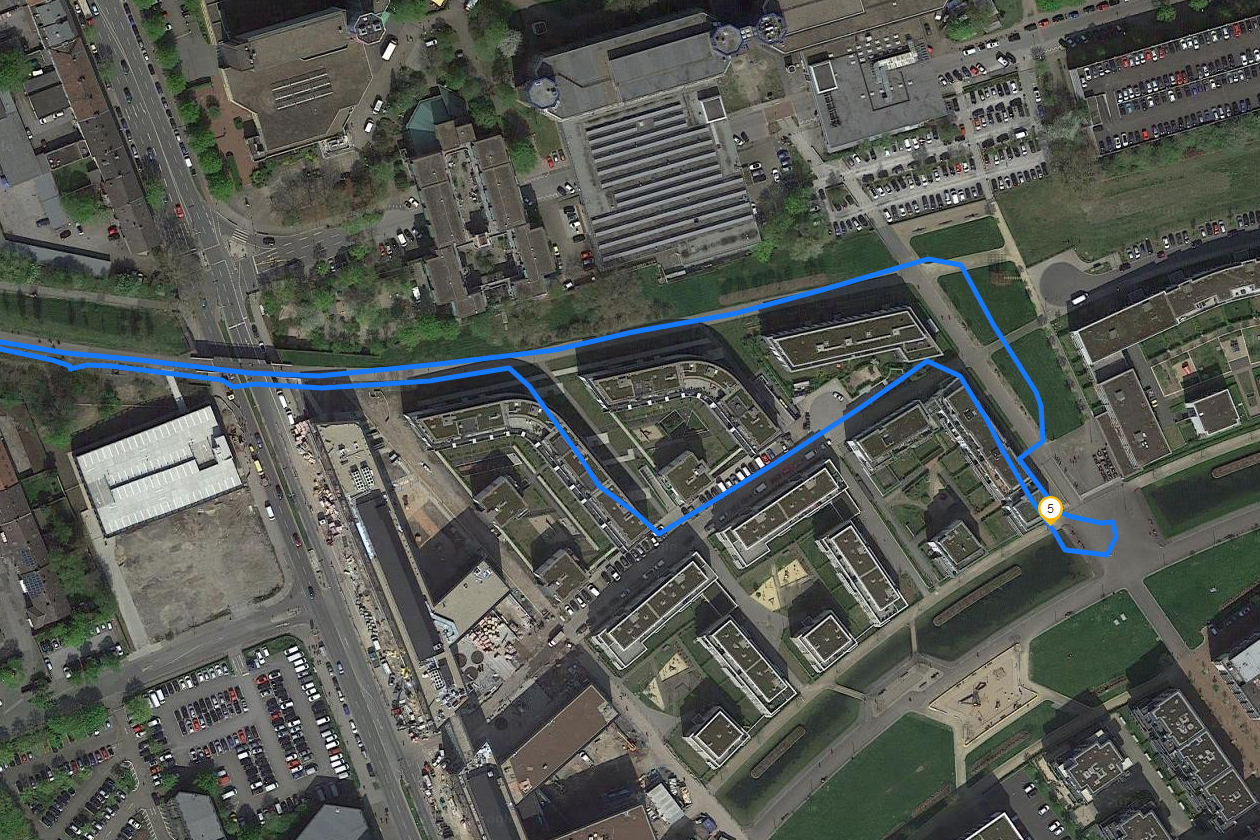
We also took the Tab S4 on a compulsory bike ride to compare its location accuracy against a Garmin Edge 500. Our test device claimed that we covered 9.40 km (5.84 miles) on our route, which is 100 metres (~109 yards) short of what the Garmin recorded us travelling. This is a decent result for the Tab S4 and demonstrates that it is accurate enough for most navigation tasks.
Cameras
The Tab S4 has rather basic cameras that are not befitting of a premium device. The cameras are disappointing compared to the sensors that Samsung used in either the Galaxy S8 or S9.
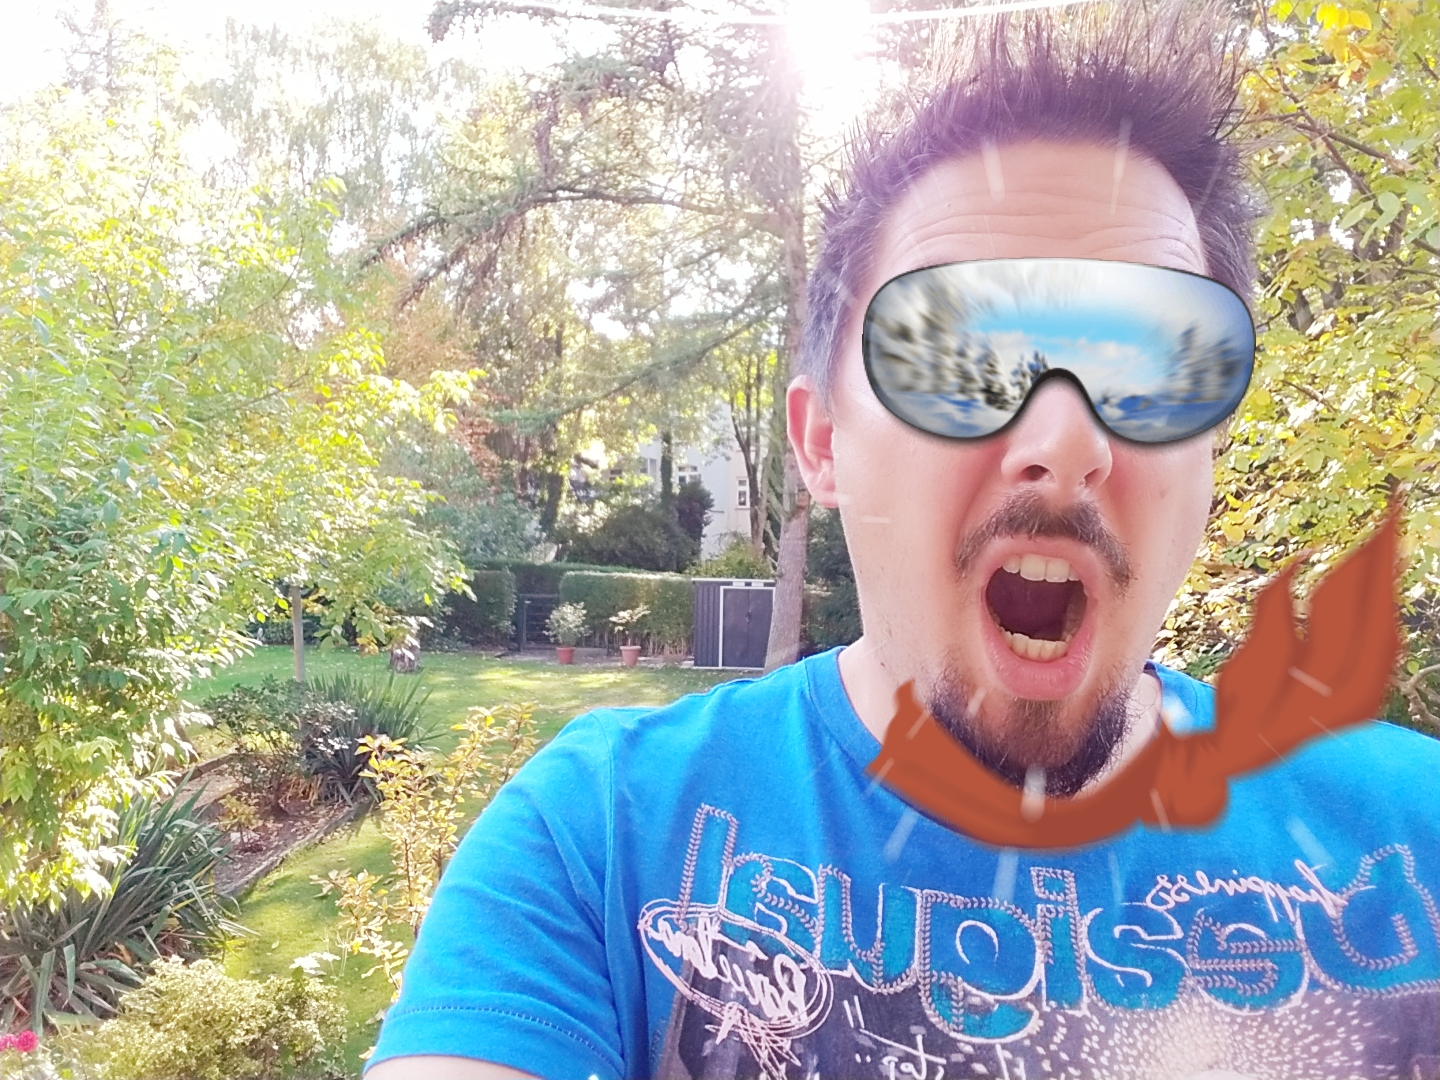
The front-facing camera is an 8 MP Sony IMX320 sensor. The camera uses fixed focus and produces photos that look washed out. The default camera supports stickers and a beauty mode though, which helps to make selfies look more interesting. The front-facing camera can record videos in up to Full HD too, but the sensor lacks image-stabilisation.
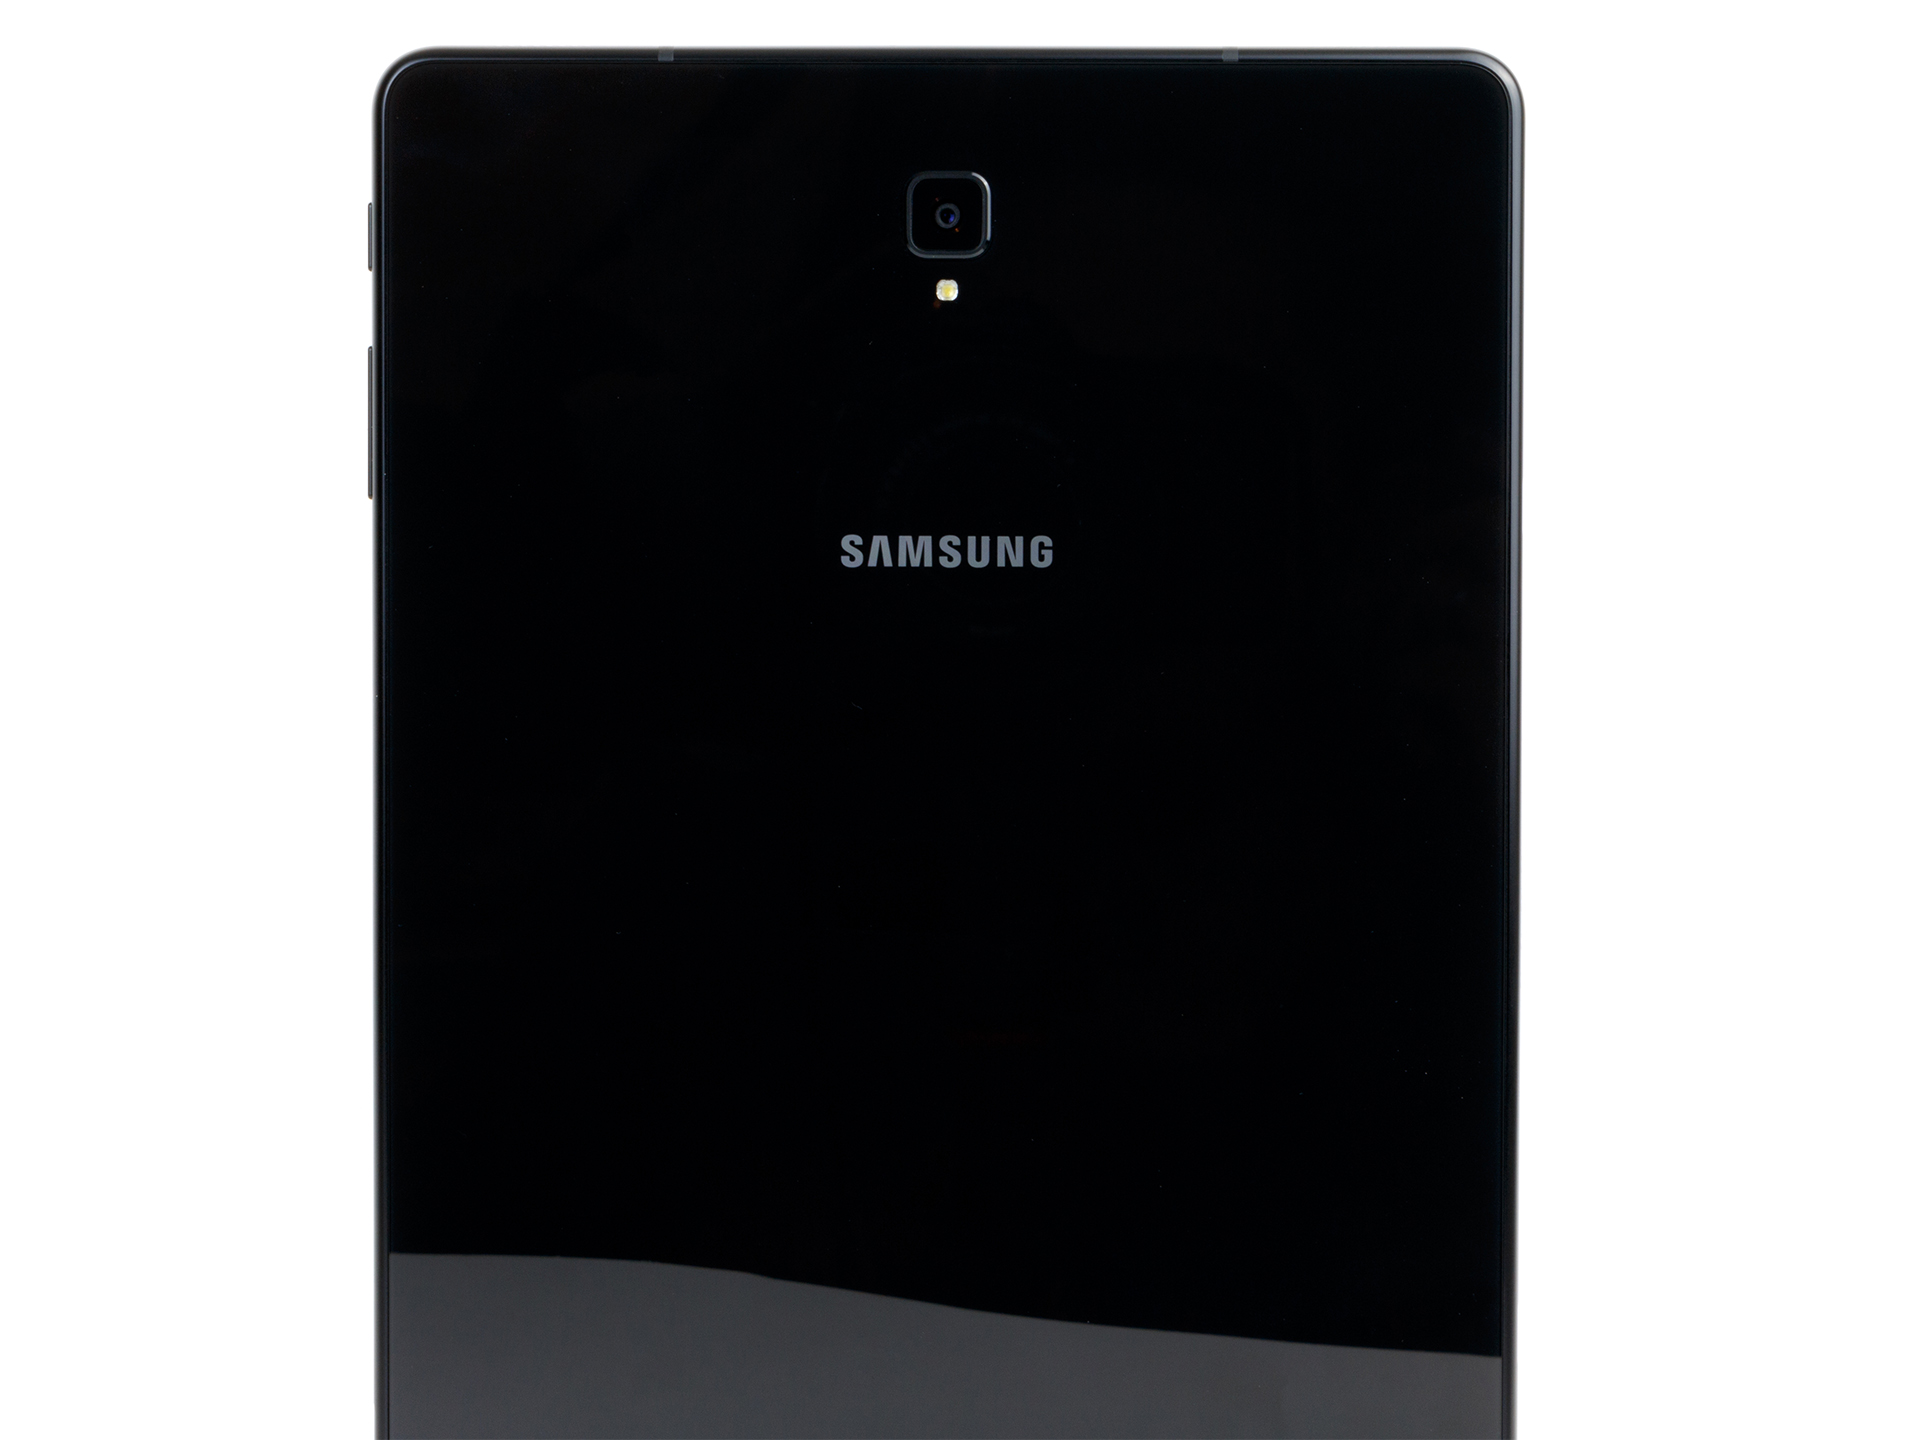
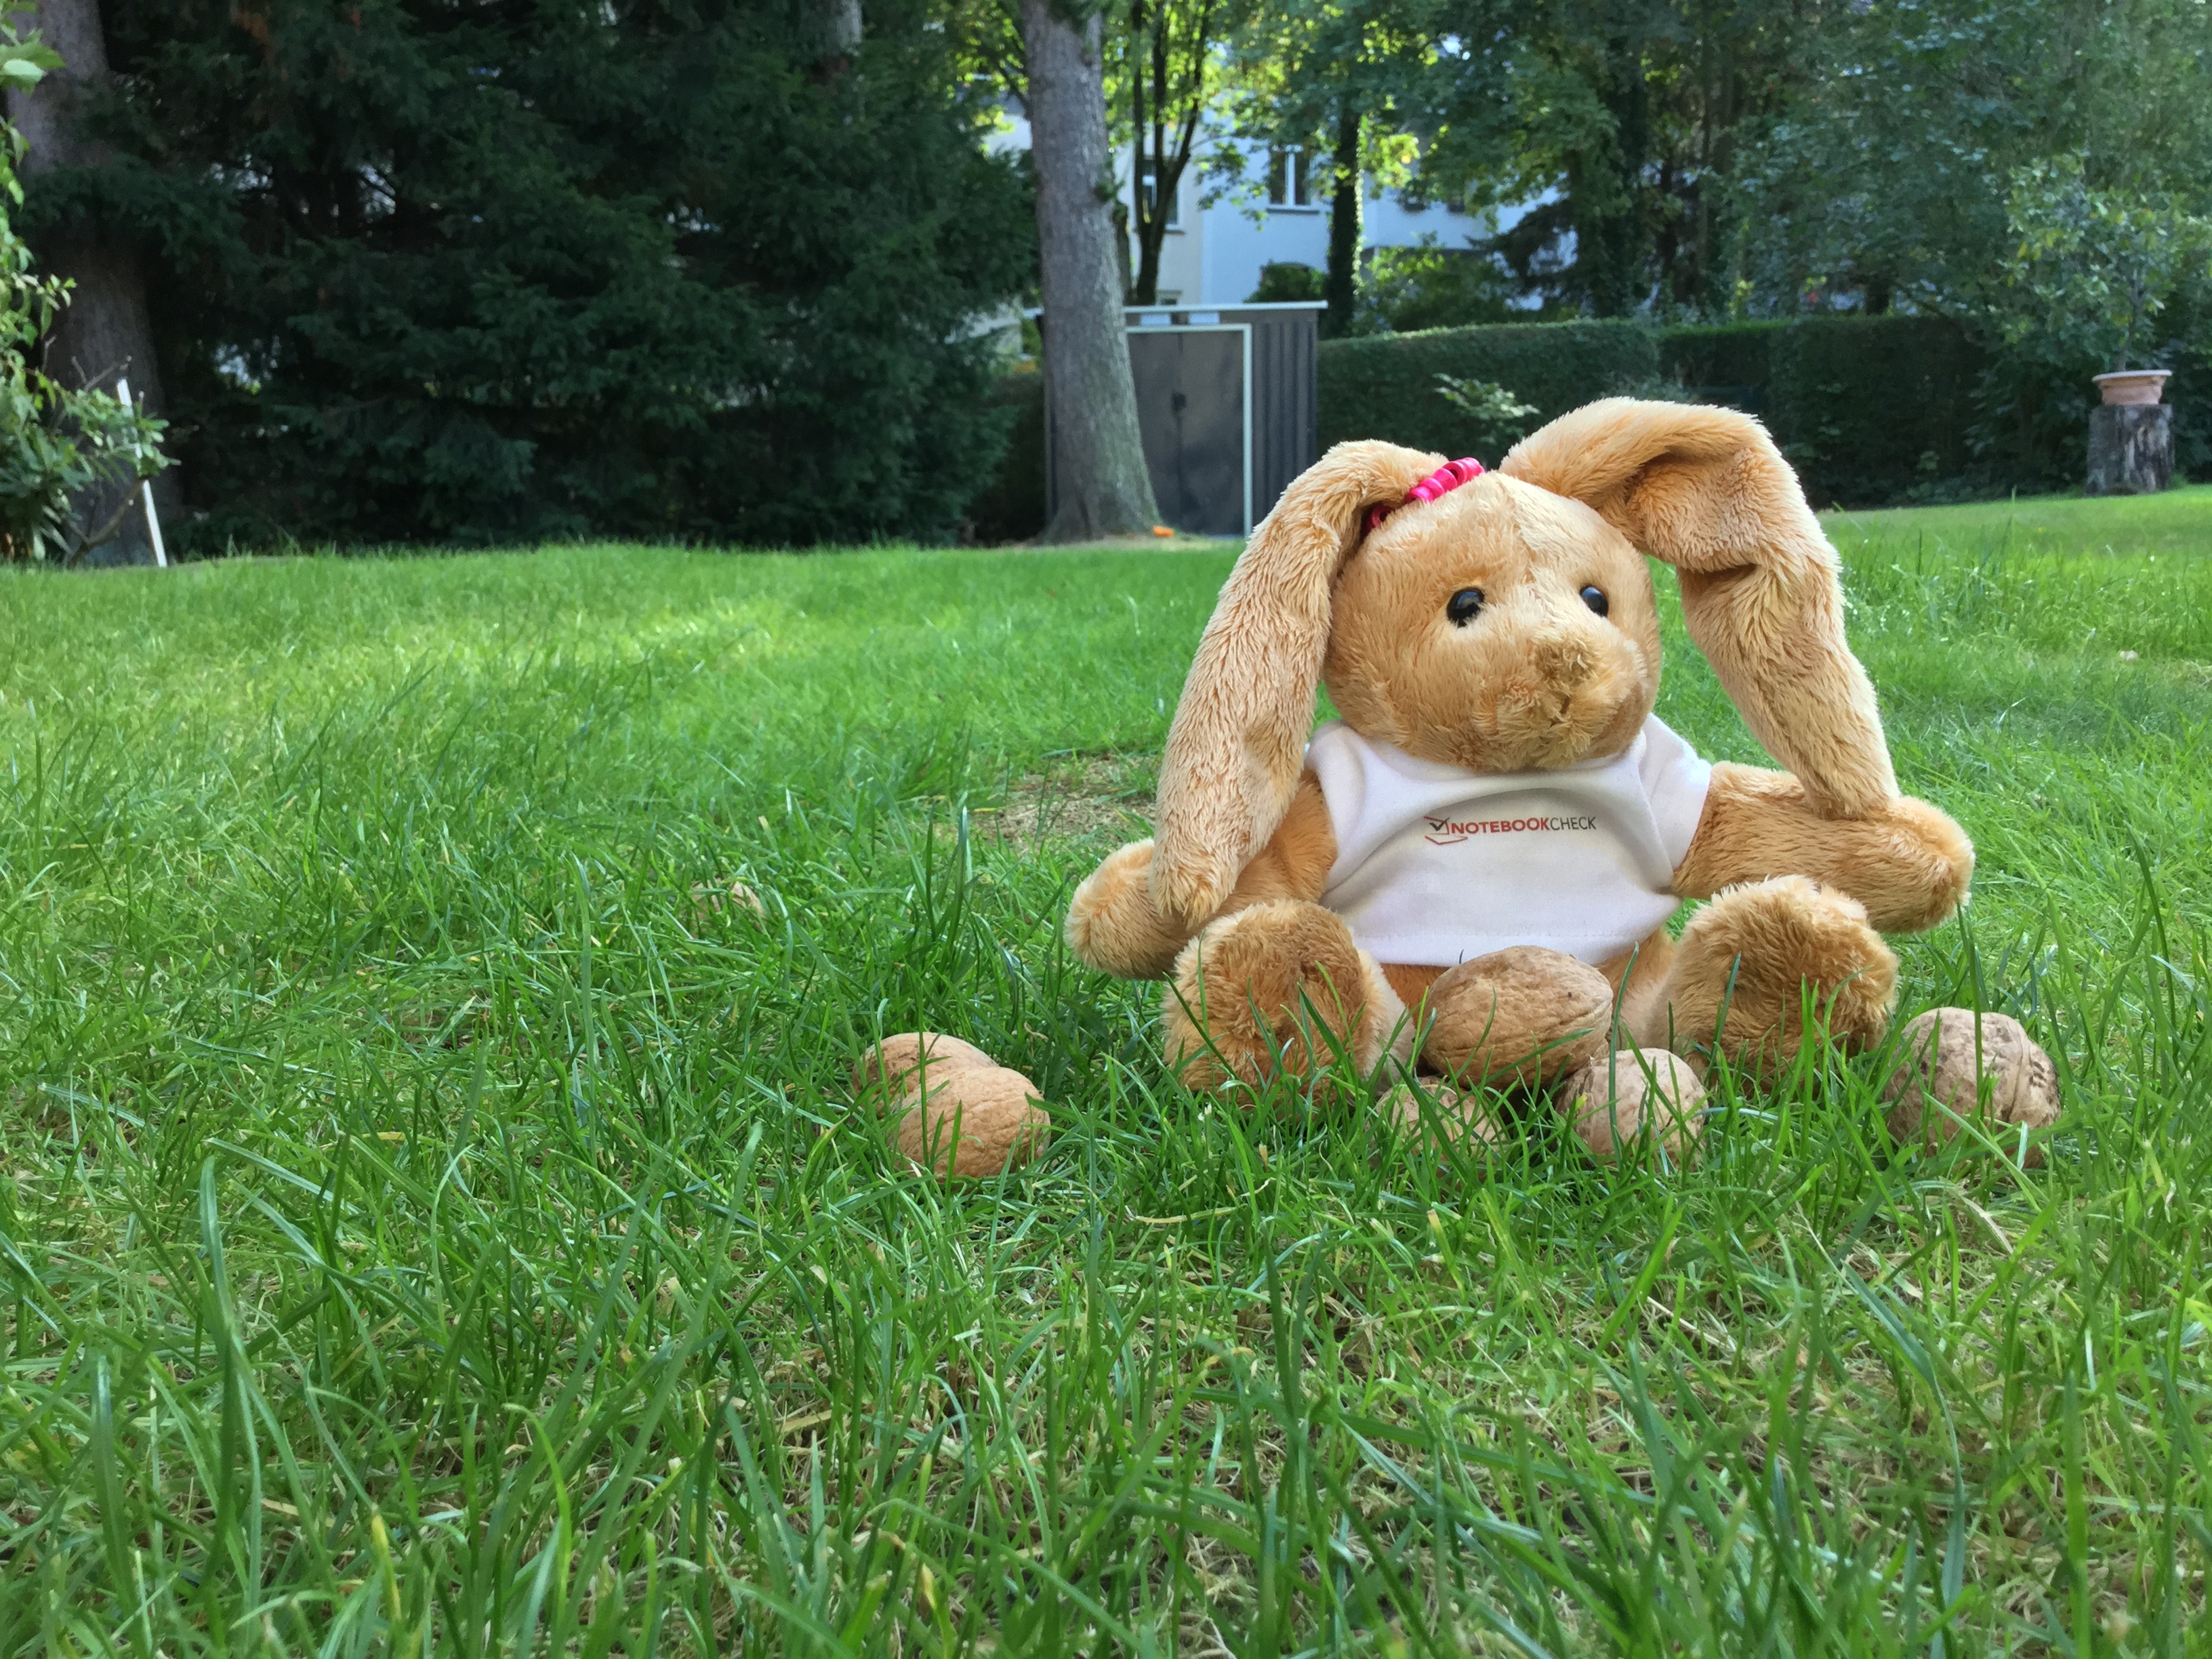
The rear-facing camera is a 13 MP Samsung S5K2L2SA sensor. The camera is nominally the same as the one in the Galaxy S8, but its image quality is considerably worse. Photos have only mediocre dynamic range, while chromatic aberrations are quickly visible upon looking closely at photos. The camera also performs poorly in low-light conditions and can only produce photos that are overwhelmed by image noise.
The main camera can also record videos in up to Ultra HD at 30 FPS and makes use of electronic image stabilisation (EIS) to stabilise videos. We could only shoot videos for up to 10 minutes at these settings though, while image quality is only decent at best in bright ambient light.


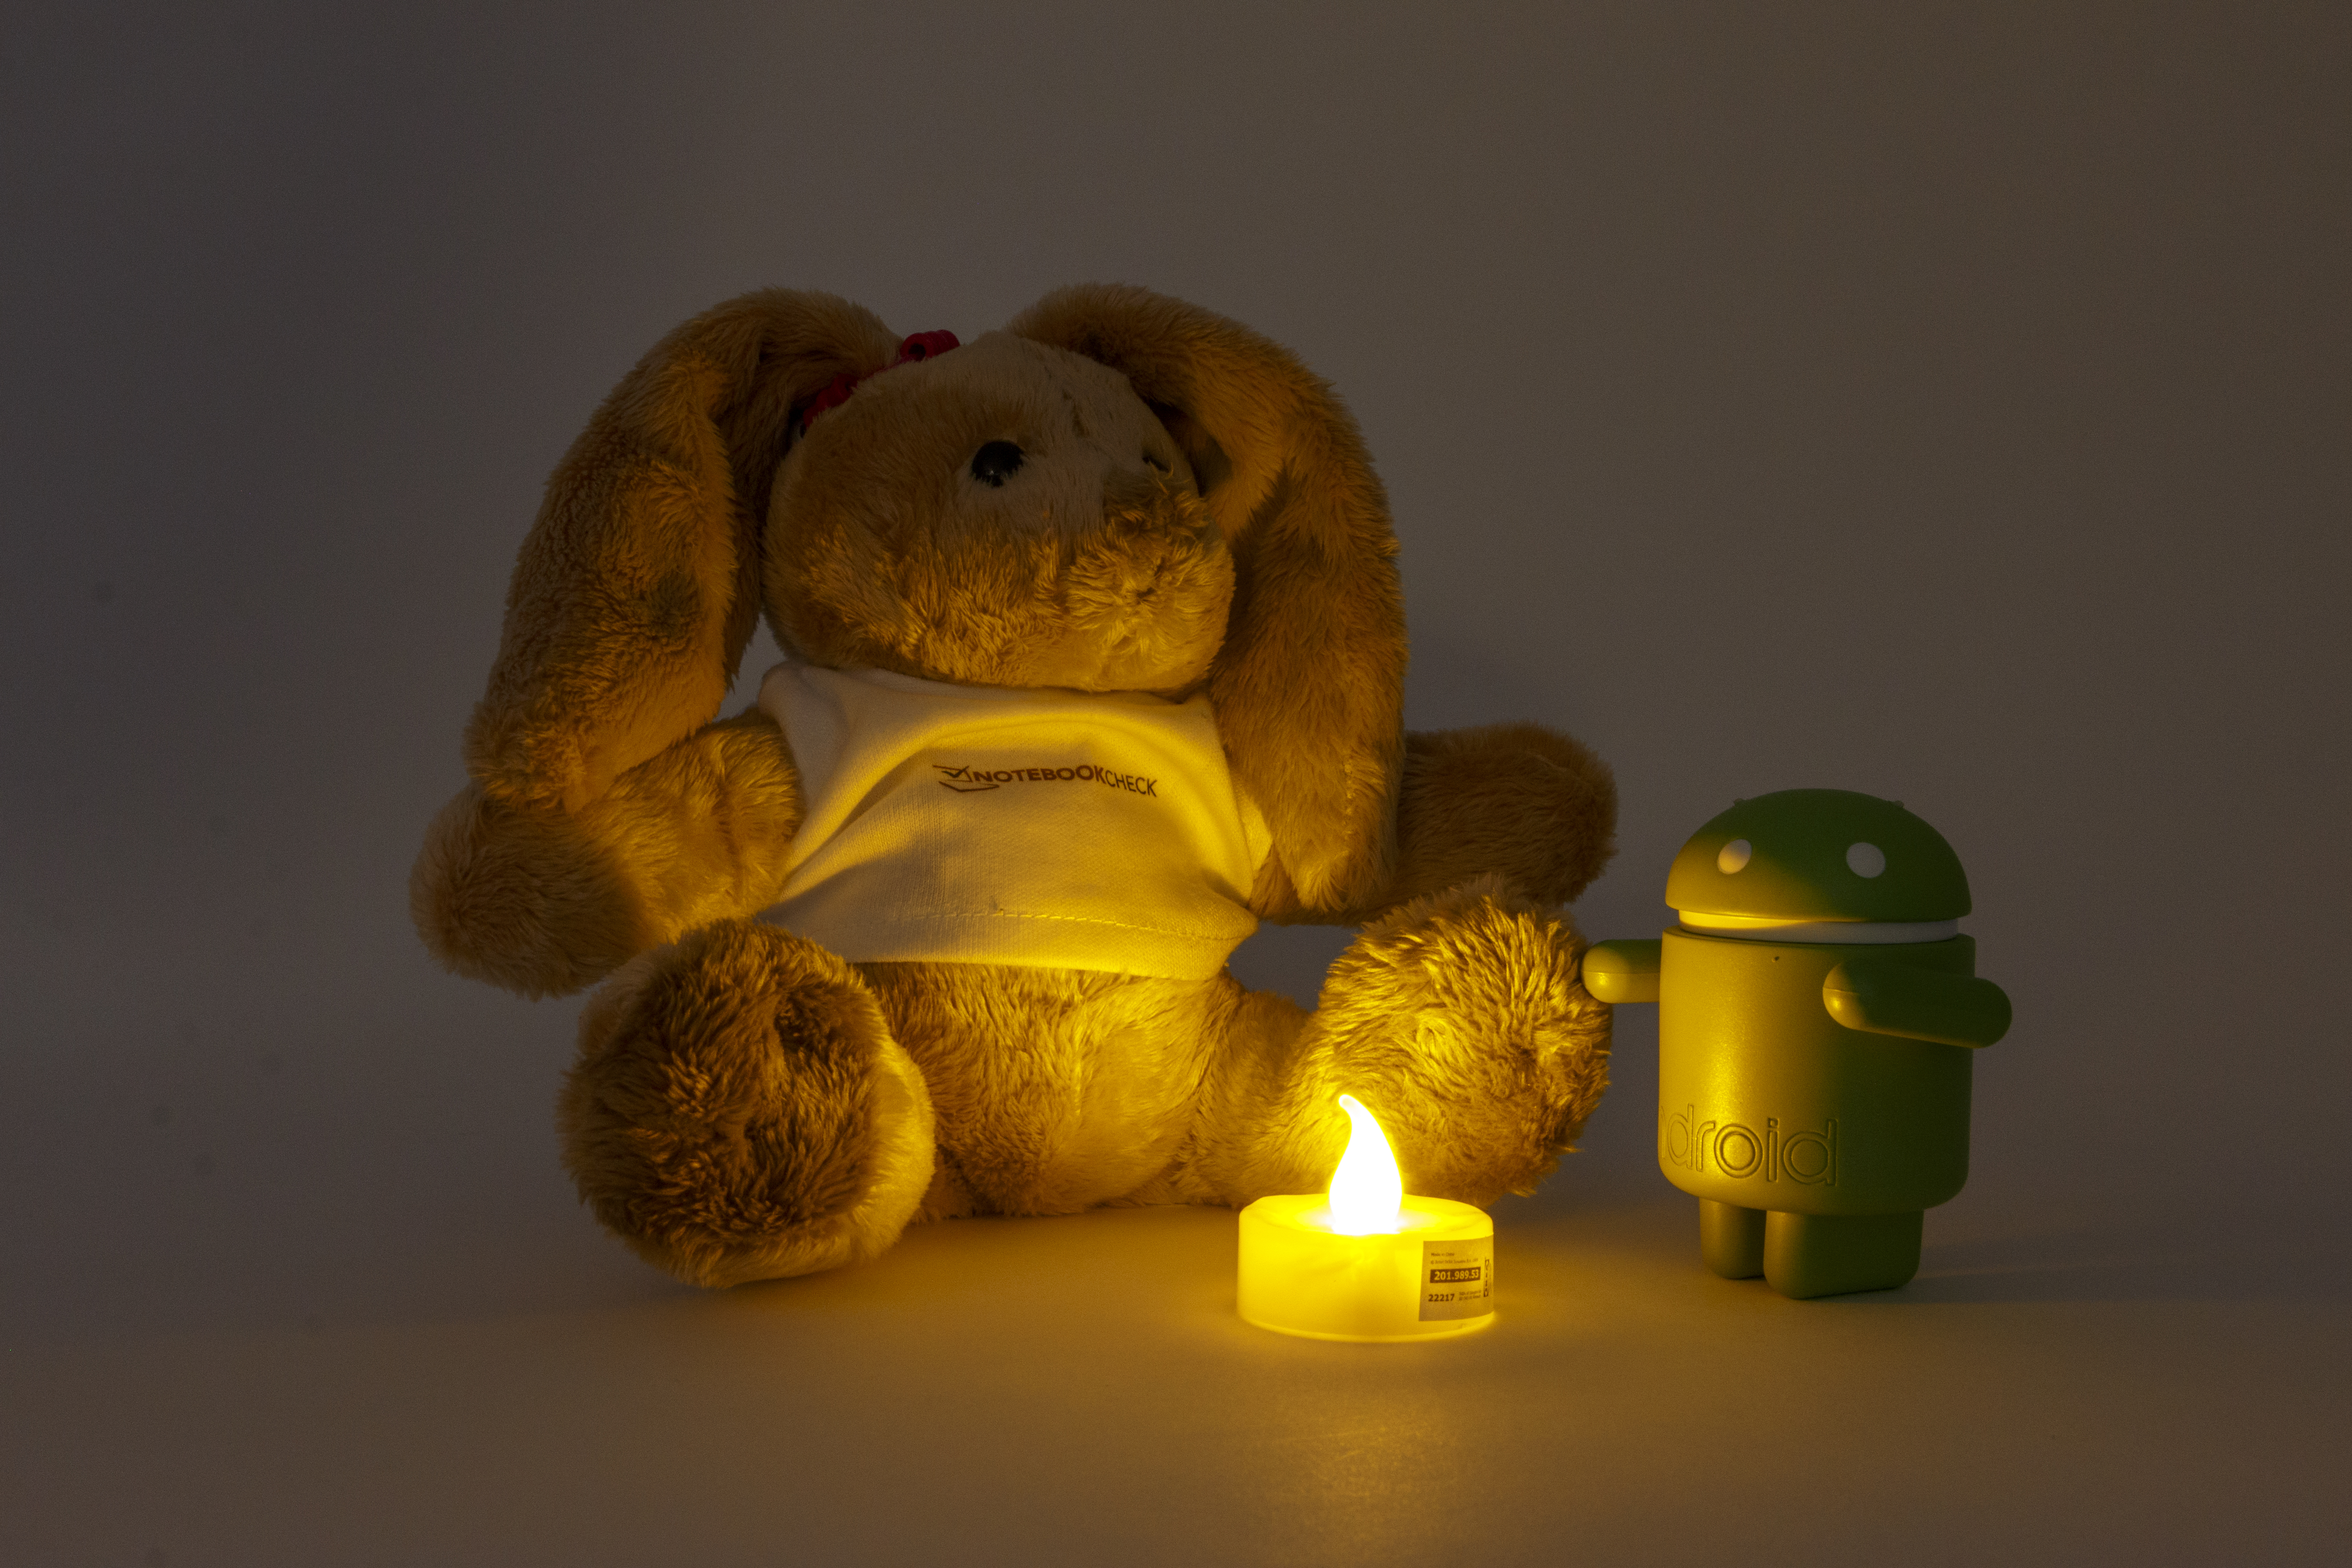
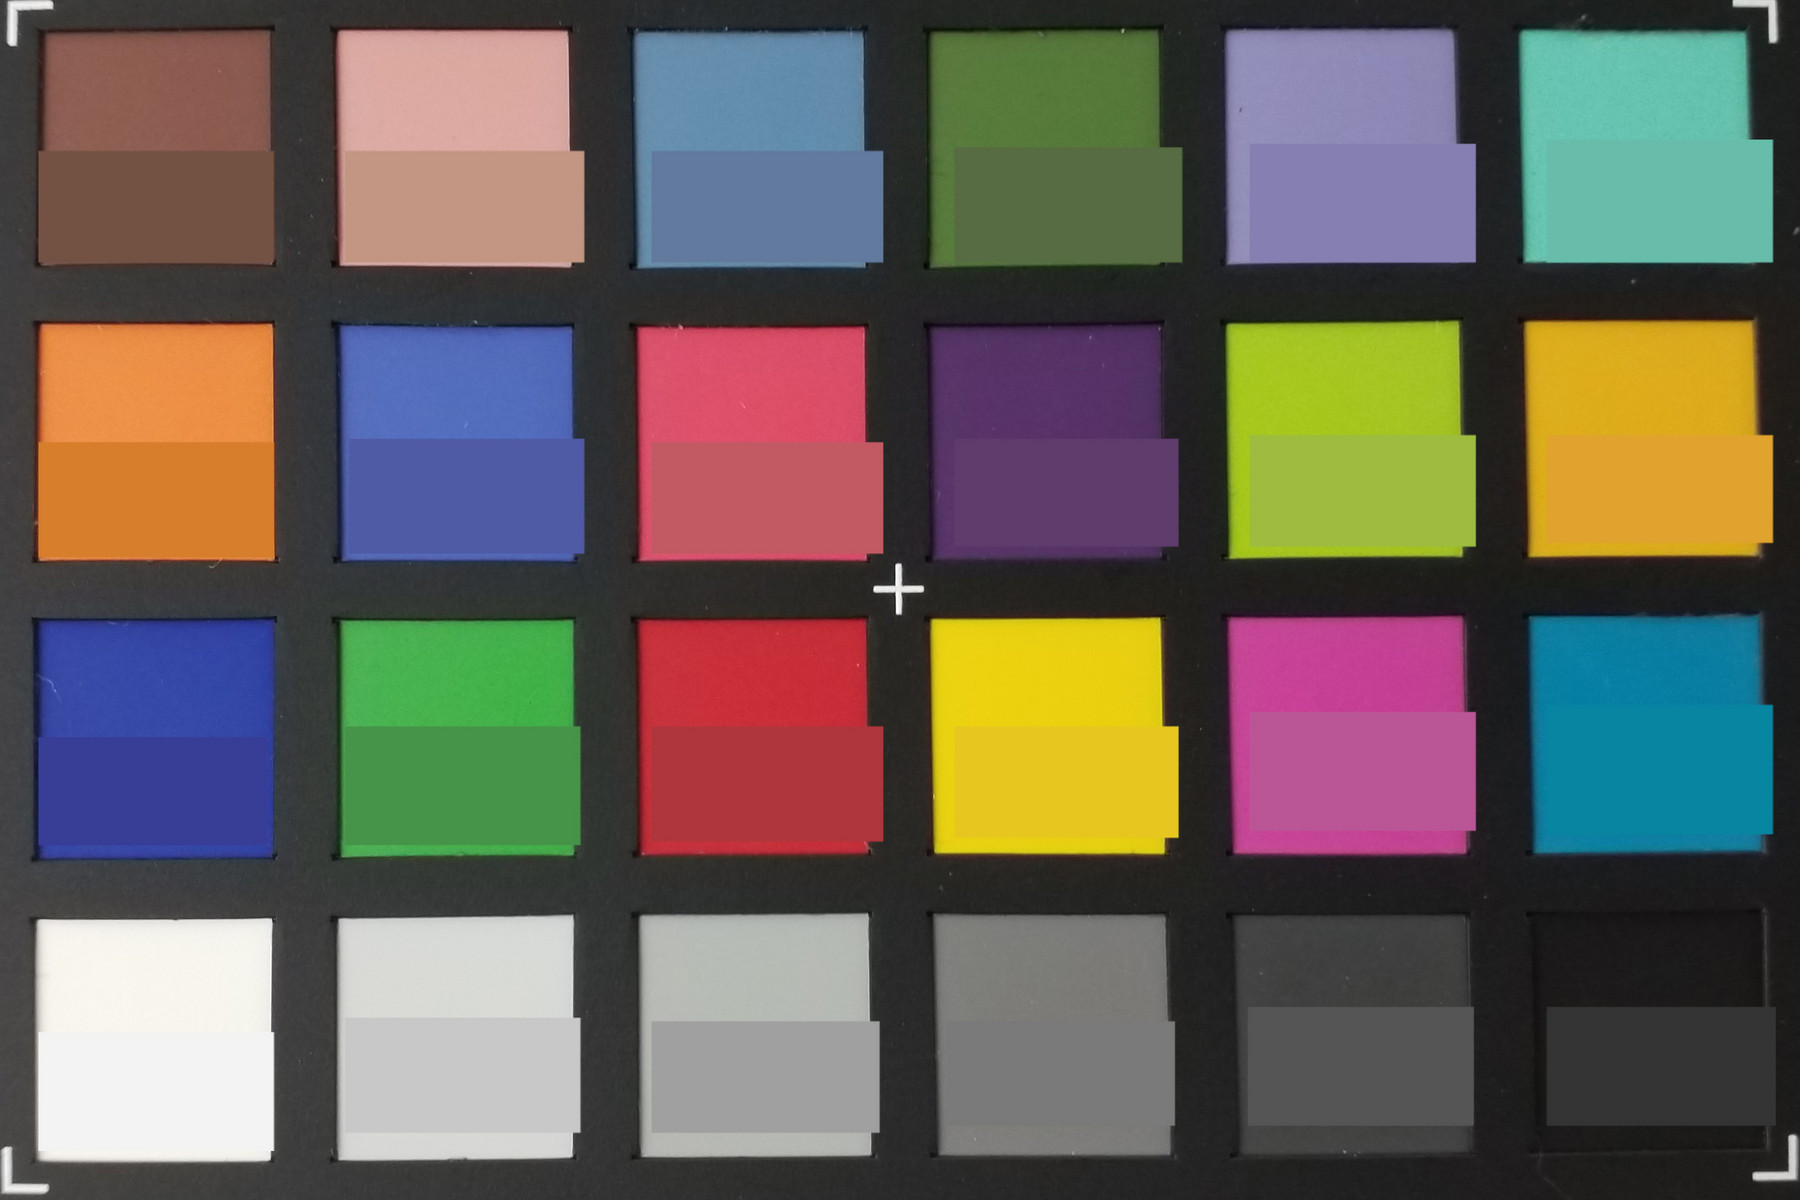
We subjected our test device to further camera tests under controlled lighting conditions for a fairer comparison against other devices. As demonstrated by the chart to the right, brown tones have a reddish tint to them while blue tones are noticeably lighter than the reference colour. Overall though, the main camera reproduces colours accurately and has a pleasing white balance.
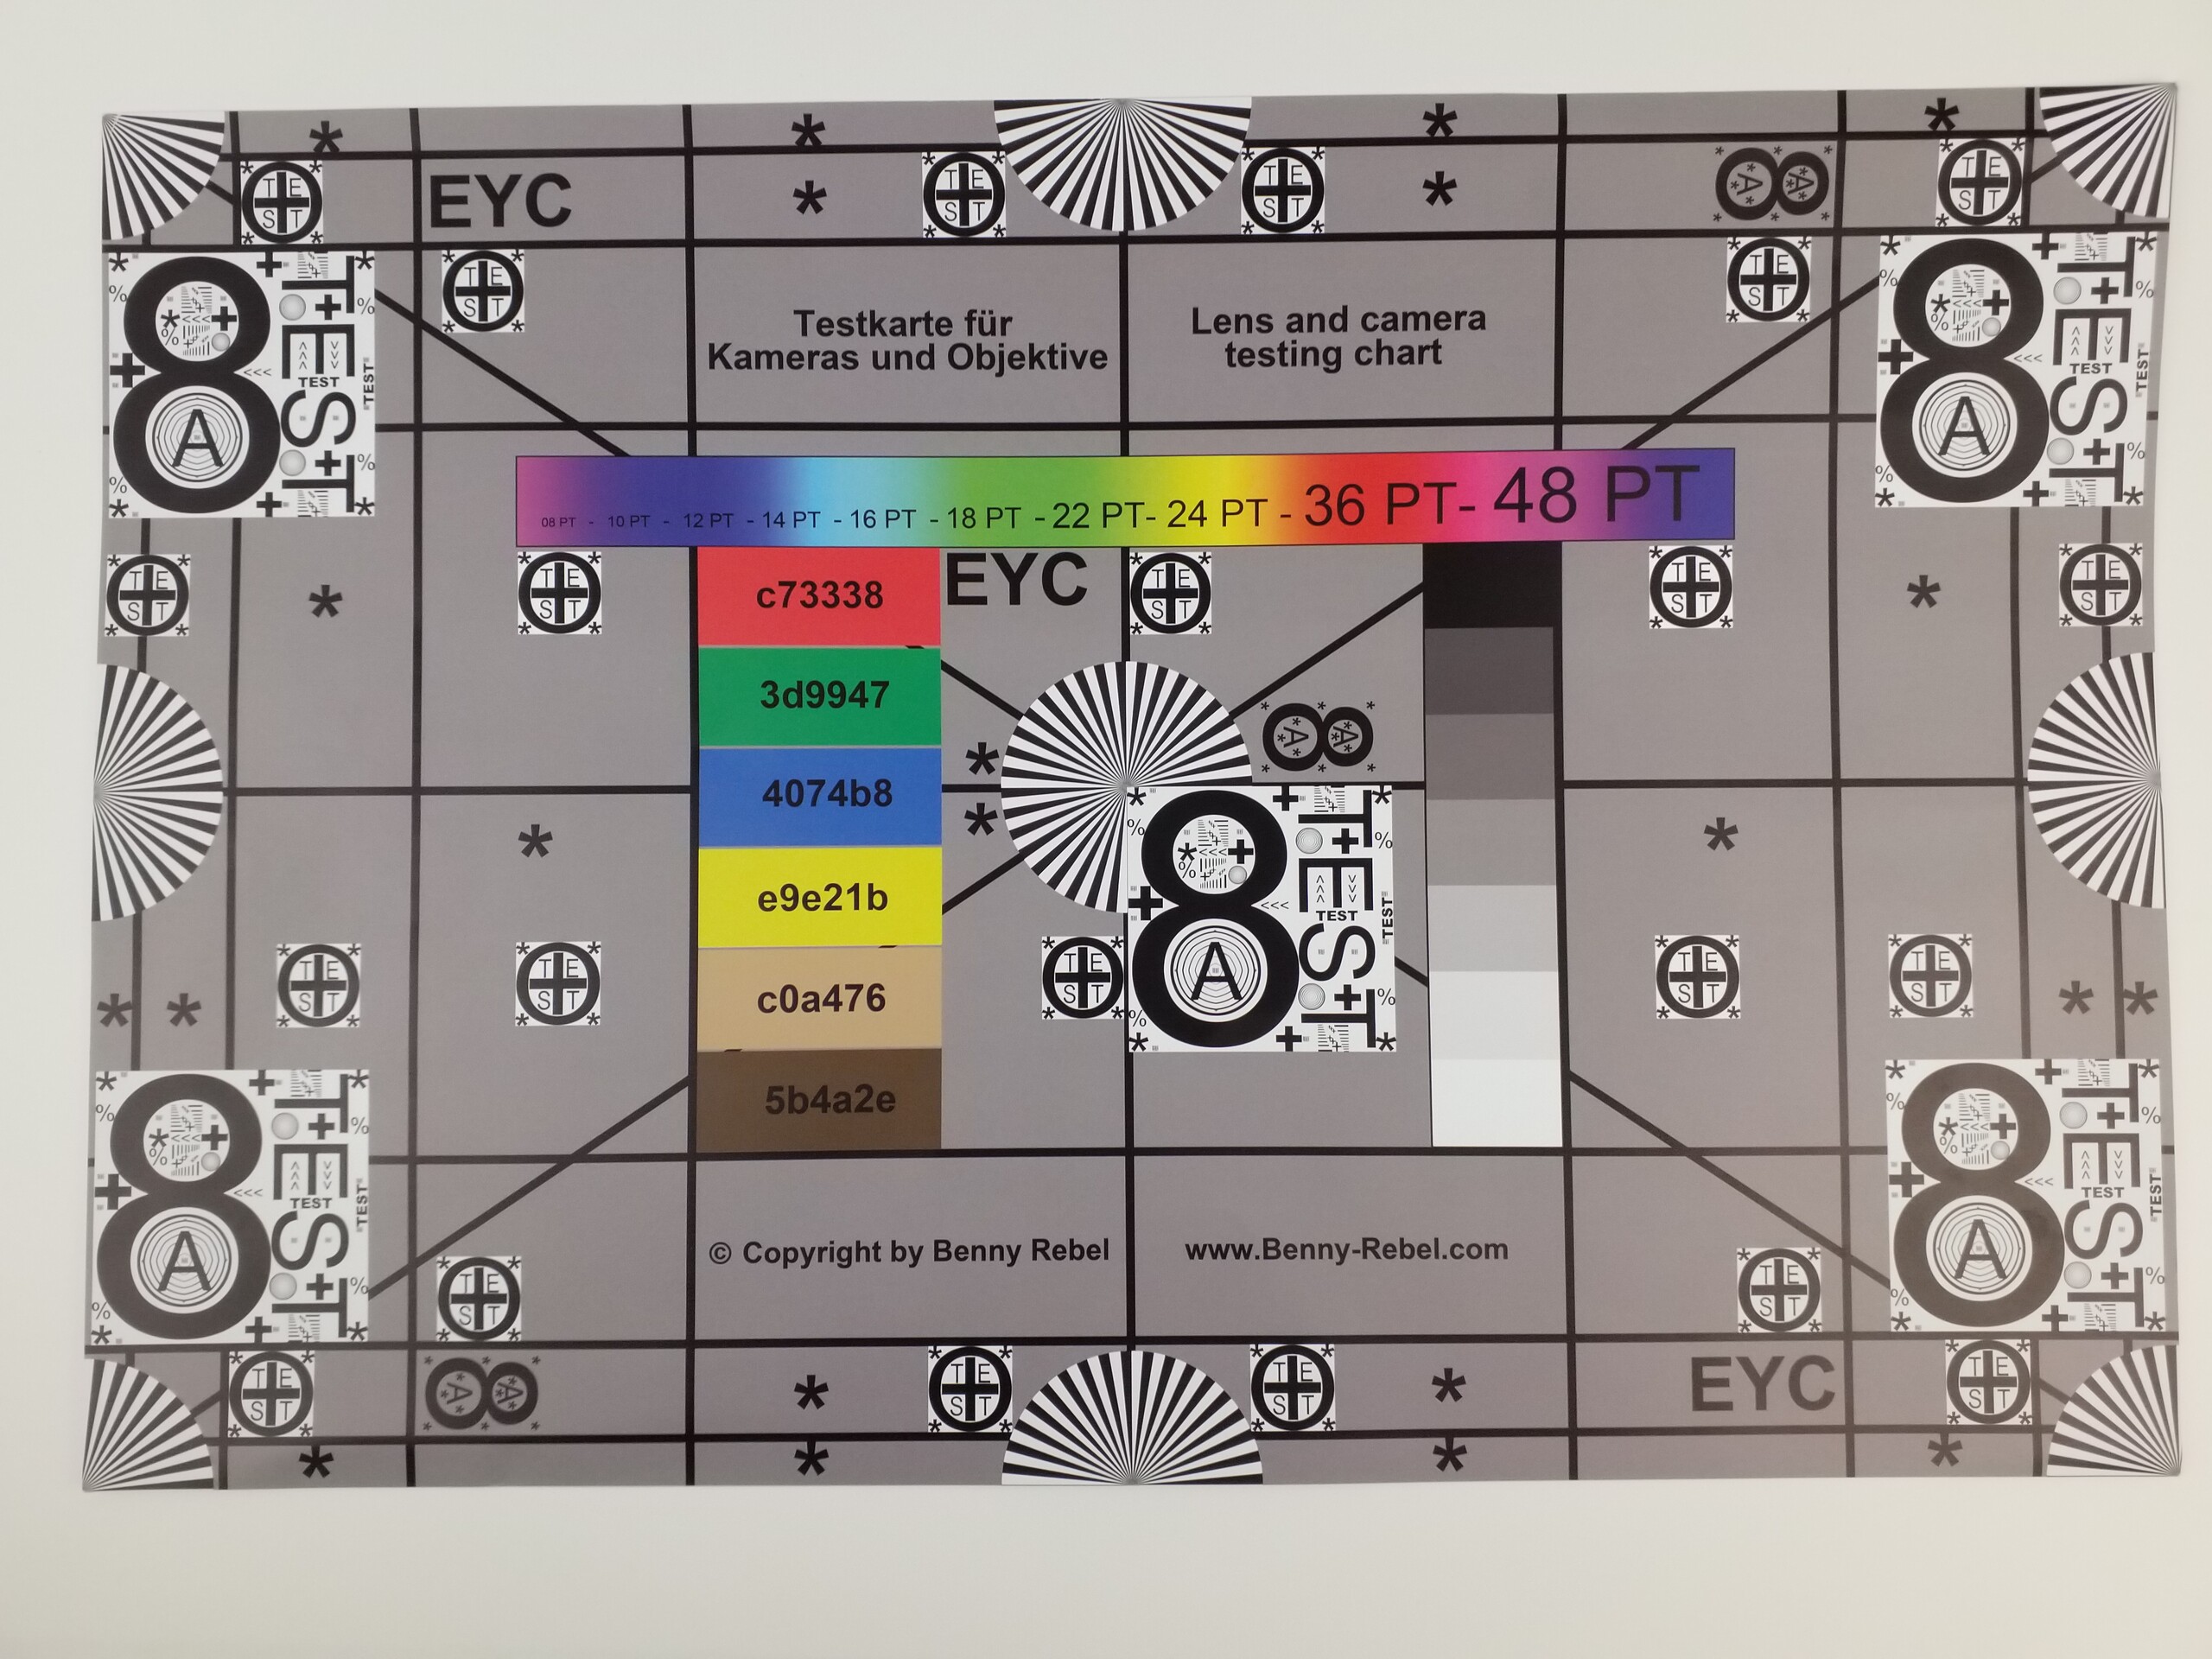
However, our test device performed noticeably worse when capturing our test chart. The main camera struggles to capture fine details even at the centre of the image while distorting the edges of lines and structures at the sides of our test chart.

Accessories & Warranty
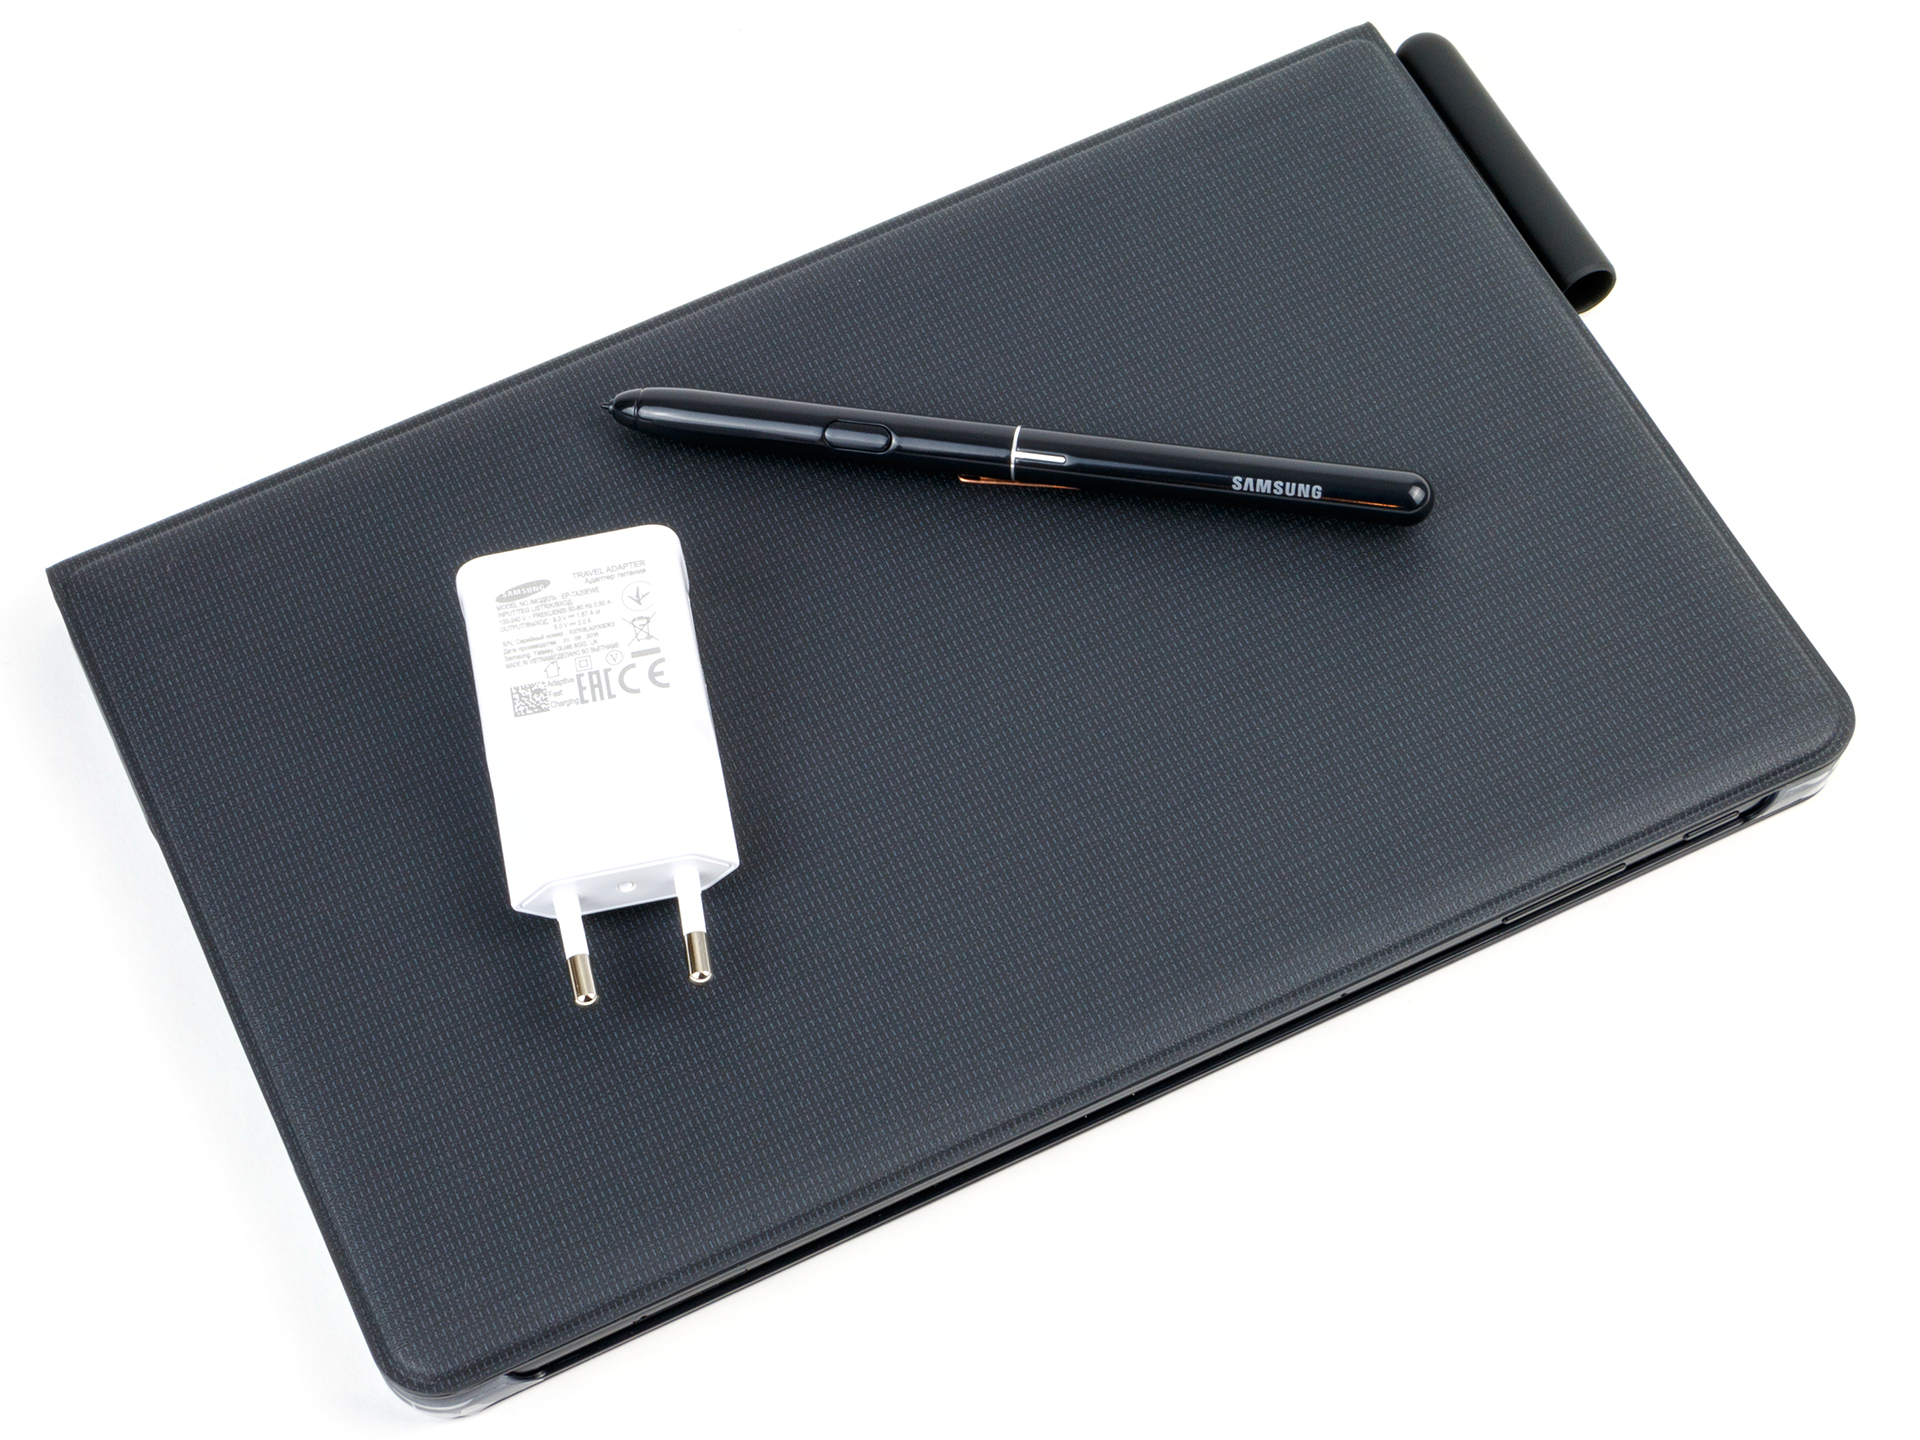
The Tab S4 comes with a modular quick charger (9.0 V/1.67 A, 5.0 V/2.0 A), a USB Type-A to Type-C cable, a SIM tool, an S Pen with replacement nibs and a tool with which to extract them. Our test device also came with several warranty leaflets, safety instructions and a quick-start guide.
The tablet comes with a 24-month manufacturer’s warranty, but this cannot be expanded with Samsung Care + like you could with its predecessor. Please see our Guarantees, Return policies and Warranties FAQ for country-specific information.
Samsung also sells several Tab S4 specific accessories including a keyboard cover ($149.99/£119) and a Pogo Charging Dock ($59.99/£49). The full list of accessories is available on the Samsung website.
Input Devices & Operation
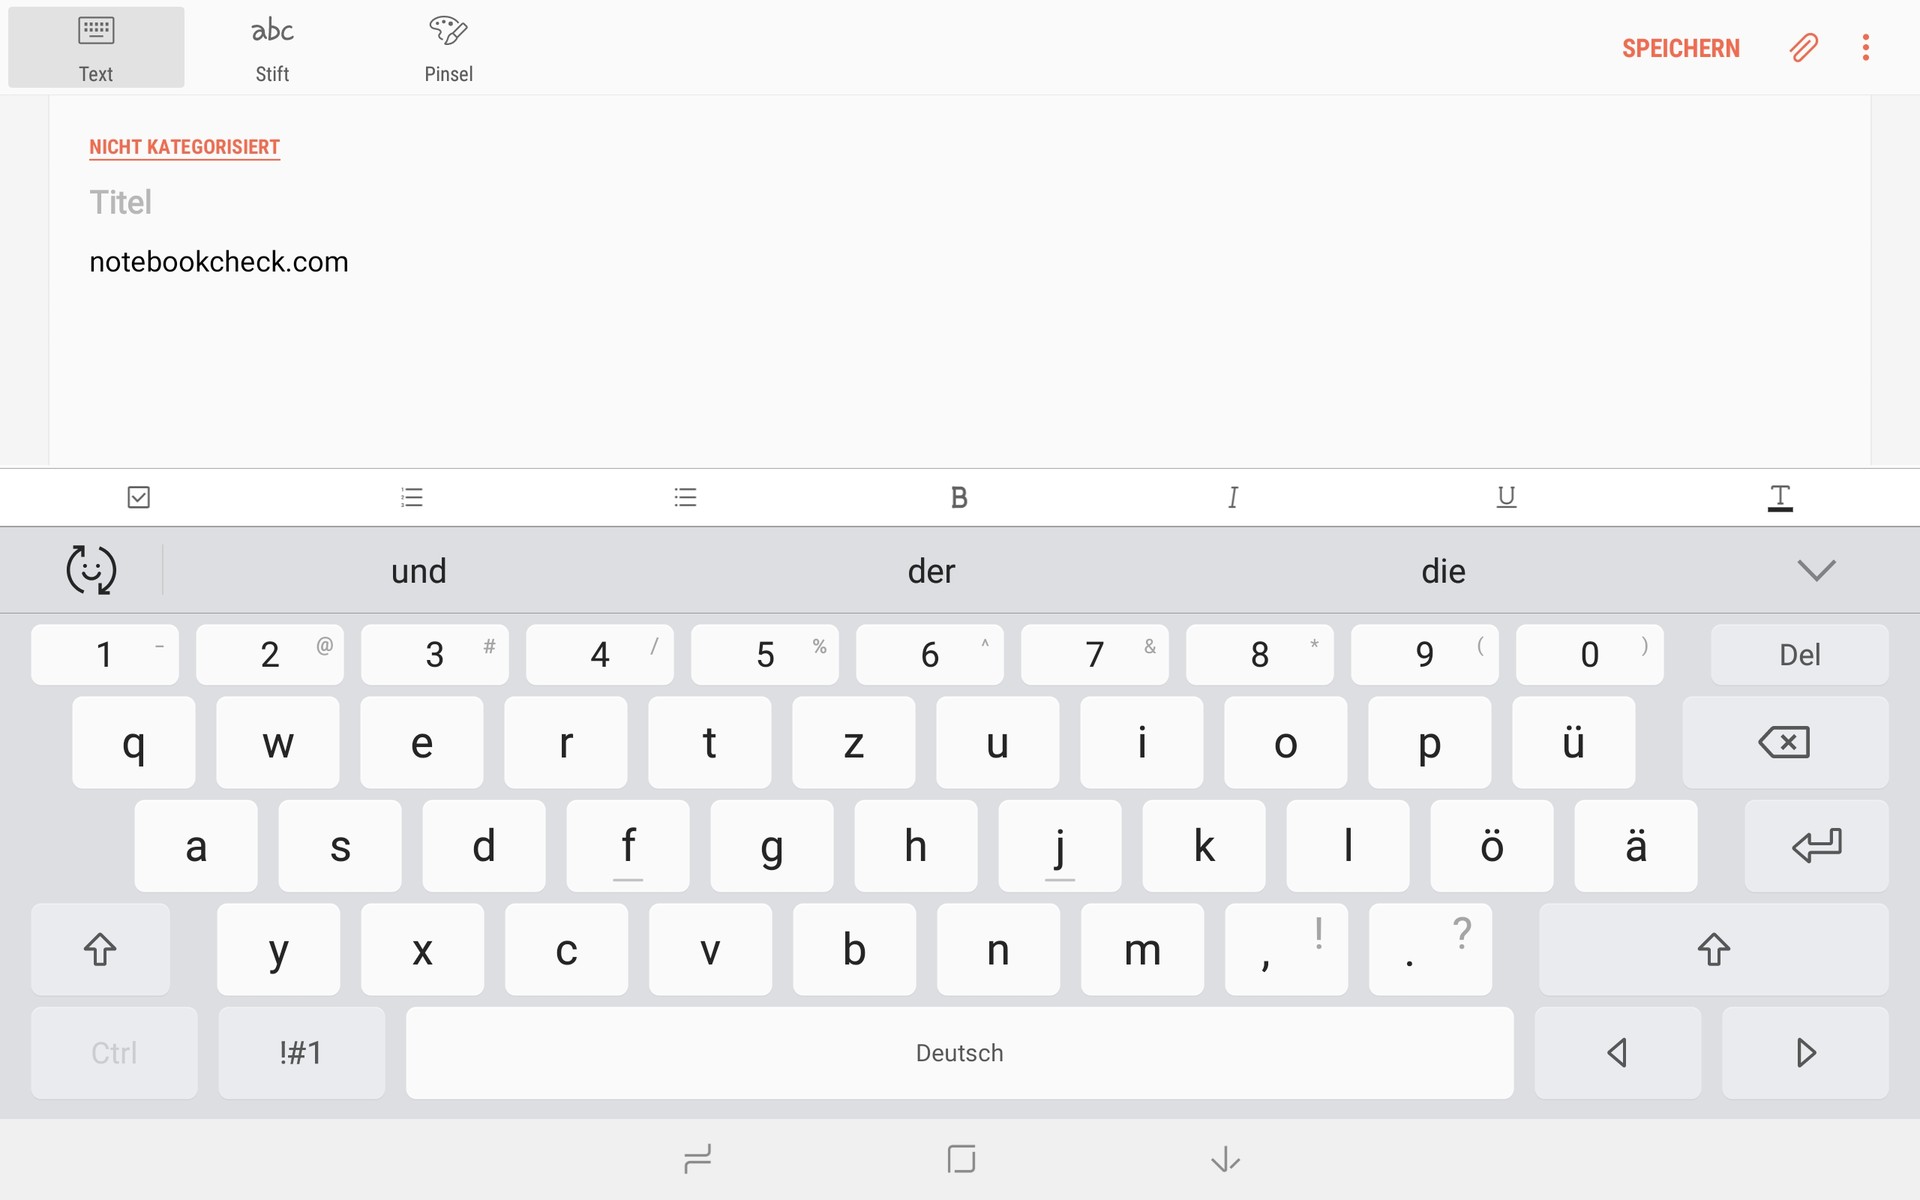
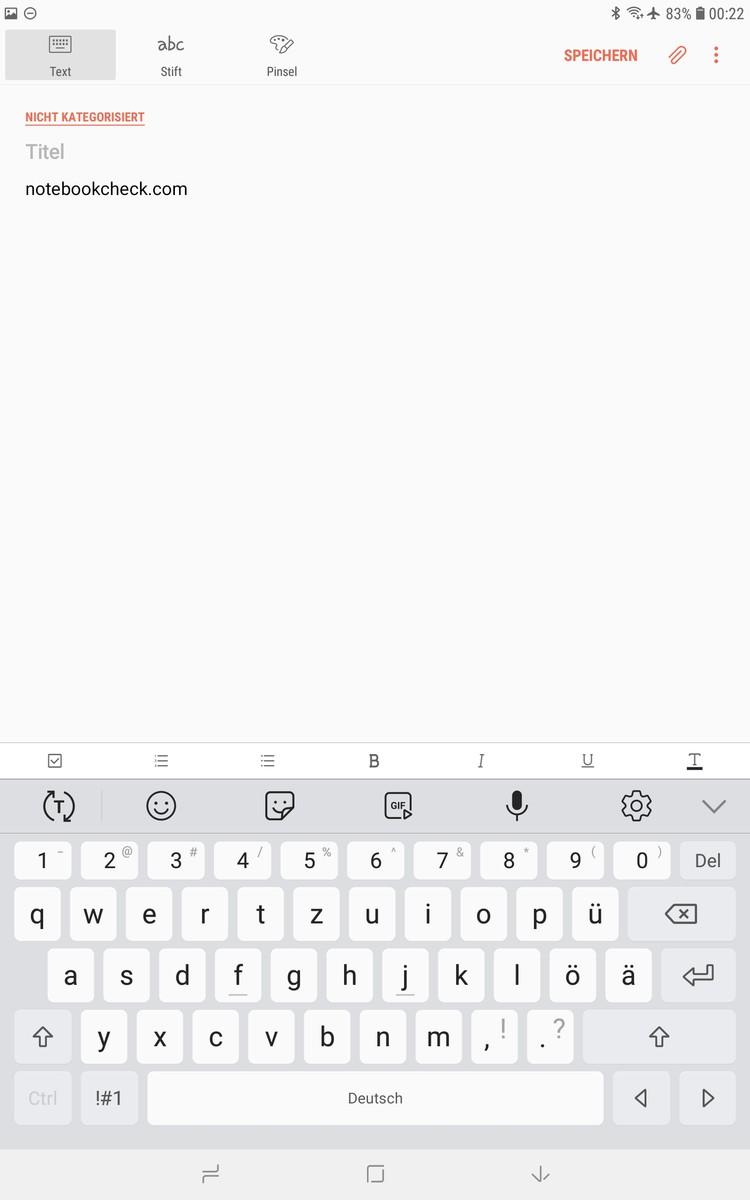
The Tab S4 has a 10-point multitouch capacitive touchscreen that is bonded to a glossy glass display. The display is easy to use and precisely reproduces inputs from our fingers or the included S Pen. The pen does not have a battery and has the same features as the one that Samsung included with the Galaxy Tab S3. Writing with the S Pen feels great, but it is no better of an experience over its predecessor. Moreover, the pen feels cheap, which is a pity given how expensive the Tab S4 is. It is nice that Samsung has now integrated a pen loop within the tablet’s optional covers.
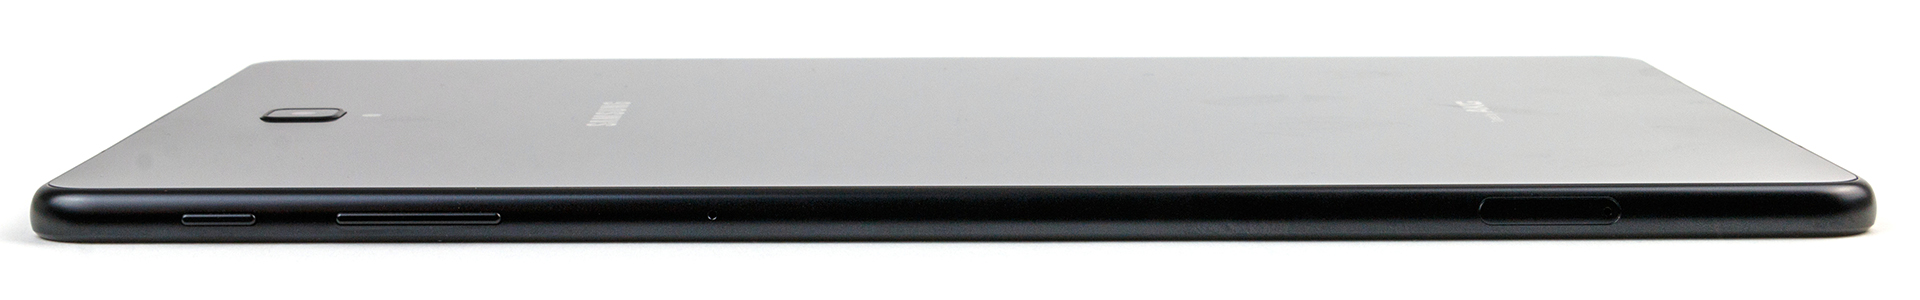
The device’s physical keys have clear and crisp pressure points that react well when pressed. The keys sit firmly within the aluminium frame too.
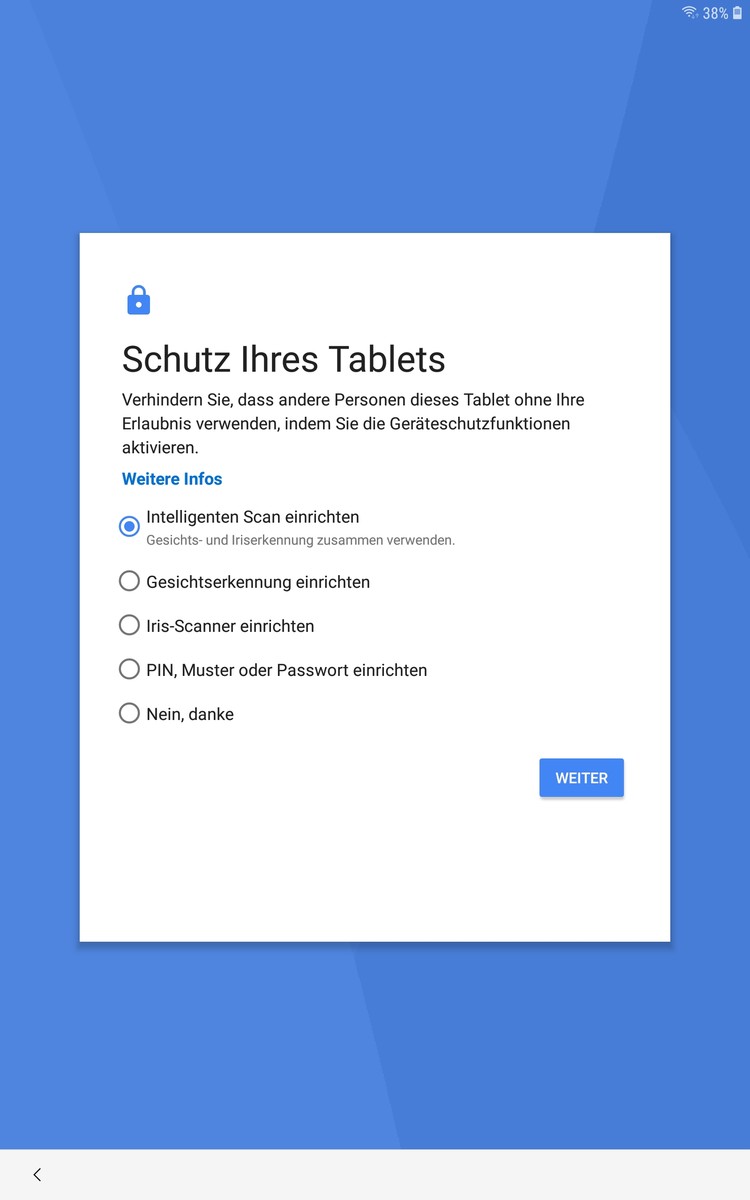
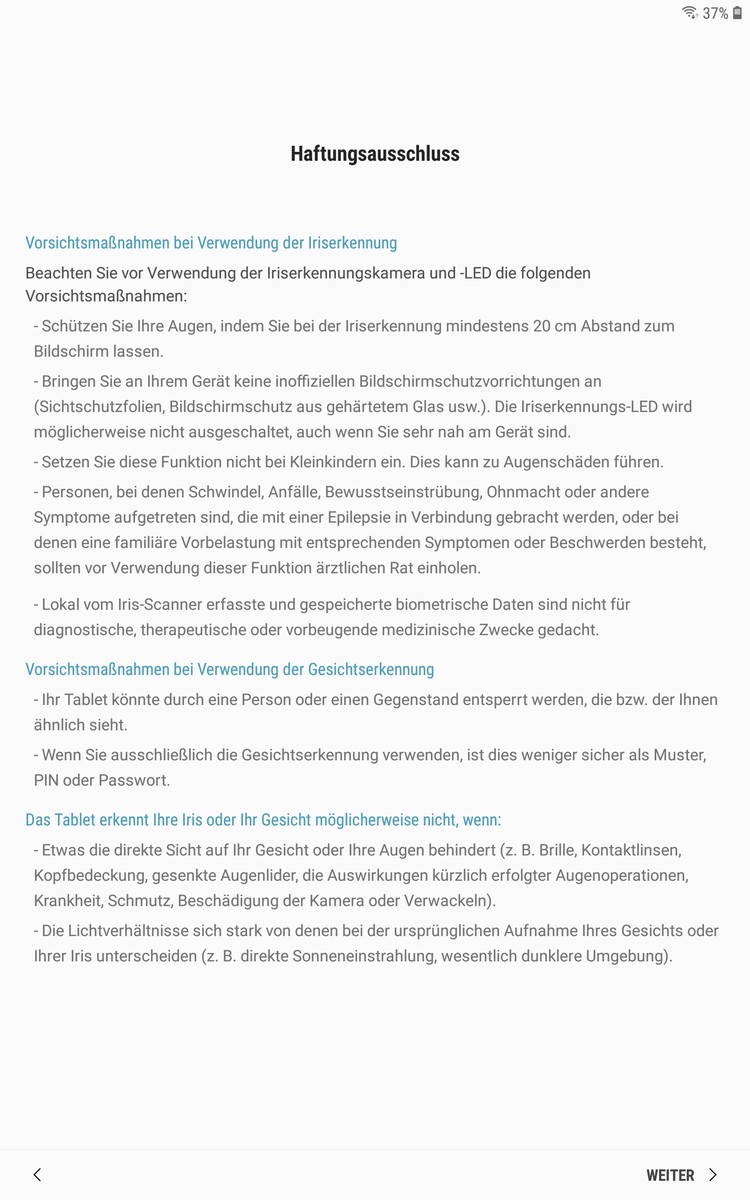
Samsung has included an iris scanner for biometric authentication, although this did not always work during testing and regularly took several seconds to unlock the device. Hence, we often resorted to using the PIN code instead. The ineffectiveness of the iris scanner made us long for a fingerprint sensor, which Samsung has unfortunately omitted.
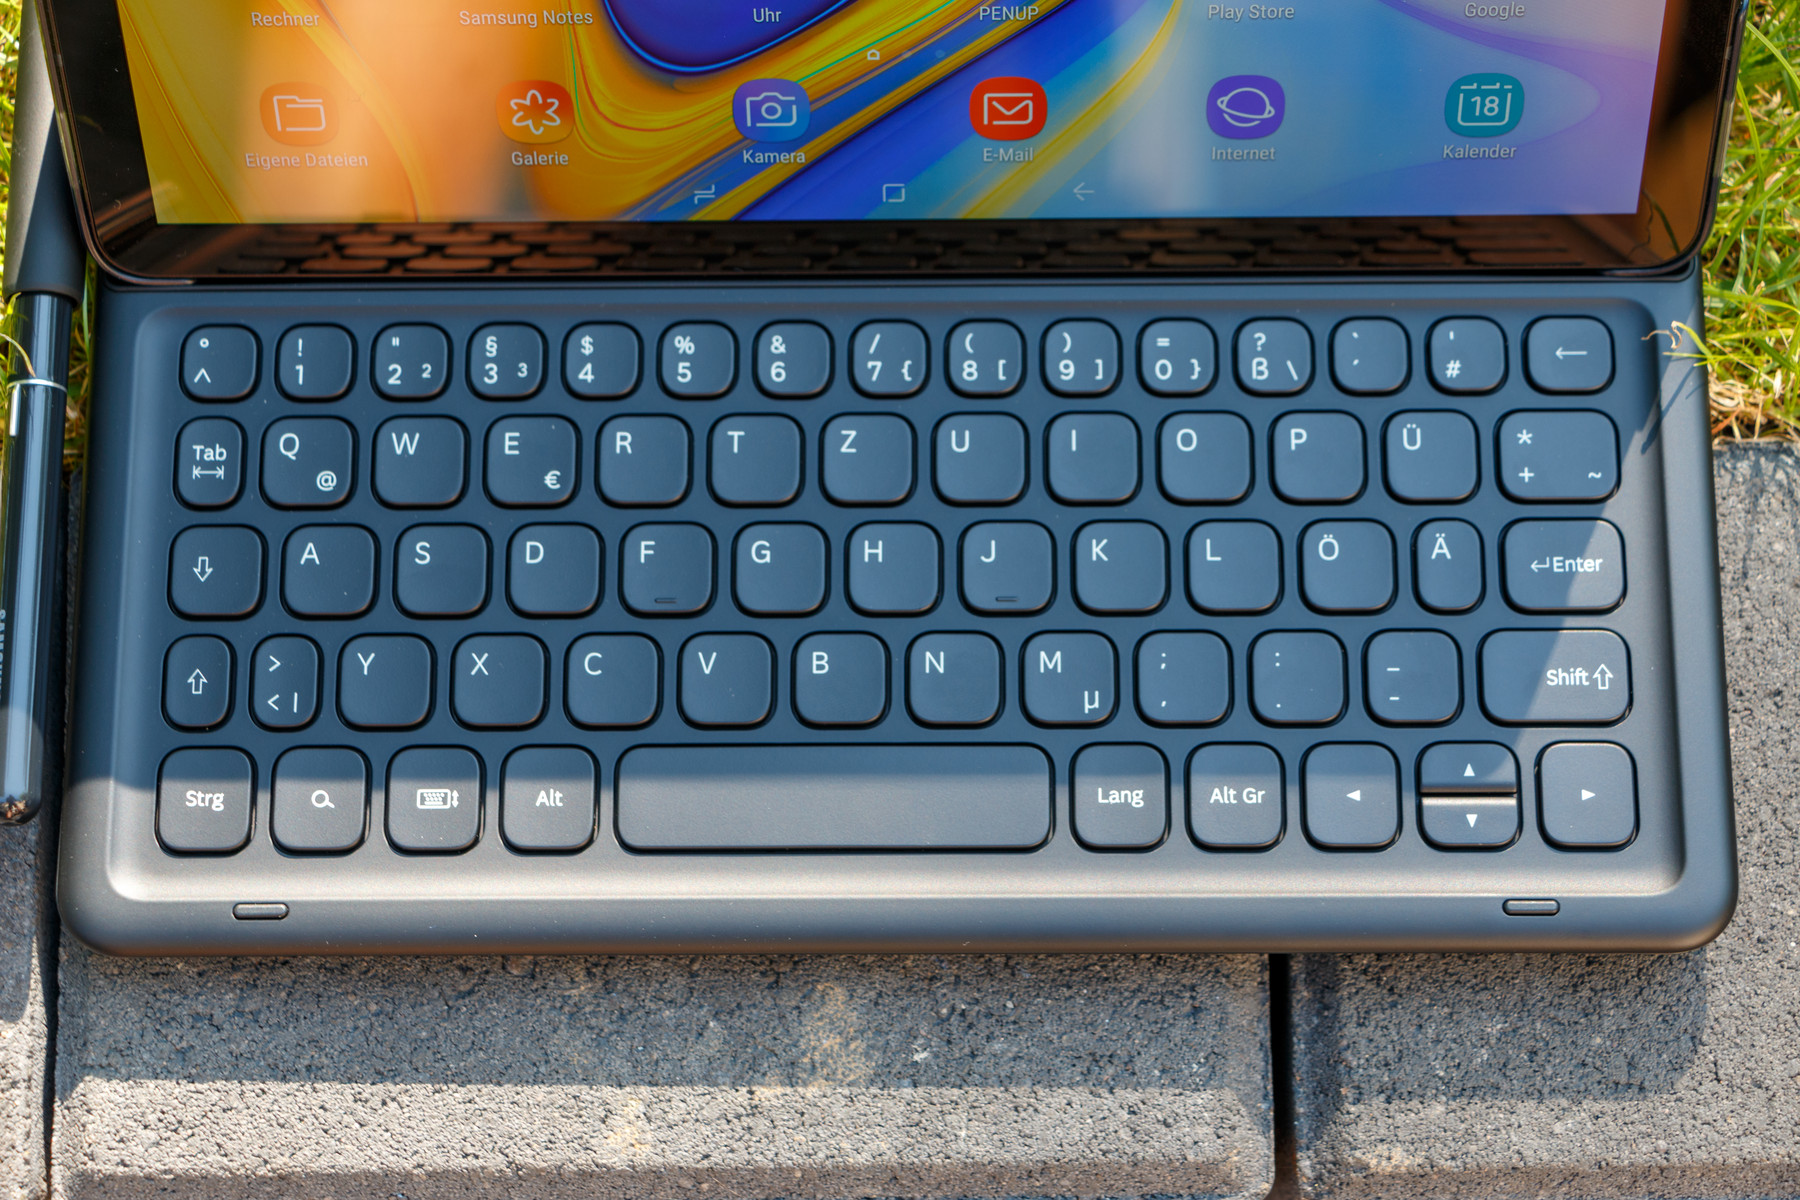
The optional keyboard cover is now made of a smooth plastic that is no longer powder coated, which makes the keyboard feel cheaper than previous editions. The keystroke and typing experience is good, but the keys are annoyingly loud regardless of how lightly we type.
Display
The Tab S4 has a 10.5-inch Super AMOLED display with a 16:10 aspect ratio, which runs at a native resolution of 2560x1600 and has a pixel density of 288 PPI. The display looks noticeably larger compared to the Tab S3 thanks not only to the Tab S4’s reduced bezels but also because Samsung has changed from using a 4:3 aspect ratio. The sub-pixel matrix remains the same though. The pixel density is smaller than those of modern premium smartphones, but the display should still look sharp as people typically hold tablets further away from their faces than they do with smartphones.
Our test device achieves a respectable average maximum brightness of 474 cd/m² according to X-Rite i1Pro 2 with its ambient light sensor activated. However, turning this off reduced the maximum luminosity to an underwhelming 303 cd/m². By contrast, the more practical APL50 test measures our test device as reaching a maximum brightness of 533 cd/m² at the centre of its display, which is 59 cd/m² brighter than the X-Rite i1Pro 2 value.
We like that Samsung has included HDR support, but the display does not get bright enough to take full advantage of the benefits that the technology offers. However, colours look rich and there are deep blacks thanks to its AMOLED display technology. AMOLED and OLED panels can individually switch off pixels, which theoretically gives devices like the Tab S4 a zero black value and an infinite contrast ratio.
We did notice that our test device used pulse-width modulation (PWM) to regulate its display brightness though, which may cause eye strain and headaches with some people. We measured the PWM frequency at around 240 Hz at 99% brightness and below, which then drops to 60 Hz at 100% brightness. Both frequencies are low enough to irritate those who are PWM sensitive.
| |||||||||||||||||||||||||
Brightness Distribution: 91 %
Center on Battery: 474 cd/m²
Contrast: ∞:1 (Black: 0 cd/m²)
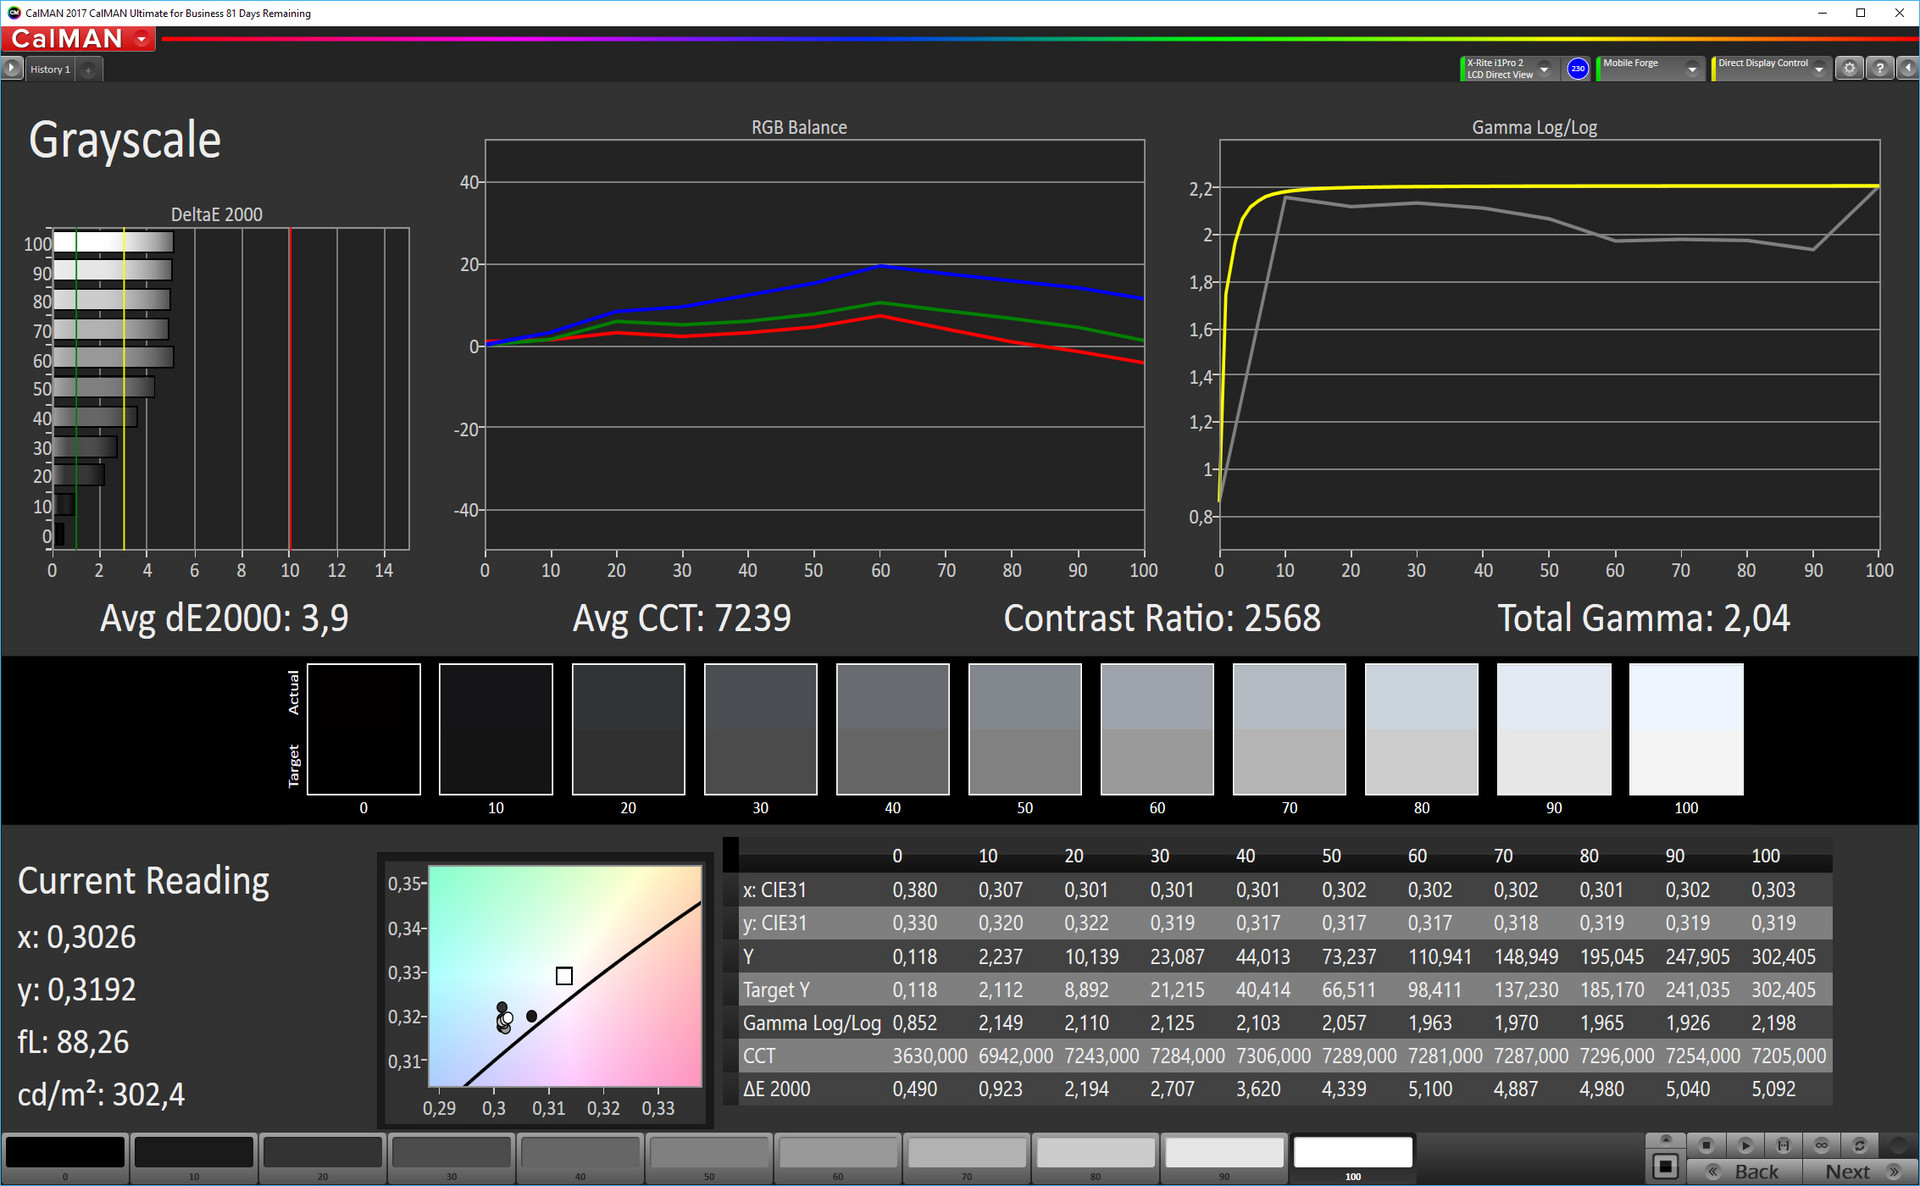
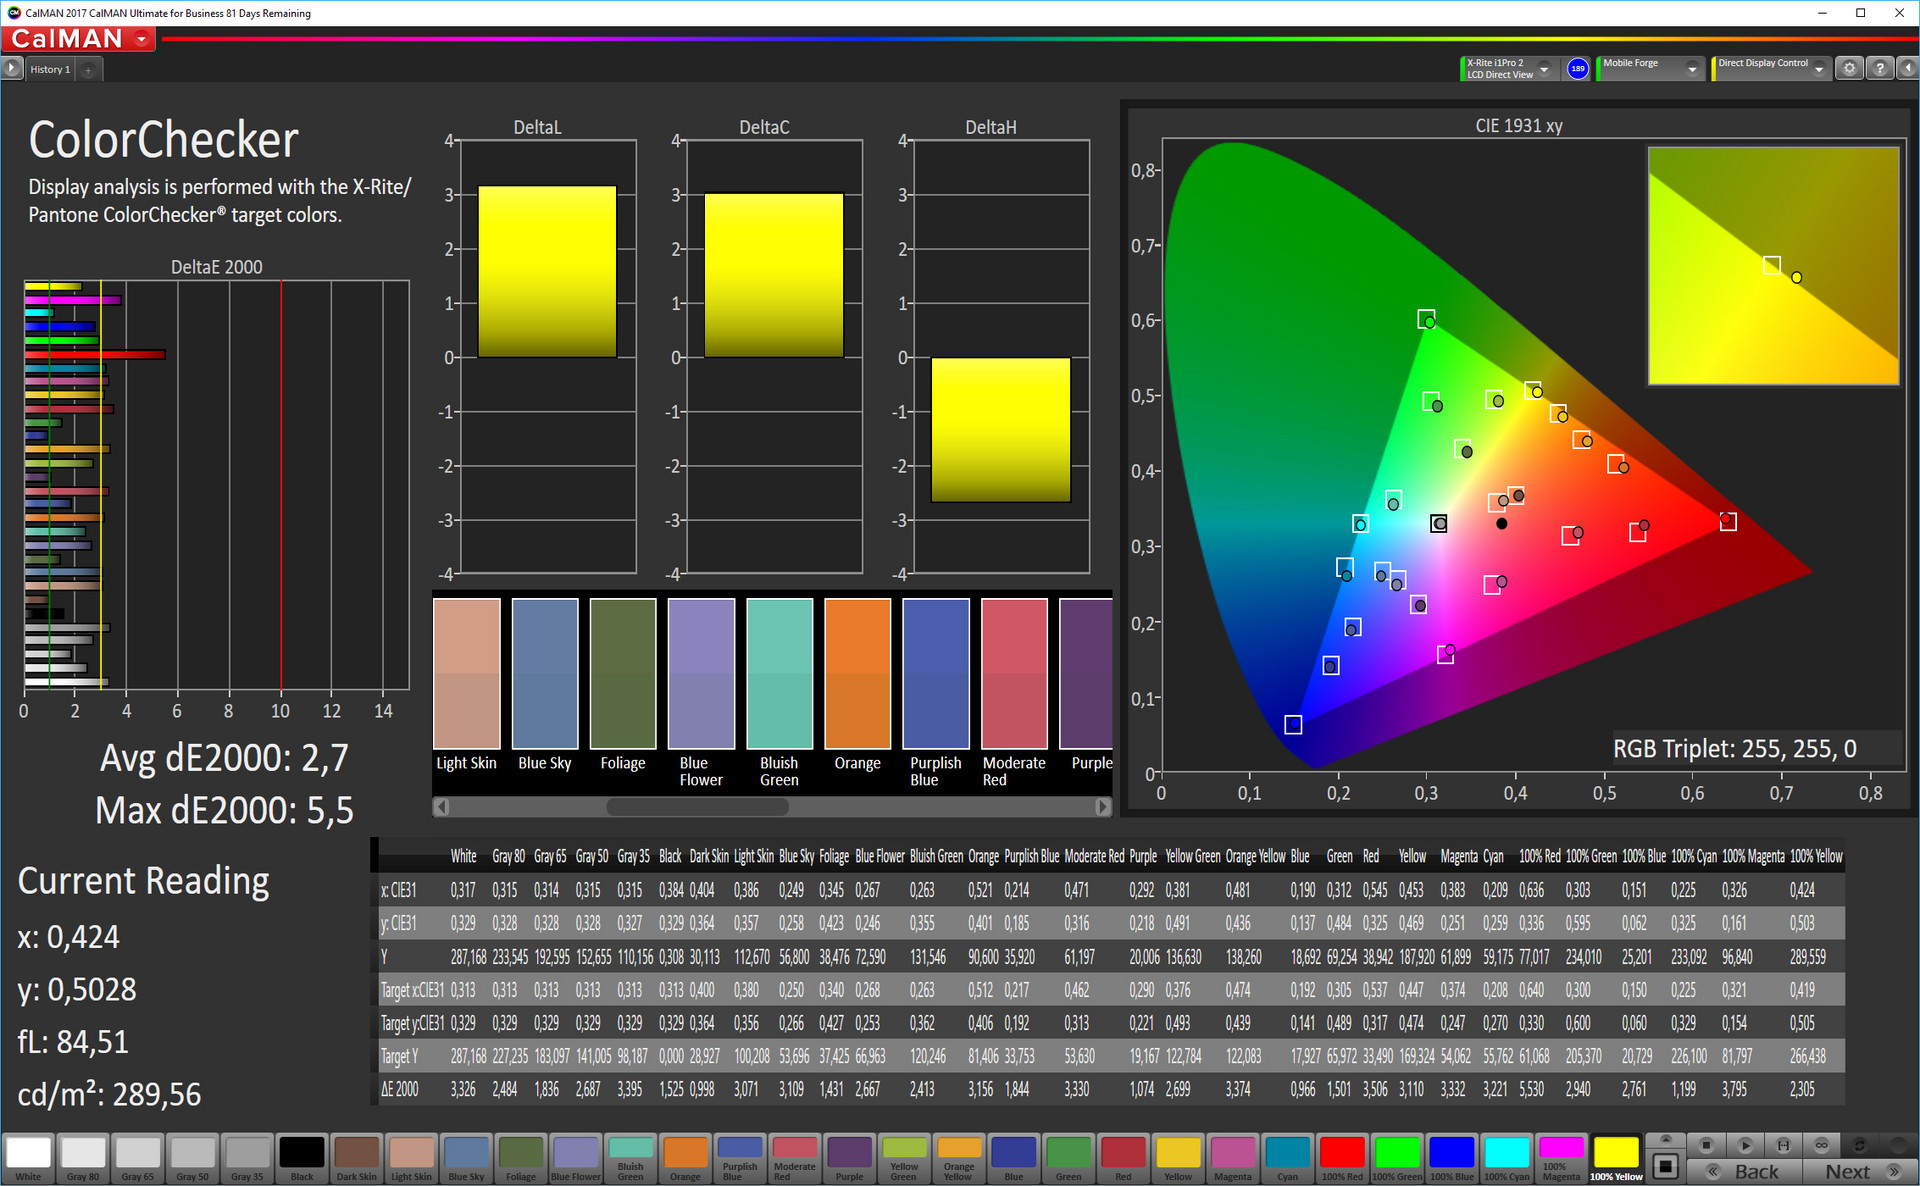
ΔE ColorChecker Calman: 2.5 | ∀{0.5-29.43 Ø4.71}
ΔE Greyscale Calman: 2.1 | ∀{0.09-98 Ø4.96}
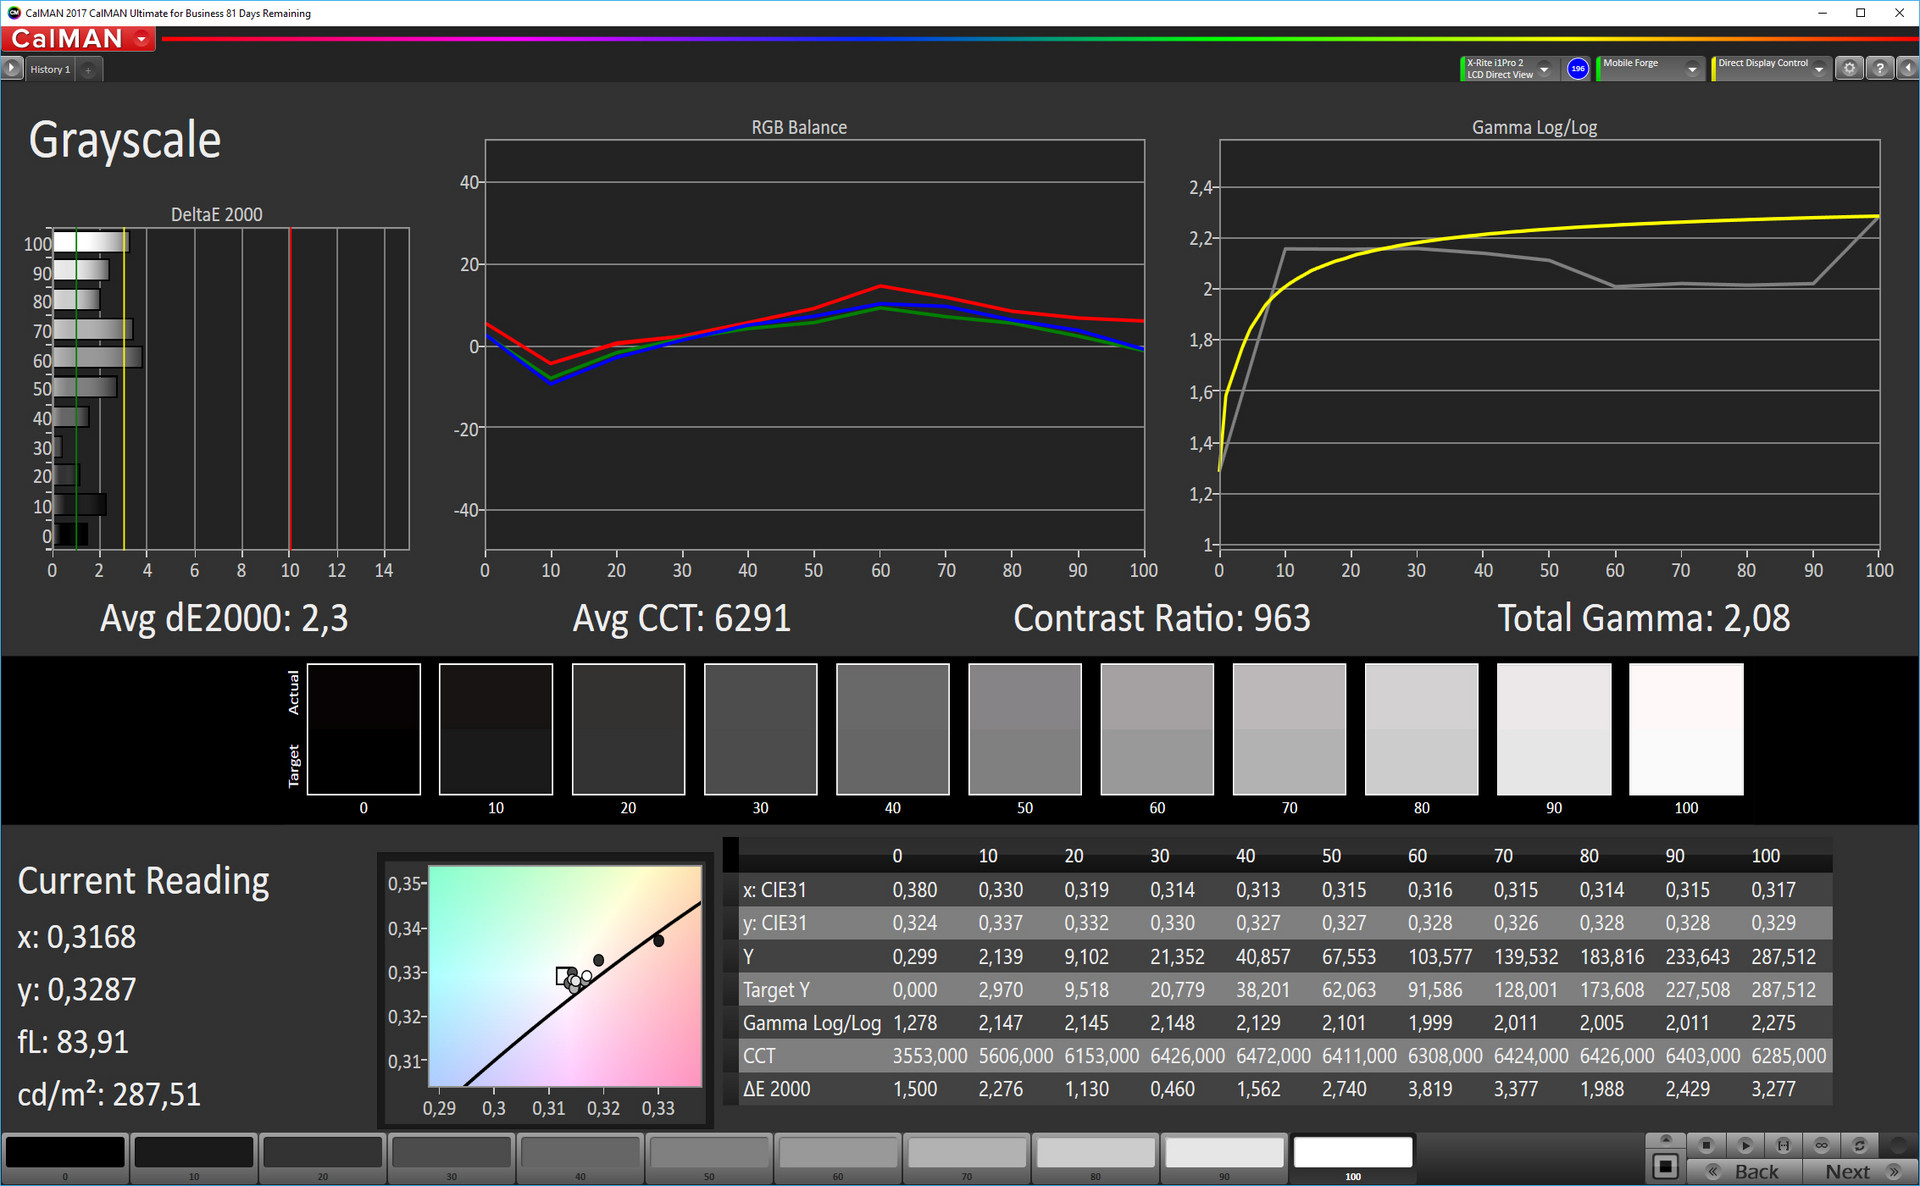
Gamma: 2.08
CCT: 6281 K
| Samsung Galaxy Tab S4 Super AMOLED, 2560x1600, 10.5" | Samsung Galaxy Tab S3 SM-T825 Super AMOLED, 2048x1526, 9.7" | Apple iPad Pro 10.5 2017 IPS, 2224x1668, 10.5" | Huawei MediaPad M5 10.8 Pro IPS, 2560x1600, 10.8" | Amazon Fire HD 10 2017 IPS, 1920x1200, 10.1" | Acer Iconia Tab 10 A3-A50 IPS, 1920x1200, 10.1" | |
|---|---|---|---|---|---|---|
| Screen | 14% | 14% | -100% | -48% | -159% | |
| Brightness middle (cd/m²) | 474 | 452 -5% | 634 34% | 384 -19% | 426 -10% | 340 -28% |
| Brightness (cd/m²) | 477 | 468 -2% | 625 31% | 360 -25% | 399 -16% | 320 -33% |
| Brightness Distribution (%) | 91 | 82 -10% | 87 -4% | 84 -8% | 91 0% | 84 -8% |
| Black Level * (cd/m²) | 0.39 | 0.8 | 0.38 | 0.19 | ||
| Colorchecker dE 2000 * | 2.5 | 1.8 28% | 1.9 24% | 6.83 -173% | 4.5 -80% | 15 -500% |
| Colorchecker dE 2000 max. * | 5.8 | 4 31% | 3.9 33% | 12.7 -119% | 7.9 -36% | 22.8 -293% |
| Greyscale dE 2000 * | 2.1 | 1.2 43% | 2.8 -33% | 7.5 -257% | 5.2 -148% | 4 -90% |
| Gamma | 2.08 106% | 2.11 104% | 2.26 97% | 2.199 100% | 2.23 99% | 2.09 105% |
| CCT | 6281 103% | 6500 100% | 7027 93% | 8544 76% | 6875 95% | 6940 94% |
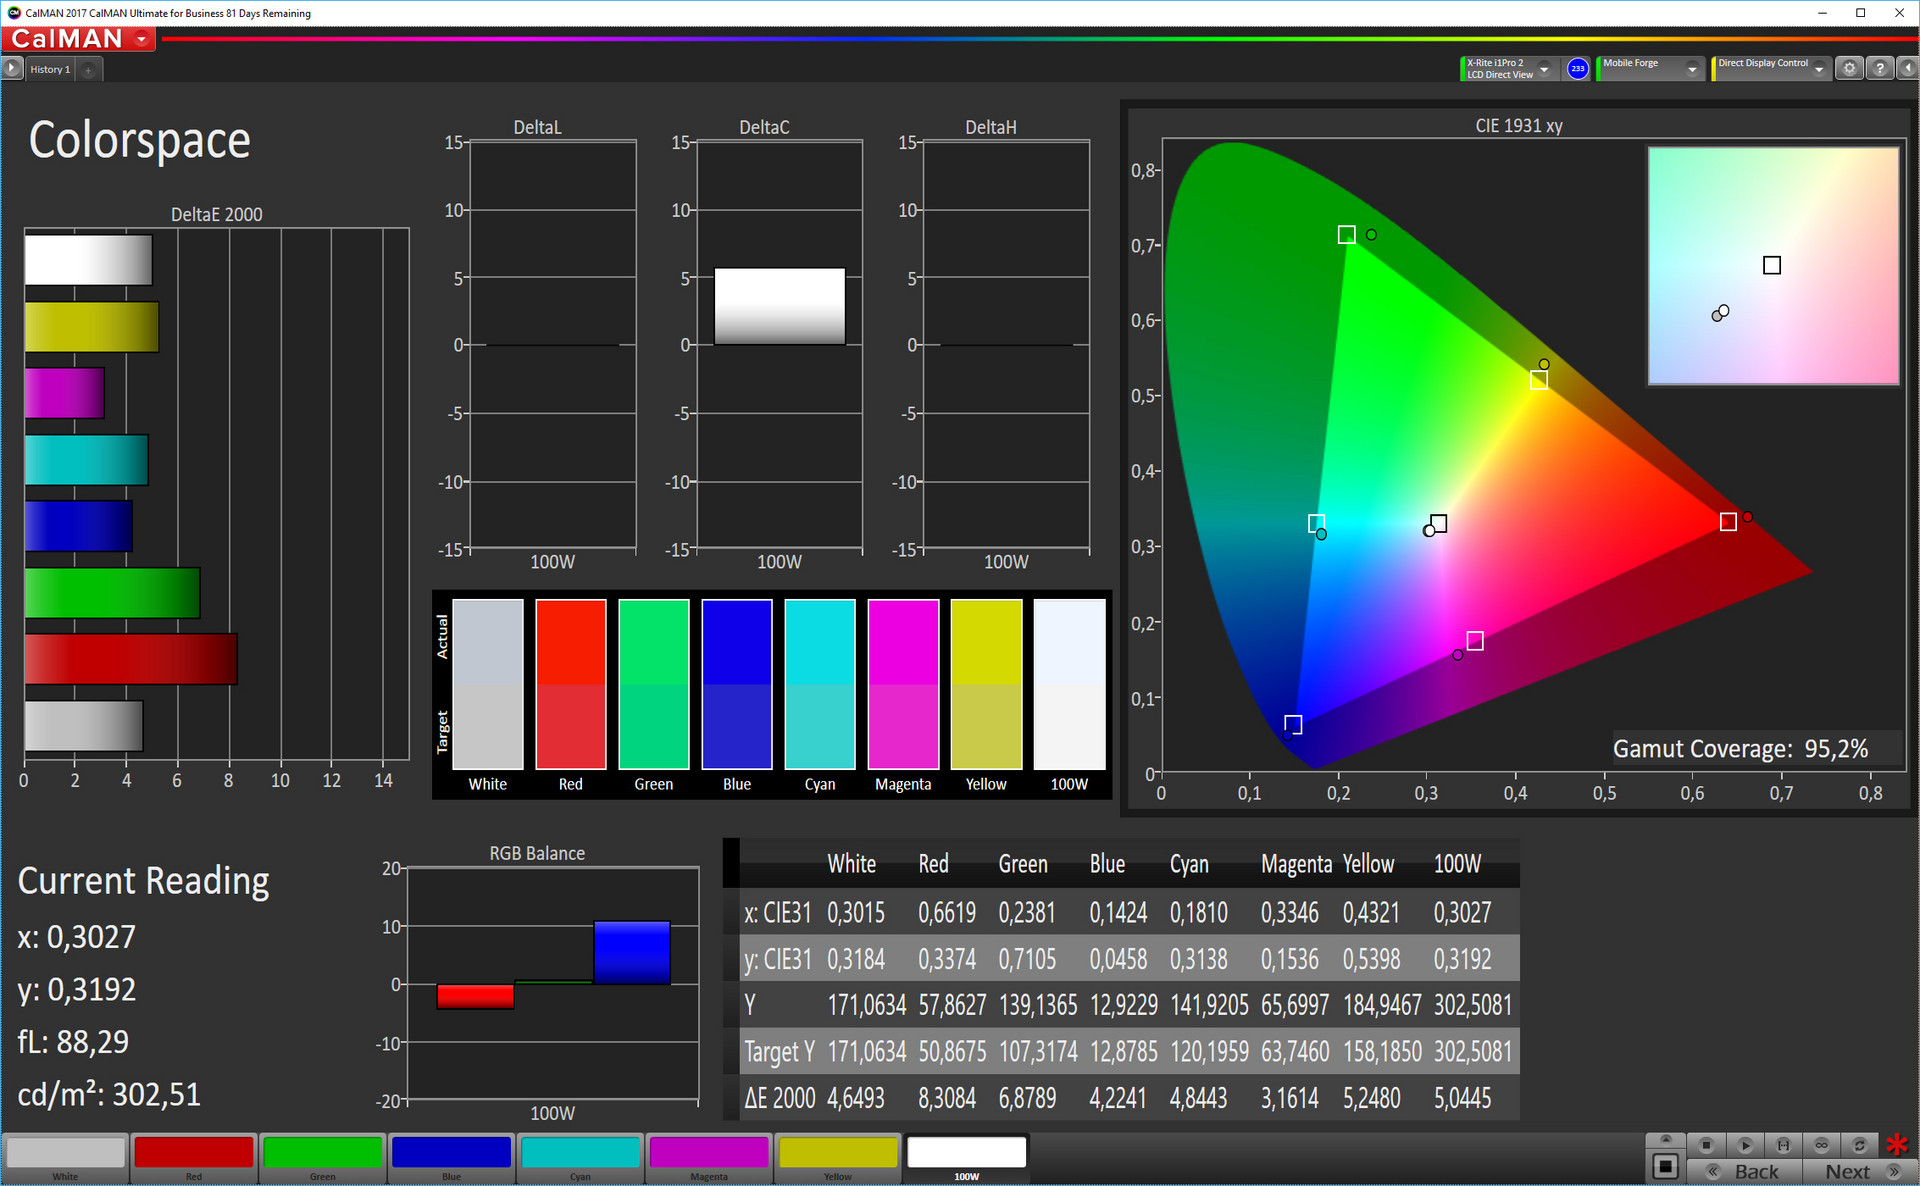
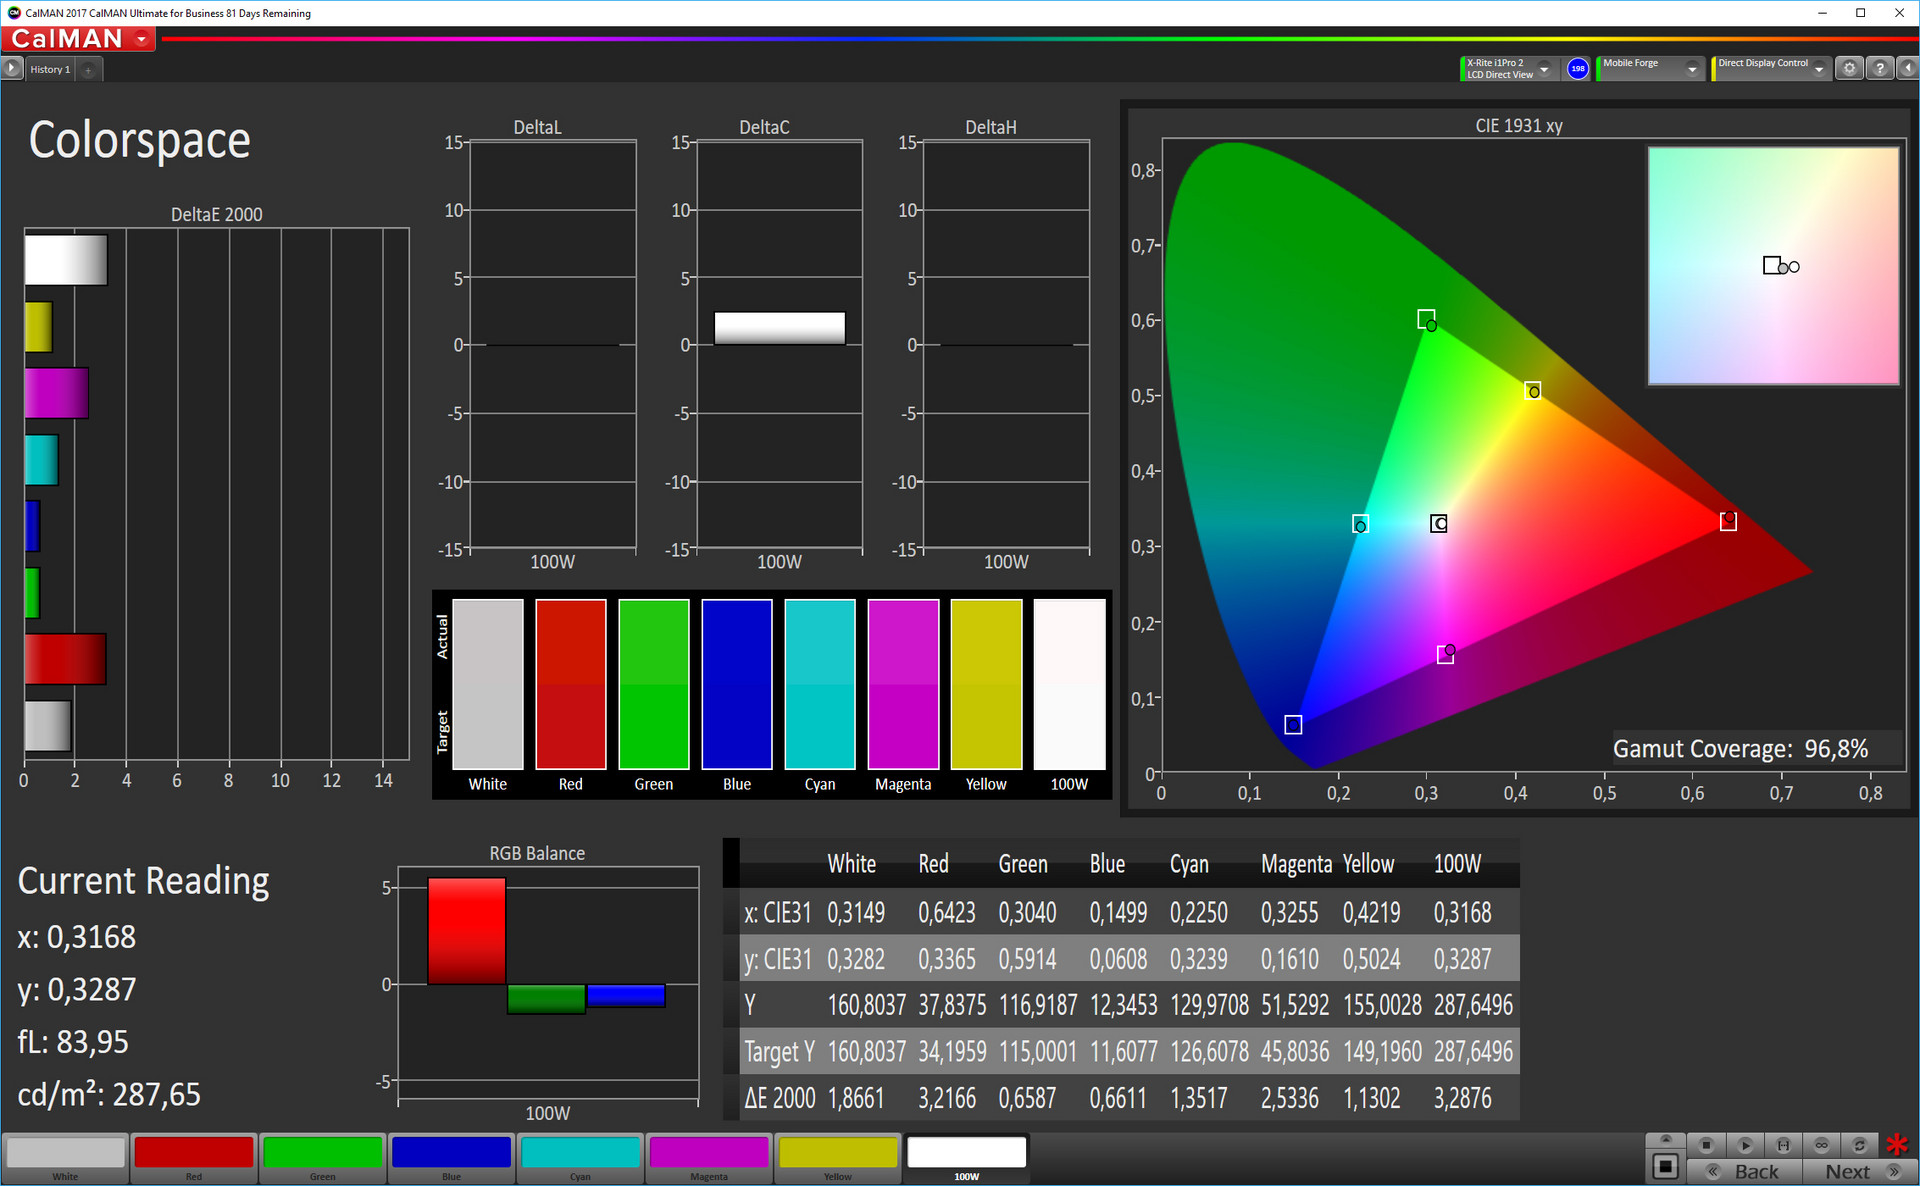
| Color Space (Percent of AdobeRGB 1998) (%) | 82.32 | |||||
| Color Space (Percent of sRGB) (%) | 99.06 | |||||
| Contrast (:1) | 1626 | 480 | 1121 | 1789 |
* ... smaller is better
Screen Flickering / PWM (Pulse-Width Modulation)
| Screen flickering / PWM detected | 240.4 Hz | ≤ 99 % brightness setting | 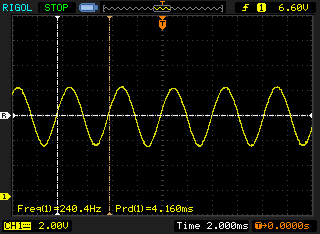 |
The display backlight flickers at 240.4 Hz (worst case, e.g., utilizing PWM) Flickering detected at a brightness setting of 99 % and below. There should be no flickering or PWM above this brightness setting. The frequency of 240.4 Hz is relatively low, so sensitive users will likely notice flickering and experience eyestrain at the stated brightness setting and below. In comparison: 52 % of all tested devices do not use PWM to dim the display. If PWM was detected, an average of 7741 (minimum: 5 - maximum: 343500) Hz was measured. | |||
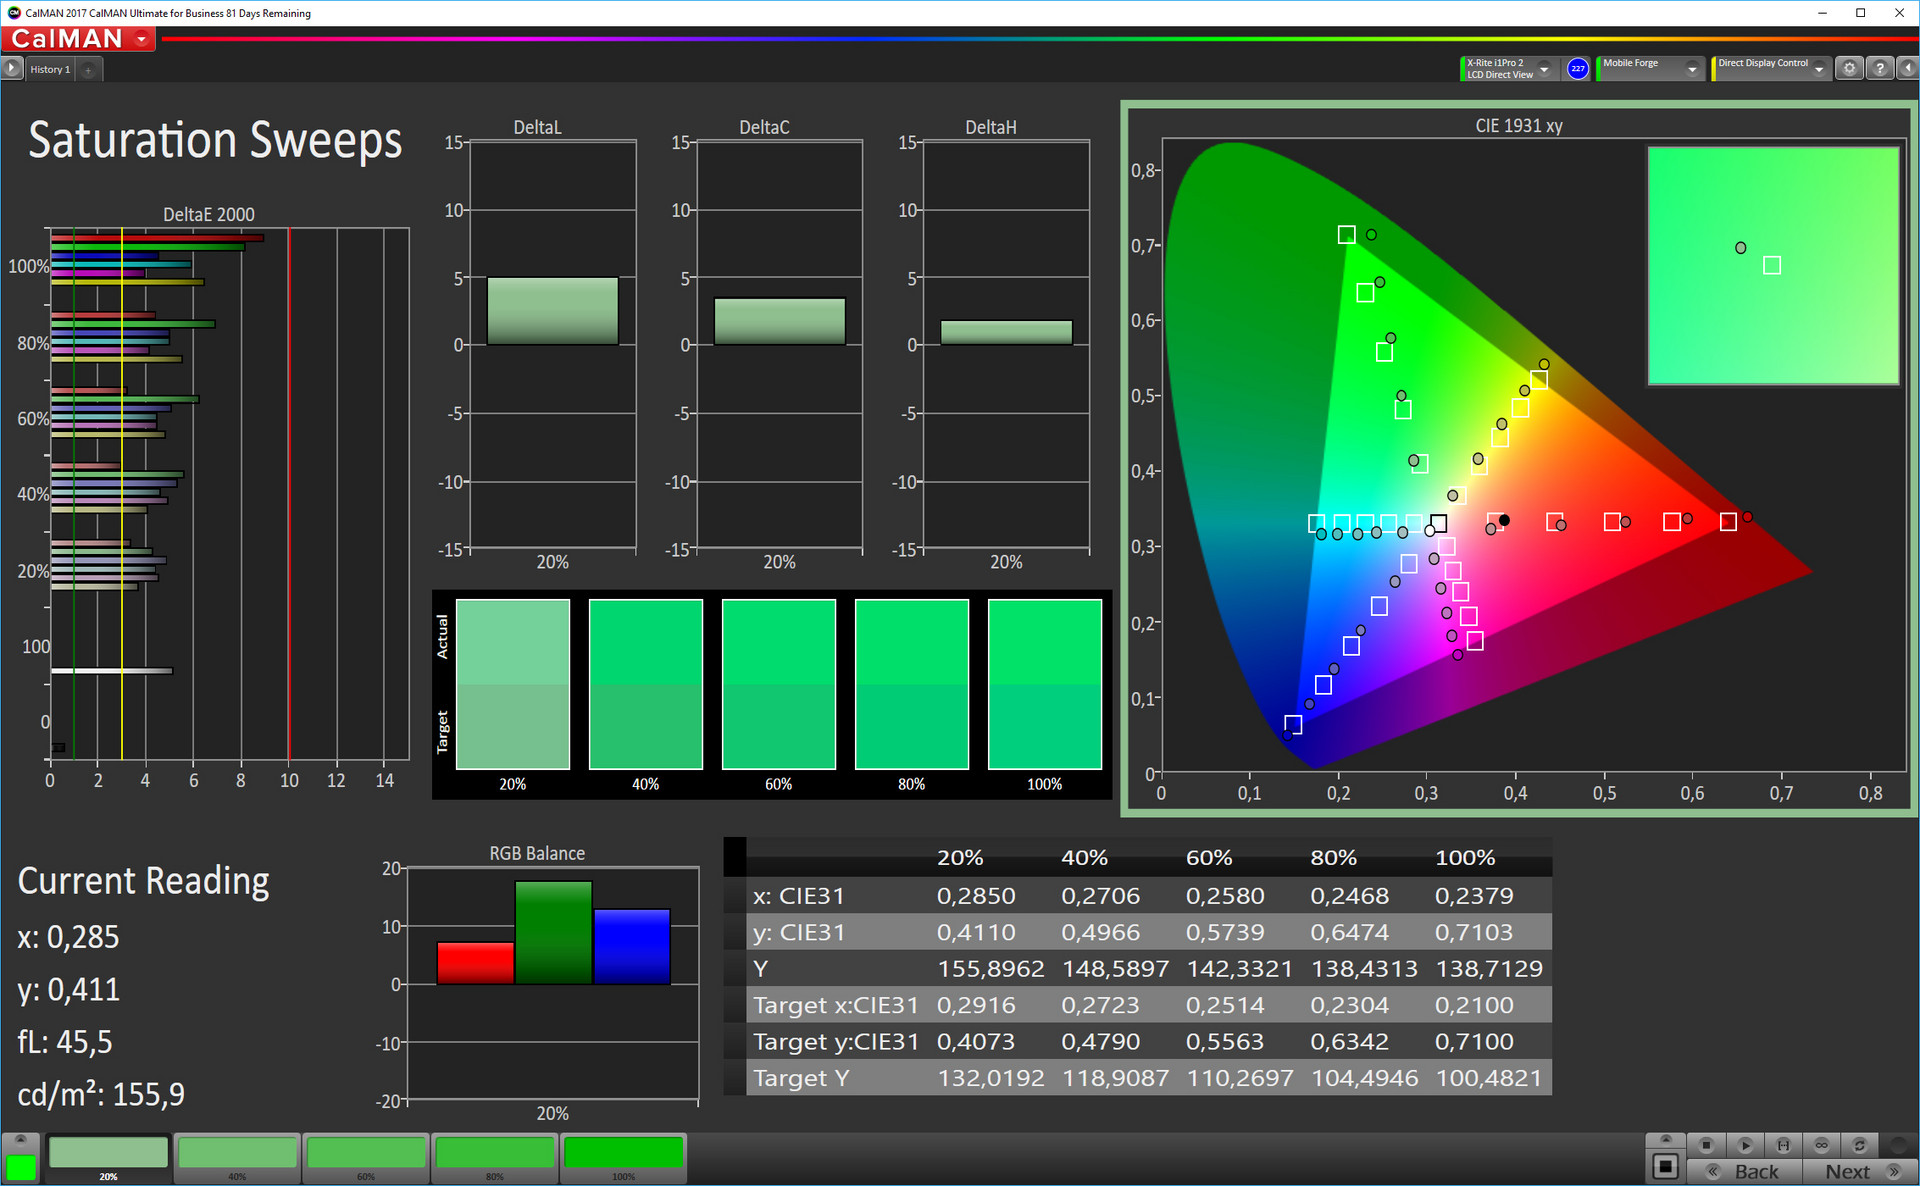
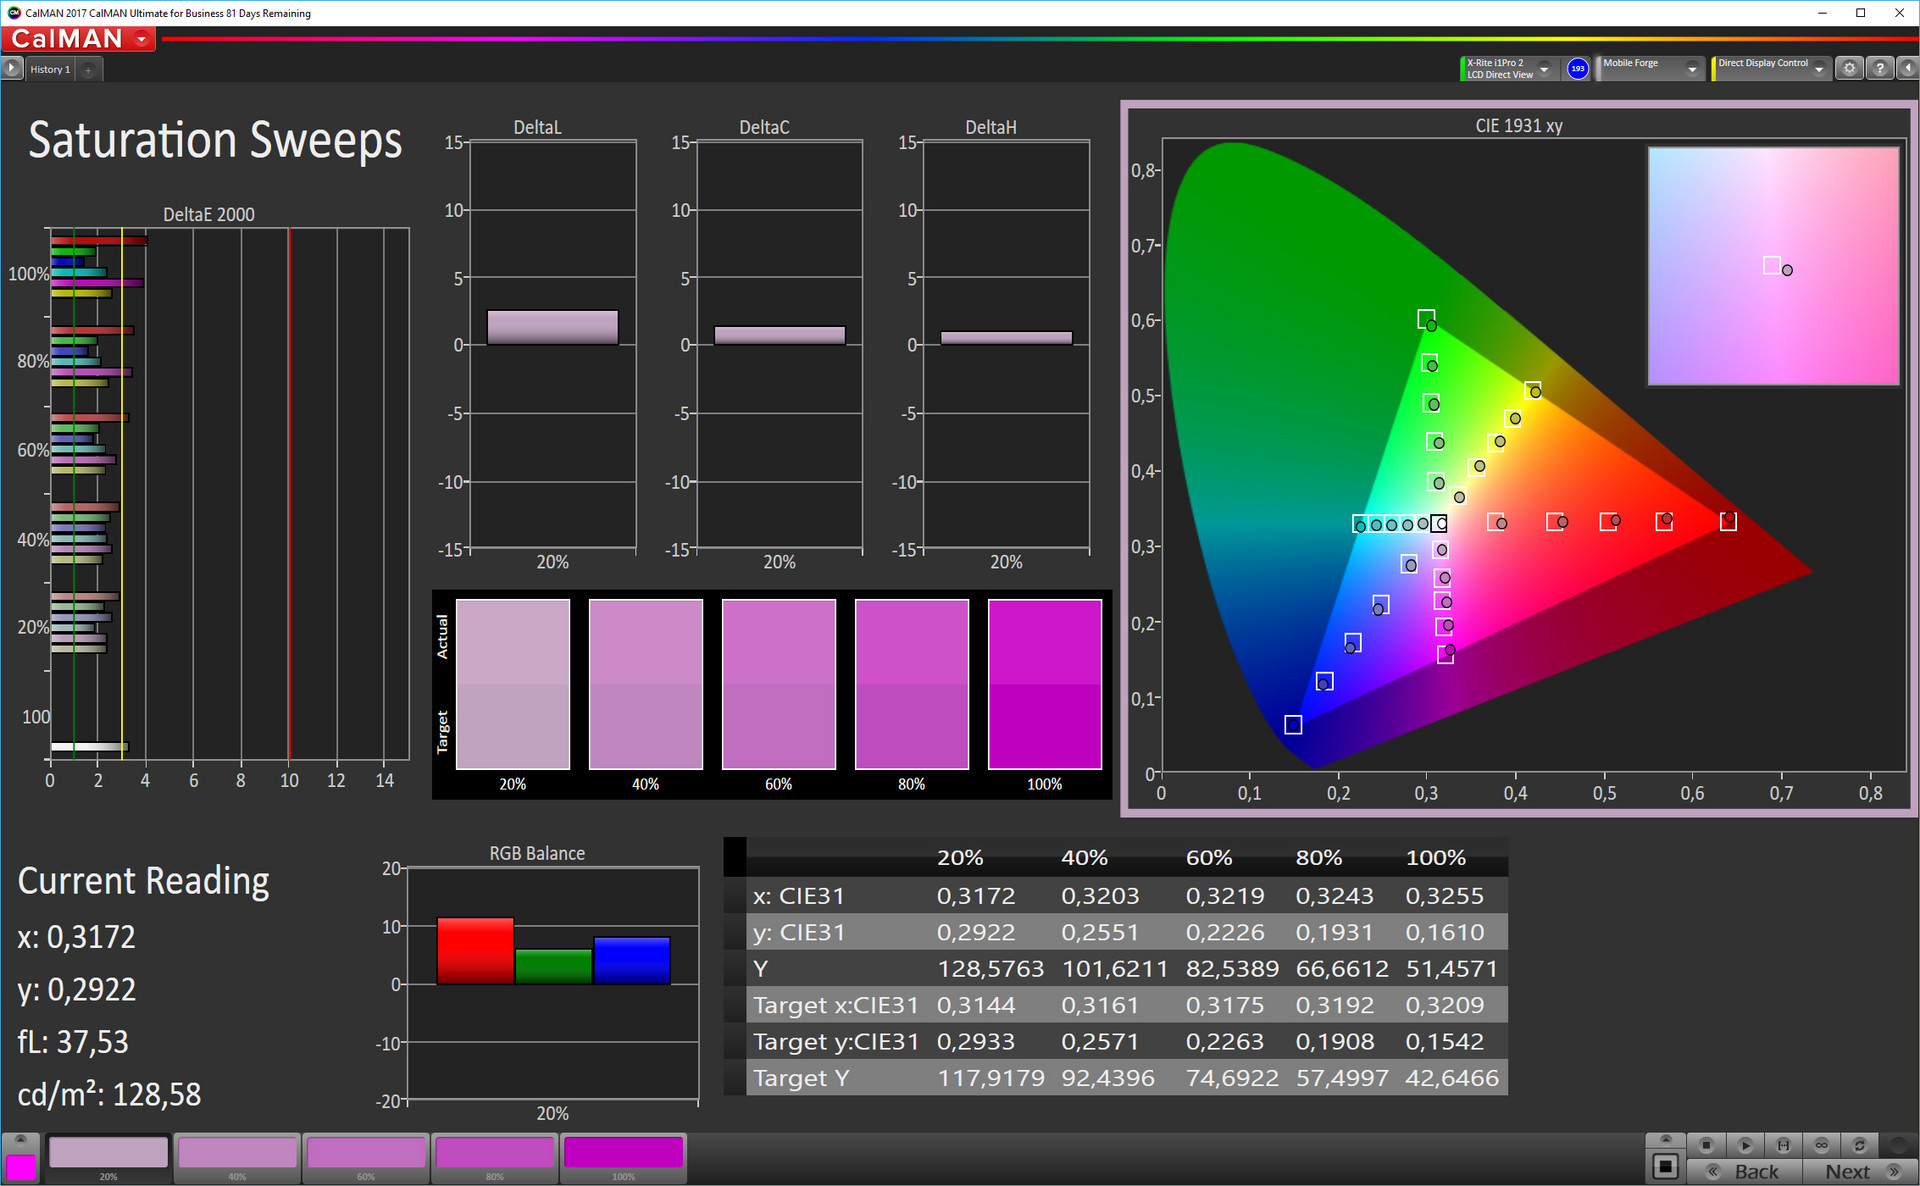
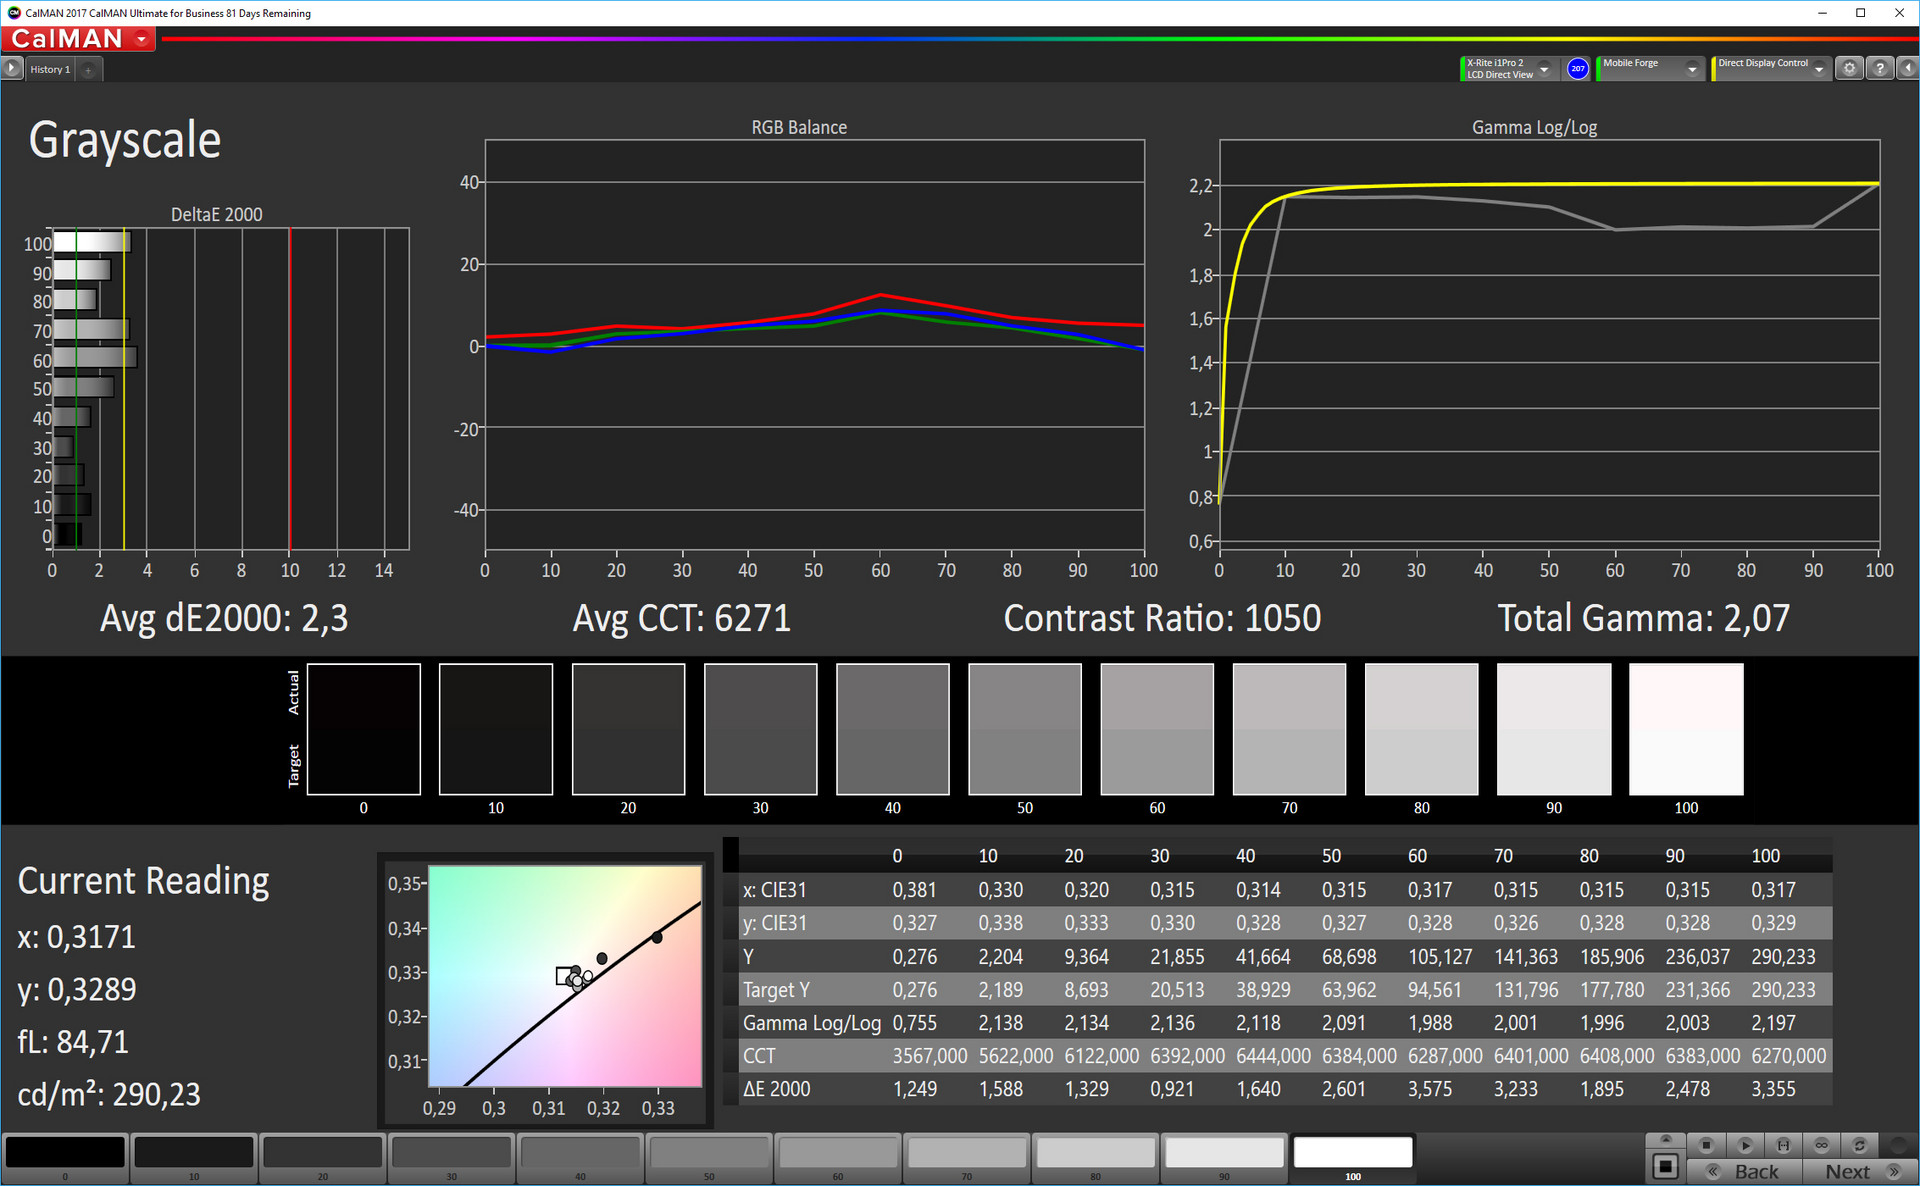
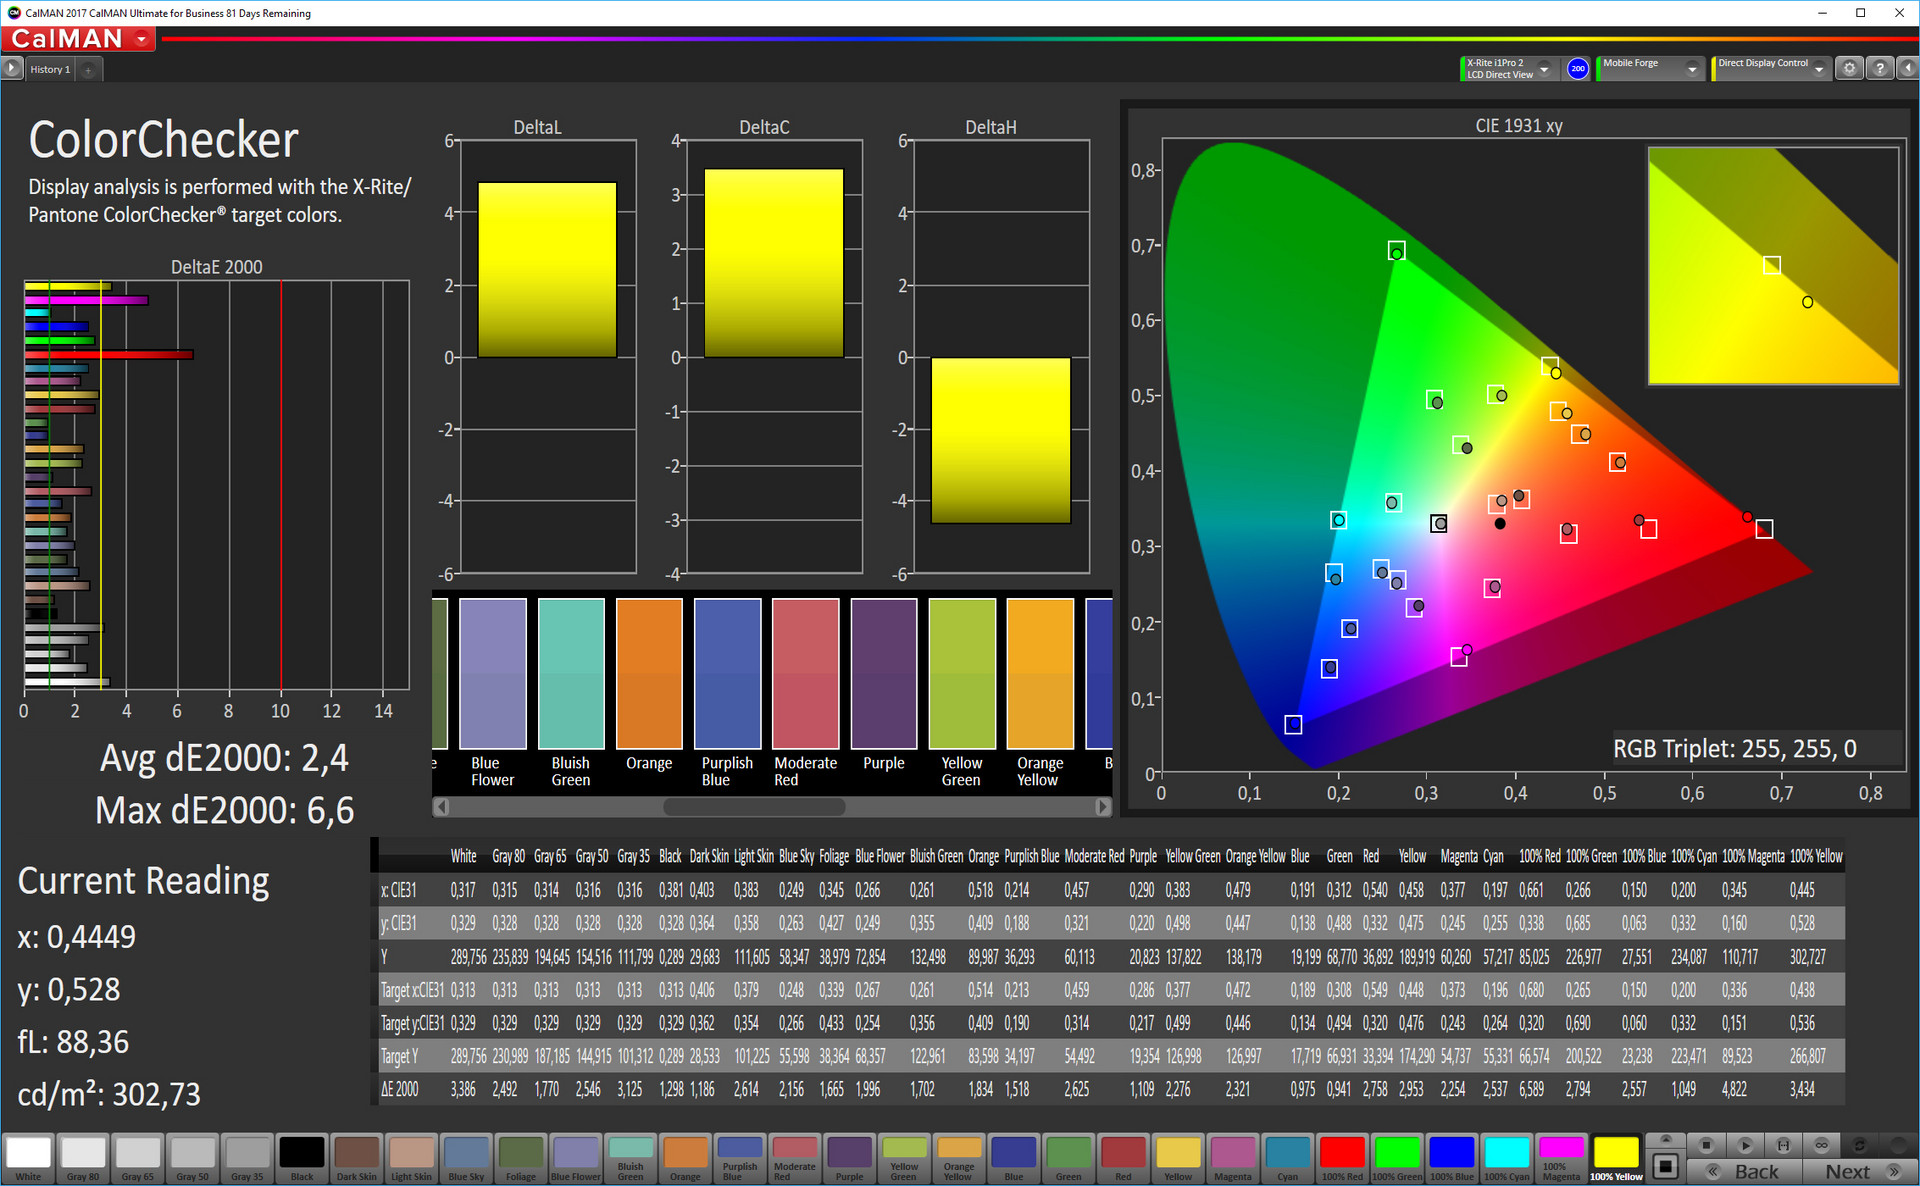
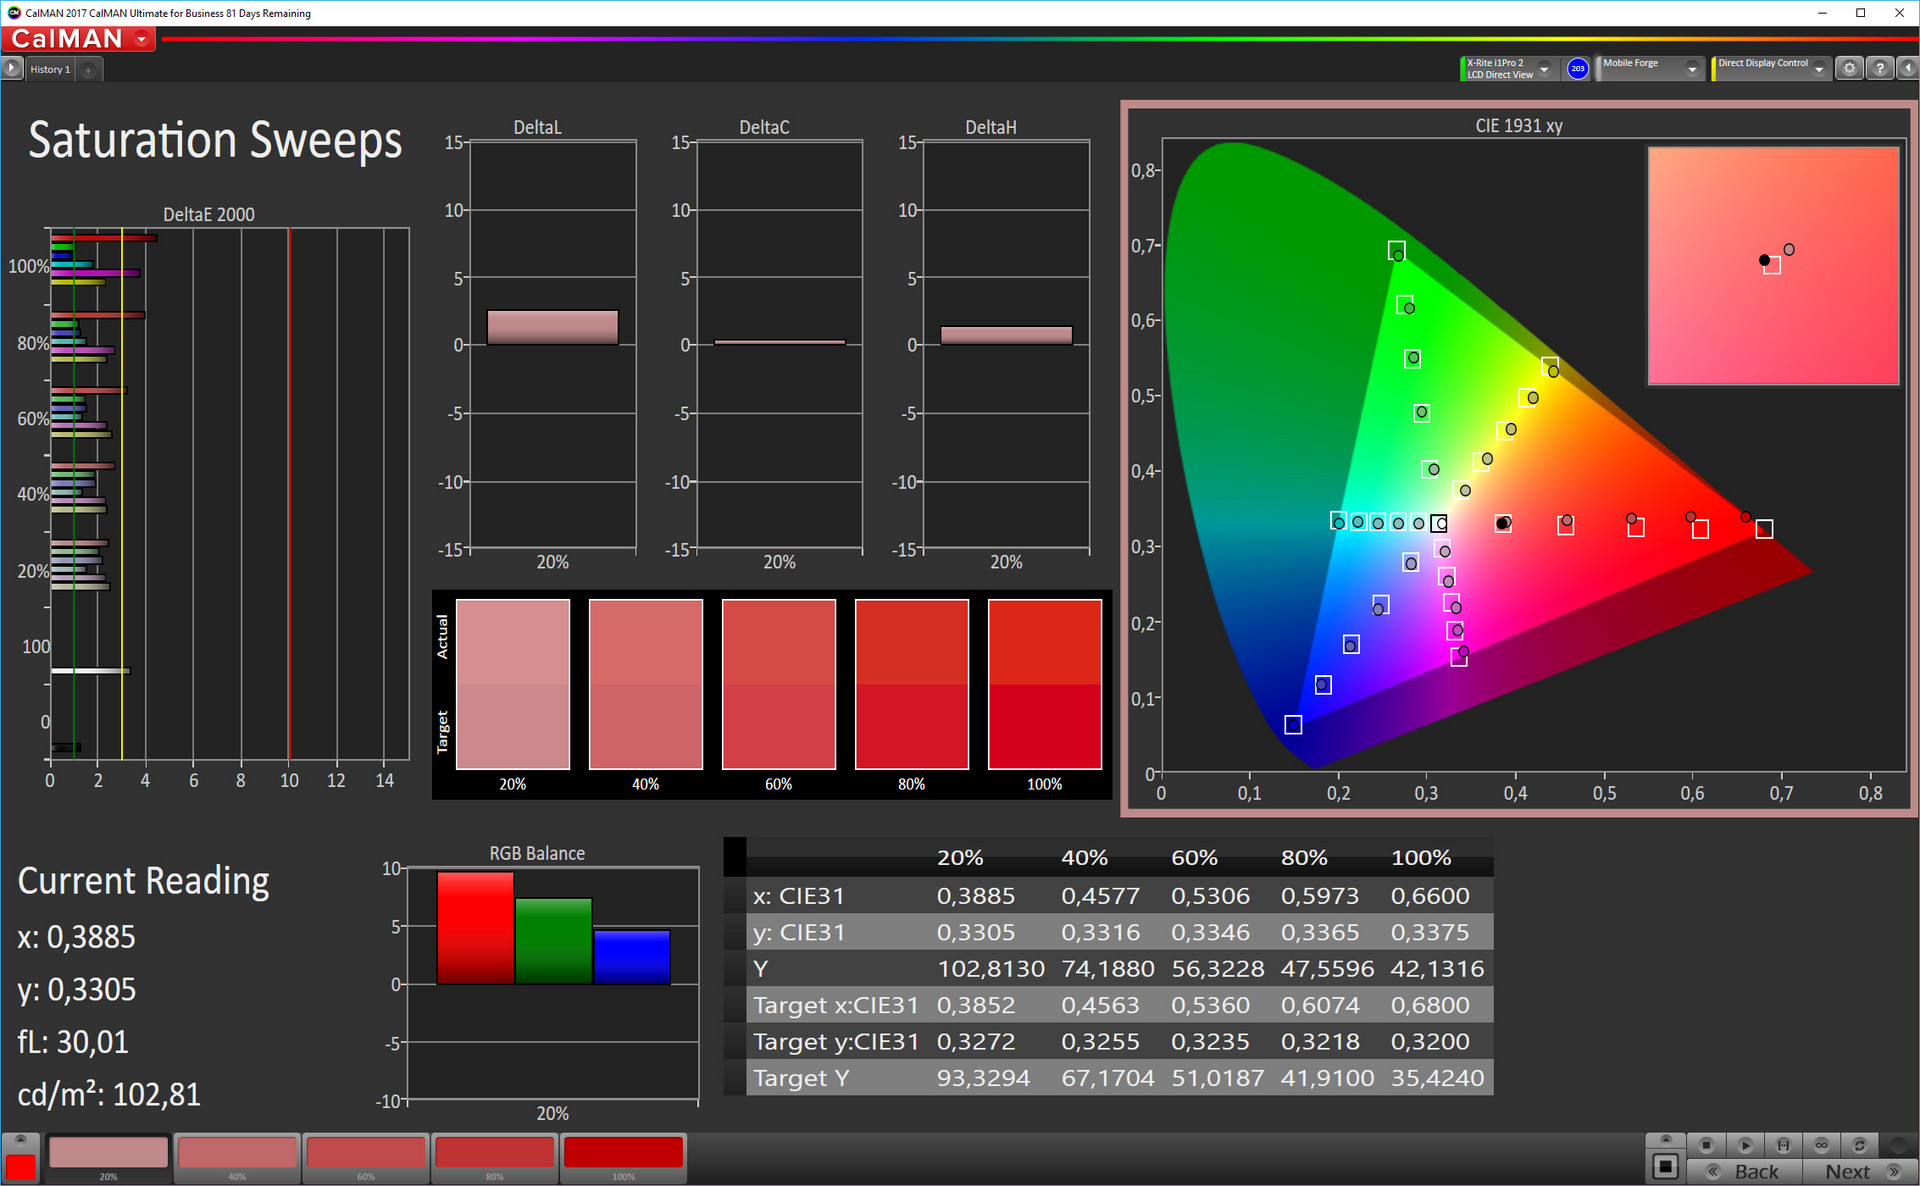
We examined the colour accuracy of our test device’s display with a photo spectrometer and CalMAN analysis software. The Tab S4 has different display modes like its predecessors. The device is set to adaptive display by default, which automatically adjusts the colour mode according to the content that is being displayed onscreen. There are three colour profiles too, which we also examined in greater detail.
The Tab S4 has strikingly good colour accuracy, albeit it is not quite at the level of its predecessor’s. The difference is only noticeable when examining the display data in CalMAN and not to the naked eye. The different profiles all produce similar results but use different colour spaces. All profiles reproduce greyscale practically identically, while there are only subtle differences with mixed colours. Red accuracy is an issue with all profiles though. In short, the lower the average Delta E divergence, the higher the gap to the red divergence.


Display Response Times
| ↔ Response Time Black to White | ||
|---|---|---|
| 4 ms ... rise ↗ and fall ↘ combined | ↗ 2 ms rise | 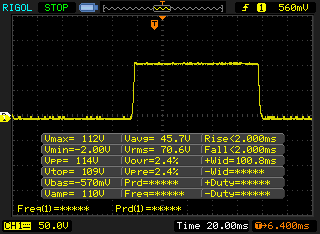 |
| ↘ 2 ms fall | ||
| The screen shows very fast response rates in our tests and should be very well suited for fast-paced gaming. In comparison, all tested devices range from 0.1 (minimum) to 240 (maximum) ms. » 16 % of all devices are better. This means that the measured response time is better than the average of all tested devices (19.8 ms). | ||
| ↔ Response Time 50% Grey to 80% Grey | ||
| 4.8 ms ... rise ↗ and fall ↘ combined | ↗ 2.8 ms rise | 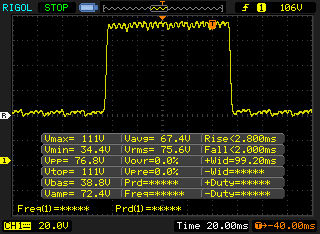 |
| ↘ 2 ms fall | ||
| The screen shows very fast response rates in our tests and should be very well suited for fast-paced gaming. In comparison, all tested devices range from 0.165 (minimum) to 636 (maximum) ms. » 17 % of all devices are better. This means that the measured response time is better than the average of all tested devices (30.9 ms). | ||
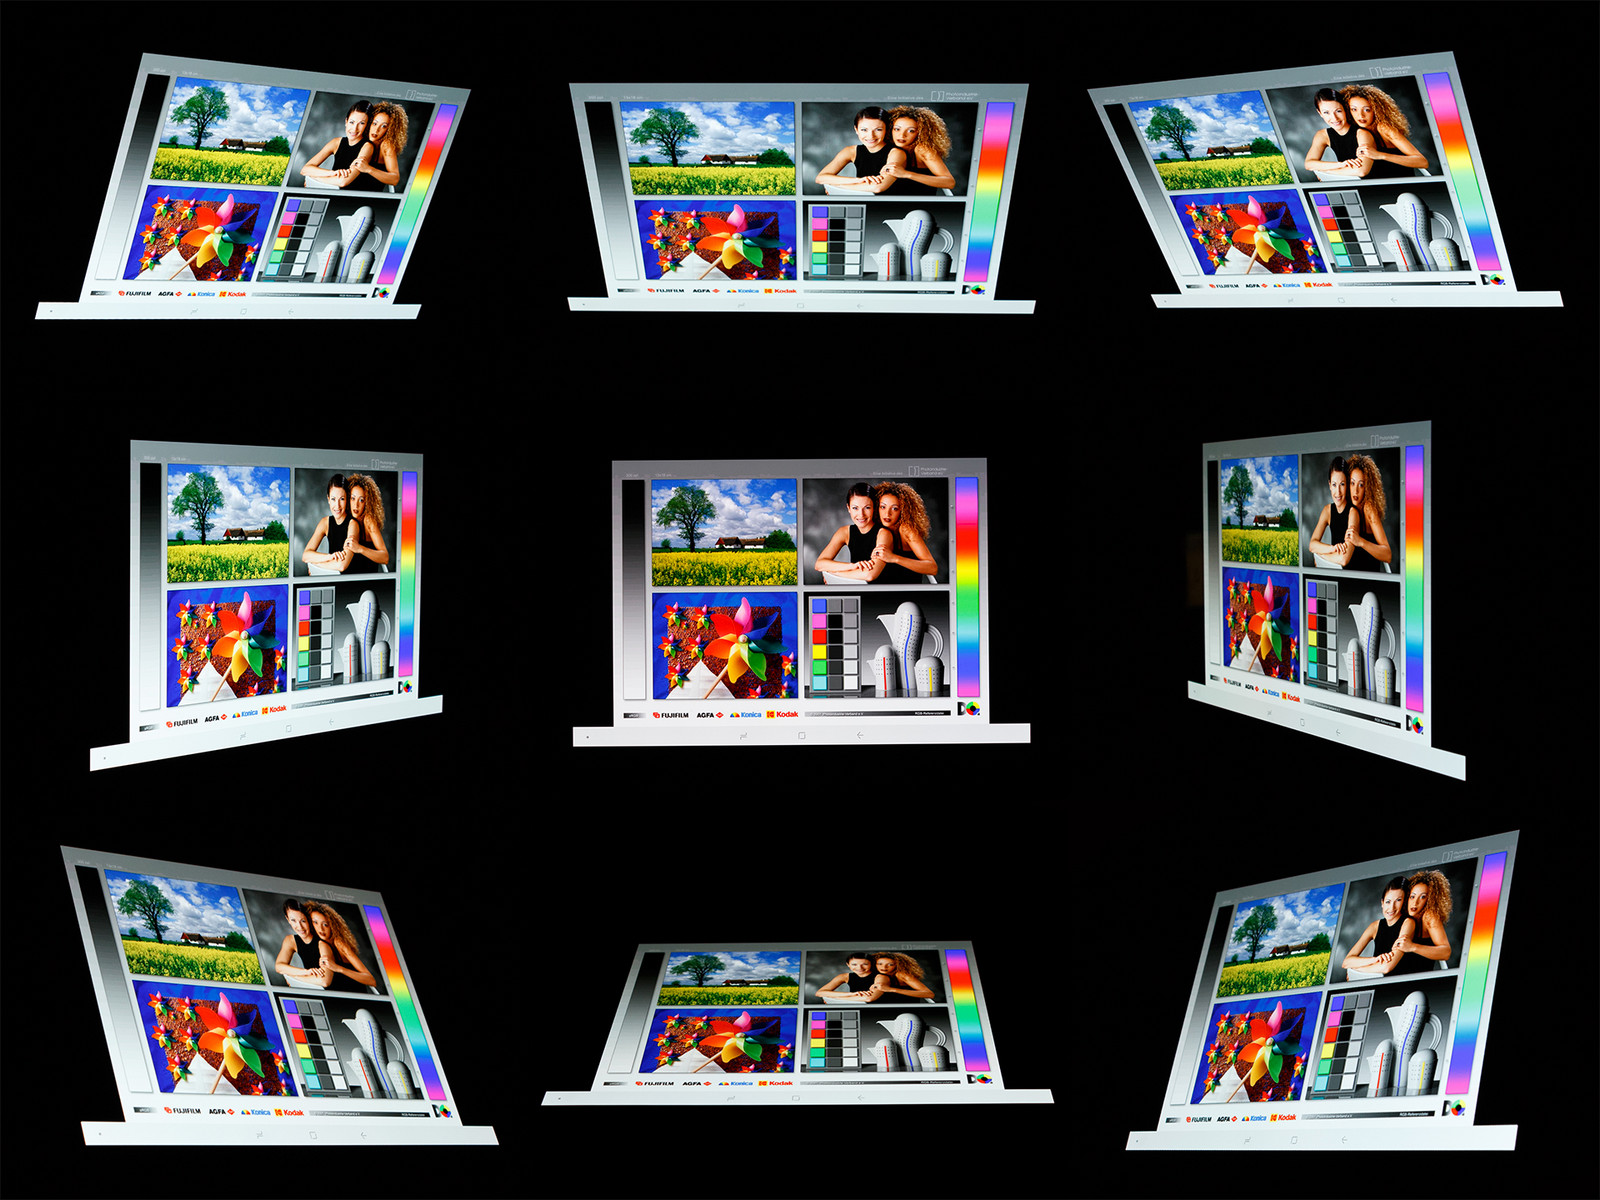
The Tab S4 is easy to use outdoors thanks to bright display. The ambient light sensor worked well throughout testing and reliably adjusted display brightness to changing lighting conditions. We only struggled to read the display when we used the device in direct sunlight, as the display’s glossy finish is highly reflective.
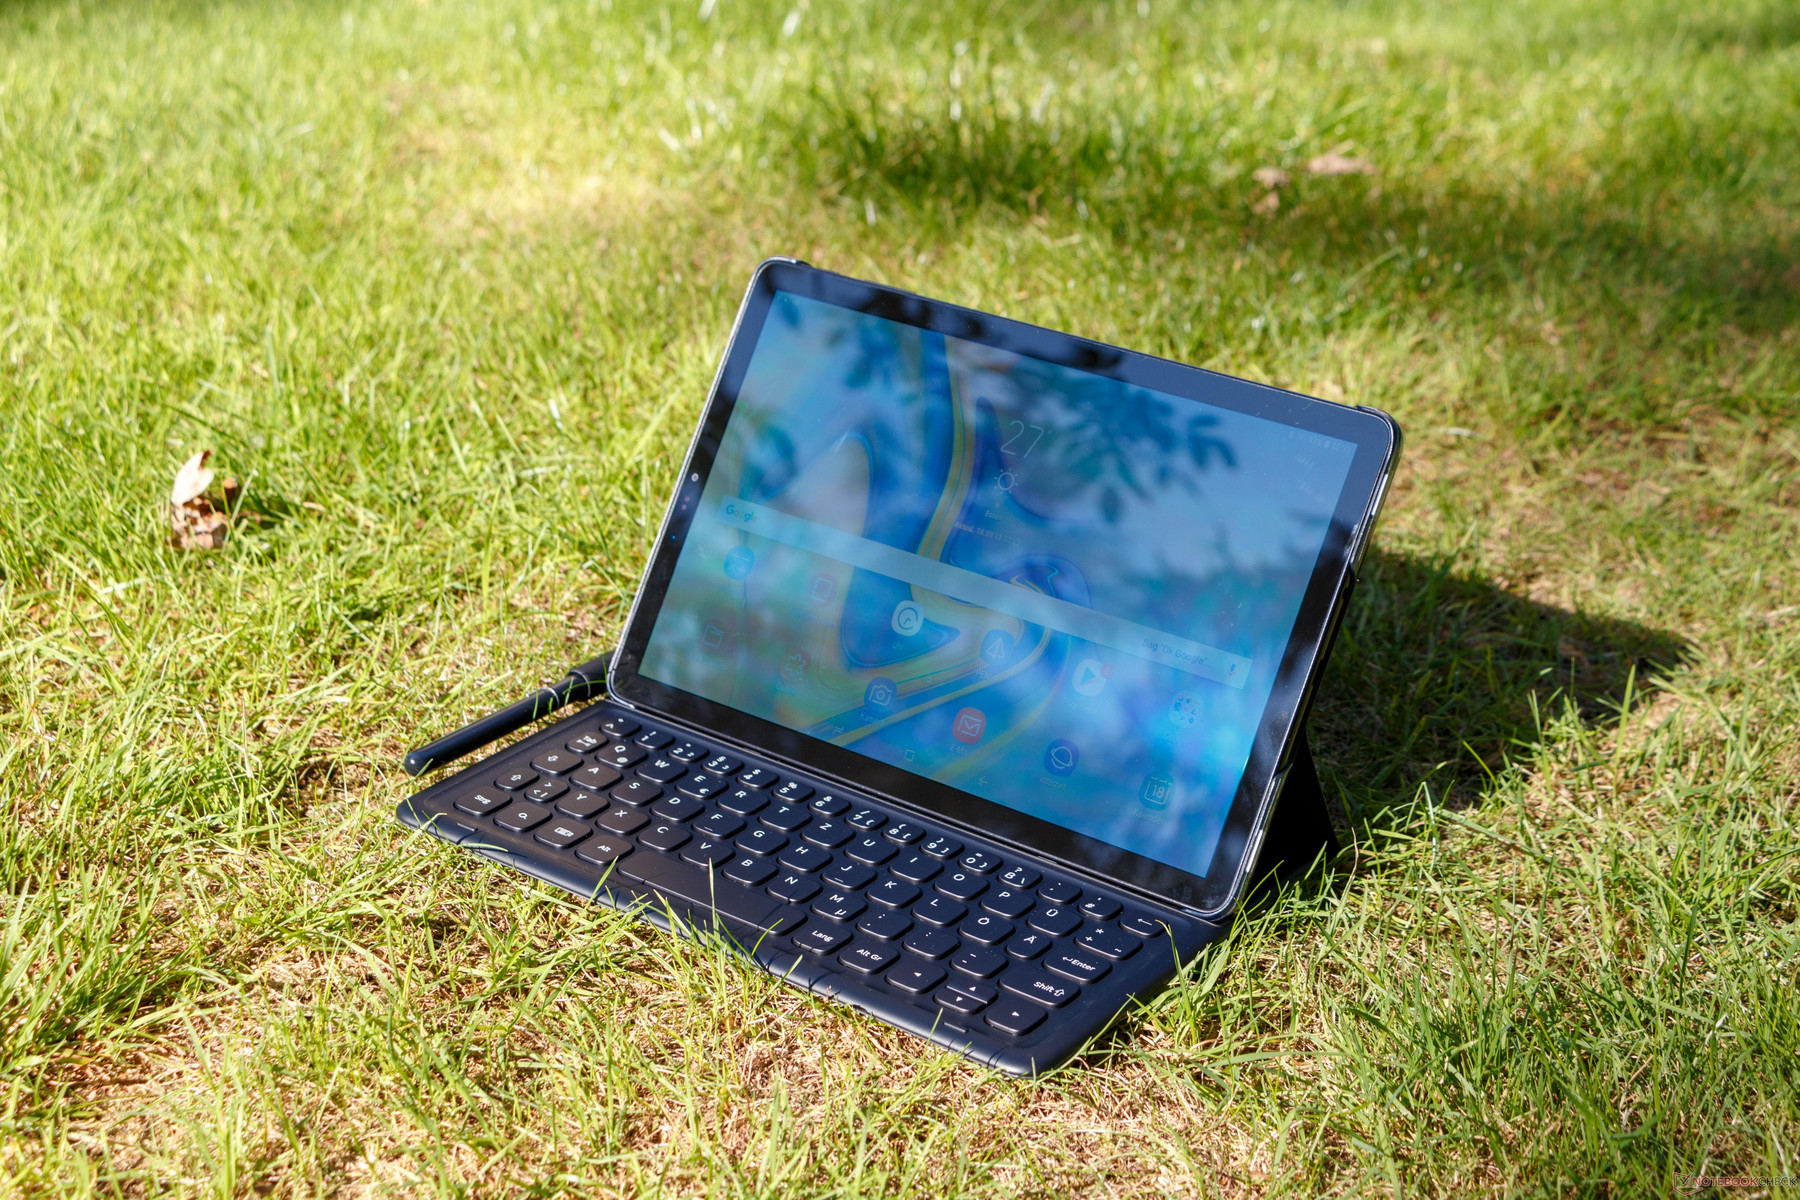
The Tab S4 has strong viewing angles thanks to its AMOLED display. We did not notice any brightness or colour distortions even at acute viewing angles. Moreover, our test device did not even exhibit an OLED-typical green shimmer when looking at the display from tight angles, which is impressive.
Performance
Samsung has equipped the Tab S4 with a Qualcomm Snapdragon 835 SoC, a 2017 flagship-level chip that is out of place in a premium mobile device released by an established manufacturer in 2018. Samsung complements the SoC with 4 GB RAM, which is also unremarkable for a high-end 2018 device and is something that we have started to see in upper mid-range devices. By contrast, some flagship-level smartphones like the OnePlus 6T have up to 8 GB of RAM.
The Tab S4 has more powerful hardware than many of our comparison devices though and so scores comparatively highly in CPU benchmarks. Our test device finishes second to the iPad Pro 10.5 in all benchmarks that we conducted on both devices. Moreover, system performance is good and multitasking worked without issue throughout testing.
| AnTuTu v7 - Total Score | |
| Average Qualcomm Snapdragon 835 (8998) (201881 - 217442, n=8) | |
| Samsung Galaxy Tab S4 | |
| Huawei MediaPad M5 10.8 Pro | |
| Amazon Fire HD 10 2017 | |
| Lightmark - 1920x1080 1080p | |
| Average Qualcomm Snapdragon 835 (8998) (32.1 - 38.7, n=5) | |
| Samsung Galaxy Tab S3 SM-T825 | |
| Basemark ES 3.1 / Metal - offscreen Overall Score | |
| Average of class Tablet (255 - 5784, n=6, last 2 years) | |
| Average Qualcomm Snapdragon 835 (8998) (733 - 889, n=6) | |
| Samsung Galaxy Tab S3 SM-T825 | |
Our test device consistently finishes below the iPad Pro 10.5 in browser benchmarks too. Subjectively, web-browsing feels snappy on the default Samsung Browser 8.0 and gave rise to no complaints during testing.
| Octane V2 - Total Score | |
| Average of class Tablet (1633 - 138481, n=70, last 2 years) | |
| Apple iPad Pro 10.5 2017 (Safari Mobile 10) | |
| Samsung Galaxy Tab S4 (Samsung Browser 8.0) | |
| Huawei MediaPad M5 10.8 Pro (Chrome 68.0.3440.91) | |
| Average Qualcomm Snapdragon 835 (8998) (3086 - 14300, n=20) | |
| Samsung Galaxy Tab S3 SM-T825 (Samsung Browser 5.2) | |
| Acer Iconia Tab 10 A3-A50 (Browser: Chrome Version 63) | |
| Amazon Fire HD 10 2017 (Amazon Silk 61.2) | |
| WebXPRT 2015 - Overall | |
| Apple iPad Pro 10.5 2017 (Safari Mobile 10) | |
| Samsung Galaxy Tab S4 (Samsung Browser 8.0) | |
| Huawei MediaPad M5 10.8 Pro (Chrome 68.0.3440.91) | |
| Average Qualcomm Snapdragon 835 (8998) (57 - 204, n=17) | |
| Amazon Fire HD 10 2017 (Amazon Silk 61.2) | |
| Samsung Galaxy Tab S3 SM-T825 (Samsung Browser 5.2) | |
| JetStream 1.1 - 1.1 Total | |
| Apple iPad Pro 10.5 2017 (Safari Mobile 10) | |
| Average Qualcomm Snapdragon 835 (8998) (52.9 - 80.4, n=19) | |
| Samsung Galaxy Tab S4 (Samsung Browser 8.0) | |
| Huawei MediaPad M5 10.8 Pro (Chrome 68.0.3440.91) | |
| Acer Iconia Tab 10 A3-A50 (Browser: Chrome Version 63) | |
| Amazon Fire HD 10 2017 (Amazon Silk 61.2) | |
| Samsung Galaxy Tab S3 SM-T825 (Samsung Browser 5.2) | |
| Mozilla Kraken 1.1 - Total | |
| Amazon Fire HD 10 2017 (Amazon Silk 61.2) | |
| Acer Iconia Tab 10 A3-A50 (Browser: Chrome Version 63) | |
| Huawei MediaPad M5 10.8 Pro (Chrome 68.0.3440.91) | |
| Average Qualcomm Snapdragon 835 (8998) (2425 - 4813, n=19) | |
| Samsung Galaxy Tab S4 (Samsung Browser 8.0) | |
| Samsung Galaxy Tab S3 SM-T825 (Samsung Browser 5.2) | |
| Average of class Tablet (243 - 16233, n=65, last 2 years) | |
| Apple iPad Pro 10.5 2017 (Safari Mobile 10) | |
* ... smaller is better
Samsung has equipped the Tab S4 with UHS 2.1 internal storage, which is considerably faster than all the comparison devices in our comparison table. No comparable Android tablet can compete in this regard.
The microSD card reader is fast too, but it cannot take full advantage of our Toshiba Exceria Pro M501 reference card’s full potential. Moreover, the microSD card reader is slower than the one in the Huawei MediaPad M5 10.8 and is only noticeably faster than the Fire HD 10 (2017) out of our comparison devices.
| Samsung Galaxy Tab S4 | Samsung Galaxy Tab S3 SM-T825 | Huawei MediaPad M5 10.8 Pro | Amazon Fire HD 10 2017 | Acer Iconia Tab 10 A3-A50 | Average 64 GB UFS 2.1 Flash | Average of class Tablet | |
|---|---|---|---|---|---|---|---|
| AndroBench 3-5 | -39% | -34% | -52% | -48% | 38% | 563% | |
| Sequential Read 256KB (MB/s) | 741 | 288.6 -61% | 278.6 -62% | 262.2 -65% | 173.7 -77% | 696 ? -6% | 2074 ? 180% |
| Sequential Write 256KB (MB/s) | 195.8 | 87.6 -55% | 94.1 -52% | 147.7 -25% | 92.4 -53% | 224 ? 14% | 1666 ? 751% |
| Random Read 4KB (MB/s) | 142 | 45.82 -68% | 27.41 -81% | 27.72 -80% | 13.7 -90% | 137.2 ? -3% | 276 ? 94% |
| Random Write 4KB (MB/s) | 24.43 | 13.13 -46% | 15.35 -37% | 9.37 -62% | 8.77 -64% | 84.7 ? 247% | 324 ? 1226% |
| Sequential Read 256KB SDCard (MB/s) | 80.1 ? | 76.4 ? -5% | 84.9 ? 6% | 55.5 ? -31% | 80.4 ? 0% | 68.6 ? -14% | |
| Sequential Write 256KB SDCard (MB/s) | 59.1 ? | 58.6 ? -1% | 73.1 ? 24% | 30.14 ? -49% | 56.8 ? -4% | 52.2 ? -12% |
Games
The Snapdragon 835 SoC integrates a Qualcomm Adreno 540 GPU, which is still a powerful GPU by today’s standards despite it being over 18 months old. The GPU combines well with the Tab S4’s large high-resolution display and its quad-speakers to deliver a great gaming experience.
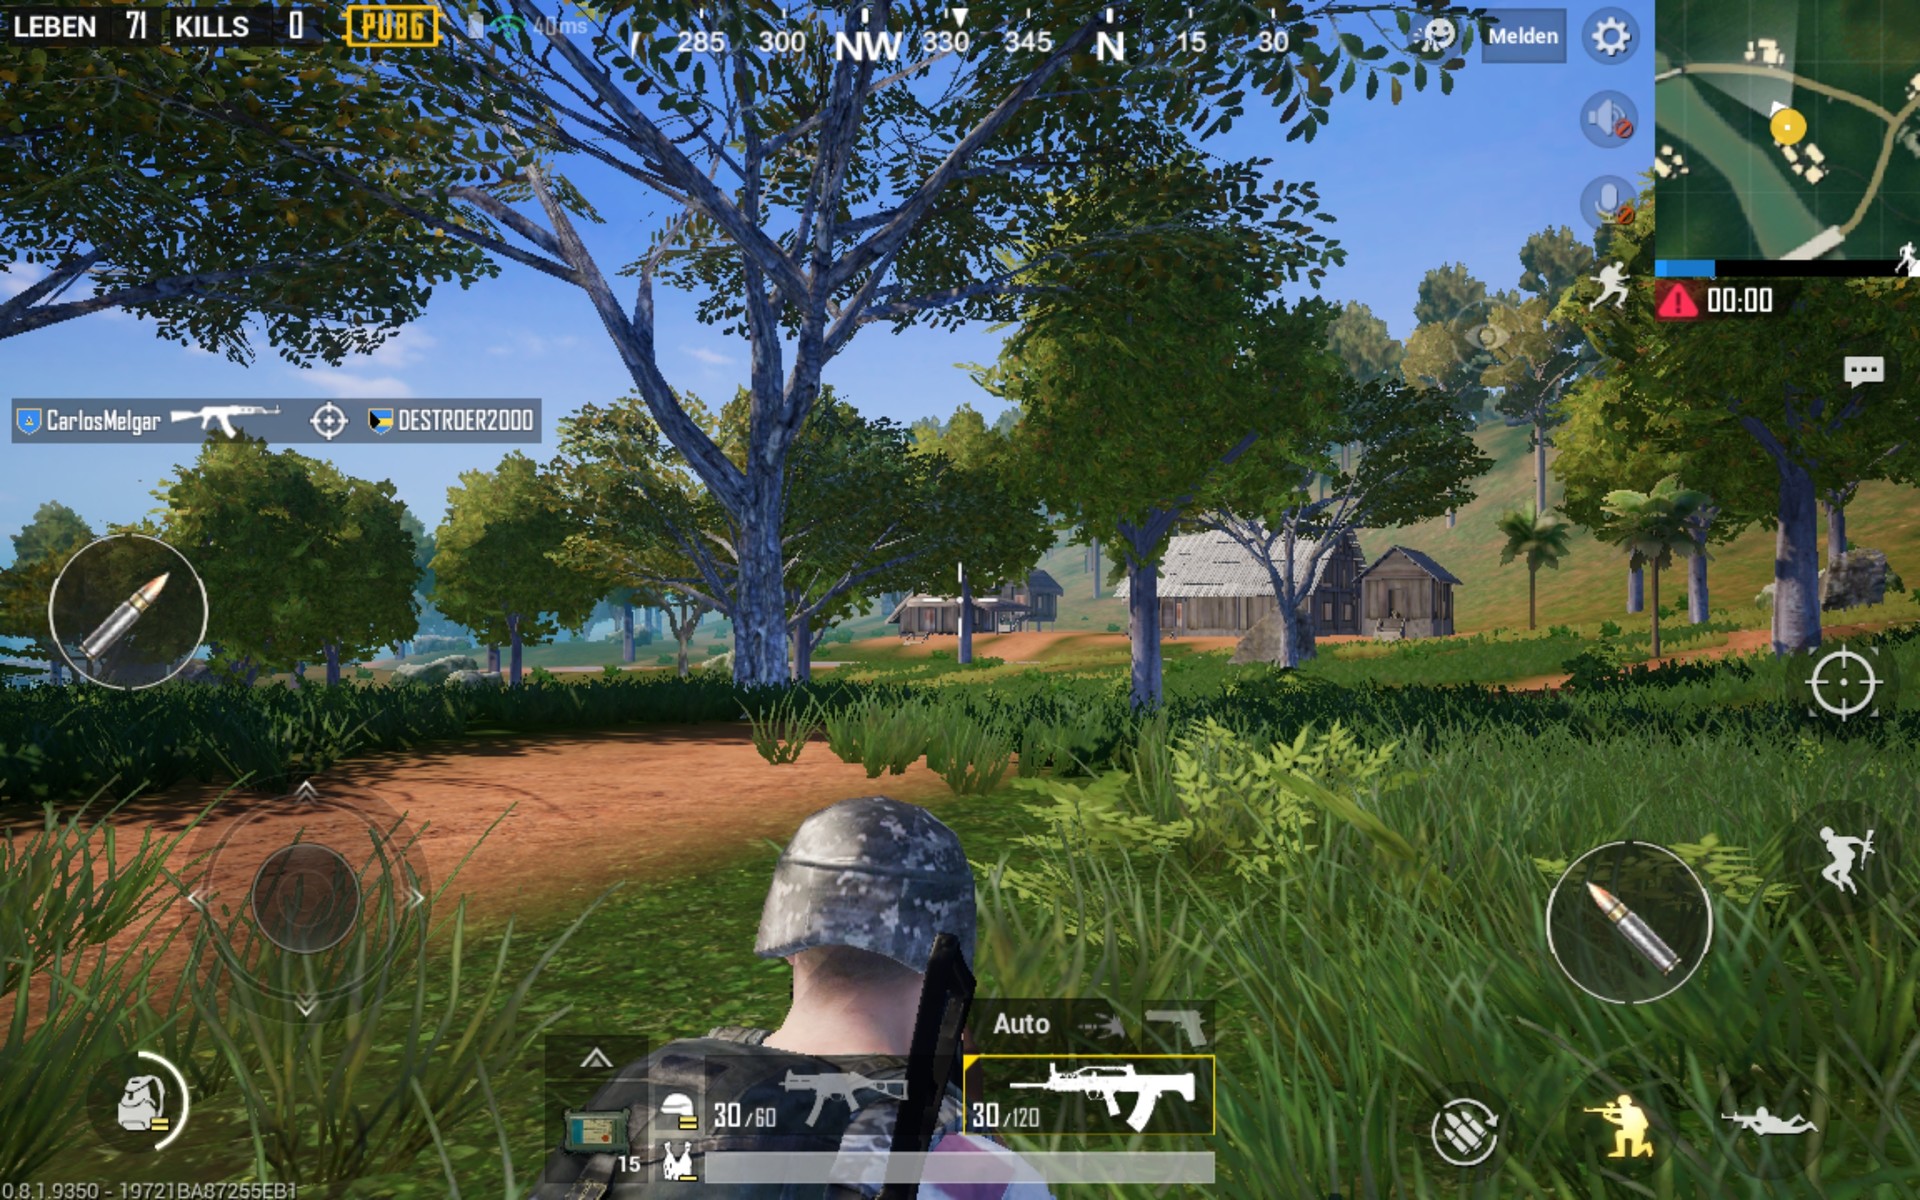
Unfortunately, games are only playable in tablet mode, which rules out using DeX to play games like PUBG Mobile on an external monitor with a mouse and keyboard. This limitation is unfortunate as the Tab S4 render even complex games at playable frame rates. Our test device achieved stable frame rates in GameBench too. The only drawback of playing games on the Tab S4 is its size, which could prove cumbersome when gaming while holding the device in your hand for a prolonged period.
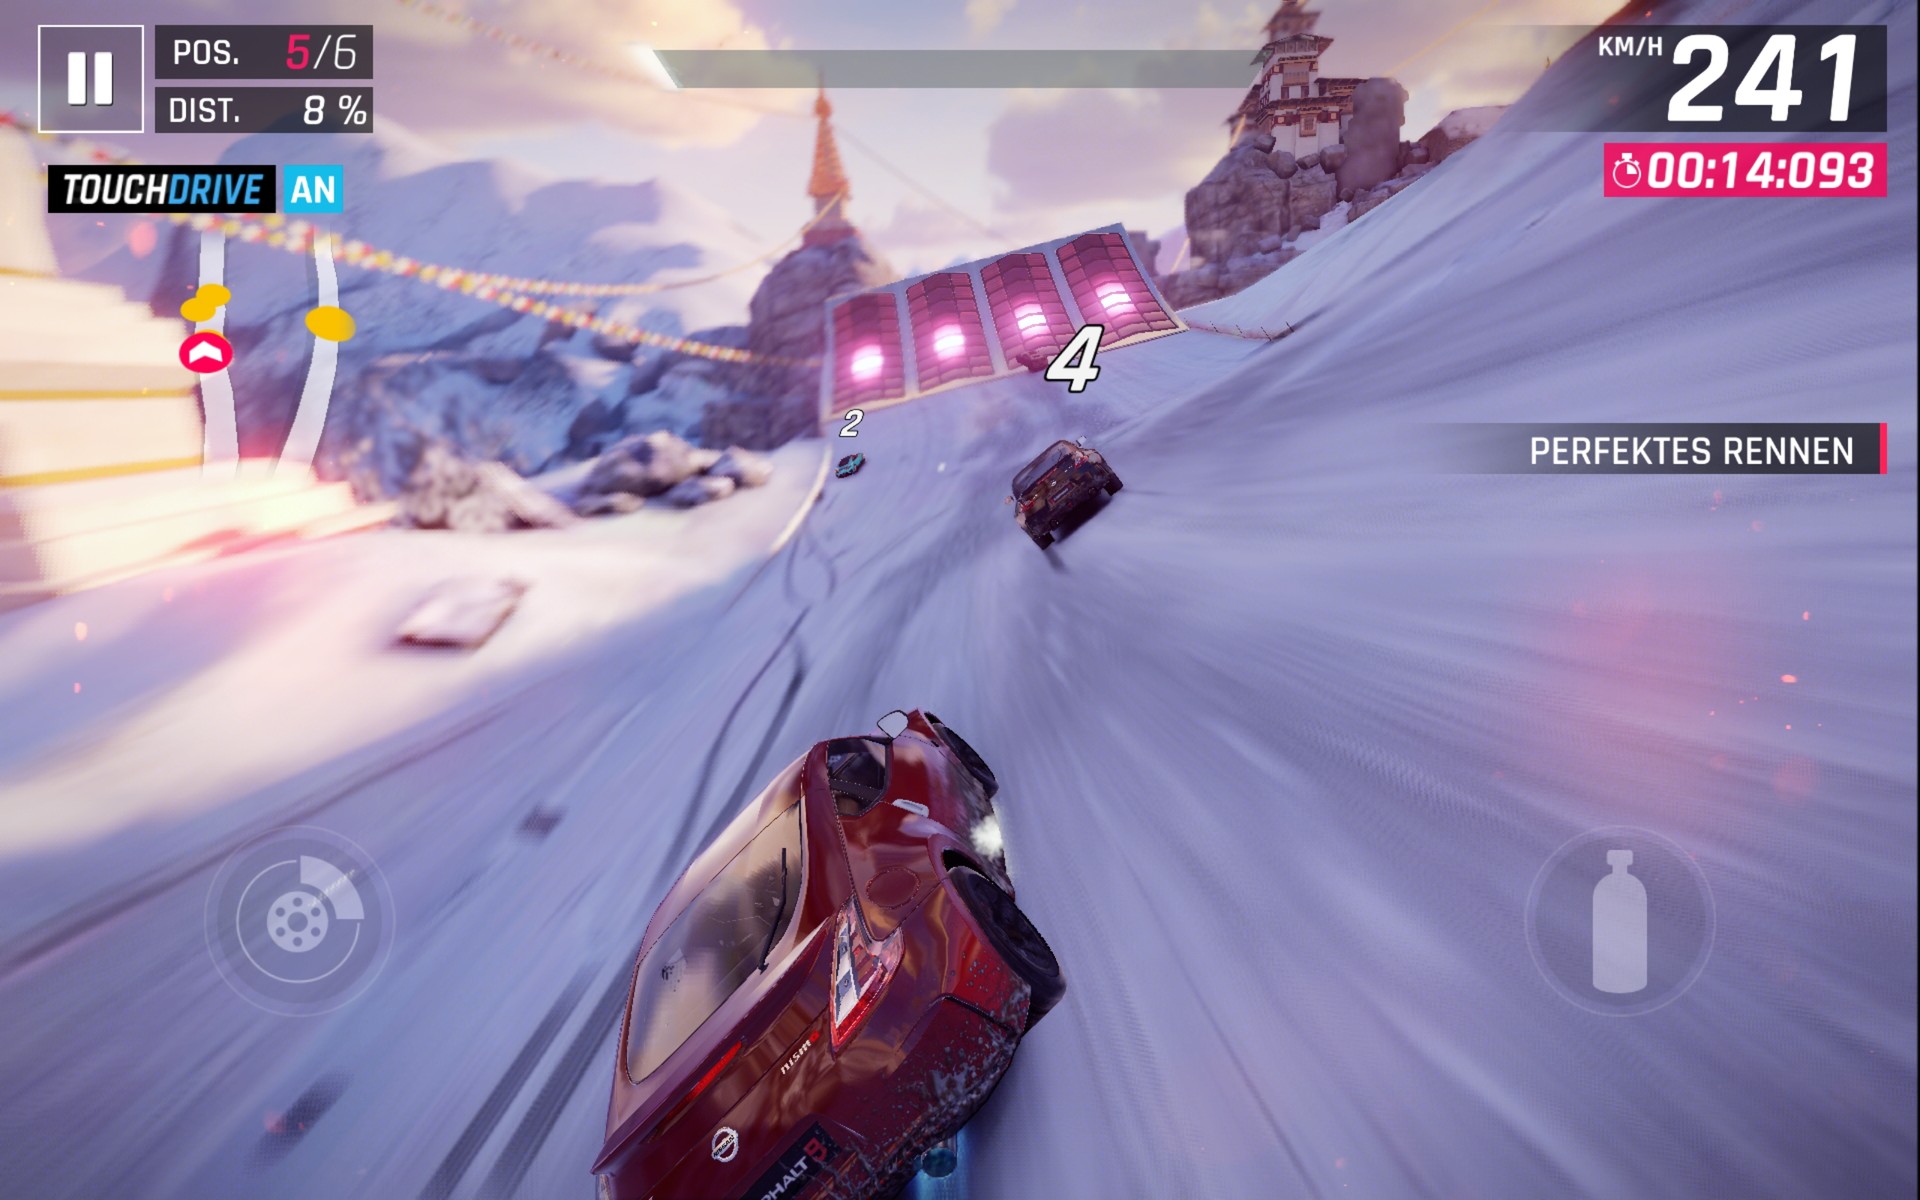
Asphalt 9: Legends
PUBG Mobile
Emissions
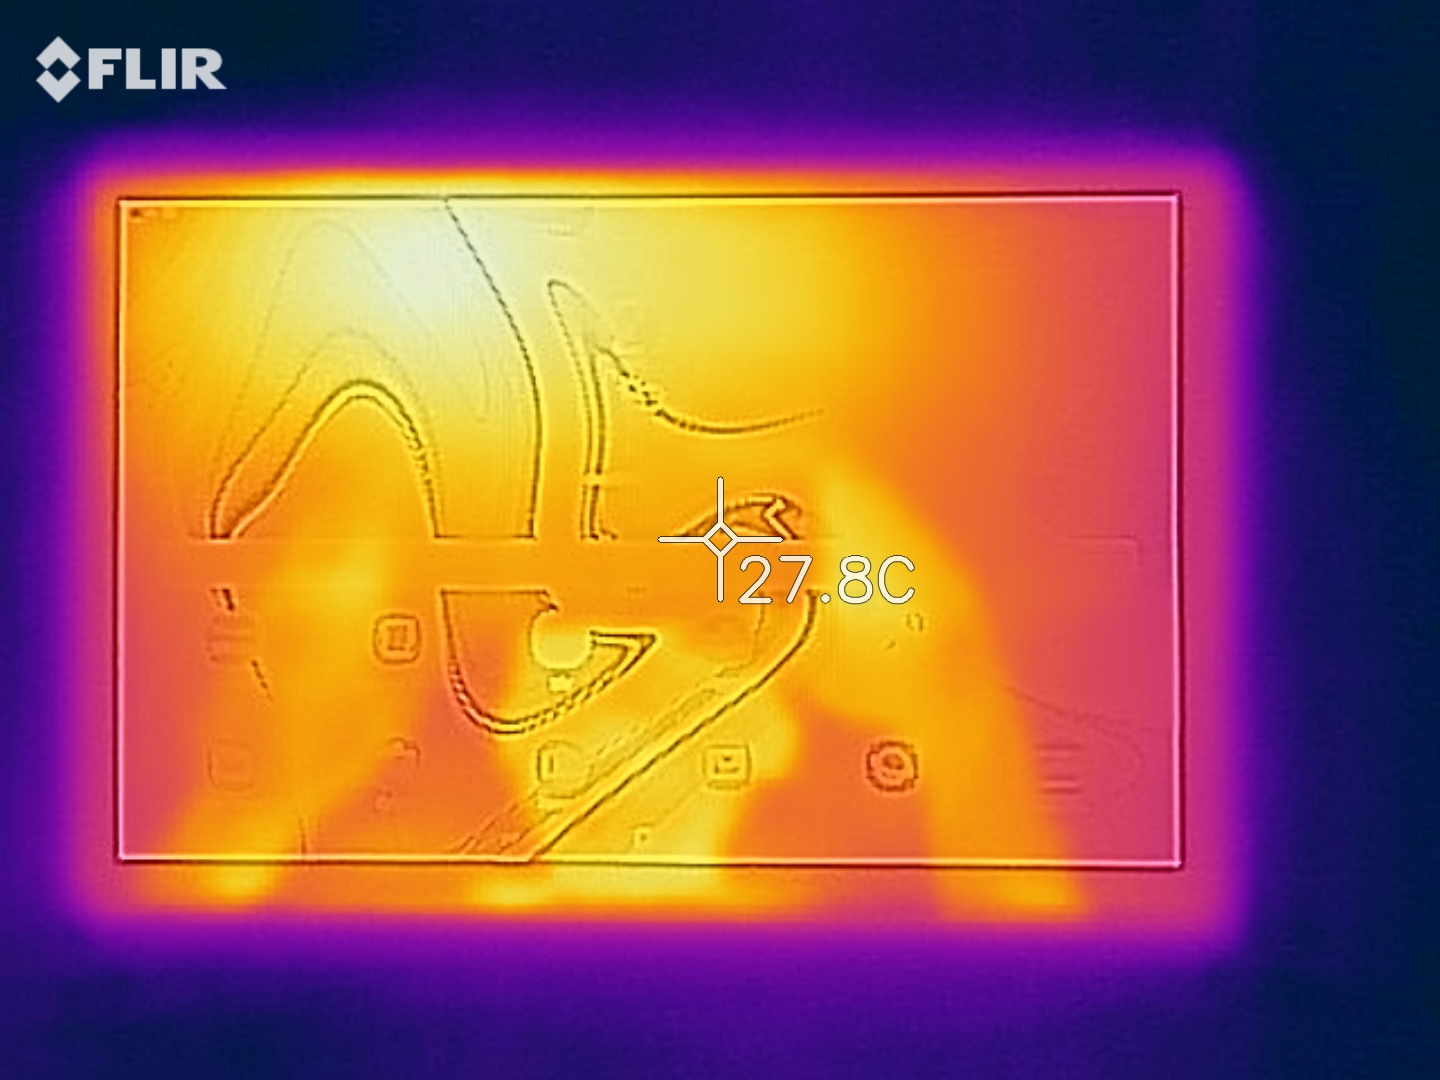
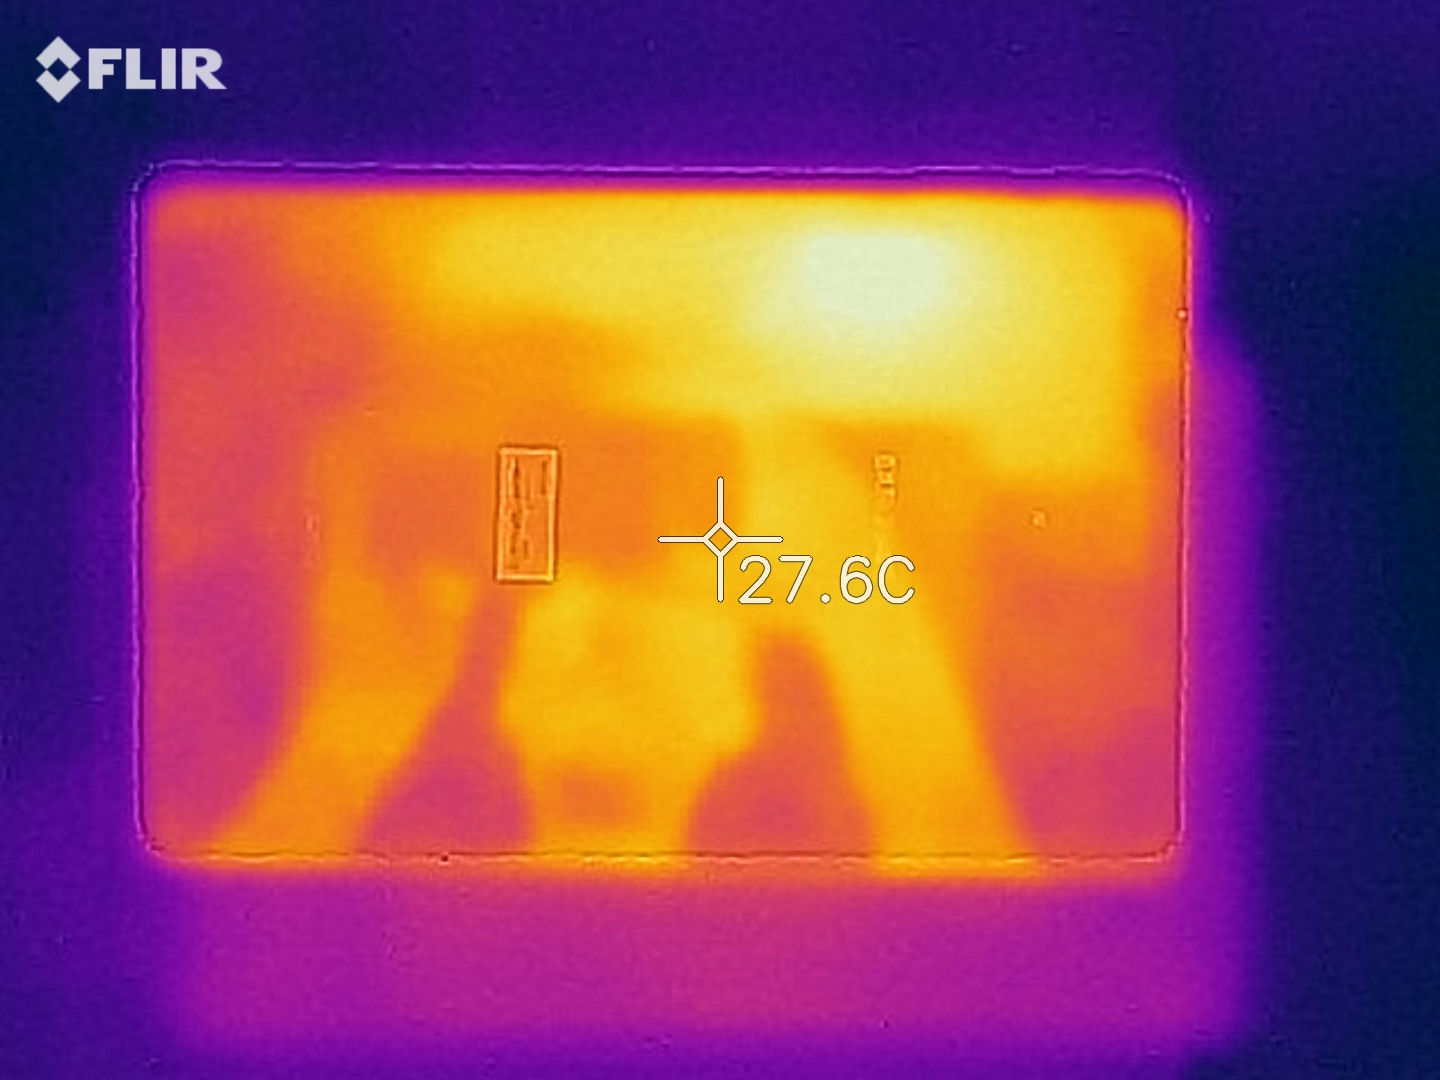
Temperature
The Tab S4 manages its temperatures exceptionally well. Surface temperatures on our test device reached a maximum of 28 °C on the display at idle and averaged 26.2 °C across the entire device. Impressively, surface temperatures only rise to a maximum of 31.4 °C under sustained load and average below 30 °C. No smartphone or laptop can manage its surface temperatures to the same degree as the Tab S4 can.
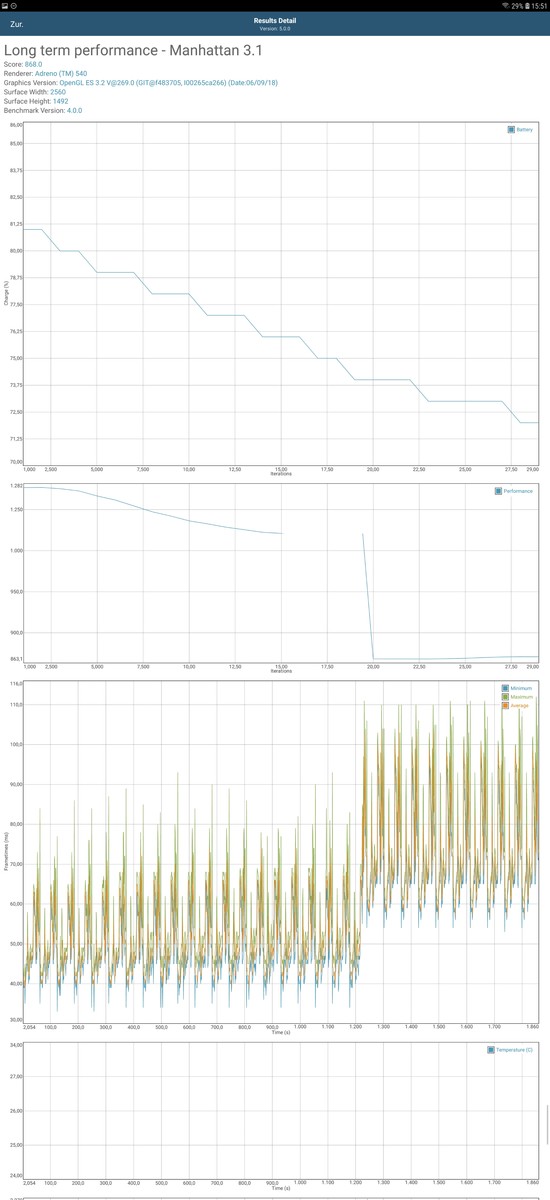
We checked how well our test device maintained peak performance under sustained load by running GFXBench battery tests on a loop and measuring changes in FPS per benchmark run through. Frame rates dropped steadily throughout the Manhattan looped benchmark, but the Tab S4 maintained around two-thirds of its initial performance by the final run through, which is a decent result. Overall, the Tab S4 should not thermal throttle even during long gaming sessions.
(+) The maximum temperature on the upper side is 31.4 °C / 89 F, compared to the average of 33.7 °C / 93 F, ranging from 20.7 to 53.2 °C for the class Tablet.
(+) The bottom heats up to a maximum of 30.2 °C / 86 F, compared to the average of 33.2 °C / 92 F
(+) In idle usage, the average temperature for the upper side is 26.8 °C / 80 F, compared to the device average of 30 °C / 86 F.
Speakers
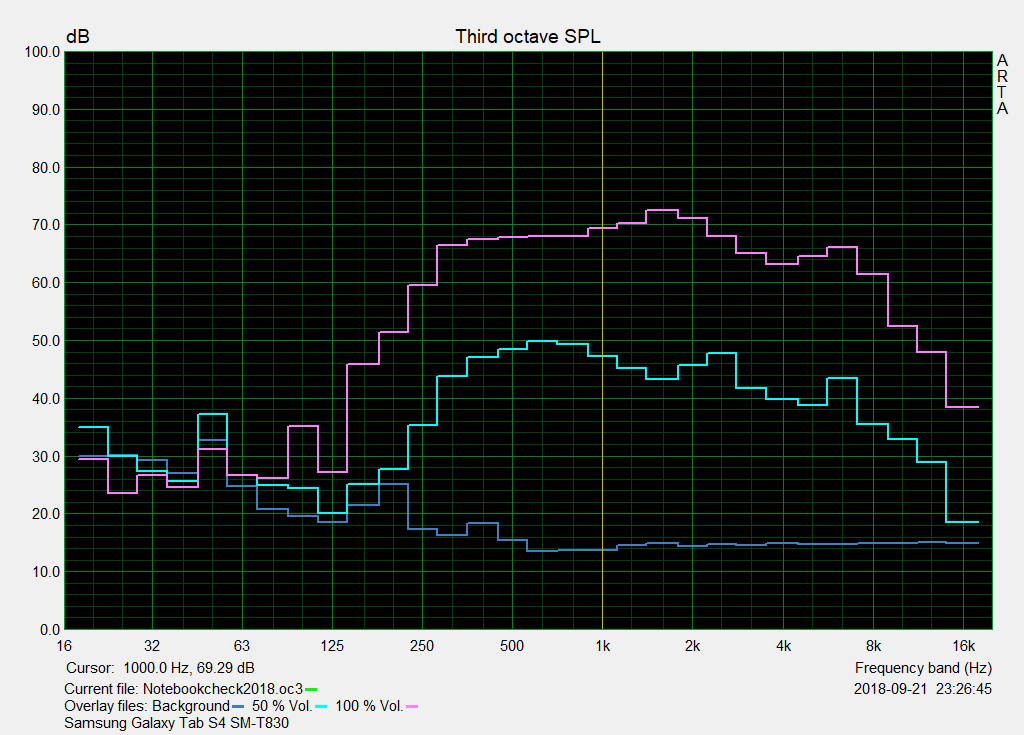
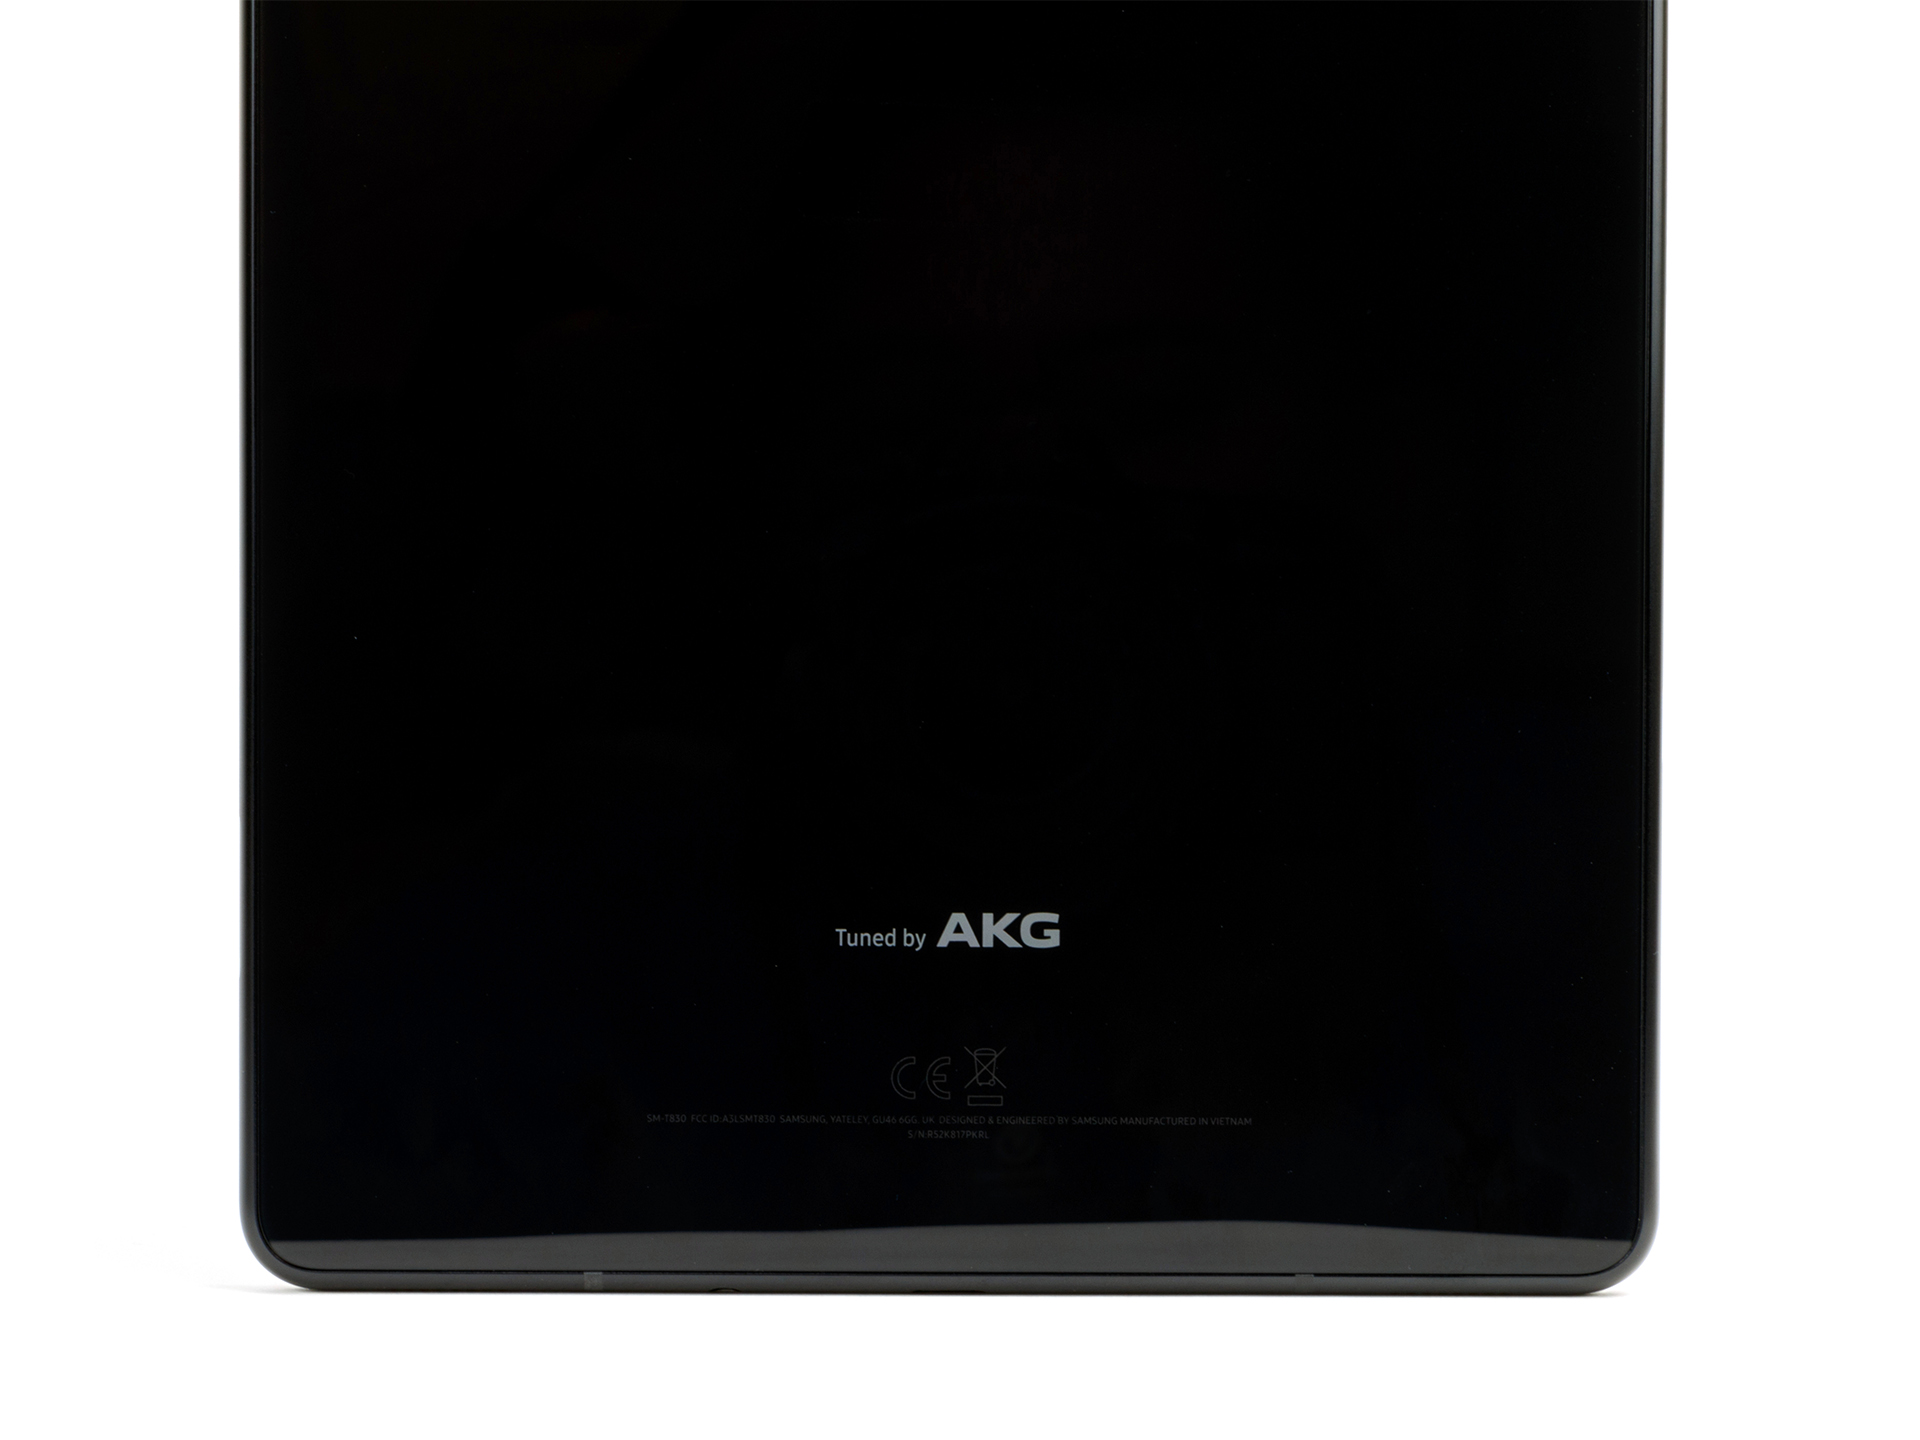
Samsung collaborated with AKG and Harman to create the Tab S4’s quad-speakers. The speakers automatically adjust to the orientation in which the tablet is being held for a consistent sound experience, which works well in practice.
The speakers sound great too, albeit there is a noticeable lack of bass. Our test device reproduces deep mid-tones well that help to create an impressive sound quality overall. The speakers sound loud at maximum volume, but we measure a lower dB(A) than the speakers on the Tab S3.
The Tab S4 also supports wired or wireless audio output using the 3.5 mm jack and Bluetooth 5.0 respectively. The latter supports aptX and LDAC, which ensure good sound quality over Bluetooth.
Samsung Galaxy Tab S4 audio analysis
(±) | speaker loudness is average but good (80.1 dB)
Bass 100 - 315 Hz
(-) | nearly no bass - on average 18% lower than median
(-) | bass is not linear (18.7% delta to prev. frequency)
Mids 400 - 2000 Hz
(+) | balanced mids - only 4.3% away from median
(+) | mids are linear (1.9% delta to prev. frequency)
Highs 2 - 16 kHz
(+) | balanced highs - only 3.3% away from median
(±) | linearity of highs is average (7% delta to prev. frequency)
Overall 100 - 16.000 Hz
(±) | linearity of overall sound is average (19.2% difference to median)
Compared to same class
» 53% of all tested devices in this class were better, 6% similar, 41% worse
» The best had a delta of 7%, average was 20%, worst was 129%
Compared to all devices tested
» 46% of all tested devices were better, 7% similar, 46% worse
» The best had a delta of 4%, average was 23%, worst was 134%
Huawei MediaPad M5 10.8 Pro audio analysis
(+) | speakers can play relatively loud (84.6 dB)
Bass 100 - 315 Hz
(-) | nearly no bass - on average 73.6% lower than median
(+) | bass is linear (0% delta to prev. frequency)
Mids 400 - 2000 Hz
(-) | nearly no mids - on average 73.6% lower than median
(+) | mids are linear (0% delta to prev. frequency)
Highs 2 - 16 kHz
(-) | nearly no highs - on average 73.6% lower than median
(+) | highs are linear (0% delta to prev. frequency)
Overall 100 - 16.000 Hz
(-) | overall sound is not linear (110.3% difference to median)
Compared to same class
» 98% of all tested devices in this class were better, 1% similar, 1% worse
» The best had a delta of 7%, average was 20%, worst was 129%
Compared to all devices tested
» 96% of all tested devices were better, 0% similar, 4% worse
» The best had a delta of 4%, average was 23%, worst was 134%
Power Management
Power Consumption
The Tab S4 has a 7,300 mAh battery, which is significantly larger than the 6,000 mAh battery found in its predecessor. The newer tablet has lower power consumption under load, primarily because of its more efficient SoC. However, our test device consumes more power on average than the Tab S3 at idle because of the former’s larger and higher resolution display. We also measured our test device consuming 2.53 W more at maximum brightness with the ambient light sensor activated to when it was deactivated.
Samsung has included the same charger as it did with the Tab S3. Predictably, the larger battery takes longer to charge; our test device takes around two-and-a-half hours to recharge fully with the included charger.
| Off / Standby | |
| Idle | |
| Load |
|
Key:
min: | |
| Samsung Galaxy Tab S4 7300 mAh | Samsung Galaxy Tab S3 SM-T825 6000 mAh | Apple iPad Pro 10.5 2017 8134 mAh | Huawei MediaPad M5 10.8 Pro 7500 mAh | Amazon Fire HD 10 2017 6300 mAh | Acer Iconia Tab 10 A3-A50 6100 mAh | |
|---|---|---|---|---|---|---|
| Power Consumption | -8% | -41% | -74% | -15% | -64% | |
| Idle Minimum * (Watt) | 1.76 | 2.08 -18% | 1.44 18% | 3.3 -88% | 1.55 12% | 3.21 -82% |
| Idle Average * (Watt) | 4.22 | 3.5 17% | 6.12 -45% | 4.2 -0% | 4.17 1% | 5.97 -41% |
| Idle Maximum * (Watt) | 4.25 | 3.58 16% | 6.14 -44% | 7 -65% | 4.25 -0% | 6.19 -46% |
| Load Average * (Watt) | 4.52 | 6.97 -54% | 8.55 -89% | 10.4 -130% | 7.13 -58% | 9.72 -115% |
| Load Maximum * (Watt) | 7.35 | 7.4 -1% | 10.62 -44% | 13.8 -88% | 9.63 -31% | 9.97 -36% |
* ... smaller is better
Battery Life
The Tab S4 has good, albeit comparatively disappointing, battery life. Our test device lasted longer than all our comparison devices in our looped H.264 video battery life test, which is surprising as the iPad Pro 10.5 and the MediaPad M5 10.8 Pro both have larger batteries than the Galaxy Tab S4. Our test device also finished third in our battery life under sustained load test, but the H.264 video test is the only battery life test in which the Tab S4 excelled.
Surprisingly, the Tab S3 lasted over 50% longer in three of our four battery life tests despite having marginally worse power consumption and a smaller battery capacity. Something seems amiss here though that we hope that Samsung will address in an update.
| Samsung Galaxy Tab S4 7300 mAh | Samsung Galaxy Tab S3 SM-T825 6000 mAh | Apple iPad Pro 10.5 2017 8134 mAh | Huawei MediaPad M5 10.8 Pro 7500 mAh | Amazon Fire HD 10 2017 6300 mAh | Acer Iconia Tab 10 A3-A50 6100 mAh | |
|---|---|---|---|---|---|---|
| Battery runtime | 34% | 18% | 3% | -6% | -30% | |
| Reader / Idle (h) | 20.5 | 31.7 55% | 33.9 65% | 20.9 2% | 16 -22% | 12.3 -40% |
| H.264 (h) | 12.3 | 9.2 -25% | 10.5 -15% | 10.5 -15% | 9.8 -20% | |
| WiFi v1.3 (h) | 8.3 | 12.7 53% | 11.6 40% | 11.2 35% | 9 8% | 6.5 -22% |
| Load (h) | 4.1 | 6.3 54% | 3.3 -20% | 3.7 -10% | 4.6 12% | 2.9 -29% |
Pros
Cons
Verdict
The Samsung Galaxy Tab S4 is currently the strongest Android tablet on the market. The great Super AMOLED display is particularly convincing, while its DeX integration is great for productivity, although there are limitations with its use for gaming and multimedia. The 64 GB of storage and 4 GB of RAM are plentiful too, although it is a shame that Samsung does not sell the 256 GB in more regions and currently limits it to only the Wi-Fi version. The battery-less S Pen remains a great tool too.
The Samsung Galaxy Tab S4 is a fantastic tablet that takes the Android tablet crown thanks to its great display and the current lack of viable alternatives.
However, Samsung has missed the mark in trying to create a high-end tablet with a suitably premium feeling. The company has equipped the Tab S4 with last year’s flagship SoC, while its storage, RAM and cameras are more befitting of a mid-range smartphone than a 2018 flagship device. The plastic S Pen and optional keyboard cover only add to our impression that Samsung could have gone further in delivering a flagship-level tablet experience.
The Tab S4 starts at $649.99 (£599) on Samsung’s website, which rises to $749 for the 256 GB Wi-Fi version in the United States and to $729.99 (£649) for the LTE variant. However, most Android tablets are considerably cheaper, of which the Huawei MediaPad M5 Pro is currently the best alternative. Its optional accessories are hard to come by though, and it falls just short of the Tab S4 overall too.
Samsung Galaxy Tab S4
- 08/31/2022 v7 (old)
Daniel Schmidt
Price comparison

