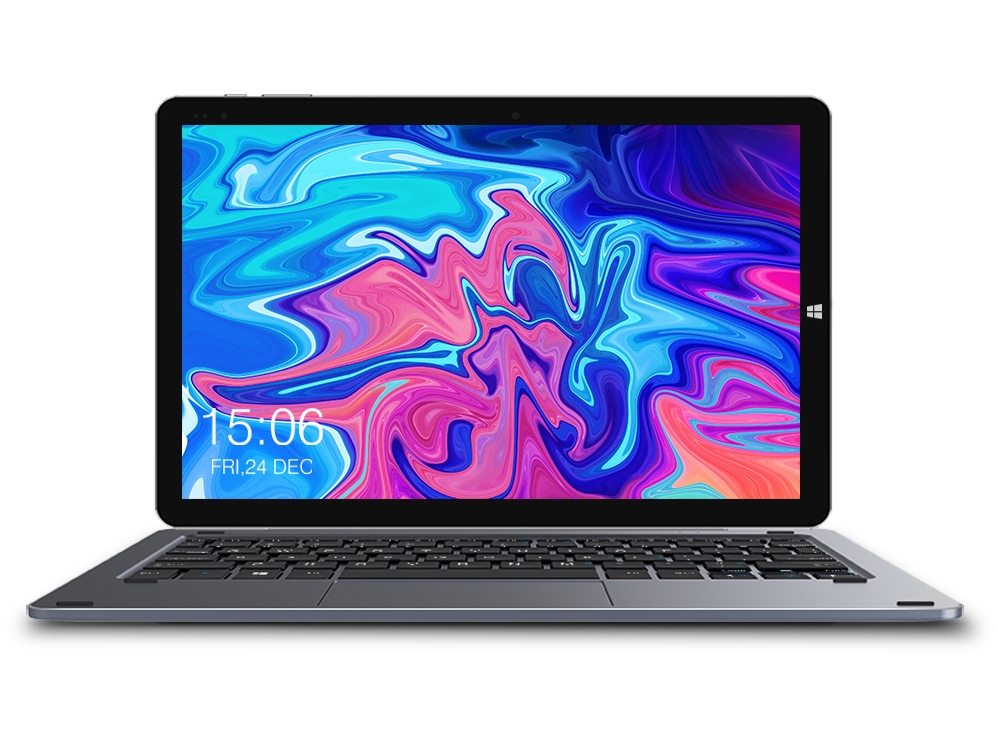
Chuwi UBook CWI509 Tablet Review: The Surface Go Wannabe
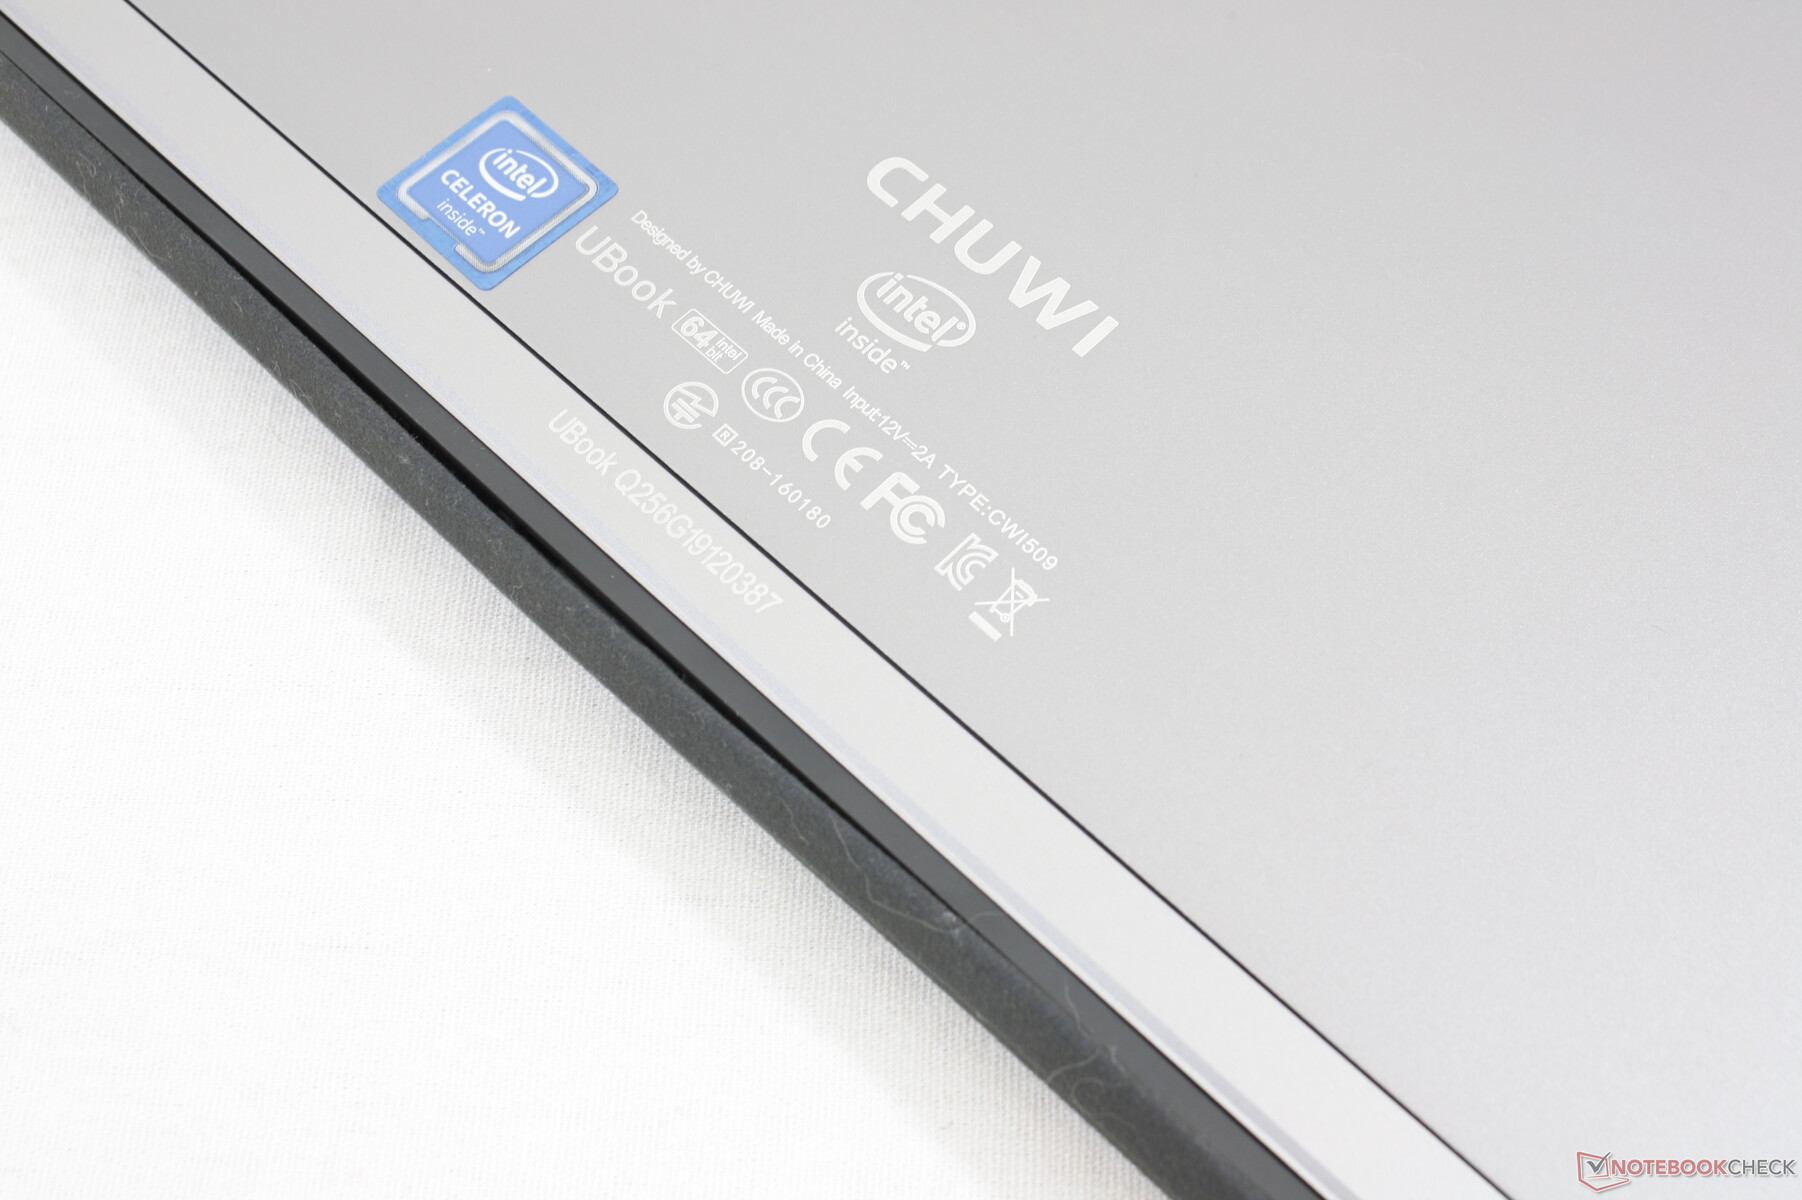
Whereas the 12.3-inch Chuwi UBook Pro is the Microsoft Surface Pro clone, the 11.6-inch Chuwi UBook is the Microsoft Surface Go clone. The Chinese manufacturer is infamous for its cheap devices and knock-offs ranging from the MacBook Air-like AeroBook to the inexpensive 15.6-inch 4K LapBook Plus laptop. This review will focus on the Chuwi UBook and how it differs from the Surface Go that it's trying to imitate.
The Chuwi UBook can currently be found on Amazon for $340 with its official product page here.
More Chuwi reviews:
Rating | Date | Model | Weight | Height | Size | Resolution | Price |
|---|---|---|---|---|---|---|---|
| 70 % v7 (old) | 12 / 2019 | Chuwi UBook CWI509 Celeron N4100, UHD Graphics 600 | 810 g | 9 mm | 11.60" | 1920x1080 | |
| 88.4 % v7 (old) | 11 / 2019 | Microsoft Surface Pro 7 Core i5-1035G4 i5-1035G4, Iris Plus Graphics G4 (Ice Lake 48 EU) | 1.1 kg | 8.5 mm | 12.30" | 2736x1824 | |
| 83.3 % v7 (old) | 10 / 2018 | Microsoft Surface Go MHN-00003 Pentium 4415Y, UHD Graphics 615 | 523 g | 8.3 mm | 10.00" | 1800x1200 | |
| 82.5 % v7 (old) | 09 / 2019 | HP ProBook x360 11 G4 m3-8100Y, UHD Graphics 615 | 1.4 kg | 19.9 mm | 11.60" | 1366x768 | |
| 77.3 % v6 (old) | 12 / 2018 | HP x2 210 G2 Z8350, HD Graphics 400 (Braswell) | 1.2 kg | 23.5 mm | 10.10" | 1280x800 |
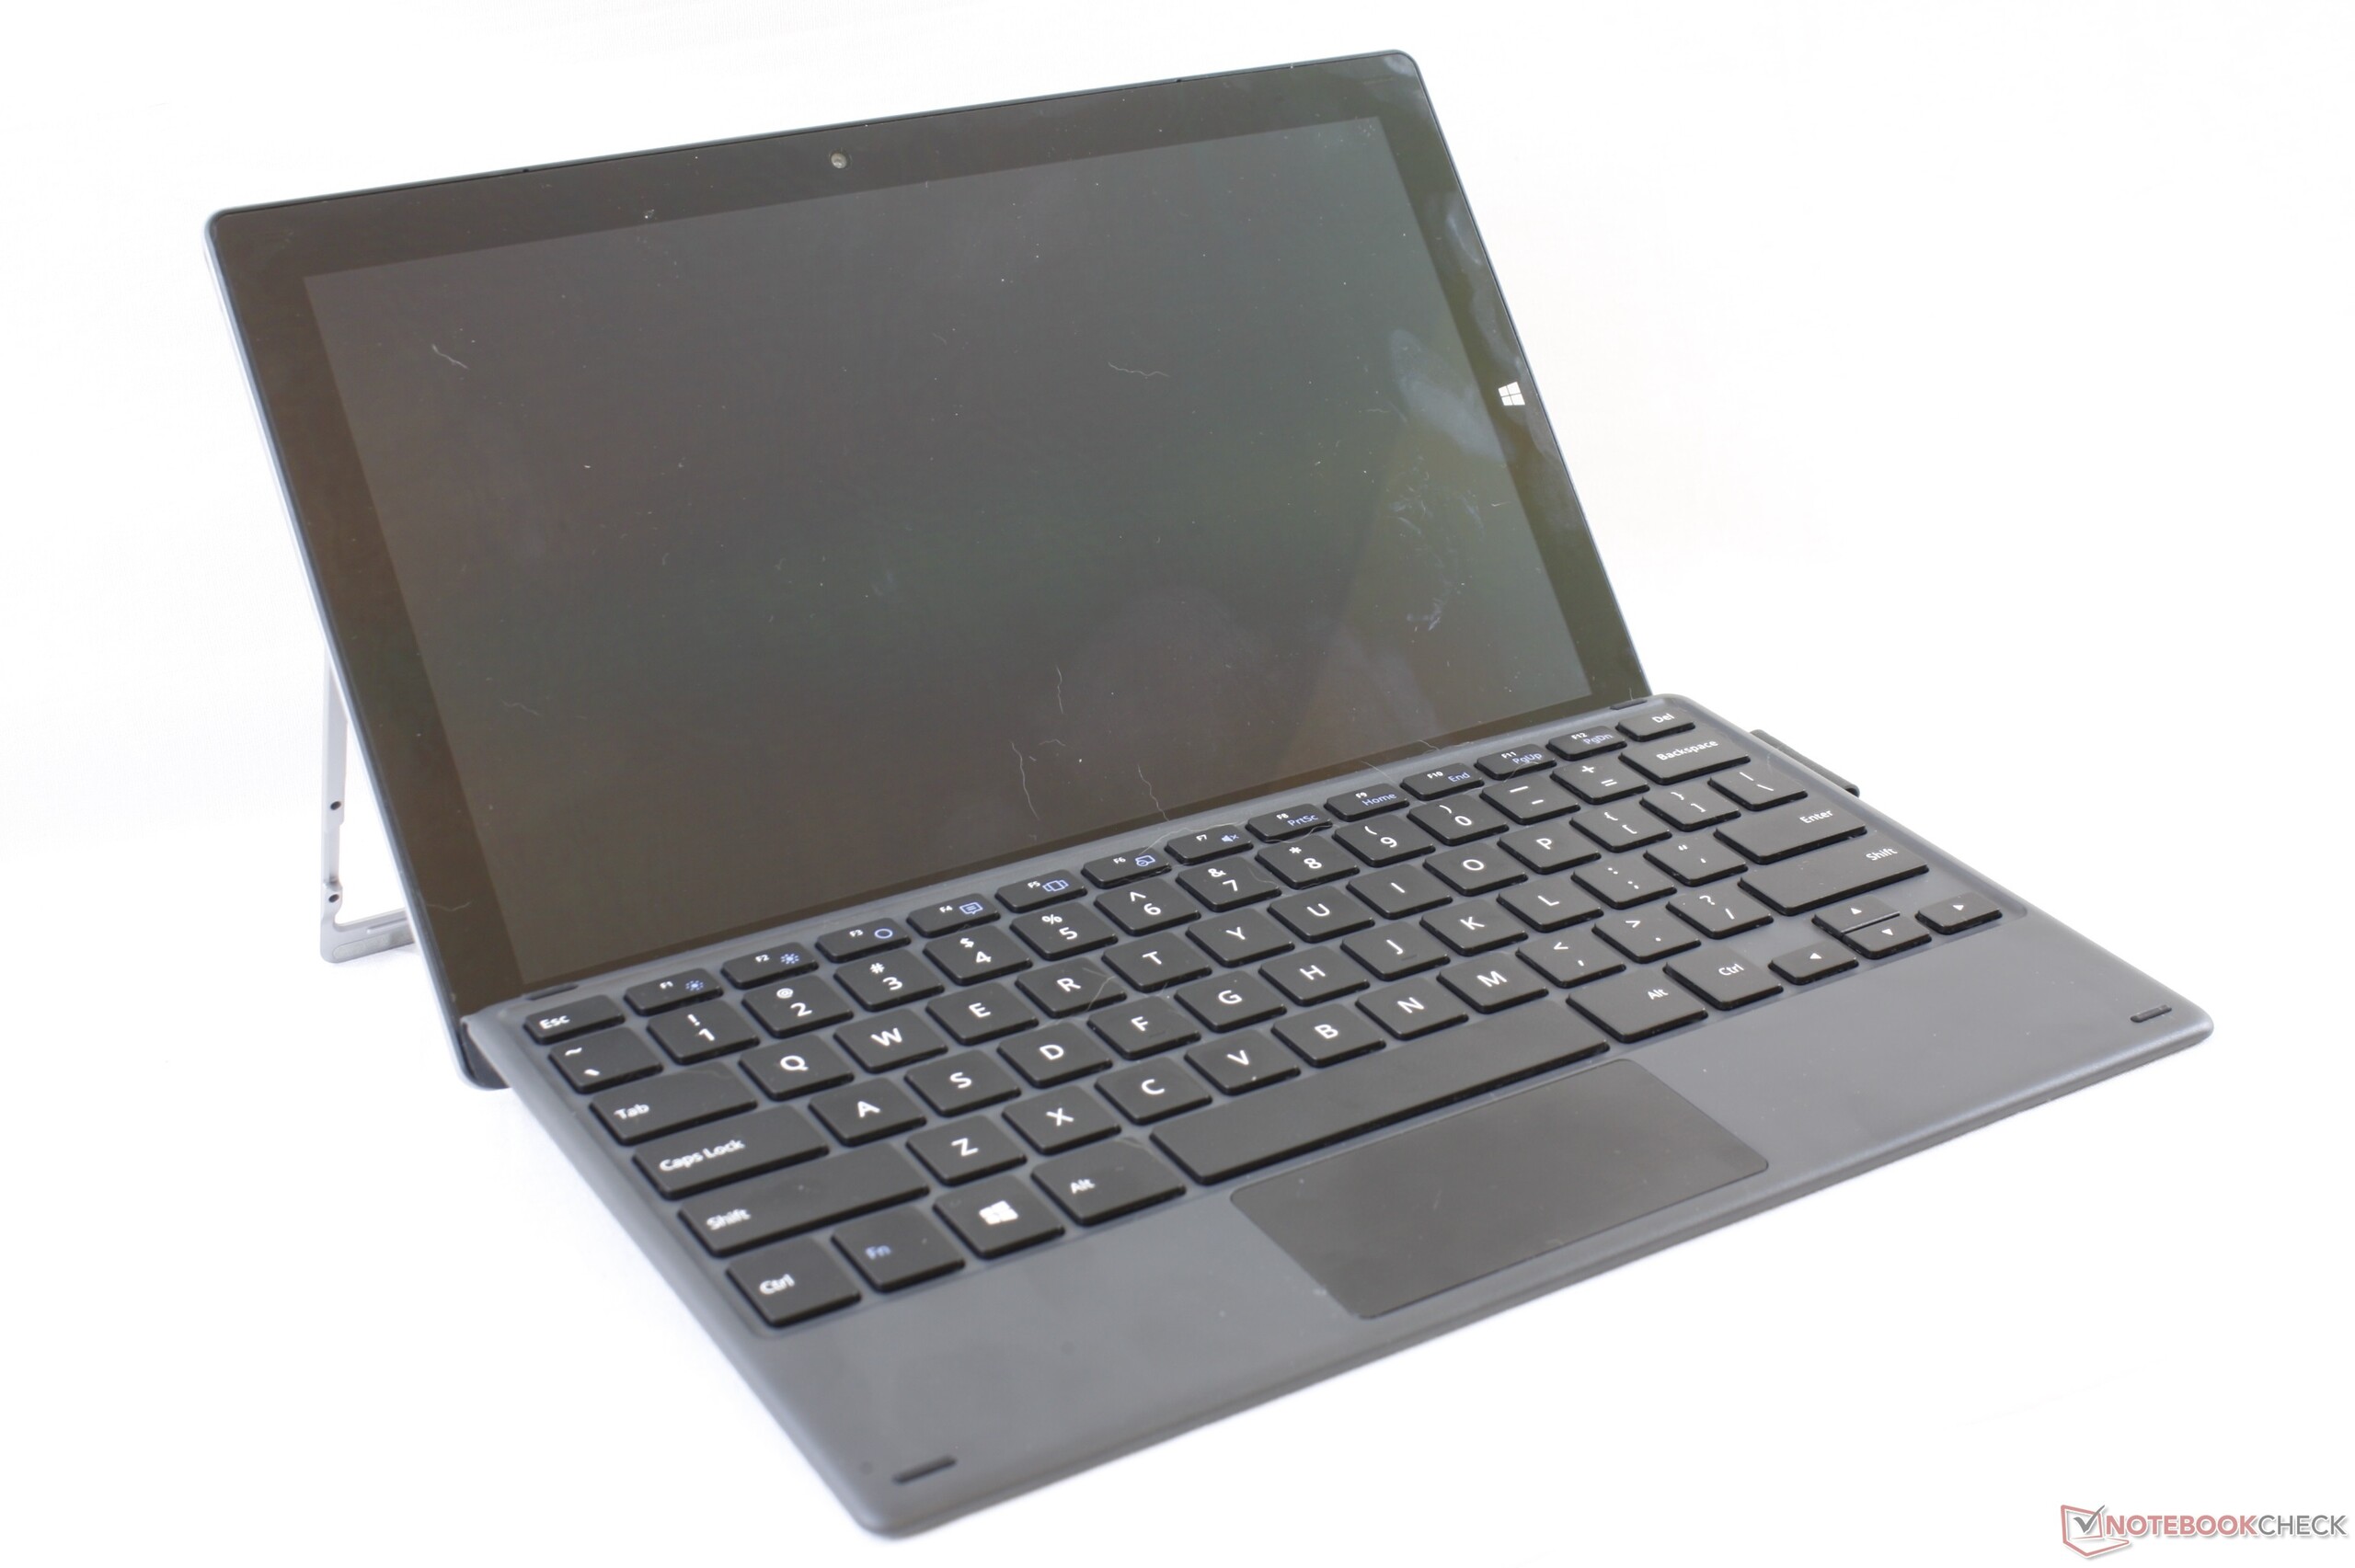
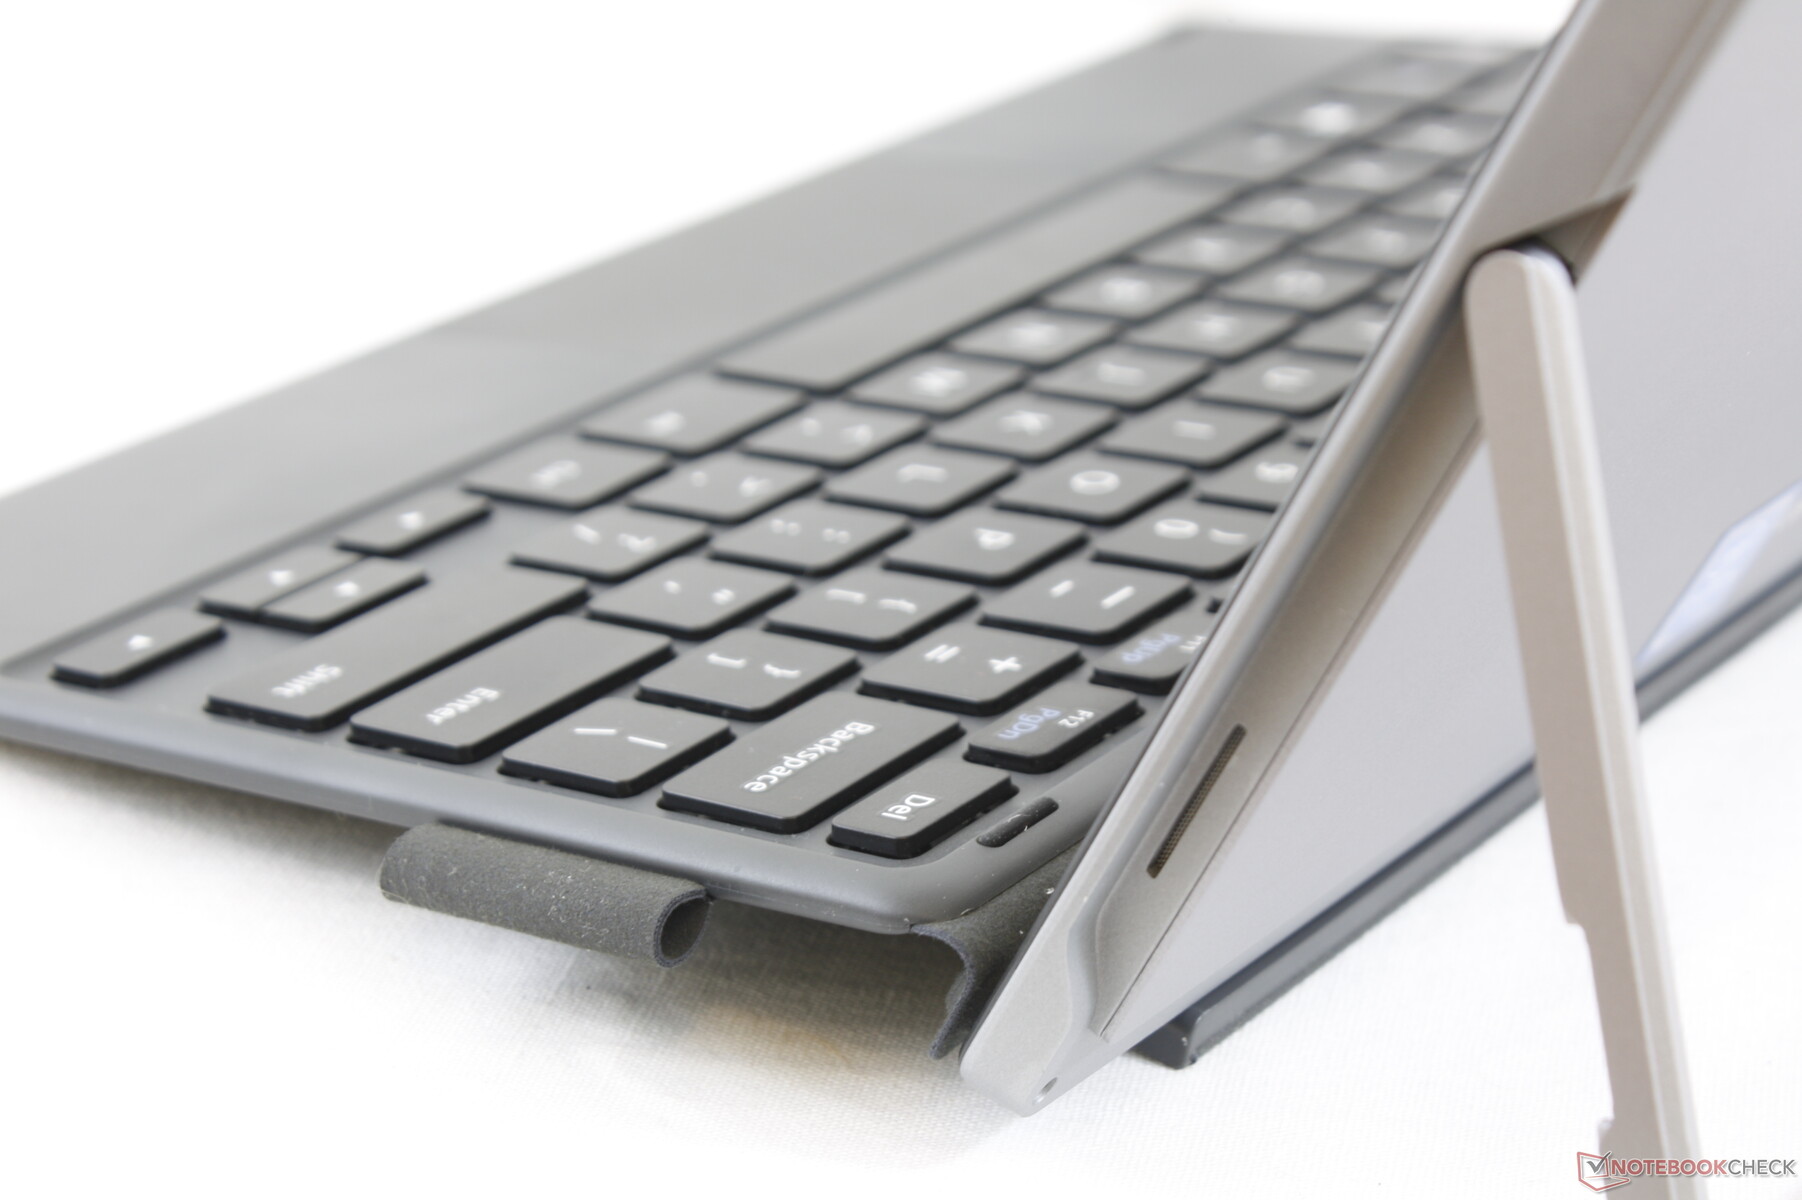
Case
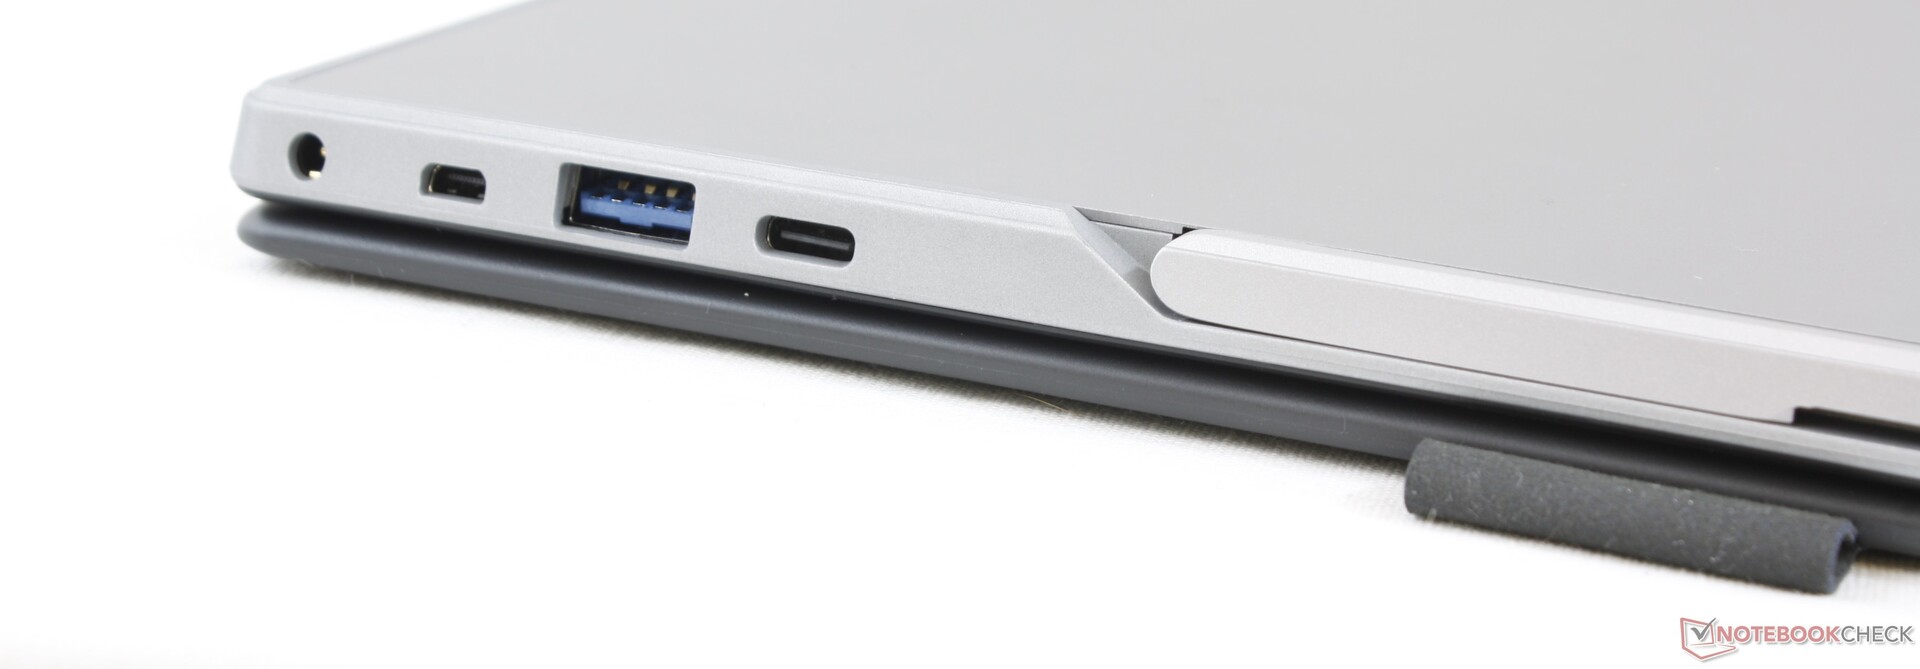
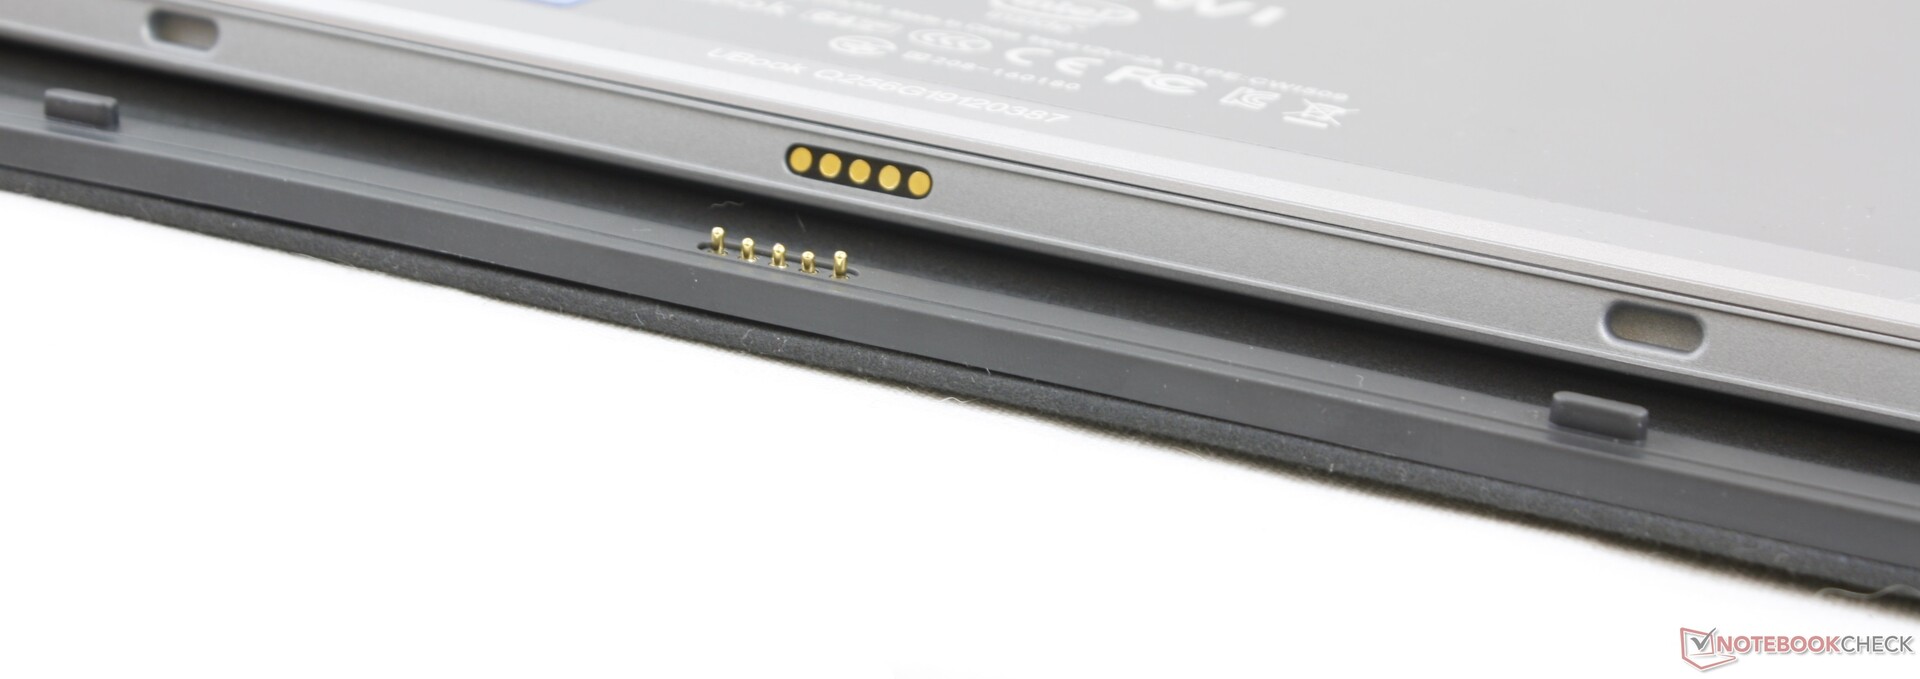
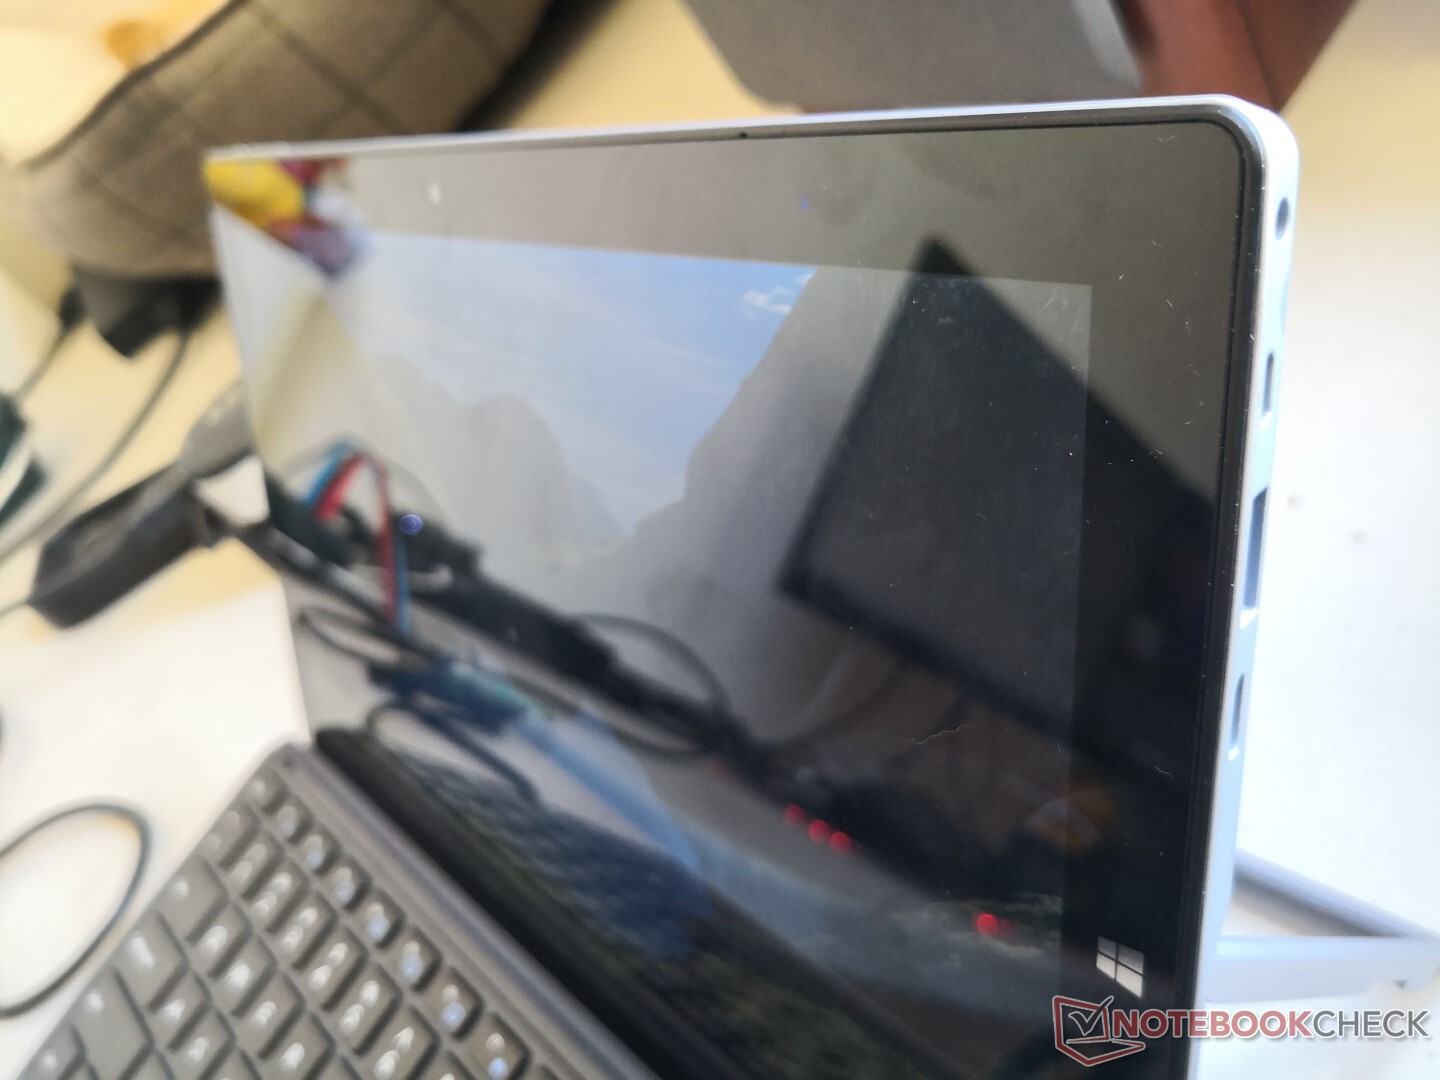
The chassis is nearly identical to the TrekStor Surftab Theatre S11 and so most of our existing comments apply here on the UBook. Even the dimensions between the two detachables are essentially the same. The main visual difference between them is that the UBook integrates a USB Type-C port while the TrekStor includes none.
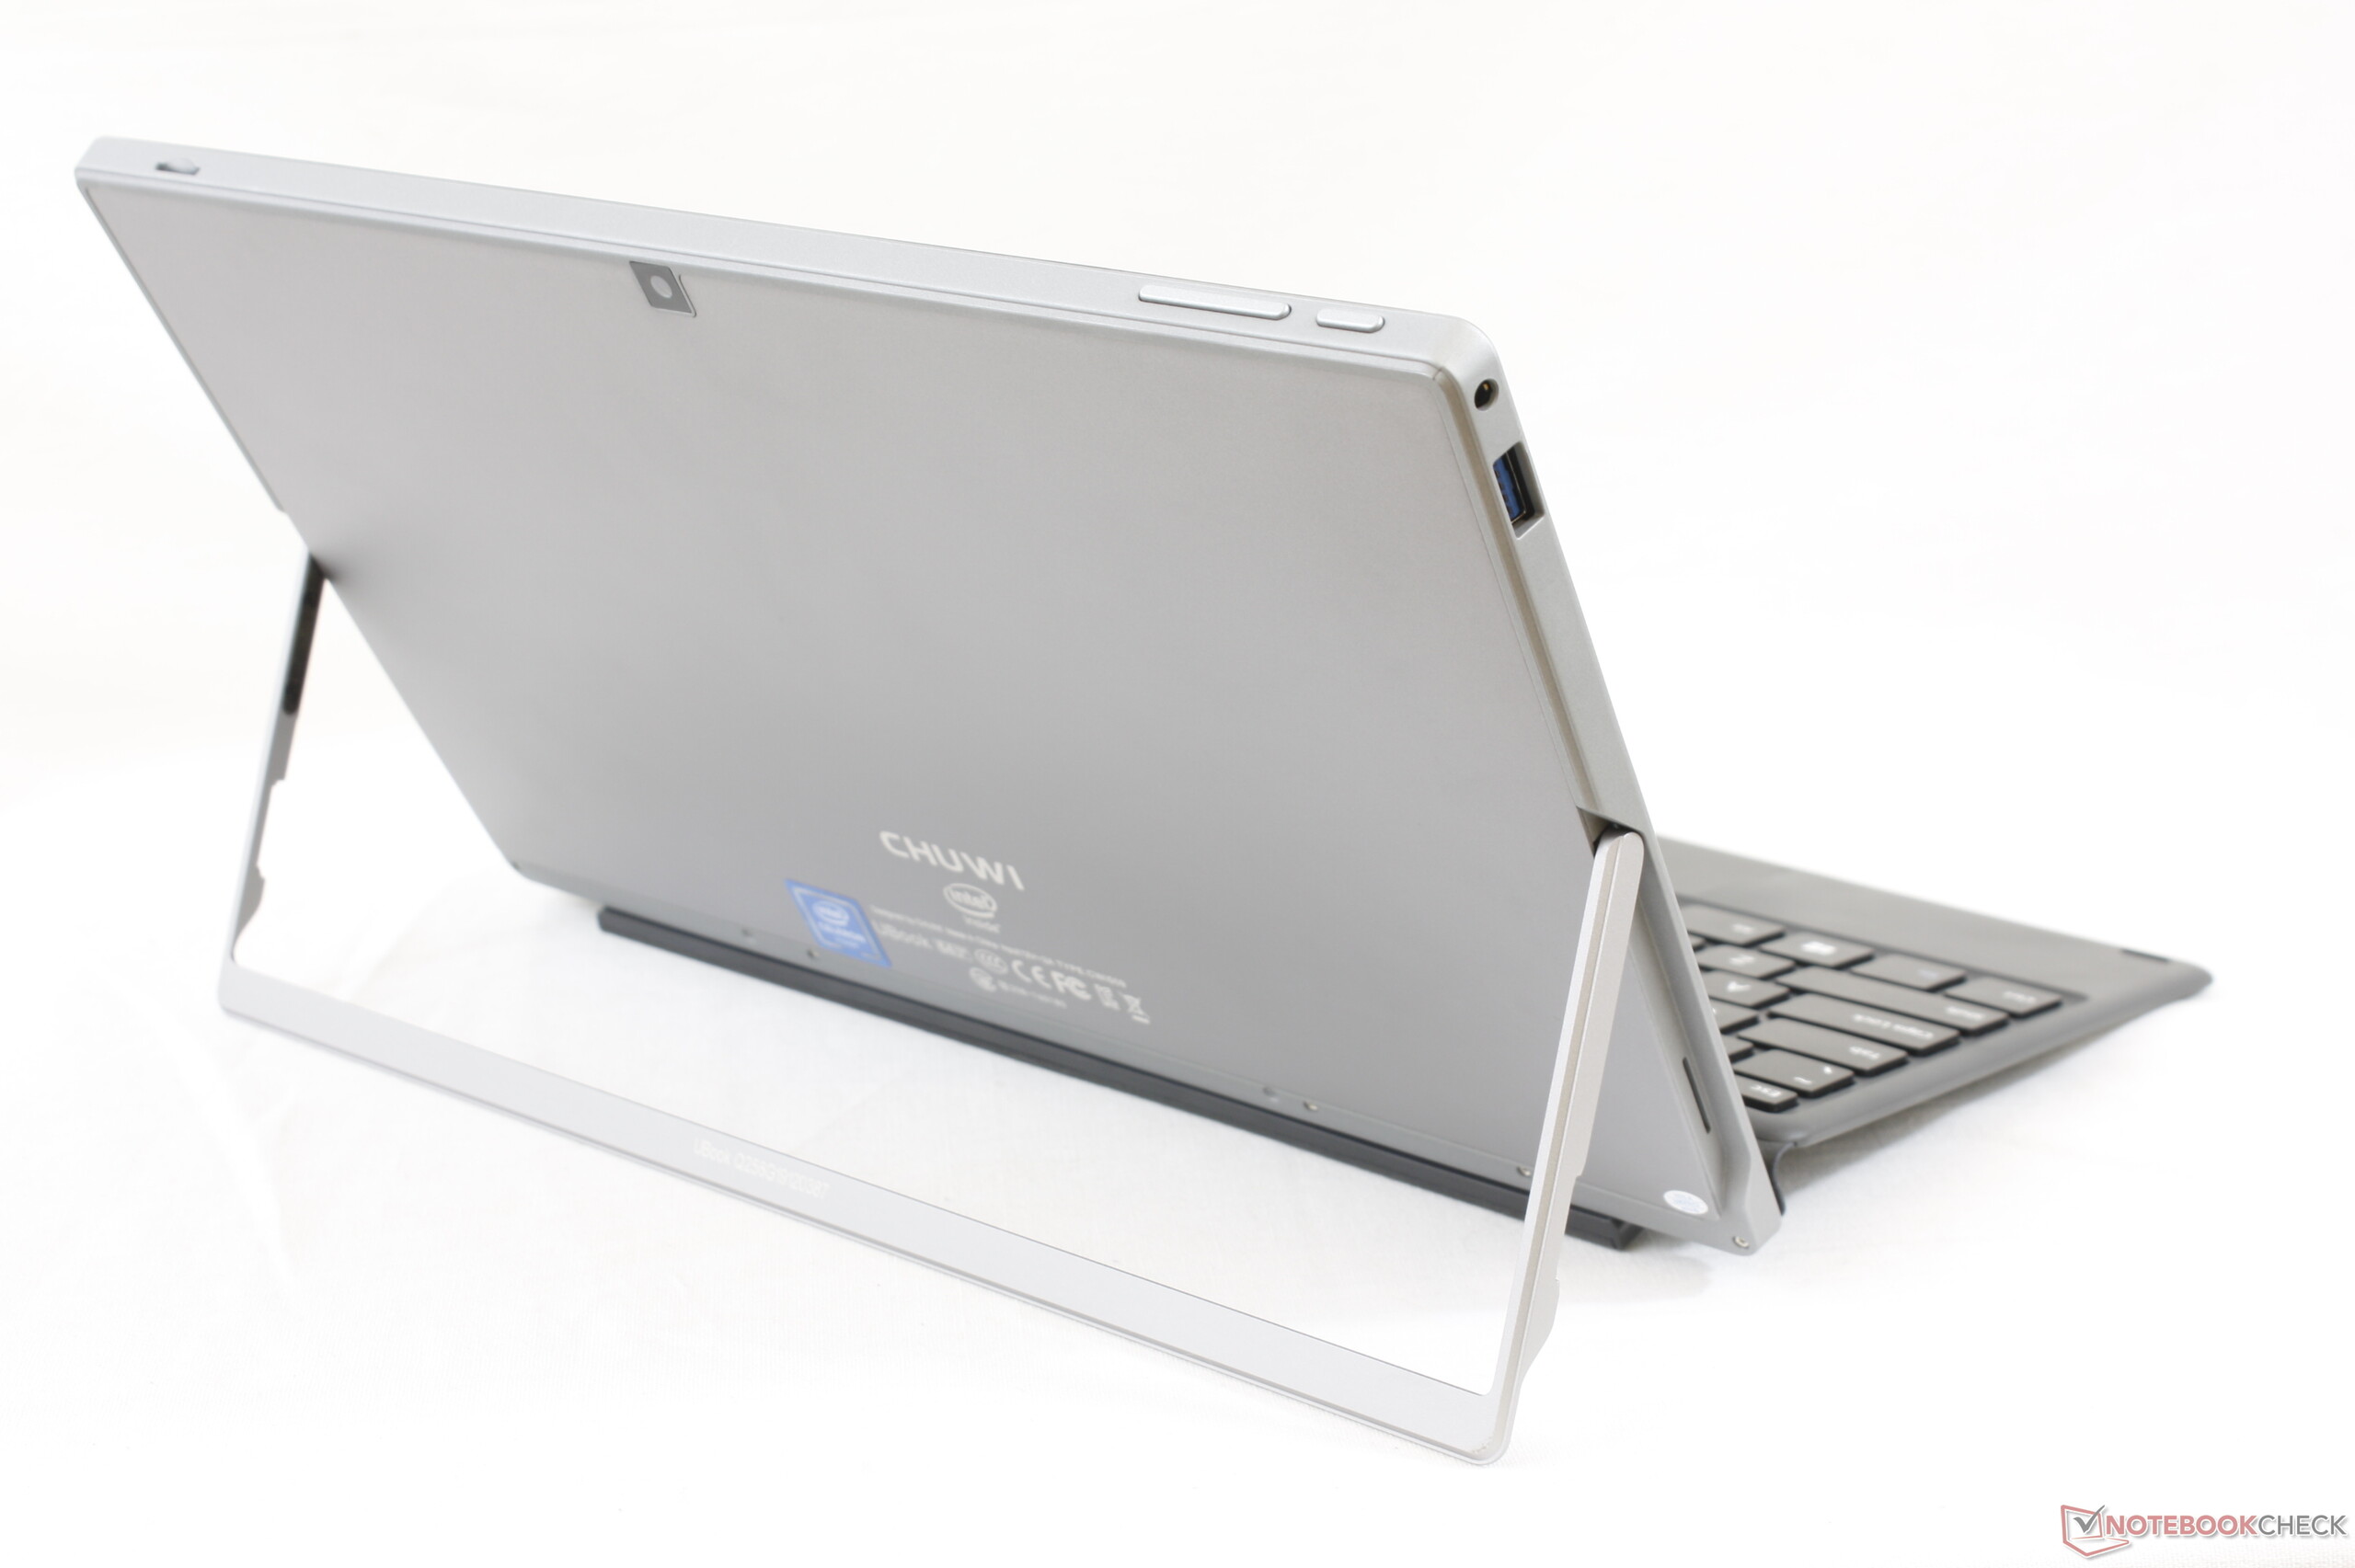
Connectivity
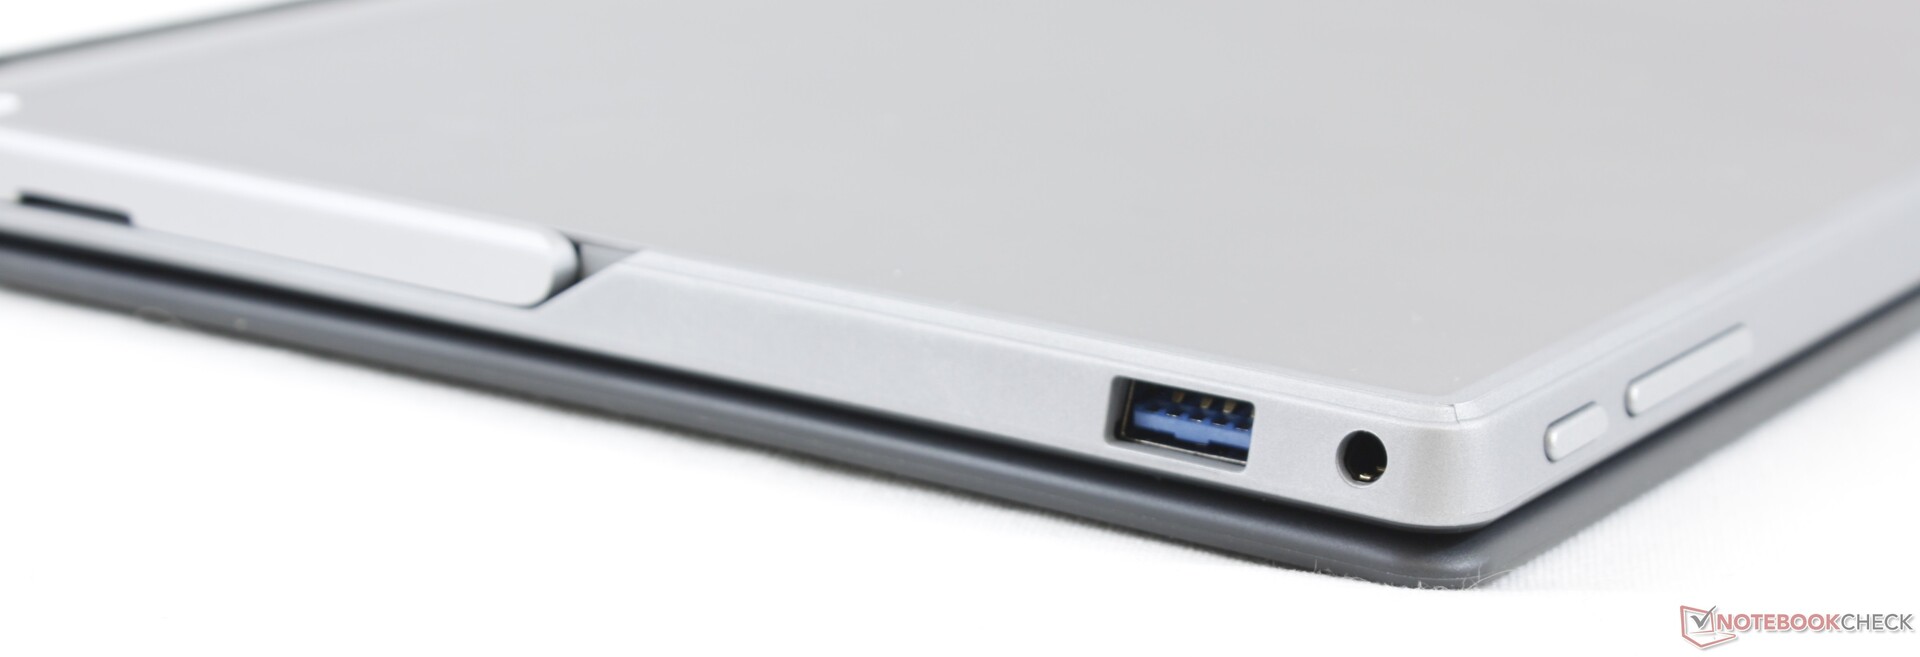
Port options and positioning are identical to the larger UBook Pro. However, attempting to recharge the tablet via USB Type-C will not work unlike on the UBook Pro.
SD Card Reader
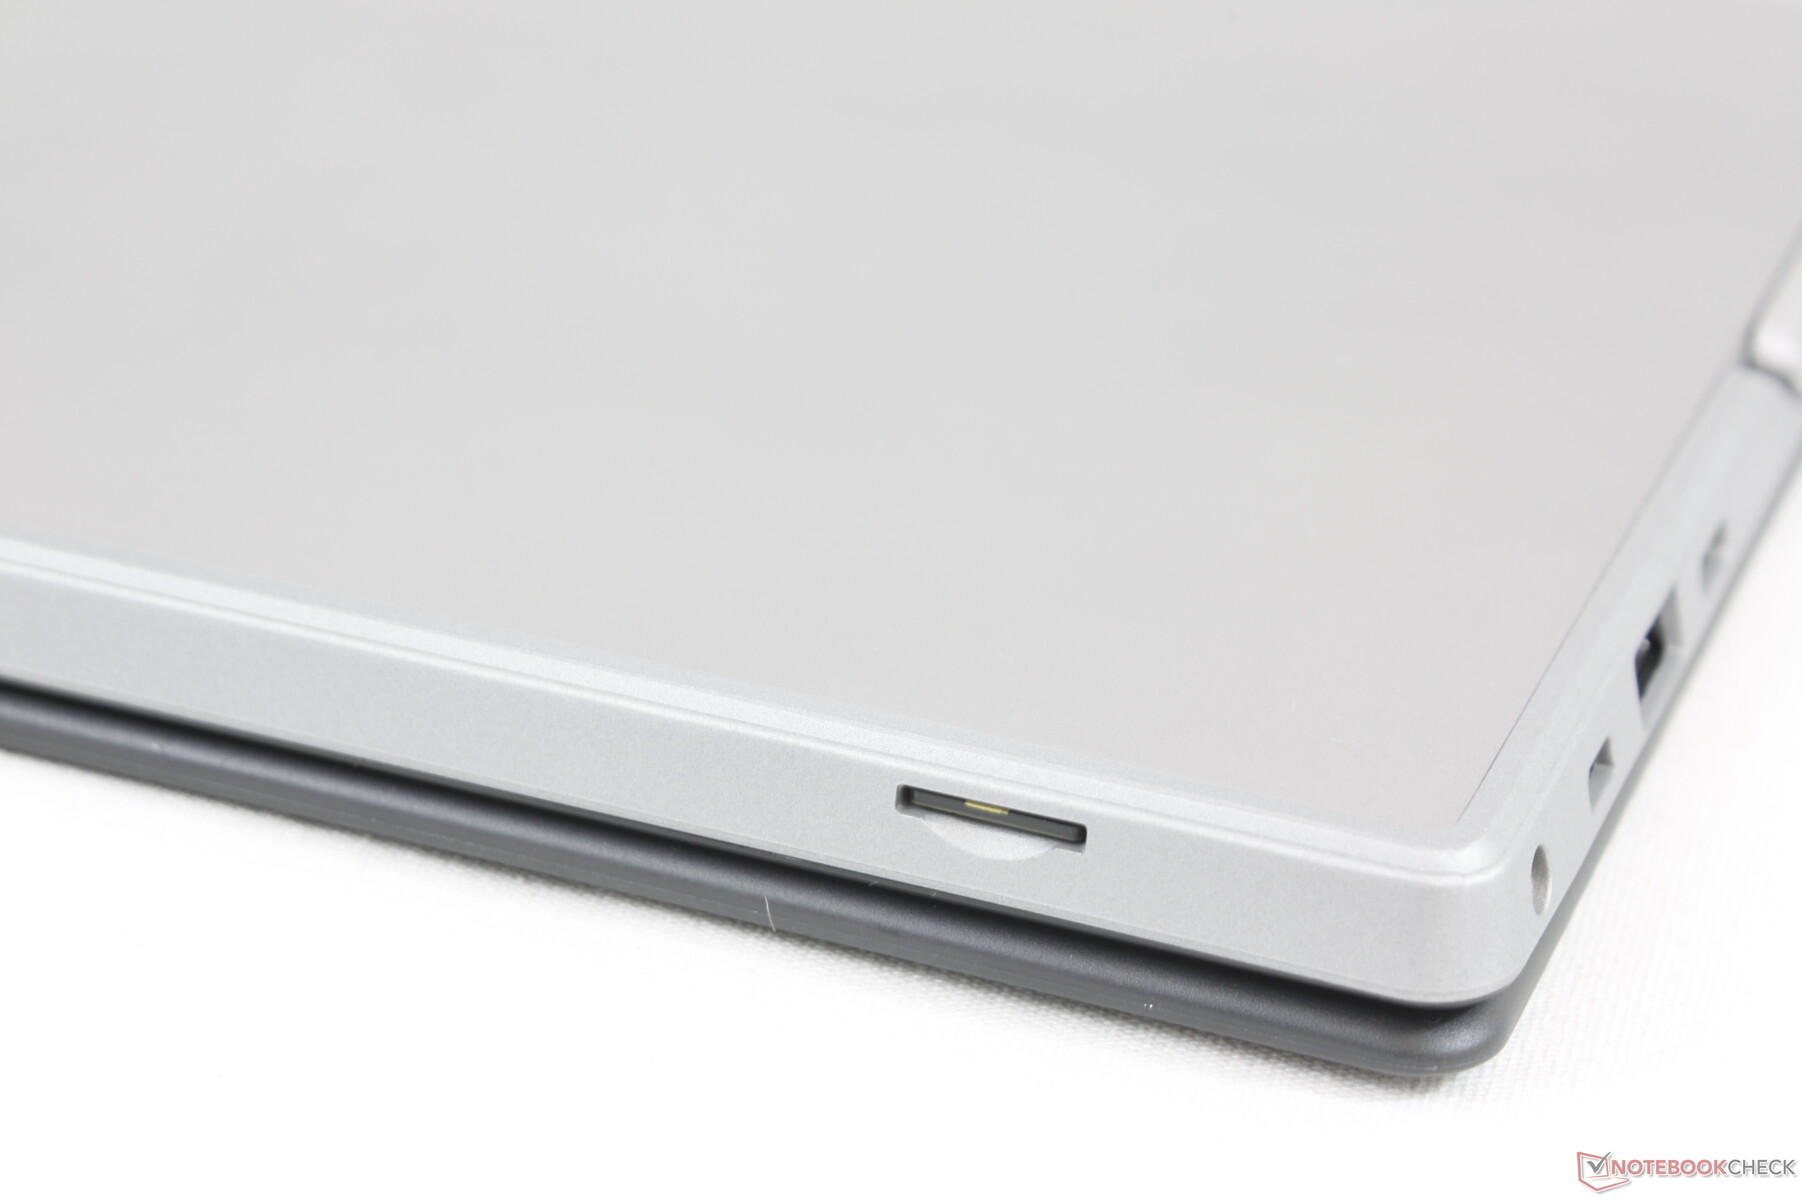
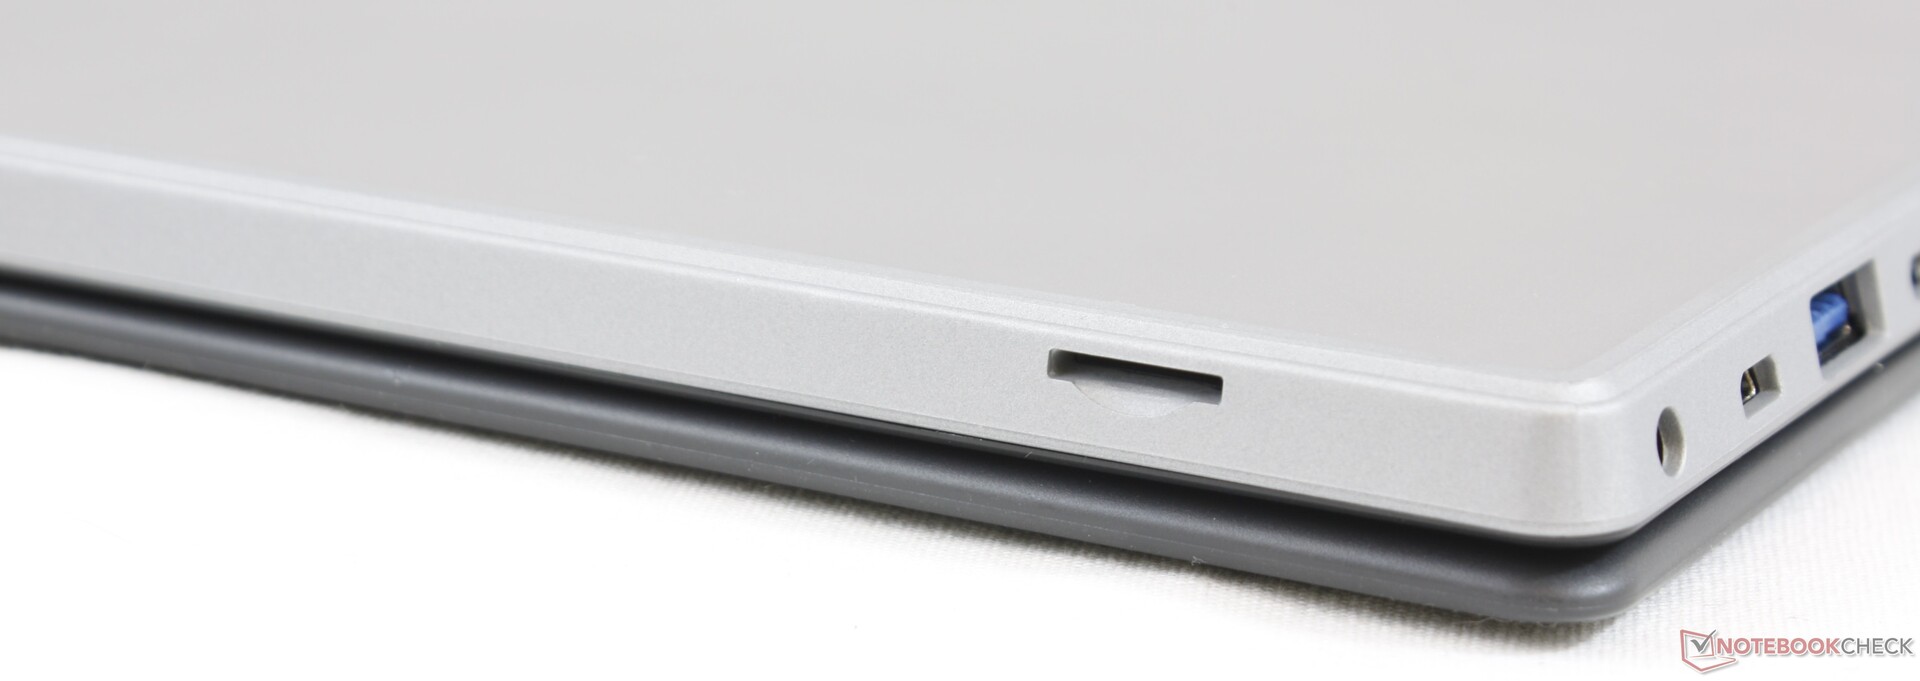
The spring-loaded MicroSD card reader is as fast as the card reader on the Microsoft Surface series. An inserted card, however, can be difficult to remove especially for larger hands.
| SD Card Reader | |
| average JPG Copy Test (av. of 3 runs) | |
| HP ProBook x360 11 G4 (Toshiba Exceria Pro SDXC 64 GB UHS-II) | |
| Microsoft Surface Pro 7 Core i5-1035G4 (Toshiba Exceria Pro M501 64 GB UHS-II) | |
| Chuwi UBook CWI509 (Toshiba Exceria Pro M501 64 GB UHS-II) | |
| Microsoft Surface Go MHN-00003 (Toshiba Exceria Pro M501) | |
| HP x2 210 G2 (Toshiba Exceria Pro M501 microSDXC 64GB) | |
| maximum AS SSD Seq Read Test (1GB) | |
| HP ProBook x360 11 G4 (Toshiba Exceria Pro SDXC 64 GB UHS-II) | |
| Microsoft Surface Pro 7 Core i5-1035G4 (Toshiba Exceria Pro M501 64 GB UHS-II) | |
| Microsoft Surface Go MHN-00003 (Toshiba Exceria Pro M501) | |
| Chuwi UBook CWI509 (Toshiba Exceria Pro M501 64 GB UHS-II) | |
| HP x2 210 G2 (Toshiba Exceria Pro M501 microSDXC 64GB) | |
Communication
The Intel 9461 is a 1x1 (433 Mbps) 802.11ac module providing half the transfer rates of most Ultrabooks today. It works reliably on our unit and it balances well with the entry-level package.
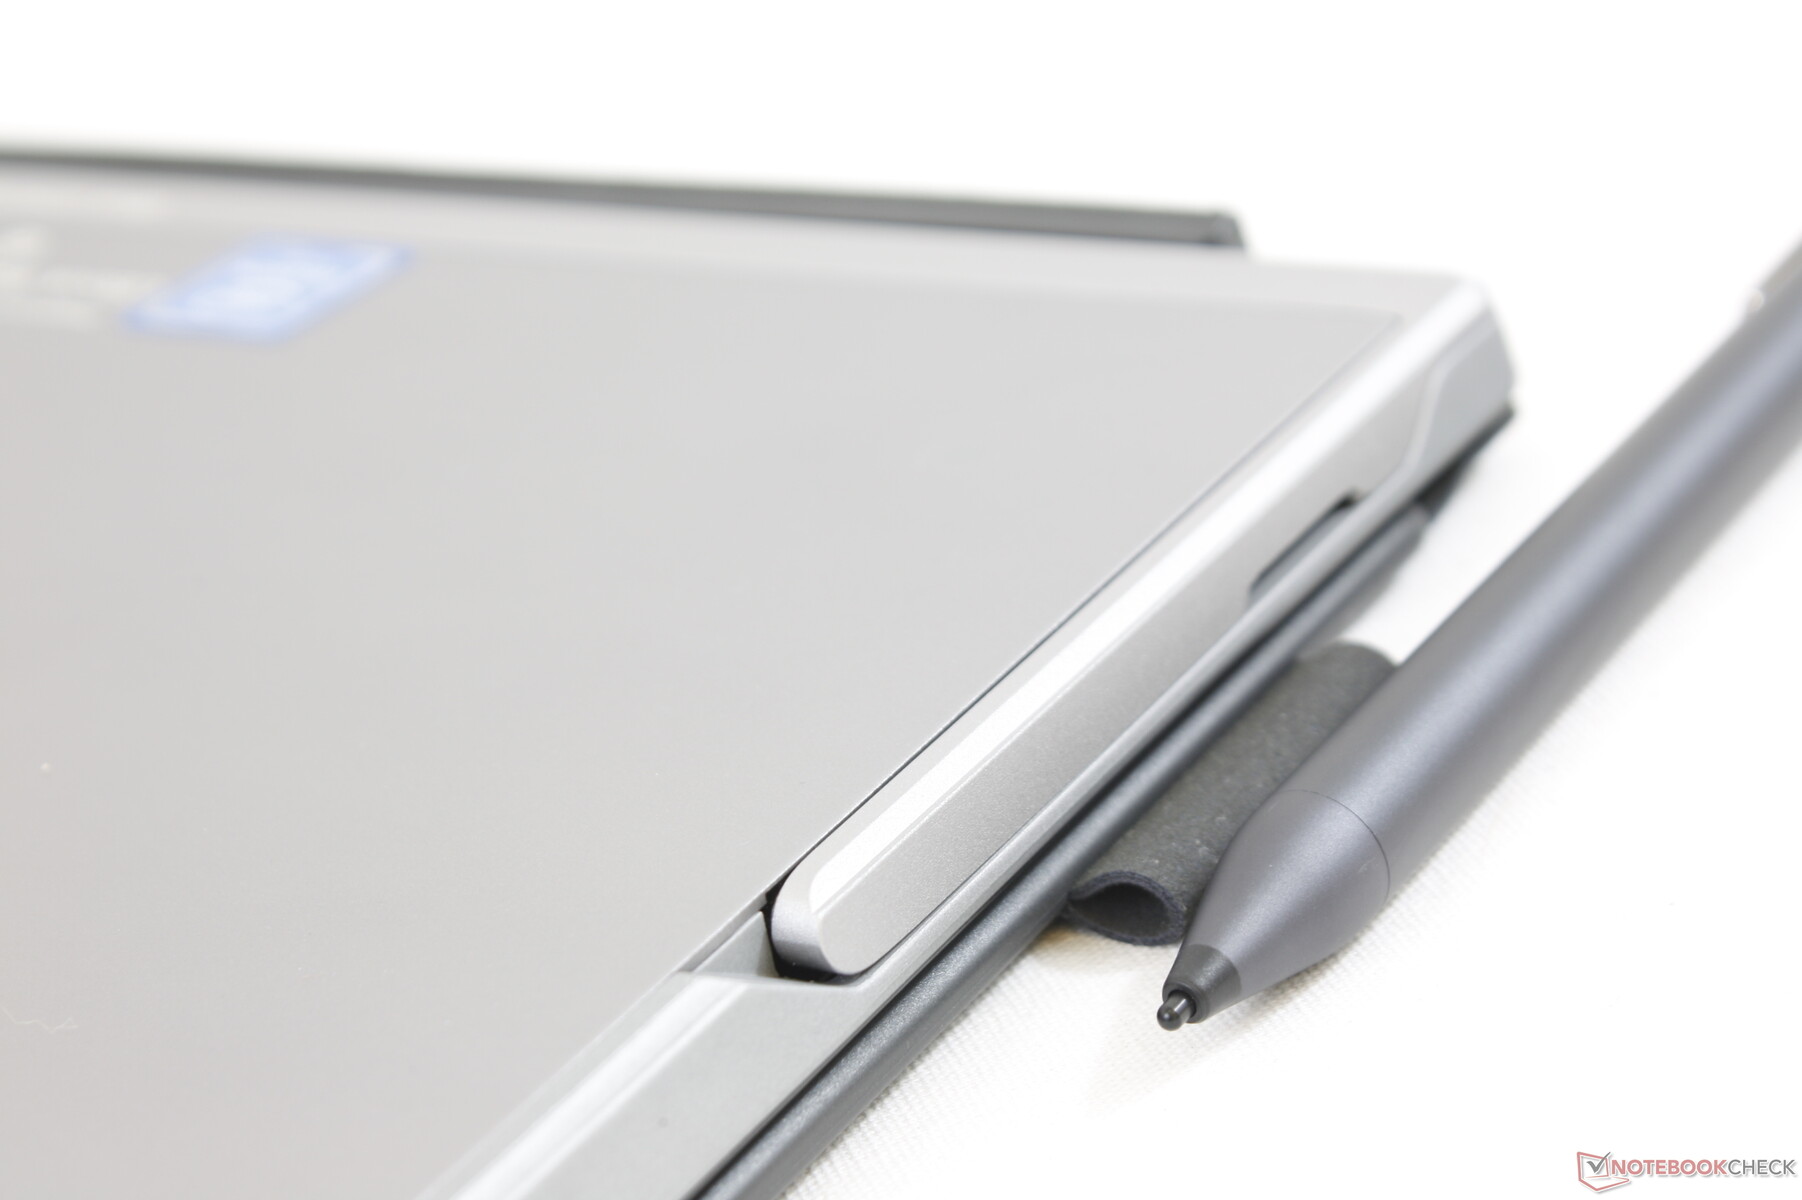
Accessories and Warranty
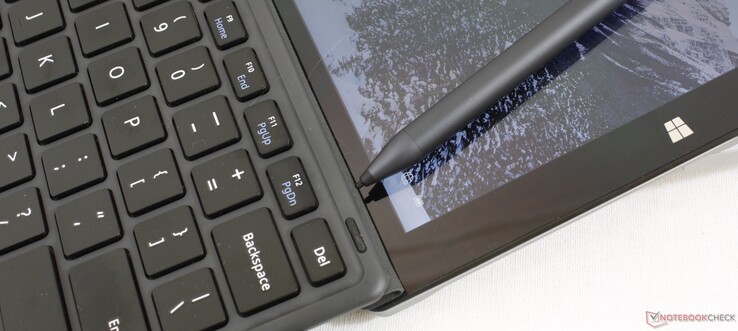
Extras include the keyboard base, active HiPen H3 stylus, and a AAAA battery.
The standard one-year limited warranty applies. Keep in mind that return shipping will likely be overseas for a slow turnaround time.
Input Devices
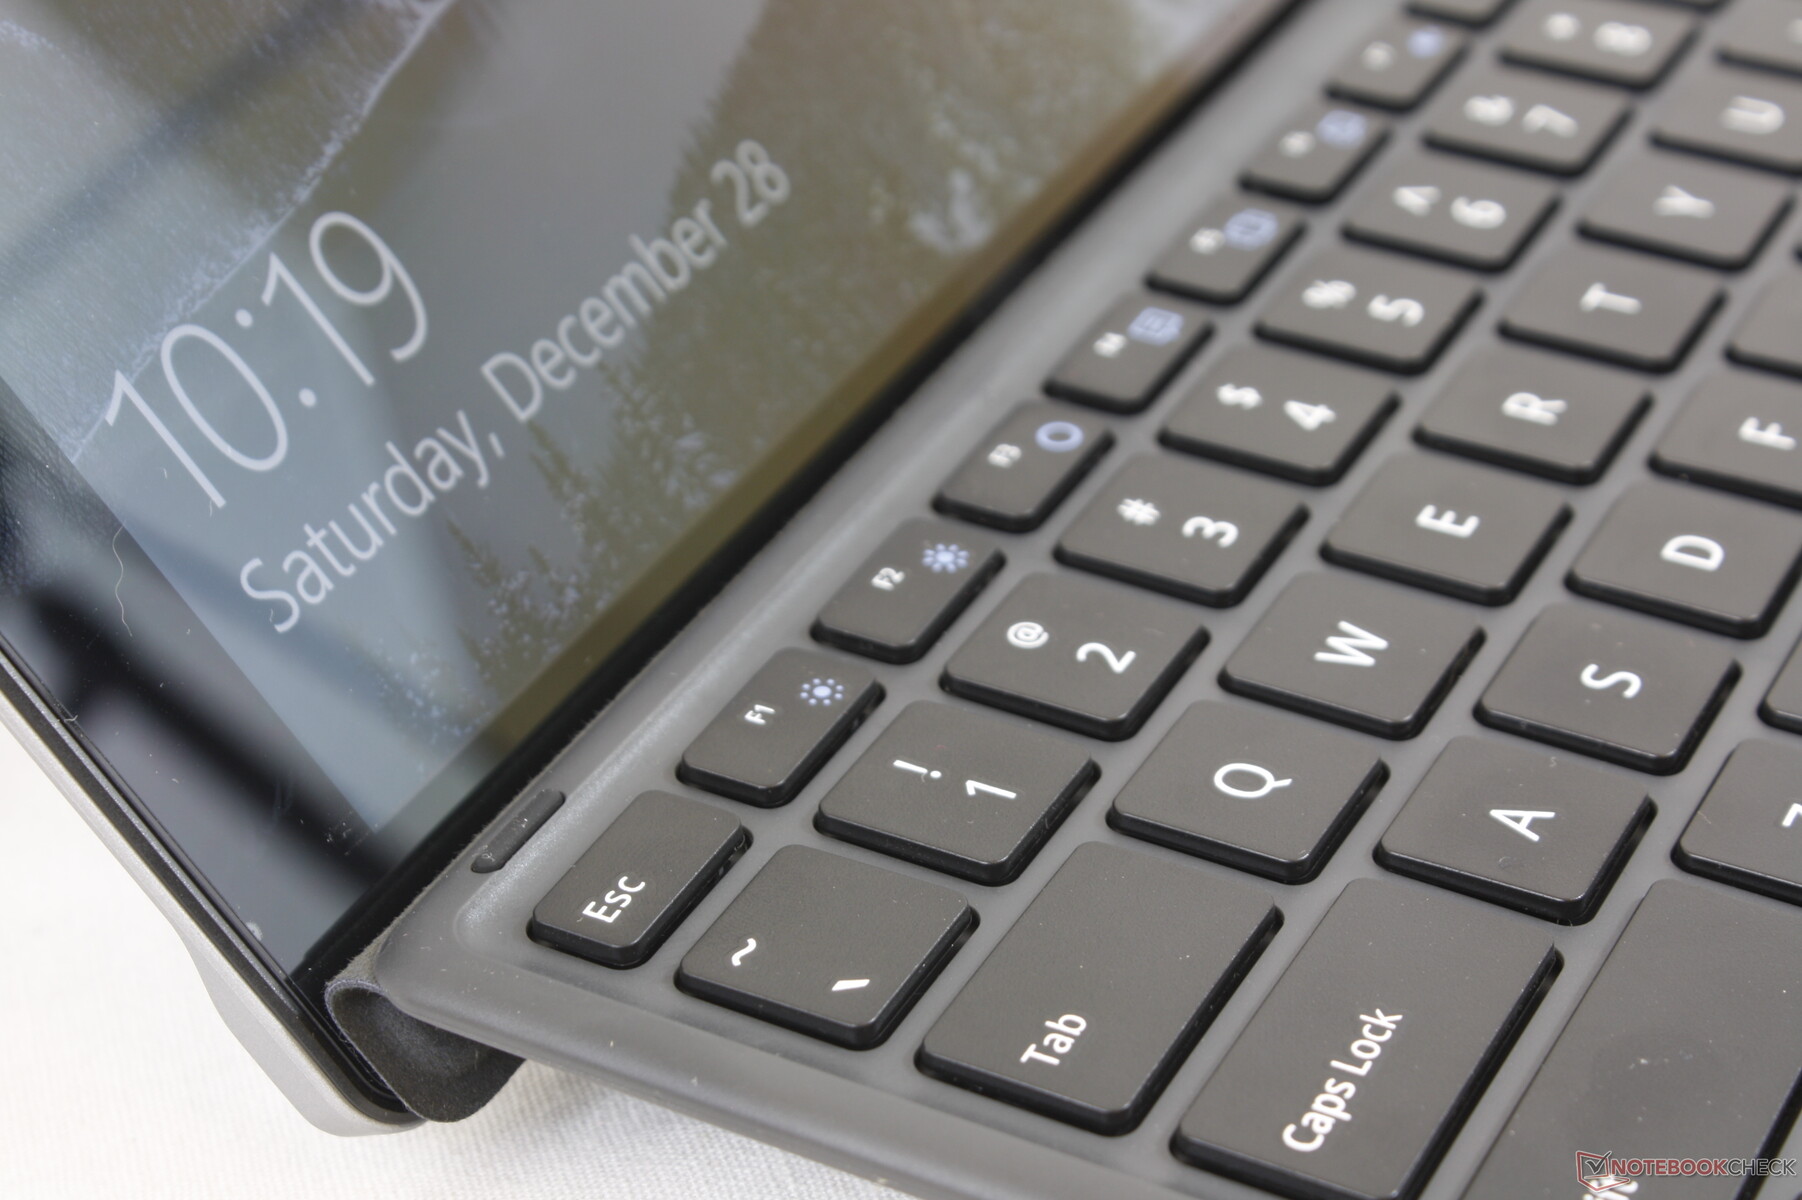
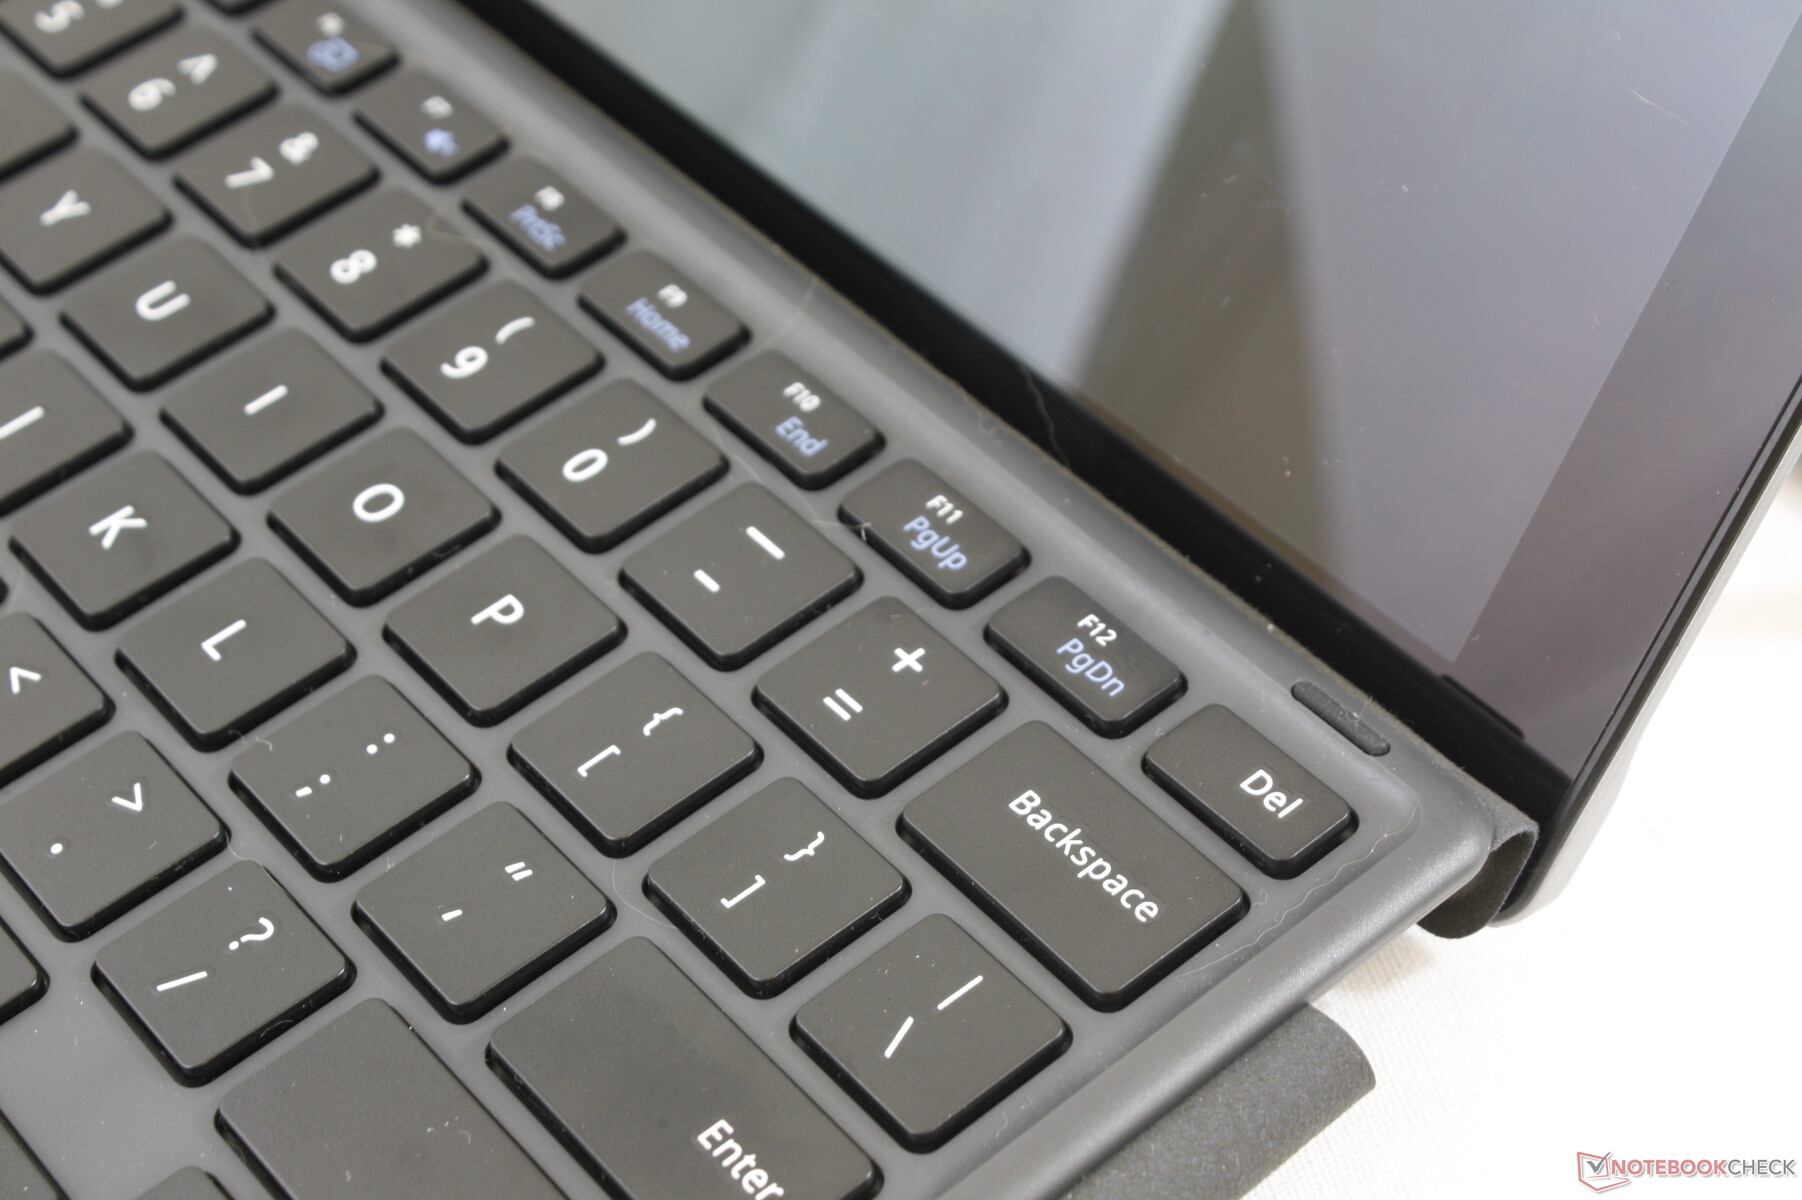
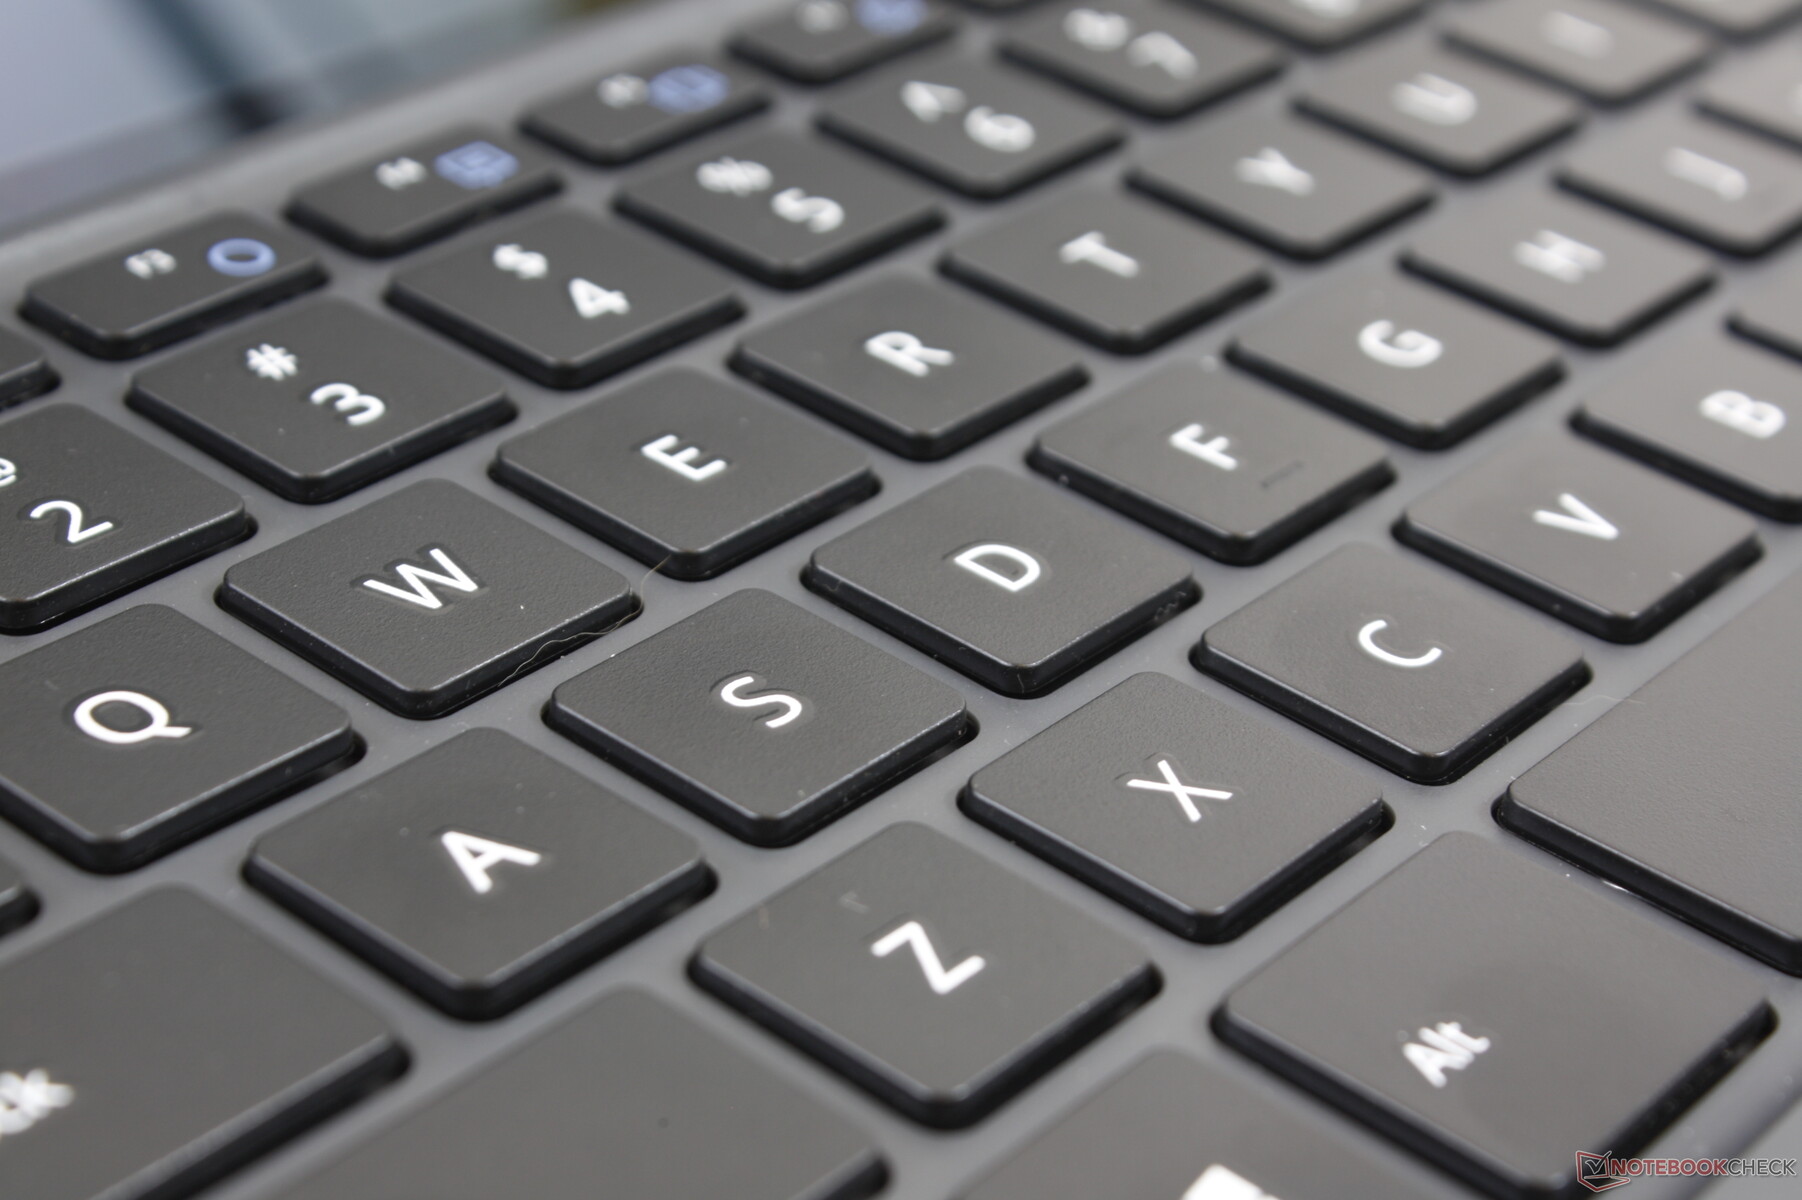
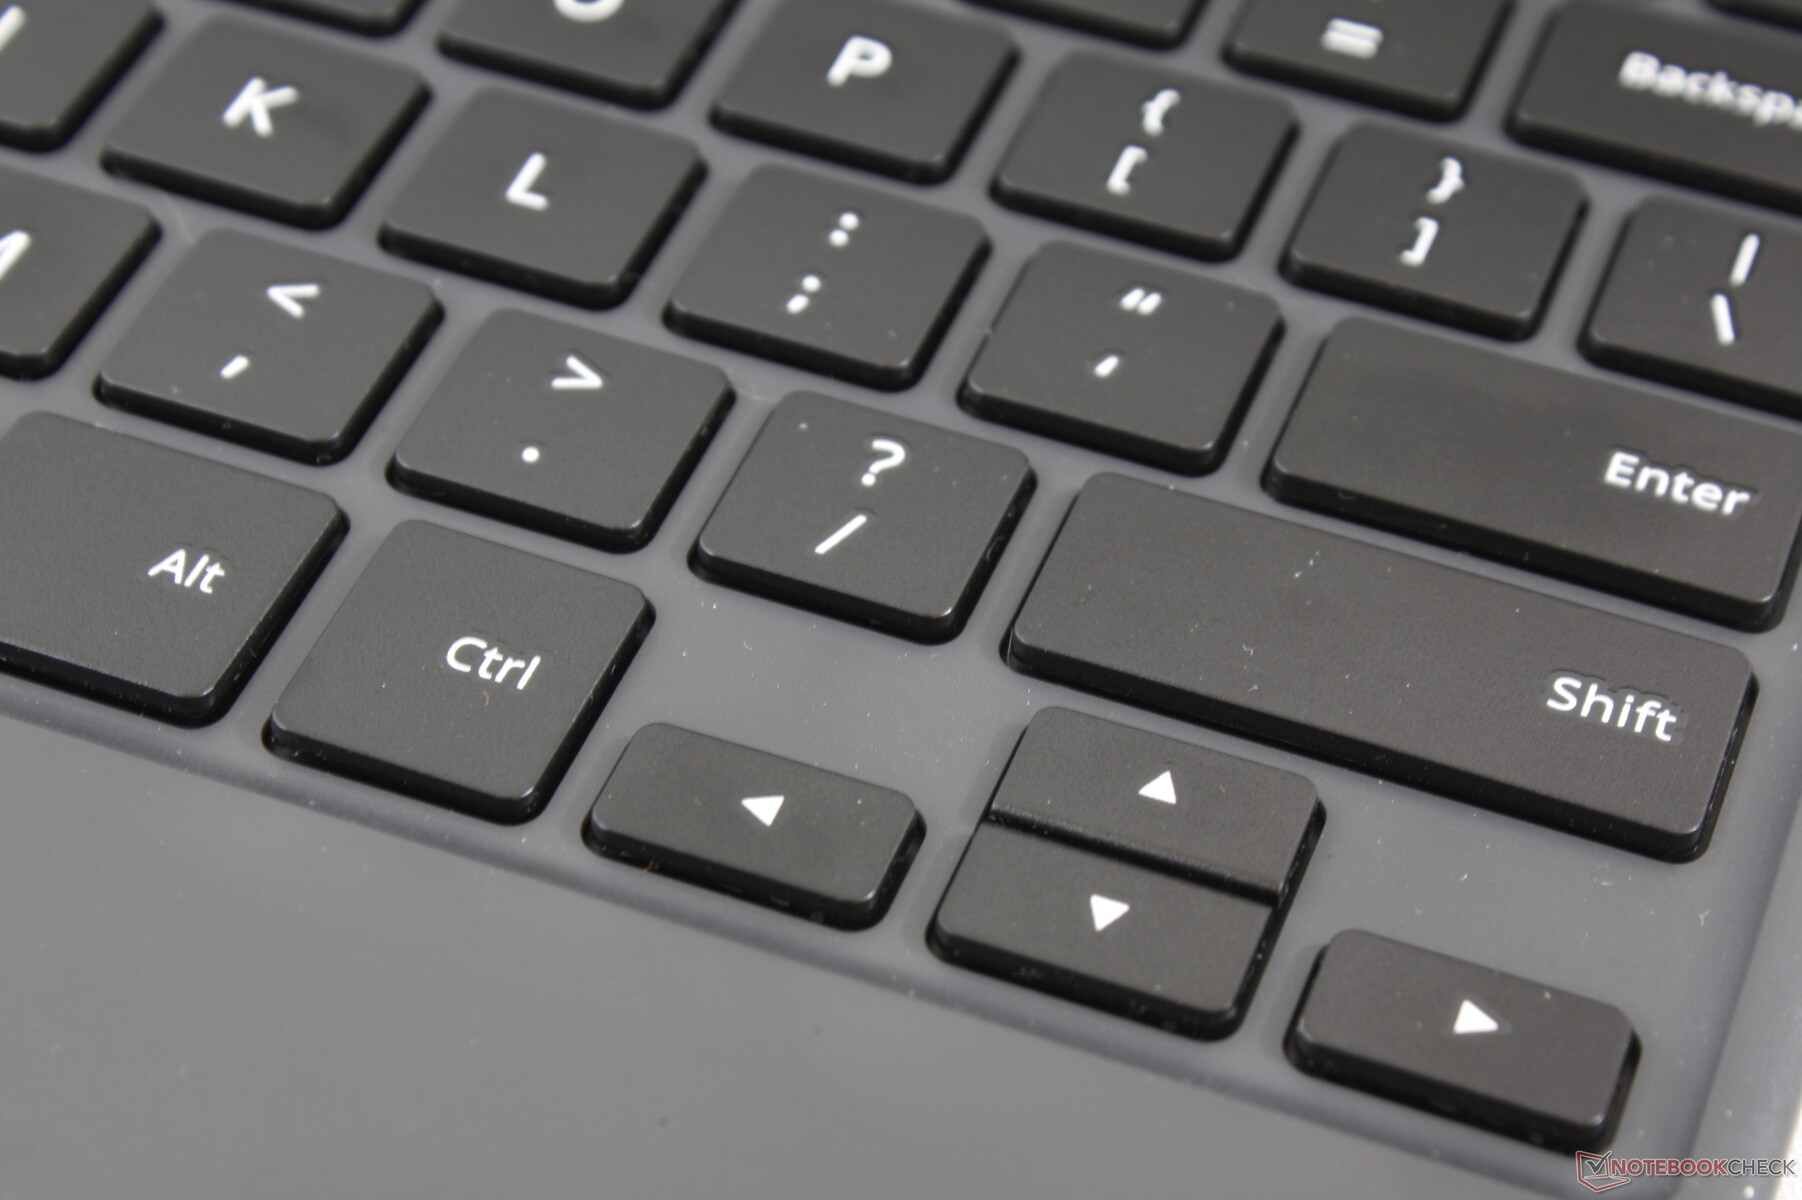
Keyboard
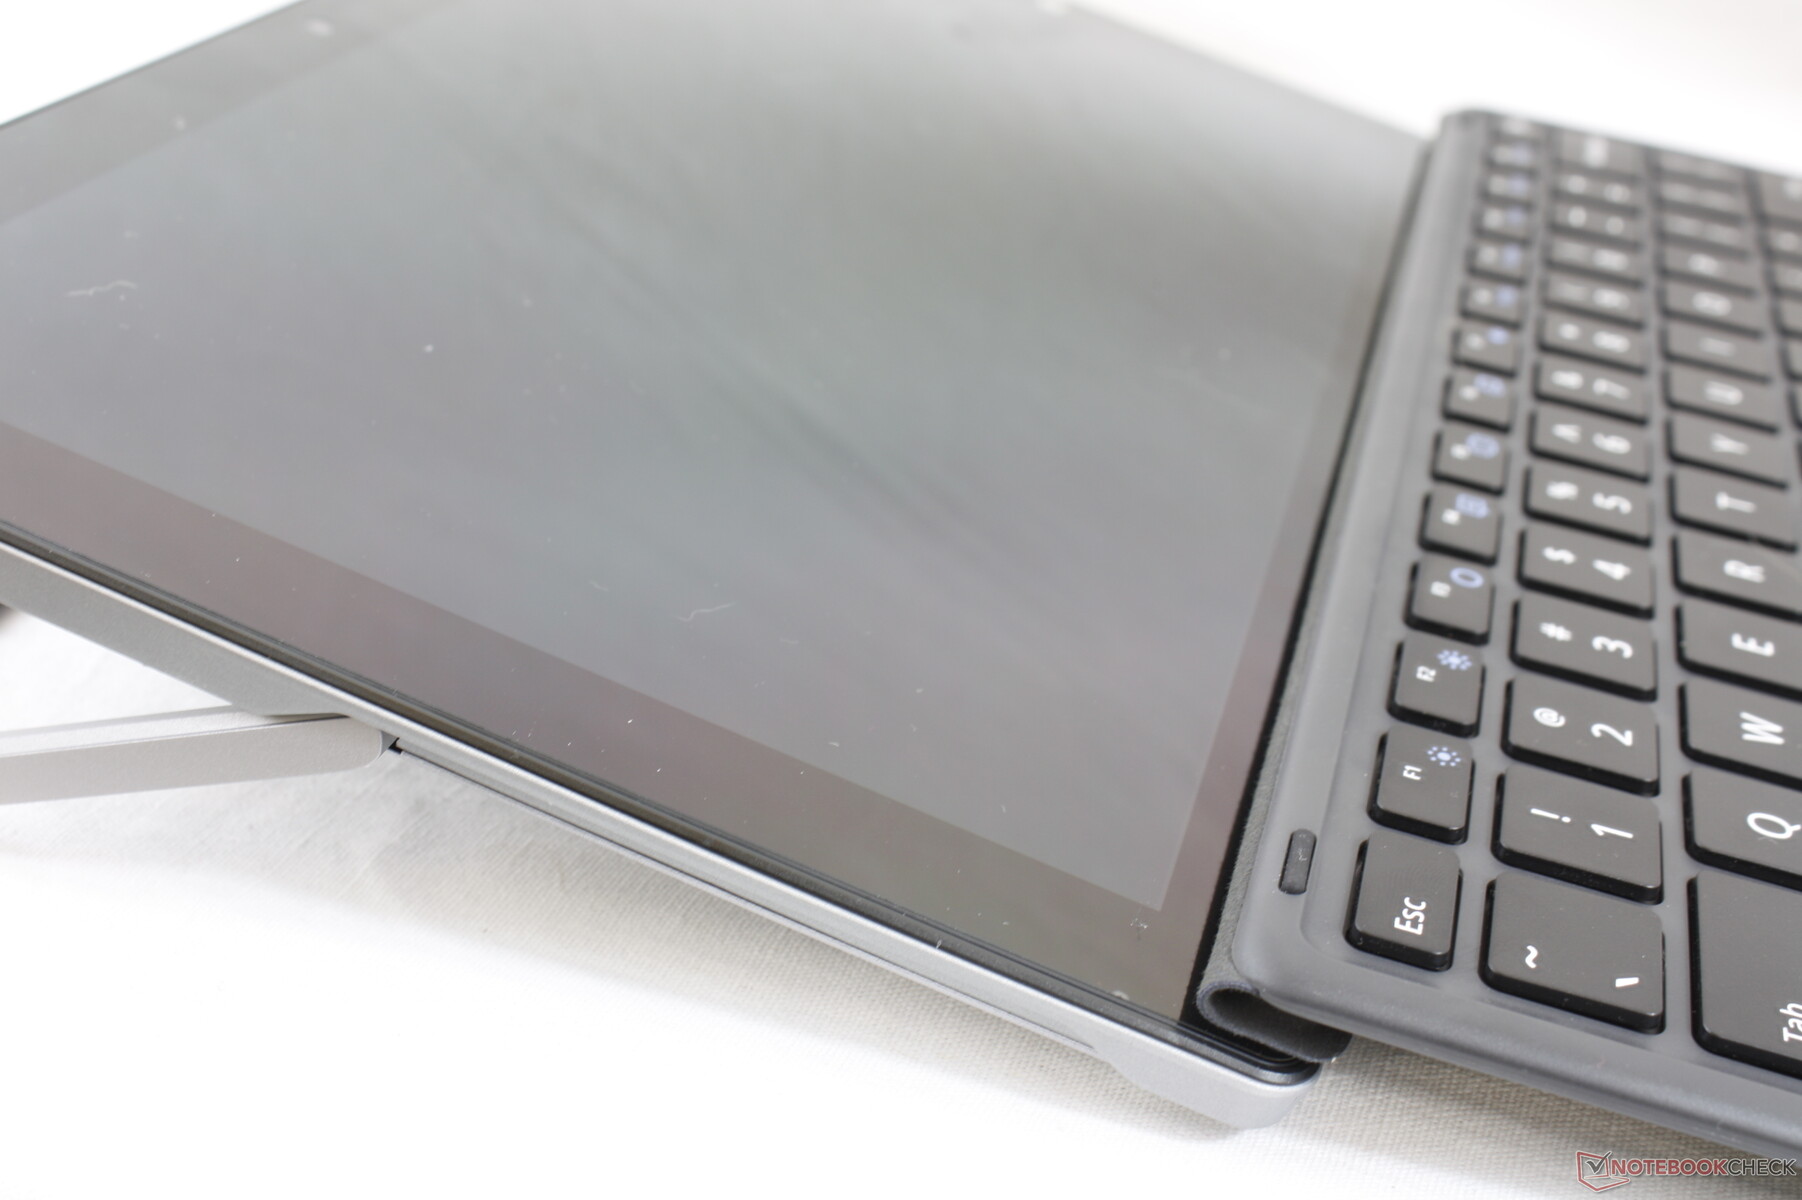
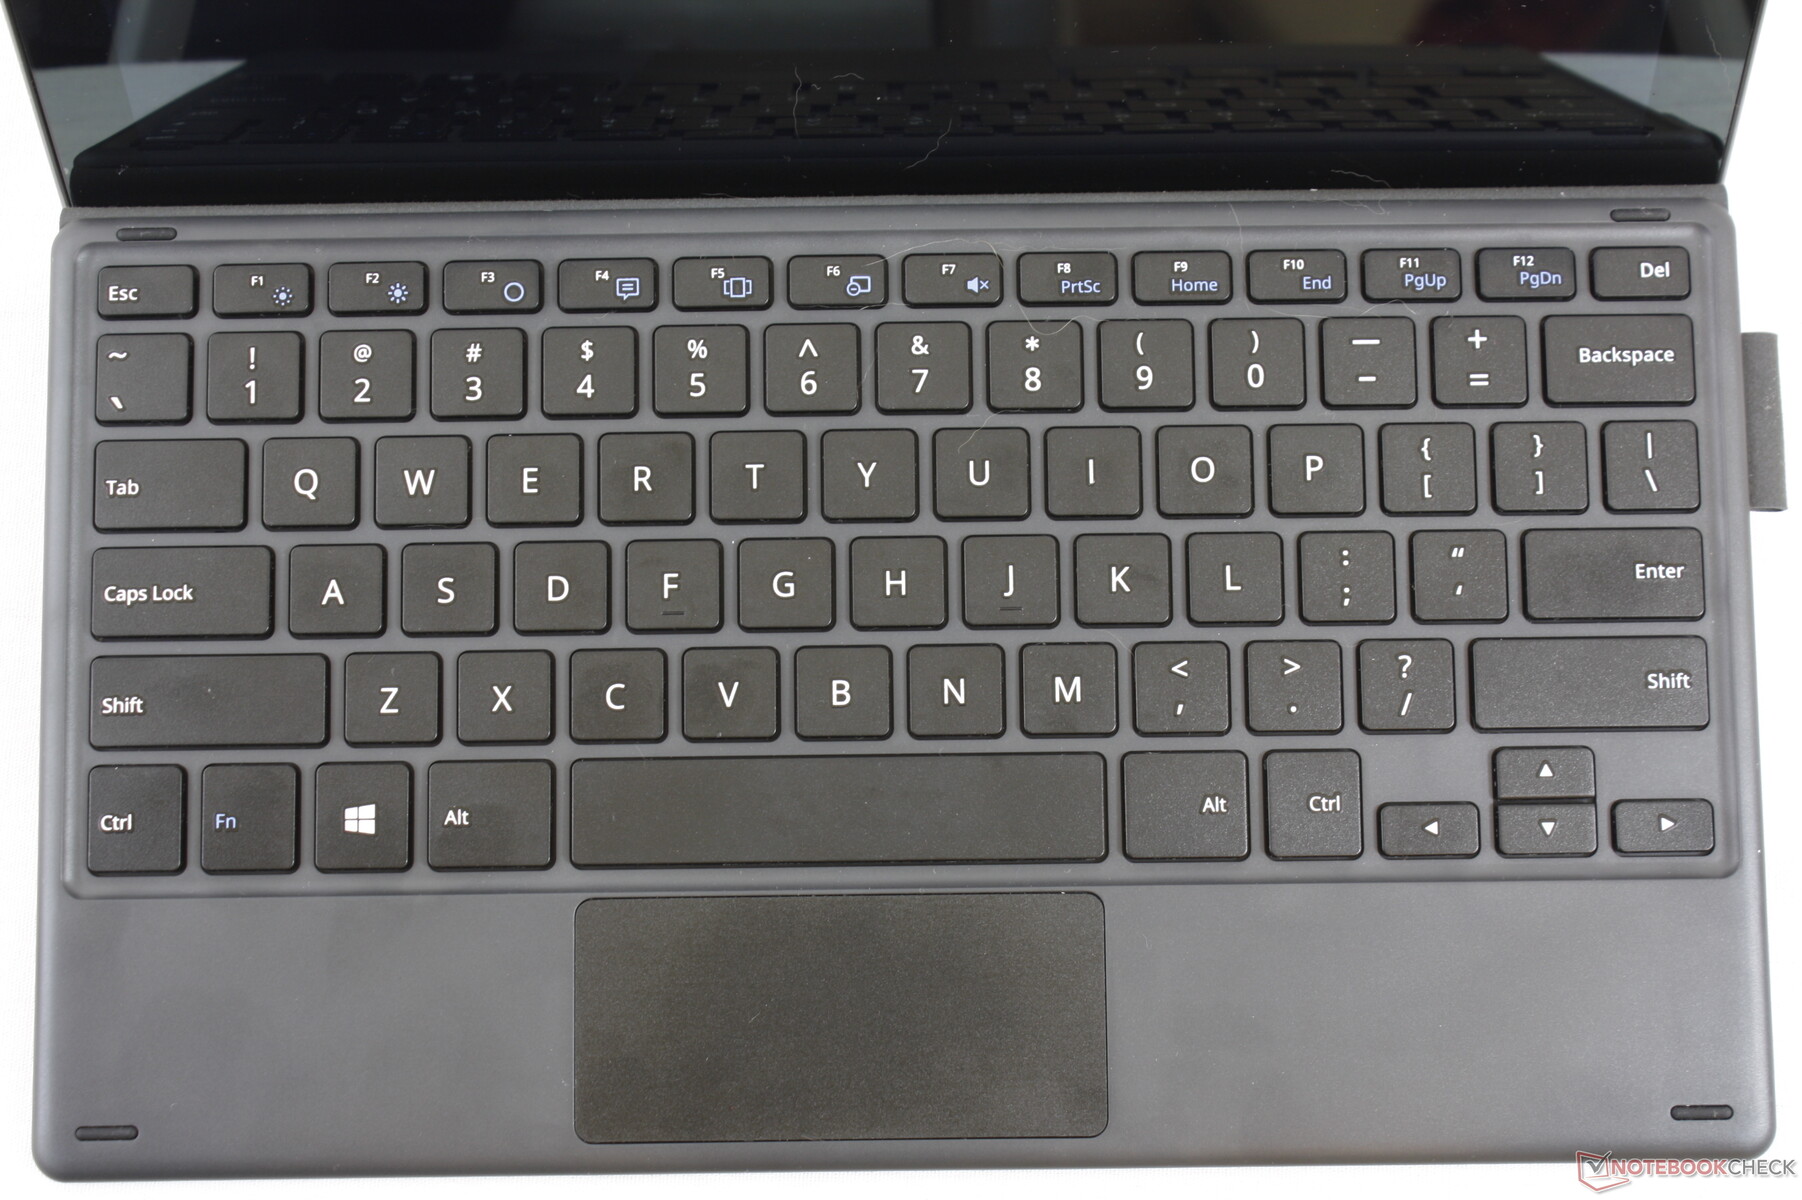
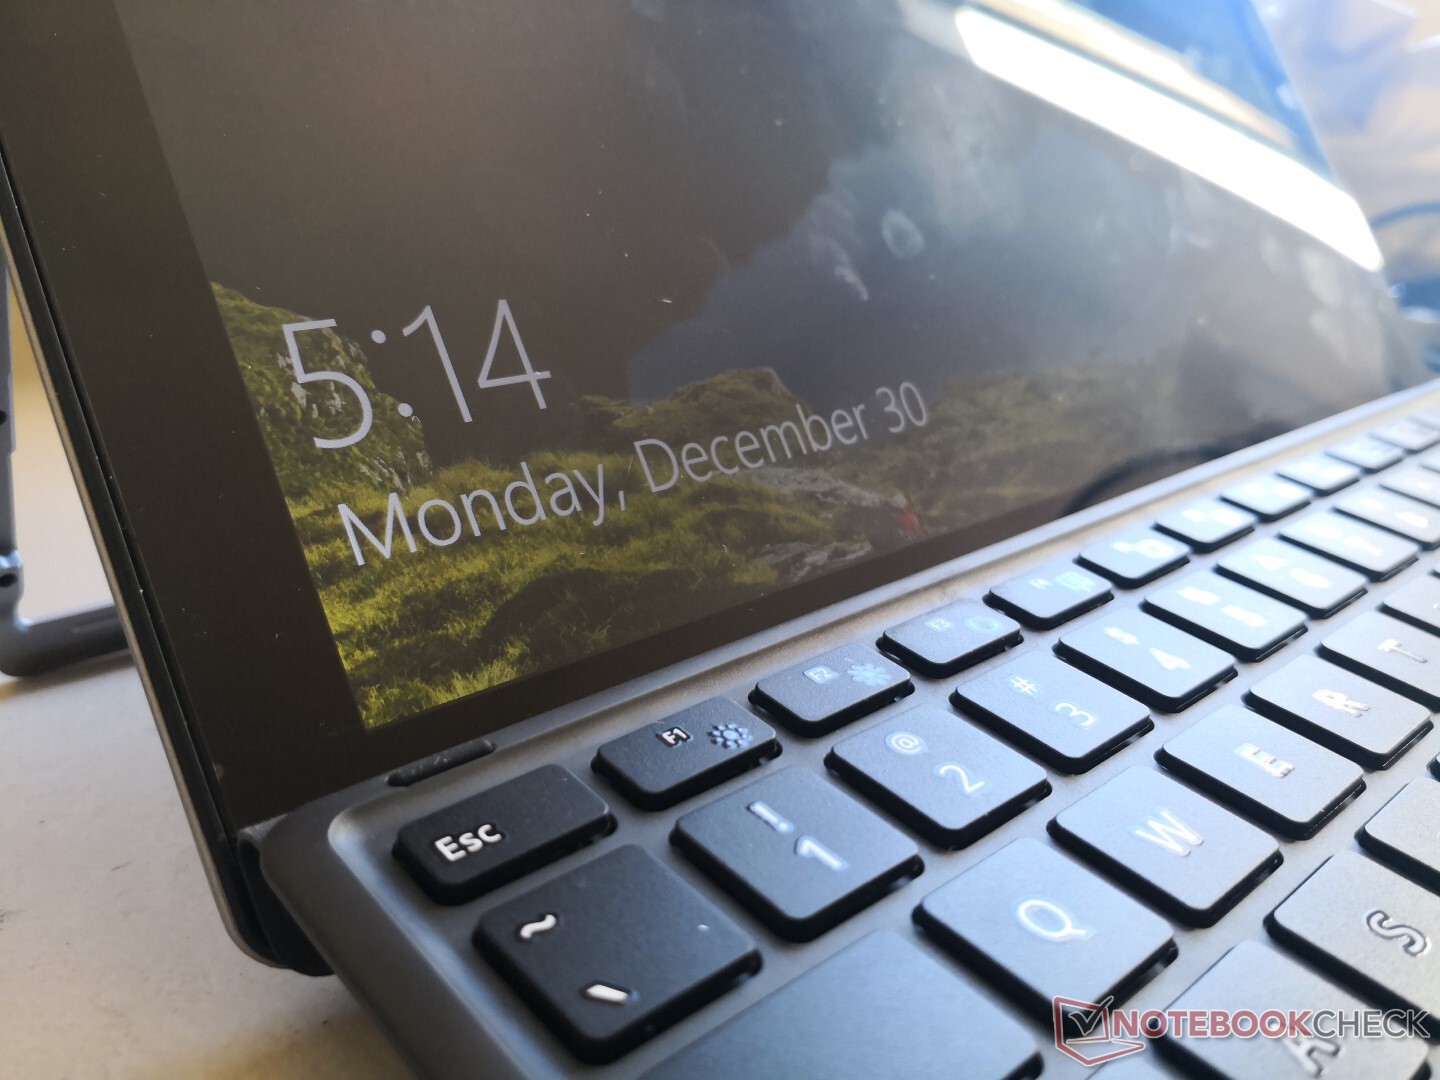
The typing experience is decent with loud clatter and relatively firm key feedback. The keyboard deck, however, tends to flex a bit with each key press meaning that the center keys can feel a bit softer than the edge and corner keys. More uniform feedback would have been ideal.
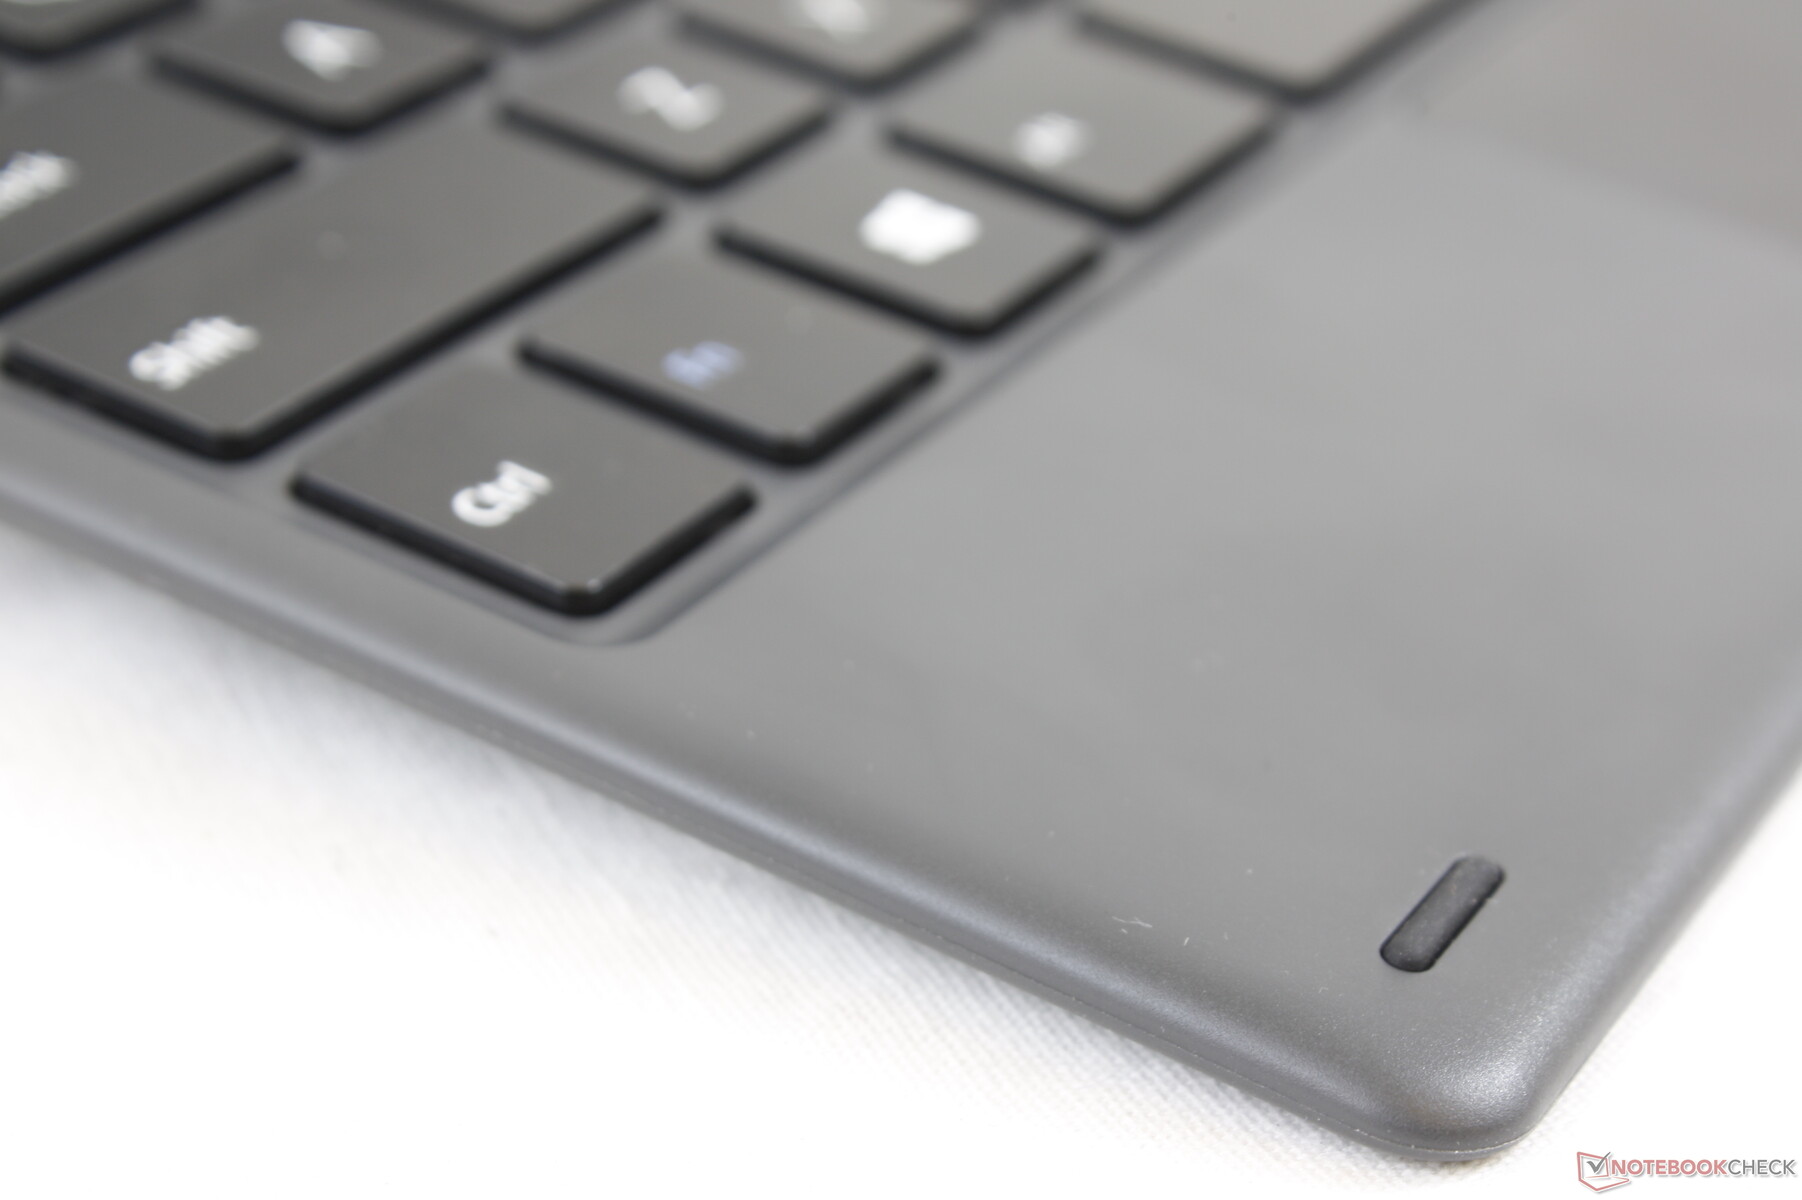
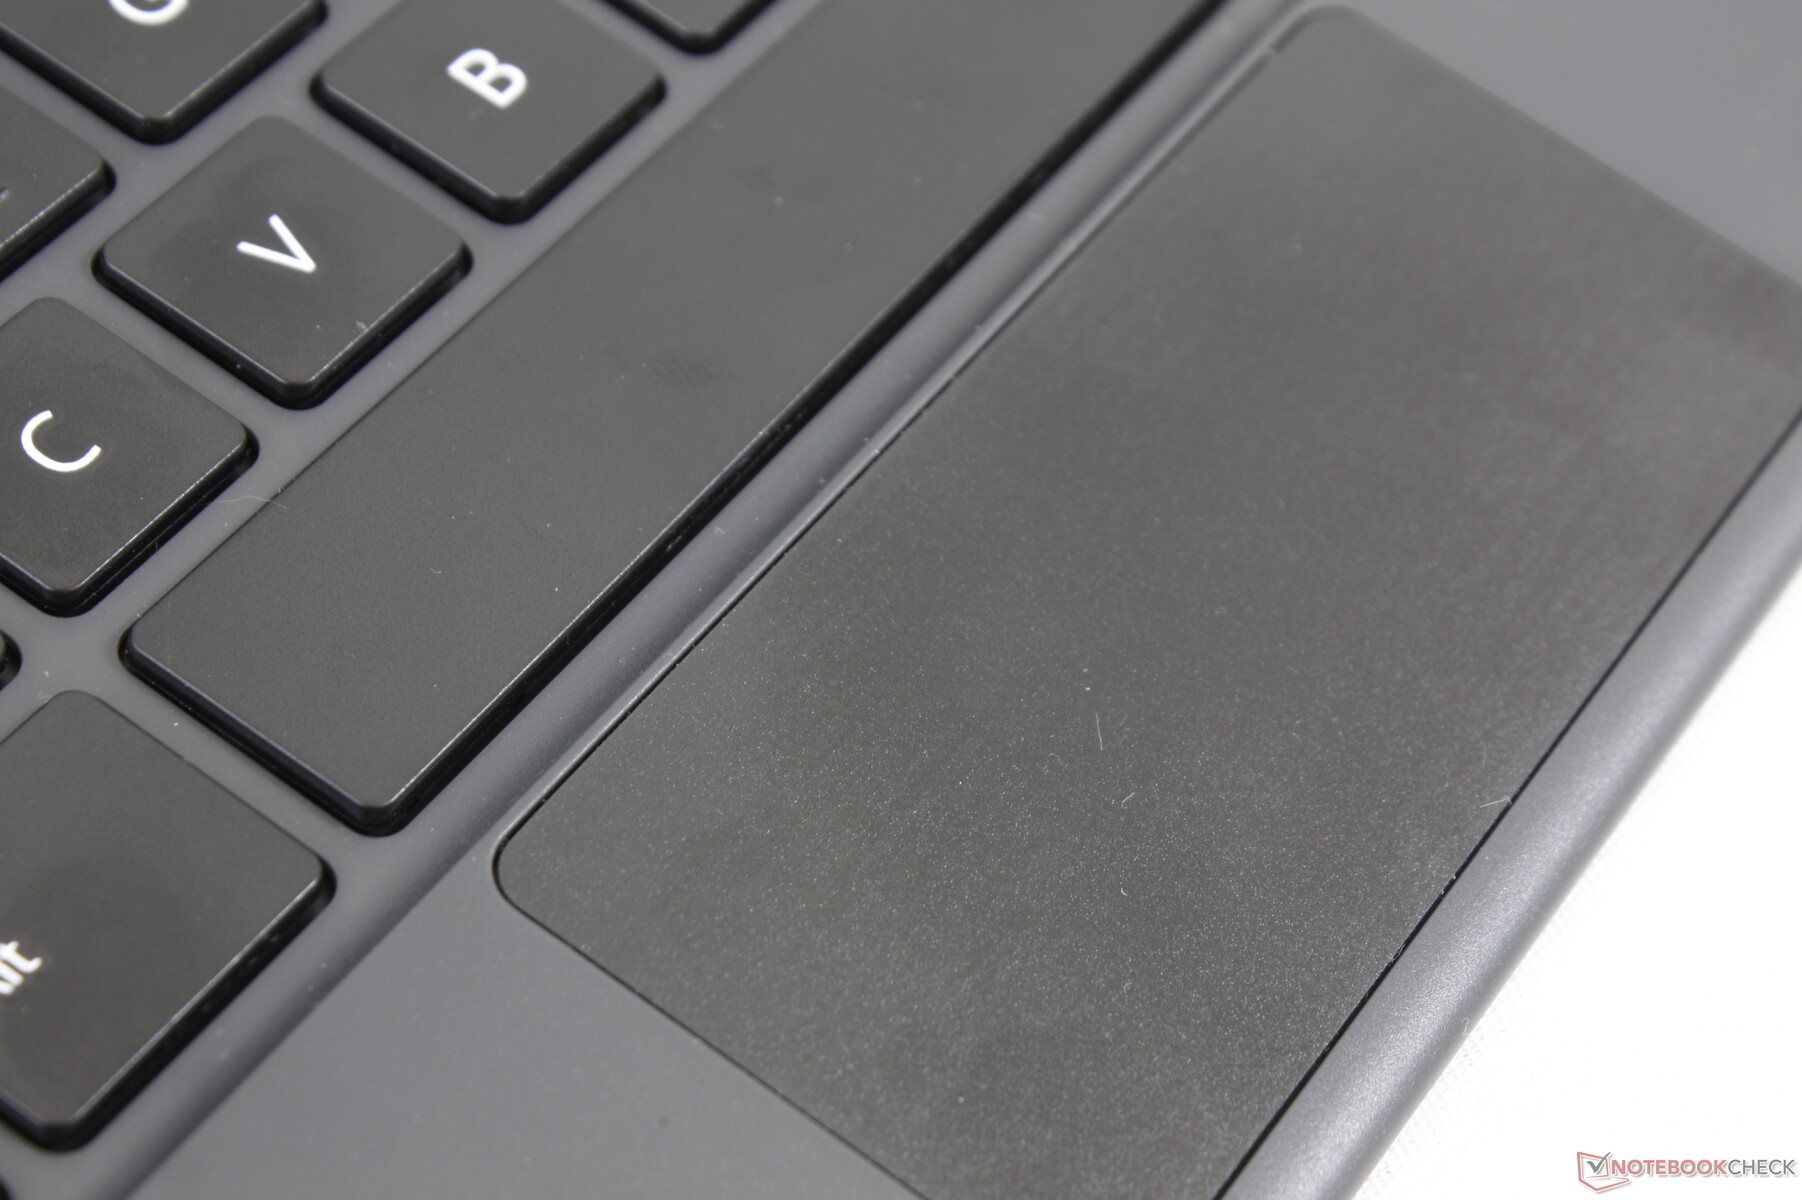
Touchpad
The clickpad is disappointing. Not only is it very small (~8.8 x 4 cm), but its gliding properties are sticky and jumpy when moving the cursor at slow speeds. Thus, precision clicks are difficult with the clickpad. Furthermore, the integrated mouse keys are both very shallow and difficult to press for an overall frustrating experience.
Display
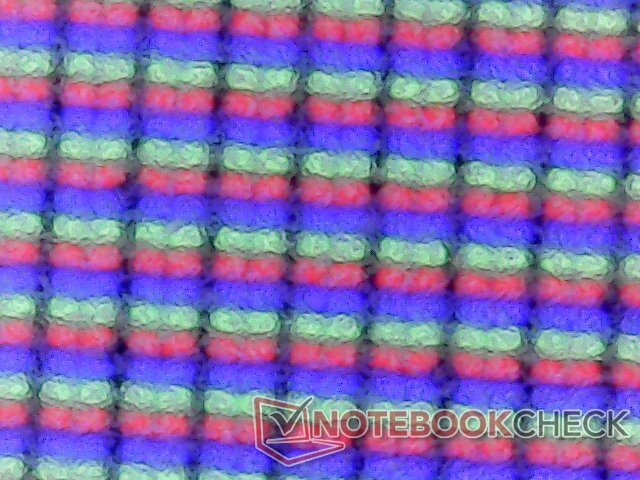
The UBook uses the exact same Panda LC116LF1L01 IPS panel as found on last year's Trekstor Yourbook C11B convertible. Thus, these two systems share similar attributes including color coverage, response times, and contrast ratio. It's a decent mid-range panel considering the low entry price of the tablet. The display on the pricier Surface Pro 7 is two times brighter with two times the contrast ratio.
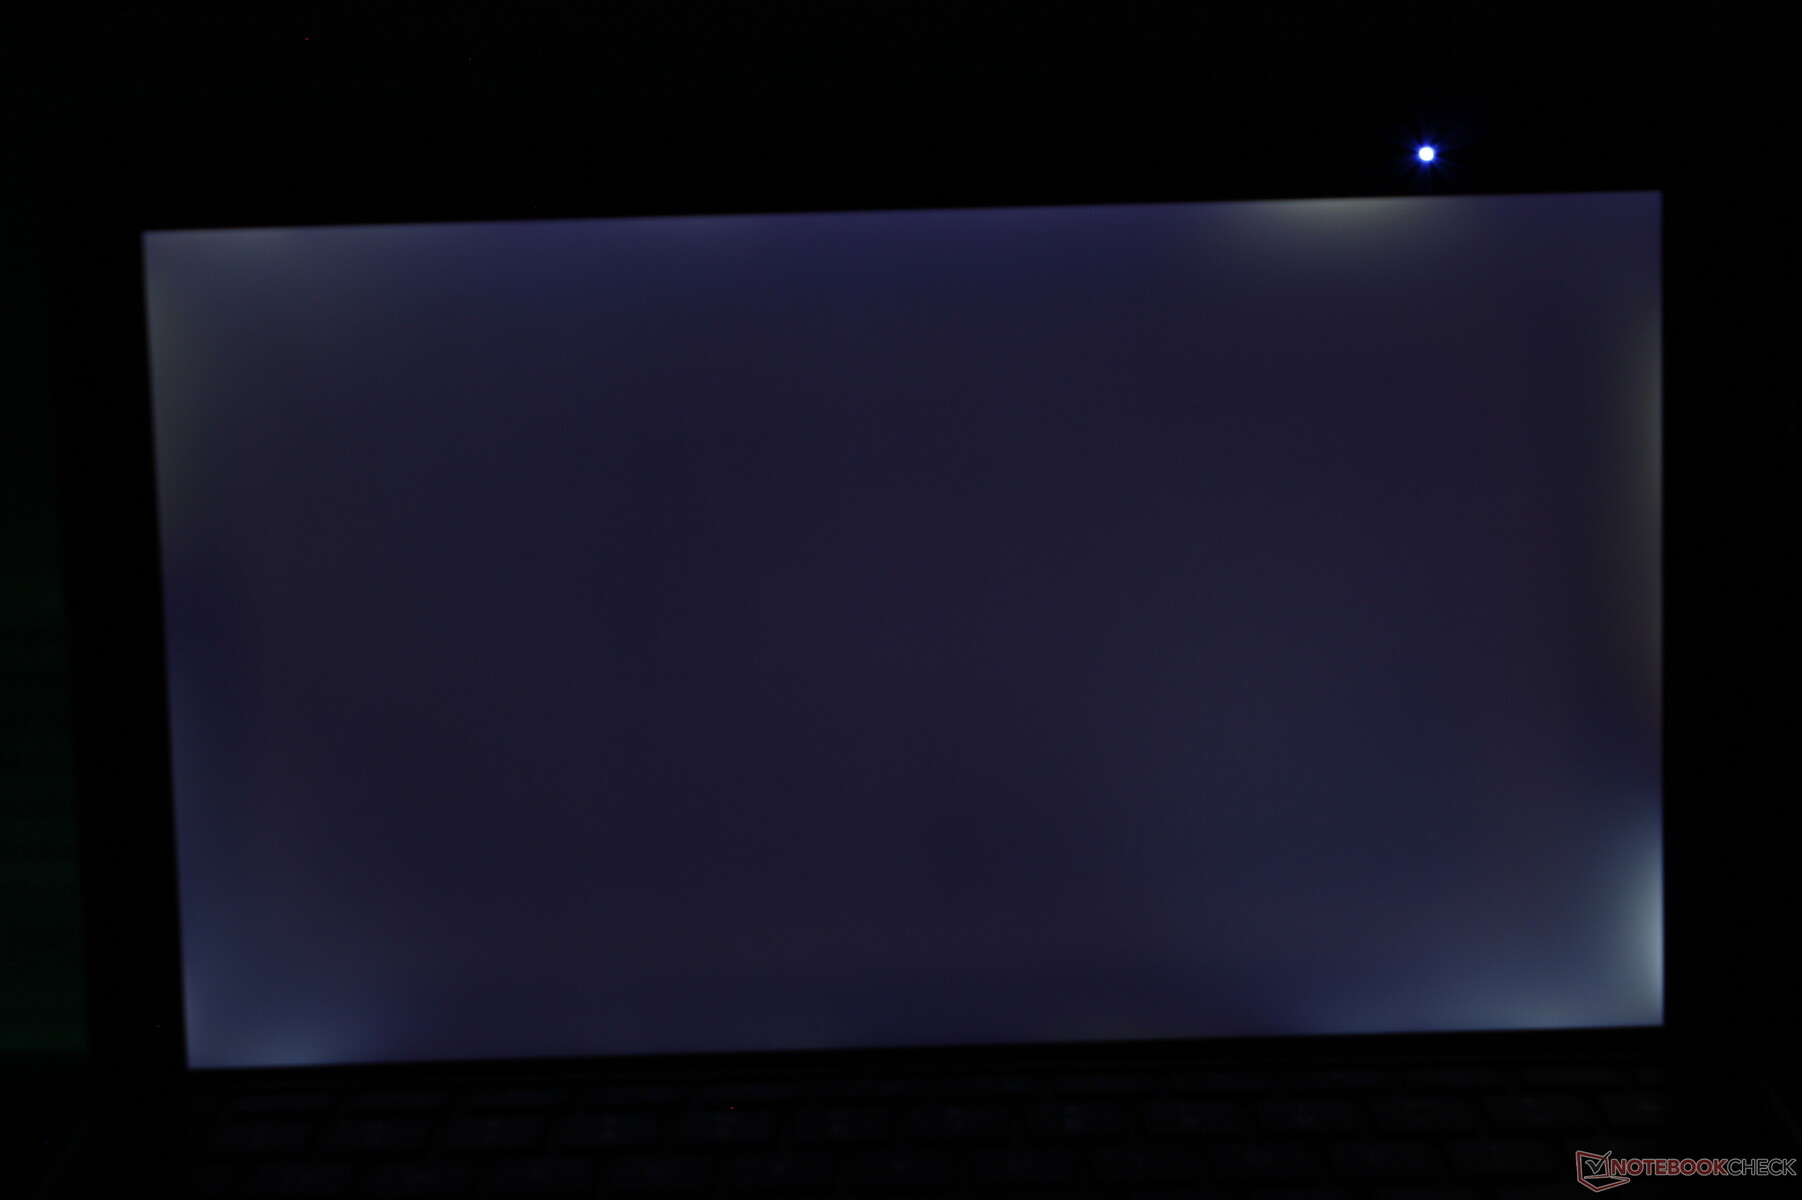
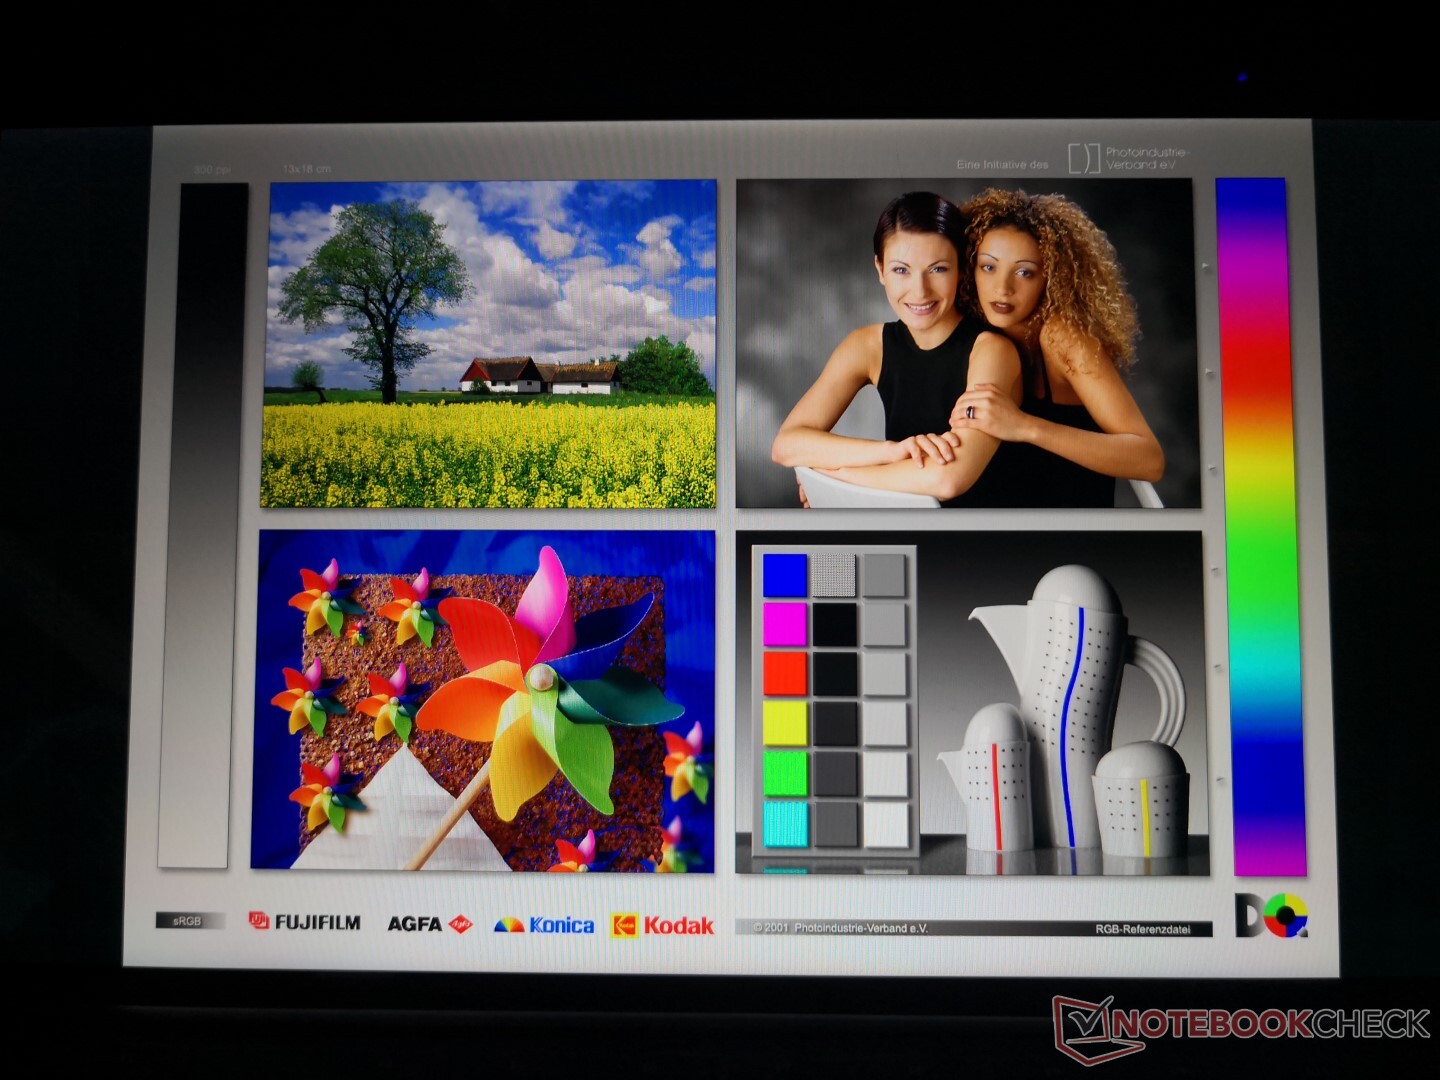
Picture is slightly on the grainy side despite the glossy overlay due to the thick glass layer. Uneven backlight bleeding is also noticeable during a cold boot or when viewing videos with black borders.
| |||||||||||||||||||||||||
Brightness Distribution: 88 %
Center on Battery: 235.6 cd/m²
Contrast: 589:1 (Black: 0.4 cd/m²)
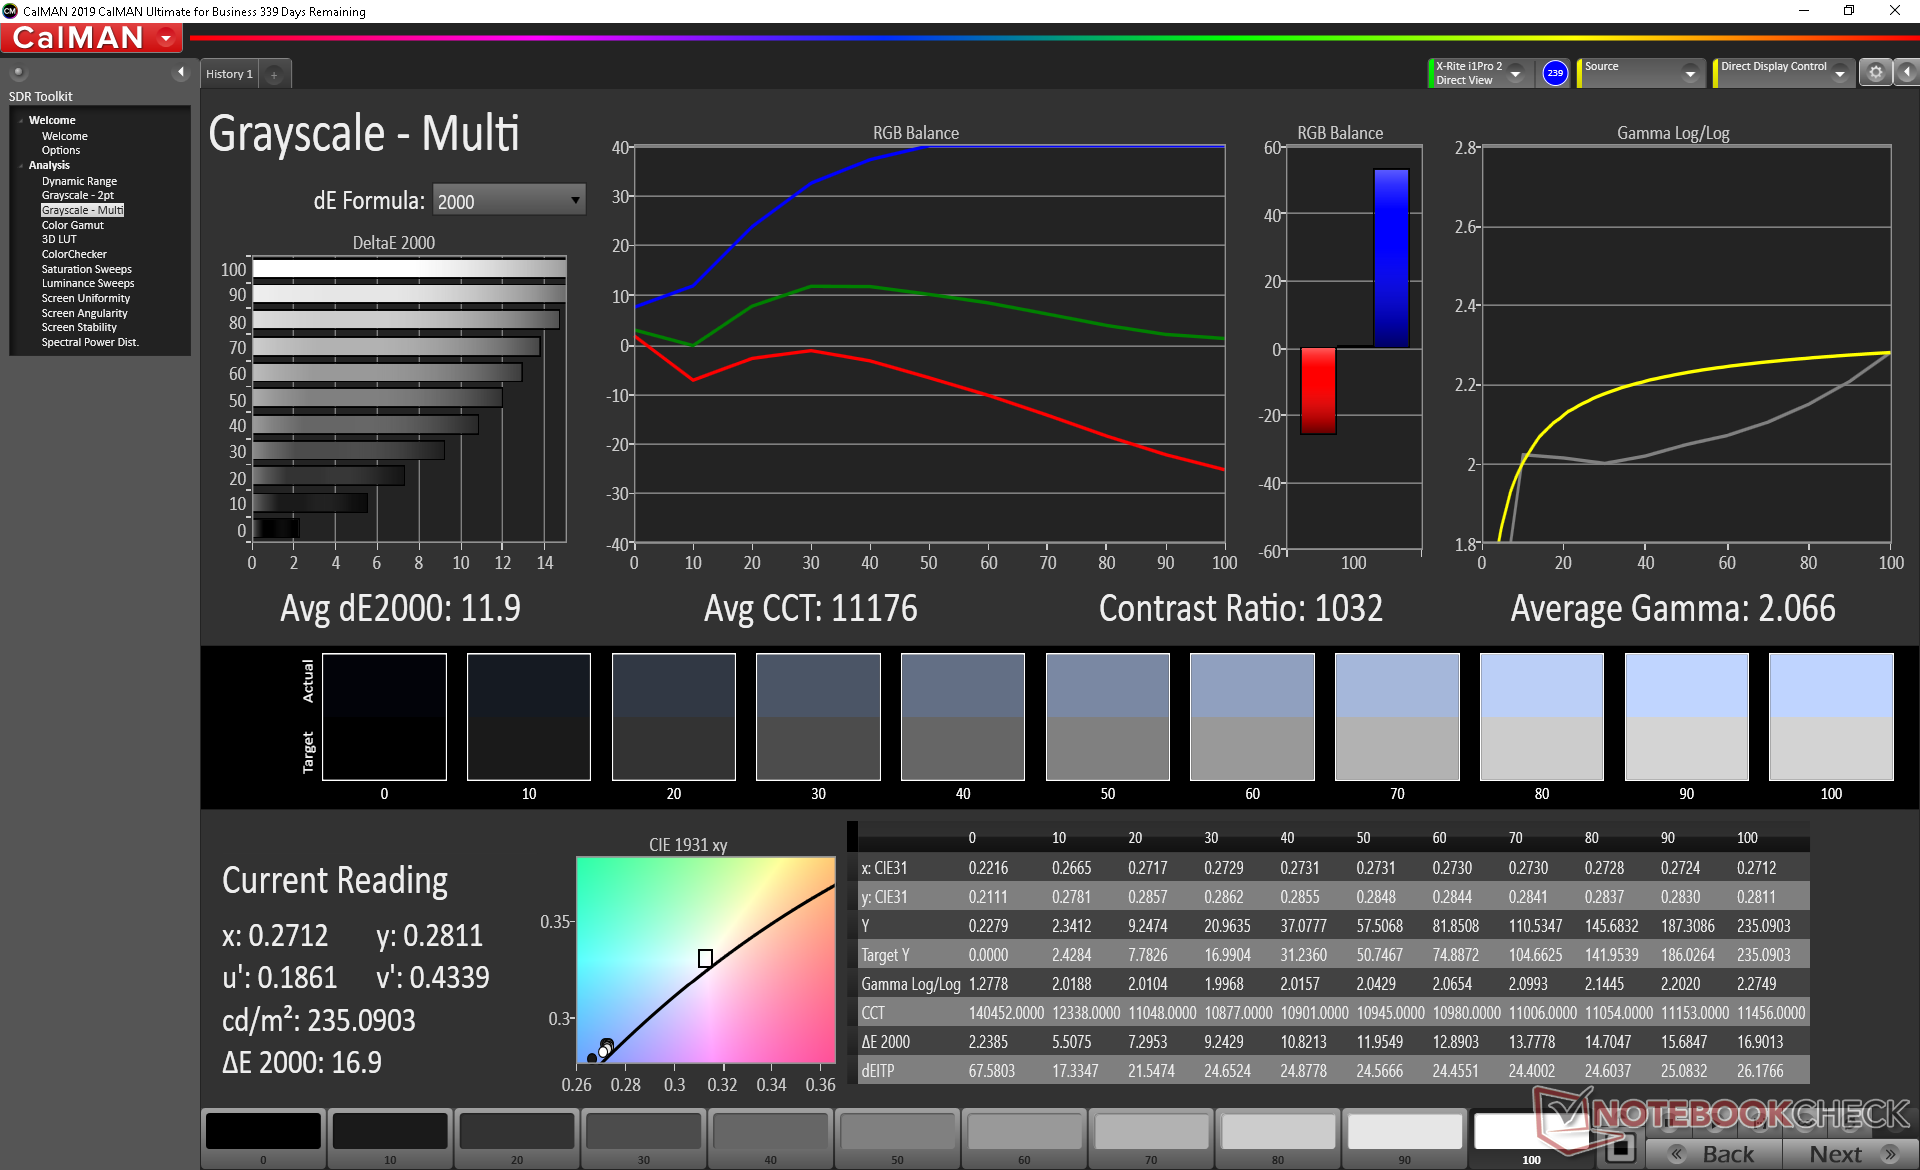
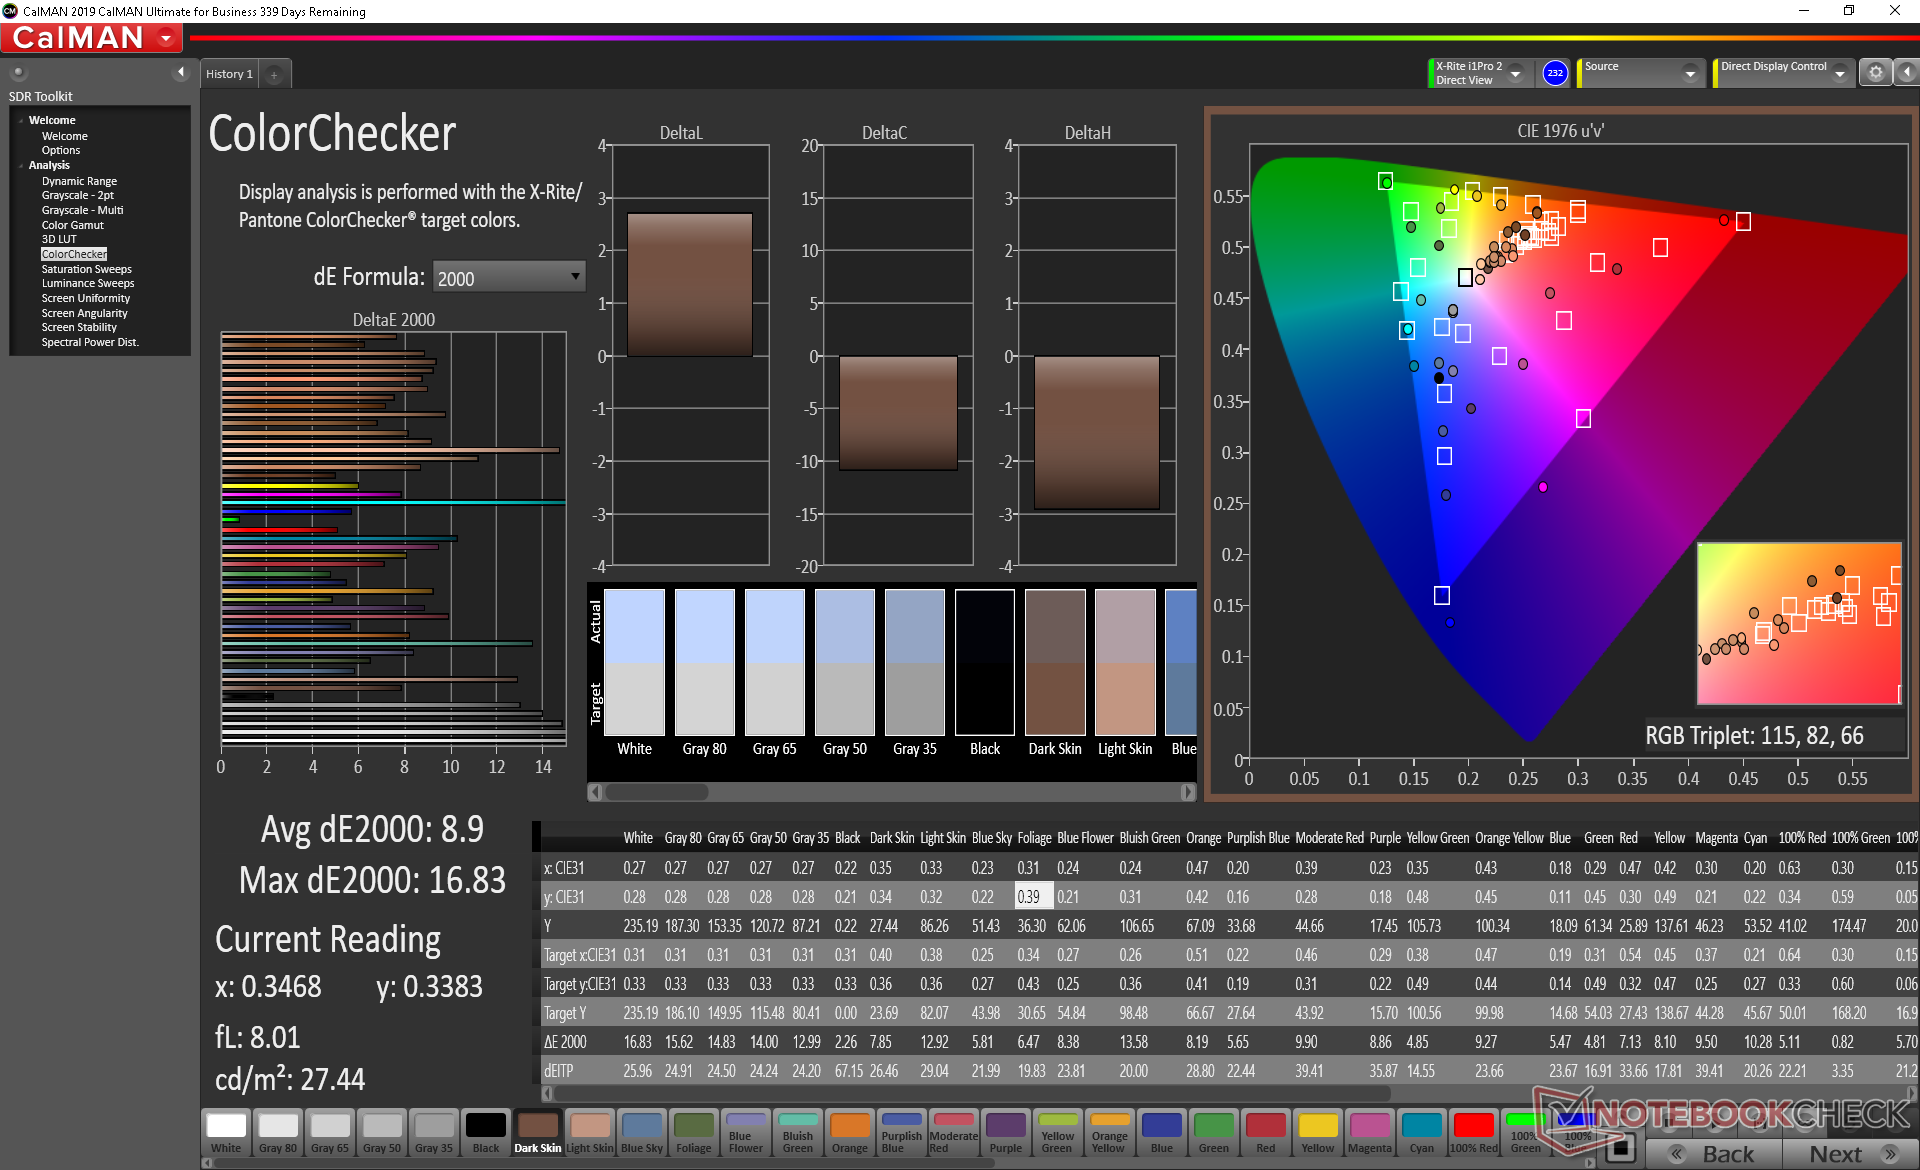
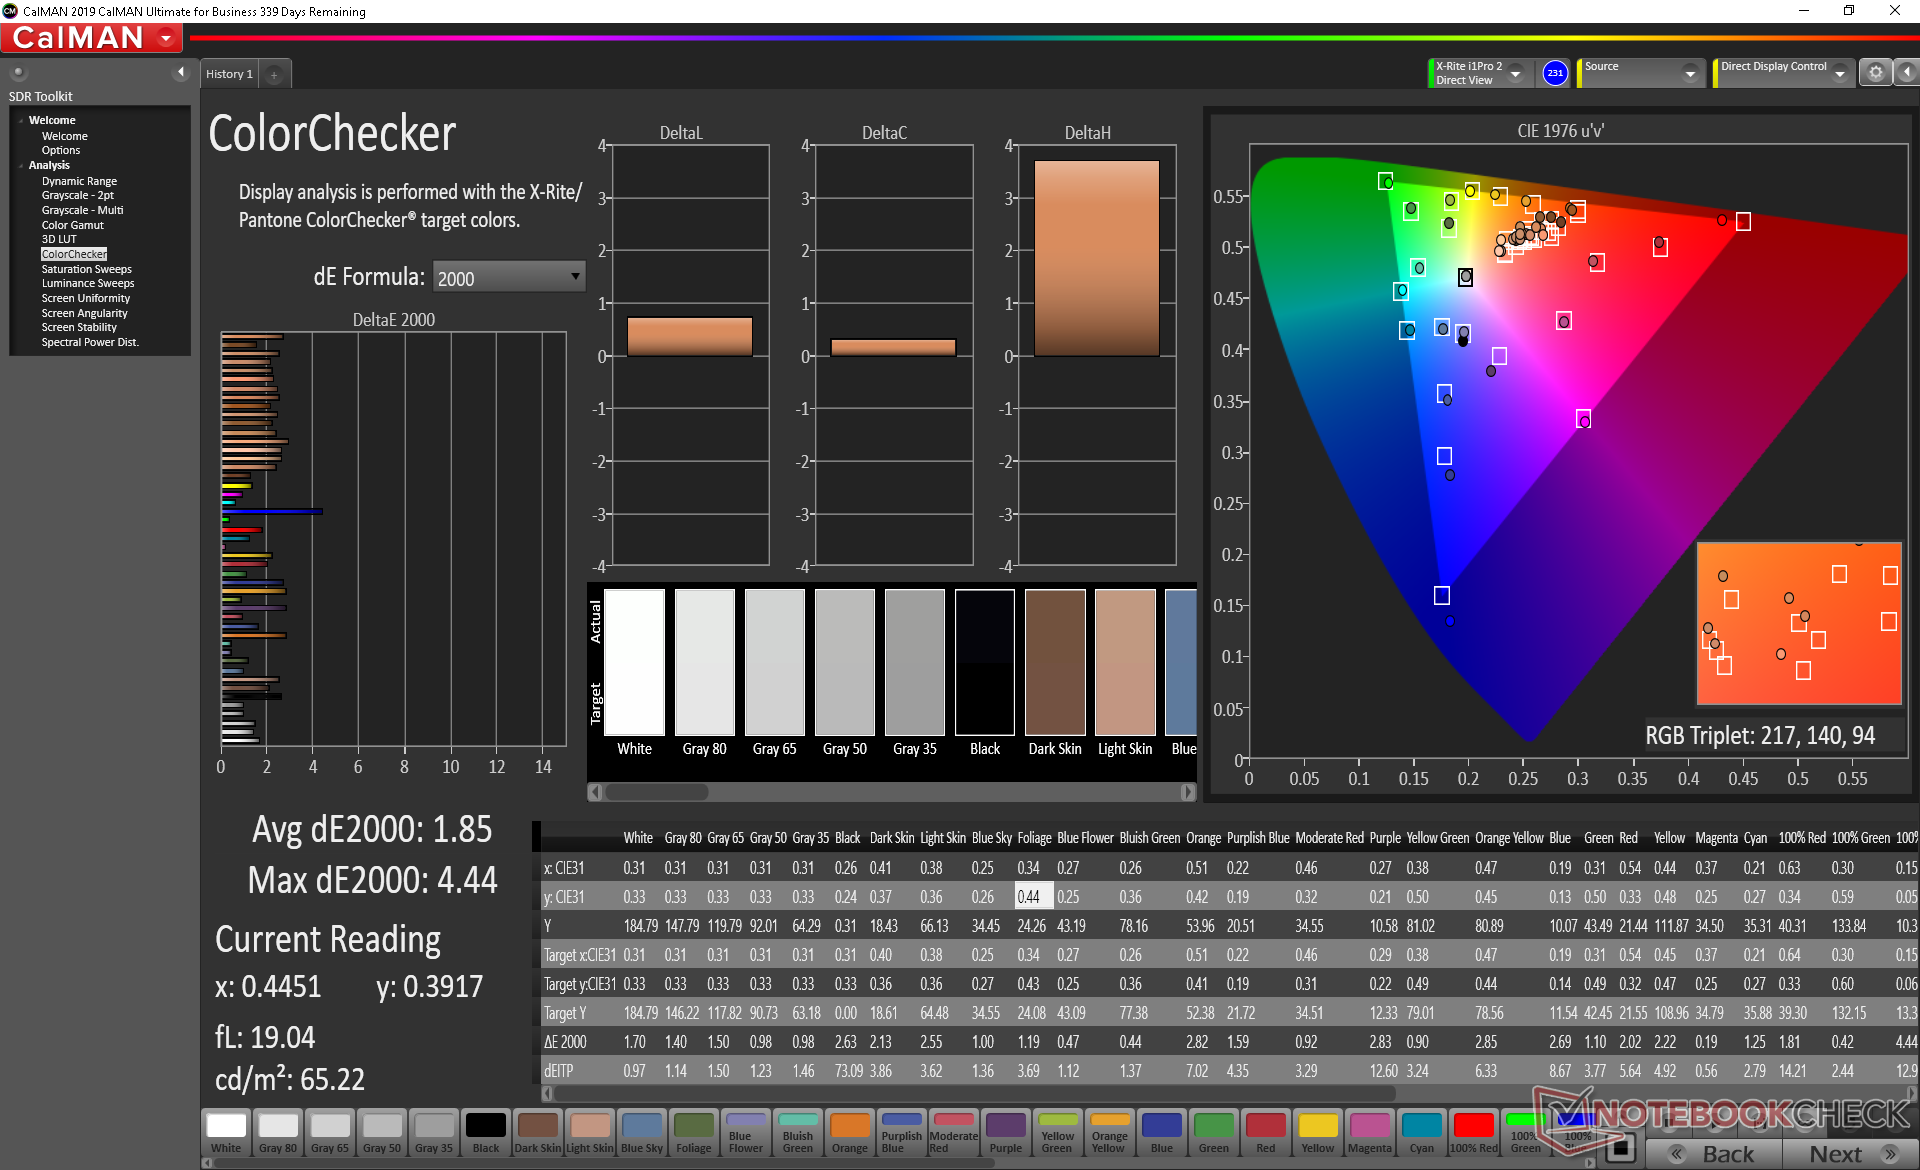
ΔE ColorChecker Calman: 8.9 | ∀{0.5-29.43 Ø4.73}
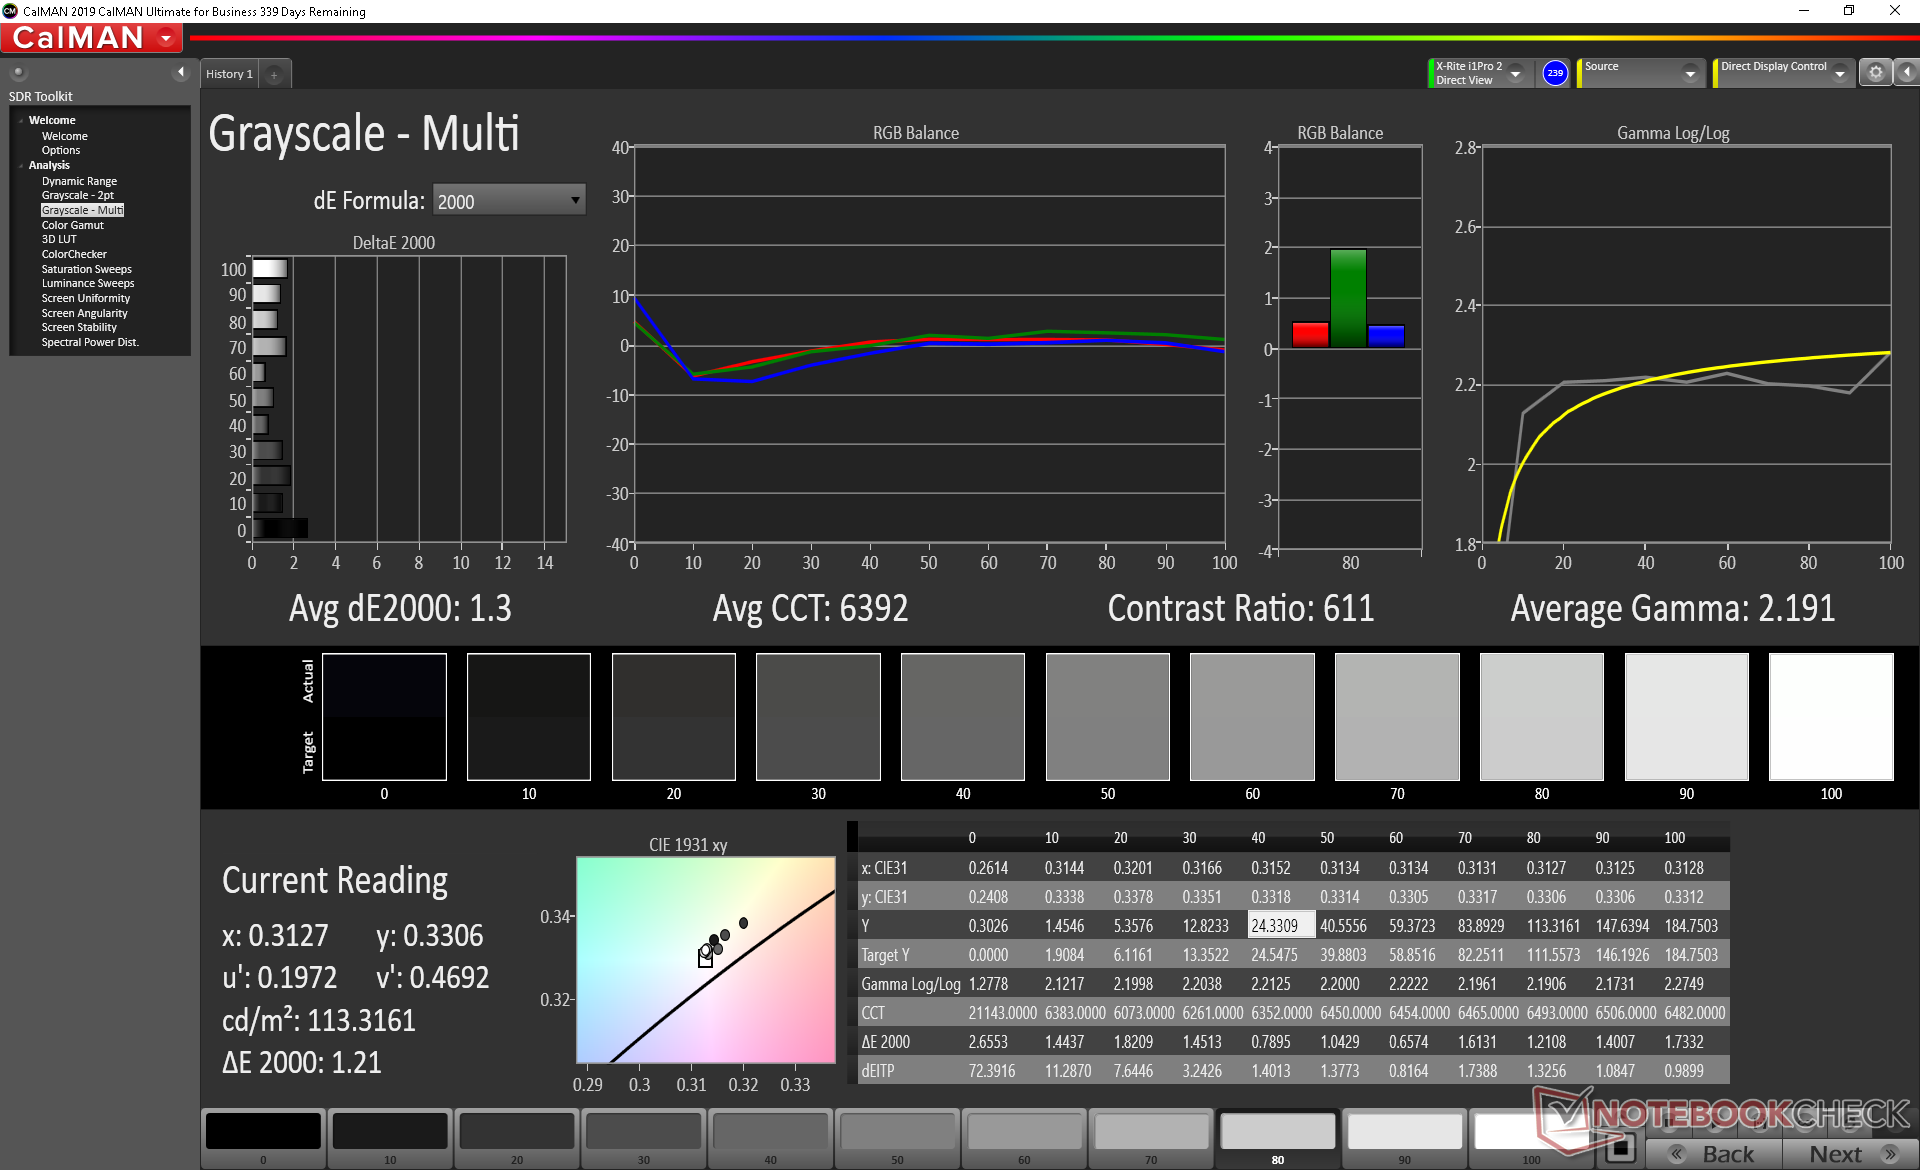
calibrated: 1.85
ΔE Greyscale Calman: 11.9 | ∀{0.09-98 Ø4.97}
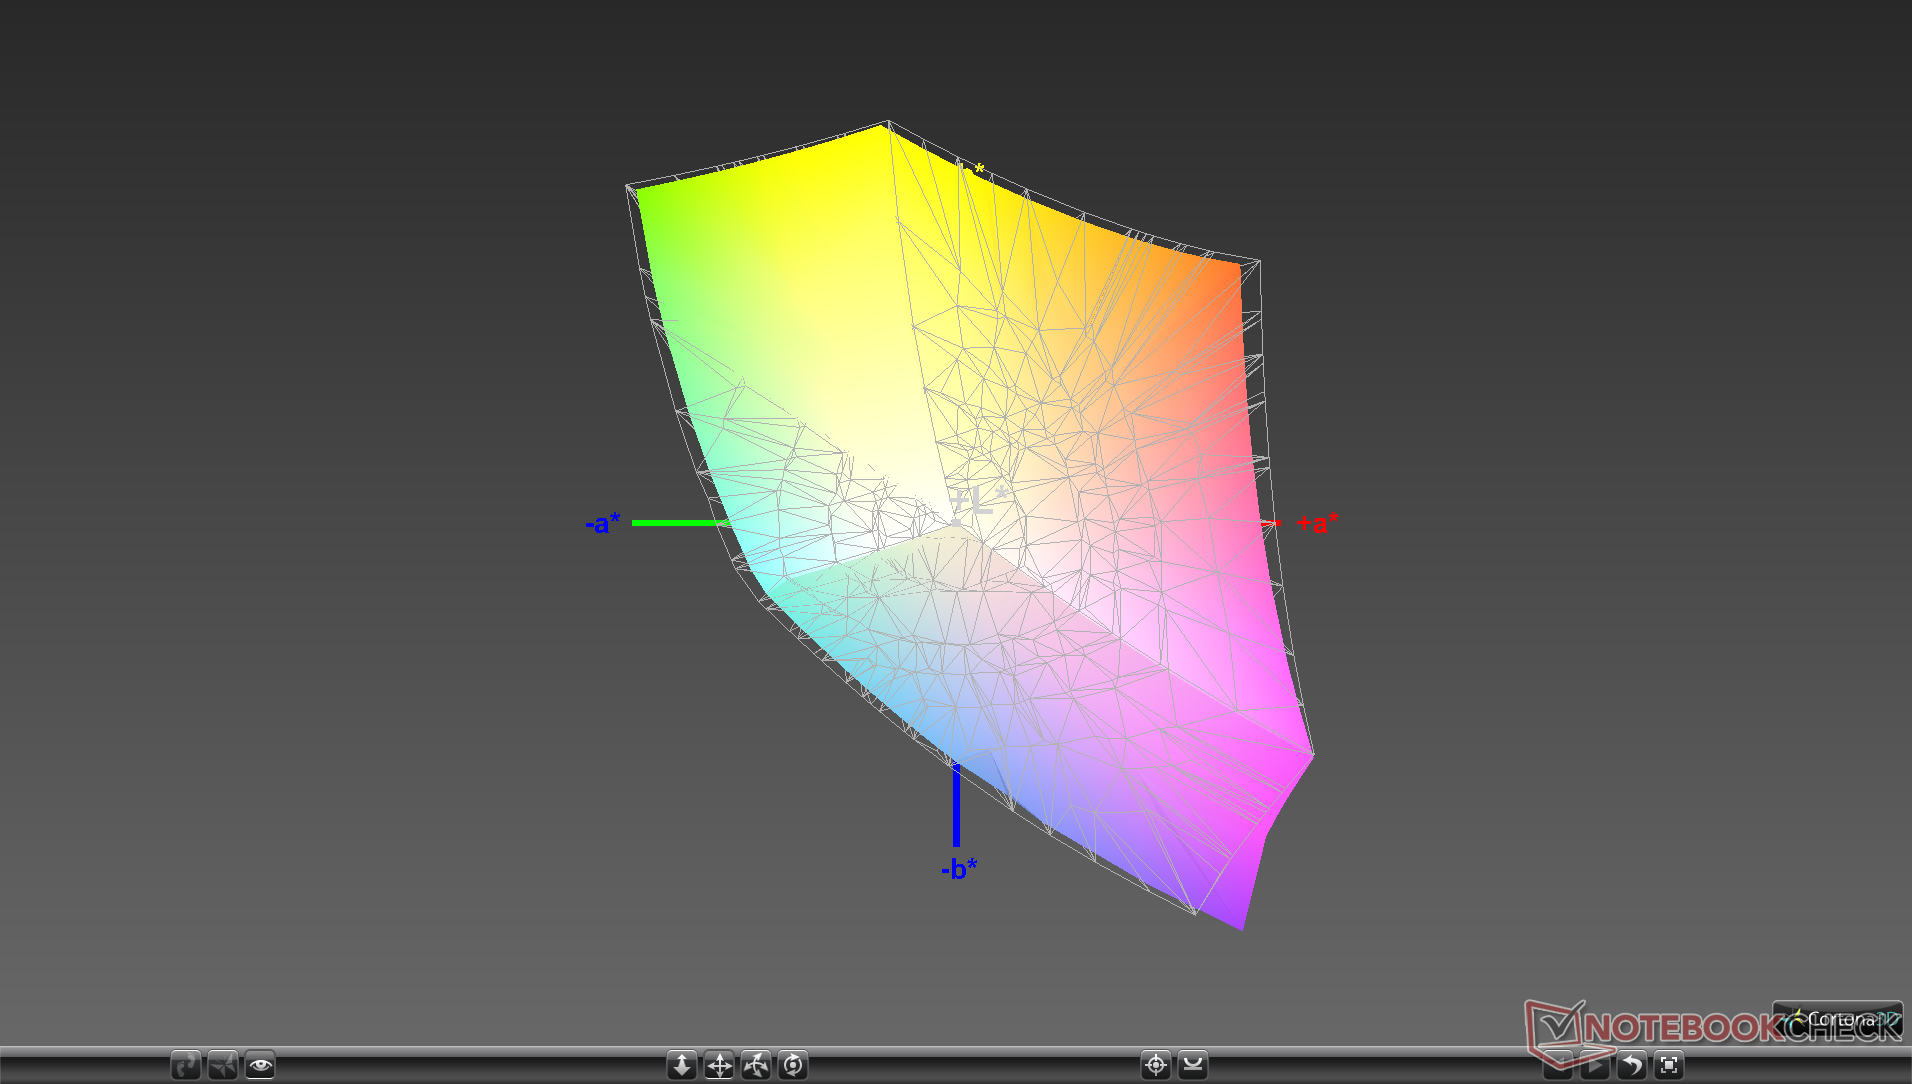
93.8% sRGB (Argyll 1.6.3 3D)
59.5% AdobeRGB 1998 (Argyll 1.6.3 3D)
64.5% AdobeRGB 1998 (Argyll 3D)
94% sRGB (Argyll 3D)
63% Display P3 (Argyll 3D)
Gamma: 2.07
CCT: 11176 K
| Chuwi UBook CWI509 Panda LC116LF1L01, IPS, 11.6", 1920x1080 | Microsoft Surface Pro 7 Core i5-1035G4 LG Philips LP123WQ112604, IPS, 12.3", 2736x1824 | Microsoft Surface Go MHN-00003 Sharp SHP14A6, IPS, 10", 1800x1200 | HP ProBook x360 11 G4 AU Optronics AUO405C, IPS, 11.6", 1366x768 | Trekstor Surftab Theatre S11 IPS, 11.6", 1920x1080 | HP x2 210 G2 AU Optronics AUO18D4, IPS, 10.1", 1280x800 | |
|---|---|---|---|---|---|---|
| Display | 3% | 5% | -30% | -33% | ||
| Display P3 Coverage (%) | 63 | 66 5% | 66.5 6% | 43.78 -31% | 42.17 -33% | |
| sRGB Coverage (%) | 94 | 93.8 0% | 97.5 4% | 65.7 -30% | 62.9 -33% | |
| AdobeRGB 1998 Coverage (%) | 64.5 | 66.9 4% | 67.5 5% | 45.27 -30% | 43.6 -32% | |
| Response Times | 8% | -3% | 3% | -28% | -22% | |
| Response Time Grey 50% / Grey 80% * (ms) | 38 ? | 34.8 ? 8% | 44 ? -16% | 40 ? -5% | 48.8 ? -28% | 46 ? -21% |
| Response Time Black / White * (ms) | 28.8 ? | 26.4 ? 8% | 25.6 ? 11% | 26 ? 10% | 37 ? -28% | 35 ? -22% |
| PWM Frequency (Hz) | 10000 ? | 21550 ? | 1020 ? | 25510 ? | ||
| Screen | 36% | 60% | 25% | 29% | 25% | |
| Brightness middle (cd/m²) | 235.6 | 480.4 104% | 456 94% | 211 -10% | 245 4% | 292 24% |
| Brightness (cd/m²) | 220 | 485 120% | 426 94% | 211 -4% | 231 5% | 275 25% |
| Brightness Distribution (%) | 88 | 91 3% | 88 0% | 88 0% | 87 -1% | 82 -7% |
| Black Level * (cd/m²) | 0.4 | 0.48 -20% | 0.31 23% | 0.15 63% | 0.25 37% | 0.17 57% |
| Contrast (:1) | 589 | 1001 70% | 1471 150% | 1407 139% | 980 66% | 1718 192% |
| Colorchecker dE 2000 * | 8.9 | 5 44% | 1.3 85% | 4.32 51% | 5.2 42% | 6.76 24% |
| Colorchecker dE 2000 max. * | 16.83 | 7.72 54% | 3 82% | 18.44 -10% | 10.8 36% | 24.45 -45% |
| Colorchecker dE 2000 calibrated * | 1.85 | 2.44 -32% | 1.1 41% | |||
| Greyscale dE 2000 * | 11.9 | 5.9 50% | 1.4 88% | 2.39 80% | 7.3 39% | 6.01 49% |
| Gamma | 2.07 106% | 2.38 92% | 2.24 98% | 2.38 92% | 2.24 98% | 2.26 97% |
| CCT | 11176 58% | 7805 83% | 6687 97% | 6815 95% | 7496 87% | 6749 96% |
| Color Space (Percent of AdobeRGB 1998) (%) | 59.5 | 60.3 1% | 62.3 5% | 42 -29% | 40 -33% | |
| Color Space (Percent of sRGB) (%) | 93.8 | 93.2 -1% | 96.8 3% | 65 -31% | 63 -33% | |
| Total Average (Program / Settings) | 16% /
26% | 21% /
42% | -1% /
11% | 1% /
17% | -10% /
7% |
* ... smaller is better
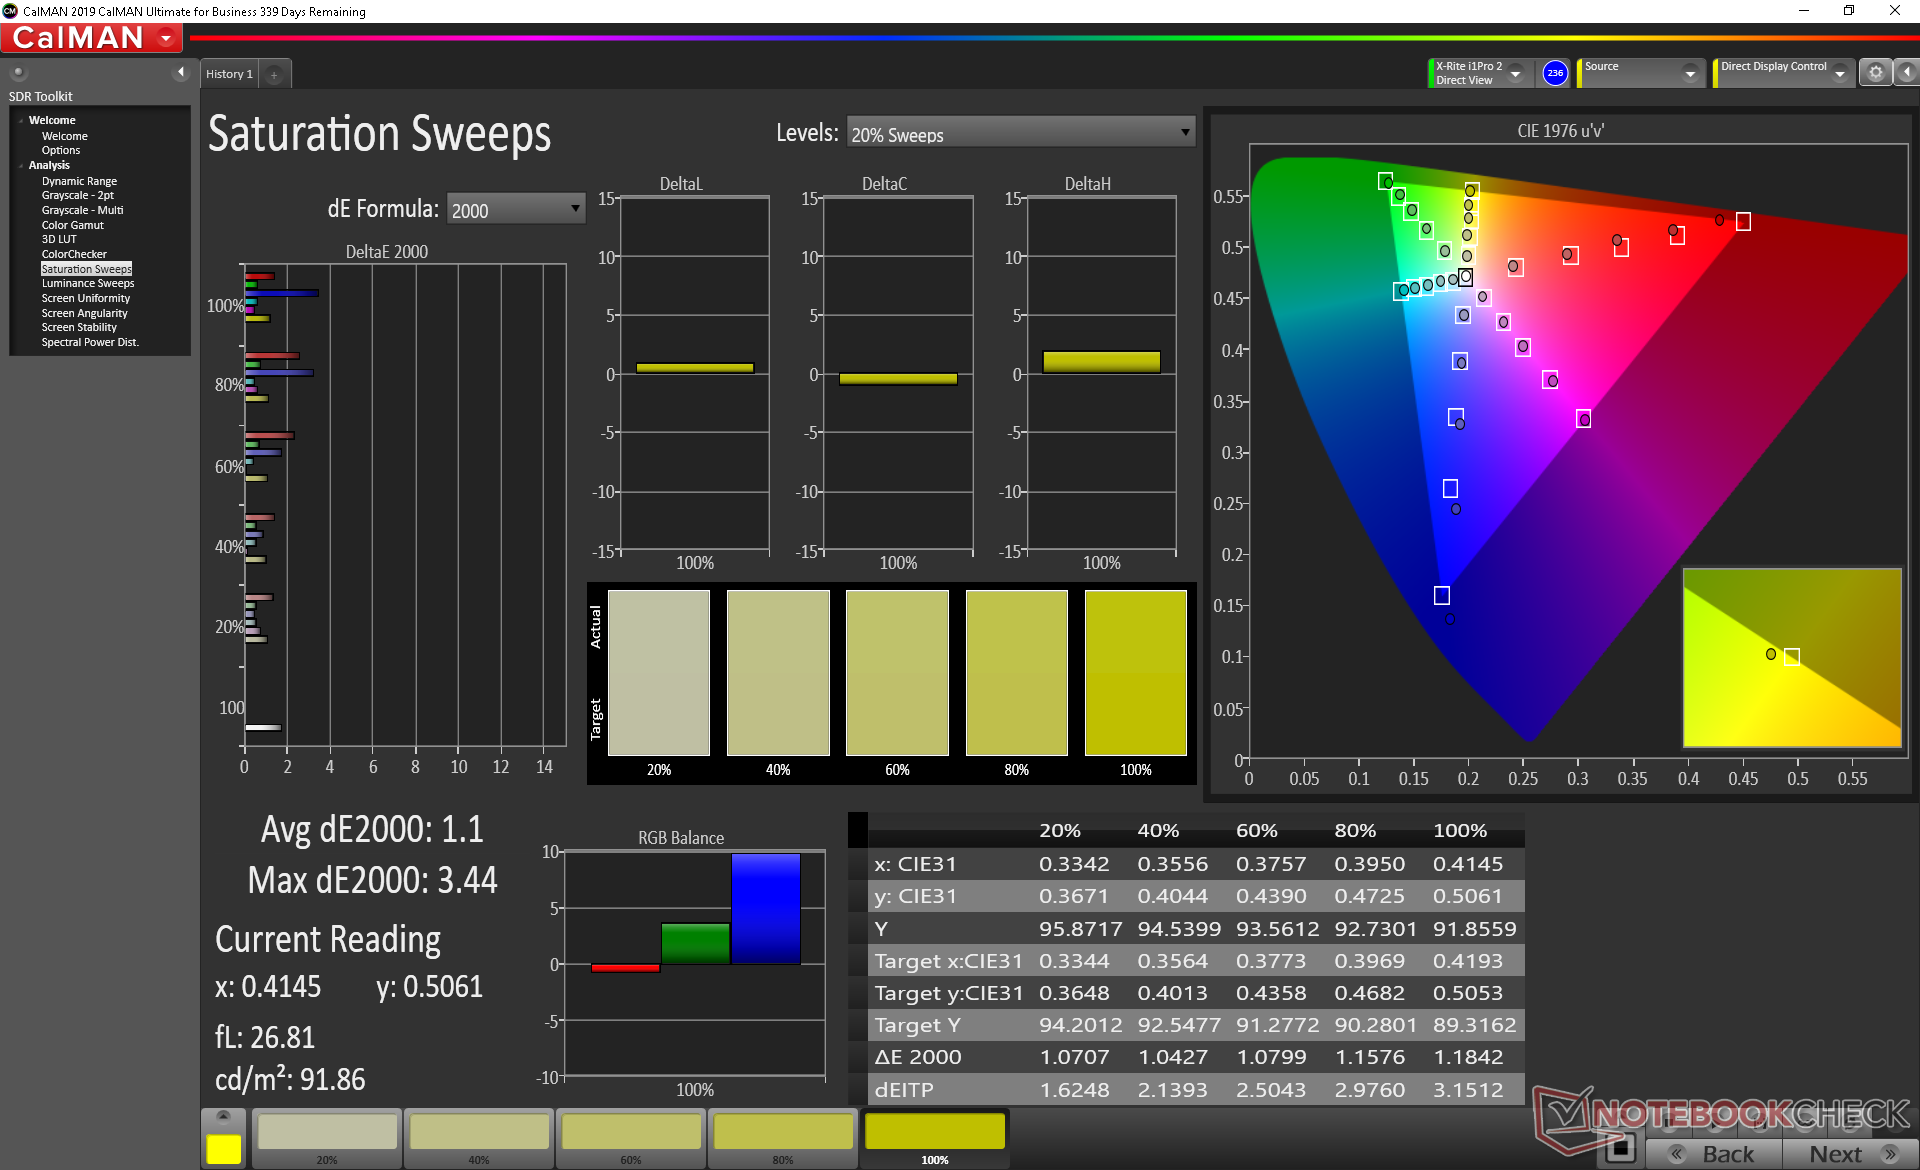
Color space covers nearly 95 percent of sRGB to be surprisingly similar to even the 2019 Microsoft Surface Pro. The competing HP ProBook x360 11 G4 utilizes a cheaper AU Optronics panel with a narrower gamut.

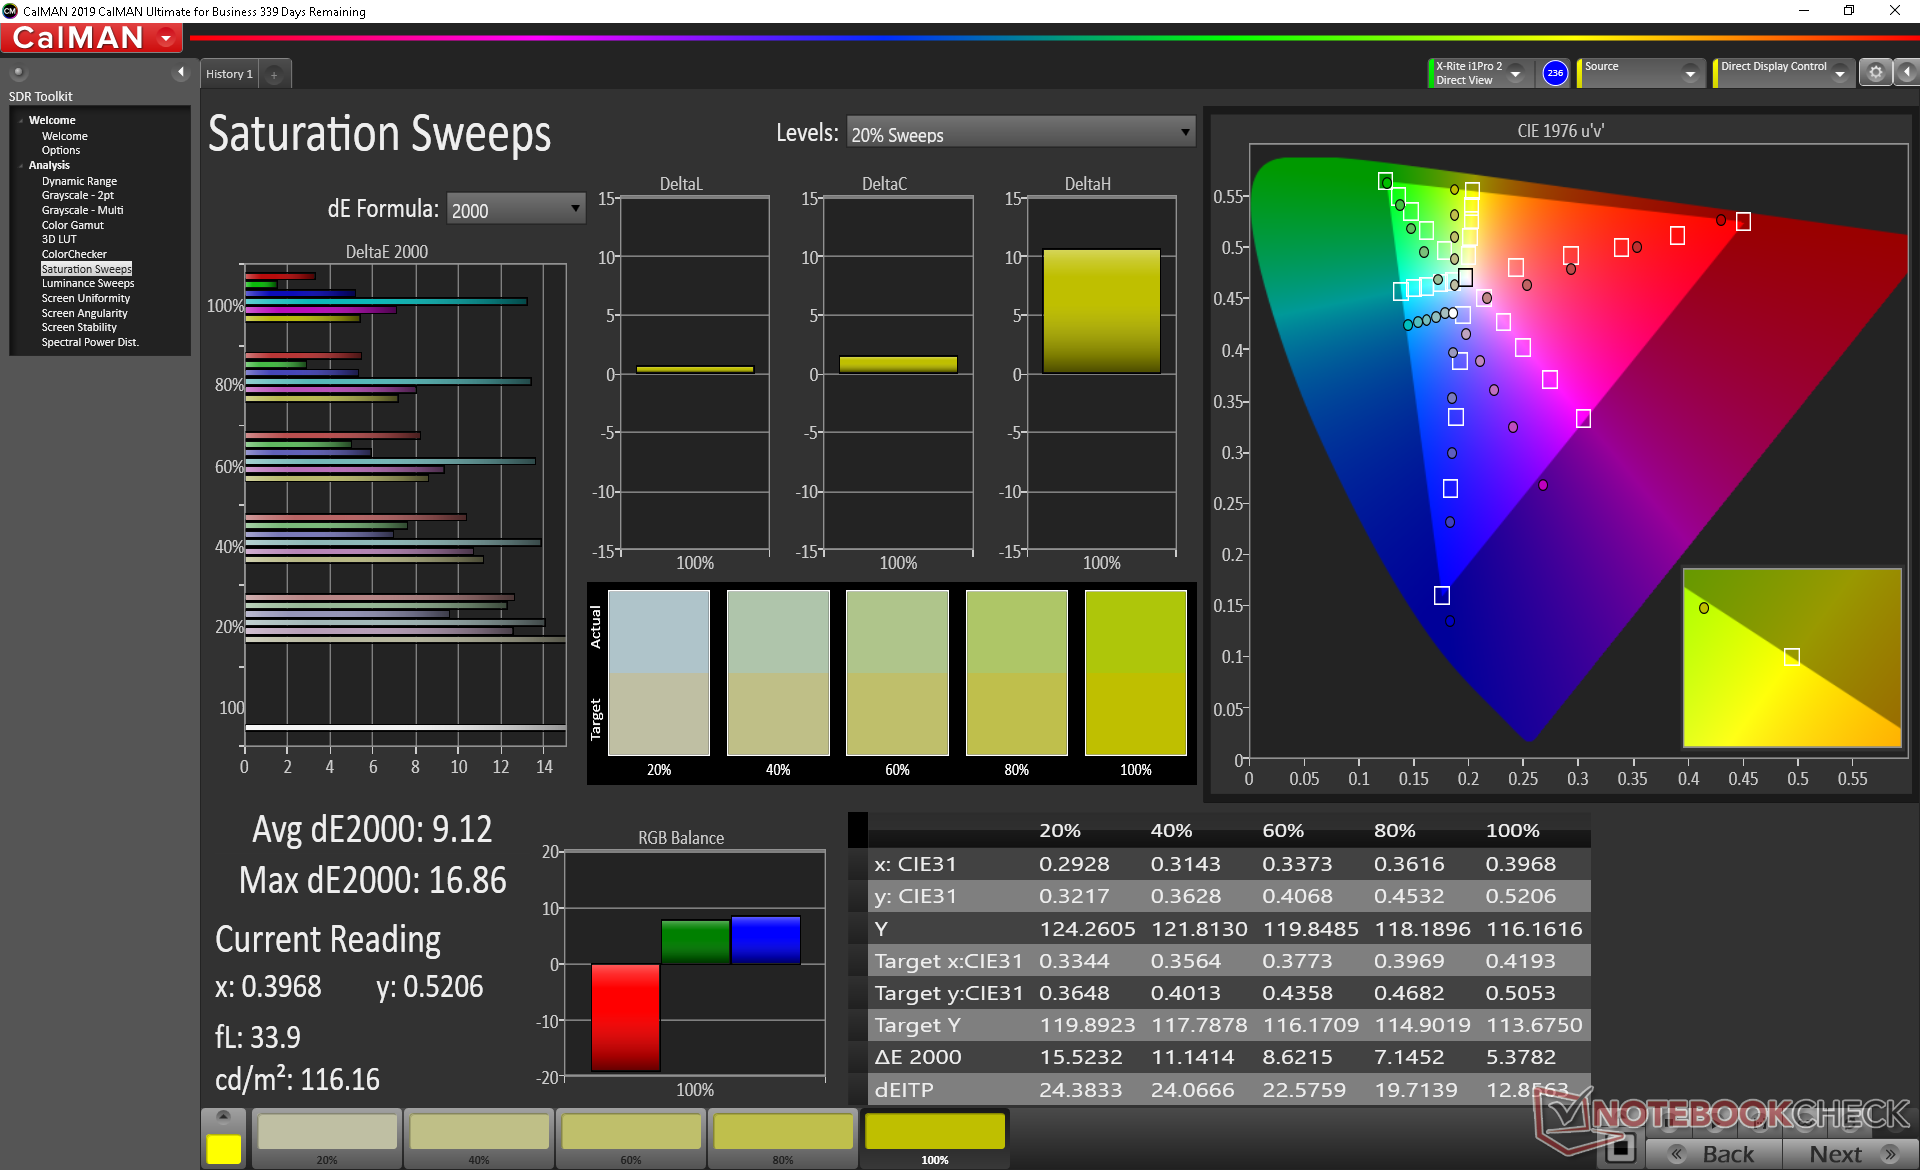
X-Rite colorimeter measurements show a very poorly calibrated display out of the box with an overly cool color temperature of 11176 and a high average grayscale deltaE value of 11.6. Nonetheless, the wide color gamut of the panel as mentioned above means that the display is capable of much more accurate colors if properly calibrated. Colors and grayscale improve dramatically after calibrating the panel ourselves and so we recommend an end-user calibration if possible to get the most out of the tablet. Owners can also apply our calibrated ICM profile above.
Display Response Times
| ↔ Response Time Black to White | ||
|---|---|---|
| 28.8 ms ... rise ↗ and fall ↘ combined | ↗ 15.6 ms rise | 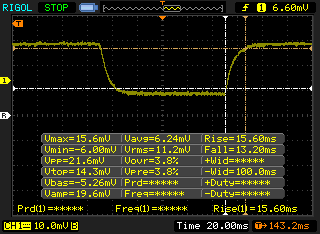 |
| ↘ 13.2 ms fall | ||
| The screen shows relatively slow response rates in our tests and may be too slow for gamers. In comparison, all tested devices range from 0.1 (minimum) to 240 (maximum) ms. » 76 % of all devices are better. This means that the measured response time is worse than the average of all tested devices (19.9 ms). | ||
| ↔ Response Time 50% Grey to 80% Grey | ||
| 38 ms ... rise ↗ and fall ↘ combined | ↗ 16.4 ms rise | 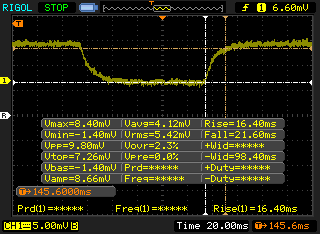 |
| ↘ 21.6 ms fall | ||
| The screen shows slow response rates in our tests and will be unsatisfactory for gamers. In comparison, all tested devices range from 0.165 (minimum) to 636 (maximum) ms. » 55 % of all devices are better. This means that the measured response time is worse than the average of all tested devices (31.1 ms). | ||
Screen Flickering / PWM (Pulse-Width Modulation)
| Screen flickering / PWM detected | 10000 Hz | ≤ 25 % brightness setting | 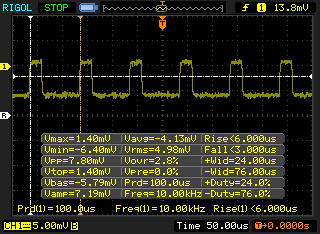 |
The display backlight flickers at 10000 Hz (worst case, e.g., utilizing PWM) Flickering detected at a brightness setting of 25 % and below. There should be no flickering or PWM above this brightness setting. The frequency of 10000 Hz is quite high, so most users sensitive to PWM should not notice any flickering. In comparison: 52 % of all tested devices do not use PWM to dim the display. If PWM was detected, an average of 7801 (minimum: 5 - maximum: 343500) Hz was measured. | |||
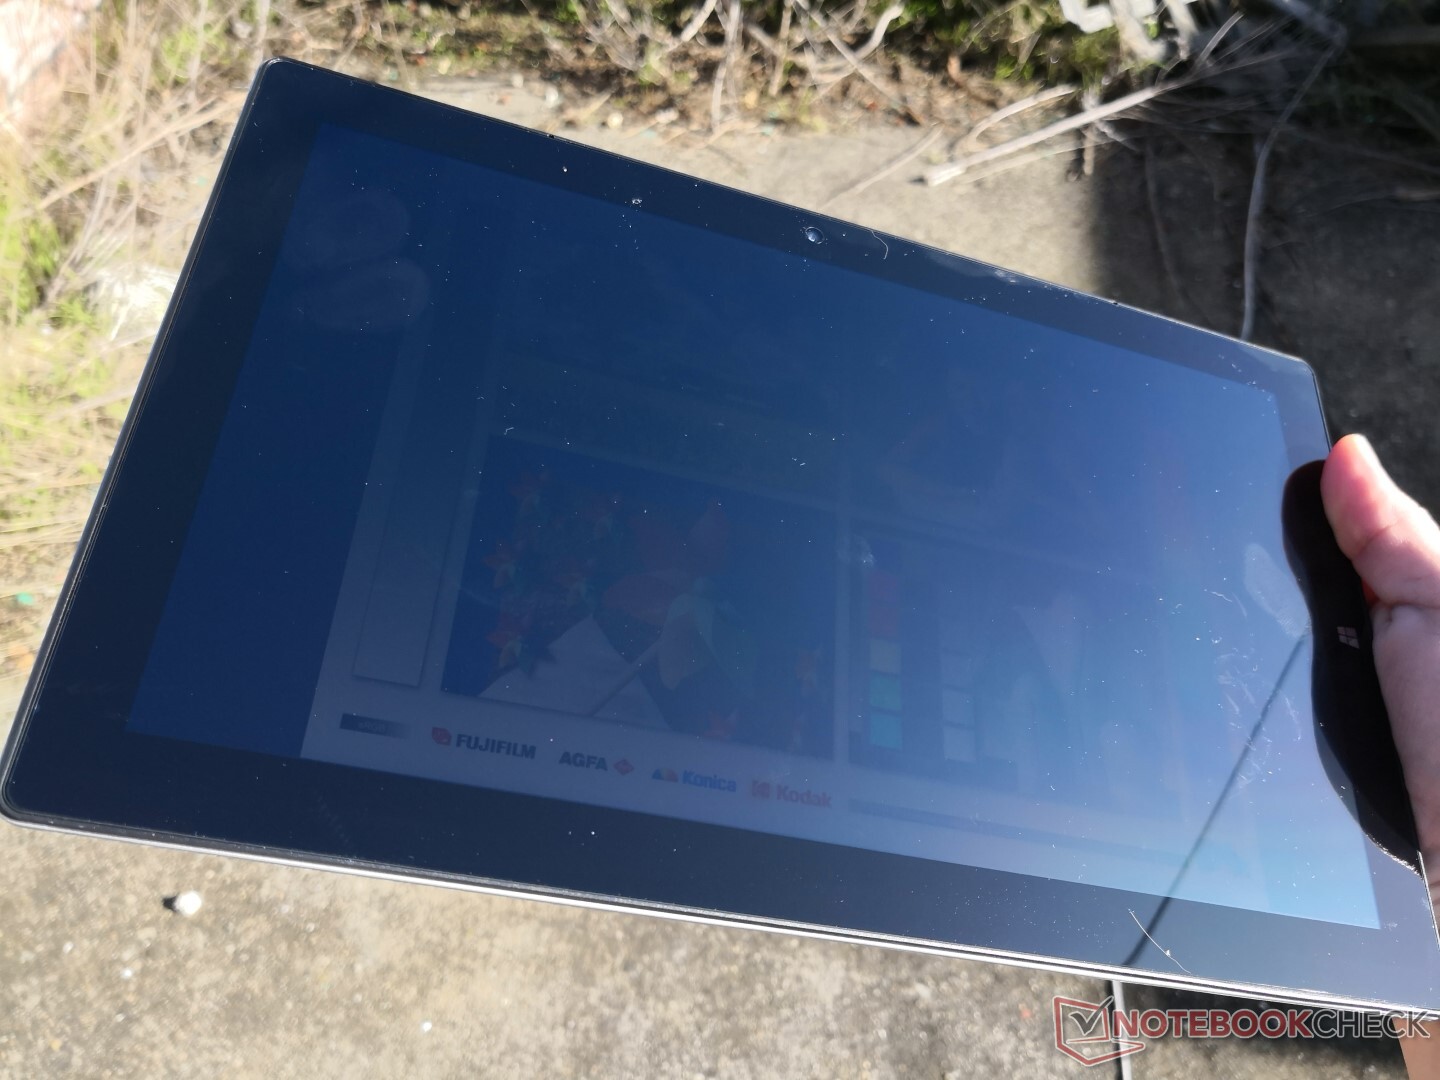
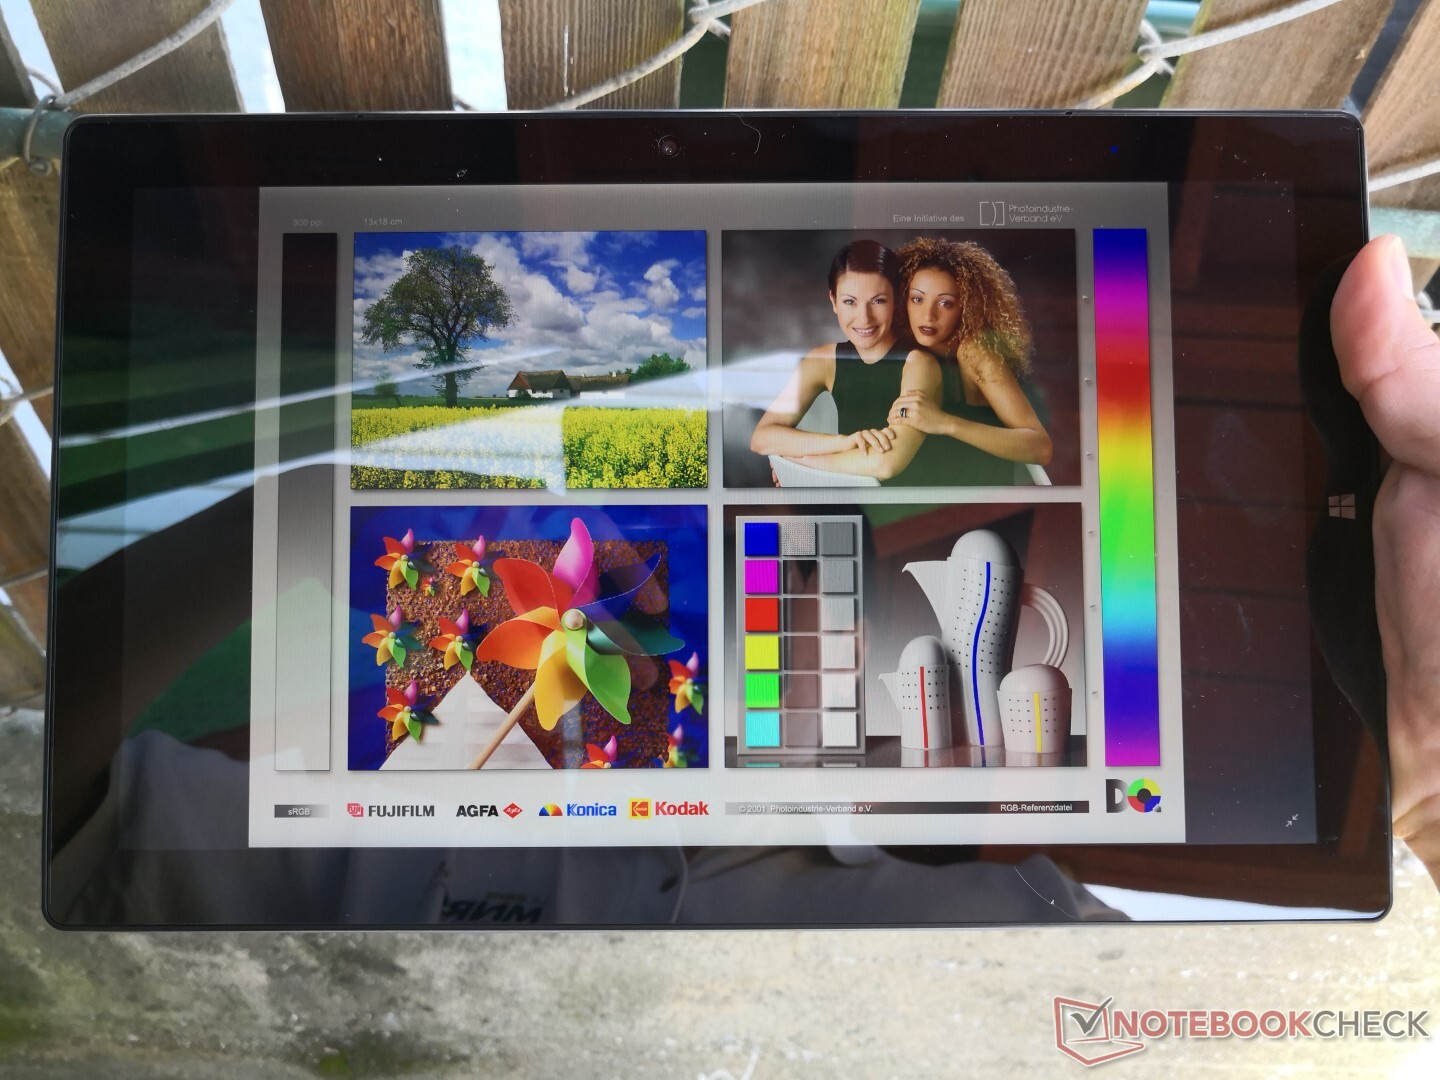
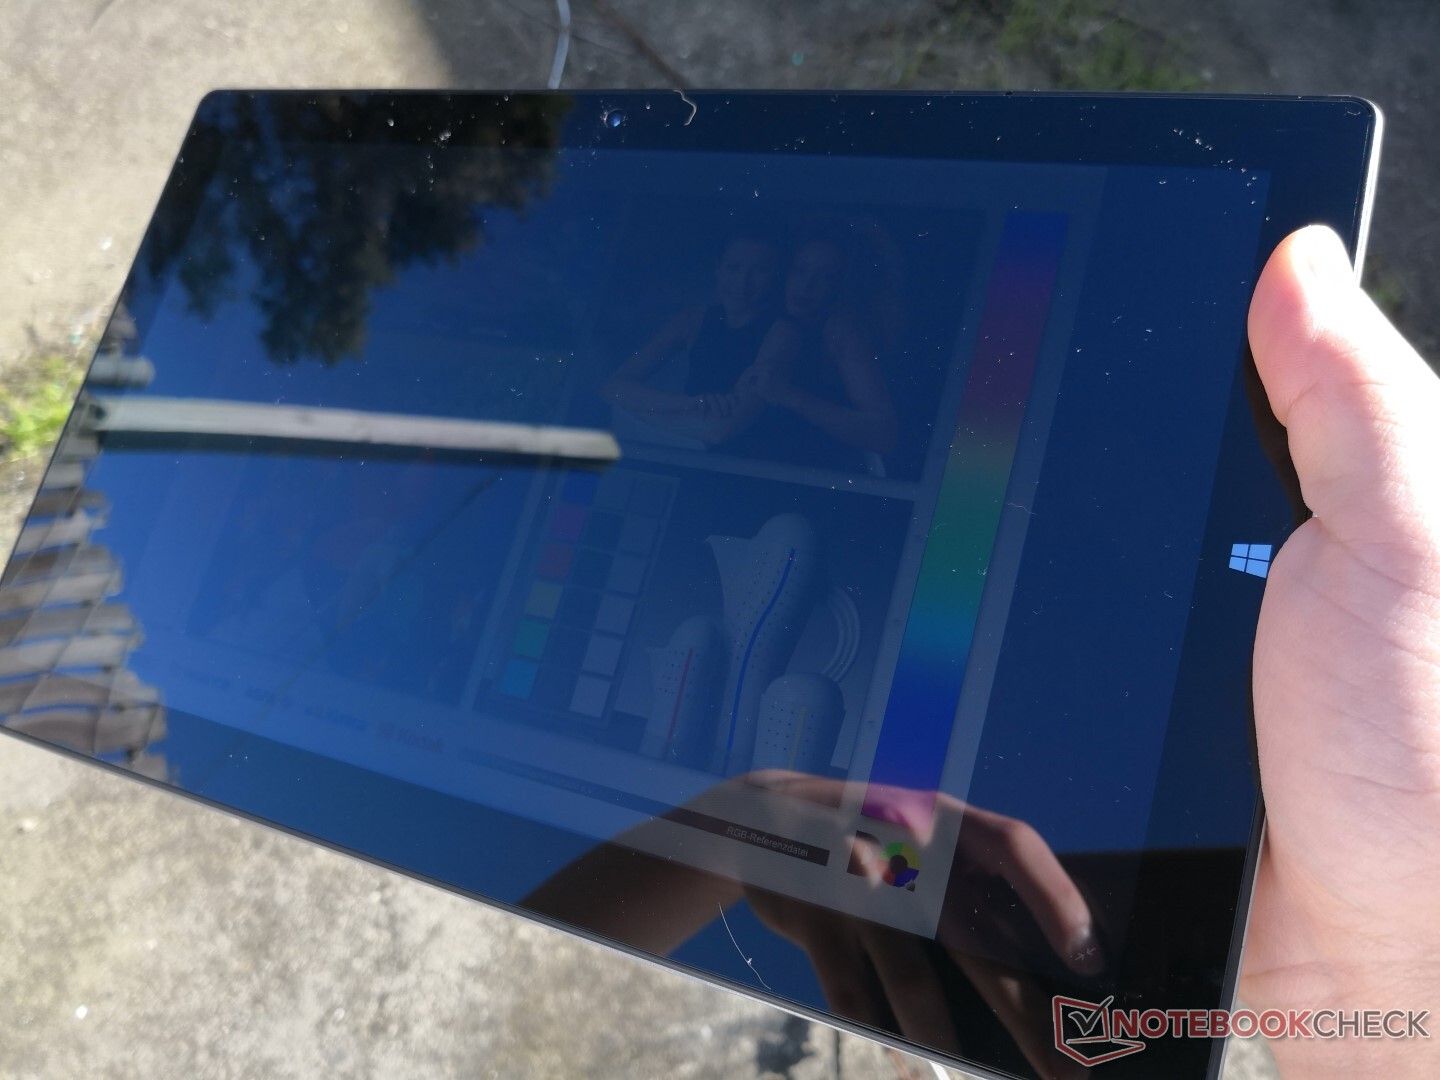
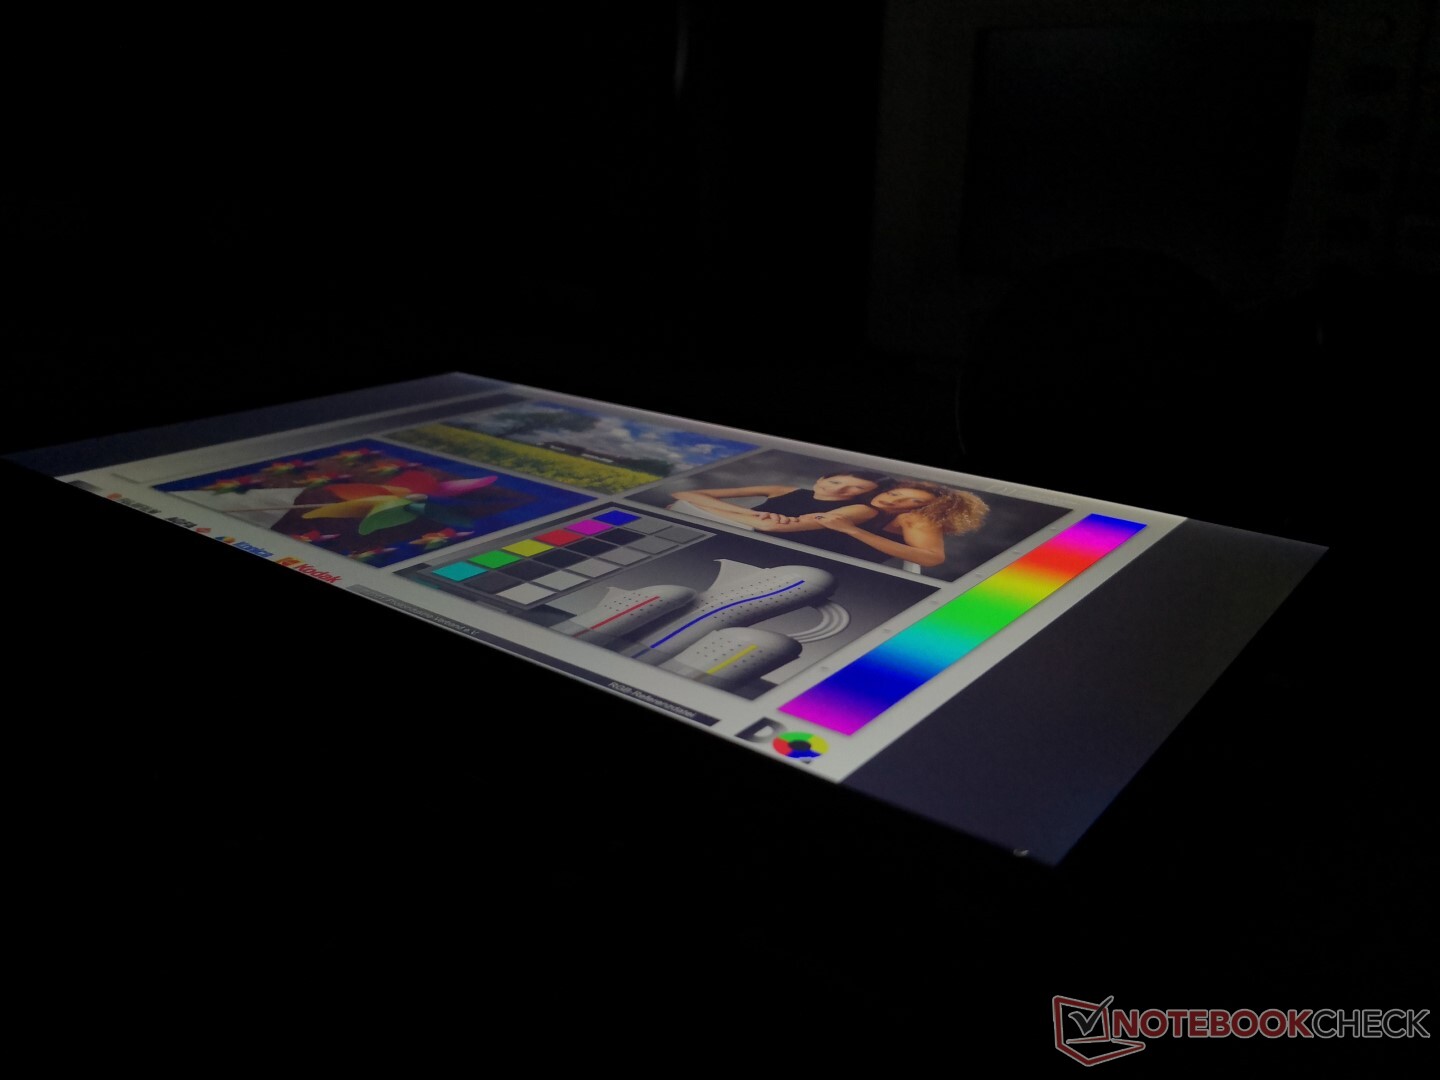
Outdoor visibility is poor because of the dim backlight and glossy screen. The wide viewing angles can only do so much to mitigate the inevitable glare in an outdoor scenario.
Performance
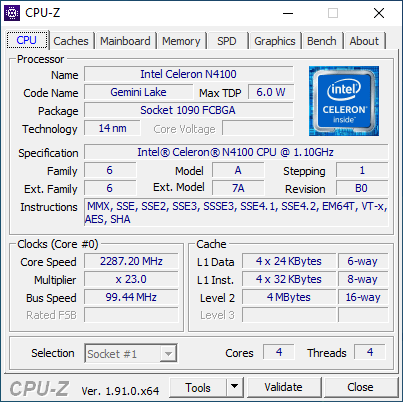
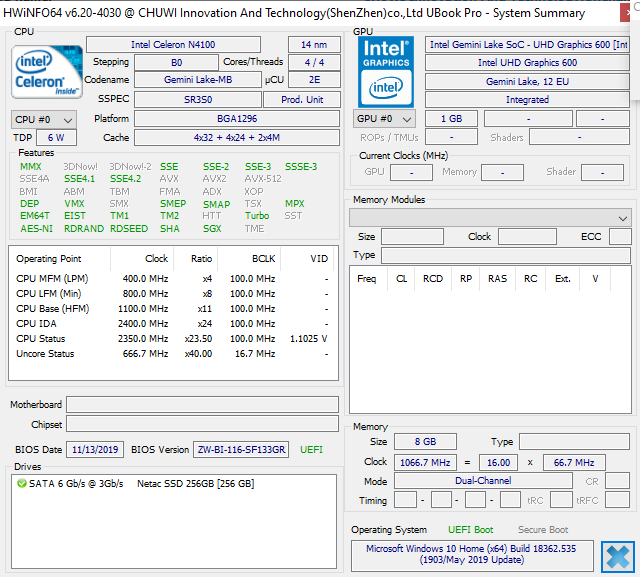
Chuwi offers no other SKUs at the moment other than the Gemini Lake Celeron N4100 CPU. This passively-cooled processor is a step down from the Core m3-6Y30 which is considered one of the Intel's slowest Core CPUs from the Skylake family. Chuwi uses the same Celeron CPU for its GBox mini PC as well.
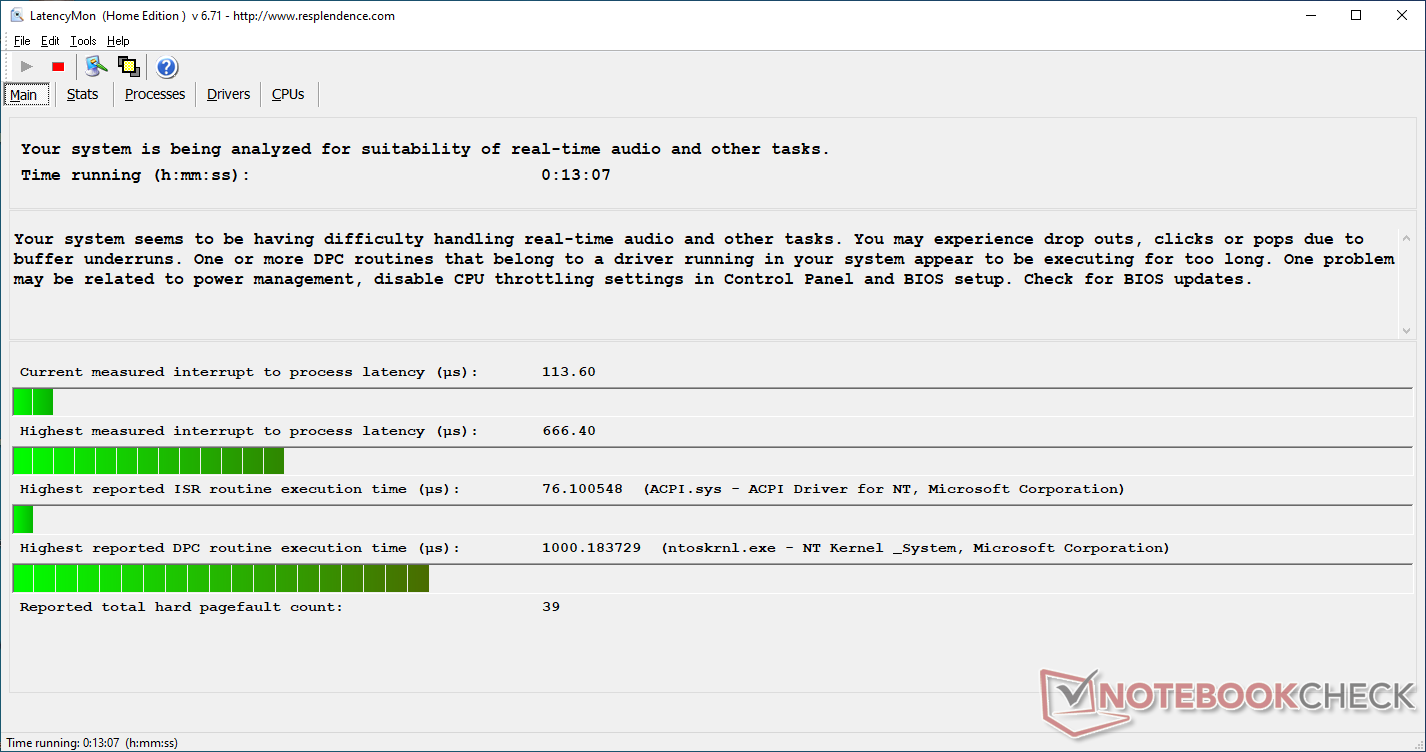
LatencyMon shows DPC latency issues regardless of wireless activity.
Processor
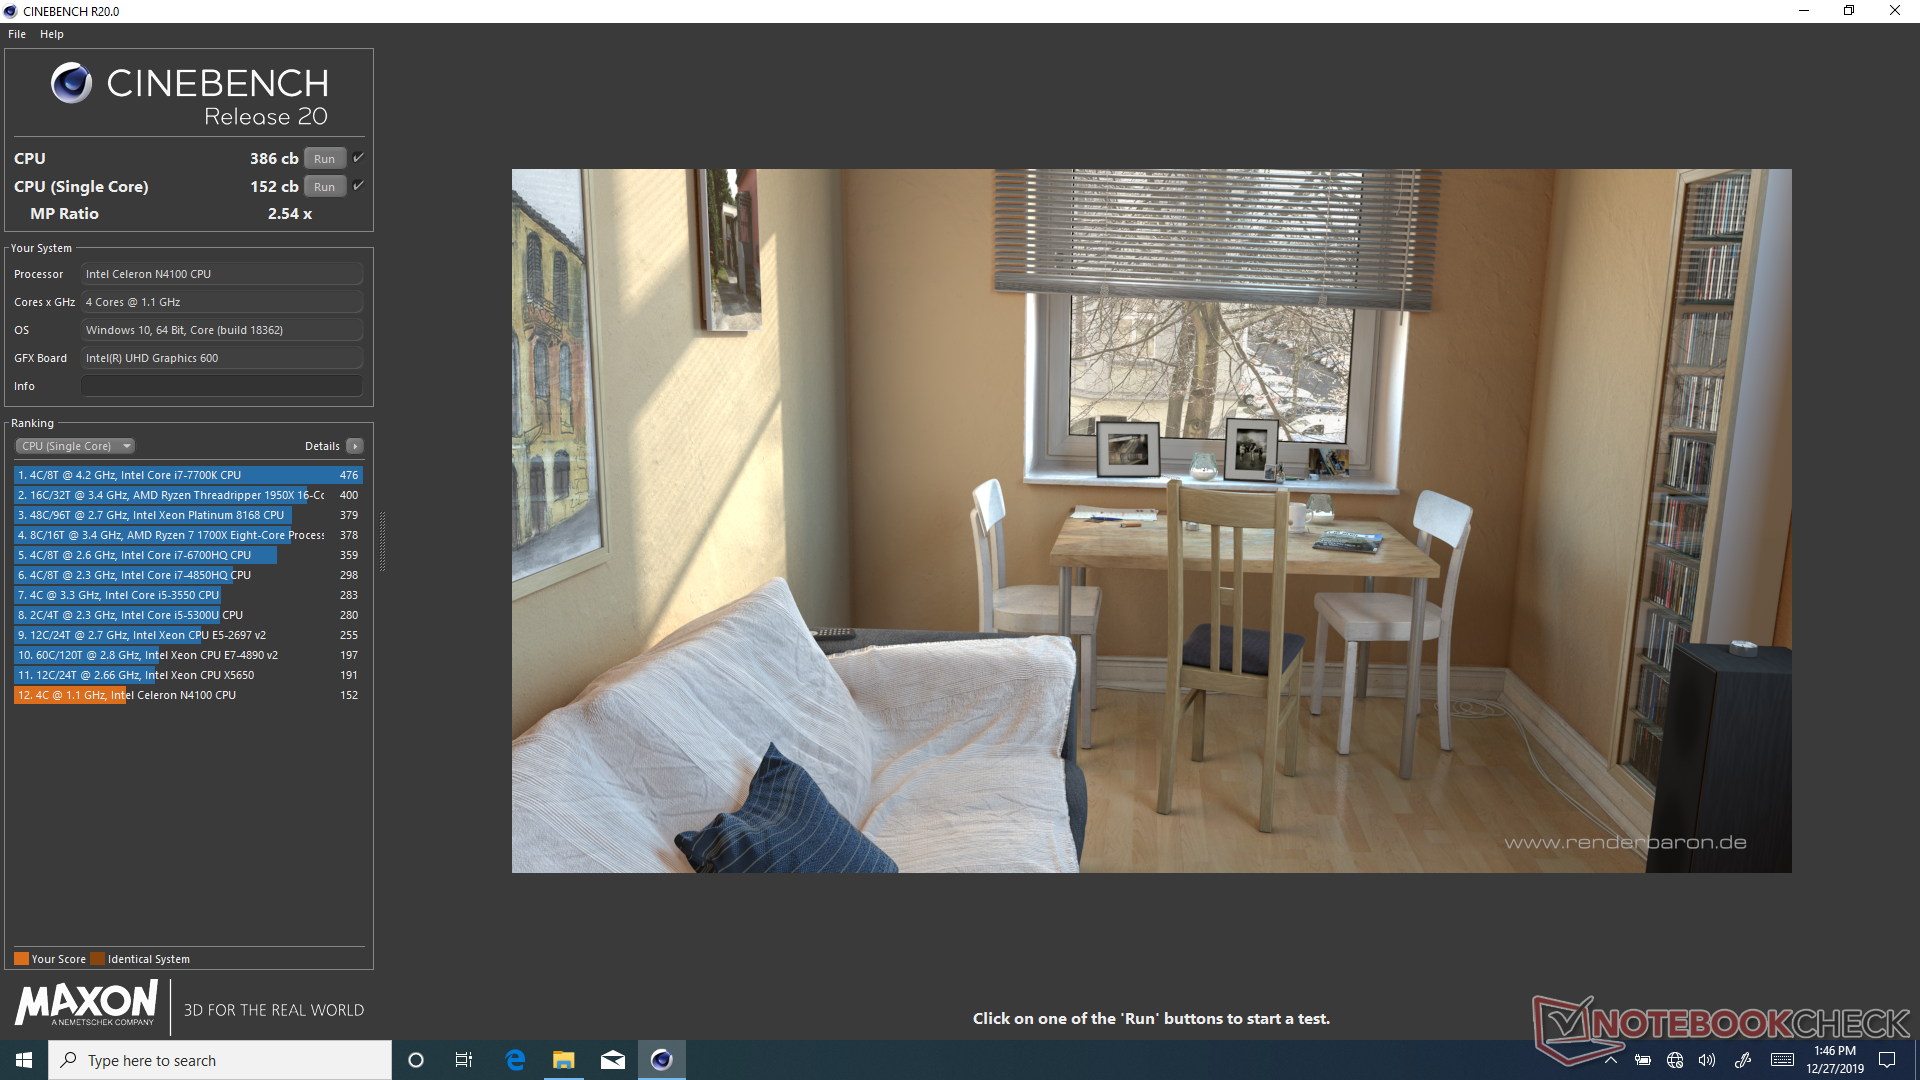
CPU performance is essentially the same as the Pentium Gold 4415Y as found on the Surface Go. The newer and more efficient Amber Lake-Y Core m3-8100Y is able to consistently outperform our Celeron while at a lower TDP (6 W vs. 5 W).
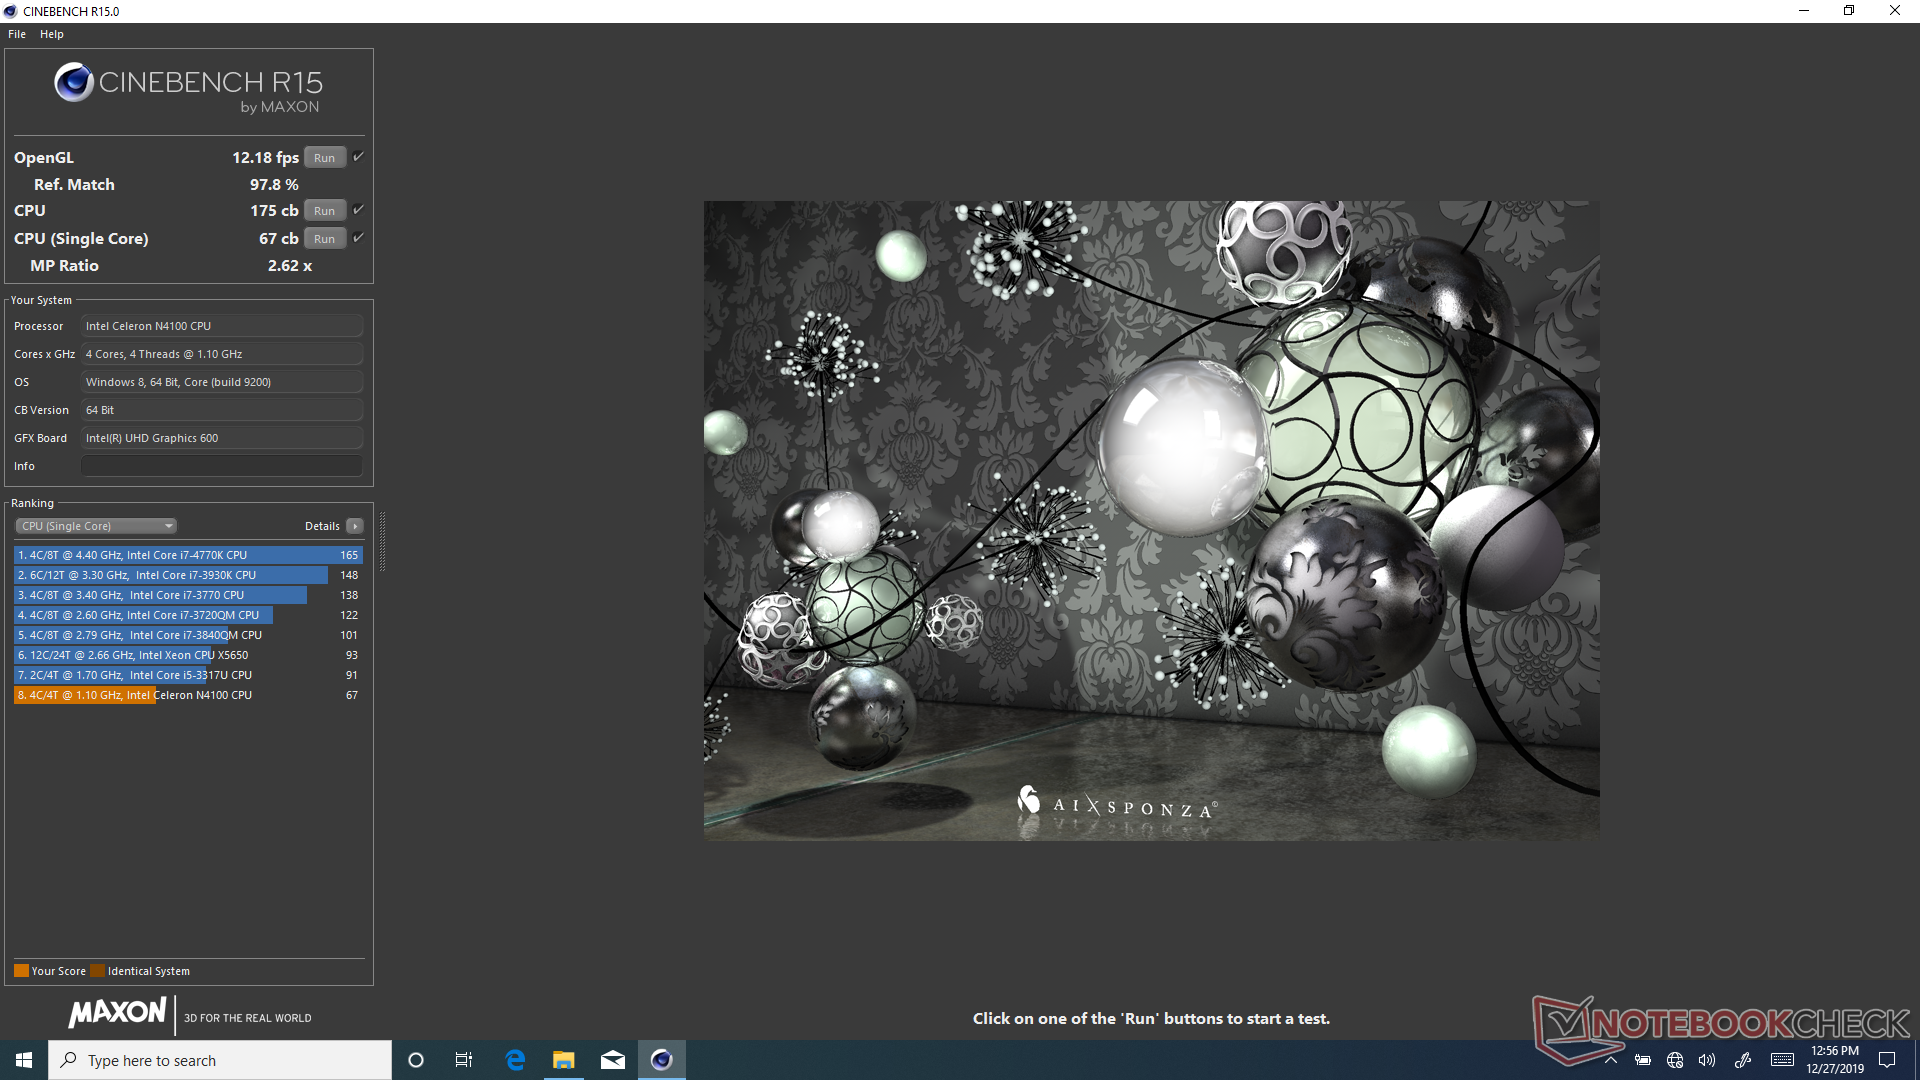
Running CineBench R15 in a loop results in consistent scores throughout to suggest no significant Turbo Boost potential as expected from a passively-cooled CPU. See our dedicated page on the Celeron N4100 for more technical information and benchmarks.
System Performance
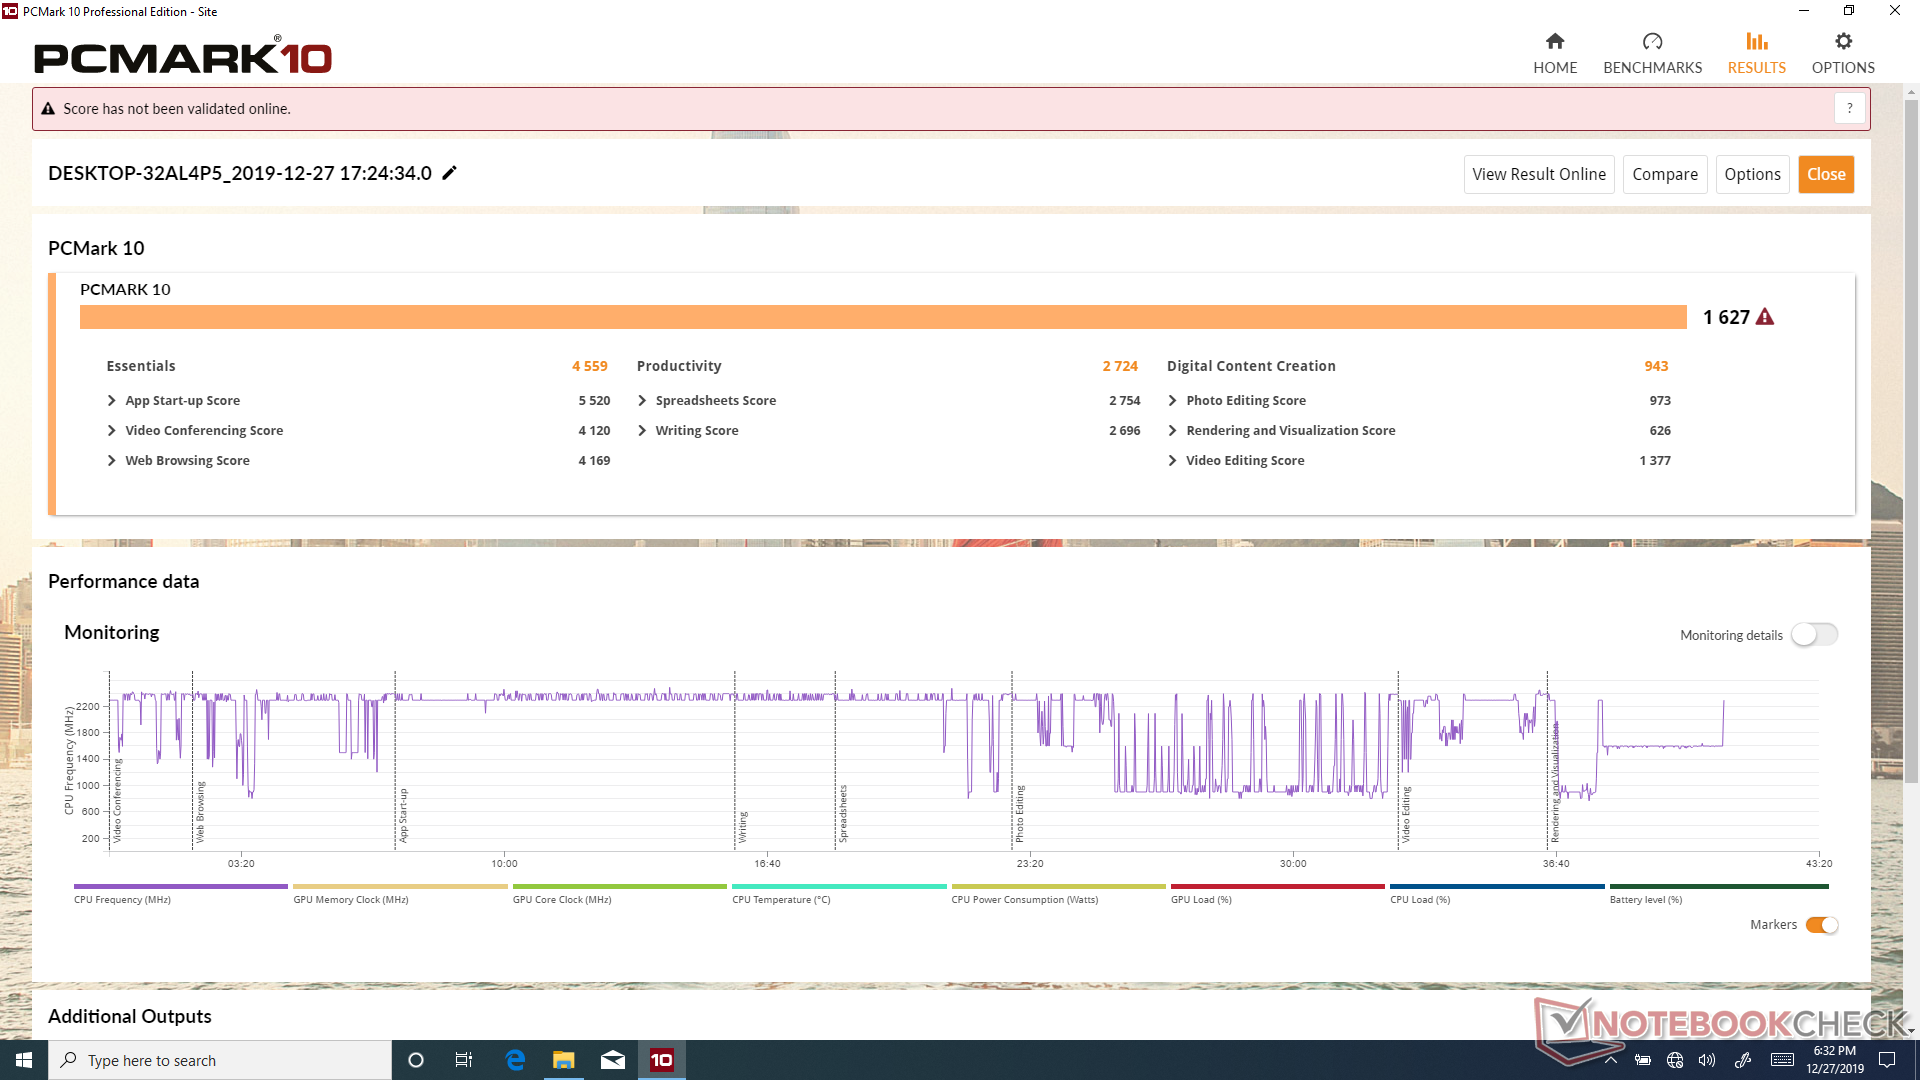
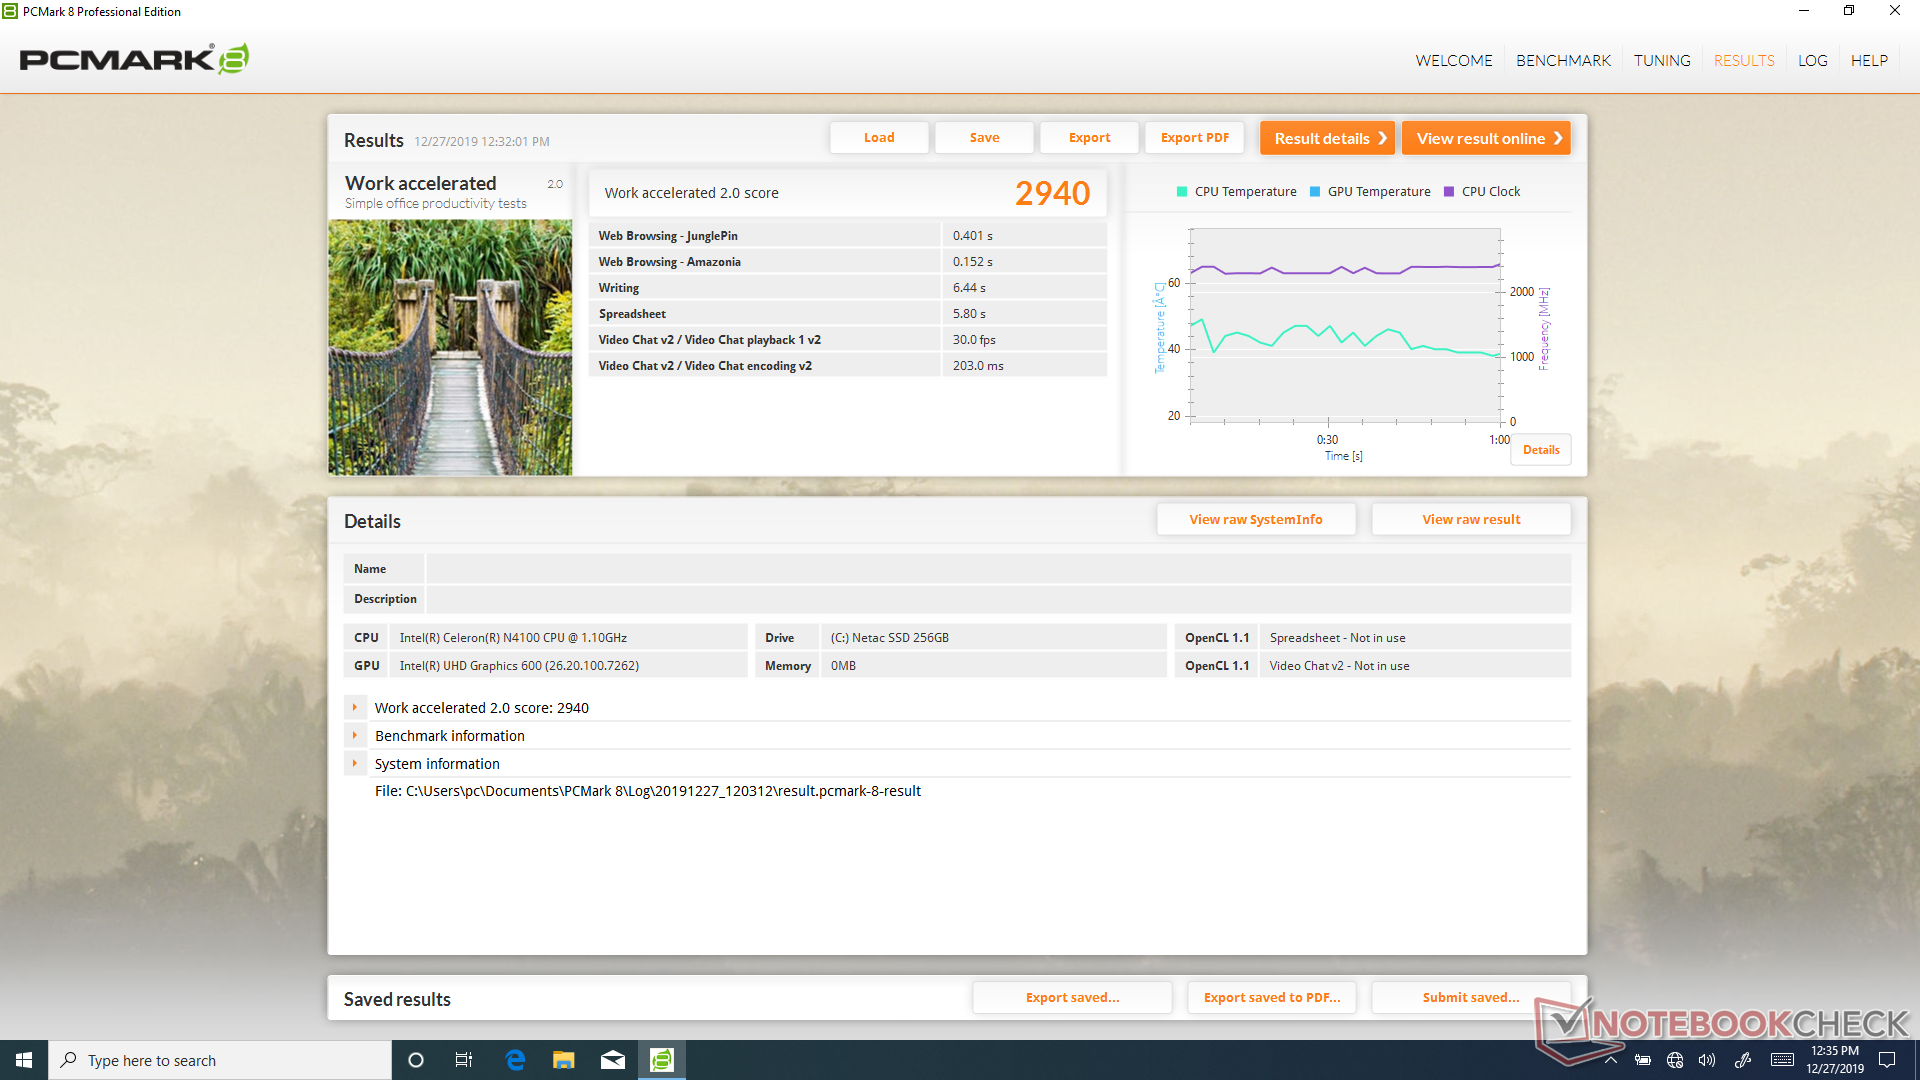
PCMark benchmarks are where we expect them to be albeit still consistently below the average Celeron N4100 by just a few percentage points. We didn't experience any software issues during our time with the unit and we can appreciate the lack of bloatware as well.
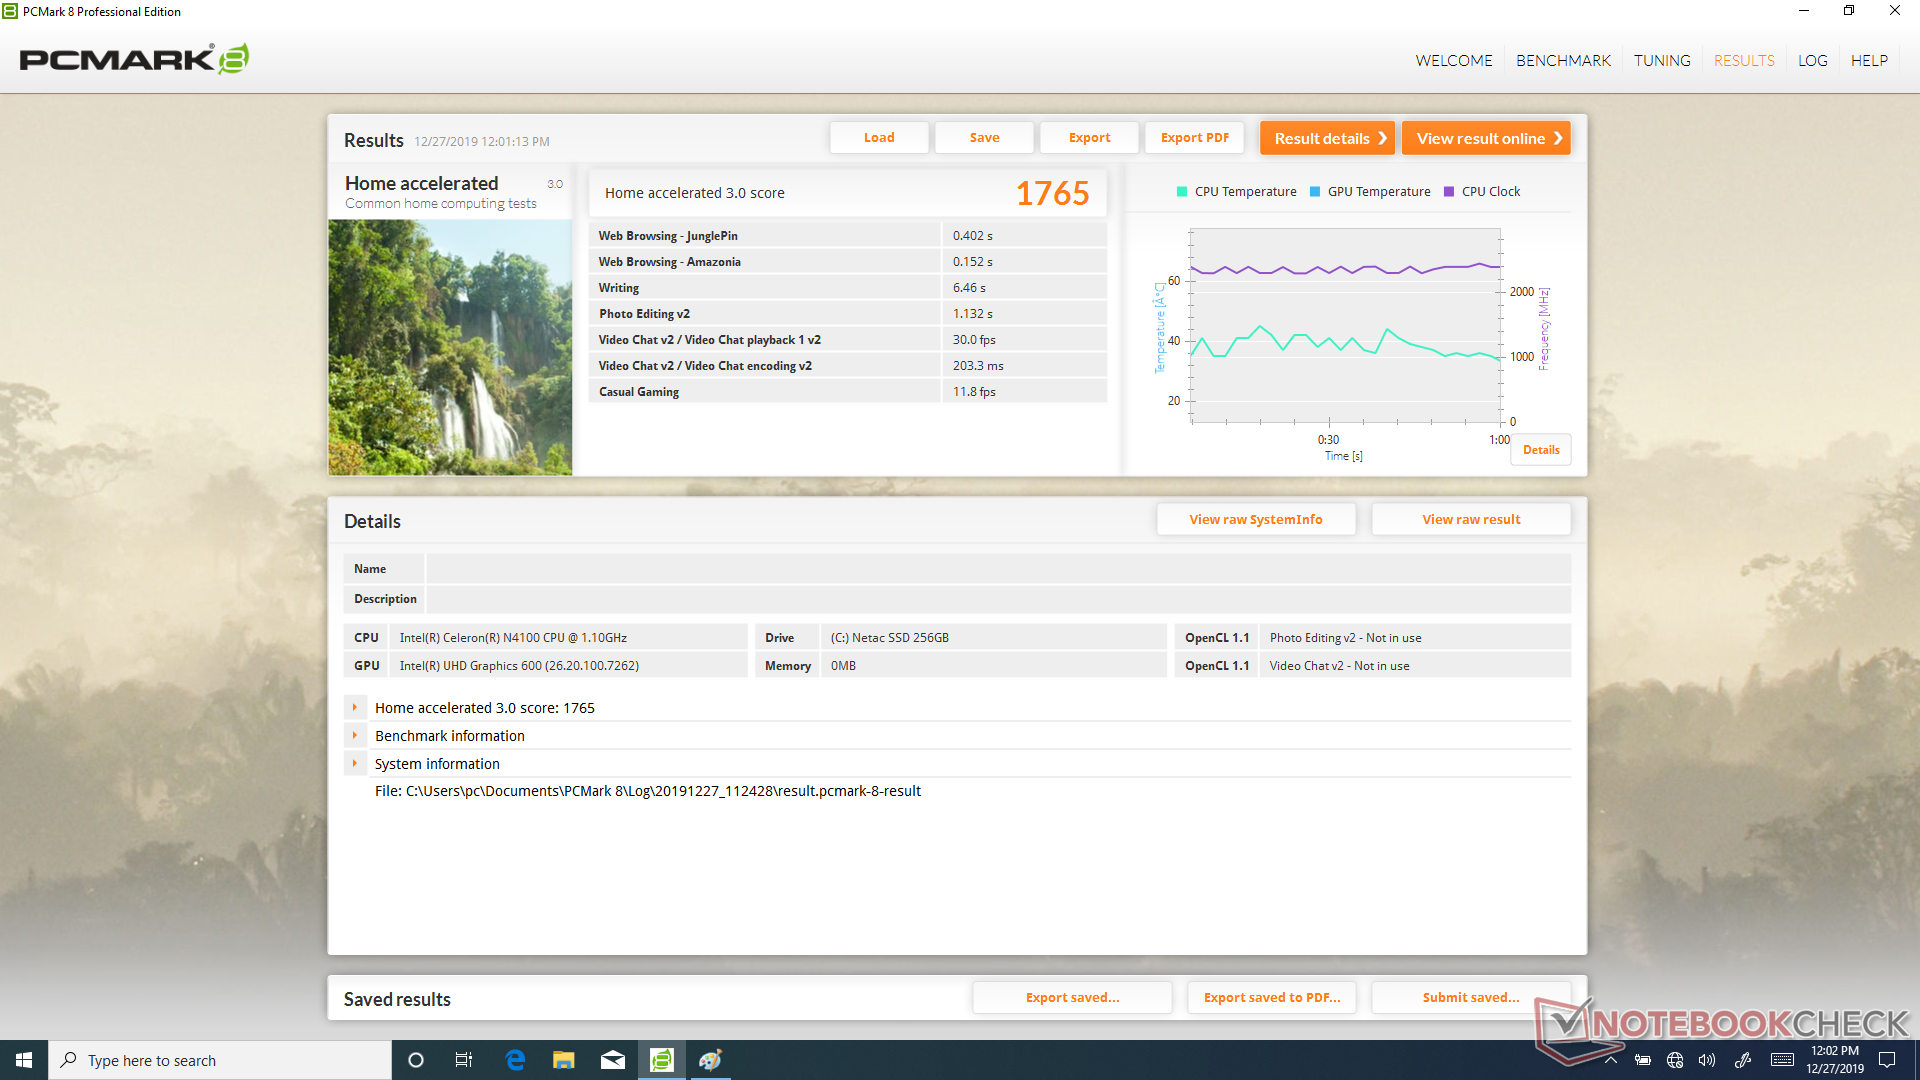
| PCMark 8 Home Score Accelerated v2 | 1765 points | |
| PCMark 8 Work Score Accelerated v2 | 2940 points | |
| PCMark 10 Score | 1627 points | |
Help | ||
Storage Devices
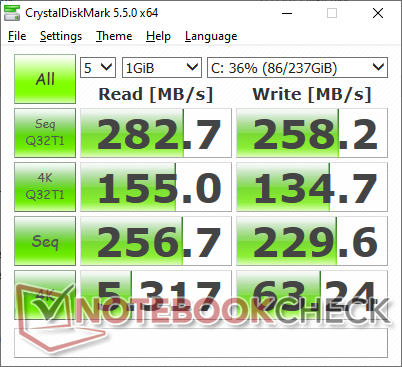
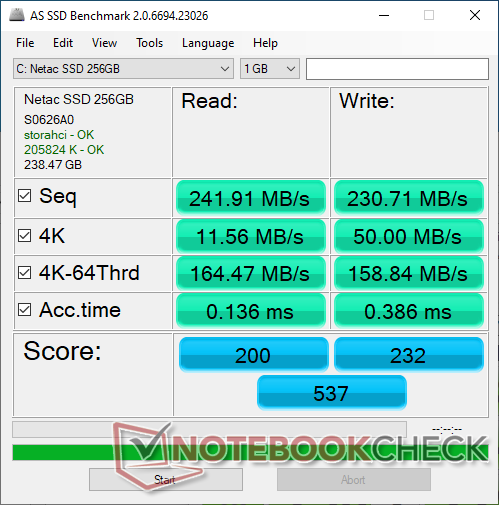
The tablet uses the same 256 GB Netac SSD as found on the Chuwi AeroBook 13. However, transfer rates are much slower on the tablet likely because of the slower SATA interface of the UBook.
| Chuwi UBook CWI509 Netac SSD 256GB | Microsoft Surface Pro 7 Core i5-1035G4 Toshiba BG4 KBG40ZPZ256G | Microsoft Surface Go MHN-00003 64 GB eMMC Flash | HP ProBook x360 11 G4 WDC PC SN520 SDAPNUW-256G | HP x2 210 G2 64 GB eMMC Flash | |
|---|---|---|---|---|---|
| CrystalDiskMark 5.2 / 6 | 440% | -1% | 278% | -31% | |
| Write 4K (MB/s) | 63.2 | 118.5 88% | 26.91 -57% | 81.7 29% | 18.11 -71% |
| Read 4K (MB/s) | 5.317 | 54.1 917% | 19.72 271% | 34.41 547% | 15.77 197% |
| Write Seq (MB/s) | 229.6 | 1166 408% | 126.2 -45% | 1167 408% | 62.5 -73% |
| Read Seq (MB/s) | 256.7 | 1676 553% | 268 4% | 1223 376% | 121.8 -53% |
| Write 4K Q32T1 (MB/s) | 134.7 | 330.5 145% | 62.9 -53% | 293.4 118% | 31.72 -76% |
| Read 4K Q32T1 (MB/s) | 155 | 393.1 154% | 39.82 -74% | 230.6 49% | 48.64 -69% |
| Write Seq Q32T1 (MB/s) | 258.2 | 1569 508% | 131.3 -49% | 728 182% | 95.6 -63% |
| Read Seq Q32T1 (MB/s) | 282.7 | 2390 745% | 259.3 -8% | 1729 512% | 166.5 -41% |

GPU Performance
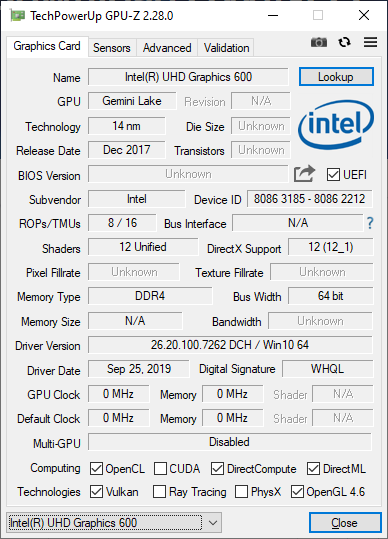
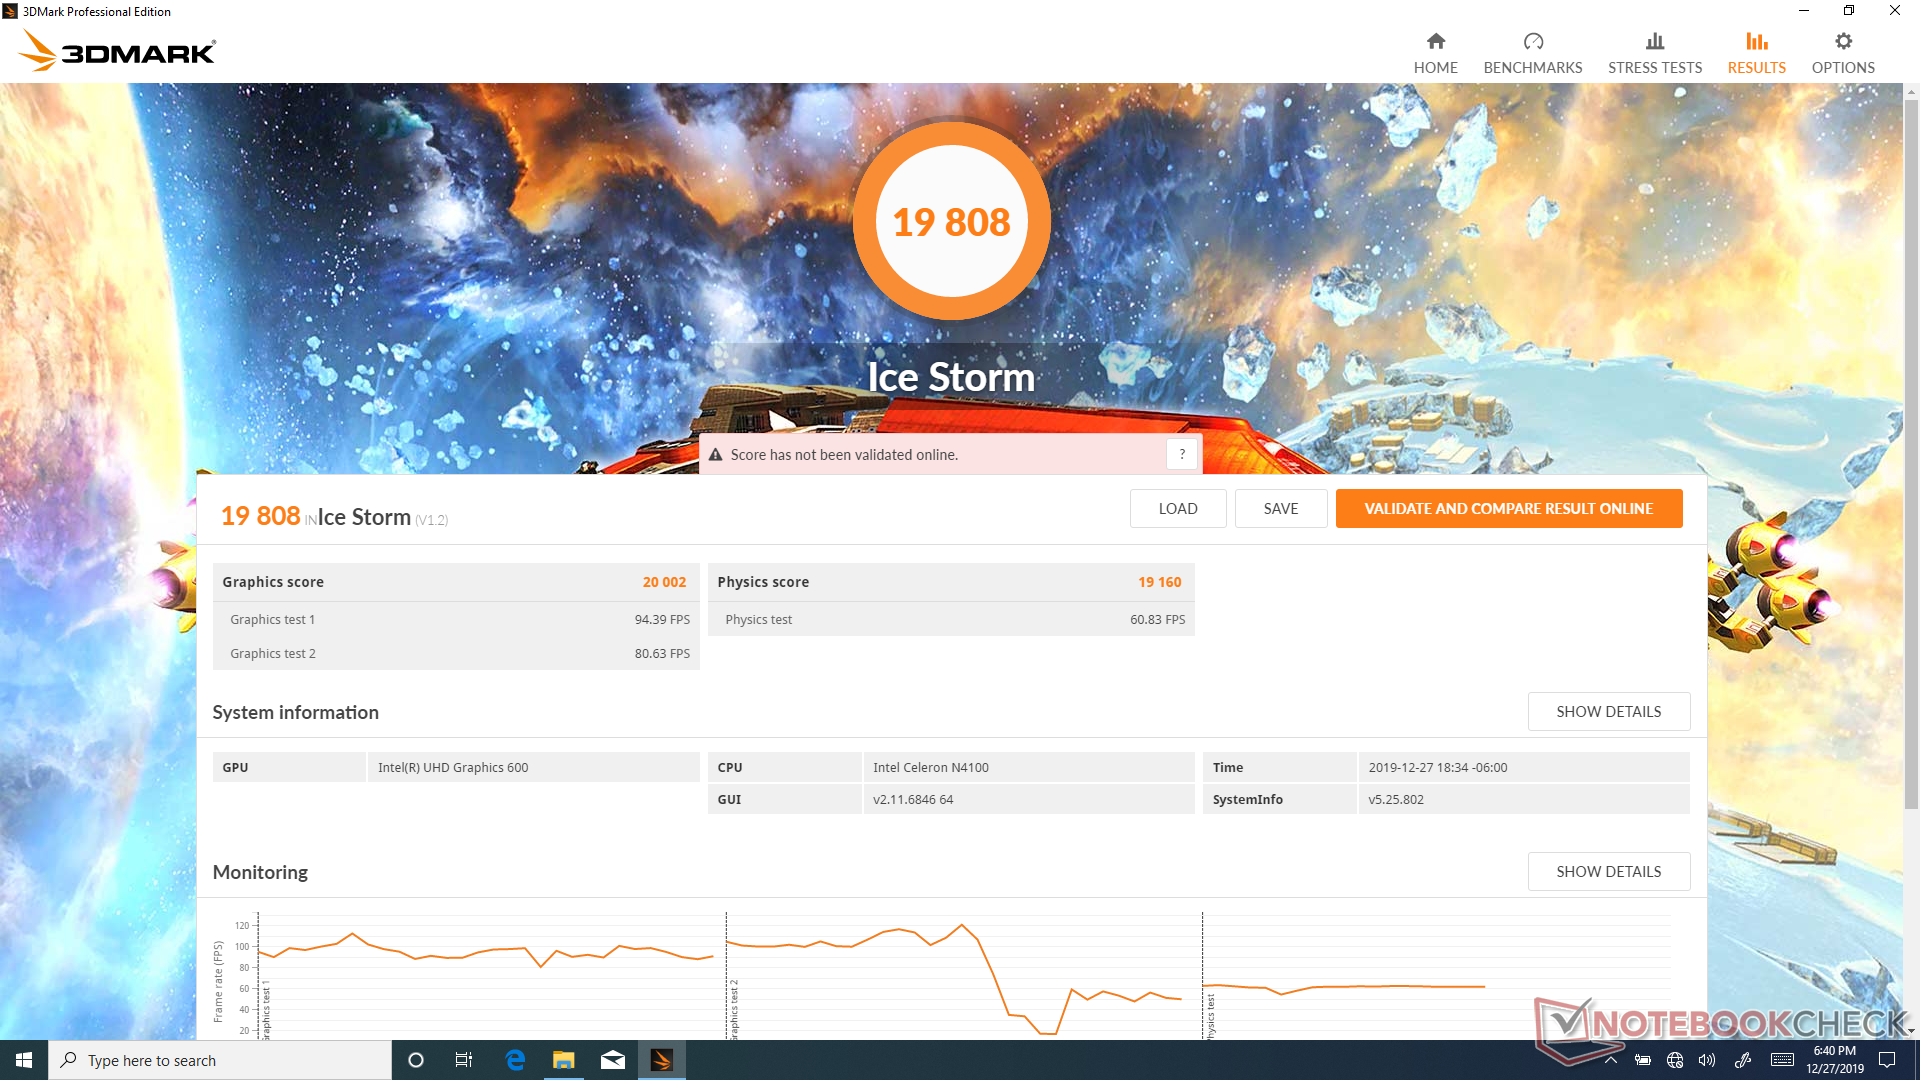
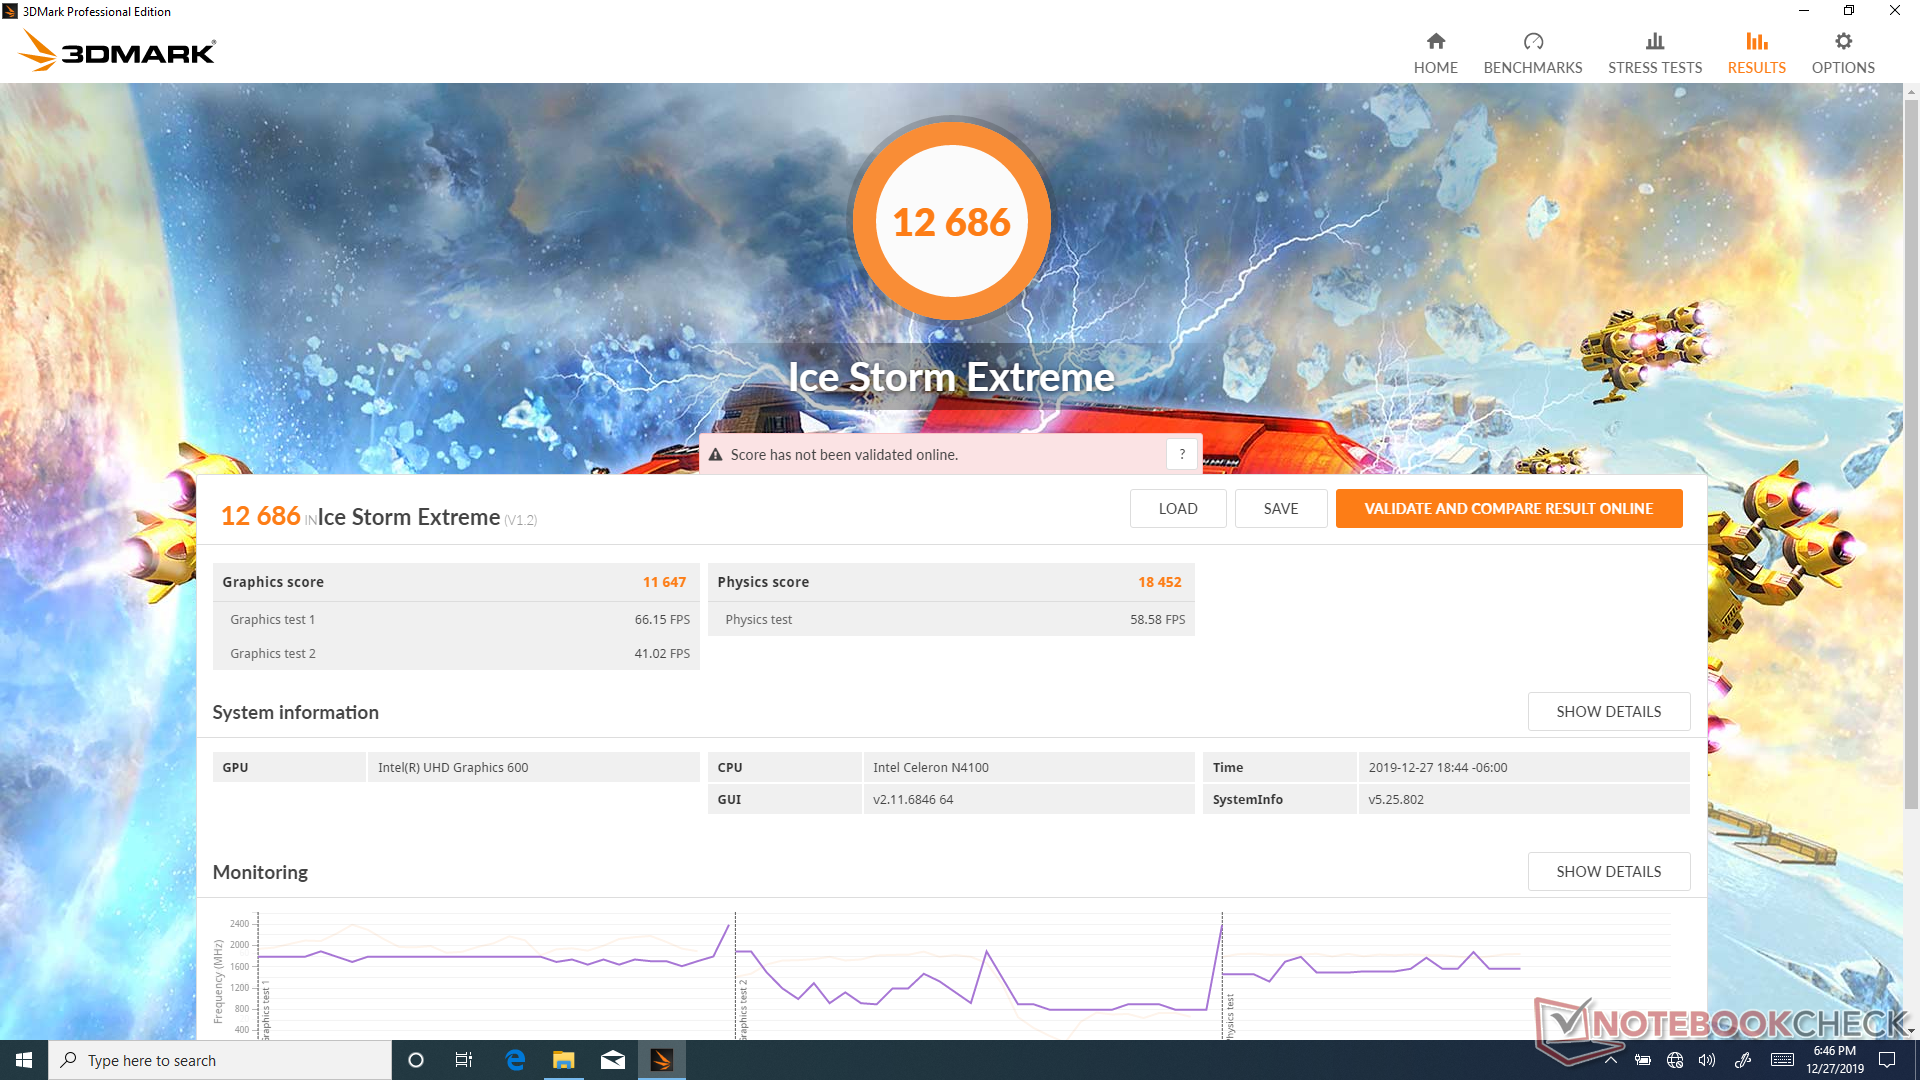
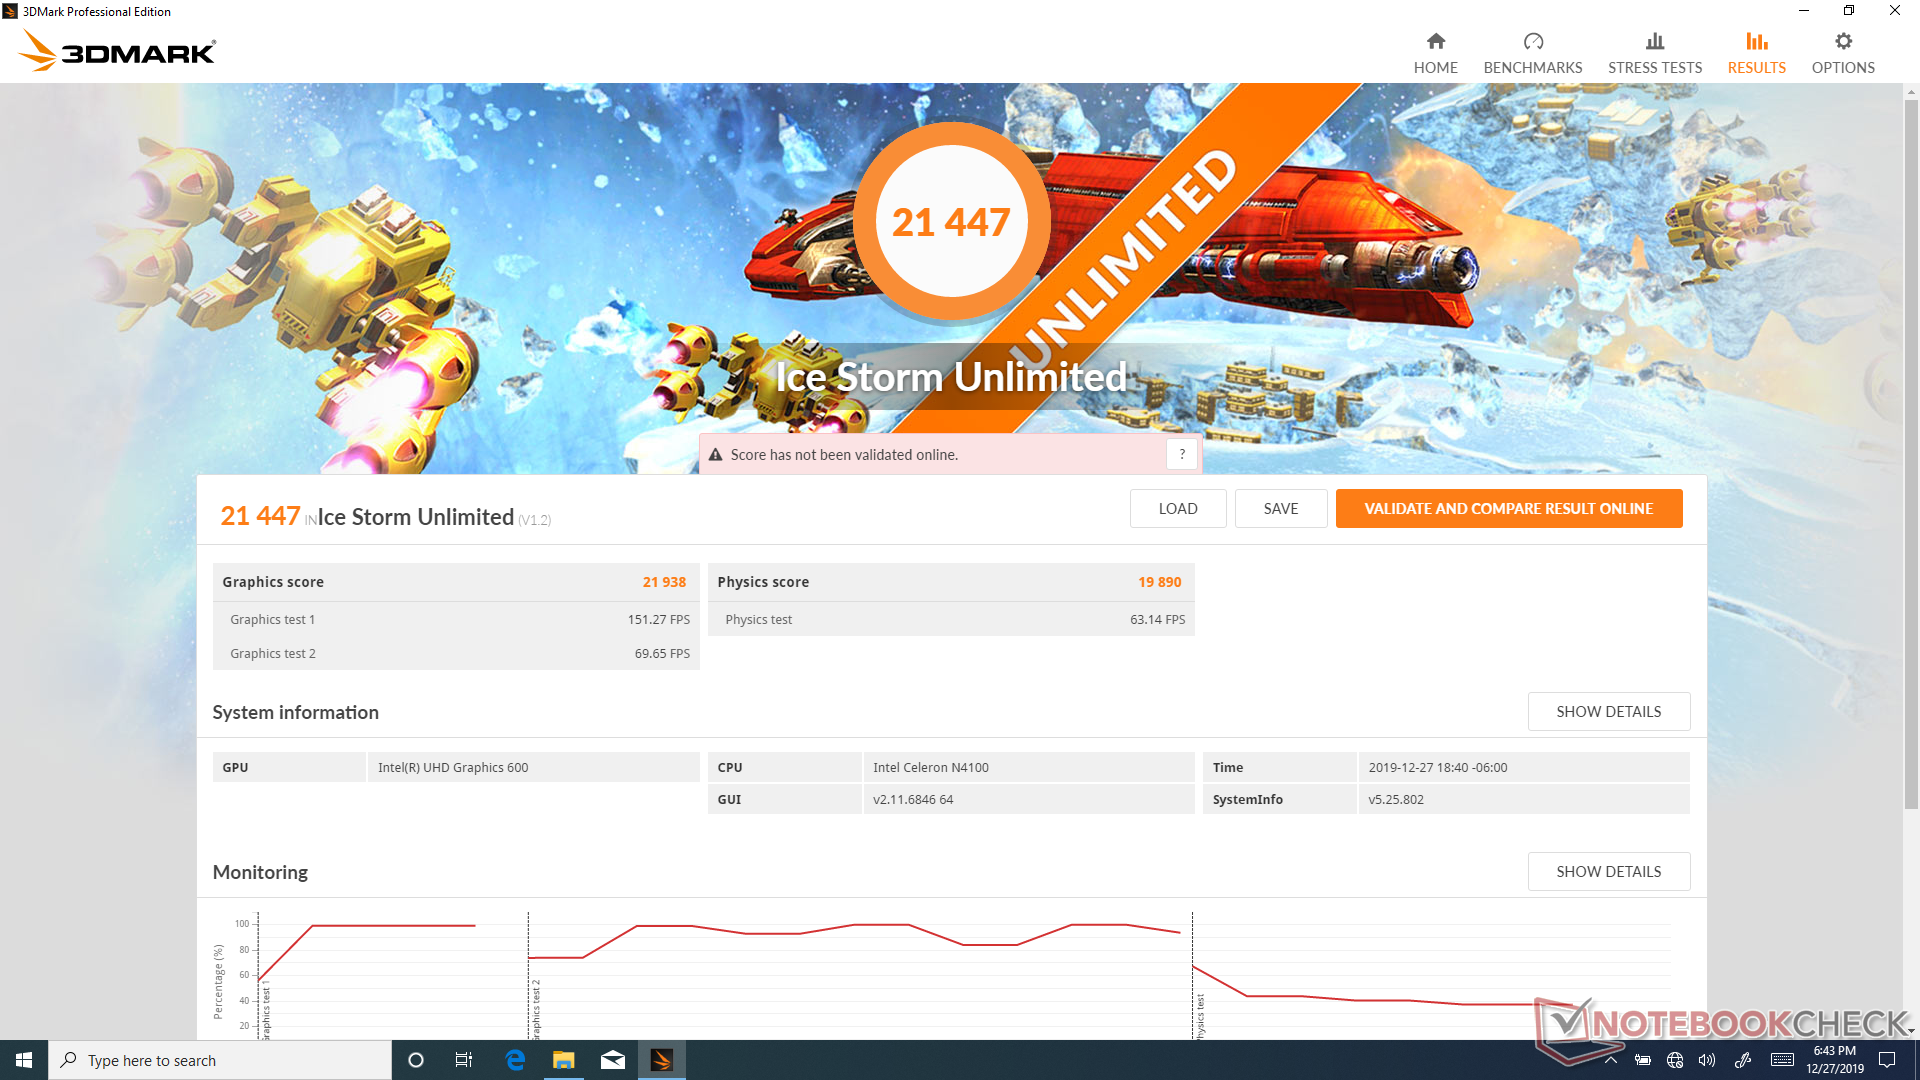
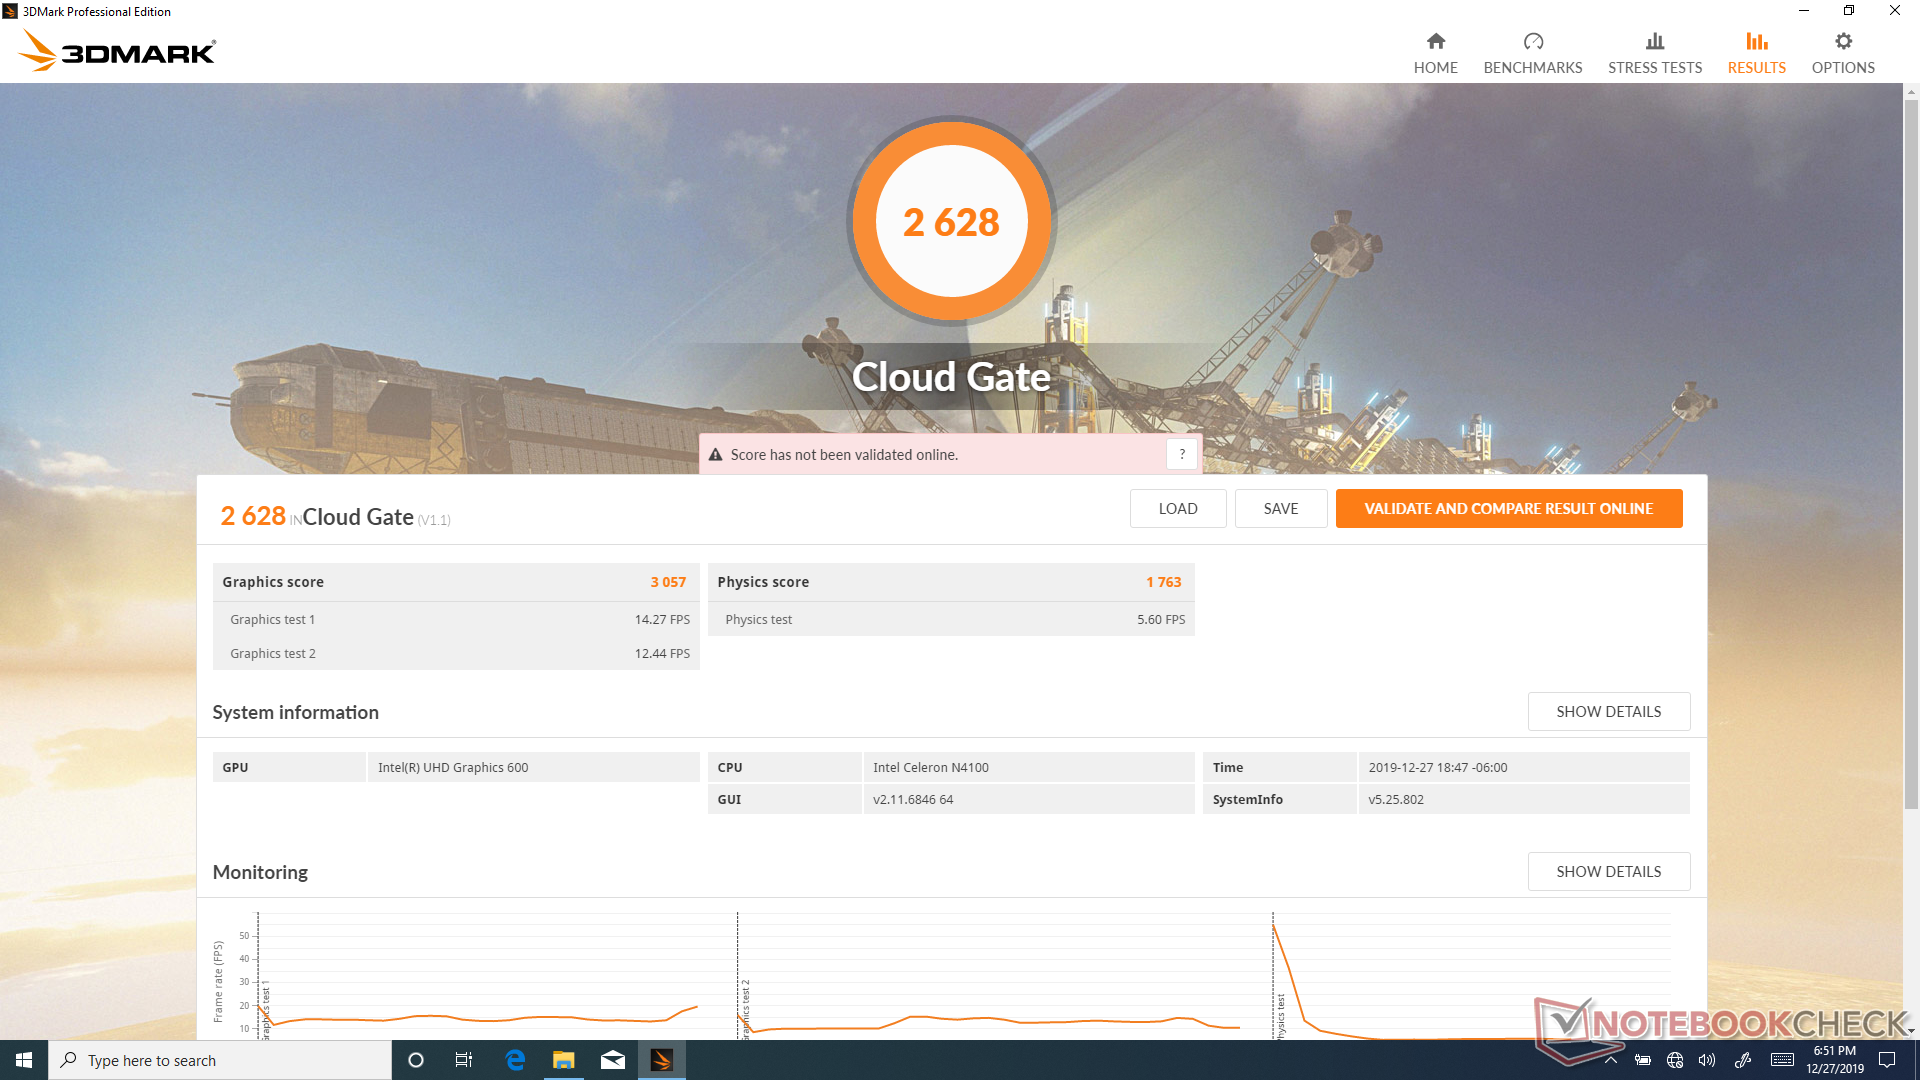
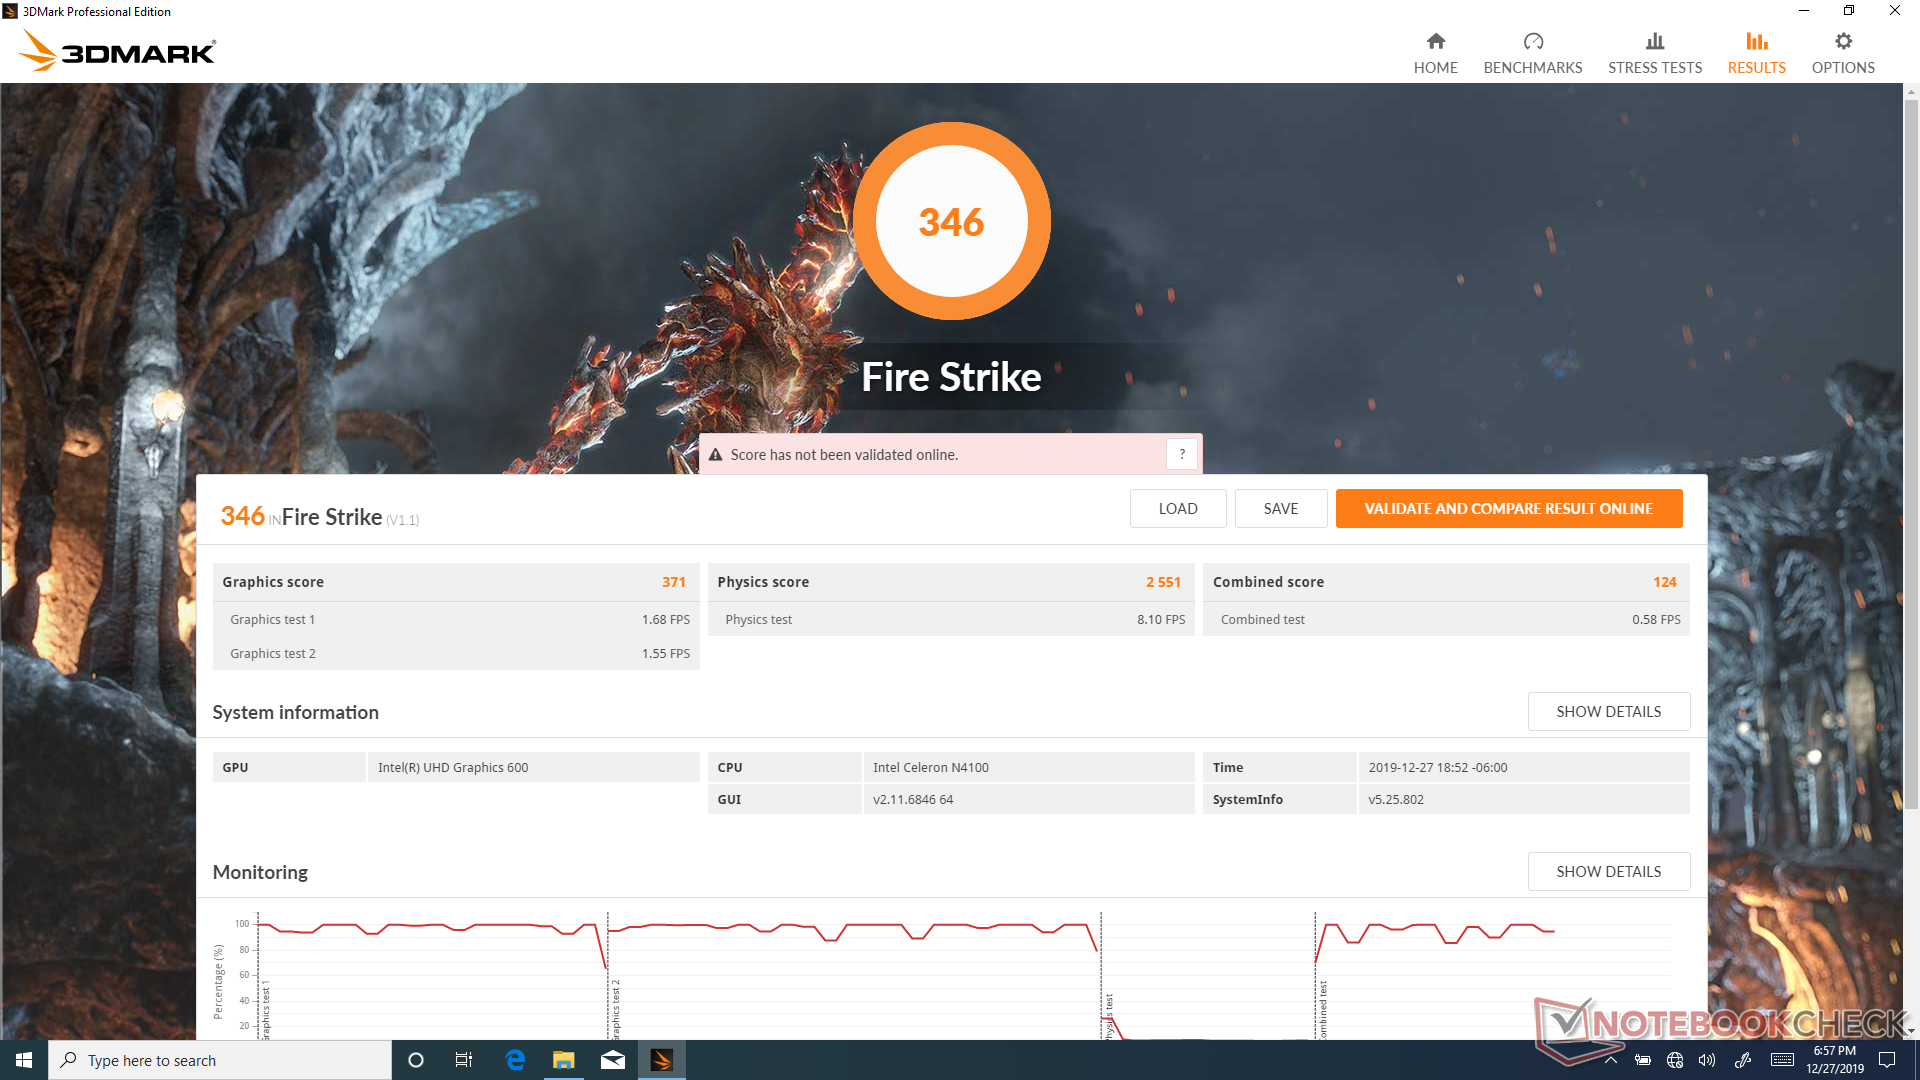
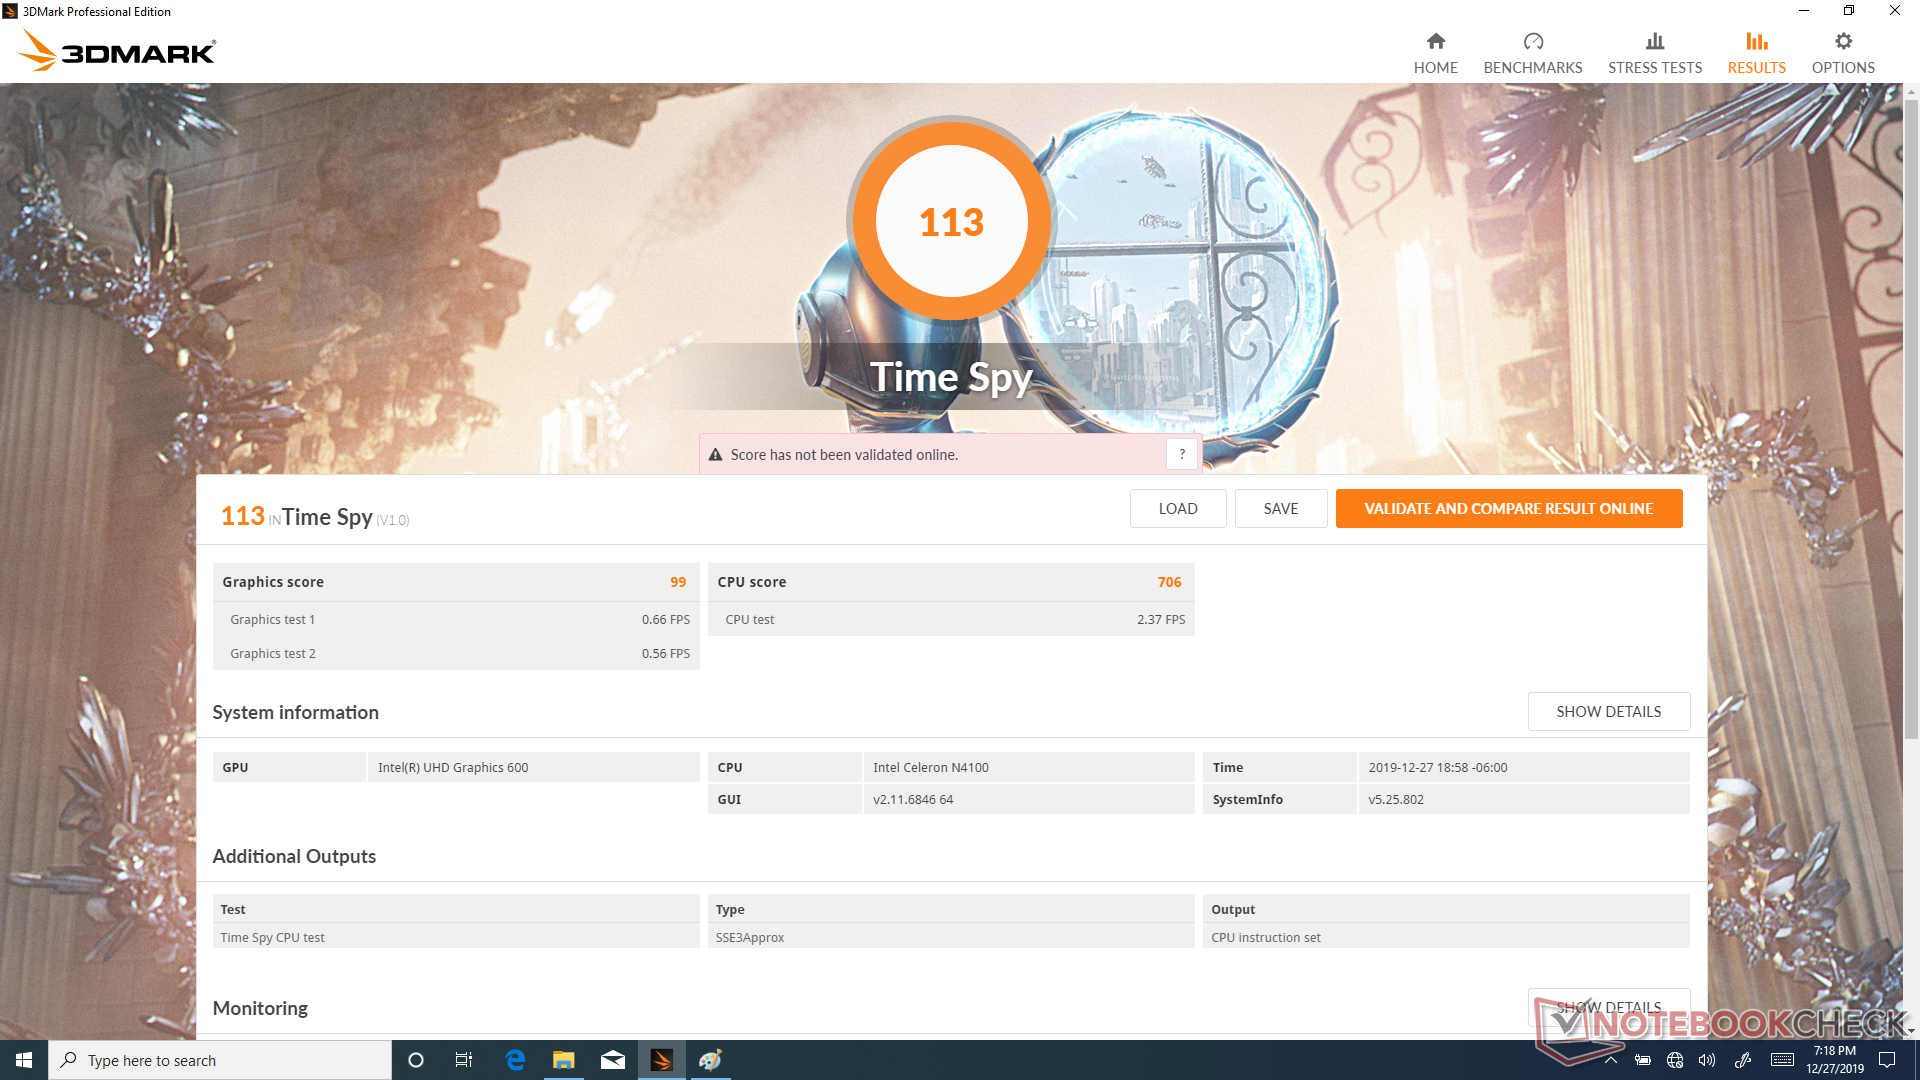
Graphics performance is slower than expected when compared to other systems with the same integrated UHD Graphics 600 GPU. 3DMark results are 10 to 27 percent behind the average UHD Graphics 600 in our database to be slower than the already slow UHD Graphics 615 on the Surface Go. This is in contrast to their nearly identical CPU performances as mentioned in our CPU section above. Even so, 1080p and 4K UHD video playback is smooth which is what most users will be using the tablet for.
See our UHD Graphics 600 page for more technical information and benchmarks.
| 3DMark 11 Performance | 482 points | |
| 3DMark Ice Storm Standard Score | 19808 points | |
| 3DMark Cloud Gate Standard Score | 2628 points | |
| 3DMark Fire Strike Score | 346 points | |
| 3DMark Time Spy Score | 113 points | |
Help | ||
| low | med. | high | ultra | |
|---|---|---|---|---|
| BioShock Infinite (2013) | 18.8 | 9 | 8 | 2 |
Emissions
Temperature
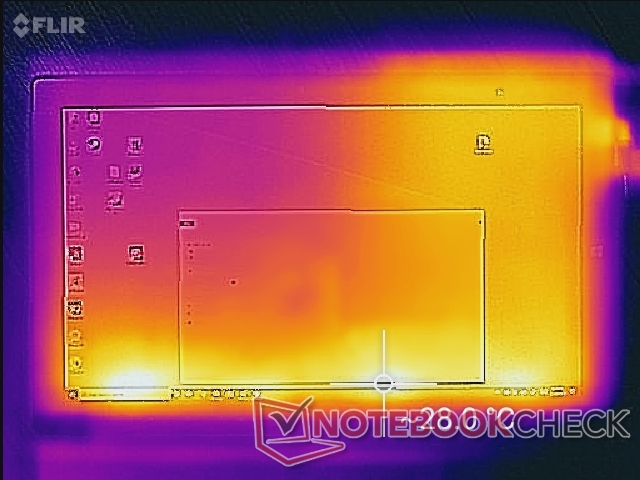
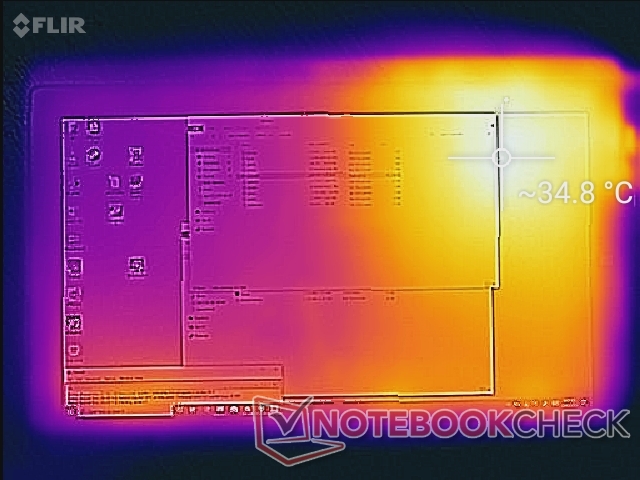
Surface temperatures are warmest towards the top right corner where the power adapter port is located. Thus, the right half of the tablet will always be warmer than the left. We're able to record a hot spot approaching 37 C when running Prime95 to stress the system.
(+) The maximum temperature on the upper side is 34.8 °C / 95 F, compared to the average of 35.4 °C / 96 F, ranging from 19.6 to 60 °C for the class Convertible.
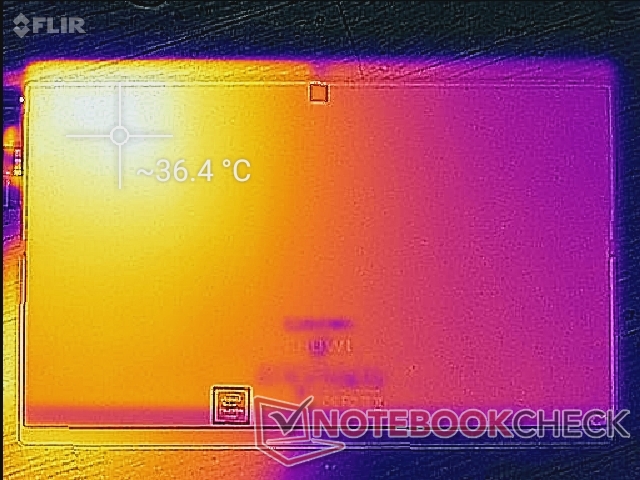
(+) The bottom heats up to a maximum of 36.4 °C / 98 F, compared to the average of 36.9 °C / 98 F
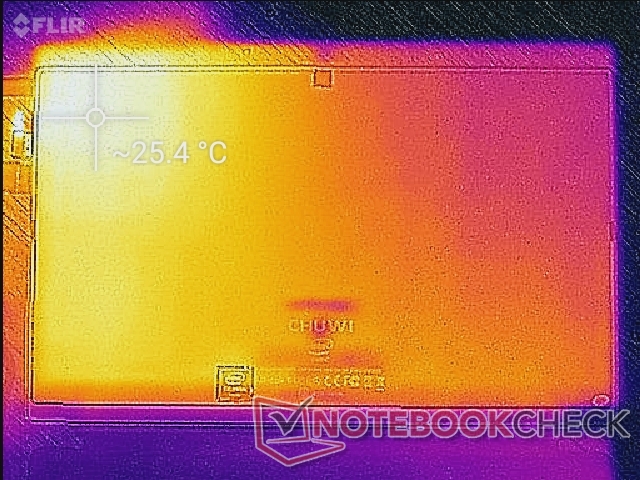
(+) In idle usage, the average temperature for the upper side is 25.1 °C / 77 F, compared to the device average of 30.3 °C / 87 F.
(+) The palmrests and touchpad are cooler than skin temperature with a maximum of 28.8 °C / 83.8 F and are therefore cool to the touch.
(±) The average temperature of the palmrest area of similar devices was 28 °C / 82.4 F (-0.8 °C / -1.4 F).
Stress Test
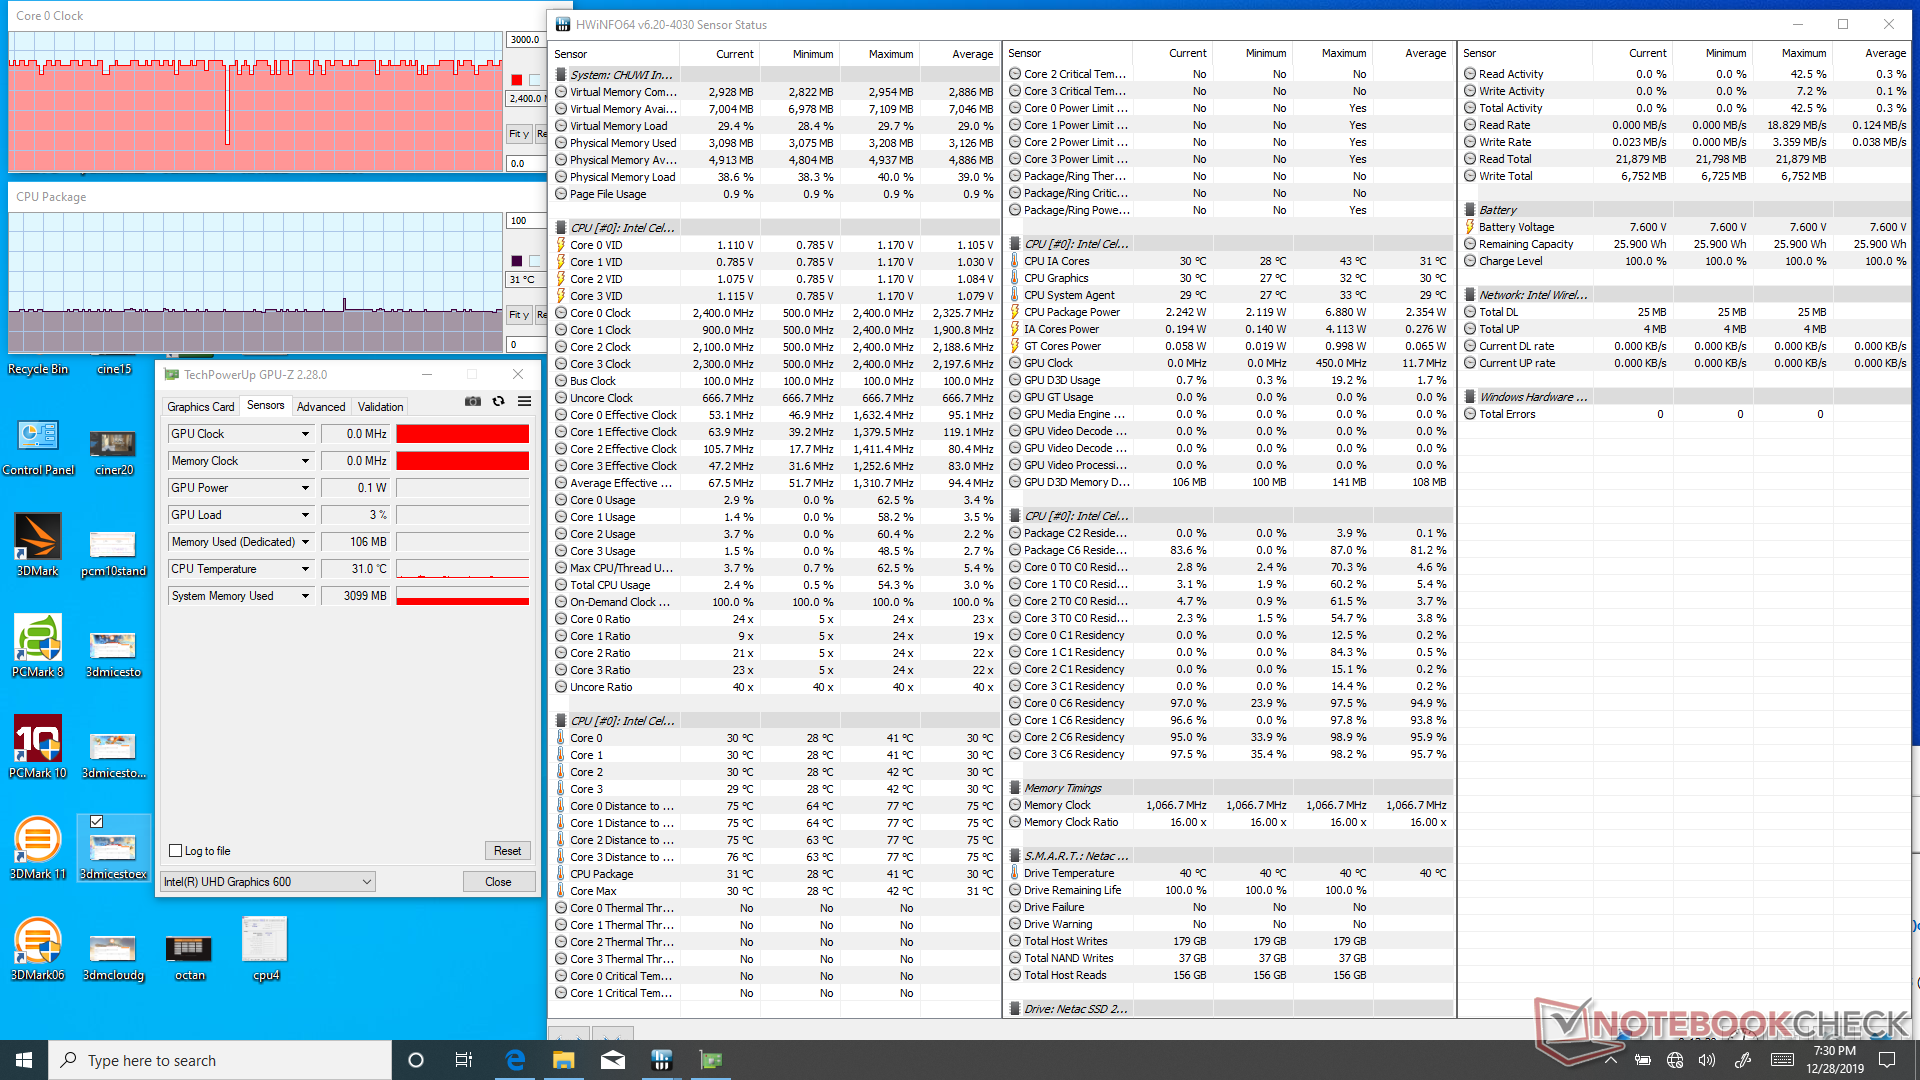
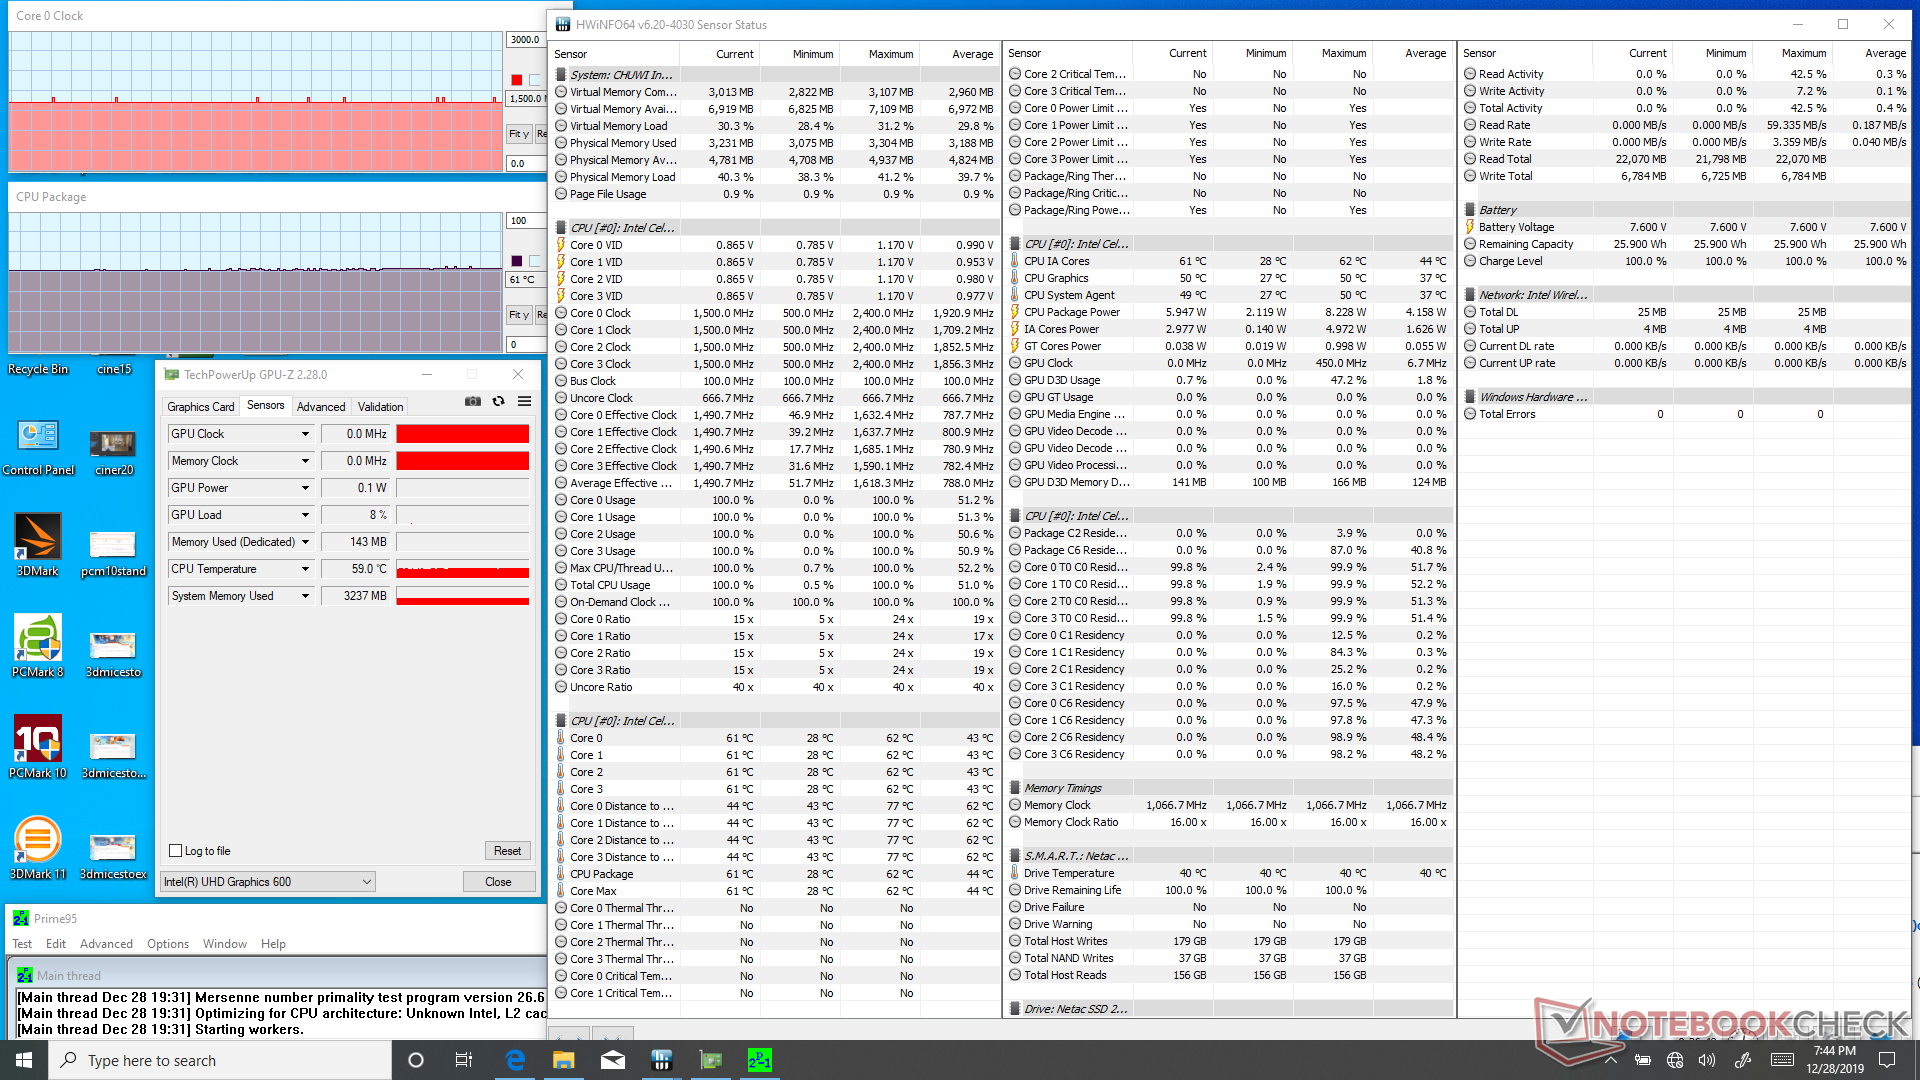
Running Prime95 will boost the CPU clock rate to 2.3 GHz for just a couple of seconds before falling and stabilizing at 1.5 GHz and 61 C. This observation matches our Power Consumption readings below.
Running on battery power will limit graphics performance just slightly. A Cloud Gate test on batteries returns Physics and Graphics scores of 1773 and 2710 points, respectively, compared to 1763 and 3057 points when on mains.
| CPU Clock (GHz) | GPU Clock (MHz) | Average CPU Temperature (°C) | |
| System Idle | -- | -- | 31 |
| Prime95 Stress | 1.5 | -- | 61 |
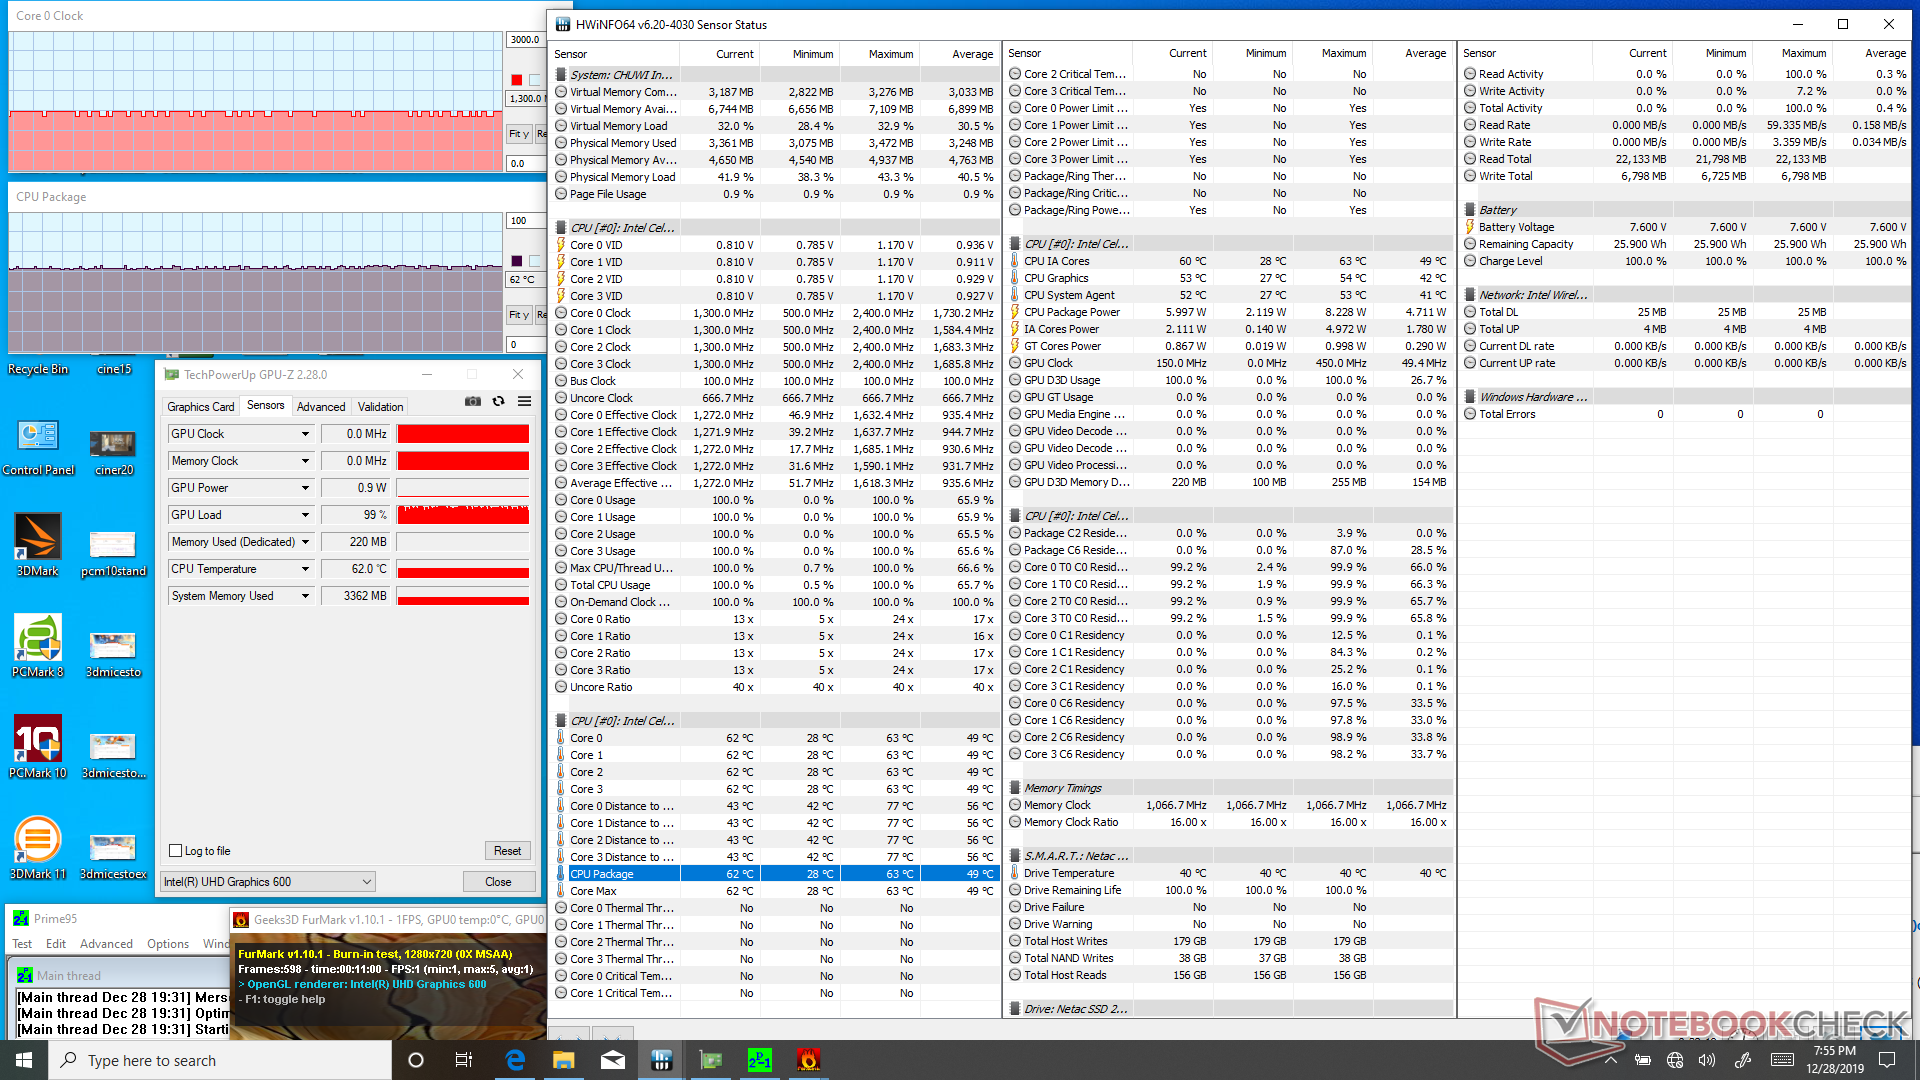
| Prime95 + FurMark Stress | 1.0 - 1.3 | -- | 62 |
Speakers
The stereo speakers are both low in volume with weak bass. Roll-off begins at around 1 kHz compared to 250 Hz or 500 Hz on most laptops.

Chuwi UBook CWI509 audio analysis
(-) | not very loud speakers (67.7 dB)
Bass 100 - 315 Hz
(-) | nearly no bass - on average 18.9% lower than median
(+) | bass is linear (5.5% delta to prev. frequency)
Mids 400 - 2000 Hz
(±) | reduced mids - on average 6% lower than median
(-) | mids are not linear (15.7% delta to prev. frequency)
Highs 2 - 16 kHz
(+) | balanced highs - only 1.5% away from median
(+) | highs are linear (6.3% delta to prev. frequency)
Overall 100 - 16.000 Hz
(-) | overall sound is not linear (38.2% difference to median)
Compared to same class
» 96% of all tested devices in this class were better, 2% similar, 2% worse
» The best had a delta of 6%, average was 20%, worst was 57%
Compared to all devices tested
» 95% of all tested devices were better, 1% similar, 5% worse
» The best had a delta of 4%, average was 24%, worst was 134%
Apple MacBook 12 (Early 2016) 1.1 GHz audio analysis
(+) | speakers can play relatively loud (83.6 dB)
Bass 100 - 315 Hz
(±) | reduced bass - on average 11.3% lower than median
(±) | linearity of bass is average (14.2% delta to prev. frequency)
Mids 400 - 2000 Hz
(+) | balanced mids - only 2.4% away from median
(+) | mids are linear (5.5% delta to prev. frequency)
Highs 2 - 16 kHz
(+) | balanced highs - only 2% away from median
(+) | highs are linear (4.5% delta to prev. frequency)
Overall 100 - 16.000 Hz
(+) | overall sound is linear (10.2% difference to median)
Compared to same class
» 7% of all tested devices in this class were better, 2% similar, 91% worse
» The best had a delta of 5%, average was 18%, worst was 53%
Compared to all devices tested
» 5% of all tested devices were better, 1% similar, 94% worse
» The best had a delta of 4%, average was 24%, worst was 134%
Energy Management
Power Consumption
Idling on desktop draws between 5 W and 9 W to be higher than expected for its category. Additionally, the tablet continues to draw between 2 W and 3 W from the outlet when turned off or in Sleep mode to suggest poor power management.
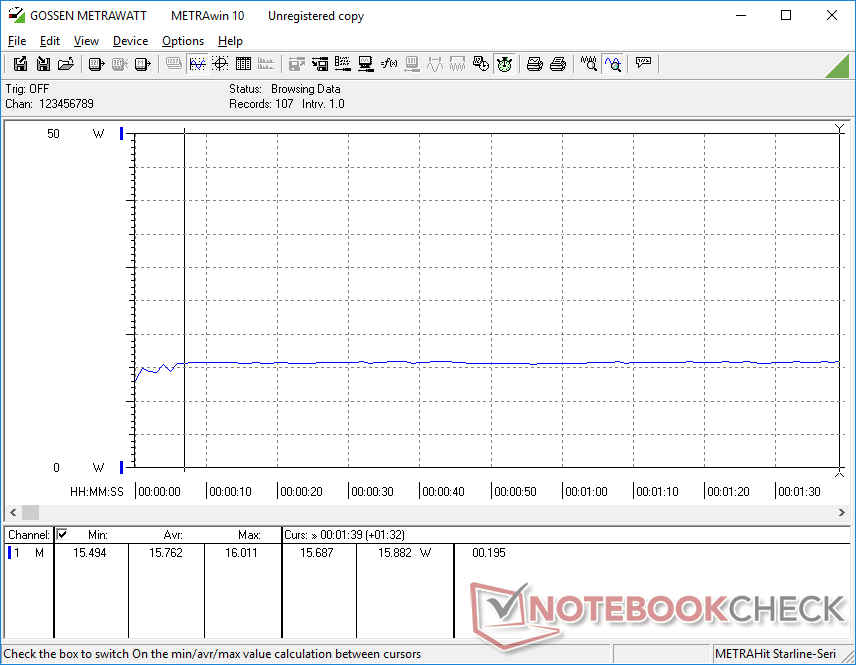
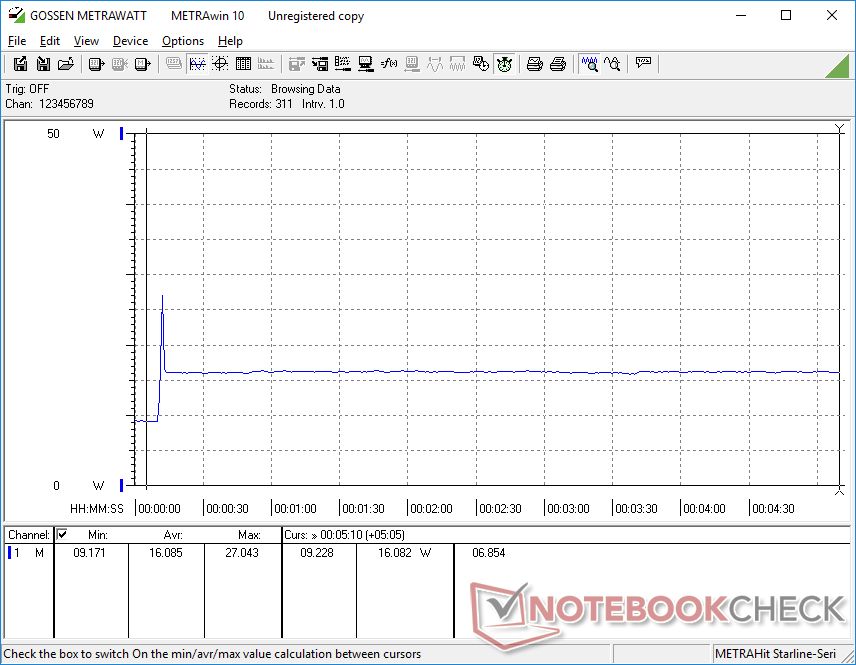
Running Prime95 and FurMark simultaneously pulls 27 W from the small (~9.5 x 4.3 x 3 cm) 24 W AC adapter. This maximum consumption is very short-lived as shown by our graphs below.

| Off / Standby | |
| Idle | |
| Load |
|
Key:
min: | |
| Chuwi UBook CWI509 Celeron N4100, UHD Graphics 600, Netac SSD 256GB, IPS, 1920x1080, 11.6" | Microsoft Surface Pro 7 Core i5-1035G4 i5-1035G4, Iris Plus Graphics G4 (Ice Lake 48 EU), Toshiba BG4 KBG40ZPZ256G, IPS, 2736x1824, 12.3" | Microsoft Surface Go MHN-00003 Pentium 4415Y, UHD Graphics 615, 64 GB eMMC Flash, IPS, 1800x1200, 10" | HP ProBook x360 11 G4 m3-8100Y, UHD Graphics 615, WDC PC SN520 SDAPNUW-256G, IPS, 1366x768, 11.6" | Trekstor Surftab Theatre S11 MT8163 V/A 1.5 GHz, Mali-T720 MP2, 32 GB eMMC Flash, IPS, 1920x1080, 11.6" | HP x2 210 G2 Z8350, HD Graphics 400 (Braswell), 64 GB eMMC Flash, IPS, 1280x800, 10.1" | |
|---|---|---|---|---|---|---|
| Power Consumption | -62% | 21% | 41% | 39% | 44% | |
| Idle Minimum * (Watt) | 5.2 | 4.5 13% | 2.88 45% | 2.4 54% | 3.27 37% | 2.9 44% |
| Idle Average * (Watt) | 8.3 | 9.2 -11% | 4.8 42% | 4.2 49% | 6.33 24% | 4.8 42% |
| Idle Maximum * (Watt) | 8.7 | 9.6 -10% | 7.5 14% | 5 43% | 6.39 27% | 5.2 40% |
| Load Average * (Watt) | 15.8 | 42 -166% | 16.9 -7% | 13.2 16% | 8.9 44% | 10.4 34% |
| Load Maximum * (Watt) | 27.1 | 63.5 -134% | 23.8 12% | 16 41% | 10.55 61% | 10.9 60% |
* ... smaller is better
Battery Life
Battery capacity is small at just 26 Wh and battery life is just average at best. We're able to record a total WLAN runtime of 5.5 hours before automatic shutdown compared to 7.5 hours on the Surface Go. Recharging from empty to full capacity is slow at 2 to 2.5 hours.
| Chuwi UBook CWI509 Celeron N4100, UHD Graphics 600, 26 Wh | Microsoft Surface Pro 7 Core i5-1035G4 i5-1035G4, Iris Plus Graphics G4 (Ice Lake 48 EU), 45 Wh | Microsoft Surface Go MHN-00003 Pentium 4415Y, UHD Graphics 615, 28 Wh | HP ProBook x360 11 G4 m3-8100Y, UHD Graphics 615, 48 Wh | Trekstor Surftab Theatre S11 MT8163 V/A 1.5 GHz, Mali-T720 MP2, 25.16 Wh | HP x2 210 G2 Z8350, HD Graphics 400 (Braswell), 32.5 Wh | |
|---|---|---|---|---|---|---|
| Battery runtime | 82% | 36% | 95% | -11% | 67% | |
| WiFi v1.3 (h) | 5.5 | 10 82% | 7.5 36% | 10.7 95% | 4.9 -11% | 9.2 67% |
| Reader / Idle (h) | 22.3 | 12.9 | ||||
| Load (h) | 1.9 | 3 |
Pros
Cons
Verdict
The Chuwi UBook has a few noteworthy features for its budget category. The display shows potential when properly calibrated and the wide selection of ports is a lot better than what the Surface Go can offer. Unfortunately, everything else kind of just falls apart or is average at best. The detachable keyboard feels cheaply put together, the display is fairly dim with noticeable backlight bleeding, and overall system responsiveness is very slow. It's decent enough for word processing, light browsing and streaming, but certainly not all at once.
An inexpensive tablet convertible that's reflective of its cheap price point. The Chuwi UBook works best as a backup or small HTPC rather than a primary workhorse.
Chuwi UBook CWI509
- 12/30/2019 v7 (old)
Allen Ngo
Price comparison
