Schenker Slim 15 Review: Wi-fi 6 laptop doesn't go to full capacity
Rating | Date | Model | Weight | Height | Size | Resolution | Price |
|---|---|---|---|---|---|---|---|
| 82.1 % v7 (old) | 12 / 2019 | Schenker Slim 15 L19 i5-10210U, UHD Graphics 620 | 1.6 kg | 19.9 mm | 15.60" | 1920x1080 |
Case, Equipment and Input devices
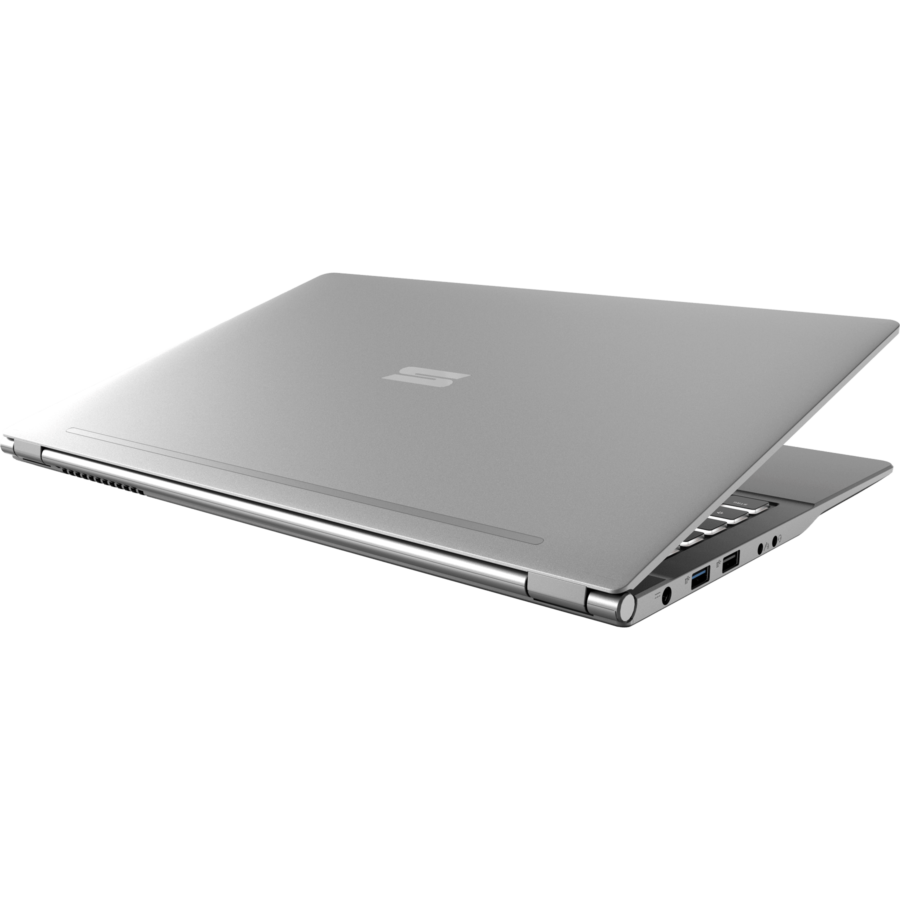
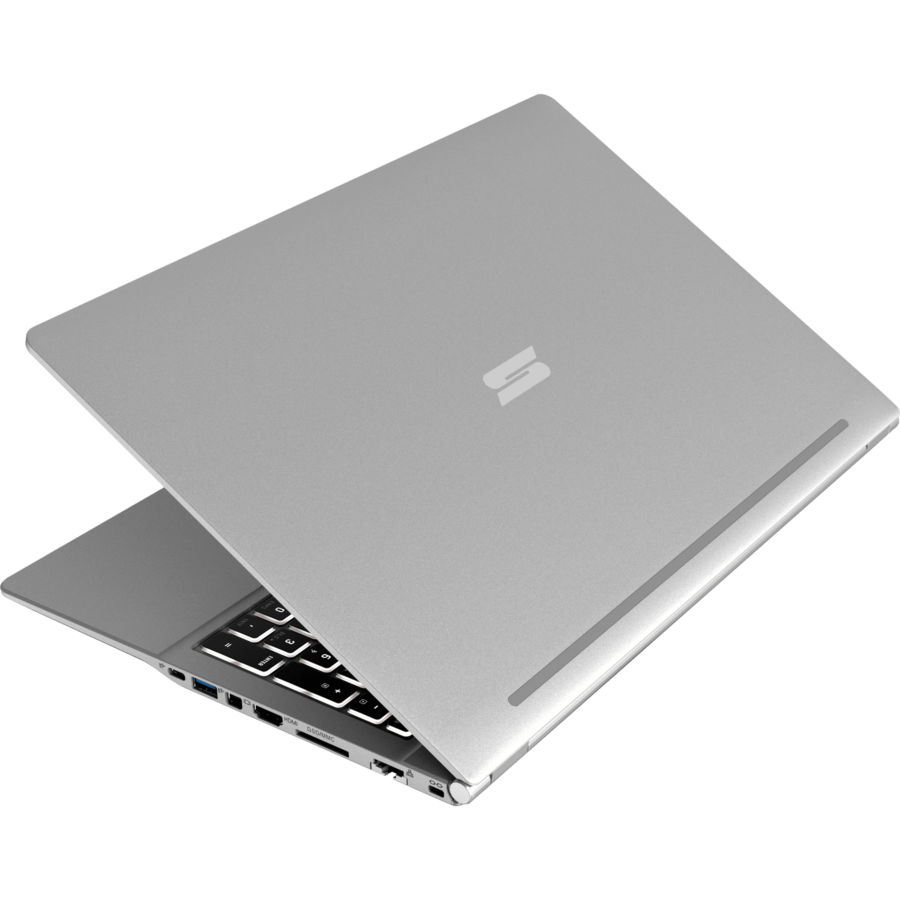
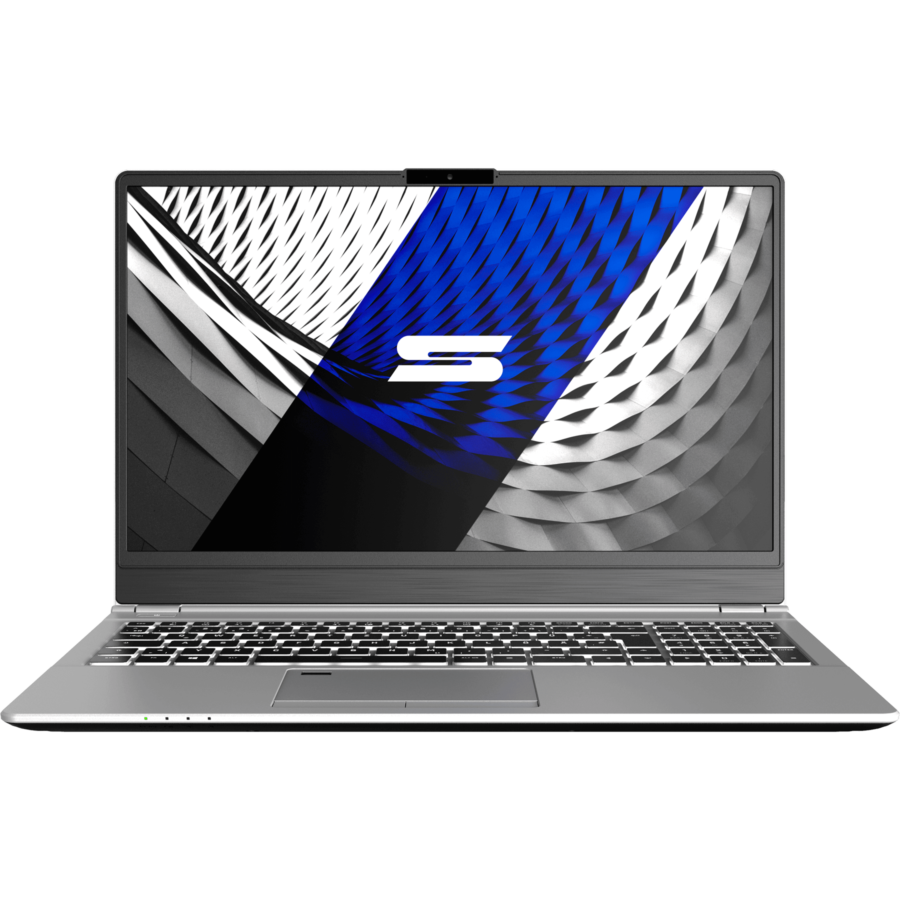
Schenker has once again opted for a mixture of aluminium and plastic components for the new Slim 15. The back of the display and the keyboard unit are made of metal elements. Whereas the display frame and the underbody unit are made of plastic. The transition between the two materials is precise and the overall feel is tidy. The hinges also make a robust impression at first glance.
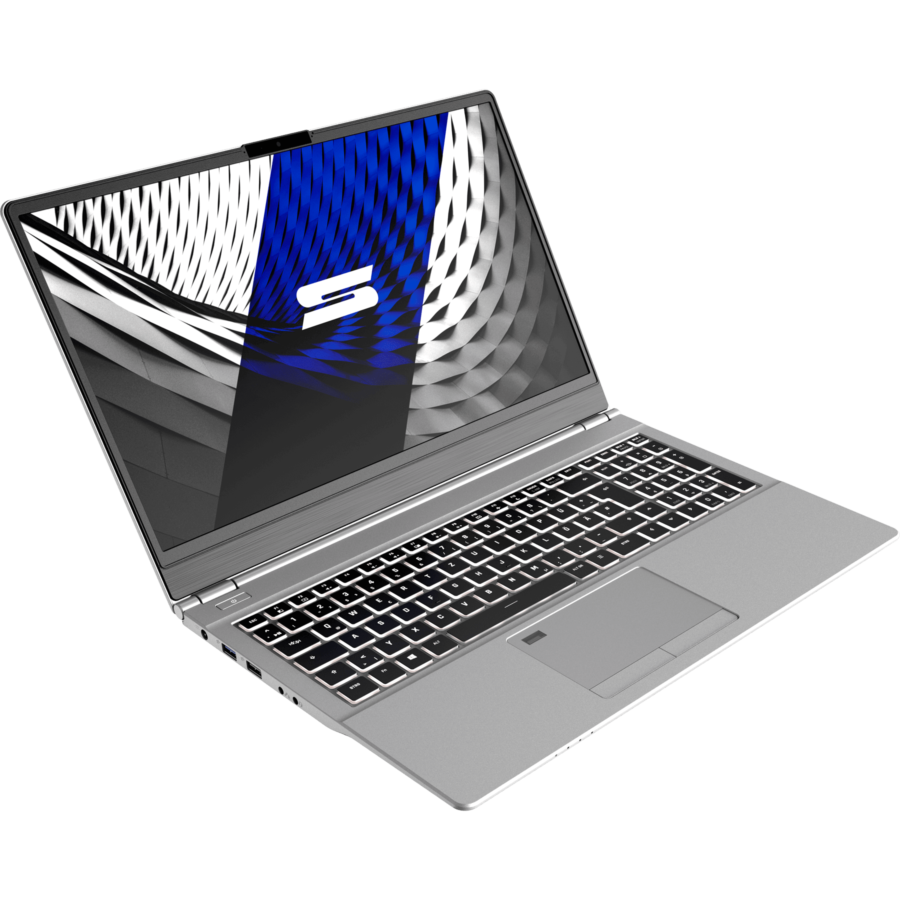
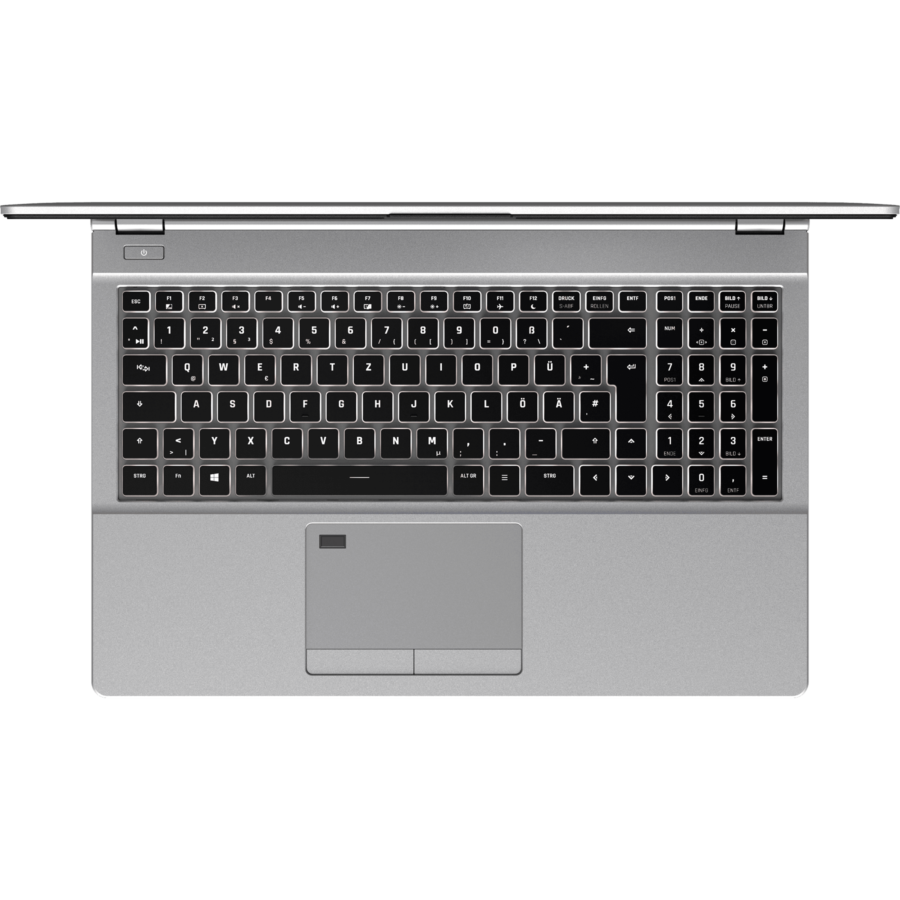
The same applies to the input devices: nothing new in the West. The chiclet keyboard has a relatively wide and soft stroke with even and precise pressure points. Schenker also supplies a complete Numpad, which has to make do with somewhat narrower keys due to the space required. The real innovation is optical: Schenker provides a keyboard illumination with 23 selectable colours.
The touchpad used is sufficiently large and interprets all inputs as desired. Multitouch gestures are no problem either. What is new is that the fingerprint reader is now installed in the upper left corner of the touchpad. This limits the actual usable area somewhat.
Depending on preference, potential customers can choose between five different WLAN modules when configuring the Schenker Slim 15. Our present model has an Intel Wi-Fi 6 AX200 module including Bluetooth 5.0. According to the data sheet, the 2x2 stream is supposed to achieve a transmission rate of up to 2.4 GBit/s gross. In our tests, the test candidate achieves a speed of 1.3 - 1.4 GBit/s. The data sheet shows that the 2x2 stream has a gross transmission rate of up to 2.4 GBit/s. In our tests, the test candidate achieves a speed of 1.3 - 1.4 GBit/s.
The large 6-in-1 card reader convinces as in our last test of the Slim-15-RED-Edtion. Using Toshiba Exceria Pro SDXC 64 GB UHS-II, the test notebook achieves higher read and write rates than the average in its class.
| SD Card Reader | |
| average JPG Copy Test (av. of 3 runs) | |
| Lenovo ThinkPad L590-20Q70019GE (Toshiba Exceria Pro M501 64 GB UHS-II) | |
| Schenker Slim 15 L19 (Toshiba Exceria Pro SDXC 64 GB UHS-II) | |
| Schenker Slim 15-RE-E19 (Toshiba Exceria Pro SDXC 64 GB UHS-II) | |
| Average of class Office (22.4 - 198.5, n=21, last 2 years) | |
| Dell Inspiron 15 5000 5584 (Toshiba Exceria Pro SDXC 64 GB UHS-II) | |
| maximum AS SSD Seq Read Test (1GB) | |
| Lenovo ThinkPad L590-20Q70019GE (Toshiba Exceria Pro M501 64 GB UHS-II) | |
| Schenker Slim 15 L19 (Toshiba Exceria Pro SDXC 64 GB UHS-II) | |
| Schenker Slim 15-RE-E19 (Toshiba Exceria Pro SDXC 64 GB UHS-II) | |
| Average of class Office (27.4 - 249, n=20, last 2 years) | |
| Dell Inspiron 15 5000 5584 (Toshiba Exceria Pro SDXC 64 GB UHS-II) | |
Display

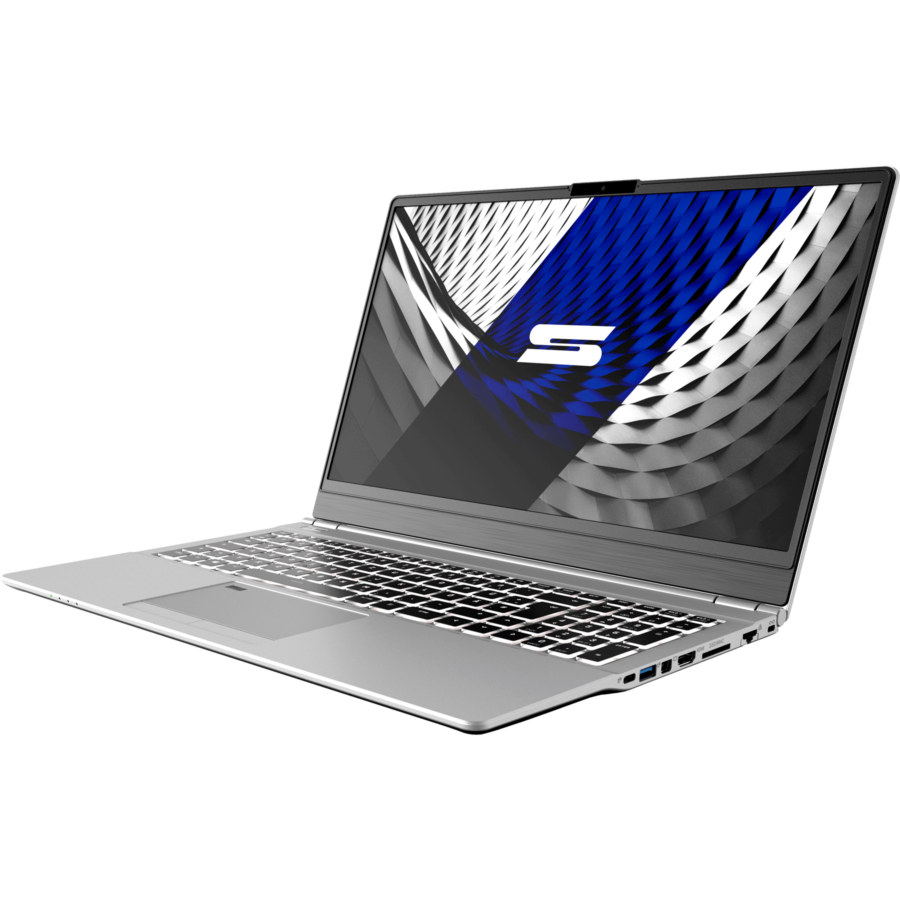
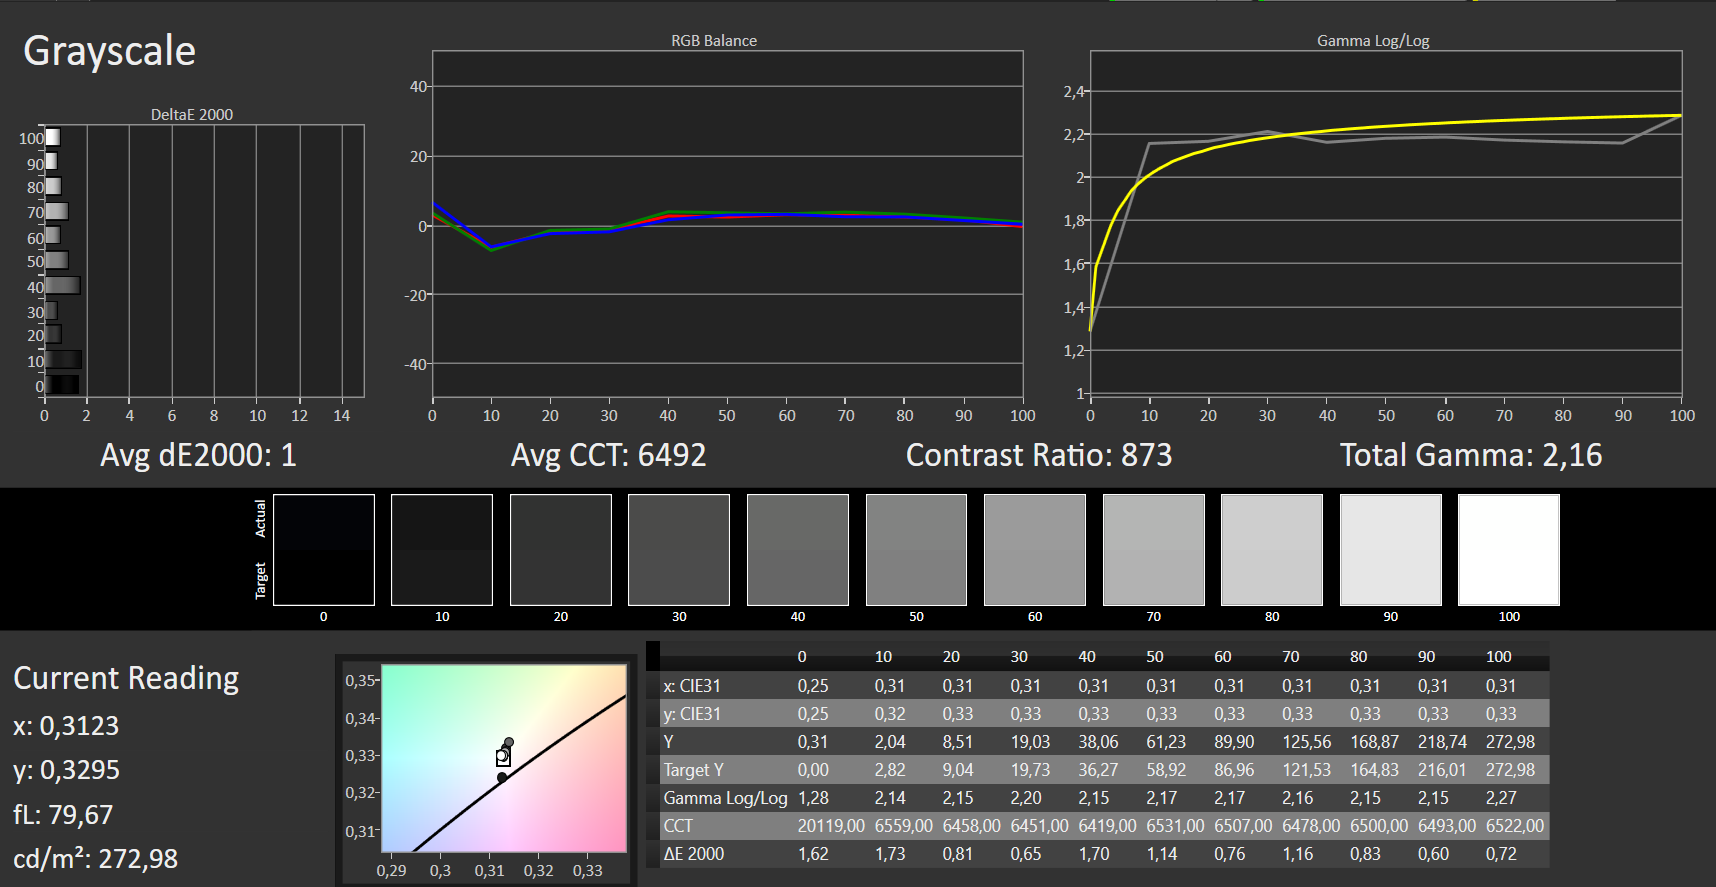
A matt IPS panel with a Full HD resolution of 1,920 x 1,020 pixels is used in our test device. The BOE display has an average brightness of 294 cd/m². The brightness can also be maintained during battery operation.
The adjustment of the brightness levels of the display is technically realized by means of PWM control. Unfortunately, we notice particularly low frequencies of 250 Hz here. This can have negative effects on sensitive people.
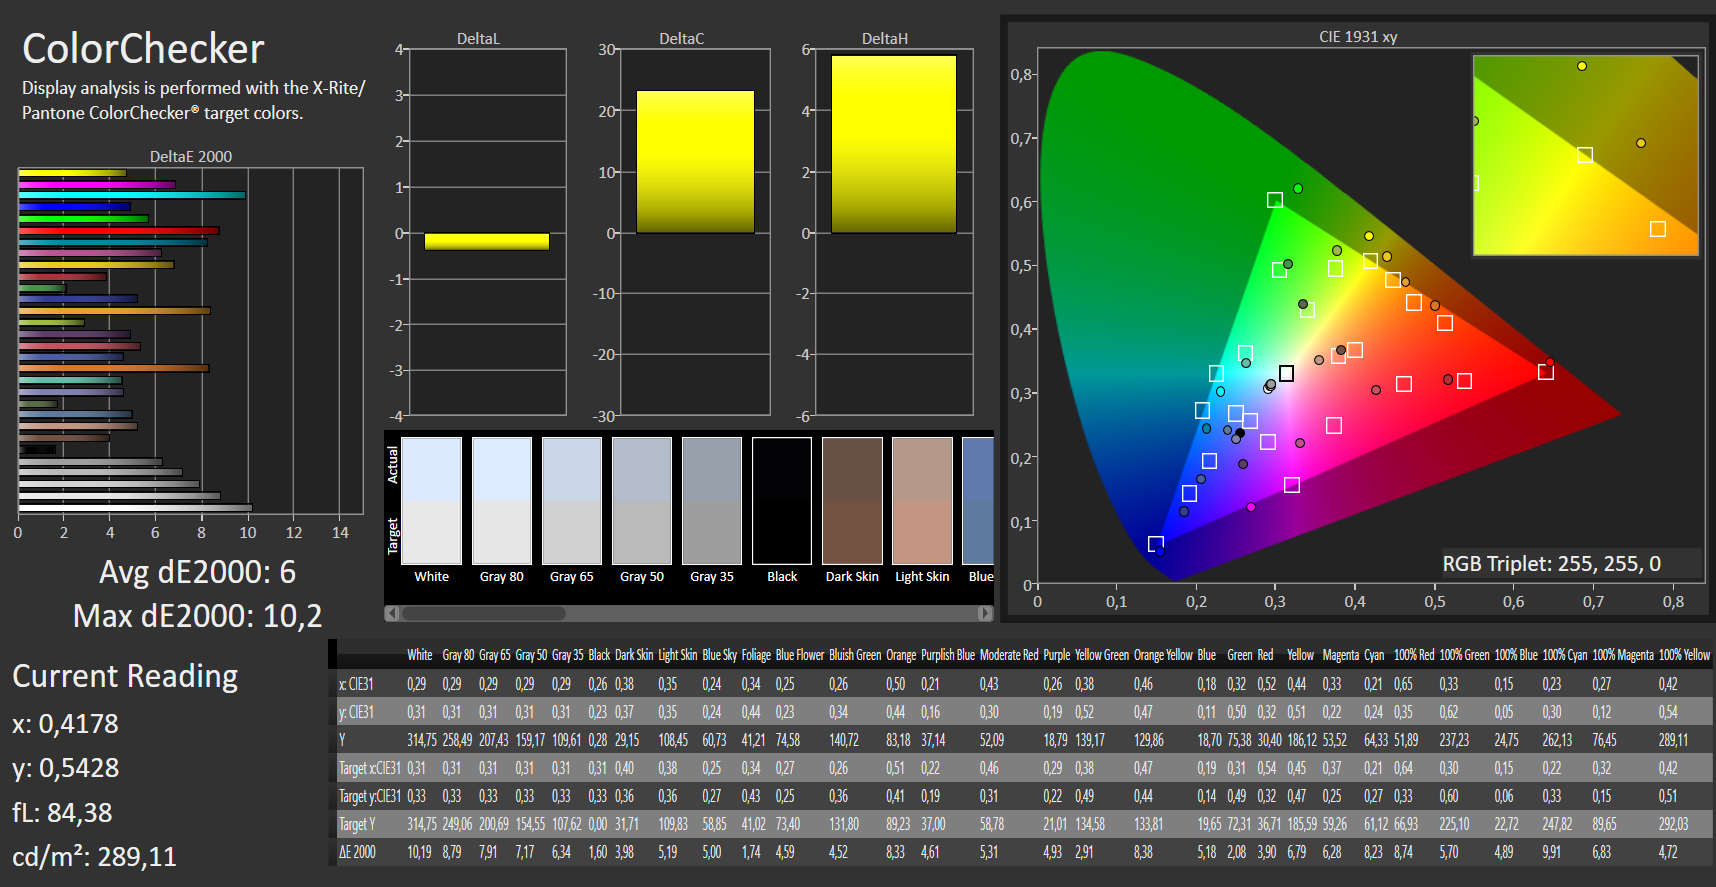
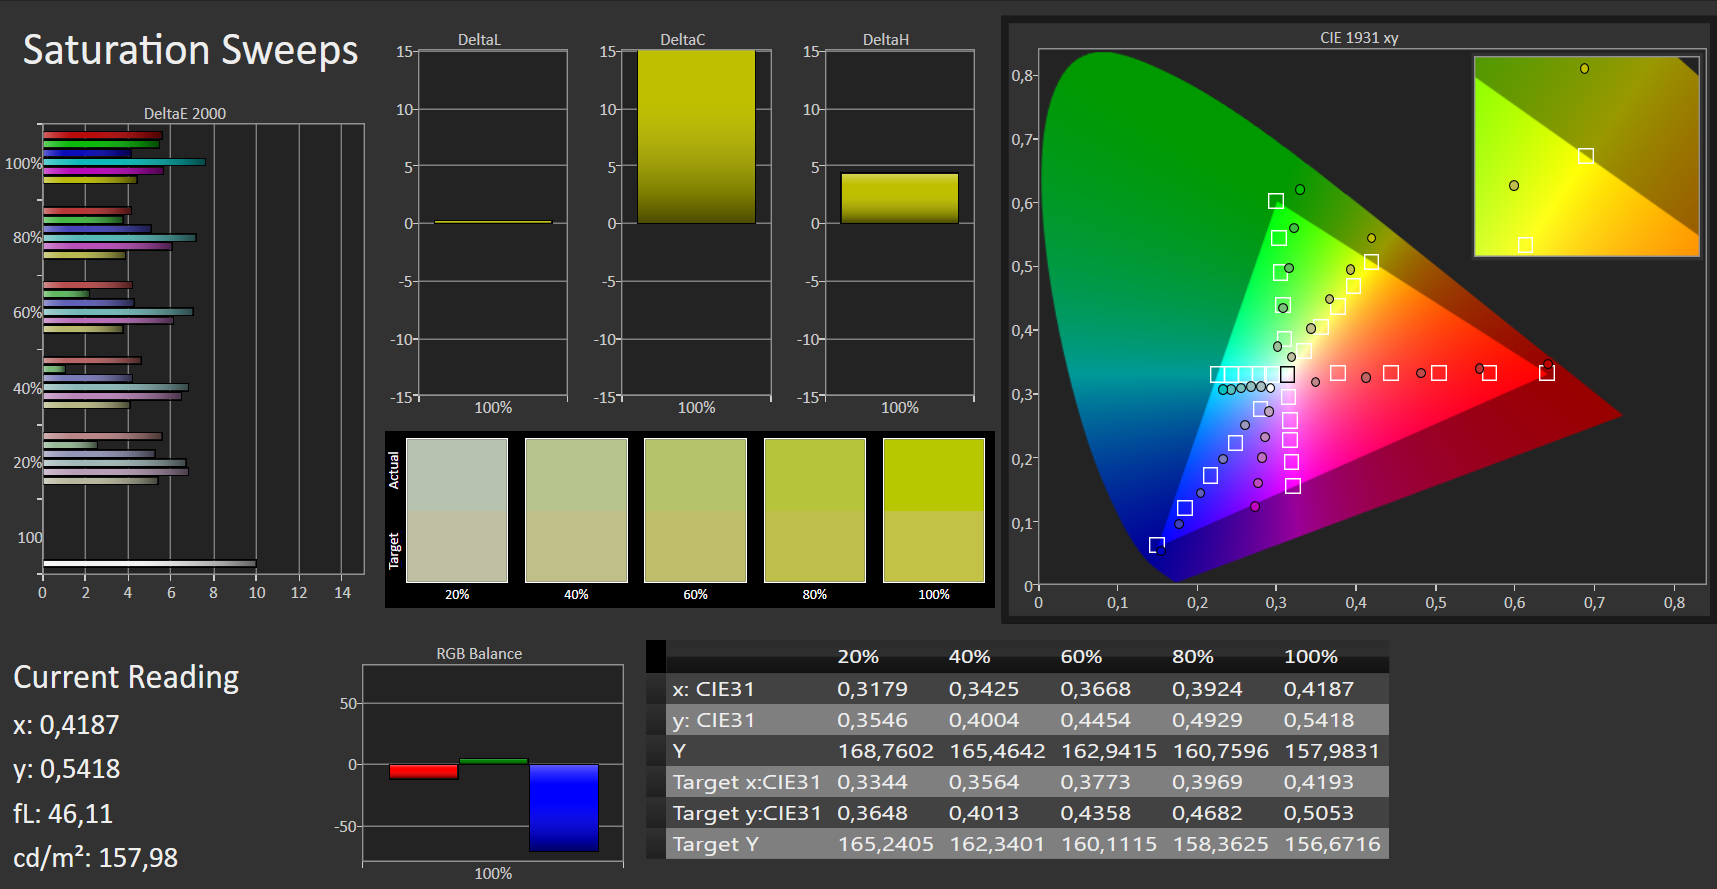
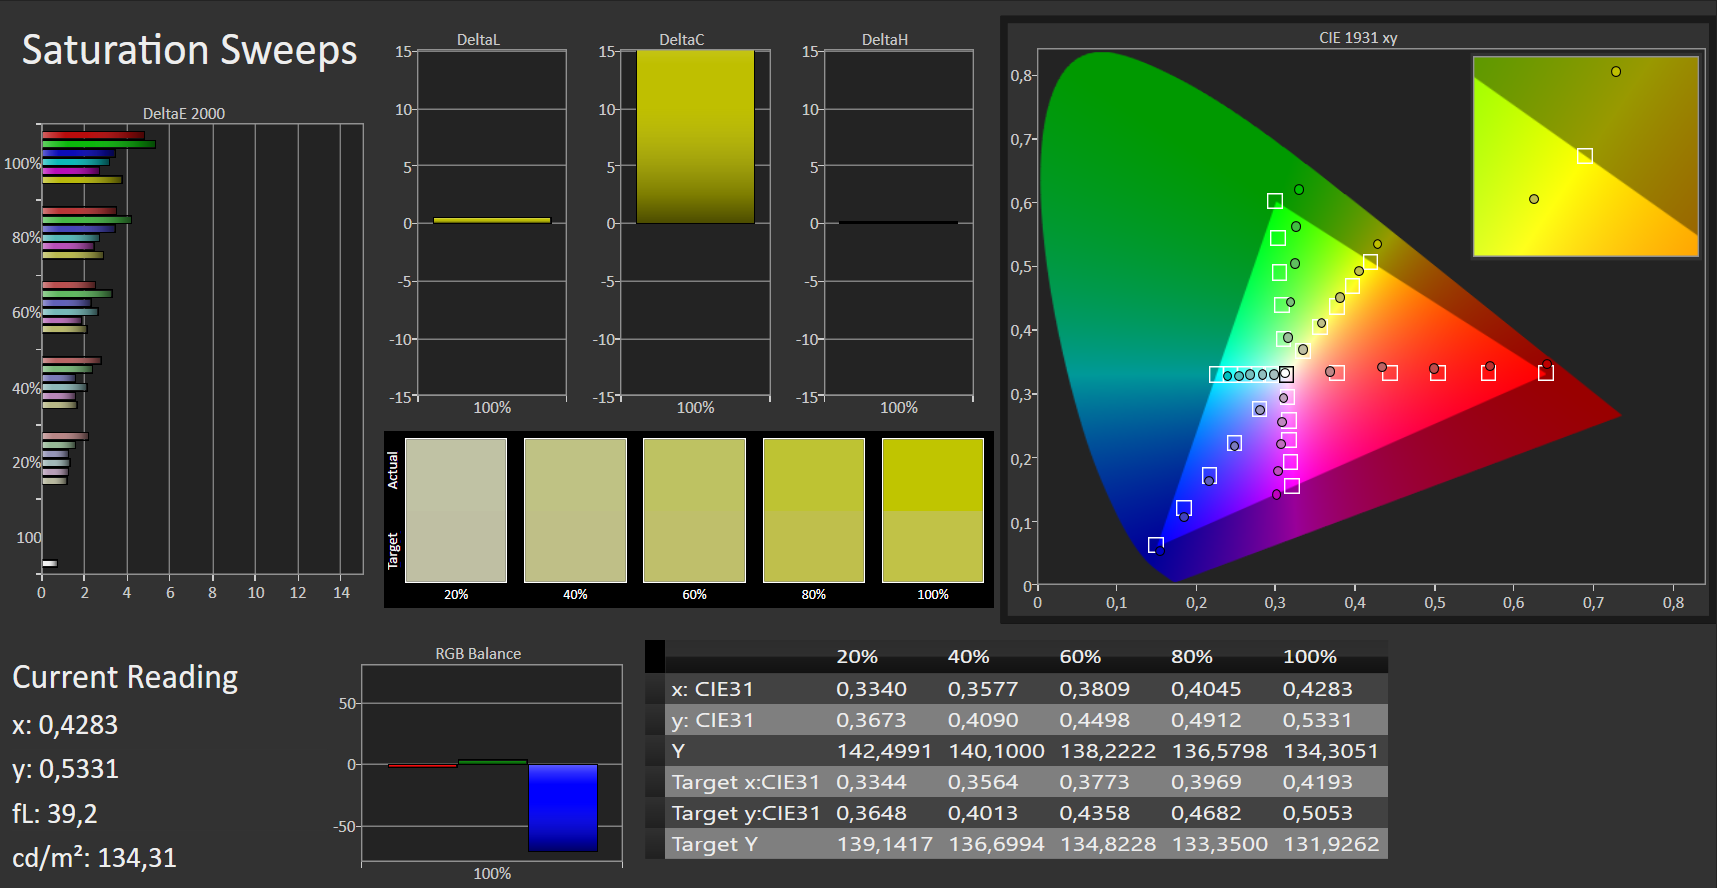
The contrast of 1:086 and the deviations of the colors are, as usual with an IPS panel, decent.
| |||||||||||||||||||||||||
Brightness Distribution: 83 %
Center on Battery: 315 cd/m²
Contrast: 1086:1 (Black: 0.29 cd/m²)
ΔE ColorChecker Calman: 6 | ∀{0.5-29.43 Ø4.73}
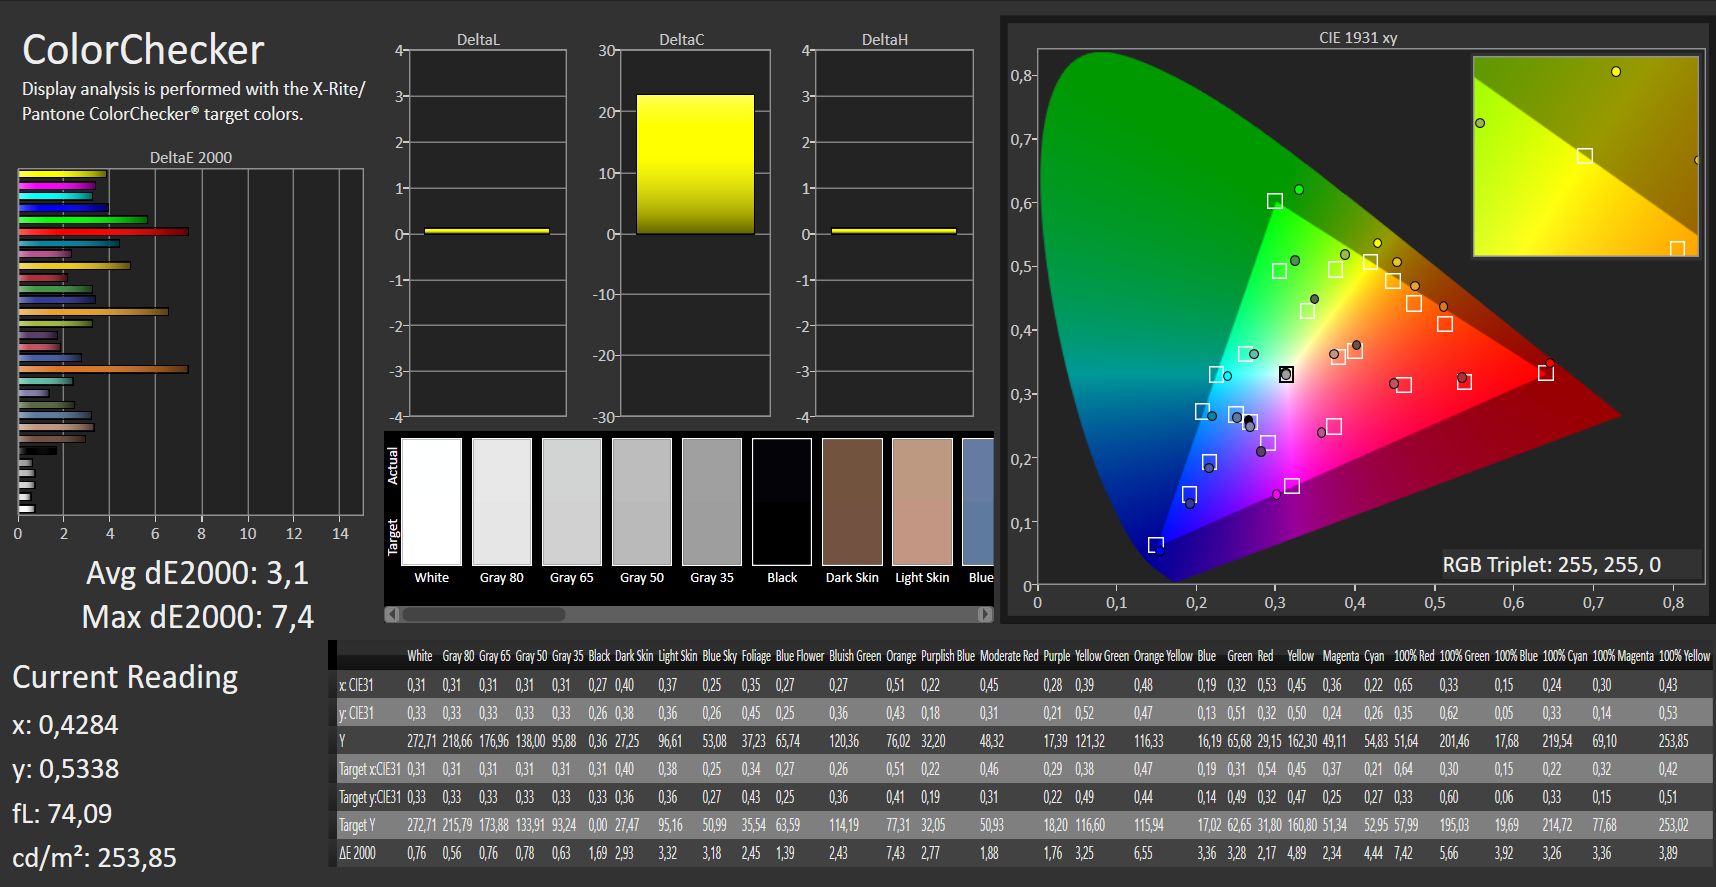
calibrated: 3.1
ΔE Greyscale Calman: 6 | ∀{0.09-98 Ø4.97}
87% sRGB (Argyll 1.6.3 3D)
57% AdobeRGB 1998 (Argyll 1.6.3 3D)
63.7% AdobeRGB 1998 (Argyll 3D)
87.1% sRGB (Argyll 3D)
66.8% Display P3 (Argyll 3D)
Gamma: 2.16
CCT: 8038 K
| Schenker Slim 15 L19 BOE CQ NV156FHM-N61, , 1920x1080, 15.6" | Schenker Slim 15-RE-E19 Chi Mei CMN15E8, IPS, 2x1, 15.6" | Lenovo ThinkPad L590-20Q70019GE N156HCE-EAA, IPS, 1920x1080, 15.6" | Dell Inspiron 15 5000 5584 AU Optronics AUO22ED, B156HAK, IPS, 1920x1080, 15.6" | |
|---|---|---|---|---|
| Display | -1% | -30% | -36% | |
| Display P3 Coverage (%) | 66.8 | 63.7 -5% | 43.3 -35% | 39.17 -41% |
| sRGB Coverage (%) | 87.1 | 87.7 1% | 64.4 -26% | 58.8 -32% |
| AdobeRGB 1998 Coverage (%) | 63.7 | 63.9 0% | 44.81 -30% | 40.48 -36% |
| Response Times | 21% | 3% | -1% | |
| Response Time Grey 50% / Grey 80% * (ms) | 45 ? | 37 ? 18% | 42.8 ? 5% | 48.8 ? -8% |
| Response Time Black / White * (ms) | 31 ? | 24 ? 23% | 30.8 ? 1% | 29.2 ? 6% |
| PWM Frequency (Hz) | 250 ? | 25000 ? | 24510 ? | |
| Screen | 5% | -18% | -23% | |
| Brightness middle (cd/m²) | 315 | 289 -8% | 247 -22% | 227 -28% |
| Brightness (cd/m²) | 294 | 280 -5% | 228 -22% | 230 -22% |
| Brightness Distribution (%) | 83 | 87 5% | 81 -2% | 92 11% |
| Black Level * (cd/m²) | 0.29 | 0.36 -24% | 0.18 38% | 0.21 28% |
| Contrast (:1) | 1086 | 803 -26% | 1372 26% | 1081 0% |
| Colorchecker dE 2000 * | 6 | 3.93 34% | 5.9 2% | 6.55 -9% |
| Colorchecker dE 2000 max. * | 10.2 | 6.98 32% | 22.9 -125% | 23.45 -130% |
| Colorchecker dE 2000 calibrated * | 3.1 | 4.7 -52% | 4.61 -49% | |
| Greyscale dE 2000 * | 6 | 3.73 38% | 5.1 15% | 5.2 13% |
| Gamma | 2.16 102% | 2.42 91% | 2.21 100% | 2.66 83% |
| CCT | 8038 81% | 6802 96% | 6398 102% | 6434 101% |
| Color Space (Percent of AdobeRGB 1998) (%) | 57 | 57 0% | 41.2 -28% | 37 -35% |
| Color Space (Percent of sRGB) (%) | 87 | 87 0% | 64.1 -26% | 58.2 -33% |
| Total Average (Program / Settings) | 8% /
6% | -15% /
-18% | -20% /
-23% |
* ... smaller is better
Display Response Times
| ↔ Response Time Black to White | ||
|---|---|---|
| 31 ms ... rise ↗ and fall ↘ combined | ↗ 17 ms rise | 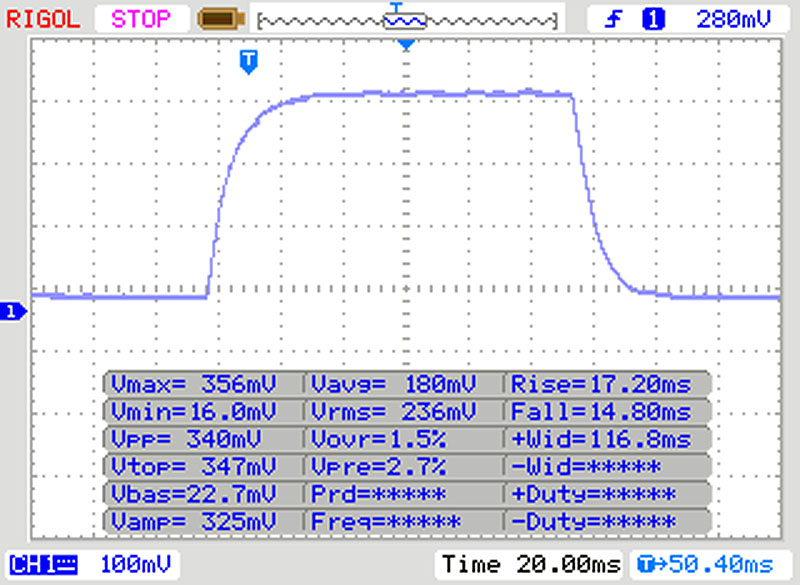 |
| ↘ 14 ms fall | ||
| The screen shows slow response rates in our tests and will be unsatisfactory for gamers. In comparison, all tested devices range from 0.1 (minimum) to 240 (maximum) ms. » 84 % of all devices are better. This means that the measured response time is worse than the average of all tested devices (19.9 ms). | ||
| ↔ Response Time 50% Grey to 80% Grey | ||
| 45 ms ... rise ↗ and fall ↘ combined | ↗ 23 ms rise | 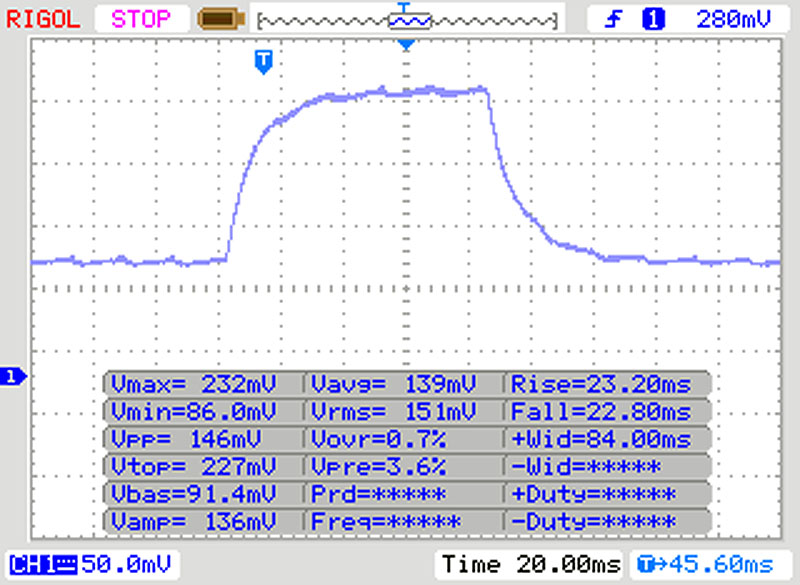 |
| ↘ 22 ms fall | ||
| The screen shows slow response rates in our tests and will be unsatisfactory for gamers. In comparison, all tested devices range from 0.165 (minimum) to 636 (maximum) ms. » 77 % of all devices are better. This means that the measured response time is worse than the average of all tested devices (31.1 ms). | ||
Screen Flickering / PWM (Pulse-Width Modulation)
| Screen flickering / PWM detected | 250 Hz | ≤ 80 % brightness setting | 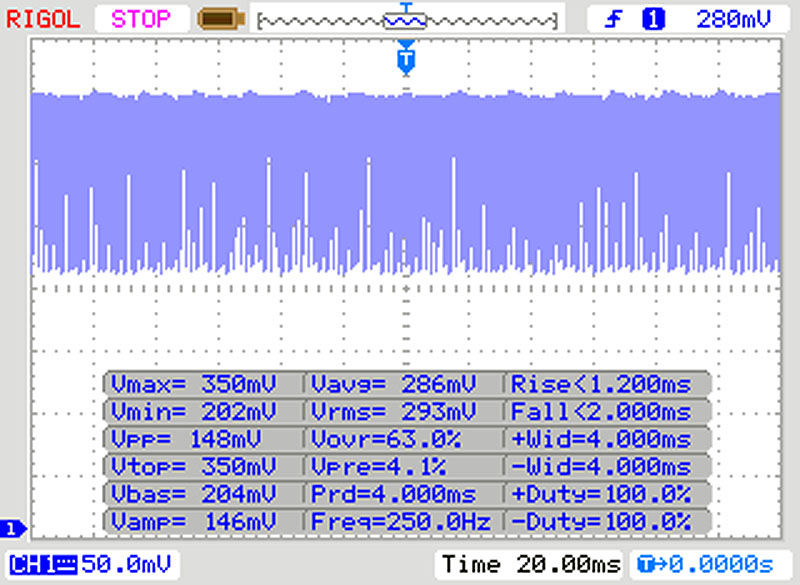 |
The display backlight flickers at 250 Hz (worst case, e.g., utilizing PWM) Flickering detected at a brightness setting of 80 % and below. There should be no flickering or PWM above this brightness setting. The frequency of 250 Hz is relatively low, so sensitive users will likely notice flickering and experience eyestrain at the stated brightness setting and below. In comparison: 52 % of all tested devices do not use PWM to dim the display. If PWM was detected, an average of 7794 (minimum: 5 - maximum: 343500) Hz was measured. | |||

Performance, Emissions and Battery life
Performance, Emissions and Battery lifeThe heart of the new Slim 15 is an Intel Core i5-10210U from Intel's Comet-Lake-U generation. The new SoC has four cores with a clock rate between 1.6 - 4.2 GHz. In our case, according to HWInfo, we can only maintain a maximum clock frequency of 3.9 GHz. In our last configuration of the Schenker Slim 15 series, an Intel Core i5-8265U was installed. Whether there are differences in performance and how serious they are, we want to analyze on the basis of various benchmarks.
In the Cinebench R15, our test candidate scores 744 points. In the first run of the benchmark, the CPU calculates with 3.4 - 3.7 GHz. In the second attempt, the average speed is only 2.4 - 2.7 GHz, which is why the score drops to 602. In the further course, the willingness to perform decreases further, so that only a score of about 540 points is achieved. This result is slightly above that of the predecessor model of the Slim 15 with Intel Core i5-8265U. However, opponents like the Asus Zenbook 14 (i5-8265U) perform somewhat better.
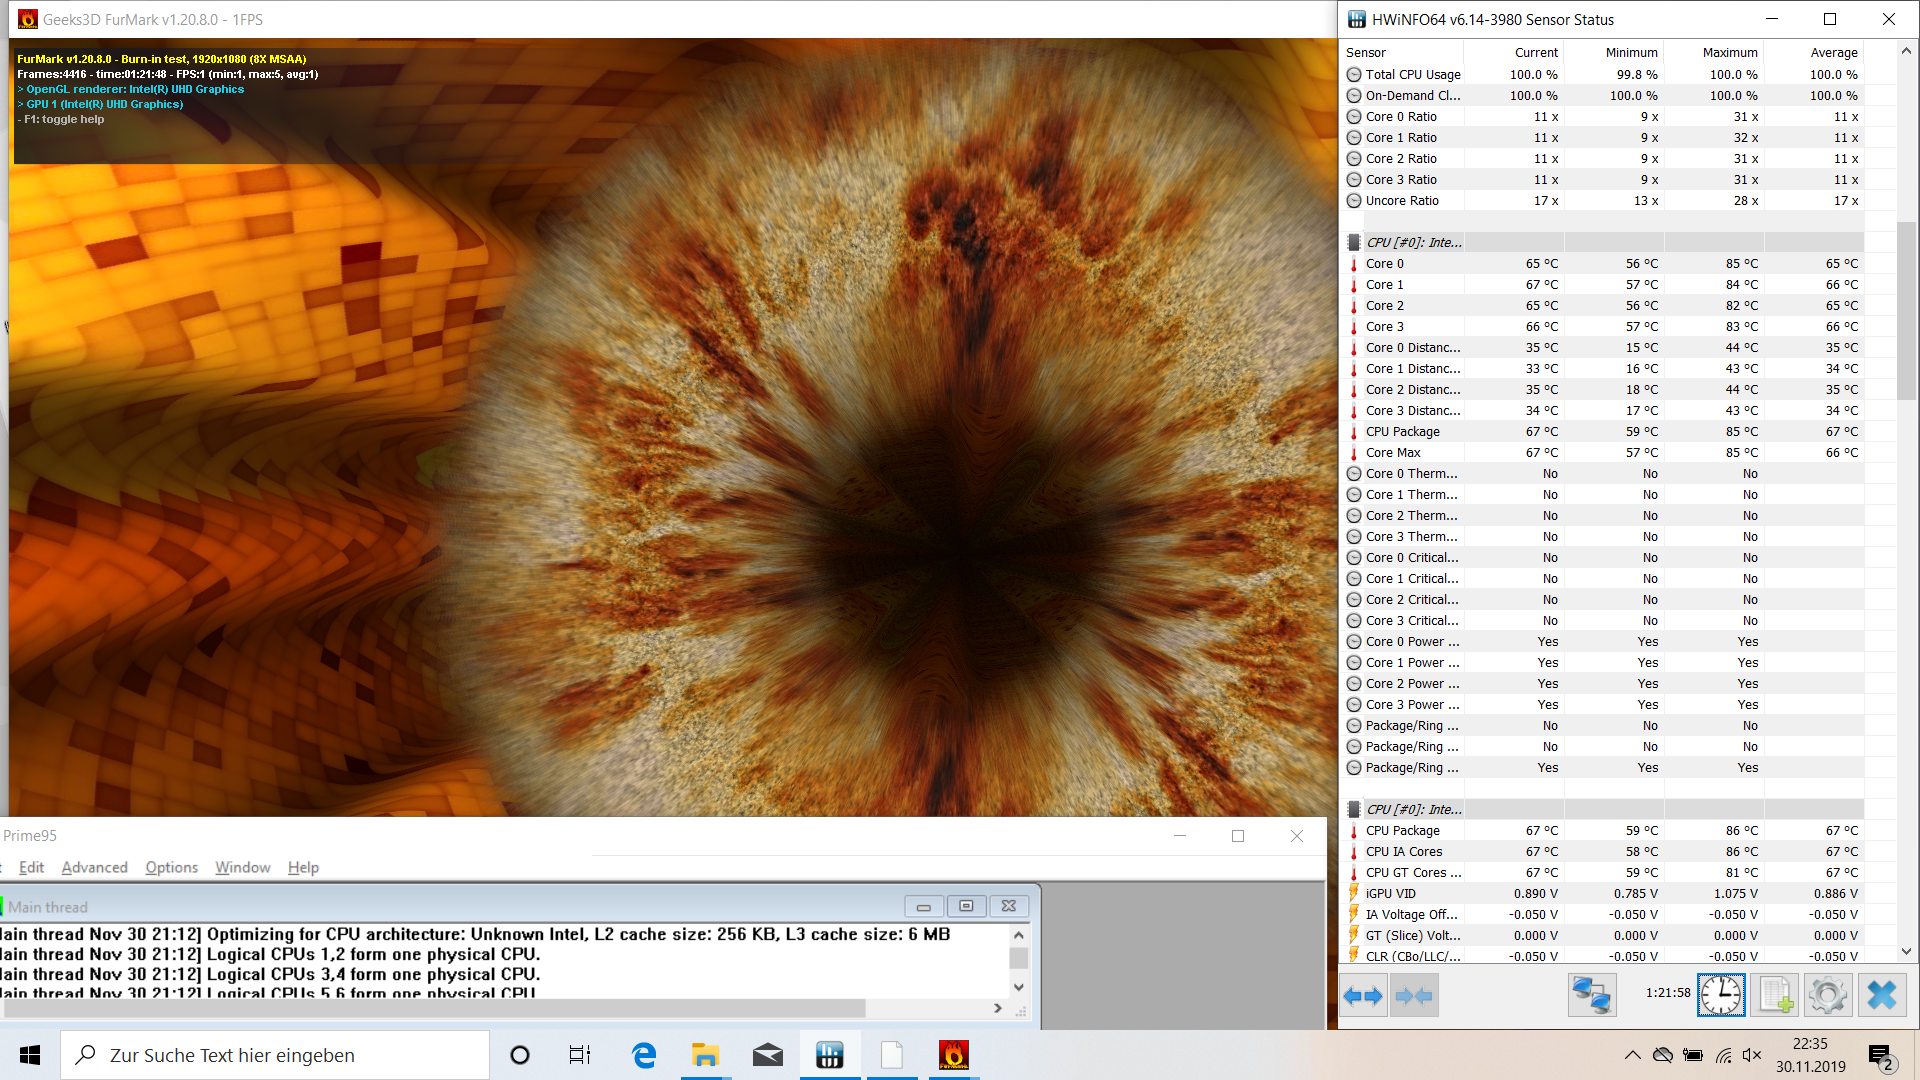
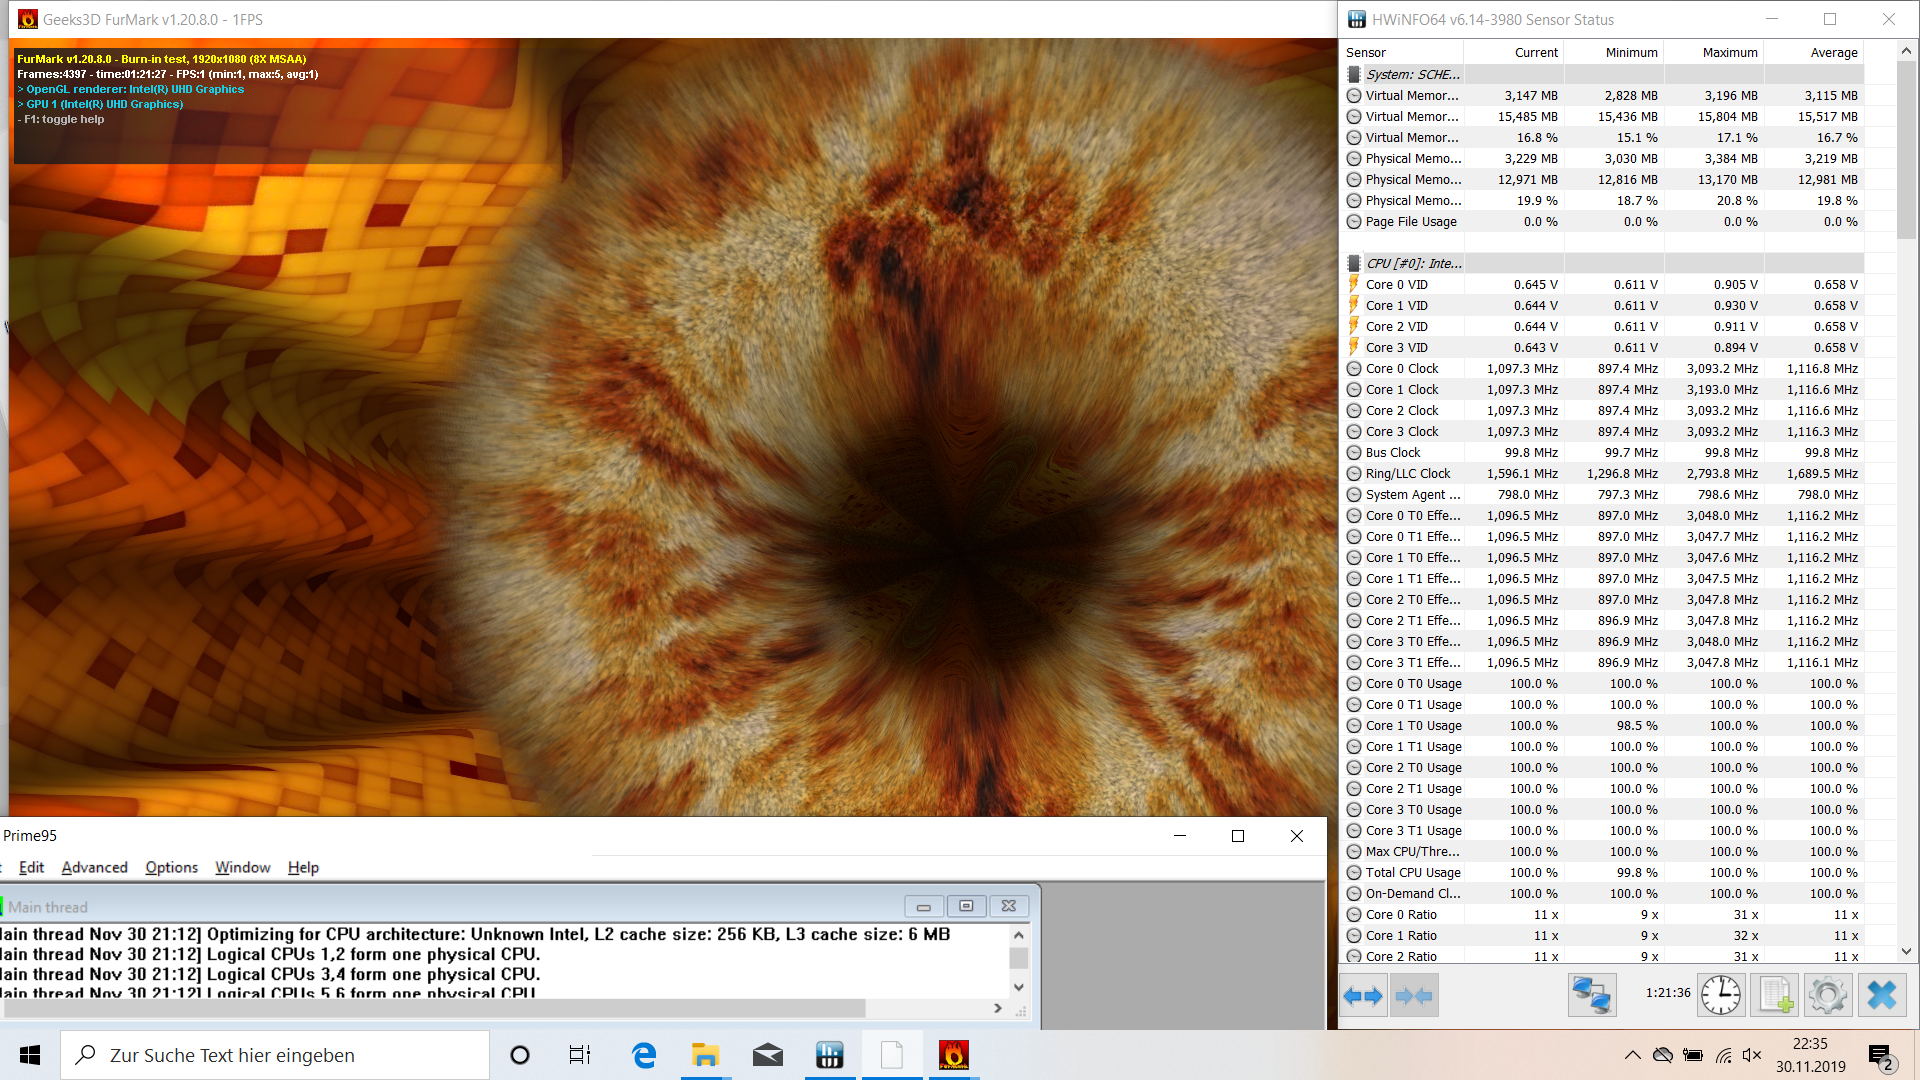
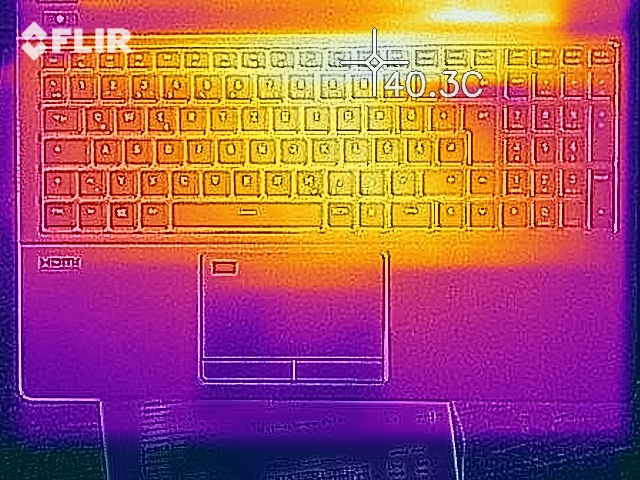
The reason for the result are the temperatures inside: The test device barely warms up externally. Even under load conditions, the Schenker laptop stays below 40 °C almost everywhere. This can only be achieved if the heat development of the CPU is kept low. Even after over an hour in the load scenario, we notice that the processor doesn't get warmer than 65 °C on average. At this load, the processor clock drops to only 1.1 GHz.
Overall, the system performance is satisfactory. In combination with the fast PCIe SSD memory, the test device leaves a sovereign character.
We can also positively state that the battery capacity has increased from 36 Wh to 54.5 Wh. As a result, the Schenker Slim 15 now lasts around six hours while surfing the World Wide Web. Compared to the competition, however, we also see that there is even more air upwards. One explanation is the required power consumption. Overall, the current Schenker notebook was thirstier than its predecessor.
Cinebench R15 Loop
| Schenker Slim 15 L19 Samsung SSD 970 EVO Plus 500GB | Schenker Slim 15-RE-E19 Samsung SSD 970 EVO Plus 500GB | Lenovo ThinkPad L590-20Q70019GE Toshiba XG6 KXG6AZNV512G | Dell Inspiron 15 5000 5584 Toshiba BG3 KBG30ZMS512G | Average Samsung SSD 970 EVO Plus 500GB | Average of class Office | |
|---|---|---|---|---|---|---|
| CrystalDiskMark 5.2 / 6 | -4% | -27% | -37% | 5% | 35% | |
| Write 4K (MB/s) | 188.7 | 187.2 -1% | 115.3 -39% | 115.3 -39% | 159.2 ? -16% | 151.4 ? -20% |
| Read 4K (MB/s) | 51.9 | 51.8 0% | 43.34 -16% | 51.8 0% | 48.5 ? -7% | 72.8 ? 40% |
| Write Seq (MB/s) | 1566 | 1438 -8% | 1014 -35% | 795 -49% | 2114 ? 35% | 2558 ? 63% |
| Read Seq (MB/s) | 1452 | 1347 -7% | 1481 2% | 1162 -20% | 2044 ? 41% | 3237 ? 123% |
| Write 4K Q32T1 (MB/s) | 444 | 396.7 -11% | 495.4 12% | 247.6 -44% | 435 ? -2% | 424 ? -5% |
| Read 4K Q32T1 (MB/s) | 566 | 534 -6% | 332.6 -41% | 488.1 -14% | 508 ? -10% | 509 ? -10% |
| Write Seq Q32T1 (MB/s) | 3279 | 3280 0% | 1654 -50% | 852 -74% | 3238 ? -1% | 3999 ? 22% |
| Read Seq Q32T1 (MB/s) | 3558 | 3556 0% | 1746 -51% | 1600 -55% | 3499 ? -2% | 5962 ? 68% |
| Write 4K Q8T8 (MB/s) | 1033 | 2067 ? | 901 ? | |||
| Read 4K Q8T8 (MB/s) | 892 | 1064 ? | 1317 ? |
| 3DMark - 1920x1080 Fire Strike Graphics | |
| Average of class Office (736 - 21871, n=72, last 2 years) | |
| Schenker Slim 15 L19 | |
| Dell Inspiron 15 5000 5584 | |
| Average Intel UHD Graphics 620 (557 - 2608, n=213) | |
| Lenovo ThinkPad L590-20Q70019GE | |
Emissions
Noise level
| Idle |
| 30.6 / 30.6 / 30.6 dB(A) |
| Load |
| 40.5 / 42.7 dB(A) |
 | ||
30 dB silent 40 dB(A) audible 50 dB(A) loud |
||
min: | ||
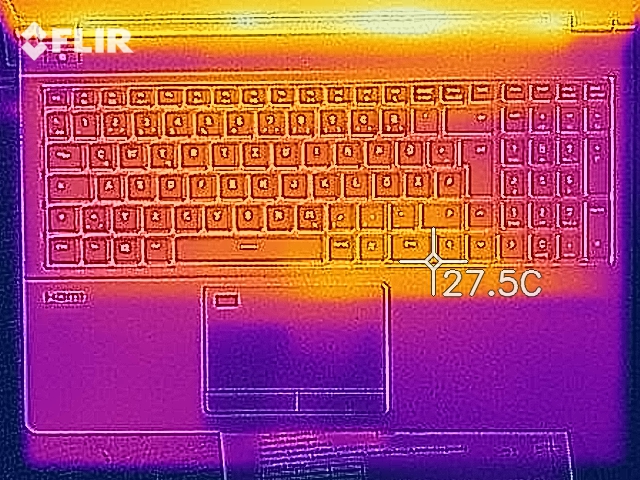
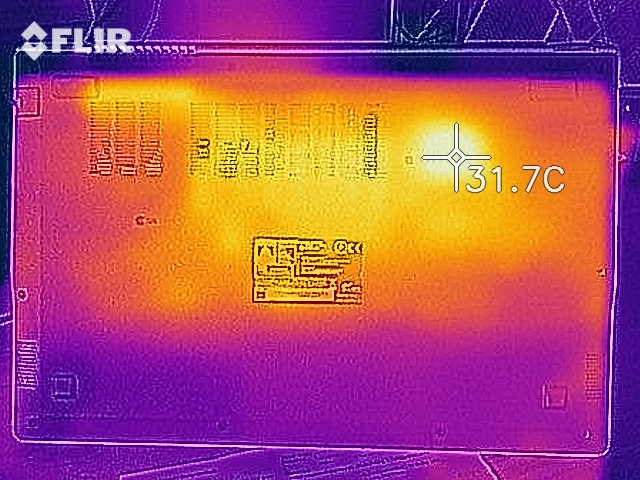
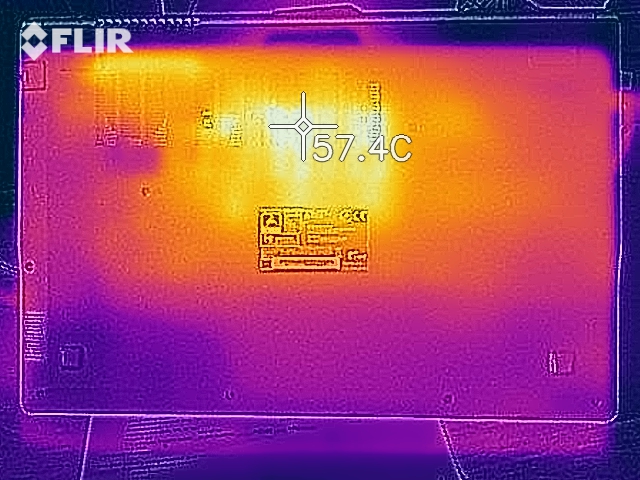
Temperature
(+) The maximum temperature on the upper side is 37 °C / 99 F, compared to the average of 34.3 °C / 94 F, ranging from 21.2 to 62.5 °C for the class Office.
(±) The bottom heats up to a maximum of 43.1 °C / 110 F, compared to the average of 36.8 °C / 98 F
(+) In idle usage, the average temperature for the upper side is 24.1 °C / 75 F, compared to the device average of 29.5 °C / 85 F.
(+) The palmrests and touchpad are cooler than skin temperature with a maximum of 25.1 °C / 77.2 F and are therefore cool to the touch.
(+) The average temperature of the palmrest area of similar devices was 27.5 °C / 81.5 F (+2.4 °C / 4.3 F).
Speakers
Schenker Slim 15 L19 audio analysis
(-) | not very loud speakers (70.7 dB)
Bass 100 - 315 Hz
(-) | nearly no bass - on average 30.1% lower than median
(+) | bass is linear (6.4% delta to prev. frequency)
Mids 400 - 2000 Hz
(±) | higher mids - on average 8.7% higher than median
(±) | linearity of mids is average (11.6% delta to prev. frequency)
Highs 2 - 16 kHz
(+) | balanced highs - only 4.6% away from median
(+) | highs are linear (6.5% delta to prev. frequency)
Overall 100 - 16.000 Hz
(-) | overall sound is not linear (32.4% difference to median)
Compared to same class
» 95% of all tested devices in this class were better, 1% similar, 4% worse
» The best had a delta of 7%, average was 21%, worst was 53%
Compared to all devices tested
» 91% of all tested devices were better, 1% similar, 7% worse
» The best had a delta of 4%, average was 24%, worst was 134%
Apple MacBook 12 (Early 2016) 1.1 GHz audio analysis
(+) | speakers can play relatively loud (83.6 dB)
Bass 100 - 315 Hz
(±) | reduced bass - on average 11.3% lower than median
(±) | linearity of bass is average (14.2% delta to prev. frequency)
Mids 400 - 2000 Hz
(+) | balanced mids - only 2.4% away from median
(+) | mids are linear (5.5% delta to prev. frequency)
Highs 2 - 16 kHz
(+) | balanced highs - only 2% away from median
(+) | highs are linear (4.5% delta to prev. frequency)
Overall 100 - 16.000 Hz
(+) | overall sound is linear (10.2% difference to median)
Compared to same class
» 7% of all tested devices in this class were better, 2% similar, 91% worse
» The best had a delta of 5%, average was 18%, worst was 53%
Compared to all devices tested
» 5% of all tested devices were better, 1% similar, 94% worse
» The best had a delta of 4%, average was 24%, worst was 134%
Schenker Slim 15-RE-E19 audio analysis
(-) | not very loud speakers (65.9 dB)
Bass 100 - 315 Hz
(-) | nearly no bass - on average 25.3% lower than median
(±) | linearity of bass is average (8.1% delta to prev. frequency)
Mids 400 - 2000 Hz
(±) | higher mids - on average 9.2% higher than median
(±) | linearity of mids is average (12.3% delta to prev. frequency)
Highs 2 - 16 kHz
(+) | balanced highs - only 4.4% away from median
(±) | linearity of highs is average (8.1% delta to prev. frequency)
Overall 100 - 16.000 Hz
(-) | overall sound is not linear (35.5% difference to median)
Compared to same class
» 97% of all tested devices in this class were better, 1% similar, 2% worse
» The best had a delta of 7%, average was 21%, worst was 53%
Compared to all devices tested
» 94% of all tested devices were better, 1% similar, 6% worse
» The best had a delta of 4%, average was 24%, worst was 134%
Lenovo ThinkPad L590-20Q70019GE audio analysis
(-) | not very loud speakers (68 dB)
Bass 100 - 315 Hz
(±) | reduced bass - on average 14.1% lower than median
(±) | linearity of bass is average (13% delta to prev. frequency)
Mids 400 - 2000 Hz
(±) | higher mids - on average 7.4% higher than median
(±) | linearity of mids is average (10% delta to prev. frequency)
Highs 2 - 16 kHz
(+) | balanced highs - only 1.9% away from median
(±) | linearity of highs is average (10.9% delta to prev. frequency)
Overall 100 - 16.000 Hz
(±) | linearity of overall sound is average (27.5% difference to median)
Compared to same class
» 86% of all tested devices in this class were better, 4% similar, 10% worse
» The best had a delta of 7%, average was 21%, worst was 53%
Compared to all devices tested
» 84% of all tested devices were better, 3% similar, 13% worse
» The best had a delta of 4%, average was 24%, worst was 134%
Power Consumption
| Off / Standby | |
| Idle | |
| Load |
|
Key:
min: | |
Bttery Life
| Battery Runtime - WiFi Websurfing | |
| Average of class Office (3.83 - 31.5, n=74, last 2 years) | |
| Lenovo ThinkPad L590-20Q70019GE | |
| Schenker Slim 15 L19 | |
| HP 250 G7 6HM85ES | |
| Dell Inspiron 15 5000 5584 | |
Pros
Cons
Verdict
Narrow, chic and fast - with air up. With these words the Slim 15 can be summarized in its newest version. The exterior is again adorned with a mixture of plastic and aluminium elements. The workmanship is satisfactory throughout. What is new in our current test configuration is the colour-backed keyboard illumination, the fingerprint reader and the fast WLAN module, which in practice transmits far more than one gigabit per second.
The input devices and the display were already tested for their suitability in the Red-Edtion. There were no serious differences here. Only the display in our version had a somewhat low PWM frequency. The main focus of the Schenker test device is the brand new Intel Core i5-10210U. The economical quad-core currently can't prove its performance due to a strict heat/clock ratio. But the test candidate doesn't get noticeably hot for any situation. The battery life is also rather mediocre, which we can unfortunately only date to around six hours.
Nevertheless, the Schenker Slim 15 is a fast and loyal companion in the office area.
This is not least due to the large connectivity, a matt IPS panel and an extremely fast PCIe fixed memory.
In our configuration, the Slim 15 is available in the manufacturer's own shop for around 1,090 euros.
Schenker Slim 15 L19
- 12/03/2019 v7 (old)
Nino Ricchizzi
Price comparison

