ASUS ZenBook 14 UX433FA (Core i5-8265U, SSD, FHD) Laptop Review
You may recognise the ASUS ZenBook 14 UX433FA from our review of its sibling, the UX433FA-A6076T, which we published at the end of last year. While ASUS equips the latter with an Intel Core i7-8565U processor, the UX433FA-A6061T has a Core i5-8265U processor instead. Both CPUs are from Intel’s Whiskey Lake generation, but the Core i5-8265U has lower clock speeds and a 2 MB smaller Level 3 cache.
We have chosen to compare the UX433FA-A6061T against other thin and light laptops that cost around 1,000 Euros (~$1,140). Among our comparison devices are the Acer Swift 3 SF314-55, the Huawei MateBook D 14 W50F and the Tuxedo InfinityBook Pro 14. Please keep in mind that Huawei launched the MateBook D at around 1,300 Euros (~$1,482), while the InfinityBook Pro 14 costs just 699 Euros (~$797), which is approximately 30% cheaper than the UX433FA.
The UX433FA-A6061T and UX433FA-A6076T are otherwise identical apart from their CPUs. Hence, we shall not be covering the case, the connectivity, the input devices, or the speakers in our UX433FA-A6061T review. We shall be giving just an overview of the display too as it only differs slightly from the one in our UX433FA-A6076T review unit. Please see our UX433FA-A6076T review for our thoughts on the areas that we are not covering in this review.


| SD Card Reader | |
| average JPG Copy Test (av. of 3 runs) | |
| Average of class Subnotebook (23.7 - 188, n=9, last 2 years) | |
| Asus Zenbook 14 UX433FA-A6018T (Toshiba Exceria Pro M501 microSDXC 64GB) | |
| Asus ZenBook 14 UX433FA (Toshiba Exceria Pro M501 microSDXC) | |
| Acer Swift 3 SF314-55-31N8 (Toshiba Exceria Pro SDXC 64 GB UHS-II) | |
| maximum AS SSD Seq Read Test (1GB) | |
| Average of class Subnotebook (24.9 - 195, n=8, last 2 years) | |
| Asus ZenBook 14 UX433FA (Toshiba Exceria Pro M501 microSDXC) | |
| Acer Swift 3 SF314-55-31N8 (Toshiba Exceria Pro SDXC 64 GB UHS-II) | |
| Asus Zenbook 14 UX433FA-A6018T (Toshiba Exceria Pro M501 microSDXC 64GB) | |
Display
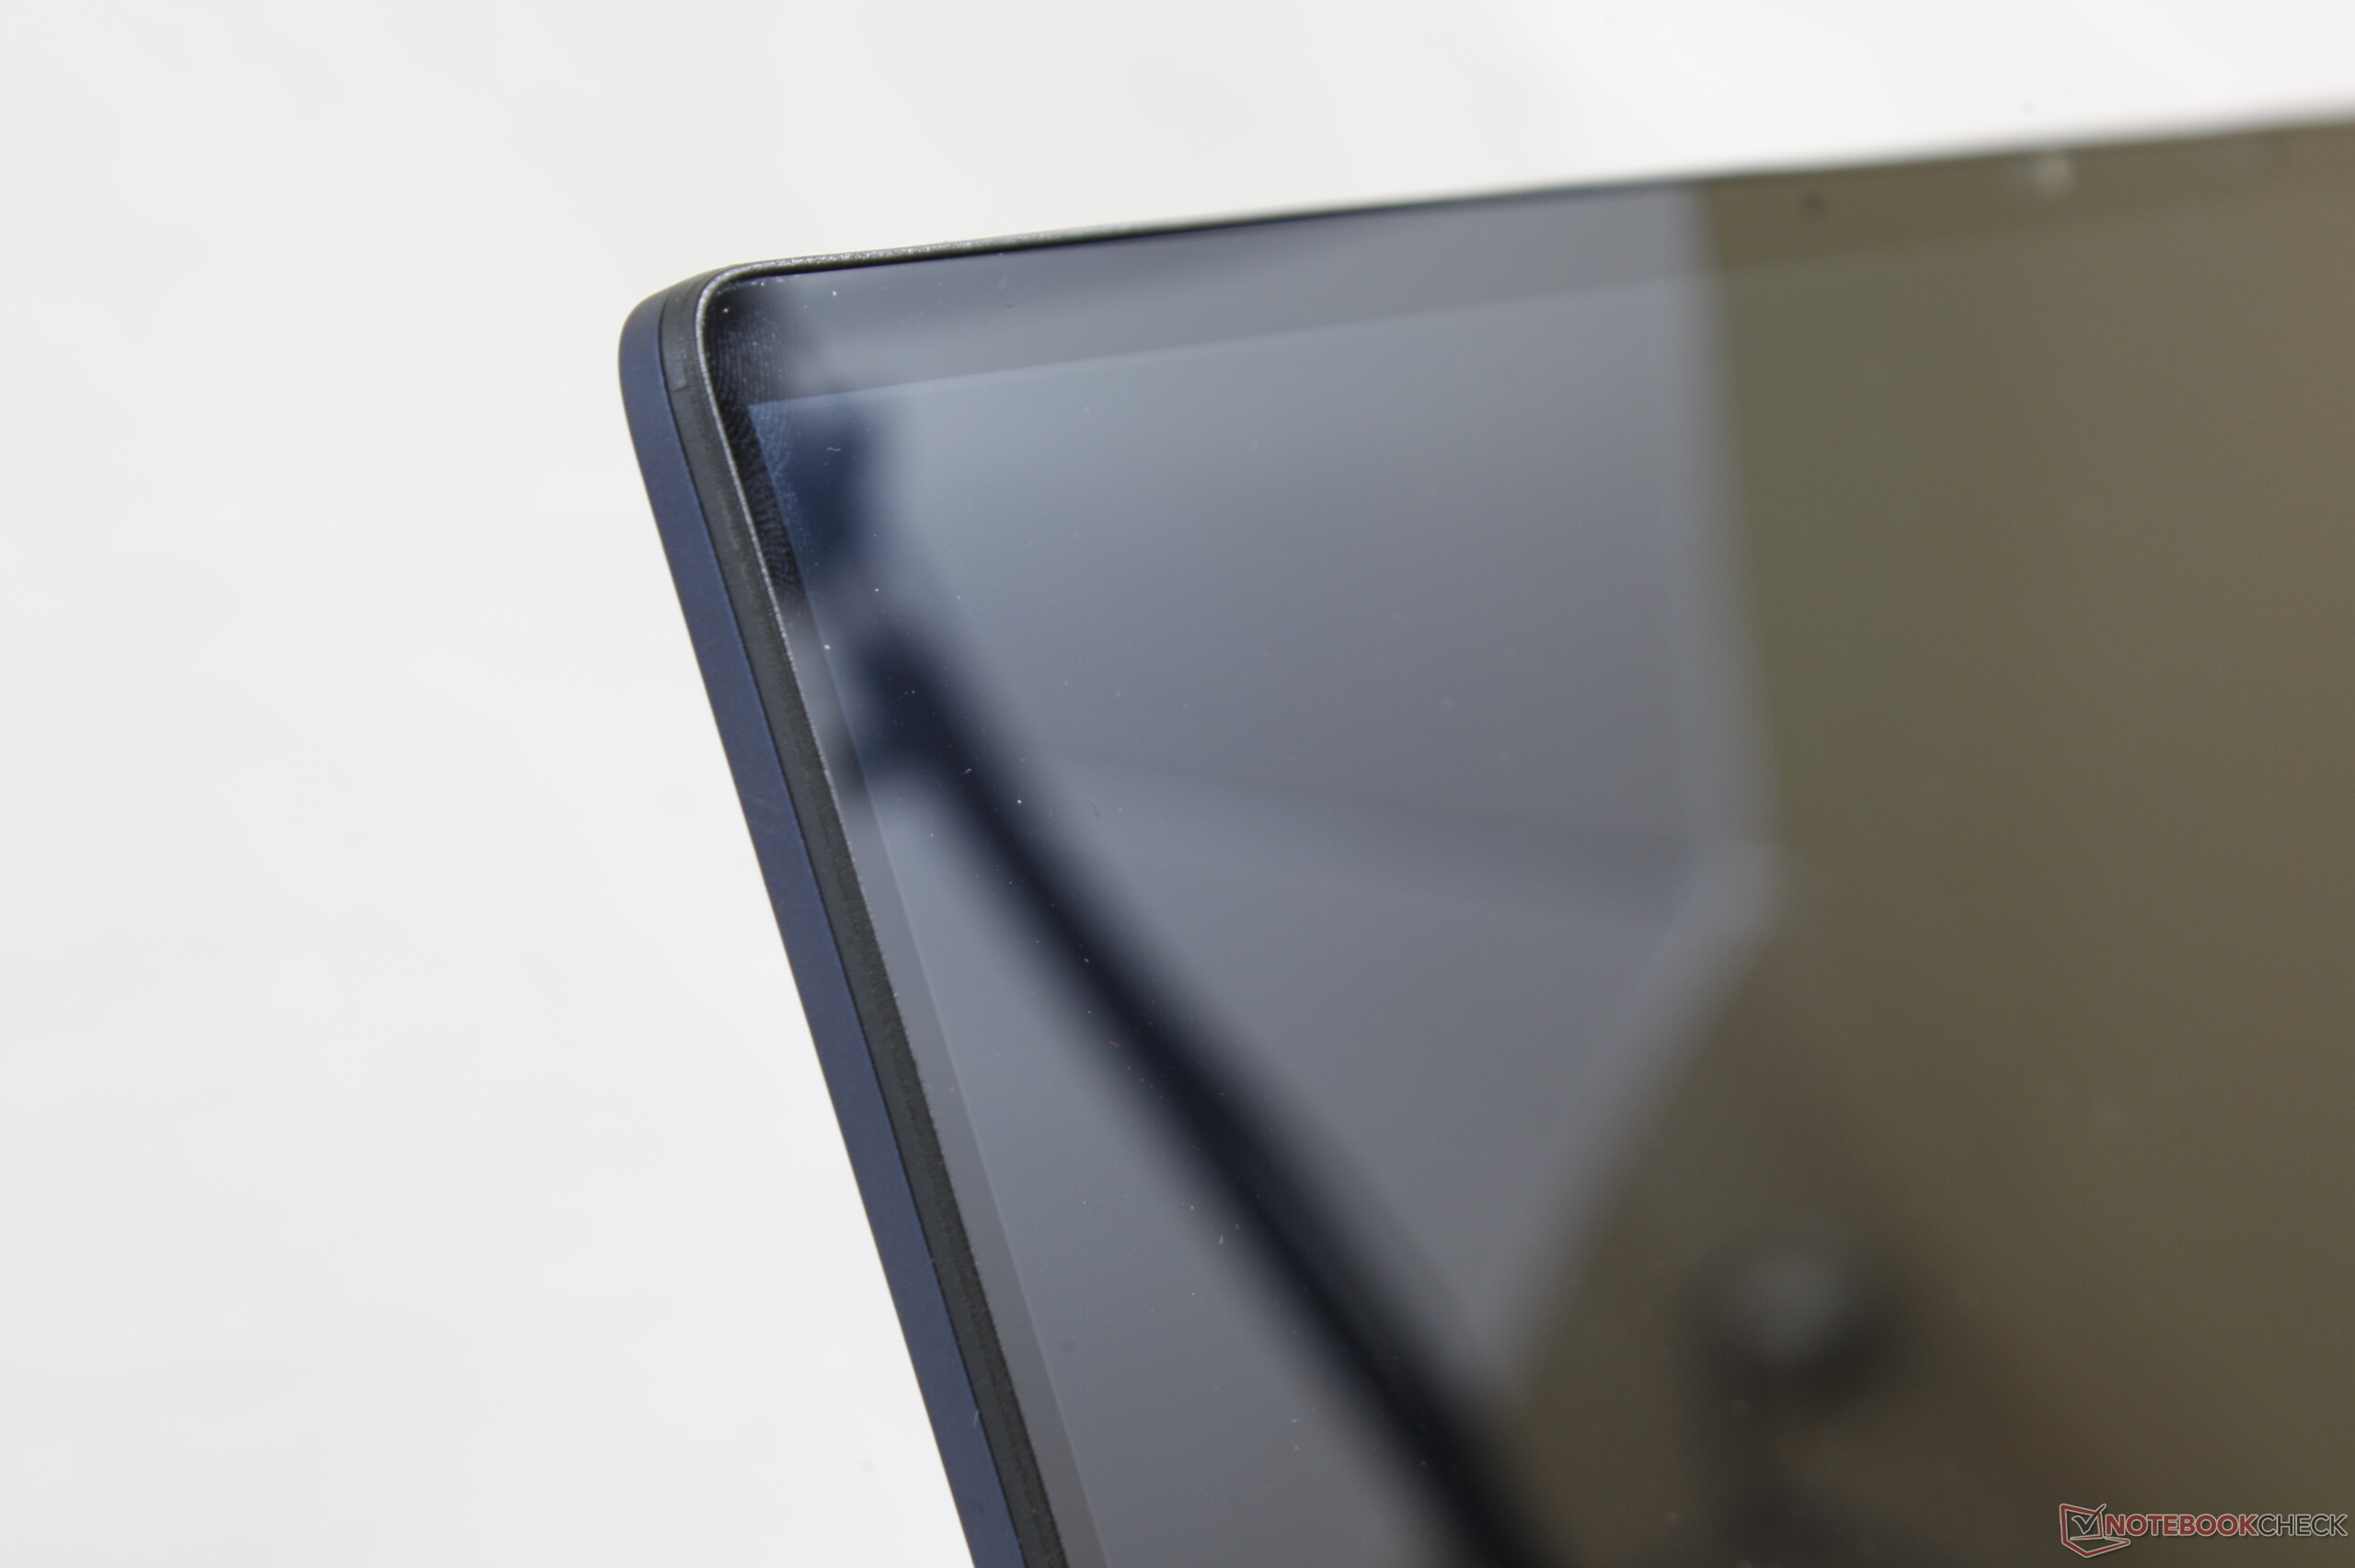
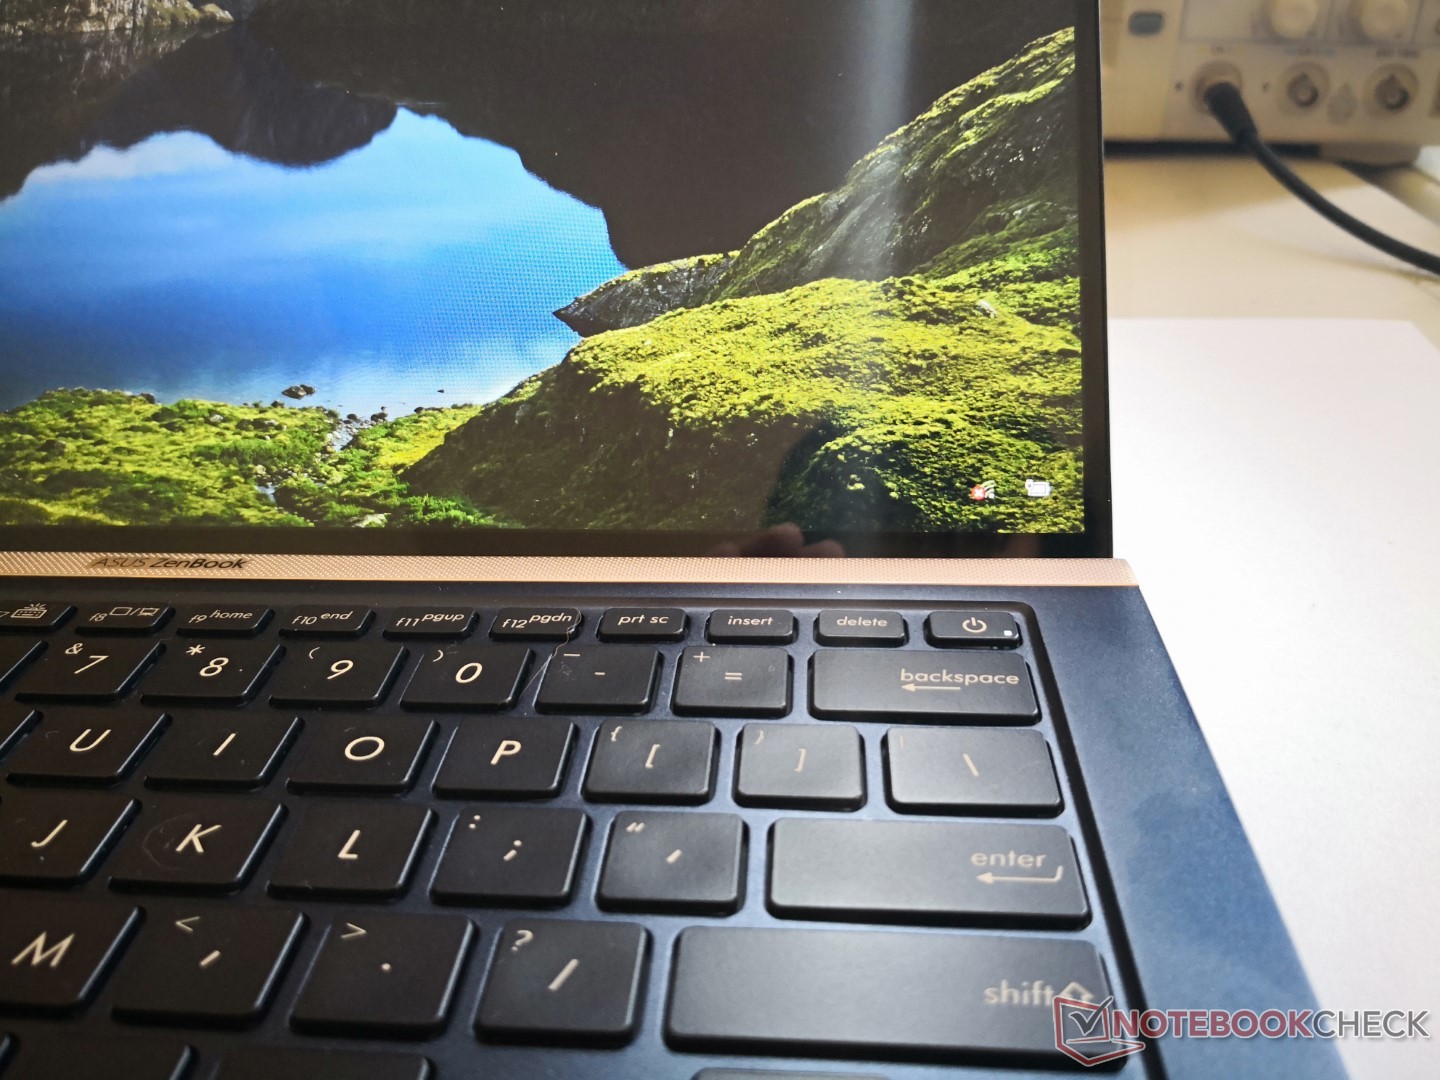
The UX433FA-A6061T has the same 14-inch IPS display as the UX433FA-A6076T. The screen operates natively at 1920x1080 and has a highly reflective finish. Our test unit achieved an average maximum brightness of 282 cd/m², according to X-Rite i1Pro 2, which is 10% darker than the display in our UX433FA-A6076T review device. We suspect that ASUS has partnered with multiple display manufacturers to build its UX433F range as the screens in the UX433FA-A6076T and UX433FA-A6061T have consistently different values. Please keep in mind that these displays could carry the same model number too, as no two screens have identical brightness, contrast ratios or colour accuracy.
The UX433FA-A6061T is slightly brighter than our other comparison devices though and achieved a higher contrast ratio than the UX433FA-A6076T thanks to its 45% lower black value. Generally, we expect displays at this price to achieve at least 300 cd/m² and above a 1,000:1 contrast ratio. Our test device falls just short of that first criteria, but that is mainly because the bottom third of its display is much darker than the top two-thirds.
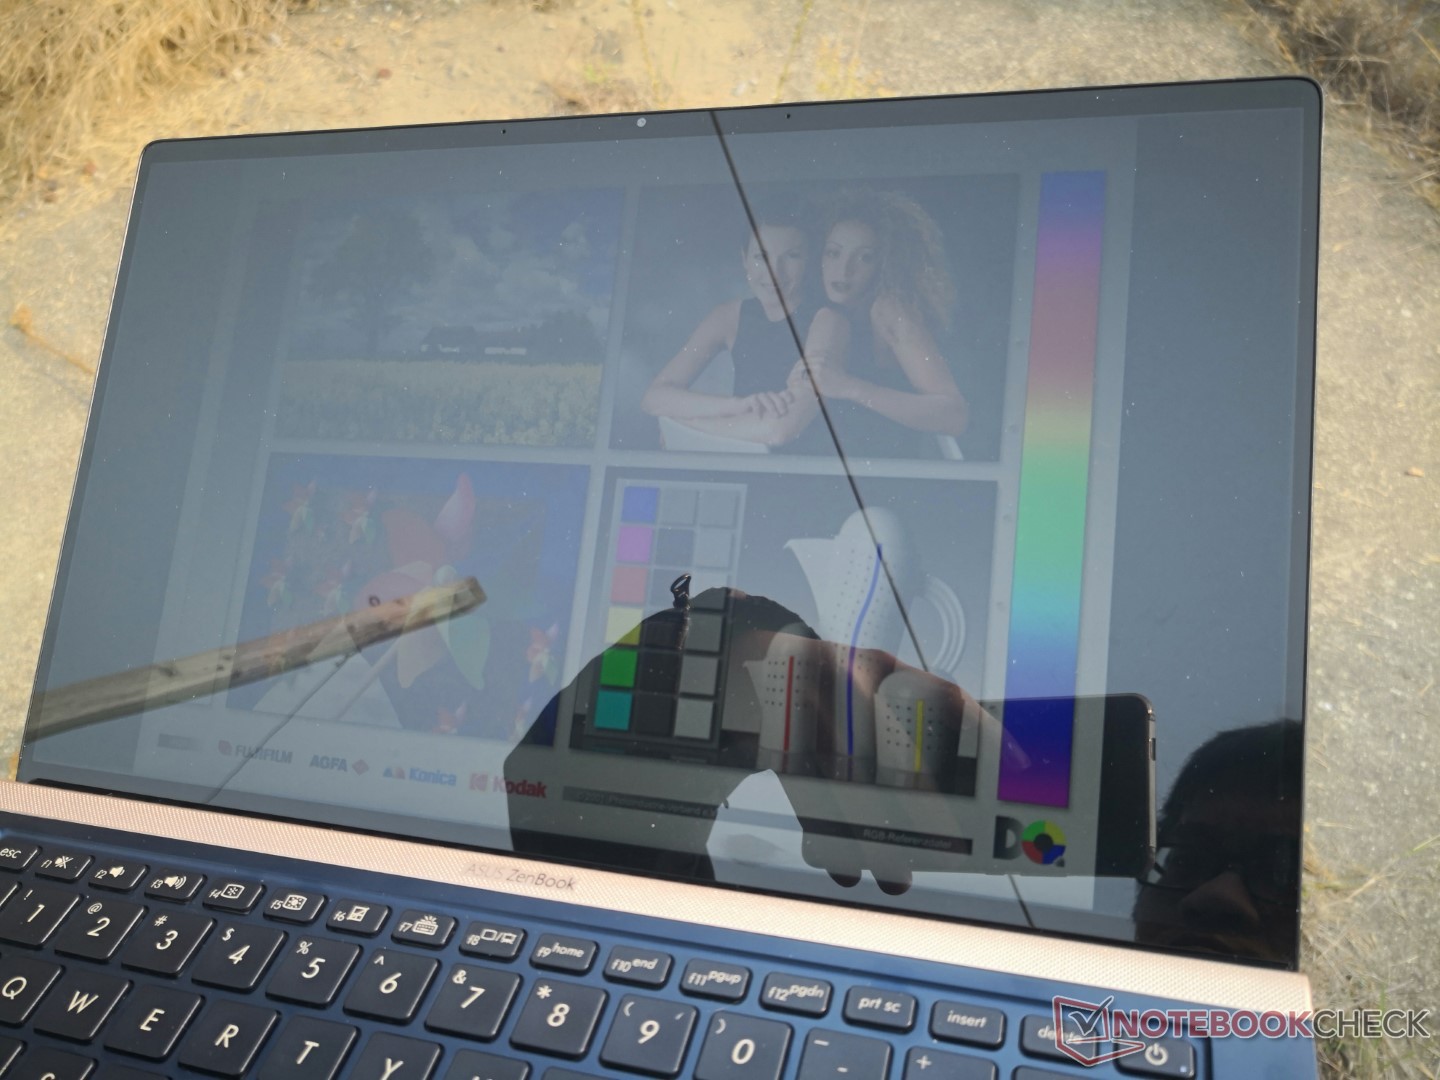
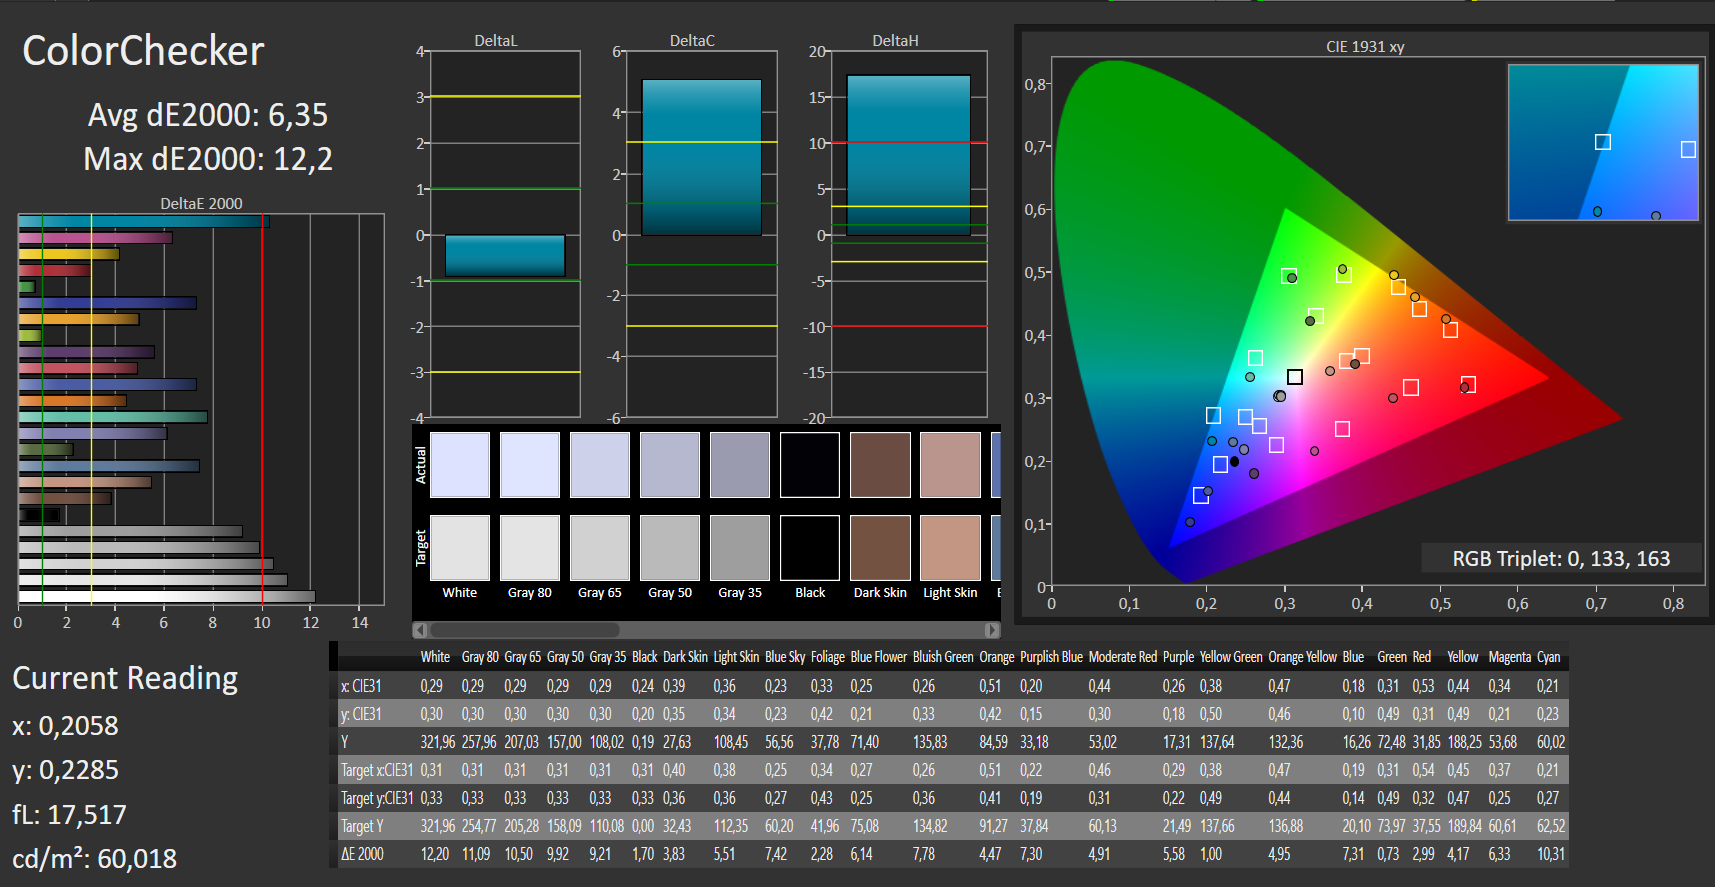
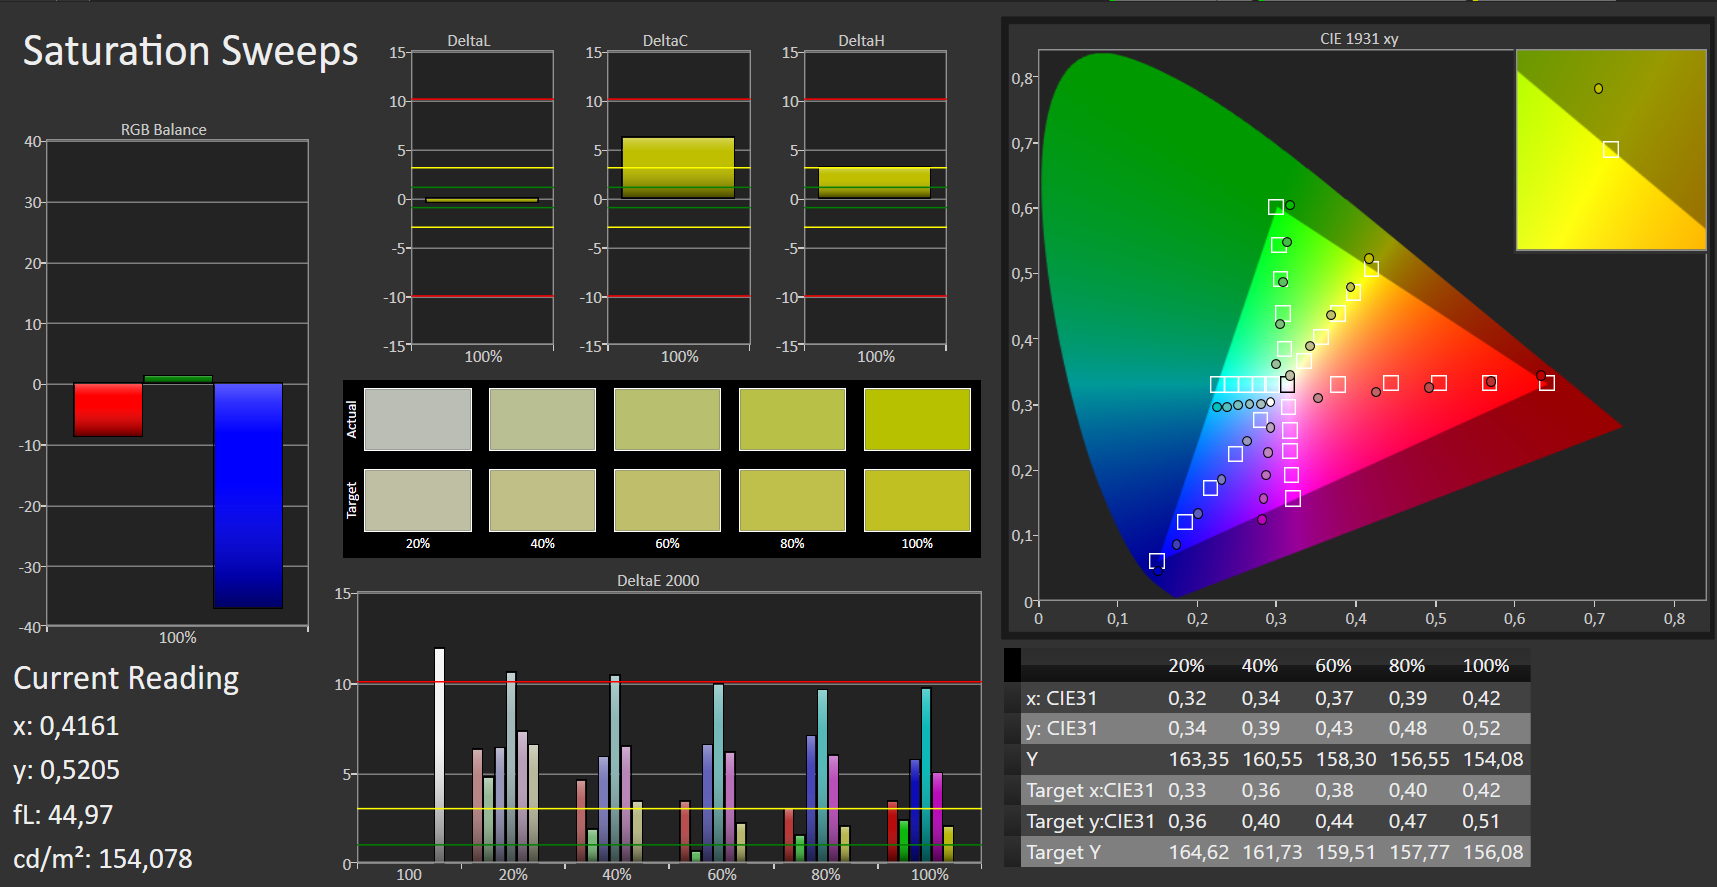
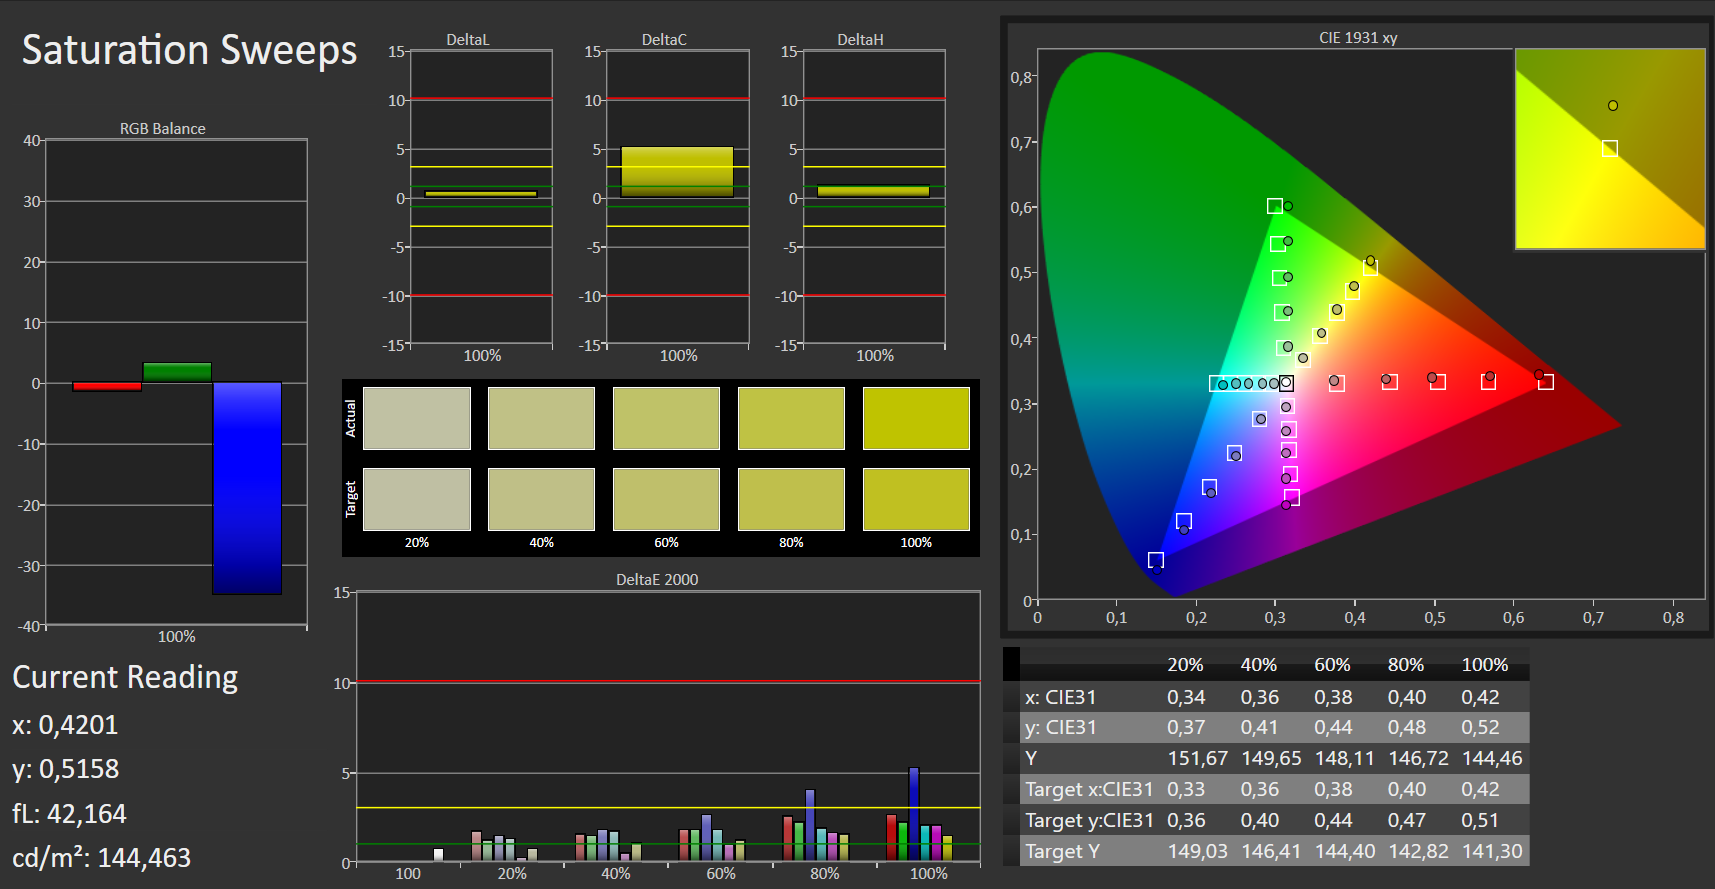
The UX433FA-A6061T also has a considerably less evenly lit display than our comparison devices, while the accuracy of its colour reproduction is on par with the UX433FA-A6076T and slightly worse than the Swift 3 SF314. Viewing angles are equally as good as the display in the UX433FA-A6076T, although the UX433FA-A6061T will be slightly harder to read outside on a sunny day because of its lower maximum luminosity.
| |||||||||||||||||||||||||
Brightness Distribution: 77 %
Center on Battery: 323 cd/m²
Contrast: 1605:1 (Black: 0.2 cd/m²)
ΔE ColorChecker Calman: 6.35 | ∀{0.5-29.43 Ø4.72}
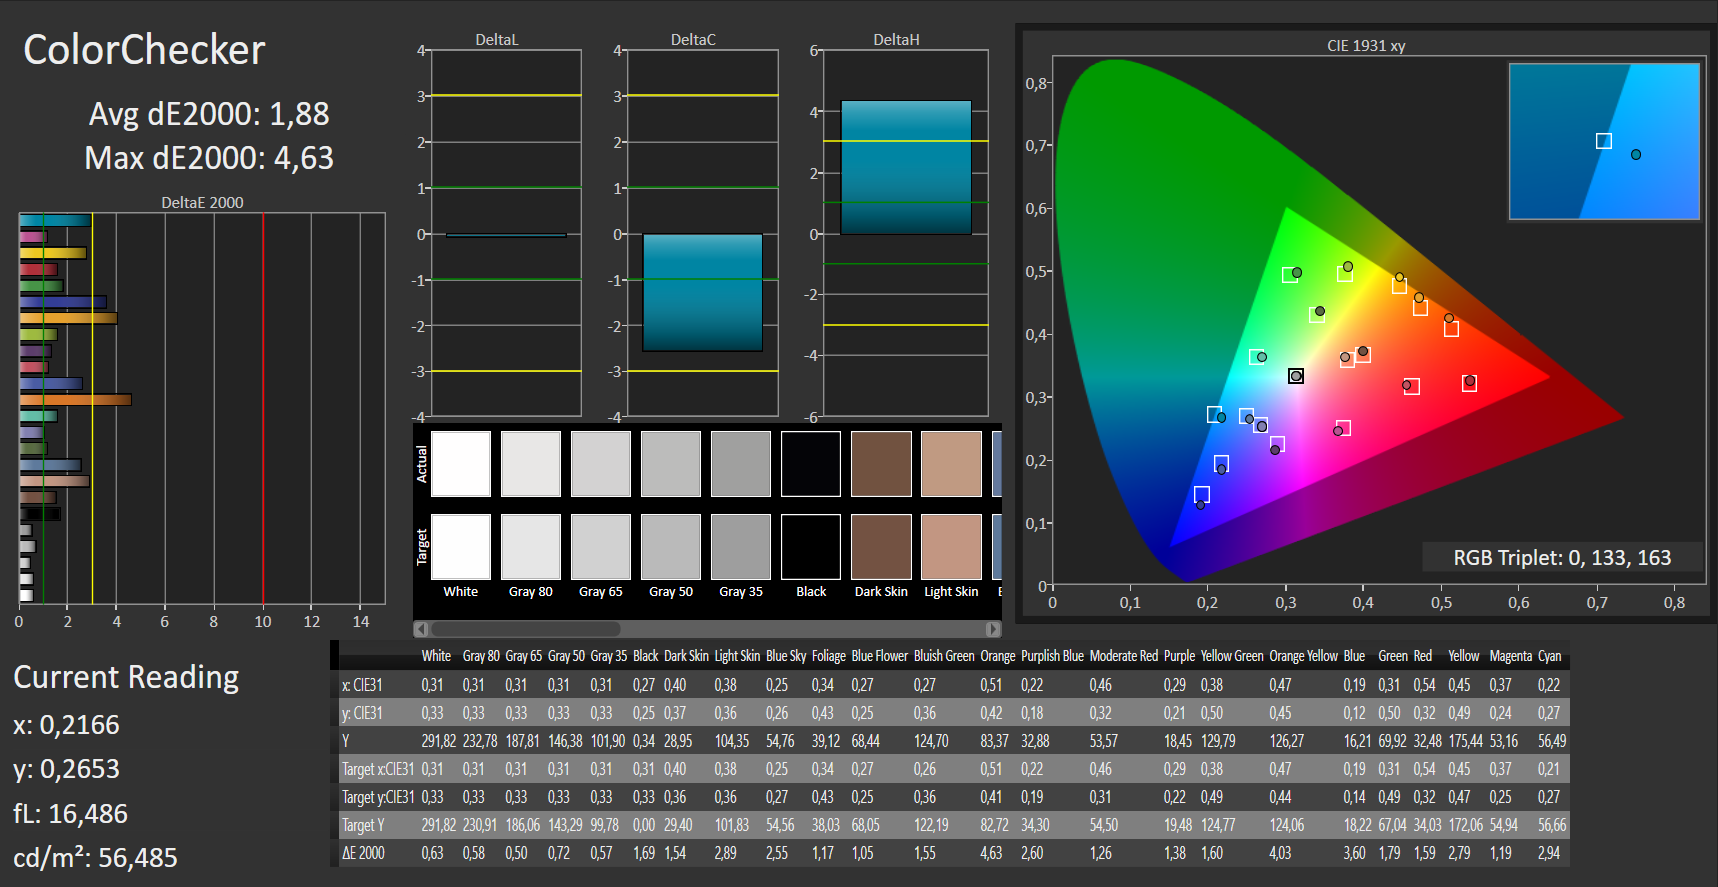
calibrated: 1.88
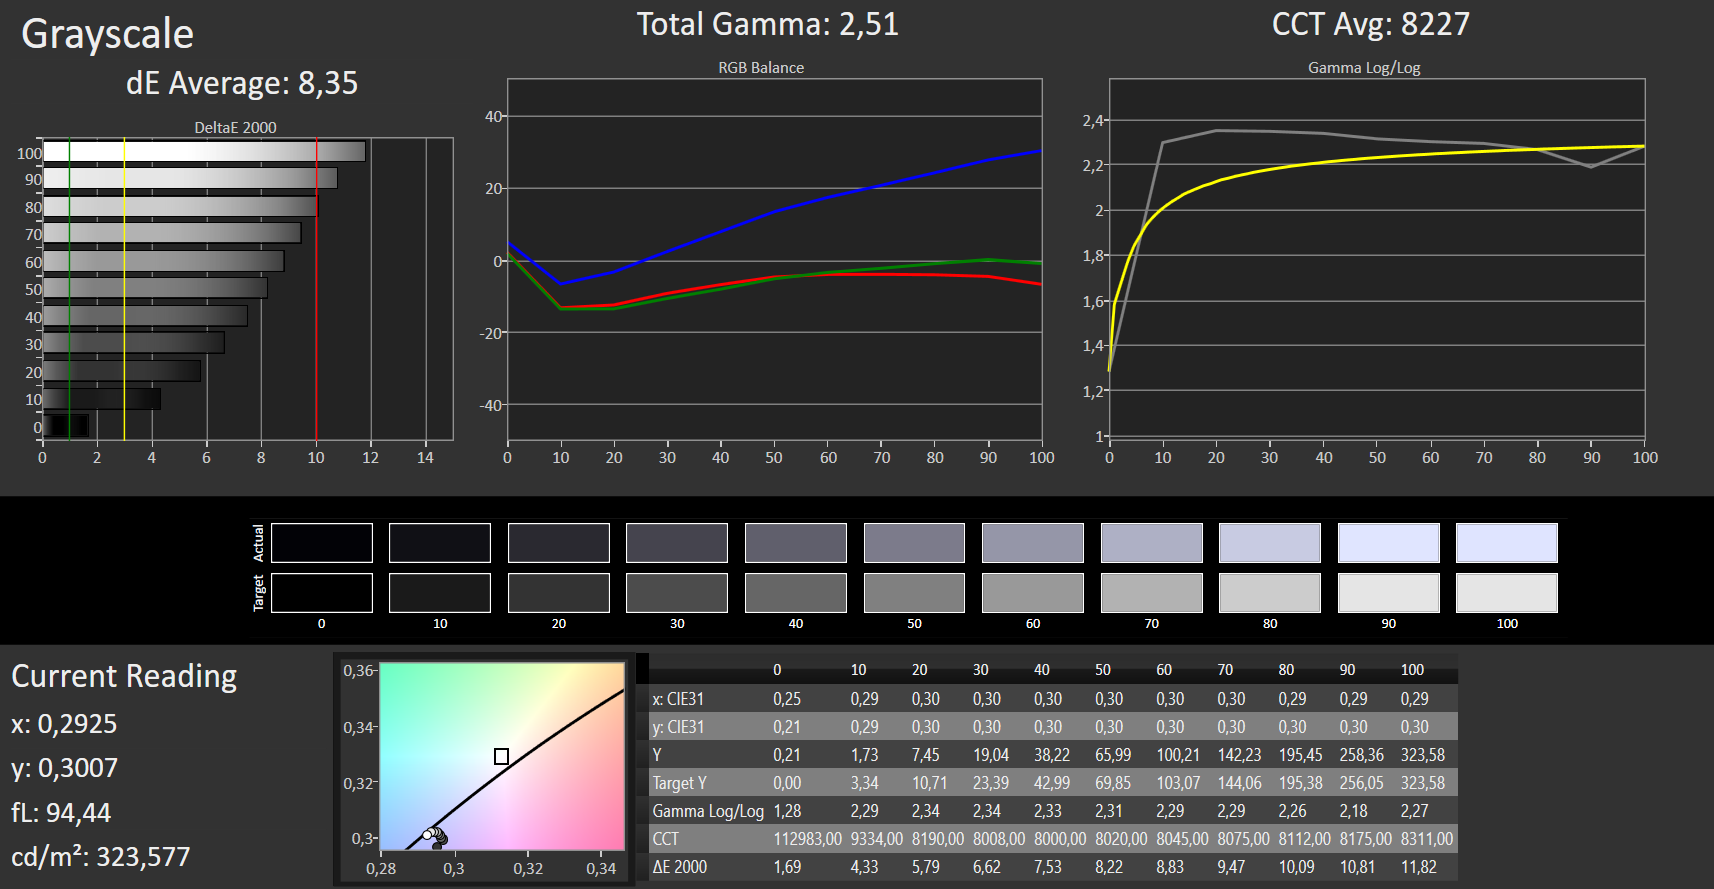
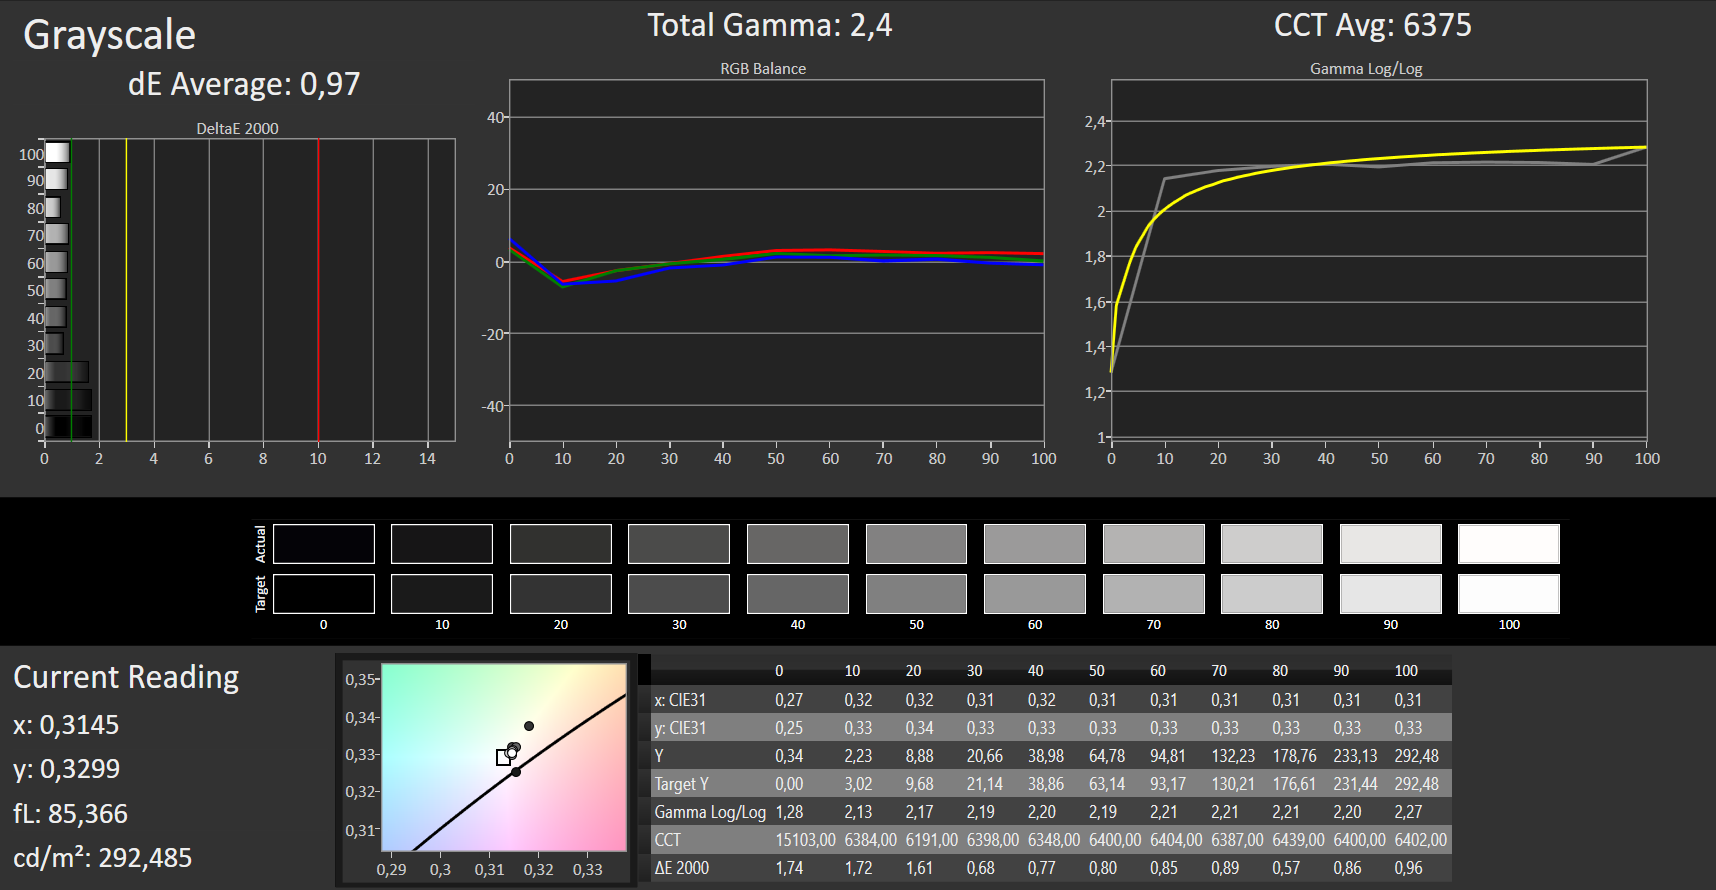
ΔE Greyscale Calman: 8.35 | ∀{0.09-98 Ø4.97}
91% sRGB (Argyll 1.6.3 3D)
59% AdobeRGB 1998 (Argyll 1.6.3 3D)
64.6% AdobeRGB 1998 (Argyll 3D)
90.9% sRGB (Argyll 3D)
63.5% Display P3 (Argyll 3D)
Gamma: 2.51
CCT: 8227 K
| Asus Zenbook 14 UX433FA-A6018T IPS, 1920x1080, 14" | Asus ZenBook 14 UX433FA IPS, 1920x1080, 14" | Acer Swift 3 SF314-55-31N8 IPS, 1920x1080, 14" | Huawei MateBook D 14 W50F IPS, 1920x1080, 14" | |
|---|---|---|---|---|
| Display | 0% | 6% | -31% | |
| Display P3 Coverage (%) | 63.5 | 64.3 1% | 66.2 4% | 43.19 -32% |
| sRGB Coverage (%) | 90.9 | 89.7 -1% | 98.3 8% | 64 -30% |
| AdobeRGB 1998 Coverage (%) | 64.6 | 65.1 1% | 67.8 5% | 44.62 -31% |
| Response Times | 10% | -3% | -15% | |
| Response Time Grey 50% / Grey 80% * (ms) | 42 ? | 39.6 ? 6% | 41 ? 2% | 41 ? 2% |
| Response Time Black / White * (ms) | 28 ? | 24 ? 14% | 30 ? -7% | 37 ? -32% |
| PWM Frequency (Hz) | 25000 ? | 200 ? | ||
| Screen | -11% | 6% | -20% | |
| Brightness middle (cd/m²) | 321 | 332.8 4% | 291 -9% | 291 -9% |
| Brightness (cd/m²) | 282 | 310 10% | 276 -2% | 276 -2% |
| Brightness Distribution (%) | 77 | 87 13% | 90 17% | 85 10% |
| Black Level * (cd/m²) | 0.2 | 0.29 -45% | 0.27 -35% | 0.46 -130% |
| Contrast (:1) | 1605 | 1148 -28% | 1078 -33% | 633 -61% |
| Colorchecker dE 2000 * | 6.35 | 5.14 19% | 3.86 39% | 4.3 32% |
| Colorchecker dE 2000 max. * | 12.2 | 11.88 3% | 8.26 32% | 10.01 18% |
| Colorchecker dE 2000 calibrated * | 1.88 | 3.61 -92% | 3.18 -69% | |
| Greyscale dE 2000 * | 8.35 | 8.8 -5% | 5.33 36% | 4.21 50% |
| Gamma | 2.51 88% | 2.33 94% | 2.25 98% | 2.46 89% |
| CCT | 8227 79% | 8227 79% | 7426 88% | 6867 95% |
| Color Space (Percent of AdobeRGB 1998) (%) | 59 | 58.1 -2% | 62 5% | 41 -31% |
| Color Space (Percent of sRGB) (%) | 91 | 89.2 -2% | 98 8% | 64 -30% |
| Total Average (Program / Settings) | -0% /
-7% | 3% /
5% | -22% /
-22% |
* ... smaller is better
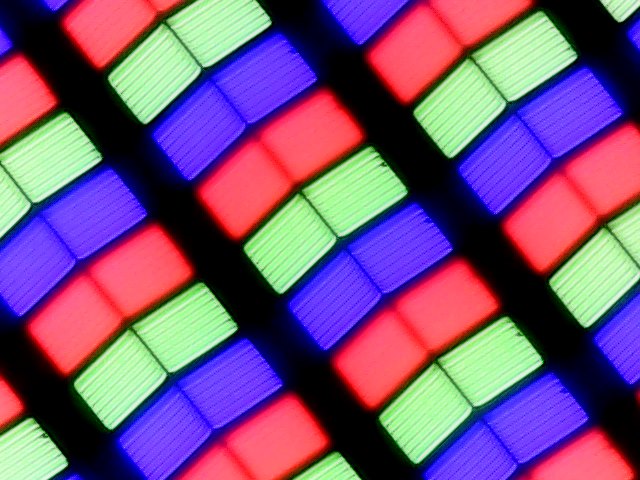
Screen Flickering / PWM (Pulse-Width Modulation)
| Screen flickering / PWM not detected | 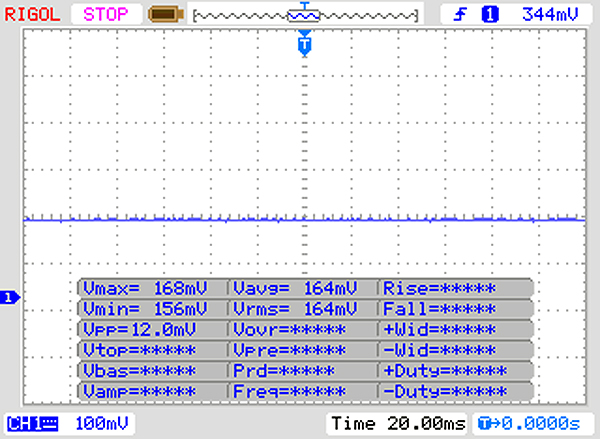 | ||
In comparison: 52 % of all tested devices do not use PWM to dim the display. If PWM was detected, an average of 7763 (minimum: 5 - maximum: 343500) Hz was measured. | |||
Display Response Times
| ↔ Response Time Black to White | ||
|---|---|---|
| 28 ms ... rise ↗ and fall ↘ combined | ↗ 16 ms rise | 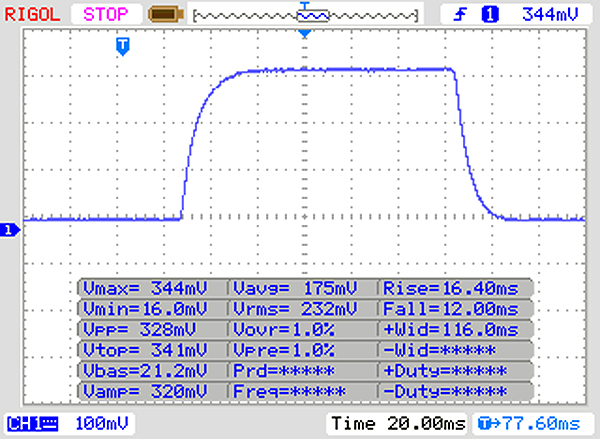 |
| ↘ 12 ms fall | ||
| The screen shows relatively slow response rates in our tests and may be too slow for gamers. In comparison, all tested devices range from 0.1 (minimum) to 240 (maximum) ms. » 71 % of all devices are better. This means that the measured response time is worse than the average of all tested devices (19.8 ms). | ||
| ↔ Response Time 50% Grey to 80% Grey | ||
| 42 ms ... rise ↗ and fall ↘ combined | ↗ 21 ms rise | 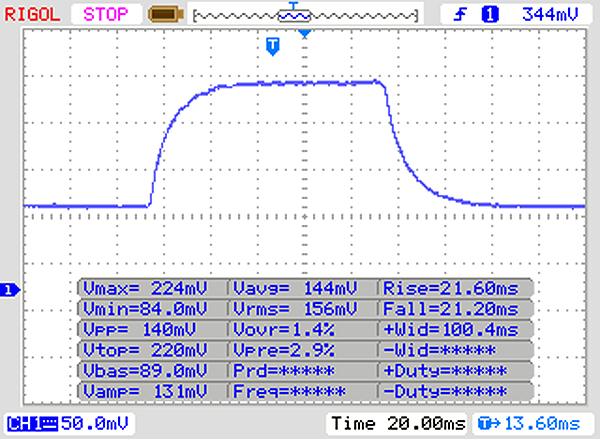 |
| ↘ 21 ms fall | ||
| The screen shows slow response rates in our tests and will be unsatisfactory for gamers. In comparison, all tested devices range from 0.165 (minimum) to 636 (maximum) ms. » 67 % of all devices are better. This means that the measured response time is worse than the average of all tested devices (31 ms). | ||
Performance
The UX433FA-A6061T is powerful enough for most office and Internet applications. Its Core i5-8265U is a modern quad-core processor that should combine with 8 GB of DDR4-2400 RAM to deliver consistently smooth system performance.
The UX433FA-A6061T currently costs around 1,100 Euros (~$1,254), but the UX433 starts at close to 900 Euros (~$1,026). ASUS also sells the UX433FN, which the company equips with an Nvidia GeForce MX150 GPU, should you need more graphics performance than the integrated Intel UHD Graphics 620 delivers.
Processor
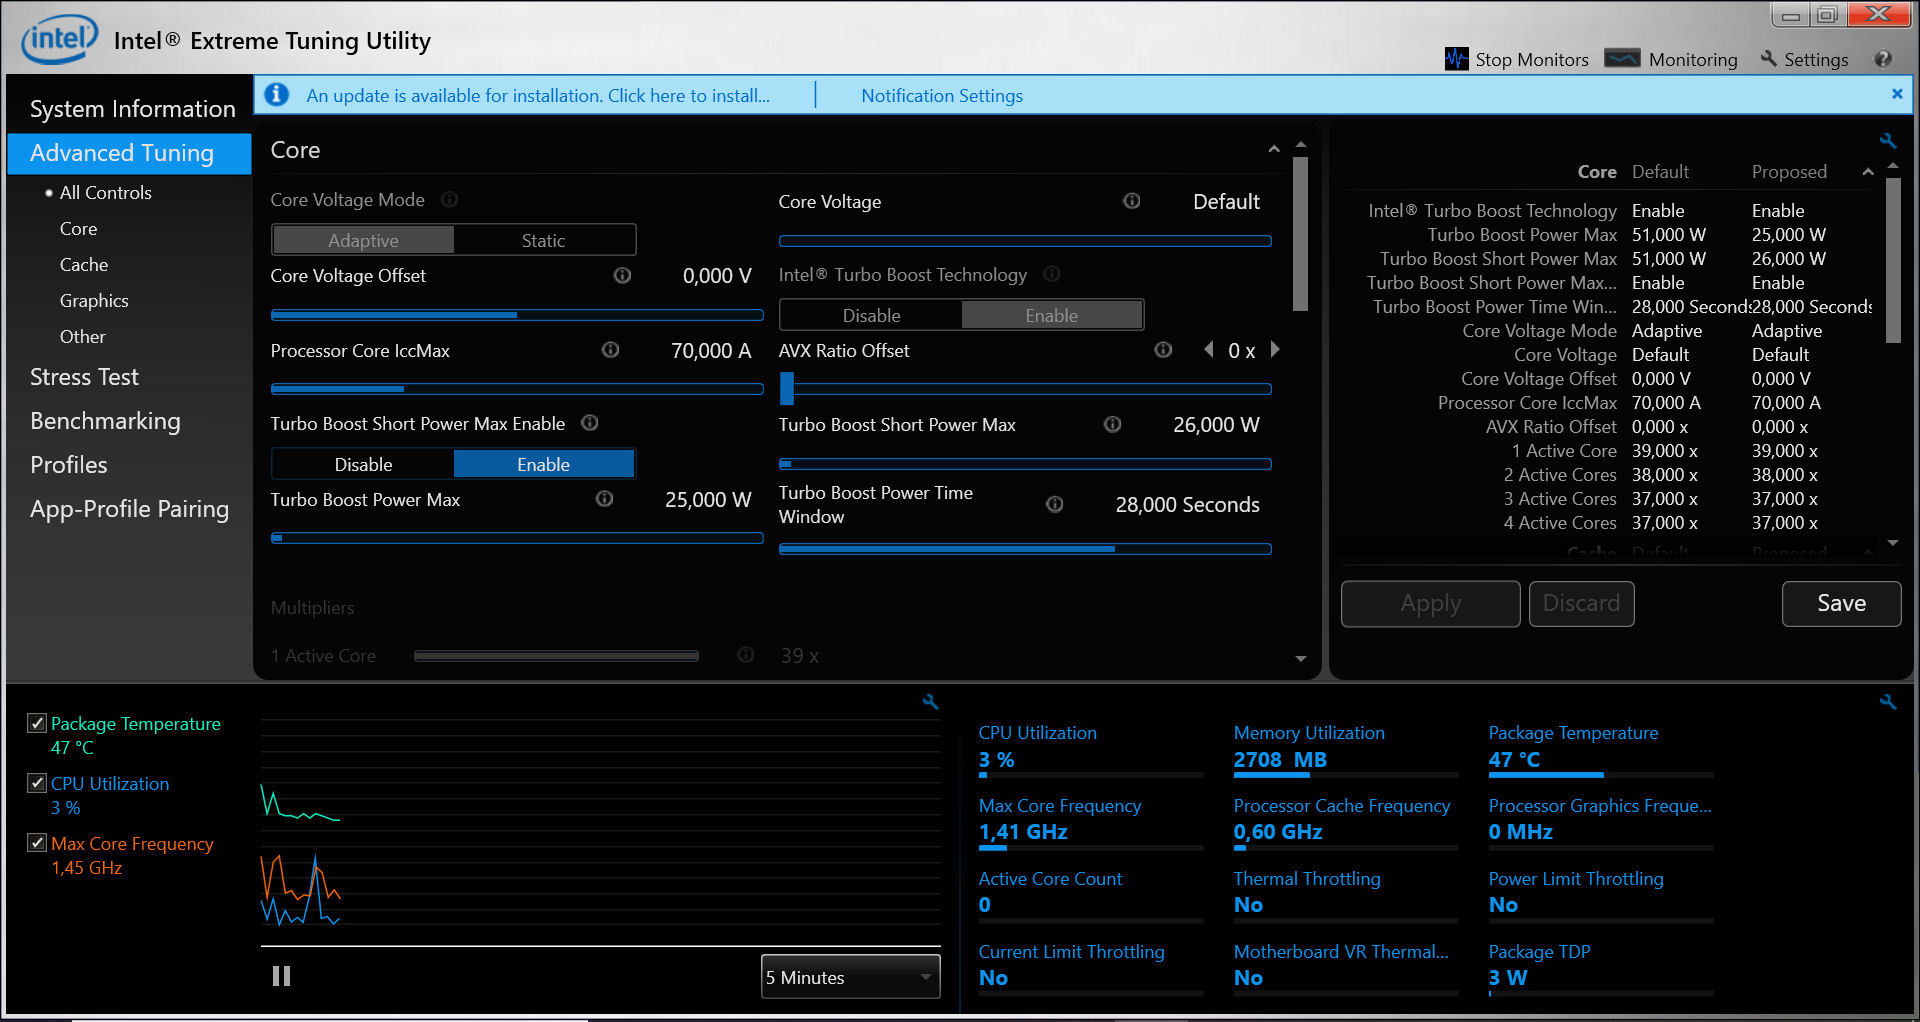
The Core i5-8265U is an ultra-low voltage (ULV) CPU that has a 15 W thermal design power (TDP) and is based on Intel's Whiskey Lake architecture. The CPU has a 1.6 GHz base clock speed and can utilise Intel Turbo Boost to increase up to 3.7 GHz across all cores when required. The Core i5-8265U can achieve up to 3.8 GHz across two cores and 3.9 GHz in single-core applications.
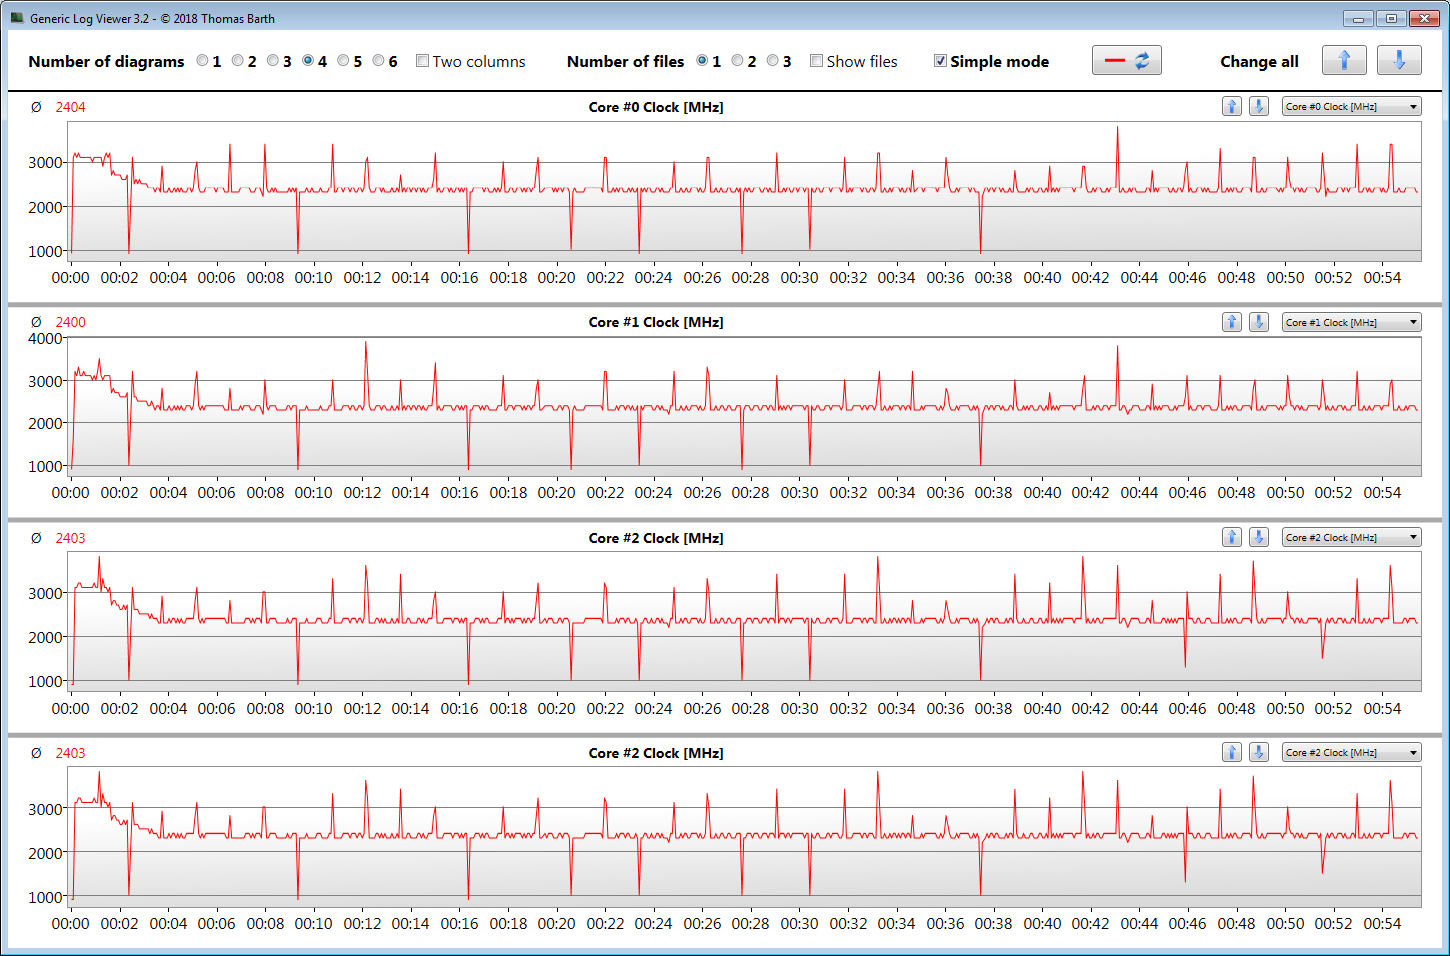
The CPU operates at between 3 GHz and 3.4 GHz when we run a Cinebench R15 Multi 64-bit benchmark, while the CPU fluctuates between 2.5 GHz and 3.9 GHz during the single-core benchmark.
This behaviour only applies to when the UX433FA-A6061T is running on mains power. The system downclocks the CPU to around 1.8 GHz on battery power, although we noticed clock speeds occasionally reaching 2.5 GHz.
We also subjected our test unit to a looped CB R15 Multi 64-bit benchmark to test how well it maintained its turbo clock speeds. We ran the continuous loop for around 30 minutes and observed any changes in benchmark scores. The UX433FA-A6061T initially scored 647 points, but the CPU throttled heavily, with our test device only scoring 496 points by the fourth run through. The CPU then stabilised, and the UX433FA-A6061T scored around 496/497 points for the remainder of our benchmark loop. However, this drop represents a 25% loss of peak performance, which is considerable throttling.
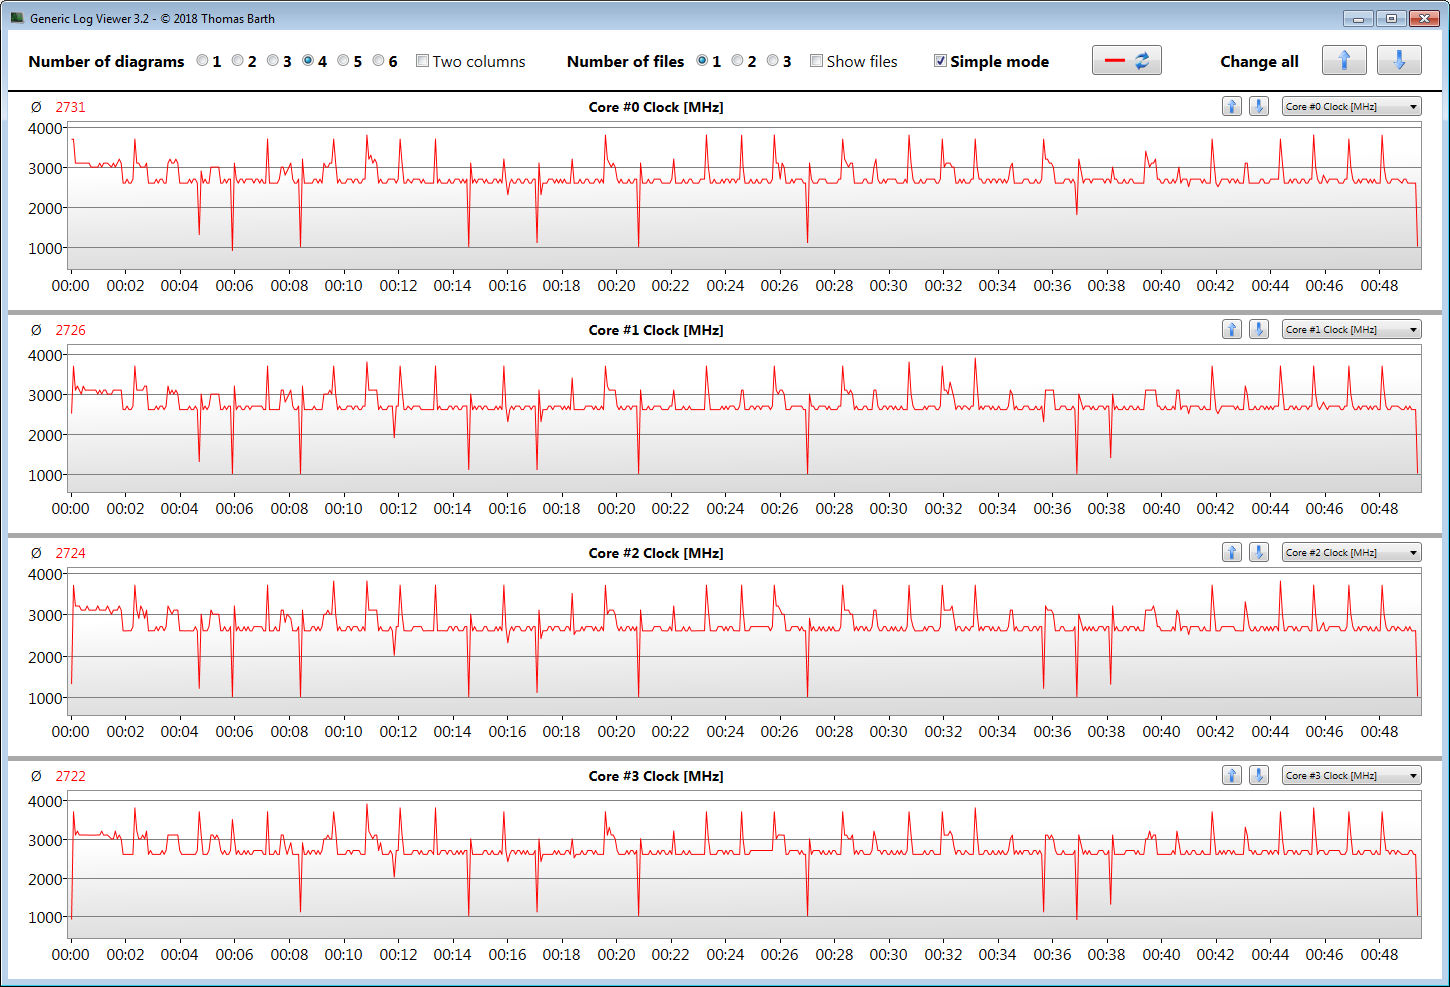
By contrast, the UX433FA-A6076T can maintain more consistent performance under load with its more-powerful Core i7-8565U processor. We suspected that the heavy throttling in our review unit could have been caused by the BIOS. We downgraded from BIOS 301 to BIOS 204, on which we tested the UX433FA-A6076T, and we re-ran our benchmark loop. The performance difference is dramatic. The device initially scores around 1% less in CB R15 Multi 64-bit on BIOS 204 than it did on BIOS 301, but it then only drops to a minimum of 557 points, which is around 12% higher than on BIOS 301. It appears then that ASUS is now causing its UX433 laptops to throttle more aggressively than they need to, but you can revert to an older BIOS to circumvent this.
| Cinebench R15 | |
| CPU Single 64Bit | |
| Average of class Subnotebook (72.4 - 322, n=57, last 2 years) | |
| Tuxedo InfinityBook Pro 14 (Windows 10) | |
| Asus ZenBook 14 UX433FA | |
| Average Intel Core i5-8265U (111 - 164, n=35) | |
| Acer Swift 3 SF314-55-31N8 | |
| Asus Zenbook 14 UX433FA-A6018T | |
| Huawei MateBook D 14 W50F | |
| CPU Multi 64Bit | |
| Average of class Subnotebook (327 - 3345, n=57, last 2 years) | |
| Asus Zenbook 14 UX433FA-A6018T | |
| Asus Zenbook 14 UX433FA-A6018T (BIOS 204) | |
| Asus ZenBook 14 UX433FA | |
| Average Intel Core i5-8265U (457 - 750, n=38) | |
| Tuxedo InfinityBook Pro 14 (Windows 10) | |
| Huawei MateBook D 14 W50F | |
| Acer Swift 3 SF314-55-31N8 | |
| Cinebench R10 | |
| Rendering Single 32Bit | |
| Average of class Subnotebook (2299 - 10697, n=13, last 2 years) | |
| Tuxedo InfinityBook Pro 14 (Windows 10) | |
| Asus ZenBook 14 UX433FA | |
| Average Intel Core i5-8265U (5841 - 6209, n=9) | |
| Acer Swift 3 SF314-55-31N8 | |
| Asus Zenbook 14 UX433FA-A6018T | |
| Rendering Multiple CPUs 32Bit | |
| Average of class Subnotebook (14395 - 51868, n=13, last 2 years) | |
| Asus Zenbook 14 UX433FA-A6018T | |
| Asus ZenBook 14 UX433FA | |
| Average Intel Core i5-8265U (16318 - 22962, n=9) | |
| Tuxedo InfinityBook Pro 14 (Windows 10) | |
| Acer Swift 3 SF314-55-31N8 | |
| Geekbench 3 | |
| 32 Bit Multi-Core Score | |
| Average of class Subnotebook (n=1last 2 years) | |
| Average Intel Core i5-8265U (12198 - 14499, n=6) | |
| Asus Zenbook 14 UX433FA-A6018T | |
| Tuxedo InfinityBook Pro 14 (Windows 10) | |
| Acer Swift 3 SF314-55-31N8 | |
| 32 Bit Single-Core Score | |
| Average of class Subnotebook (n=1last 2 years) | |
| Tuxedo InfinityBook Pro 14 (Windows 10) | |
| Average Intel Core i5-8265U (3470 - 3842, n=6) | |
| Asus Zenbook 14 UX433FA-A6018T | |
| Acer Swift 3 SF314-55-31N8 | |
| Geekbench 4.0 | |
| 64 Bit Multi-Core Score | |
| Average of class Subnotebook (n=1last 2 years) | |
| Average Intel Core i5-8265U (13168 - 14390, n=3) | |
| Asus Zenbook 14 UX433FA-A6018T | |
| Acer Swift 3 SF314-55-31N8 | |
| 64 Bit Single-Core Score | |
| Average of class Subnotebook (n=1last 2 years) | |
| Average Intel Core i5-8265U (4229 - 4605, n=3) | |
| Asus Zenbook 14 UX433FA-A6018T | |
| Acer Swift 3 SF314-55-31N8 | |
| Geekbench 4.4 | |
| 64 Bit Multi-Core Score | |
| Average of class Subnotebook (27854 - 45023, n=7, last 2 years) | |
| Asus Zenbook 14 UX433FA-A6018T | |
| Tuxedo InfinityBook Pro 14 (Windows 10) | |
| Average Intel Core i5-8265U (7144 - 16249, n=19) | |
| Asus ZenBook 14 UX433FA | |
| Acer Swift 3 SF314-55-31N8 | |
| 64 Bit Single-Core Score | |
| Average of class Subnotebook (5976 - 8929, n=7, last 2 years) | |
| Tuxedo InfinityBook Pro 14 (Windows 10) | |
| Asus ZenBook 14 UX433FA | |
| Asus Zenbook 14 UX433FA-A6018T | |
| Average Intel Core i5-8265U (2106 - 4830, n=19) | |
| Acer Swift 3 SF314-55-31N8 | |
| JetStream 1.1 - 1.1 Total | |
| Average of class Subnotebook (215 - 476, n=2, last 2 years) | |
| Asus ZenBook 14 UX433FA (Edge 42.17134.1.0) | |
| Tuxedo InfinityBook Pro 14 (Chromium 71.0.3578.98 - Windows 10) | |
| Average Intel Core i5-8265U (193.7 - 244, n=19) | |
| Asus Zenbook 14 UX433FA-A6018T (Edge 44) | |
| Acer Swift 3 SF314-55-31N8 (Edge 42) | |
System Performance
The UX433FA-A6061T performed well in PCMark benchmarks, but all the differences between devices in our comparison tables are rather small. The InfinityBook Pro 14 scored around 12% more than the UX433FA-A6061T overall in PCMark 10, but this is because of the former’s much faster SSD.
Subjectively, our test unit felt snappy and delivered smooth system performance throughout our tests. We did not encounter any problems when multitasking and the Core i5-8265U should be powerful enough for most tasks, but it lacks the graphics performance needed for resource-intensive activities like video-editing.
| PCMark 7 Score | 5946 points | |
| PCMark 8 Home Score Accelerated v2 | 3733 points | |
| PCMark 8 Creative Score Accelerated v2 | 4690 points | |
| PCMark 8 Work Score Accelerated v2 | 4715 points | |
| PCMark 10 Score | 3643 points | |
Help | ||
| PCMark 8 - Home Score Accelerated v2 | |
| Tuxedo InfinityBook Pro 14 | |
| Asus Zenbook 14 UX433FA-A6018T | |
| Average Intel Core i5-8265U, Intel UHD Graphics 620 (2747 - 4244, n=24) | |
| Asus ZenBook 14 UX433FA | |
| Acer Swift 3 SF314-55-31N8 | |
| Average of class Subnotebook (1739 - 1828, n=2, last 2 years) | |
Storage Devices
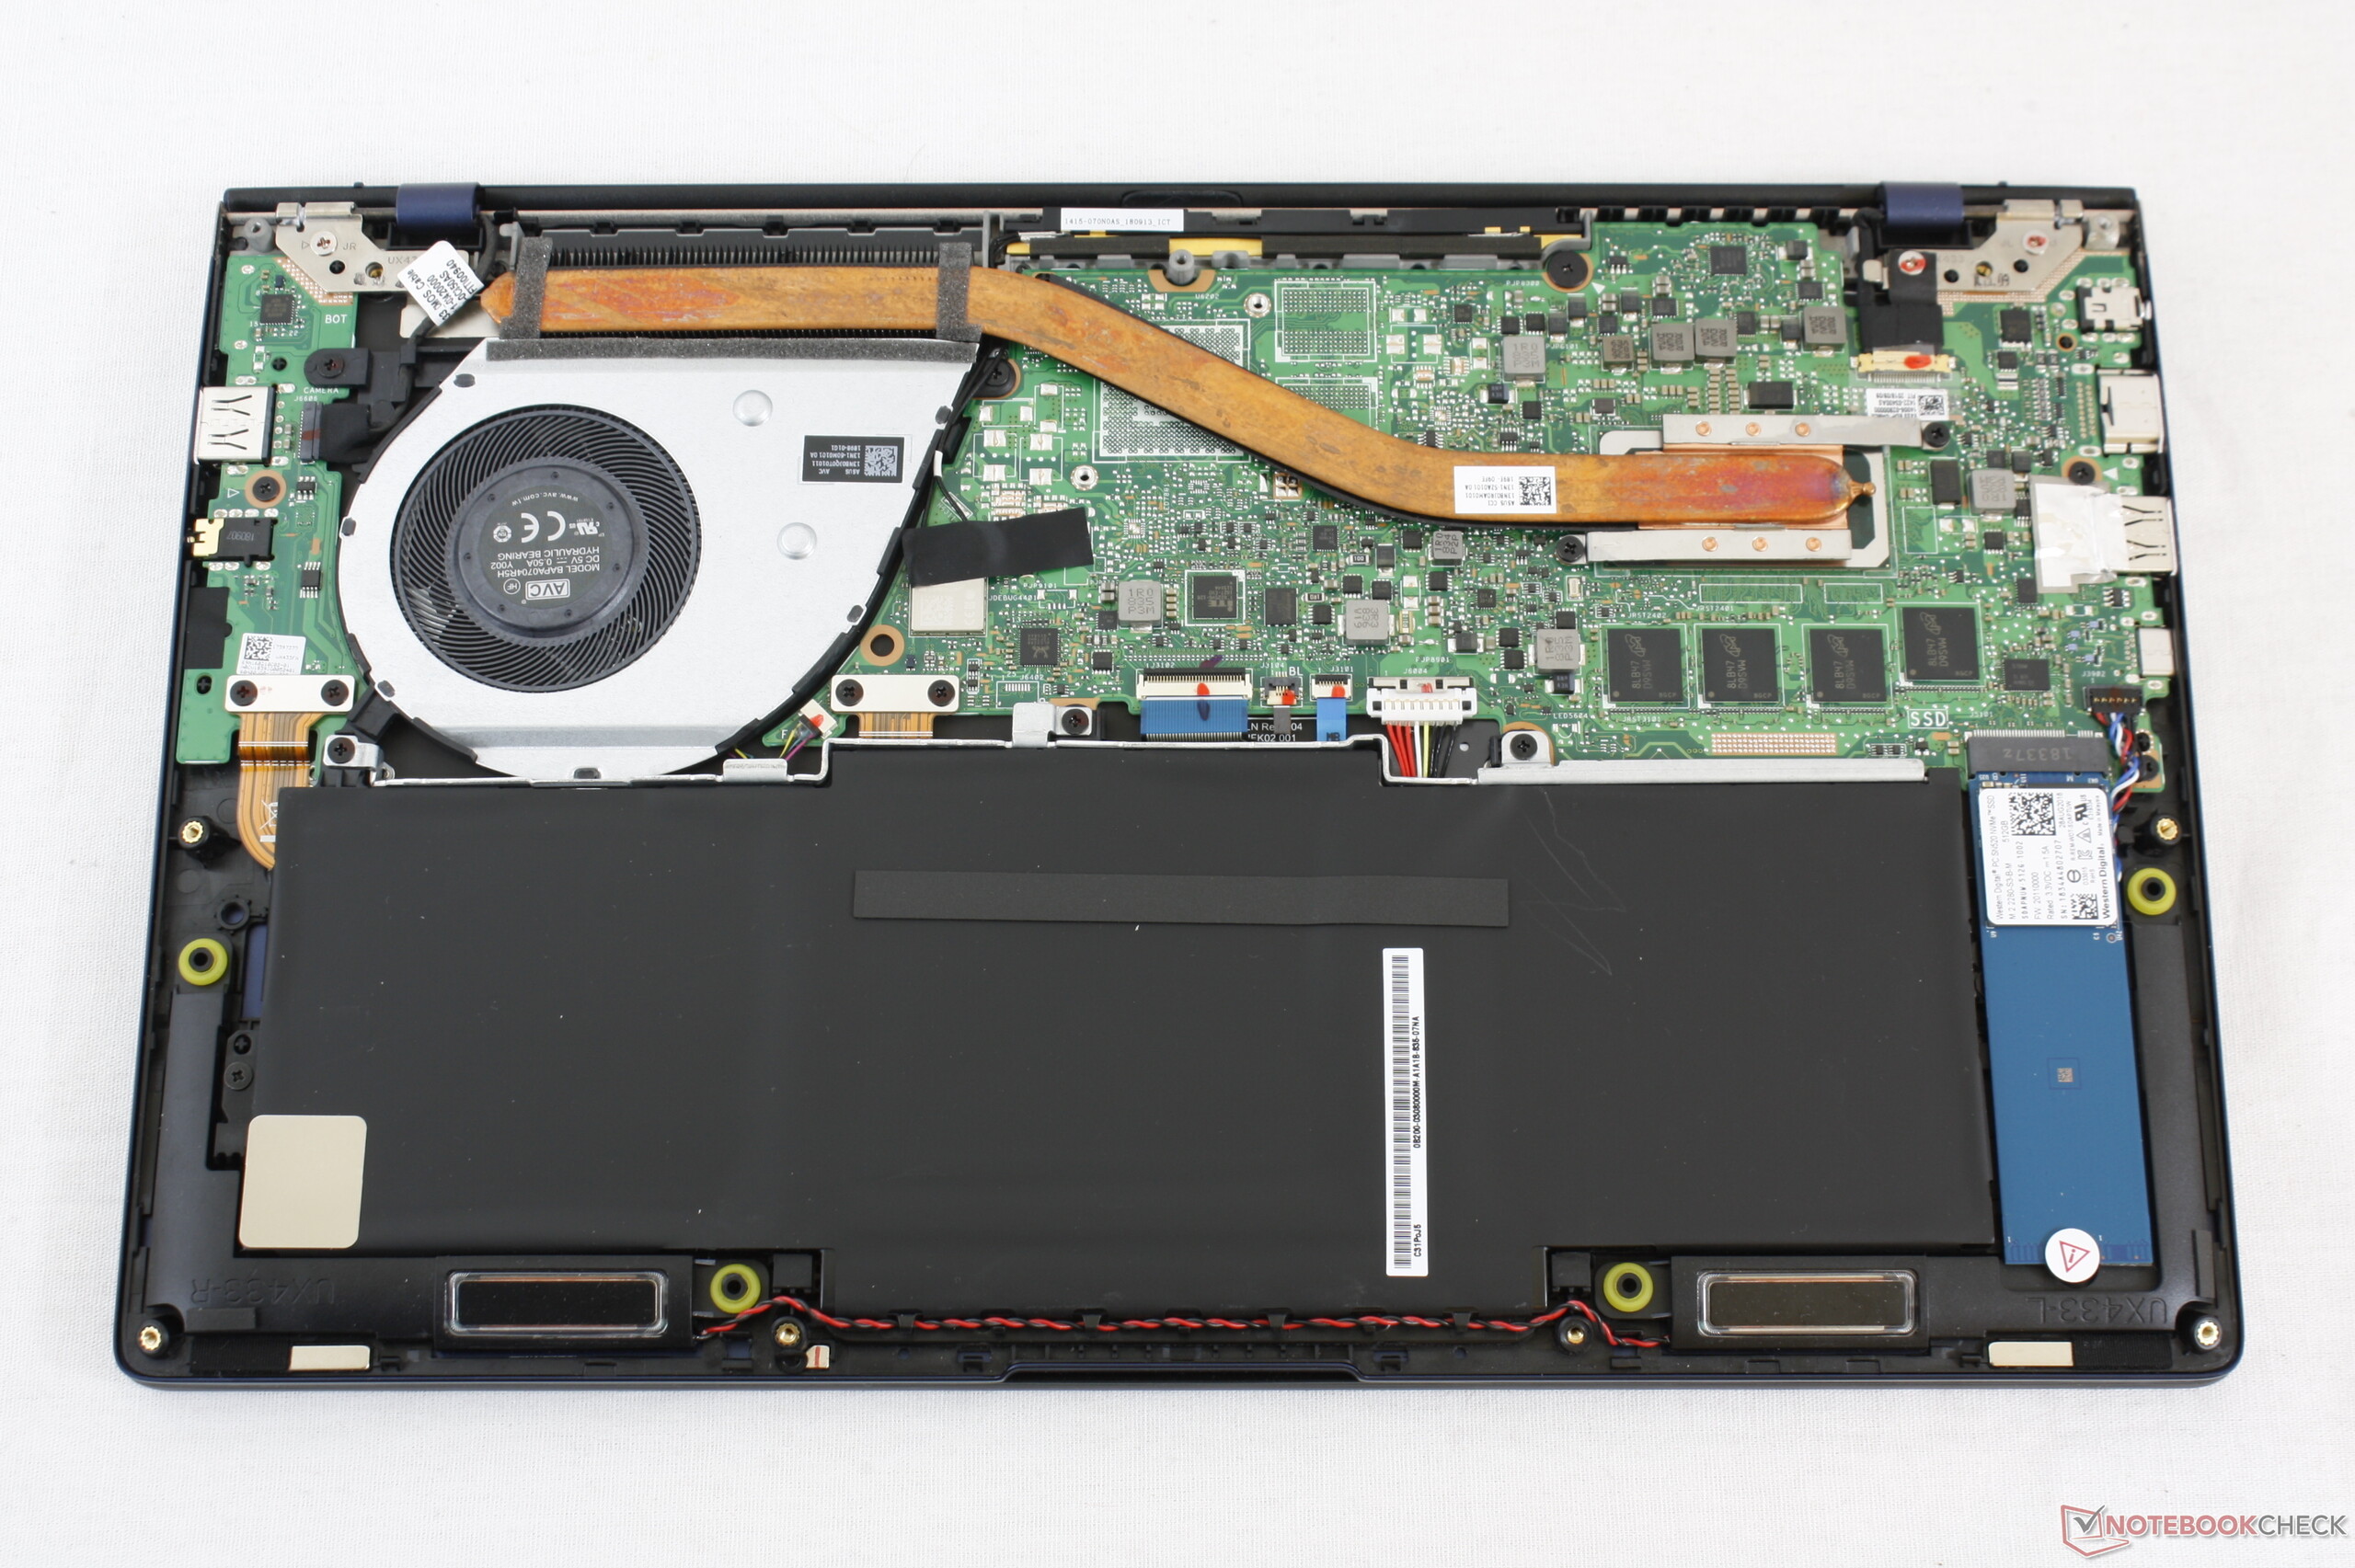
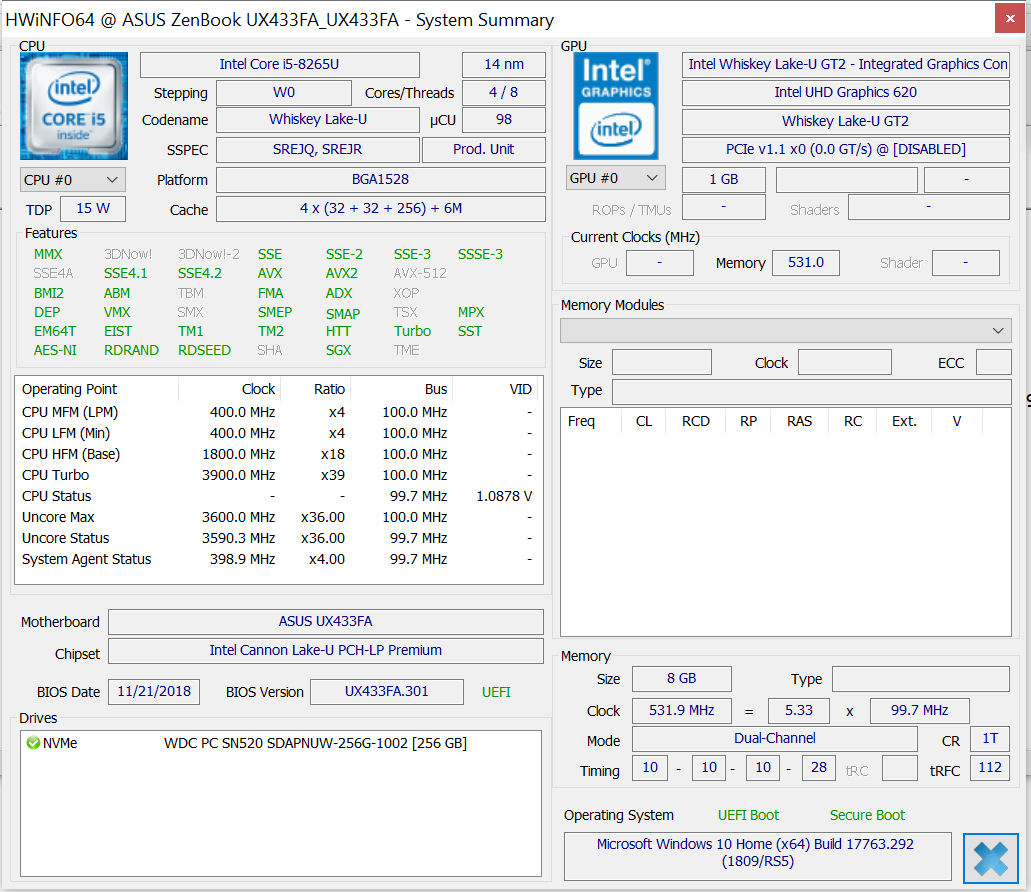
ASUS has equipped our test device with a 256 GB Western Digital SSD that carries the model number WDC PC SN520 SDAPNUW-256G. The SSD operates using the NVMe protocol and had approximately 206 GB free space when we first booted our review unit, with Windows 10 and its recovery partition taking up the remaining space.
The SN520 achieved fast transfer speeds in CrystalDiskMark 5.2/6, but it is resoundingly beaten by the Samsung 970 EVO in the InfinityBook Pro 14 and is slightly slower overall than the 512 GB version of the SN520 in the UX433FA-A6076T. Our test device achieved better transfer speeds than the drives in our other two comparison devices as these are equipped with SATA III SSDs, which are considerably slower than their NVMe counterparts.

| Asus Zenbook 14 UX433FA-A6018T WDC PC SN520 SDAPNUW-256G | Asus ZenBook 14 UX433FA WDC PC SN520 SDAPNUW-512G | Tuxedo InfinityBook Pro 14 Samsung SSD 970 EVO 500GB | Acer Swift 3 SF314-55-31N8 Kingston RBUSNS8154P3128GJ | Huawei MateBook D 14 W50F SanDisk SD9SN8W256G1027 | Average WDC PC SN520 SDAPNUW-256G | Average of class Subnotebook | |
|---|---|---|---|---|---|---|---|
| CrystalDiskMark 5.2 / 6 | 12% | 37% | -20% | -45% | 4% | 138% | |
| Write 4K (MB/s) | 99.9 | 123 23% | 130.9 31% | 96.8 -3% | 60.5 -39% | 118.5 ? 19% | 155.4 ? 56% |
| Read 4K (MB/s) | 40.03 | 43.28 8% | 44.66 12% | 36.99 -8% | 21.63 -46% | 42 ? 5% | 64.3 ? 61% |
| Write Seq (MB/s) | 973 | 753 -23% | 1187 22% | 463.1 -52% | 450.9 -54% | 1123 ? 15% | 2846 ? 192% |
| Read Seq (MB/s) | 1111 | 1336 20% | 1190 7% | 794 -29% | 482.3 -57% | 1208 ? 9% | 3299 ? 197% |
| Write 4K Q32T1 (MB/s) | 424.6 | 510 20% | 317.4 -25% | 291.7 -31% | 248.9 -41% | 324 ? -24% | 431 ? 2% |
| Read 4K Q32T1 (MB/s) | 255.9 | 339.2 33% | 386.1 51% | 352 38% | 267.6 5% | 322 ? 26% | 504 ? 97% |
| Write Seq Q32T1 (MB/s) | 1300 | 1455 12% | 2510 93% | 468.1 -64% | 534 -59% | 1091 ? -16% | 4671 ? 259% |
| Read Seq Q32T1 (MB/s) | 1723 | 1727 0% | 3560 107% | 1489 -14% | 563 -67% | 1729 ? 0% | 5833 ? 239% |
Graphics Card
The Intel UHD Graphics 620 handles graphics and can clock up to 1.1 GHz. The GPU supports DirectX 12 and achieves typical 3DMark benchmark results for a UHD Graphics 620. The UX433FA-A6061T runs in dual-channel mode, which helps improve graphics performance over devices that run in single-channel mode. You cannot switch between modes though as the RAM is soldered to the motherboard. You can only enable dual-channel mode in a system that is running in single-channel mode if you add a second identical RAM module.
| 3DMark 06 Standard Score | 11338 points | |
| 3DMark 11 Performance | 2074 points | |
| 3DMark Cloud Gate Standard Score | 9534 points | |
| 3DMark Fire Strike Score | 1168 points | |
Help | ||
| 3DMark 11 - 1280x720 Performance GPU | |
| Average of class Subnotebook (995 - 18489, n=55, last 2 years) | |
| Asus ZenBook 14 UX433FA | |
| Tuxedo InfinityBook Pro 14 | |
| Asus Zenbook 14 UX433FA-A6018T | |
| Huawei MateBook D 14 W50F | |
| Average Intel UHD Graphics 620 (1144 - 3432, n=244) | |
| Acer Swift 3 SF314-55-31N8 | |
| 3DMark | |
| 1920x1080 Fire Strike Graphics | |
| Average of class Subnotebook (832 - 16347, n=56, last 2 years) | |
| Tuxedo InfinityBook Pro 14 | |
| Asus Zenbook 14 UX433FA-A6018T | |
| Huawei MateBook D 14 W50F | |
| Average Intel UHD Graphics 620 (557 - 2608, n=213) | |
| Acer Swift 3 SF314-55-31N8 | |
| 1280x720 Cloud Gate Standard Graphics | |
| Average of class Subnotebook (5577 - 61591, n=28, last 2 years) | |
| Asus ZenBook 14 UX433FA | |
| Tuxedo InfinityBook Pro 14 | |
| Asus Zenbook 14 UX433FA-A6018T | |
| Huawei MateBook D 14 W50F | |
| Average Intel UHD Graphics 620 (6205 - 16400, n=225) | |
| Acer Swift 3 SF314-55-31N8 | |
| 2560x1440 Time Spy Graphics | |
| Average of class Subnotebook (804 - 6288, n=55, last 2 years) | |
| Asus ZenBook 14 UX433FA | |
| Average Intel UHD Graphics 620 (299 - 797, n=88) | |
Gaming Performance
The UX433FA-A6061T can play some older and simple games with its UHD Graphics 620, but only at low resolutions and low graphics settings. Modern triple-A games like Battlefield V are unplayable, but our review unit achieved an impressive 60+ FPS in BioShock Infinite at low graphics in 720p. The system even averaged 31 FPS at high settings, but this does not deliver a smooth gaming experience in our opinion.
| low | med. | high | ultra | |
|---|---|---|---|---|
| BioShock Infinite (2013) | 67.4 | 36.7 | 31 | 9.9 |
Emissions
Fan Noise
The UX433FA-A6061T operated quietly throughout testing and only reached a maximum of 30.9 dB(A) at idle. Moreover, the single fan ramps up to just 32.7 dB(A) under sustained load, but this is still quieter than the ambient noise produced in most offices.
Unfortunately, our review unit suffers from coil whine, which some people may find annoying. We did not find it intrusive during our tests, but your ears may be more sensitive than ours.
Noise level
| Idle |
| 30.5 / 30.5 / 30.9 dB(A) |
| Load |
| 32.7 / 31.5 dB(A) |
 | ||
30 dB silent 40 dB(A) audible 50 dB(A) loud |
||
min: | ||
Temperature
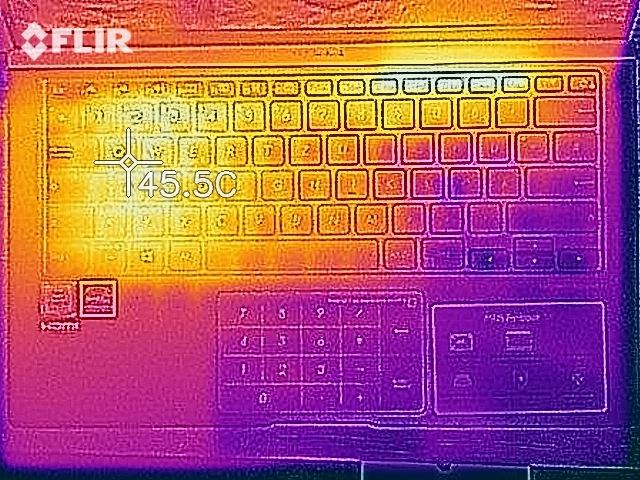
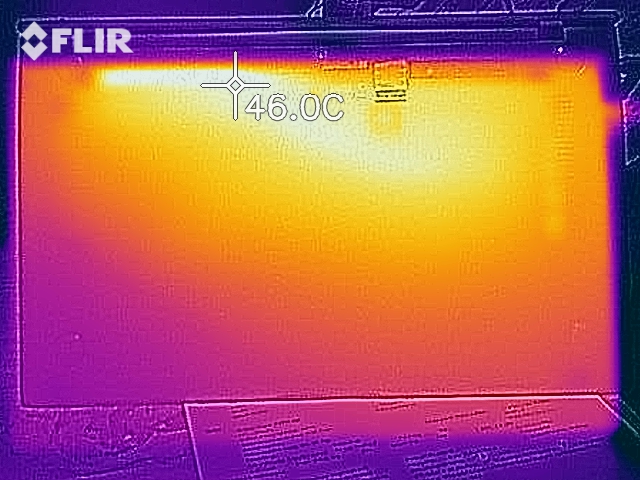
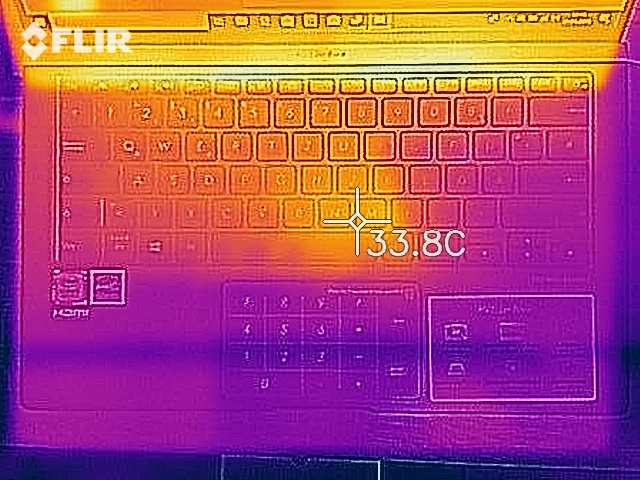
The UX433FA-A6061T also manages its surface temperatures well. The case reaches a maximum of 26.1 °C at idle and averages just 25 °C across all surfaces. The areas around the display hinge reached around 40 °C during our stress test, but the palm rest averages a pleasantly cool 29.2 °C. In short, the UX433FA-A6061T should not feel hot to the touch in daily use.
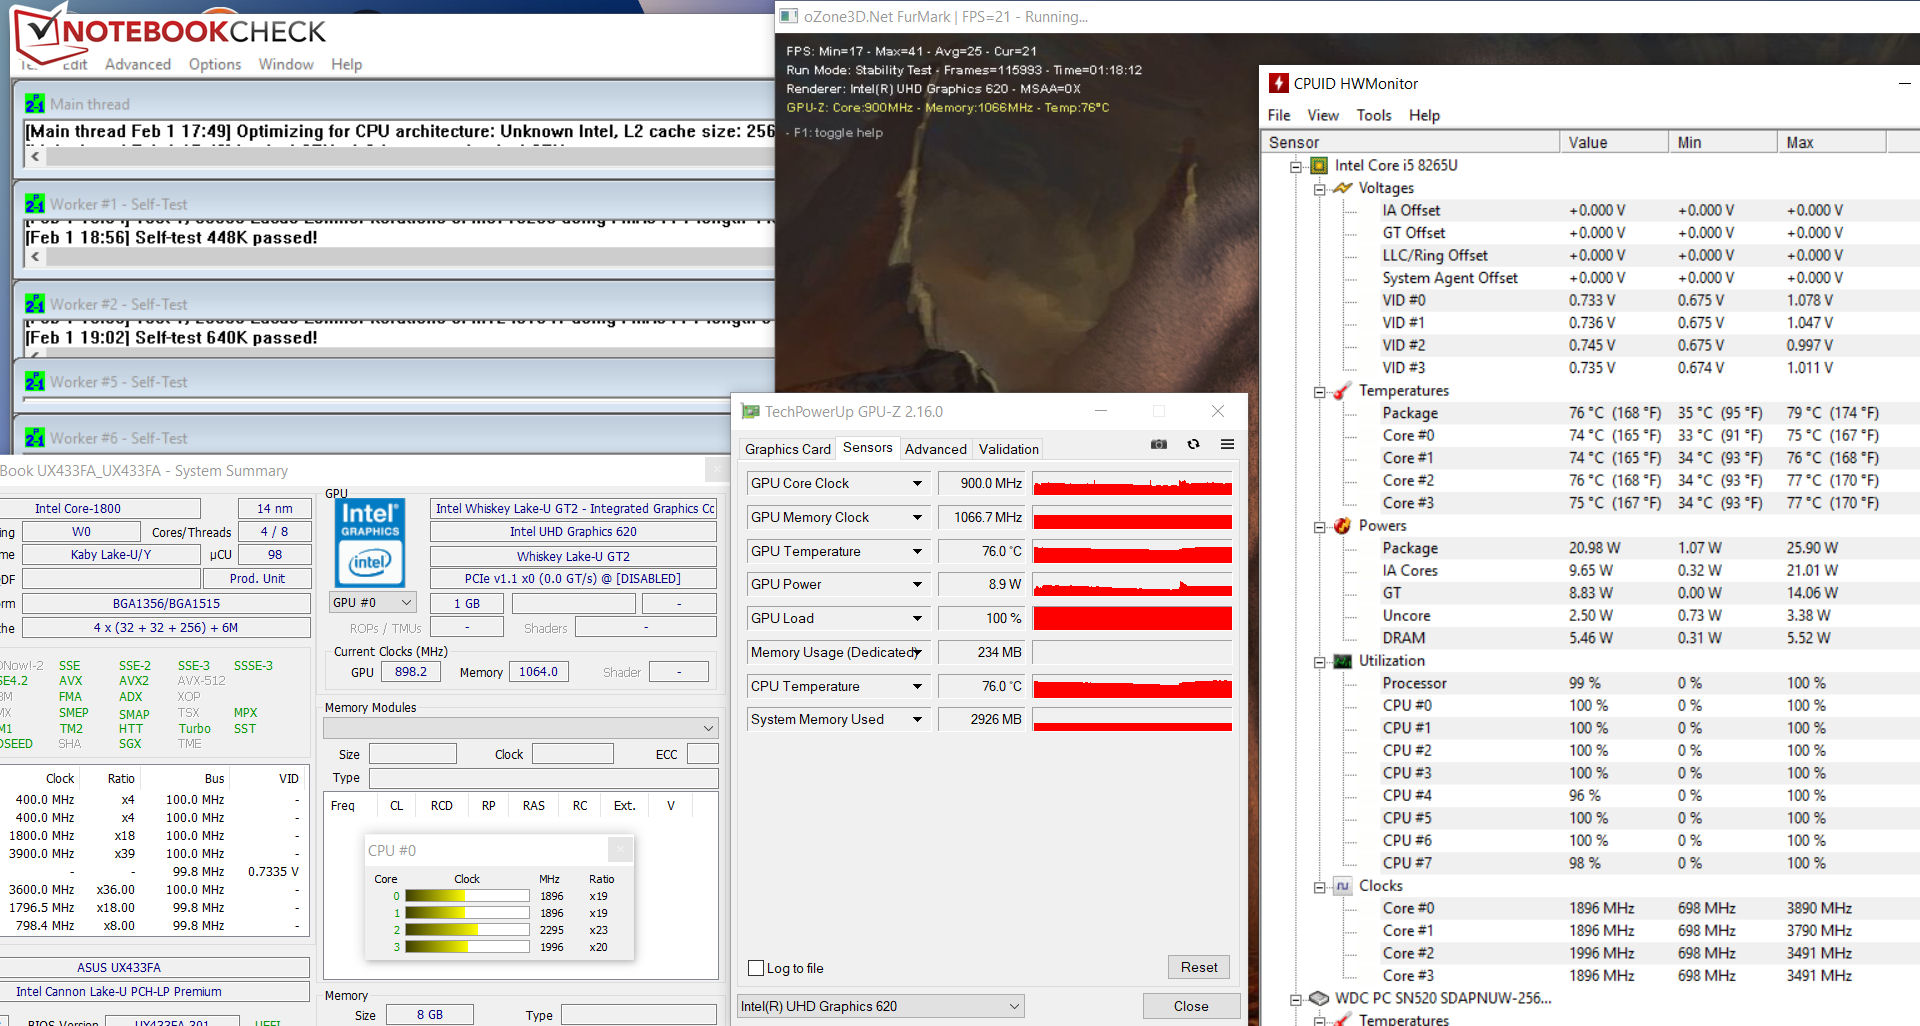
We also subjected our review unit to an hour-long FurMark and Prime95 stress test to determine how well it manages its internal temperatures. It is worth noting that the UX433FA-A6061T performs differently when connected to the mains than when we tested it on battery power.
On mains power, the CPU starts running at between 1.6 GHz and 2 GHz before throttling back below its base clock to 900/1,000 MHz. It also frequently clocked back up to between 1.6 GHz and 2 GHz, but it would then throttle back again. By contrast, the CPU consistently maintained 900/1,000 MHz on battery power and never exceeded its base clock.
Likewise, the GPU never clocks back up on battery power after it throttles. The GPU initially ran at 1,000 MHz when we started FurMark, but then clocked down to between 700 MHz and 750 MHz after a short time. It then repeatedly boosted back to 900 MHz on mains power but then throttled back to 700/750 MHz again, but only on mains power.
(±) The maximum temperature on the upper side is 41 °C / 106 F, compared to the average of 35.9 °C / 97 F, ranging from 21.4 to 59 °C for the class Subnotebook.
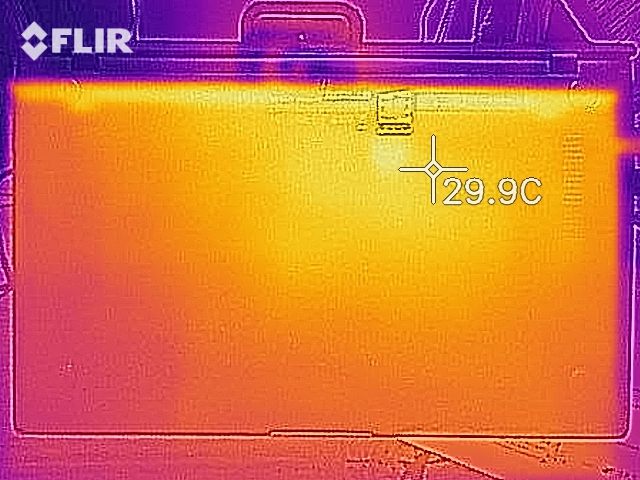
(±) The bottom heats up to a maximum of 41.4 °C / 107 F, compared to the average of 39.2 °C / 103 F
(+) In idle usage, the average temperature for the upper side is 25 °C / 77 F, compared to the device average of 30.8 °C / 87 F.
(+) The palmrests and touchpad are cooler than skin temperature with a maximum of 30.4 °C / 86.7 F and are therefore cool to the touch.
(-) The average temperature of the palmrest area of similar devices was 28.2 °C / 82.8 F (-2.2 °C / -3.9 F).
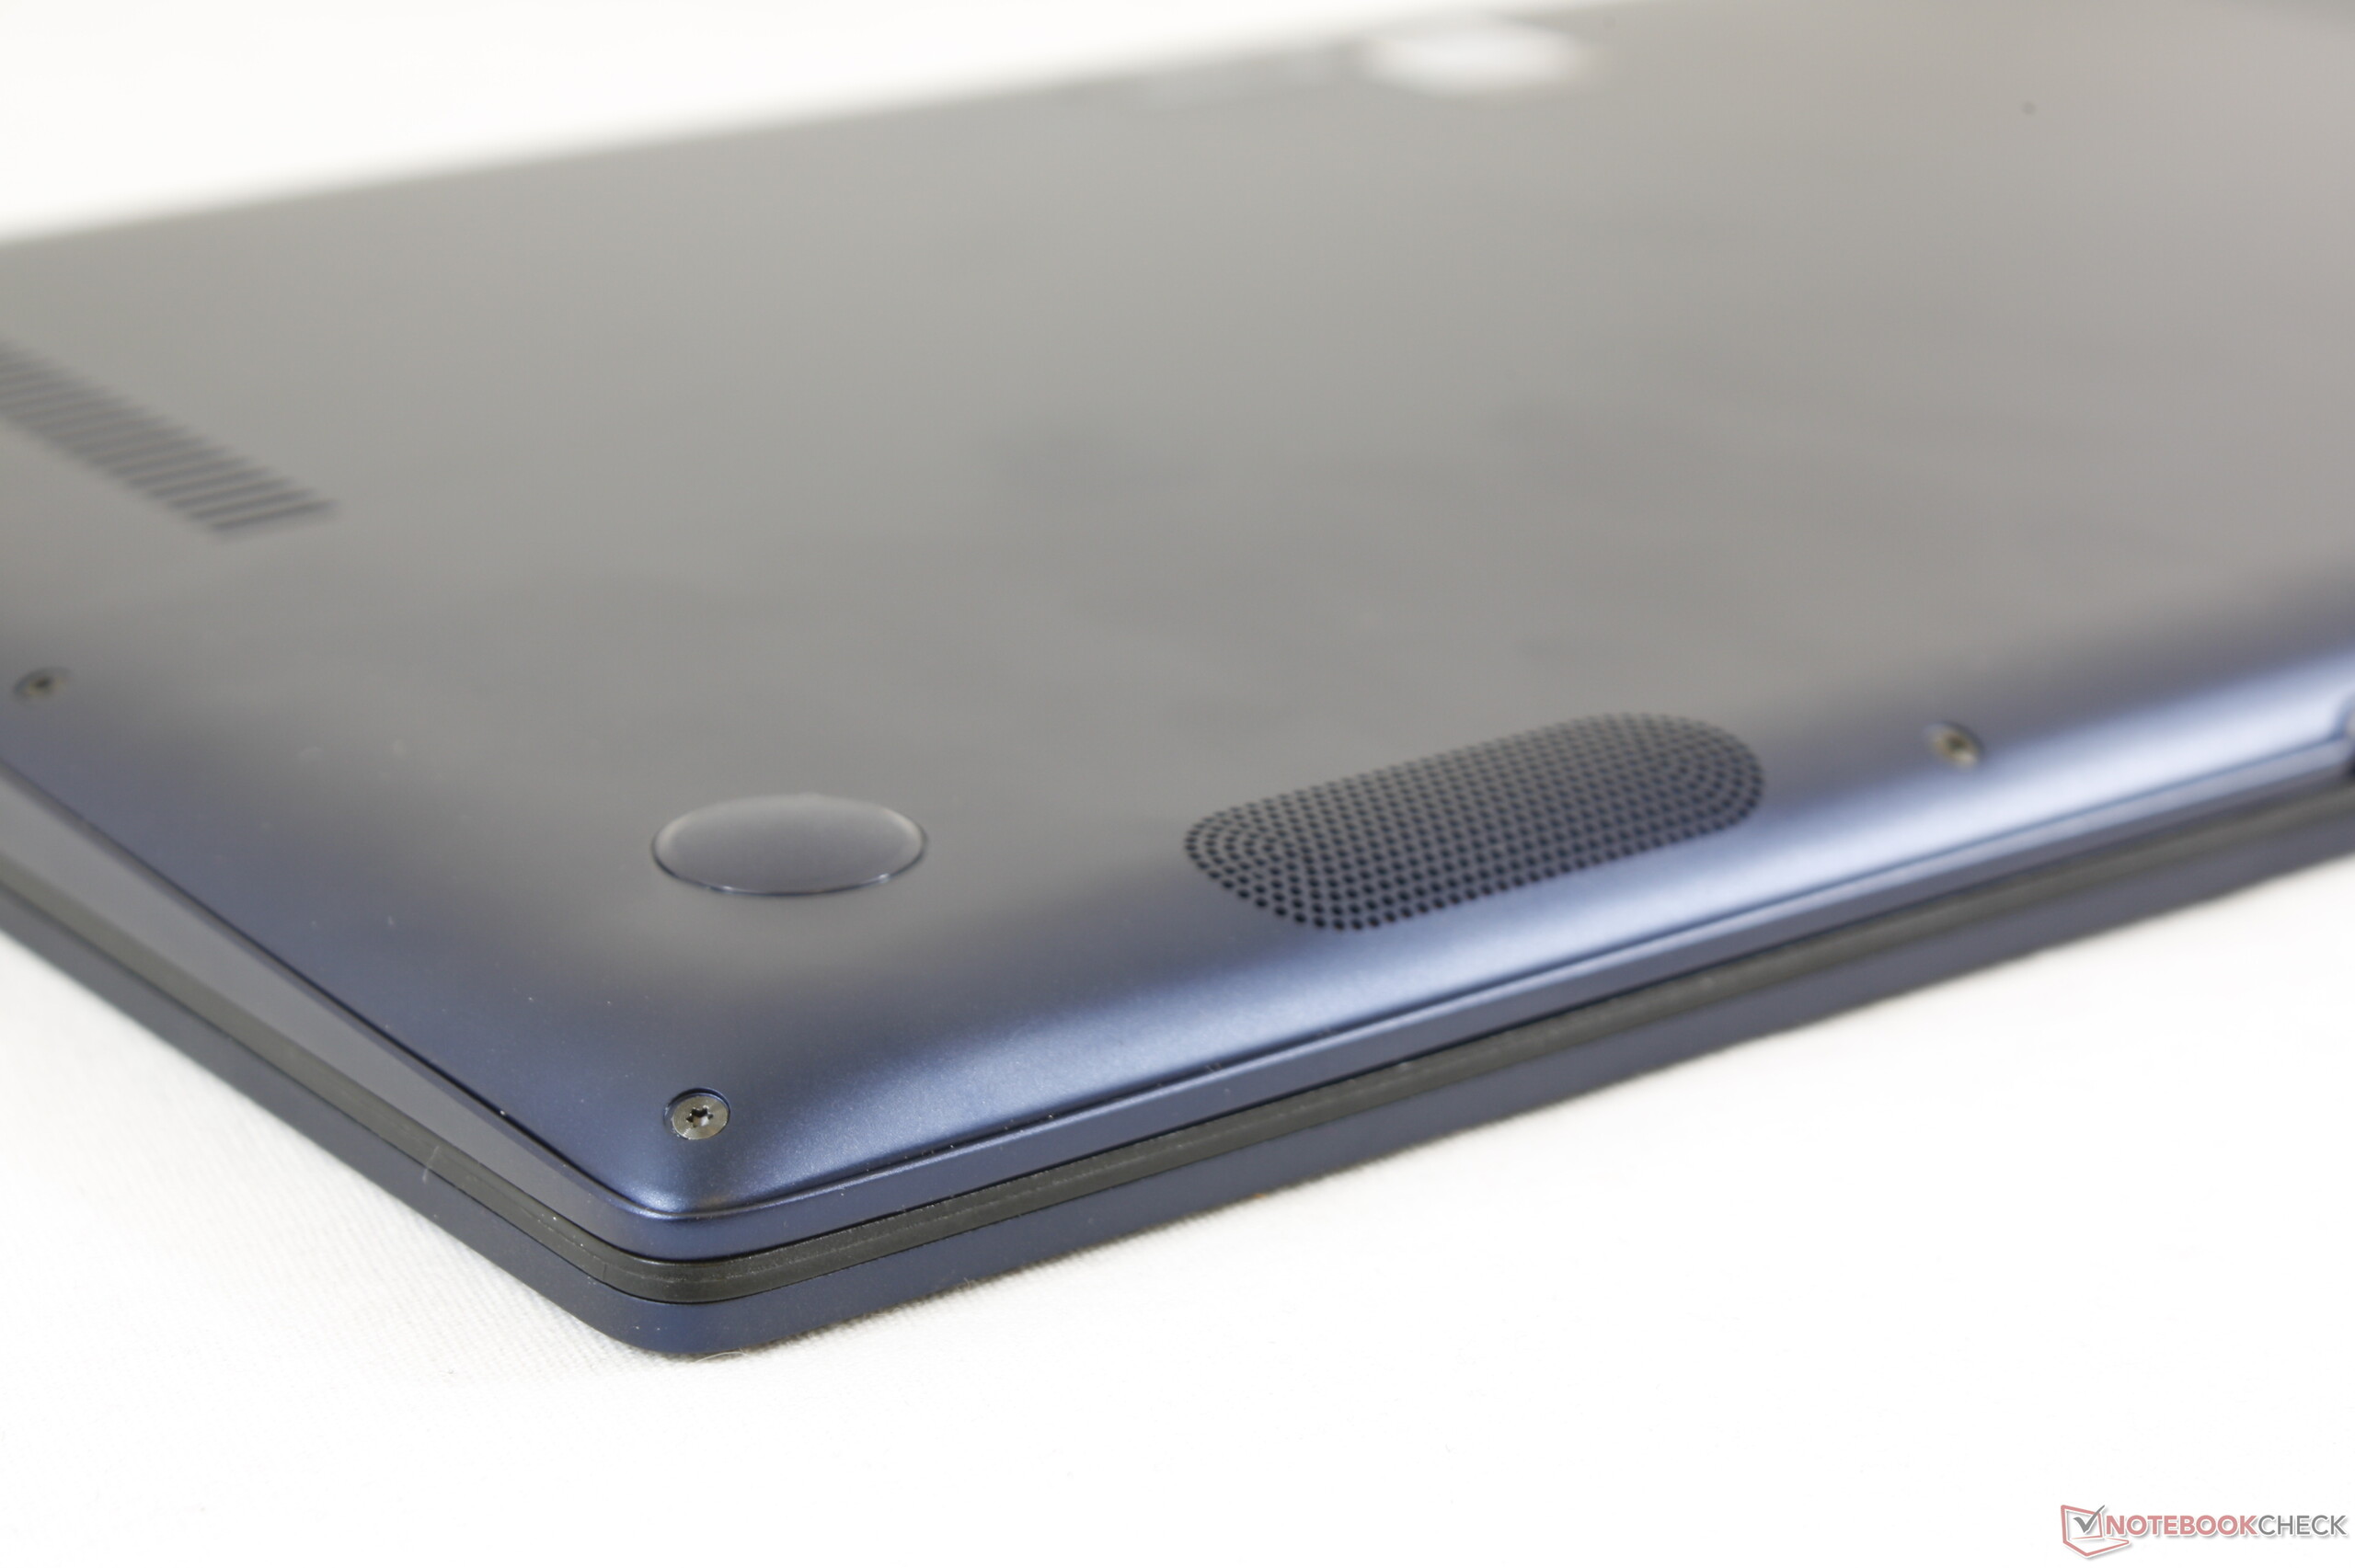
Speakers
Asus Zenbook 14 UX433FA-A6018T audio analysis
(±) | speaker loudness is average but good (75.1 dB)
Bass 100 - 315 Hz
(-) | nearly no bass - on average 18% lower than median
(±) | linearity of bass is average (9.9% delta to prev. frequency)
Mids 400 - 2000 Hz
(+) | balanced mids - only 3.7% away from median
(+) | mids are linear (5.3% delta to prev. frequency)
Highs 2 - 16 kHz
(+) | balanced highs - only 4.1% away from median
(+) | highs are linear (4.5% delta to prev. frequency)
Overall 100 - 16.000 Hz
(±) | linearity of overall sound is average (17.1% difference to median)
Compared to same class
» 43% of all tested devices in this class were better, 9% similar, 48% worse
» The best had a delta of 5%, average was 18%, worst was 53%
Compared to all devices tested
» 31% of all tested devices were better, 8% similar, 61% worse
» The best had a delta of 4%, average was 24%, worst was 134%
Acer Swift 3 SF314-55-31N8 audio analysis
(-) | not very loud speakers (64.7 dB)
Bass 100 - 315 Hz
(-) | nearly no bass - on average 17.1% lower than median
(+) | bass is linear (5.3% delta to prev. frequency)
Mids 400 - 2000 Hz
(+) | balanced mids - only 3.1% away from median
(+) | mids are linear (6.8% delta to prev. frequency)
Highs 2 - 16 kHz
(+) | balanced highs - only 1.8% away from median
(+) | highs are linear (3.8% delta to prev. frequency)
Overall 100 - 16.000 Hz
(±) | linearity of overall sound is average (19.4% difference to median)
Compared to same class
» 60% of all tested devices in this class were better, 7% similar, 33% worse
» The best had a delta of 5%, average was 18%, worst was 53%
Compared to all devices tested
» 48% of all tested devices were better, 7% similar, 45% worse
» The best had a delta of 4%, average was 24%, worst was 134%
Huawei MateBook D 14 W50F audio analysis
(±) | speaker loudness is average but good (72 dB)
Bass 100 - 315 Hz
(-) | nearly no bass - on average 17.3% lower than median
(-) | bass is not linear (15.5% delta to prev. frequency)
Mids 400 - 2000 Hz
(±) | higher mids - on average 7.4% higher than median
(±) | linearity of mids is average (9.6% delta to prev. frequency)
Highs 2 - 16 kHz
(+) | balanced highs - only 3% away from median
(+) | highs are linear (5.2% delta to prev. frequency)
Overall 100 - 16.000 Hz
(±) | linearity of overall sound is average (23.2% difference to median)
Compared to same class
» 65% of all tested devices in this class were better, 8% similar, 27% worse
» The best had a delta of 7%, average was 21%, worst was 53%
Compared to all devices tested
» 70% of all tested devices were better, 5% similar, 25% worse
» The best had a delta of 4%, average was 24%, worst was 134%
Power Management
Power Consumption
The UX433FA-A6061T consumes a minimum of 2.7 W at idle and averages 5.8 W, but it can consume as much as 10.2 W when it is not being stressed. The latter value is rather high for a compact 14-inch notebook that is equipped with a ULV processor.
Our review unit also reached 35 W during our combined stress test, but it consumed up to 44.4 W during just a Prime95 benchmark. ASUS includes a 45 W adaptor in the box, but this should be powerful enough as the CPU cannot maintain its peak wattage for more than a minute, so it should not be an issue in daily use.
| Off / Standby | |
| Idle | |
| Load |
|
Key:
min: | |
Battery Life
ASUS equips the UX433FA with a 50 Wh battery. We subjected our review unit to our practical Wi-Fi test, during which we run a script that simulates the load required to render websites. We set the Windows 10 Power Plan to Balanced, disabled all power-saving features and adjusted the brightness to approximately 150 cd/m². The UX433FA-A6061T lasted for 9:23 hours in this test, which puts the device second bottom of our comparison table.
This result may seem odd at first glance because the more-powerful UX433FA-A6076T lasted over an hour longer than our test device. We suspected that something was amiss with BIOS 301 but reverting the device back to BIOS 204 did not yield a longer runtime. Hence, we are unsure why the UX433FA-A6076T outlasts its weaker sibling by such a degree.
| Battery Runtime - WiFi Websurfing | |
| Average of class Subnotebook (7.25 - 26.4, n=59, last 2 years) | |
| Asus ZenBook 14 UX433FA | |
| Acer Swift 3 SF314-55-31N8 | |
| Huawei MateBook D 14 W50F | |
| Asus Zenbook 14 UX433FA-A6018T | |
| Tuxedo InfinityBook Pro 14 | |
Pros
Cons
Verdict
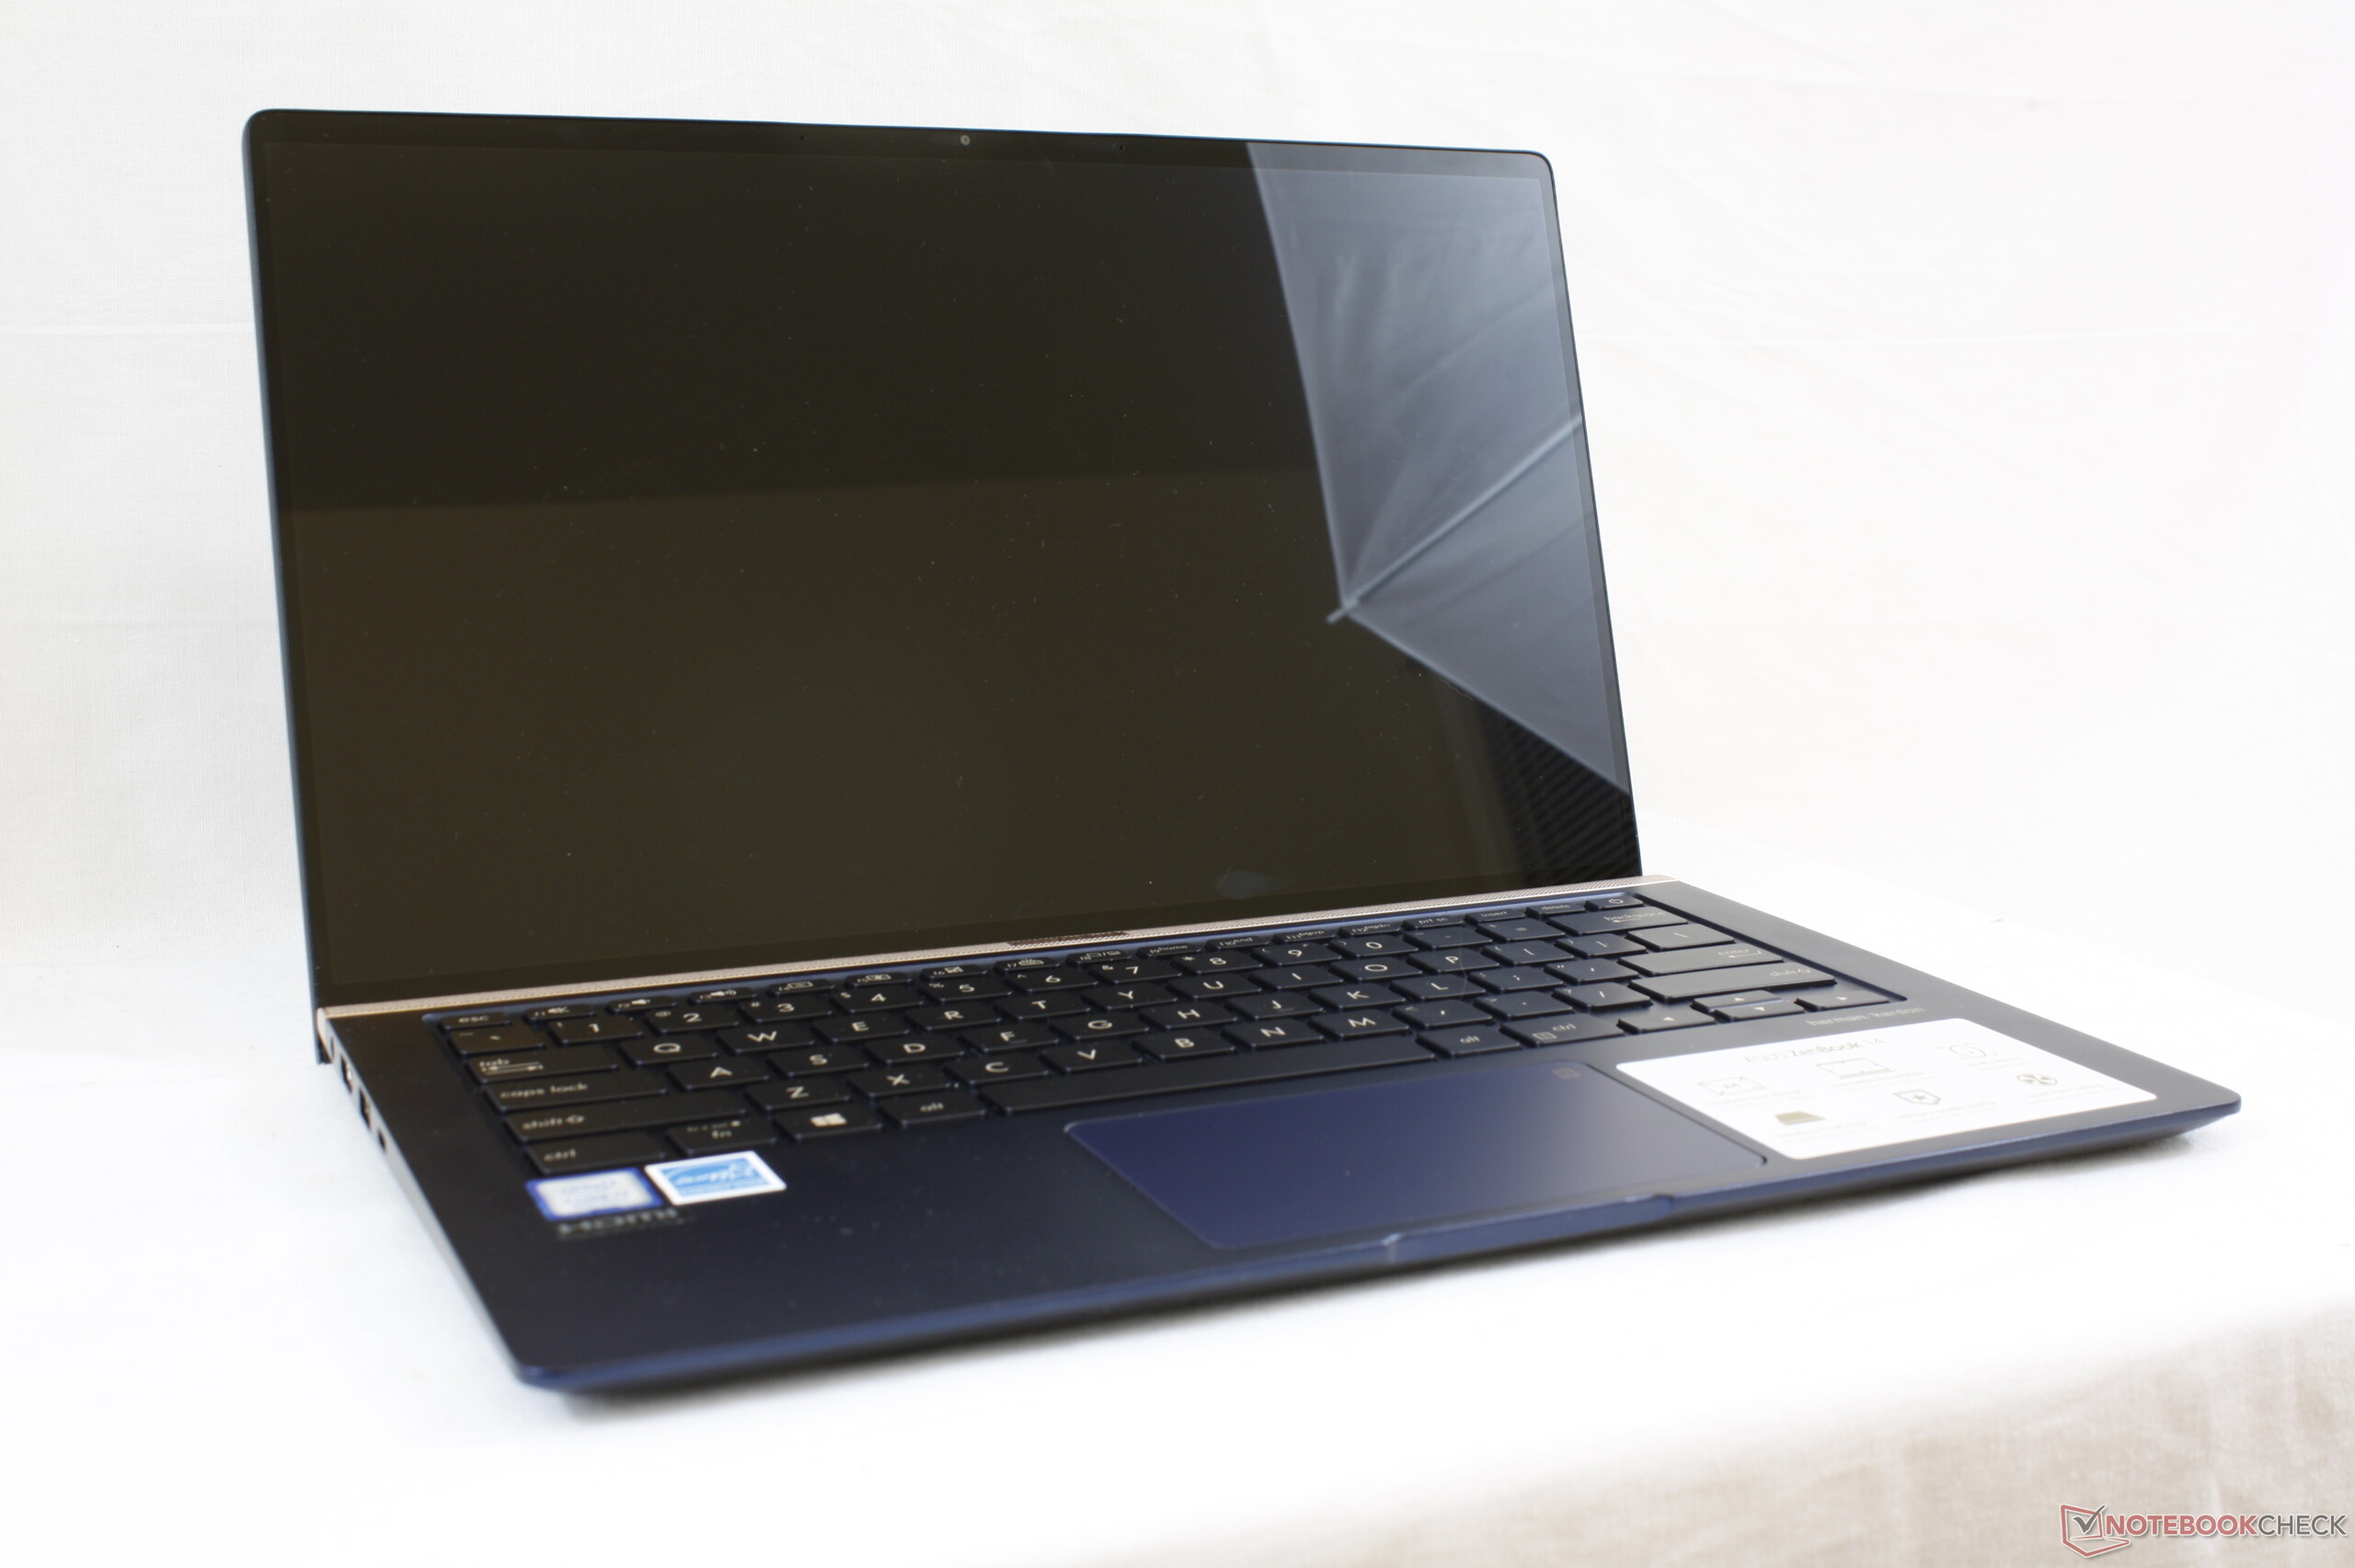
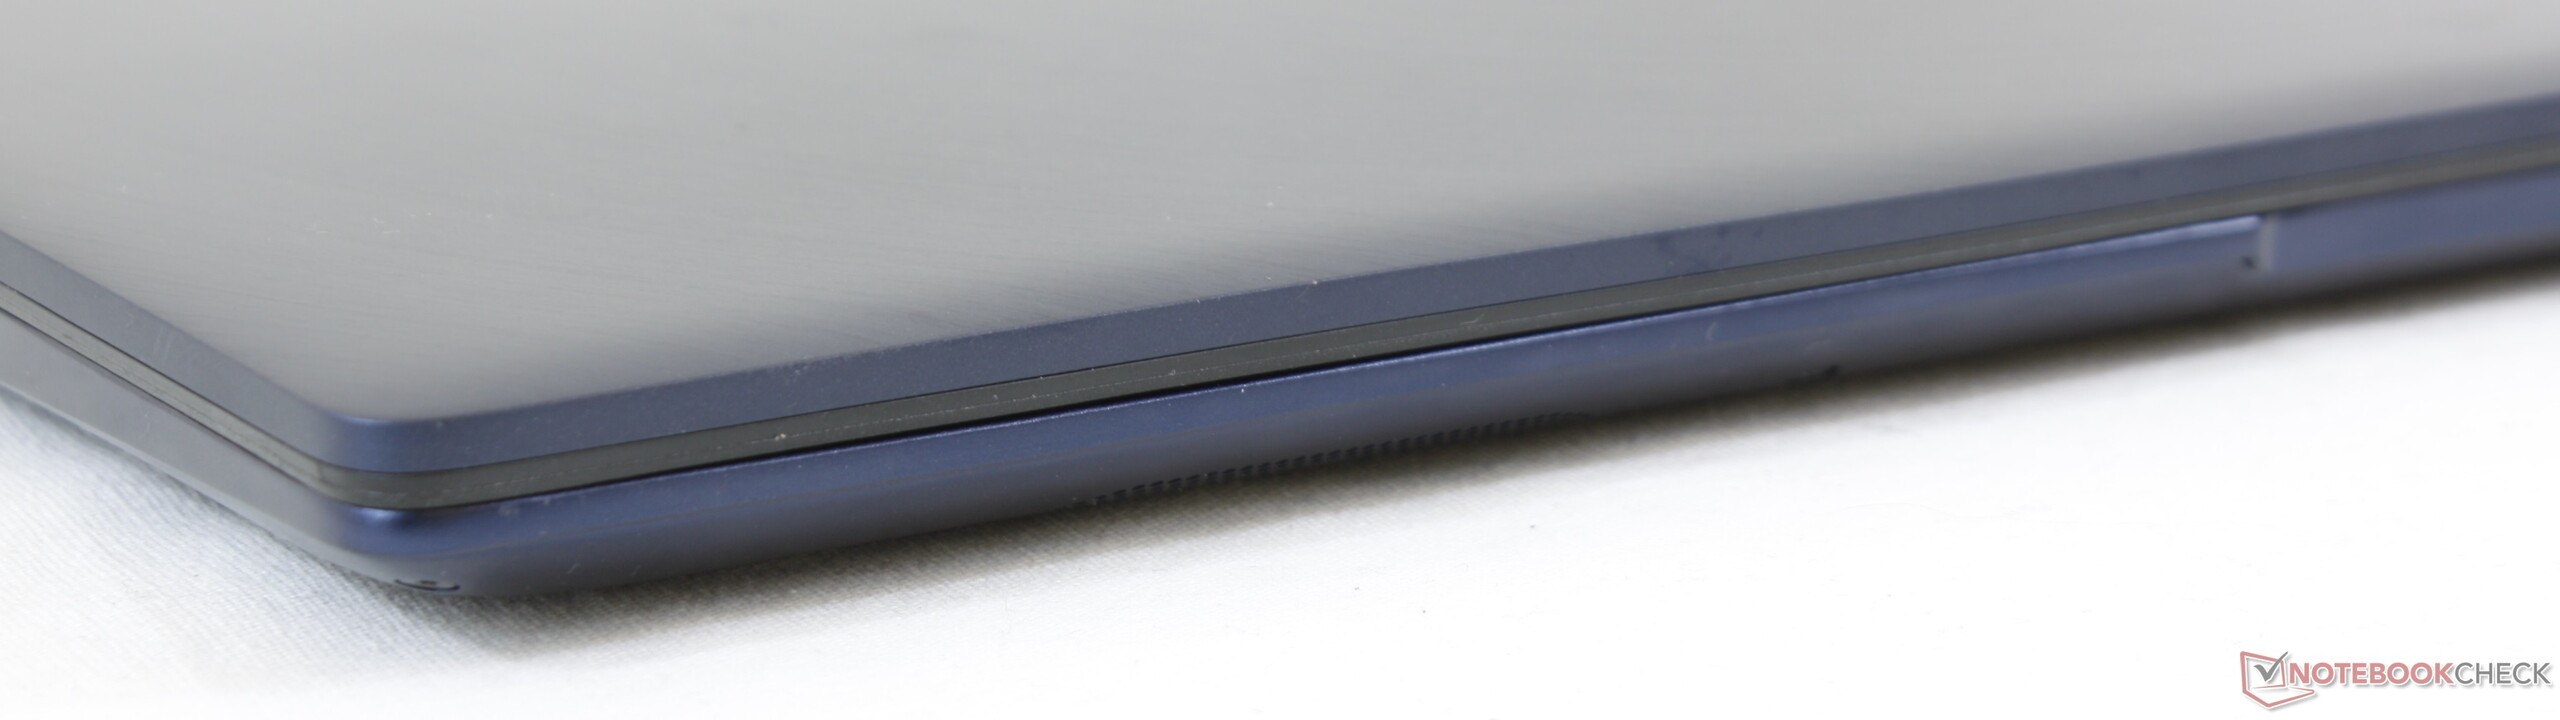
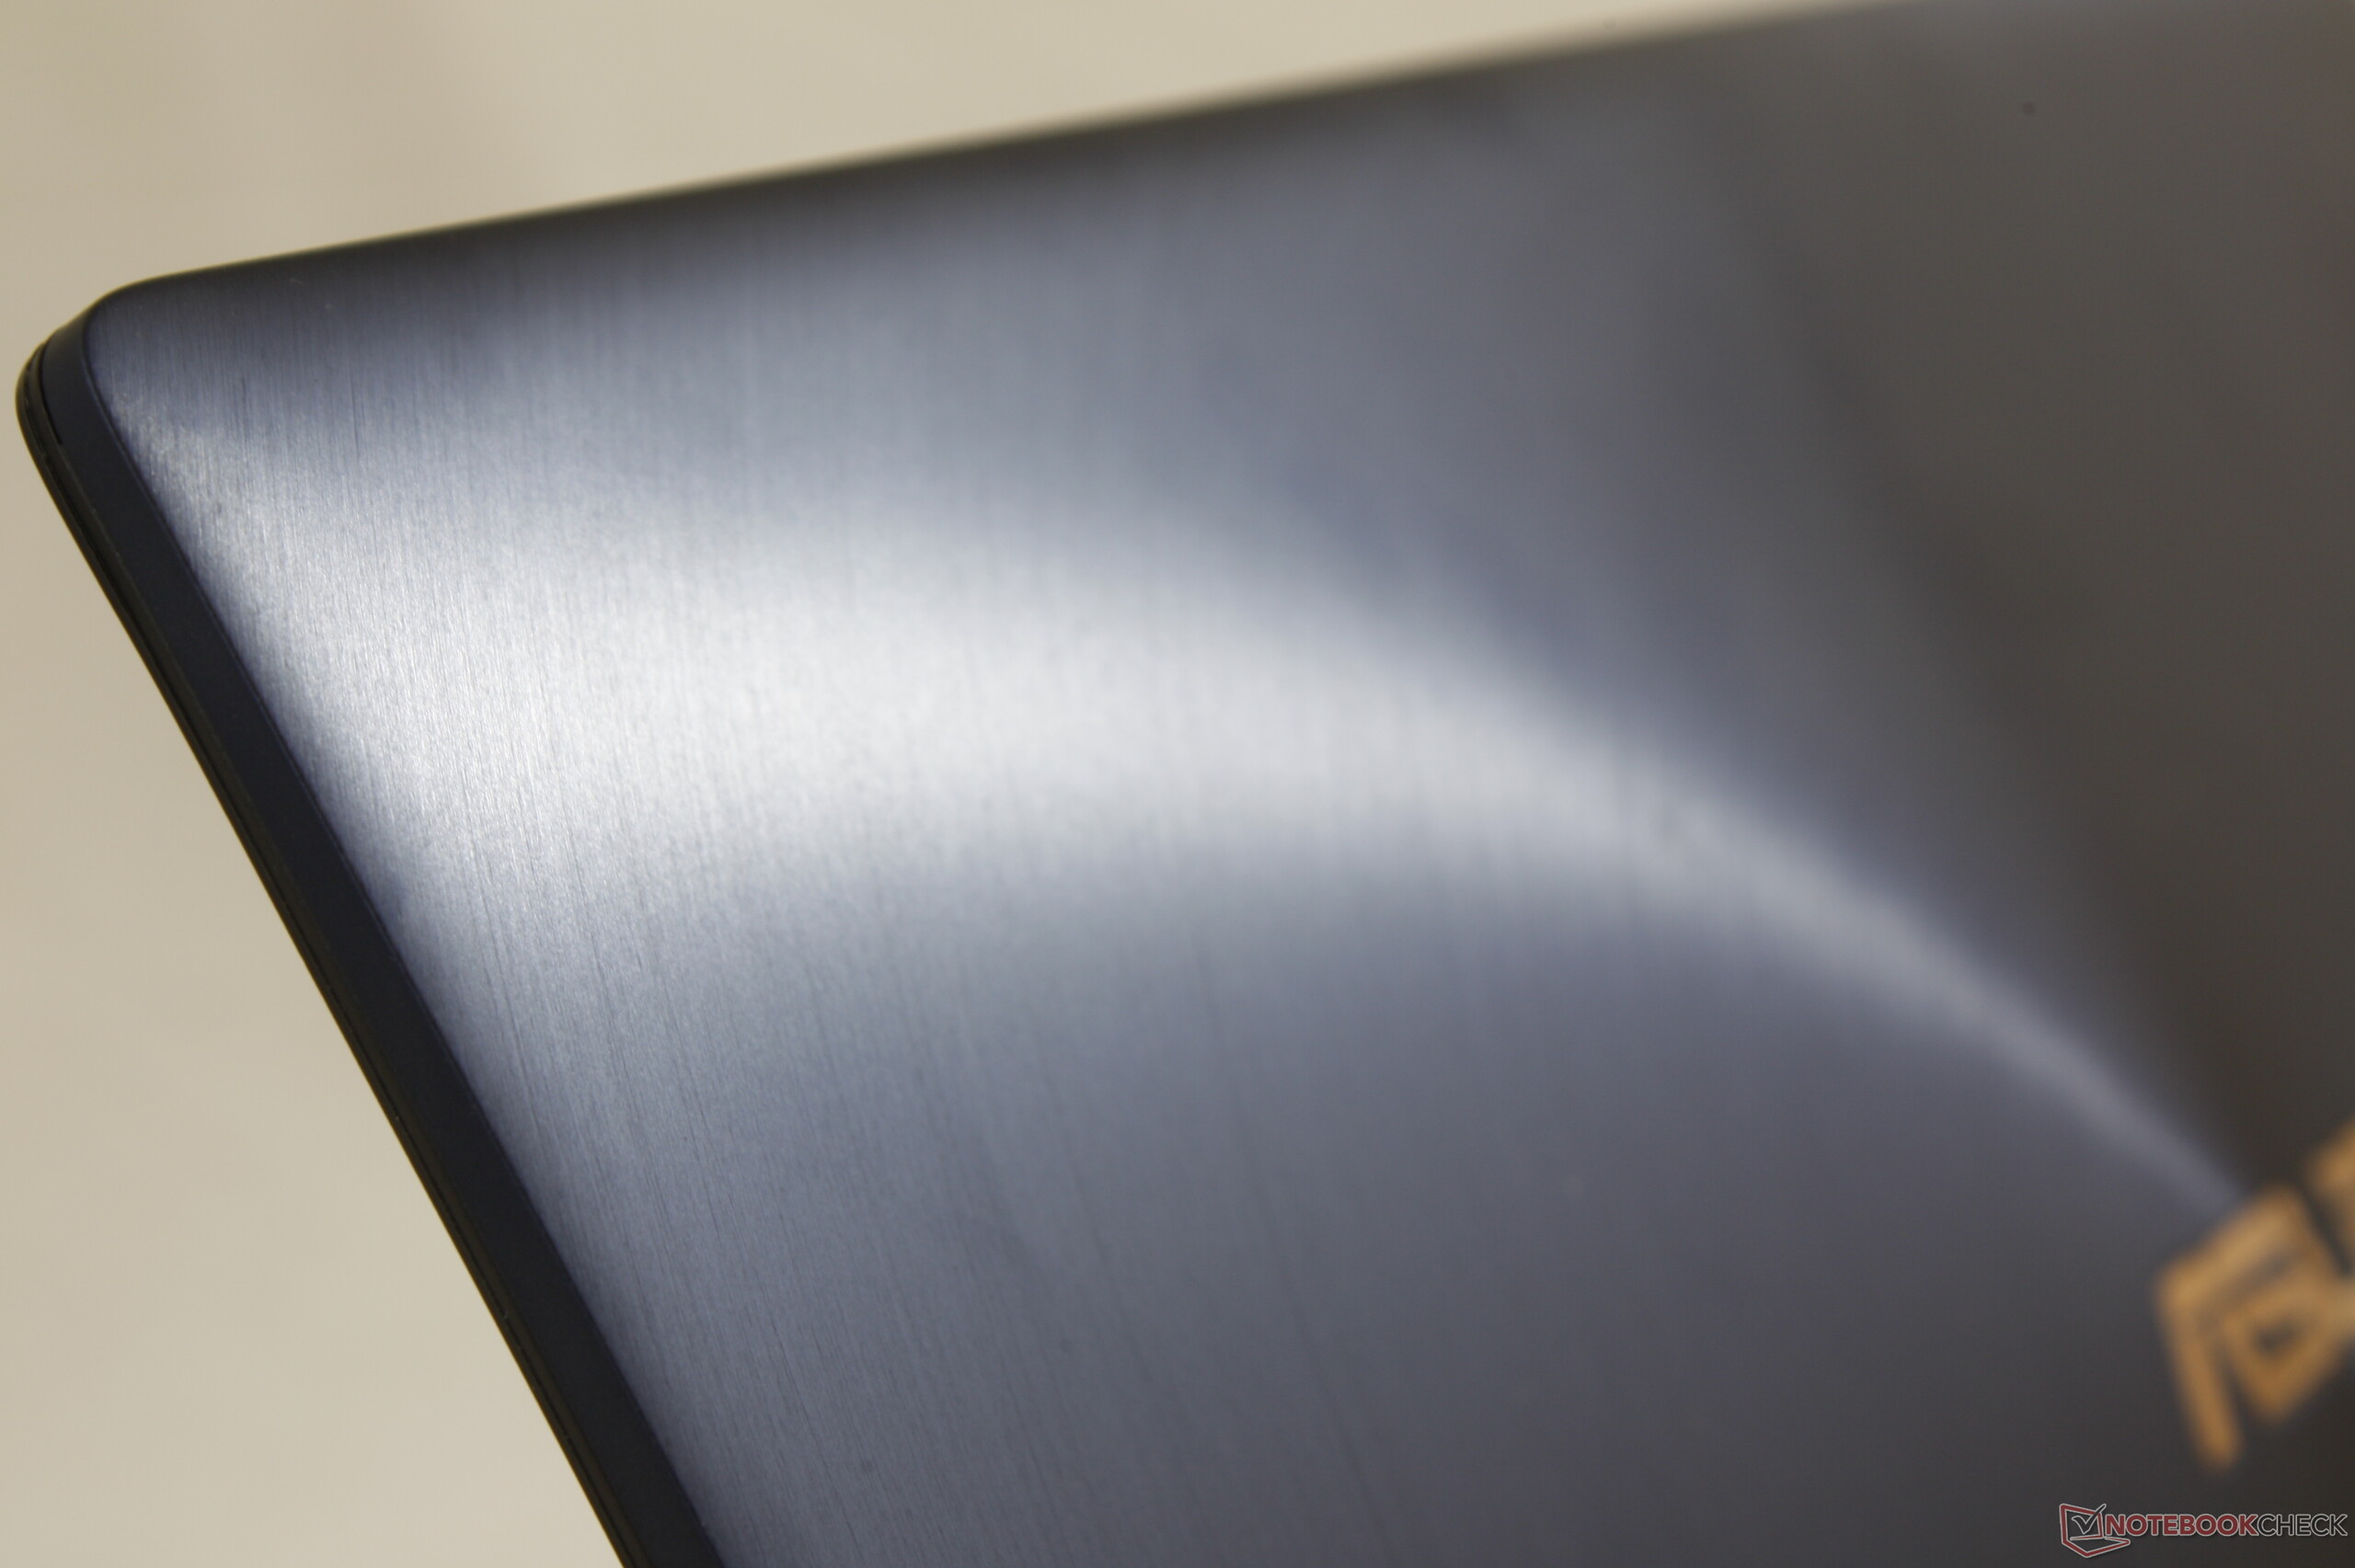
The ASUS ZenBook 14 UX433FA-A6061T is a slim, stylish and compact 14-inch laptop. Its metal case feels premium, and its Whiskey Lake Core i5 processor should provide enough power for most programs and uses. The A6061T is also pleasantly quiet, so you should have no problems with pushing it hard in a noise-sensitive environment.
The ZenBook 14 UX433FA-A6061T is a well-designed and powerful 14-inch laptop that is let down by its dark display and its BIOS.
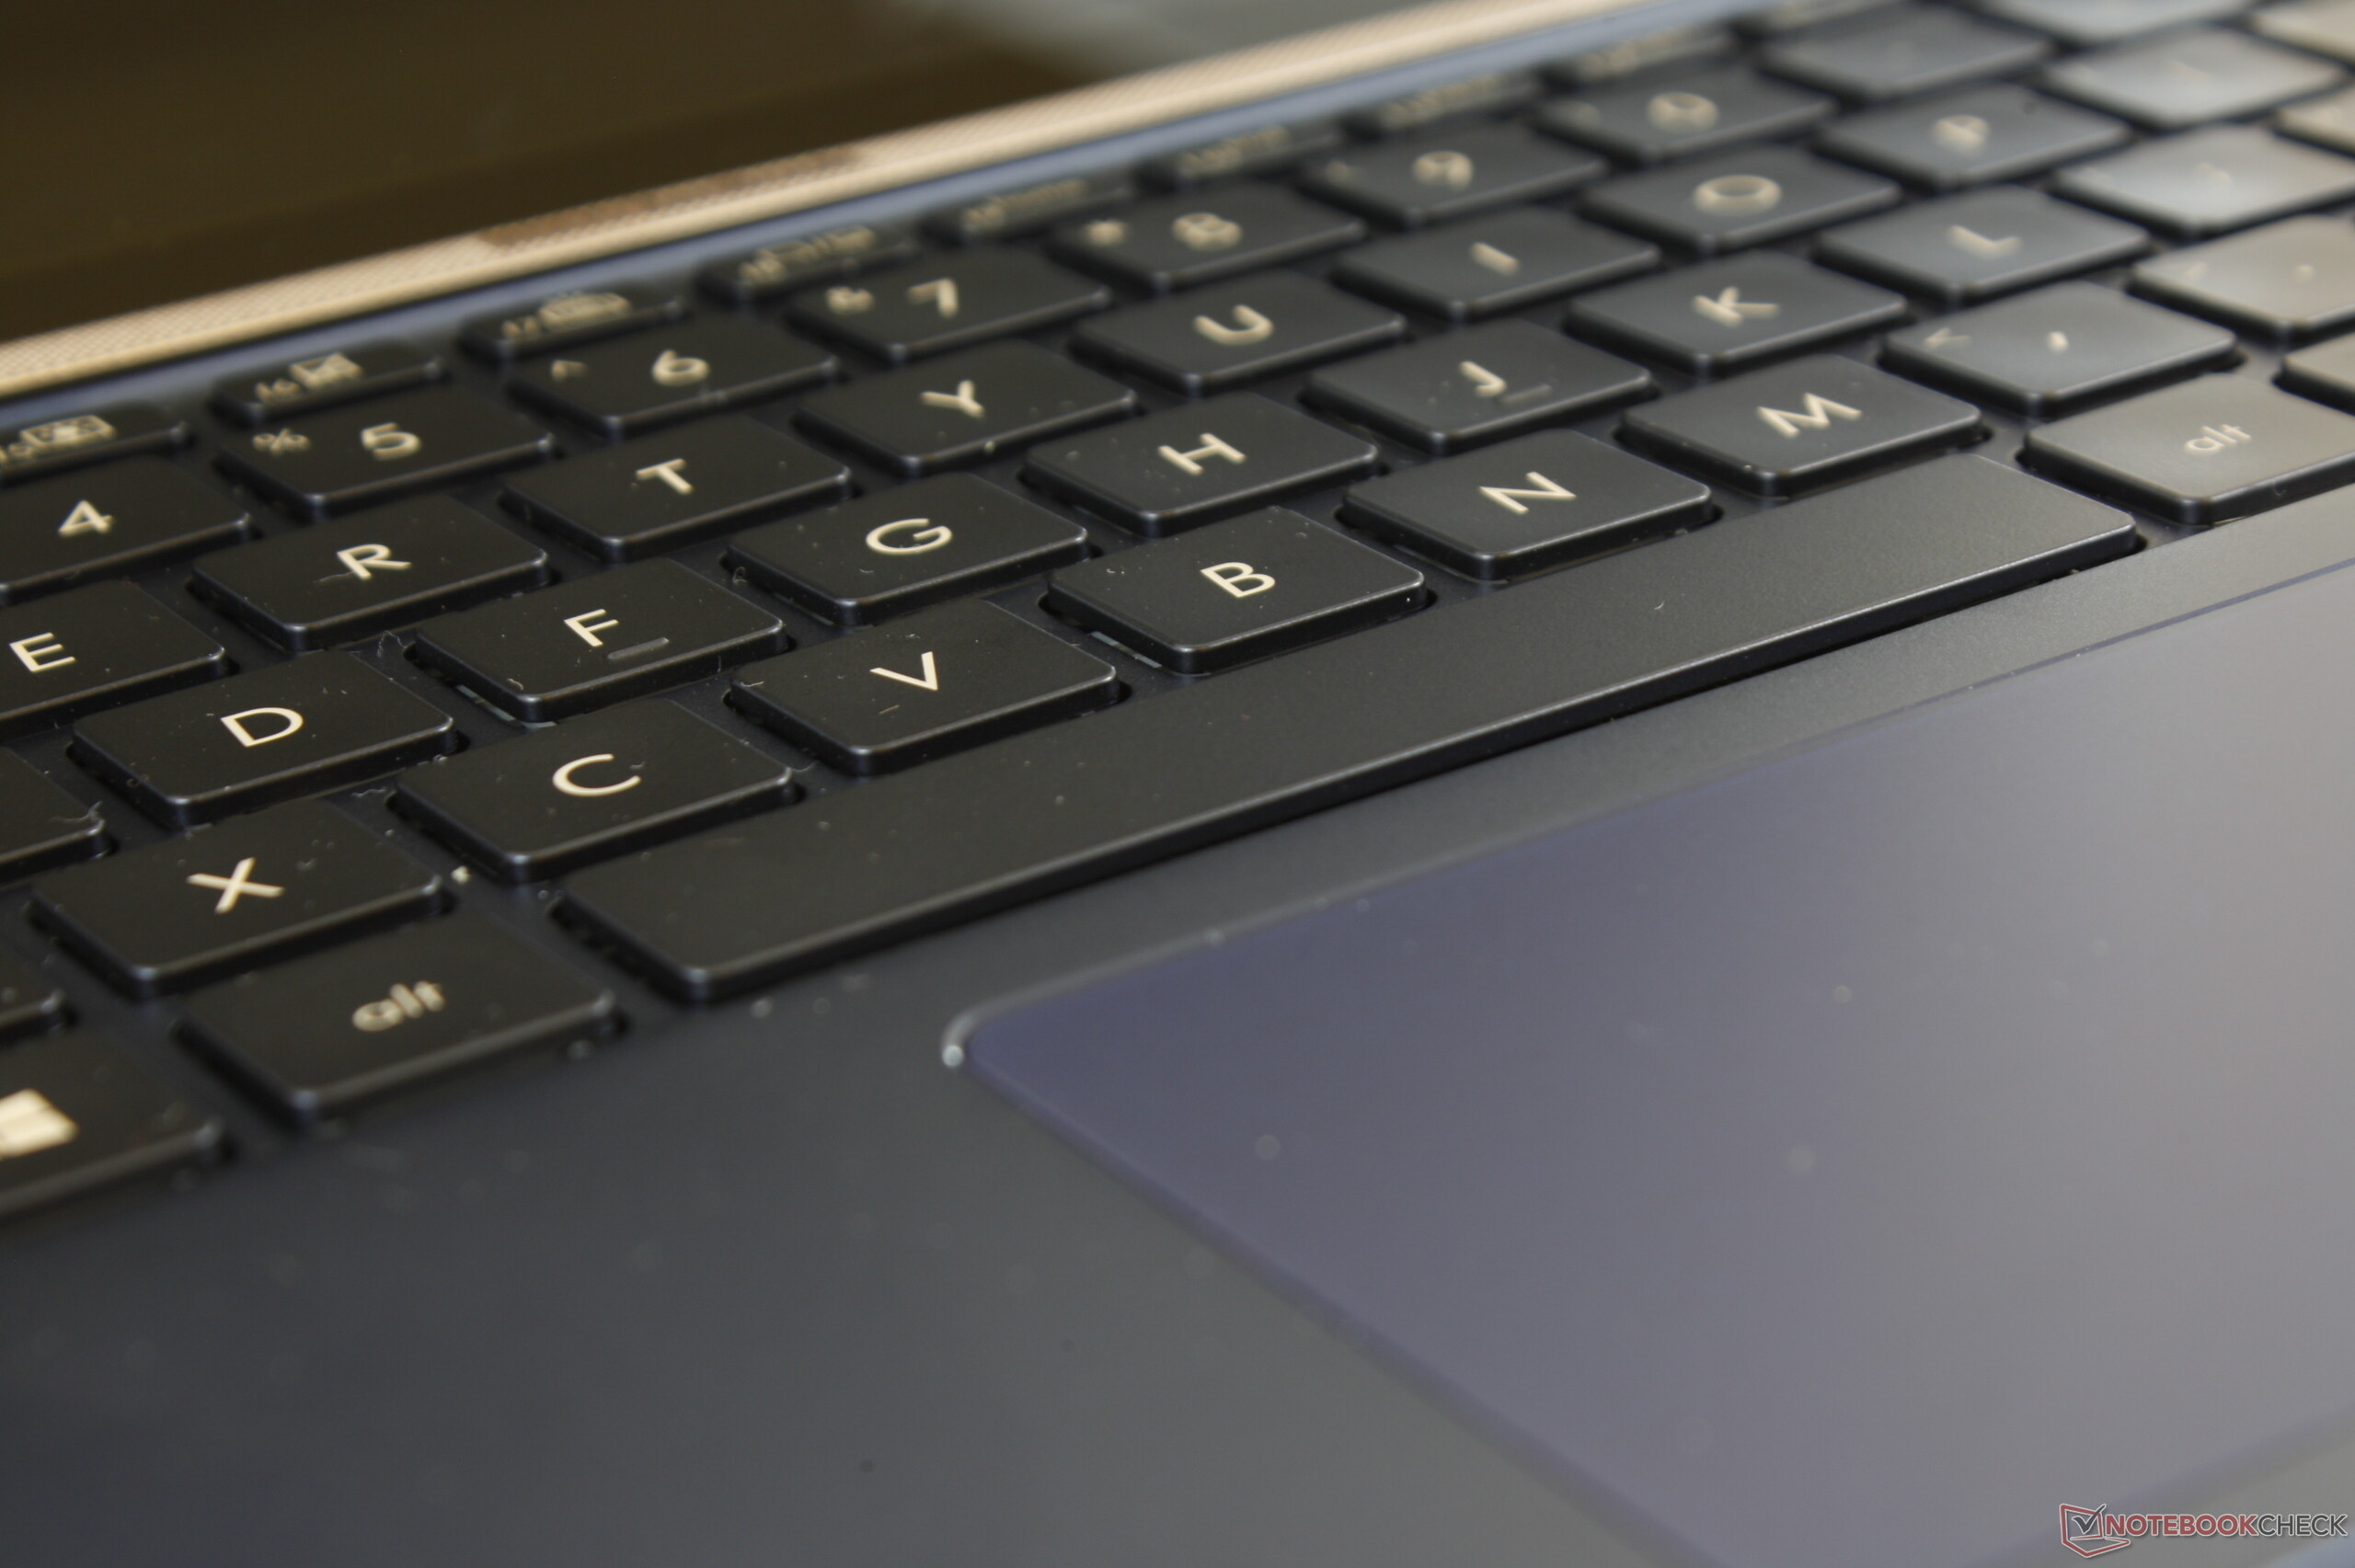
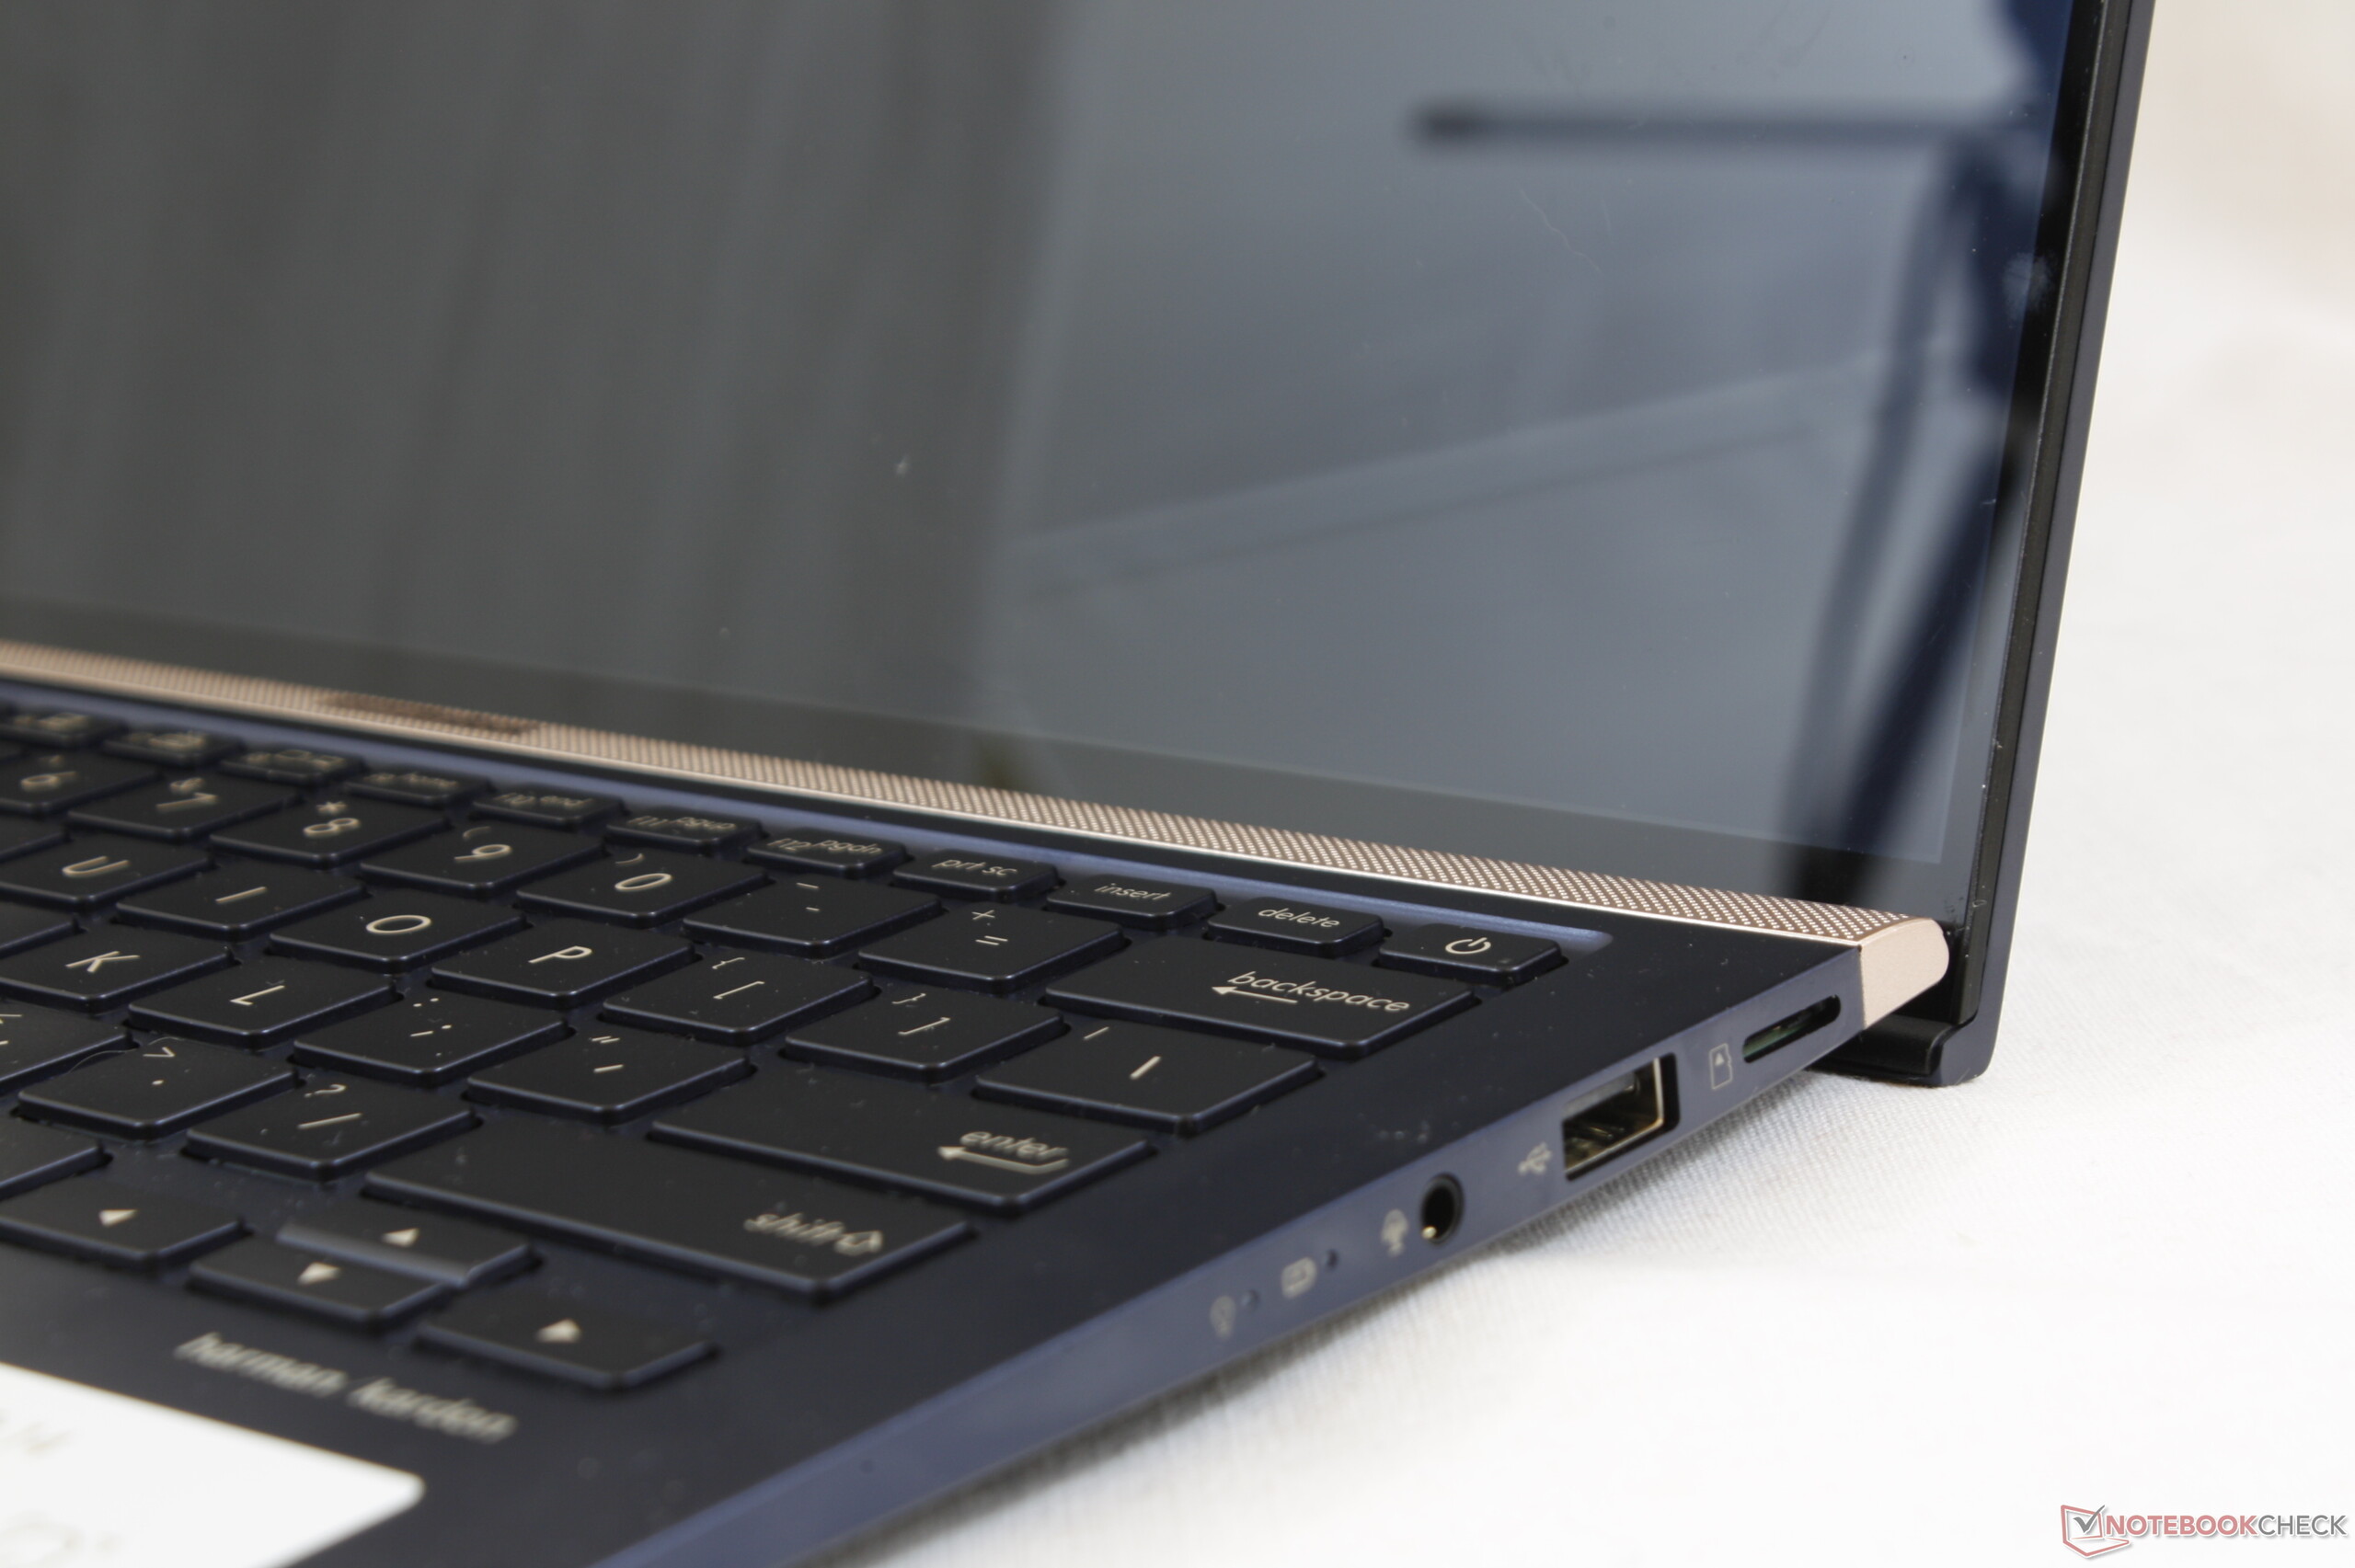
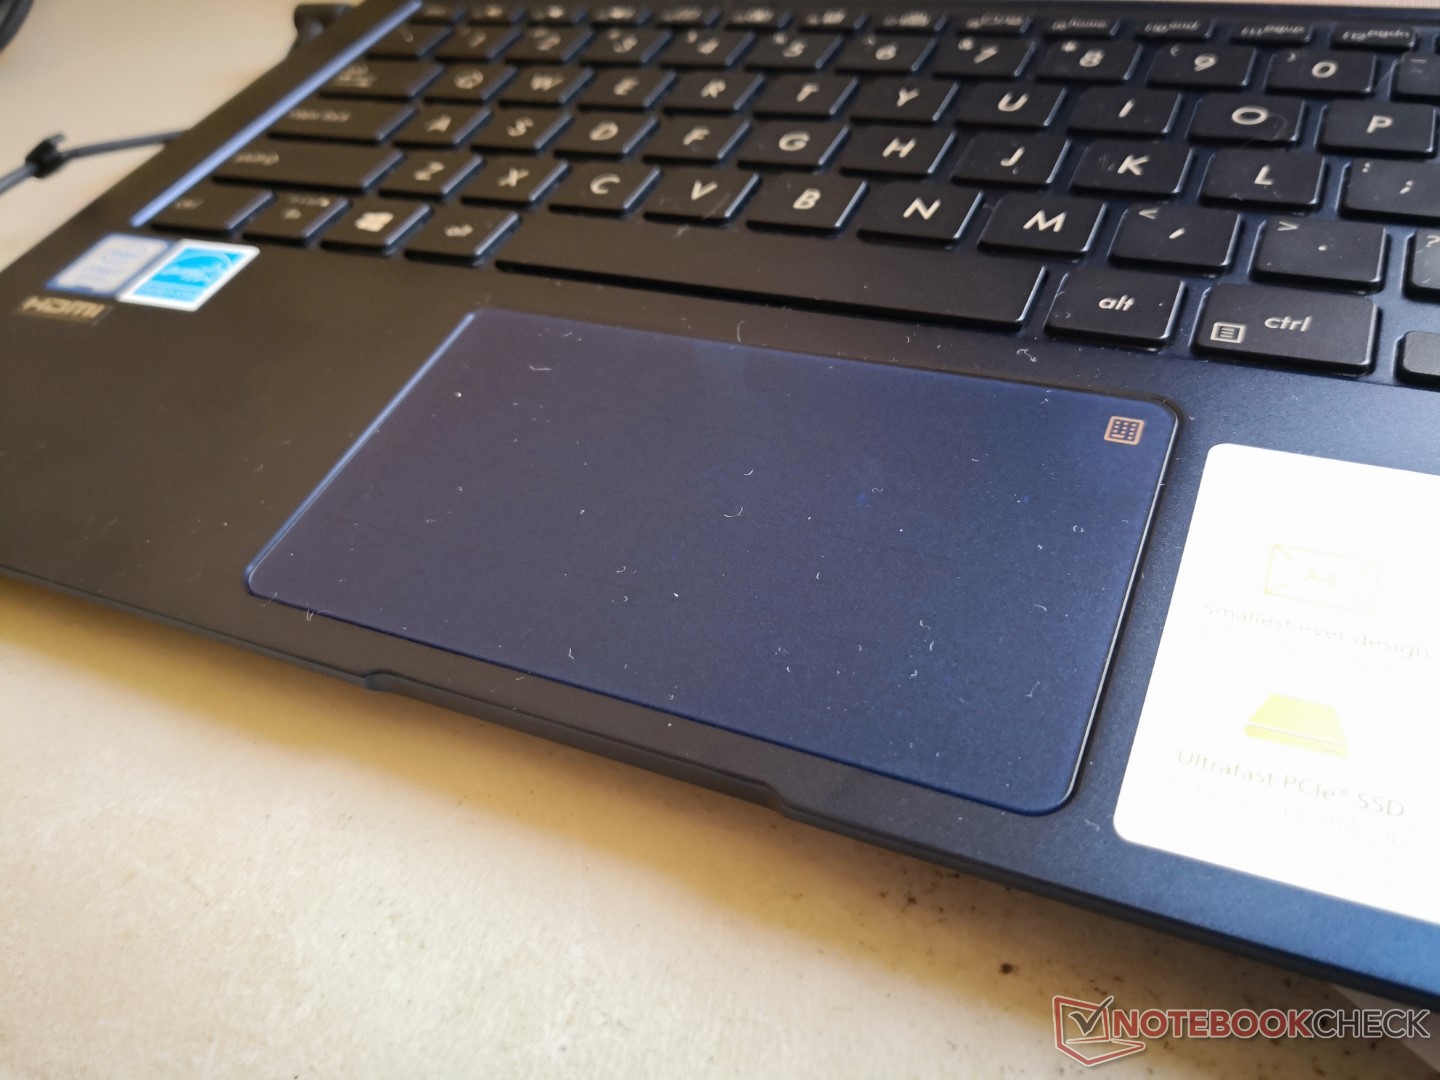
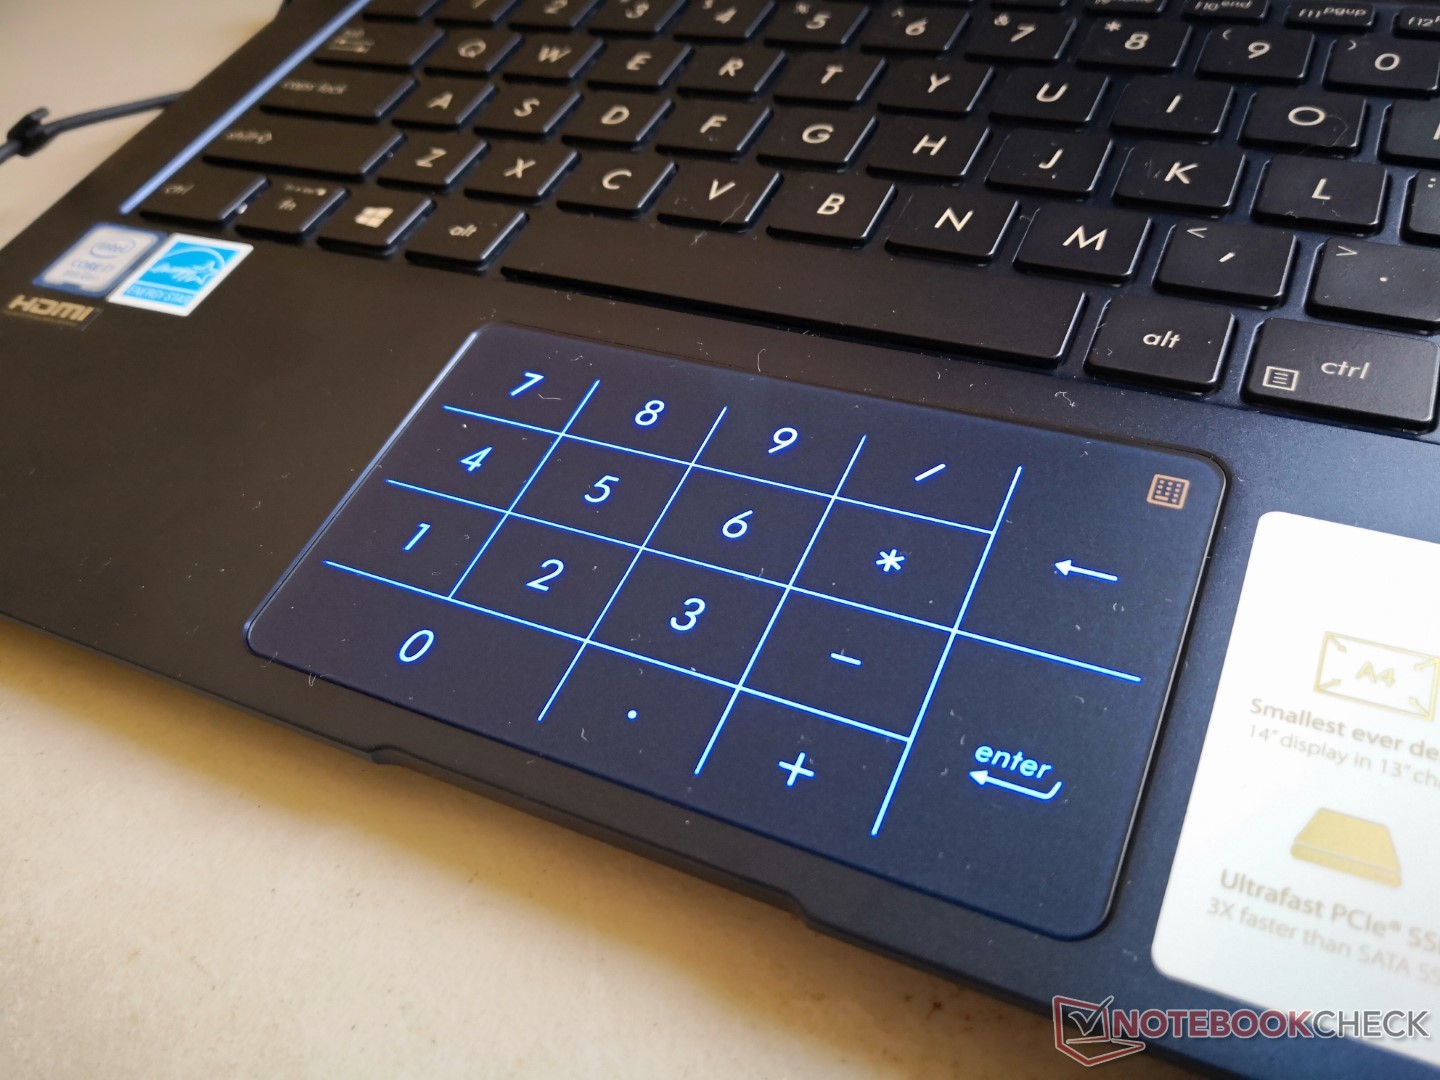
The inclusion of an NVMe SSD is welcome too as it ensures that the system runs smoothly. You can always swap the SSD if you run out of storage, but you must disassemble the device to do so. The keyboard is decent too, while its hidden number pad is fun, and it may prove useful to some people.
The UX433FA-A6061T also has good battery life, but curiously it is shorter than its more-powerful sibling, despite having an equally sized battery. Moreover, the IPS display has stable viewing angles and a good contrast ratio, but it is too dark in our opinion for a device that costs more than 1,000 Euros (~$1,140). We do not like that ASUS opted for a glossy screen as it is highly reflective, but that is a problem with most modern laptops.
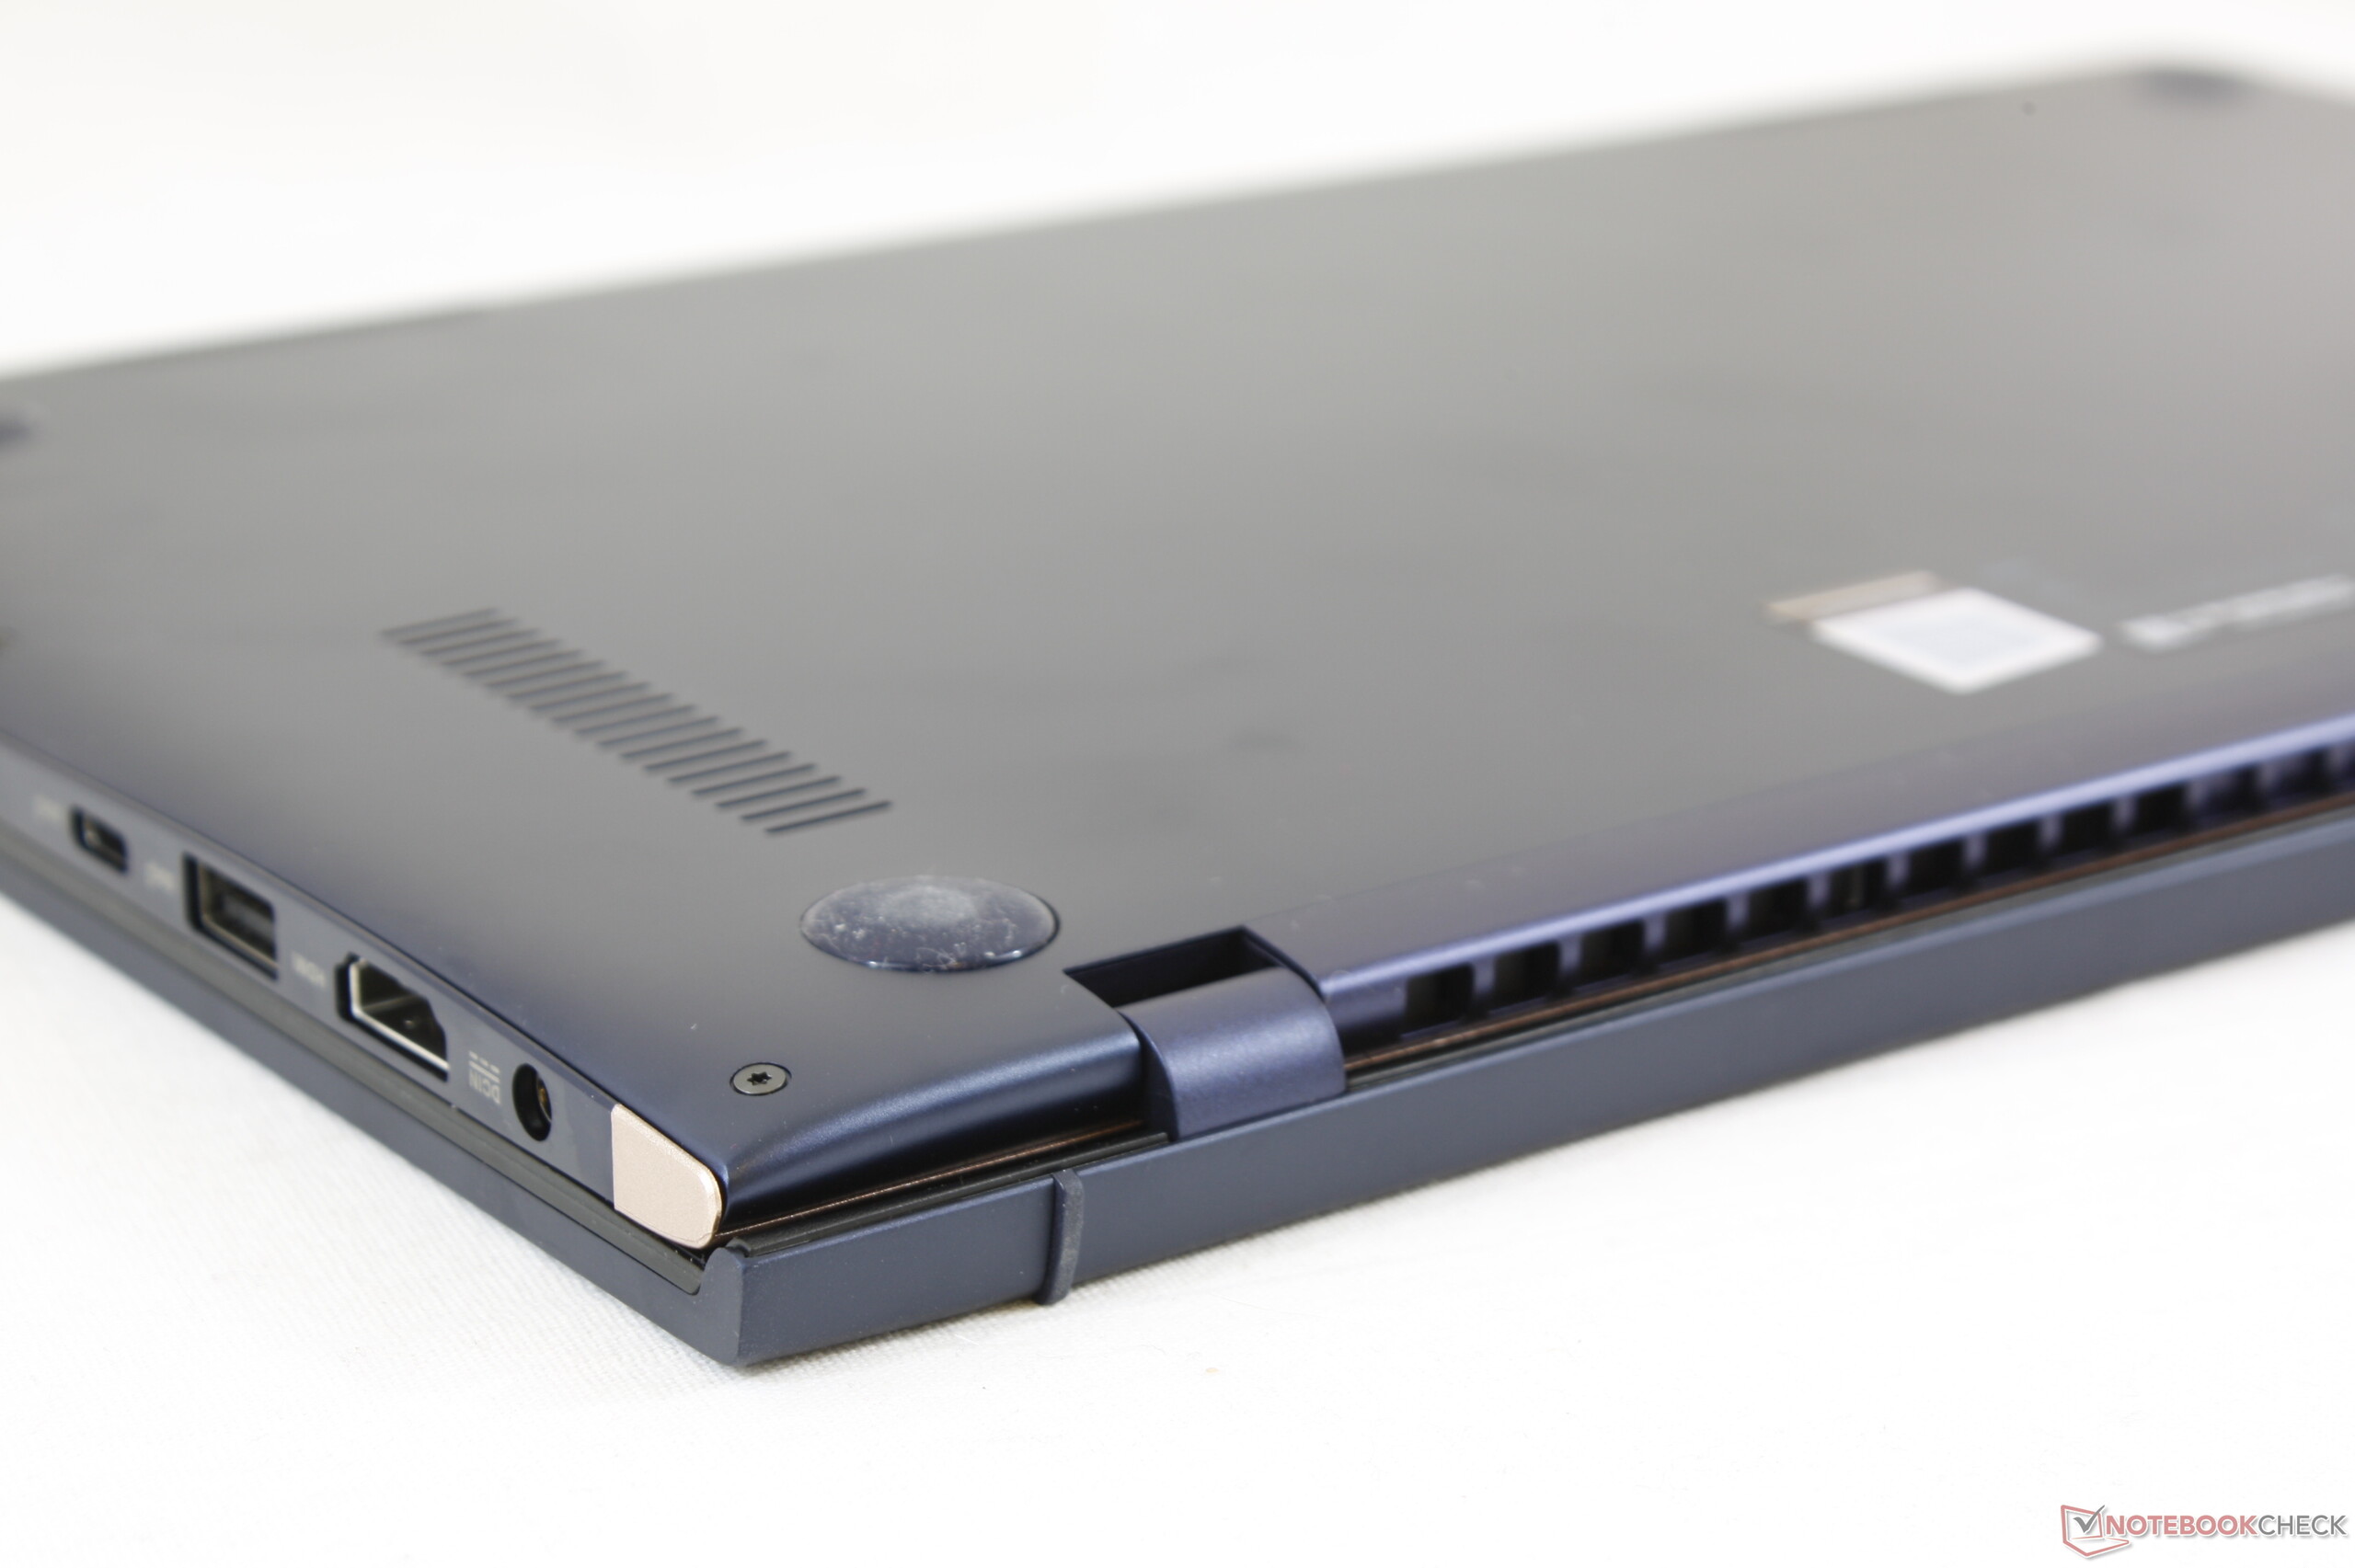
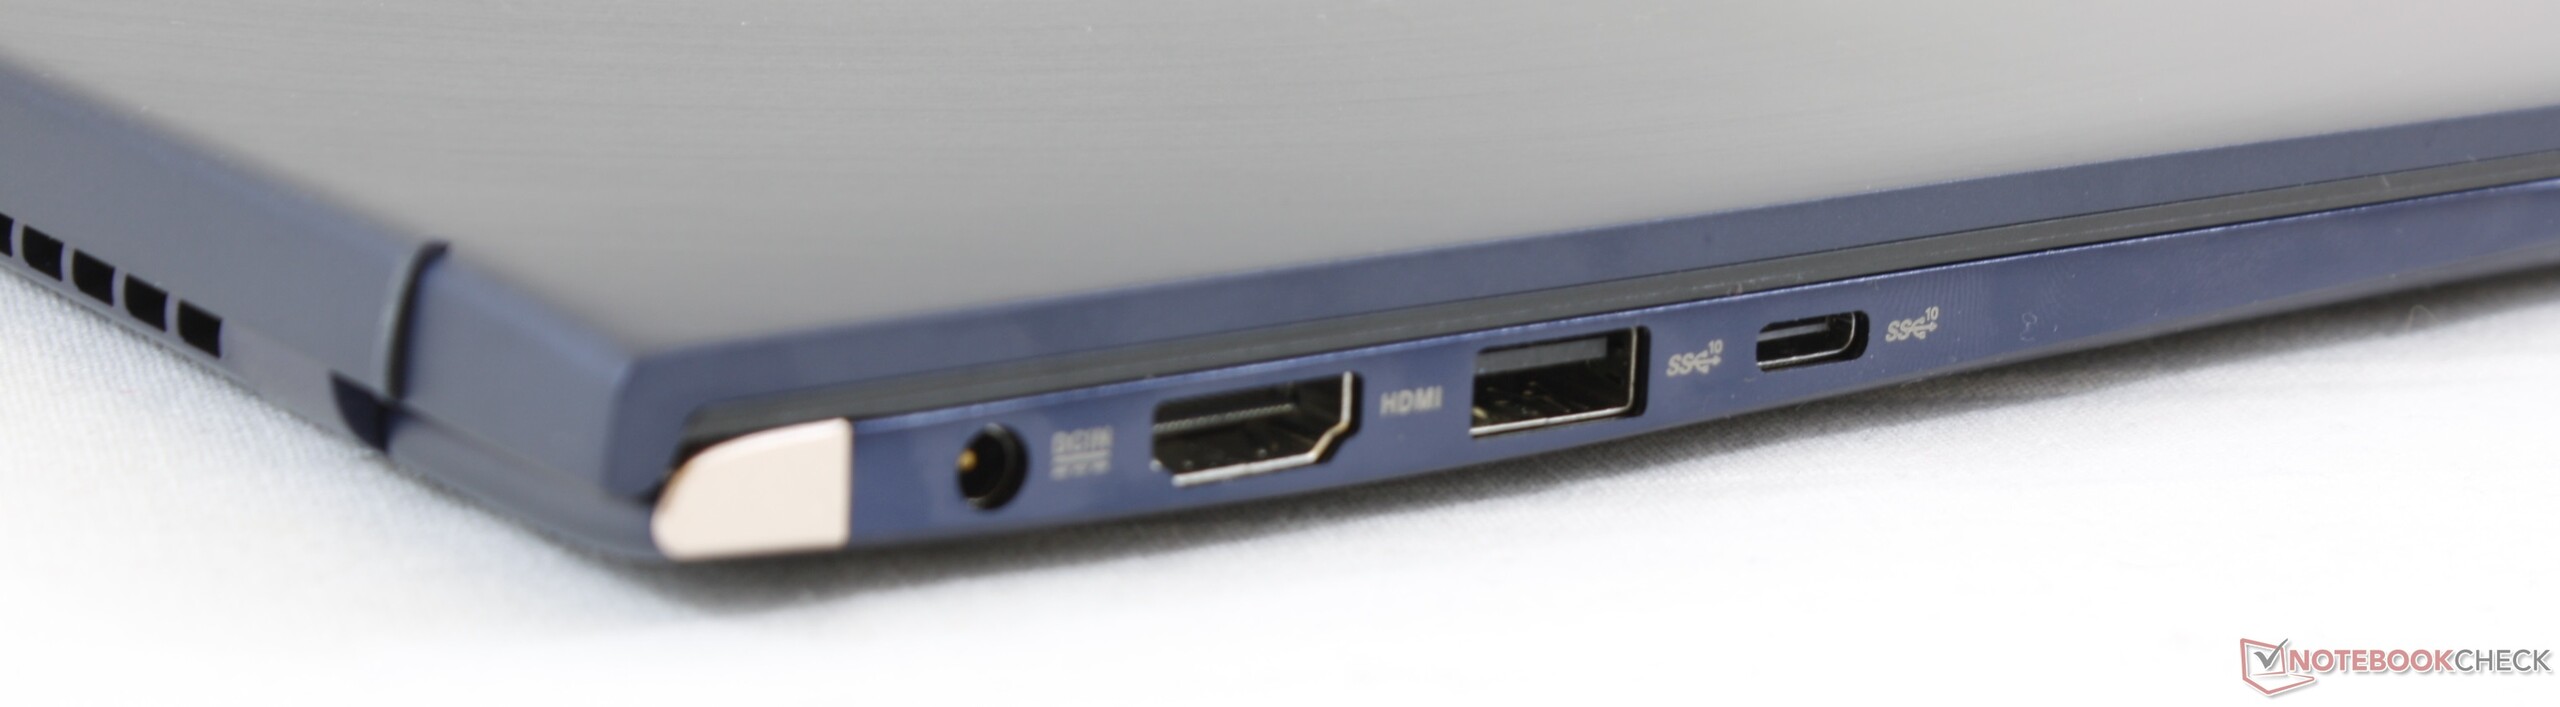
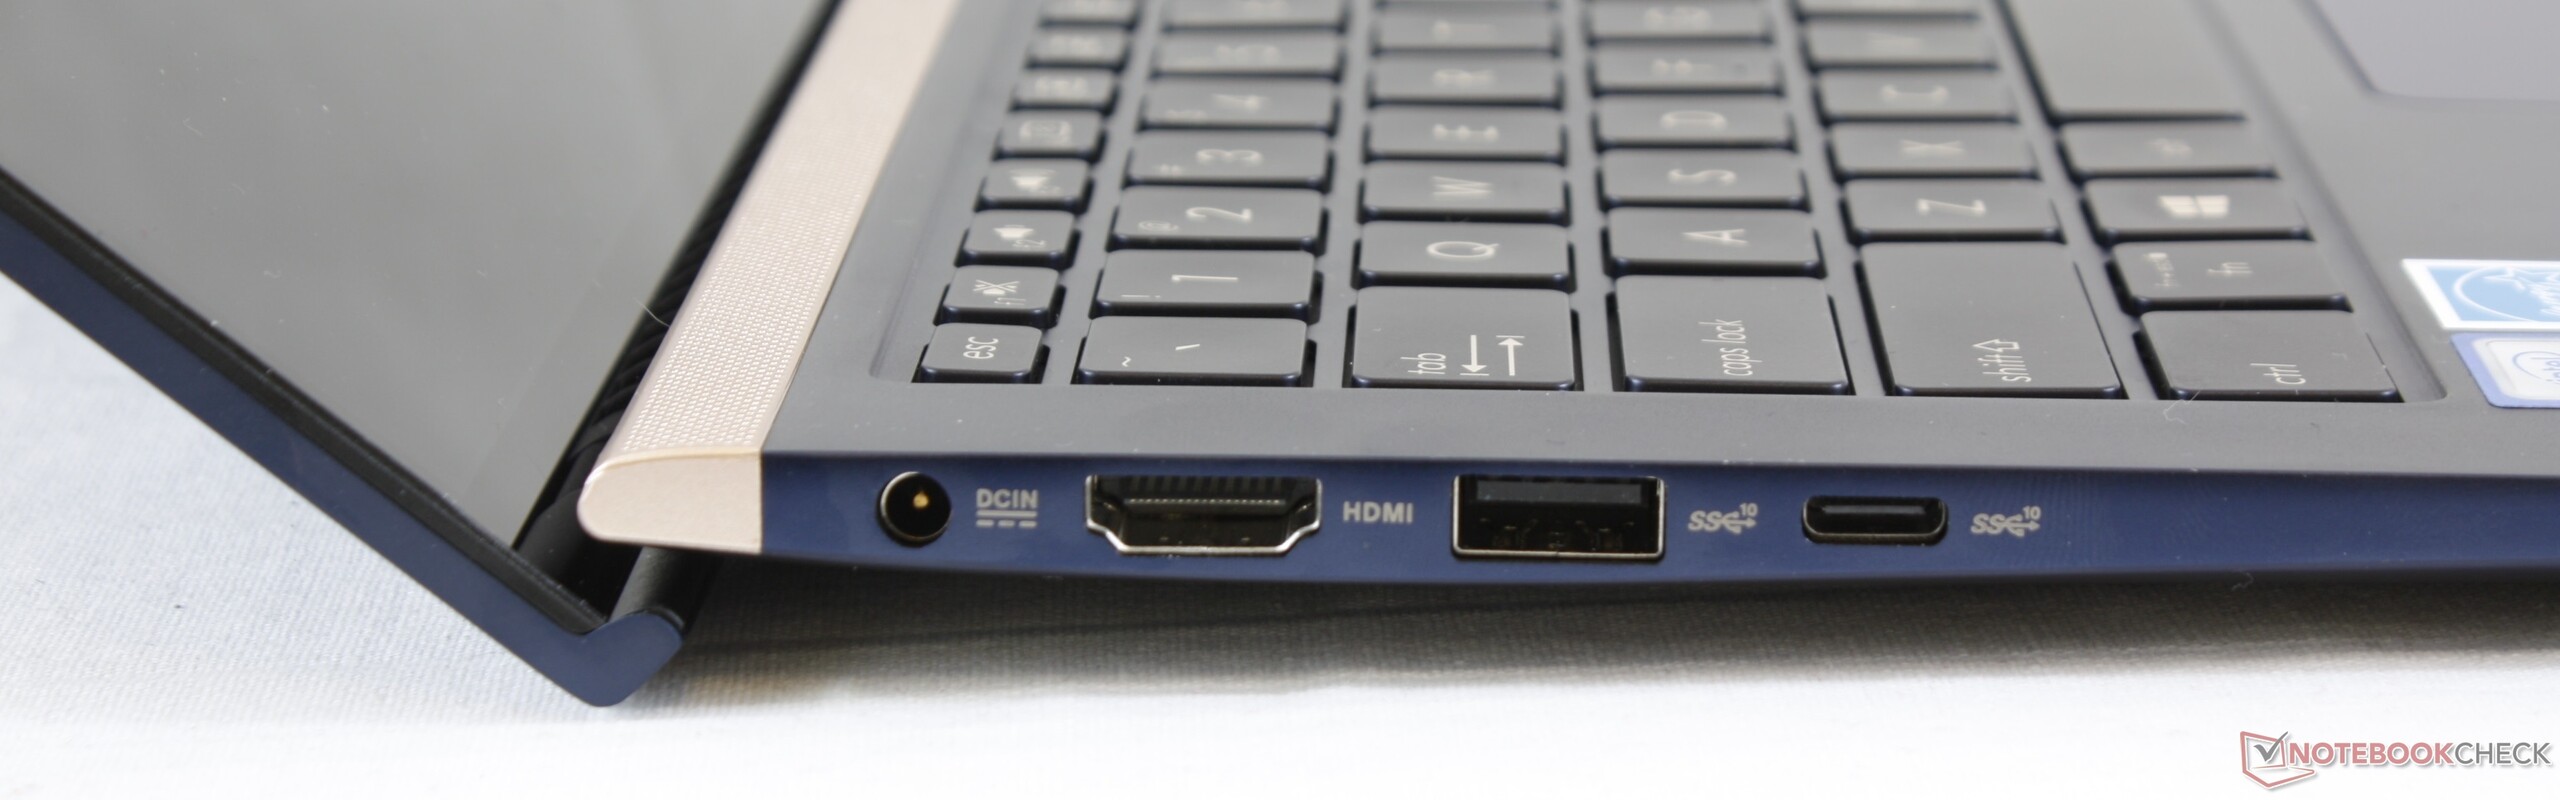
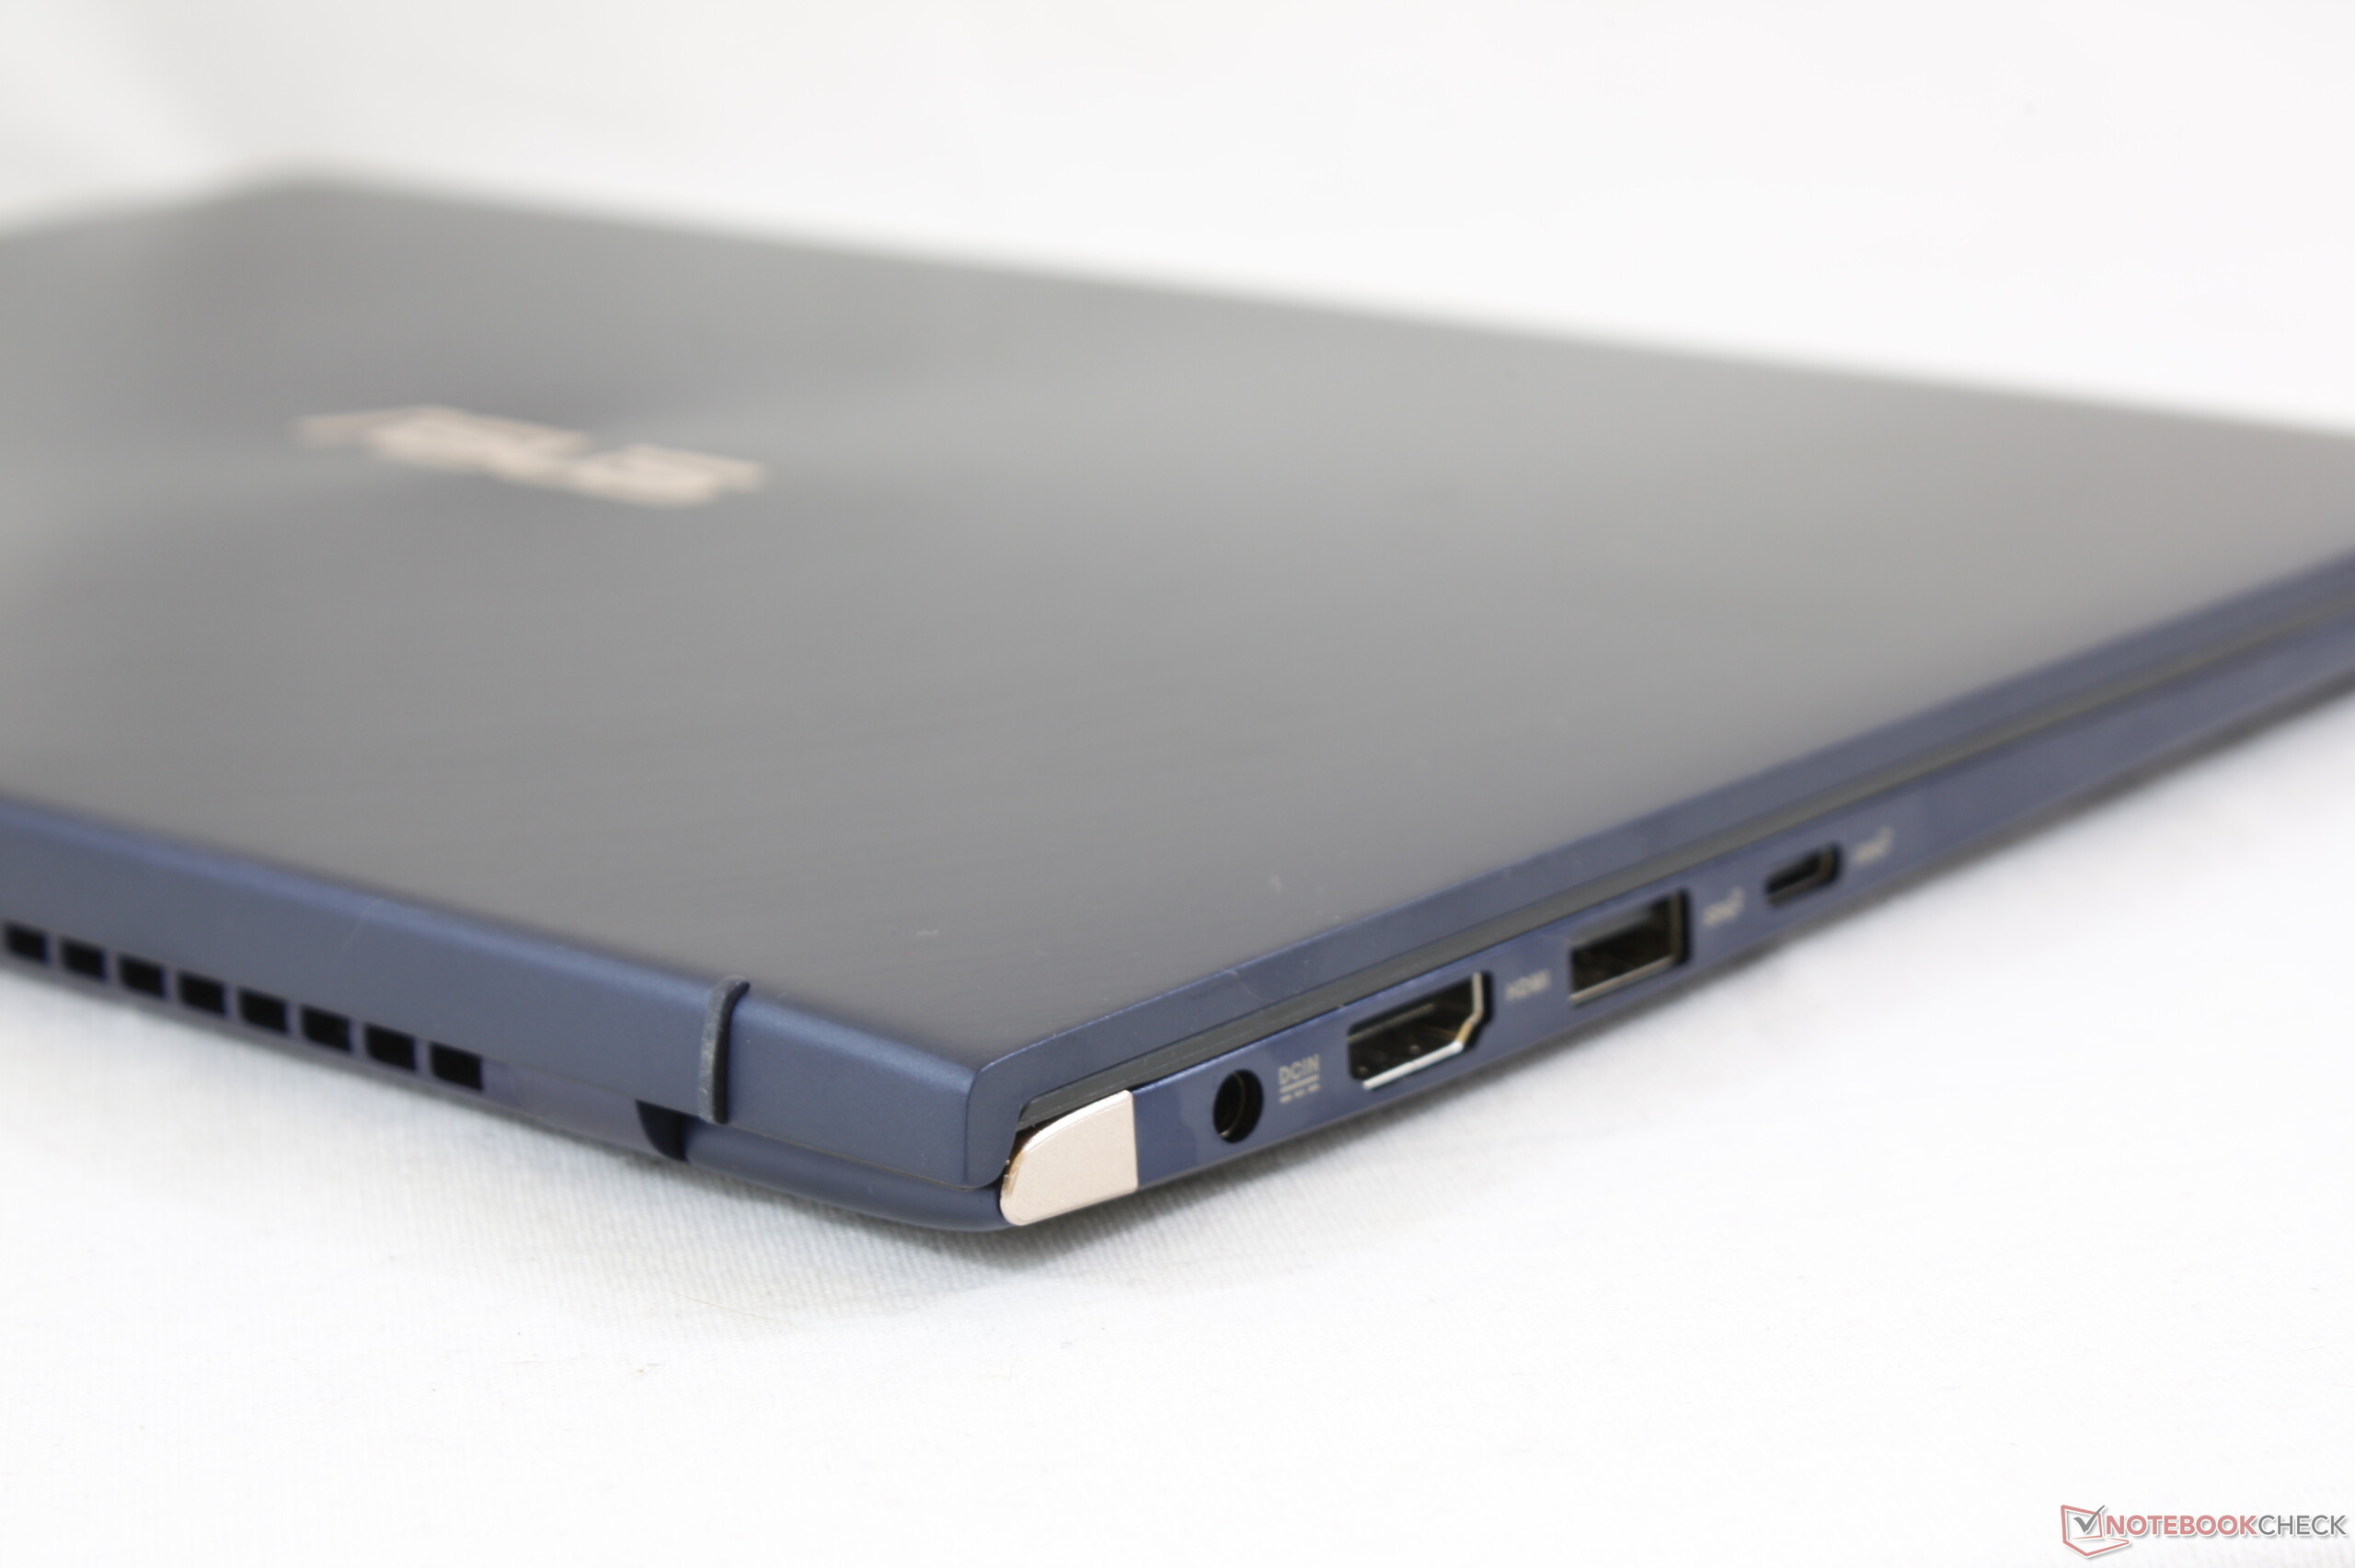
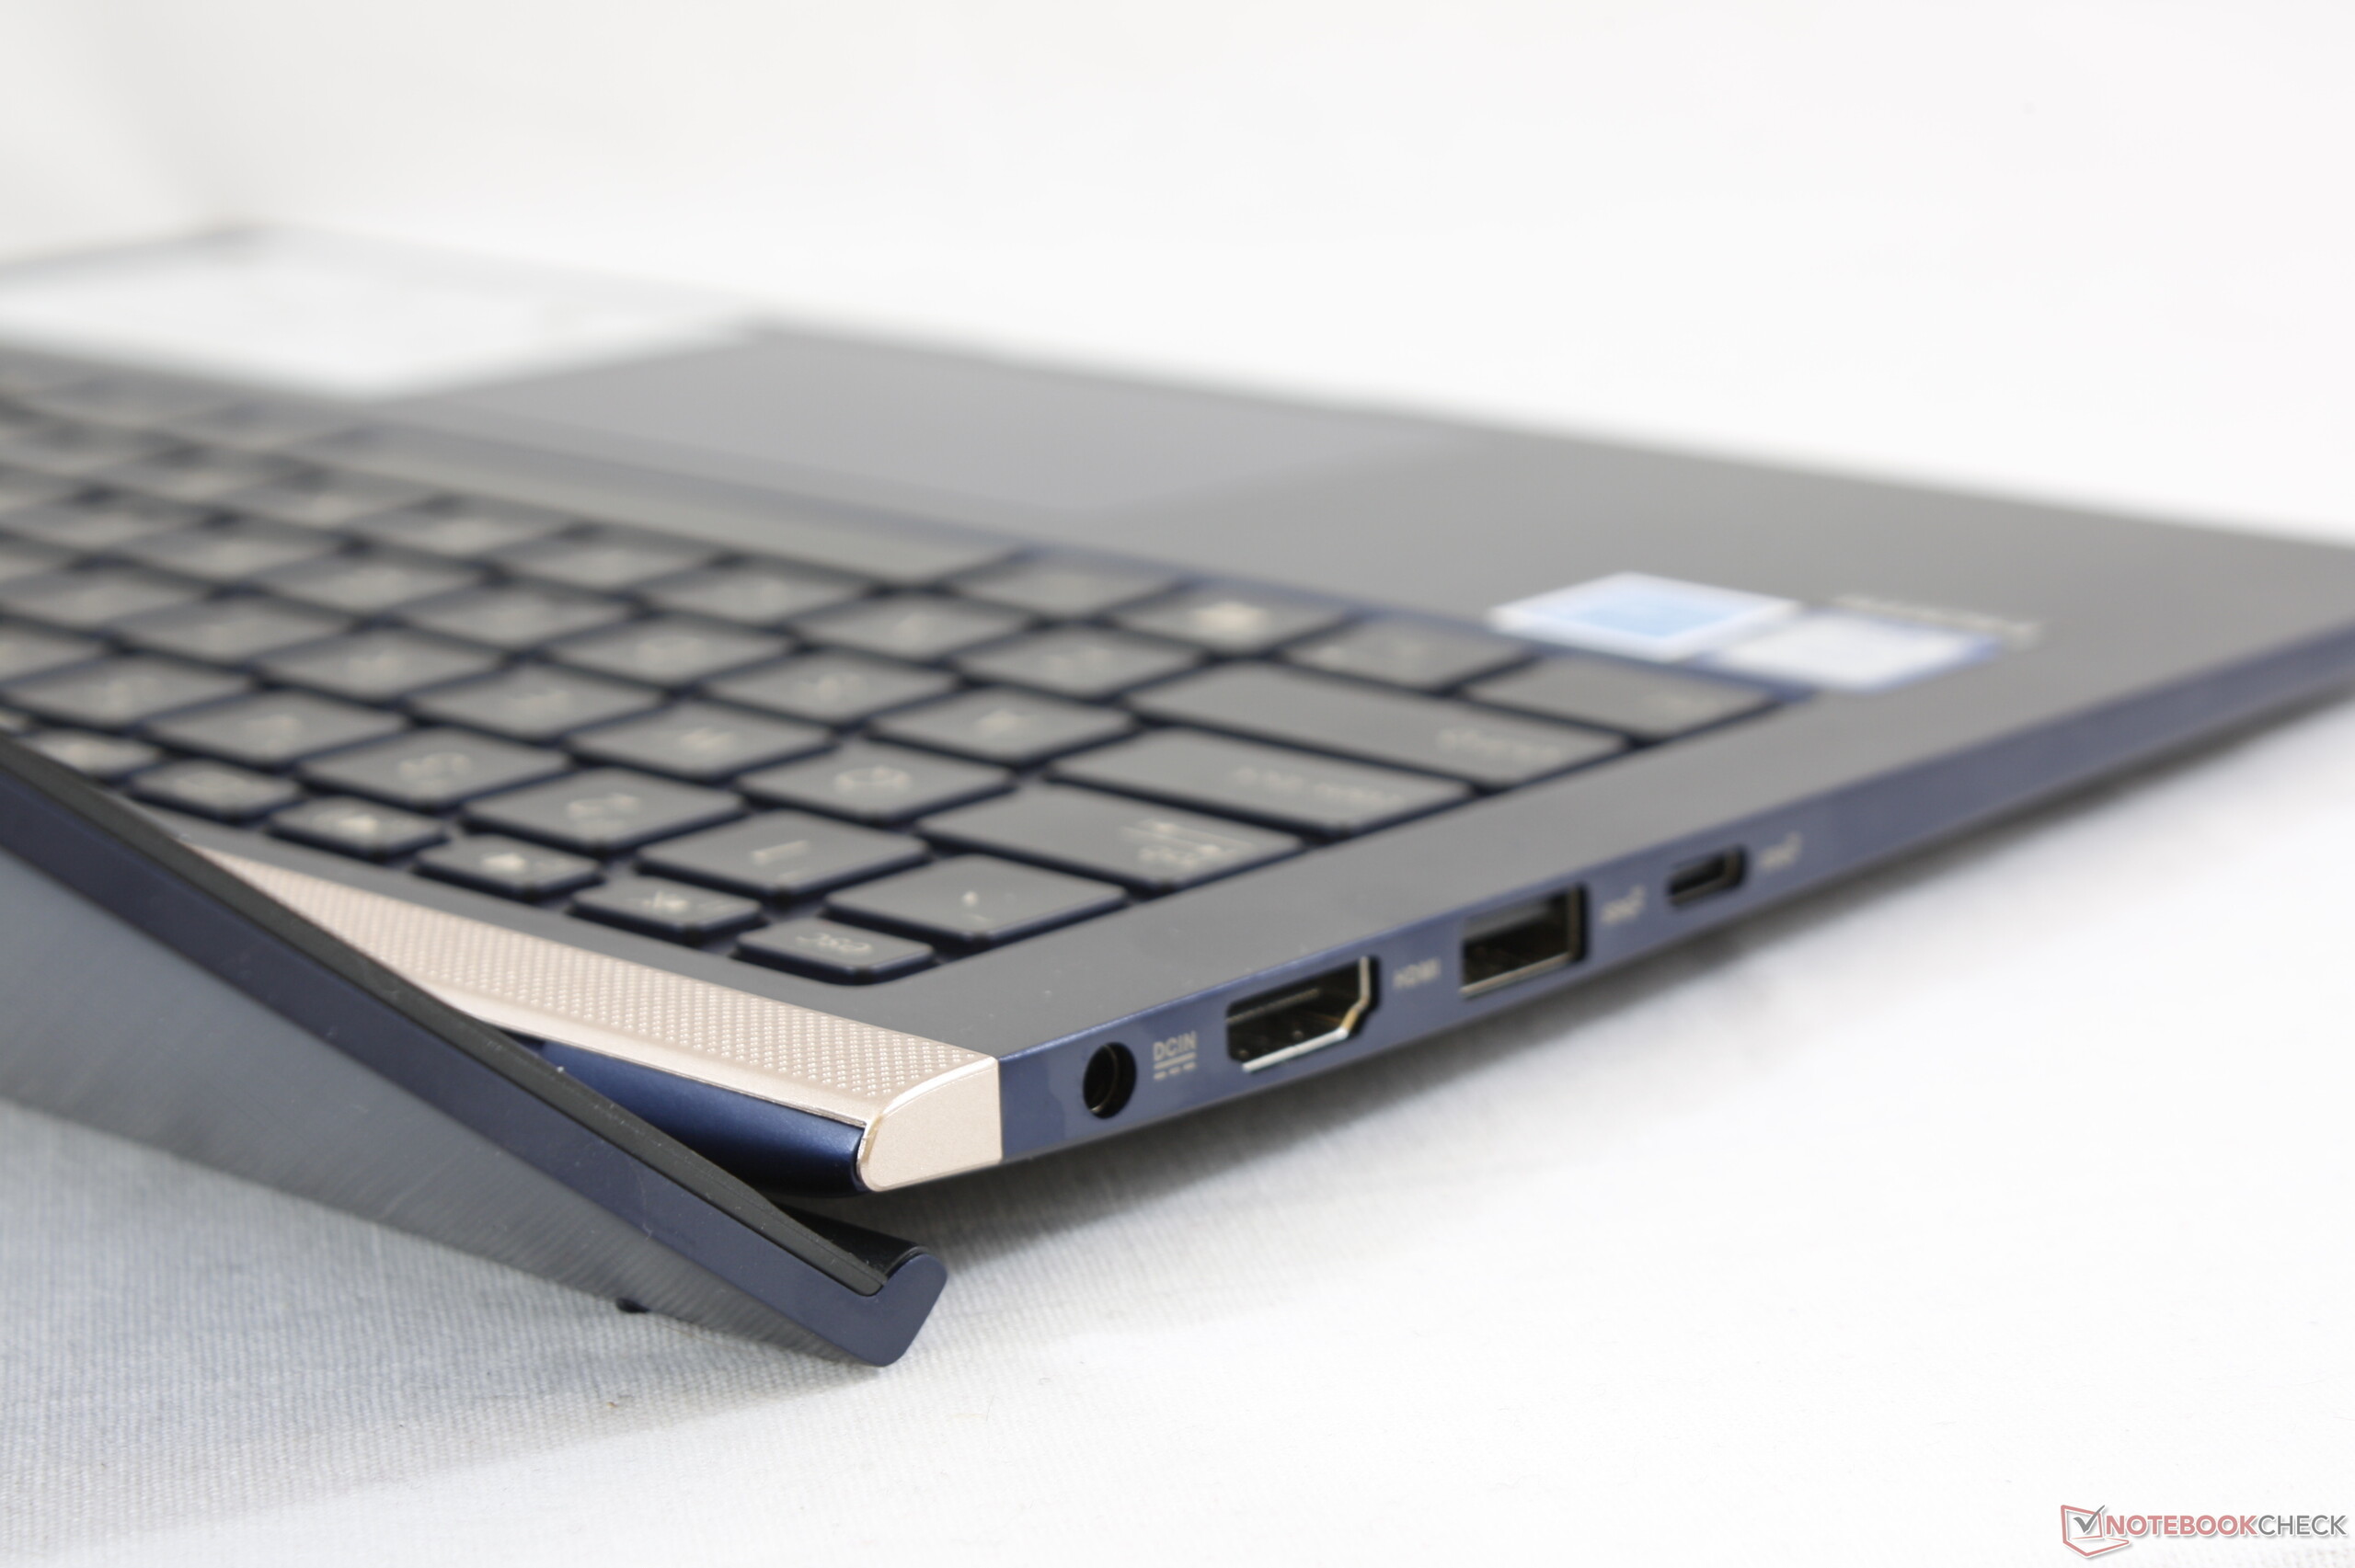
Oddly, the USB Type-C port cannot charge the device, nor does it support DisplayPort-out. We would have liked ASUS to have equipped the UX433FA with a Thunderbolt 3 port too as we have seen many OEMs starting to do this with their 1,000-Euro (~$1,140) laptops. Ultimately, its inclusion would have allowed people to connect external GPUs, which is still a niche market.
Overall, the UX433FA-A6061T is a decent 14-inch laptop that has a lot going for it, but it only beats the UX433FA-A6076T on price. The A6061T cannot better maintain its performance or last longer than its more-expensive sibling as we had expected, which is disappointing. This does not prevent the UX433FA-A6061T from achieving an excellent overall score though.
Asus Zenbook 14 UX433FA-A6018T
- 02/08/2019 v6 (old)
Sascha Mölck
Price comparison

