Asus ZenBook 14 UX433F (i7-8565U) Laptop Review
Asus has been doubling down on narrow bezels at a quicker pace than many of its competitors. After launching the first 17-inch gaming laptop with narrow bezels a couple of months ago, the OEM is now ready to introduce a new ultrathin Zenbook series with narrow bezels on all four sides of the display. In contrast, the Spectre x360 13 and XPS 13 have narrow bezels on only two and threes sides of the display, respectively.
The new Zenbook family consists of 13.3-inch (UX333), 14.0-inch (UX433), and 15.6-inch (UX533) offerings that all share similar design features. We recommend checking out the original announcement here for a quick comparison between the UX333, UX433, and UX533.
Our unit under review today is the Zenbook UX433FA equipped with 8 GB of LPDDR3 RAM, a 1080p IPS display, 512 GB NVMe SSD, and the new Whiskey Lake Core i7-8565U CPU for $1200 USD. The CPU and display resolution are fixed while RAM can go up to 16 GB and storage can start at 128 GB. A GeForce MX150 GPU option is planned but not yet available at the time of writing. The Zenbook UX433 is a successor to the Zenbook UX430 and it's set to compete directly with alternatives like the 13.9-inch Huawei MateBook X Pro, 13.9-inch Lenovo Yoga C930, 14-inch Acer Swift 5, and 14-inch HP Pavilion 14.
More Asus Zenbook reviews:
Case
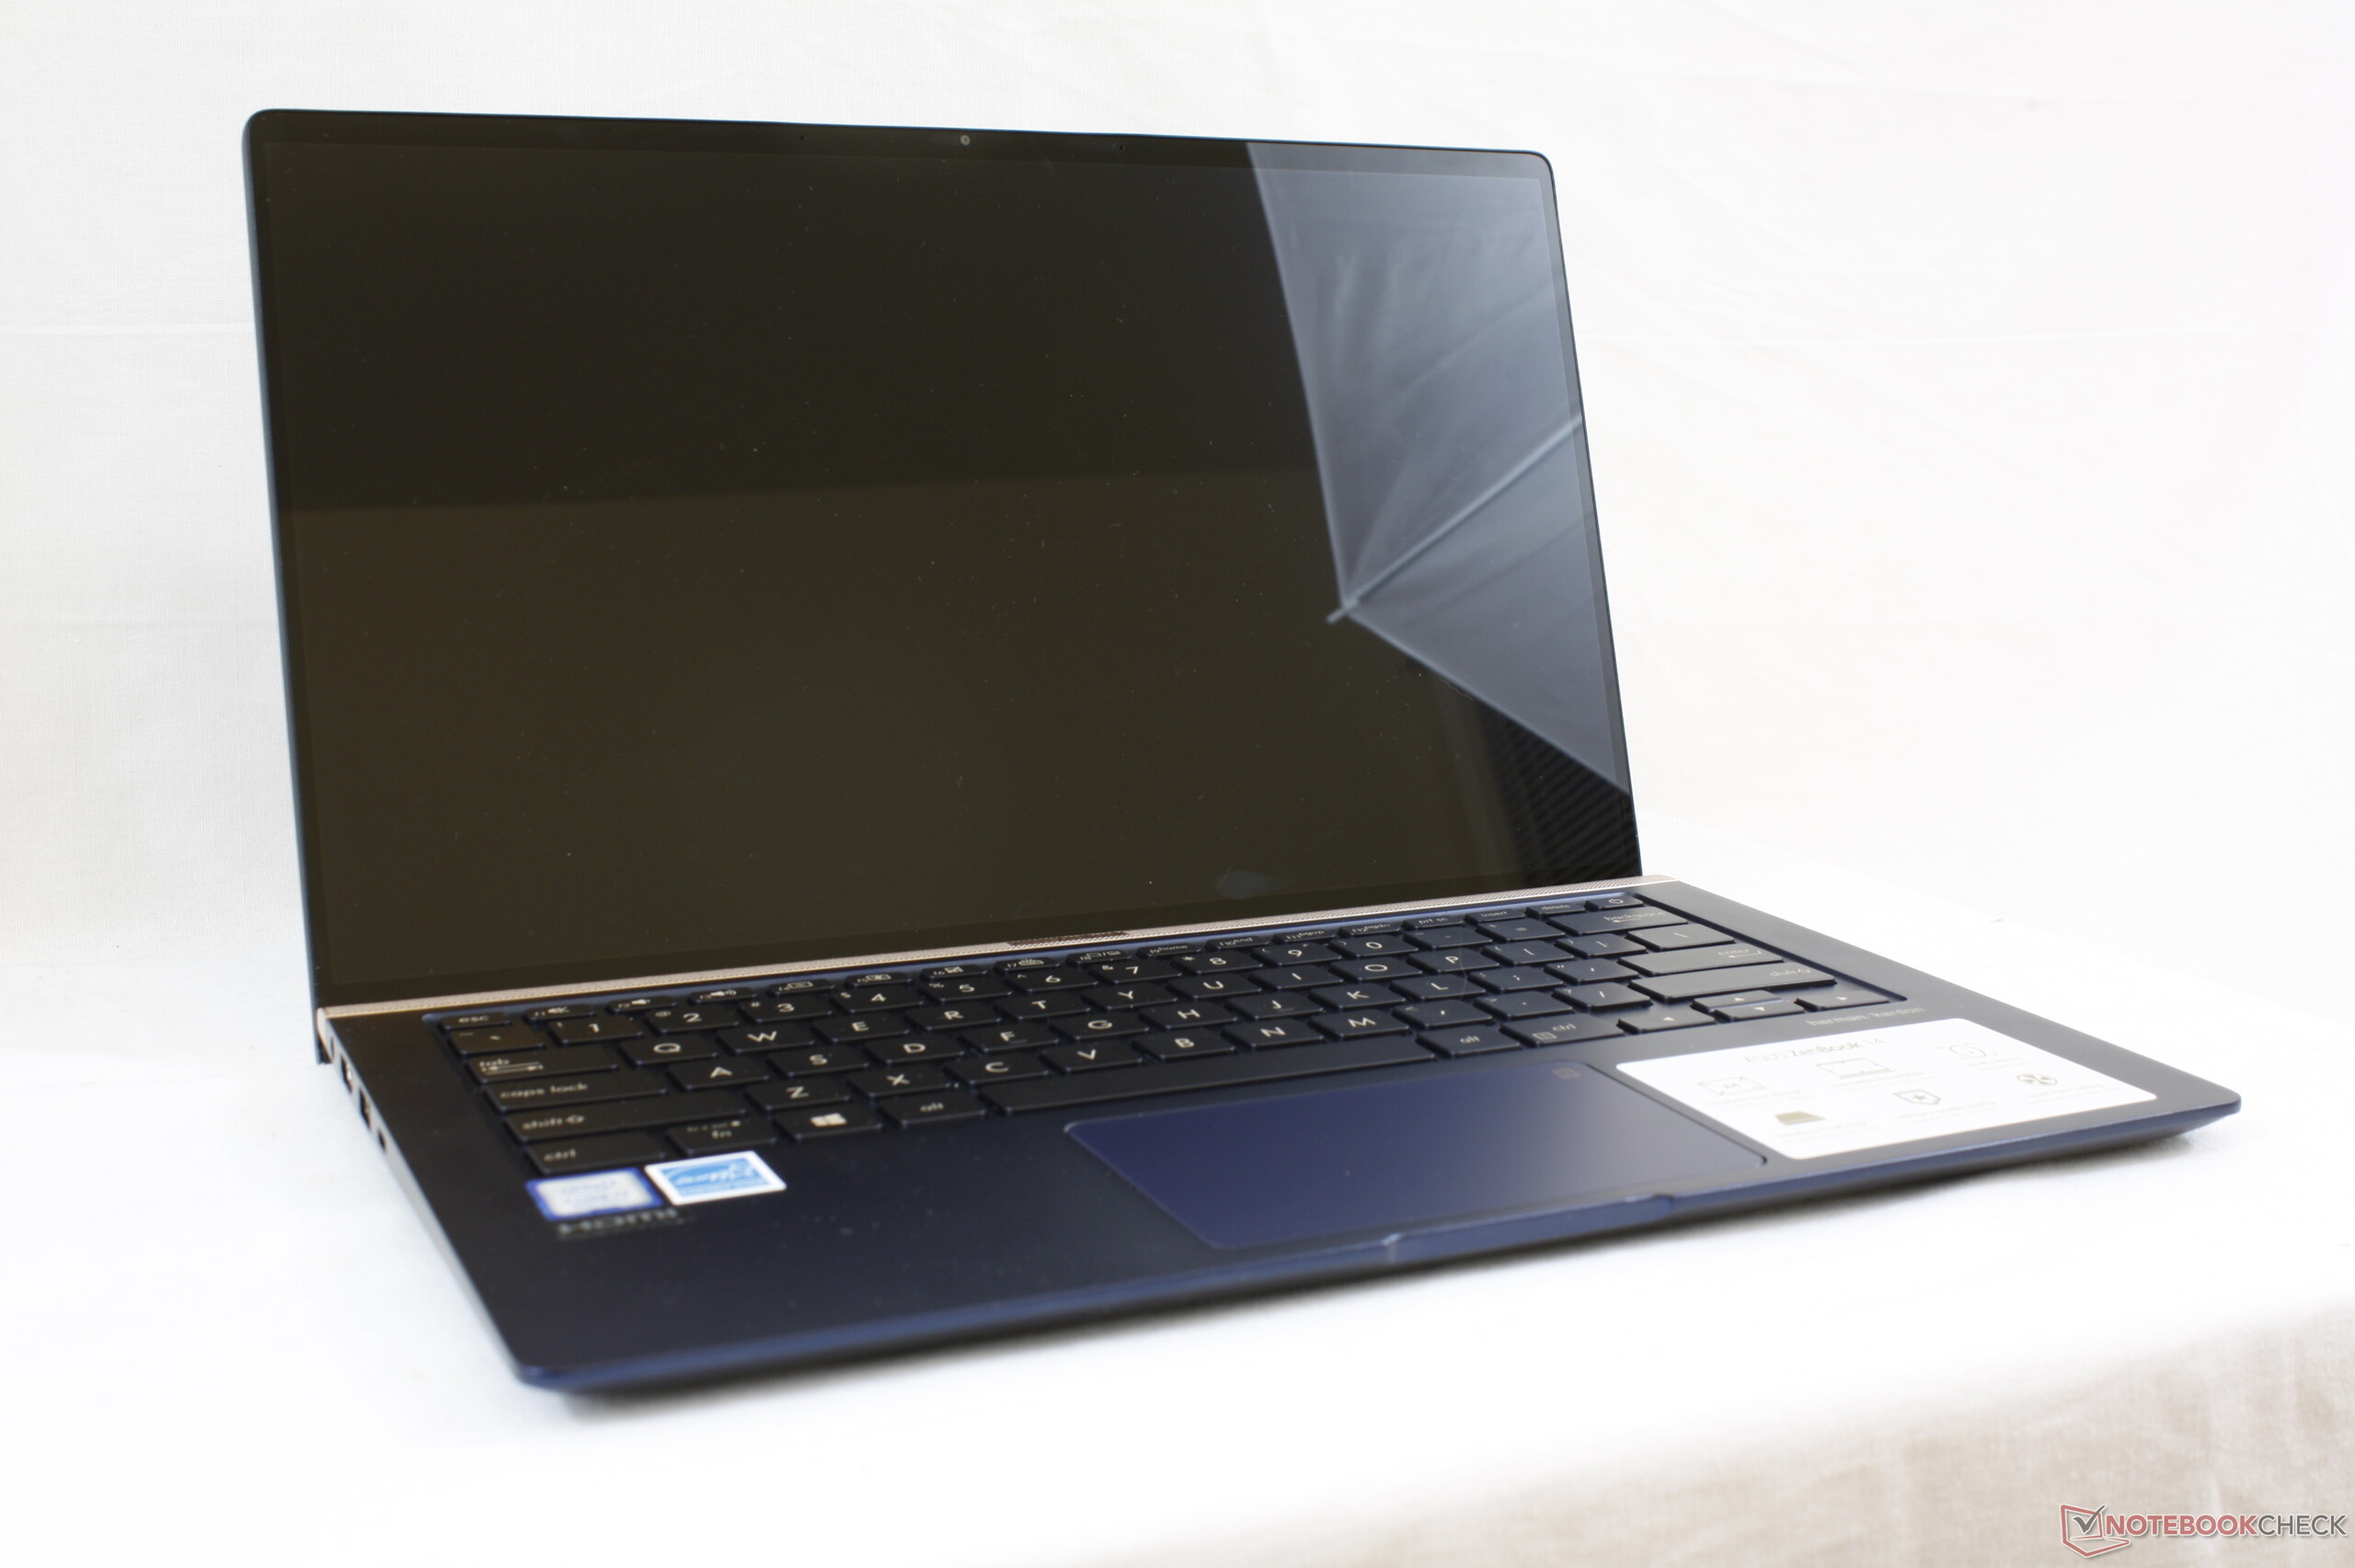
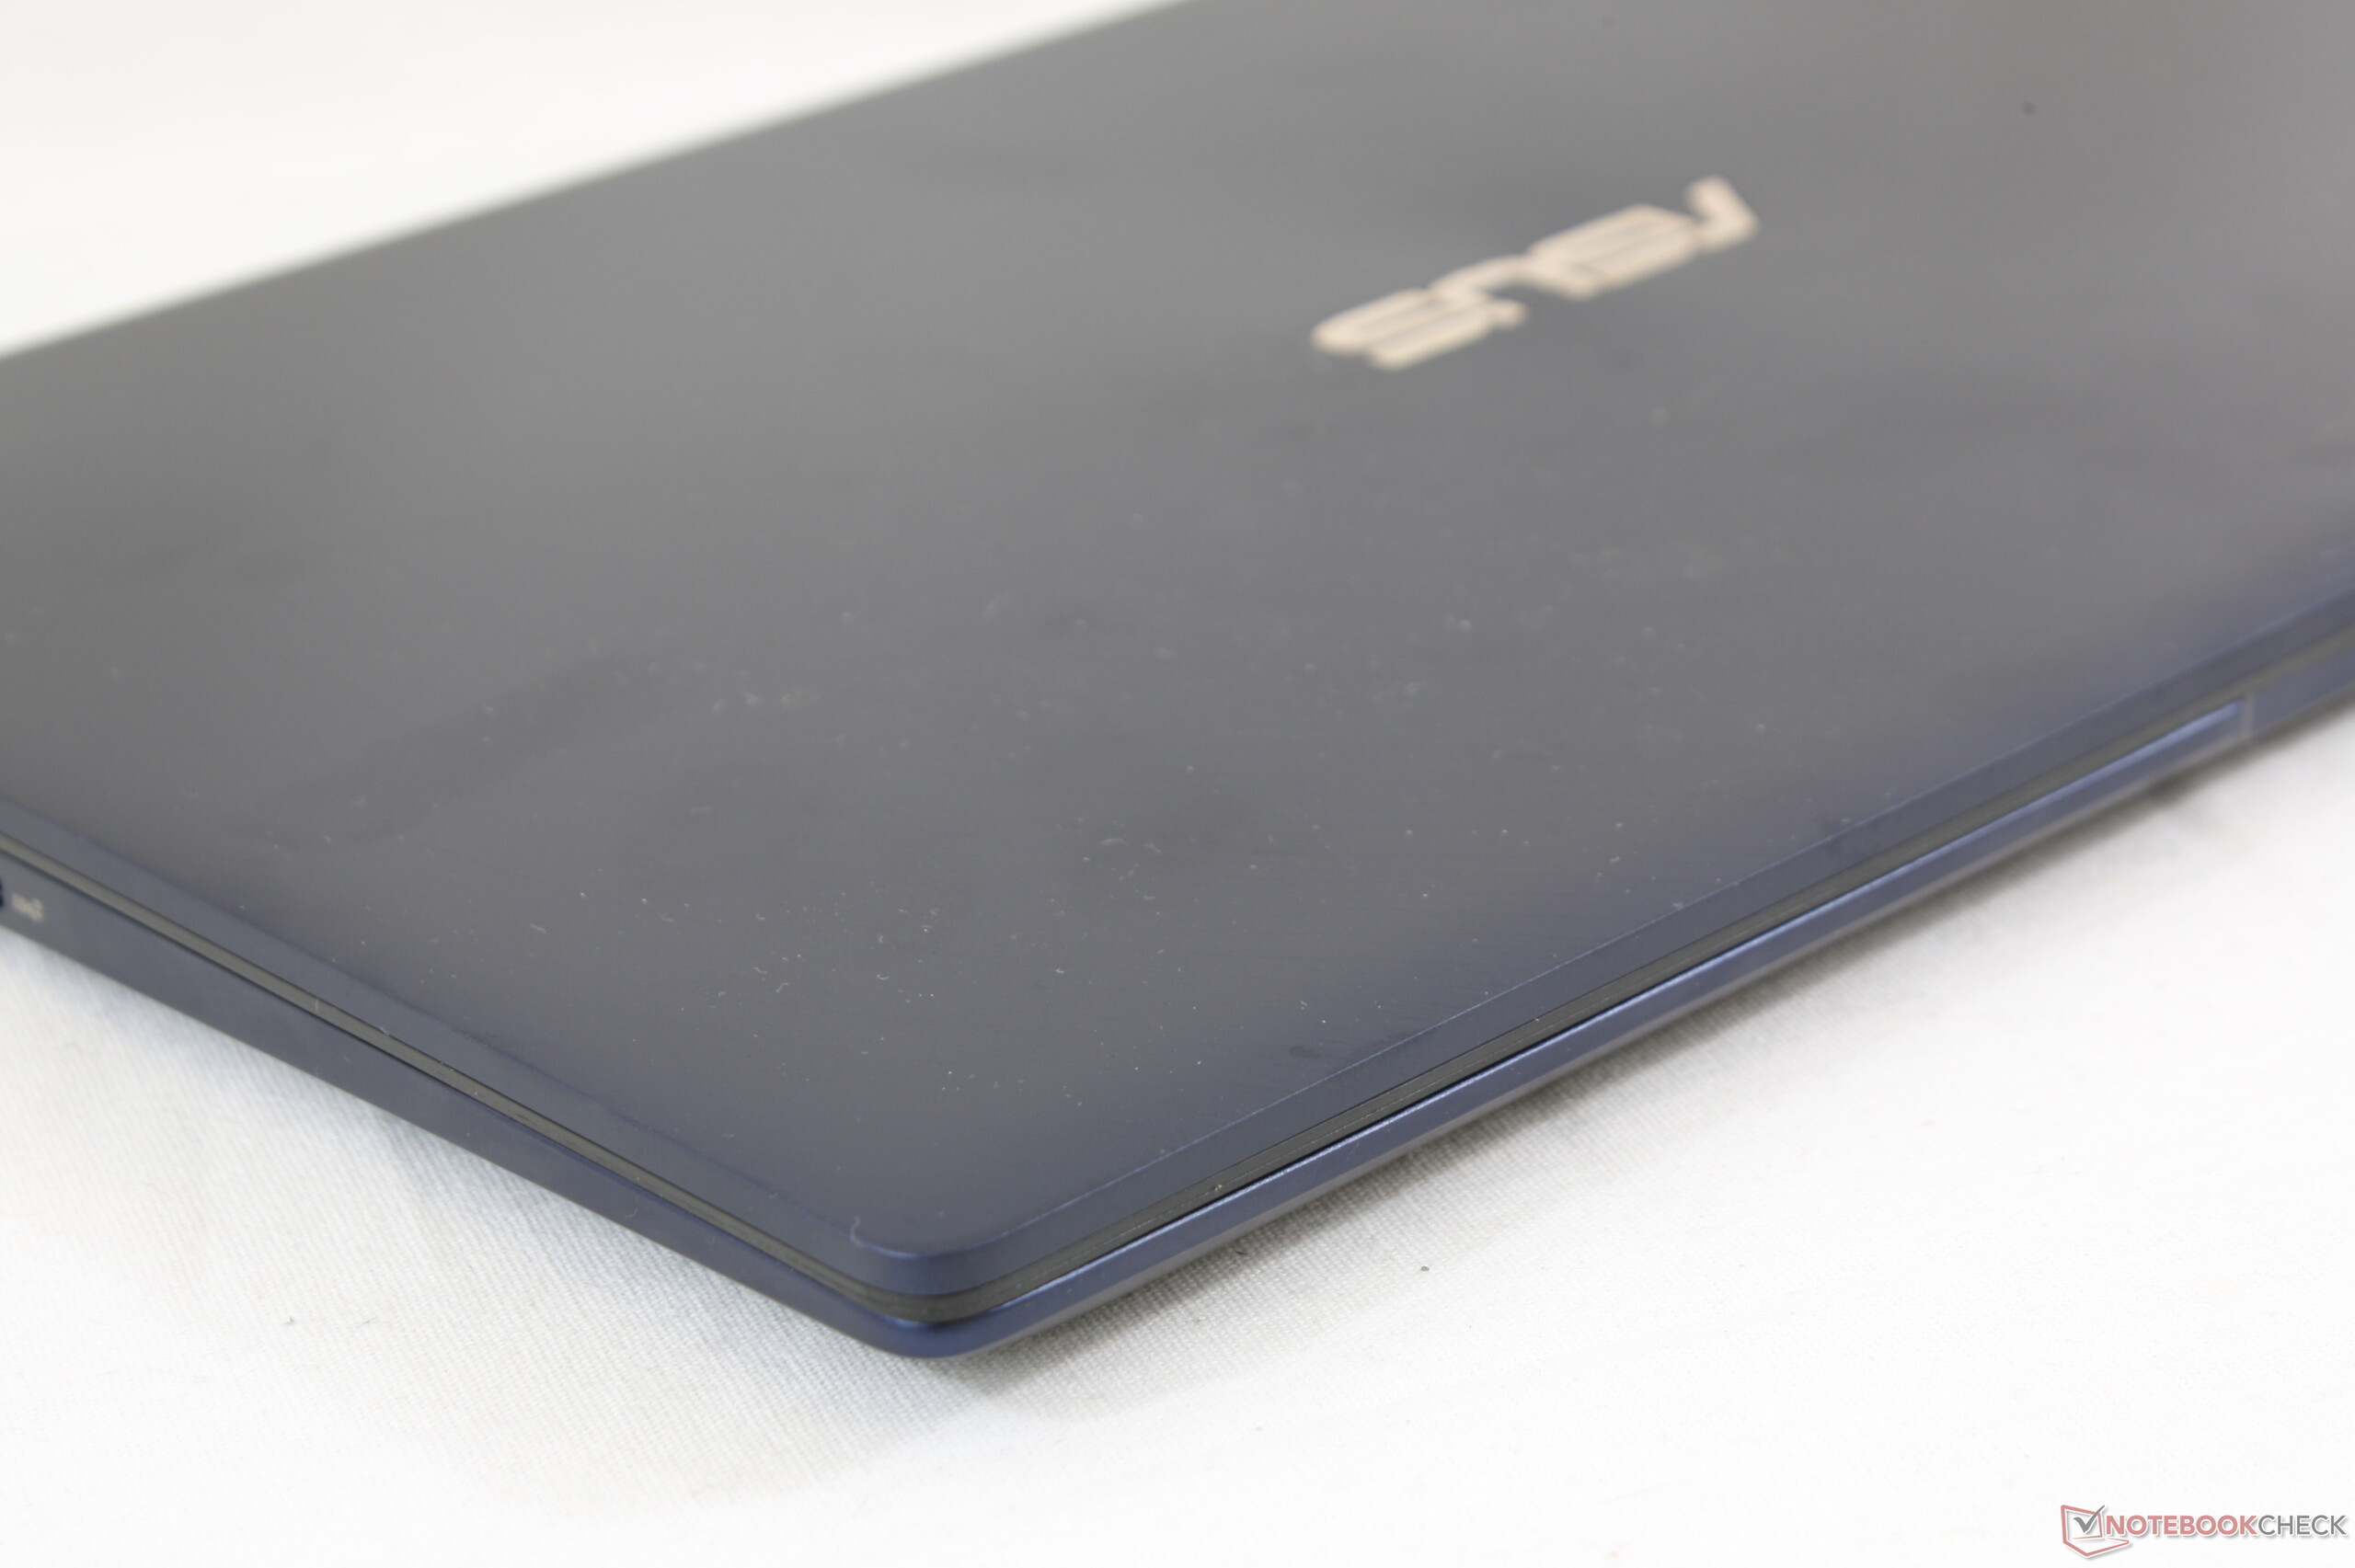
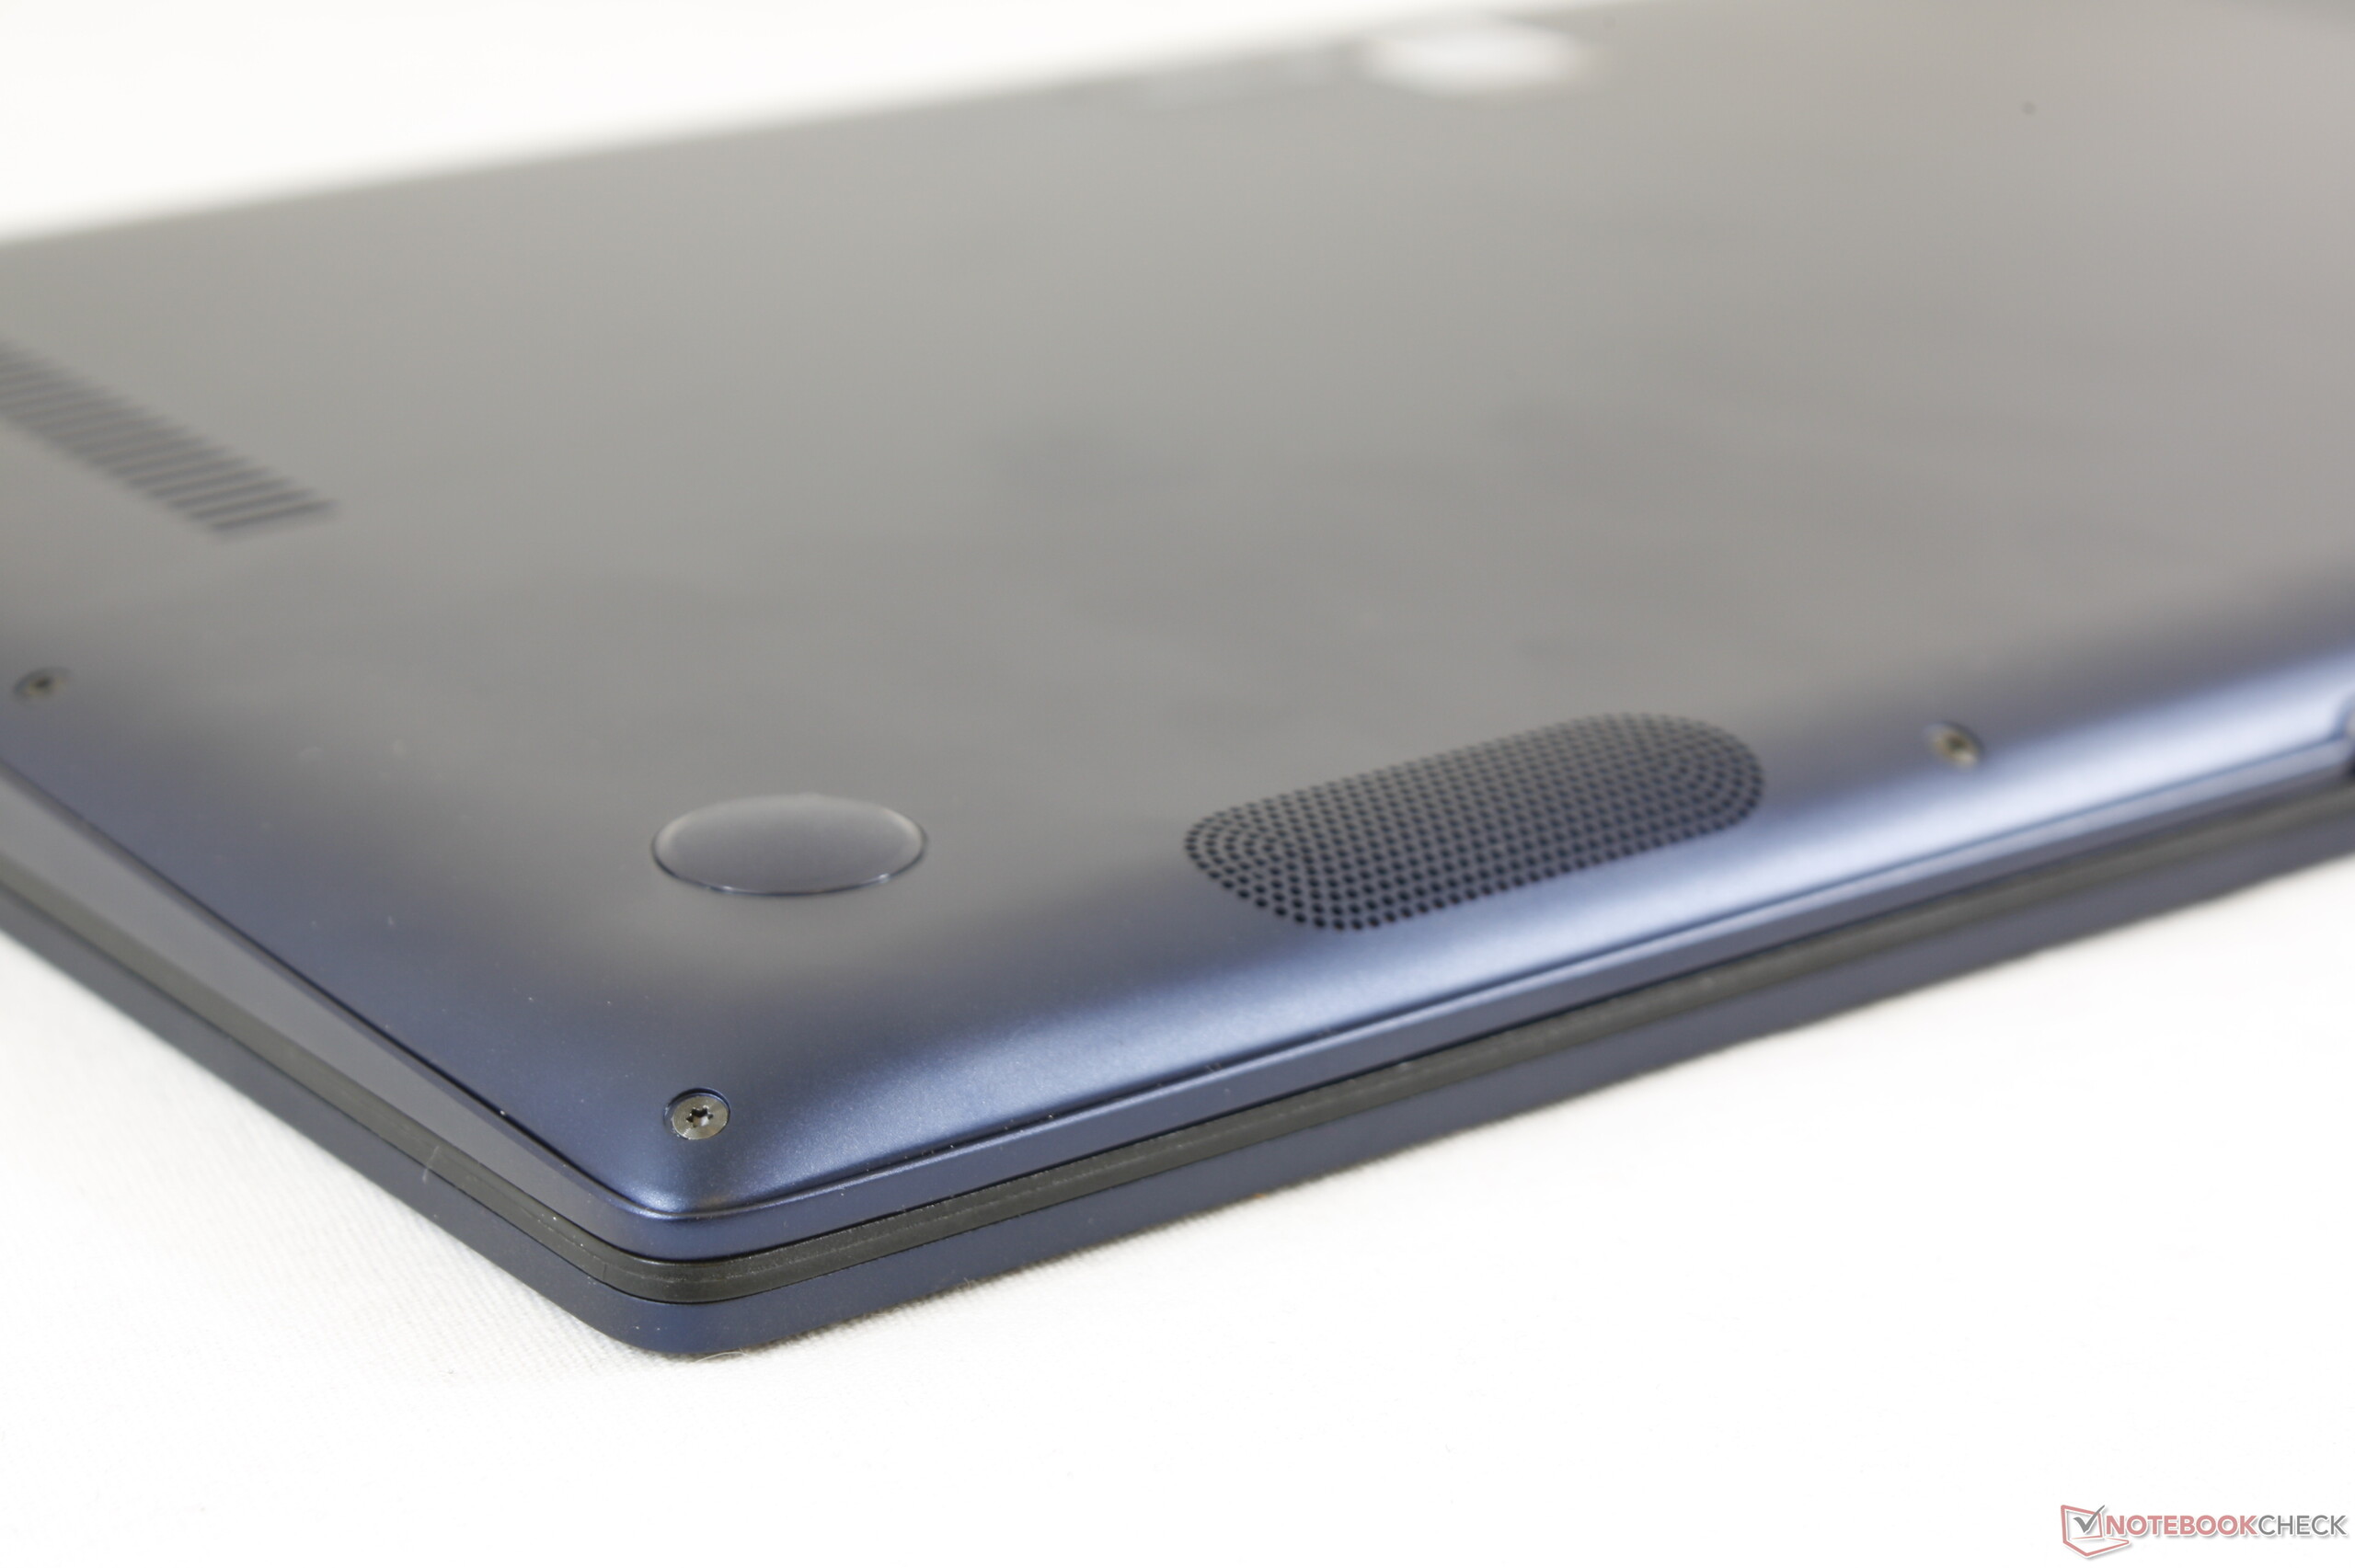
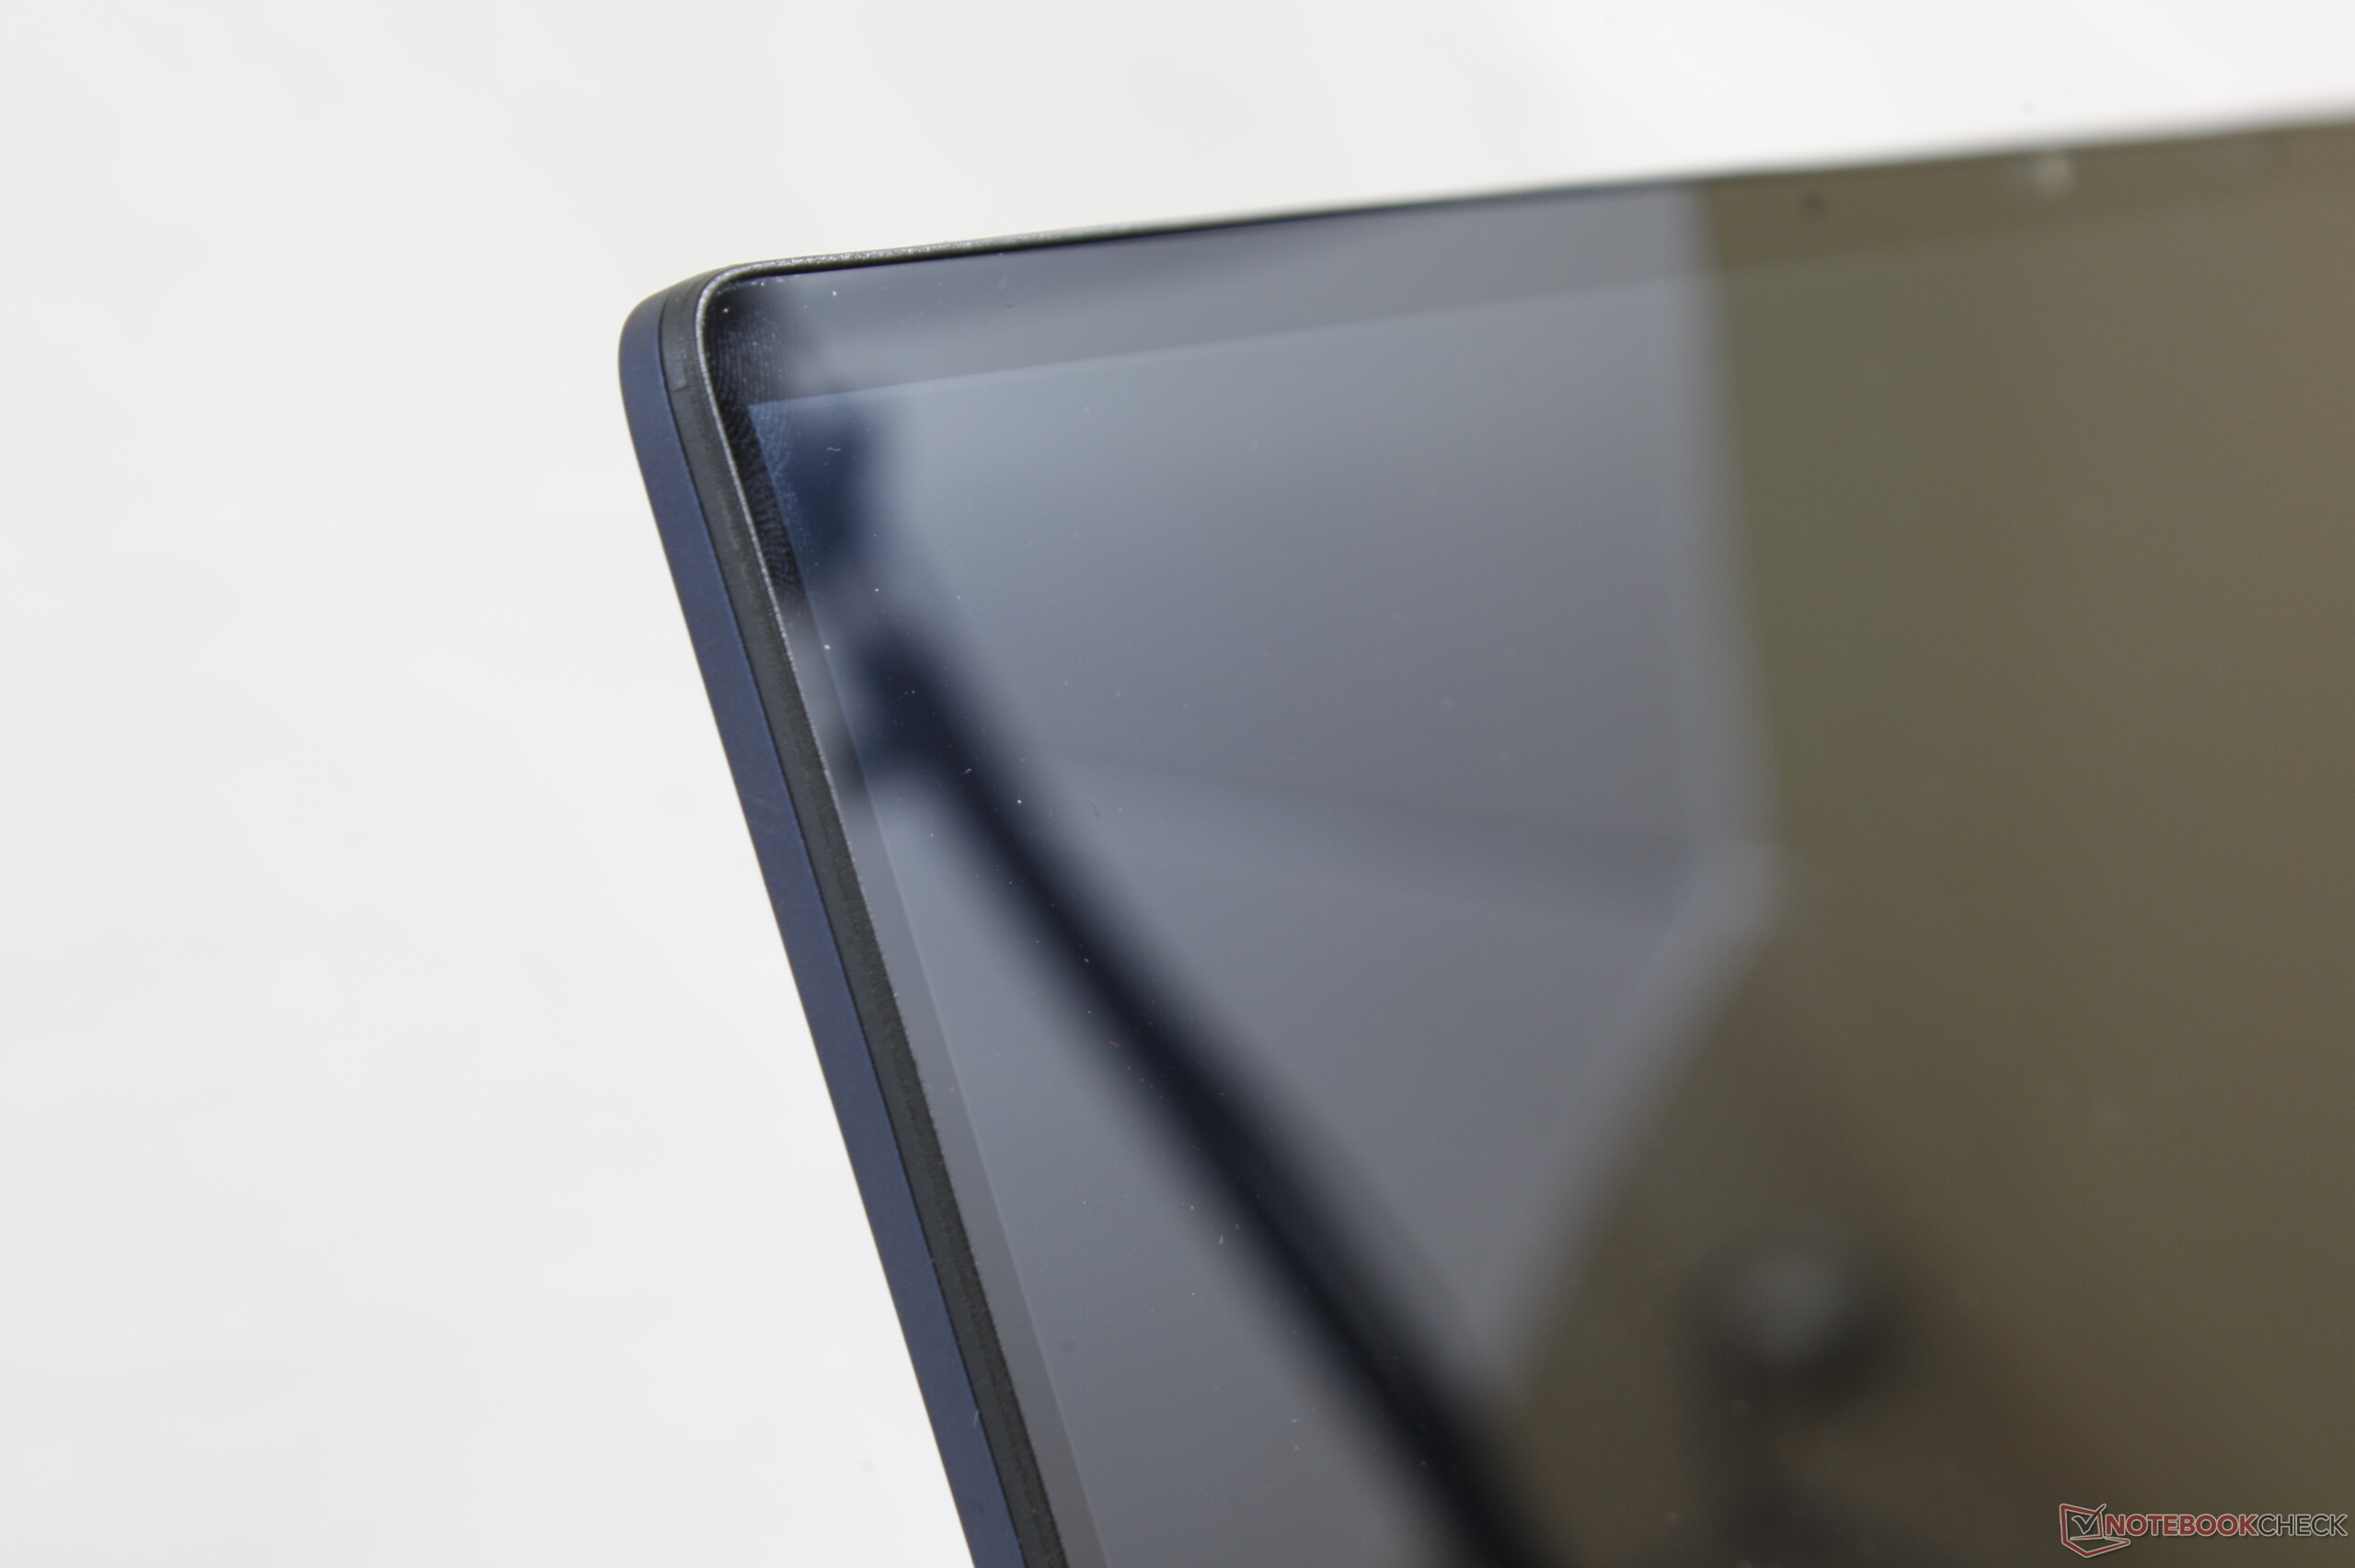
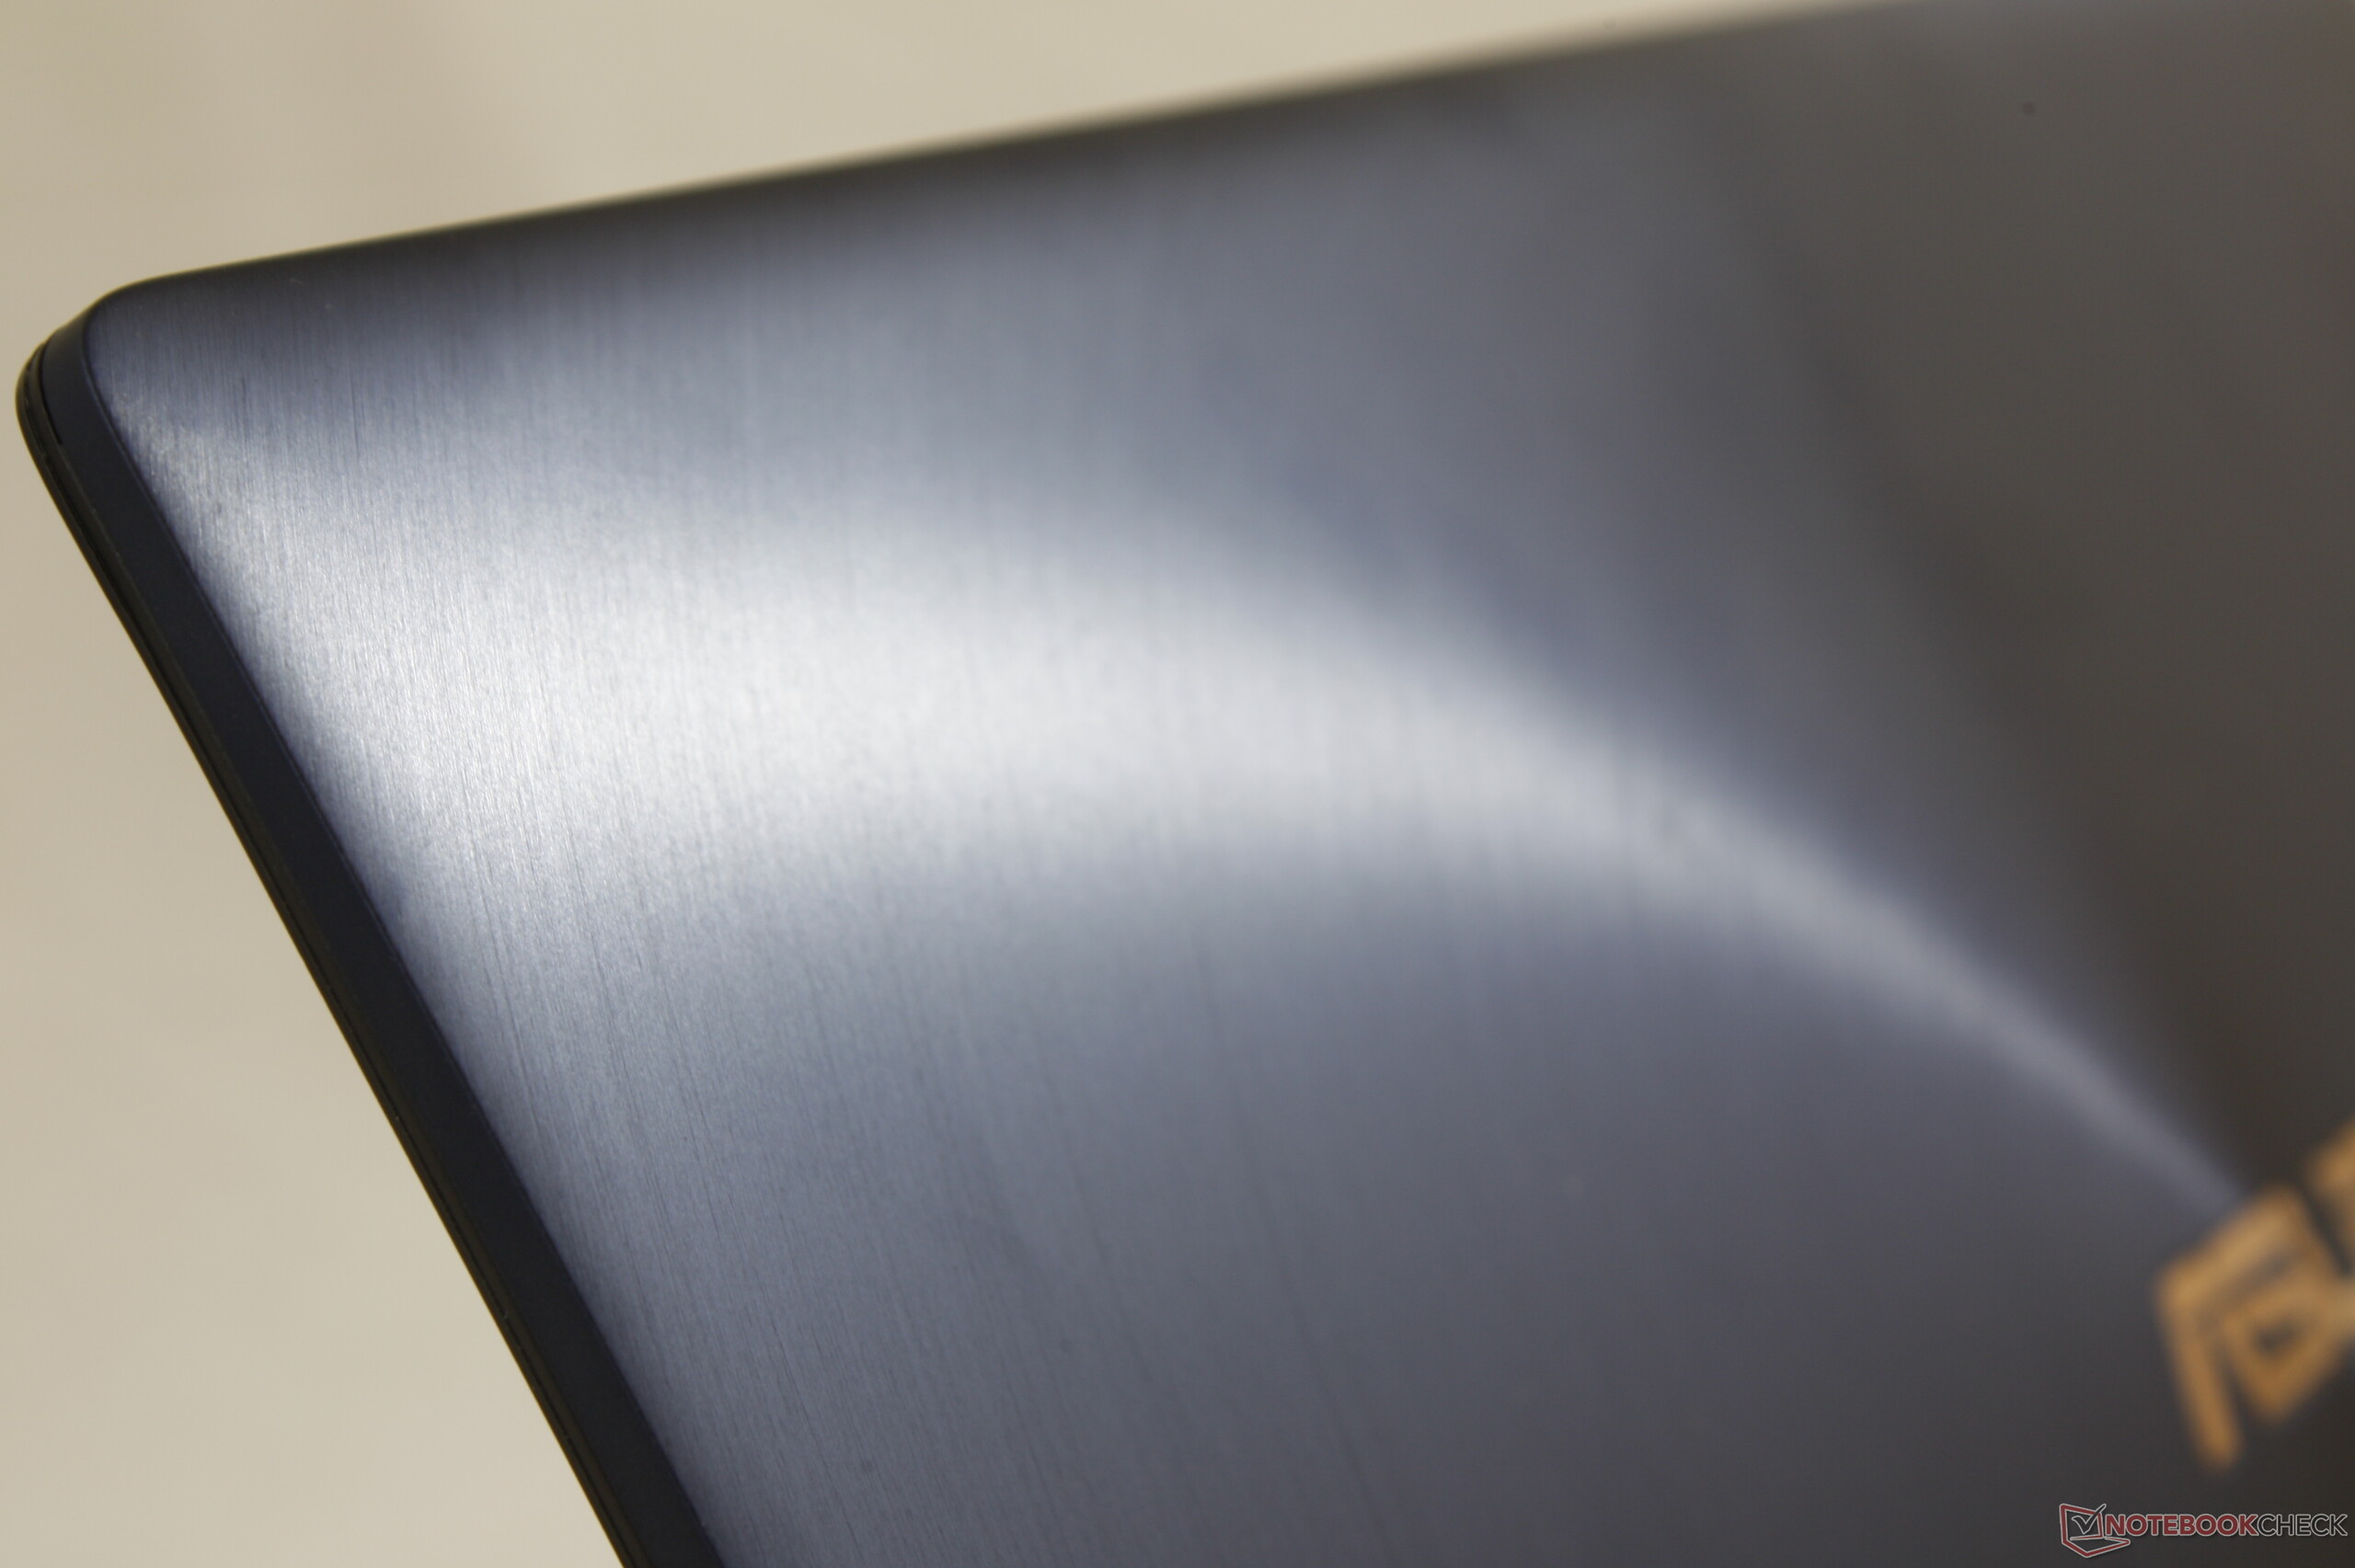
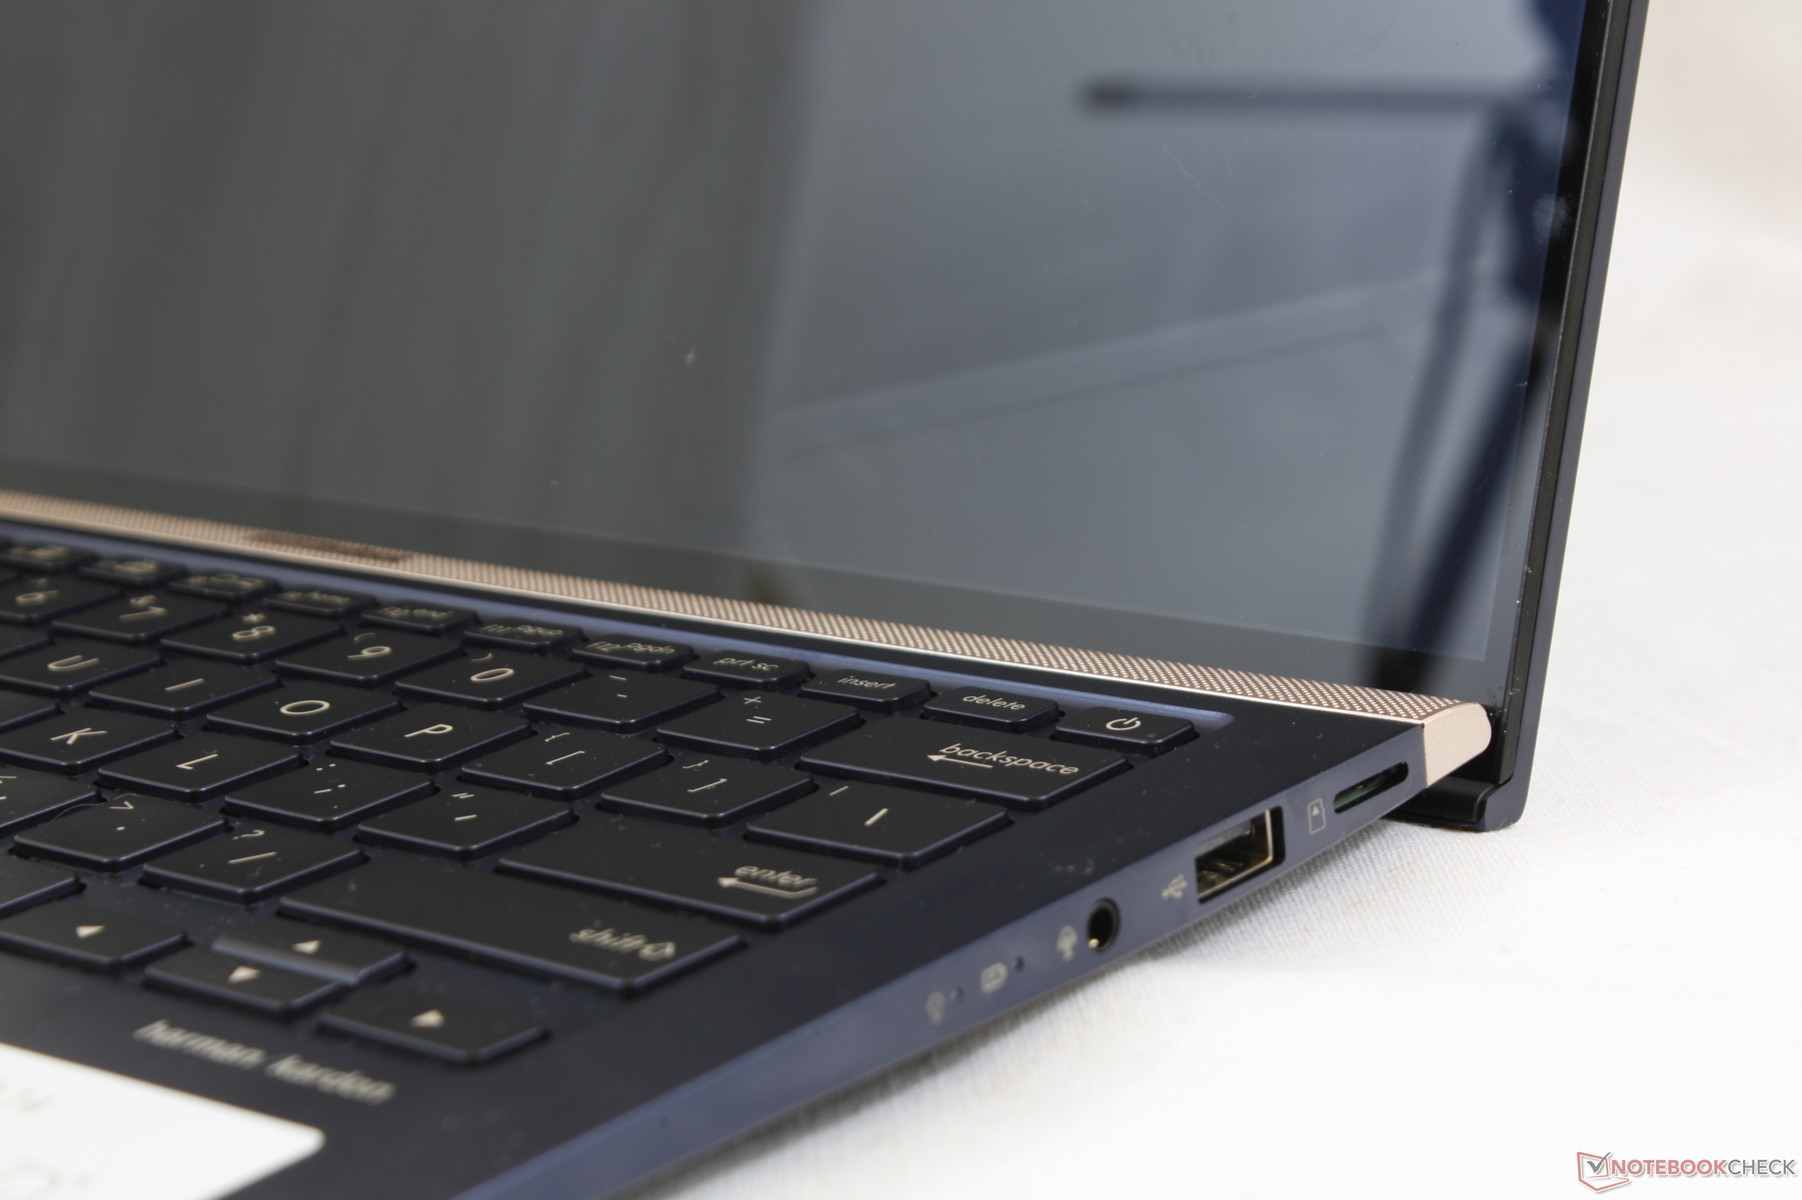
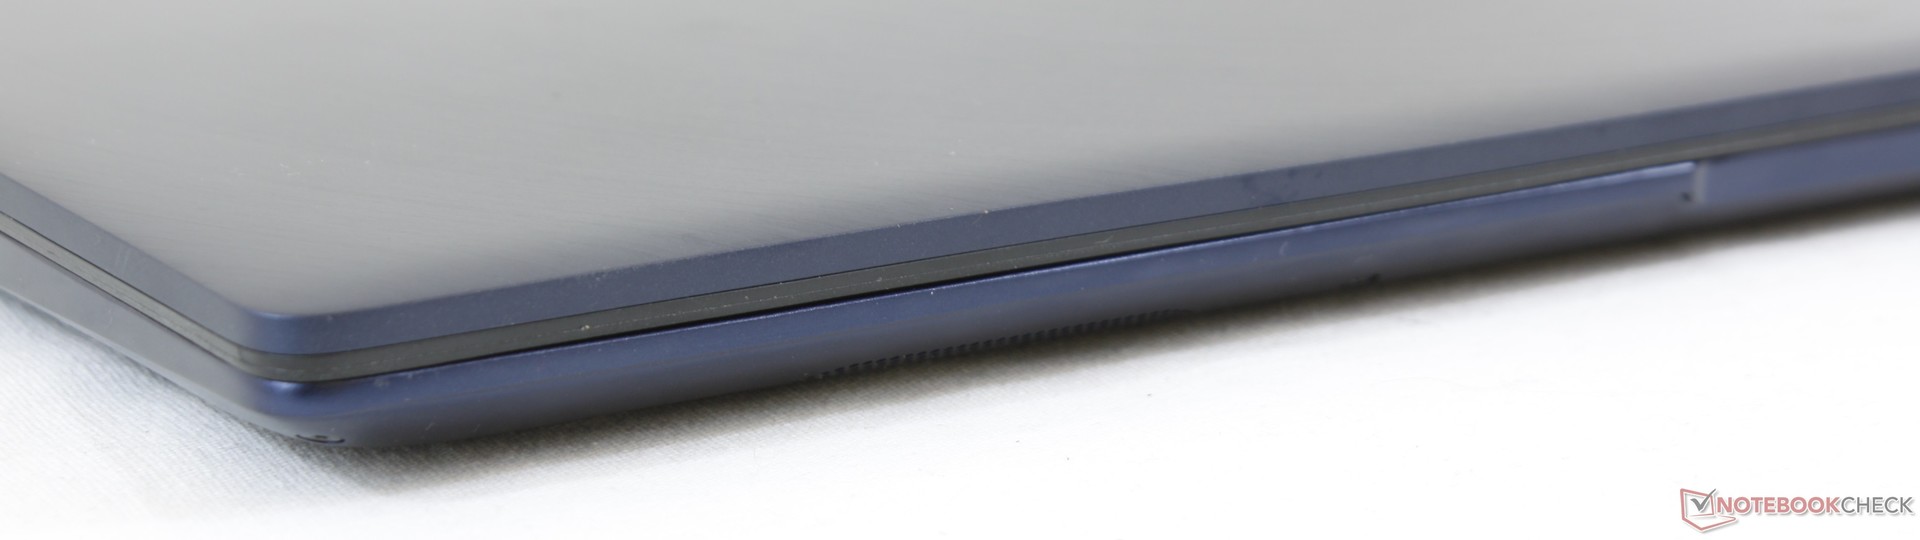
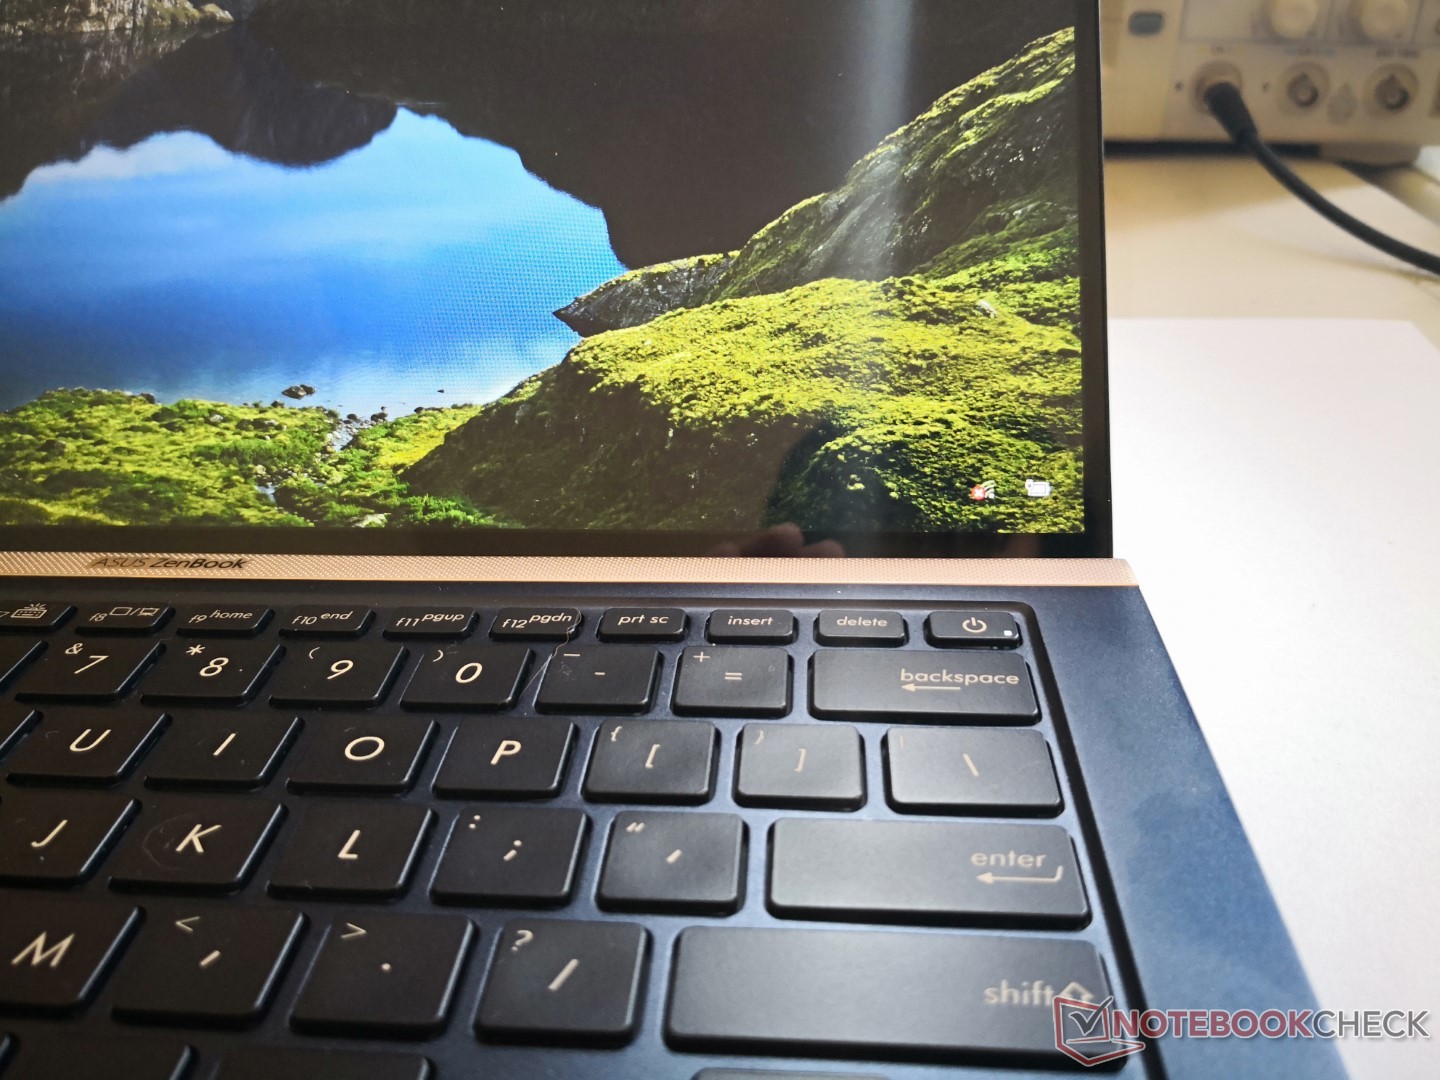
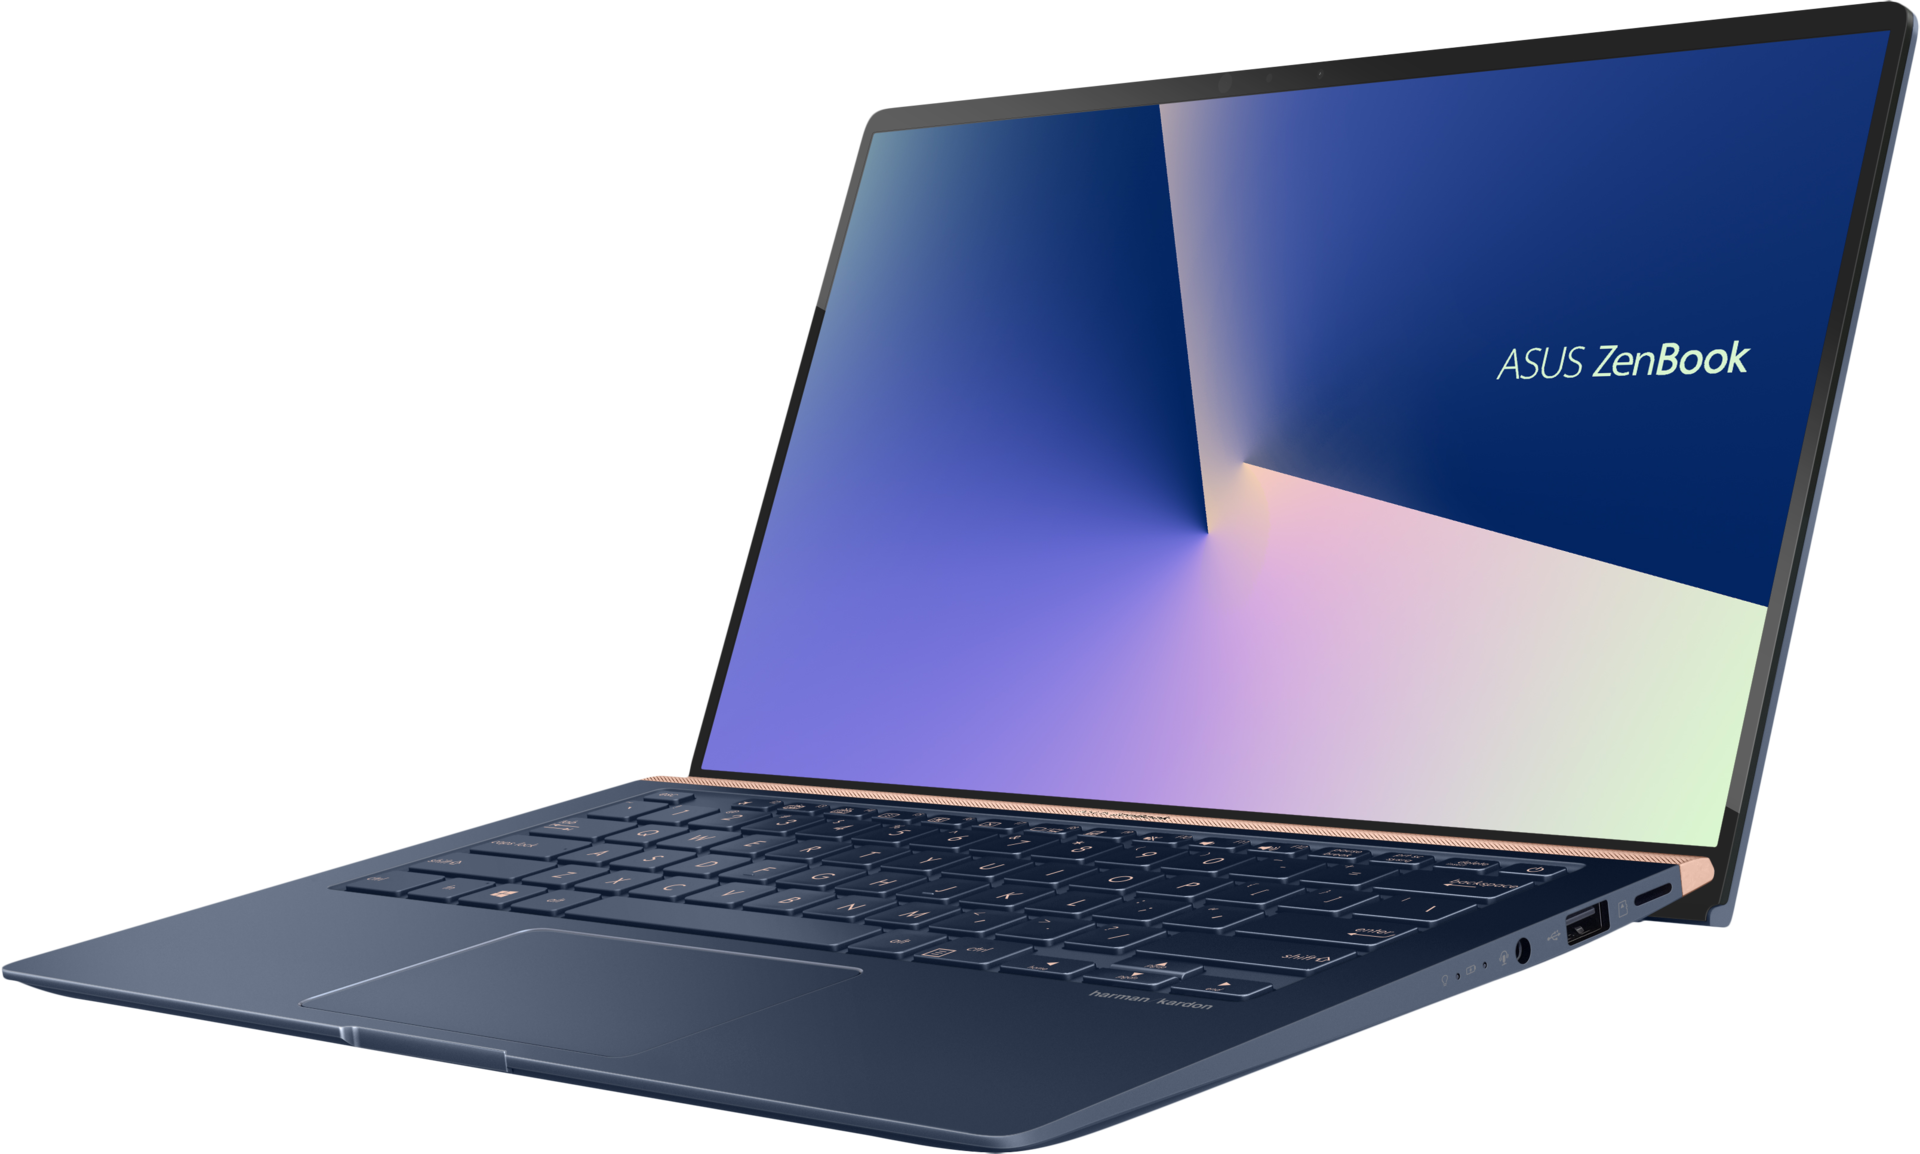
The UX433 chassis is visually striking and distinct when compared to other Ultrabooks because of the angled rear lid and narrow bezels along the bottom of the screen. The screen is narrow on all four sides without needing to alter the position of the webcam unlike on the XPS 13. Asus is claiming a very high 92 percent screen-to-body ratio compared to "only" 80.7 percent on the Dell.
In fairness, however, the angled rear lid is not new as it can also be found on the older HP Pavilion 15 Power. Furthermore, Asus managed to make the bottom bezel look narrower than it actually is by hiding a large portion of it behind the base when the lid is opened. Our screenshot below shows why Asus couldn't have used regular hinges for this particular design as it would have exposed more of the bottom bezel. It's a clever approach because users see a bottom bezel that's just 3.3 mm thick when the lid is opened.
Chassis quality is an improvement over the UX430. The relatively thick lid is more rigid than the flexible lids of the UX430, Yoga 920, LG Gram 15, or Samsung Notebook 9 while coming very close to the lid of the XPS 13 9360. Pushing down on the outer lid, palm rests, or keyboard center results in minor warping but no audible creaking. The base isn't quite as sturdy as a HP Spectre, but it's the closest we've seen yet from an ultrathin Zenbook.
The hinges are rigid enough to prevent teetering when typing. However, it could have been stiffer for improved longevity as we're unsure how the hinges will hold over time. The HP Spectre has the advantage yet again with its stronger hinges.

The narrow bezels on both the top and bottom edges of the display have an interesting side effect. The notebook appears wider than other 16:9 laptops since the chassis can afford to be shorter in depth. In fact, the length of the UX433 is exactly the same as on the XPS 13 despite the fact that the Asus has a larger 14-inch screen. Asus managed to shave off over 2.5 cm in length when compared to the last generation UX430 largely due to the trimmed bottom bezel.
The system still weighs about the same as many of its competitors since it is slightly thicker (15.9 mm) than the XPS 13 (11.6 mm), MacBook Air (15.6 mm), and Yoga C930 (14.9 mm). In other words, the UX433 has one of the smallest footprints for its size class even though it's not necessarily the thinnest.
Connectivity
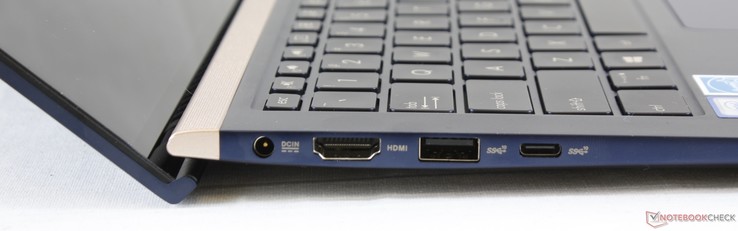
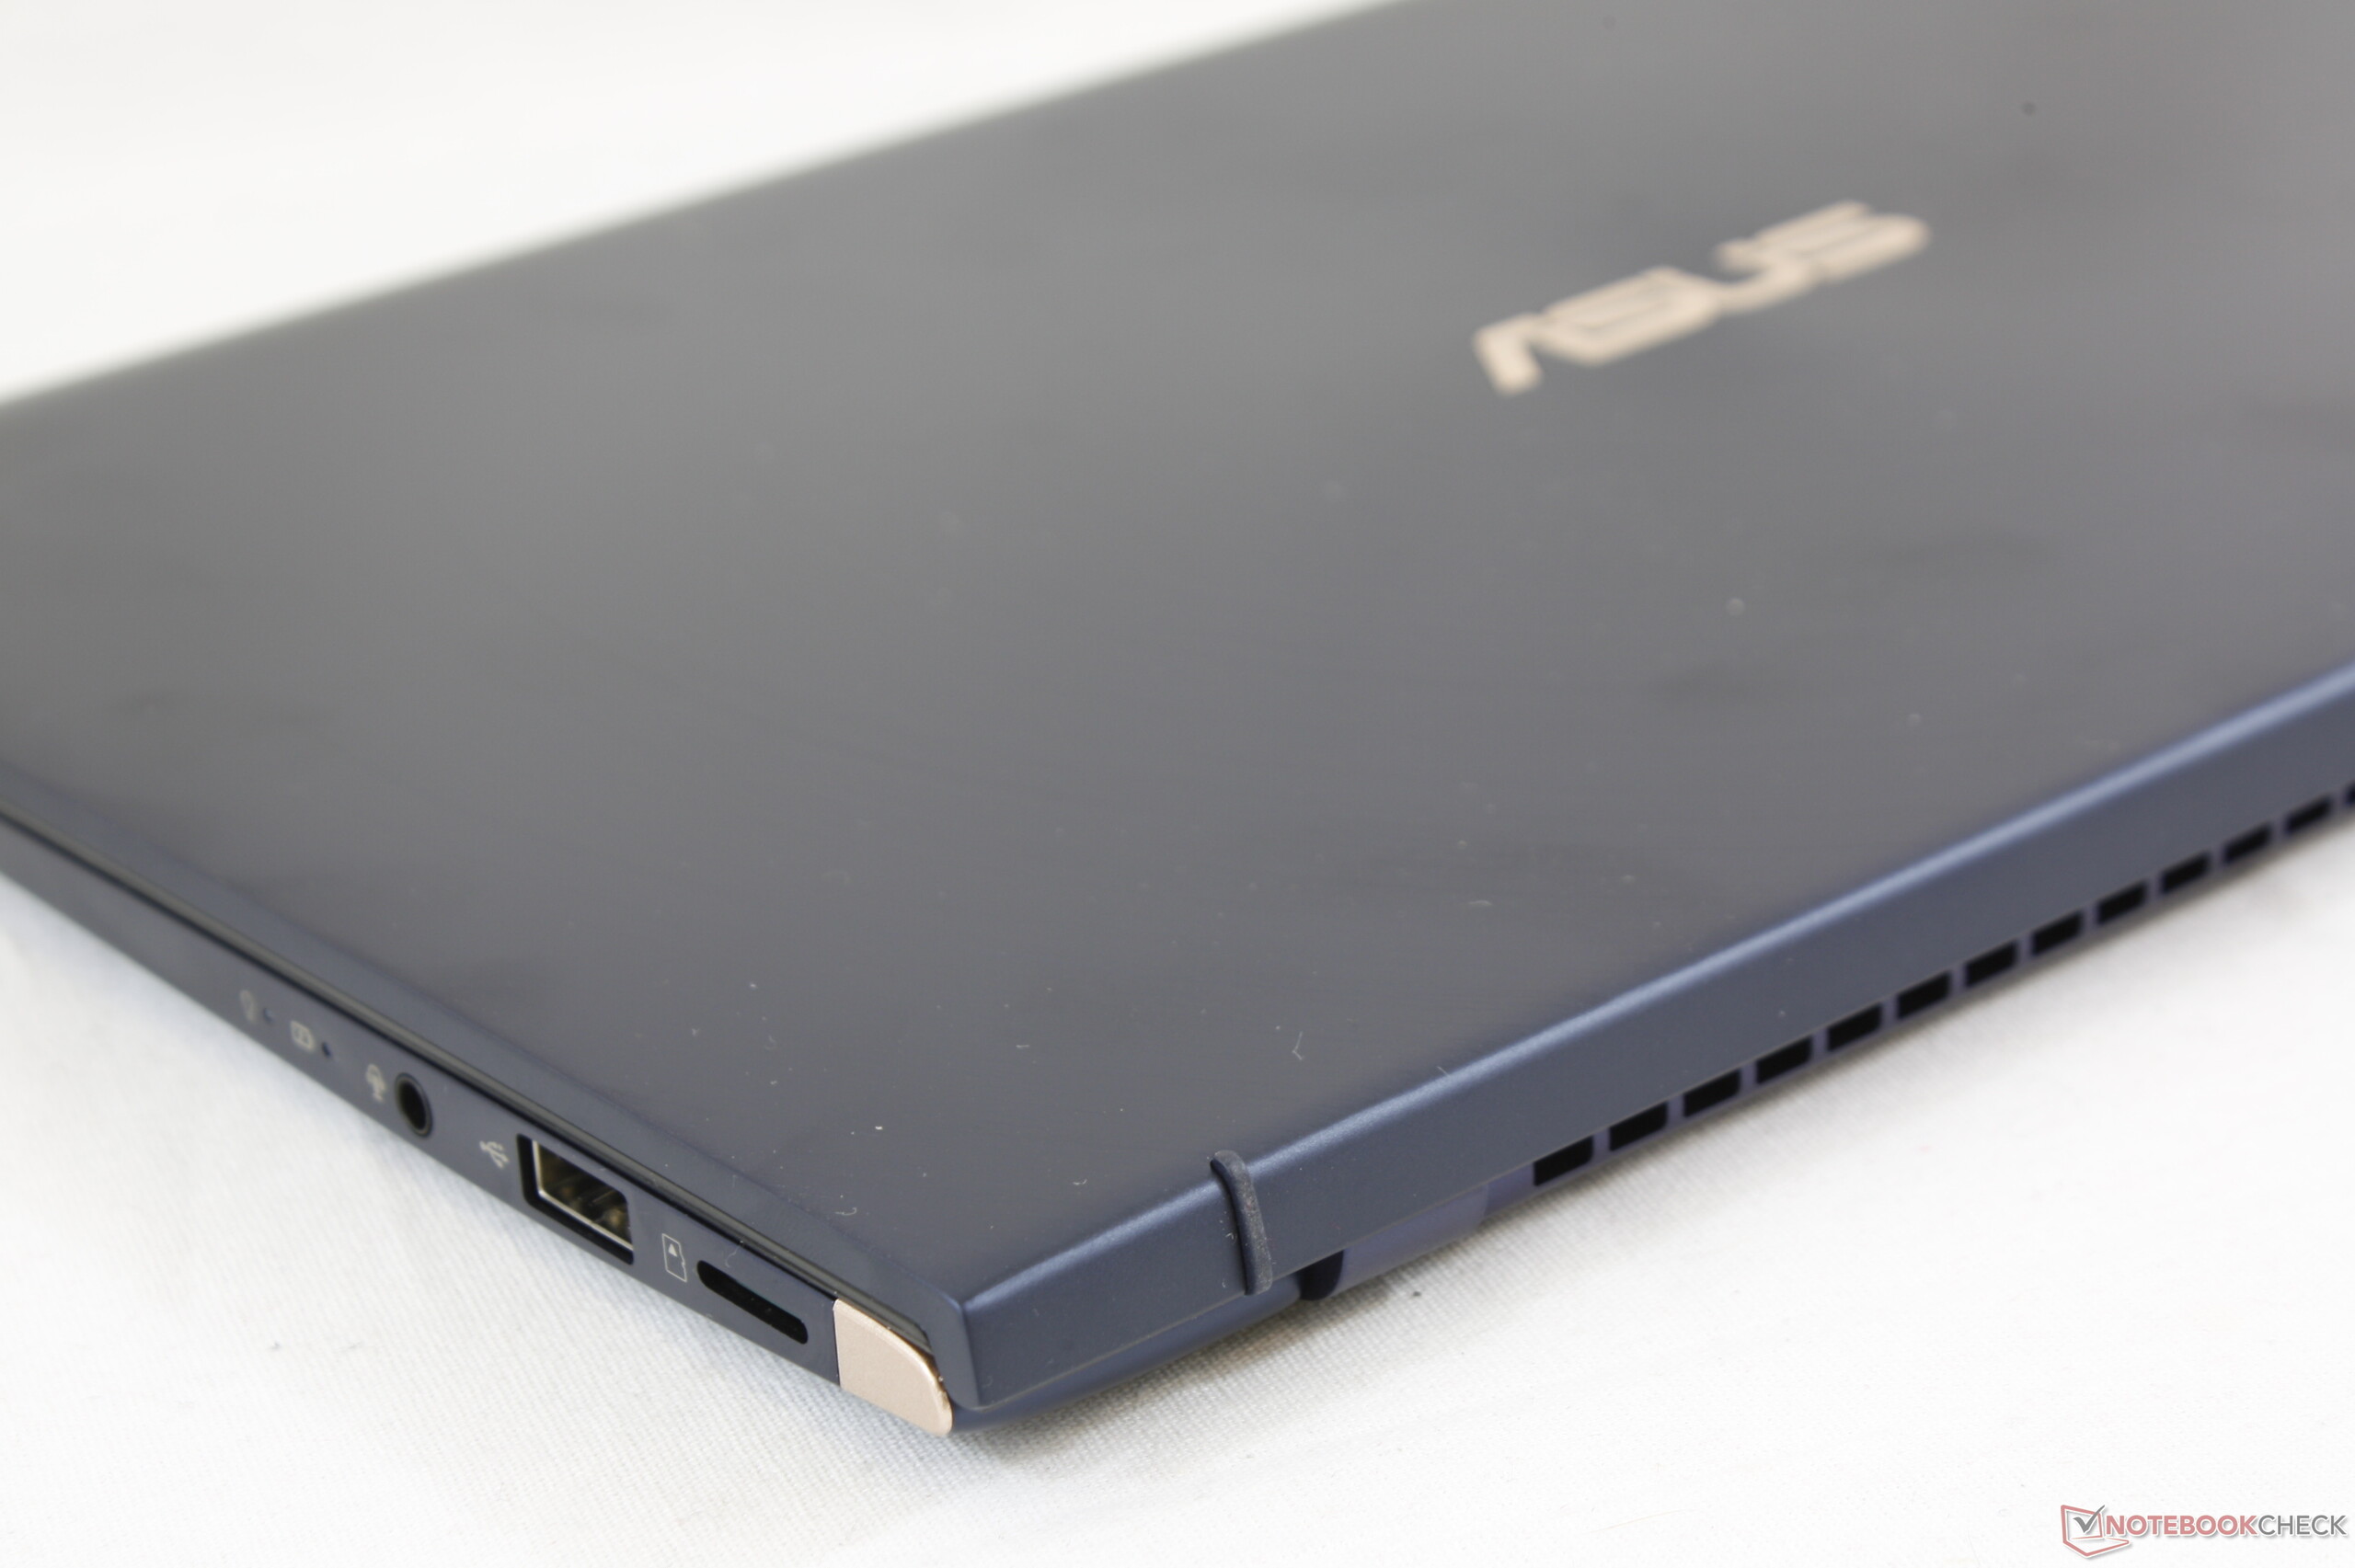
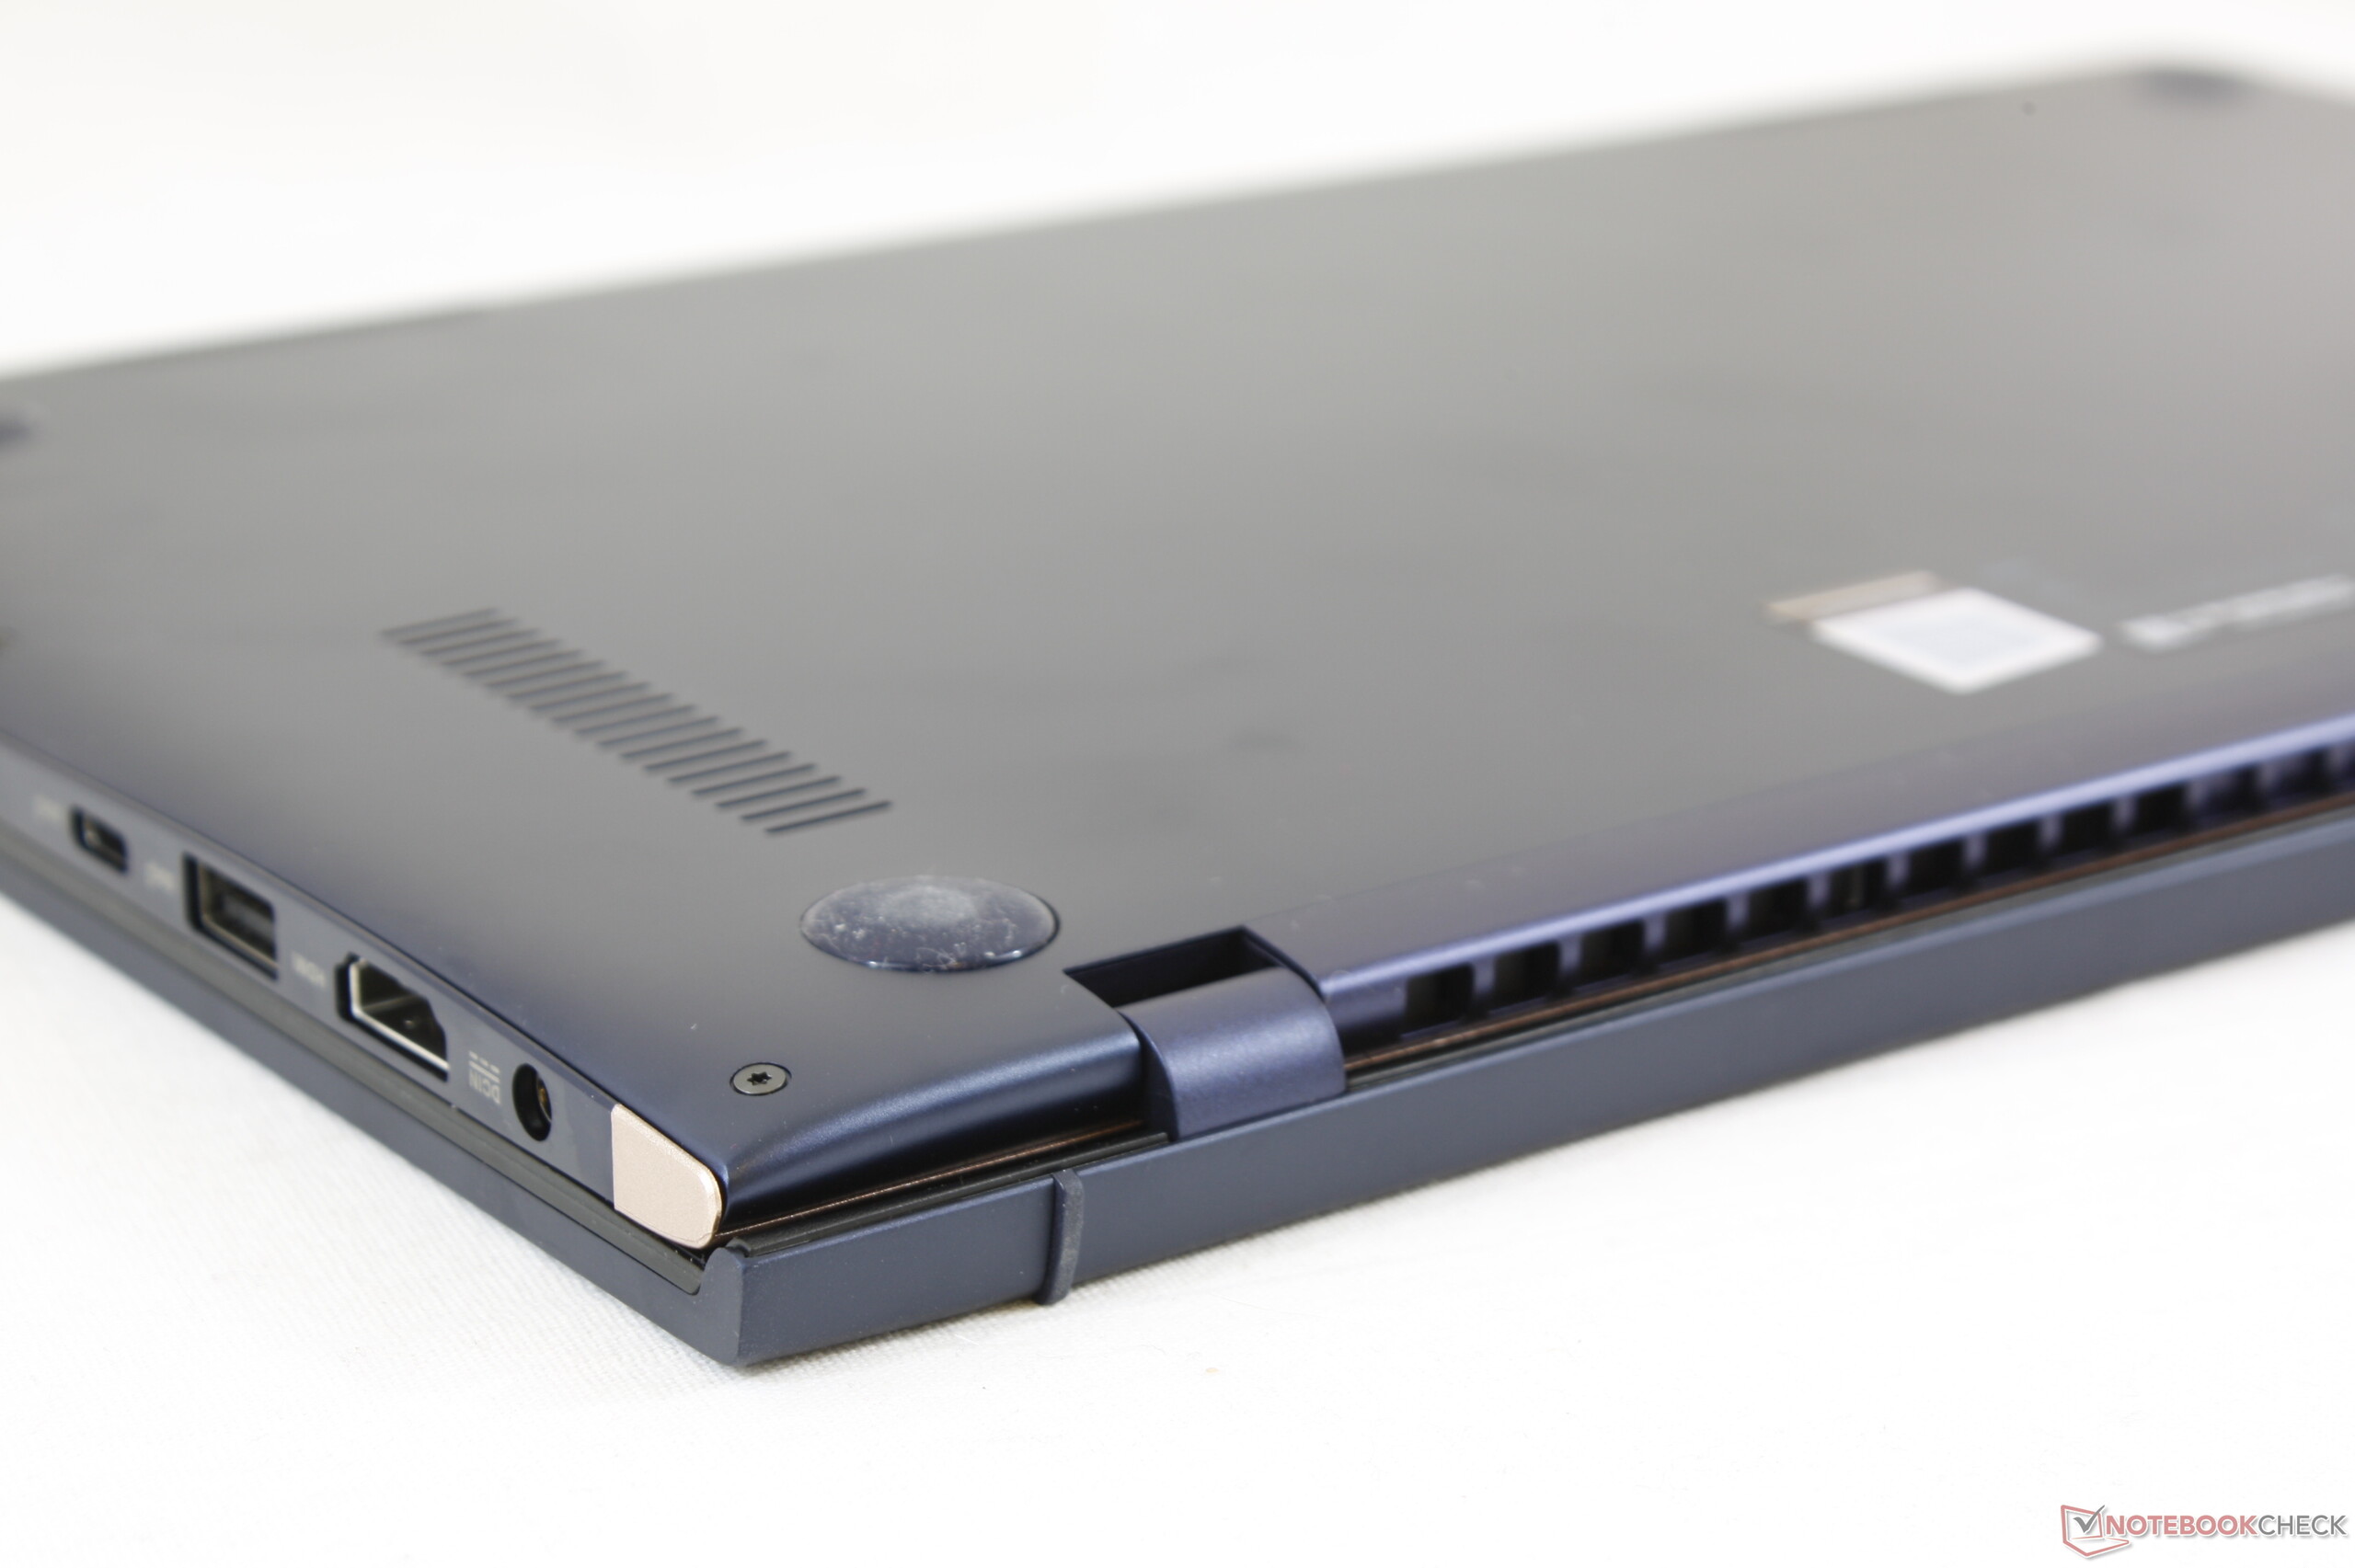
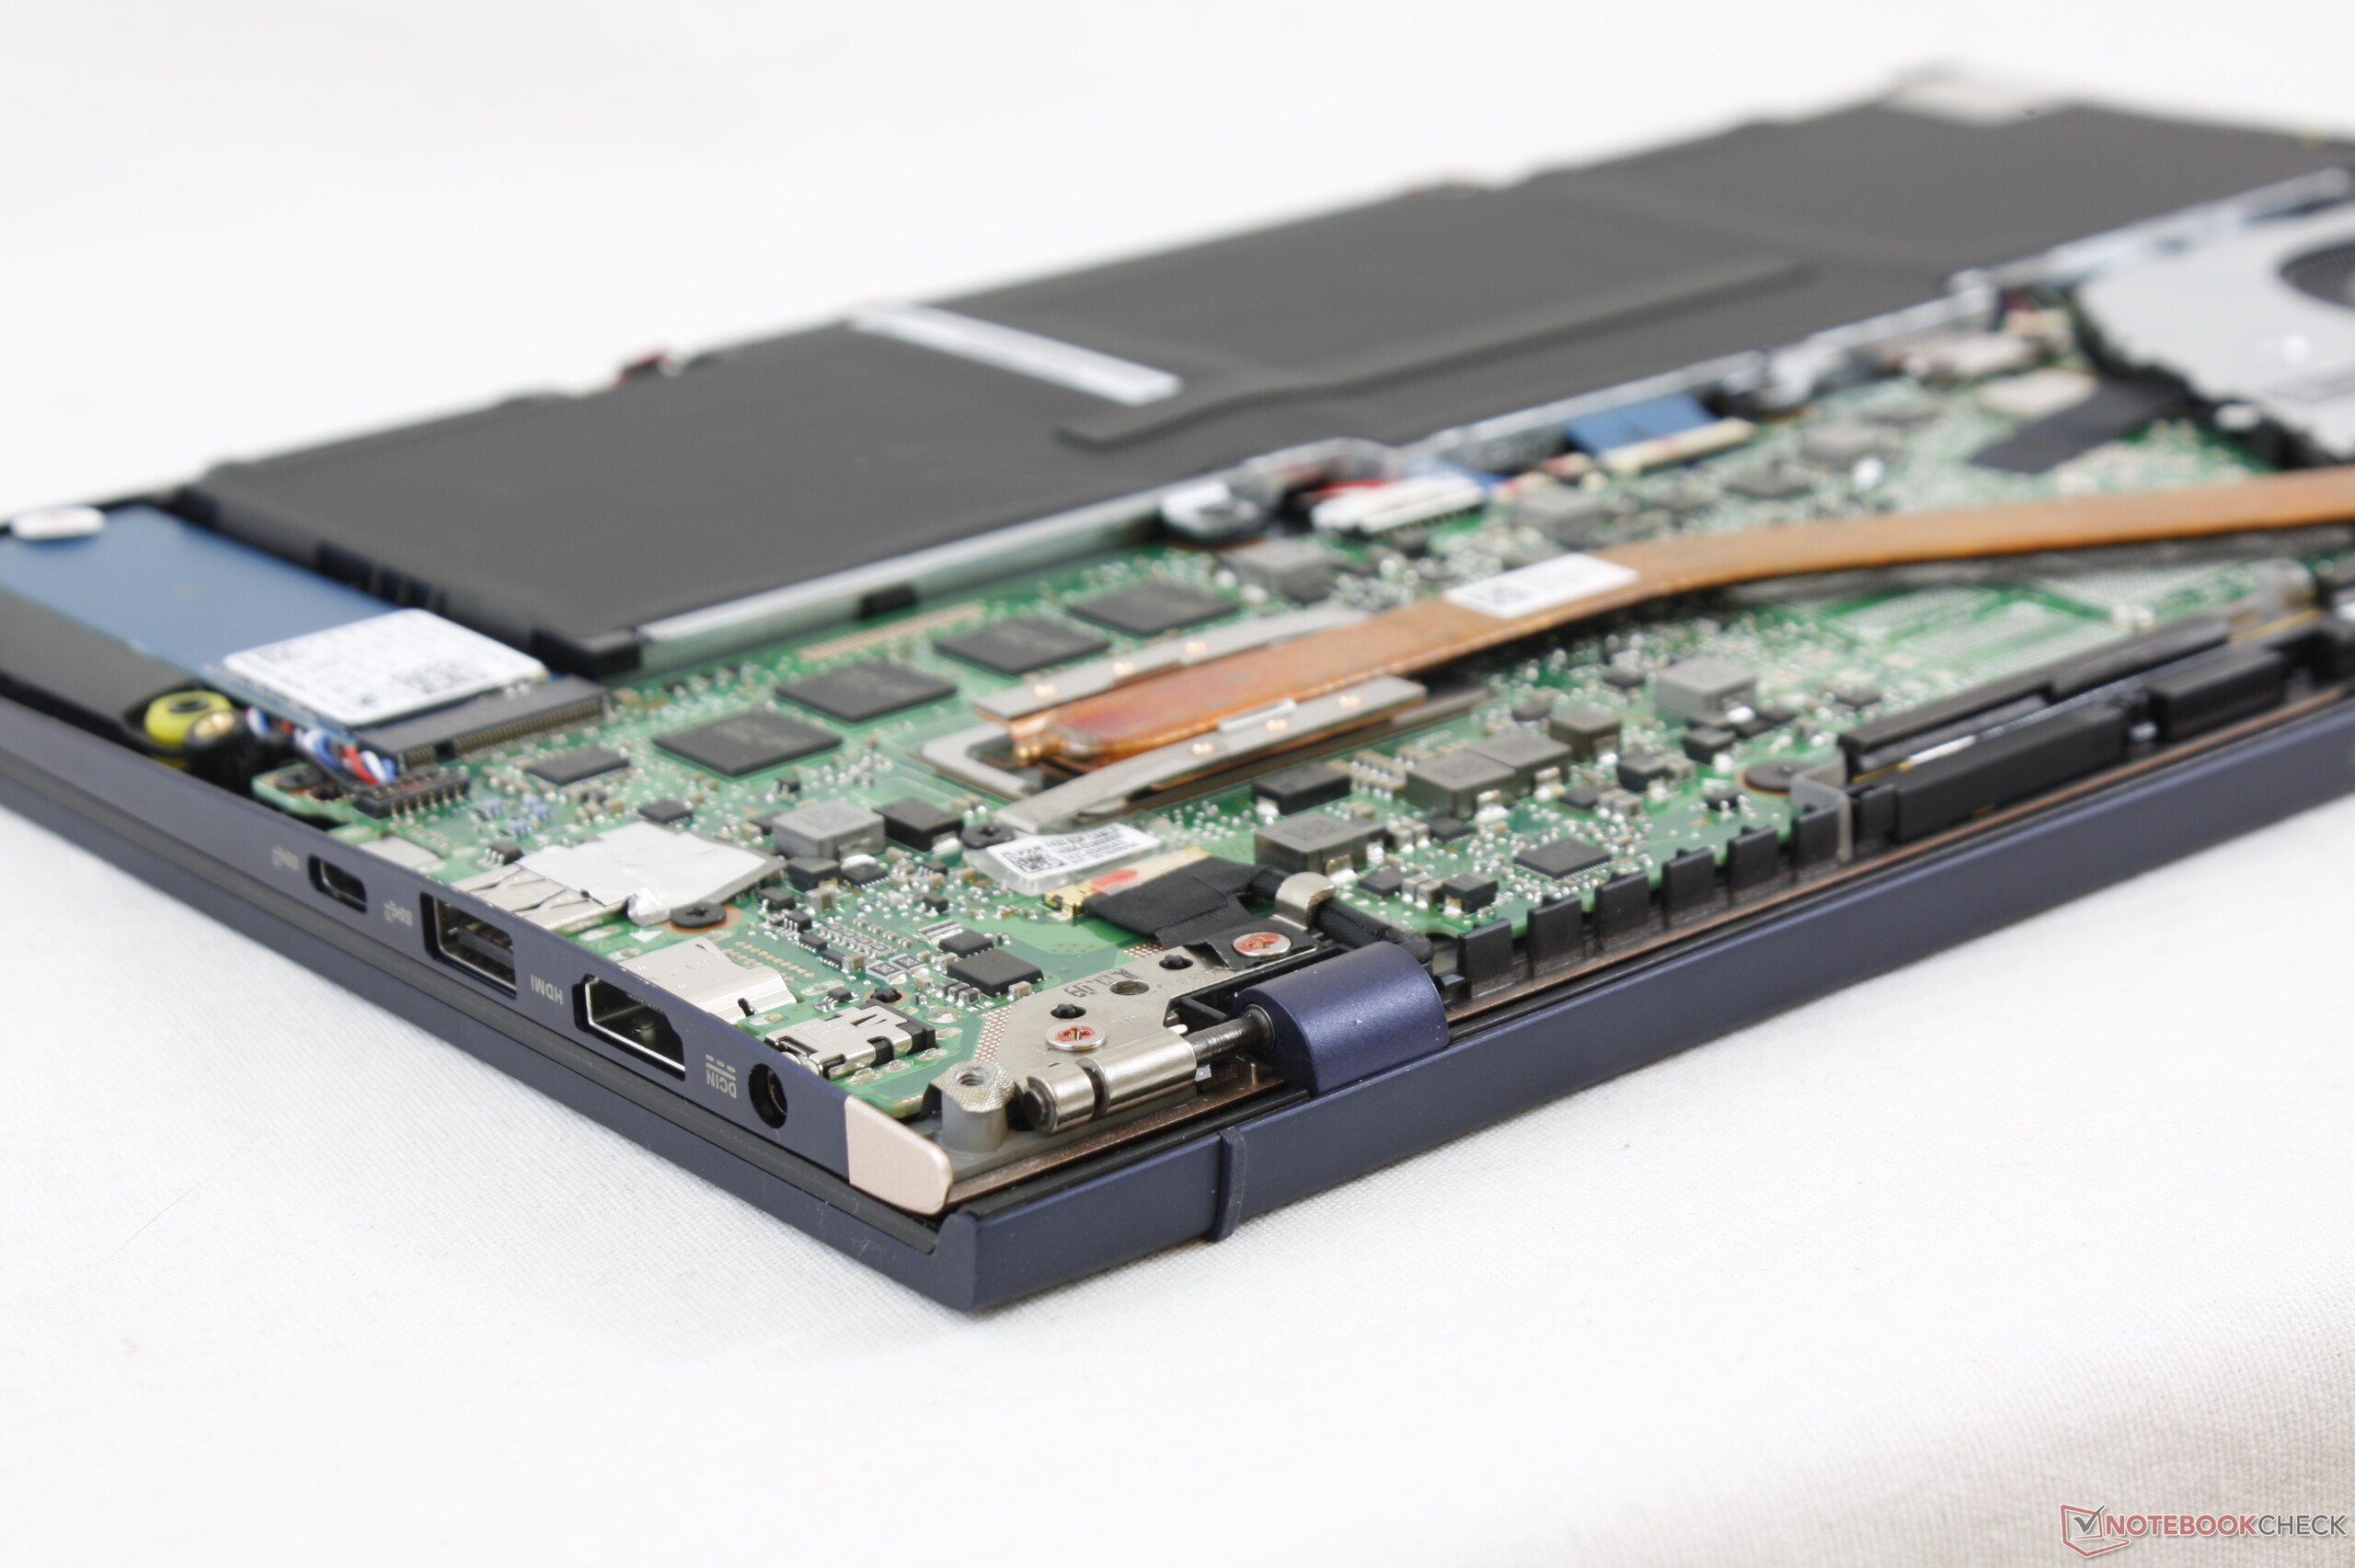
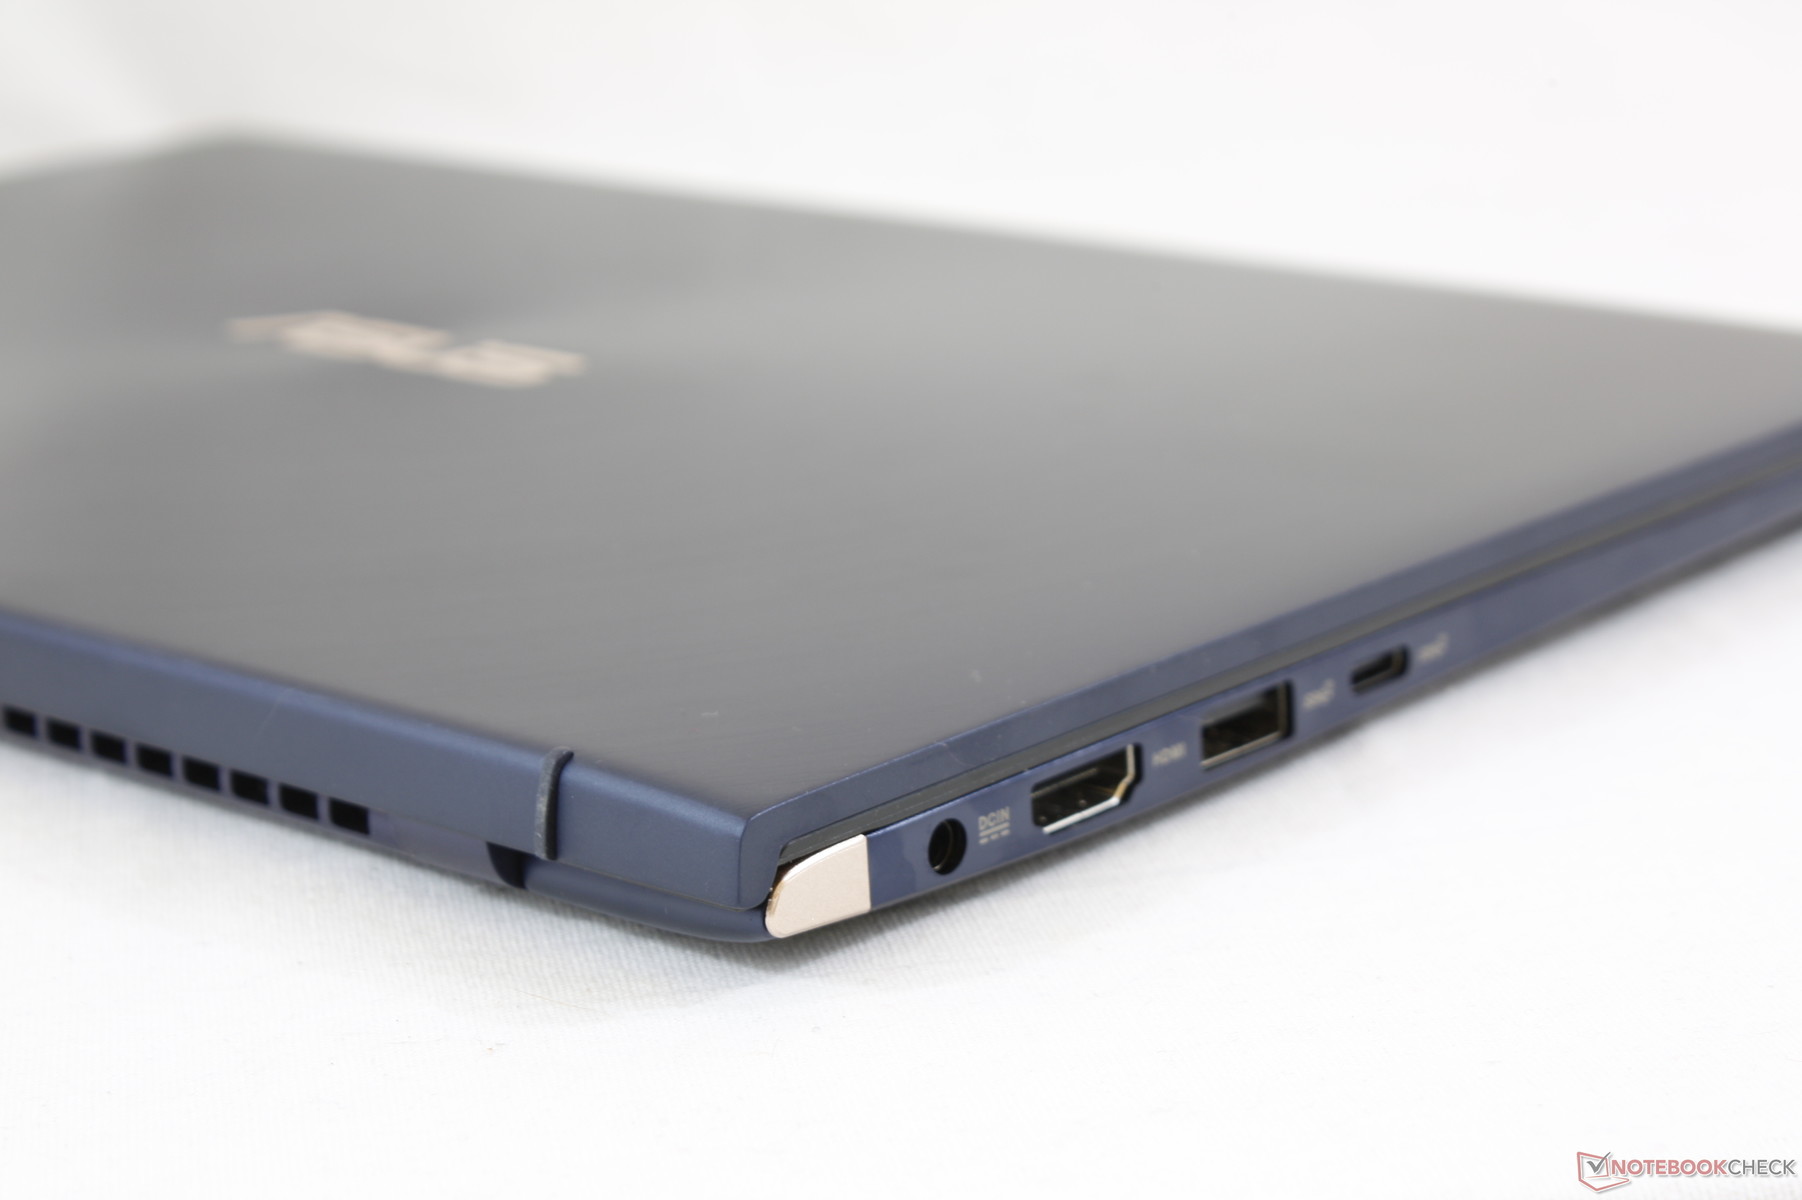
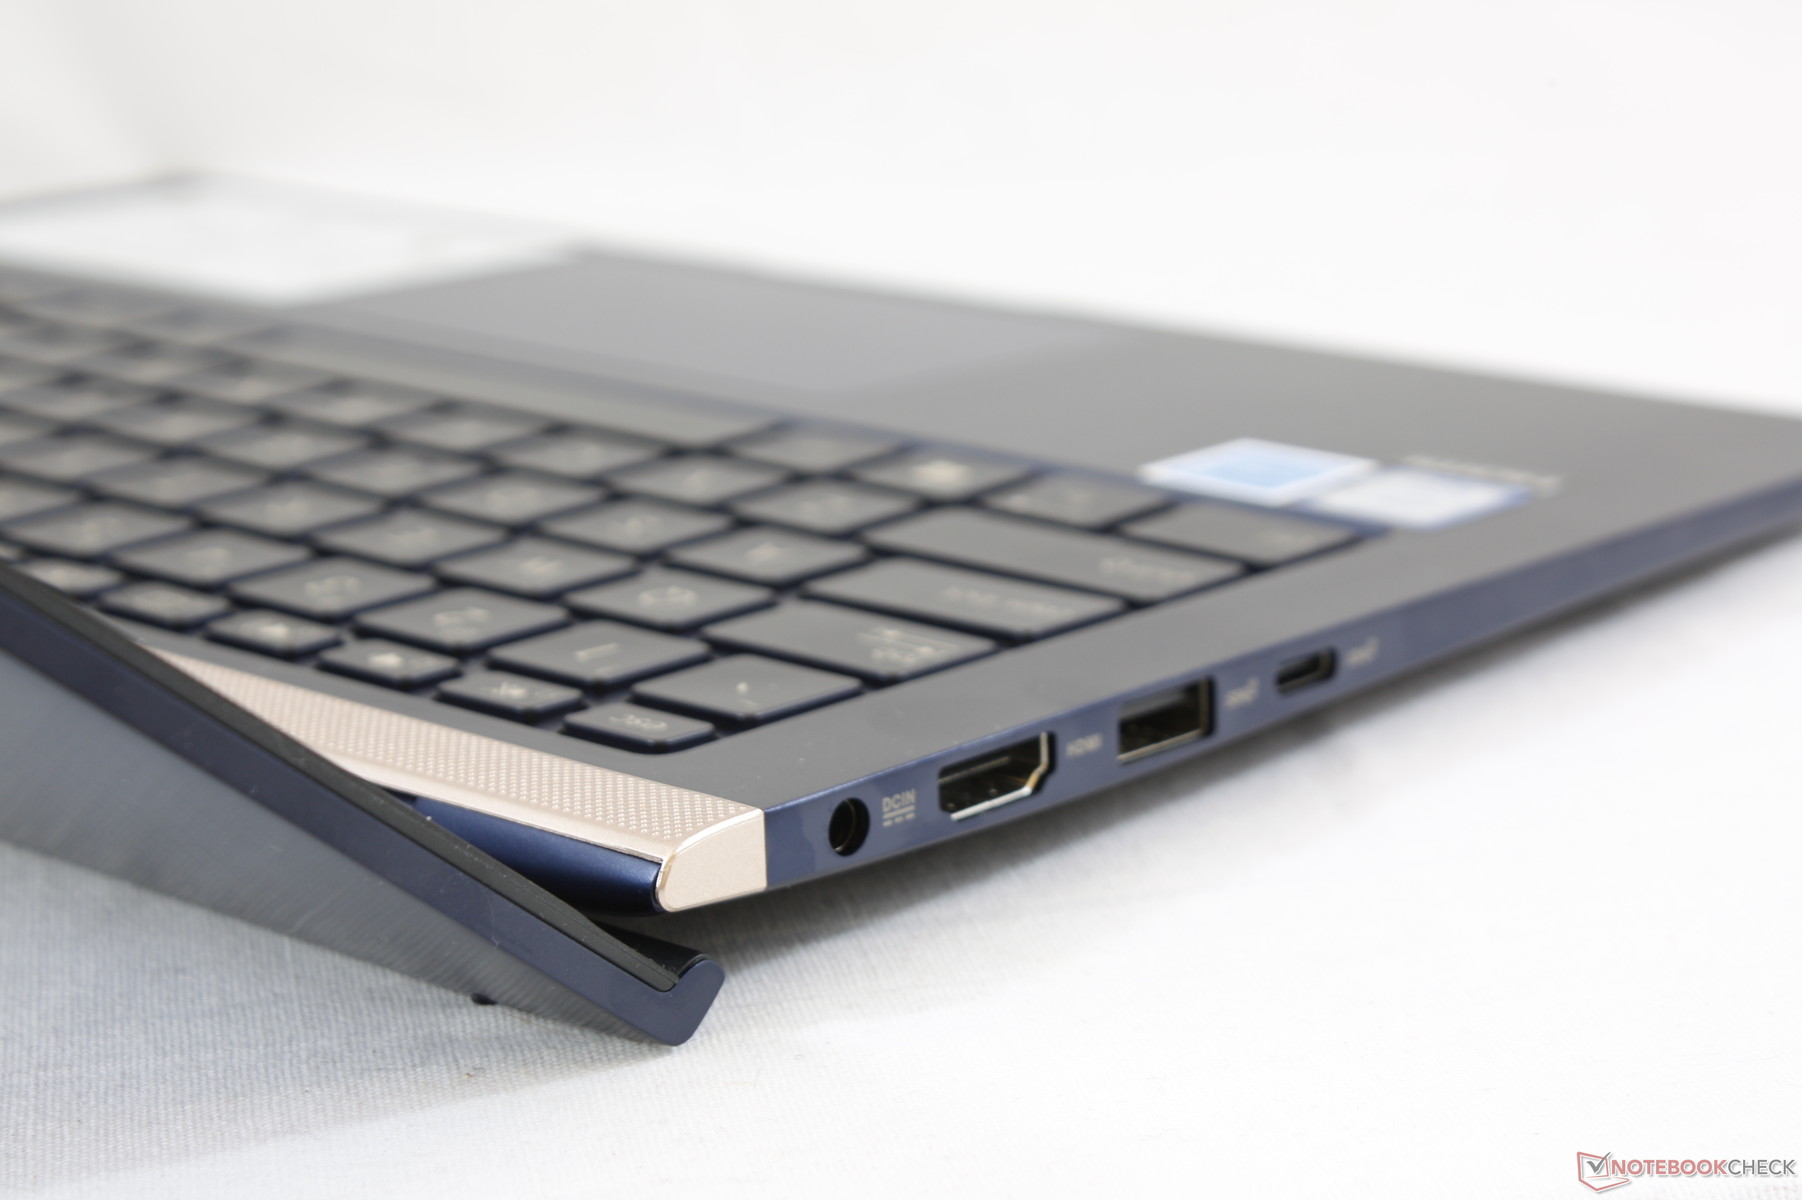
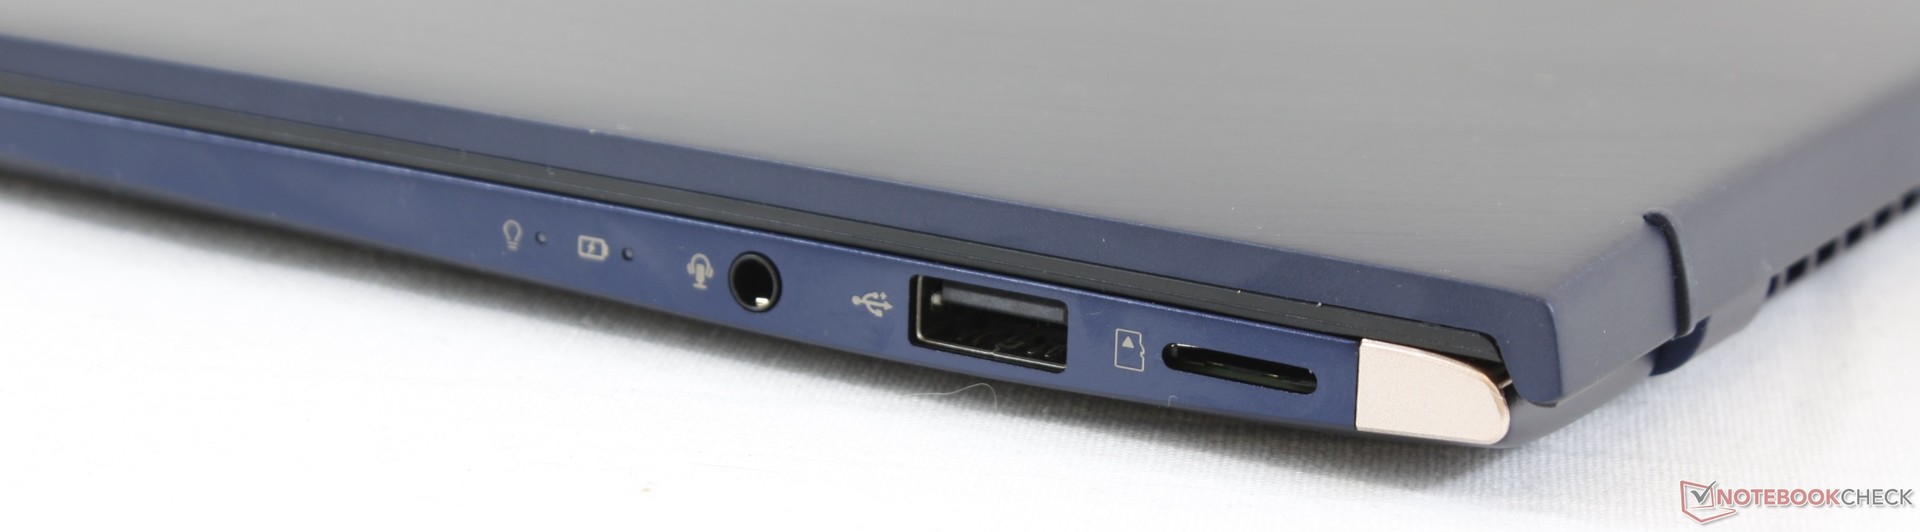
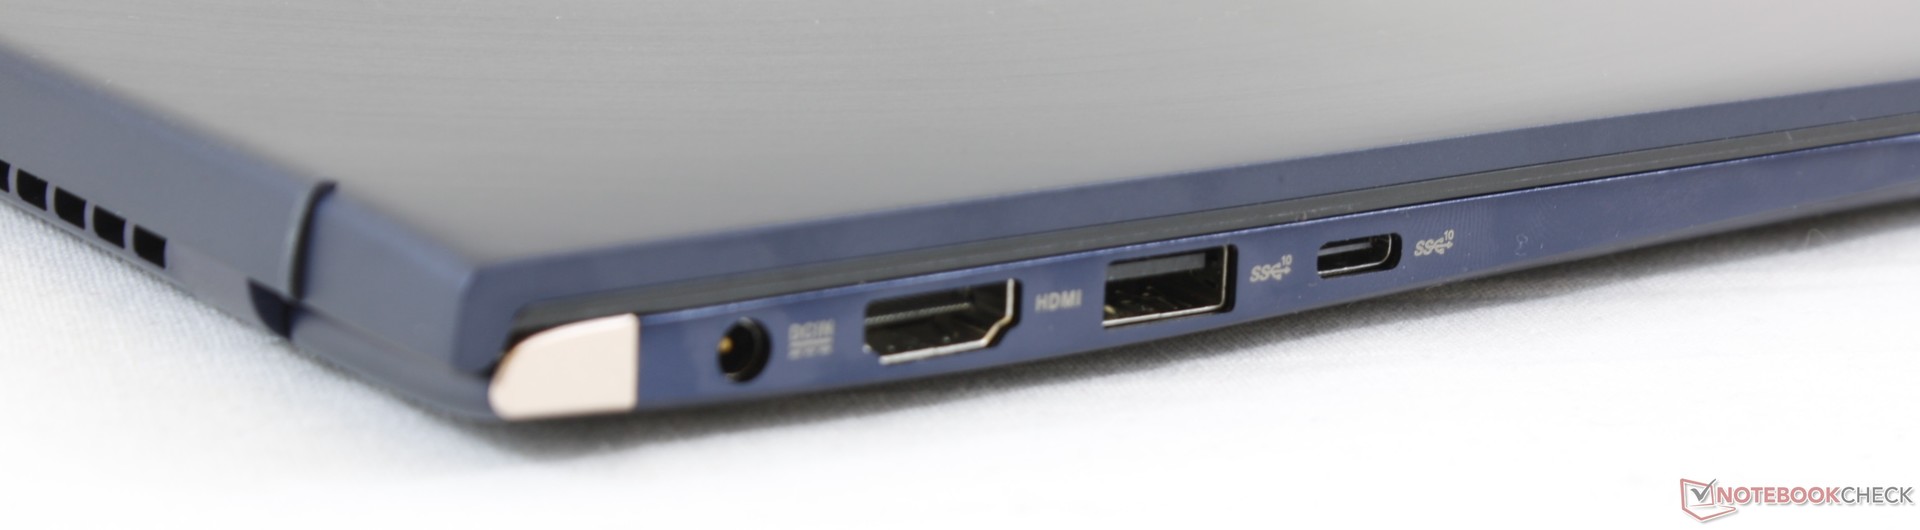
Port selection has changed when compared to the UX430. The full-size SD reader on the last generation model has been replaced by a smaller MicroSD reader while the smaller Micro HDMI port on the UX430 has been replaced by a full-size HDMI port. USB Type-C returns albeit still with no Thunderbolt 3 support.
We're disappointed to see a proprietary charging port yet again as a combo USB Type-C charger would have been more convenient. Competitors like the HP Spectre 13, Dell XPS 13, and Lenovo Yoga C930 have already moved on to USB Type-C charging.
SD Card Reader
The spring-loaded MicroSD reader is just as slow as the full-size reader on the UX430. Transferring 1 GB of images from our UHS-II MicroSD card takes 33 seconds compared to less than 7 seconds on the XPS 13 MicroSD reader.
A fully inserted MicroSD card protrudes by about 1 mm for easy ejecting and safe carrying.
| SD Card Reader | |
| average JPG Copy Test (av. of 3 runs) | |
| HP Spectre x360 13-ae048ng (Toshiba Exceria Pro M501 microSDXC 64GB) | |
| Dell XPS 13 9370 i7 UHD (Toshiba Exceria Pro UHS-II) | |
| Asus Zenbook UX430UN (Toshiba Exceria Pro SDXC 64 GB UHS-II) | |
| Asus ZenBook 14 UX433FA (Toshiba Exceria Pro M501 microSDXC) | |
| maximum AS SSD Seq Read Test (1GB) | |
| Dell XPS 13 9370 i7 UHD (Toshiba Exceria Pro UHS-II) | |
| HP Spectre x360 13-ae048ng (Toshiba Exceria Pro M501 microSDXC 64GB) | |
| Asus Zenbook UX430UN (Toshiba Exceria Pro SDXC 64 GB UHS-II) | |
| Asus ZenBook 14 UX433FA (Toshiba Exceria Pro M501 microSDXC) | |
Communication
The Intel 9560 provides Bluetooth 5 and WLAN transfer rates of up to 1.73 Gbps. Our results below are much slower than this since our server is limited to a 1 Gbps line. We didn't experience any connectivity issues during our time with the unit.
| Networking | |
| iperf3 transmit AX12 | |
| Asus ZenBook 14 UX433FA | |
| Huawei Matebook X Pro i5 | |
| Dell XPS 13 9370 i7 UHD | |
| Asus Zenbook UX430UN | |
| iperf3 receive AX12 | |
| Dell XPS 13 9370 i7 UHD | |
| Huawei Matebook X Pro i5 | |
| Asus Zenbook UX430UN | |
| Asus ZenBook 14 UX433FA | |
Maintenance
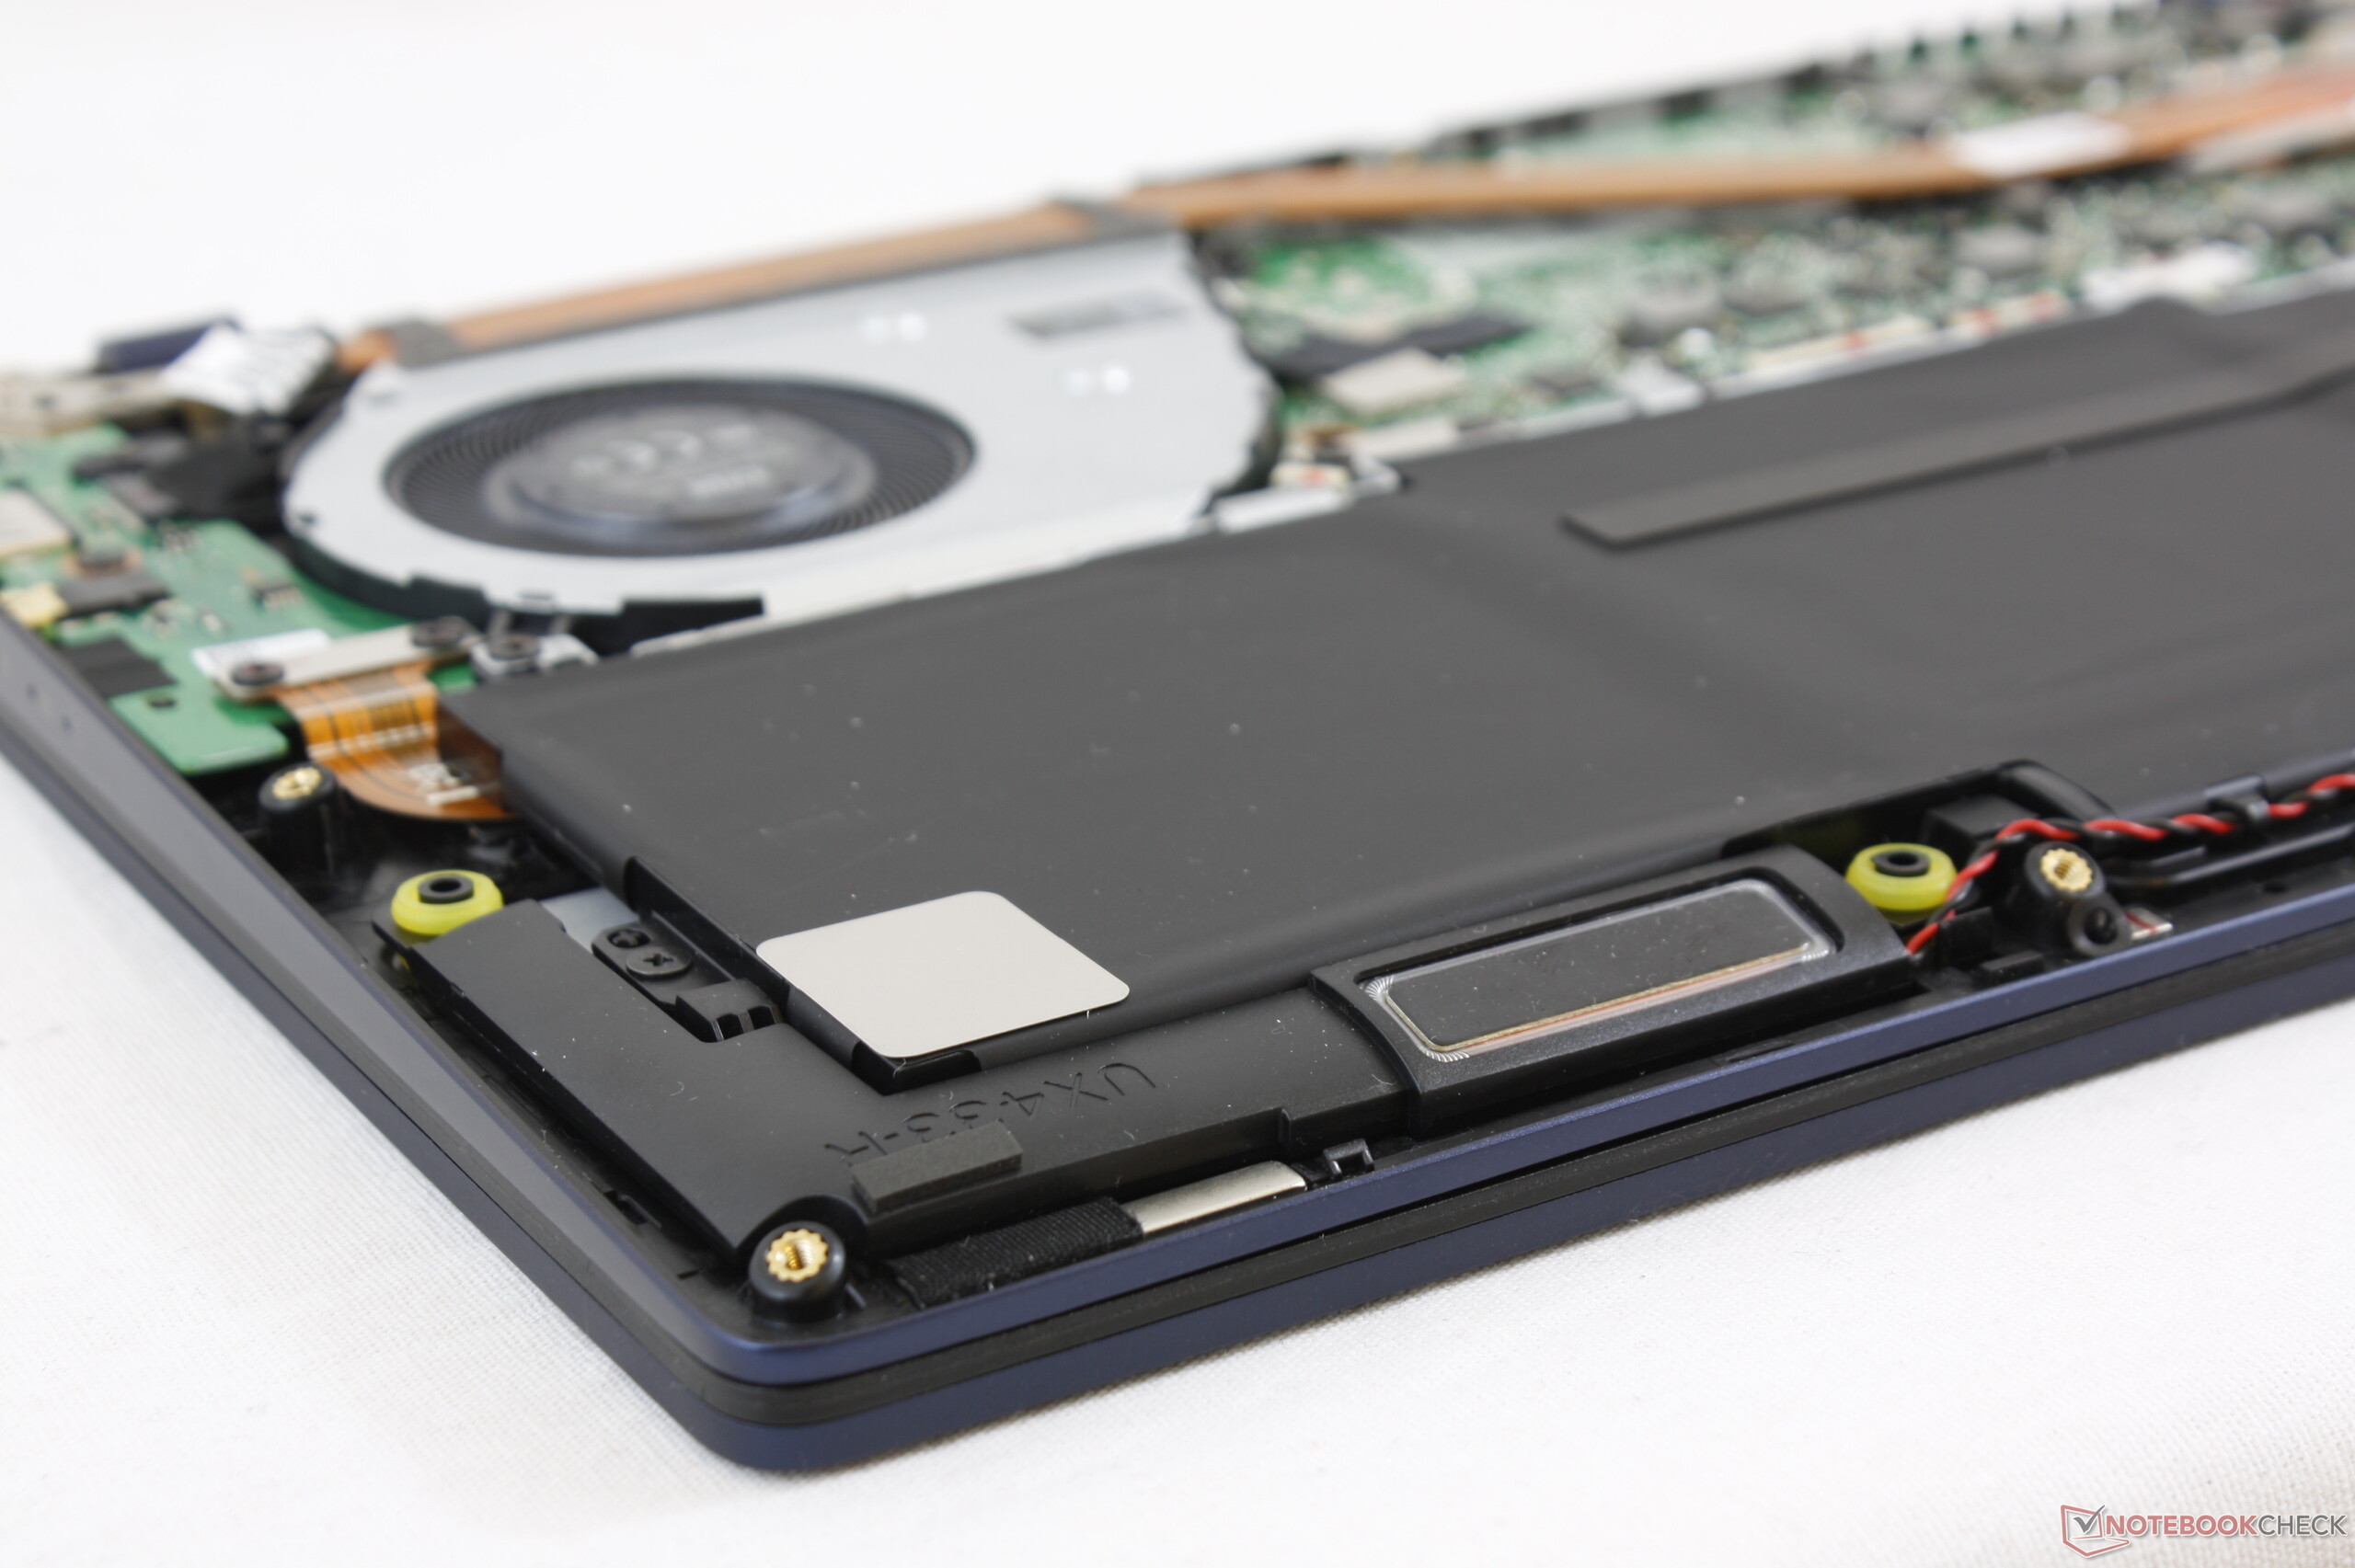
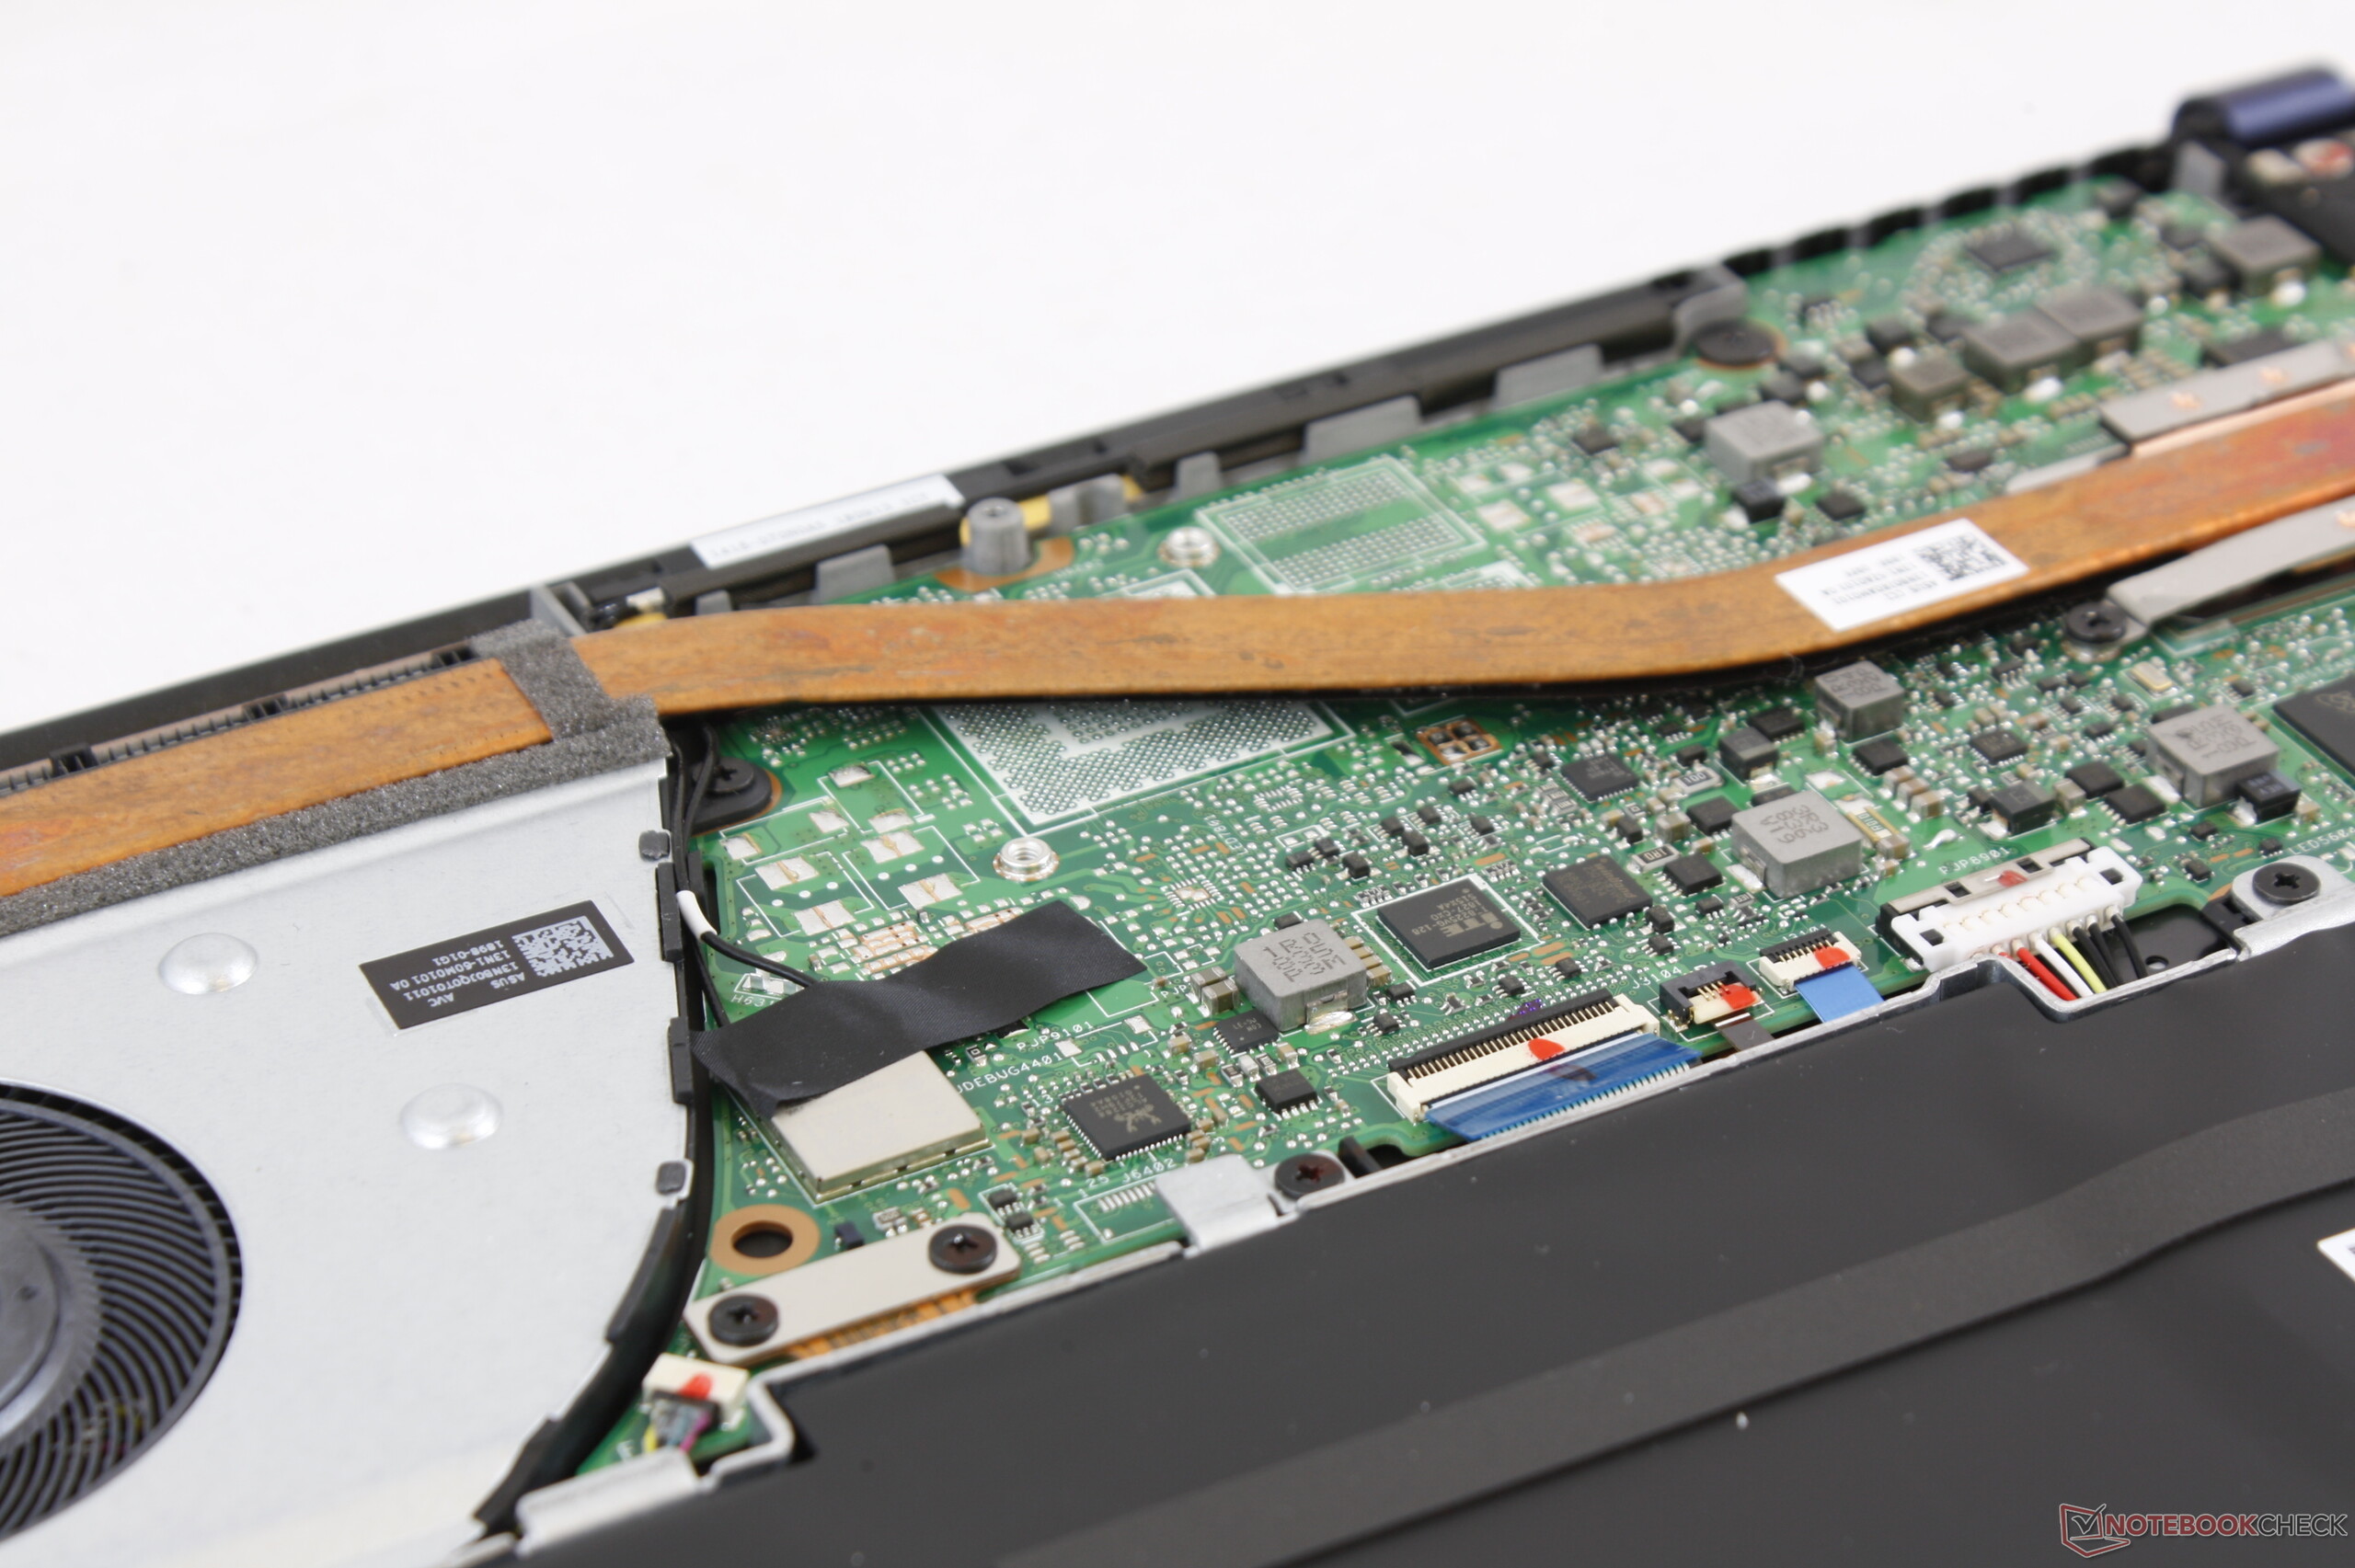
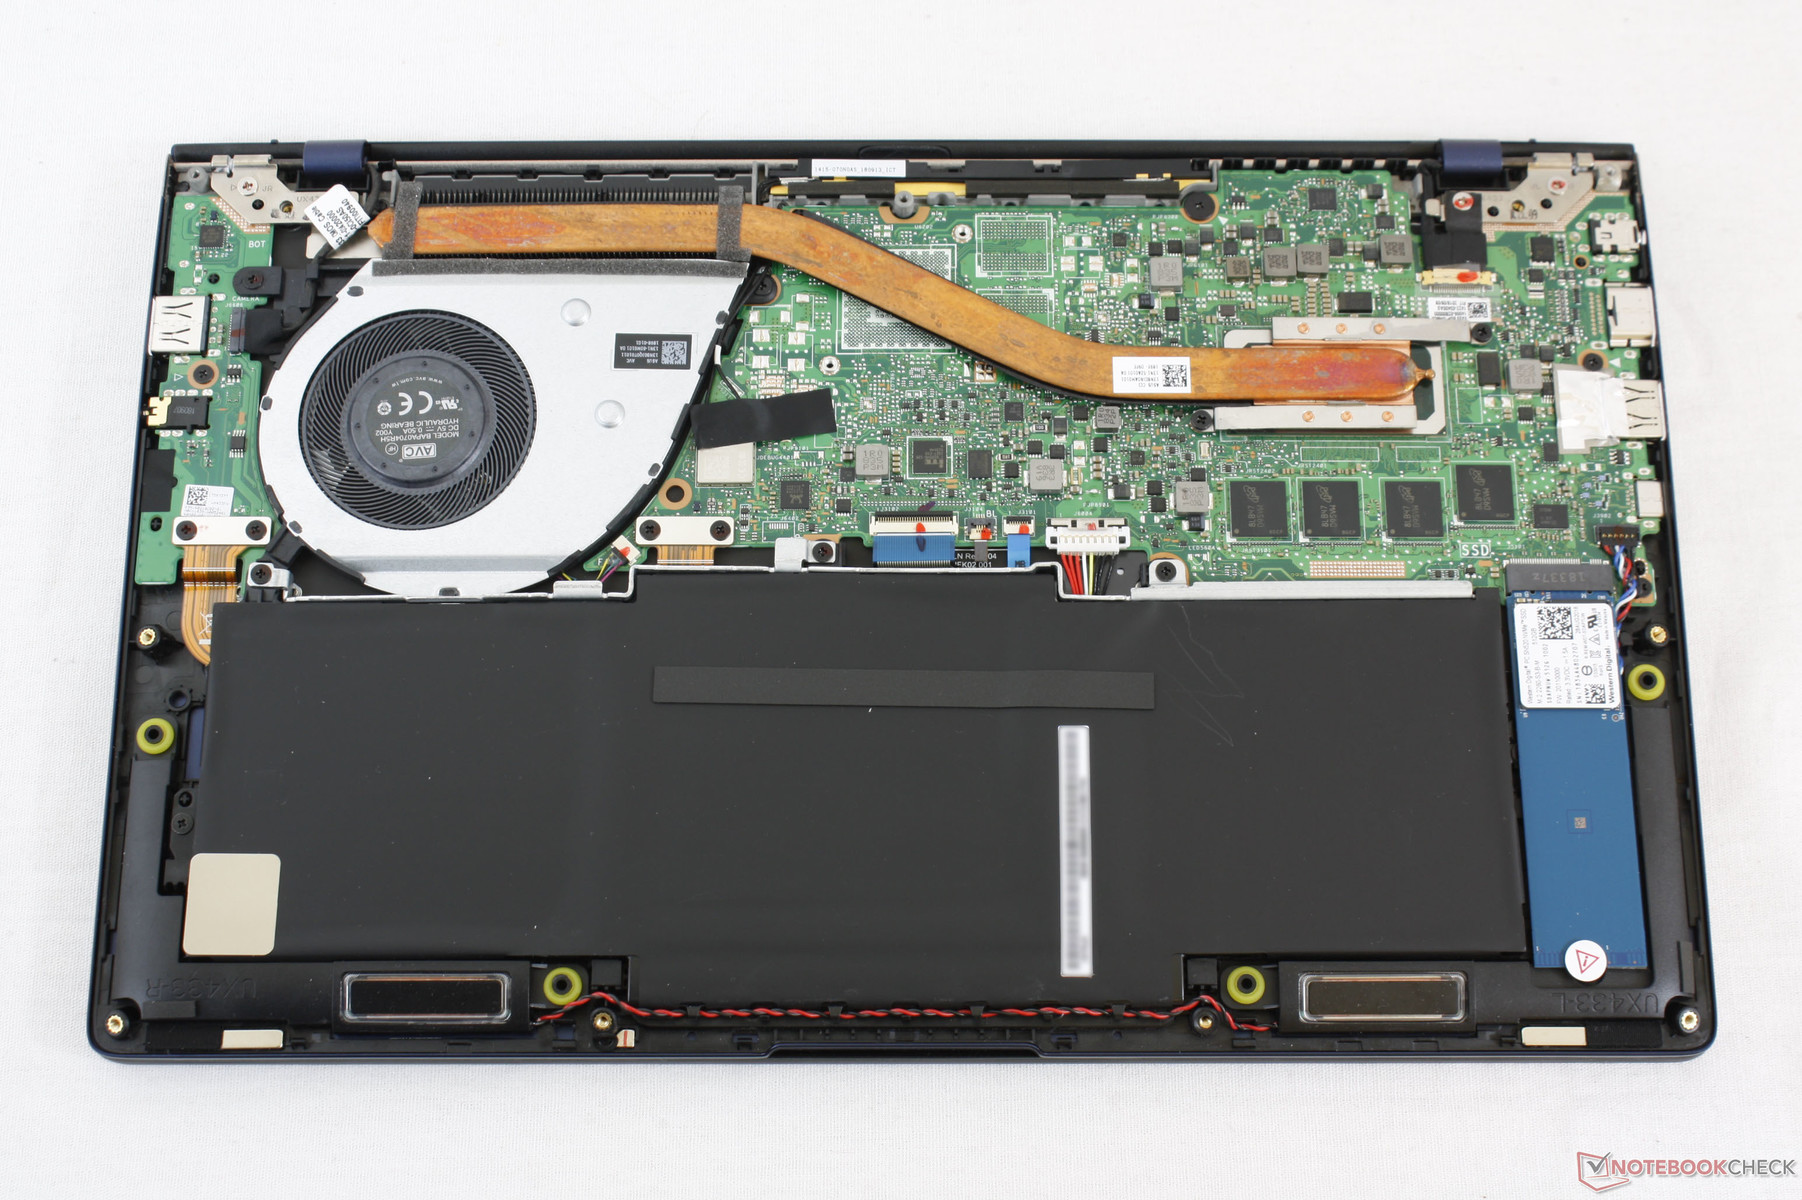
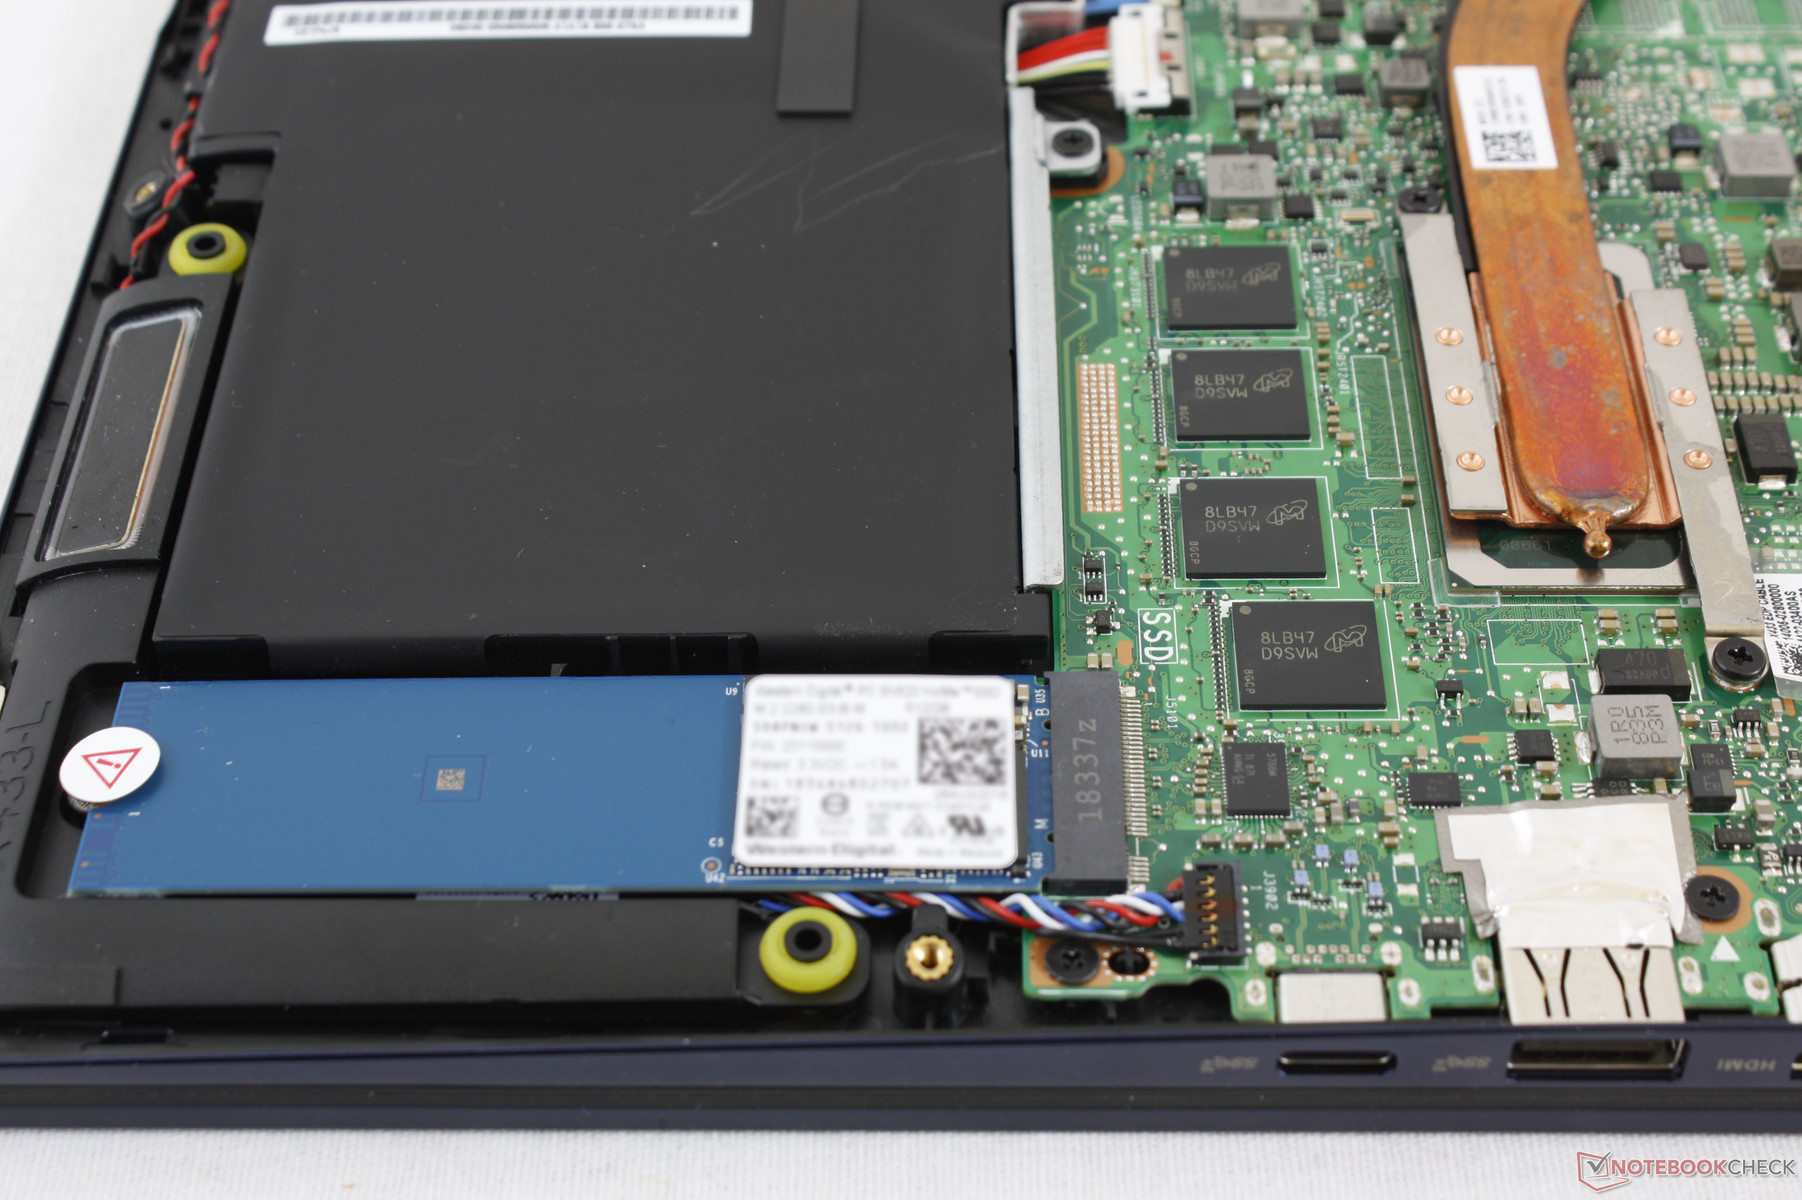
The bottom panel requires both a T5 Torx wrench and a Philips screwdriver for the two hidden screws underneath the rubber footing. Servicing is easy if not slightly annoying because the rubber feet can be difficult to remove.
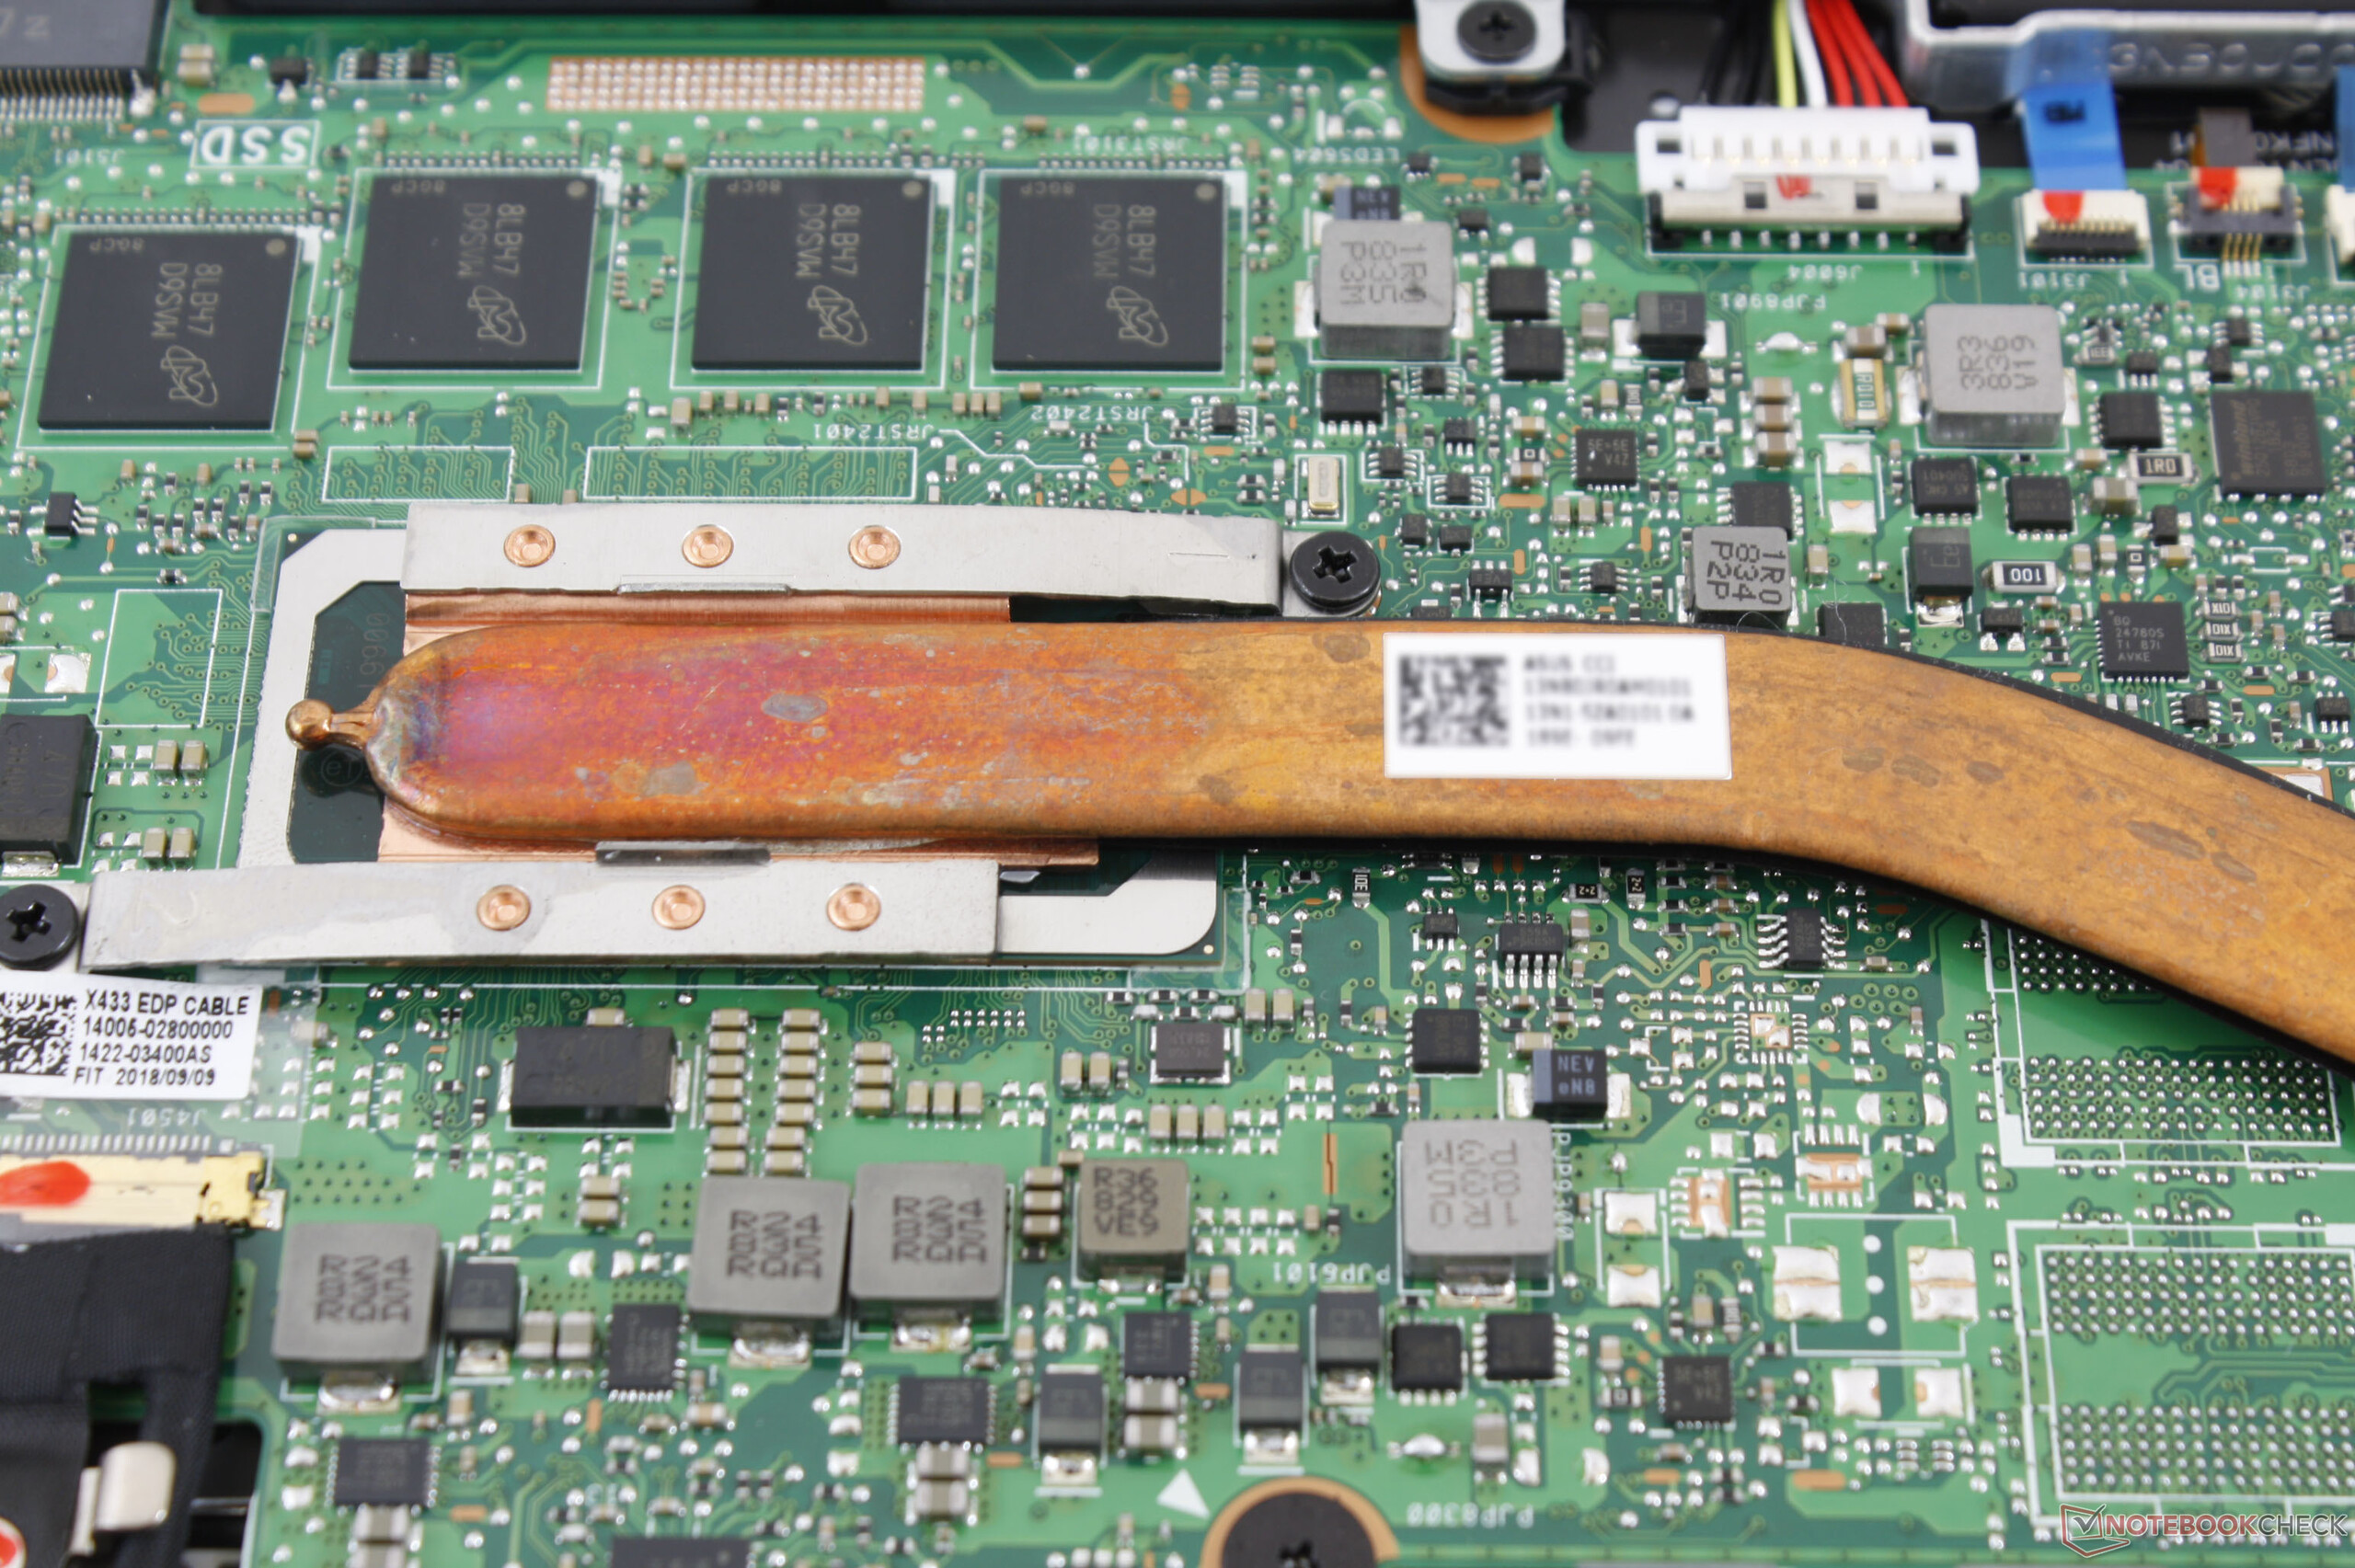
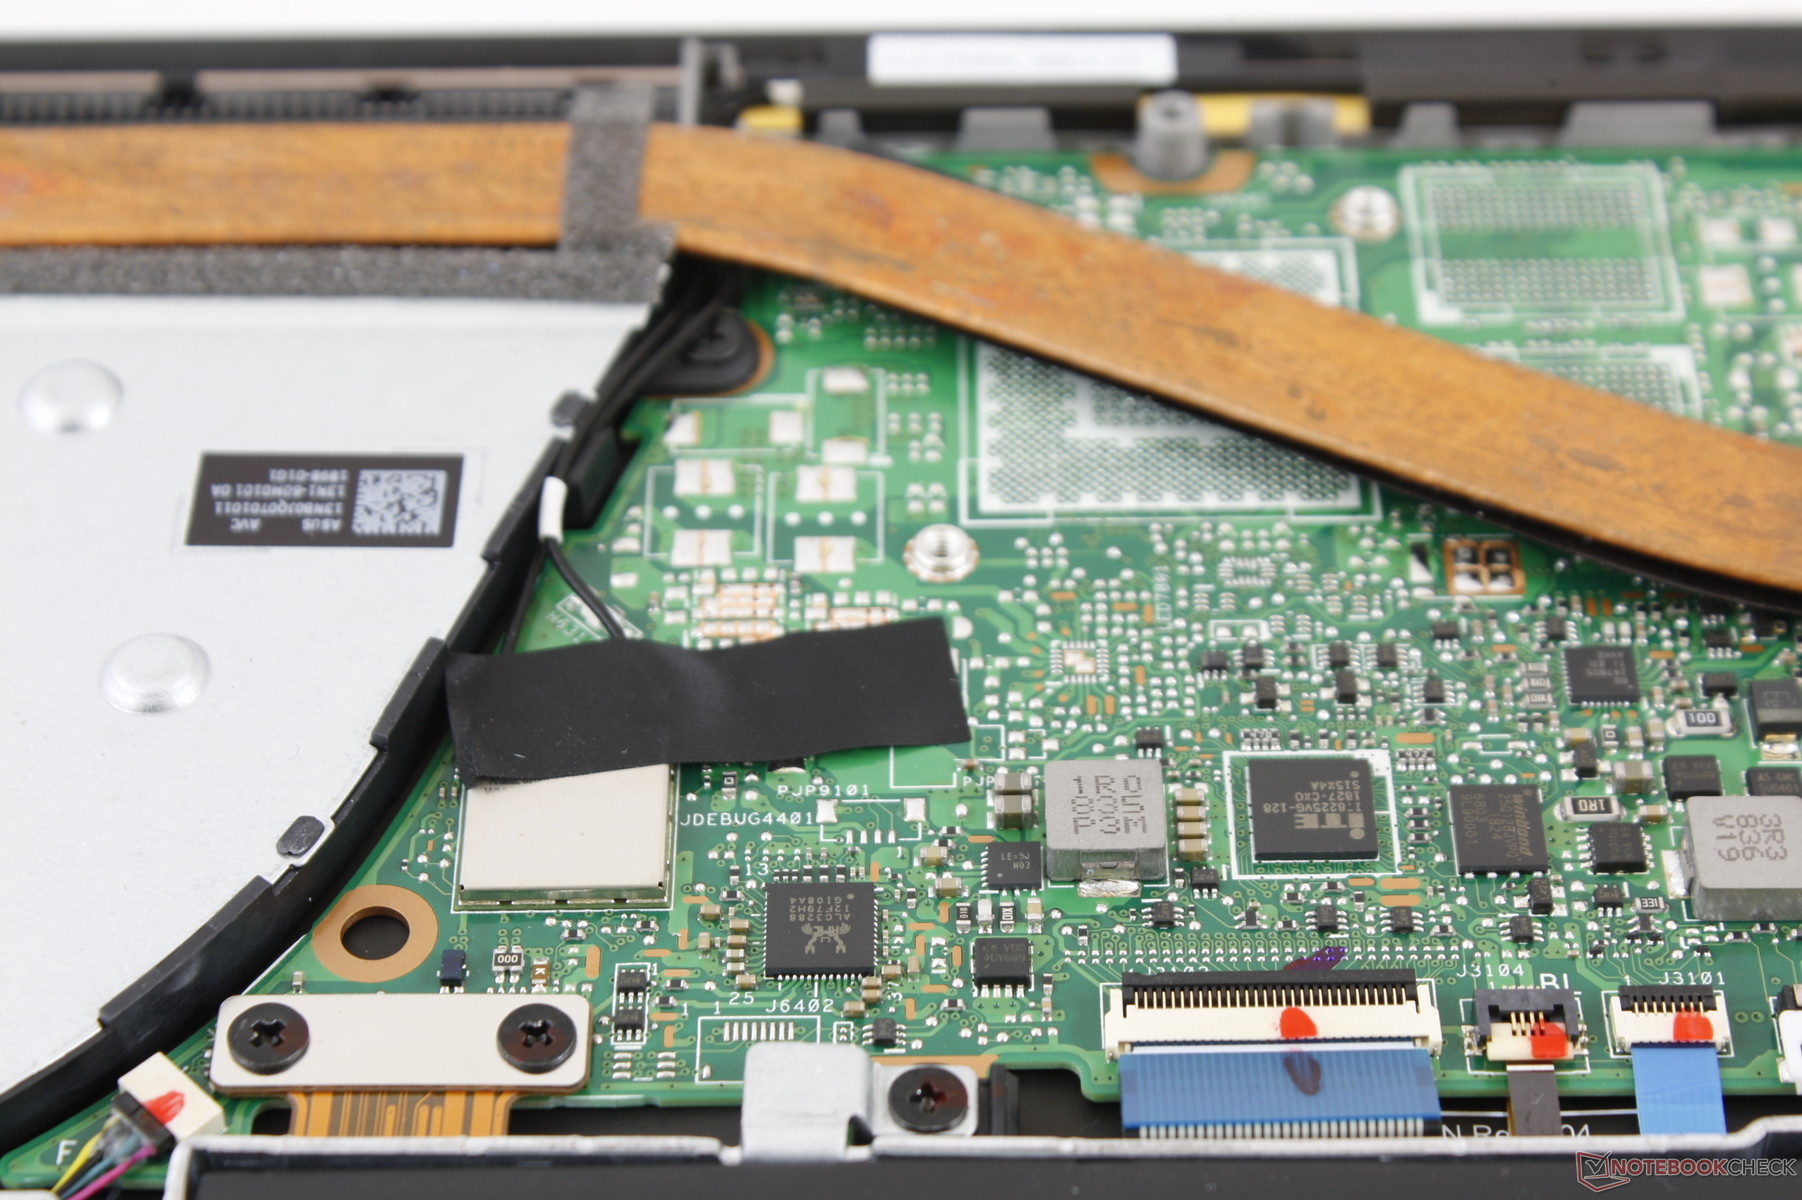
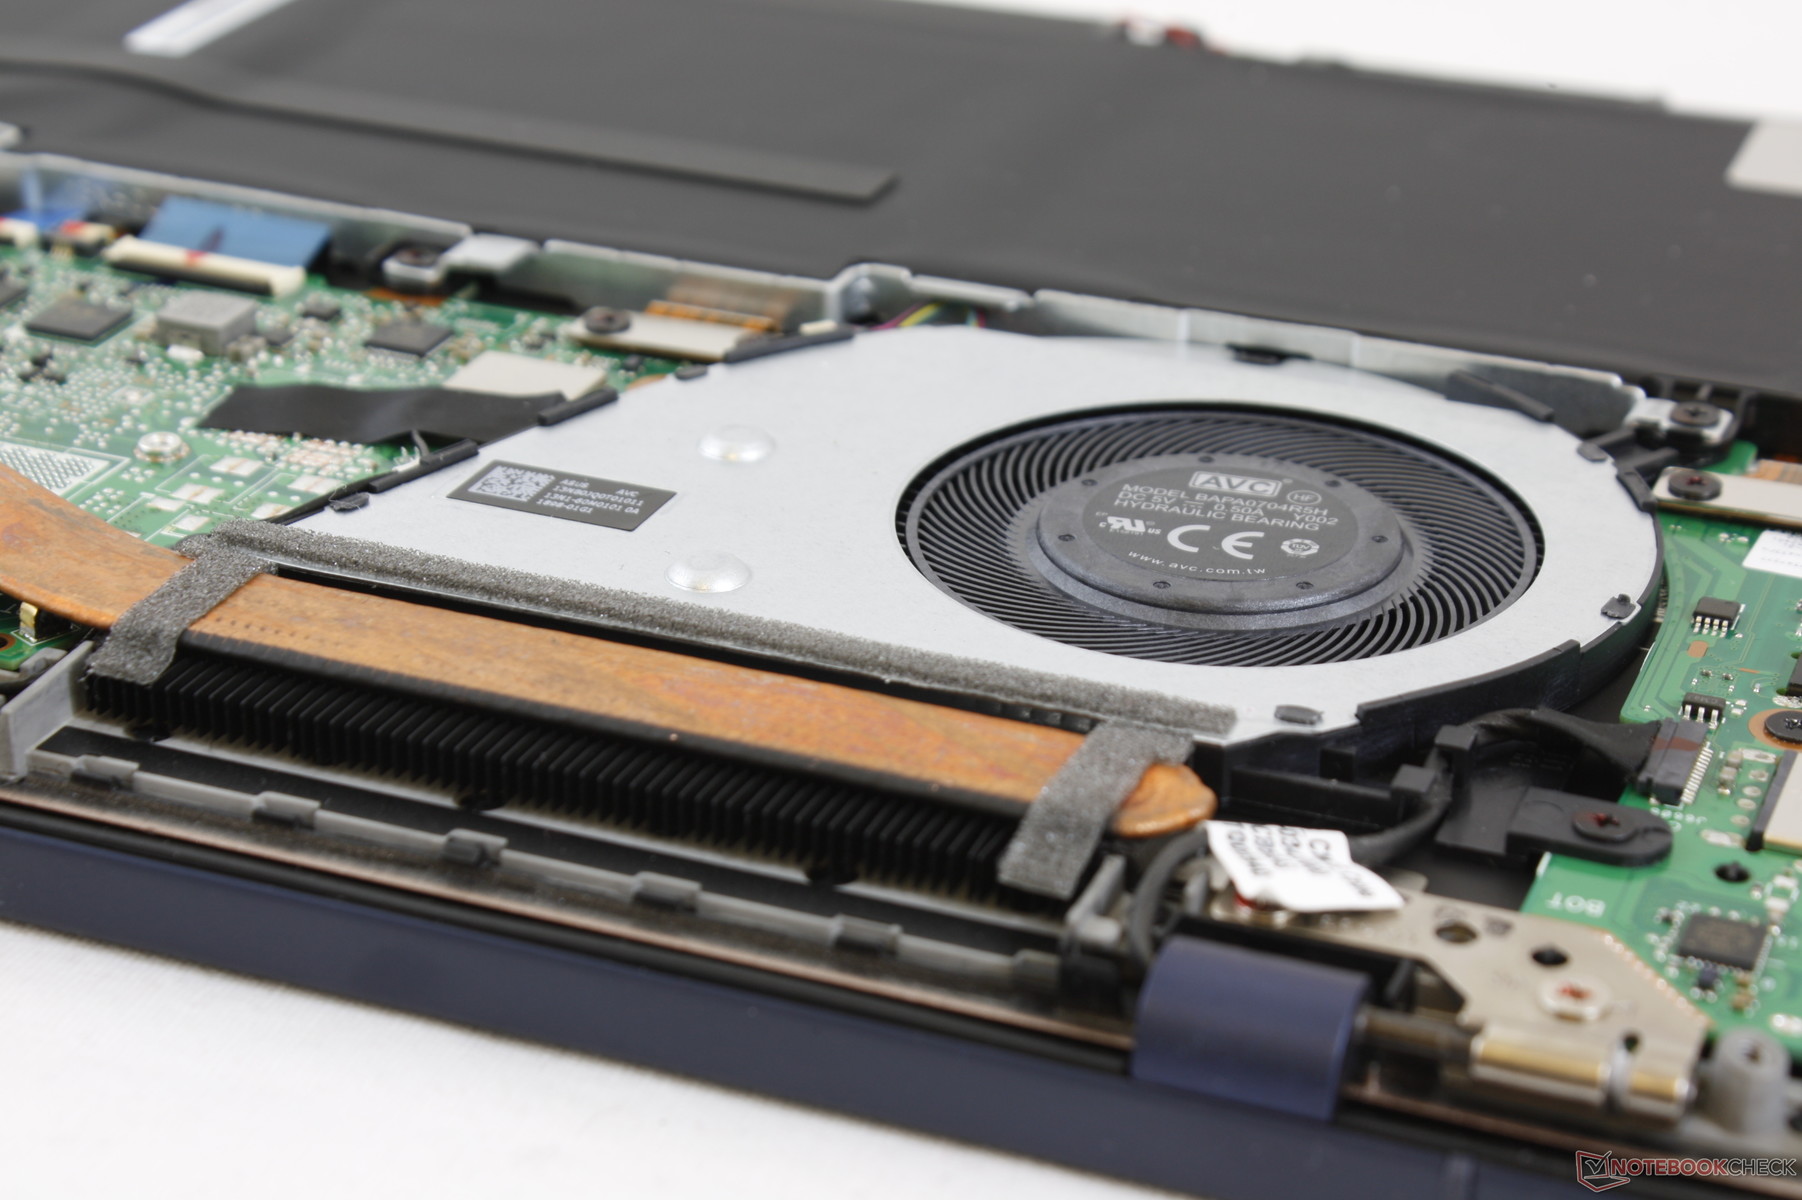
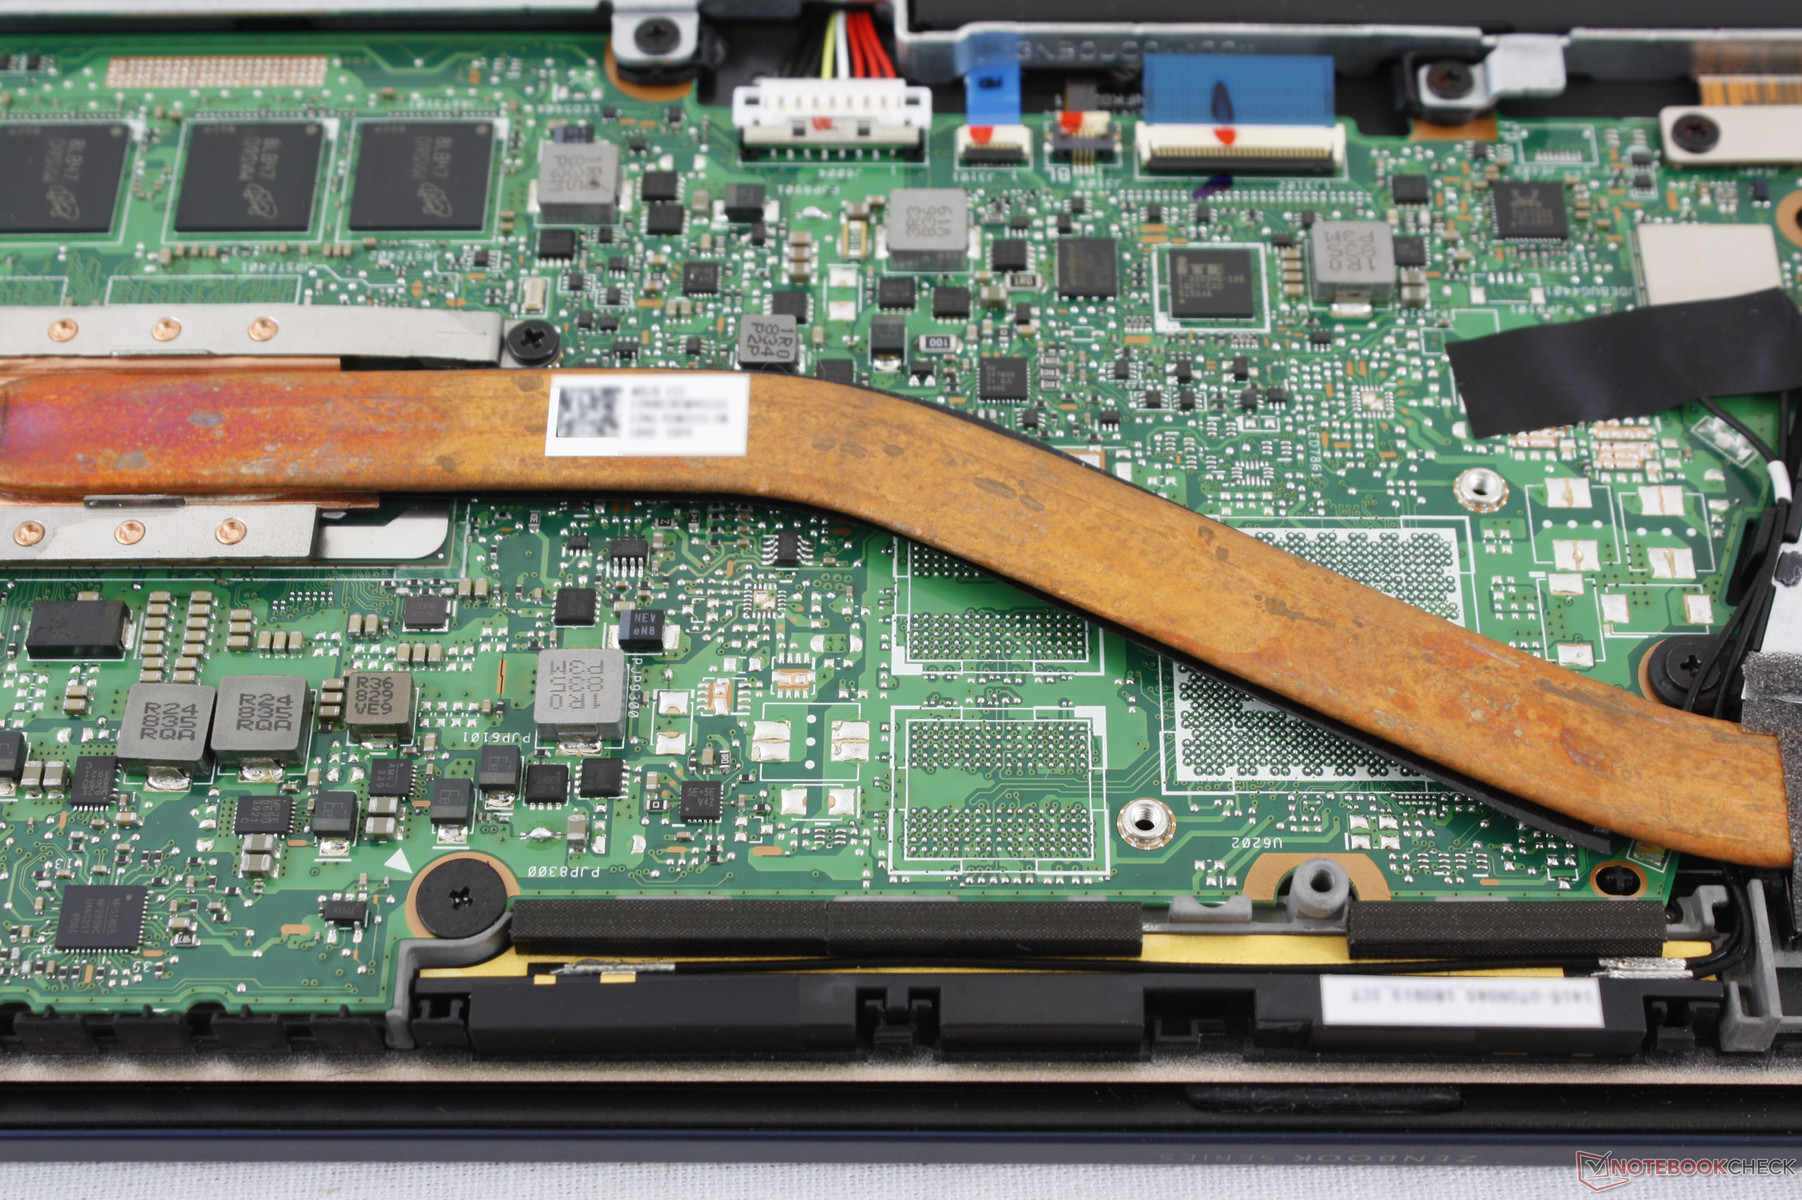
Upgrades are limited to the M.2 SSD as the WLAN and RAM modules are soldered. An empty slot underneath the heat pipe is reserved for a potential dedicated GPU even though there are currently no other GPU options for the UX433 as of this writing.
Accessories and Warranty
Asus throws in a free USB Type-A to RJ-45 adapter alongside the usual Quick Start guide and warranty card. Older Zenbook models, such as the Zenbook 3, included a free carrying case that we're sad to see missing for the UX433.
The standard one-year limited warranty applies. Please see our Guarantees, Return policies and Warranties FAQ for country-specific information.
Input Devices
Keyboard
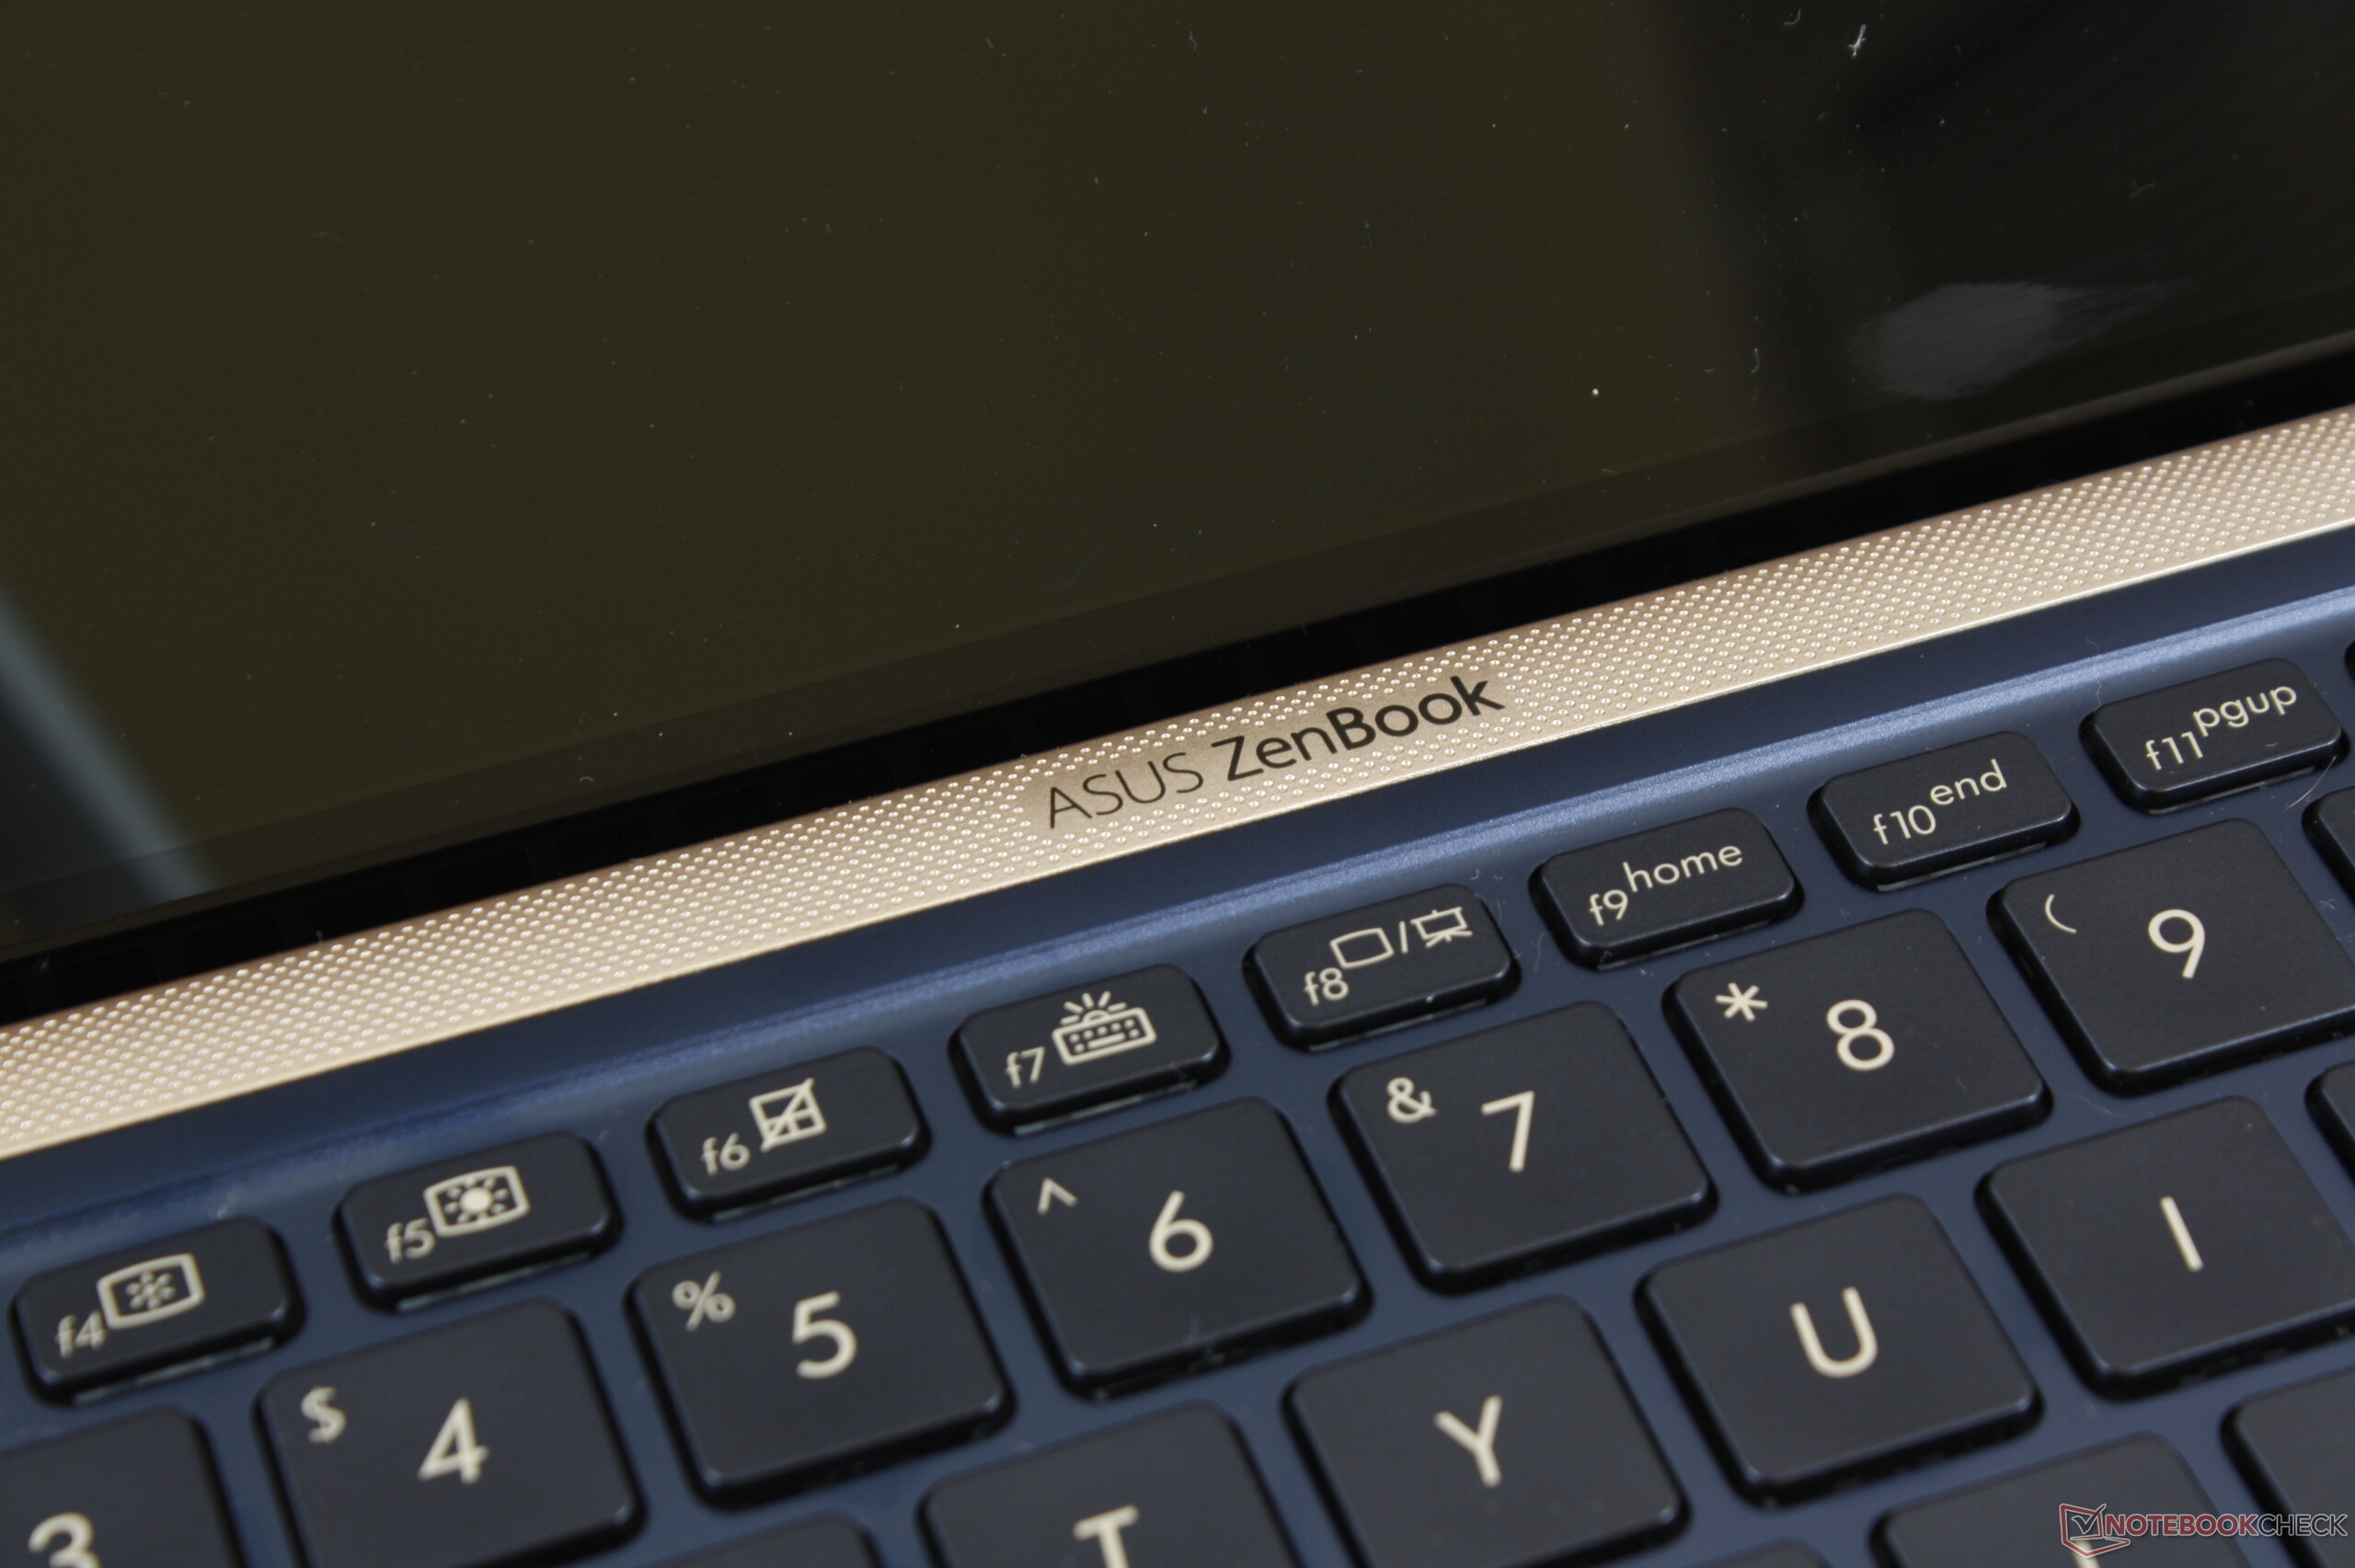
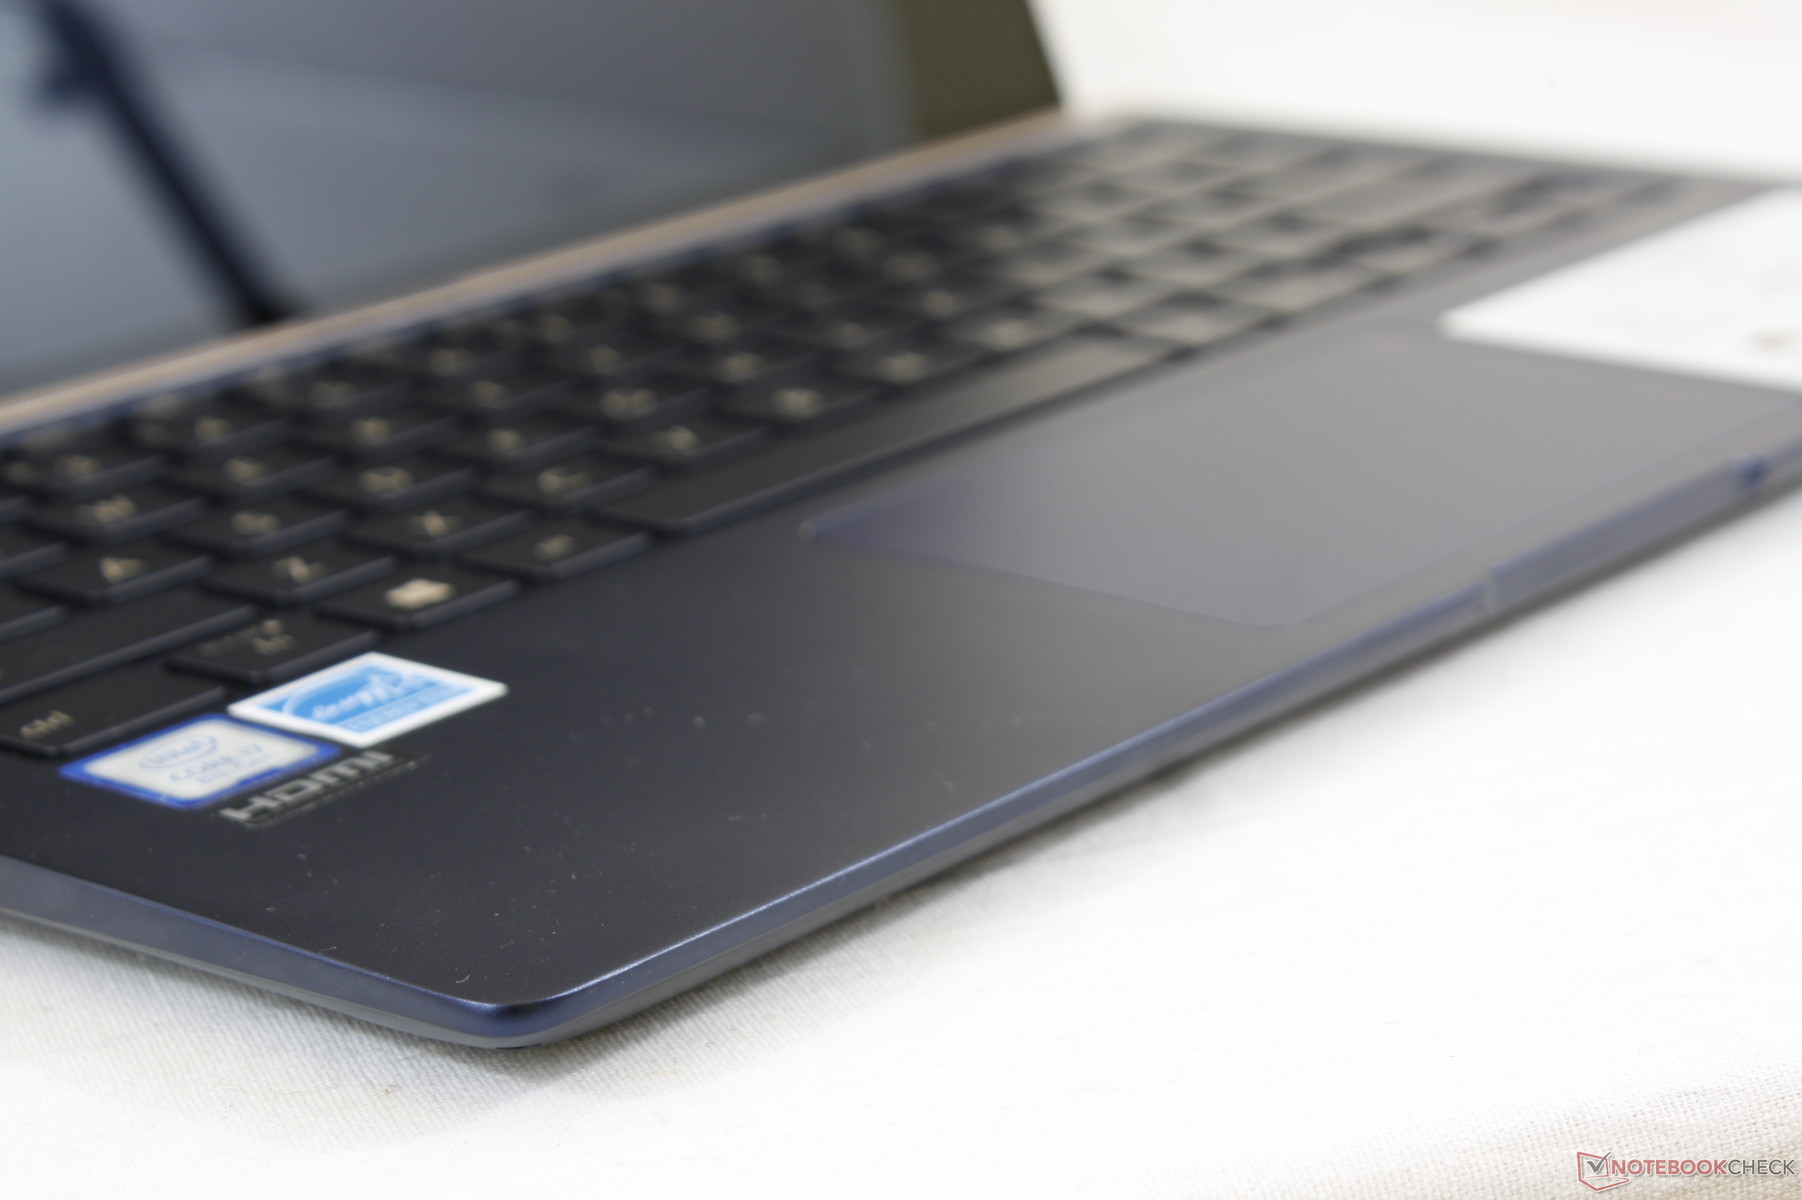
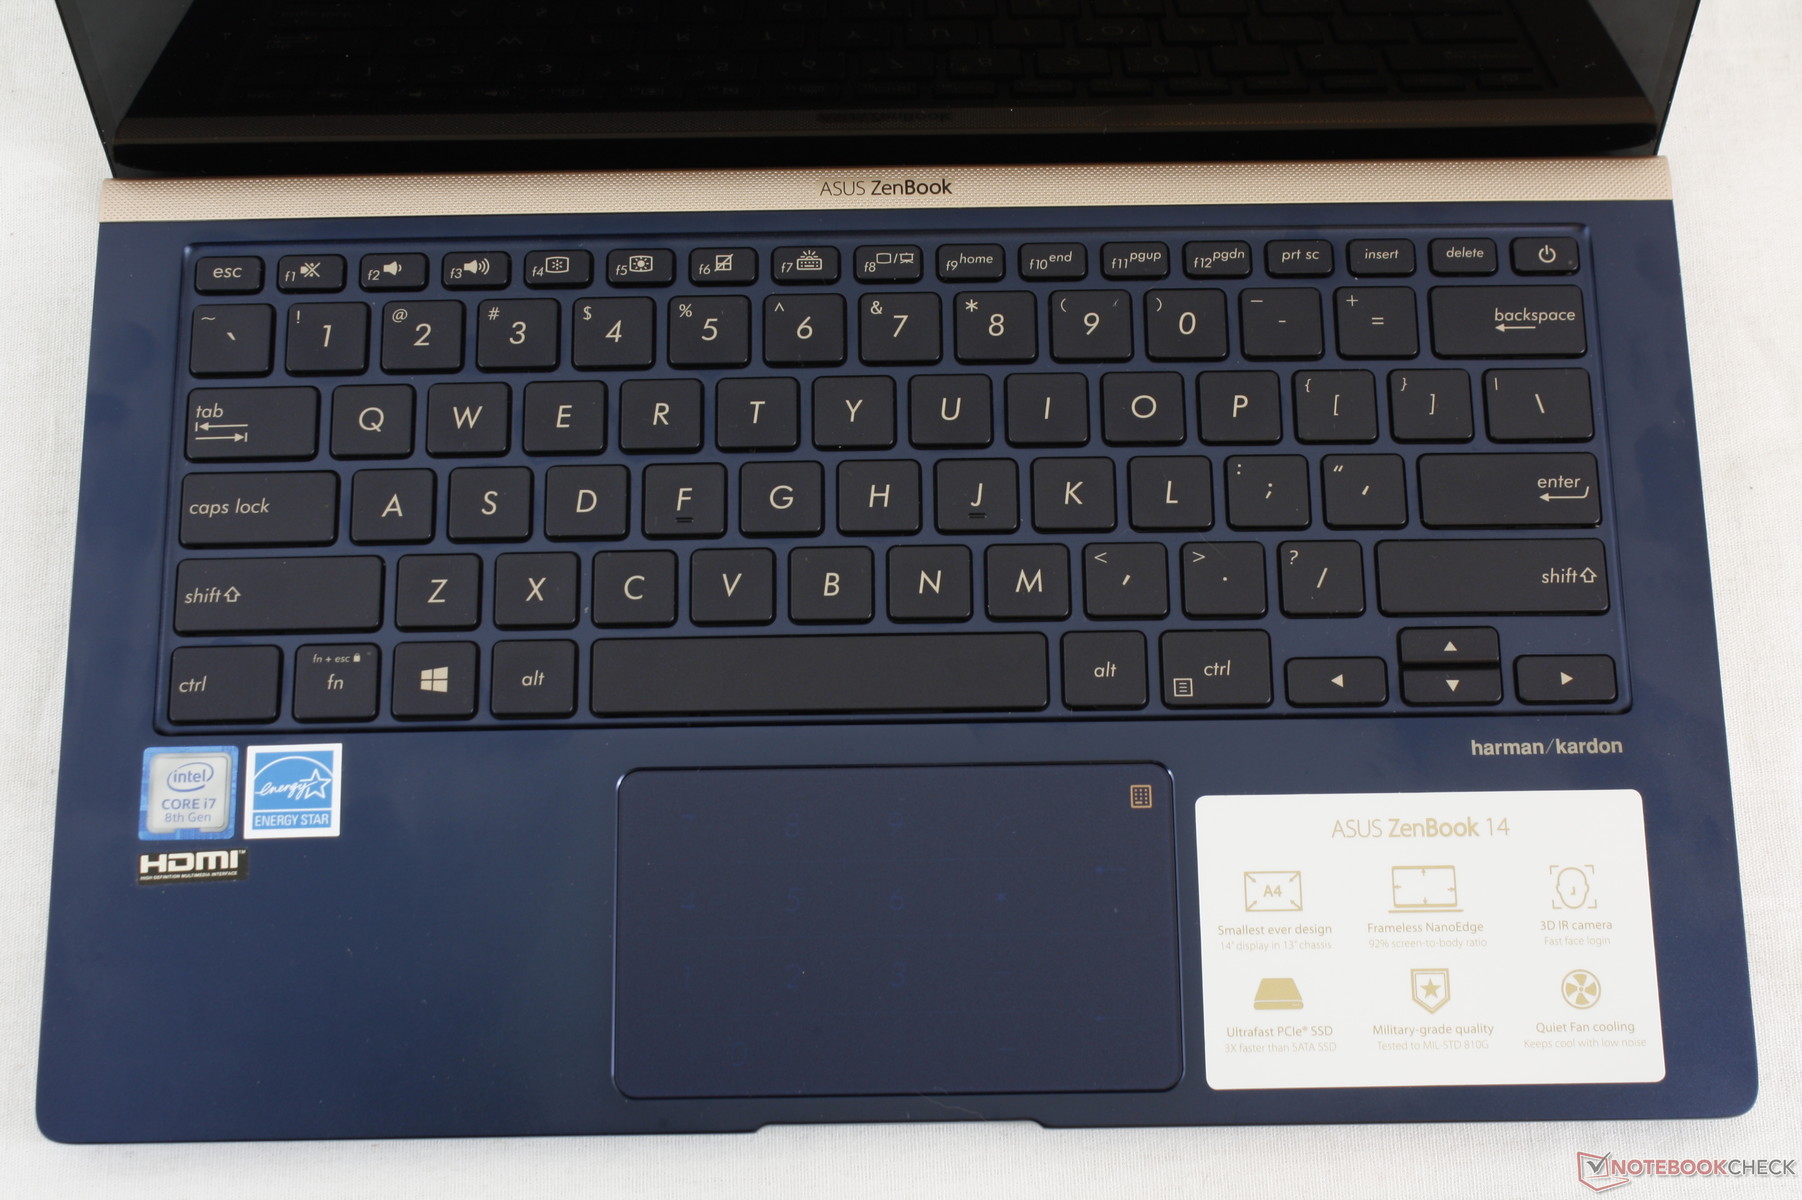
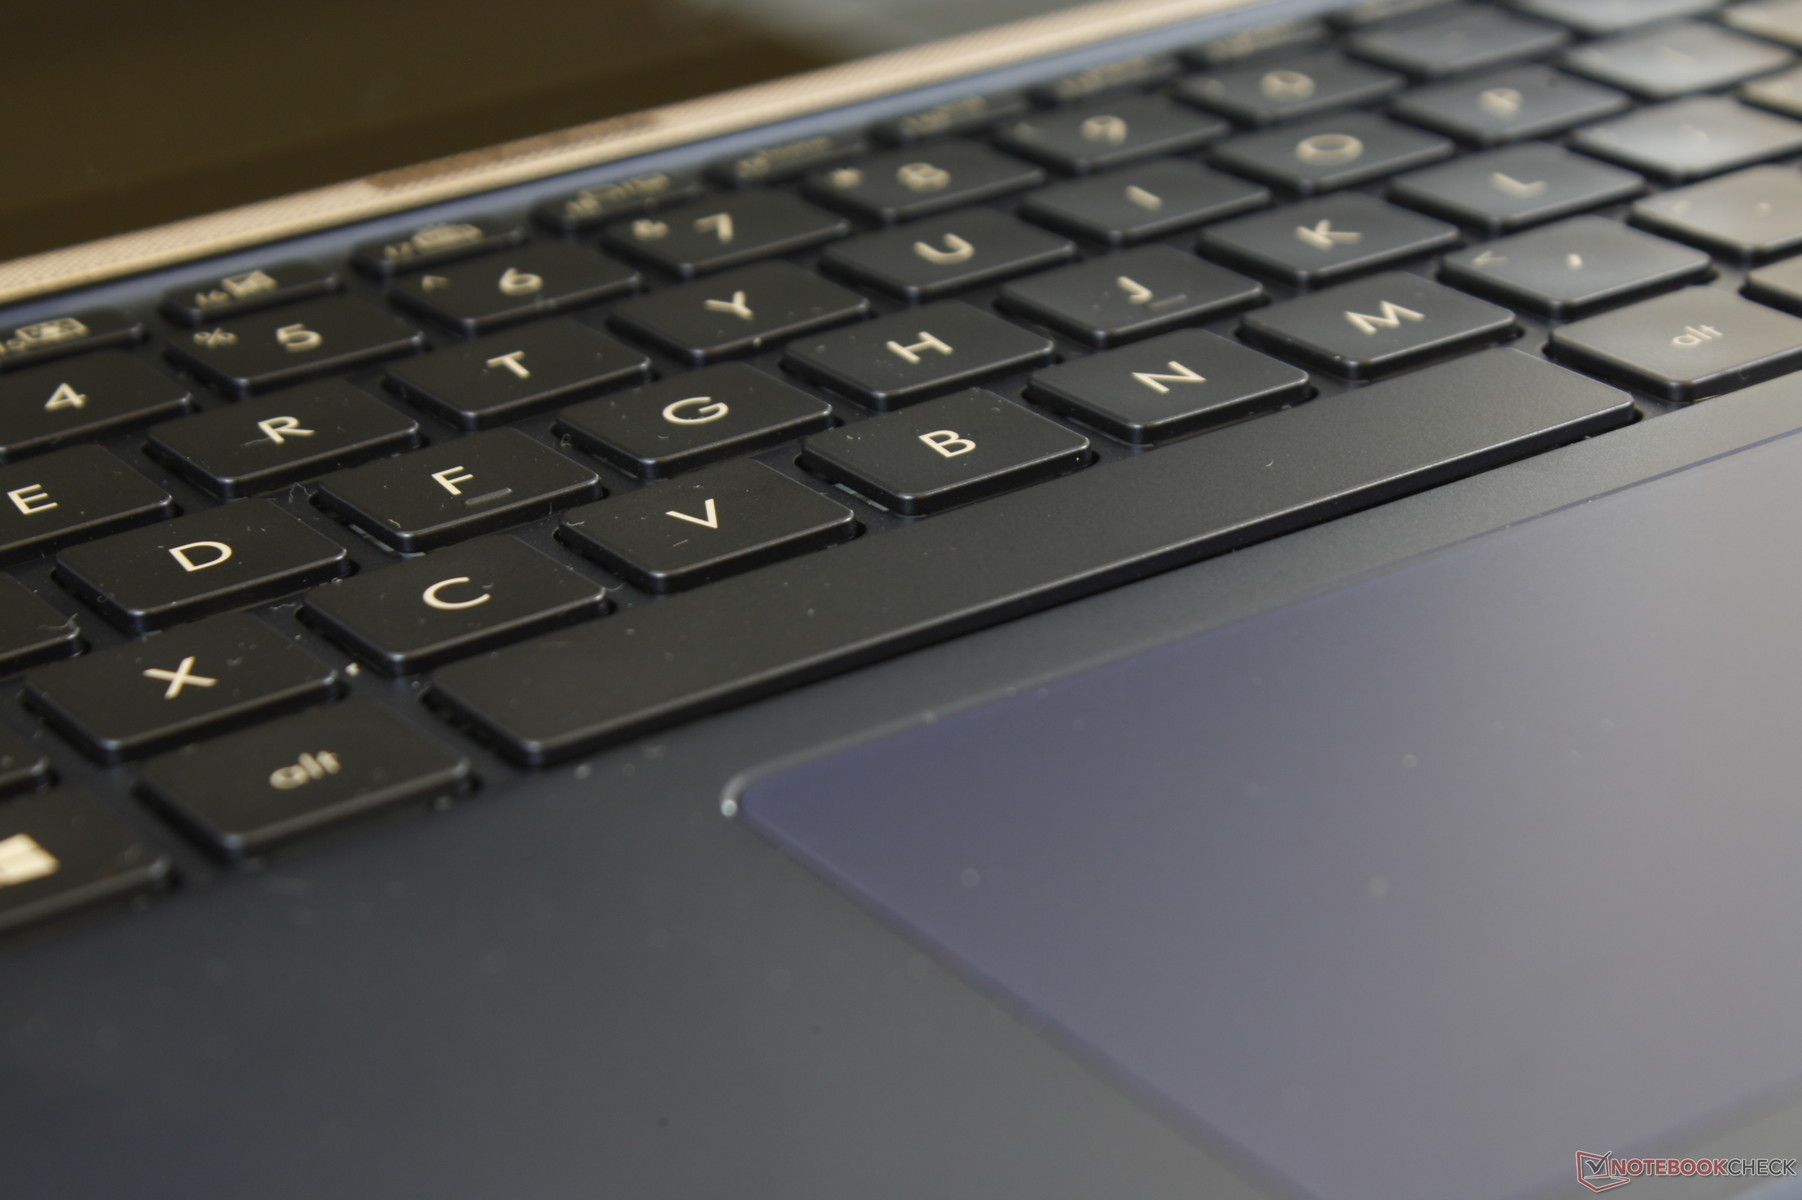
The backlit keys have improved tactility over the UX430. The 1.4 mm travel is back compared to 1.3 mm on the HP Spectre 13 for a slightly deeper press. Feedback is uniform and slightly softer than on the Spectre or EliteBook x360 1030, but still firm enough for a satisfactory typing experience with relatively quiet clatter.
The Directional keys are unfortunately small and spongy and there is no fingerprint reader available.
Touchpad
The Precision trackpad (10.5 x 6.2 cm) is actually narrower than the trackpad on the last generation UX430 (10.5 x 7.5 cm). Nonetheless, glide is smooth and responsive with no sticking when moving at slow speeds.
The integrated click keys are soft and shallow with quiet clatter due to their spongy press. The clickpad the job done if an external mouse is not available, but we find it easier to simply tap on the surface to input a click instead. The trackpad on the competing MateBook X Pro does a much better job in this regard.
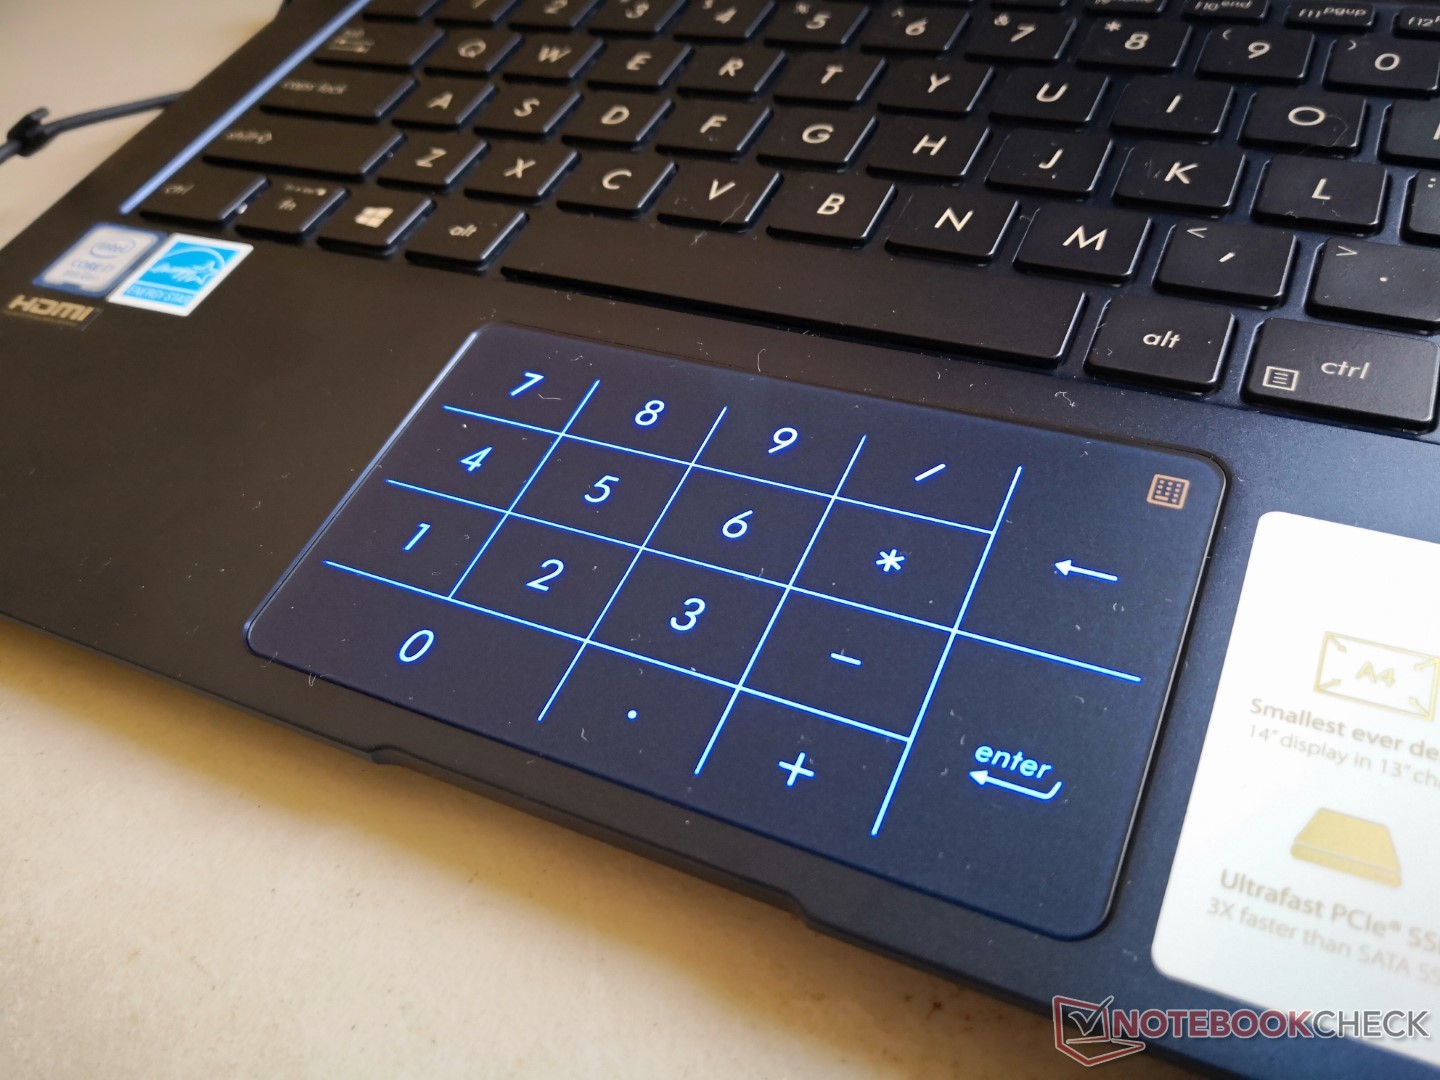
A unique feature of the new UX333/433/533 series is the backlit NumPad inspired by the NumPad on the Zephyrus GX501 gaming laptop. By pressing the top right corner of the trackpad, the trackpad surface becomes a virtual touch-sensitive NumPad. It's a clever approach especially for smaller laptops where there is no room for a dedicated NumPad.
In practice, the virtual NumPad is simply not as reliable as a dedicated NumPad because it lacks tactile feedback when tapped. Attempting to tap the numbers quickly will inevitably lead to missed values. Additionally, the brightness of the lit NumPad cannot be controlled and it's far too bright when working on a plane or dark room. It's certainly better than nothing, but adding brightness control and haptic feedback would have gone a long way to making the virtual NumPad more comfortable to use.
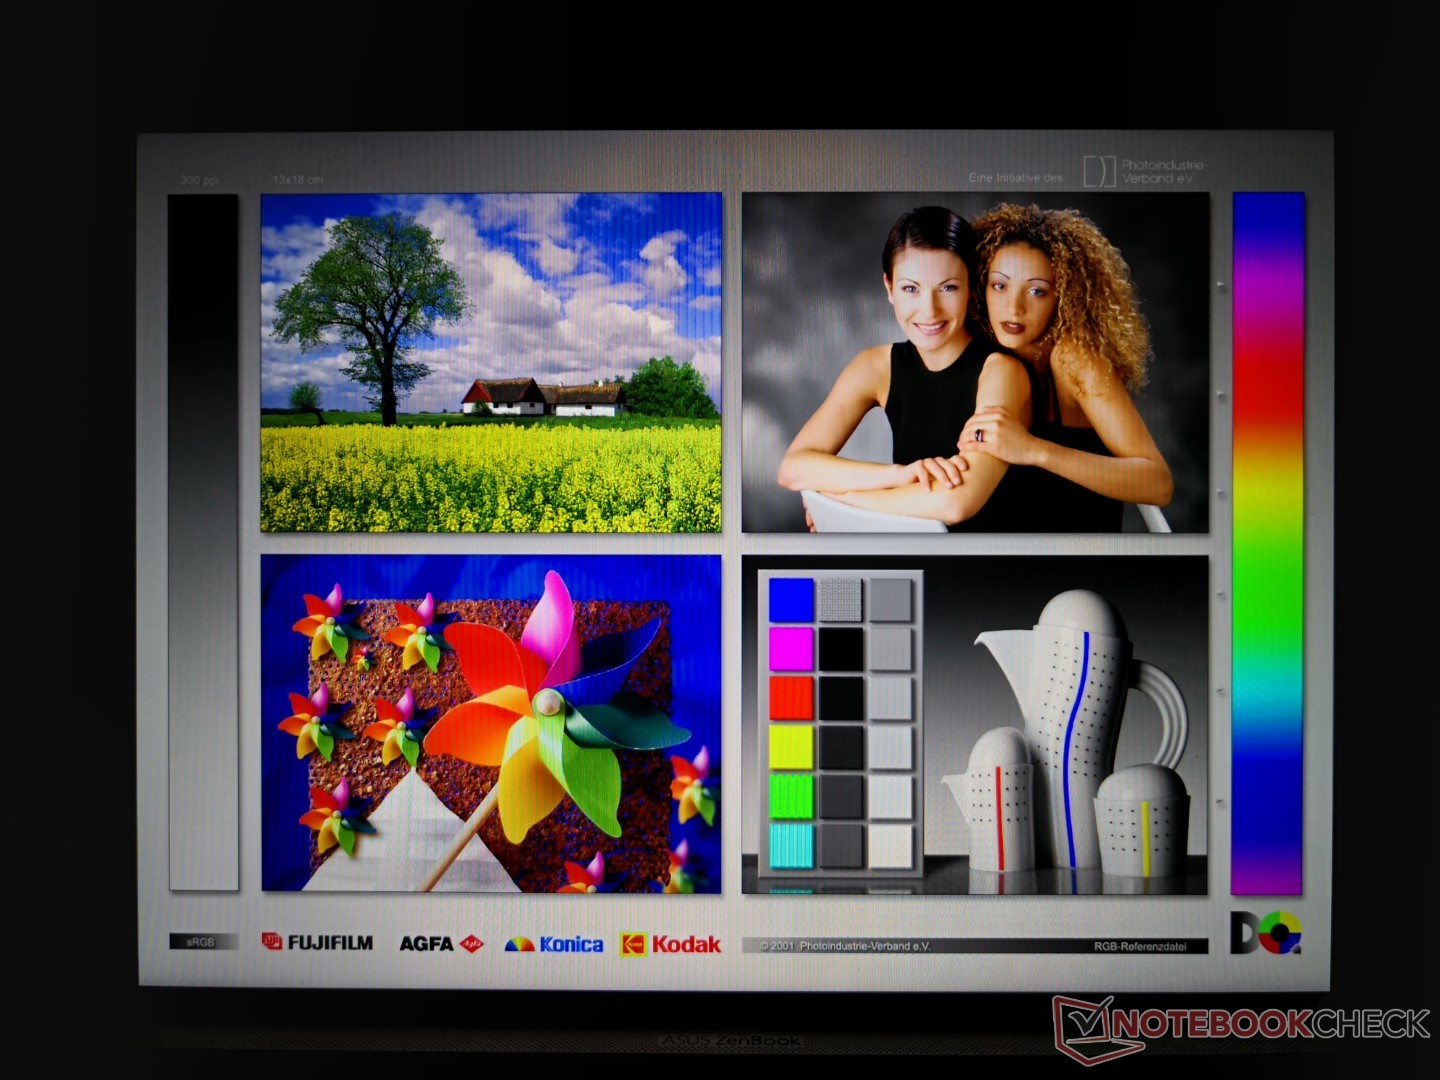
Display
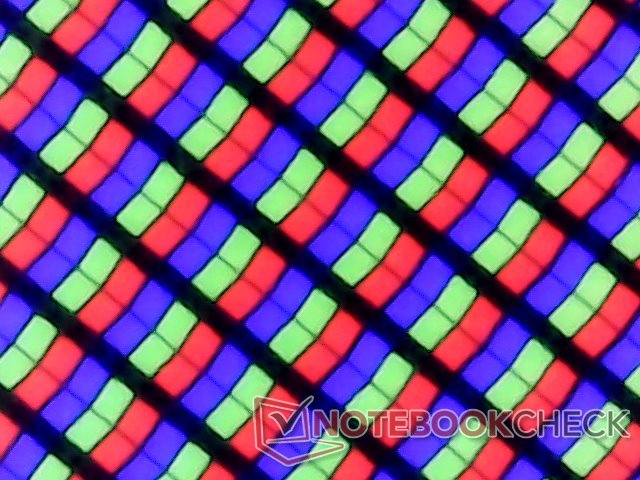
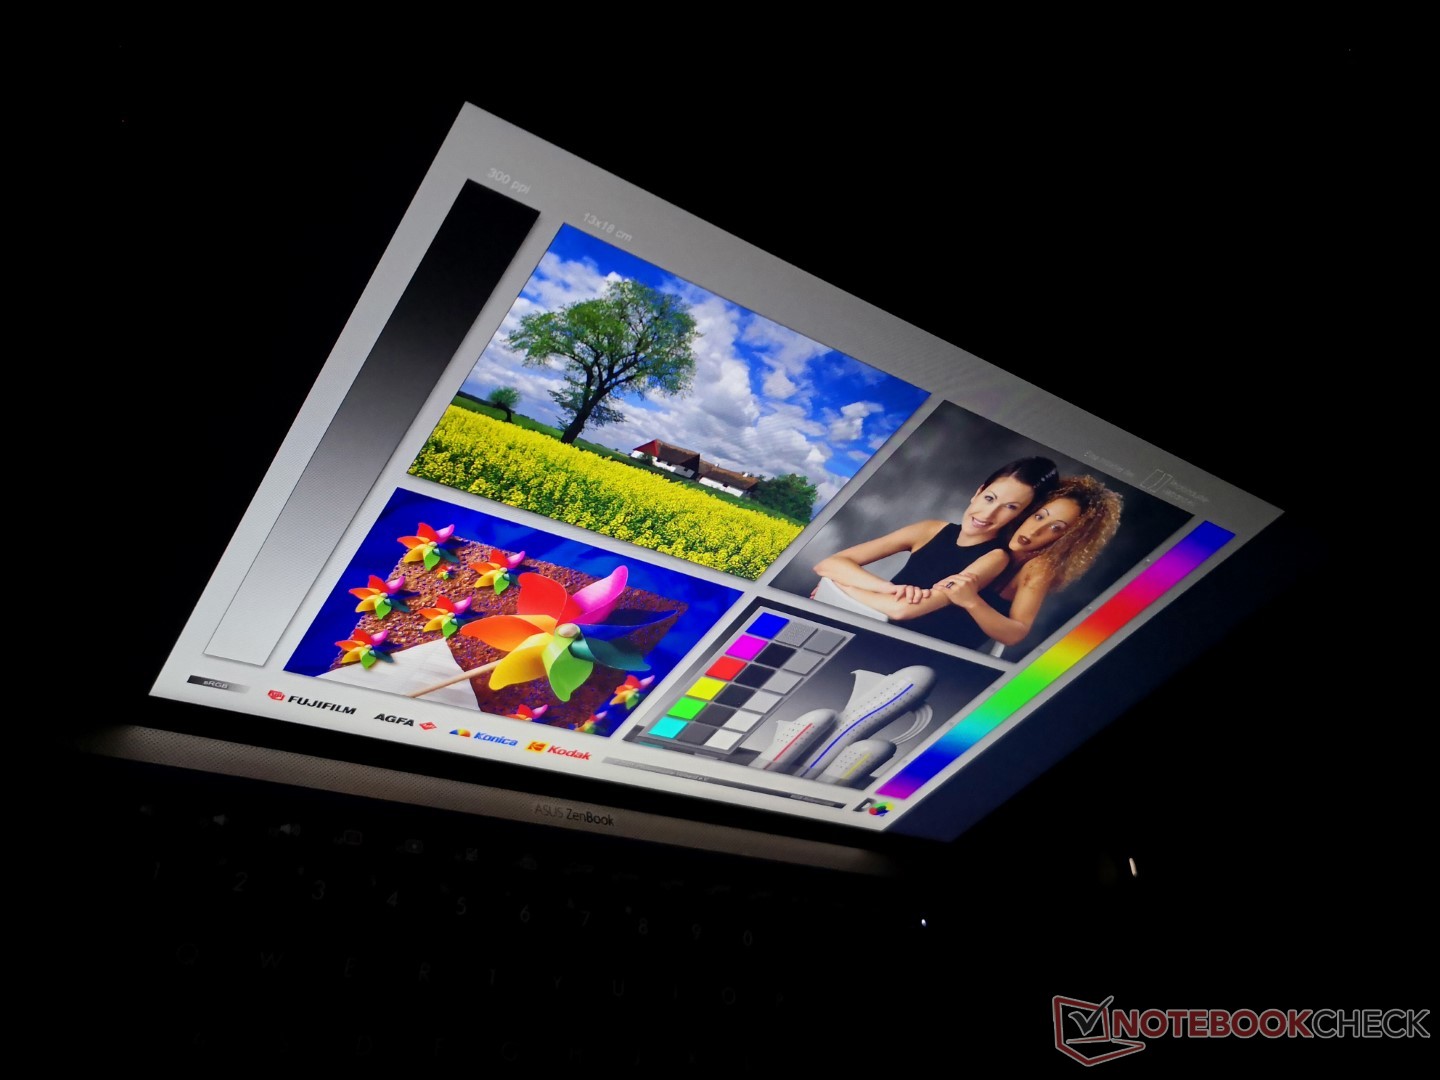
The UX433 uses the same AU Optronics B140HAN03.2 IPS panel as found on last year's Acer Swift 5 SF514 and Acer Spin 7 SP714. Consequently, our Zenbook shares the many of the same display characteristics as these 14-inch Acer laptops. Contrast is excellent at over 1000:1 and colors are deep with crisp text and no graininess issues. A lighter matte panel SKU is planned, but there will be no touchscreen or 4K UHD options across all SKUs. This is a high quality panel that looks even better because of the narrow bezels.
The maximum backlight brightness of about 309 nits is standard for most Ultrabooks and gaming laptops. Although not dim by any means, we were hoping for a brighter display just to one up the competition even further. The MacBook Pro 13 and Samsung Notebook 9, for example, are each over 60 percent brighter when on their respective maximum settings.
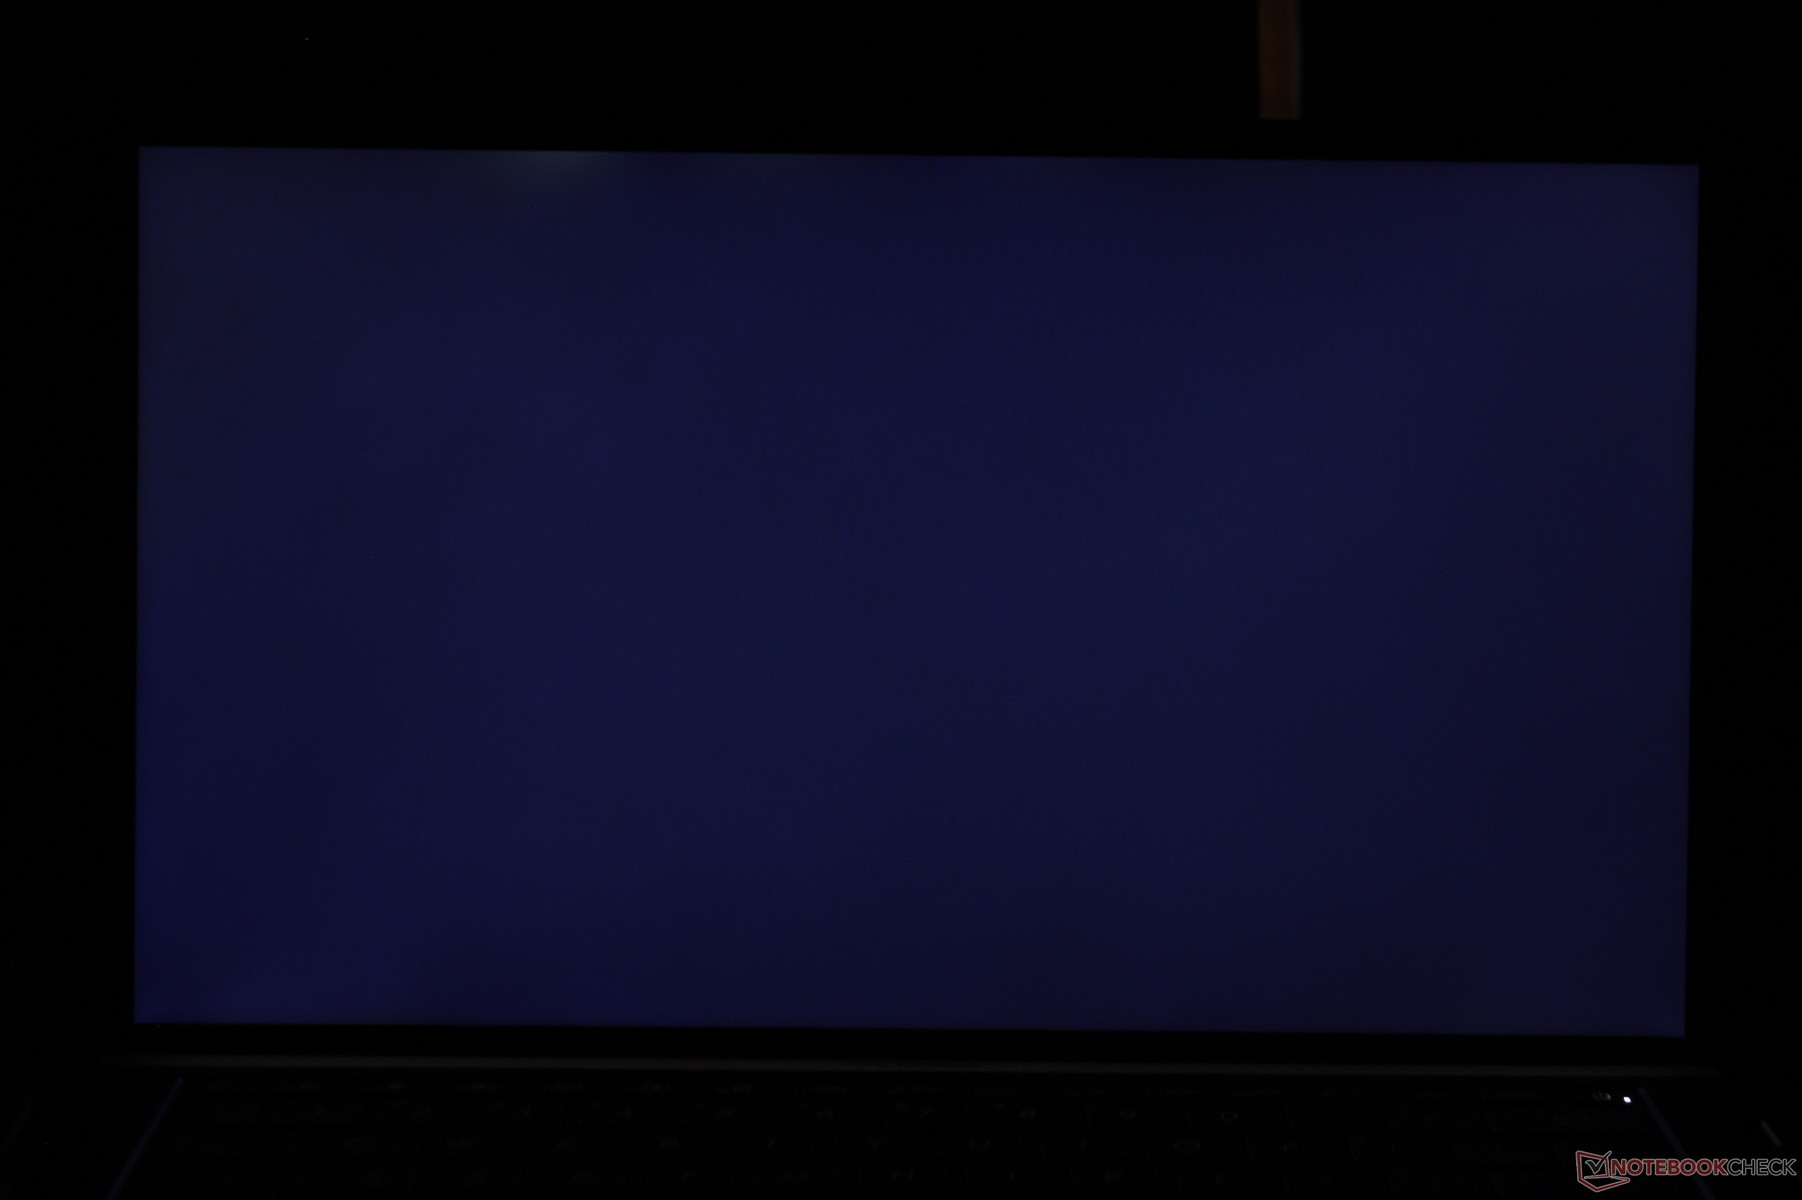
When compared to the BOE panel on the original UX430, the UX433 has faster response times for reduced ghosting and it doesn't suffer from pulse-width modulation. Slight uneven backlight bleeding is present along the top edge of our screen.

| |||||||||||||||||||||||||
Brightness Distribution: 87 %
Center on Battery: 332.8 cd/m²
Contrast: 1148:1 (Black: 0.29 cd/m²)
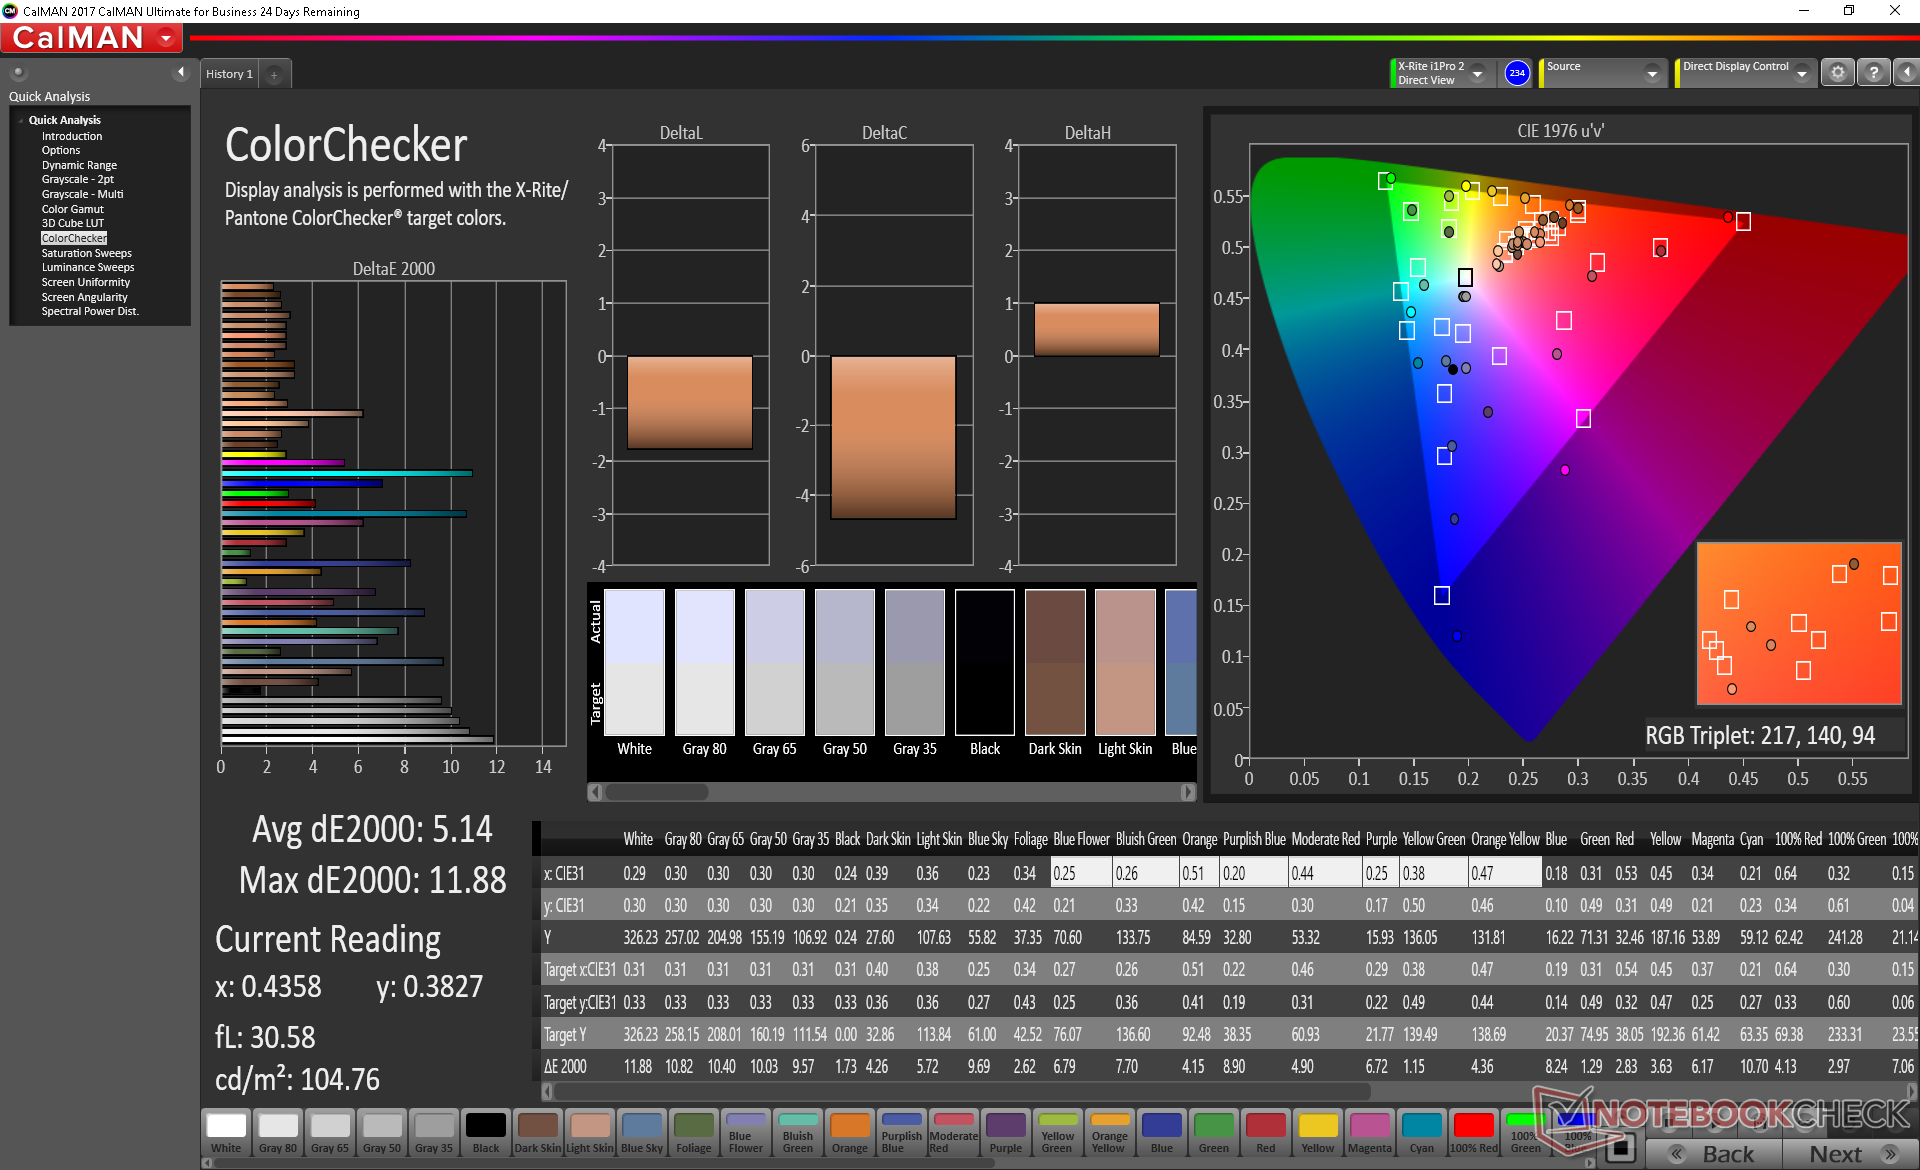
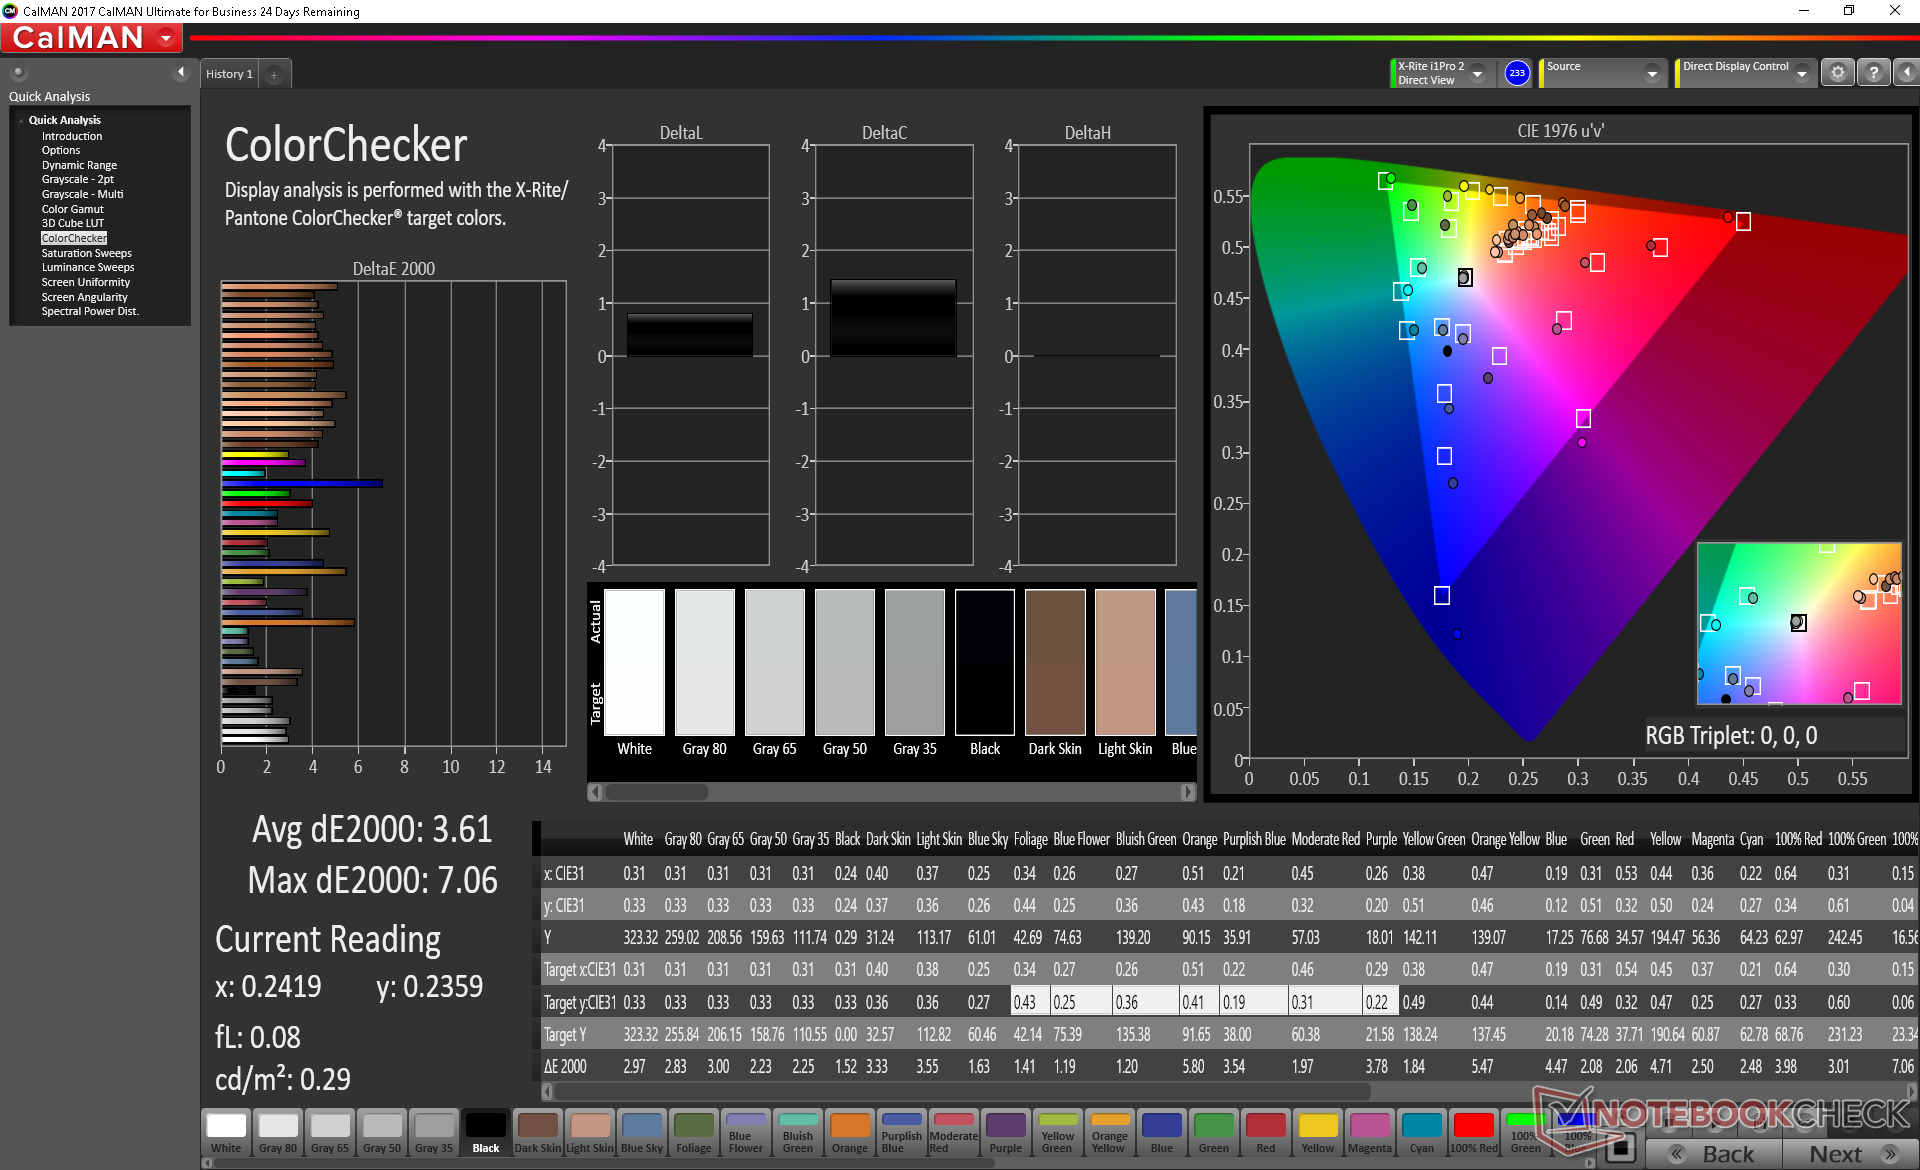
ΔE ColorChecker Calman: 5.14 | ∀{0.5-29.43 Ø4.73}
calibrated: 3.61
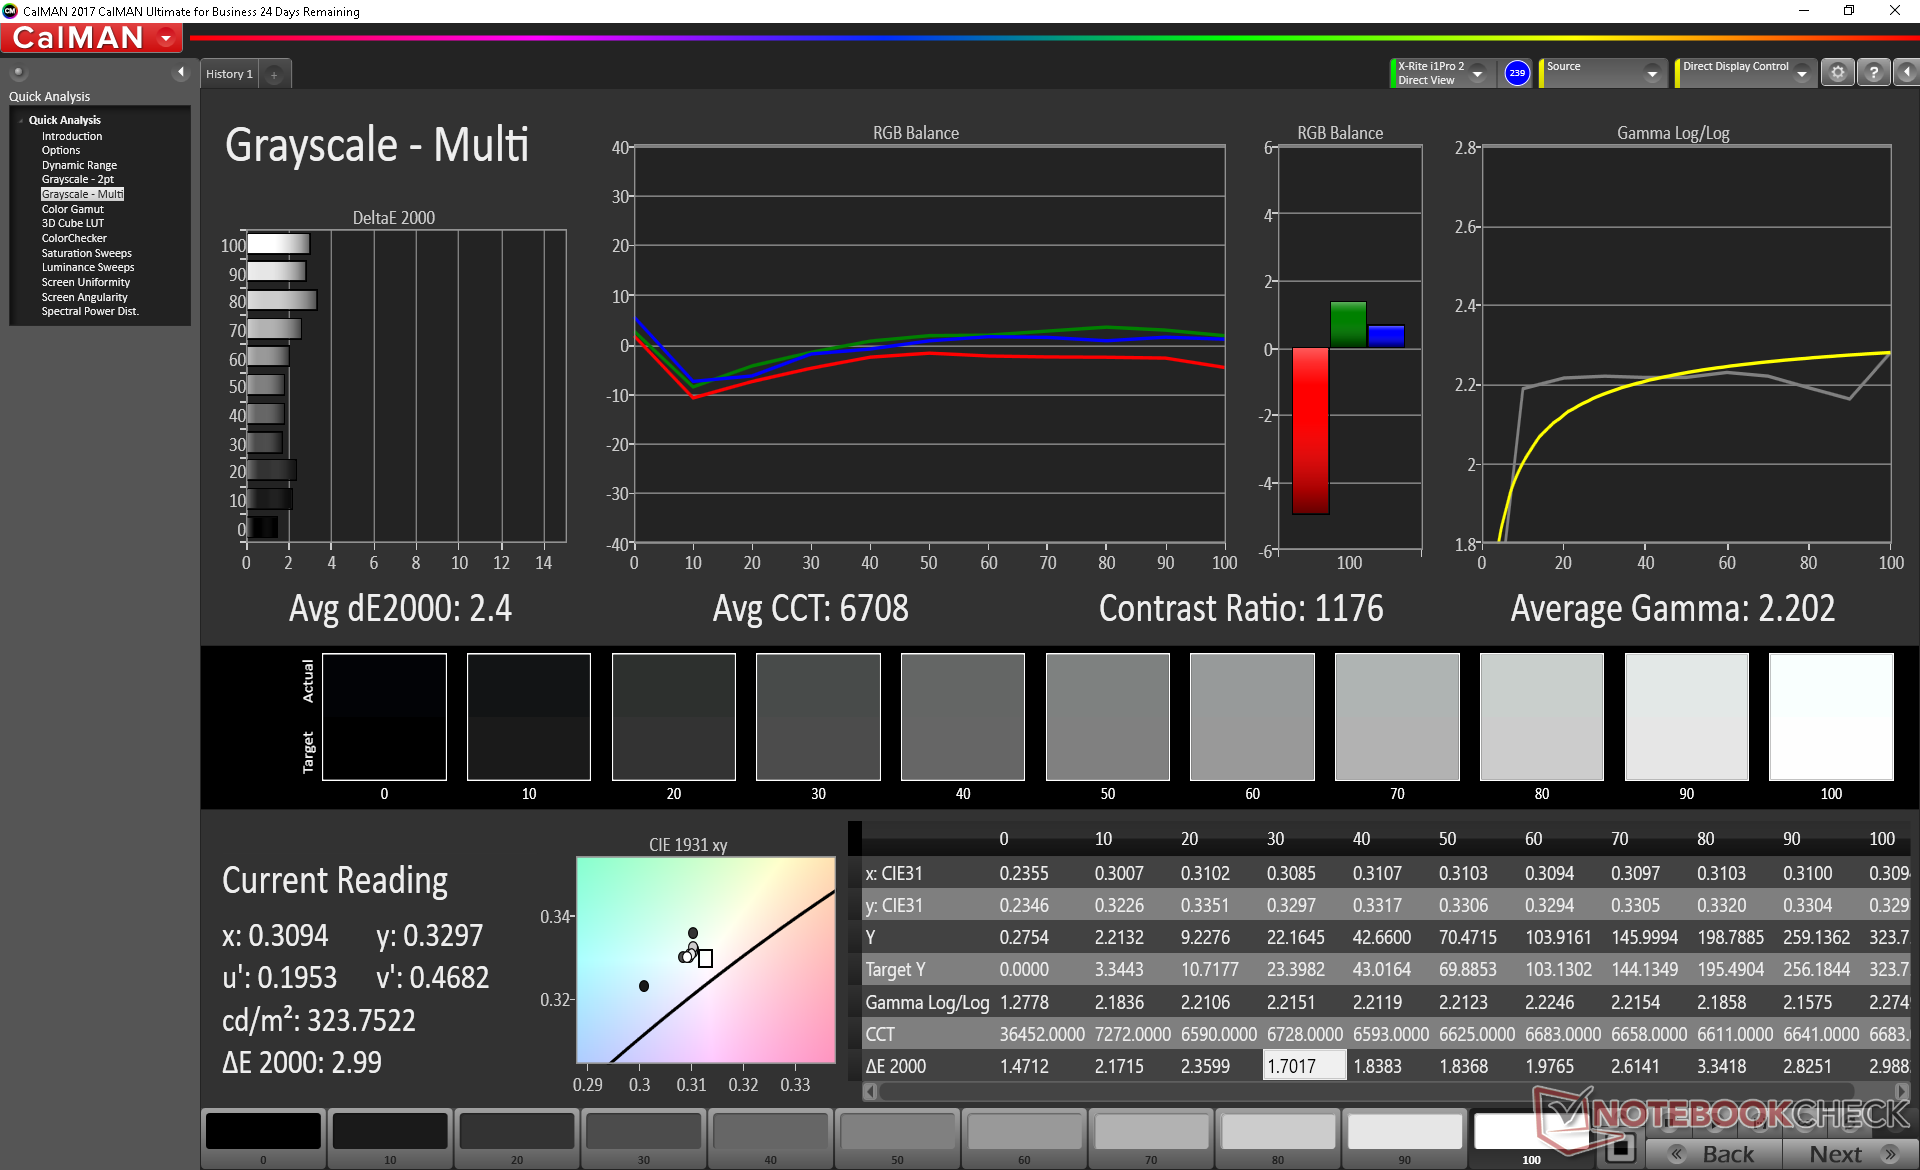
ΔE Greyscale Calman: 8.8 | ∀{0.09-98 Ø4.97}
89.2% sRGB (Argyll 1.6.3 3D)
58.1% AdobeRGB 1998 (Argyll 1.6.3 3D)
65.1% AdobeRGB 1998 (Argyll 3D)
89.7% sRGB (Argyll 3D)
64.3% Display P3 (Argyll 3D)
Gamma: 2.33
CCT: 8227 K
| Asus ZenBook 14 UX433FA AU Optronics B140HAN03.2, IPS, 14", 1920x1080 | Apple MacBook Air 2018 APPA039, IPS, 13.3", 2560x1600 | Dell XPS 13 9370 i7 UHD ID: Sharp SHP148B, Name: LQ133D1, Dell P/N: 8XDHY, IPS, 13.3", 3840x2160 | Huawei Matebook X Pro i5 Tianma XM, IPS, 13.9", 3000x2000 | Lenovo Yoga C930-13IKB 81C4 AUO B139HAN03_0, IPS, 13.9", 1920x1080 | Asus Zenbook UX430UN NV140FHM-N62, BOE0718, IPS, 14", 1920x1080 | |
|---|---|---|---|---|---|---|
| Display | 6% | 8% | 4% | 0% | -3% | |
| Display P3 Coverage (%) | 64.3 | 67.8 5% | 68.9 7% | 65.9 2% | 62.7 -2% | 64.6 0% |
| sRGB Coverage (%) | 89.7 | 96.1 7% | 98.4 10% | 95.2 6% | 92.6 3% | 84.8 -5% |
| AdobeRGB 1998 Coverage (%) | 65.1 | 69.8 7% | 69.5 7% | 67.6 4% | 64.7 -1% | 62 -5% |
| Response Times | -9% | -80% | -5% | 3% | -37% | |
| Response Time Grey 50% / Grey 80% * (ms) | 39.6 ? | 39.6 ? -0% | 69.6 ? -76% | 40.4 ? -2% | 34.4 ? 13% | 43.6 ? -10% |
| Response Time Black / White * (ms) | 24 ? | 28 ? -17% | 44 ? -83% | 25.6 ? -7% | 25.6 ? -7% | 39.2 ? -63% |
| PWM Frequency (Hz) | 113600 ? | 3759 ? | 200 ? | |||
| Screen | 31% | 25% | 23% | -11% | 6% | |
| Brightness middle (cd/m²) | 332.8 | 320 -4% | 478.5 44% | 442.7 33% | 312 -6% | 310.4 -7% |
| Brightness (cd/m²) | 310 | 315 2% | 466 50% | 428 38% | 295 -5% | 303 -2% |
| Brightness Distribution (%) | 87 | 95 9% | 86 -1% | 84 -3% | 87 0% | 89 2% |
| Black Level * (cd/m²) | 0.29 | 0.29 -0% | 0.43 -48% | 0.31 -7% | 0.43 -48% | 0.31 -7% |
| Contrast (:1) | 1148 | 1103 -4% | 1113 -3% | 1428 24% | 726 -37% | 1001 -13% |
| Colorchecker dE 2000 * | 5.14 | 1.2 77% | 3.09 40% | 2.24 56% | 7.6 -48% | 4.07 21% |
| Colorchecker dE 2000 max. * | 11.88 | 3.2 73% | 5.94 50% | 7.19 39% | 15.06 -27% | 8.33 30% |
| Colorchecker dE 2000 calibrated * | 3.61 | 0.5 86% | 2.06 43% | 1.11 69% | 1.96 46% | 4.07 -13% |
| Greyscale dE 2000 * | 8.8 | 0.8 91% | 2.4 73% | 9.7 -10% | 8.8 -0% | 2.8 68% |
| Gamma | 2.33 94% | 2.2 100% | 2.063 107% | 1.42 155% | 2.01 109% | 2.217 99% |
| CCT | 8227 79% | 6548 99% | 6883 94% | 6227 104% | 6874 95% | 7033 92% |
| Color Space (Percent of AdobeRGB 1998) (%) | 58.1 | 62.1 7% | 69.47 20% | 61.6 6% | 59.1 2% | 55.3 -5% |
| Color Space (Percent of sRGB) (%) | 89.2 | 96 8% | 98.36 10% | 95 7% | 92.3 3% | 84.6 -5% |
| Total Average (Program / Settings) | 9% /
22% | -16% /
9% | 7% /
16% | -3% /
-7% | -11% /
-1% |
* ... smaller is better
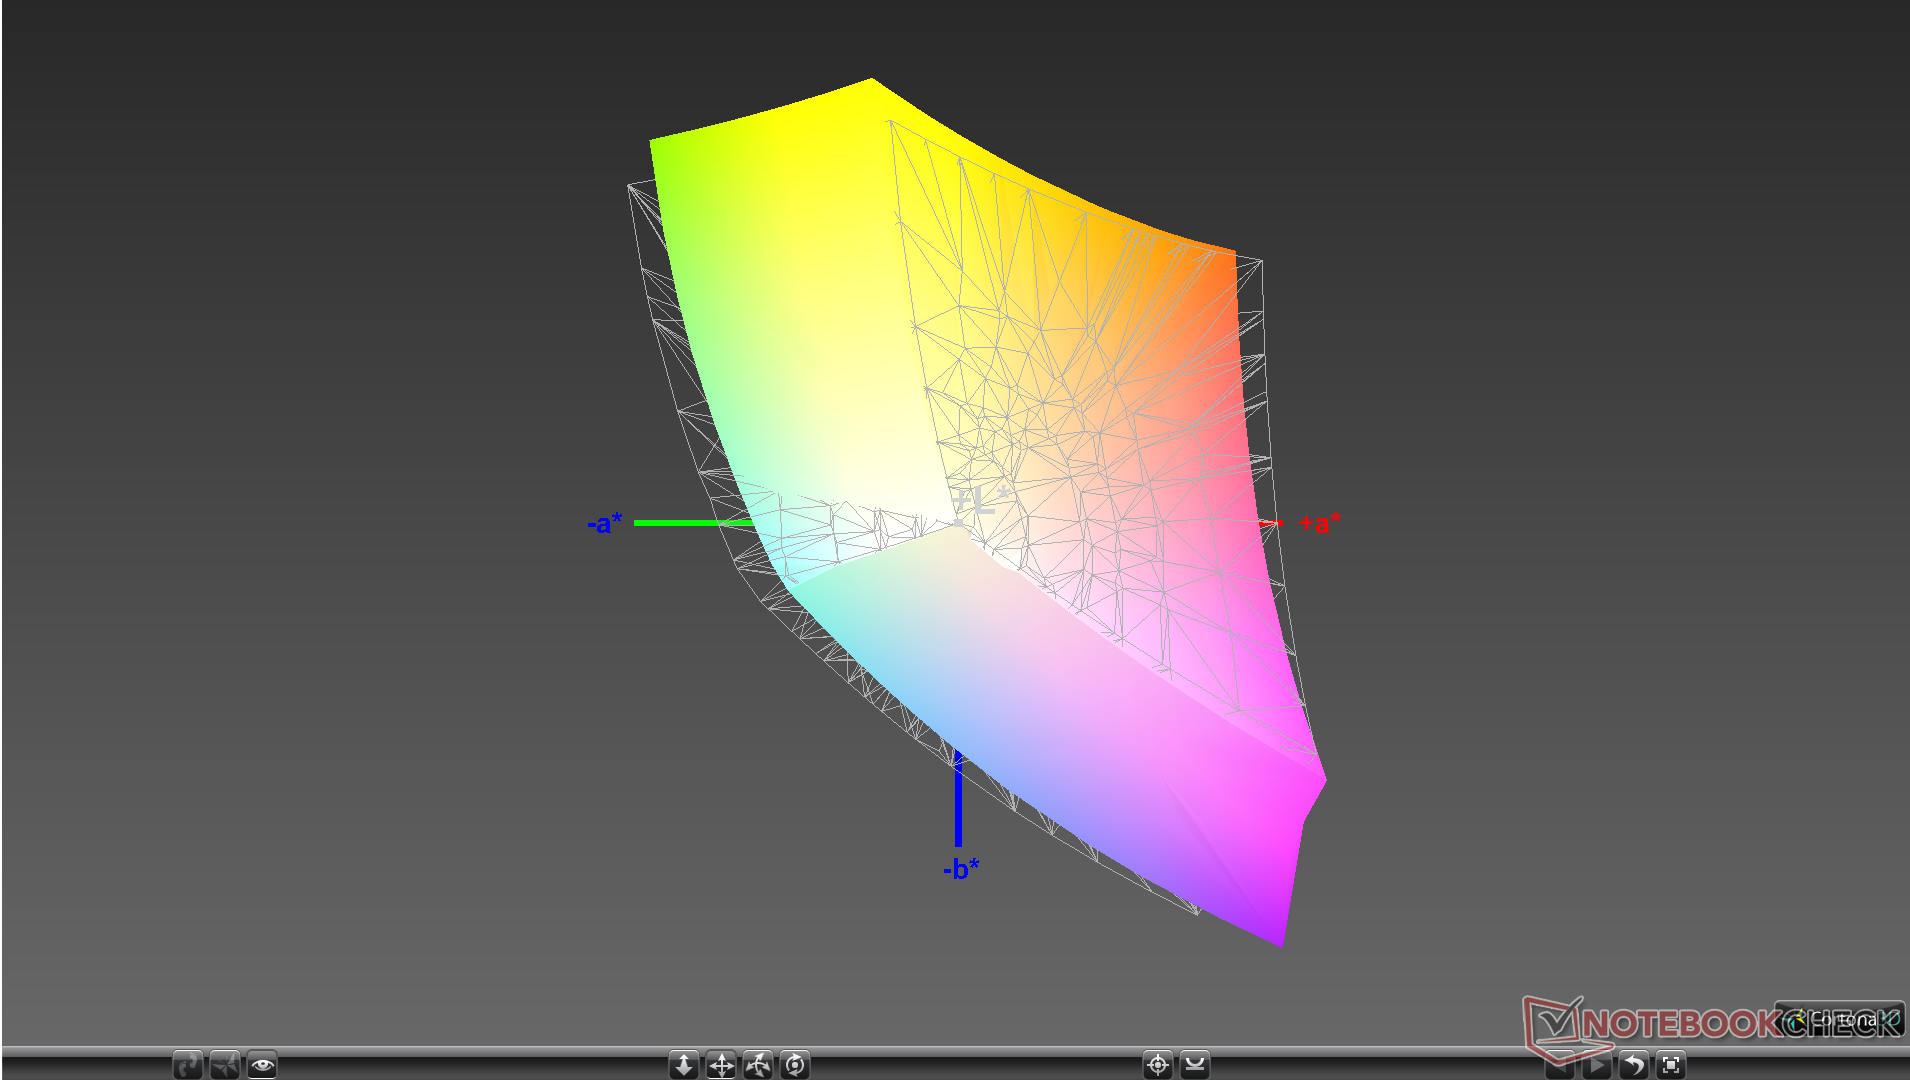
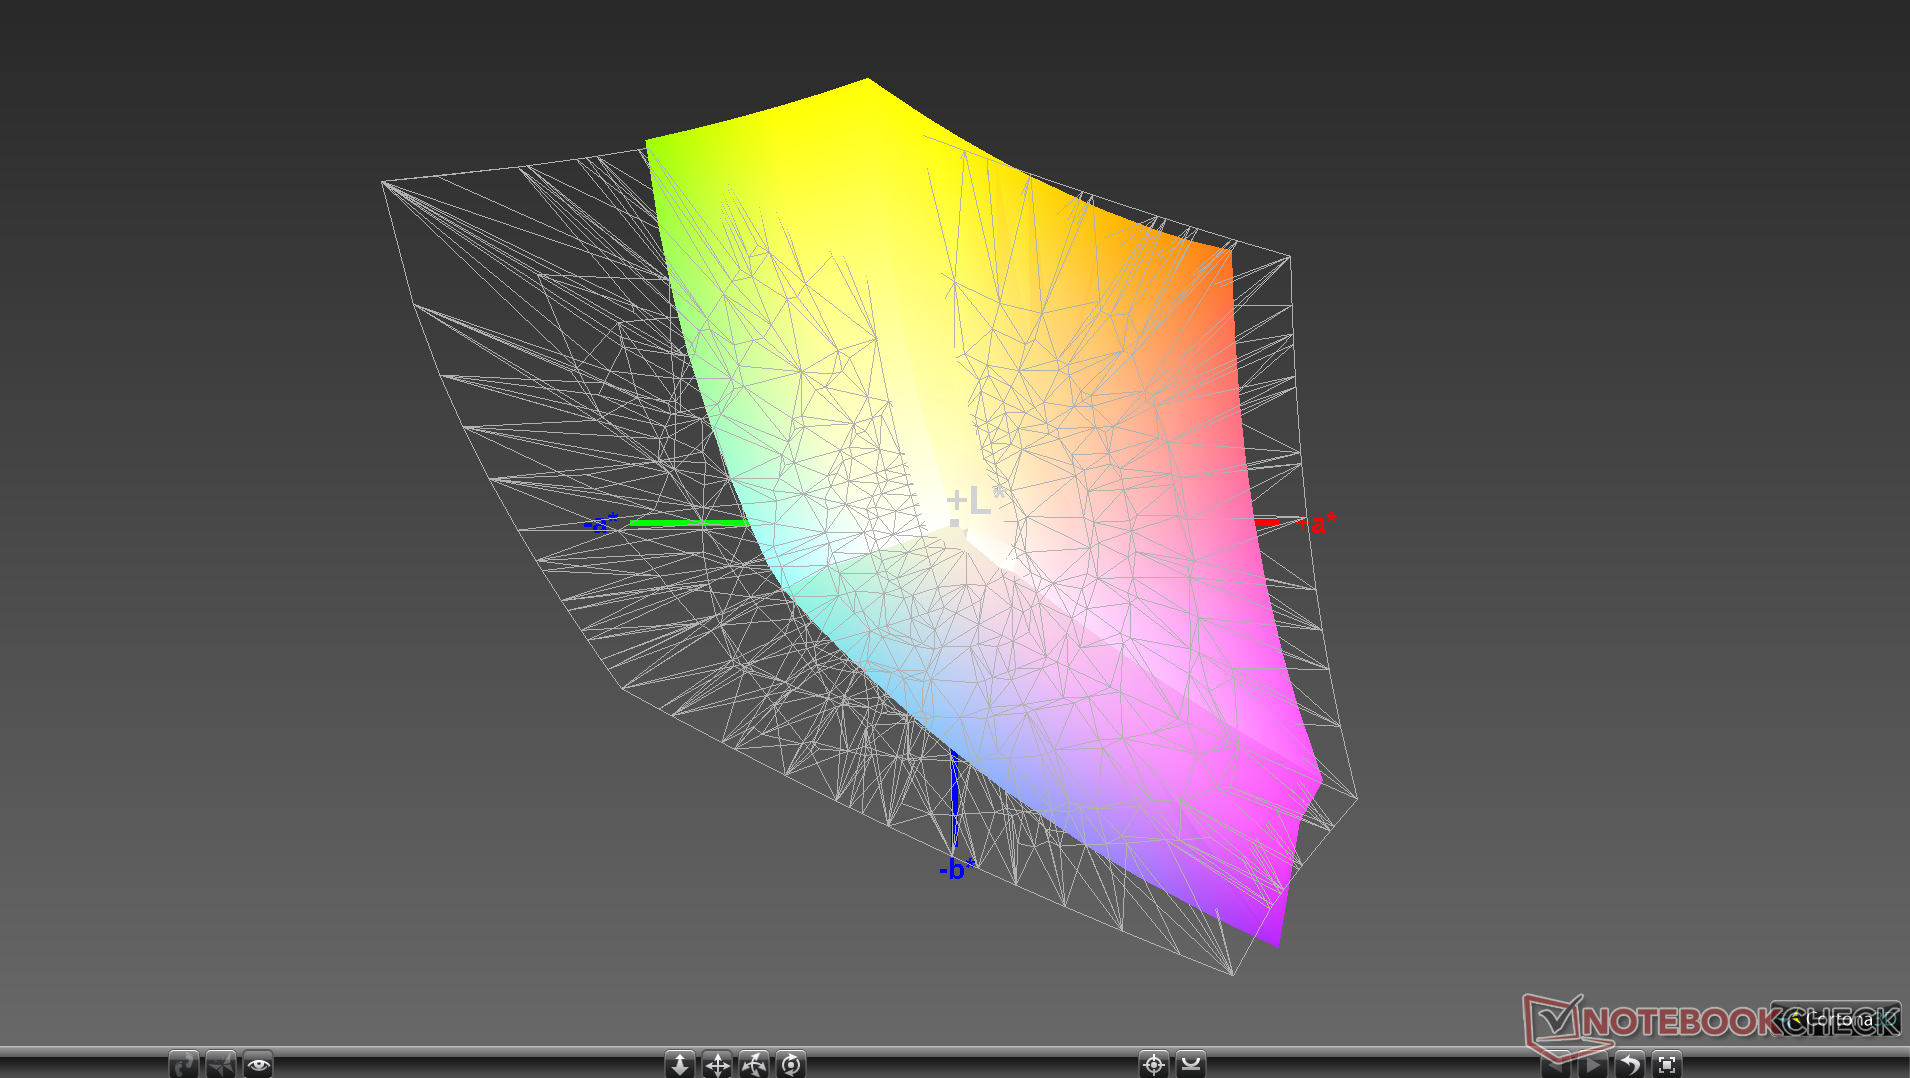
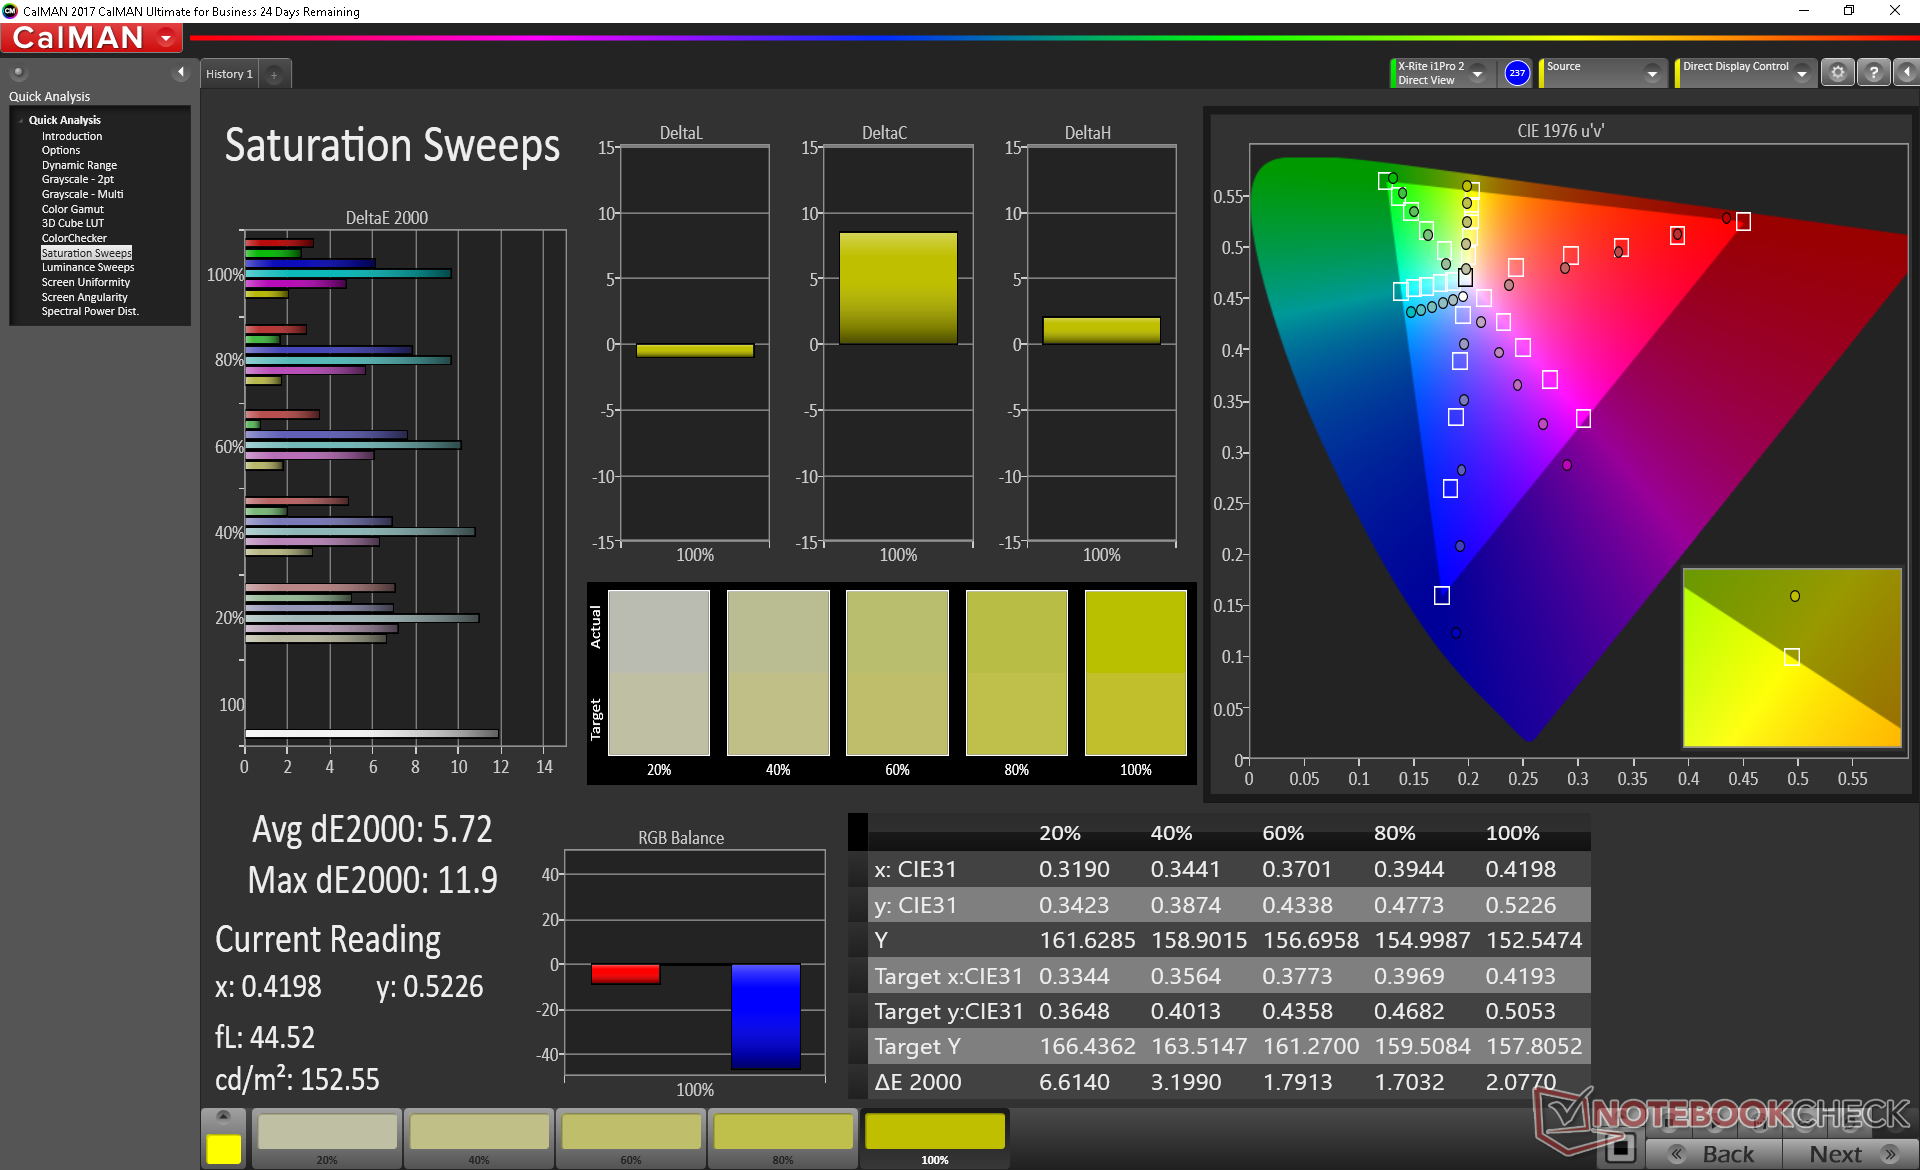
Color space is approximately 89 percent and 58 percent of the sRGB and AdobeRGB standards, respectively, compared to Asus' claim of 100 percent sRGB. Results are similar to most mainstream Ultrabooks and just slightly better than on the UX430. Wider color coverage is available on the larger 15.6-inch Zenbook UX580 but not for the UX333/433/533 series.
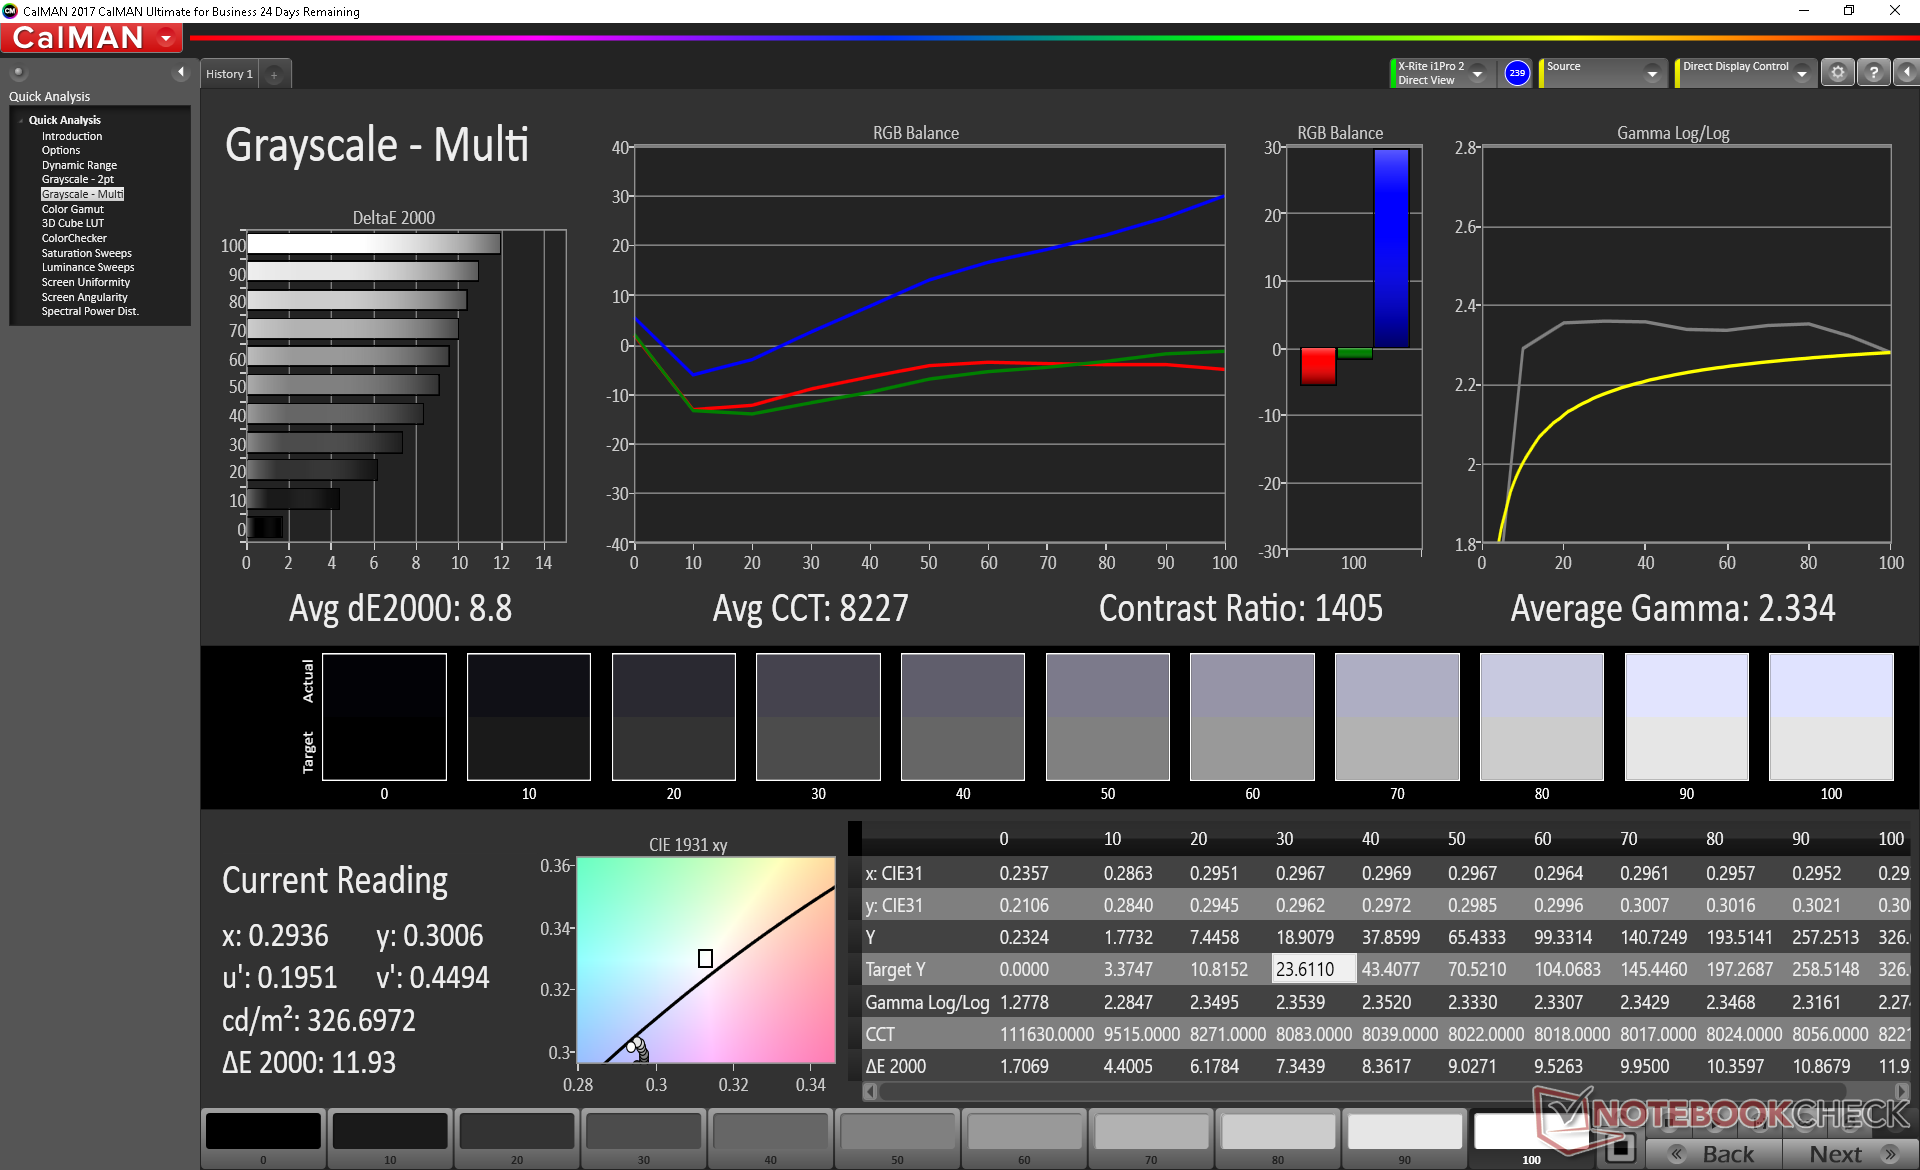
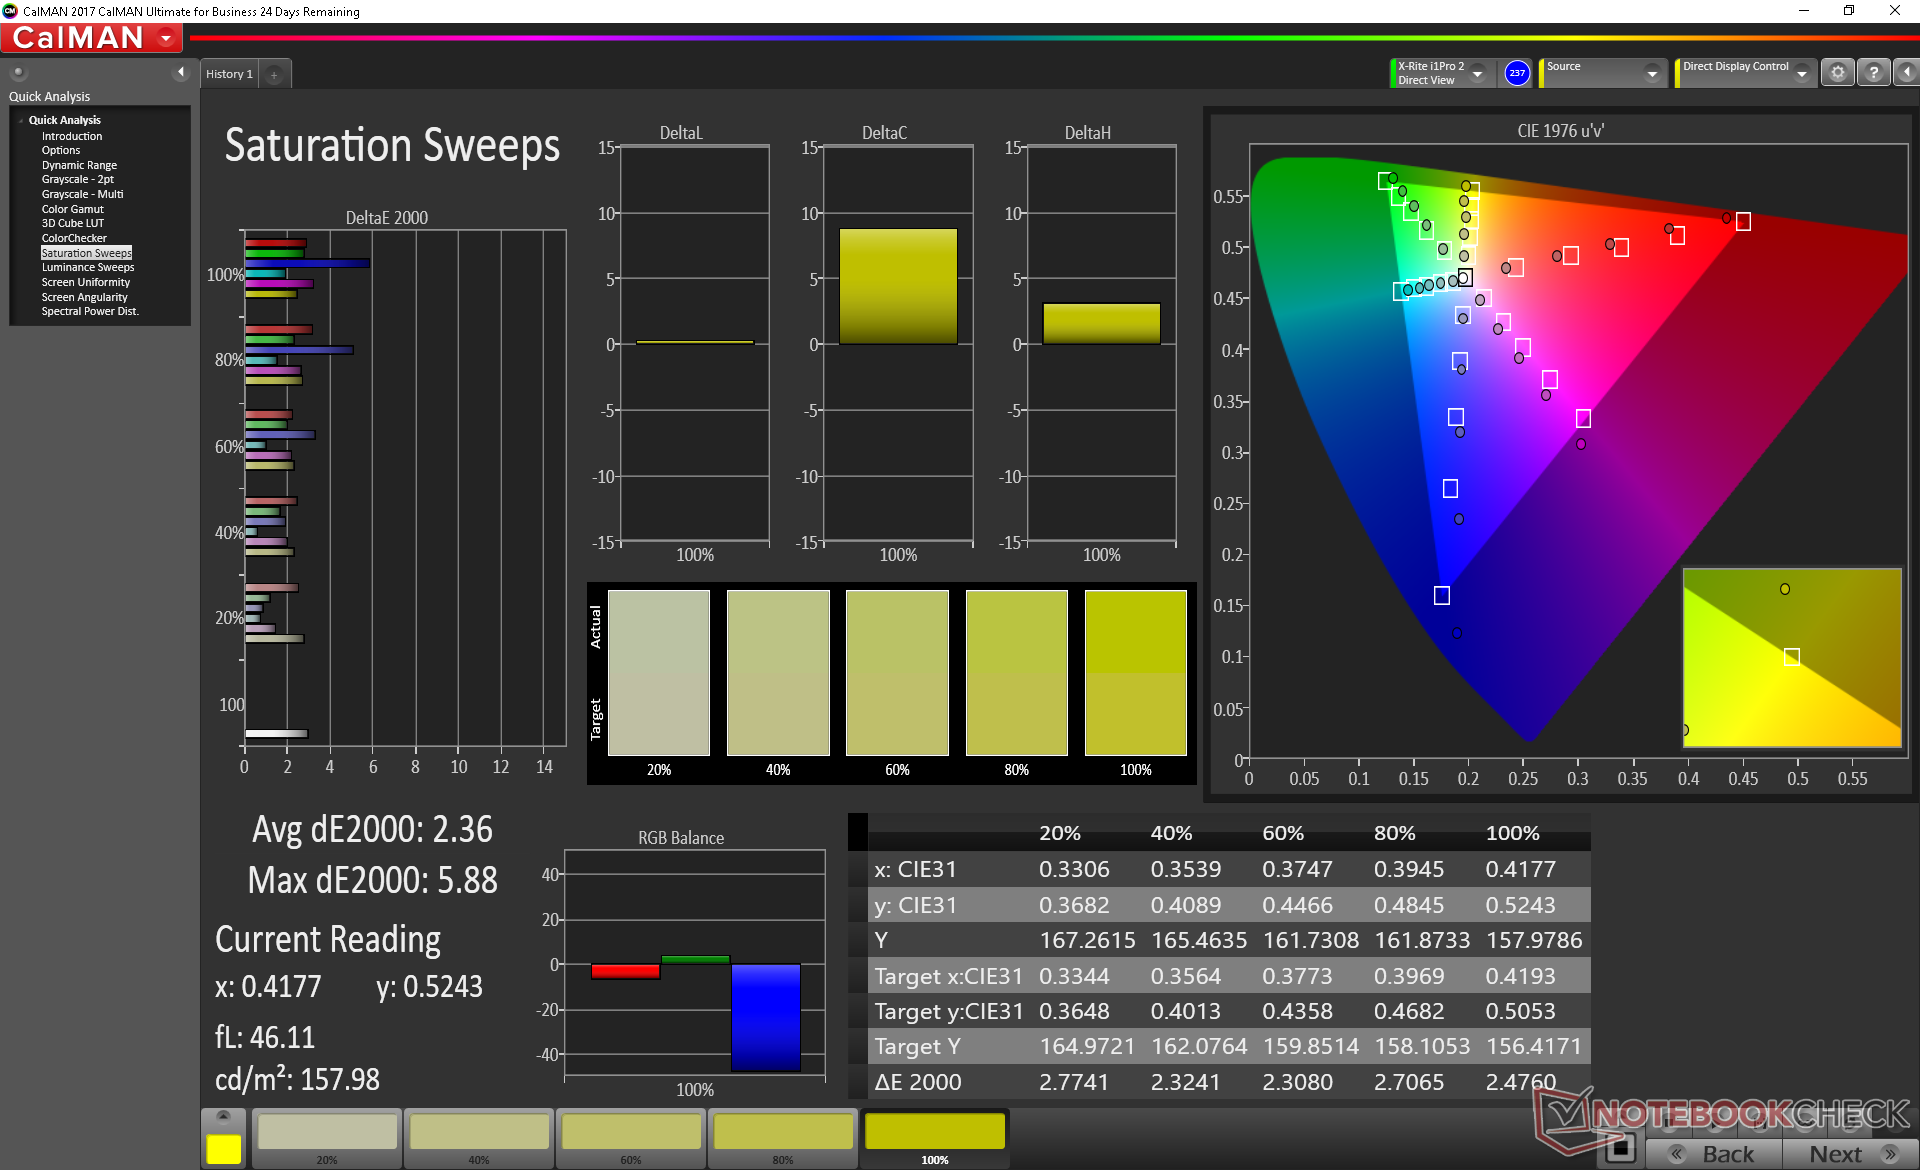
Further measurements with a X-Rite spectrophotometer reveal an overly cool color temperature out-of-the-box with poor reproduction of Blue and Teal in particular. While this is to be expected from a cheap panel with limited color coverage, we're a bit surprised to see it here on a premier laptop. Our calibration addresses these issues and greatly improves color accuracy in the process. We highly recommend applying our ICC profile to get the most out of the display especially since the panel is capable of very accurate colors.
Display Response Times
| ↔ Response Time Black to White | ||
|---|---|---|
| 24 ms ... rise ↗ and fall ↘ combined | ↗ 14.4 ms rise | 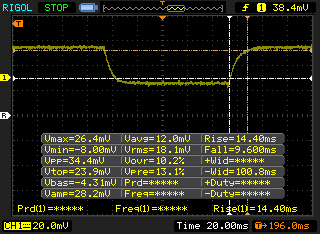 |
| ↘ 9.6 ms fall | ||
| The screen shows good response rates in our tests, but may be too slow for competitive gamers. In comparison, all tested devices range from 0.1 (minimum) to 240 (maximum) ms. » 54 % of all devices are better. This means that the measured response time is worse than the average of all tested devices (19.9 ms). | ||
| ↔ Response Time 50% Grey to 80% Grey | ||
| 39.6 ms ... rise ↗ and fall ↘ combined | ↗ 21.2 ms rise | 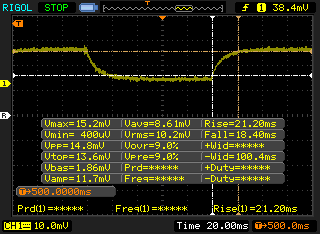 |
| ↘ 18.4 ms fall | ||
| The screen shows slow response rates in our tests and will be unsatisfactory for gamers. In comparison, all tested devices range from 0.165 (minimum) to 636 (maximum) ms. » 60 % of all devices are better. This means that the measured response time is worse than the average of all tested devices (31.1 ms). | ||
Screen Flickering / PWM (Pulse-Width Modulation)
| Screen flickering / PWM not detected | 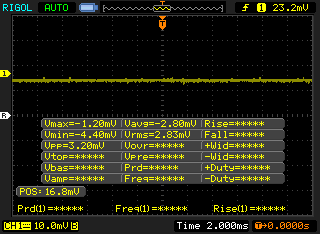 | ||
In comparison: 52 % of all tested devices do not use PWM to dim the display. If PWM was detected, an average of 7794 (minimum: 5 - maximum: 343500) Hz was measured. | |||
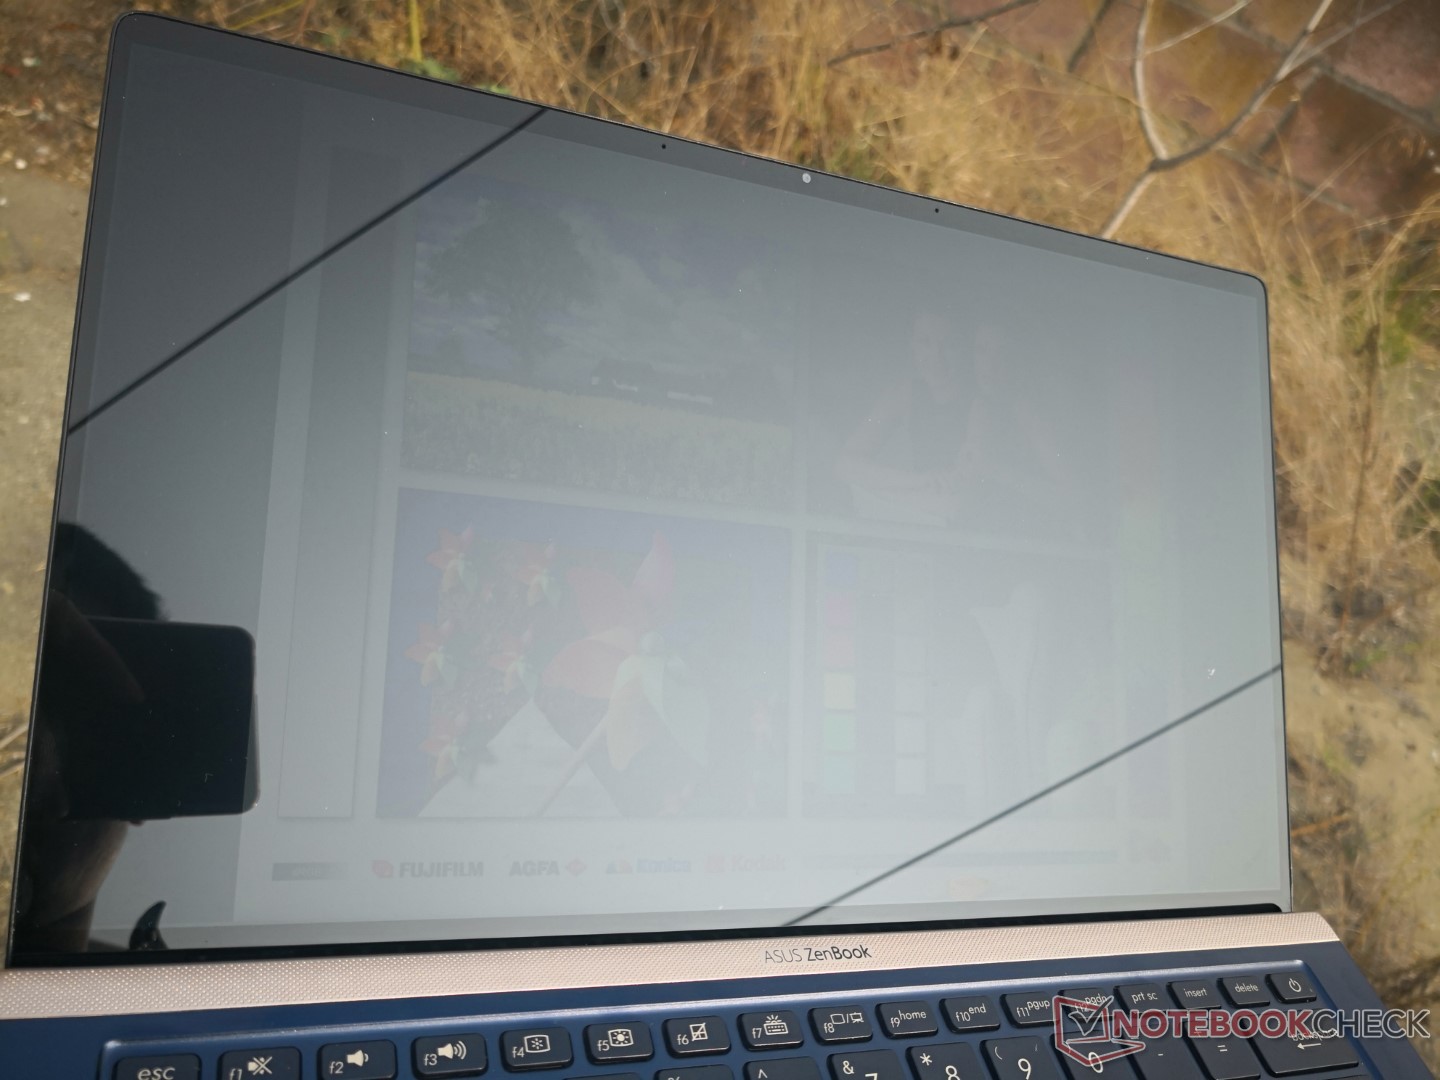
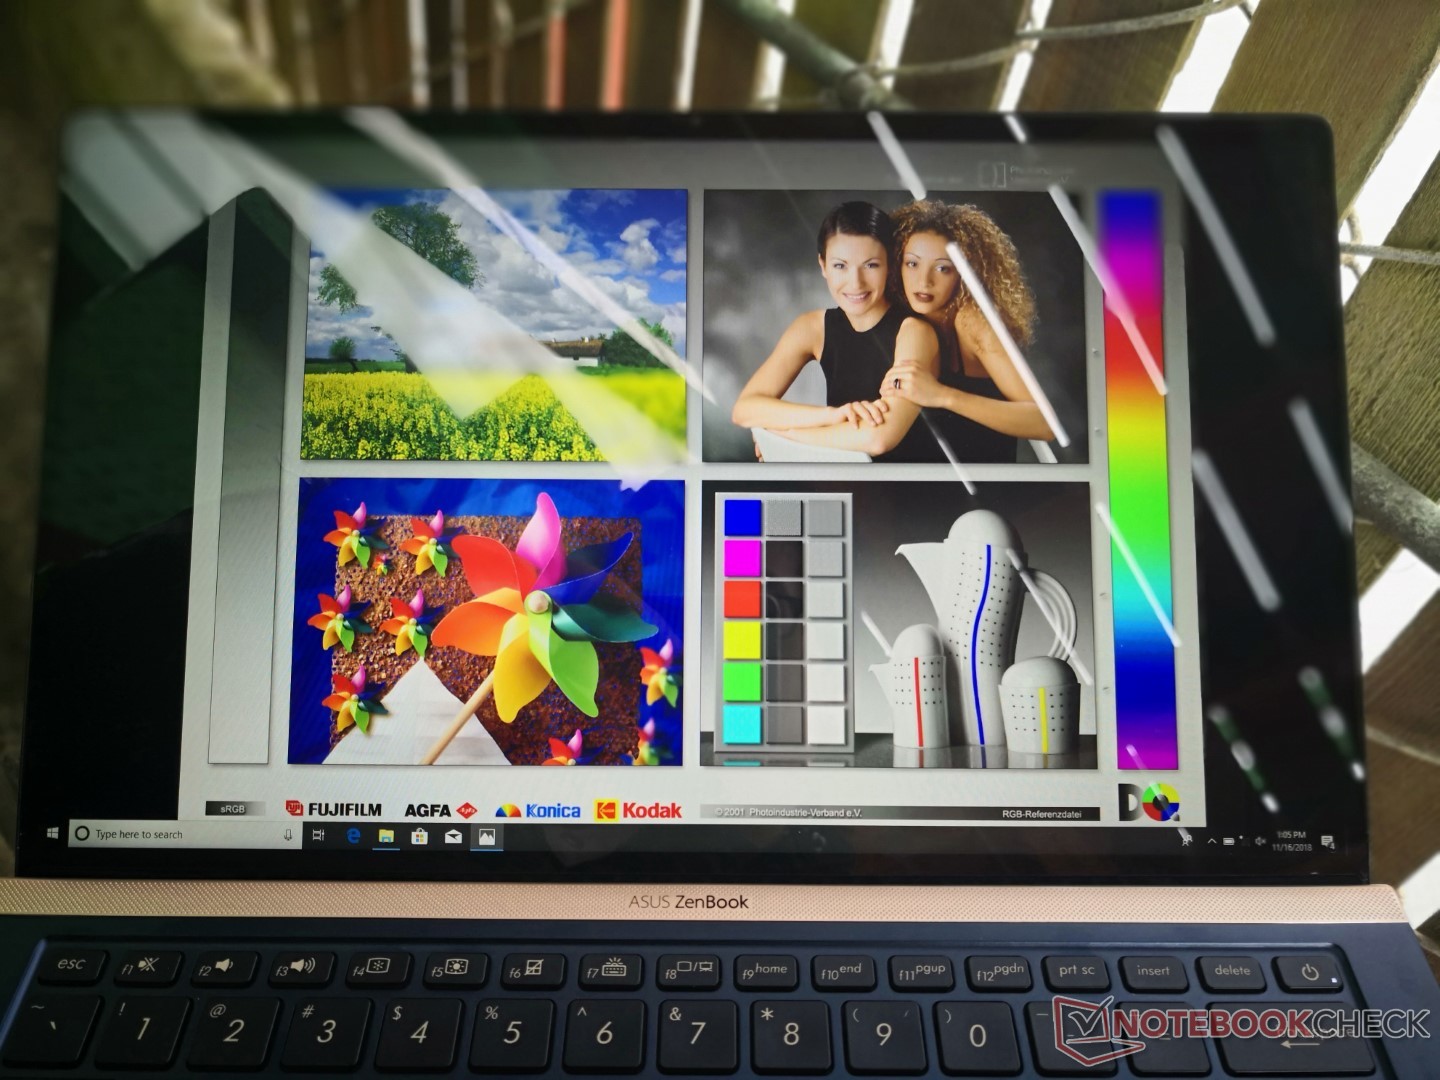
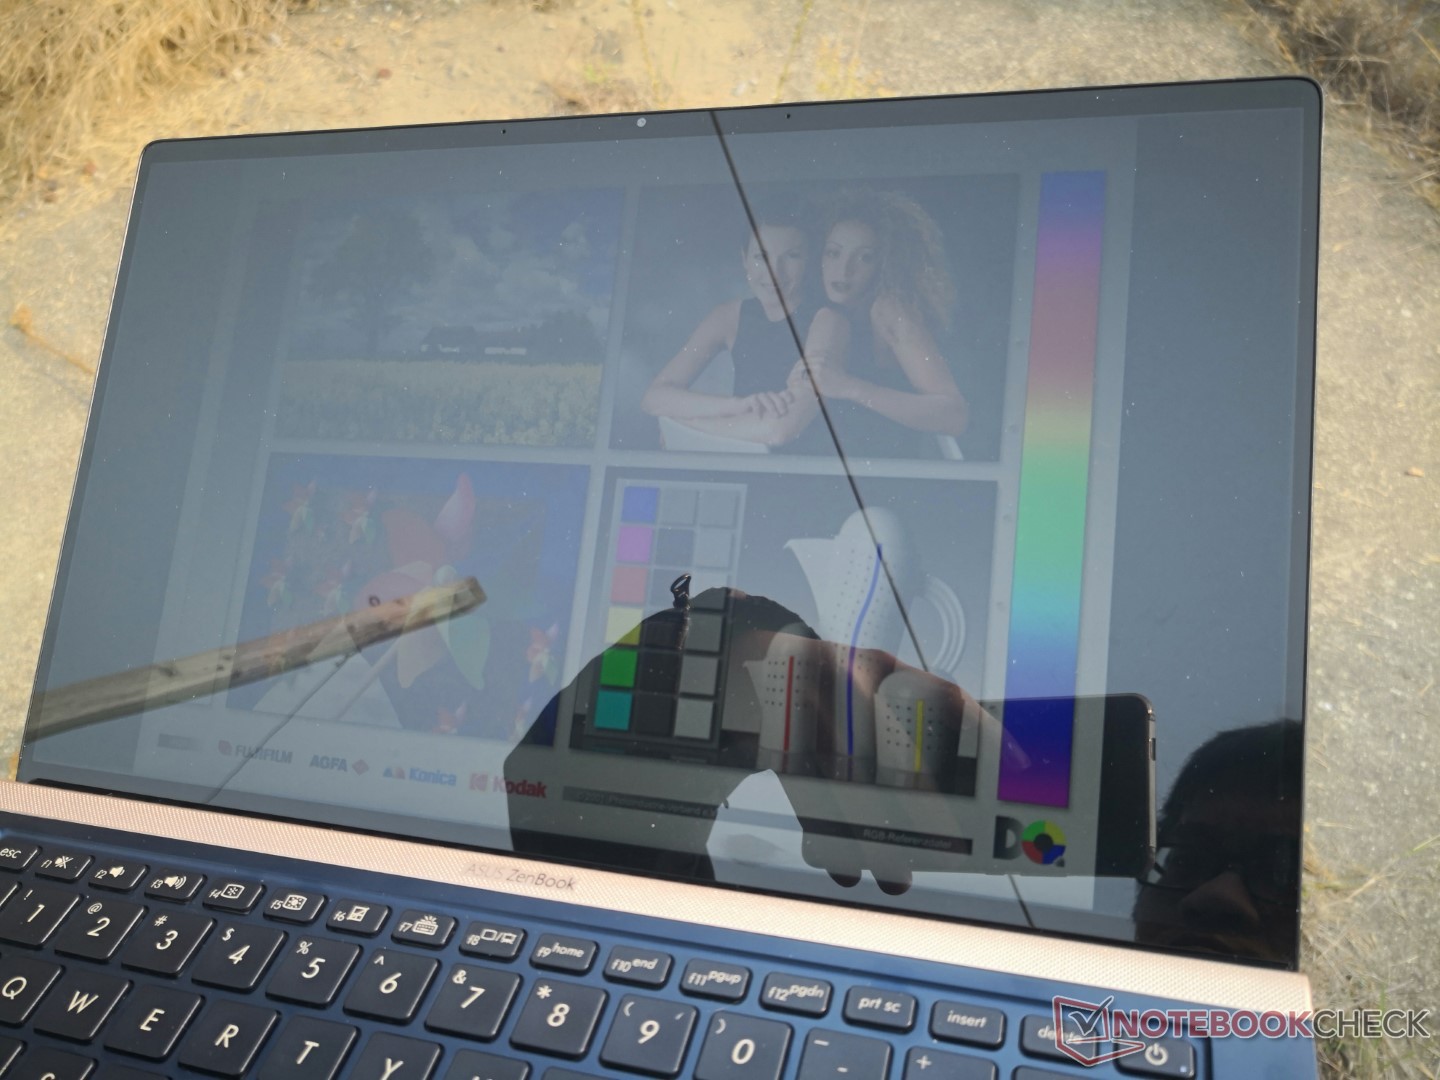
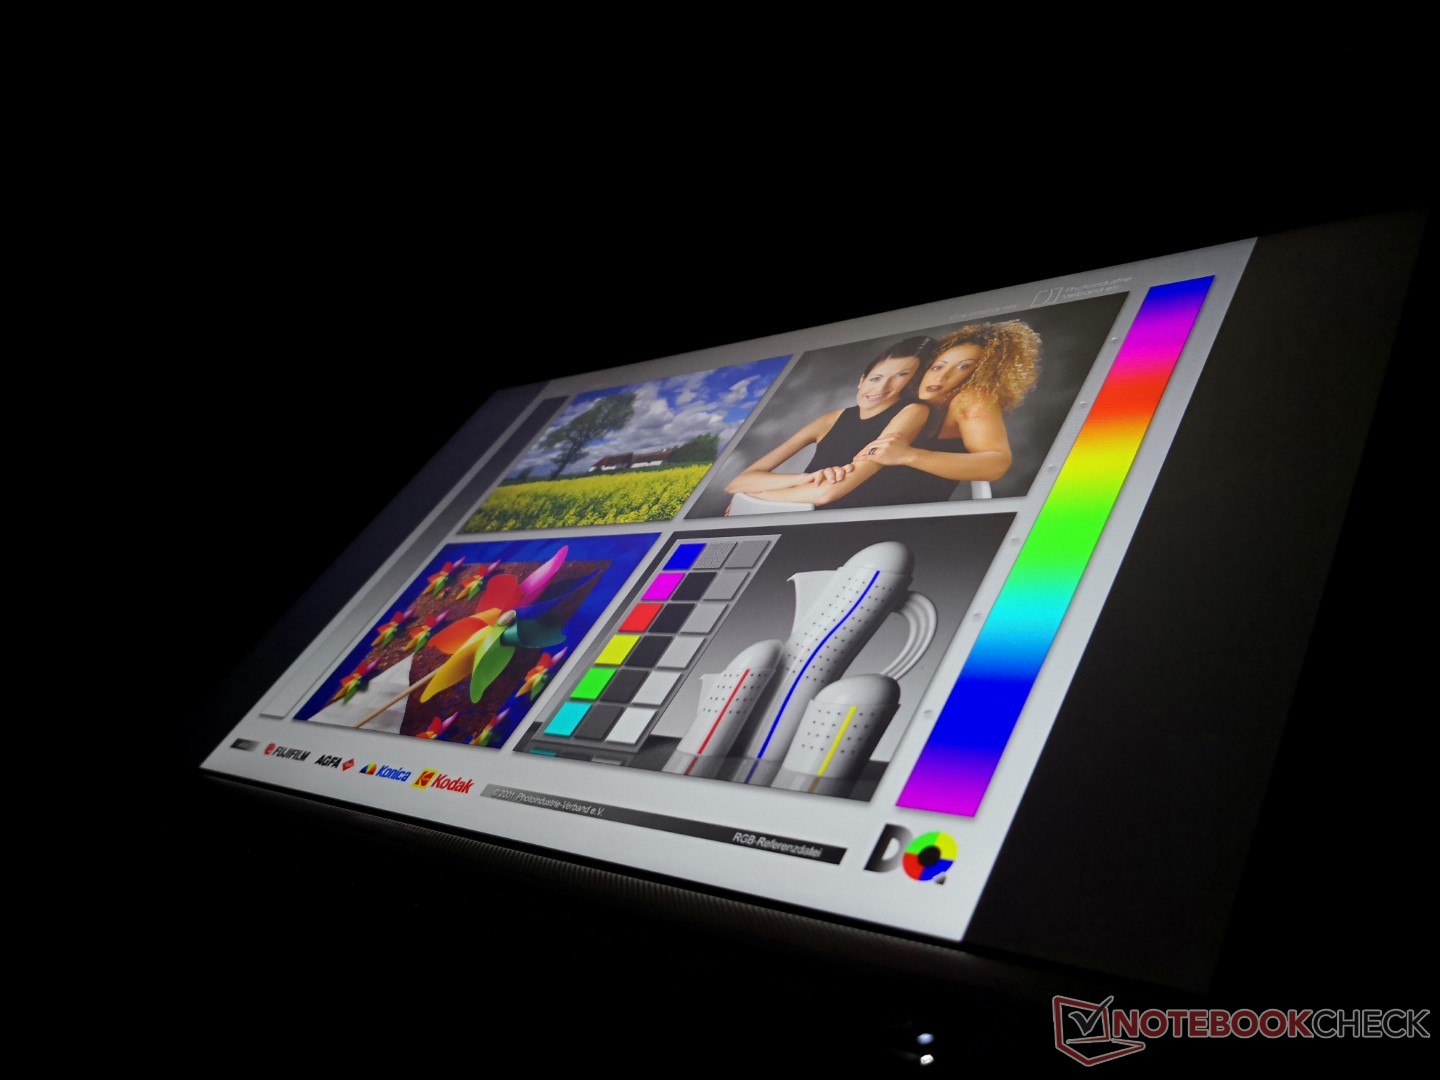
The glossy display makes for poor outdoor visibility as the backlight is not powerful enough to overcome glare. Working under shade is still the best option if outdoor use is unavoidable. The MateBook X Pro and XPS 13 9370 are equipped with brighter displays if outdoor visibility is priority.
Performance
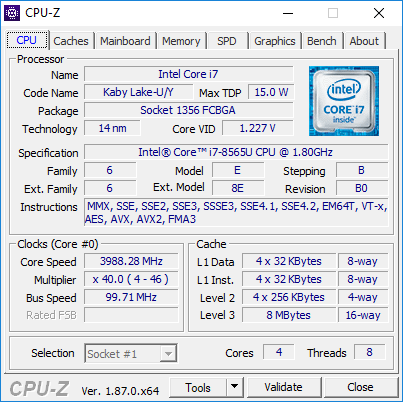
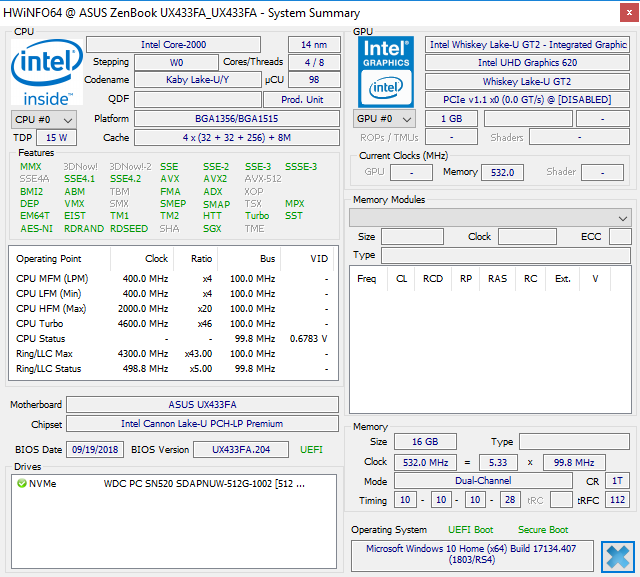
The UX433 is one of the first notebooks to ship with a Whiskey Lake-U processor and while the new CPU series consists of i5-8265U and i7-8565U SKUs, the UX433 is currently only shipping with the i7-8565U. We suspect that future iterations will expand to include Core i5 and discrete GeForce options up to the MX150 GPU as well.
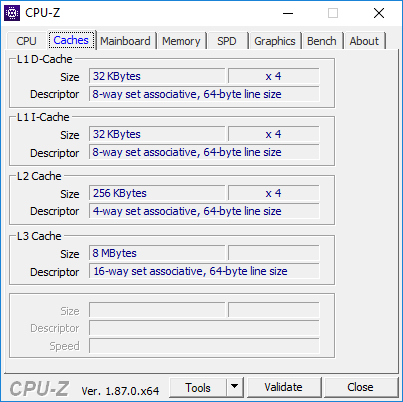
The 15 W Whiskey Lake-U targets the same Ultrabook audience as the preceding 15 W Kaby Lake-R series. Nonetheless, the base clock rates and L1/L2/L3 caches are exactly the same between the i7-8565U and older i7-8550U.
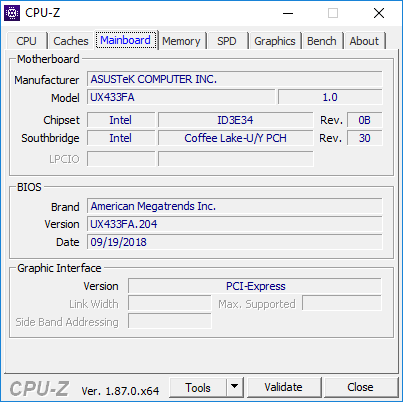
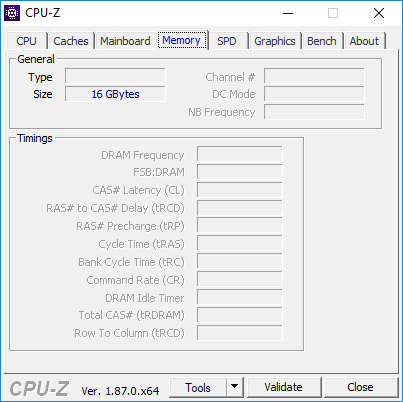
Monitoring programs like CPU-Z, GPU-Z, and HWiNFO are unable to fully recognize the new Whiskey Lake-U CPU as of this writing.
Processor
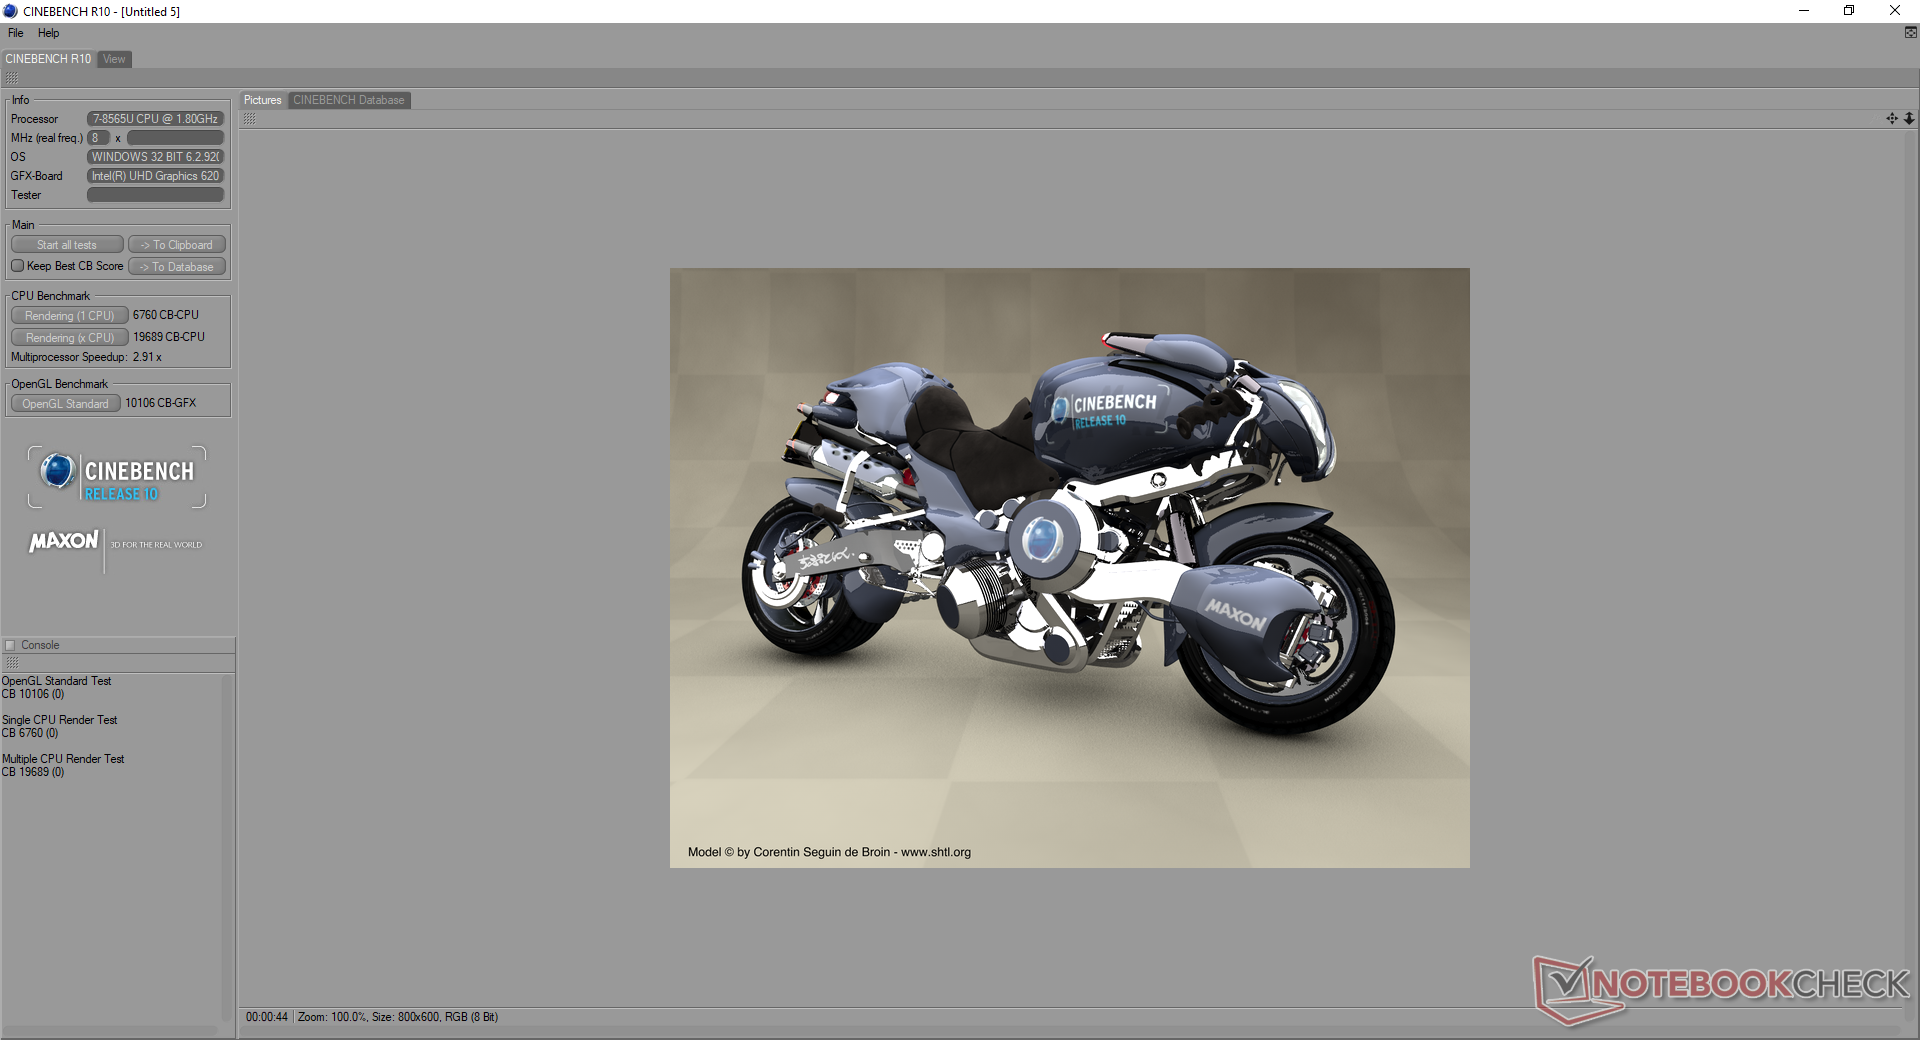
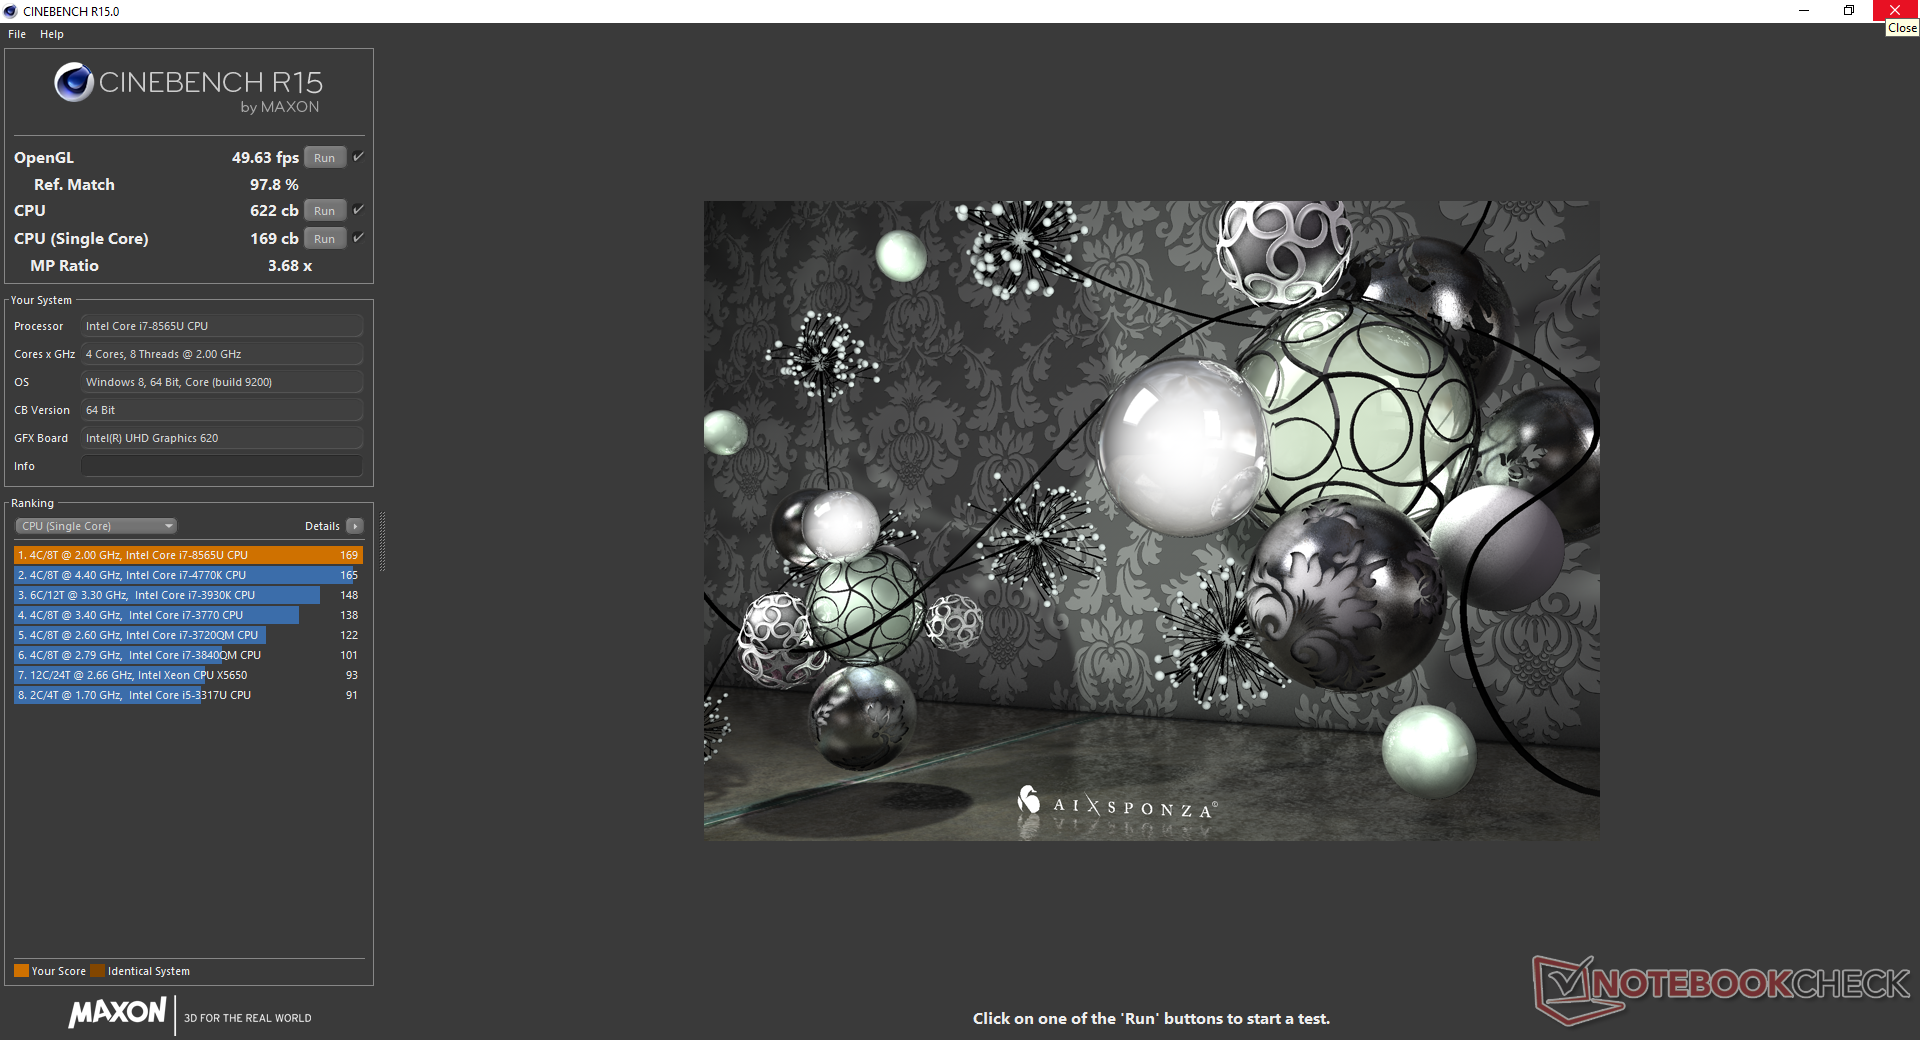
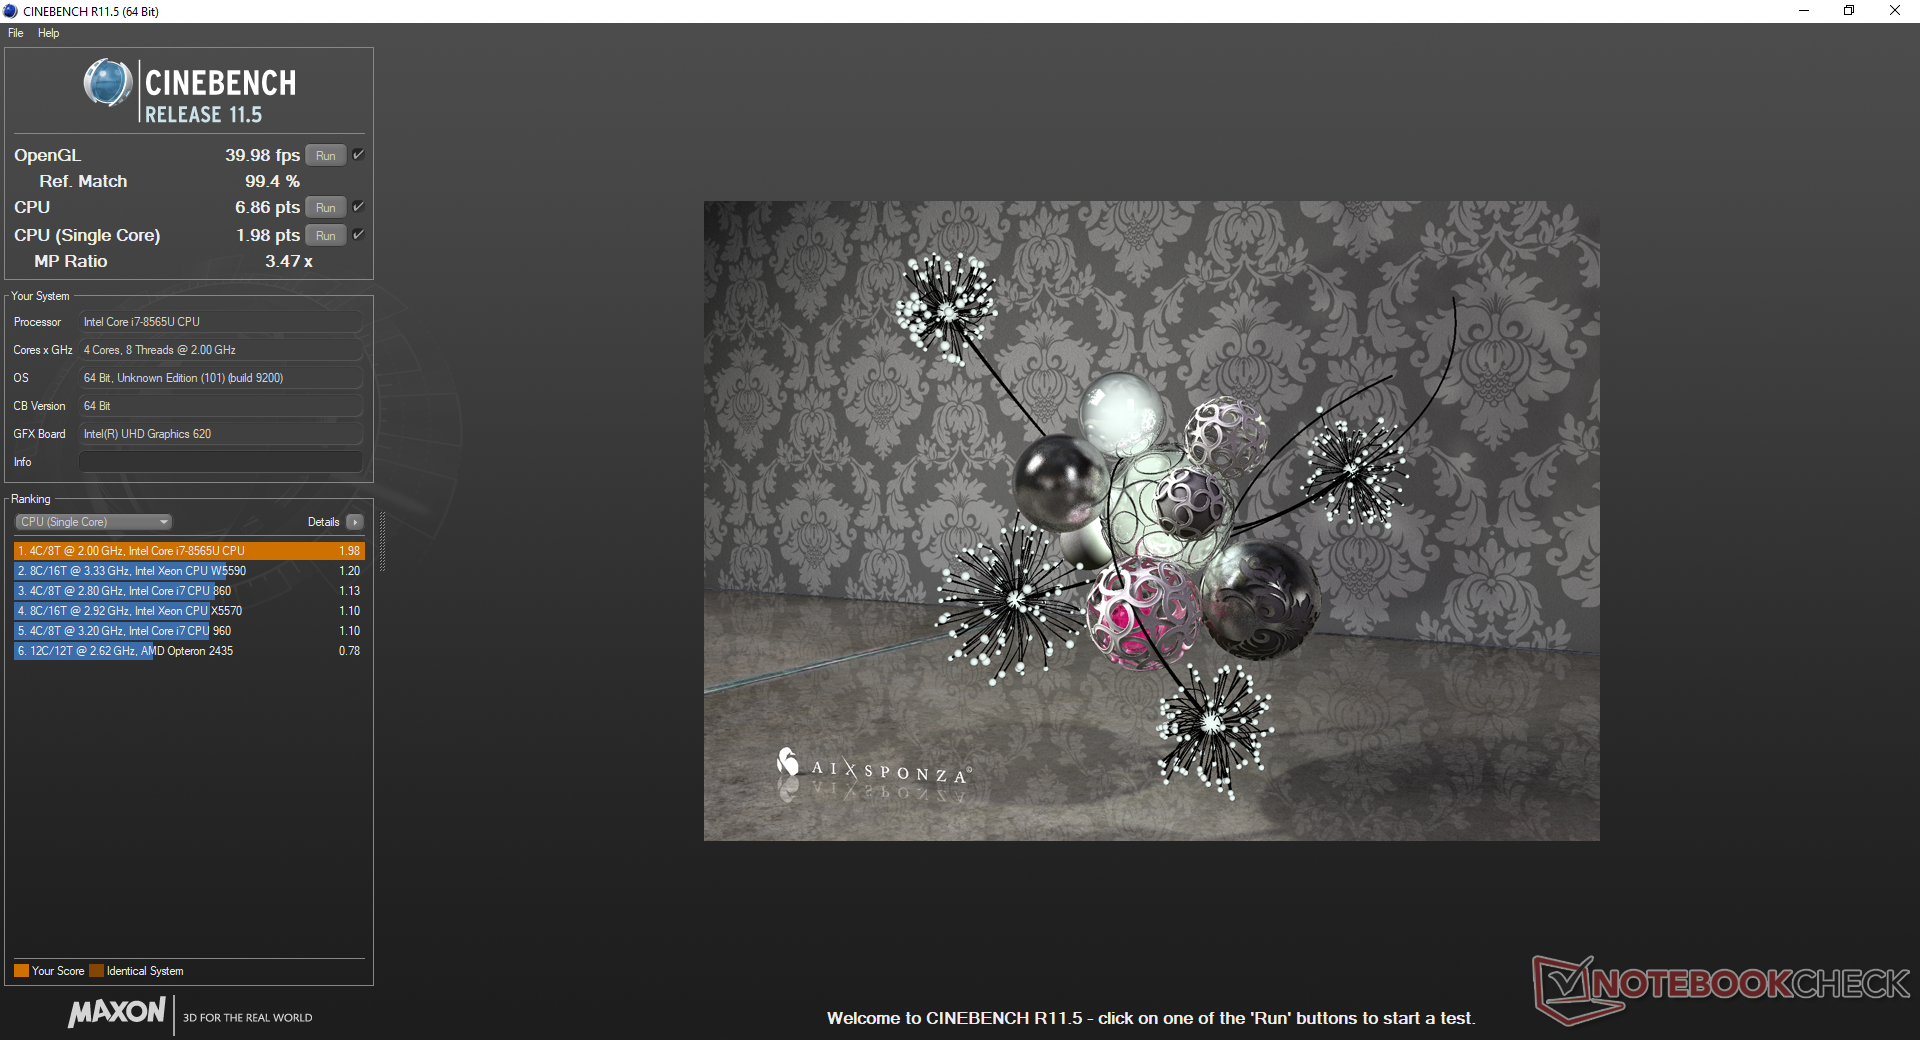
Is this new-fangled processor any faster than the Core i7-8550U that it replaces? CineBench benchmarks reveal the i7-8565U in our Asus to be just 6 percent faster than the i7-8550U in the last generation UX430 and slightly below that of the Core i5-8259U in the MacBook Pro 13. It's a minor performance upgrade at best especially when compared to the massive gen-to-gen performance boost that the Kaby Lake-R series brought to the table last year. Users upgrading from Kaby Lake or earlier processors will still see significant performance gains.
Running CineBench R15 Multi-Thread in a loop shows relatively stable performance over time. The initial score of 624 points eventually drops to about 586 points for a dip of only about 6 percent. While marginally better than the i7-8550U in the UX430, we were hoping for a higher initial score to help boost the system even further over its Kaby Lake-R predecessors.
See our dedicated page on the Core i7-8565U for more technical information and benchmarks.
| Cinebench R11.5 | |
| CPU Single 64Bit | |
| Asus ZenBook 14 UX433FA | |
| Dell XPS 15 9575 i7-8705G | |
| Asus FX504GD | |
| Asus Zenbook UX430UN | |
| CPU Multi 64Bit | |
| Dell XPS 15 9575 i7-8705G | |
| Asus ZenBook 14 UX433FA | |
| Asus Zenbook UX430UN | |
| Asus FX504GD | |
| Cinebench R10 | |
| Rendering Multiple CPUs 32Bit | |
| Dell XPS 15 9575 i7-8705G | |
| Asus FX504GD | |
| Asus ZenBook 14 UX433FA | |
| Asus Zenbook UX430UN | |
| Lenovo Ideapad 720S-13ARR | |
| Rendering Single 32Bit | |
| Asus ZenBook 14 UX433FA | |
| Asus FX504GD | |
| Asus Zenbook UX430UN | |
| Dell XPS 15 9575 i7-8705G | |
| Lenovo Ideapad 720S-13ARR | |
| wPrime 2.10 - 1024m | |
| Asus Zenbook UX430UN | |
| Asus ZenBook 14 UX433FA | |
| Asus FX504GD | |
| Dell XPS 15 9575 i7-8705G | |
* ... smaller is better
System Performance
PCMark benchmarks rank our Asus within single-digit percentages of many of its competitors including the Yoga C930 and outgoing UX430. In other words, system performance is not significantly faster than last generation Kaby Lake-R options. The latest 2018 MacBook Air scores much lower than our UX433 due largely to its slower Core Y processor.
We didn't experience any software or hardware issues during testing.
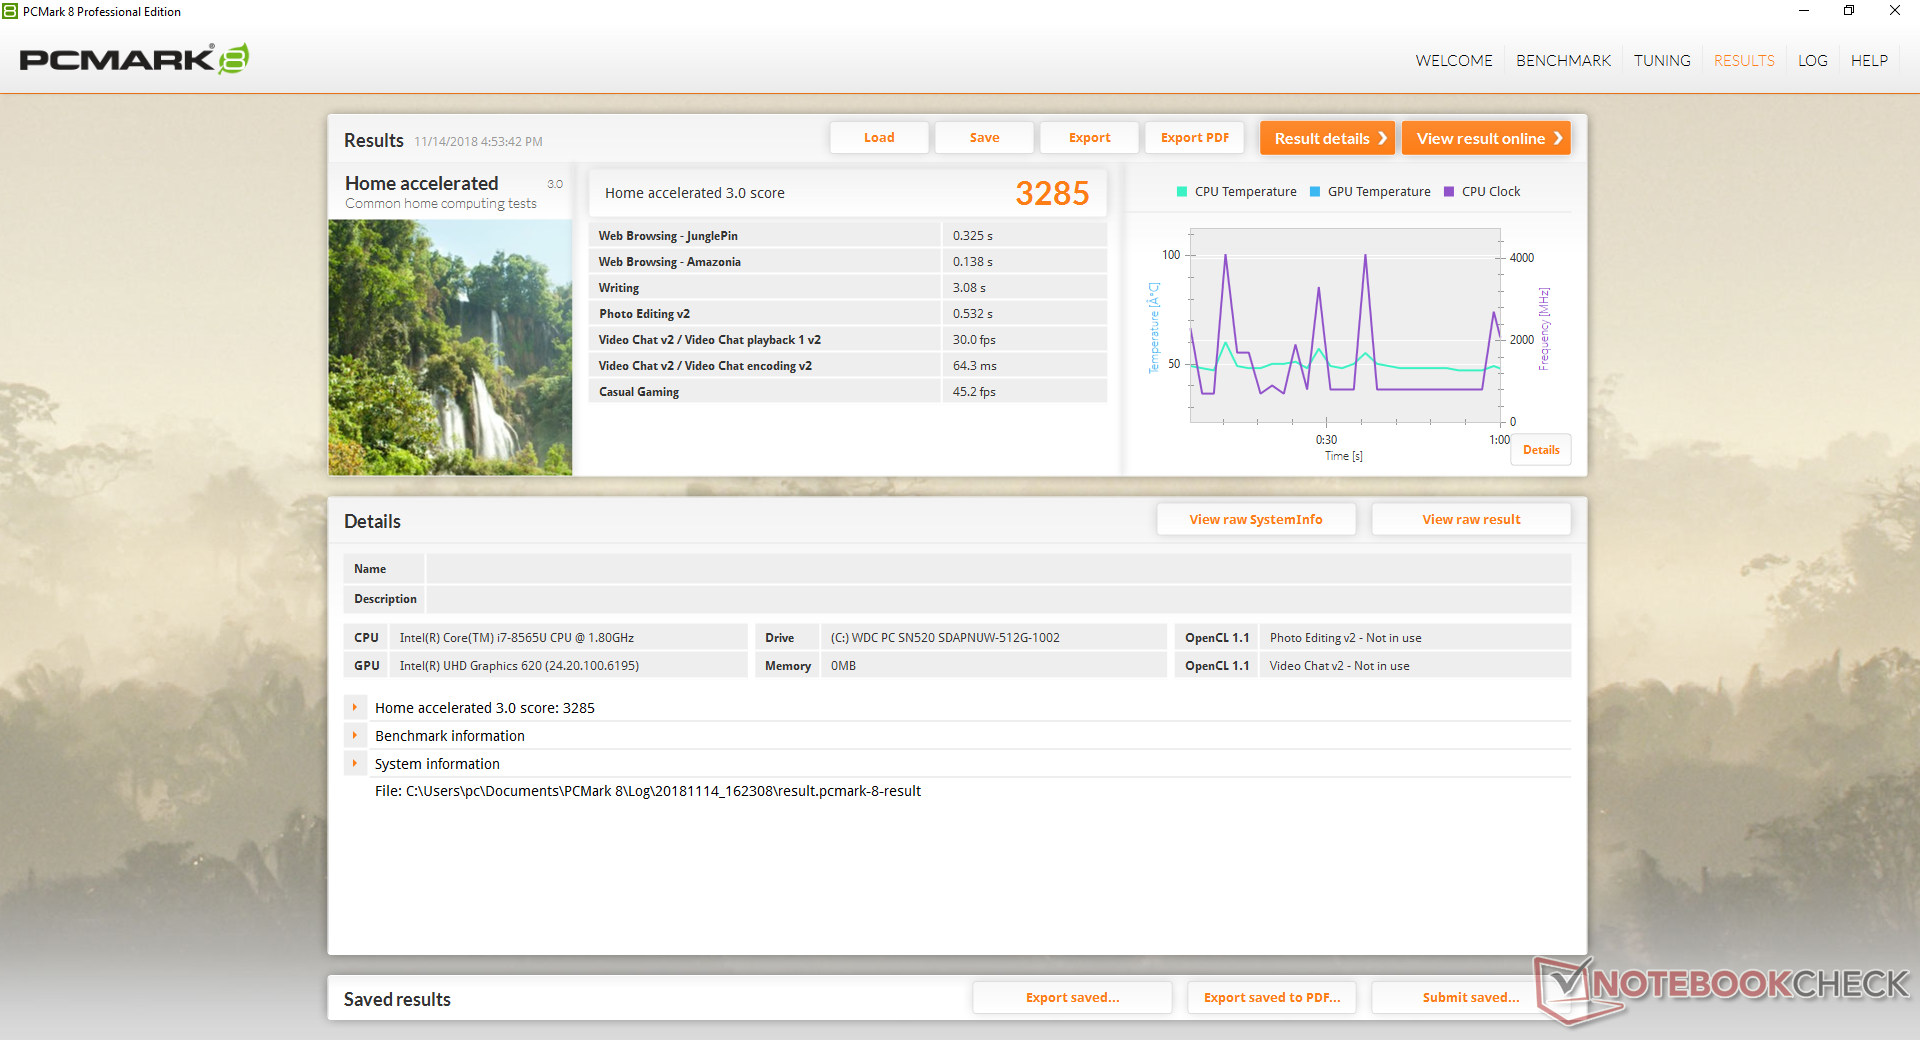
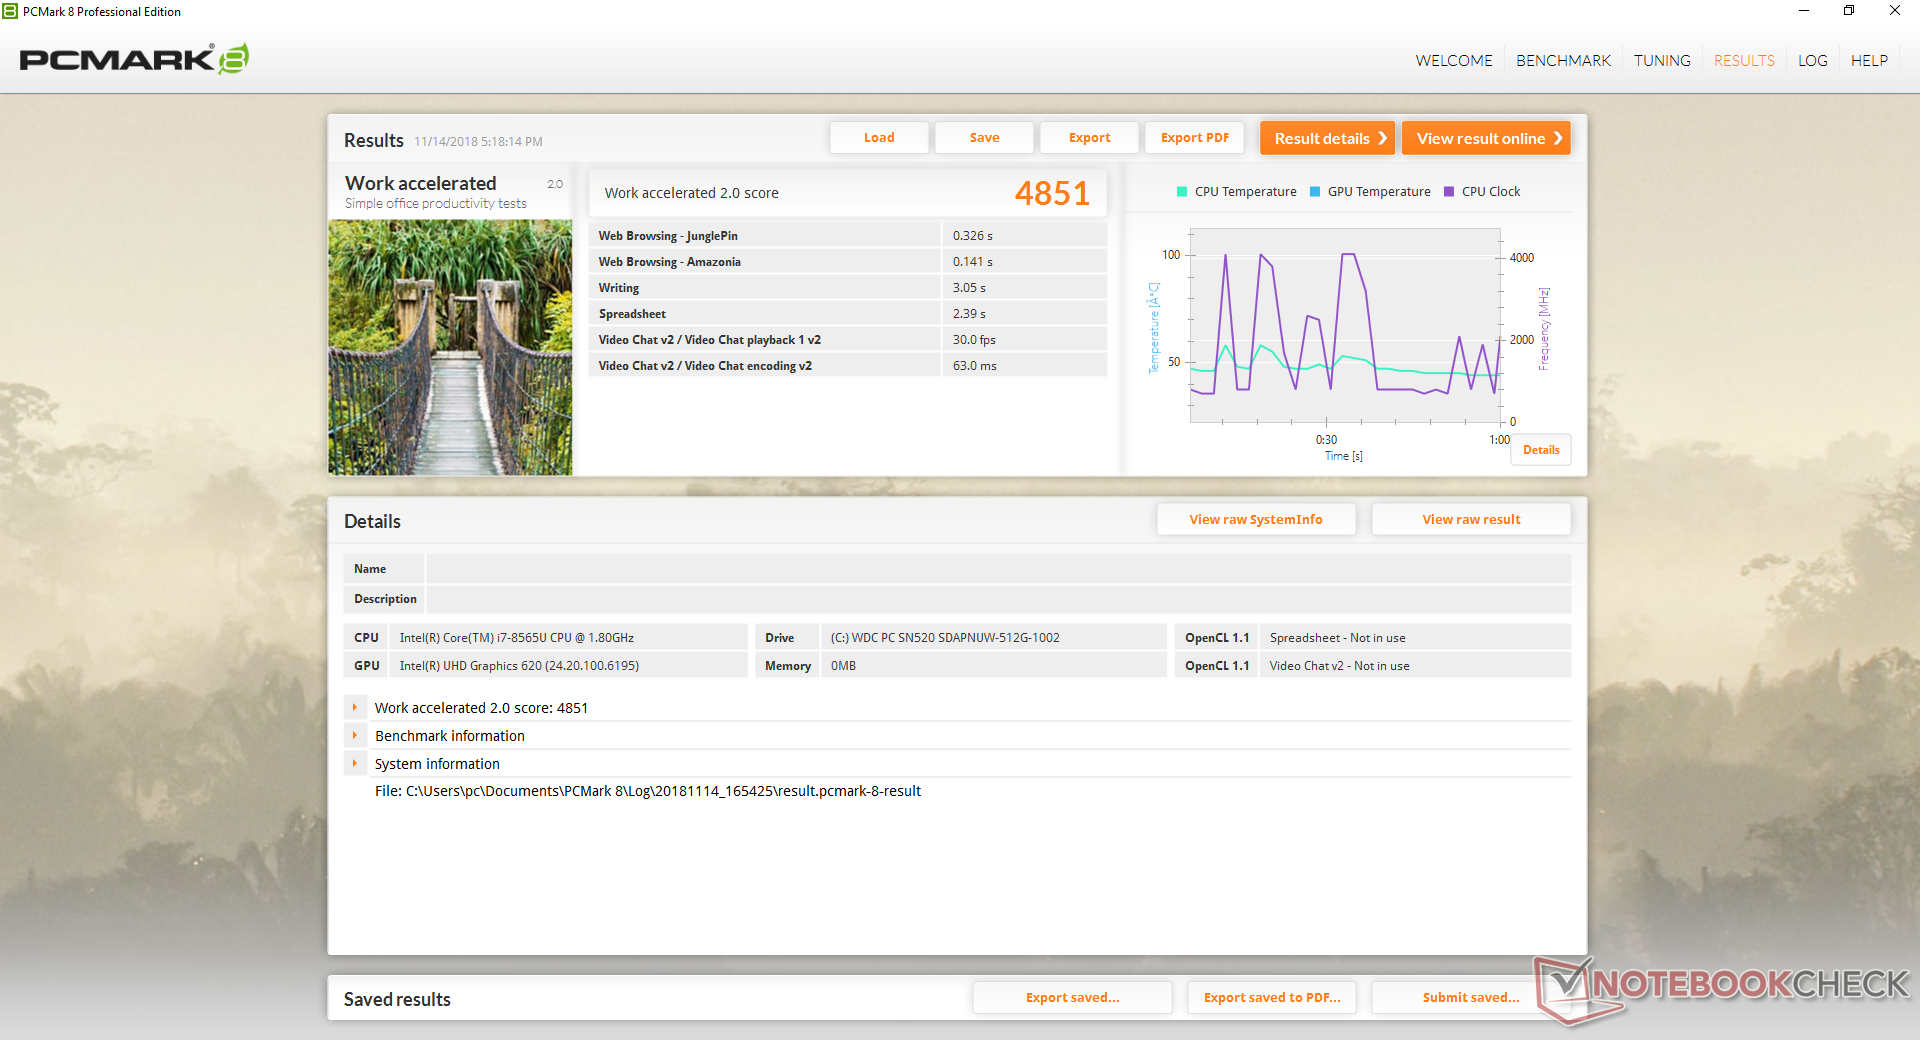
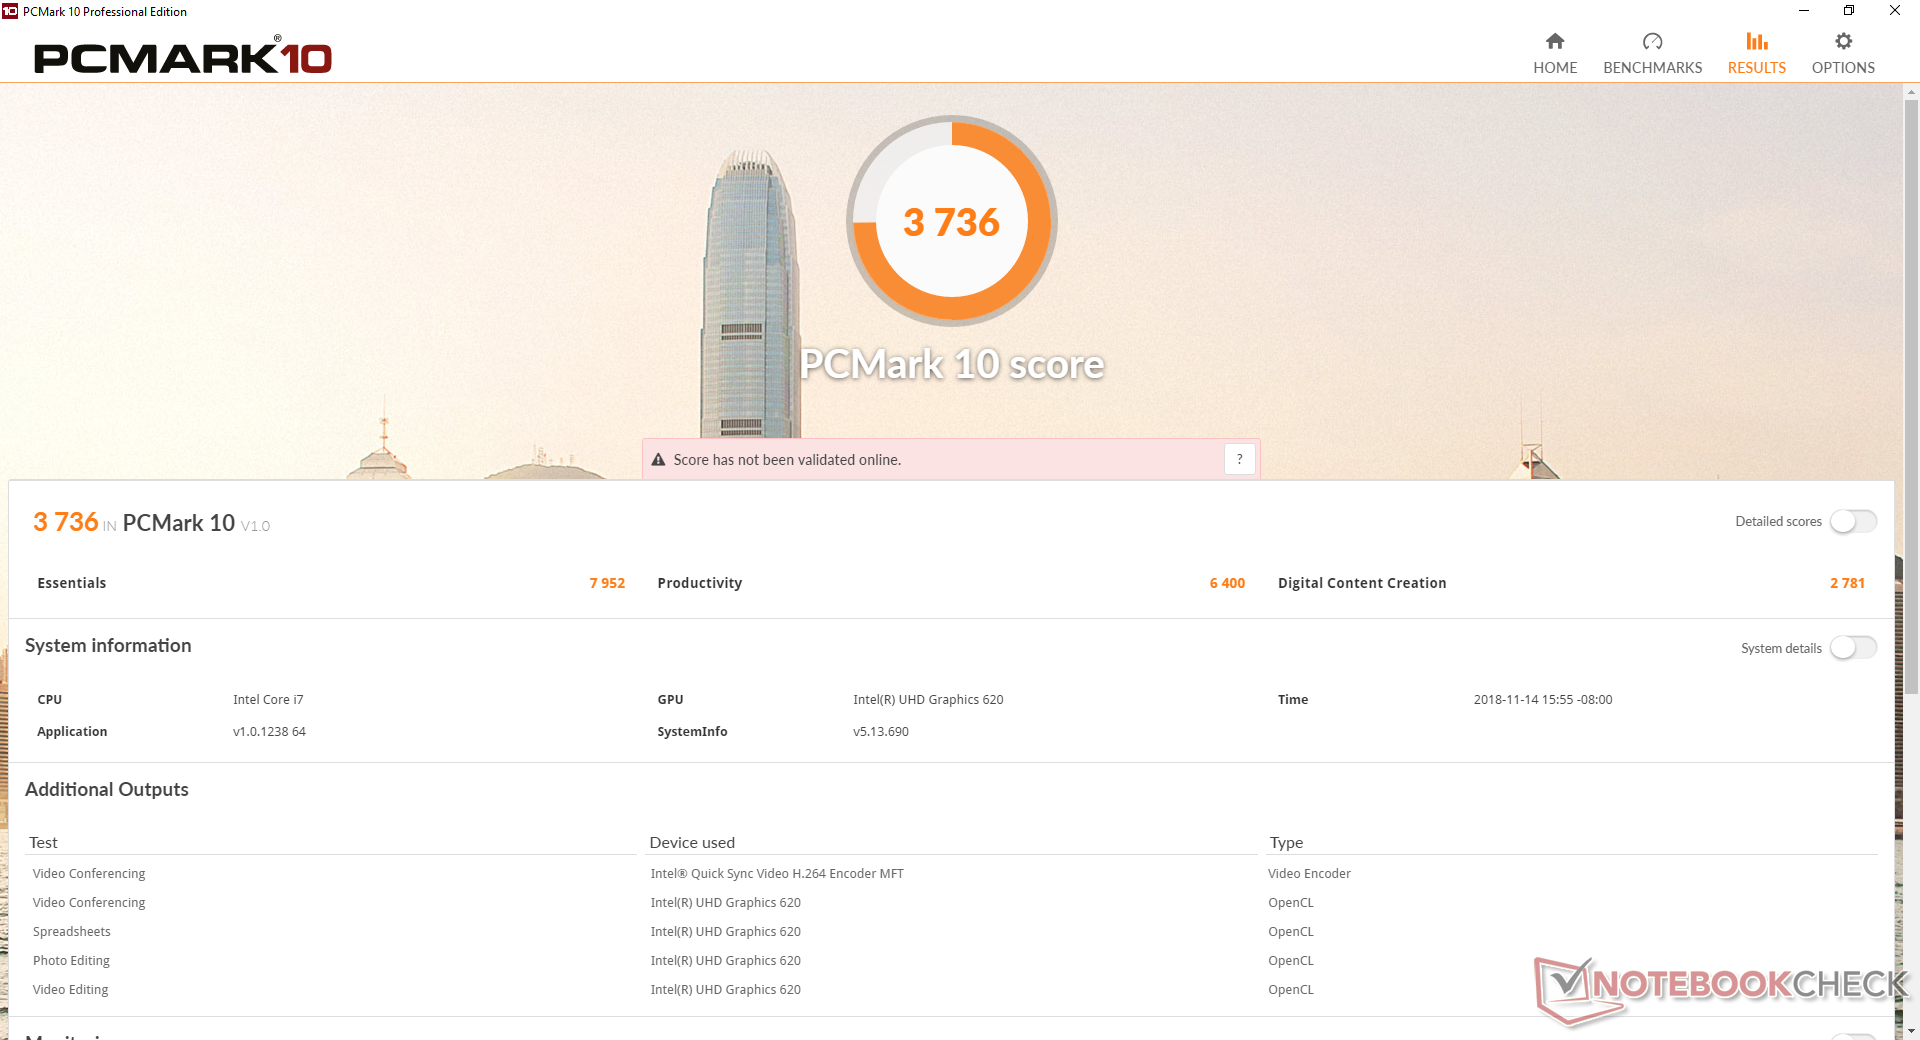
| PCMark 8 Home Score Accelerated v2 | 3285 points | |
| PCMark 8 Work Score Accelerated v2 | 4851 points | |
| PCMark 10 Score | 3736 points | |
Help | ||
Storage Devices
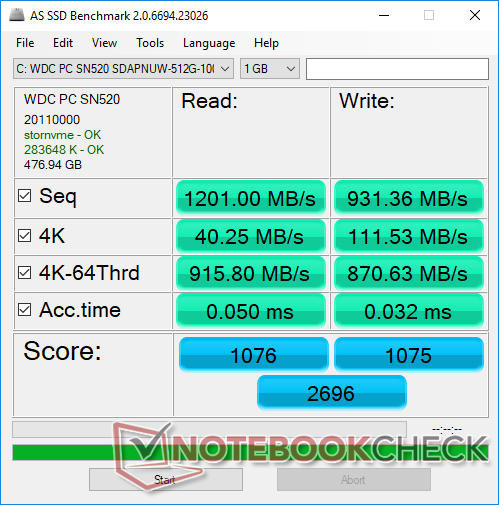
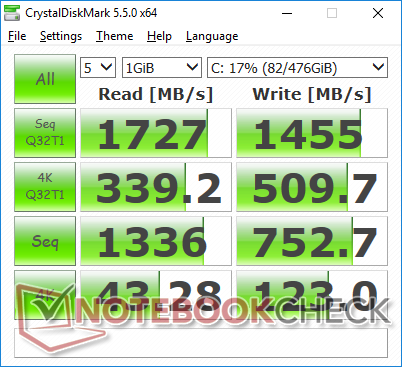
According to the official spec sheet for the 512 GB Western Digital SN520 SDAPMUW NVMe SSD, the drive offers a theoretical sequential read and write rate of up to 1700 MB/s and 1400 MB/s, respectively. Our own test with AS SSD returns read and write rates of only 1201 MB/s and 931 MB/s, respectively. Performance is nonetheless significantly faster than the SATA III SanDisk SSD in the UX430 while still trailing behind the Samsung PM961 and PM981.
Swapping out the sole M.2 SSD may void the manufacturer warranty as there is a warning sticker over the screw.
See our table of HDDs and SSDs for more benchmark comparisons.
| Asus ZenBook 14 UX433FA WDC PC SN520 SDAPNUW-512G | Dell XPS 13 9370 i7 UHD Toshiba XG5 KXG50ZNV512G | Huawei Matebook X Pro i5 Samsung PM961 MZVLW256HEHP | Lenovo Yoga C930-13IKB 81C4 SK hynix PC401 HFS256GD9TNG | Asus Zenbook UX430UN SanDisk SD8SN8U512G1002 | HP Spectre x360 13-ae048ng Toshiba NVMe THNSN51T02DUK | |
|---|---|---|---|---|---|---|
| AS SSD | -22% | -4% | -192% | -70% | -570% | |
| Seq Read (MB/s) | 1201 | 2205 84% | 2416 101% | 1228 2% | 494.4 -59% | 1574 31% |
| Seq Write (MB/s) | 931 | 435.8 -53% | 1170 26% | 544 -42% | 300.3 -68% | 377.1 -59% |
| 4K Read (MB/s) | 40.25 | 29.36 -27% | 48.33 20% | 39.16 -3% | 25.39 -37% | 31.73 -21% |
| 4K Write (MB/s) | 111.5 | 107.4 -4% | 103.1 -8% | 106.5 -4% | 47.88 -57% | 1.73 -98% |
| 4K-64 Read (MB/s) | 916 | 678 -26% | 1039 13% | 466.4 -49% | 366 -60% | 115.6 -87% |
| 4K-64 Write (MB/s) | 871 | 444.8 -49% | 399.6 -54% | 305.1 -65% | 183.5 -79% | 2.09 -100% |
| Access Time Read * (ms) | 0.05 | 0.059 -18% | 0.058 -16% | 0.46 -820% | 0.089 -78% | 0.044 12% |
| Access Time Write * (ms) | 0.032 | 0.055 -72% | 0.036 -13% | 0.51 -1494% | 0.088 -175% | 2.391 -7372% |
| Score Read (Points) | 1076 | 926 -14% | 1329 24% | 628 -42% | 441 -59% | 305 -72% |
| Score Write (Points) | 1075 | 596 -45% | 620 -42% | 466 -57% | 261 -76% | 42 -96% |
| Score Total (Points) | 2696 | 1911 -29% | 2575 -4% | 1394 -48% | 926 -66% | 455 -83% |
| Copy ISO MB/s (MB/s) | 1153 | 585 -49% | 739 -36% | 628 -46% | 467.6 -59% | 1205 5% |
| Copy Program MB/s (MB/s) | 415.1 | 570 37% | 312.3 -25% | 540 30% | 270.5 -35% | 281.8 -32% |
| Copy Game MB/s (MB/s) | 930 | 503 -46% | 486.3 -48% | 533 -43% | 225.1 -76% | 856 -8% |
* ... smaller is better

GPU Performance
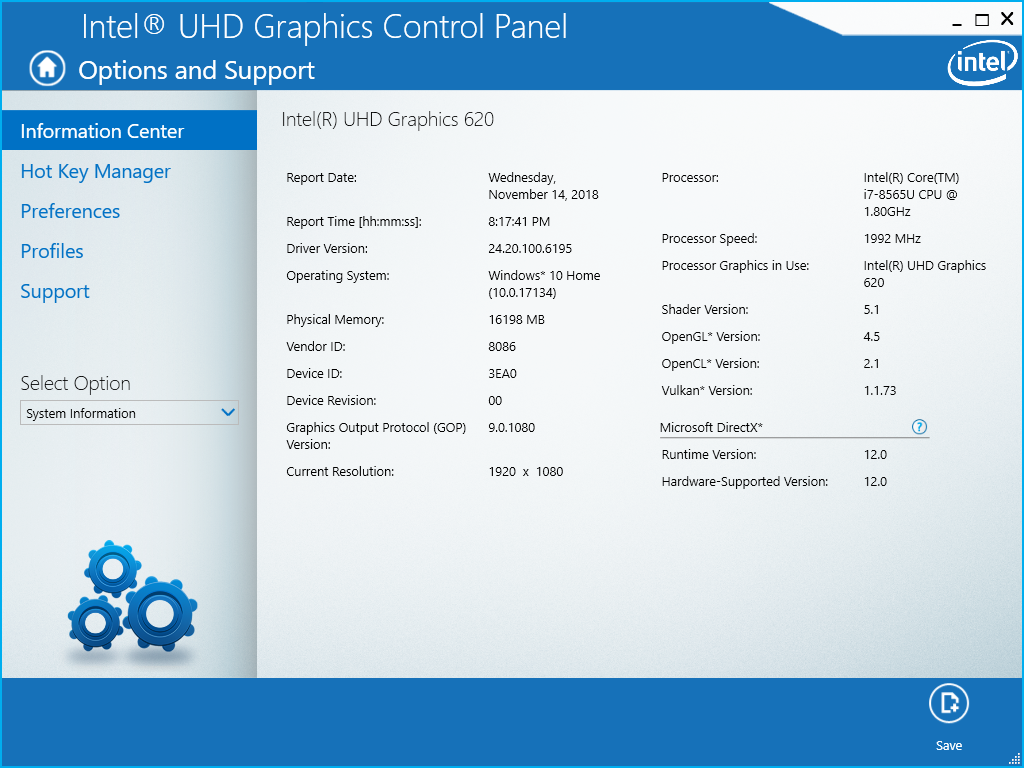
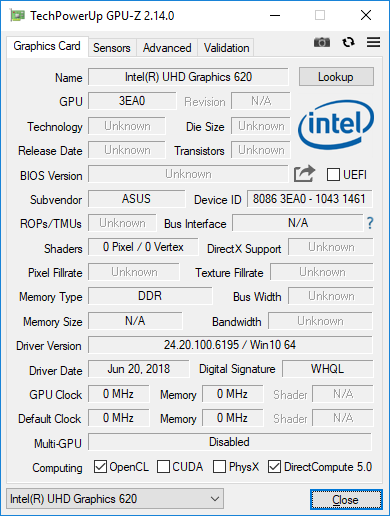
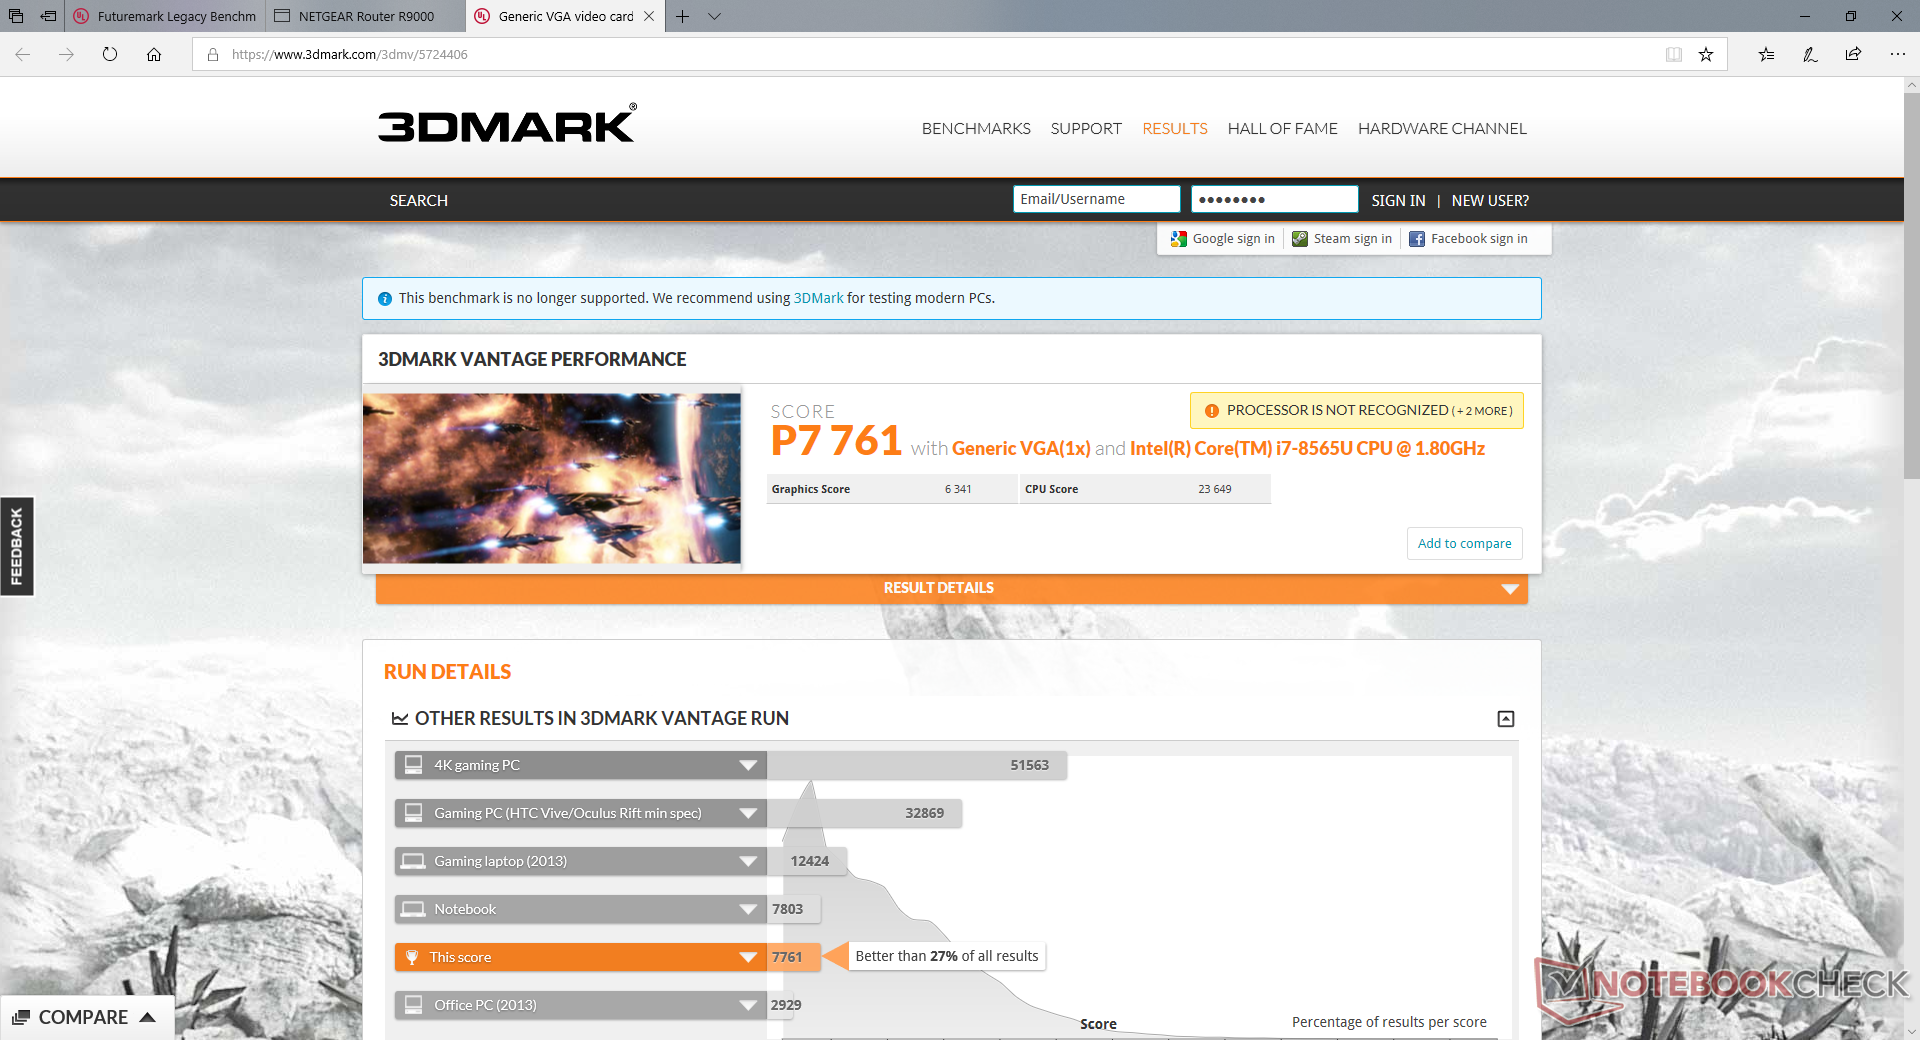
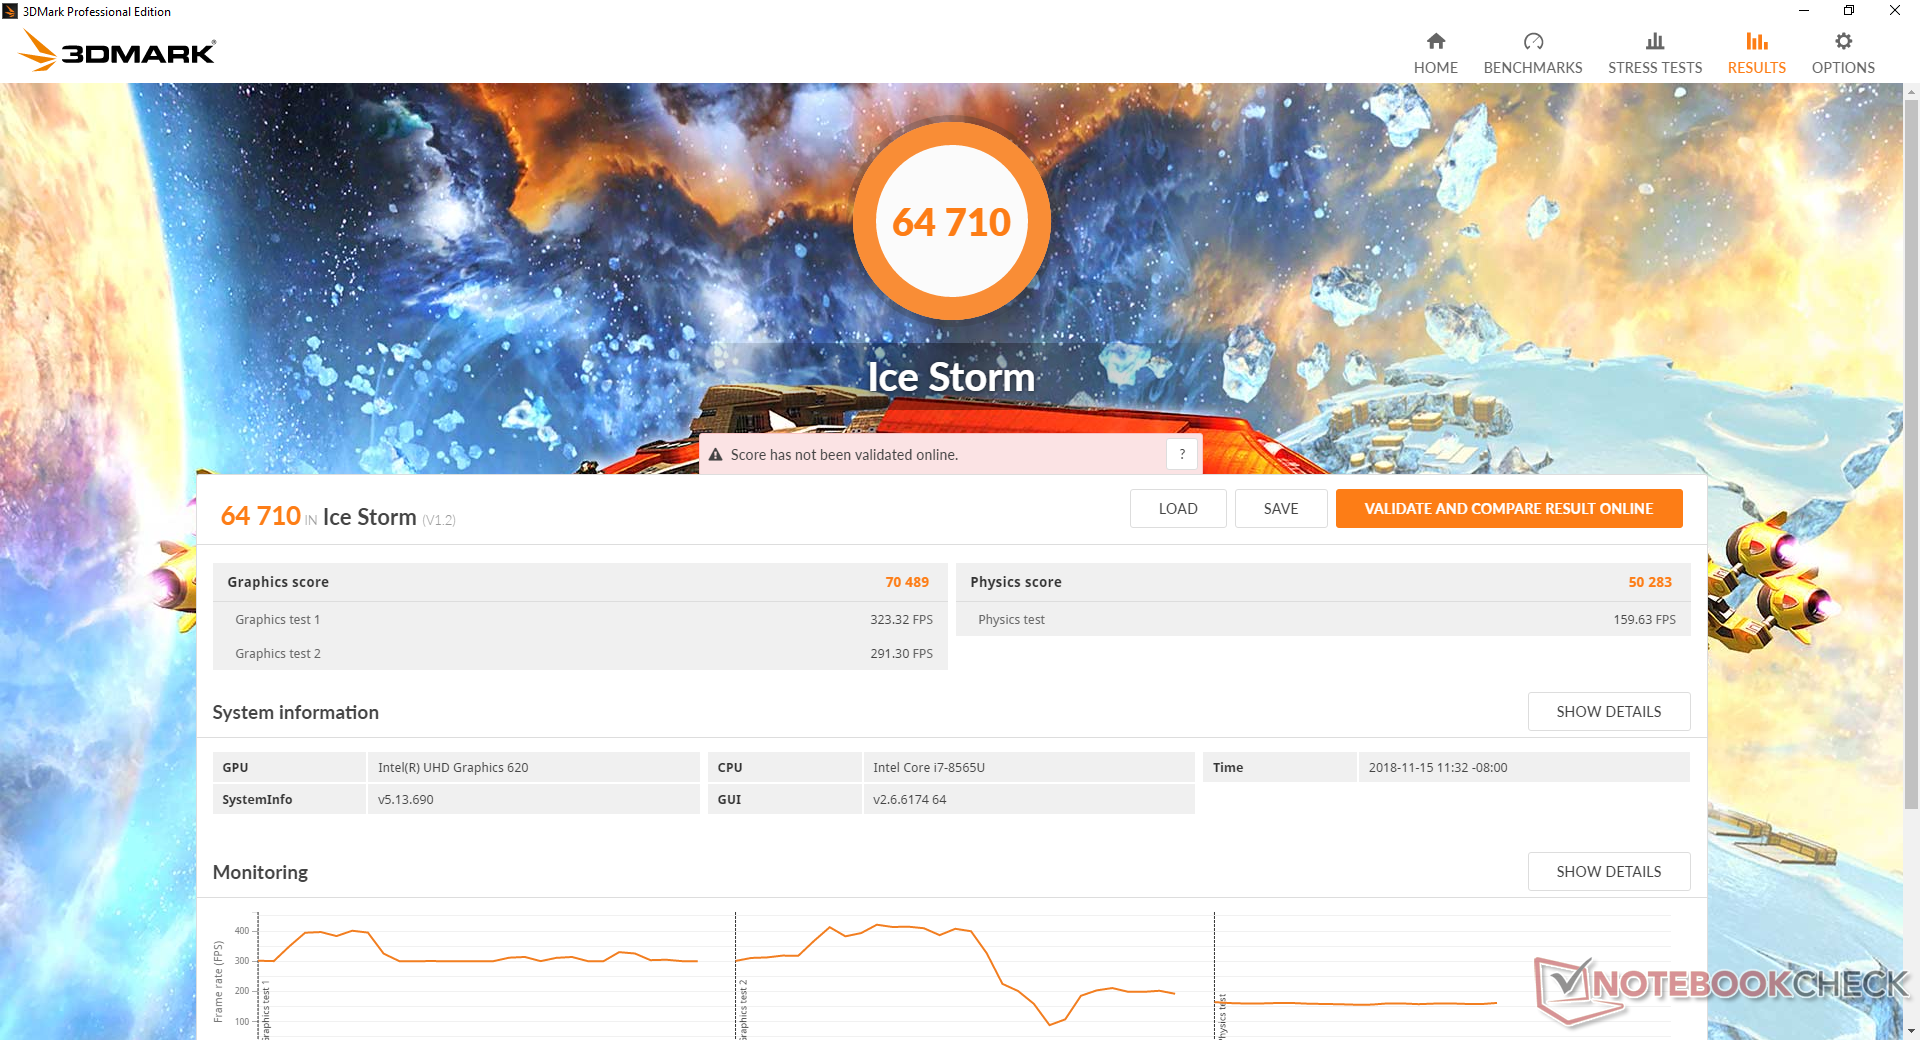
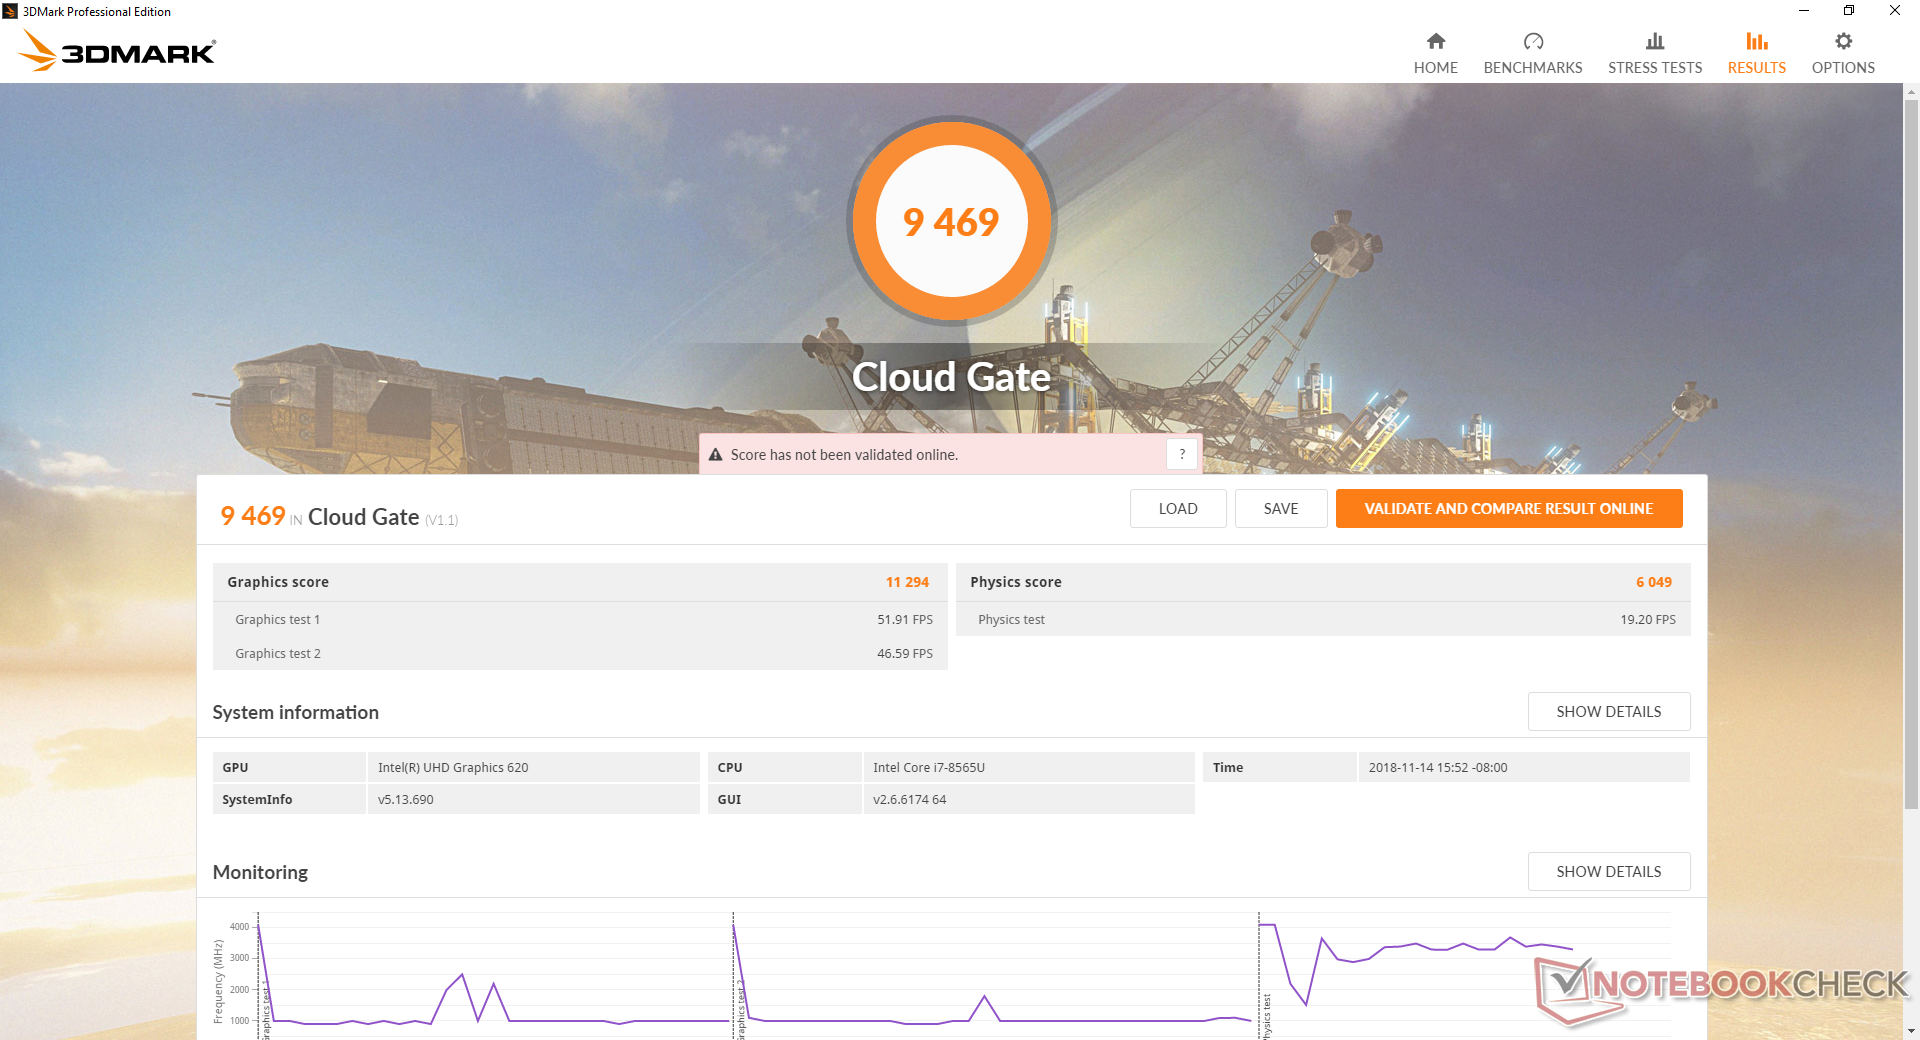
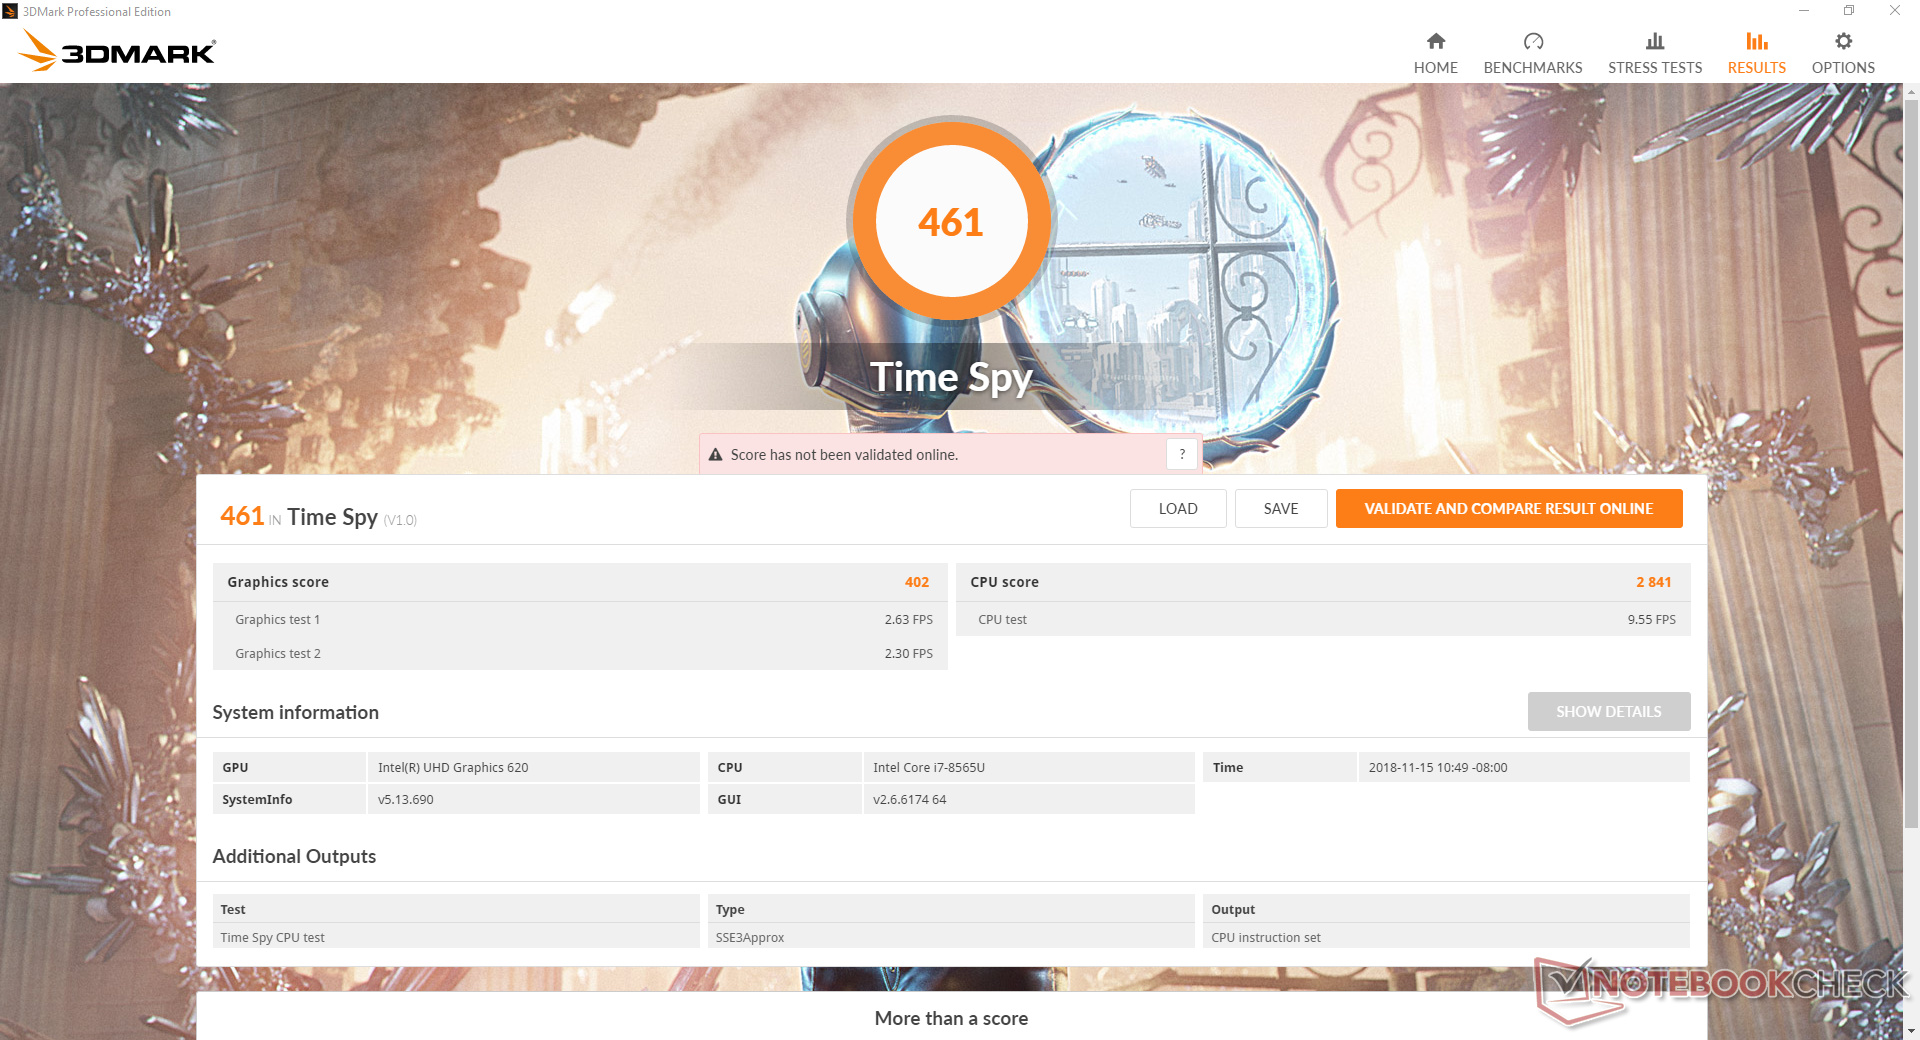
The Whiskey Lake CPU may be new, but the integrated UHD Graphics 620 is the same ol' GPU with no performance surprises to speak of. 3DMark scores are about 18 to 28 percent higher than the average UHD Graphics 620 in our database. When compared to its direct Kaby Lake-R predecessors in the XPS 13 9370 or Surface Pro 6, however, graphics performance is essentially identical.
See our dedicated page on the UHD Graphics 620 for more technical information and benchmark comparisons. It is unknown if the MX150 option for the system is the slower 1D12 variant or the full-power 1D10 variant.
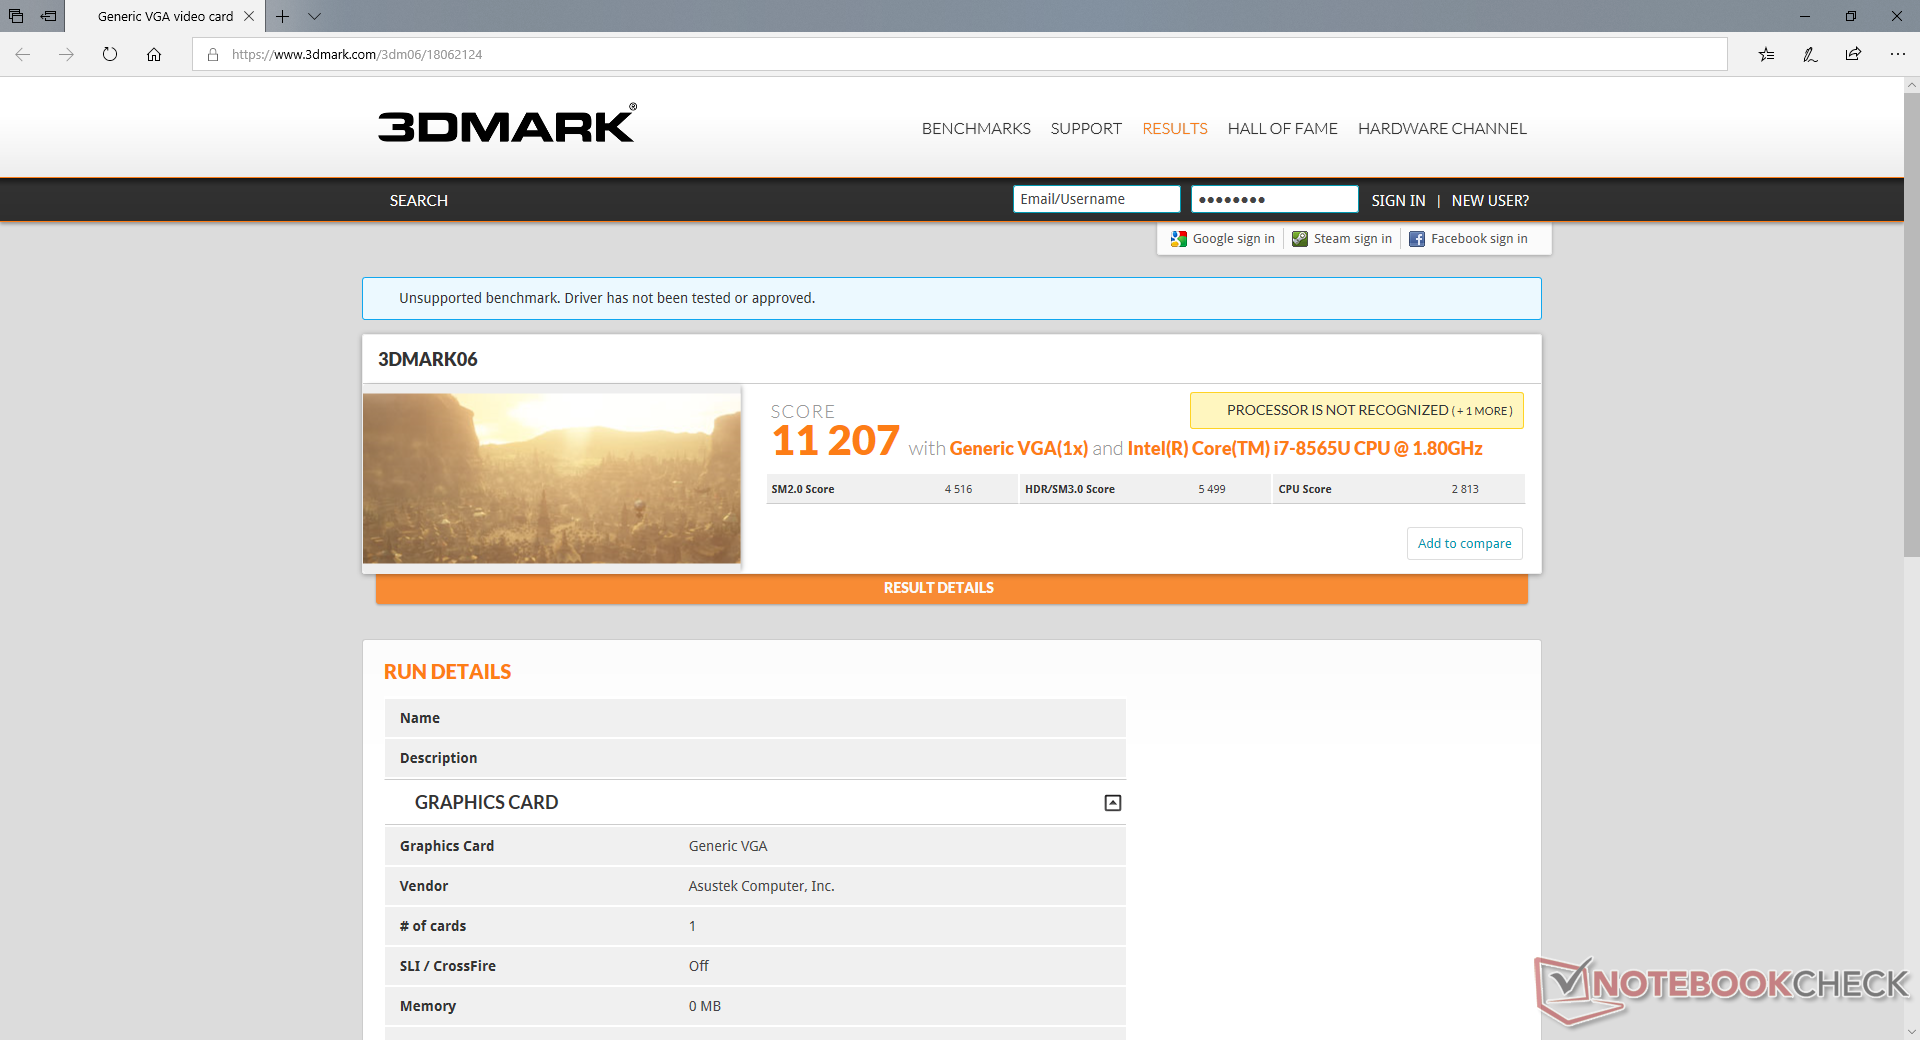
| 3DMark 06 Standard Score | 11207 points | |
| 3DMark Vantage P Result | 7761 points | |
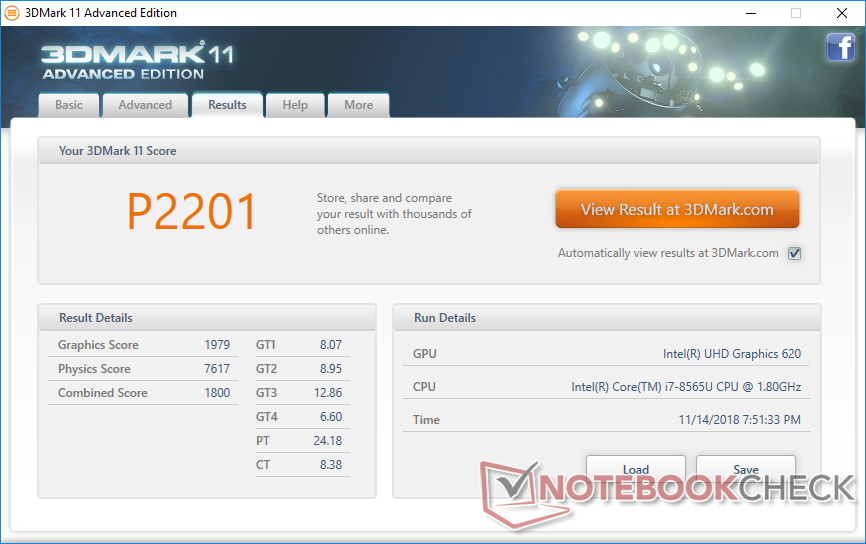
| 3DMark 11 Performance | 2201 points | |
| 3DMark Ice Storm Standard Score | 64710 points | |
| 3DMark Cloud Gate Standard Score | 9469 points | |
| 3DMark Time Spy Score | 461 points | |
Help | ||
| low | med. | high | ultra | |
|---|---|---|---|---|
| BioShock Infinite (2013) | 78.5 | 38.1 | 31.8 | 9.7 |
| Rise of the Tomb Raider (2016) | 22.8 | 13.7 | 7.2 | 5.7 |
| Rocket League (2017) | 71.4 | 32.9 | 21.1 |
Emissions
System Noise
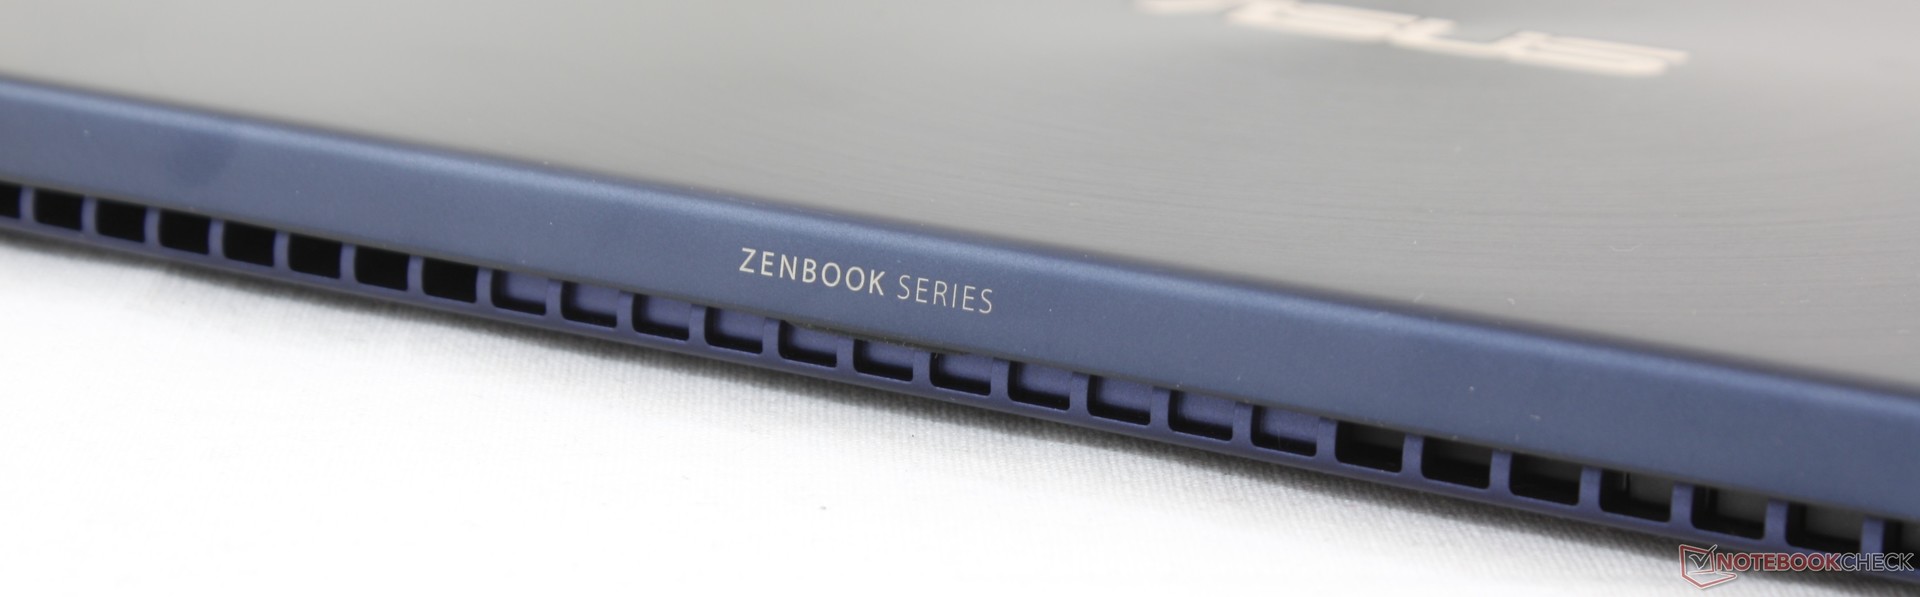
The cooling solution is almost identical to its UX430 predecessor despite the vast changes to the rest of the chassis. The fan is active during low loads like browsing or streaming, but it is essentially inaudible when sitting at a normal distance. Higher medium loads will bump fan noise to 36 dB(A) compared to almost 42 dB(A) on the UX430 since the latter is equipped with dedicated GeForce graphics. Had our UX433 test unit included GeForce graphics, it would have been very likely to exhibit the same fan behavior as the UX430.
Fan noise is quiet overall if not a bit louder than many other iGPU-only Ultrabooks like the XPS 13 or Spectre 13 when under higher processing stress. Our unit suffers from slight-moderate electronic noise that can be heard when placing an ear near the keyboard.
| Asus ZenBook 14 UX433FA UHD Graphics 620, i7-8565U, WDC PC SN520 SDAPNUW-512G | Dell XPS 13 9370 i7 UHD UHD Graphics 620, i5-8550U, Toshiba XG5 KXG50ZNV512G | Huawei Matebook X Pro i5 GeForce MX150, i5-8250U, Samsung PM961 MZVLW256HEHP | Asus Zenbook UX430UN GeForce MX150, i5-8550U, SanDisk SD8SN8U512G1002 | Lenovo Yoga C930-13IKB 81C4 UHD Graphics 620, i5-8550U, SK hynix PC401 HFS256GD9TNG | HP Spectre x360 13-ae048ng UHD Graphics 620, i5-8550U, Toshiba NVMe THNSN51T02DUK | |
|---|---|---|---|---|---|---|
| Noise | 4% | 1% | -4% | 4% | 2% | |
| off / environment * (dB) | 28.8 | 28 3% | 27.9 3% | 28.3 2% | 27.9 3% | 30.13 -5% |
| Idle Minimum * (dB) | 28.8 | 28 3% | 27.9 3% | 28.9 -0% | 27.9 3% | 30.13 -5% |
| Idle Average * (dB) | 28.8 | 28 3% | 27.9 3% | 30 -4% | 27.9 3% | 30 -4% |
| Idle Maximum * (dB) | 29.1 | 28 4% | 27.9 4% | 30.2 -4% | 29.3 -1% | 30.13 -4% |
| Load Average * (dB) | 36.1 | 32.5 10% | 36.2 -0% | 41.8 -16% | 32 11% | 33.4 7% |
| Load Maximum * (dB) | 41.2 | 42.2 -2% | 45.2 -10% | 42 -2% | 39.3 5% | 33 20% |
| Witcher 3 ultra * (dB) | 45 | 42 |
* ... smaller is better
Noise level
| Idle |
| 28.8 / 28.8 / 29.1 dB(A) |
| Load |
| 36.1 / 41.2 dB(A) |
 | ||
30 dB silent 40 dB(A) audible 50 dB(A) loud |
||
min: | ||
Temperature

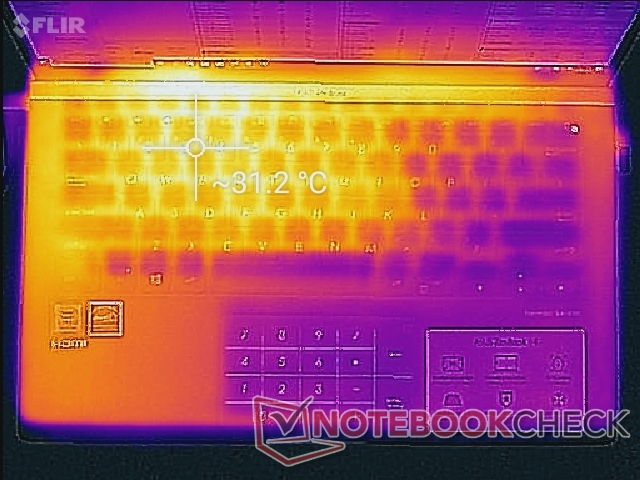
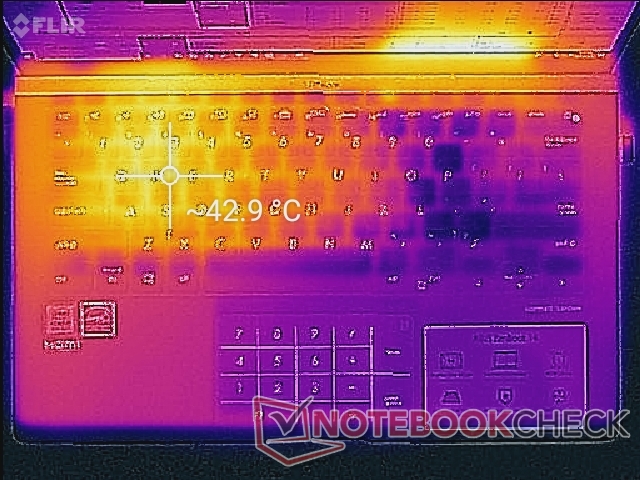
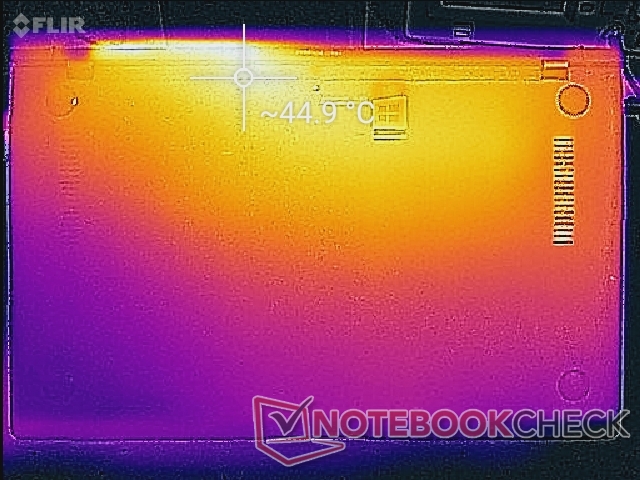
The left half of the notebook will always be warmer than the right half due to the positioning of the CPU and design of the cooling solution. In this case, surface temperature behavior hasn't change very much when compared to the older UX430.
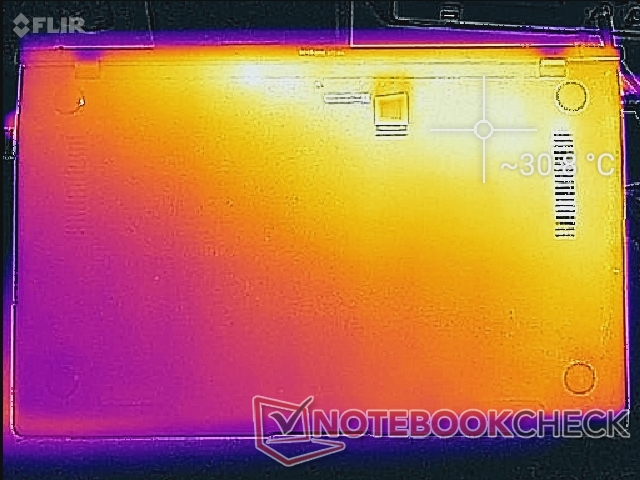
Hot spots can reach over 43 C or 45 C on the WASD keys and bottom plate, respectively, while the palm rests remain cooler. Users can expect a warm notebook when browsing, word processing, or surfing. A more symmetrical temperature gradient like on the HP Spectre x360 13 would have been preferable.
We stress the notebook to identify for any potential throttling or stability issues. When subjected to Prime95 load, we can observe a CPU clock rate as high as 3.9 GHz while core temperature slowly rises to 89 C. Once this threshold is reached, the clock rate begins to alternate between 2.0 GHz and 2.7 GHz in order to keep temperatures in check. Since the base clock rate of the i7-8565U is 1.8 GHz, the CPU in our Asus is able to maintain at least a 200 MHz Turbo Boost at all times when under extreme CPU stress. Our screenshot below shows this in action including the alternating clock rate pattern.
Running Prime95 and FurMark simultaneously to stress both the CPU and iGPU will throttle clock rates even further as the system struggles to satisfy the processing demands.
Running on battery power will impact both CPU and GPU performance. A 3DMark 11 run on batteries returns Physics and Graphics scores 6211 and 1745 points, respectively, compared to 7617 and 1979 points when on mains.
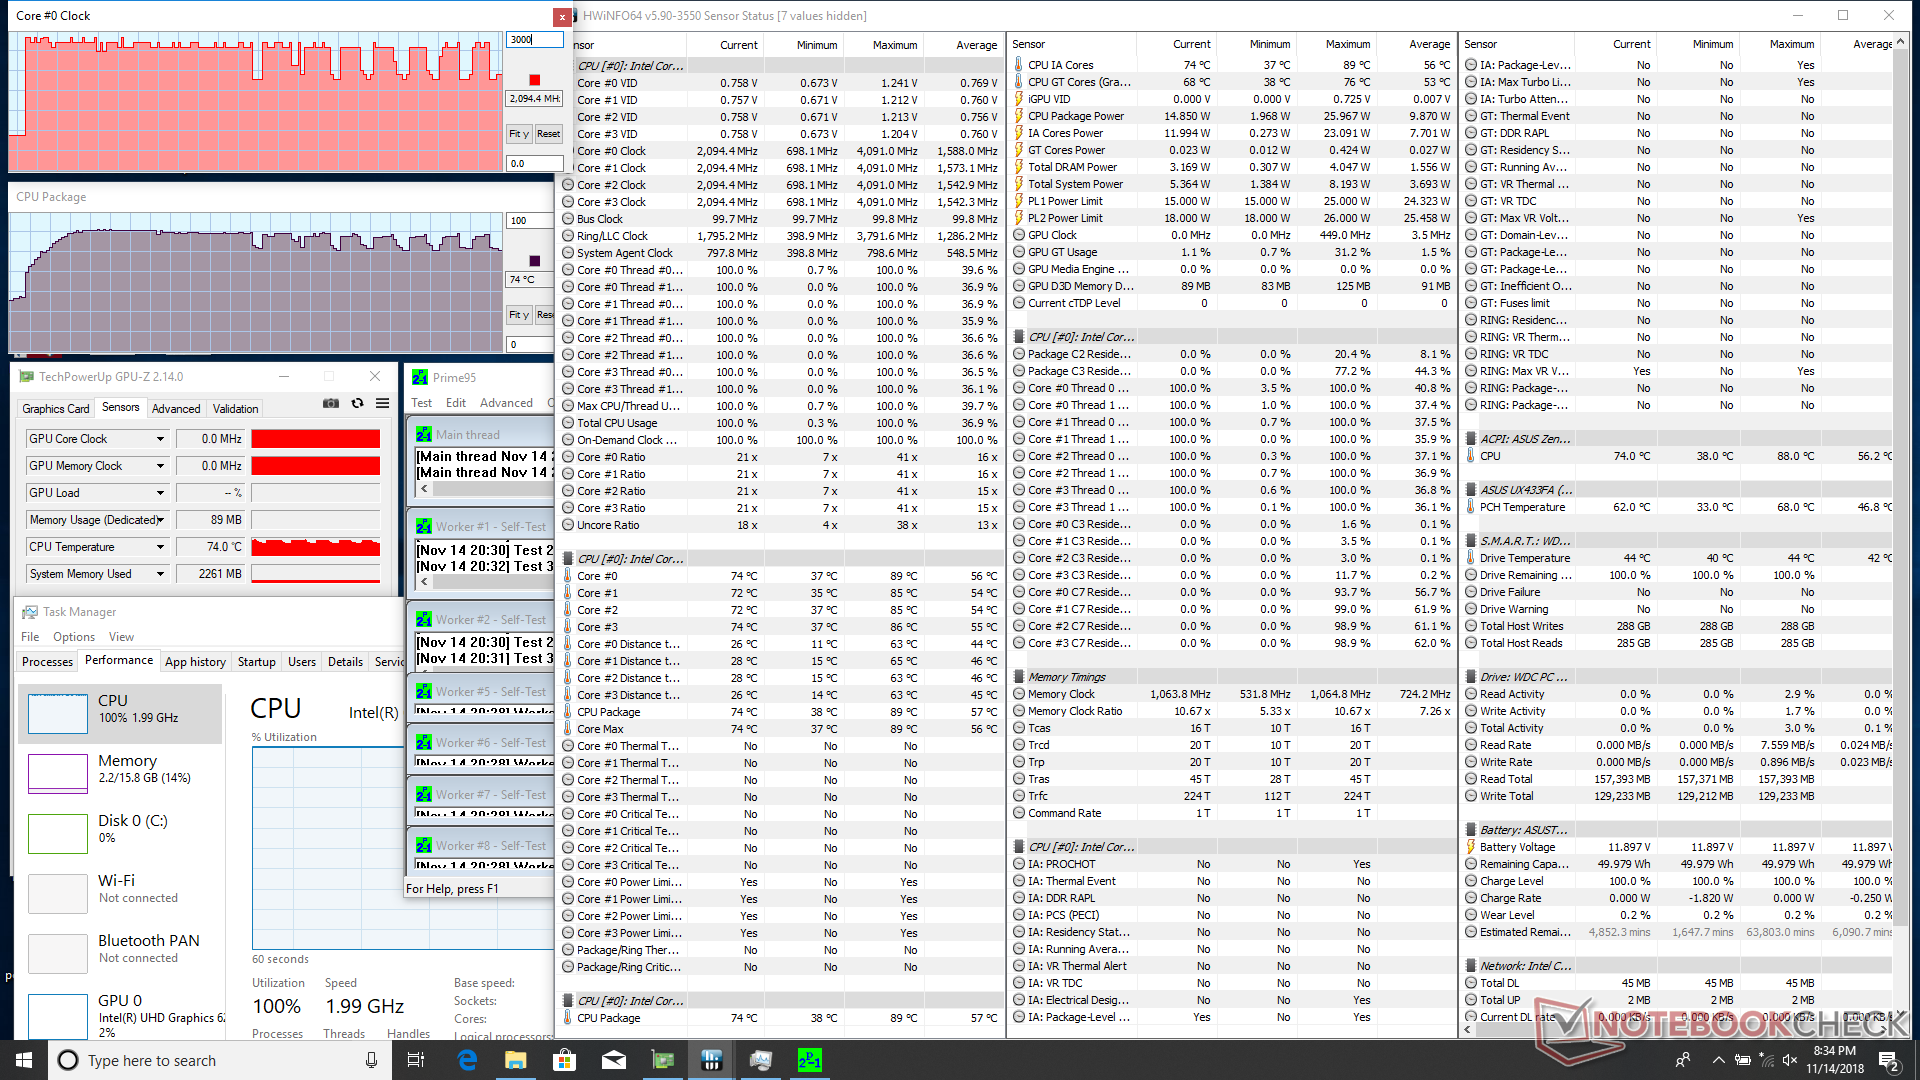
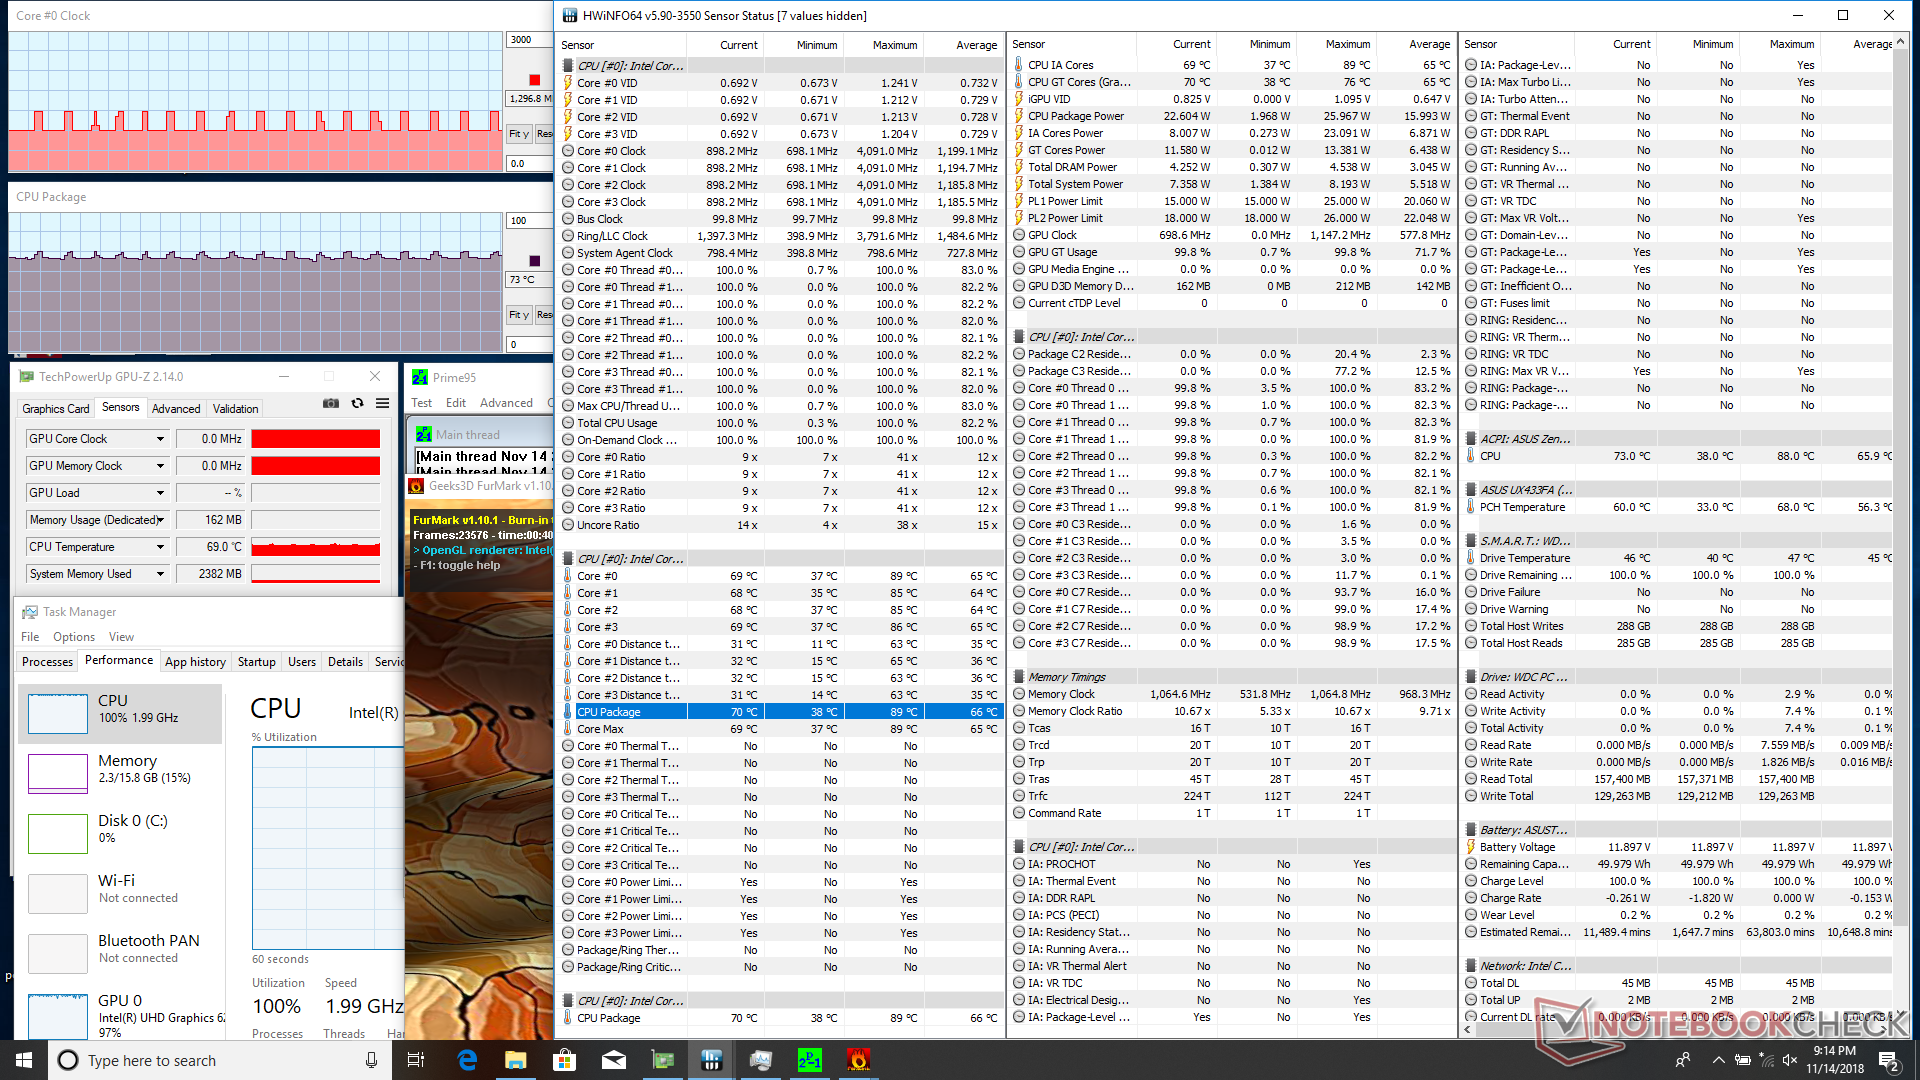
| CPU Clock (GHz) | GPU Clock (MHz) | Average CPU Temperature (°C) | |
| System Idle | -- | -- | 40 |
| Prime95 Stress | 2.0 - 2.7 | -- | 75 - 86 |
| Prime95 + FurMark Stress | 0.9 - 1.3 | -- | 68 - 73 |
(±) The maximum temperature on the upper side is 42.4 °C / 108 F, compared to the average of 35.9 °C / 97 F, ranging from 21.4 to 59 °C for the class Subnotebook.
(±) The bottom heats up to a maximum of 45 °C / 113 F, compared to the average of 39.2 °C / 103 F
(+) In idle usage, the average temperature for the upper side is 28.5 °C / 83 F, compared to the device average of 30.8 °C / 87 F.
(+) The palmrests and touchpad are cooler than skin temperature with a maximum of 31 °C / 87.8 F and are therefore cool to the touch.
(-) The average temperature of the palmrest area of similar devices was 28.2 °C / 82.8 F (-2.8 °C / -5 F).
Speakers
The integrated stereo speakers are louder than on the 2017 Spectre 13 but with average bass reproduction. Higher frequencies are emphasized for an overall "tinny" audio quality that's common amongst small laptops. Higher volume settings do not introduce any static and will reverberate the palm rests just slightly.


Asus ZenBook 14 UX433FA audio analysis
(±) | speaker loudness is average but good (75.8 dB)
Bass 100 - 315 Hz
(±) | reduced bass - on average 13.8% lower than median
(±) | linearity of bass is average (10.6% delta to prev. frequency)
Mids 400 - 2000 Hz
(+) | balanced mids - only 3.4% away from median
(+) | mids are linear (4.8% delta to prev. frequency)
Highs 2 - 16 kHz
(±) | higher highs - on average 5.2% higher than median
(+) | highs are linear (6.1% delta to prev. frequency)
Overall 100 - 16.000 Hz
(±) | linearity of overall sound is average (16.1% difference to median)
Compared to same class
» 39% of all tested devices in this class were better, 4% similar, 57% worse
» The best had a delta of 5%, average was 18%, worst was 53%
Compared to all devices tested
» 26% of all tested devices were better, 5% similar, 69% worse
» The best had a delta of 4%, average was 24%, worst was 134%
Apple MacBook 12 (Early 2016) 1.1 GHz audio analysis
(+) | speakers can play relatively loud (83.6 dB)
Bass 100 - 315 Hz
(±) | reduced bass - on average 11.3% lower than median
(±) | linearity of bass is average (14.2% delta to prev. frequency)
Mids 400 - 2000 Hz
(+) | balanced mids - only 2.4% away from median
(+) | mids are linear (5.5% delta to prev. frequency)
Highs 2 - 16 kHz
(+) | balanced highs - only 2% away from median
(+) | highs are linear (4.5% delta to prev. frequency)
Overall 100 - 16.000 Hz
(+) | overall sound is linear (10.2% difference to median)
Compared to same class
» 7% of all tested devices in this class were better, 2% similar, 91% worse
» The best had a delta of 5%, average was 18%, worst was 53%
Compared to all devices tested
» 5% of all tested devices were better, 1% similar, 94% worse
» The best had a delta of 4%, average was 24%, worst was 134%
Energy Management
Power Consumption
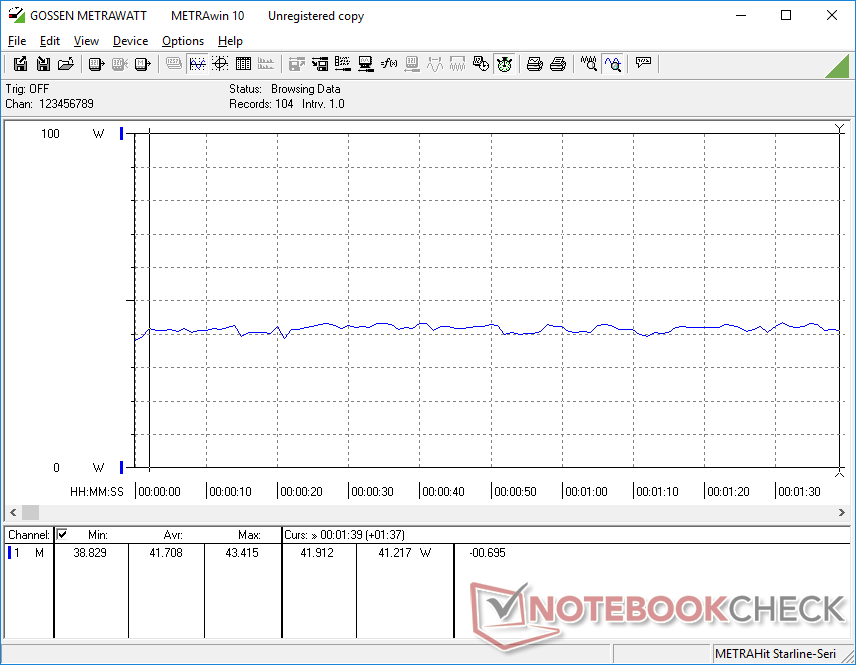
Perhaps the closest system we can compare the UX433 to in terms of power consumption is the 14-inch VivoBook Flip 14 since have 15 W TDP CPUs and no discrete graphics. Even with these constants, however, the VivoBook Flip 14 still comes out to be more power efficient under all tested conditions. Running 3DMark 06 demands 42 W from our UX433 compared to just 33 W on our VivoBook. The new model may be a bit faster, but it also draws a tad bit more power in the process.
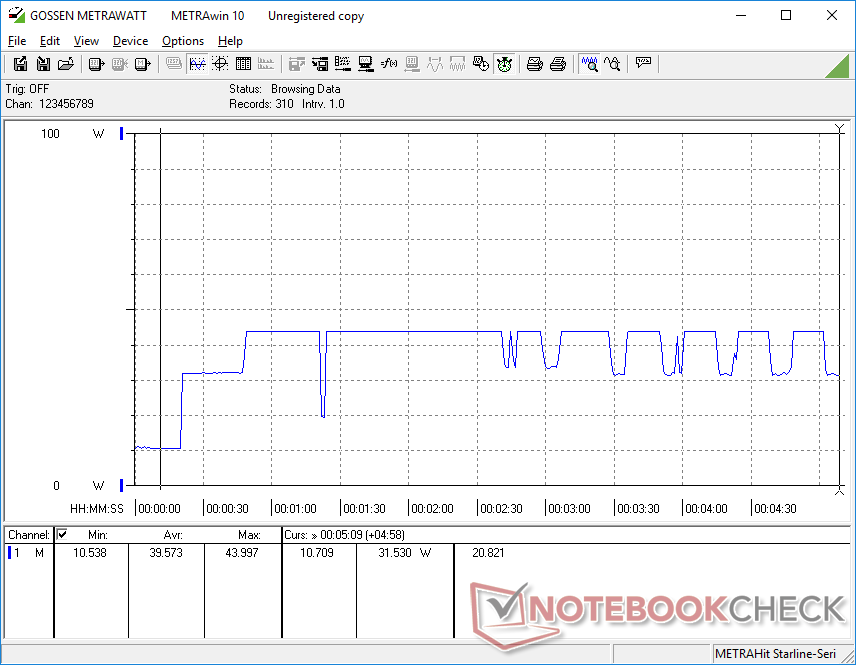
The highest consumption we can record is 44 W from the very small (~5.4 x 5.4 x 2.8 cm) 45 W AC adapter. This maximum draw is unsustainable over long periods of extreme stress because the system eventually throttles as shown by our graph below. The alternating power consumption behavior mirrors our clock rate observations during the stress test above.
| Off / Standby | |
| Idle | |
| Load |
|
Key:
min: | |
| Asus ZenBook 14 UX433FA i7-8565U, UHD Graphics 620, WDC PC SN520 SDAPNUW-512G, IPS, 1920x1080, 14" | Dell XPS 13 9370 i7 UHD i5-8550U, UHD Graphics 620, Toshiba XG5 KXG50ZNV512G, IPS, 3840x2160, 13.3" | Huawei Matebook X Pro i5 i5-8250U, GeForce MX150, Samsung PM961 MZVLW256HEHP, IPS, 3000x2000, 13.9" | Lenovo Yoga C930-13IKB 81C4 i5-8550U, UHD Graphics 620, SK hynix PC401 HFS256GD9TNG, IPS, 1920x1080, 13.9" | Asus Zenbook UX430UN i5-8550U, GeForce MX150, SanDisk SD8SN8U512G1002, IPS, 1920x1080, 14" | HP Spectre x360 13-ae048ng i5-8550U, UHD Graphics 620, Toshiba NVMe THNSN51T02DUK, IPS, 1920x1080, 13.3" | |
|---|---|---|---|---|---|---|
| Power Consumption | -18% | -26% | -21% | -1% | 12% | |
| Idle Minimum * (Watt) | 3.9 | 5 -28% | 3.5 10% | 3.4 13% | 3 23% | 3.2 18% |
| Idle Average * (Watt) | 5.9 | 8.3 -41% | 8.9 -51% | 7.5 -27% | 5.8 2% | 6 -2% |
| Idle Maximum * (Watt) | 8.8 | 8.8 -0% | 12.3 -40% | 11.8 -34% | 6.2 30% | 9.2 -5% |
| Load Average * (Watt) | 41.7 | 46.4 -11% | 54.2 -30% | 47.7 -14% | 54.1 -30% | 29.5 29% |
| Load Maximum * (Watt) | 44 | 48.6 -10% | 52.1 -18% | 63.2 -44% | 56.4 -28% | 35.6 19% |
| Witcher 3 ultra * (Watt) | 42.4 | 45.9 |
* ... smaller is better
Battery Life
Battery capacity remains unchanged from the UX430. Nonetheless, battery life is excellent at over 10 hours of constant WLAN use to be comparable to the MateBook X Pro. Charging from near empty to full capacity is slow at about 2 to 2.5 hours compared to 1.5 hours on most competing Ultrabooks.
| Asus ZenBook 14 UX433FA i7-8565U, UHD Graphics 620, 50 Wh | Apple MacBook Air 2018 i5-8210Y, UHD Graphics 617, 50.3 Wh | Dell XPS 13 9370 i7 UHD i5-8550U, UHD Graphics 620, 52 Wh | Huawei Matebook X Pro i5 i5-8250U, GeForce MX150, 57.4 Wh | Lenovo Yoga C930-13IKB 81C4 i5-8550U, UHD Graphics 620, 60 Wh | Asus Zenbook UX430UN i5-8550U, GeForce MX150, 50 Wh | HP Spectre x360 13-ae048ng i5-8550U, UHD Graphics 620, 60 Wh | |
|---|---|---|---|---|---|---|---|
| Battery runtime | -14% | -33% | -12% | 6% | -24% | -16% | |
| Reader / Idle (h) | 19.1 | 13.7 -28% | 20.7 8% | 17.3 -9% | |||
| WiFi v1.3 (h) | 10.5 | 11.1 6% | 7.8 -26% | 9.3 -11% | 11.1 6% | 9.3 -11% | 8.8 -16% |
| Load (h) | 3.3 | 2.2 -33% | 1.8 -45% | 2.2 -33% | 1.6 -52% | 2.8 -15% |
Verdict
Pros
Cons
The Ultrabook market has been steadily growing in terms of options and it's becoming more challenging for OEMs to set themselves apart from one another. Even so, Asus is still managing to surprise us with unique features like the UX580 ScreenPad and now the four-sided NanoEdge bezels that give the UX433 a very small footprint for the 14-inch screen size. The new design is visually distinct and uniquely Zenbook while improving upon rigidity and connectivity from the last generation. It's an evolutionary upgrade that we've come to expect but with a defining characteristic that's both visually striking and ergonomic.
We especially appreciate that the UX433 includes anti-glare matte and glossy panel options and an eventual GeForce MX150 SKU. Most Ultrabooks have glossy displays only and are limited to slower integrated Intel graphics.
The weakest feature of the UX433 is CPU performance. It's not the speed that's disappointing, but it's how marginal of a boost Whiskey Lake-U provides over 8th gen Kaby Lake-R to the point where users will not likely notice any performance gains. Even Asus knows this as the official UX433 product page is comparing Whiskey Lake-U to 7th gen Kaby Lake instead of 8th gen Kaby Lake-R in order to advertise a larger jump in CPU power. We can't help but feel that the system could have been cheaper and just as fast had it shipped with the i7-8550U or i5-8250U instead.
For future iterations, we'd like to see Thunderbolt 3 and a brighter display to better compete against popular alternatives like the XPS 13, MateBook X Pro, MacBook Pro 13, Samsung NP900, and others that may be easier to see in an outdoor setting. Asus should move away from the proprietary AC adapter port and adopt the more versatile USB Type-C charging as well. Haptic feedback for the virtual NumPad, a fingerprint reader, and a spill-proof keyboard are just a handful of missing features the manufacturer could consider to make the UX433 an even better value.
A visual and quality upgrade from the last generation UX430. The system feels strong for the size even though it omits some features commonly found on other ultrabooks in its price range. The boost in CPU power from Whiskey Lake-U will be much greater if users are upgrading from laptops that are at least two or three years old.
Asus ZenBook 14 UX433FA
- 11/20/2018 v6 (old)
Allen Ngo
Price comparison
