HP Pavilion 14 (i7-8550U, MX150) Laptop Review
HP equips its latest 14-inch Pavilion with an eighth-generation Intel Core i7-8550U processor and an Nvidia GeForce MX150 dedicated GPU in a modern case. We are particularly interested at seeing how our test device performs as its powerful components can sometimes prove too much for a 14-inch case. Hence, we are looking forward to seeing how our test device performs in stress tests.
We have chosen to compare the new HP Pavilion 14-ce0002ng against the ASUS ZenBook UX430UN, the Huawei MateBook X Pro, the HP Pavilion 15, the HP Spectre x360 and the Lenovo ThinkPad T480s. All our comparison devices are equipped with Core i7-8550U processors, except for the Pavilion 15, which is powered by an AMD Ryzen 5 2500U APU.
Case
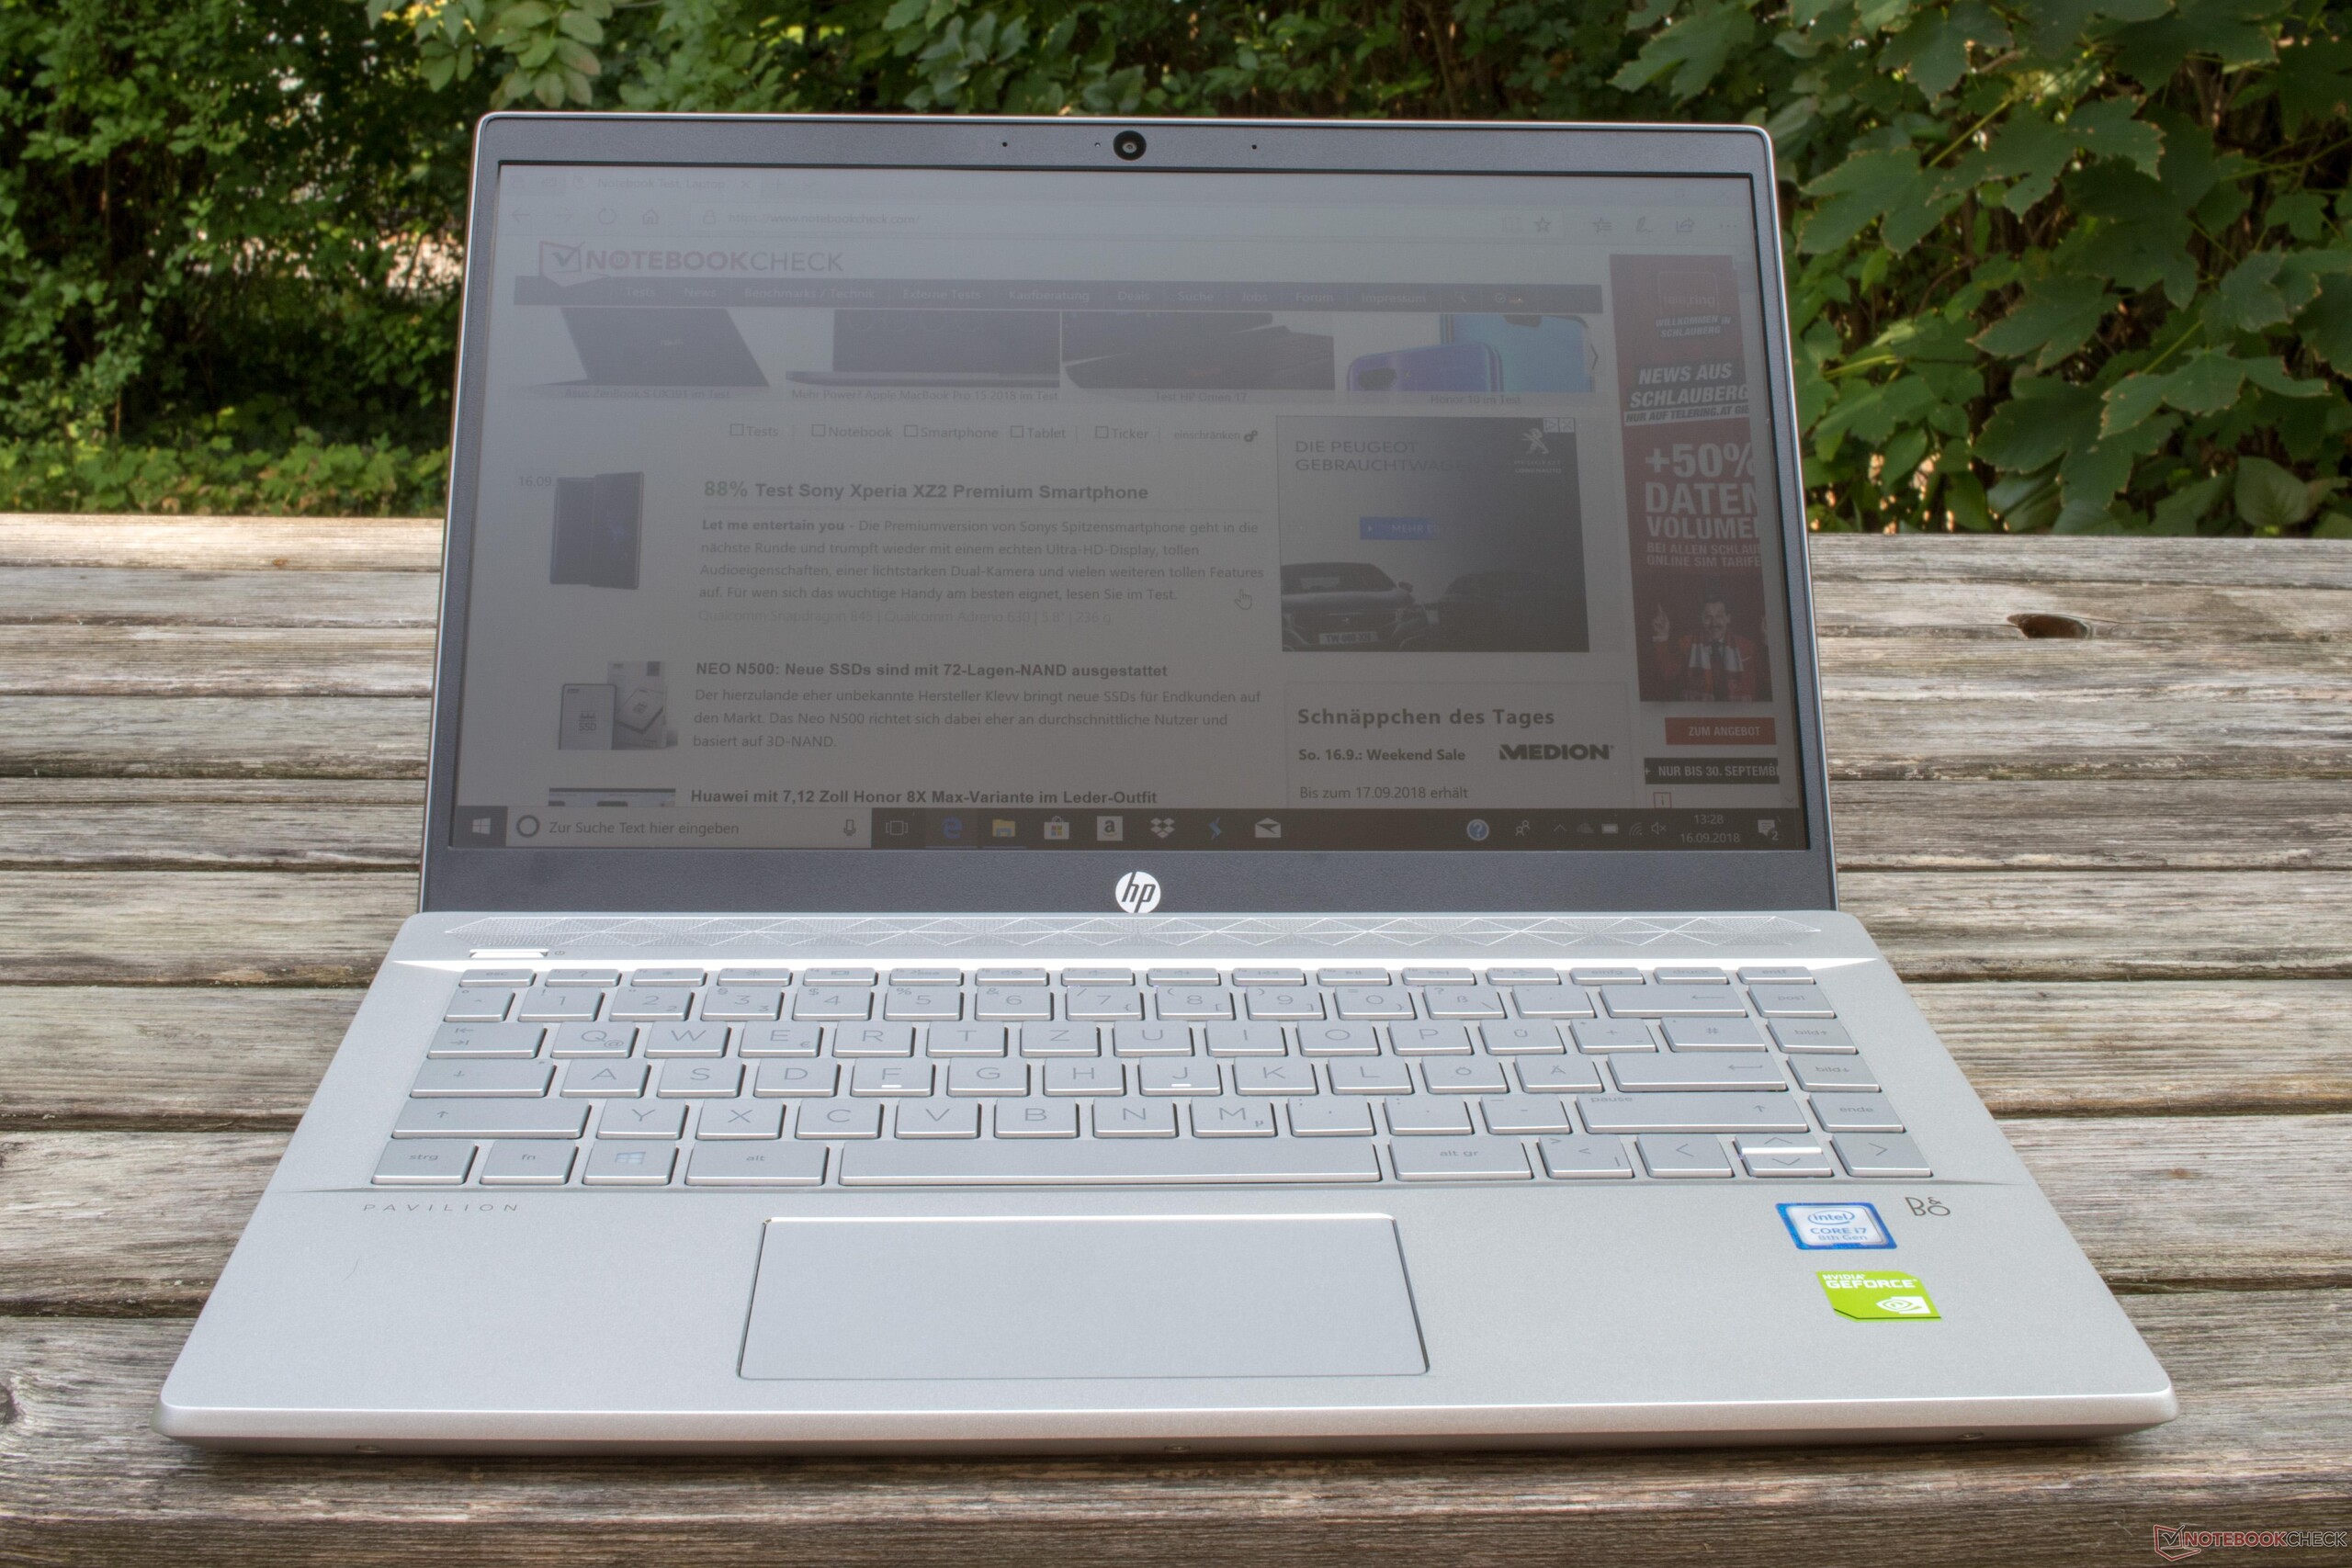
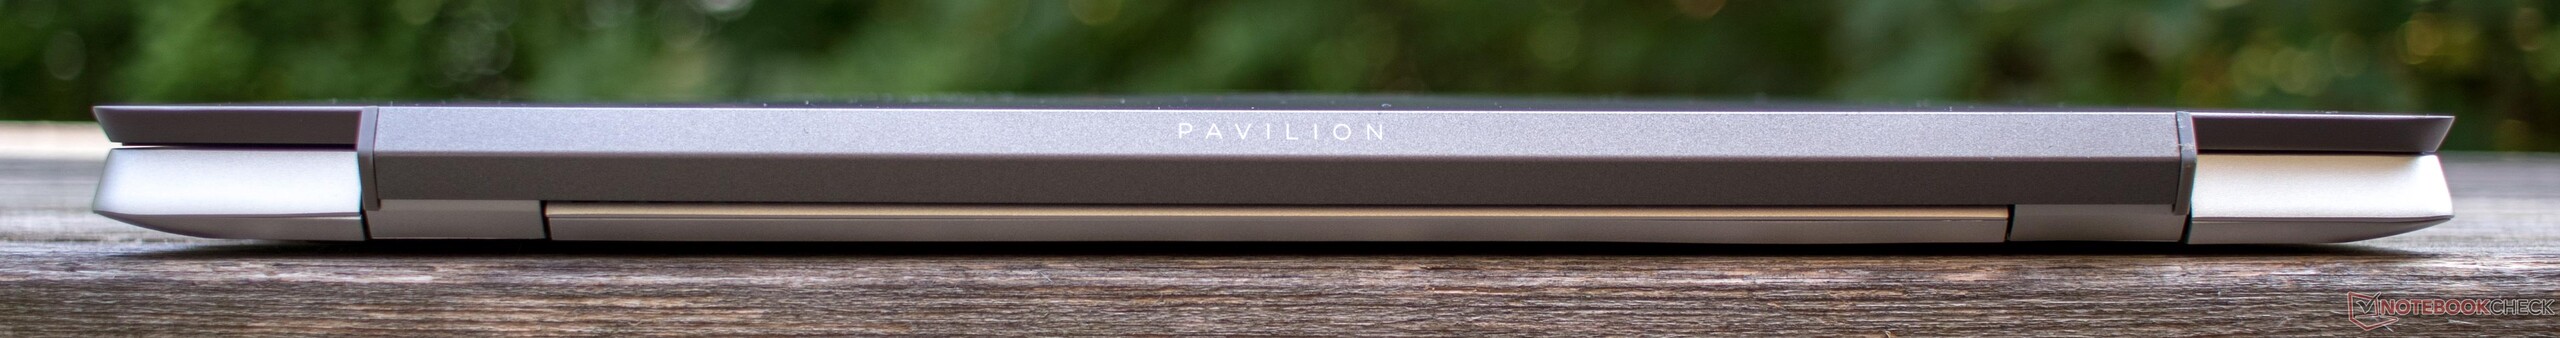
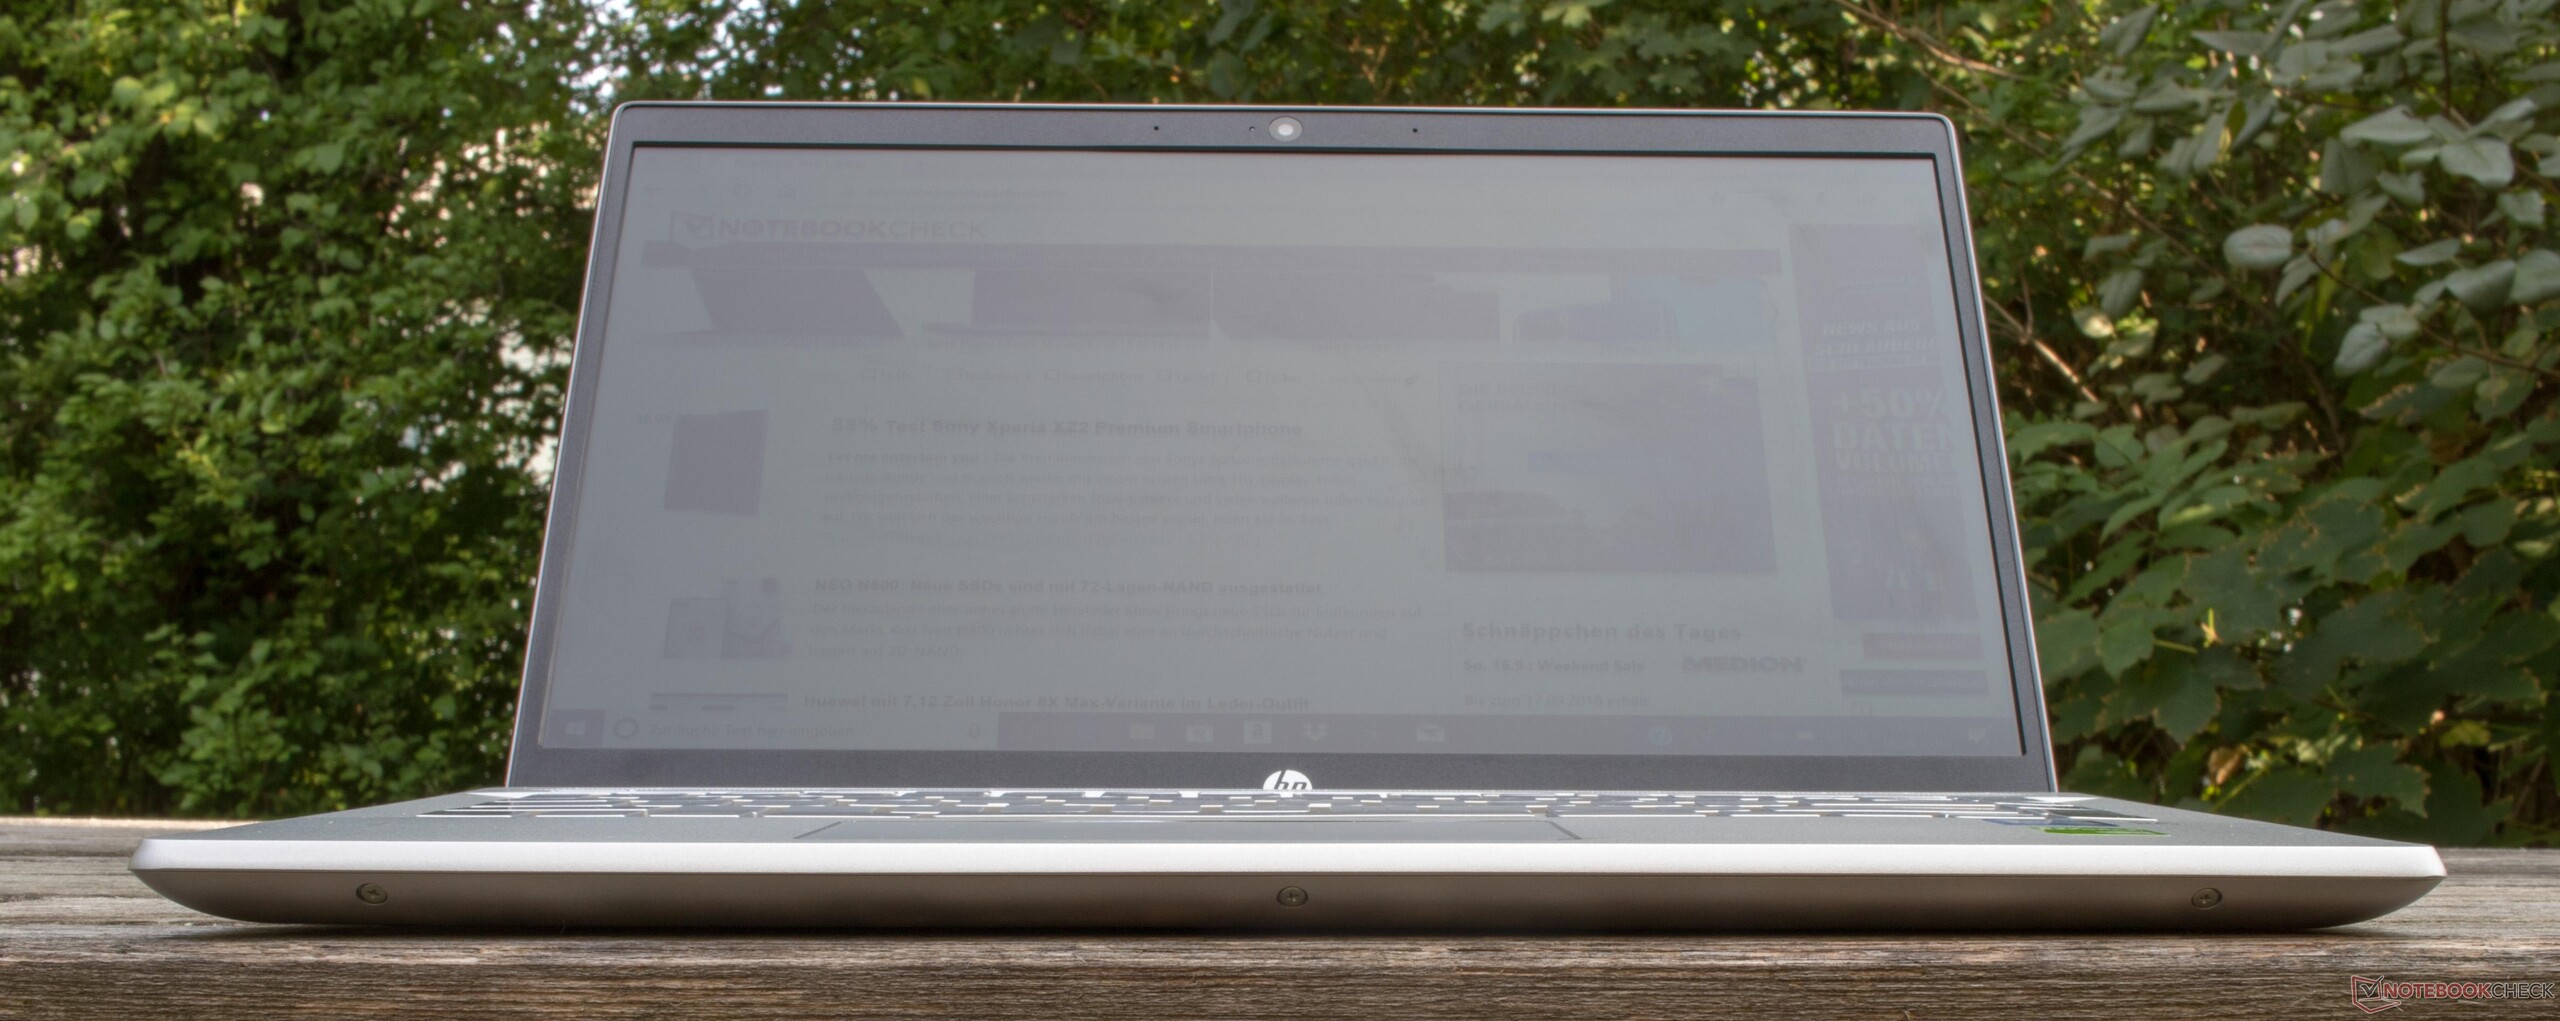
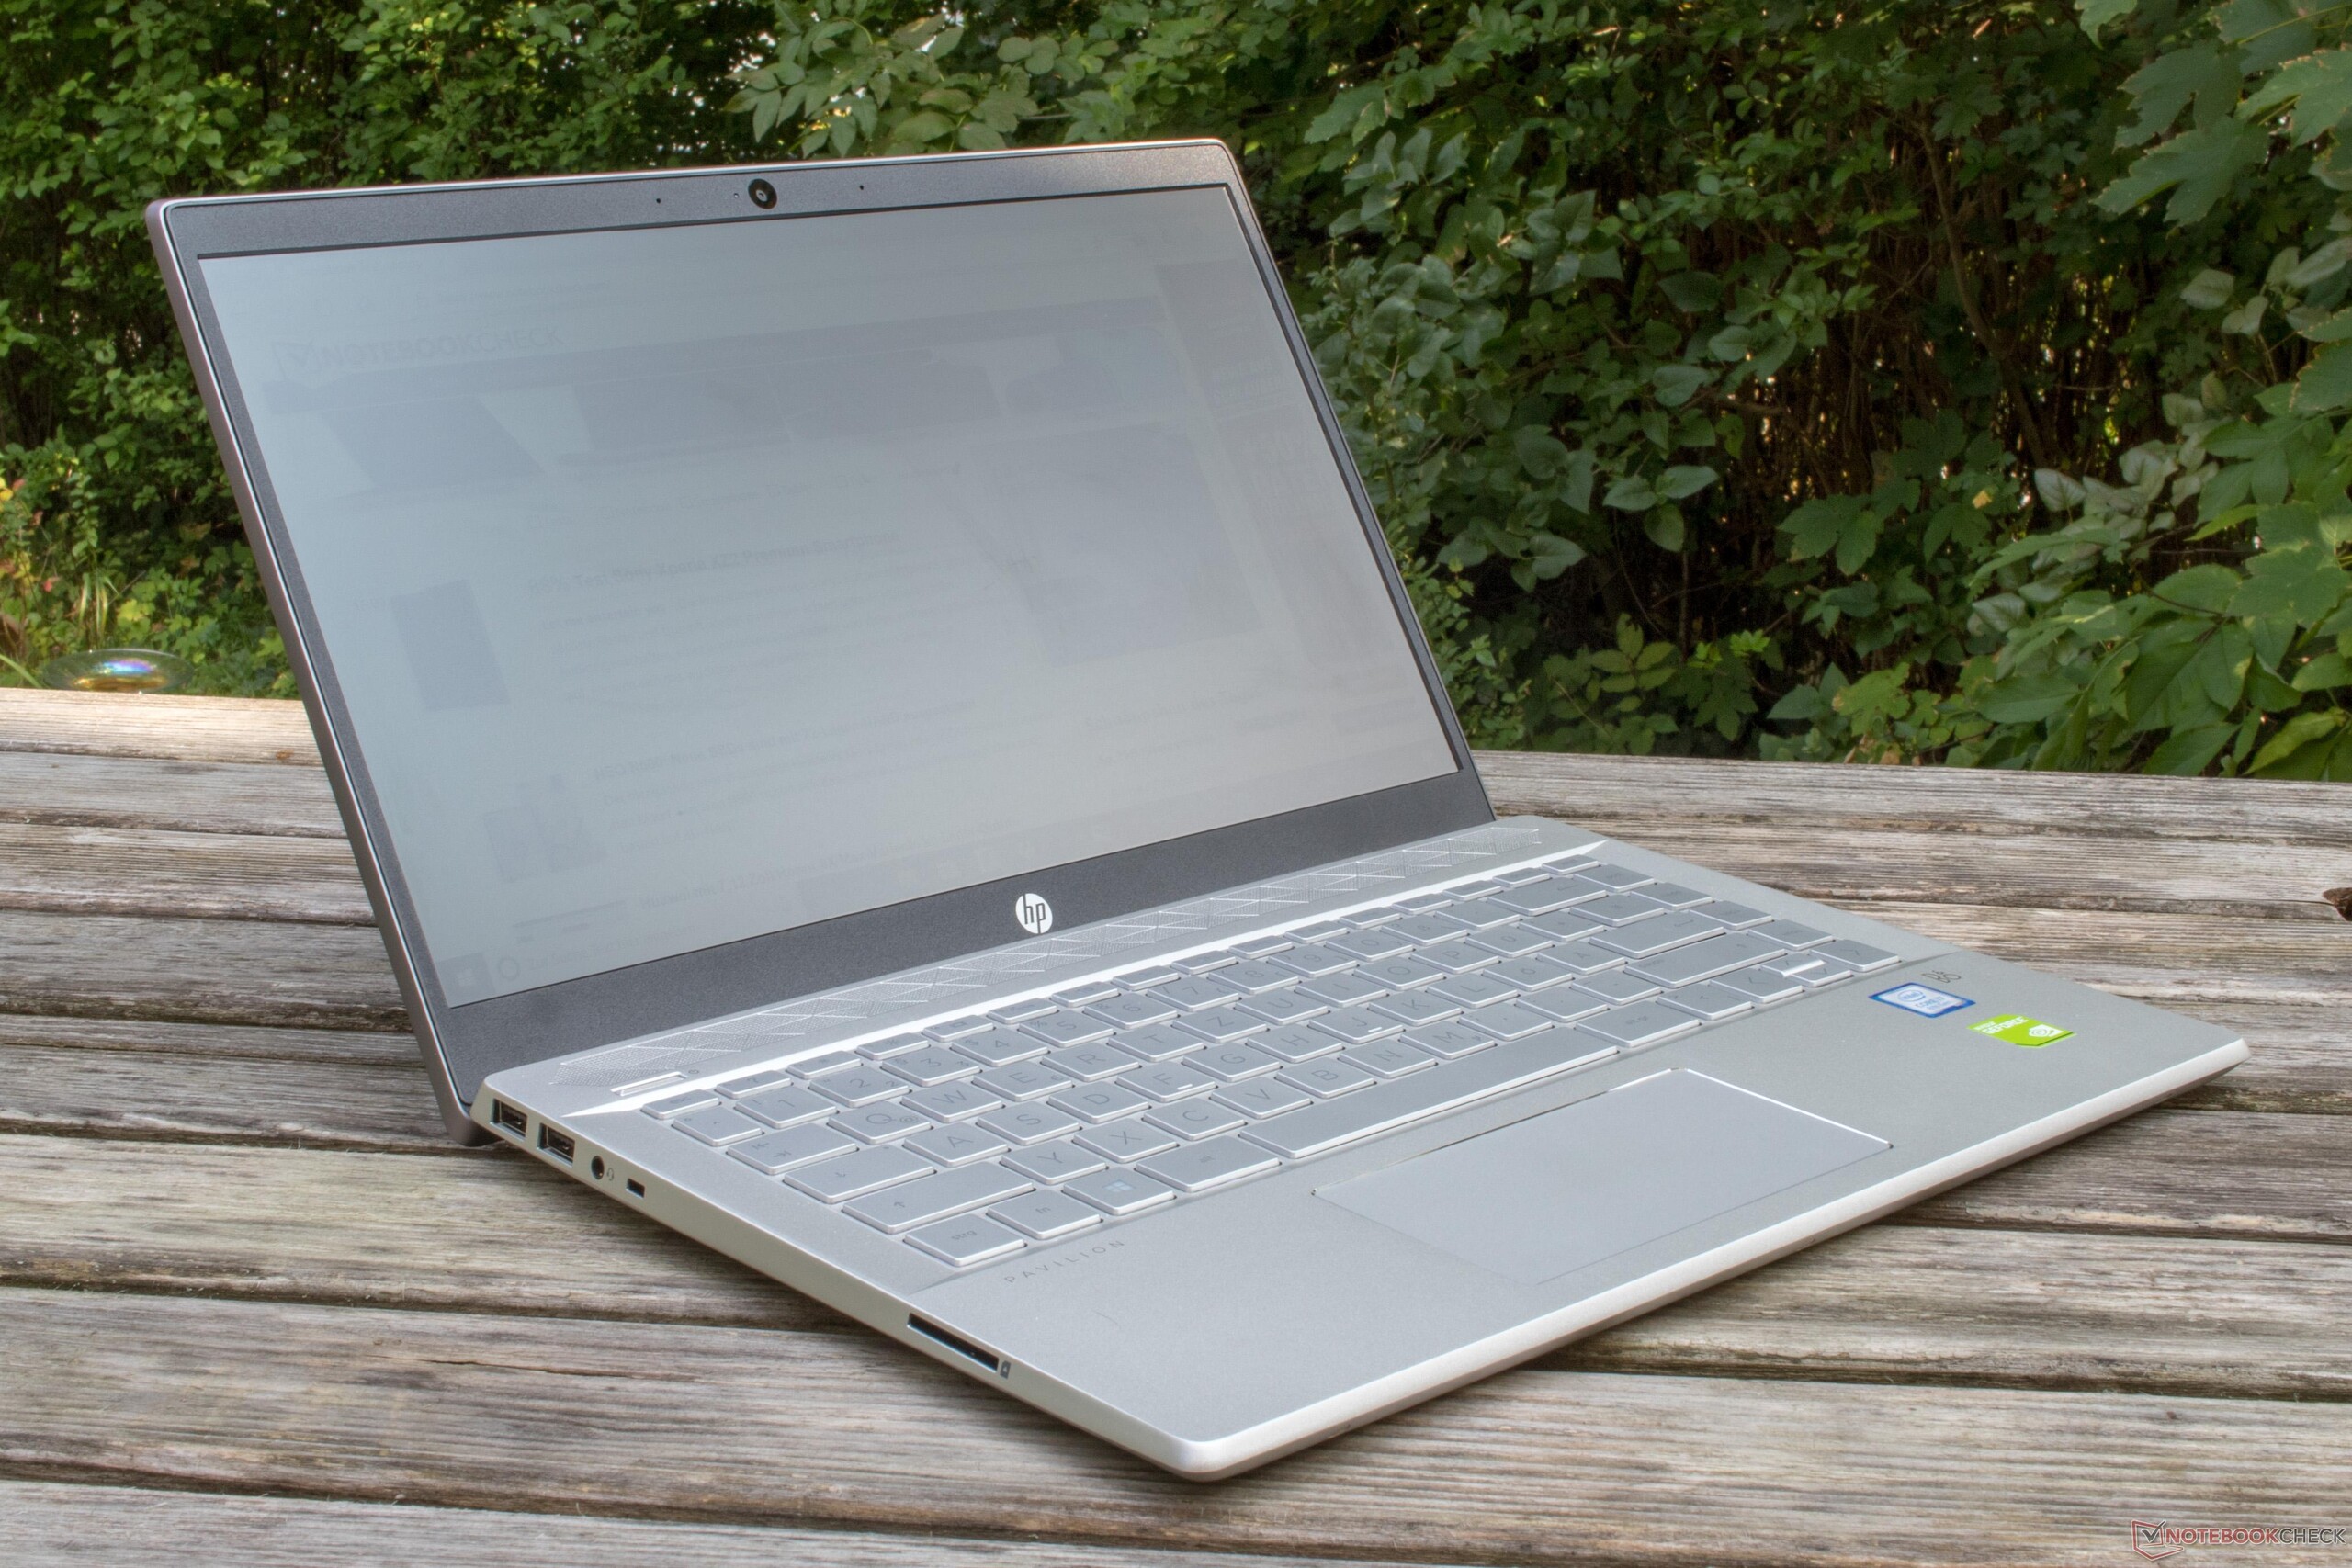
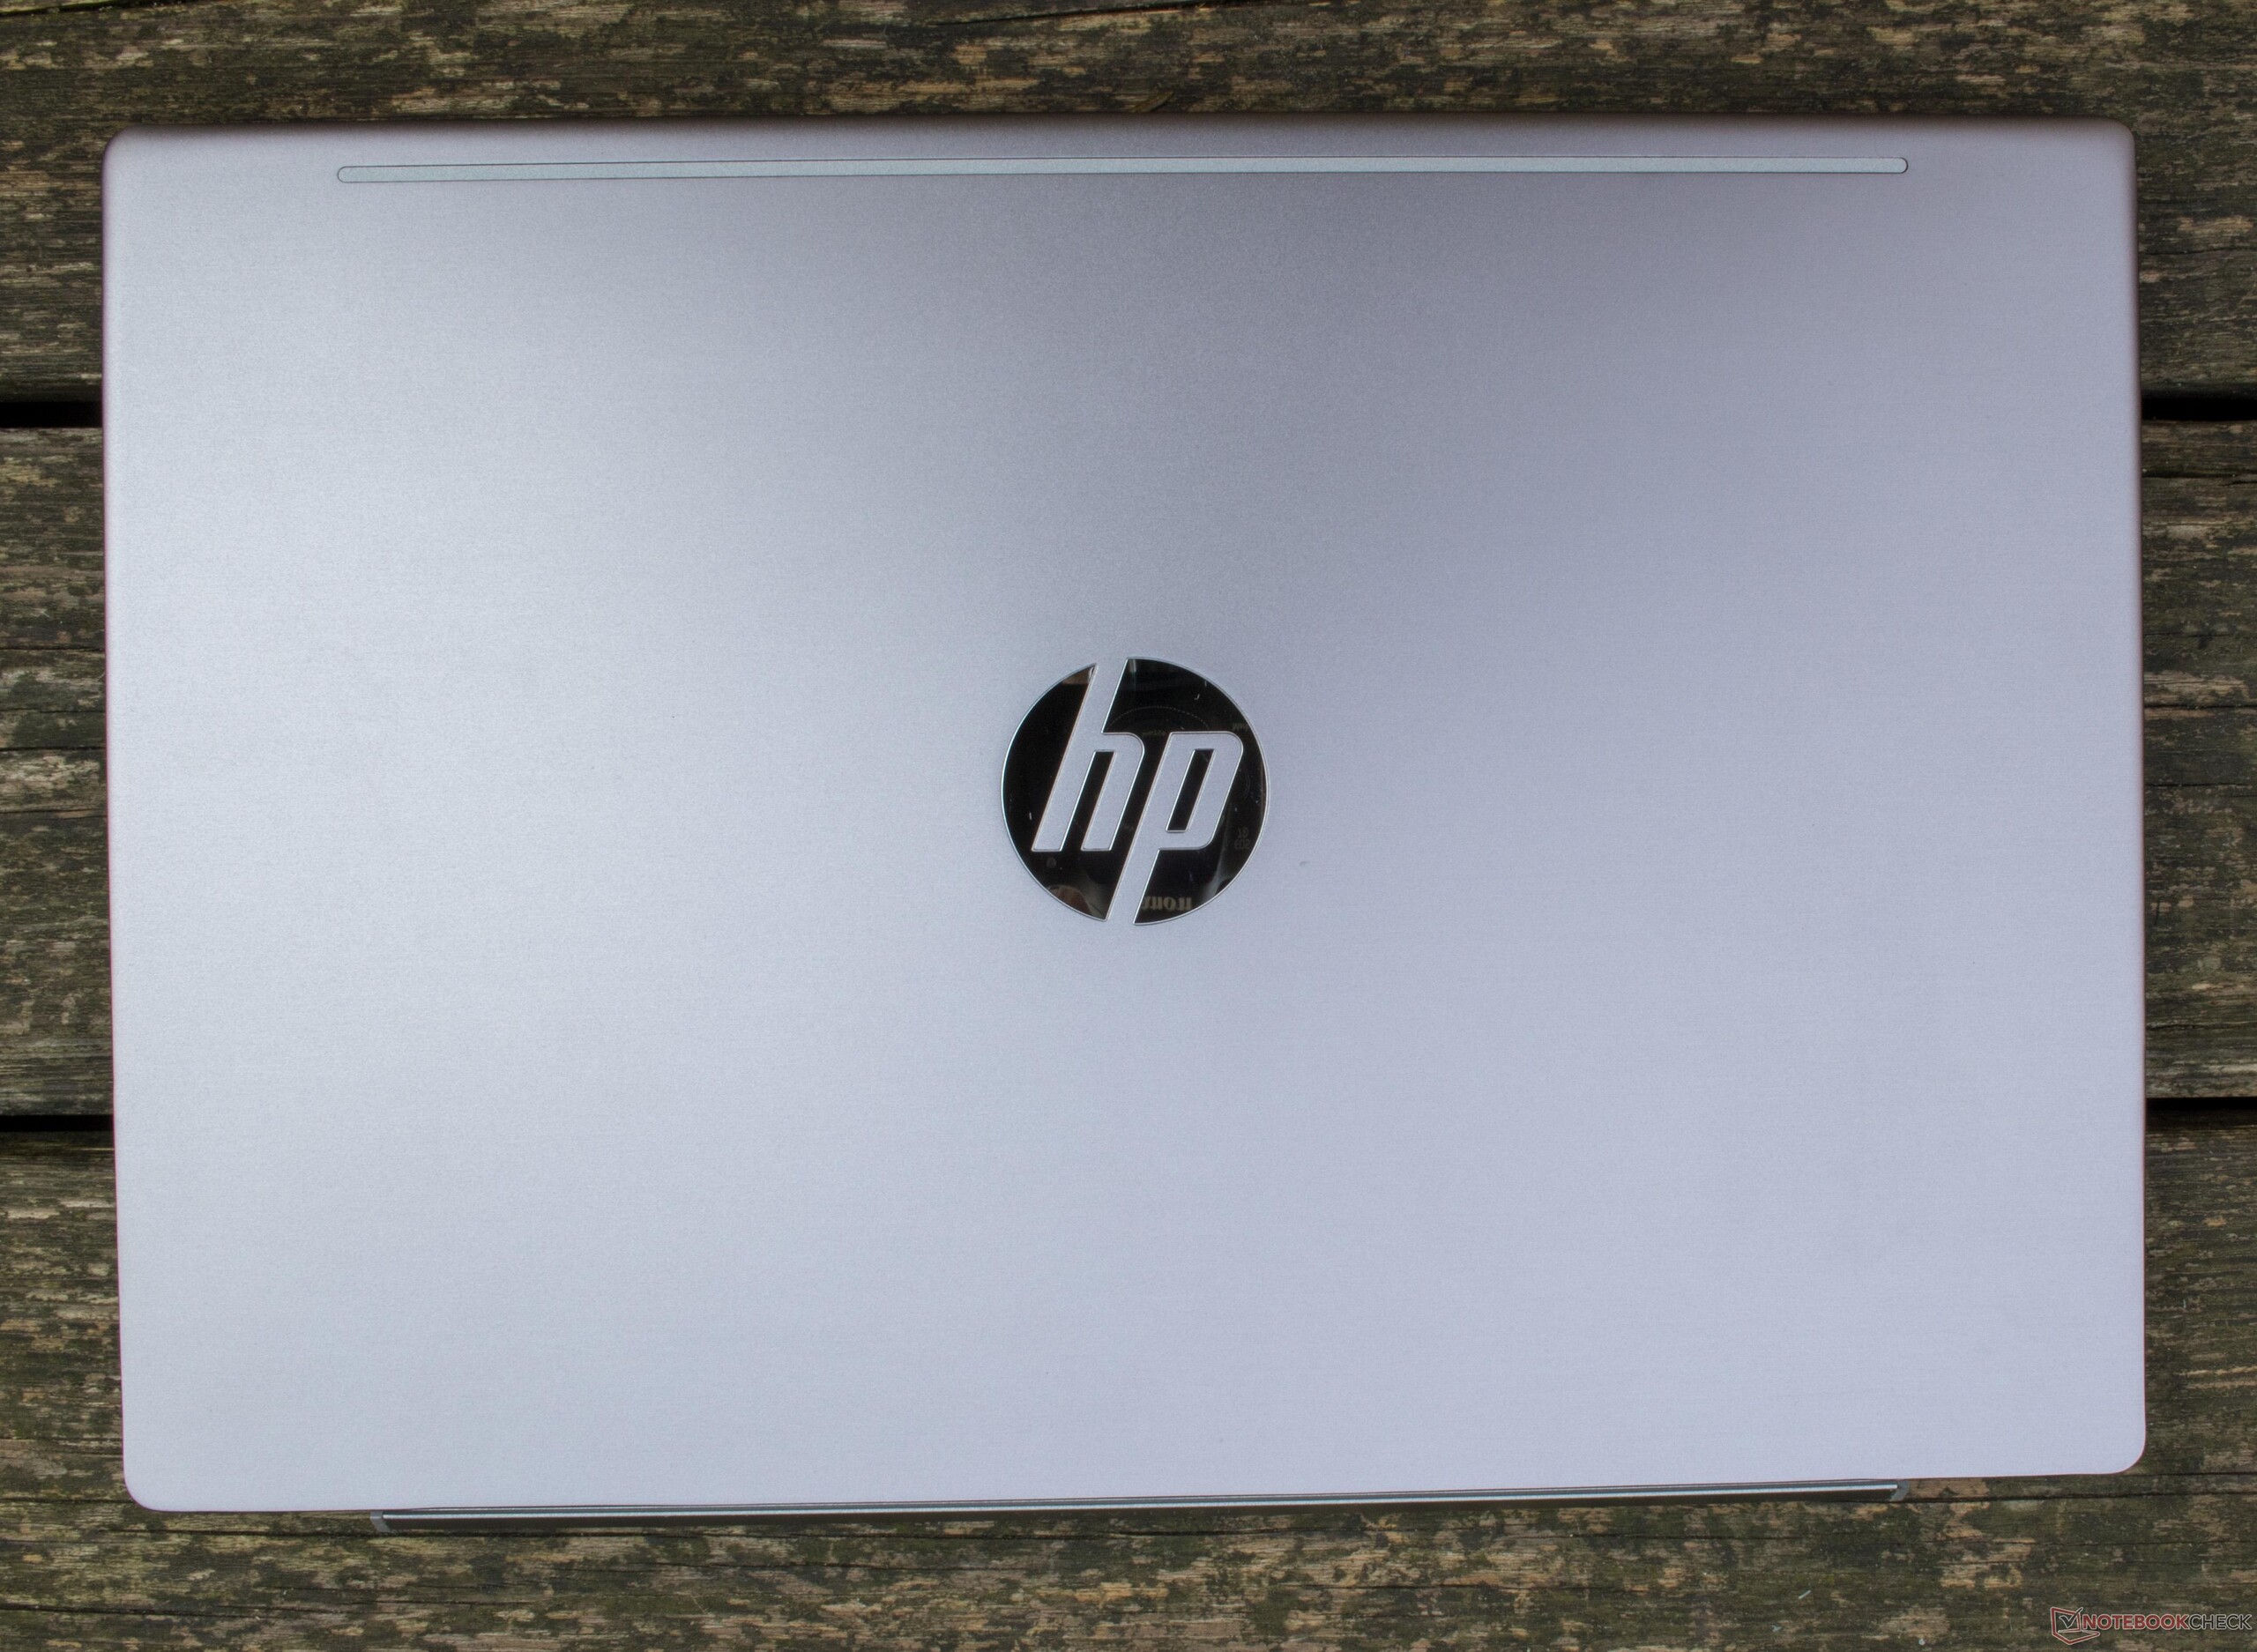
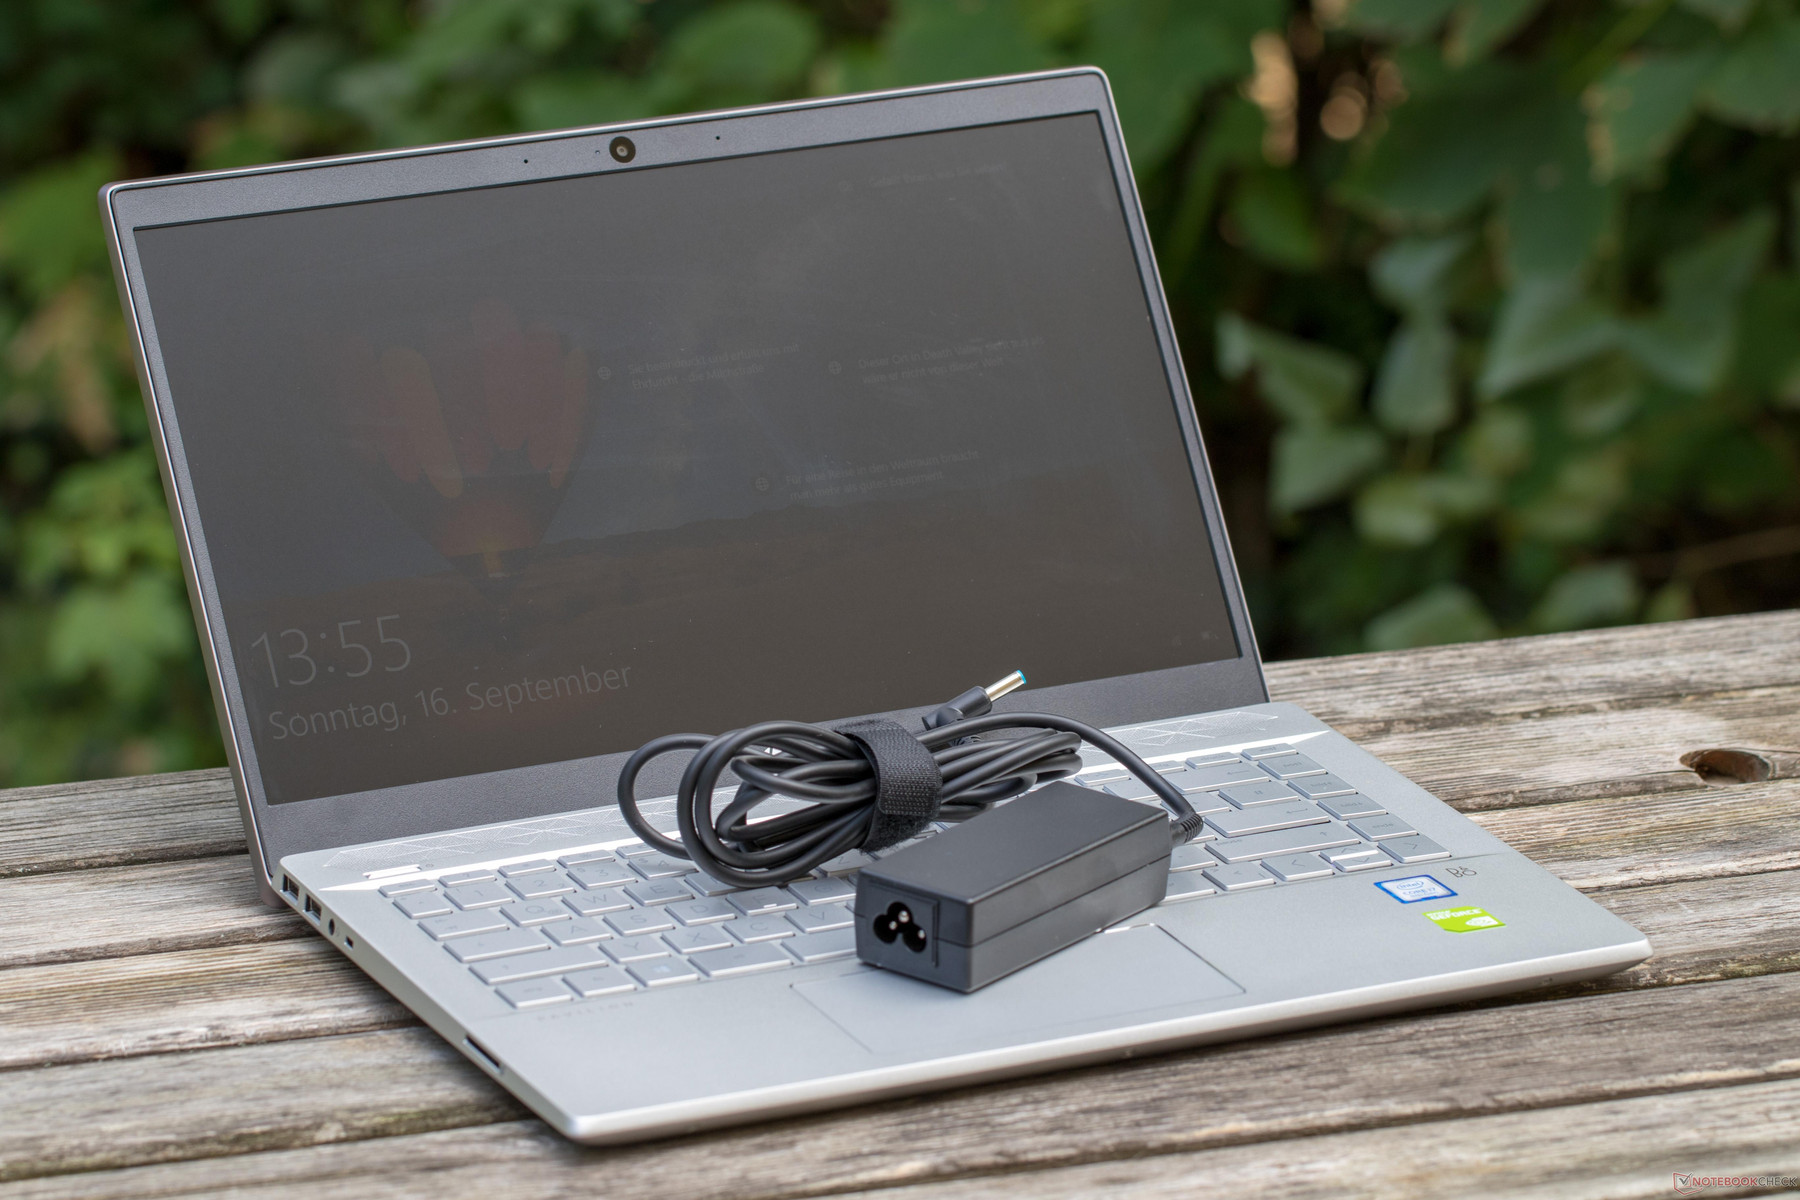
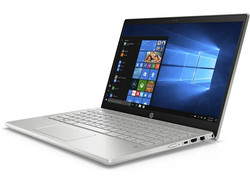
HP has now extended its sleek design aesthetic to the Pavilion 14, which looks modern with its sharp lines, rounded corners and narrow display bezels. Our test device has considerably smaller bezels than previous models thanks to HP’s Micro-Edge display and no longer resembles an old TV. The entire keyboard is recessed around two millimeters within the case so that it is level with the trackpad. Moreover, the speaker grille has a check design reminiscent of the HP Envy that we also recently reviewed. The sides of the case also taper inwards but without looking fussy or ostentatious.
HP has used premium materials that help make our test device feel sturdy. The display bezel and bottom case are made of plastic like previous models, but the display lid and keyboard deck are covered in a sandblasted, anodized metal case. Overall, our test device is well-built; only the bottom case creaks when we apply pressure to the case.
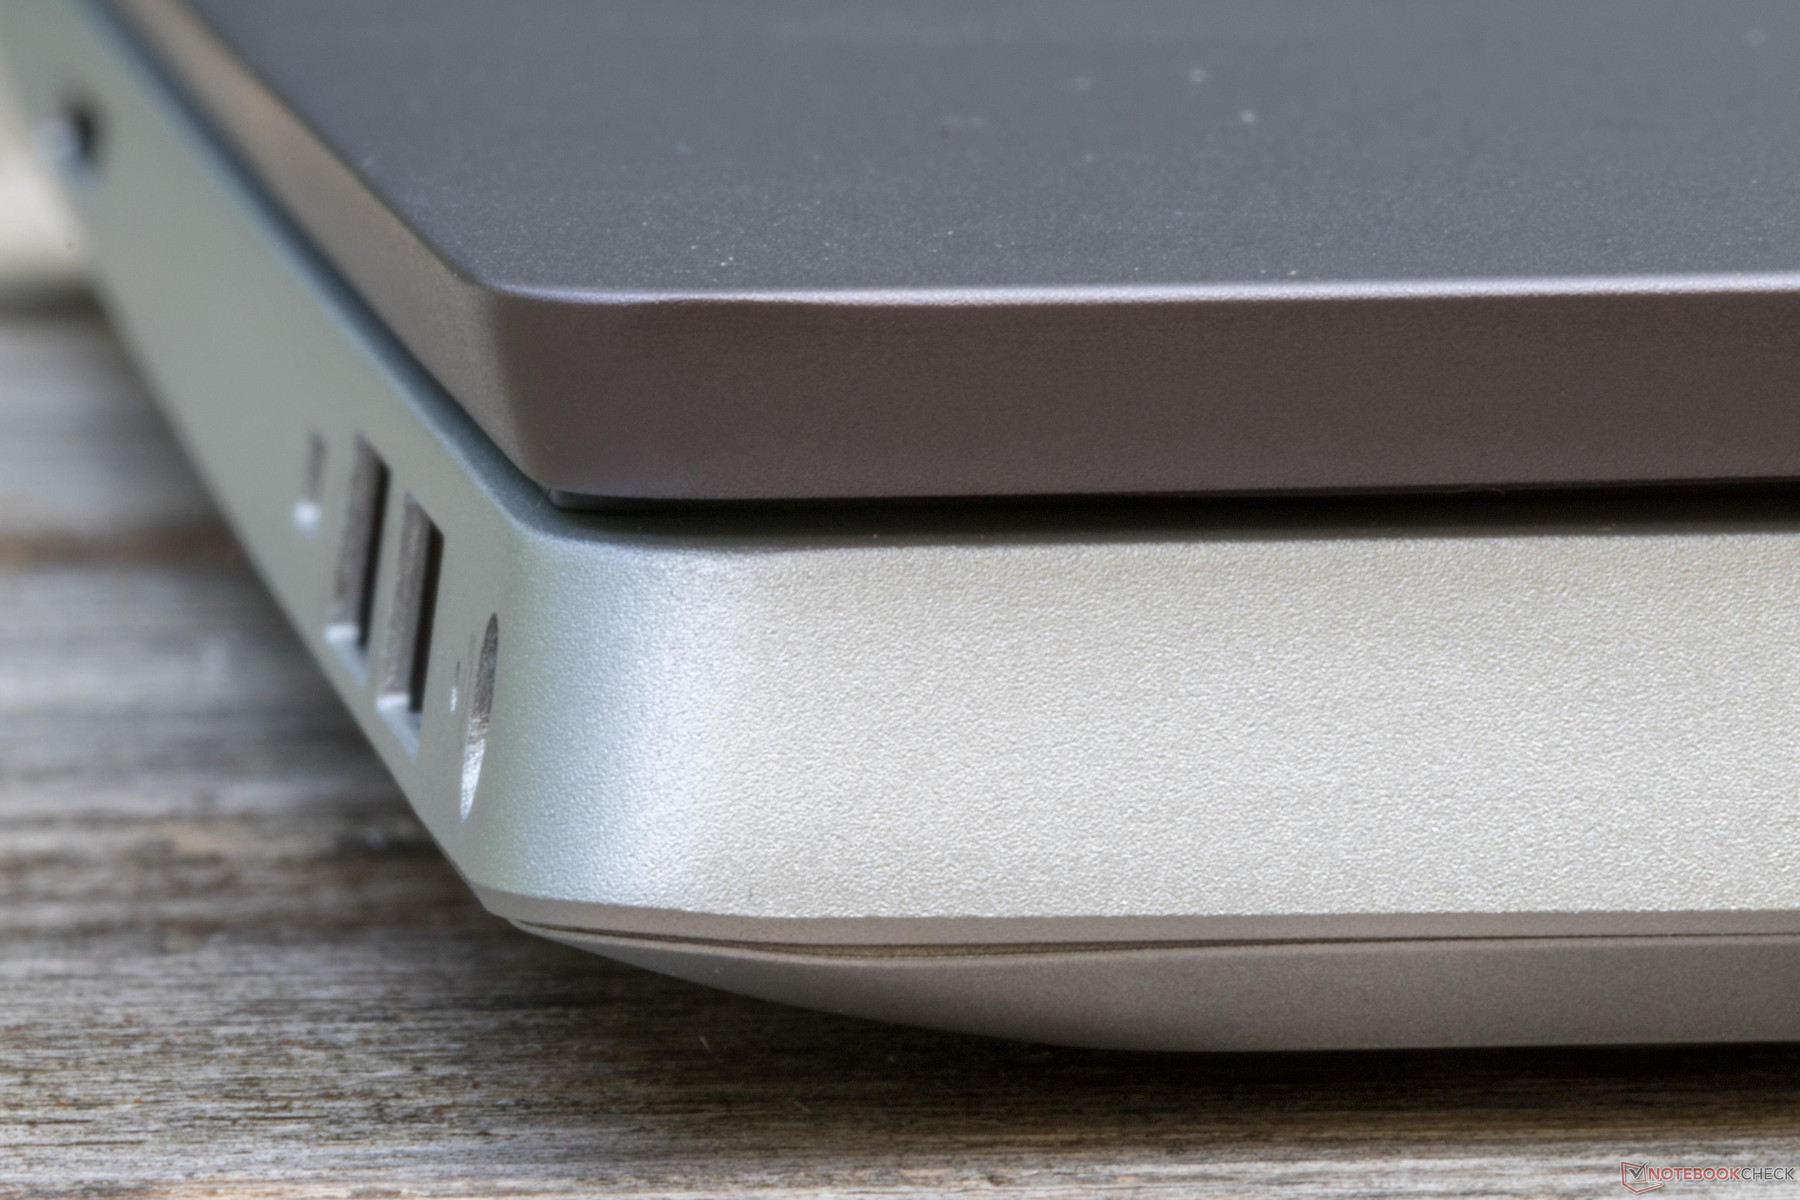
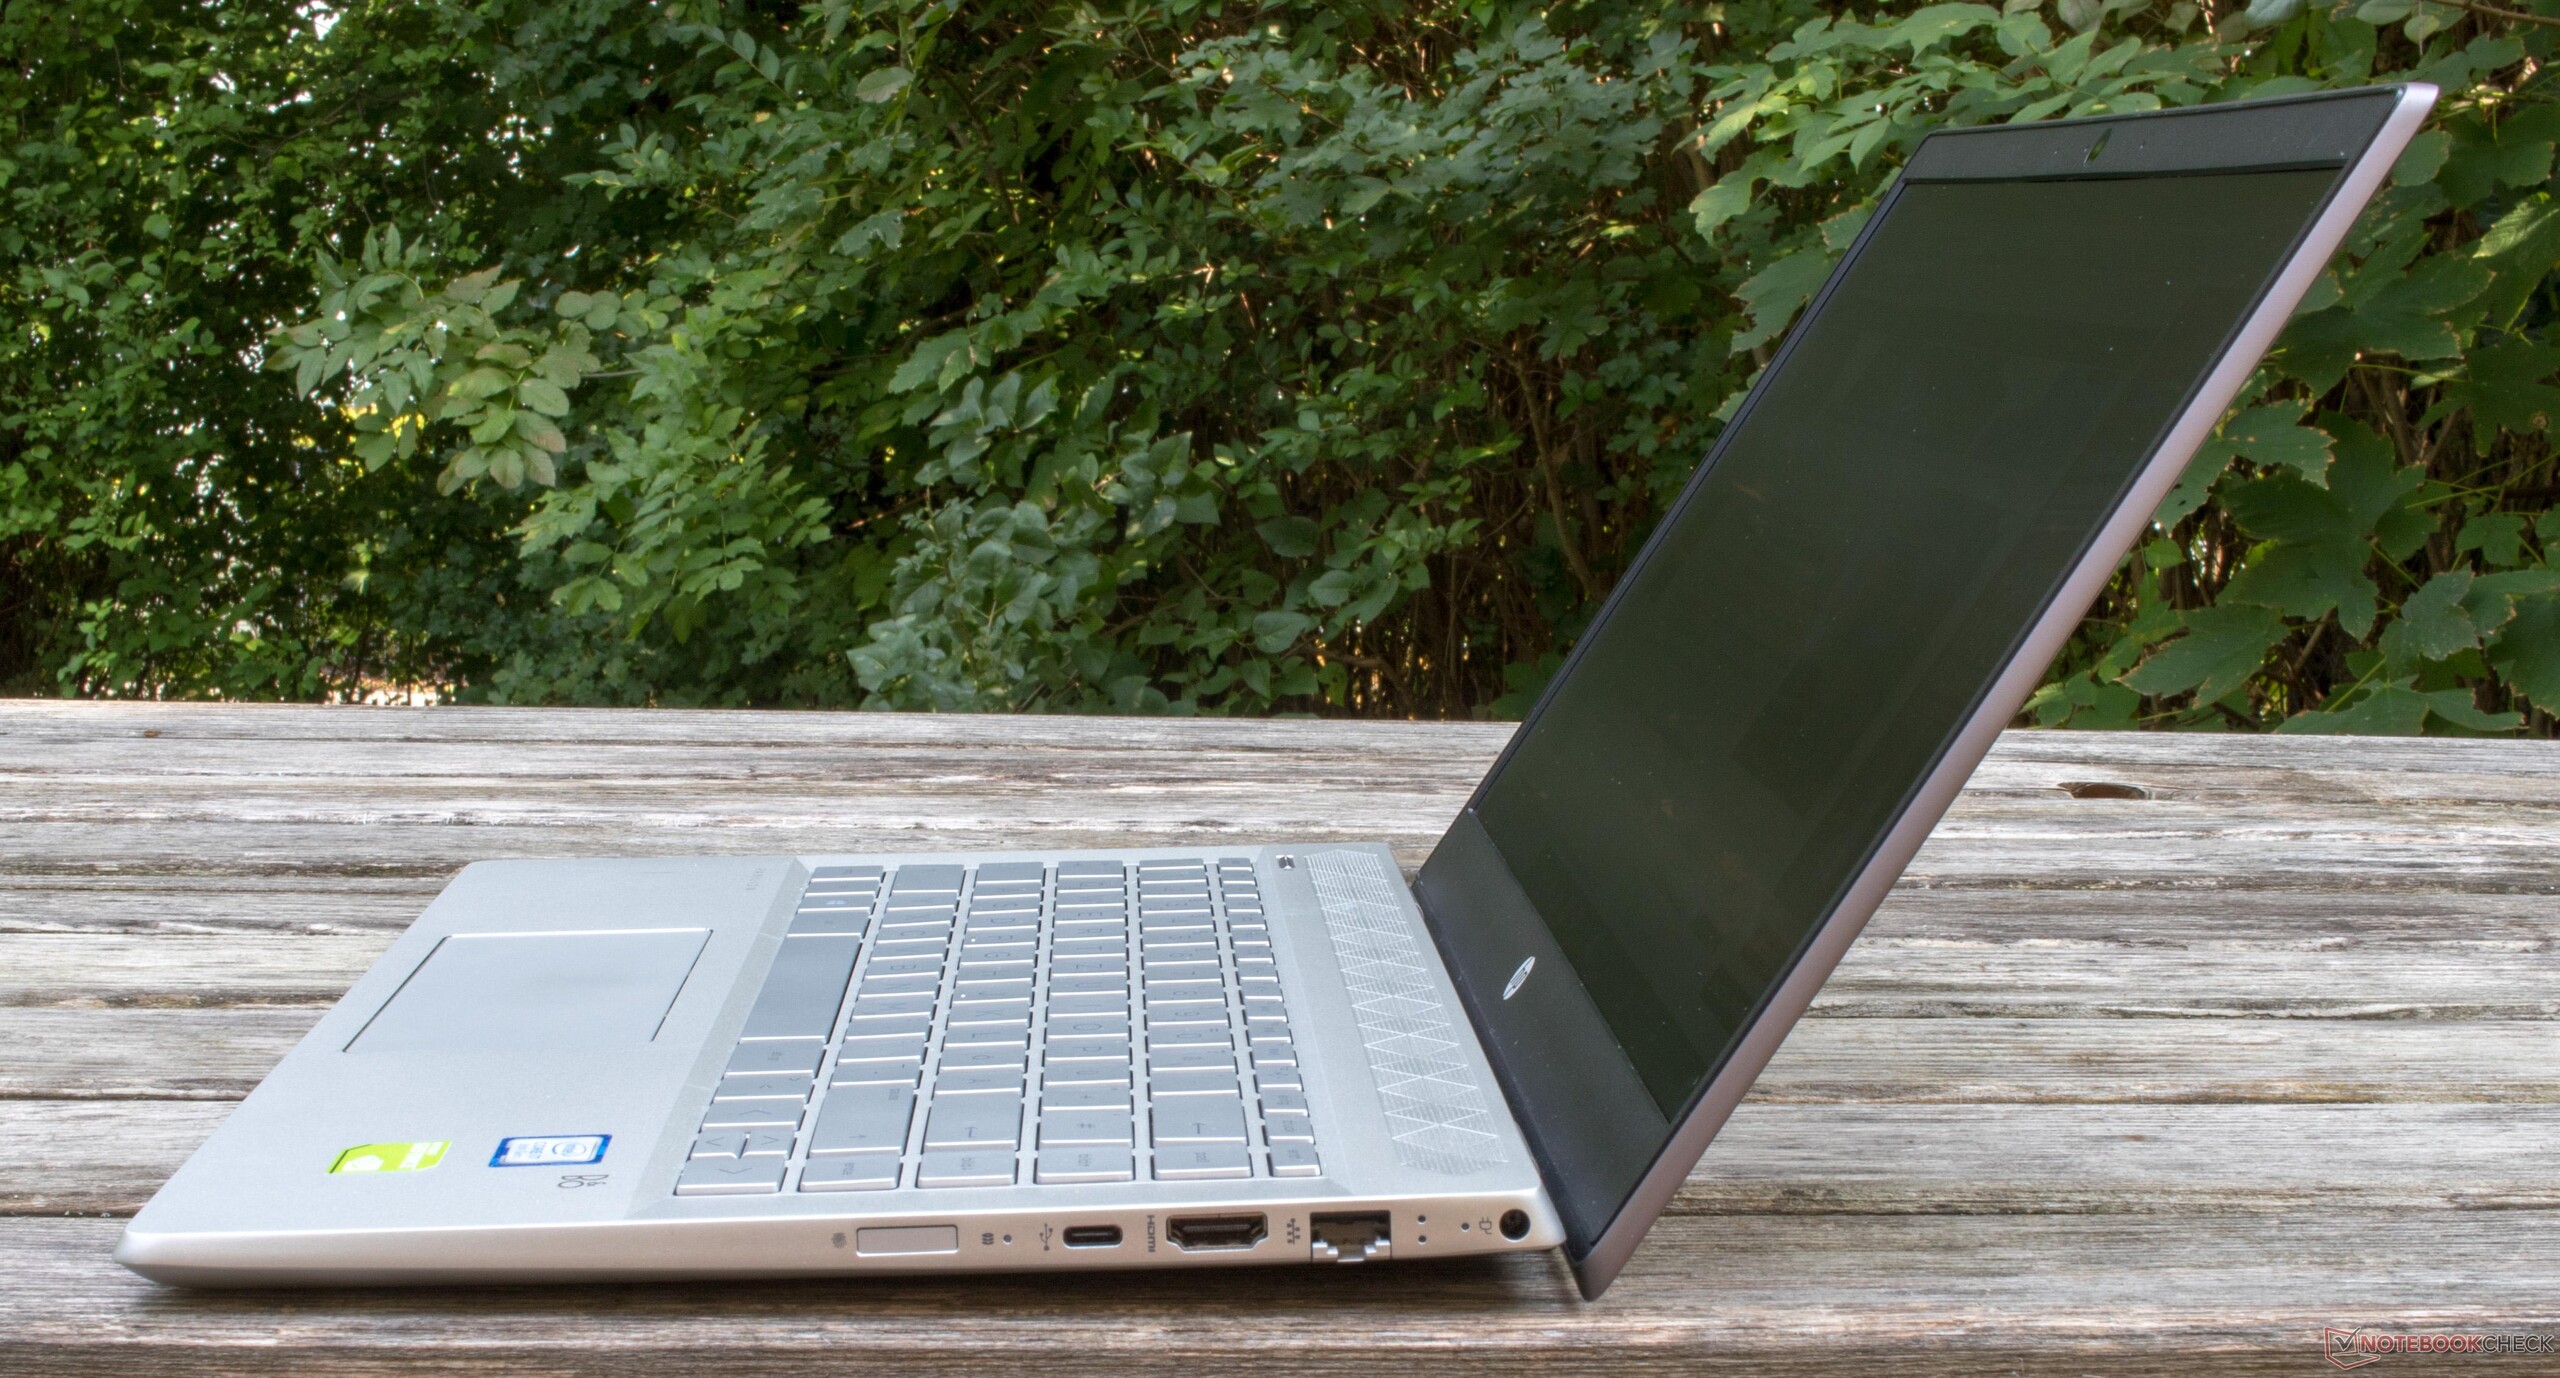
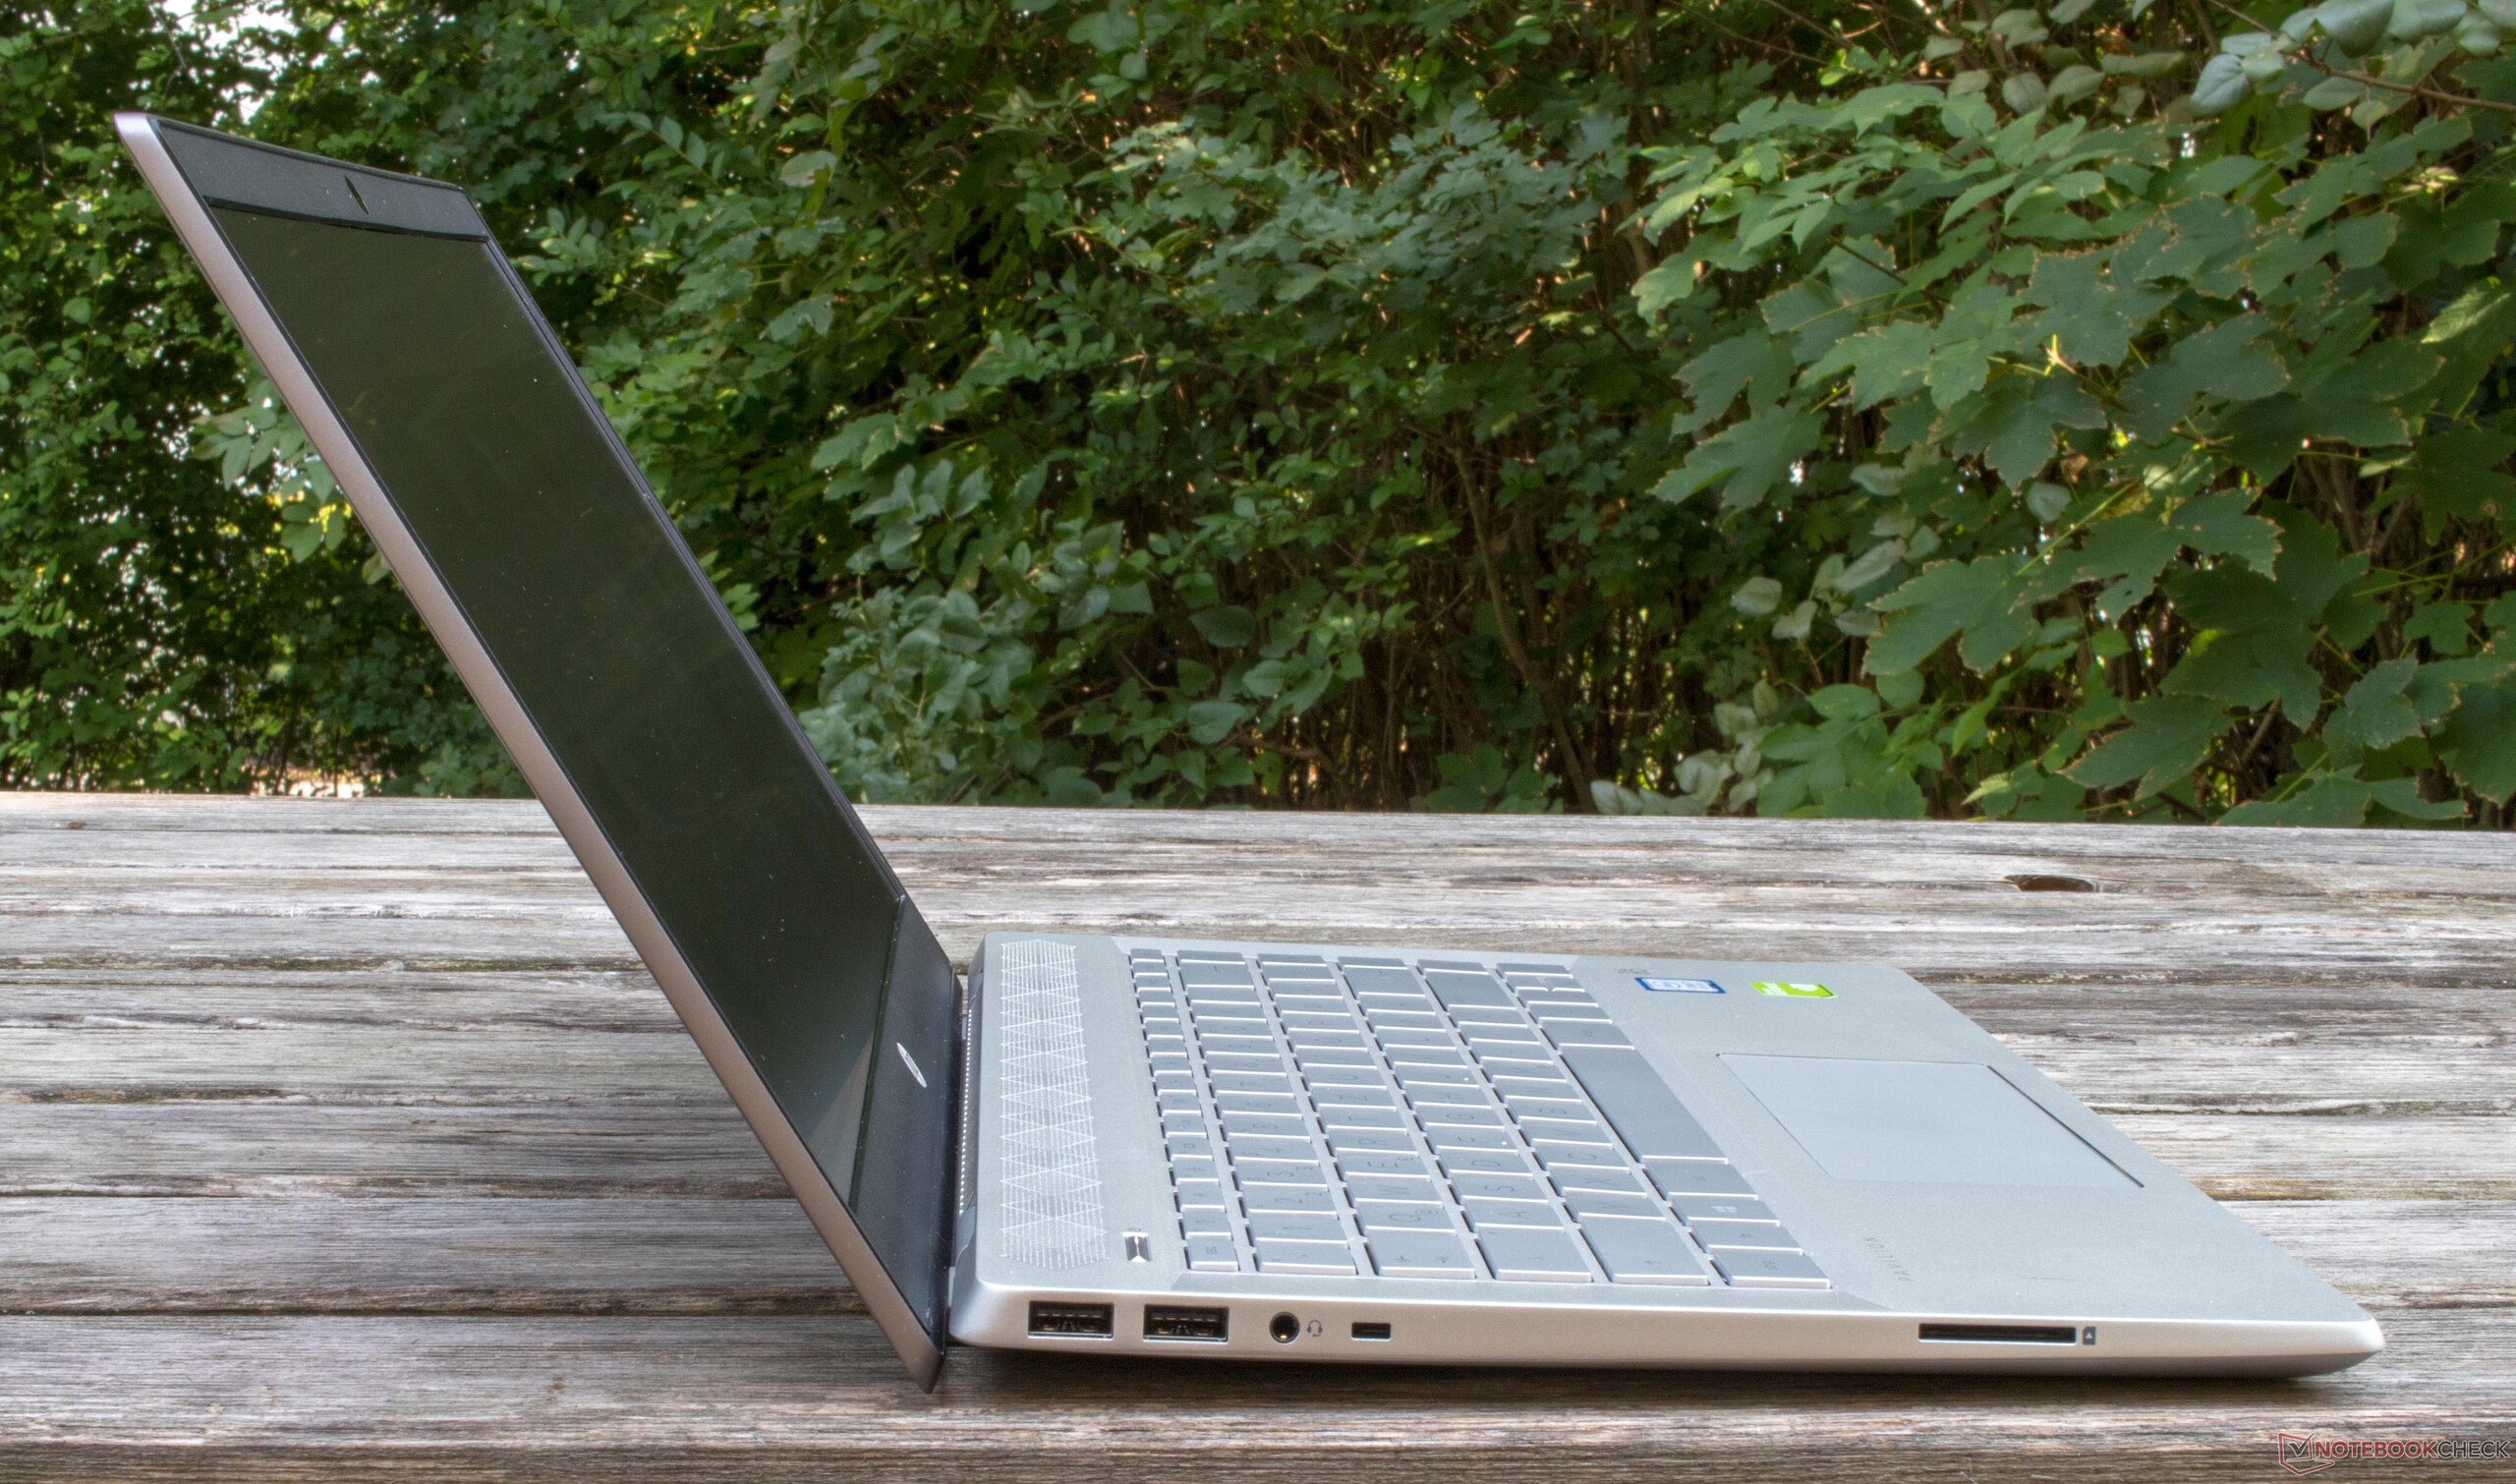
The new Pavilion 14 has an interesting hinge design, the likes of which we have seen with the new 13-inch HP Envy. The hinge opens to a maximum angle of 130 degrees, with the display moving underneath the case as the screen moves backwards, causing the latter to lift away from the surface on which the laptop is placed. What first looks like a design flaw is intentional; the slight incline provides a better typing experience than if the keyboard deck lay flat against a table or your legs. The design also allows for better airflow underneath the device.
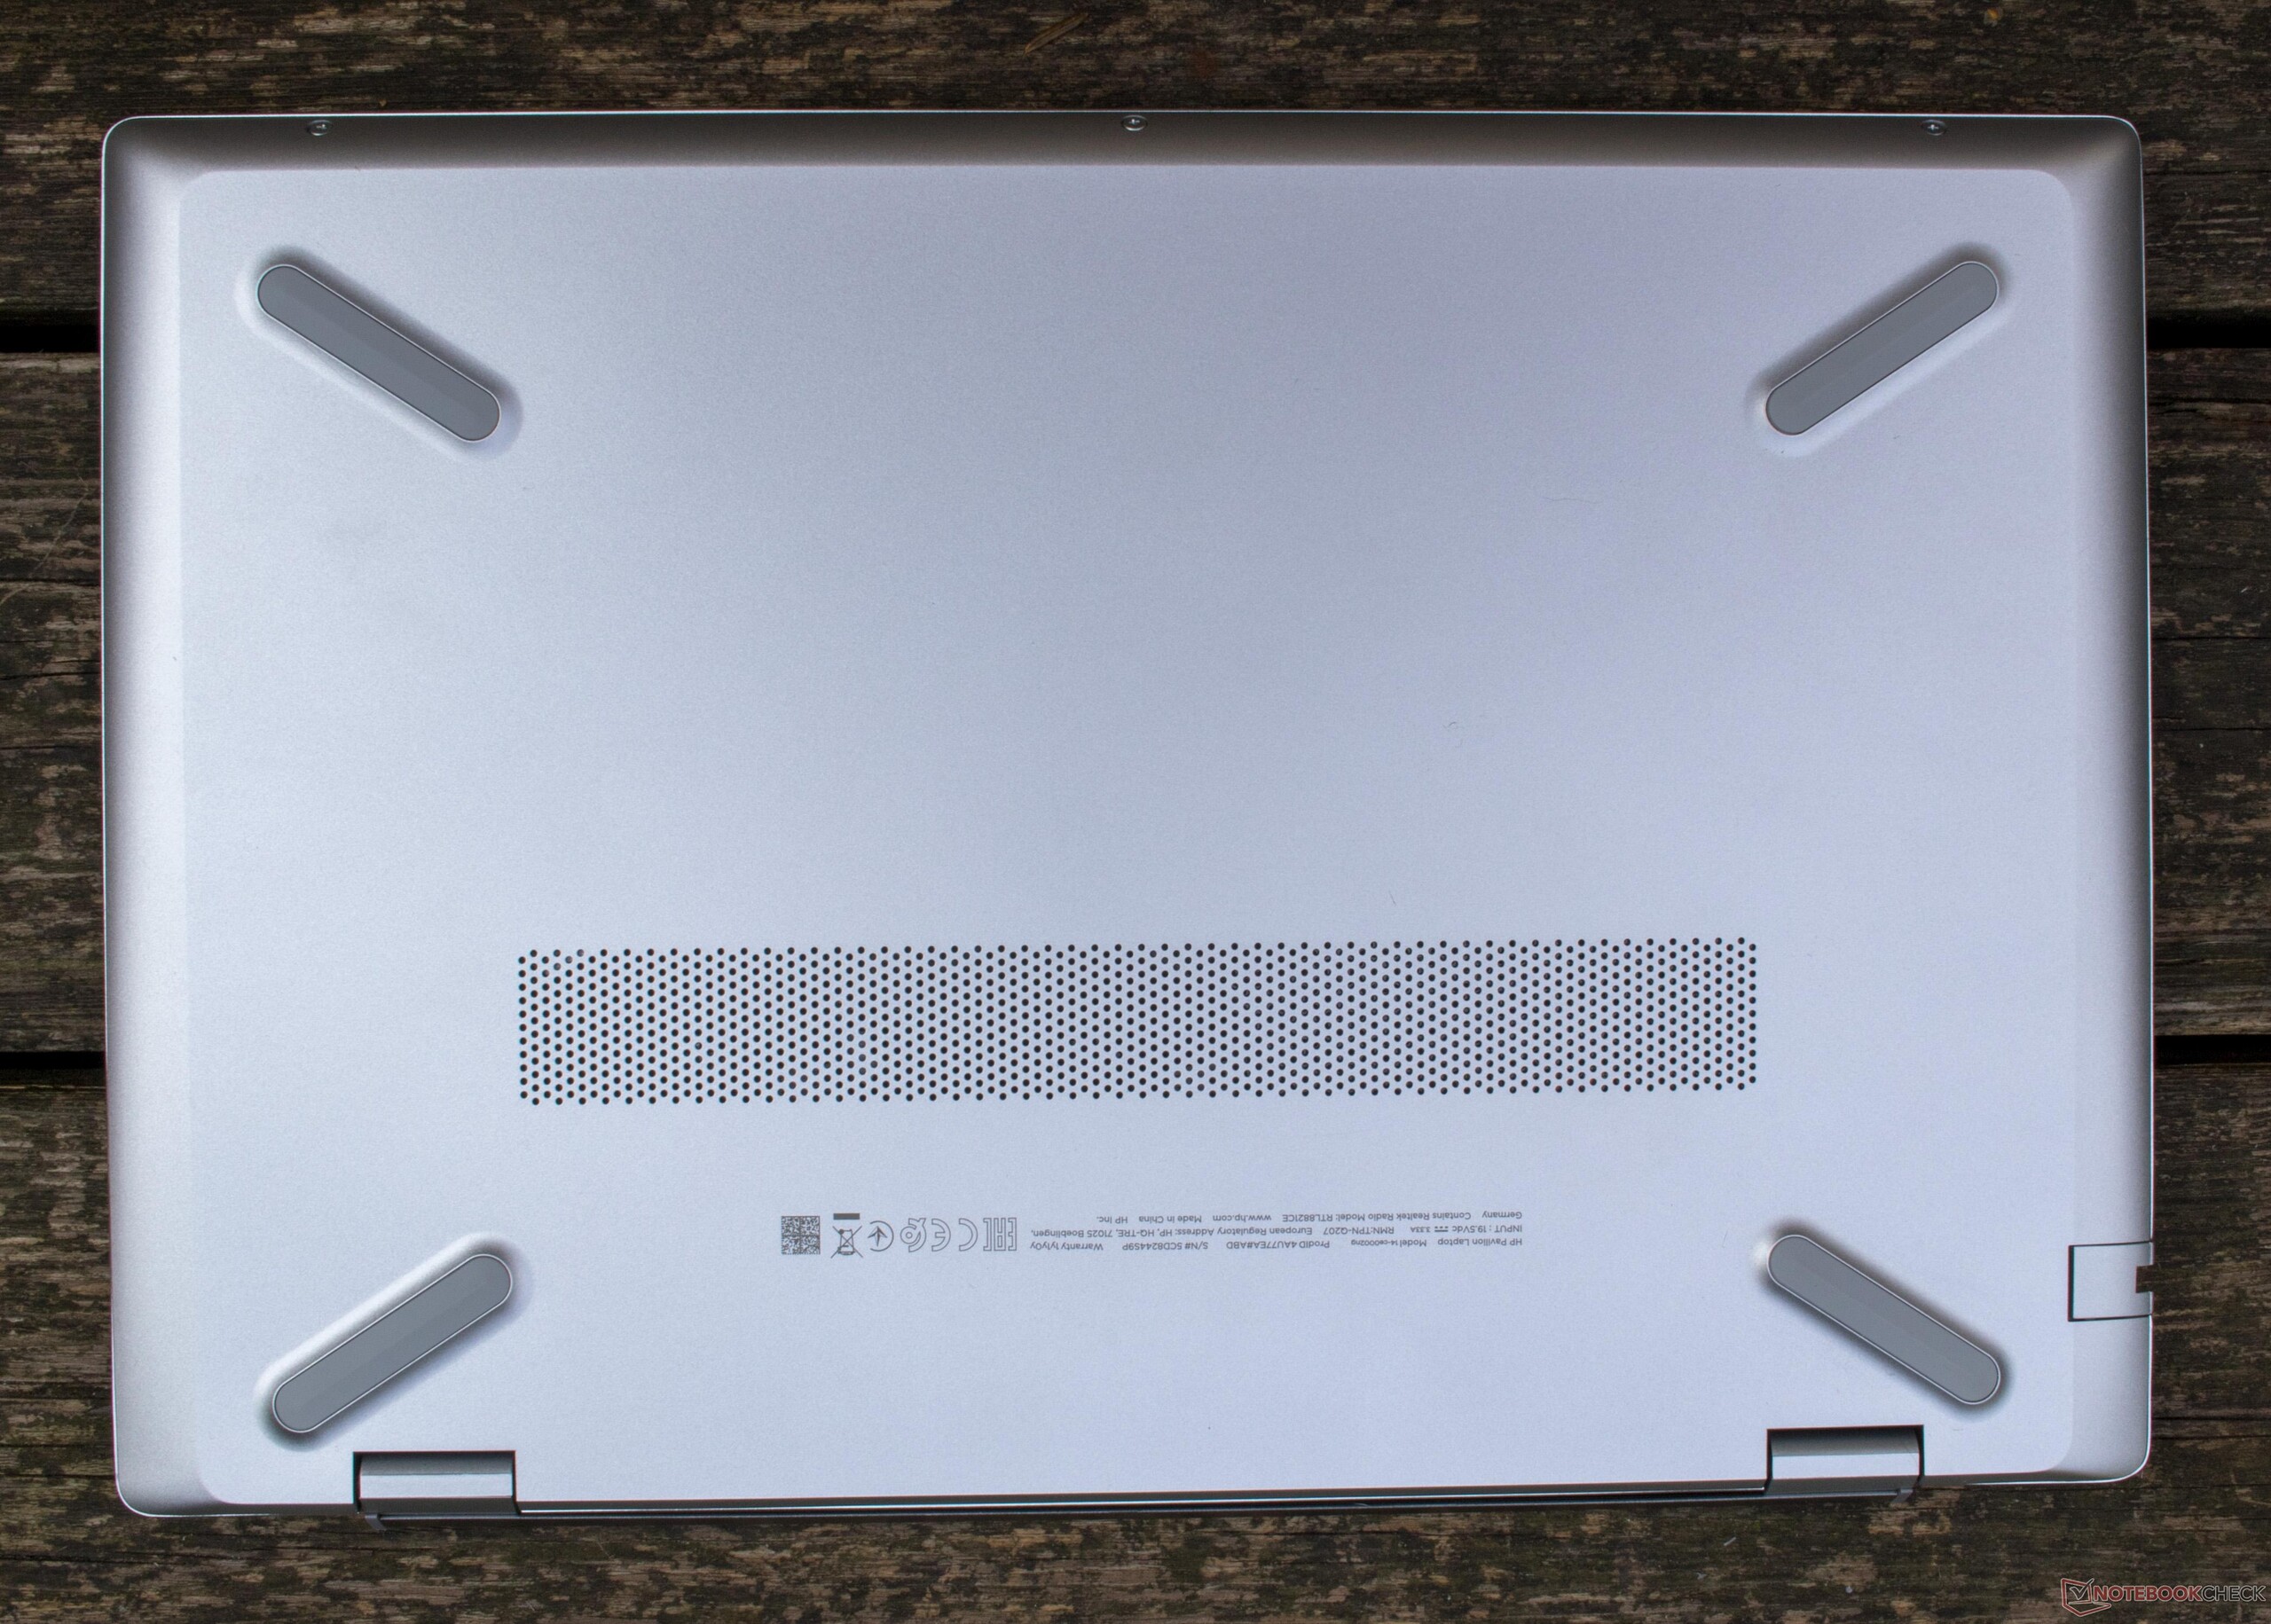
The maintenance options are less impressive than the case though. Accessing the internal components requires removing the entire bottom case, which is more arduous than if HP had included a maintenance cover for the SSD or SO-DIMM RAM slots.

The Pavilion 14 measures 326.8 x 225.5 x 17.9 millimeters, which gives our test device a footprint akin to the ASUS ZenBook UX430UN, the Lenovo IdeaPad 530s-14IKB and the Lenovo ThinkPad T480s. However, our test device weighs 1.7 kg, which is between 200 and 400 grams heavier than those other devices. Our comparison devices are far from being cheap plastic laptops too, so we cannot explain away the Pavilion 14’s additional weight because it is made mostly from metal. By contrast, our test device’s 65 W power supply is compact and handy.
Connectivity
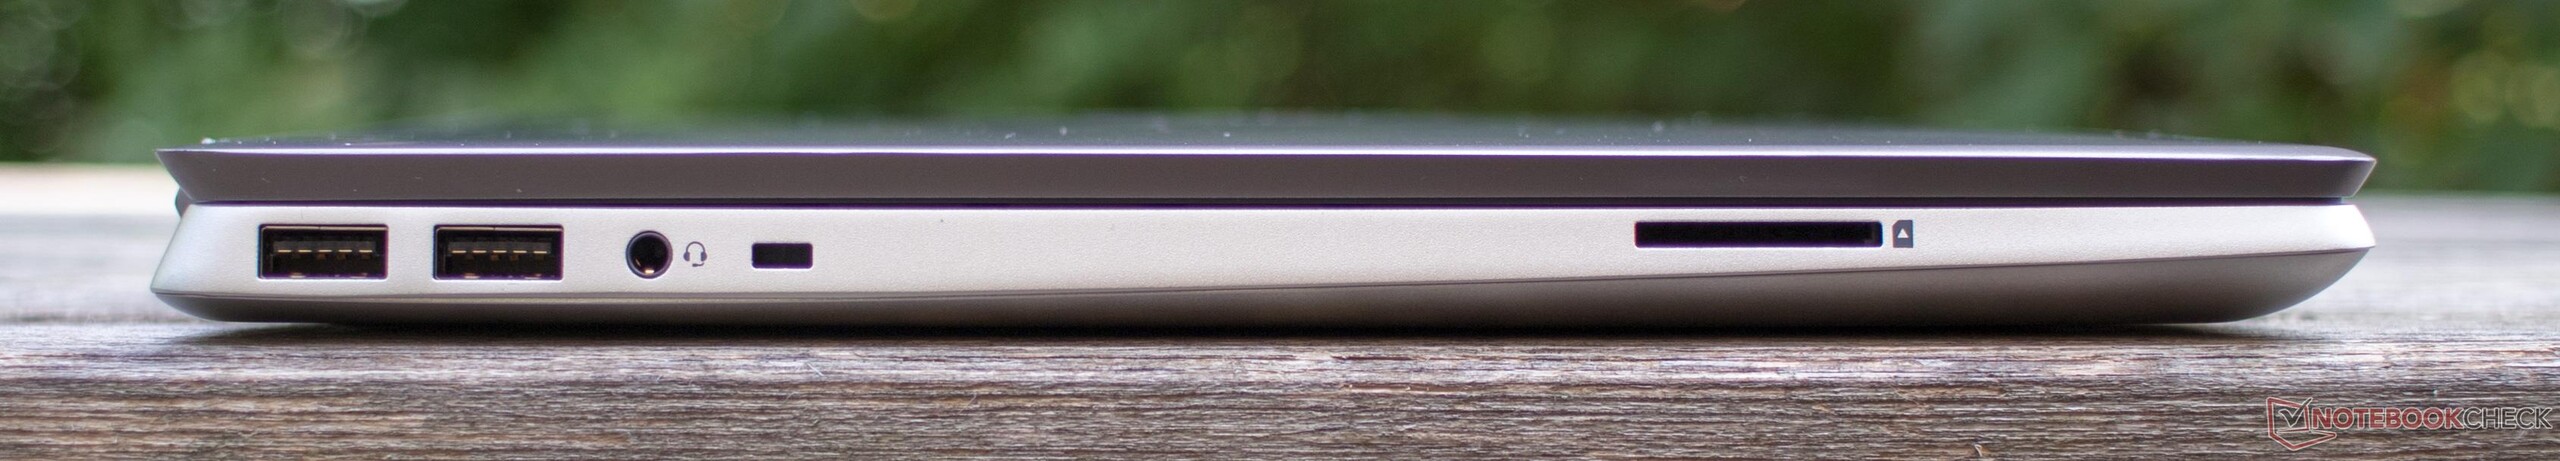
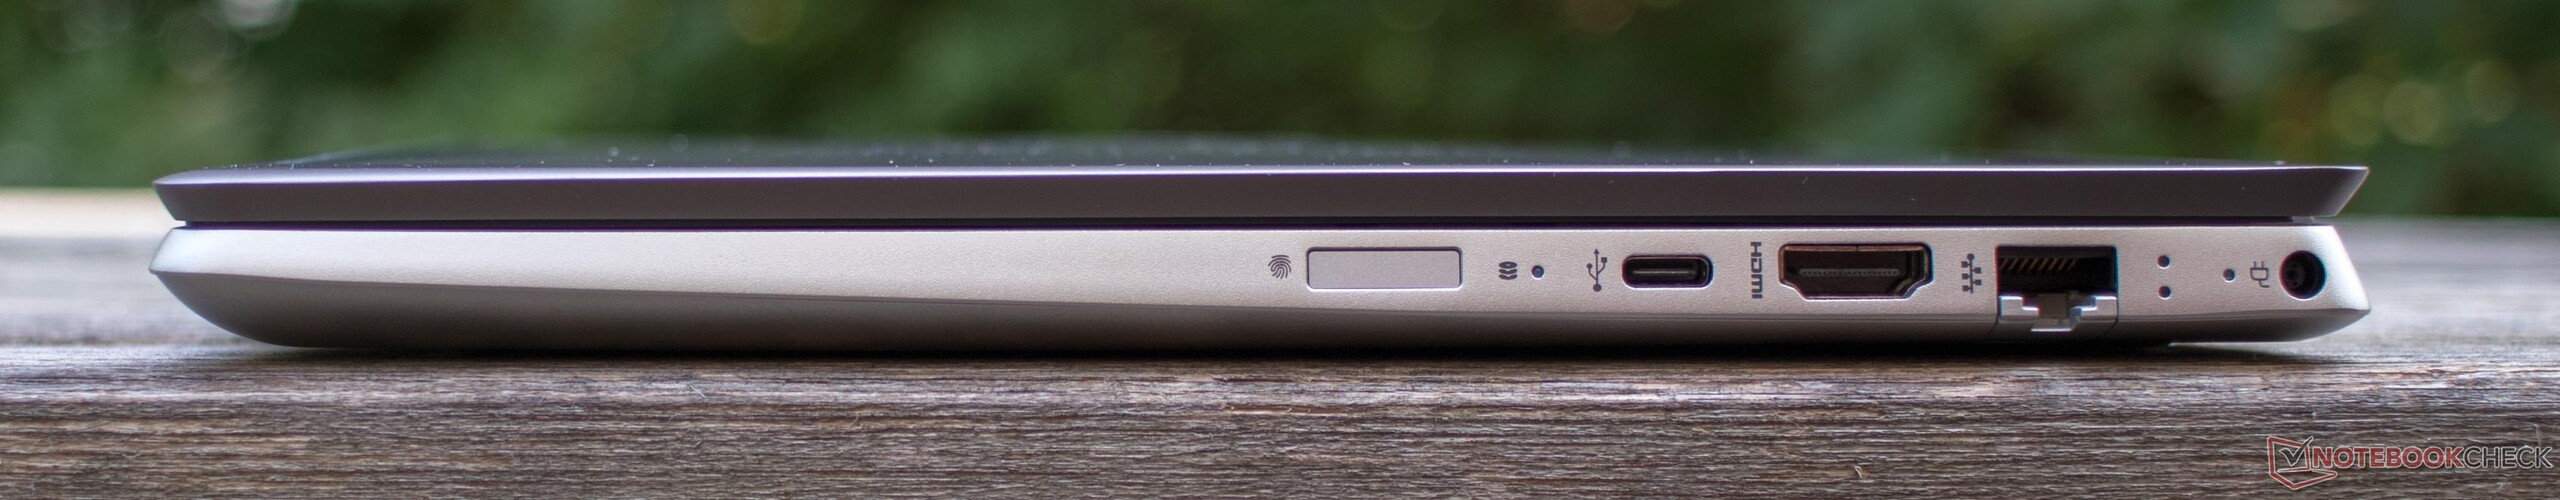
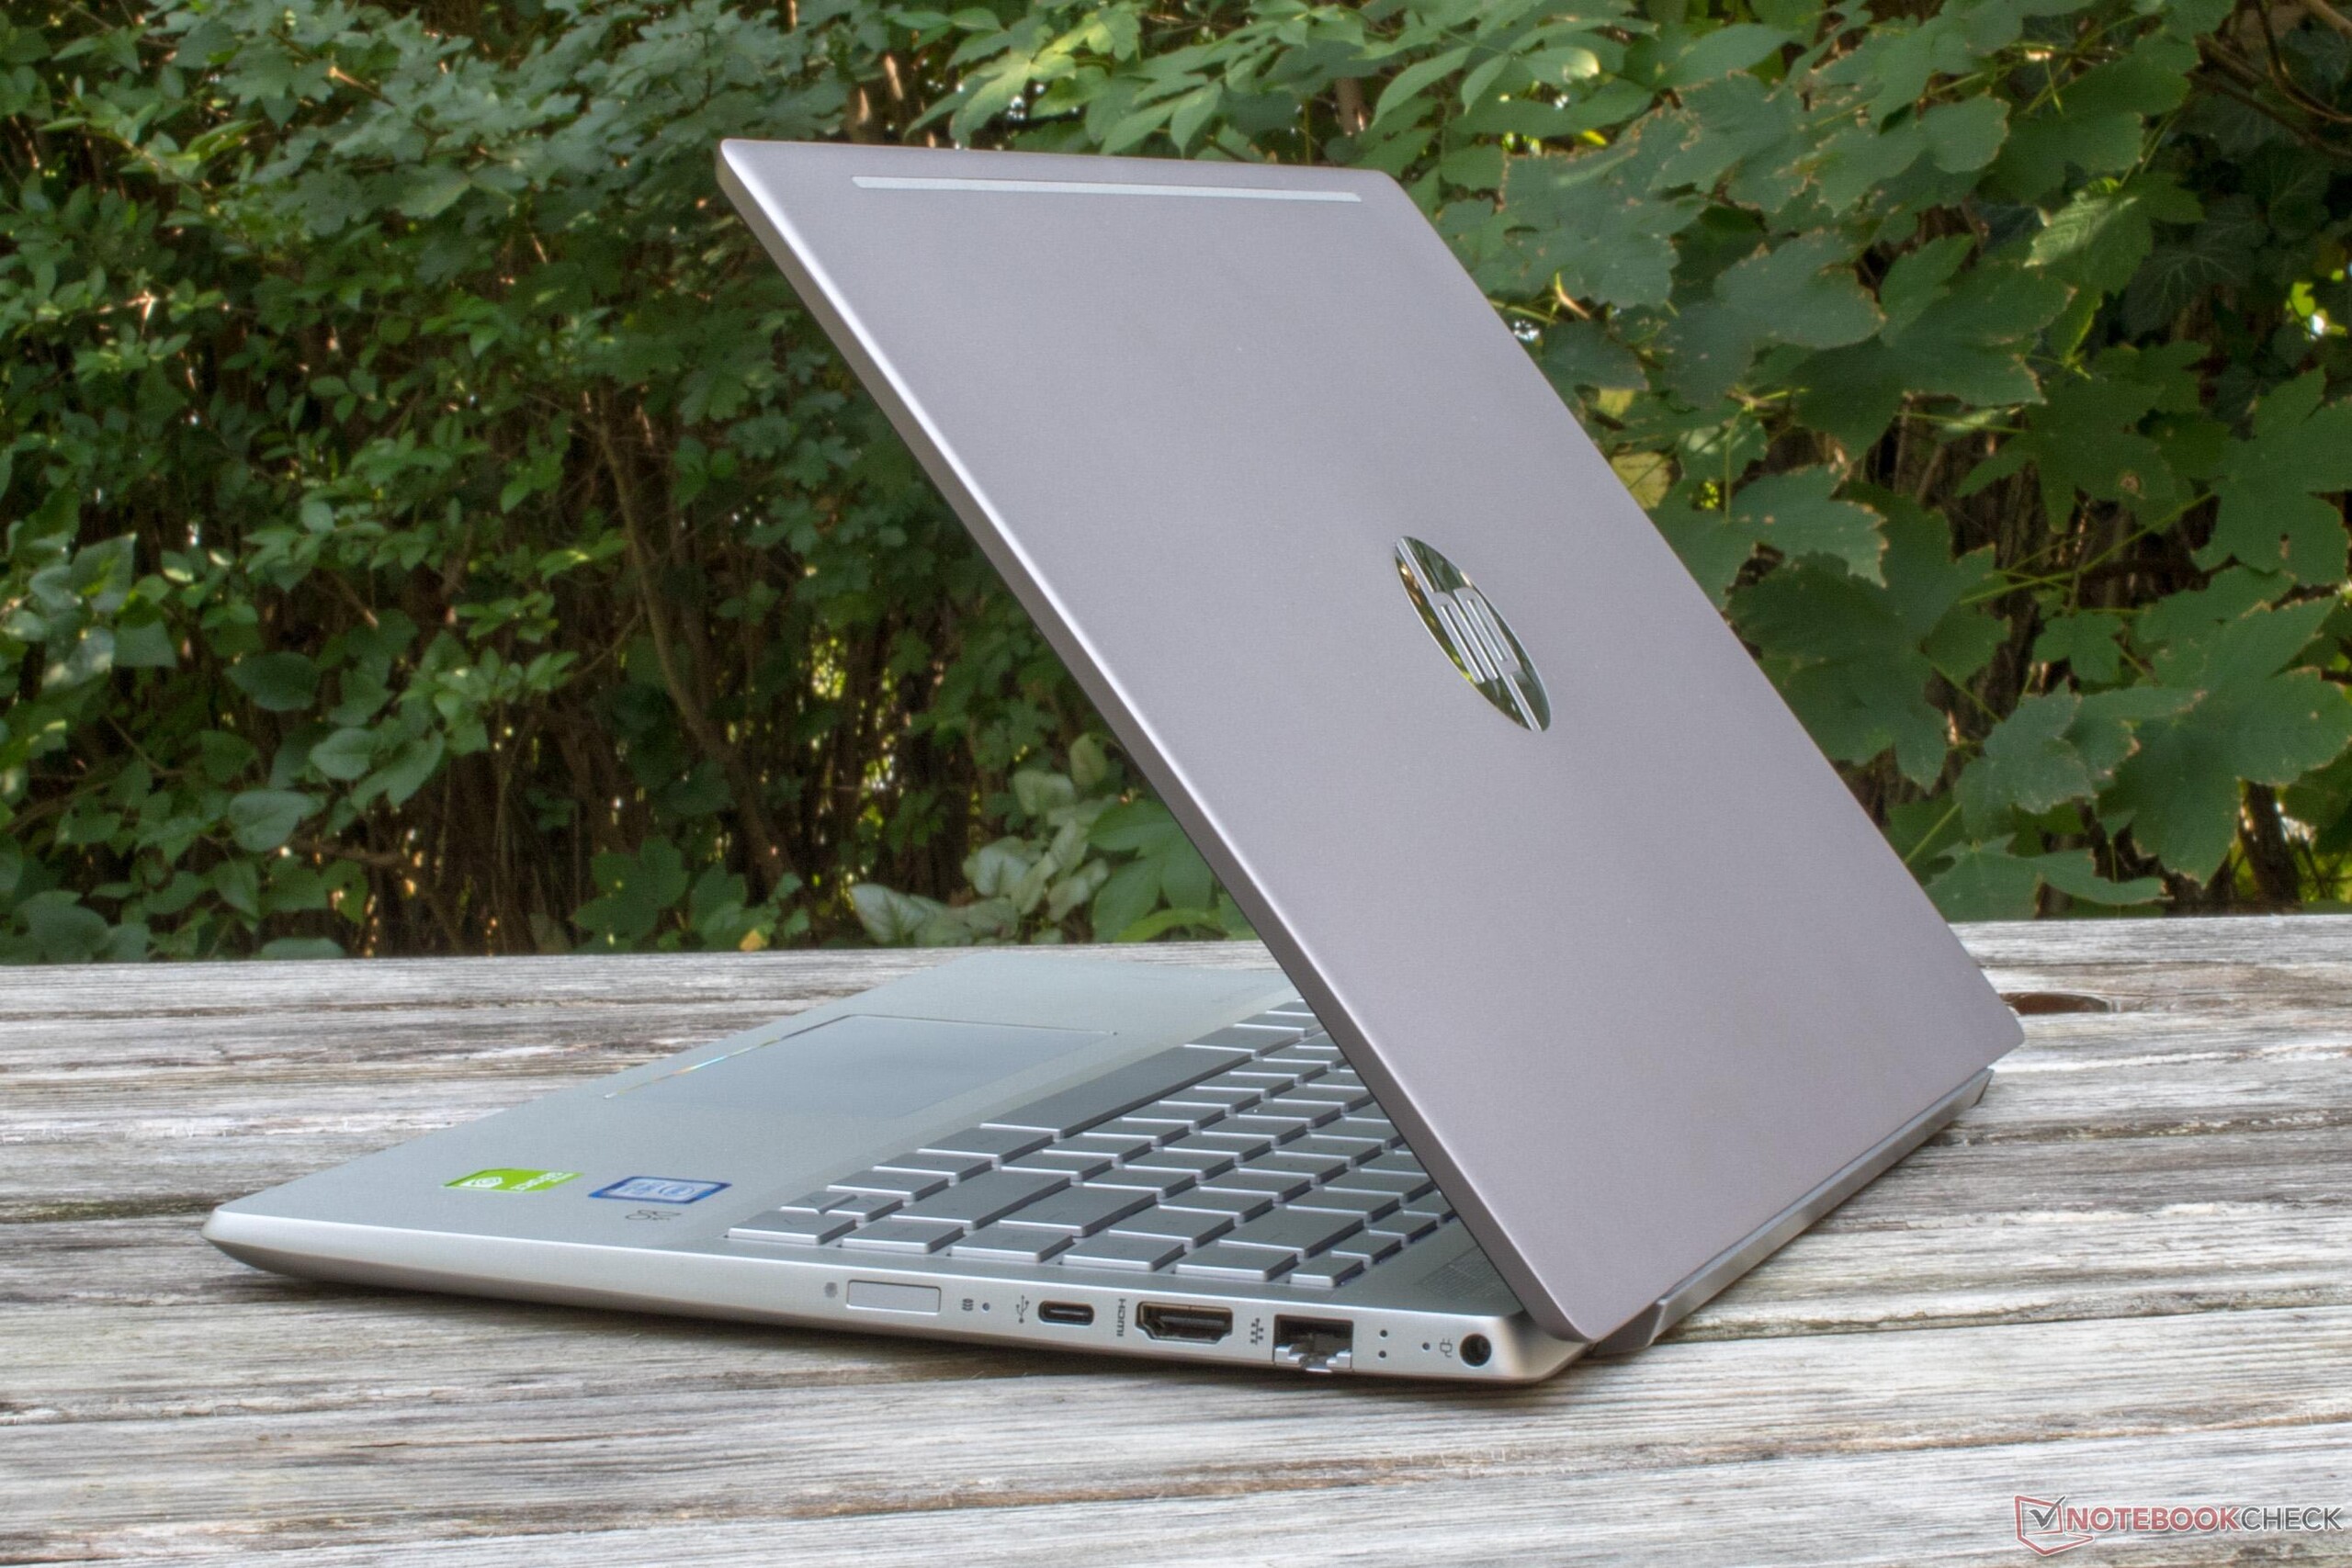
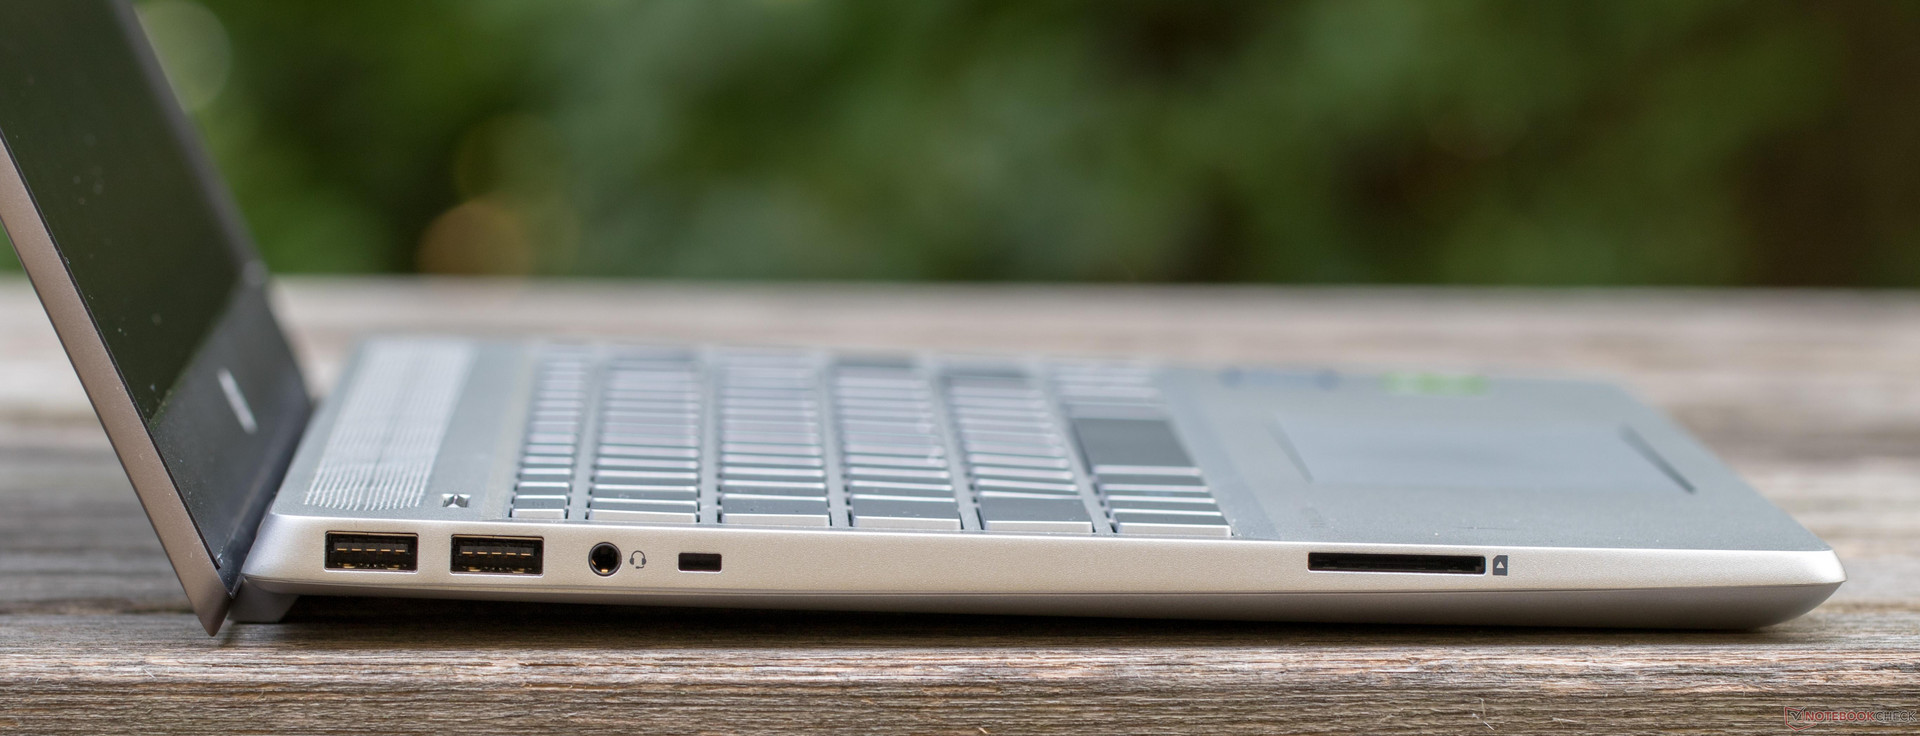
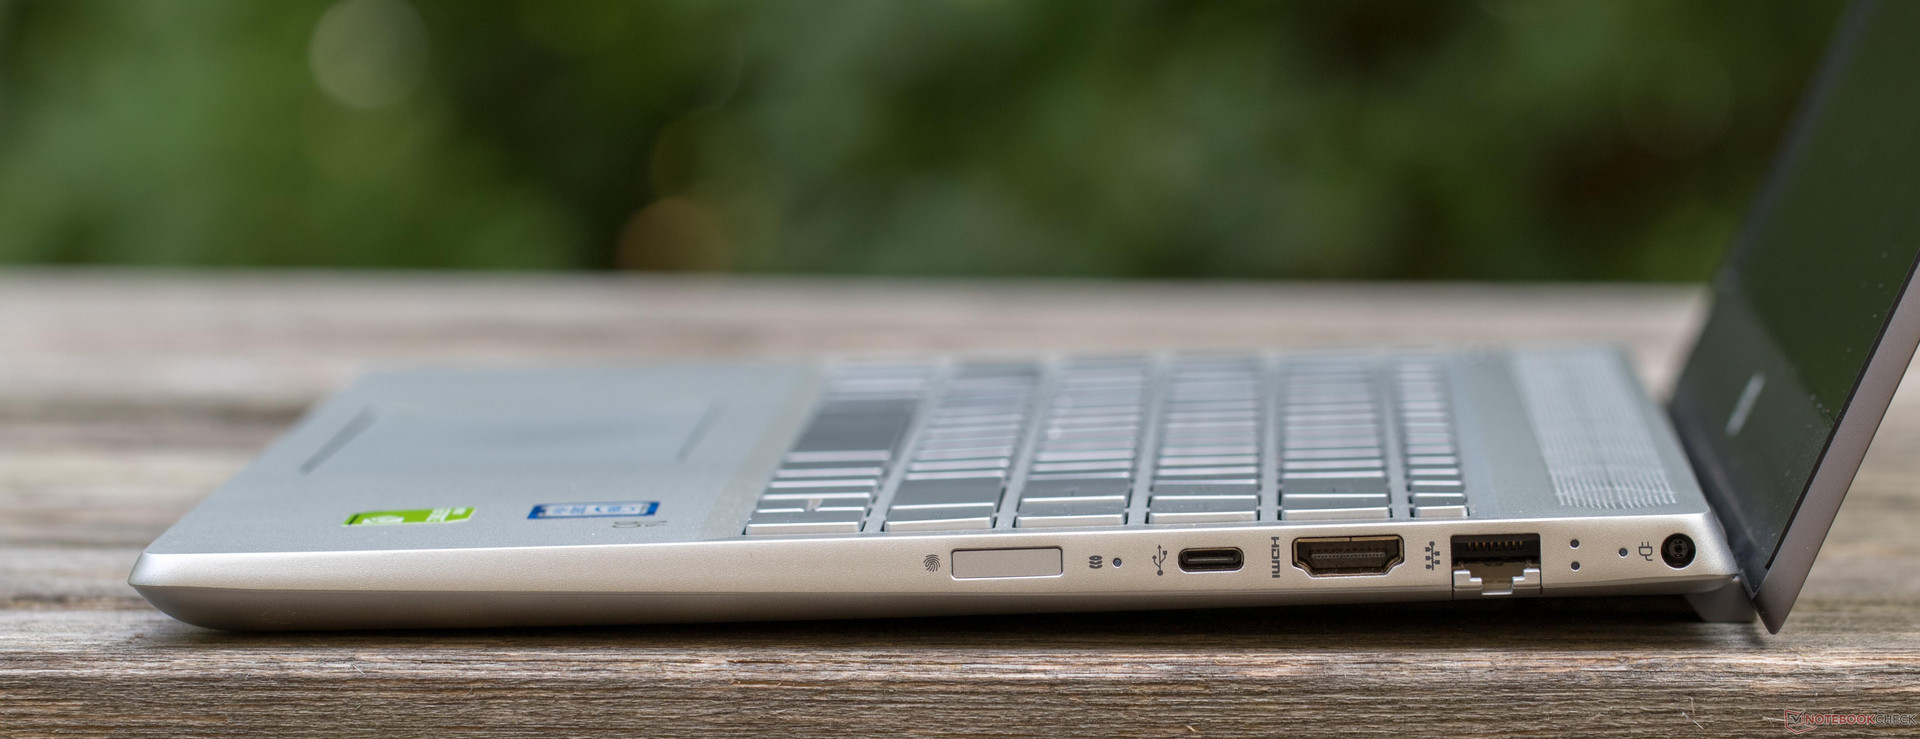
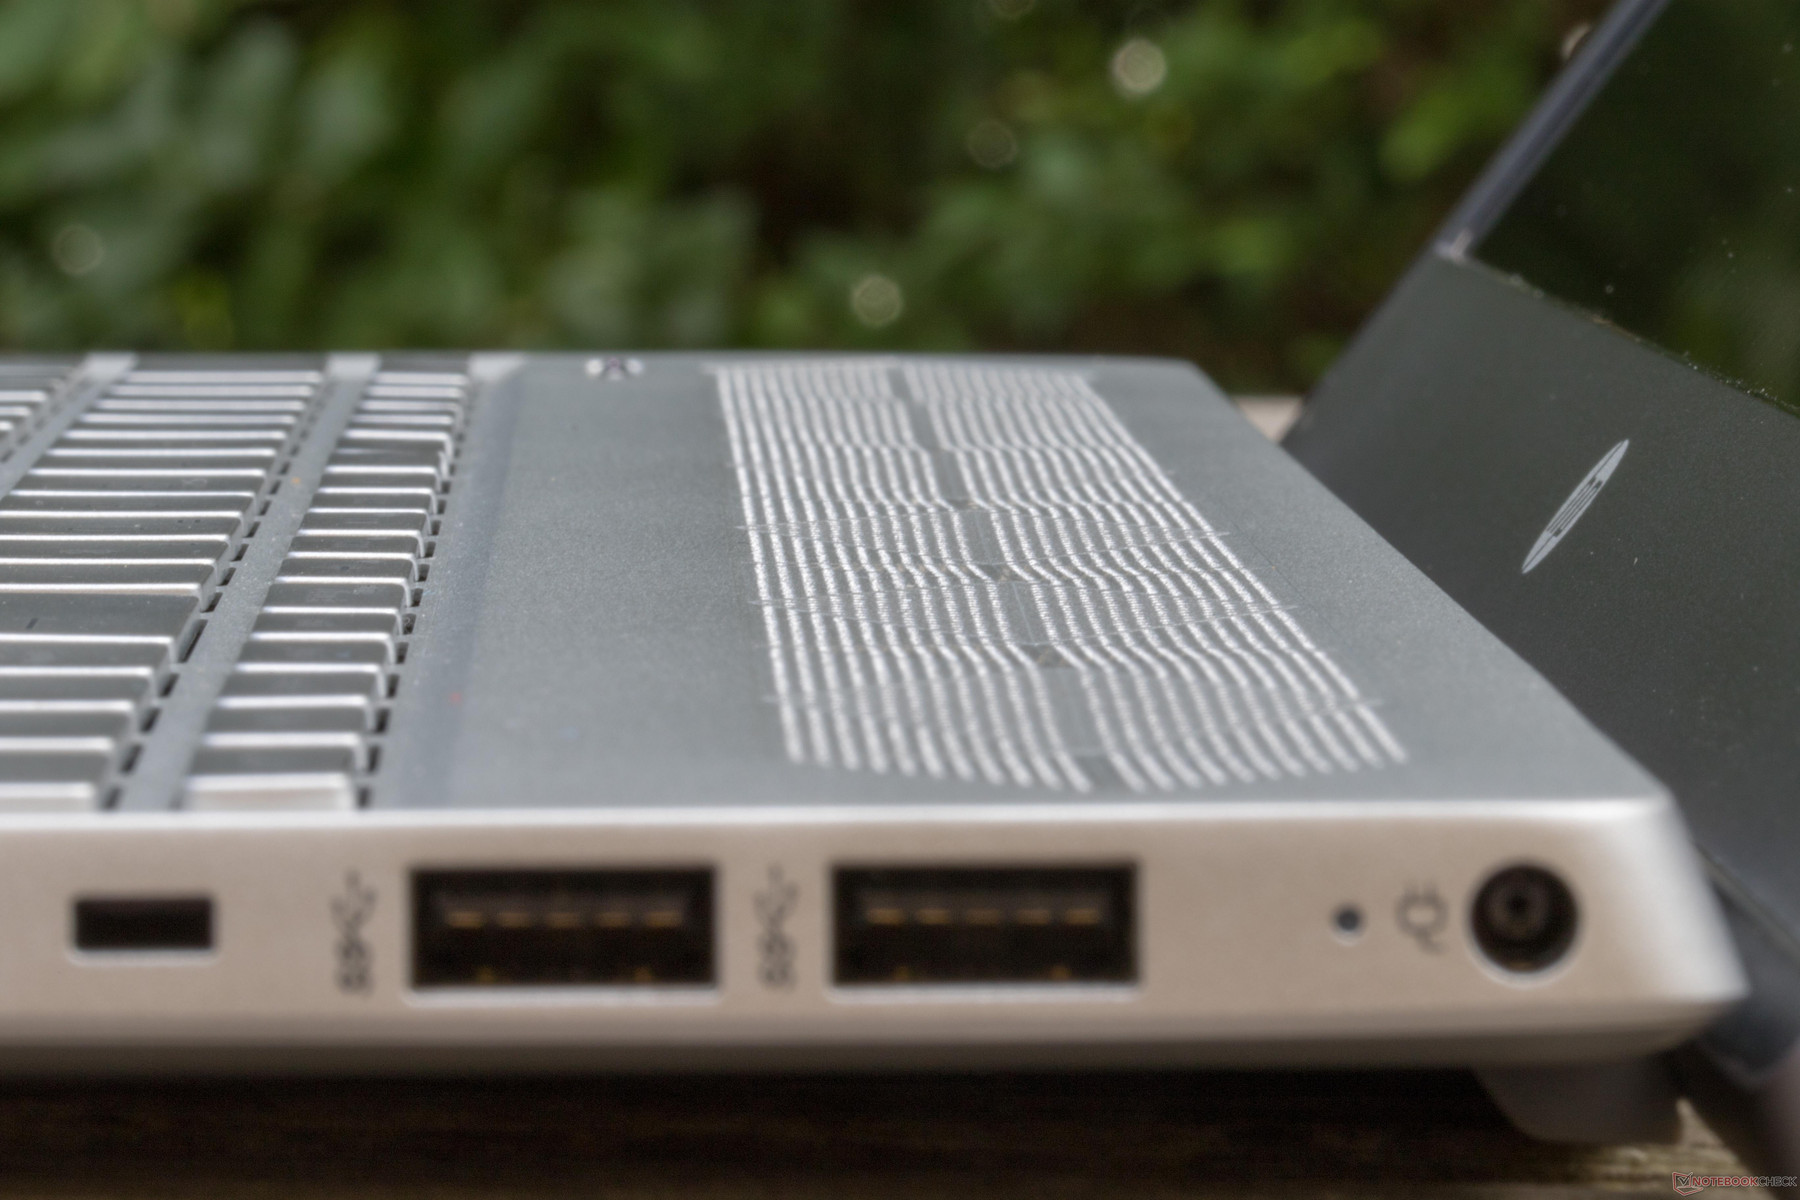
Our test device has three USB 3.1 Gen 1 ports: a USB Type-C port on the right-hand side of the device and two USB Type-A ports on the opposite side. The device also has a single 3.5 mm jack, a full-sized SD card reader and a Kensington lock slot on its left-hand side with a power connector, an RJ45 Ethernet port, an HDMI 1.4 port and a fingerprint sensor on its right-hand side. There is a small LED for hard drive activity next to the fingerprint sensor too. Overall, the ports are well spaced, and you should have no problems with connectors blocking each other when using multiple ports.
SD card reader
The Pavilion 14 has a spring-loaded SD card reader that absorbs practically an entire card. Unfortunately, the reader is comparatively slow, with our Toshiba Exceria Pro SDXC 64 GB UHS-II reference SD card only achieving 40 MB/s transfer speeds in our tests. By contrast, the SD card reader in the HP Spectre X360 15 reaches an average write speed of 163.8 MB/s and an average read speed of 212.4 MB/s. Our test device’s values are considerably lower than the class average too.
| SD Card Reader | |
| average JPG Copy Test (av. of 3 runs) | |
| HP Spectre x360 15-ch011nr (Toshiba Exceria Pro SDXC 64 GB UHS-II) | |
| Average of class Multimedia (23 - 531, n=41, last 2 years) | |
| Lenovo ThinkPad T480s-20L8S02E00 (Toshiba Exceria Pro SDXC 64 GB UHS-II) | |
| HP Pavilion 14-ce0002ng (Toshiba Exceria Pro SDXC 64 GB UHS-II) | |
| HP Pavilion 15-cw0003ng (Toshiba Exceria Pro SDXC 64 GB UHS-II) | |
| Asus Zenbook UX430UN (Toshiba Exceria Pro SDXC 64 GB UHS-II) | |
| Lenovo IdeaPad 530s-14IKB (Toshiba Exceria Pro SDXC 64 GB UHS-II) | |
| maximum AS SSD Seq Read Test (1GB) | |
| HP Spectre x360 15-ch011nr (Toshiba Exceria Pro SDXC 64 GB UHS-II) | |
| Average of class Multimedia (37.3 - 1455, n=40, last 2 years) | |
| Lenovo ThinkPad T480s-20L8S02E00 (Toshiba Exceria Pro SDXC 64 GB UHS-II) | |
| Asus Zenbook UX430UN (Toshiba Exceria Pro SDXC 64 GB UHS-II) | |
| HP Pavilion 14-ce0002ng (Toshiba Exceria Pro SDXC 64 GB UHS-II) | |
| HP Pavilion 15-cw0003ng (Toshiba Exceria Pro SDXC 64 GB UHS-II) | |
| Lenovo IdeaPad 530s-14IKB (Toshiba Exceria Pro SDXC 64 GB UHS-II) | |
Communication
HP has also equipped the Pavilion 14 with a Realtek 1x1 Wi-Fi module that is significantly slower than most of our comparison devices. Our test device manages around 280 Mb/s in iperf3 Client Wi-Fi tests, which is at least 200 Mb/s slower than the class average and four of our comparison devices. The Pavilion 14 also has an Ethernet port should you need a faster wired Internet connection.
Input Devices & Operation
Keyboard
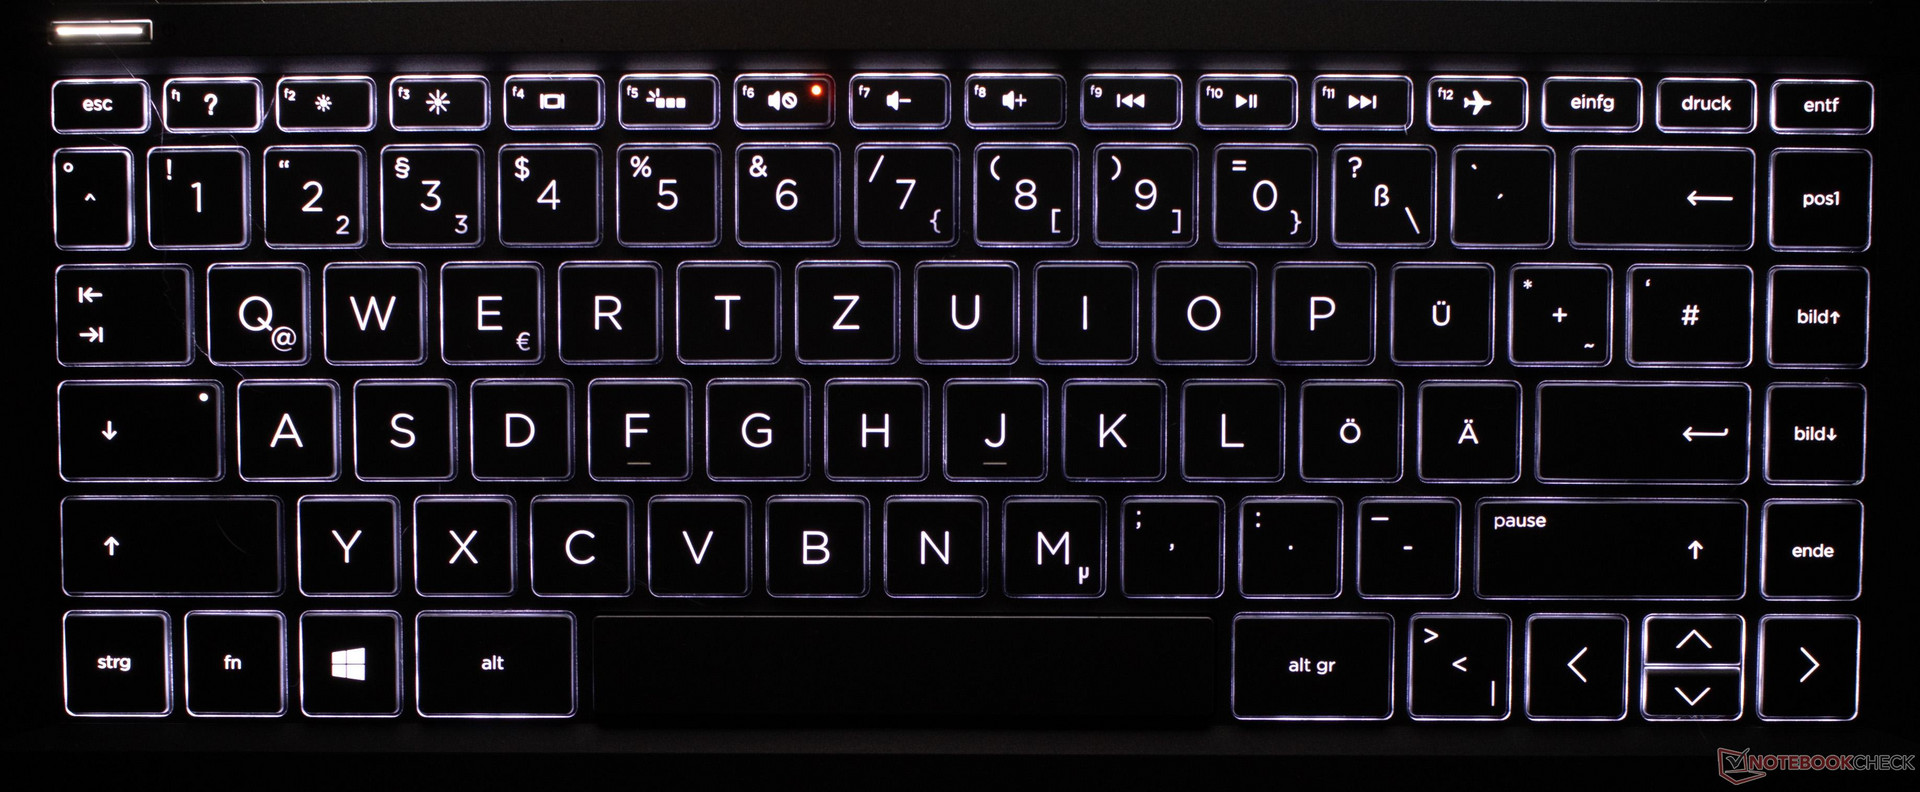
The Pavilion 14 has a chiclet keyboard with keys that have a crisp action while feeling both smooth and flat. The square keys are large and have a short stroke with 15 millimeters of travel, making the Pavilion 14 a great device for high-speed typists. The keyboard is backlit too, but the white backlight can only be switched on and off with the F5 button like many other HP laptops. Other laptops, like the MacBook Pro, have multi-levels of keyboard backlighting.
Trackpad
The trackpad is unusually wide relative to its height, with the trackpad on our test device measuring 11-inches wide and 5.5-inches tall. The trackpad is so wide that at default settings we can move the mouse across the entire display without having to lift our fingers. The tracking works well even at the edges of the trackpad. Moreover, there are two mouse buttons in the bottom half of the trackpad. Clicks are clean and feel evenly crisp throughout.
Display
The Pavilion 14 has a 14-inch IPS display with a native resolution of 1920x1080 and a 16:9 aspect ratio. Our test device has a BOE panel with the model number BOE072C that achieves an average maximum brightness of 223 cd/m² according to X-Rite i1Pro 2, a value that is lower than all our comparison devices except for the HP Pavilion 15. The Pavilion has comparatively poor color-space coverage too and is only better than the HP Envy x360 with its Chi Mei CM15E panel out of our comparison devices.
| |||||||||||||||||||||||||
Brightness Distribution: 88 %
Center on Battery: 205 cd/m²
Contrast: 885:1 (Black: 0.27 cd/m²)
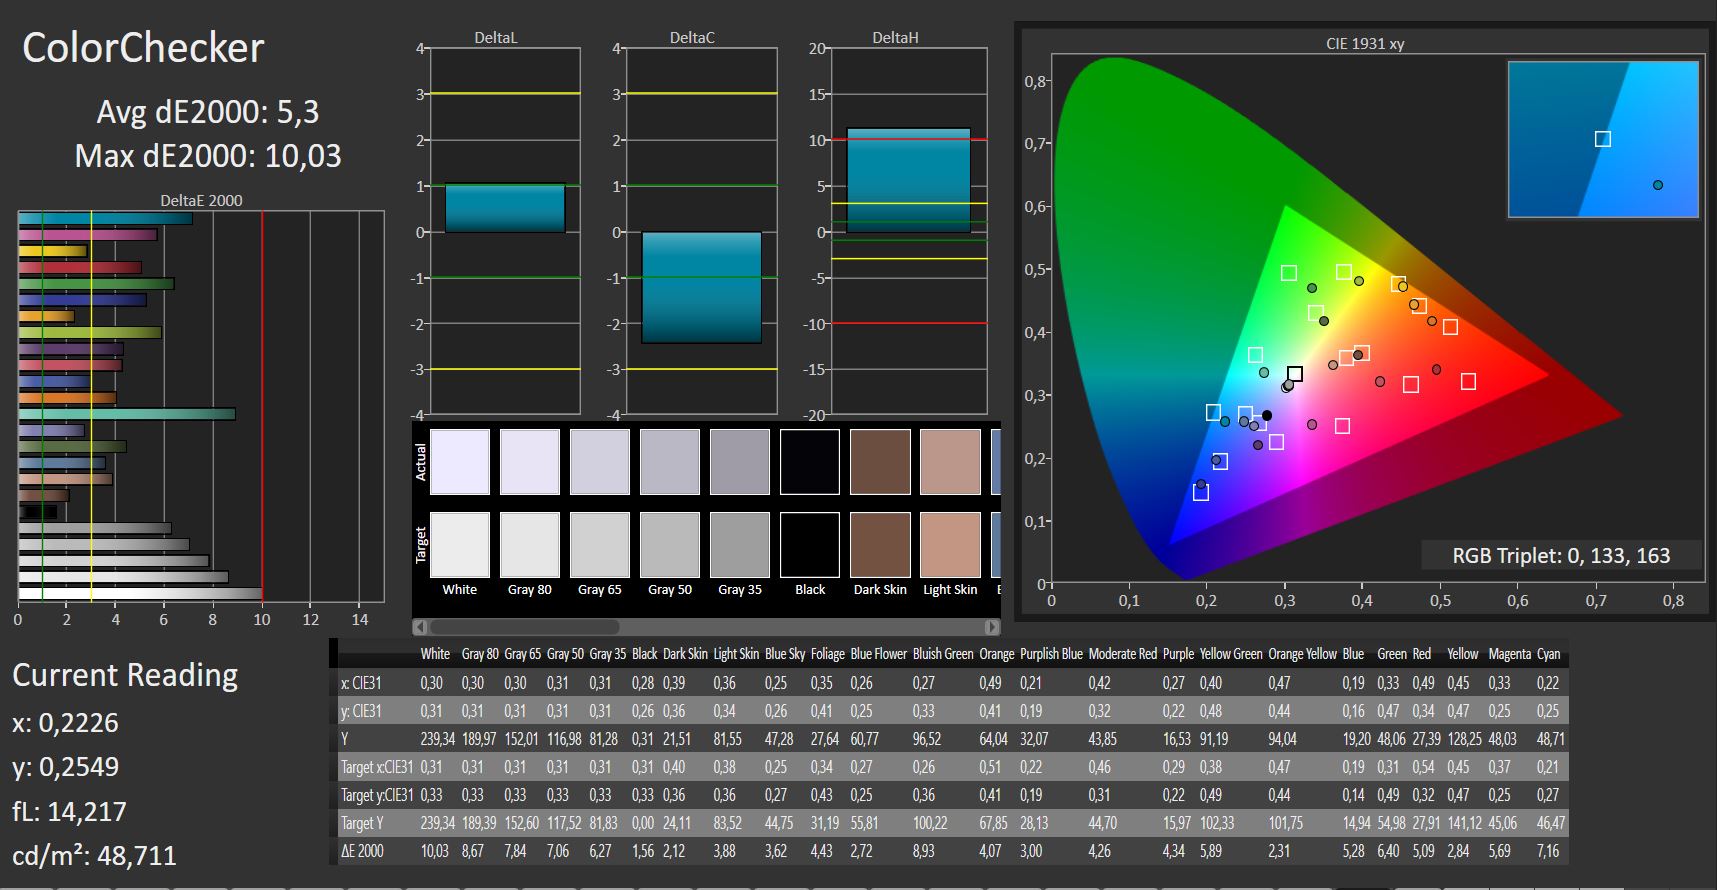
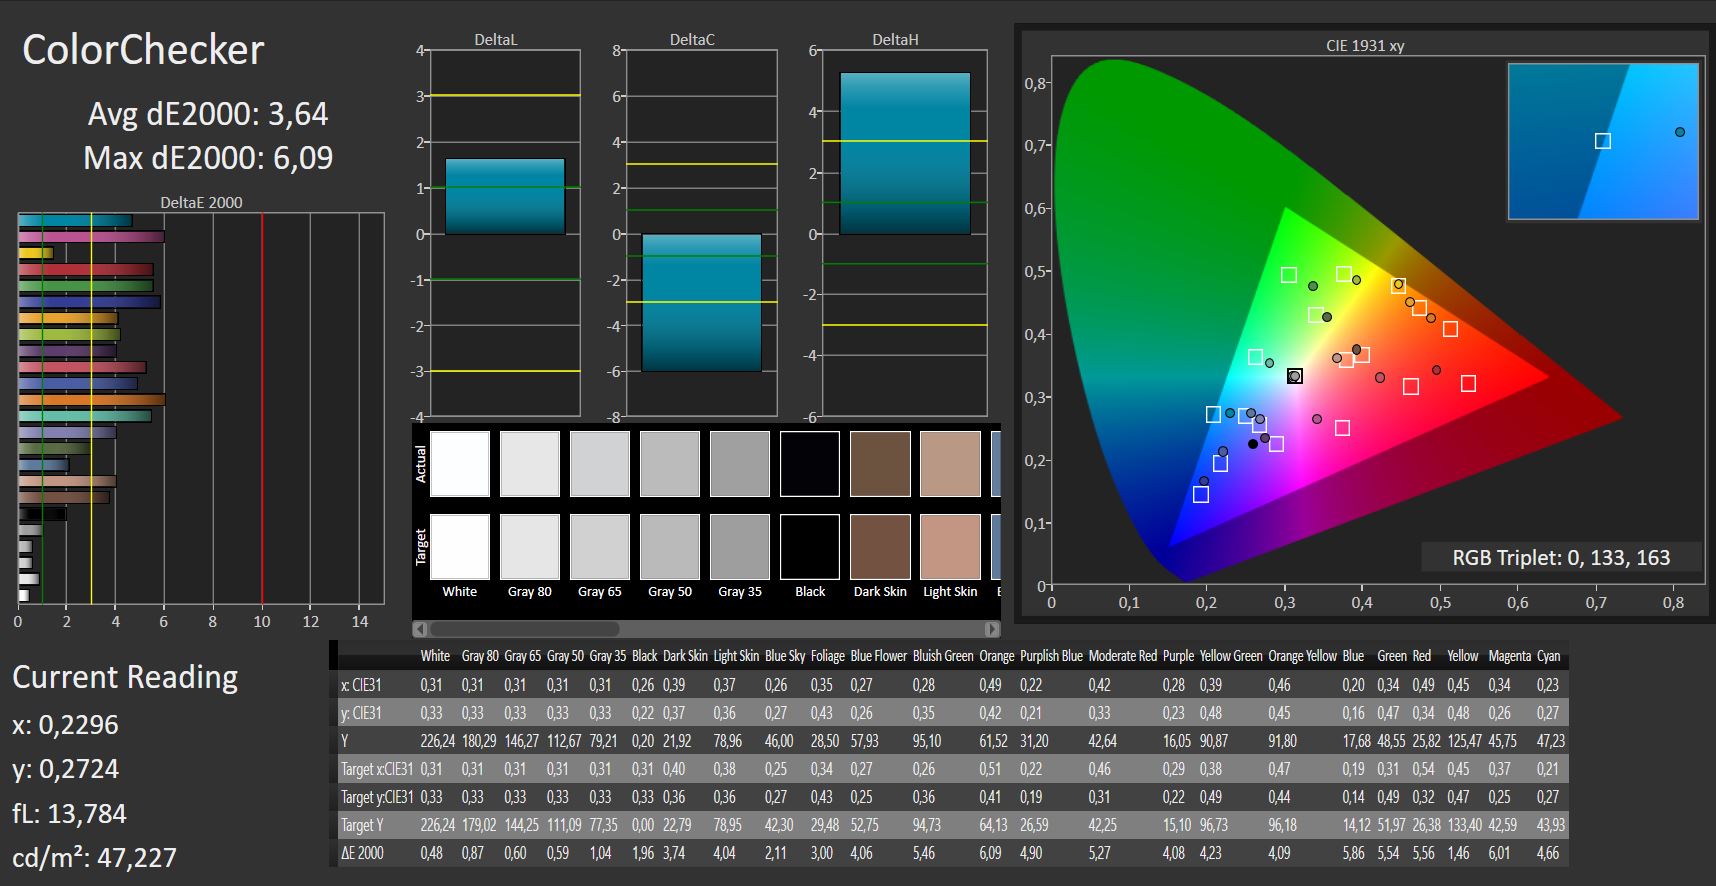
ΔE ColorChecker Calman: 5.3 | ∀{0.5-29.43 Ø4.72}
calibrated: 3.64
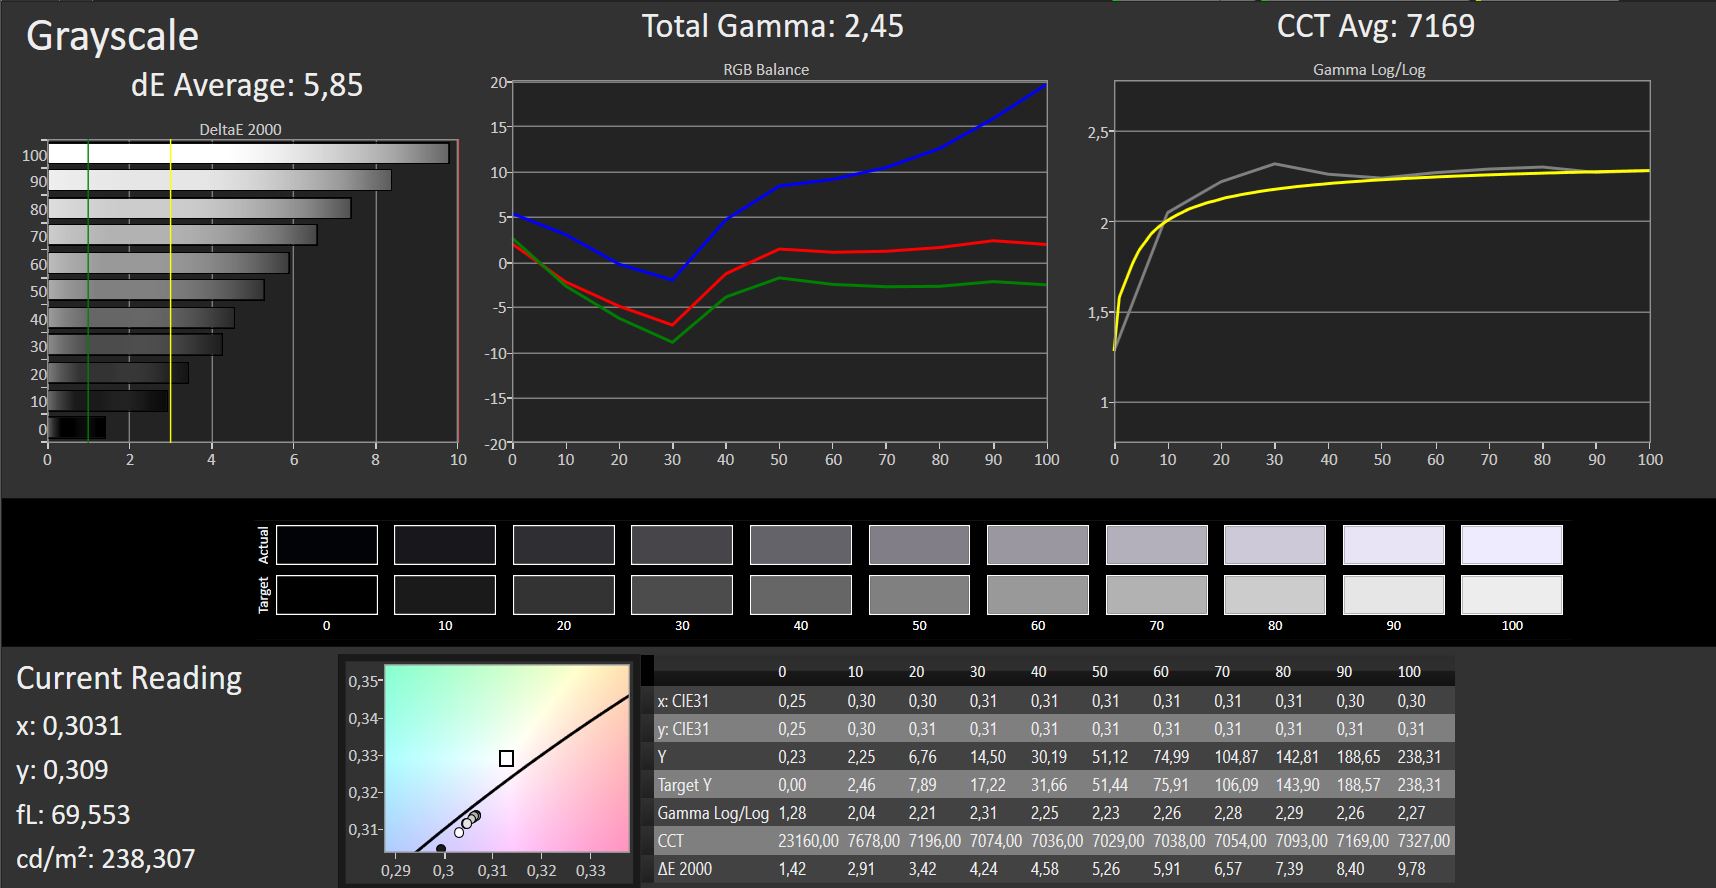
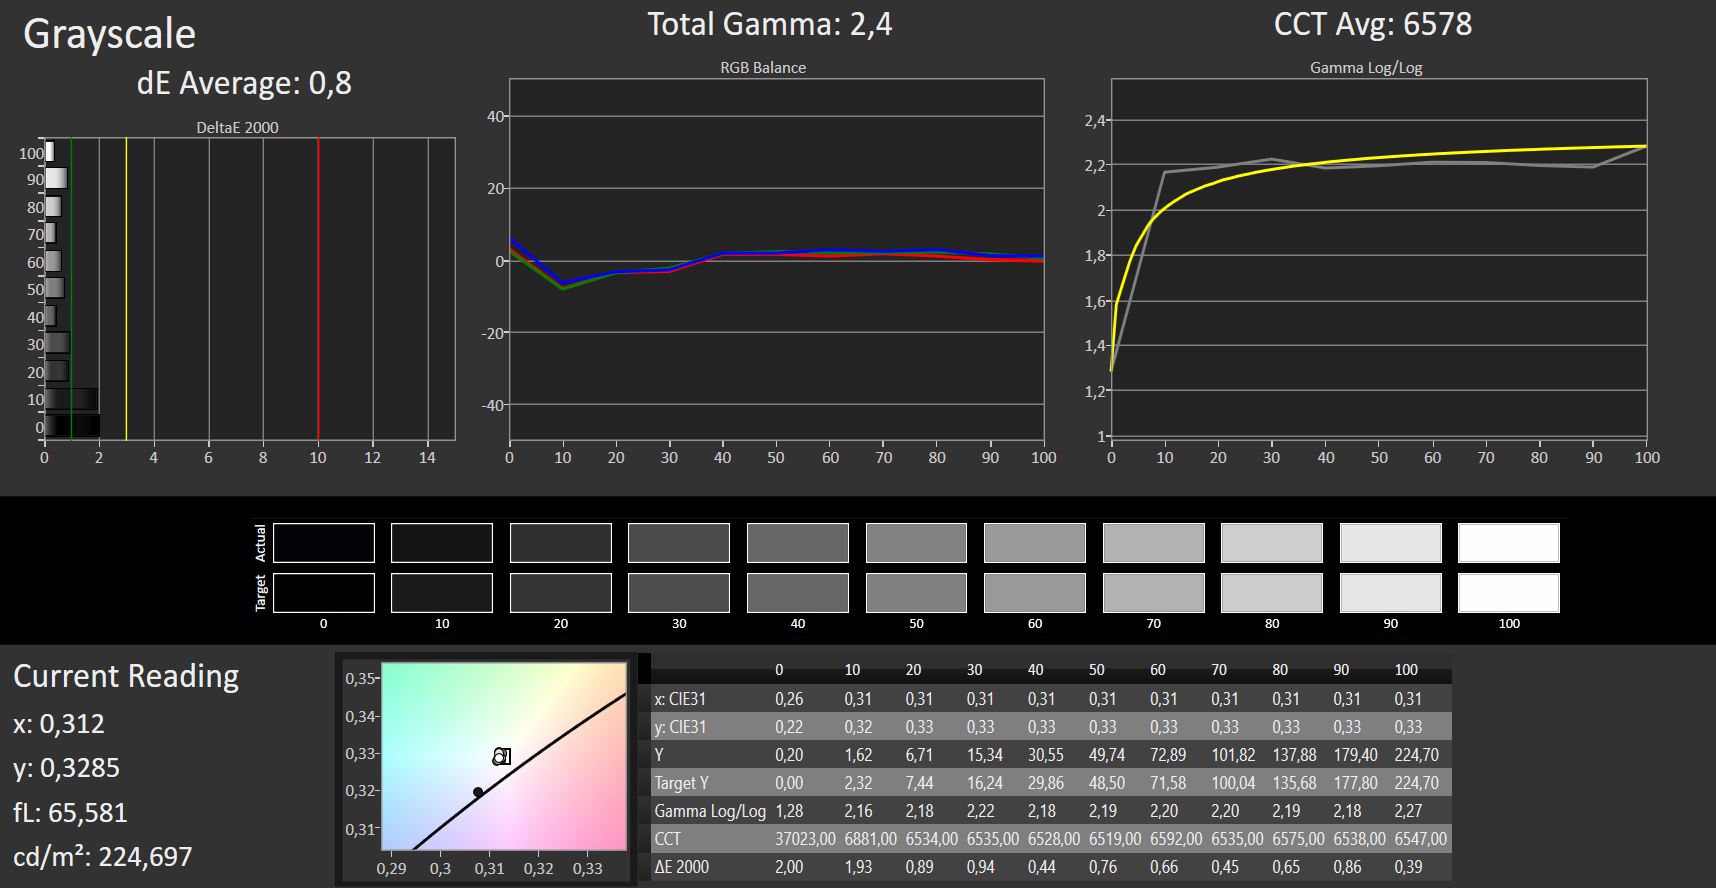
ΔE Greyscale Calman: 5.85 | ∀{0.09-98 Ø4.97}
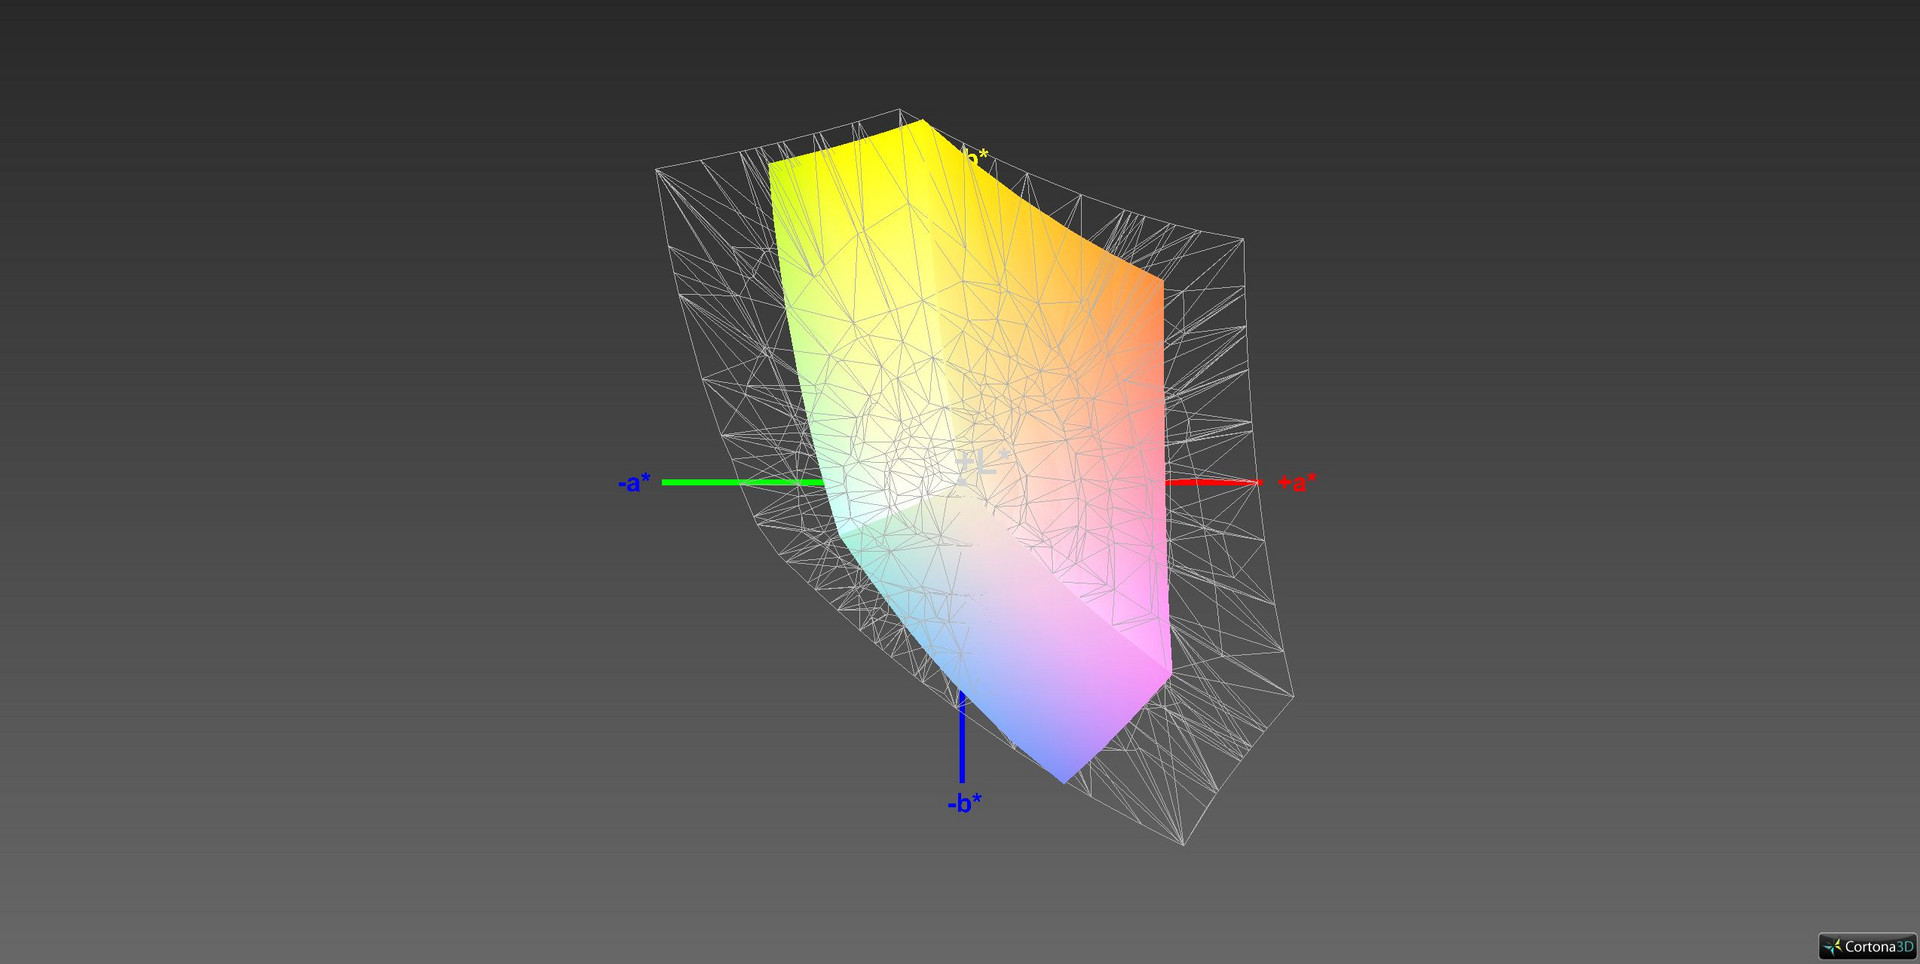
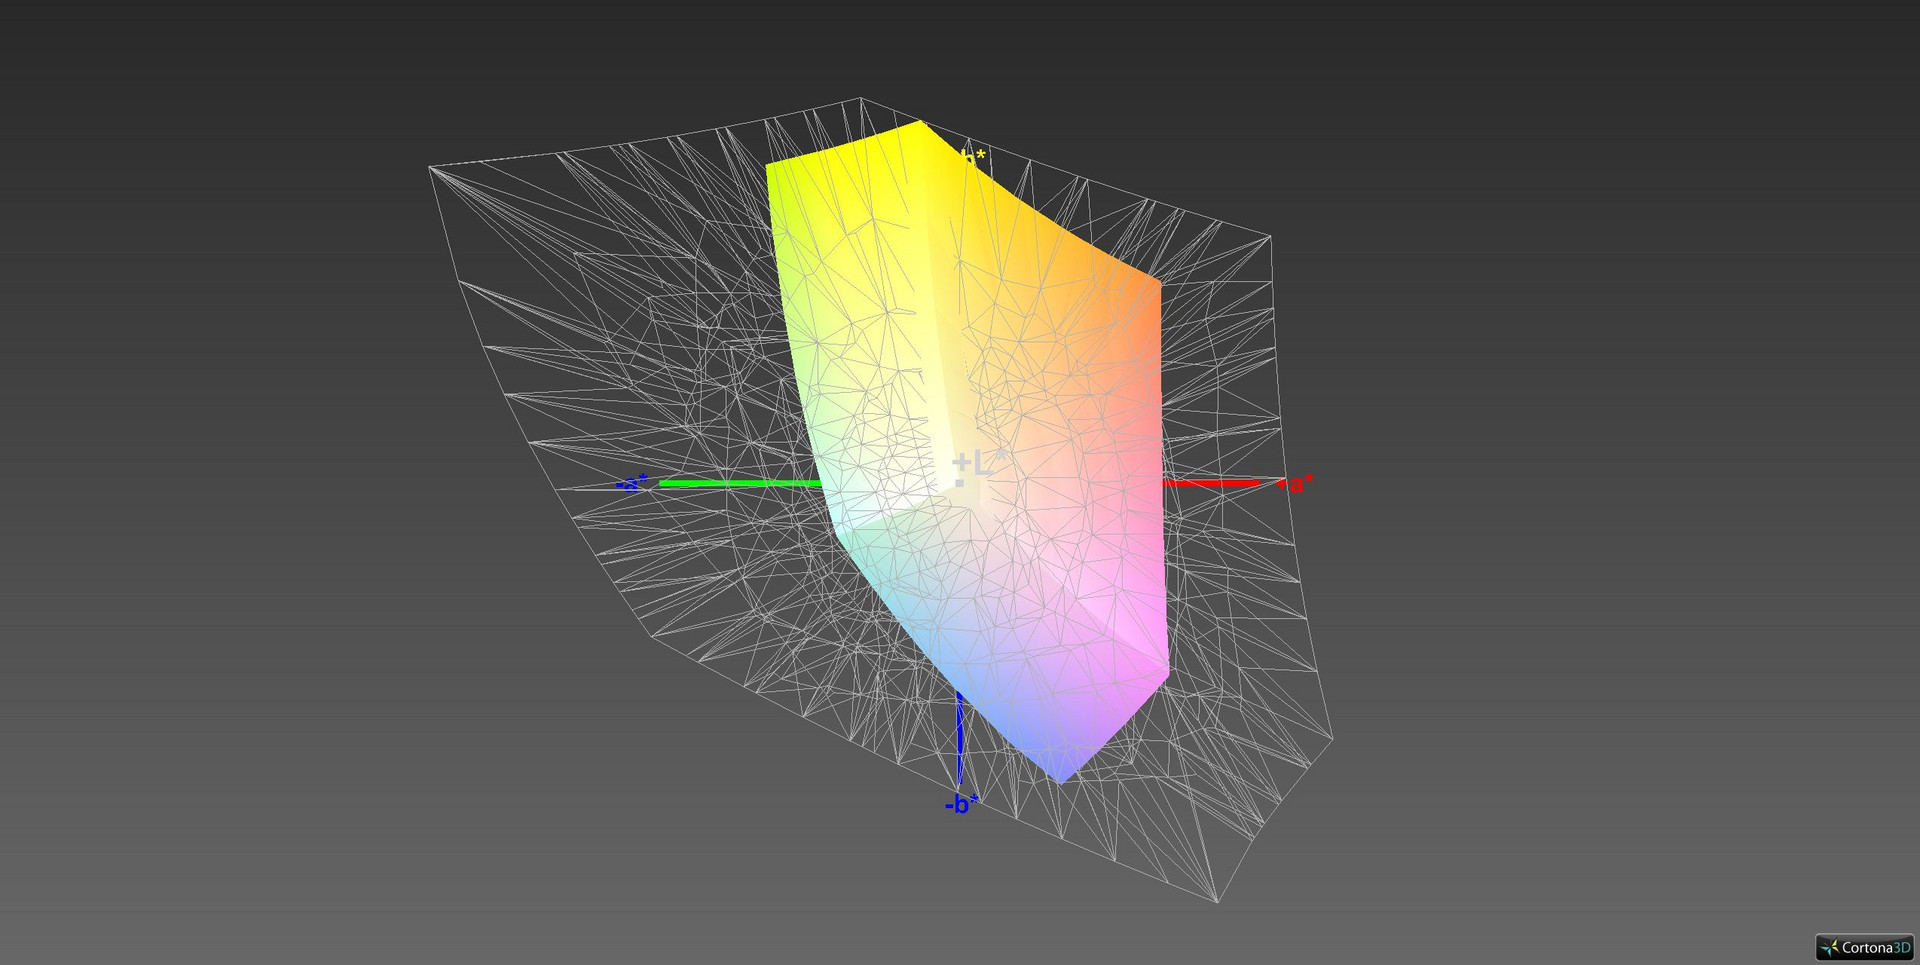
59% sRGB (Argyll 1.6.3 3D)
38% AdobeRGB 1998 (Argyll 1.6.3 3D)
40.96% AdobeRGB 1998 (Argyll 3D)
59.3% sRGB (Argyll 3D)
39.64% Display P3 (Argyll 3D)
Gamma: 2.45
CCT: 7169 K
| HP Pavilion 14-ce0002ng BOE072C, , 1920x1080, 14" | HP Pavilion 15-cw0003ng AU Optronics AUO23ED, , 1920x1080, 15.6" | Huawei MateBook X Pro, i7 JDI LPM139M422A, , 3000x2000, 13.9" | Lenovo IdeaPad 530s-14IKB AUO B140QAN02.3, , 2560x1440, 14" | Lenovo ThinkPad T480s-20L8S02E00 LP140QH2-SPB1, , 2560x1440, 14" | Asus Zenbook UX430UN NV140FHM-N62, BOE0718, , 1920x1080, 14" | HP Spectre x360 15-ch011nr BOE0730, , 3840x2160, 15.6" | |
|---|---|---|---|---|---|---|---|
| Display | -7% | 65% | 63% | 73% | 52% | 63% | |
| Display P3 Coverage (%) | 39.64 | 36.7 -7% | 65.8 66% | 65.5 65% | 71.4 80% | 64.6 63% | 68.5 73% |
| sRGB Coverage (%) | 59.3 | 55 -7% | 97.7 65% | 96.2 62% | 96.6 63% | 84.8 43% | 90.7 53% |
| AdobeRGB 1998 Coverage (%) | 40.96 | 37.91 -7% | 67.5 65% | 66.1 61% | 72.1 76% | 62 51% | 66.3 62% |
| Response Times | 8% | 7% | -24% | 10% | -18% | 8% | |
| Response Time Grey 50% / Grey 80% * (ms) | 40 ? | 40 ? -0% | 42 ? -5% | 58.4 ? -46% | 36 ? 10% | 43.6 ? -9% | 38 ? 5% |
| Response Time Black / White * (ms) | 31 ? | 26 ? 16% | 25 ? 19% | 31.2 ? -1% | 28 ? 10% | 39.2 ? -26% | 27.6 ? 11% |
| PWM Frequency (Hz) | 200 ? | 200 ? | 943 ? | ||||
| Screen | -3% | 64% | 24% | 31% | 21% | 14% | |
| Brightness middle (cd/m²) | 239 | 186 -22% | 550 130% | 311 30% | 311 30% | 310.4 30% | 329.3 38% |
| Brightness (cd/m²) | 223 | 180 -19% | 512 130% | 293 31% | 302 35% | 303 36% | 316 42% |
| Brightness Distribution (%) | 88 | 88 0% | 88 0% | 85 -3% | 91 3% | 89 1% | 84 -5% |
| Black Level * (cd/m²) | 0.27 | 0.15 44% | 0.32 -19% | 0.2 26% | 0.36 -33% | 0.31 -15% | 0.31 -15% |
| Contrast (:1) | 885 | 1240 40% | 1719 94% | 1555 76% | 864 -2% | 1001 13% | 1062 20% |
| Colorchecker dE 2000 * | 5.3 | 5.94 -12% | 2.28 57% | 6 -13% | 3 43% | 4.07 23% | 4.78 10% |
| Colorchecker dE 2000 max. * | 10.03 | 10.81 -8% | 4.36 57% | 11.6 -16% | 6.1 39% | 8.33 17% | 11.75 -17% |
| Colorchecker dE 2000 calibrated * | 3.64 | 6.07 -67% | 0.8 78% | 1.6 56% | 1.7 53% | 4.07 -12% | 3.51 4% |
| Greyscale dE 2000 * | 5.85 | 4.44 24% | 3.27 44% | 8.7 -49% | 4 32% | 2.8 52% | 7.9 -35% |
| Gamma | 2.45 90% | 2.81 78% | 2.35 94% | 2.19 100% | 2.17 101% | 2.217 99% | 2.24 98% |
| CCT | 7169 91% | 6272 104% | 6819 95% | 8426 77% | 6961 93% | 7033 92% | 8323 78% |
| Color Space (Percent of AdobeRGB 1998) (%) | 38 | 35 -8% | 62 63% | 60.9 60% | 66.7 76% | 55.3 46% | 58.8 55% |
| Color Space (Percent of sRGB) (%) | 59 | 55 -7% | 98 66% | 96 63% | 96.7 64% | 84.6 43% | 90.4 53% |
| Total Average (Program / Settings) | -1% /
-3% | 45% /
57% | 21% /
25% | 38% /
36% | 18% /
22% | 28% /
22% |
* ... smaller is better
Our test device has a relatively low 0.27 cd/m² black value, which is better than most of our comparison devices. However, our test device’s low maximum brightness means that the display only has an 885:1 contrast ratio. Our test device’s contrast ratio is common for devices at this price, but it is resoundingly beaten by the Pavilion 15, the MateBook X Pro and the Lenovo IdeaPad 530s in this respect. In daily use, colors will look duller on the Pavilion 14 than on those three comparison devices.
Our test device has a Delta E ColorChecker divergence of 5.3 from the reference color space by default, but we reduced this value with calibration to 3.64. Likewise, we measured the grayscale deviation at 5.85; ideal divergences are anything below 3. We have included our calibrated ICC profile above should you wish to use it.
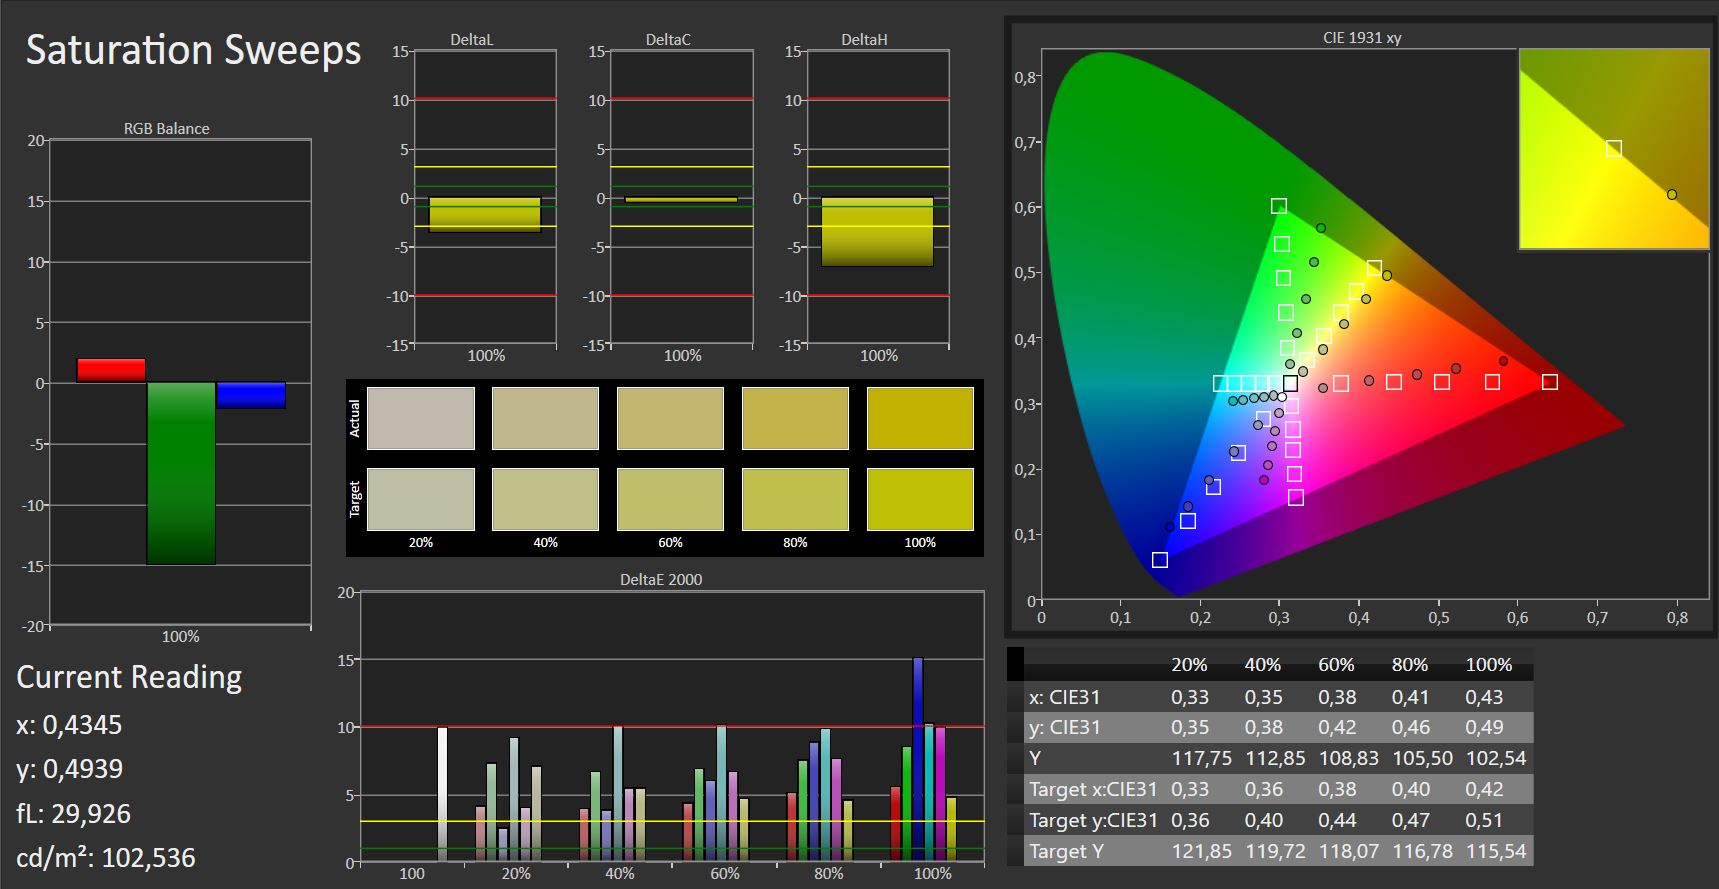
The Pavilion 14 has poor color space accuracy though, being 38% AdobeRGB and 59% sRGB accurate. These values are below average and make the Pavilion 14 unsuitable for professional photo or image-editing.

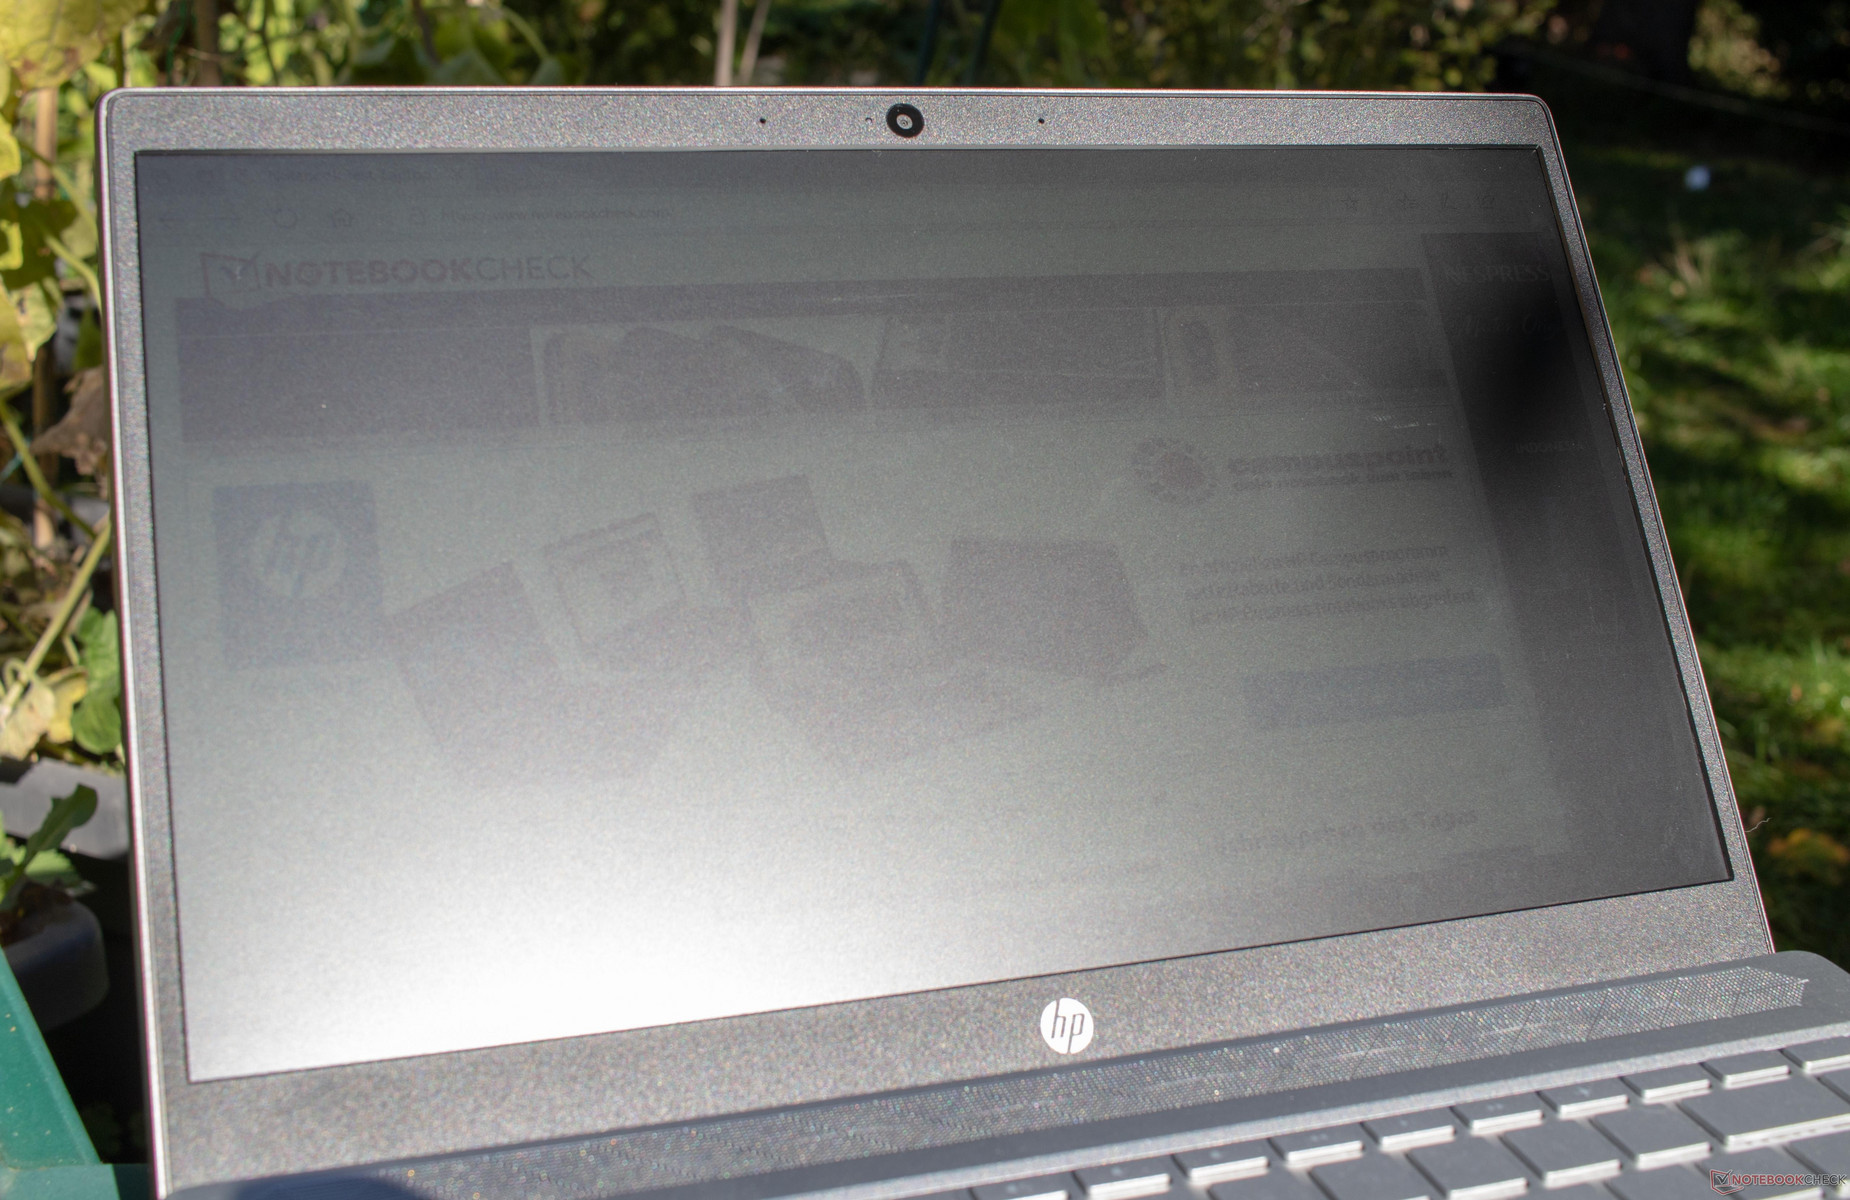
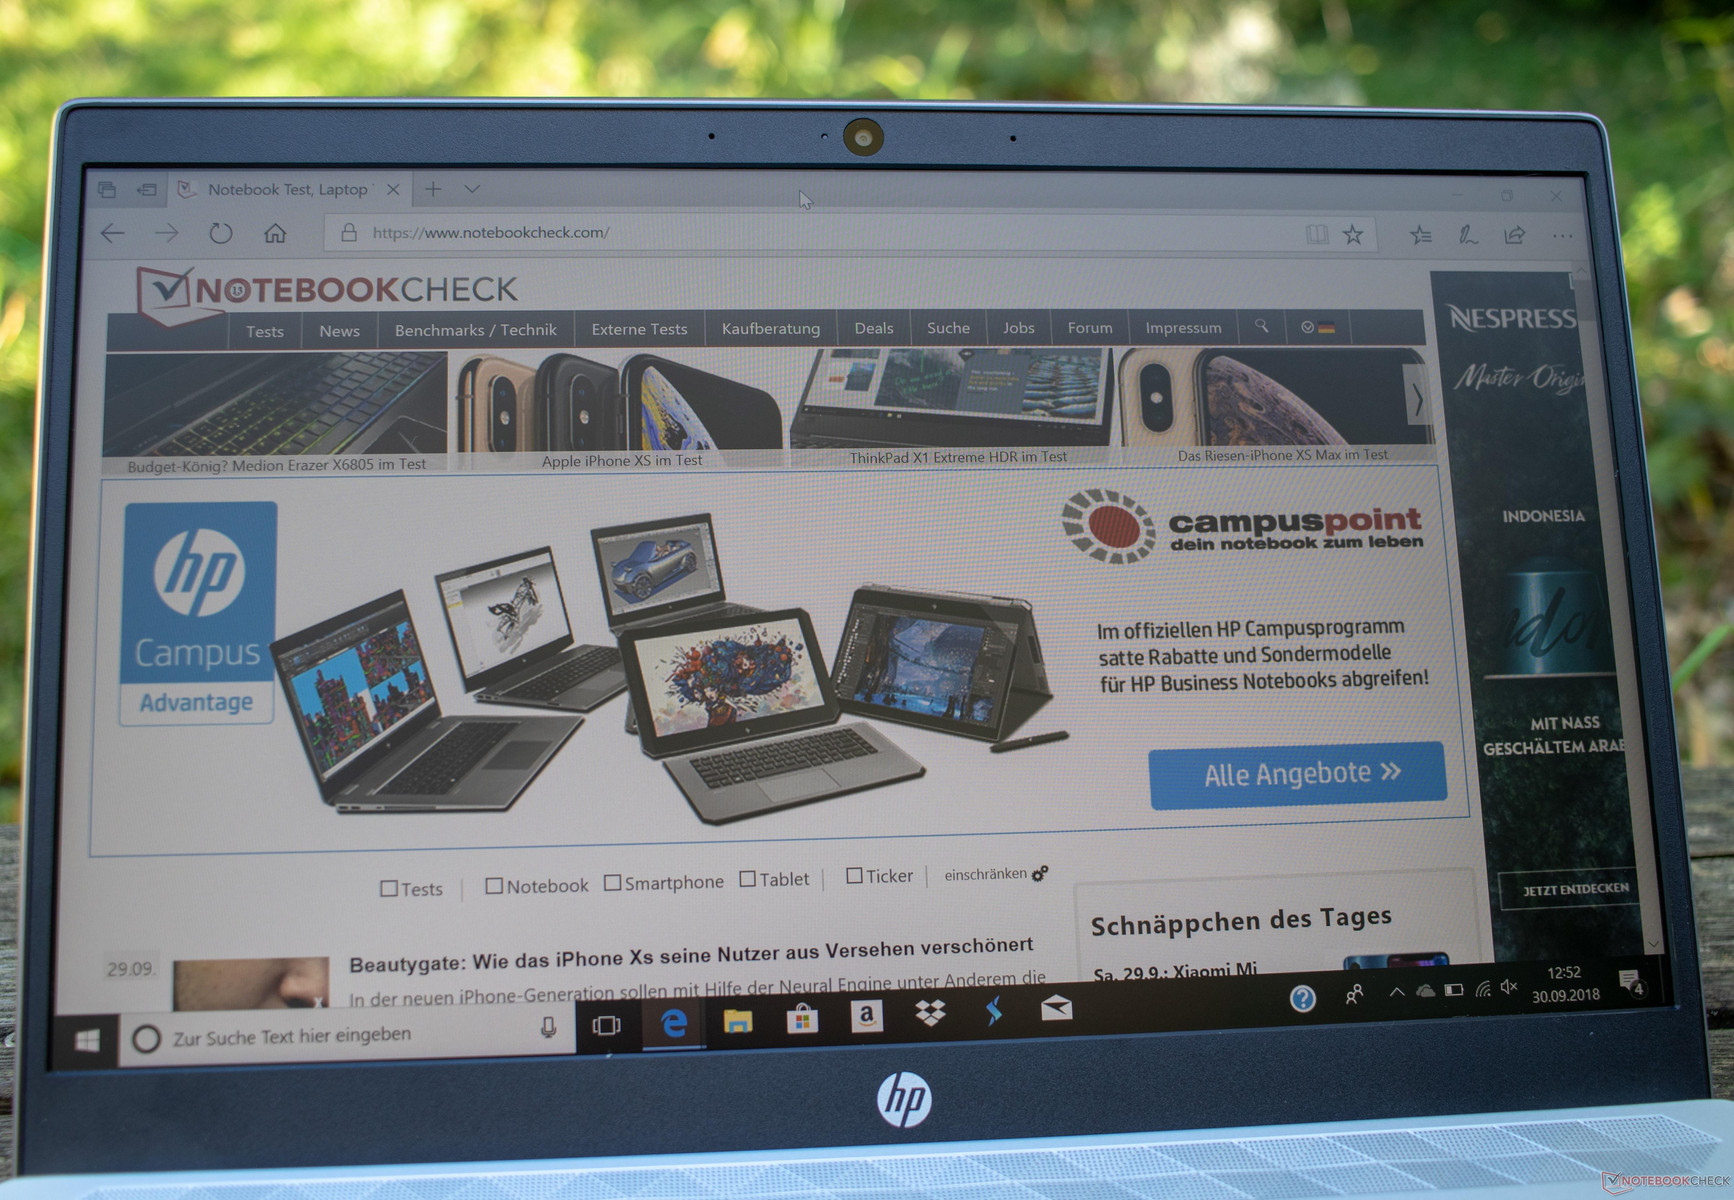
Using our test device outdoors is a miserable experience. We are unable to see anything on the Pavilion 14’s matte display when using it on a sunny autumn afternoon. We suspect that the lack of readability stems from the panel’s low maximum luminosity and the finish of the top layer of the display. We doubt that the display would be any more readable in direct sunlight even if it reached above 300 cd/m².
Display Response Times
| ↔ Response Time Black to White | ||
|---|---|---|
| 31 ms ... rise ↗ and fall ↘ combined | ↗ 18 ms rise | 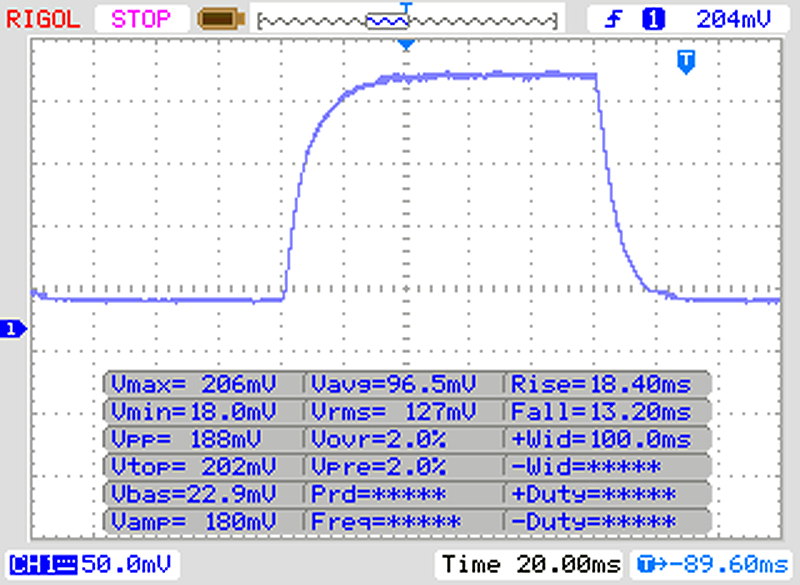 |
| ↘ 13 ms fall | ||
| The screen shows slow response rates in our tests and will be unsatisfactory for gamers. In comparison, all tested devices range from 0.1 (minimum) to 240 (maximum) ms. » 84 % of all devices are better. This means that the measured response time is worse than the average of all tested devices (19.8 ms). | ||
| ↔ Response Time 50% Grey to 80% Grey | ||
| 40 ms ... rise ↗ and fall ↘ combined | ↗ 21 ms rise | 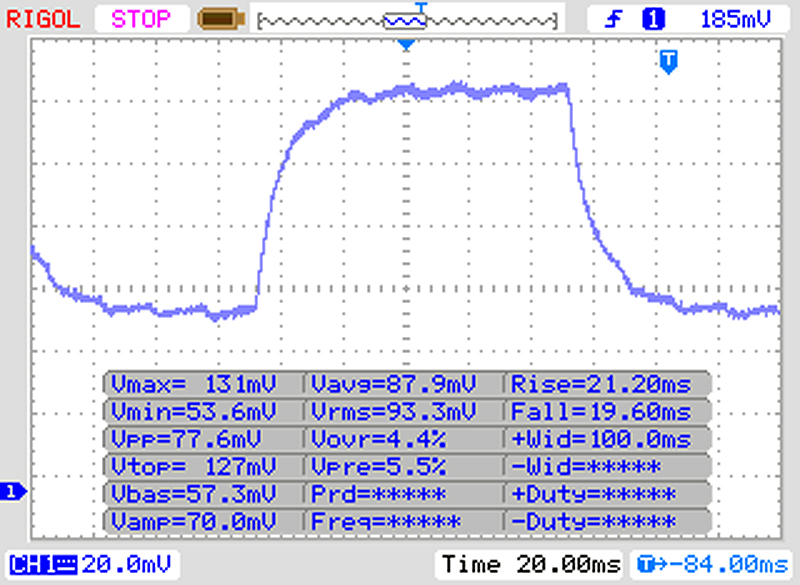 |
| ↘ 19 ms fall | ||
| The screen shows slow response rates in our tests and will be unsatisfactory for gamers. In comparison, all tested devices range from 0.165 (minimum) to 636 (maximum) ms. » 61 % of all devices are better. This means that the measured response time is worse than the average of all tested devices (31 ms). | ||
Screen Flickering / PWM (Pulse-Width Modulation)
| Screen flickering / PWM detected | 200 Hz | ≤ 90 % brightness setting | 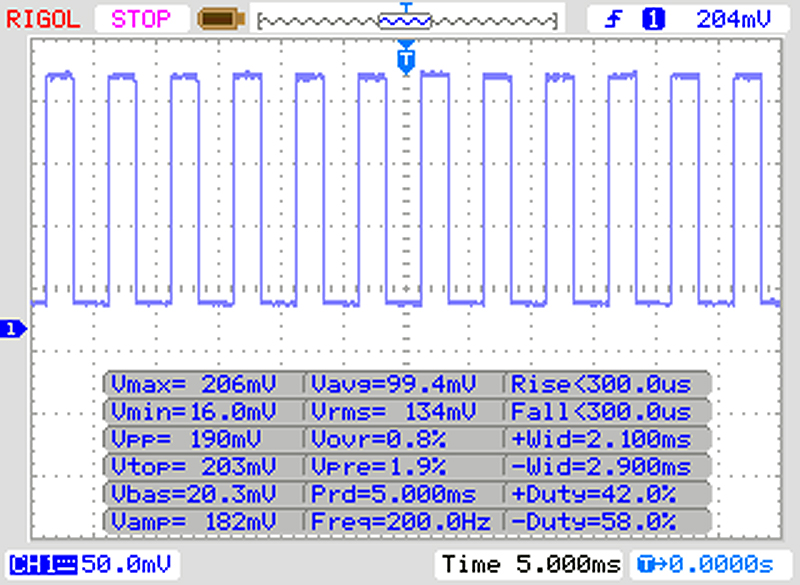 |
The display backlight flickers at 200 Hz (worst case, e.g., utilizing PWM) Flickering detected at a brightness setting of 90 % and below. There should be no flickering or PWM above this brightness setting. The frequency of 200 Hz is relatively low, so sensitive users will likely notice flickering and experience eyestrain at the stated brightness setting and below. In comparison: 52 % of all tested devices do not use PWM to dim the display. If PWM was detected, an average of 7747 (minimum: 5 - maximum: 343500) Hz was measured. | |||
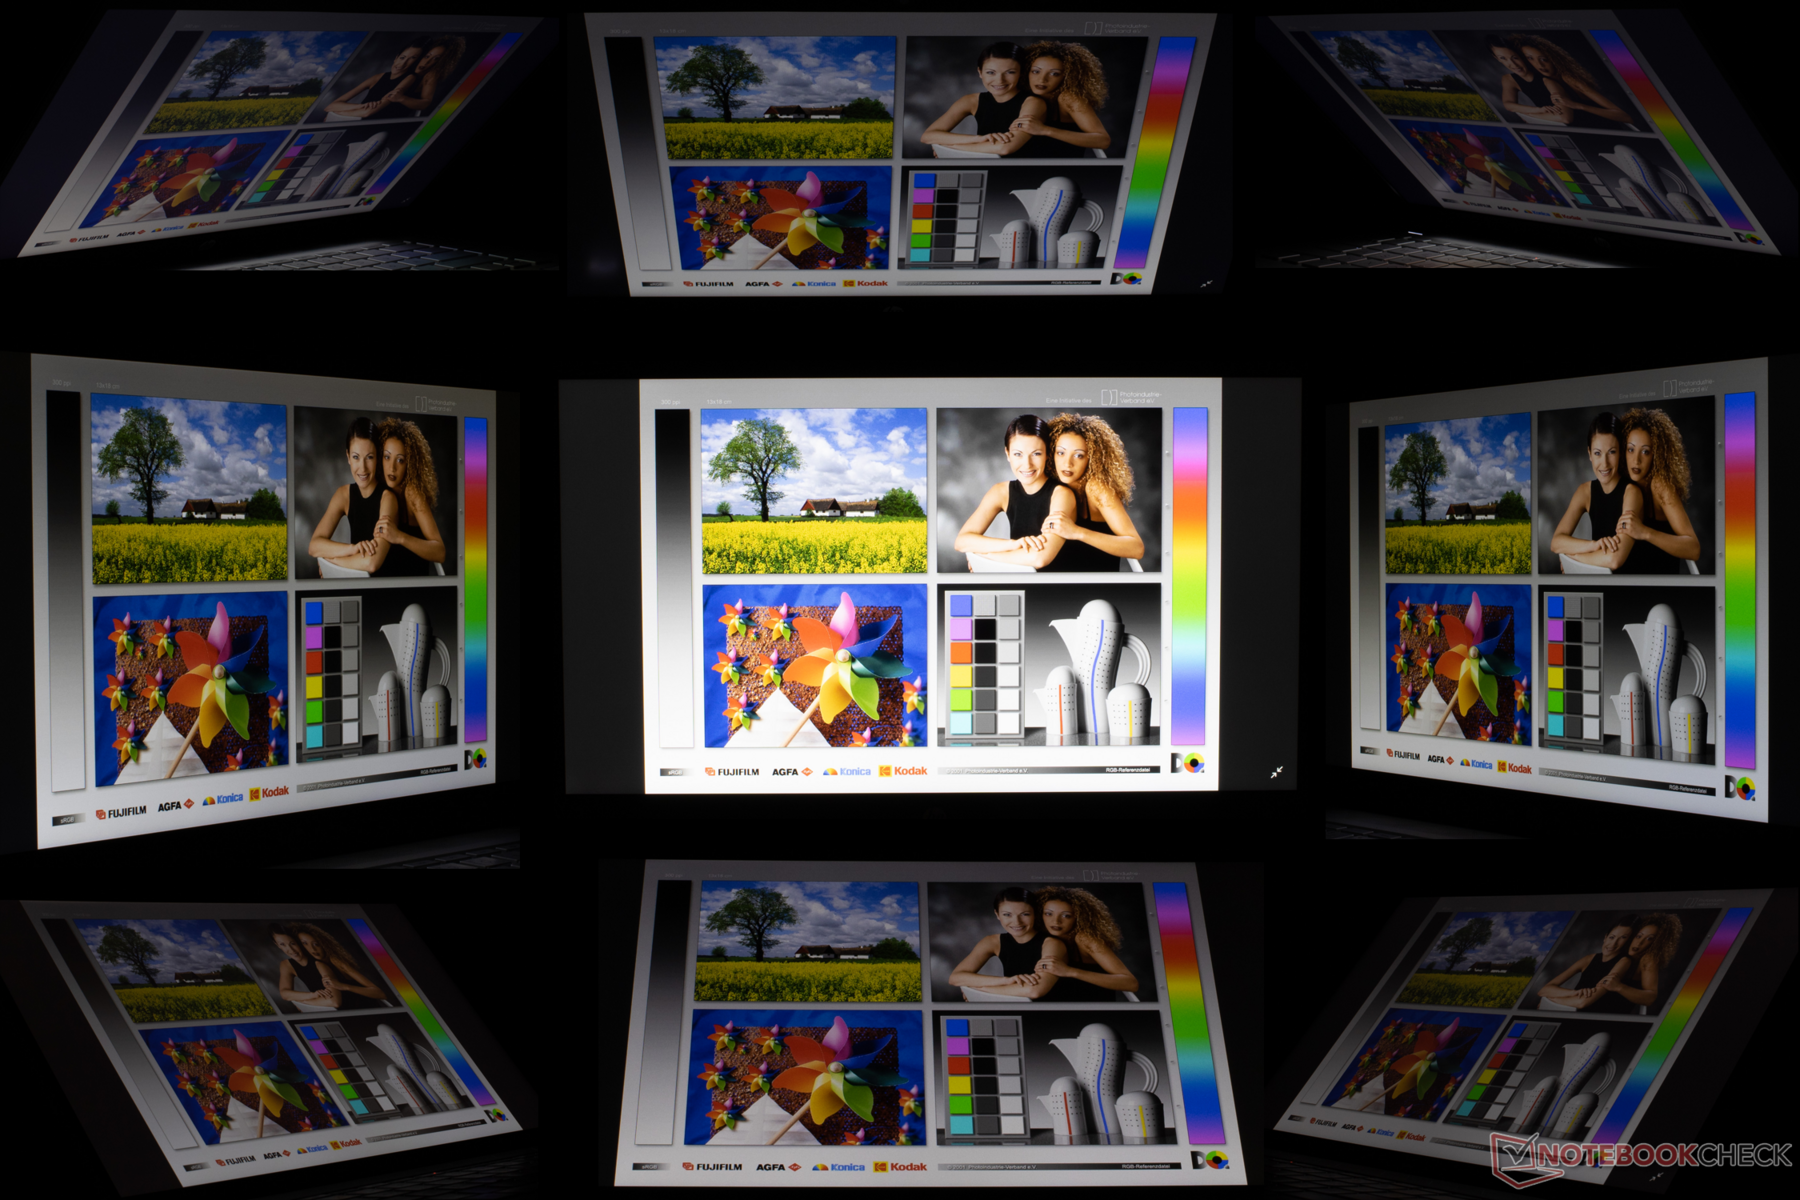
As expected, the Pavilion 14 has strong viewing angles thanks to its IPS display. We observed some brightness distortion at acute viewing angles, but the display remained readable. Our test device has no display backlight bleeding either.
Performance
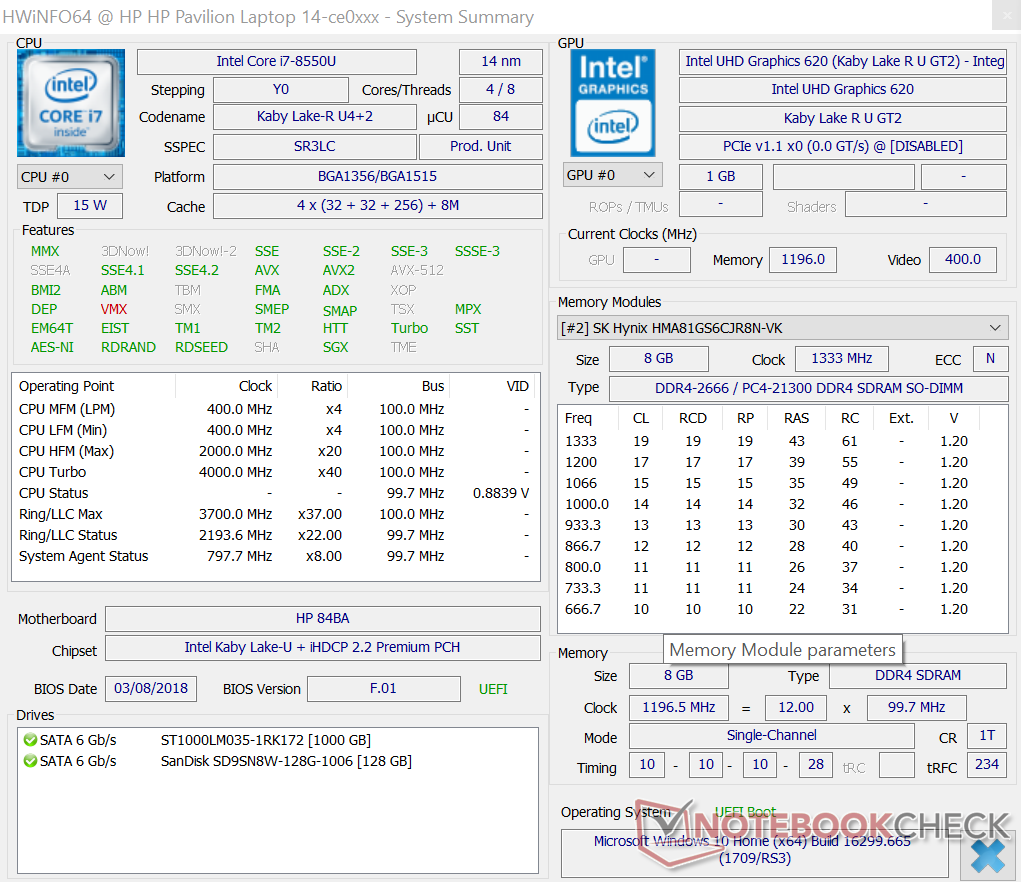
An Intel Core i7-8550U processor powers our test device, which also integrates Intel's UHD Graphics 620. HP has also equipped the device with an Nvidia GeForce MX150 dedicated GPU with 2 GB of GDDR5 VRAM. These components are complemented by 8 GB of DDR4-2400 RAM that runs in single-channel mode. The Pavilion has two SO-DIMM RAM slots with a 32 GB theoretical limit. Our test device also has a small 128 GB SanDisk SSD and a 1 TB Seagate HDD.
The hardware spec sheet makes for tempting reading, particularly as the Pavilion 14-ce0002ng sells for 899 Euros (~$1039) on HP’s online store in Germany. The GeForce MX150 could prove a useful addition for occasional gaming too, while the rest of the device should be powerful enough for most multimedia applications.

Processor
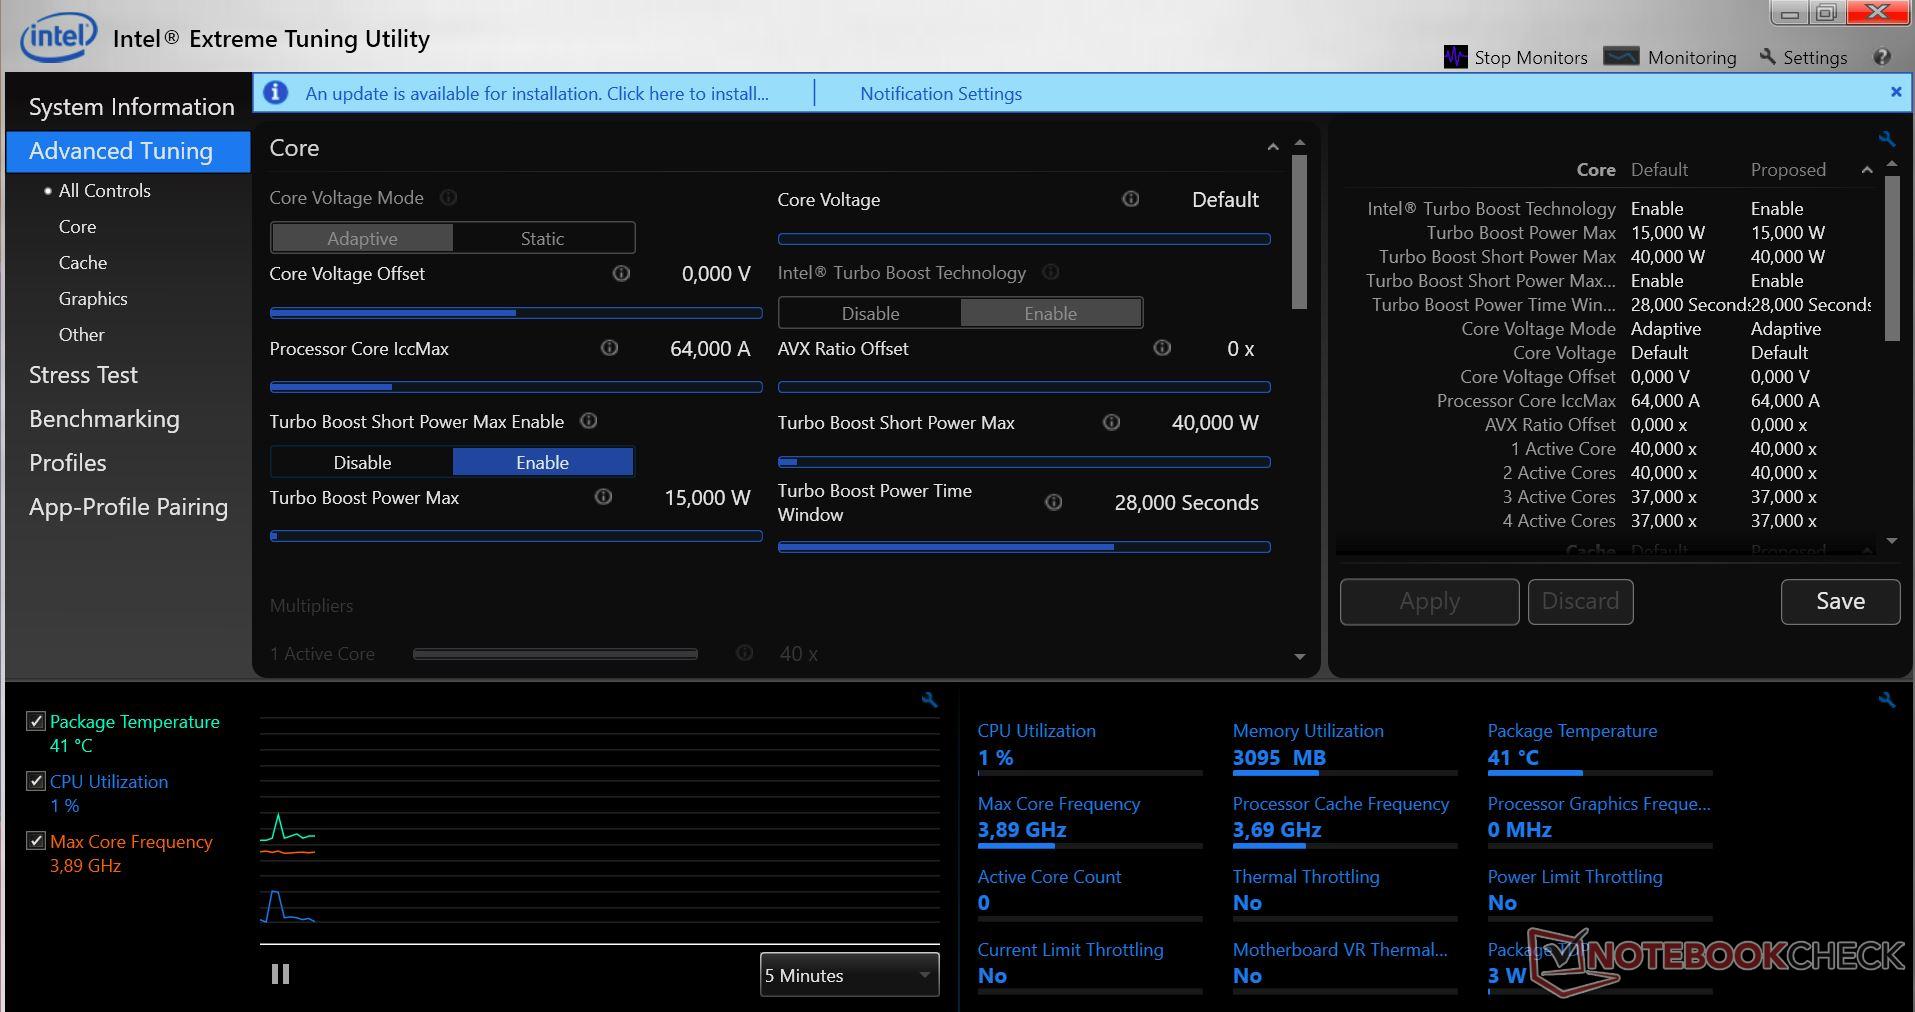
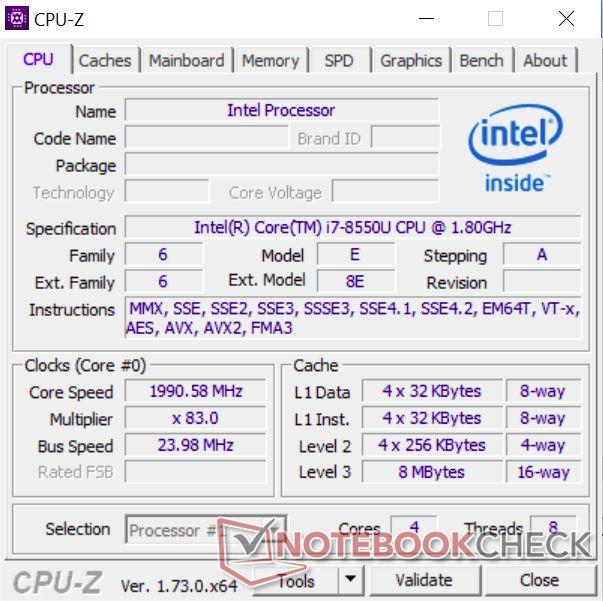
The Intel Core i7-8550U is a popular chip that has appeared in many devices that we have reviewed in the last year. The eighth-generation processor has four cores that can clock up to 4 GHz and has a 15 W thermal design power (TDP). However, only two cores can simultaneously reach 4 GHz with the processor averaging 3.7 GHz across all four cores. Please see our CPU benchmark page for a more detailed look at the Core i7-8550U and how it performs in different devices.
Our test device performs satisfactorily in Cinebench R15, finishing in our comparison table for the single-threaded benchmark but 7% below average in the multithreaded version. We ran each benchmark 40 times in a loop to determine how our test device performed under sustained load. The Pavilion 14 exceeded our expectations, maintaining 96% peak performance by the end of our looped benchmark. By contrast, the ThinkPad T480s and ZenBook UX430UN both perform around 15% lower by the end of the benchmark loop than they did at the start. In short, the Pavilion 14 should not thermal throttle in daily use.
System Performance
Our test device performed disappointingly in system performance benchmarks, scoring 7-8% less in both PCMark 8 benchmarks than the average of Core i7-8550U and GeForce MX150-powered devices that we have currently tested. The Pavilion 14 performs better than the equivalently equipped MateBook X Pro in both benchmarks but is only on par with the Ryzen 5 2500U-powered Pavilion 15; the Ryzen 5 2500U is comparable to the Core i5-8250U and not the more powerful Core i7-8550U.
Incidentally, both the ZenBook UX430UN and the ThinkPad T480s scored noticeably higher than the Pavilion 14 in both PCMark 8 benchmarks.
| PCMark 8 Home Score Accelerated v2 | 3379 points | |
| PCMark 8 Work Score Accelerated v2 | 4456 points | |
Help | ||
Storage Devices
As mentioned earlier, our test device is equipped with a 128 GB SanDisk X600 SSD and a 1 TB SATA III HDD that operates at 5,400 RPM. The drives carry the model numbers SD9SN8W-128G and ST1000LM035-1RK172, respectively. The SSD is comparatively slow and cannot compete with the faster NVMe drives found in our comparison devices. Specifically, the ThinkPad T480s’ drive, the Samsung PM981, has six times faster write speeds than the SanDisk SSD. In practice, the ThinkPad T480s will open applications quicker and generally feel faster than the Pavilion 14 despite having the same processor and GPU.
| HP Pavilion 14-ce0002ng SanDisk X600 SD9SN8W-128G | Huawei MateBook X Pro, i7 Toshiba XG5 KXG50ZNV512G | Lenovo IdeaPad 530s-14IKB SK Hynix PC401 512GB M.2 (HFS512GD9TNG) | Lenovo ThinkPad T480s-20L8S02E00 Samsung SSD PM981 MZVLB512HAJQ | |
|---|---|---|---|---|
| CrystalDiskMark 3.0 | 103% | 138% | 446% | |
| Read Seq (MB/s) | 508 | 1317 159% | 1360 168% | 2588 409% |
| Write Seq (MB/s) | 202.4 | 459.9 127% | 733 262% | 1858 818% |
| Read 512 (MB/s) | 309.6 | 628 103% | 769 148% | 1799 481% |
| Write 512 (MB/s) | 158.2 | 461.4 192% | 642 306% | 1863 1078% |
| Read 4k (MB/s) | 33.15 | 33.79 2% | 39.83 20% | 62.7 89% |
| Write 4k (MB/s) | 68.7 | 117.5 71% | 100 46% | 146.8 114% |
| Read 4k QD32 (MB/s) | 262.1 | 360 37% | 330.3 26% | 446.6 70% |
| Write 4k QD32 (MB/s) | 116.4 | 273.6 135% | 260.2 124% | 706 507% |

Graphics Card
The Pavilion 14 can use either an Intel UHD Graphics 620 or GeForce MX150 for graphics, the latter of which has 2 GB of dedicated GDDR5 VRAM. The MX150 is on par with the older GeForce GTX 950M but is considerably weaker than the GeForce GTX 1050. Please see our GPU benchmark page for more information on the MX150 and how it compares to other GPUs.
GPU benchmark results are a mixed bag. Our test device performs worse than the MateBook X Pro with its weaker 1D12 MX150 in the 1280x720 3DMark 11 benchmark and is 29% below average. However, the Pavilion 14 then performed slightly above average in the remaining 3DMark benchmarks, finishing second behind the Spectre x360 15 in both tests. These synthetic benchmarks only tell half the story though as we will discuss below.
| 3DMark 11 Performance | 3130 points | |
| 3DMark Cloud Gate Standard Score | 12943 points | |
| 3DMark Fire Strike Score | 3215 points | |
Help | ||
Gaming Performance
The Pavilion 14 is no gaming monster, consistently scoring over 40% lower in gaming benchmarks than the average of MX150-equipped devices that we have currently tested. The Lenovo IdeaPad 530s performs up to 50% better too. Overall, the Pavilion 14 should play older games smoothly, but it will struggle with complex modern titles.
| Shadow of the Tomb Raider | |
| 1280x720 Lowest Preset | |
| Average of class Multimedia (66 - 204, n=7, last 2 years) | |
| Average NVIDIA GeForce MX150 (30 - 50, n=5) | |
| HP Pavilion 14-ce0002ng | |
| 1920x1080 Medium Preset | |
| Average of class Multimedia (28 - 167, n=8, last 2 years) | |
| Average NVIDIA GeForce MX150 (11 - 18, n=5) | |
| HP Pavilion 14-ce0002ng | |
| 1920x1080 High Preset AA:SM | |
| Average of class Multimedia (26 - 143, n=8, last 2 years) | |
| Average NVIDIA GeForce MX150 (9 - 15, n=5) | |
| HP Pavilion 14-ce0002ng | |
| Final Fantasy XV Benchmark | |
| 1280x720 Lite Quality | |
| Average of class Multimedia (21.4 - 232, n=61, last 2 years) | |
| Average NVIDIA GeForce MX150 (23 - 36.9, n=7) | |
| Asus Zenbook UX430UN | |
| HP Pavilion 14-ce0002ng | |
| 1920x1080 Standard Quality | |
| Average of class Multimedia (11.4 - 181.1, n=61, last 2 years) | |
| Average NVIDIA GeForce MX150 (12 - 17.4, n=6) | |
| Asus Zenbook UX430UN | |
| HP Pavilion 14-ce0002ng | |
| 1920x1080 High Quality | |
| Average of class Multimedia (7.61 - 144.4, n=61, last 2 years) | |
| Average NVIDIA GeForce MX150 (7 - 10.9, n=5) | |
| Asus Zenbook UX430UN | |
| low | med. | high | ultra | |
|---|---|---|---|---|
| Final Fantasy XV Benchmark (2018) | 23 | 12 | ||
| Far Cry 5 (2018) | 31 | 12 | 10 | 9 |
| Shadow of the Tomb Raider (2018) | 33 | 13 | 11 |
Emissions
Fan Noise
The Pavilion 14 is a noisy laptop. The fan in our test device reaches 32.7 dB(A) at idle, while the 1 TB HDD gets slightly louder at 33.4 dB(A). Incidentally, the HDD noise at idle is as loud as the Ryzen 5 2500U HP Pavilion 15 even when the latter is operating under full load.
Predictably, the fan noise ramps up further in stress tests, but 45 dB(A) is comparatively loud for a multimedia laptop. We suspect that the smaller case of the Pavilion 14 struggles to manage the heat created by its powerful components compared to the larger Pavilion 15; hence, the fans turn on quickly during a stress test.
Noise level
| Idle |
| 32.7 / 32.7 / 32.7 dB(A) |
| HDD |
| 33.4 dB(A) |
| Load |
| 42.9 / 45 dB(A) |
 | ||
30 dB silent 40 dB(A) audible 50 dB(A) loud |
||
min: | ||
Temperature
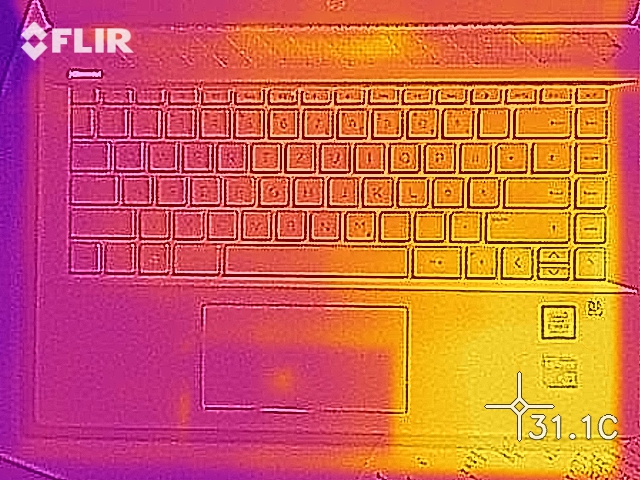
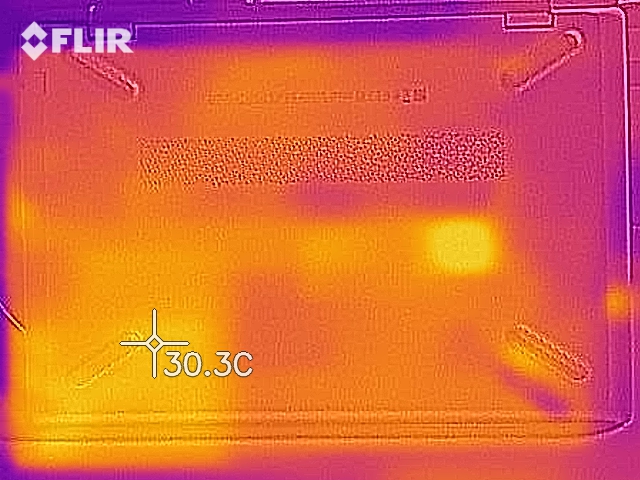
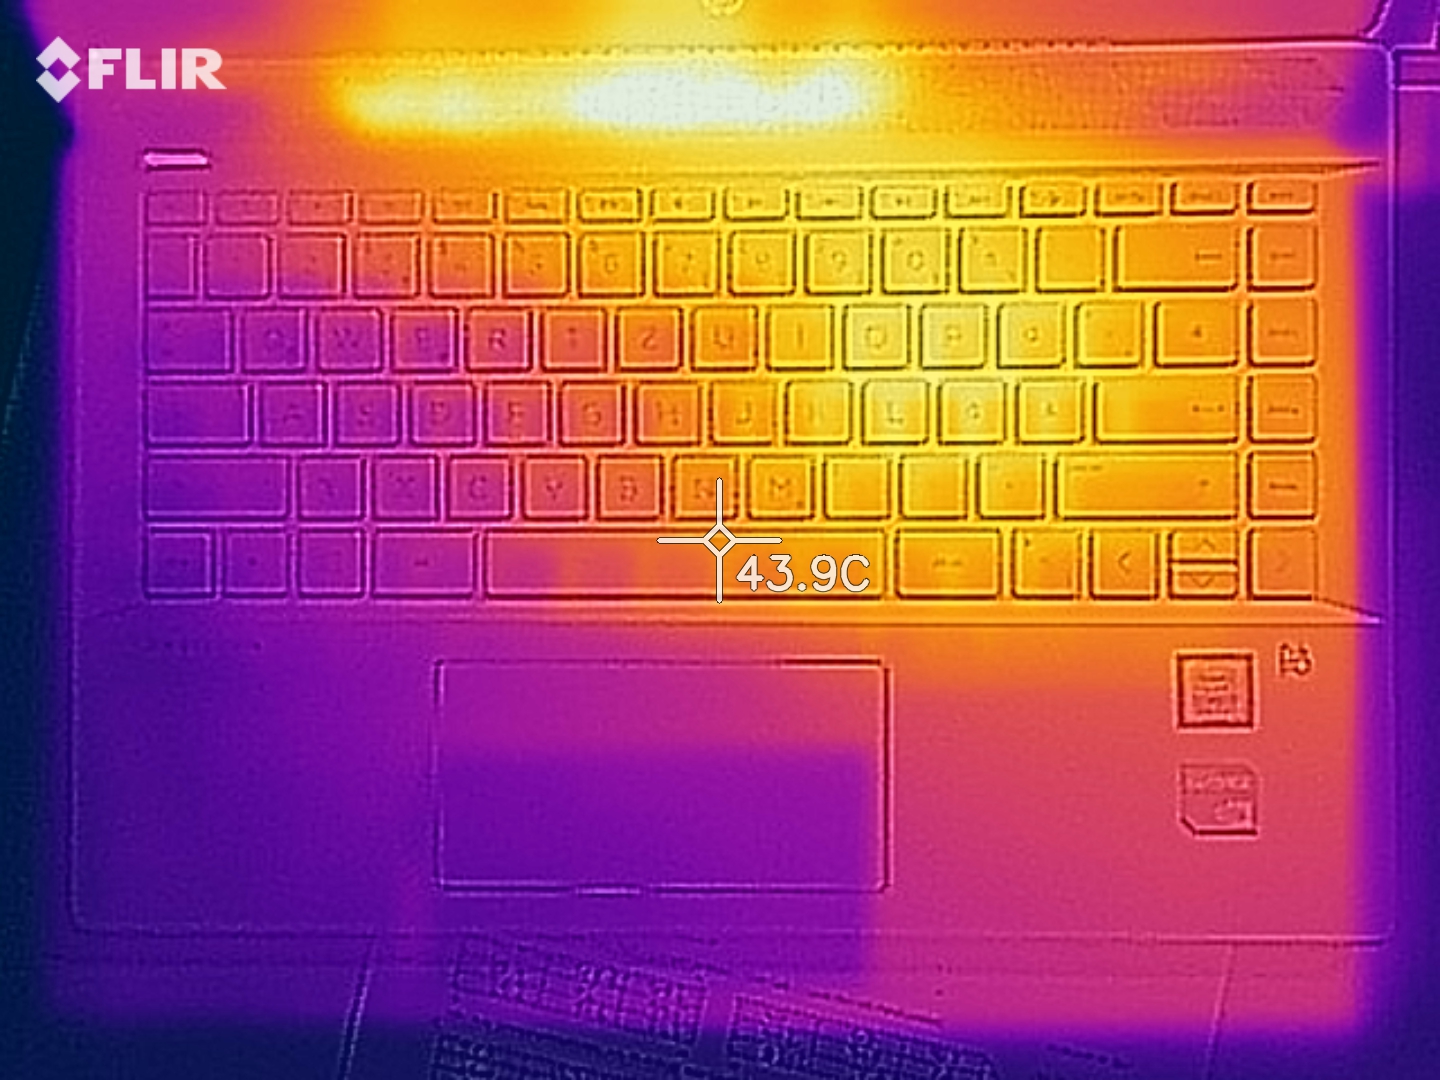
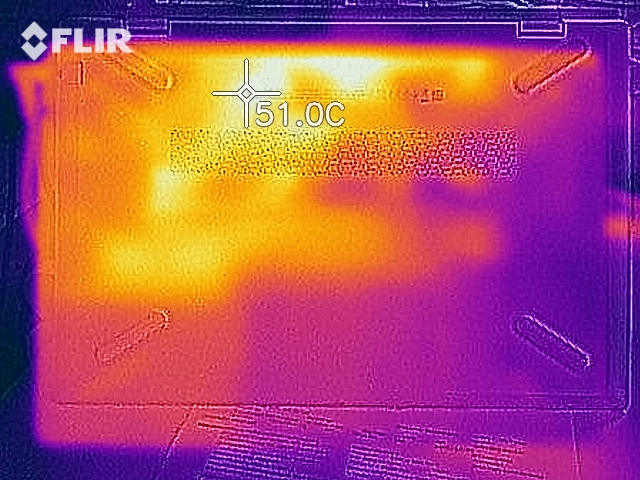
The Pavilion 14 not only has loud fans but also has poor thermals. Our test device has relatively cool surface temperatures at idle, with no area reaching above 23.1 °C. However, surface temperatures rocket when the device is working under full load. Our test device reaches a maximum of 49.2 °C in the top right of the keyboard deck and 47 °C on the underside next to the display hinge. Moreover, most of the keyboard reaches above 40 °C, which is noticeably hot. Interestingly, the heat distribution is uneven with surface temperatures varying by up to 24 °C on the top case and 21 °C on the bottom case.
(-) The maximum temperature on the upper side is 49.2 °C / 121 F, compared to the average of 36.8 °C / 98 F, ranging from 21 to 71 °C for the class Multimedia.
(-) The bottom heats up to a maximum of 47 °C / 117 F, compared to the average of 39.1 °C / 102 F
(+) In idle usage, the average temperature for the upper side is 21.8 °C / 71 F, compared to the device average of 31.3 °C / 88 F.
(+) The palmrests and touchpad are cooler than skin temperature with a maximum of 31.3 °C / 88.3 F and are therefore cool to the touch.
(-) The average temperature of the palmrest area of similar devices was 28.7 °C / 83.7 F (-2.6 °C / -4.6 F).
Speakers
The Pavilion has Bang & Olufsen-branded stereo speakers, which sound better subjectively than our mediocre test results demonstrate. The speakers reproduce high tones well but struggle with bass tones like those in many other equivalently sized laptops. The speakers do not crackle or distort at maximum volume, but those in our test device do not get beyond 70 dB(A), which is comparatively quiet for laptop speakers. Hence, we could sit directly next to the laptop happily listening to music at 100% volume. This is mostly because the sound quality remains listenable at maximum volume, although we would still be able to tolerate the speakers being a few percent louder.
HP Pavilion 14-ce0002ng audio analysis
(-) | not very loud speakers (69.9 dB)
Bass 100 - 315 Hz
(-) | nearly no bass - on average 26.7% lower than median
(±) | linearity of bass is average (12.8% delta to prev. frequency)
Mids 400 - 2000 Hz
(+) | balanced mids - only 2.3% away from median
(+) | mids are linear (6.2% delta to prev. frequency)
Highs 2 - 16 kHz
(+) | balanced highs - only 1.5% away from median
(+) | highs are linear (2.8% delta to prev. frequency)
Overall 100 - 16.000 Hz
(±) | linearity of overall sound is average (20.6% difference to median)
Compared to same class
» 70% of all tested devices in this class were better, 8% similar, 22% worse
» The best had a delta of 5%, average was 17%, worst was 45%
Compared to all devices tested
» 55% of all tested devices were better, 8% similar, 37% worse
» The best had a delta of 4%, average was 23%, worst was 134%
Huawei MateBook X Pro, i7 audio analysis
(-) | not very loud speakers (70.2 dB)
Bass 100 - 315 Hz
(±) | reduced bass - on average 12.1% lower than median
(±) | linearity of bass is average (13.5% delta to prev. frequency)
Mids 400 - 2000 Hz
(+) | balanced mids - only 4.1% away from median
(+) | mids are linear (6.1% delta to prev. frequency)
Highs 2 - 16 kHz
(+) | balanced highs - only 2.3% away from median
(+) | highs are linear (4.3% delta to prev. frequency)
Overall 100 - 16.000 Hz
(±) | linearity of overall sound is average (16.2% difference to median)
Compared to same class
» 40% of all tested devices in this class were better, 4% similar, 56% worse
» The best had a delta of 5%, average was 18%, worst was 53%
Compared to all devices tested
» 26% of all tested devices were better, 6% similar, 68% worse
» The best had a delta of 4%, average was 23%, worst was 134%
Lenovo IdeaPad 530s-14IKB audio analysis
(±) | speaker loudness is average but good (78.1 dB)
Bass 100 - 315 Hz
(-) | nearly no bass - on average 17.2% lower than median
(±) | linearity of bass is average (14.5% delta to prev. frequency)
Mids 400 - 2000 Hz
(+) | balanced mids - only 2.4% away from median
(+) | mids are linear (6.4% delta to prev. frequency)
Highs 2 - 16 kHz
(+) | balanced highs - only 3.6% away from median
(±) | linearity of highs is average (8.3% delta to prev. frequency)
Overall 100 - 16.000 Hz
(±) | linearity of overall sound is average (16.8% difference to median)
Compared to same class
» 43% of all tested devices in this class were better, 8% similar, 49% worse
» The best had a delta of 5%, average was 18%, worst was 53%
Compared to all devices tested
» 30% of all tested devices were better, 8% similar, 63% worse
» The best had a delta of 4%, average was 23%, worst was 134%
Lenovo ThinkPad T480s-20L8S02E00 audio analysis
(±) | speaker loudness is average but good (78.9 dB)
Bass 100 - 315 Hz
(-) | nearly no bass - on average 19.4% lower than median
(±) | linearity of bass is average (12.1% delta to prev. frequency)
Mids 400 - 2000 Hz
(±) | higher mids - on average 6.5% higher than median
(±) | linearity of mids is average (9.6% delta to prev. frequency)
Highs 2 - 16 kHz
(+) | balanced highs - only 3.5% away from median
(±) | linearity of highs is average (7.6% delta to prev. frequency)
Overall 100 - 16.000 Hz
(±) | linearity of overall sound is average (22.1% difference to median)
Compared to same class
» 58% of all tested devices in this class were better, 8% similar, 34% worse
» The best had a delta of 7%, average was 21%, worst was 53%
Compared to all devices tested
» 64% of all tested devices were better, 6% similar, 30% worse
» The best had a delta of 4%, average was 23%, worst was 134%
Power Management
Power Consumption
The Pavilion 14 is a relatively power-inefficient device. Our test device consumes a minimum of 6.3 W at idle, which can rise to a maximum of 10.2 W. Power consumption then rises to a maximum of 66.3 W under load, averaging at around 59 W.
HP includes a 65 W power supply with the Pavilion 14 that, as our results demonstrate, is only just powerful enough to charge our test device under sustained load. The power supply will take a while to recharge your device fully if you are gaming or doing other intensive tasks as most of its rated capacity will be used on just maintaining the device’s power output.
| Off / Standby | |
| Idle | |
| Load |
|
Key:
min: | |
| HP Pavilion 14-ce0002ng i5-8550U, GeForce MX150, SanDisk X600 SD9SN8W-128G, IPS, 1920x1080, 14" | Huawei MateBook X Pro, i7 i5-8550U, GeForce MX150, Toshiba XG5 KXG50ZNV512G, LTPS, 3000x2000, 13.9" | Lenovo IdeaPad 530s-14IKB i5-8550U, GeForce MX150, SK Hynix PC401 512GB M.2 (HFS512GD9TNG), IPS, 2560x1440, 14" | Lenovo ThinkPad T480s-20L8S02E00 i5-8550U, GeForce MX150, Samsung SSD PM981 MZVLB512HAJQ, IPS LED, 2560x1440, 14" | Asus Zenbook UX430UN i5-8550U, GeForce MX150, SanDisk SD8SN8U512G1002, IPS, 1920x1080, 14" | HP Spectre x360 15-ch011nr i5-8550U, GeForce MX150, SK hynix PC401 NVMe 500 GB, IPS, 3840x2160, 15.6" | Average NVIDIA GeForce MX150 | Average of class Multimedia | |
|---|---|---|---|---|---|---|---|---|
| Power Consumption | 19% | 23% | 10% | 29% | -14% | 10% | -23% | |
| Idle Minimum * (Watt) | 6.3 | 4.7 25% | 3.9 38% | 3.4 46% | 3 52% | 5.3 16% | 4.48 ? 29% | 5.68 ? 10% |
| Idle Average * (Watt) | 8.4 | 8.7 -4% | 5.76 31% | 7.5 11% | 5.8 31% | 9.8 -17% | 7.88 ? 6% | 10.2 ? -21% |
| Idle Maximum * (Watt) | 10.2 | 9.8 4% | 7.14 30% | 10.8 -6% | 6.2 39% | 12.6 -24% | 9.76 ? 4% | 12.4 ? -22% |
| Load Average * (Watt) | 59 | 39.4 33% | 50.8 14% | 55.4 6% | 54.1 8% | 73 -24% | 54.7 ? 7% | 65.4 ? -11% |
| Load Maximum * (Watt) | 66.3 | 40.4 39% | 65.8 1% | 70.3 -6% | 56.4 15% | 80 -21% | 63.5 ? 4% | 113.3 ? -71% |
| Witcher 3 ultra * (Watt) | 34 | 45.9 | 67.6 |
* ... smaller is better
Battery Life
The Pavilion 14 has a 41 Wh battery that lasted longer than average, particularly in our idle and Wi-Fi battery life tests. However, our test device struggles against our comparison devices as all have larger battery capacities than the Pavilion 14. Specifically, both the ThinkPad T480s and MateBook X Pro last longer than 1,000 minutes at idle compared to the Pavilion 14’s 800 minutes thanks to their 57 Wh batteries. In short, while the Pavilion 14 has above average battery life, it falls short of all our comparison devices overall.
| HP Pavilion 14-ce0002ng i5-8550U, GeForce MX150, 41 Wh | Huawei MateBook X Pro, i7 i5-8550U, GeForce MX150, 57 Wh | Lenovo IdeaPad 530s-14IKB i5-8550U, GeForce MX150, 45 Wh | Lenovo ThinkPad T480s-20L8S02E00 i5-8550U, GeForce MX150, 57 Wh | Asus Zenbook UX430UN i5-8550U, GeForce MX150, 50 Wh | HP Spectre x360 15-ch011nr i5-8550U, GeForce MX150, 84 Wh | Average of class Multimedia | |
|---|---|---|---|---|---|---|---|
| Battery runtime | 25% | 4% | 28% | 11% | 21% | 80% | |
| Reader / Idle (h) | 13.3 | 19.3 45% | 14.7 11% | 22.8 71% | 17.3 30% | 15.5 17% | 25.2 ? 89% |
| H.264 (h) | 5.8 | 7.1 22% | 9.2 59% | 16.4 ? 183% | |||
| WiFi v1.3 (h) | 6.9 | 8.4 22% | 8.7 26% | 8.8 28% | 9.3 35% | 10.4 51% | 12.2 ? 77% |
| Load (h) | 2.4 | 2.6 8% | 1.4 -42% | 1.3 -46% | 1.6 -33% | 2.3 -4% | 1.662 ? -31% |
Verdict
Pros
Cons
The new HP Pavilion 14 is an affordable yet stylish multimedia device that is powered by an Intel Core i7-8550U processor and an Nvidia GeForce MX150 GPU. Our test device has acceptable system performance except for its slow SanDisk SSD. Positively, the device does not thermal throttle either. Despite this, the Pavilion 14 cannot compete with other GeForce MX150-equipped devices on graphics performance; the IdeaPad 530s achieved up to 50% better frame rates in gaming benchmarks, for example.
Undisputedly, our biggest criticism of the new HP Pavilion 14 is its display. A combination of a matte finish and a maximum luminosity of 239 cd/m² makes the device unusable outside on a sunny day.
Moreover, our test device has poor thermal management. The Pavilion 14 gets too hot for a multimedia laptop, particularly given its modest gaming and graphics performance. Likewise, the fan gets incredibly loud but cannot sufficiently cool the device. Overall, the cooling system is inadequate for a Core i7-8550U and a GeForce MX150.
The Pavilion 14 is best suited for everyday applications and office work. The device will have enough performance for most tasks and aesthetically looks better than many of its competitors. With that said, we would recommend looking at the AMD Ryzen 5 2500U-powered Pavilion 15, which has a better display and more efficient cooling. It also costs 200 Euros (~$231) less, although you must forgo a dedicated GPU and settle on weaker system performance.
HP Pavilion 14-ce0002ng
- 10/07/2018 v6 (old)
Daniel Puschina
Price comparison

