Notebook reviews with NVIDIA GeForce GTX 950M graphics card
Asus ZenBook UX530UX (i7-7500U, GTX 950M) Laptop Review
Tame lightweight. A 15-inch device which is still as thin as 17 mm and weighs only 1630 grams? A brilliant screen with minimal bezels? A battery runtime lasting...
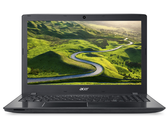
Intel Core i7-7500U | NVIDIA GeForce GTX 950M | 15.60" | 1.6 kgAcer Aspire F17 F5-771G (i5, GTX 950M) Laptop Review
Whisperer in disguise.Acer’s 17-inch aluminum multimedia machine surprised us with its unexpectedly quiet gaming qualities. Is the 699-Euro ($800) laptop worth ...
Intel Core i5-7200U | NVIDIA GeForce GTX 950M | 17.30" | 2.9 kgLenovo ThinkPad E570 (Core i5, GTX 950M) Notebook Review
Affordable ThinkPad pioneer. After the smaller E470 quite convinced us, we now have Lenovo's ThinkPad E570 as a 15.6-inch Kaby Lake pioneer in the test. Our in-...
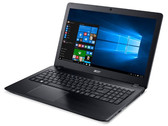
Intel Core i5-7200U | NVIDIA GeForce GTX 950M | 15.60" | 2.3 kgAcer Aspire E5-575G (i5-7200U, GTX 950M) Notebook Review
Lots of hardware for little money. Thanks to a GeForce GTX 950M and a cutting-edge Kaby Lake processor, Acer's Aspire E5-575G should render even sophisticated ...
Intel Core i5-7200U | NVIDIA GeForce GTX 950M | 15.60" | 2.4 kgAcer Aspire F15 F5-573G-53V1 Notebook Review
Inexpensive multimedia talent. In the Aspire F15, Acer combines a ULV processor with enough RAM and a dedicated GPU. These specifications appear good on paper a...
Intel Core i5-6200U | NVIDIA GeForce GTX 950M | 15.60" | 2.4 kgAsus F756UX-T7013T: Intel Core i5-6200U, 17.30", 2.7 kg
Review » Asus F756UX-T7013T Notebook Review
MSI PX60 6QD: Intel Core i7-6700HQ, 15.60", 2.2 kg
Review » MSI PX60 6QD Prestige iBuyPower Edition Notebook Review
Asus N752VX-GC131T: Intel Core i7-6700HQ, 17.30", 3.2 kg
Review » Asus N752VX-GC131T Notebook Review
Asus N552VX-FY103T: Intel Core i7-6700HQ, 15.60", 2.5 kg
Review » Asus N552VX-FY103T Notebook Review
MSI PE60 2QD: Intel Core i7-6700HQ, 15.60"
Review » NVIDIA GeForce GTX 950M DDR3 vs. GDDR5 Review
Toshiba Satellite P50-C-188: Intel Core i5-6200U, 15.60", 2.2 kg
Review » Toshiba Satellite P50-C-188 Notebook Review
Acer Aspire V5-591G-71K2: Intel Core i7-6700HQ, 15.60", 2.4 kg
Review » Acer Aspire V5-591G-71K2 Notebook Review
HP Pavilion 15-ak003ng: Intel Core i7-6700HQ, 15.60", 2.4 kg
Review » HP Pavilion 15 (i7-6700HQ, GTX 950M) Notebook Review
HP Envy 17-n107ng: Intel Core i7-6700HQ, 17.30", 2.8 kg
Review » HP Envy 17-n107ng Notebook Review
Acer Aspire VN7-572G-72L0: Intel Core i7-6500U, 15.60", 2.4 kg
Review » Acer Aspire V 15 Nitro VN7-572G-72L0 Notebook Review
Nexoc M731III (W670RCQ): Intel Core i7-6700HQ, 17.30", 3.1 kg
Review » Nexoc M731 III (Clevo W670RCQ) (i7, GTX 950M) Notebook Review
Nexoc M512 III (W650RC) (i7,GTX 950M): Intel Core i7-6700HQ, 15.60", 2.6 kg
Review » Nexoc M512 III (Clevo W650RC) (i7, GTX 950M) Notebook Review
MSI PX60 QD-034US: Intel Core i7-5700HQ, 15.60", 1.9 kg
Review » MSI PX60 Prestige Notebook Review
MSI GP72-2QEi781: Intel Core i7-5700HQ, 17.30", 2.8 kg
Review » MSI GP72 2QE Leopard Pro Notebook Review
HP Envy 15-ae020ng: Intel Core i7-5500U, 15.60", 2.4 kg
Review » HP Envy 15-ae020ng Notebook Review
Asus GL552JX-CN154H: Intel Core i7-4720HQ, 15.60", 2.6 kg
Review » Asus GL552JX Notebook Review
MSI GP62-2QEi781FD: Intel Core i7-5700HQ, 15.60", 2.3 kg
Review » MSI GP62 2QE Notebook Review
Asus N751JX-T4056H: Intel Core i7-4720HQ, 17.30", 3.4 kg
Review » Asus N751JX Notebook Review
Schenker M505: Intel Core i5-4210M, 15.60", 2.6 kg
Review » Schenker M505 (Clevo W650SC) Notebook Review
MSI GP72 2QE-015NL: Intel Core i7-5700HQ, 17.30", 2.6 kg
External Review » MSI GP72 2QE-015NL
HP Omen 15-ax014ns: Intel Core i5-6300HQ, 15.60", 2.2 kg
External Review » HP OMEN 15-ax014ns
HP Pavilion 15-bc300ns: Intel Core i5-7200U, 15.60", 2.2 kg
External Review » HP Pavilion 15-bc300ns
HP Omen 15-ax013ns: Intel Core i5-6300HQ, 15.60", 2.2 kg
External Review » HP Omen 15-ax013ns
Asus ZenBook UX510UX-DM102T: Intel Core i5-7200U, 15.60", 2 kg
External Review » Asus ZenBook UX510UX-DM102T
Asus ZenBook UX530UX-FY026T: Intel Core i7-7500U, 15.60", 1.6 kg
External Review » Asus ZenBook UX530UX-FY026T
Lenovo IdeaPad 700-17ISK-80RV008SMH: Intel Core i5-6300HQ, 17.30", 2.7 kg
External Review » Lenovo IdeaPad 700-17ISK-80RV008SMH
Lenovo Ideapad 700-15ISK-80RU00VPSP: Intel Core i5-6300HQ, 15.60", 2.3 kg
External Review » Lenovo Ideapad 700-15ISK-80RU00VPSP
Asus R510VX-DM004D: Intel Core i5-6300HQ, 15.60", 2.5 kg
External Review » Asus R510VX-DM004D
Acer Aspire F5-573G-743S: Intel Core i7-7500U, 15.60", 2.4 kg
External Review » Acer Aspire F5-573G-743S
Lenovo Thinkpad E570-20H50070SP: Intel Core i7-7500U, 15.60", 2.3 kg
External Review » Lenovo Thinkpad E570-20H50070SP
Medion Erazer P6679-MD60474: Intel Core i7-7500U, 15.60", 2.3 kg
External Review » Medion Erazer P6679-MD60474
Asus VivoBook A550VX-DM660T: Intel Core i5-7300HQ, 15.60", 2.5 kg
External Review » Asus VivoBook A550VX-DM660T
Lenovo Ideapad 700-15ISK-80RU00VUS: Intel Core i5-6300HQ, 15.60", 2.3 kg
External Review » Lenovo Ideapad 700-15ISK-80RU00VUS
Asus R510VX-DM169D: Intel Core i5-6300HQ, 15.60", 2.5 kg
External Review » Asus R510VX-DM169D
HP Pavilion 15-bc005ns: Intel Core i7-6700HQ, 15.60", 2.2 kg
External Review » HP Pavilion 15-bc005ns
Acer Aspire F5-573G-507X: Intel Core i5-7200U, 15.60", 2.4 kg
External Review » Acer Aspire F5-573G-507X
Acer Aspire E5-575G-56BX: Intel Core i5-7200U, 15.60", 2.4 kg
External Review » Acer Aspire E5-575G-56BX
Acer Aspire F5-573G-58N1: Intel Core i5-7200U, 15.60", 2.3 kg
External Review » Acer Aspire F5-573G-58N1
Acer Aspire F5-573G-5331: Intel Core i5-6200U, 15.60", 2.4 kg
External Review » Acer Aspire F5-573G-5331
Asus VivoBook Pro N552VX-FY186T: Intel Core i7-6700HQ, 15.60", 2.5 kg
External Review » Asus VivoBook Pro N552VX-FY186T
Acer Aspire E5-575G-57RL: Intel Core i5-7200U, 15.60", 2.2 kg
External Review » Acer Aspire E5-575G-57RL
Lenovo IdeaPad 700-17ISK-80RV0067RK: Intel Core i5-6300HQ, 17.30", 2.8 kg
External Review » Lenovo IdeaPad 700-17ISK-80RV0067RK
Acer Aspire E5-575G-58R: Intel Core i5-7200U, 15.60", 2.4 kg
External Review » Acer Aspire E5-575G-58R
Lenovo IdeaPad 700-15ISK 80RU00HVTX: Intel Core i7-6700HQ, 15.60", 2.3 kg
External Review » Lenovo IdeaPad 700-15ISK 80RU00HVTX
Dell Inspiron 14 7466: Intel Core i5-6300HQ, 14.10", 2.2 kg
External Review » Dell Inspiron 14 7466
Lenovo ThinkPad E570-20H6S00000: Intel Core i5-7200U, 15.60", 2.3 kg
External Review » Lenovo ThinkPad E570-20H6S00000
Medion Erazer P6661-30019794: Intel Core i5-6200U, 15.60", 2.2 kg
External Review » Medion Erazer P6661-30019794
Lenovo IdeaPad 700-15ISK-80RU008PMH: Intel Core i5-6300HQ, 15.60", 2.3 kg
External Review » Lenovo IdeaPad 700-15ISK-80RU008PMH
HP Envy 17-n111ur: Intel Core i7-6700HQ, 17.30", 2.8 kg
External Review » HP Envy 17-n111ur
Acer Aspire E5-575G-54E6: Intel Core i5-6200U, 15.60", 2.4 kg
External Review » Acer Aspire E5-575G-54E6
MSI GP72 Leopard Pro 6QE-254XFR: Intel Core i7-6700HQ, 17.30", 2.7 kg
External Review » MSI GP72 Leopard Pro 6QE-254XFR
Asus Vivobook Pro N752VX-GC114T: Intel Core i7-6700HQ, 17.30", 3.2 kg
External Review » Asus Vivobook Pro N752VX-GC114T
Lenovo IdeaPad 700-15ISK 80RU00P6MH: Intel Core i7-6700HQ, 15.60", 2.3 kg
External Review » Lenovo IdeaPad 700-15ISK 80RU00P6MH
Lenovo IdeaPad 700-15ISK 80RU008RMH: Intel Core i7-6700HQ, 15.60", 2.3 kg
External Review » Lenovo IdeaPad 700-15ISK 80RU008RMH
Acer Aspire F15 F5-573G-74X5: Intel Core i7-7500U, 15.60", 2.4 kg
External Review » Acer Aspire F15 F5-573G-74X5
Asus K550VX-DM368T: Intel Core i5-6300HQ, 15.60", 2.5 kg
External Review » Asus K550VX-DM368T
Lenovo Ideapad 700-15ISK-80RU00L2GE: Intel Core i5-6300HQ, 15.60", 2.3 kg
External Review » Lenovo Ideapad 700-15ISK-80RU00L2GE
Asus N552VX-FW320T: Intel Core i7-6700HQ, 15.60", 2.5 kg
External Review » Asus N552VX-FW320T
MSI GS32 7QE-013RU Shadow: Intel Core i7-7500U, 13.30", 1.2 kg
External Review » MSI GS32 7QE-013RU Shadow
Asus N552VX-FW140T: Intel Core i7-6700HQ, 0.00", 2.5 kg
External Review » Asus N552VX-FW140T
Asus N552VX-FW027T: Intel Core i7-6700HQ, 15.60", 2.5 kg
External Review » Asus N552VX-FW027T
Acer Aspire E5-575G-78VT: Intel Core i7-6500U, 15.60", 2.4 kg
External Review » Acer Aspire E5-575G-78VT
Acer Aspire F17 F5-771G-74P9: Intel Core i7-7500U, 17.30", 2.9 kg
External Review » Acer Aspire F17 F5-771G-74P9
Medion Erazer P6679: Intel Core i5-7200U, 15.60", 2.3 kg
External Review » Medion Erazer P6679
Asus F756UX-T4061T: Intel Core i7-6500U, 17.30", 2.7 kg
External Review » Asus F756UX-T4061T
Acer Aspire F15 F5-573G-76KL: Intel Core i7-6500U, 15.60", 2.3 kg
External Review » Acer Aspire F15 F5-573G-76KL
HP Omen 15-ax008ns: Intel Core i5-6300HQ, 15.60", 2.2 kg
External Review » HP Omen 15-ax008ns
Medion P7648-MD99980: Intel Core i7-7500U, 17.30", 2.9 kg
External Review » Medion P7648-MD99980
Asus N752VX-GC234T: Intel Core i7-6700HQ, 17.30", 2.7 kg
External Review » Asus N752VX-GC234T
Asus R510VX-DM205D: Intel Core i5-6300HQ, 15.60", 2.5 kg
External Review » Asus R510VX-DM205D
Asus R753UX-T4115D: Intel Core i7-6700HQ, 17.30", 2.7 kg
External Review » Asus R753UX-T4115D
MSI GP62-2QE-242NL: Intel Core i5-4200H, 15.60", 2.3 kg
External Review » MSI GP62-2QE-242NL
Acer Aspire E5-575G-549D: Intel Core i5-7200U, 15.60", 2.4 kg
External Review » Acer Aspire E5-575G-549D
Acer Aspire E5-774G-70G6: Intel Core i7-6500U, 17.30", 3 kg
External Review » Acer Aspire E5-774G-70G6
Acer Aspire F5-771G-78X0: Intel Core i7-7500U, 17.30", 3 kg
External Review » Acer Aspire F5-771G-78X0
Asus N552VX-FW120T: Intel Core i7-6700HQ, 15.60", 2.5 kg
External Review » Asus N552VX-FW120T
Asus K550VX-DM028D: Intel Core i7-6700HQ, 15.60", 2.5 kg
External Review » Asus K550VX-DM028D
Asus K550VX-DM108T: Intel Core i7-6700HQ, 15.60", 2.4 kg
External Review » Asus K550VX-DM108T
HP Envy 15-ae103ng: Intel Core i7-6500U, 15.60", 2.4 kg
External Review » HP Envy 15-ae103ng
HP Pavilion Gaming 15-ak113nl: Intel Core i7-6700HQ, 15.60", 2.5 kg
External Review » HP Pavilion Gaming 15-ak113nl
Asus R510VX-DM010D: Intel Core i7-6700HQ, 15.60", 2.4 kg
External Review » Asus R510VX-DM010D
Asus R510VX-DM010T: Intel Core i7-6700HQ, 15.60", 2.4 kg
External Review » Asus R510VX-DM010T
Asus R510VX-DM006T: Intel Core i7-6700HQ, 15.60", 2.4 kg
External Review » Asus R510VX-DM006T
Acer Aspire F15 F5-573G-74UR: Intel Core i7-6500U, 15.60", 2.3 kg
External Review » Acer Aspire F15 F5-573G-74UR
Asus R510VX-DM006D: Intel Core i7-6700HQ, 15.60", 2.4 kg
External Review » Asus R510VX-DM006D
Asus K550VX-DM115T: Intel Core i7-6700HQ, 15.60", 2.4 kg
External Review » Asus K550VX-DM115T
Asus N552VX-FY209D: Intel Core i7-6700HQ, 15.60", 2.5 kg
External Review » Asus N552VX-FY209D
Asus GL552VX-CN267T: Intel Core i7-6700HQ, 15.60", 2.6 kg
External Review » Asus GL552VX-CN267T
Lenovo Ideapad 700-17ISK-80RV003UCK: Intel Core i7-6700HQ, 17.30", 2.6 kg
External Review » Lenovo Ideapad 700-17ISK-80RV003UCK
Acer Aspire F5-771G-54C5: Intel Core i5-7200U, 17.30", 3 kg
External Review » Acer Aspire F5-771G-54C5
Medion Erazer P6661 MD 99873: Intel Core i7-6500U, 15.60", 2.3 kg
External Review » Medion Erazer P6661 MD 99873
Asus N552VX-FY200T: Intel Core i7-6700HQ, 15.60", 2.5 kg
External Review » Asus N552VX-FY200T
Medion Erazer P7643-MD99839: Intel Core i5-6200U, 17.30", 2.4 kg
External Review » Medion Erazer P7643-MD99839
HP Envy 17-r182nz: Intel Core i7-6700HQ, 17.30", 2.8 kg
External Review » HP Envy 17-r182nz
HP Envy 17-n107ng: Intel Core i7-6700HQ, 17.30", 2.8 kg
External Review » HP Envy 17-n107ng
HP Envy 17-r110ng: Intel Core i7-6700HQ, 17.30", 2.8 kg
External Review » HP Envy 17-r110ng
HP Envy 15-ae109ng: Intel Core i7-6500U, 15.60", 2.4 kg
External Review » HP Envy 15-ae109ng
Asus N552VX-FY299T: Intel Core i7-6700HQ, 15.60", 2.5 kg
External Review » Asus N552VX-FY299T
Acer Aspire F15 F5-573G-55KW: Intel Core i5-6200U, 15.60", 2.4 kg
External Review » Acer Aspire F15 F5-573G-55KW
HP Pavilion 15-bc003ng: Intel Core i5-6300HQ, 15.60", 2.2 kg
External Review » HP Pavilion 15-bc003ng
Lenovo Yoga 710 15-80U00005US: Intel Core i7-6500U, 15.60", 1.9 kg
External Review » Lenovo Yoga 710 15-80U00005US
HP Pavilion Gaming 15-ak008na: Intel Core i7-6700HQ, 15.60", 2.3 kg
External Review » HP Pavilion Gaming 15-ak008na
Asus GL552VX-CN117T: Intel Core i5-6300HQ, 15.60", 2.6 kg
External Review » Asus GL552VX-CN117T
Lenovo IdeaPad 700-15ISK-80RU0009GE: Intel Core i7-6700HQ, 15.60", 2.3 kg
External Review » Lenovo IdeaPad 700-15ISK-80RU0009GE
HP Envy 17-r100ur: Intel Core i7-6700HQ, 17.30", 2.8 kg
External Review » HP Envy 17-r100ur
Acer Aspire V5-591-51QH: Intel Core i5-6300HQ, 15.60", 2.4 kg
External Review » Acer Aspire V5-591-51QH
Acer Aspire V5-591G-52AL: Intel Core i5-6300HQ, 15.60", 2.4 kg
External Review » Acer Aspire V5-591G-52AL
MSI GL72 6QD-039XPL: Intel Core i7-6700HQ, 17.30", 2.7 kg
External Review » MSI GL72 6QD-039XPL
MSI GL62-6QDi581: Intel Core i5-6300HQ, 15.60", 2.3 kg
External Review » MSI GL62-6QDi581
Toshiba Satellite P50-C-179: Intel Core i7-6700HQ, 15.60", 2.1 kg
External Review » Toshiba Satellite P50-C-179
Acer Aspire V15 Nitro BE VN7-572G-75ZN: Intel Core i7-6500U, 15.60", 2.4 kg
External Review » Acer Aspire V15 Nitro BE VN7-572G-75ZN
Asus N752VX-GC131T: Intel Core i7-6700HQ, 17.30", 3.2 kg
External Review » Asus N752VX-GC131T
HP Envy 15-ae102nh: Intel Core i7-6500U, 15.60", 2.4 kg
External Review » HP Envy 15-ae102nh
HP Pavilion 15 ak-003ur: Intel Core i7-6700HQ, 15.60", 2.3 kg
External Review » HP Pavilion 15 ak-003ur
Acer Aspire V5-591G-54XY: Intel Core i5-6300HQ, 15.60", 2.4 kg
External Review » Acer Aspire V5-591G-54XY
Acer Aspire V5-591G-78CE: Intel Core i7-6700HQ, 15.60", 2.4 kg
External Review » Acer Aspire V5-591G-78CE
HP Pavilion 15-ak001nu: Intel Core i7-6700HQ, 15.60", 2.3 kg
External Review » HP Pavilion 15-ak001nu
HP Pavilion 15-ak003nf: Intel Core i7-6700HQ, 15.60", 2.4 kg
External Review » HP Pavilion 15-ak003nf
Acer Aspire VN7-571G-50Z3: Intel Core i5-5200U, 15.60", 2.4 kg
External Review » Acer Aspire VN7-571G-50Z3
MSI PE70-6QD-064XRU: Intel Core i7-6700HQ, 17.30", 2.6 kg
External Review » MSI PE70-6QD-064XRU
Samsung 940Z5L-X01US: Intel Core i7-6700HQ, 15.60", 2 kg
External Review » Samsung 940Z5L-X01US
HP Envy 15-ae15030tx: Intel Core i7-5500U, 15.60", 2.4 kg
External Review » HP Envy 15-ae15030tx
Asus K751LX-TY077H: Intel Core i5-5200U, 17.30", 2.8 kg
External Review » Asus K751LX-TY077H
Acer Aspire V5-591G-71K2: Intel Core i7-6700HQ, 15.60", 2.4 kg
External Review » Acer Aspire V5-591G-71K2
Medion Erazer P7644: Intel Core i7-6500U, 17.30", 2.4 kg
External Review » Medion Erazer P7644
MSI GP62-6QE8H11: Intel Core i7-6700HQ, 15.60", 2.3 kg
External Review » MSI GP62-6QE8H11
Acer Aspire VN7-572G-72L0: Intel Core i7-6500U, 15.60", 2.4 kg
External Review » Acer Aspire VN7-572G-72L0
Asus K550JX-XO032H: Intel Core i7-4720HQ, 15.60", 2.3 kg
External Review » Asus K550JX-XO032H
Toshiba Satellite P50T-C-109: Intel Core i5-5200U, 15.60", 2.4 kg
External Review » Toshiba Satellite P50T-C-109
MSI PX60 2QD-037RU: Intel Core i7-5700HQ, 15.60", 2.1 kg
External Review » MSI PX60 2QD-037RU
HP Envy 15-ae101nc: Intel Core i5-6200U, 15.60", 2.5 kg
External Review » HP Envy 15-ae101nc
HP Pavilion Gaming 15-ak001ng: Intel Core i7-6700HQ, 15.60", 2.3 kg
External Review » HP Pavilion Gaming 15-ak001ng
Acer Aspire V Nitro VN7-792G-54HJ: Intel Core i5-6300HQ, 17.30", 3 kg
External Review » Acer Aspire V Nitro VN7-792G-54HJ
HP Envy 15-ae030tx: Intel Core i7-5500U, 15.60", 2.4 kg
External Review » HP Envy 15-ae030tx
HP Envy 15-ae047nd: Intel Core i7-5500U, 15.60", 2.4 kg
External Review » HP Envy 15-ae047nd
Asus N550JX-CN066H: Intel Core i7-4720HQ, 15.60", 2.3 kg
External Review » Asus N550JX-CN066H
Asus GL552JX-CN154H: Intel Core i7-4720HQ, 15.60", 2.6 kg
External Review » Asus GL552JX-CN154H
HP Envy 15-AE007NF: Intel Core i7-5500U, 15.60", 2.4 kg
External Review » HP Envy 15-AE007NF
MSI GP72 2QE Leopard Pro: Intel Core i7-5700HQ, 17.30", 2.6 kg
External Review » MSI GP72 2QE Leopard Pro
MSI GP62-2QEi781FD: Intel Core i7-5700HQ, 15.60", 2.3 kg
External Review » MSI GP62-2QEi781FD
Asus K501LX-NB52: Intel Core i5-5200U, 15.60", 2 kg
External Review » Asus K501LX-NB52
MSI PX60 2QD-049UK: Intel Core i7-5700HQ, 15.60", 2.1 kg
External Review » MSI PX60 2QD-049UK
HP Envy 15-ae020ng: Intel Core i7-5500U, 15.60", 2.4 kg
External Review » HP Envy 15-ae020ng
Asus GL552JX-DM120: Intel Core i7-4720HQ, 15.60", 2.6 kg
External Review » Asus GL552JX-DM120
Asus GL552JX-CN029D: Intel Core i5-4200H, 15.60", 2.6 kg
External Review » Asus GL552JX-CN029D
MSI GE60-2QDi782: Intel Core i7-4720HQ, 15.60", 2.6 kg
External Review » MSI GE60-2QDi782