Reviews for the Intel Core i7-4720HQ processor
Eurocom Shark 4 (Clevo N150SD) Notebook Review
Shark attack. Eurocom's fourth generation Shark gets an updated chassis with GTX 960M graphics. Is this mainstream-level gaming notebook a better deal than more well-known competitors?
Intel Core i7-4720HQ, NVIDIA GeForce GTX 960M, 15.6", 2.5 kgAsus GL552JX Notebook Review
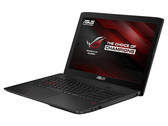
Gaming with limits. The Asus slogan for the new 15-inch ROG device is "Gaming Without Limits", which is unfortunately not the case because of the GeForce GTX 950M. If the limited performance is sufficient for you, you get a well-balanced multimedia notebook with an SSD, great input devices and a convincing display for 1,200 Euros (~$1354), which is, however, not without some flaws.
Intel Core i7-4720HQ, NVIDIA GeForce GTX 950M, 15.6", 2.6 kgAsus ZenBook Pro UX501JW-FI218H Notebook Review
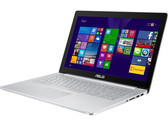
A new perspective. It is not long since we had the US model of the Asus UX501JW in our hands and we were impressed by the overall concept including the 4K display. Now, the ZenBook is available in Germany with a matte display. Unfortunately, not everything has turned out for the better.
Intel Core i7-4720HQ, NVIDIA GeForce GTX 960M, 15.6", 2 kgAsus G751JY G-Sync Notebook Review
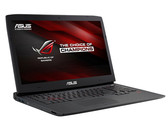
Synchronization complete. Nvidia's G-Sync technology promises a smooth gaming experience without annoying screen tearing. We could examine this feature for the first time in Asus' G751JY. Has the venerable V-Sync completed its service?
Intel Core i7-4720HQ, NVIDIA GeForce GTX 980M, 17.3", 4.2 kgAsus N551JW (GTX 960M) Notebook Review
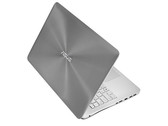
High-quality entertainment. The latest edition of Asus' paragon multimedia laptop promises more power in all sectors. The whole thing has only one catch: The buyer has to dig deeper into their pocket.
Intel Core i7-4720HQ, NVIDIA GeForce GTX 960M, 15.6", 2.6 kgAsus G501JW-CN168H: NVIDIA GeForce GTX 960M, 15.60", 2 kg
Review » Asus G501JW (FHD) Notebook Review
Asus N751JX-T4056H: NVIDIA GeForce GTX 950M, 17.30", 3.4 kg
Review » Asus N751JX Notebook Review
MSI GE72-2QDi716H11: NVIDIA GeForce GTX 960M, 17.30", 2.9 kg
Review » MSI GE72 (GTX 960M) Notebook Review
MSI GE60-2QEWi781: NVIDIA GeForce GTX 960M, 15.60", 2.6 kg
Review » MSI GE60 (GTX 960M) Notebook Review
Asus GL771JW-T7082H: NVIDIA GeForce GTX 960M, 17.30", 3.3 kg
Review » Asus GL771JW Notebook Review
MSI GE62-2QFUi716H11: NVIDIA GeForce GTX 970M, 15.60", 2.4 kg
Review » MSI GE62 (GTX 970M) Notebook Review
Asus UX501JW-DS71T: NVIDIA GeForce GTX 960M, 15.60", 2.3 kg
Review » Asus ZenBook Pro UX501JW Notebook Review
Razer Blade Pro 17 inch 2015: NVIDIA GeForce GTX 960M, 17.30", 3.1 kg
Review » Razer Blade Pro 2015 Notebook Review
Asus G501JW: NVIDIA GeForce GTX 960M, 15.60", 2.1 kg
Review » Asus G501JW Notebook Review
MSI PE70-2QEi716H21BW: NVIDIA GeForce GTX 960M, 17.30"
Review » MSI PE70 Multimedia Notebook Preview
Acer Aspire V Nitro 7-791G-70TW: NVIDIA GeForce GTX 960M, 17.30", 3 kg
Review » Acer Aspire V Nitro 7-791G Notebook Review
Acer Aspire VN7-591G-727P: NVIDIA GeForce GTX 960M, 15.60", 2.4 kg
Review » Acer Aspire V15 Nitro Black Edition VN7-591G Notebook Review
Gigabyte P37X: NVIDIA GeForce GTX 980M, 17.30", 3 kg
Review » Gigabyte P37X Notebook Review
Schenker XMG A705: NVIDIA GeForce GTX 960M, 17.30", 3.1 kg
Review » Schenker XMG A705 (Clevo N170SD) Notebook Review
Razer Blade 14 2015: NVIDIA GeForce GTX 970M, 14.00", 2 kg
Review » Razer Blade 14 (Early 2015) Notebook Review
Schenker XMG C405: NVIDIA GeForce GTX 965M, 14.00", 1.8 kg
Review » Schenker XMG C405 Notebook Review
Schenker XMG A505: NVIDIA GeForce GTX 960M, 15.60", 2.5 kg
Review » Nvidia GeForce GTX 960M Review
MSI GE62 2QD: NVIDIA GeForce GTX 960M, 15.60", 2.4 kg
Review » iBuyPower MSI GE62 Notebook Review
Schenker XMG A505: NVIDIA GeForce GTX 960M, 15.60", 2.5 kg
Review » Schenker XMG A505 (Clevo N150SD) Notebook Review
MSI GE62-2QEUi716H21BW: NVIDIA GeForce GTX 965M, 15.60", 2.4 kg
Review » MSI GE62 Notebook Review
Toshiba Satellite P70-B-10T: AMD Radeon R9 M265X, 17.30", 2.9 kg
Review » Toshiba Satellite P70-B Notebook Review
Gigabyte P34W V3: NVIDIA GeForce GTX 970M, 14.00", 1.8 kg
Review » Gigabyte P34W v3 Notebook Review
MSI GS60 2QE Ghost Pro 4K (2QEUi716SR51G): NVIDIA GeForce GTX 970M, 15.60", 2 kg
Review » MSI GS60 2QE Ghost Pro 4K (2QEUi716SR51G) Notebook Review
Schenker XMG P705: NVIDIA GeForce GTX 965M, 17.30", 3.3 kg
Review » Schenker XMG P705 (Clevo P670SA) Notebook Review
MSI GS70-2QE16SR51: NVIDIA GeForce GTX 970M, 17.30", 2.7 kg
Review » MSI GS70-2QE16SR51 Notebook Review
Alienware 17 A17-4518: NVIDIA GeForce GTX 970M, 17.30", 3.8 kg
External Review » Alienware 17 A17-4518
Asus ZenBook Pro UX501JW-FI204H: NVIDIA GeForce GTX 960M, 15.60", 2.1 kg
External Review » Asus ZenBook Pro UX501JW-FI204H
Asus ZenBook Pro UX501-FJ221H: NVIDIA GeForce GTX 960M, 15.60", 2.3 kg
External Review » Asus ZenBook Pro UX501-FJ221H
MSI WT60-2OKU32SR51BW: NVIDIA Quadro K3100M, 15.60", 3.5 kg
External Review » MSI WT60-2OKU32SR51BW
Asus K550JX-XO032H: NVIDIA GeForce GTX 950M, 15.60", 2.3 kg
External Review » Asus K550JX-XO032H
MSI PE70 2QE-075RU: NVIDIA GeForce GTX 960M, 17.30", 2.6 kg
External Review » MSI PE70 2QE-075RU
MSI GT80-2QES16SR221BW: NVIDIA GeForce GTX 980M SLI, 18.40", 4.5 kg
External Review » MSI GT80-2QES16SR221BW
MSI GT80-2QE16SR221BW: NVIDIA GeForce GTX 980M SLI, 18.40", 4.5 kg
External Review » MSI GT80-2QE16SR221BW
HP Omen Pro-M2T39AA: NVIDIA Quadro K1100M, 15.60", 2.1 kg
External Review » HP Omen Pro-M2T39AA
Asus G751JT-T7179T: NVIDIA GeForce GTX 970M, 17.30", 3.8 kg
External Review » Asus G751JT-T7179T
MSI GE72 2QD-037UK: NVIDIA GeForce GTX 960M, 17.30", 2.7 kg
External Review » MSI GE72 2QD-037UK
Acer Aspire V15 Nitro VN7-591G-727P: NVIDIA GeForce GTX 960M, 15.60", 2.4 kg
External Review » Acer Aspire V15 Nitro VN7-591G-727P
Asus UX501J-DS71T: NVIDIA GeForce GTX 960M, 15.60", 2.3 kg
External Review » Asus UX501J-DS71T
Asus G751JY-DB72: NVIDIA GeForce GTX 980M, 17.30", 4.8 kg
External Review » Asus G751JY-DB72
Asus N550JX-CN066H: NVIDIA GeForce GTX 950M, 15.60", 2.3 kg
External Review » Asus N550JX-CN066H
MSI PE60 2QE-051NL: NVIDIA GeForce GTX 960M, 15.60", 2.3 kg
External Review » MSI PE60 2QE-051NL
Asus GL552JX-CN154H: NVIDIA GeForce GTX 950M, 15.60", 2.6 kg
External Review » Asus GL552JX-CN154H
Asus G501JW-CN039H: NVIDIA GeForce GTX 960M, 15.60", 2.1 kg
External Review » Asus G501JW-CN039H
Asus G751JY-T7378H: NVIDIA GeForce GTX 980M, 17.30", 4.2 kg
External Review » Asus G751JY-T7378H
Origin PC EON15-S 2015: NVIDIA GeForce GTX 980M, 15.60", 2.5 kg
External Review » Origin PC EON15-S 2015
HP Omen 15-5110nr: NVIDIA GeForce GTX 960M, 15.60", 2.1 kg
External Review » HP Omen 15-5110nr
Asus G751JL-T7028: NVIDIA GeForce GTX 965M, 17.30", 4.3 kg
External Review » Asus G751JL-T7028
Asus G751JY: NVIDIA GeForce GTX 980M, 17.30", 4.2 kg
External Review » Asus G751JY
MSI Prestige PE70 2QE: NVIDIA GeForce GTX 960M, 17.30", 2.6 kg
External Review » MSI Prestige PE70 2QE
MSI GE62 2QD-027RU: NVIDIA GeForce GTX 960M, 15.60", 2.4 kg
External Review » MSI GE62 2QD-027RU
MSI PE60-2QEi716H11BW: NVIDIA GeForce GTX 960M, 15.60", 2.3 kg
External Review » MSI PE60-2QEi716H11BW
Acer Aspire V Nitro 7-791G-70TW: NVIDIA GeForce GTX 960M, 17.30", 3 kg
External Review » Acer Aspire V Nitro 7-791G-70TW
Asus G551JW-CN080H: NVIDIA GeForce GTX 960M, 15.60", 2.7 kg
External Review » Asus G551JW-CN080H
MSI GS70-2QC: NVIDIA GeForce GTX 960M, 17.30", 2.7 kg
External Review » MSI GS70-2QC
MSI GT72 2QE-32SR351BW: , 17.30", 3.8 kg
External Review » MSI GT72 2QE-32SR351BW
Schenker XMG A705: NVIDIA GeForce GTX 960M, 17.30", 3.1 kg
External Review » Schenker XMG A705
MSI GE62-2QFUi716H11: NVIDIA GeForce GTX 970M, 15.60", 2.4 kg
External Review » MSI GE62-2QFUi716H11
Asus UX501JW-DS71T: NVIDIA GeForce GTX 960M, 15.60", 2.3 kg
External Review » Asus UX501JW-DS71T
MSI GS60 2QD-470UK: NVIDIA GeForce GTX 965M, 15.60", 2 kg
External Review » MSI GS60 2QD-470UK
Asus GL552JX-DM120: NVIDIA GeForce GTX 950M, 15.60", 2.6 kg
External Review » Asus GL552JX-DM120
Asus UX501JW-CN209H: NVIDIA GeForce GTX 960M, 15.60", 2 kg
External Review » Asus UX501JW-CN209H
MSI PE70-2QEi78H11: NVIDIA GeForce GTX 960M, 17.30", 2.7 kg
External Review » MSI PE70-2QEi78H11
Lenovo IdeaPad Y50-70-59442843: NVIDIA GeForce GTX 960M, 15.60", 2.4 kg
External Review » Lenovo IdeaPad Y50-70-59442843
Asus G501JW: NVIDIA GeForce GTX 960M, 15.60", 2.1 kg
External Review » Asus G501JW
Toshiba Qosmio X70-B-10T: AMD Radeon R9 M265X, 17.30", 2.9 kg
External Review » Toshiba Qosmio X70-B-10T
Razer Blade Pro 17 inch 2015: NVIDIA GeForce GTX 960M, 17.30", 3.1 kg
External Review » Razer Blade Pro 17 inch 2015
MSI GE62 2QD-029UK: NVIDIA GeForce GTX 960M, 15.60", 2.4 kg
External Review » MSI GE62 2QD-029UK
Acer Aspire V17 Nitro VN7-791G-70TW: NVIDIA GeForce GTX 960M, 17.40", 3.1 kg
External Review » Acer Aspire V17 Nitro VN7-791G-70TW
MSI GE60-2QDi782: NVIDIA GeForce GTX 950M, 15.60", 2.6 kg
External Review » MSI GE60-2QDi782
Acer Aspire V Nitro VN7-791G-77SW: NVIDIA GeForce GTX 960M, 17.30", 3 kg
External Review » Acer Aspire V Nitro VN7-791G-77SW
MSI GE62-2QEWi78H11: NVIDIA GeForce GTX 965M, 15.60", 2.4 kg
External Review » MSI GE62-2QEWi78H11
MSI GE72-2QEi716H21BW: NVIDIA GeForce GTX 965M, 17.30", 2.7 kg
External Review » MSI GE72-2QEi716H21BW
Schenker XMG C405: NVIDIA GeForce GTX 965M, 14.00", 1.8 kg
External Review » Schenker XMG C405
Gigabyte P34W V3: NVIDIA GeForce GTX 970M, 14.00", 1.8 kg
External Review » Gigabyte P34W V3
MSI GE62 2QD: NVIDIA GeForce GTX 960M, 15.60", 2.4 kg
External Review » MSI GE62 2QD
Asus UX501JW-FI177H: NVIDIA GeForce GTX 960M, 15.60", 2.3 kg
External Review » Asus UX501JW-FI177H
Acer Aspire V15 Nitro VN7-591G-767P: NVIDIA GeForce GTX 960M, 15.60", 2.4 kg
External Review » Acer Aspire V15 Nitro VN7-591G-767P
Schenker XMG A505: NVIDIA GeForce GTX 960M, 15.60", 2.5 kg
External Review » Schenker XMG A505
MSI GE72-2QDi716H11: NVIDIA GeForce GTX 960M, 17.30", 2.9 kg
External Review » MSI GE72-2QD
Gigabyte P35K v3: NVIDIA GeForce GTX 965M, 15.60", 2.3 kg
External Review » Gigabyte P35K v3
Razer Blade 14 2015: NVIDIA GeForce GTX 970M, 14.00", 2 kg
External Review » Razer Blade 14 inch 2015
MSI GE62-2QEWi781: NVIDIA GeForce GTX 965M, 15.60", 2.4 kg
External Review » MSI GE62-2QEWi781
Gigabyte P37X: NVIDIA GeForce GTX 980M, 17.30", 3 kg
External Review » Gigabyte P37X
MSI GS60 2QE-262ES: NVIDIA GeForce GTX 970M, 15.60", 2.1 kg
External Review » MSI GS60 2QE-262ES
Schenker XMG P705: NVIDIA GeForce GTX 965M, 17.30", 3.3 kg
External Review » Schenker XMG P705
MSI GS60 2QE Ghost Pro 4K (2QEUi716SR51G): NVIDIA GeForce GTX 970M, 15.60", 2 kg
External Review » MSI GS60-2QEWi716SR51G
MSI GS70-2QE16SR51: NVIDIA GeForce GTX 970M, 17.30", 2.7 kg
External Review » MSI GS70-2QE16SR51