Reviews for the Intel Core i7-4702MQ processor
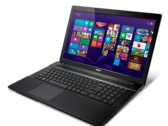
Acer Aspire V3-772G-747a8G1.12TWakk Notebook Review
Let's play again. About a year ago we took a look at the Acer Aspire V3-772G and came away impressed with its performance. This time around, we'll examine the latest model in the series and check to see what else is new besides an updated graphics card.
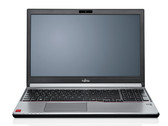
Intel Core i7-4702MQ, NVIDIA GeForce GTX 850M, 17.3", 3.2 kgFujitsu Lifebook E744 (E7440MXP11DE) Notebook Review Update
Haswell update. Fujitsu wants to entice potential buyers with its newest 14-inch laptop from the Lifebook E series. The model features a sturdy case, good input devices, security functions and an LTE modem. In this review, we will find out if the laptop is worth its price.
Intel Core i7-4702MQ, HD Graphics 4600, 14", 1.7 kgFujitsu LifeBook E754 (E7540MXP11DE) Notebook Review Update
Businessman's delight? Fujitsu launches a heavily armed machine dubbed Lifebook E754: matte Full HD screen, Haswell quad-core processor, a swift Samsung SSD, and an LTE modem. Good battery runtimes round off the bundle. Our report uncovers whether Fujitsu has designed the ideal business laptop.
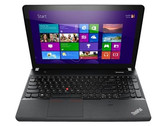
Intel Core i7-4702MQ, HD Graphics 4600, 15.6", 1.9 kgReview Lenovo ThinkPad Edge E540 20C6003AGE Notebook
Workhorse. Lenovo updated its devices with the latest hardware but did not change the concept of the cheap Edge series. The company offers many different models and our review will reveal whether the surcharge for the top model is justified.
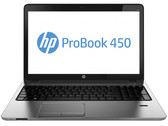
Intel Core i7-4702MQ, NVIDIA GeForce GT 740M, 15.6", 2.4 kgReview Update HP ProBook 450 G1 E9Y58EA Notebook
Haswell update. The combination of a high-performance Core i7 quad-core processor, matte screen, and Windows 7/8 Professional already indicates that the ProBook 450 G1 wants to be a work machine. HP aims at both professional and private users at the same time. However, the company demands just under 800 Euros (~$1099) for the laptop. Our test report reveals whether the device is worth the money.
Intel Core i7-4702MQ, HD Graphics 4600, 15.6", 2.4 kgMSI GE40-i760M2811: NVIDIA GeForce GTX 760M, 14.00", 1.9 kg
Review » Review MSI GE40-i760M2811 Notebook
Nexoc B509II Ultra: Intel HD Graphics 4600, 15.60", 2.2 kg
Review » Review Nexoc B509II Ultra (Clevo W550SU) Notebook
HP Envy 17-j110eg: NVIDIA GeForce GT 750M, 17.30", 3.4 kg
Review » Review HP Envy 17-j110eg Leap Motion Notebook
Lenovo G710 59397112: NVIDIA GeForce GT 720M, 17.30", 2.9 kg
Review » Review Lenovo G710 59397112 Notebook
MSI CX70-i740M281W7H: NVIDIA GeForce GT 740M, 17.30", 3 kg
Review » Review MSI CX70-i740M281W7H Notebook
One K33-3E: NVIDIA GeForce GTX 765M, 13.30", 2 kg
Review » Review One K33-3E (Clevo W230ST Barebones) Notebook
Deviltech Fire DT14: NVIDIA GeForce GTX 760M, 14.10", 2 kg
Review » Review DevilTech Fire DT14 Notebook
Acer Aspire V3-772G-747A321: NVIDIA GeForce GTX 760M, 17.30", 3.2 kg
Review » Review Acer Aspire V3-772G-747A321 Notebook
Fujitsu LifeBook AH564: NVIDIA GeForce GT 720M, 15.60", 2.5 kg
External Review » Fujitsu LifeBook AH564
Acer Aspire V3-772GTX-747A8G1.12TMAKK: NVIDIA GeForce GTX 850M, 17.30", 3.1 kg
External Review » Acer Aspire V3-772GTX-747A8G1.12TMAKK
HP Envy 15-j151sr: NVIDIA GeForce GT 750M, 15.60", 2.6 kg
External Review » HP Envy 15-j151sr
HP ProBook 640-F1Q08ES: Intel HD Graphics 4600, 14.00", 2 kg
External Review » HP ProBook 640-F1Q08ES
Maingear Pulse 14 2014: NVIDIA GeForce GTX 850M, 14.00", 1.9 kg
External Review » Maingear Pulse 14 2014
HP Envy 17-J004ER: NVIDIA GeForce GT 750M, 17.30", 2.9 kg
External Review » HP Envy 17-J004ER
Acer Aspire V3-772G-9460: NVIDIA GeForce GTX 760M, 17.30", 3.2 kg
External Review » Acer Aspire V3-772G-9460
Lenovo Thinkpad Edge E540 20C6003AGE: NVIDIA GeForce GT 740M, 15.60", 2.4 kg
External Review » Lenovo Thinkpad Edge E540 20C6003AGE
HP Envy 17t-j100 Leap Motion: NVIDIA GeForce GT 750M, 17.30", 2.8 kg
External Review » HP Envy 17t-j100 Leap Motion
HP Envy 17-j100sr: NVIDIA GeForce GT 750M, 17.30", 3.4 kg
External Review » HP Envy 17-j100sr
Acer Aspire V3-772G-9656: NVIDIA GeForce GTX 760M, 17.30", 3.2 kg
External Review » Acer Aspire V3-772G-9656
Lenovo IdeaPad Z510-59400169: NVIDIA GeForce GT 745M, 15.60", 2.2 kg
External Review » Lenovo IdeaPad Z510-59400169
HP Envy 17-j110eg: NVIDIA GeForce GT 750M, 17.30", 3.4 kg
External Review » HP Envy 17-j110eg
Acer Aspire V3-772G-747a4G75Makk: NVIDIA GeForce GTX 760M, 17.30", 3.1 kg
External Review » Acer Aspire V3-772G-747a4G75Makk
Acer Aspire V3-772G-9402: NVIDIA GeForce GTX 760M, 17.30", 3.2 kg
External Review » Acer Aspire V3-772G-9402
Acer Aspire V3-772G-747A8G1TBDWAKK: NVIDIA GeForce GTX 760M, 17.30", 3.2 kg
External Review » Acer Aspire V3-772G-747A8G1TBDWAKK
One K33-3E: NVIDIA GeForce GTX 765M, 13.30", 2 kg
External Review » One K33-3E
Maingear Pulse 14: NVIDIA GeForce GTX 765M, 14.00", 1.9 kg
External Review » Maingear Pulse 14
Acer Aspire V3-772G-747a8G1TMakk: NVIDIA GeForce GT 750M, 17.30", 3.2 kg
External Review » Acer Aspire V3-772G-747a8G1TMakk
MSI CX61-20D-011UK: Intel HD Graphics 4600, 15.60", 2.4 kg
External Review » MSI CX61-20D-011UK
Acer Aspire V3-772G-747a161: NVIDIA GeForce GTX 760M, 17.30", 3.2 kg
External Review » Acer Aspire V3-772G-747a161
MSI GE40-2OC-015XPL: NVIDIA GeForce GTX 760M, 14.00", 2 kg
External Review » MSI GE40-2OC-015XPL
Acer Aspire V3-772G-747A321: NVIDIA GeForce GTX 760M, 17.30", 3.2 kg
External Review » Acer Aspire V3-772G-747A321