Reviews for the Intel Core i5-4200M processor
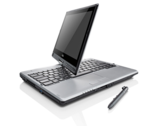
Fujitsu LifeBook T734 Convertible Review
Old-school business. Versatility and mobility are very important aspects of Fujitsu's latest convertible. Digitizer and multi-touch are new input methods and UMTS provides the necessary mobility. But it is not enough for an impressive result.
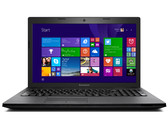
Intel Core i5-4200M, HD Graphics 4600, 12.5", 2 kgLenovo G510 (59416358) Notebook Review Update
At home on the desk. The G510 isn't one of the slimmer notebooks on the market. Its advantages are the solid performance, ease of maintenance, and the decent input devices. Equipped with a dedicated GPU from AMD, is the Home Office notebook suitable for gaming as well?
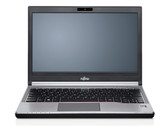
Intel Core i5-4200M, AMD Radeon R5 M230, 15.6", 2.5 kgFujitsu Lifebook E734 (E7340MXEA1DE) Notebook Review Update
Portable office. Light, handy, and strong computing power is how Fujitsu's new 13.3-inch laptop for professional users on-the-move can be described. The integrated LTE modem supplies Internet access remote from Wi-Fi. Read in our report whether the Lifebook is compelling in its whole.
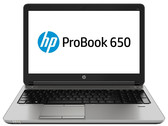
Intel Core i5-4200M, HD Graphics 4600, 13.3", 1.7 kgHP ProBook 650 H5G81ET Notebook Review Update
Any Wishes? The HP ProBook offers all features a modern business laptop should offer: matte Full HD screen, SSD, docking port, TPM and 3G modem. In this update, we will check whether the model can deliver on its promises.
Intel Core i5-4200M, HD Graphics 4600, 15.6", 2.3 kgLenovo G510 Notebook Review
Fat office worker. Solid computing power, user-friendly maintenance options, and a good keyboard is what Lenovo's G510 offers for 500 Euros (~$681), and only 440 Euros (~$599) is due without a Windows operating system. Our report reveals whether Lenovo has added a decent device to its product line.
Intel Core i5-4200M, HD Graphics 4600, 15.6", 2.5 kgLenovo ThinkPad L540 20AV002YGE: Intel HD Graphics 4600, 15.60", 2.3 kg
Review » Review Lenovo ThinkPad L540 20AV002YGE Notebook
HP Pavilion 17-e126sg: AMD Radeon HD 8670M, 17.30", 2.9 kg
Review » Review Update HP Pavilion 17-e126sg Notebook
HP ProBook 640 G1 H5G66ET: Intel HD Graphics 4600, 14.00", 2.1 kg
Review » Review HP ProBook 640 G1 H5G66ET Notebook
HP ProBook 470 G1 E9Y75EA: AMD Radeon HD 8750M, 17.30", 2.9 kg
Review » Review Update HP ProBook 470 G1 E9Y75EA Notebook
Acer Aspire E1-772G 54208G1TMnsk: NVIDIA GeForce 820M, 17.30", 3.2 kg
Review » Review Acer Aspire E1-772G 54208G1TMnsk Notebook
Toshiba Satellite C75-A-13W: NVIDIA GeForce 710M, 17.30", 2.7 kg
Review » Review Toshiba Satellite C75-A-13W Notebook
Fujitsu LifeBook A544: Intel HD Graphics 4600, 15.60", 2.2 kg
Review » Review Fujitsu LifeBook A544 Notebook
Lenovo B5400 MB825GE: NVIDIA GeForce GT 720M, 15.60", 2.4 kg
Review » Review Lenovo B5400 MB825GE Notebook
Lenovo IdeaPad Z710 59393211: NVIDIA GeForce GT 740M, 17.30", 2.9 kg
Review » Review Lenovo IdeaPad Z710 59393211 Notebook
MSI CX61-i572M: NVIDIA GeForce GT 720M, 15.60", 2.5 kg
Review » Review MSI CX61-i572M281BW7 Notebook
HP Envy 15-j011sg: NVIDIA GeForce GT 740M, 15.60", 2.3 kg
Review » Review HP Envy 15-j011sg Notebook
Lenovo IdeaPad Z510: NVIDIA GeForce GT 740M, 15.60", 2.2 kg
Review » Review Lenovo IdeaPad Z510 Notebook
Fujitsu LifeBook E744: Intel HD Graphics 4600, 14.00", 1.8 kg
External Review » Fujitsu LifeBook E744
Fujitsu LifeBook T734: Intel HD Graphics 4600, 12.50", 2 kg
External Review » Fujitsu LifeBook T734
Lenovo IdeaPad Z510: NVIDIA GeForce GT 740M, 15.60", 2.2 kg
External Review » Lenovo IdeaPad Z510
Toshiba Satellite L50-A-1CE: NVIDIA GeForce GT 740M, 15.60", 2.4 kg
External Review » Toshiba Satellite L50-A-1CE
Fujitsu LifeBook A544: Intel HD Graphics 4600, 15.60", 2.2 kg
External Review » Fujitsu LifeBook A544
Lenovo ThinkPad Edge E540 20C60071BM: NVIDIA GeForce GT 740M, 15.60", 2.5 kg
External Review » Lenovo ThinkPad Edge E540 20C60071BM
Lenovo ThinkPad T540p-20BFA0AVPB: NVIDIA GeForce GT 730M, 15.60", 2.5 kg
External Review » Lenovo ThinkPad T540p-20BFA0AVPB
HP ProBook 650 G1: AMD Radeon HD 8750M, 15.60", 2.3 kg
External Review » HP ProBook 650 G1
Toshiba Portege R30-A-13C: Intel HD Graphics 4600, 13.30", 1.5 kg
External Review » Toshiba Portege R30-A-13C
Lenovo G510-59416358: Intel HD Graphics 4600, 15.60", 2.5 kg
External Review » Lenovo G510
Toshiba Satellite Pro C50-A-1KV: Intel HD Graphics 4600, 15.60", 2.3 kg
External Review » Toshiba Satellite Pro C50-A-1KV
Eurocom Electra 2: NVIDIA GeForce GTX 850M, 15.60", 2.4 kg
External Review » Eurocom Electra 2
HP ProBook 470 G1 E9Y75EA: AMD Radeon HD 8750M, 17.30", 2.9 kg
External Review » HP ProBook 470 G1 E9Y75EA
Acer Aspire V3-772G NX.M8UEX.017: NVIDIA GeForce GTX 760M, 17.30", 3.2 kg
External Review » Acer Aspire V3-772G NX.M8UEX.017
Lenovo Essential M5400: NVIDIA GeForce GT 740M, 15.60", 2.3 kg
External Review » Lenovo Essential M5400
Lenovo B5400 MB825GE: NVIDIA GeForce GT 720M, 15.60", 2.4 kg
External Review » Lenovo B5400 MB825GE
HP ProBook 450 G1: Intel HD Graphics 4600, 15.60", 2.3 kg
External Review » HP ProBook 450 G1
MSI Adora24G 2NC-001EU: NVIDIA GeForce GT 740M, 23.60", 9.2 kg
External Review » MSI Adora24G 2NC-001EU
Eurocom Shark 2.0: NVIDIA GeForce GTX 765M, 15.60", 2.7 kg
External Review » Eurocom Shark 2.0
MSI CR61-i5U45FHDW7: Intel HD Graphics 4600, 15.60", 2.5 kg
External Review » MSI CR61-i5U45FHDW7
Toshiba Satellite C75-A-13P: Intel HD Graphics 4600, 17.30", 2.7 kg
External Review » Toshiba Satellite C75-A-13P
Lenovo IdeaPad G510: AMD Radeon HD 8750M, 15.60", 2.5 kg
External Review » Lenovo IdeaPad G510
One GameStar 13: NVIDIA GeForce GTX 765M SLI, 13.30", 2.5 kg
External Review » One GameStar 13
Asus VivoBook S551LB-CJ005H: NVIDIA GeForce GT 740M, 15.60", 2.4 kg
External Review » Asus VivoBook S551LB-CJ005H