

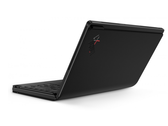
Lenovo ThinkPad X1 Fold laptop in review: Revolutionary or overpriced experiment?
With the ThinkPad X1 Fold, Lenovo presents the first laptop with a foldable OLED panel. However, it has to deal with many limitations in everyday use. We want to find out whether the X1 Fold justifies the high price or whether you should rather avoid the technology experiment.
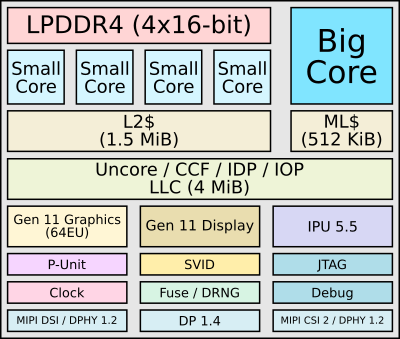
Intel Core i5-L16G7, UHD Graphics G7 (Lakefield GT2 64 EU), 13.3", 1.2 kg