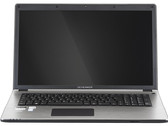
Intel Core i5-4310M
The Intel Core i5-4310M is a fast dual-core processor for laptops launched in Q1/2014. It is based on the Haswell architecture and is manufactured in 22nm. Due to Hyper-Threading, the two cores can handle up to four threads in parallel leading to better utilization of the CPU. Each core offers a base speed of 2.7 GHz but can dynamically increase clock rates with Turbo Boost up to 3.4 GHz for 1 active core or 3.3 GHz for 2 active cores.
Architecture
Haswell is the successor to the Ivy Bridge architecture with improvements on both GPU and CPU performance. The CPUs are produced in 22nm and offer an optimized branch prediction as well as additional execution ports, improving the performance per clock by 5 - 10 percent. Furthermore, new features like AVX2 and FMA should increase the performance in future applications.
Performance
Compared to the Core i5-4300M , the 4310M is clocked just 100 MHz higher and therefore only slightly faster. Overall, the performance is on par with the Ivy Bridge-based Core i7-3540M . Even demanding software or multitasking will be handled easily.
Graphics
The i5-4310M is rated at a TDP of 37 W including the graphics card, memory controller and VRMs. Therefore, the CPU is suited for laptops 14-inches or greater.
Series Intel Core i5 Codename Haswell Series: Core i5 Haswell Clock Rate 2700 - 3400 MHz Level 1 Cache 128 KB Level 2 Cache 512 KB Level 3 Cache 3 MB Number of Cores / Threads 2 / 4 Power Consumption (TDP = Thermal Design Power) 37 Watt Transistor Count 960 Million Manufacturing Technology 22 nm Die Size 130 mm2 Max. Temperature 100 °C Socket rPGA Features HD Graphics 4600 (400 - 1250 MHz), DDR3(L)-1600 Memory Controller, HyperThreading, AVX, AVX2, Quick Sync, Virtualization, vPro, AES-NI GPU Intel HD Graphics 4600 (400 - 1250 MHz)64 Bit 64 Bit support Architecture x86 Starting Price $225 U.S. Announcement Date 01/19/2014 Product Link (external) Intel Core i5 4310M
Benchmarks Cinebench R15 - Cinebench R15 CPU Multi 64 Bit
min: 325 avg: 326 median: 326 (7%) max: 327 Points
...
...
Cinebench R15 - Cinebench R15 CPU Single 64 Bit
min: 128 avg: 129 median: 128.5 (47%) max: 129 Points
...
...
Cinebench R11.5 - Cinebench R11.5 CPU Multi 64 Bit
min: 3.56 avg: 3.6 median: 3.6 (7%) max: 3.59 Points
...
...
Cinebench R11.5 - Cinebench R11.5 CPU Single 64 Bit
min: 1.47 avg: 1.5 median: 1.5 (47%) max: 1.48 Points
...
...
Cinebench R10 - Cinebench R10 Rend. Single (32bit)
4664 points (42%)
...
Intel Core i5-2500K 2%
...
Cinebench R10 - Cinebench R10 Rend. Multi (32bit)
9622 points (16%)
...
Intel Core 2 Extreme (Desktop) QX6700 -1%
...
Cinebench R10 - Cinebench R10 Rend. Multi (64bit)
14079 Points (13%)
...
...
Cinebench R10 - Cinebench R10 Rend. Single (64bit)
6533 Points (49%)
...
...
wPrime 2.10 - wPrime 2.0 1024m *
496 s (6%)
...
...
VIA C3-M C3-M-1200 1606%
wPrime 2.10 - wPrime 2.0 32m *
15.6 s (3%)
...
...
2578 points (17%)
...
...
X264 HD Benchmark 4.0 - x264 Pass 2
20.7 fps (9%)
Intel Pentium 4 2.4 GHz -91%
...
...
X264 HD Benchmark 4.0 - x264 Pass 1
105 fps (31%)
...
...
TrueCrypt - TrueCrypt Serpent
0.2 GB/s (7%)
...
...
TrueCrypt - TrueCrypt Twofish
0.3 GB/s (8%)
...
...
TrueCrypt - TrueCrypt AES
2 GB/s (7%)
...
...
Super Pi mod 1.5 XS 1M - Super Pi mod 1.5 XS 1M *
11.4 s (2%)
...
...
VIA C3-M C3-M-1200 3961%
Super Pi mod 1.5 XS 2M - Super Pi mod 1.5 XS 2M *
26 s (1%)
...
Intel Core i5-2400 -1%
...
Super Pi Mod 1.5 XS 32M - Super Pi mod 1.5 XS 32M *
591 s (3%)
...
Intel Core i5-2500K 0%
...
VIA C3-M C3-M-1200 3709%
3DMark Vantage - 3DM Vant. Perf. CPU no Physx
11595 Points (13%)
...
Intel Core 2 Quad (Desktop) Q9550 -2%
...
3DMark 11 - 3DM11 Performance Physics
min: 3846 avg: 3976 median: 3976 (15%) max: 4106 Points
...
...
3DMark - 3DMark Ice Storm Physics
min: 34628 avg: 37014 median: 37013.5 (24%) max: 39399 Points
...
...
3DMark - 3DMark Cloud Gate Physics
min: 3300 avg: 3312 median: 3312 (8%) max: 3324 Points
...
...
3DMark - 3DMark Fire Strike Standard Physics
min: 4582 avg: 4736 median: 4735.5 (12%) max: 4889 Points
...
...
Geekbench 2 - 32 Bit - Geekbench Stream
5307 Points (43%)
...
...
Geekbench 2 - 32 Bit - Geekbench Memory
5403 Points (49%)
...
...
Geekbench 2 - 32 Bit - Geekbench Floating Point
7454 Points (15%)
...
...
Geekbench 2 - 32 Bit - Geekbench Integer
6880 Points (14%)
...
...
Geekbench 2 - 32 Bit - Geekbench Total Score
6628 Points (17%)
...
...
Geekbench 3 - Geekbench 3 32 Bit Multi-Core
6227 points (11%)
...
...
Geekbench 3 - Geekbench 3 32 Bit Single-Core
2939 points (60%)
...
...
- Range of benchmark values for this graphics card
- Average benchmark values for this graphics card
* Smaller numbers mean a higher performance
v1.16
log 03. 12:14:19
#0 no ids found in url (should be separated by "_") +0s ... 0s
#1 not redirecting to Ajax server +0s ... 0s
#2 did not recreate cache, as it is less than 5 days old! Created at Wed, 03 Mar 2021 08:41:35 +0100 +0.001s ... 0.001s
#3 composed specs +0.016s ... 0.016s
#4 did output specs +0s ... 0.016s
#5 getting avg benchmarks for device 5011 +0.001s ... 0.017s
#6 got single benchmarks 5011 +0.009s ... 0.026s
#7 got avg benchmarks for devices +0s ... 0.026s
#8 min, max, avg, median took s +0.371s ... 0.396s
#9 return log +0.032s ... 0.428s
Other CPUs of the series Core i5 Surrounding CPUs
Please share our article, every link counts!
Klaus Hinum (Update: 2014-01-23)
Top 10 Laptops Multimedia , Budget Multimedia , Gaming , Budget Gaming , Lightweight Gaming , Business , Budget Office , Workstation , Subnotebooks , Ultrabooks , Chromebooks
under 300 USD/Euros , under 500 USD/Euros , 1.000 USD/Euros
Best Displays , for University Students
Top 10 Smartphones Smartphones , Phablets , ≤5-inch , Camera Smartphones Notebookcheck's Top 10 Smartphones under 160 Euros