Reviews for the AMD Ryzen 7 4700U processor
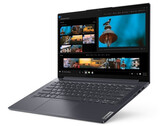
Lenovo Yoga Slim 7 14ARE05 in Review: Compact Powerhouse with Good Battery Life
Lenovo's 14-inch notebook features a powerful Ryzen 7 4700U APU with NVMe SSD and offers decent battery life. Noise and temperature emissions are fairly low for a device this thin.
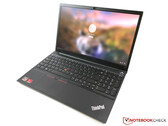
AMD Ryzen 7 4700U, Vega 7, 14", 1.4 kgLenovo ThinkPad E15 Gen.2 Review: Office laptop with an AMD chip and new design
The 15.6-inch office laptop from Lenovo comes with the redesigned housing and only AMD CPUs. We examine the second generation of the ThinkPad E15 with a Ryzen 7 processor.
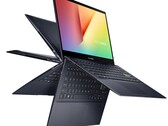
AMD Ryzen 7 4700U, Vega 7, 15.6", 1.8 kgAsus VivoBook Flip 14 TM420IA Ryzen 7 Convertible Review: Core i7 Need Not Apply
It's another home run for the affordable Asus VivoBook Flip series as this AMD-powered convertible retails is both faster and cheaper than many Intel Core i7 alternatives in the market.
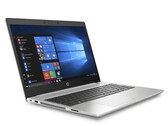
AMD Ryzen 7 4700U, Vega 7, 14", 1.6 kgHP ProBook 455 G7 Laptop in Review: Faster Performance Thanks to Zen2
With AMD's Renoir CPUs, HP has significantly elevated the performance level of the ProBook 455 G7. We took a closer look and determined whether the battery life is affected by this change. In this review, we will also go into all the other new features and ascertain whether the laptop is worth purchasing.
AMD Ryzen 7 4700U, Vega 7, 15.6", 1.8 kgAcer Swift 3 SF314-42 Laptop Review: Fast, slim and with good battery life - The Ryzen subnotebook is almost completely convincing
Acer's new 14-inch laptop has AMD's brand-new Ryzen 7 4700U APU on board, which lacks neither CPU nor GPU performance. Good battery life has not been compromised on despite the machine's large computing power, though. The new Swift 3 is well-equipped in other areas too, with Acer including an NVMe SSD, a matte IPS screen, a backlit keyboard and dual-channel RAM.
AMD Ryzen 7 4700U, Vega 7, 14", 1.2 kgFujitsu Lifebook U9311A, R7 4700U: AMD Radeon RX Vega 7, 13.30", 0.9 kg
External Review » Fujitsu Lifebook U9311A, R7 4700U
Asus VivoBook Flip 14 TM420IA-EC230T: AMD Radeon RX Vega 7, 14.00", 1.5 kg
External Review » Asus VivoBook Flip 14 TM420IA-EC230T
HP Envy x360 13-ay0004ns: AMD Radeon RX Vega 7, 13.30", 1.3 kg
External Review » HP Envy x360 13-ay0004ns
LG Ultra PC 13U70P-G.AAW7U1: AMD Radeon RX Vega 7, 13.30", 1 kg
External Review » LG Ultra PC 13U70P-G.AAW7U1
HP 15s-eq1073ns: AMD Radeon RX Vega 7, 15.60", 1.7 kg
External Review » HP 15s-eq1073ns
HP 15s-eq1071ns: AMD Radeon RX Vega 7, 15.60", 1.7 kg
External Review » HP 15s-eq1071ns
Acer Aspire 5 A515-44-R5QH: AMD Radeon RX Vega 7, 15.60", 1.8 kg
External Review » Acer Aspire 5 A515-44-R5QH
HP 15s-eq1083ns: AMD Radeon RX Vega 7, 15.60", 1.7 kg
External Review » HP 15s-eq1083ns
HP Envy x360 13-ay0003ns: AMD Radeon RX Vega 7, 13.30", 1.3 kg
External Review » HP Envy x360 13-ay0003ns
Acer Swift 3 SF314-42-R7QS: AMD Radeon RX Vega 7, 14.00", 1.2 kg
External Review » Acer Swift 3 SF314-42-R7QS
Asus VivoBook 15 S513IA-DB74: AMD Radeon RX Vega 7, 15.60", 1.6 kg
External Review » Asus VivoBook 15 S513IA-DB74
HP Pavilion 15-eh0014na: AMD Radeon RX Vega 7, 15.60", 1.8 kg
External Review » HP Pavilion 15-eh0014na
HP 15s-eq1105ns: AMD Radeon RX Vega 7, 15.60", 1.7 kg
External Review » HP 15s-eq1105ns
HP Pavilion 15-eh0177ng: AMD Radeon RX Vega 7, 15.60", 1.8 kg
External Review » HP Pavilion 15-eh0177ng
HP Probook 635 Aero G7, 4700U: AMD Radeon RX Vega 7, 13.30", 1 kg
External Review » HP Probook 635 Aero G7, 4700U
Lenovo Yoga Slim 7 14ARE05-82A200ABMH: AMD Radeon RX Vega 7, 14.00", 1.3 kg
External Review » Lenovo Yoga Slim 7 14ARE05-82A200ABMH
Asus VivoBook 15 M513IA-BQ443T: AMD Radeon RX Vega 7, 15.60", 1.8 kg
External Review » Asus VivoBook 15 M513IA-BQ443T
Lenovo ThinkBook 14 G2 ARE-20VF000BGE: AMD Radeon RX Vega 7, 14.00", 1.4 kg
External Review » Lenovo ThinkBook 14 G2 ARE-20VF000BGE
MSI Modern 14 B4MW-005TH: AMD Radeon RX Vega 7, 14.00", 1.3 kg
External Review » MSI Modern 14 B4MW-005TH
Asus ZenBook 14 UM425IA-AM006T: AMD Radeon RX Vega 7, 14.00", 1.3 kg
External Review » Asus ZenBook 14 UM425IA-AM006T
Asus VivoBook S15 M513IA-EJ354: AMD Radeon RX Vega 7, 15.60", 1.8 kg
External Review » Asus VivoBook S15 M513IA-EJ354
Asus VivoBook Flip 14 TM420IA-EC207: AMD Radeon RX Vega 7, 14.00", 1.5 kg
External Review » Asus VivoBook Flip 14 TM420IA-EC207
Acer Swift 3 SF314-42-R30P: AMD Radeon RX Vega 7, 14.00", 1.2 kg
External Review » Acer Swift 3 SF314-42-R30P
Asus VivoBook S14 M433IA-EB069: AMD Radeon RX Vega 7, 14.00", 1.4 kg
External Review » Asus VivoBook S14 M433IA-EB069
Asus ZenBook 14 UM421IA: AMD Radeon RX Vega 7, 14.00", 1.3 kg
External Review » Asus ZenBook 14 UM421IA
Lenovo IdeaPad Flex 5 14ARE05-81X200DHMH: AMD Radeon RX Vega 7, 14.00", 1.5 kg
External Review » Lenovo IdeaPad Flex 5 14ARE05-81X200DHMH
HP Envy x360 15-ee0425no: AMD Radeon RX Vega 7, 15.60", 2 kg
External Review » HP Envy x360 15-ee0425no
Asus VivoBook 14 S413IA-EK663T: AMD Radeon RX Vega 7, 14.00", 1.4 kg
External Review » Asus VivoBook 14 S413IA-EK663T
HP ProBook x360 435 G7, Ryzen 7 4700U: AMD Radeon RX Vega 7, 13.30", 1.5 kg
External Review » HP ProBook x360 435 G7, Ryzen 7 4700U
Lenovo ThinkPad E15 Gen2-20T9S00K00: AMD Radeon RX Vega 7, 15.60", 1.8 kg
External Review » Lenovo ThinkPad E15 Gen2-20T9S00K00
Lenovo Yoga Slim 7 14ARE05 82A20008GE: AMD Radeon RX Vega 7, 14.00", 1.4 kg
External Review » Lenovo Yoga Slim 7 14ARE05 82A20008GE
HP Envy x360 13-ay0008nw: AMD Radeon RX Vega 7, 13.30", 1.4 kg
External Review » HP Envy x360 13-ay0008nw
Lenovo Yoga 6 13, 4700U: AMD Radeon RX Vega 7, 13.30", 1.4 kg
External Review » Lenovo Yoga 6 13, 4700U
Acer Swift 3 SF314-42-R3ZU: AMD Radeon RX Vega 7, 14.00", 1.2 kg
External Review » Acer Swift 3 SF314-42-R3ZU
HP ProBook 445 G7, R7 4700U: AMD Radeon RX Vega 7, 14.00", 1.6 kg
External Review » HP ProBook 445 G7, R7 4700U
Lenovo IdeaPad Flex 5 14ARE05-81X2004YGE: AMD Radeon RX Vega 7, 14.00", 1.5 kg
External Review » Lenovo IdeaPad Flex 5 14ARE05-81X2004YGE
HP Envy x360 13-ay0003nd: AMD Radeon RX Vega 7, 13.30", 1.3 kg
External Review » HP Envy x360 13-ay0003nd
HP Envy x360 15-ee0175nd: AMD Radeon RX Vega 7, 15.60", 2 kg
External Review » HP Envy x360 15-ee0175nd
Asus VivoBook S15 M533IA-BQ070T: AMD Radeon RX Vega 7, 15.60", 1.8 kg
External Review » Asus VivoBook S15 M533IA-BQ070T
HP ProBook 455 G7-175W8EA: AMD Radeon RX Vega 7, 15.60", 1.8 kg
External Review » HP ProBook 455 G7-175W8EA
Asus VivoBook Flip 14 TM420IA: AMD Radeon RX Vega 7, 14.00", 1.6 kg
External Review » Asus VivoBook Flip 14 TM420IA
Lenovo ThinkPad E14 Gen2-20T6000MGE: AMD Radeon RX Vega 7, 14.00", 1.6 kg
External Review » Lenovo ThinkPad E14 Gen2-20T6000MGE
Acer Swift 3 SF314-42-R991: AMD Radeon RX Vega 7, 14.00", 1.2 kg
External Review » Acer Swift 3 SF314-42-R991
HP Envy x360 13-ay0002ns: AMD Radeon RX Vega 7, 13.30", 1.3 kg
External Review » HP Envy x360 13-ay0002ns
MSI Modern 14 B4MW-032XES: AMD Radeon RX Vega 7, 14.00", 1.3 kg
External Review » MSI Modern 14 B4MW-032XES
Asus ZenBook 14 UM425IA-HM032R: AMD Radeon RX Vega 7, 14.00", 1.1 kg
External Review » Asus ZenBook 14 UM425IA-HM032R
Acer Aspire 5 A515-44-R8VV: AMD Radeon RX Vega 7, 15.60", 1.8 kg
External Review » Acer Aspire 5 A515-44-R8VV
Xiaomi RedmiBook 16 R7 4700U: AMD Radeon RX Vega 7, 16.10", 1.8 kg
External Review » Xiaomi RedmiBook 16 R7 4700U
Lenovo Yoga Slim 7-14ARE05, Ryzen 7 4700U: AMD Radeon RX Vega 7, 14.00", 1.4 kg
External Review » Lenovo Yoga Slim 7 14ARE05, Ryzen 7 4700U
Acer Swift 3 SF314-42-R9YN: AMD Radeon RX Vega 7, 14.00", 1.2 kg
External Review » Acer Swift 3 SF314-42-R9YN
Lenovo IdeaPad 5 15ARE05-81YQ006JMH: AMD Radeon RX Vega 7, 15.60", 1.6 kg
External Review » Lenovo IdeaPad 5 15ARE05-81YQ006JMH
Asus VivoBook S14 M433IA, Ryzen 7 4700U: AMD Radeon RX Vega 7, 14.00", 1.4 kg
External Review » Asus VivoBook S14 M433IA, Ryzen 7 4700U
Asus ZenBook 14 UM433IQ-A5026T: NVIDIA GeForce MX350, 14.00", 1.2 kg
External Review » Asus ZenBook 14 UM433IQ-A5026T
Acer Swift 3 SF314-42-R4XJ: AMD Radeon RX Vega 7, 14.00", 1.2 kg
External Review » Acer Swift 3 SF314-42-R4XJ
Lenovo Yoga Slim 7 14ARE05 82A20008GE: AMD Radeon RX Vega 7, 14.00", 1.4 kg
» Ryzen 7 4700U Unleashed - Lenovo does not hold back the Yoga 7 Slim 14ARE05's APU
Lenovo ThinkPad E15 Gen2-20T9S00K00: AMD Radeon RX Vega 7, 15.60", 1.8 kg
» Lenovo's ThinkPad E15 Gen.2 AMD offers a more compact design and a lot more performance
Asus VivoBook Flip 14 TM420IA: AMD Radeon RX Vega 7, 14.00", 1.6 kg
» Ryzen-powered Asus VivoBook Flip 14 shows just how badly Intel needs to launch its Tiger Lake platform
HP ProBook 455 G7-175W8EA: AMD Radeon RX Vega 7, 15.60", 1.8 kg
» HP ProBook 455 G7 Laptop with faster performance and unaffected battery life
Lenovo ThinkPad E15 Gen2-20T9S00K00: AMD Radeon RX Vega 7, 15.60", 1.8 kg
» The first ThinkPad with Ryzen 4000 has arrived: AMD much faster than Intel
Acer Swift 3 SF314-42-R4XJ: AMD Radeon RX Vega 7, 14.00", 1.2 kg
» No chance for Intel: AMD Ryzen 7 4700U takes apart the Core i7-1065G7 in our Acer Swift 3 SF314-42 review