Reviews for the Intel Core i5-11300H processor
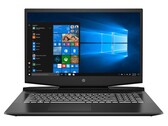
HP Pavilion Gaming 17 laptop review: A good display at a budget price
While most gaming laptops priced under 1,000 Euros (~$1,002) show significant weaknesses in image quality (keyword: color space), HP claims that the Pavilion Gaming 17-cd2146ng offers an sRGB coverage of 100%. We put the 17-incher through its paces.
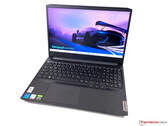
Intel Core i5-11300H, NVIDIA GeForce RTX 3050 Ti Laptop GPU, 17.3", 2.8 kgLenovo IdeaPad Gaming 3i 15 G6 Laptop Review: Budget Gaming Laptop with Poor Display
Lenovo's IdeaPad Gaming 3i 15 is a sixth generation affordable gaming notebook. Our review unit, priced at around $900, pairs an Intel Tiger Lake H35 processor with a 90 W GeForce RTX 3050 Ti - an ideal combination for FHD gaming.
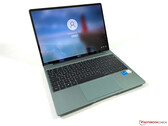
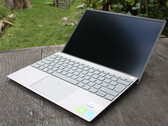
Intel Core i5-11300H, NVIDIA GeForce RTX 3050 Ti Laptop GPU, 15.6", 2 kgHuawei MateBook 13s Review: Great subnotebook with 90 Hz display
Huawei’s MateBook 13s is a very compact subnotebook with a high-resolution 13-inch screen as well as a modern Tiger Lake-H35 processor from Intel. Combined with decent input devices and good speakers, the MateBook 13s turns out to be a very interesting package.
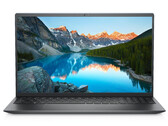
Intel Core i5-11300H, Iris Xe G7 80EUs, 13.4", 1.3 kgDell Inspiron 15 5518 laptop in review: The CPU is slowed down
The Inspiron 15 5518 offers a Core i5-11300H processor, a GeForce-MX450 GPU and 8 GB of working memory. The latter works in single-channel mode. Positive: The notebook delivers very good battery runtimes and offers space for two NVMe SSDs.
Intel Core i5-11300H, NVIDIA GeForce MX450, 15.6", 1.8 kgDell Inspiron 13 5310 review: More graphics, more battery life
Dell's 13-inch Inspiron 13 5310 combines everything your heart desires: A powerful Intel-H processor with 35 watts, a dedicated graphics card, a matte sRGB display in the Full HD resolution, and two Thunderbolt 4 ports, in addition to a large 54-Wh battery. What could possibly go wrong with this?
Intel Core i5-11300H, NVIDIA GeForce MX450, 13.3", 1.3 kgLenovo IdeaPad 5 Pro 16IHU6: NVIDIA GeForce MX450, 16.00", 1.9 kg
Review » Lenovo IdeaPad 5 Pro 16IHU6 in review: 16-inch all-rounder with good battery life
Acer Nitro 5 AN517-53-54DQ: NVIDIA GeForce RTX 3050 4GB Laptop GPU, 17.30", 2.6 kg
Review » Acer Nitro 5 AN517-53 review : Affordable gaming laptop with RTX 3050
Dell Inspiron 14 5410, i5-11300H: Intel Iris Xe Graphics G7 80EUs, 14.00", 1.4 kg
External Review » Dell Inspiron 14 5410, i5-11300H
Asus Vivobook 15 F1605PA: Intel Iris Xe Graphics G7 80EUs, 16.00", 1.9 kg
External Review » Asus Vivobook 15 F1605PA
Asus Vivobook Pro 15 K3500PC-L1293: NVIDIA GeForce RTX 3050 4GB Laptop GPU, 15.60", 1.7 kg
External Review » Asus Vivobook Pro 15 K3500PC-L1293
Lenovo Yoga Slim 7 Pro 14IHU5-82NH0048GE: Intel Iris Xe Graphics G7 80EUs, 14.00", 1.4 kg
External Review » Lenovo Yoga Slim 7 Pro 14IHU5-82NH0048GE
Acer Swift 3 SF316-51-57D7: Intel Iris Xe Graphics G7 80EUs, 16.10", 1.8 kg
External Review » Acer Swift 3 SF316-51-57D7
Microsoft Surface Laptop Studio i5-11300H: Intel Iris Xe Graphics G7 80EUs, 14.40", 1.7 kg
External Review » Microsoft Surface Laptop Studio i5-11300H
Xiaomi Mi Notebook Ultra 2021 i5: Intel Iris Xe Graphics G7 80EUs, 15.60", 1.7 kg
External Review » Xiaomi Mi Notebook Ultra 2021 i5
Acer Nitro 5 AN515-56-54DF: NVIDIA GeForce GTX 1650 Mobile, 15.60", 2.3 kg
External Review » Acer Nitro 5 AN515-56-54DF
Acer Nitro 5 AN515-56-51V8: NVIDIA GeForce GTX 1650 Mobile, 15.60", 2.3 kg
External Review » Acer Nitro 5 AN515-56-51V8
Lenovo IdeaPad Gaming 3 15IHU6-82K100QHGE: NVIDIA GeForce RTX 3050 4GB Laptop GPU, 15.60", 2.3 kg
External Review » Lenovo IdeaPad Gaming 3 15IHU6-82K100QHGE
Asus Vivobook Pro 14 K3400PA-WH51: Intel Iris Xe Graphics G7 80EUs, 14.00", 1.4 kg
External Review » Asus Vivobook Pro 14 K3400PA-WH51
Asus Vivobook Pro 16X N7600PC-L2012R: NVIDIA GeForce RTX 3050 4GB Laptop GPU, 16.10", 2 kg
External Review » Asus Vivobook Pro 16X N7600PC-L2012R
Asus Vivobook Pro 14 K3400, i5-11300H GTX 1650: NVIDIA GeForce GTX 1650 Mobile, 14.00", 1.4 kg
External Review » Asus Vivobook Pro 14 K3400, i5-11300H GTX 1650
HP Pavilion Gaming 15-dk2002TX: NVIDIA GeForce RTX 3050 4GB Laptop GPU, 15.60", 2.2 kg
External Review » HP Pavilion Gaming 15-dk2002TX
Asus VivoBook Pro 14X N7400, i5-11300H RTX 3050: NVIDIA GeForce RTX 3050 4GB Laptop GPU, 14.00", 1.5 kg
External Review » Asus VivoBook Pro 14X N7400, i5-11300H RTX 3050
Asus VivoBook Pro 15 K3500PC-L1009T: NVIDIA GeForce RTX 3050 4GB Laptop GPU, 15.60", 1.7 kg
External Review » Asus VivoBook Pro 15 K3500PC-L1009T
Lenovo IdeaPad Gaming 3 15IHU6-82K1002QGE: NVIDIA GeForce RTX 3050 4GB Laptop GPU, 15.60", 2.3 kg
External Review » Lenovo IdeaPad Gaming 3 15IHU6-82K1002QGE
Huawei MateBook 14s i5: Intel Iris Xe Graphics G7 80EUs, 14.20", 1.4 kg
External Review » Huawei MateBook 14s i5
Xiaomi RedmiBook Pro 15, i5-11300H iGPU: Intel Iris Xe Graphics G7 80EUs, 15.60", 1.7 kg
External Review » Xiaomi RedmiBook Pro 15, i5-11300H iGPU
Acer Swift 3 SF316-51-51BS: Intel Iris Xe Graphics G7 80EUs, 16.10", 1.8 kg
External Review » Acer Swift 3 SF316-51-51BS
Acer Nitro 5 AN515-56-58CQ: NVIDIA GeForce GTX 1650 Mobile, 15.60", 2.3 kg
External Review » Acer Nitro 5 AN515-56-58CQ
Xiaomi Mi Notebook Pro 15, i5-11300H MX450: NVIDIA GeForce MX450, 15.60", 1.8 kg
External Review » Xiaomi Mi Notebook Pro 15, i5-11300H MX450
Xiaomi RedmiBook Pro 15, i5-11300H MX450: NVIDIA GeForce MX450, 15.60", 1.7 kg
External Review » Xiaomi RedmiBook Pro 15, i5-11300H MX450
Acer Aspire Nitro 5 AN517-53-51FQ: NVIDIA GeForce GTX 1650 Mobile, 17.30", 2.7 kg
External Review » Acer Aspire Nitro 5 AN517-53-51FQ
Acer Predator Triton 300SE PT314-51s-57YJ: NVIDIA GeForce RTX 3060 Laptop GPU, 14.00", 1.7 kg
External Review » Acer Predator Triton 300SE PT314-51s-57YJ
Dell Inspiron 13 5310-NJ24J: NVIDIA GeForce MX450, 13.30", 1.3 kg
» Overextended cooling: The Dell Inspiron 13 5310
Lenovo IdeaPad 5 Pro 16IHU6: NVIDIA GeForce MX450, 16.00", 1.9 kg
» First place among GeForce MX450 laptops