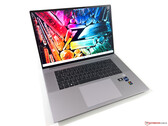
Intel Core i7-12800H
The Intel Core i7-12800H is a high-end mobile CPU for laptops based on the Alder Lake architecture. It was announced in early 2022 and offers 6 performance cores (P-cores, Golden Cove architecture) and 8 efficient cores (E-cores, Gracemont architecture). The P-cores support Hyper-Threading leading to 20 supported threads when combined with the E-cores. The clock rate ranges from 2.4 to 4.8 GHz on the performance cluster and 1.8 to3.7 GHz on the efficient cluster. The performance of the E-cores should be similar to old Skylake cores (compare to the Core i7-6920HQ ). All cores can use up to 24 MB L3 cache. Compared to the 12900H , the 12800H is lower clocked and also features the full "Enterprise" set of vPro features (for remote management).
Performance
The average 12800H in our database matches AMD Ryzen 9 6900HS and Intel Core i9-11900H in multi-thread performance, making this Core i7 a great CPU for gaming laptops and DTRs.
Features
The integrated memory controller supports various memory types up to DDR5-4800, DDR4-3200, LPDDR5-5200, and LPDDR4x-4267. The Thread Director (in hardware) can support the operating system to decide which thread to use on the performance or efficient cores for the best performance. For AI tasks, the CPU also integrates GNA 3.0 and DL Boost (via AVX2). Quick Sync in version 8 is the same as in the Rocket Lake CPUs and supports MPEG-2, AVC, VC-1 decode, JPEG, VP8 decode, VP9, HEVC, and AV1 decode in hardware. The CPU only supports PCIe 4.0 (x8 for a GPU and two x4 for SSDs).
The integrated graphics card is based on the Xe-architecture and offers 96 EUs (Execution Units) operating at up to 1.4 GHz.
The CPU is rated at 45 W base power (115 W PL2) but most laptops will use a PL1 of around 60 Watt. The SoC is manufactured in a 10nm process at Intel, which is known as Intel 7.
Series Intel Alder Lake-P Codename Alder Lake-P Series: Alder Lake-P Alder Lake-P Clock Rate 1800 - 4800 MHz Level 1 Cache 1.2 MB Level 2 Cache 11.5 MB Level 3 Cache 24 MB Number of Cores / Threads 14 / 20 Power Consumption (TDP = Thermal Design Power) 45 Watt Manufacturing Technology 10 nm Max. Temperature 100 °C Socket FCBGA1744 Features Thread Director GPU Intel Iris Xe Graphics G7 96EUs ( - 1400 MHz)64 Bit 64 Bit support Architecture x86 Announcement Date 01/04/2022
Benchmarks Performance Rating - CB R15 + R20 + 7-Zip + X265 + Blender + 3DM11 CPU
57.3 pt (64%)
...
Cinebench R23 - Cinebench R23 Multi Core
min: 9777 avg: 14387 median: 15283 (25%) max: 16597 Points
CPU TDP 55 W TDP 60 W TDP 61 W TDP 65 W TDP 70 W 90% 93% 92% 59% 100%
...
Cinebench R23 - Cinebench R23 Single Core
min: 1796 avg: 1824 median: 1828 (80%) max: 1859 Points
CPU TDP 55 W TDP 60 W TDP 61 W TDP 65 W TDP 70 W 97% 98% 99% 97% 100%
...
Cinebench R20 - Cinebench R20 CPU (Single Core)
min: 690 avg: 703 median: 706 (81%) max: 714 Points
CPU TDP 55 W TDP 60 W TDP 61 W TDP 65 W TDP 70 W 97% 99% 99% 97% 100%
...
Cinebench R20 - Cinebench R20 CPU (Multi Core)
min: 3741 avg: 5443 median: 5731 (24%) max: 6433 Points
CPU TDP 55 W TDP 60 W TDP 61 W TDP 65 W TDP 70 W 89% 84% 92% 58% 100%
...
...
Cinebench R15 - Cinebench R15 CPU Multi 64 Bit
min: 1566 avg: 2236 median: 2222 (23%) max: 2697 Points
CPU TDP 55 W TDP 60 W TDP 61 W TDP 65 W TDP 70 W 81% 100% 82% 58% 93%
...
...
0 135 270 405 540 675 810 945 1080 1215 1350 1485 1620 1755 1890 2025 2160 2295 2430 2565 Tooltip Razer Blade 15 Advanced Model Early 2022: Ø1535 (1448.91-1565.5)
Razer Blade 15 2022: Ø2081 (2061.43-2178.41)
Razer Blade 17 RTX 3080 Ti: Ø2150 (2140.41-2221.61)
HP ZBook Studio 16 G9 62U04EA: Ø2518 (2462.45-2642.53)
Razer Blade 17 (i7-12800H, RTX 3070 Ti): Ø2179 (2132.31-2697.42)
Cinebench R15 - Cinebench R15 CPU Single 64 Bit
min: 242 avg: 260 median: 265 (81%) max: 269 Points
CPU TDP 55 W TDP 60 W TDP 61 W TDP 65 W TDP 70 W 96% 99% 99% 90% 100%
...
7-Zip 18.03 - 7-Zip 18.03 Multli Thread 4 runs
min: 44553 avg: 59950 median: 62100 (38%) max: 68930 MIPS
CPU TDP 55 W TDP 60 W TDP 61 W TDP 65 W TDP 70 W 90% 90% 90% 65% 100%
...
...
7-Zip 18.03 - 7-Zip 18.03 Single Thread 4 runs
min: 5726 avg: 5835 median: 5820 (70%) max: 5976 MIPS
CPU TDP 55 W TDP 60 W TDP 61 W TDP 65 W TDP 70 W 96% 96% 97% 99% 100%
...
HWBOT x265 Benchmark v2.2 - HWBOT x265 4k Preset
min: 11.7 avg: 16.3 median: 16.8 (36%) max: 19.4 fps
CPU TDP 55 W TDP 60 W TDP 61 W TDP 65 W TDP 70 W 89% 84% 87% 60% 100%
...
0 5 10 15 20 25 30 Tooltip Razer Blade 15 Advanced Model Early 2022: Ø11.9 (1.28-21)
Razer Blade 17 (i7-12800H, RTX 3070 Ti): Ø16.8 (1.39-29.4)
Razer Blade 17 RTX 3080 Ti: Ø18.2 (1.47-31.5)
Razer Blade 15 2022: Ø18.8 (1.52-30.4)
HP ZBook Studio 16 G9 62U04EA: Ø20 (1.42-31)
Blender - Blender 3.3 Classroom CPU *
337 Seconds (5%)
...
...
Blender - Blender 2.79 BMW27 CPU *
min: 192 avg: 233.2 median: 222 (2%) max: 306 Seconds
CPU TDP 55 W TDP 60 W TDP 61 W TDP 65 W TDP 70 W 101% 101% 101% 100% 101%
...
...
R Benchmark 2.5 - R Benchmark 2.5 *
min: 0.4442 avg: 0.5 median: 0.5 (10%) max: 0.4715 sec
CPU TDP 55 W TDP 60 W TDP 61 W TDP 65 W TDP 70 W 100% 100% 100% 100% 101%
...
3DMark 11 - 3DM11 Performance Physics
min: 15130 avg: 21336 median: 22022 (61%) max: 24746 Points
CPU TDP 55 W TDP 60 W TDP 61 W TDP 65 W TDP 70 W 96% 85% 89% 61% 100%
...
...
3DMark - 3DMark Ice Storm Physics
79353 Points (51%)
...
...
3DMark - 3DMark Cloud Gate Physics
min: 12719 avg: 17648 median: 18989 (48%) max: 19895 Points
CPU TDP 55 W TDP 60 W TDP 61 W TDP 65 W 97% 93% 100% 64%
...
...
3DMark - 3DMark Fire Strike Standard Physics
min: 21866 avg: 27059 median: 27907 (51%) max: 29584 Points
CPU TDP 55 W TDP 60 W TDP 61 W TDP 65 W TDP 70 W 96% 93% 94% 74% 100%
...
3DMark - 3DMark Time Spy CPU
min: 9325 avg: 11508 median: 11786 (58%) max: 13353 Points
CPU TDP 55 W TDP 60 W TDP 61 W TDP 65 W TDP 70 W 100% 76% 88% 70% 97%
...
...
Geekbench 5.4 - Geekbench 5.1 - 5.4 64 Bit Single-Core
min: 1739 avg: 1790 median: 1771 (77%) max: 1842 points
CPU TDP 55 W TDP 60 W TDP 61 W TDP 65 W TDP 70 W 95% 96% 94% 100% 100%
...
Geekbench 5.4 - Geekbench 5.1 - 5.4 64 Bit Multi-Core
min: 9607 avg: 11957 median: 12434 (43%) max: 12940 points
CPU TDP 55 W TDP 60 W TDP 61 W TDP 65 W TDP 70 W 96% 93% 99% 74% 100%
...
...
Mozilla Kraken 1.1 - Kraken 1.1 Total Score *
min: 510 avg: 520 median: 513 (1%) max: 542 ms
CPU TDP 55 W TDP 61 W TDP 65 W TDP 70 W 100% 100% 100% 100%
...
Octane V2 - Octane V2 Total Score
91965 Points (95%)
...
WebXPRT 4 - WebXPRT 4 Score
265 Points (83%)
...
...
WebXPRT 3 - WebXPRT 3 Score
min: 284 avg: 294.8 median: 294.5 (75%) max: 306 Points
CPU TDP 55 W TDP 61 W TDP 65 W TDP 70 W 96% 93% 100% 96%
...
...
CrossMark - CrossMark Overall
min: 1768 avg: 1800 median: 1790 (69%) max: 1843 Points
CPU TDP 60 W TDP 65 W TDP 70 W 97% 96% 100%
...
Power Consumption - Prime95 Power Consumption - external Monitor *
min: 67.7 avg: 108.7 median: 118 (20%) max: 126 Watt
CPU TDP 55 W TDP 60 W TDP 61 W TDP 65 W TDP 70 W 102% 102% 100% 113% 103%
...
...
0 15 30 45 60 75 90 105 120 135 150 165 180 195 Tooltip Razer Blade 15 Advanced Model Early 2022: Ø67.7 (65.1-83.5)
HP ZBook Studio 16 G9 62U04EA: Ø112.6 (103.4-126.5)
Razer Blade 17 (i7-12800H, RTX 3070 Ti): Ø118.4 (116.74-120)
Razer Blade 15 2022: Ø118.8 (109-162)
Razer Blade 17 RTX 3080 Ti: Ø126.4 (116-204)
Power Consumption - Cinebench R15 Multi Power Consumption - external Monitor *
min: 84.3 avg: 135.4 median: 143 (30%) max: 158 Watt
CPU TDP 55 W TDP 60 W TDP 61 W TDP 65 W TDP 70 W 105% 102% 100% 123% 106%
...
0 10 20 30 40 50 60 70 80 90 100 110 120 130 140 150 160 Tooltip Razer Blade 15 Advanced Model Early 2022: Ø84.3 (65.1-96.2)
HP ZBook Studio 16 G9 62U04EA: Ø139.5 (137.6-141.9)
Razer Blade 15 2022: Ø142.8 (142-144)
Razer Blade 17 (i7-12800H, RTX 3070 Ti): Ø152.2 (148.91-154.1)
Razer Blade 17 RTX 3080 Ti: Ø158.1 (147-168)
Power Consumption - Cinebench R15 Multi Power Efficiency - external Monitor
min: 14.1 avg: 16.4 median: 16.5 (19%) max: 18.6 Points per Watt
CPU TDP 55 W TDP 60 W TDP 61 W TDP 65 W 82% 95% 76% 100%
...
...
- Range of benchmark values for this graphics card
- Average benchmark values for this graphics card
* Smaller numbers mean a higher performance