Reviews for the Intel Core i7-12650H processor
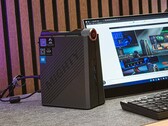
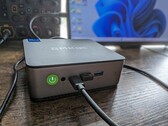
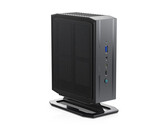
Nipogi AD08 mini PC review: The stylish PC with an Intel Core i7-12650H features a mini-tower design and three power modes
NiPoGi has given its AD08 an Intel Core i7-12650H which delivers enough performance to master everyday office tasks. As a compact gaming PC taking on a tower format, the manufacturer has gone a slightly different route when it comes to its design. In this review, you can read about what advantages arise as a result of this, and how well the NiPoGi AD08 performs compared to similarly equipped mini PCs.
Intel Core i7-12650H, UHD Graphics 64EUs, 878 gNipogi AD08 mini PC review: The stylish PC with an Intel Core i7-12650H features a mini-tower design and three power modes
NiPoGi has given its AD08 an Intel Core i7-12650H which delivers enough performance to master everyday office tasks. As a compact gaming PC taking on a tower format, the manufacturer has gone a slightly different route when it comes to its design. In this review, you can read about what advantages arise as a result of this, and how well the NiPoGi AD08 performs compared to similarly equipped mini PCs.
Intel Core i7-12650H, UHD Graphics 64EUs, 878 gGMK NucBox K3 Pro mini PC review: The NucBox K2 is better
The NucBox K3 Pro is the AMD alternative to the NucBox K2 each sporting the same chassis design but with different internals. The NucBox K3 Pro model name may sound newer and faster, but it's clearly inferior to the NucBox K2 when it comes to performance.
Intel Core i7-12650H, UHD Graphics 64EUs, 396 gMinisforum Neptune Series HN2673 review: The mini PC with a Core i7-12650H and an Arc A730M within an attractive case
Minisforum is one of the few manufacturers that has dared to house a current Intel graphics card as a dedicated graphics card within a mini PC. The Neptune Series HN2673 brings together the Intel Arc A730M and the Intel Core i7-12650H. In this review, we have summarized the most important aspects including a range of benchmarks and measurements.
Intel Core i7-12650H, A730M, 1.7 kgMinisforum Venus Series NAB6: Intel UHD Graphics 64EUs (Alder Lake 12th Gen), 0.6 kg
Review » Minisforum Venus Series NAB6 review: The sleek mini PC with a fast Intel Core i7-12650H and active SSD cooling!
MSI Cyborg 15 A12VF: NVIDIA GeForce RTX 4060 Laptop GPU, 15.60", 2 kg
Review » MSI Cyborg 15 A12VF review: Gaming laptop with low-power RTX 4060
MSI Katana 15 B12VEK: NVIDIA GeForce RTX 4050 Laptop GPU, 15.60", 2.3 kg
Review » MSI Katana 15 laptop review: Budget gamer with RTX 4050 and Alder Lake CPU
Asus TUF Dash F15 FX517ZC: NVIDIA GeForce RTX 3050 4GB Laptop GPU, 15.60", 1.9 kg
Review » Asus TUF Dash F15 FX517ZC laptop review: 1440p, 165 Hz, And Full P3 Colors For Under $1000
Asus TUF Dash F15 FX517ZR: NVIDIA GeForce RTX 3070 Laptop GPU, 15.60", 2 kg
Review » Asus TUF Dash F15 FX517ZR in review: Laptop with Mobile RTX 3070 and acceptable battery life
Acer Aspire 7 A715-76G, i7-12650H RTX 3050: NVIDIA GeForce RTX 3050 4GB Laptop GPU, 15.60", 2.1 kg
External Review » Acer Aspire 7 A715-76G, i7-12650H RTX 3050
Acer Aspire 5 A515-57, i7-12650H: Intel UHD Graphics 64EUs (Alder Lake 12th Gen), 15.60", 1.8 kg
External Review » Acer Aspire 5 A515-57, i7-12650H
HP Victus 15-fa1: NVIDIA GeForce RTX 4050 Laptop GPU, 15.60", 2.3 kg
External Review » HP Victus 15-fa1
Medion Erazer Deputy P60: NVIDIA GeForce RTX 4070 Laptop GPU, 15.60", 2.1 kg
External Review » Medion Erazer Deputy P60
MSI Thin 15 B12UC: NVIDIA GeForce RTX 3050 6GB Laptop GPU, 15.60", 1.9 kg
External Review » MSI Thin 15 B12UC
Acer Nitro 5 AN515-58, i7-12650H RTX 4050: NVIDIA GeForce RTX 4050 Laptop GPU, 15.60", 2.5 kg
External Review » Acer Nitro 5 AN515-58, i7-12650H RTX 4050
MSI GF63 Thin 12UCX: NVIDIA GeForce RTX 2050 Mobile, 15.60", 1.9 kg
External Review » MSI GF63 Thin 12UCX
Asus VivoBook 16X K3605ZF: NVIDIA GeForce RTX 2050 Mobile, 16.00", 1.8 kg
External Review » Asus VivoBook 16X K3605ZF
MSI Katana GF66 12UCK: NVIDIA GeForce RTX 3050 4GB Laptop GPU, 15.60", 2.3 kg
External Review » MSI Katana GF66 12UCK
Asus Vivobook Pro 15 K6501ZM: NVIDIA GeForce RTX 3060 Laptop GPU, 15.60", 2.1 kg
External Review » Asus Vivobook Pro 15 K6501ZM
Asus Vivobook 16X K3605ZC: NVIDIA GeForce RTX 3050 4GB Laptop GPU, 16.00", 1.8 kg
External Review » Asus Vivobook 16X K3605ZC
Asus Vivobook 16X K3605ZU: NVIDIA GeForce RTX 4050 Laptop GPU, 16.00", 1.8 kg
External Review » Asus Vivobook 16X K3605ZU
MSI Crosshair 15 C12VF: NVIDIA GeForce RTX 4060, 15.60", 2.3 kg
External Review » MSI Crosshair 15 C12VF
MSI Katana 15 B12VGK: NVIDIA GeForce RTX 4070 Laptop GPU, 15.60", 2.3 kg
External Review » MSI Katana 15 B12VGK
MSI Crosshair 15 C12VG: NVIDIA GeForce RTX 4070 Laptop GPU, 15.60", 2.3 kg
External Review » MSI Crosshair 15 C12VG
MSI Katana GF66 12UE: NVIDIA GeForce RTX 3060 Laptop GPU, 15.60", 2.3 kg
External Review » MSI Katana GF66 12UE
Asus VivoBook Pro 16 K6602ZC, i7-12650H: NVIDIA GeForce RTX 3050 4GB Laptop GPU, 16.00", 1.7 kg
External Review » Asus VivoBook Pro 16 K6602ZC, i7-12650H
MSI Katana 17 B12VFK: NVIDIA GeForce RTX 4060 Laptop GPU, 17.30", 2.6 kg
External Review » MSI Katana 17 B12VFK
MSI Cyborg 15 A12VE, i7-12650H: NVIDIA GeForce RTX 4050 Laptop GPU, 15.60", 2 kg
External Review » MSI Cyborg 15 A12VE, i7-12650H
MSI Cyborg 15 A12VF: NVIDIA GeForce RTX 4060 Laptop GPU, 15.60", 2 kg
External Review » MSI Cyborg 15 A12VF
MSI Cyborg 15 A12VE: NVIDIA GeForce RTX 4050 Laptop GPU, 15.60", 2 kg
External Review » MSI Cyborg 15 A12VE
Lenovo IdeaPad Gaming 3 16IAH7: NVIDIA GeForce RTX 3060 Laptop GPU, 16.00", 2.6 kg
External Review » Lenovo IdeaPad Gaming 3 16IAH7
MSI GF63 Thin 12VE-066US: NVIDIA GeForce RTX 4050 Laptop GPU, 15.60", 1.9 kg
External Review » MSI GF63 Thin 12VE-066US
MSI Sword 15 A12UE: NVIDIA GeForce RTX 3060 Laptop GPU, 15.60", 2.3 kg
External Review » MSI Sword 15 A12UE
MSI Katana GF66 12UD-436: NVIDIA GeForce RTX 3050 Ti Laptop GPU, 15.60", 2.3 kg
External Review » MSI Katana GF66 12UD-436
MSI Katana 15 B12VEK: NVIDIA GeForce RTX 4050 Laptop GPU, 15.60", 2.3 kg
External Review » MSI Katana 15 B12VEK
Asus Vivobook Pro 16X N7601ZM-MQ712WS: NVIDIA GeForce RTX 3060 Laptop GPU, 16.00", 2.3 kg
External Review » Asus Vivobook Pro 16X N7601ZM-MQ712WS
Asus TUF Gaming F15 FX507ZR, i7-12650H: NVIDIA GeForce RTX 3070 Laptop GPU, 15.60", 2.2 kg
External Review » Asus TUF Gaming F15 FX507ZR, i7-12650H
MSI Creator M16 A12UEV-468: NVIDIA GeForce RTX 3060 Laptop GPU, 16.00", 2.3 kg
External Review » MSI Creator M16 A12UEV-468
Asus TUF Dash F15 FX517ZR: NVIDIA GeForce RTX 3070 Laptop GPU, 15.60", 2 kg
External Review » Asus TUF Dash F15 FX517ZR
Acer Swift 3 SF314-71-79ZW: Intel UHD Graphics 64EUs (Alder Lake 12th Gen), 14.00", 1.4 kg
External Review » Acer Swift 3 SF314-71-79ZW
Lenovo IdeaPad Gaming 3 15IAH7, i7-12650H RTX 3050 Ti: NVIDIA GeForce RTX 3050 Ti Laptop GPU, 15.60", 2.3 kg
External Review » Lenovo IdeaPad Gaming 3 15IAH7, i7-12650H RTX 3050 Ti
Asus TUF Dash F15 FX517ZE: NVIDIA GeForce RTX 3050 Ti Laptop GPU, 15.60", 2 kg
External Review » Asus TUF Dash F15 FX517ZE
Asus TUF Dash 15 FX517ZM-AS73: NVIDIA GeForce RTX 3060 Laptop GPU, 15.60", 2 kg
External Review » Asus TUF Dash 15 FX517ZM-AS73
Xiaomi RedmiBook Pro 15 2022, i7 RTX 2050: NVIDIA GeForce RTX 2050 Mobile, 15.60", 1.8 kg
External Review » Xiaomi RedmiBook Pro 15 2022, i7 RTX 2050
Asus TUF Dash F15 FX517ZC: NVIDIA GeForce RTX 3050 4GB Laptop GPU, 15.60", 1.9 kg
External Review » Asus TUF Dash F15 FX517ZC
Asus ROG Zephyrus M16 GU603ZM, i7-12650H RTX 3060: NVIDIA GeForce RTX 3060 Laptop GPU, 16.10", 1.9 kg
External Review » Asus ROG Zephyrus M16 GU603ZM, i7-12650H RTX 3060
Asus TUF Dash F15 FX517ZR: NVIDIA GeForce RTX 3070 Laptop GPU, 15.60", 2 kg
» Asus TUF Dash F15 gaming laptop with RTX 3070 and Core i7 on sale for 33% off
MSI Cyborg 15 A12VF: NVIDIA GeForce RTX 4060 Laptop GPU, 15.60", 2 kg
» MSI Cyborg 15 A12VF: Gaming laptop with a low power consumption and long battery life
MSI Katana 15 B12VEK: NVIDIA GeForce RTX 4050 Laptop GPU, 15.60", 2.3 kg
» MSI Katana 15 with RTX 4050 reviewed: US$1499.99 for a budget gamer at the RTX 3060 level is too much
Xiaomi RedmiBook Pro 15 2022, i7 RTX 2050: NVIDIA GeForce RTX 2050 Mobile, 15.60", 1.8 kg
» Xiaomi refreshes the RedmiBook Pro 15 2022 with a more powerful CPU and price reduction
Asus TUF Dash F15 FX517ZC: NVIDIA GeForce RTX 3050 4GB Laptop GPU, 15.60", 1.9 kg
» One of the best Asus TUF Gaming F15 configurations with the 1440p 165 Hz display is too hard to find
Asus TUF Dash F15 FX517ZR: NVIDIA GeForce RTX 3070 Laptop GPU, 15.60", 2 kg
» Asus TUF Dash F15 FX517ZR: 2 kg gaming laptop with E-cores that can be switched off