
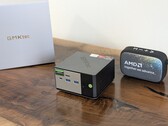
GMK NucBox K16 mini PC review: Older AMD Zen 3 CPU is good enough for most
GMKtec packs a budget Ryzen 7 7735HS CPU into its premium EVO‑X1-style chassis with an Oculink port aimed at pros.
AMD Ryzen 7 7735HS, Radeon 680M, 567 g
The AMD Ryzen 7 7735HS is a processor for (gaming) laptops based of the Rembrandt Refresh generation. The R7 7735HS integrates all eight cores based on the Zen 3+ microarchitecture. They are clocked at 3.2 (guaranteed base clock) to 4.75 GHz (Turbo) and support SMT / Hyperthreading (16 threads). The chip is manufactured in 6 nm at TSMC. The 7735HS is the refresh of the Ryzen 7 6800HS with 50 MHz higher boost speed and a potential higher TDP up to 54W.
The Zen 3+ is a refresh of the Zen 3 architecture and should not offer a lot of changes. The chip offers modern features, like support for USB 4 (40 Gbps), PCI-E Gen 4 and DDR5-4800MT/s or LPDDR5-6400MT/s.
Performance
The average 7735HS in our database is in the same league as the Ryzen 5 7645HX, Ryzen 9 6900HS, Ryzen 9 6900HX, Core i5-12500H, Core i5-13500H, as far as multi-thread benchmark scores are concerned.
Thanks to its decent cooling solution and a long-term CPU power limit of 75 W, the Acer Nitro 16 AN16-41 is among the fastest laptops built around the 7735HS that we know of. It can be about 20% faster in CPU-bound workloads than the slowest system featuring the same chip in our database, as of August 2023.
The integrated GPU Radeon 680M is still one of the fastest iGPUs (only bested by the new Radeon 780M). It is based on the RDNA2 architecture and offers 12 CUs at up to 2.2 GHz.
Power consumption
This Ryzen 7 CPU has a specified TDP of 35 W to 54 W.
| Codename | Rembrandt-HS Refresh |
| Series | AMD Rembrandt (Zen 3+) |
| Clock Rate | 3200 - 4750 MHz |
| Level 1 Cache | 512 KB |
| Level 2 Cache | 4 MB |
| Level 3 Cache | 16 MB |
| Number of Cores / Threads | 8 / 16 8 x 4.8 GHz AMD Zen 3+ |
| Power Consumption (TDP = Thermal Design Power) | 35 Watt |
| Manufacturing Technology | 6 nm |
| Die Size | 210 mm2 |
| Max. Temperature | 95 °C |
| Socket | FP7/FP7r2 |
| Features | DDR5-4800/LPDDR5-6400 RAM (incl. ECC), PCIe 4, MMX, SSE, SSE2, SSE3, SSSE3, SSE4A, SSE4.1, SSE4.2, AVX, AVX2, BMI2, ABM, FMA, ADX, SMEP, SMAP, SMT, CPB, AES-NI, RDRAND, RDSEED, SHA, SME |
| GPU | AMD Radeon 680M ( - 2200 MHz) |
| 64 Bit | 64 Bit support |
| Architecture | x86 |
| Announcement Date | 01/05/2023 |
| Product Link (external) | www.amd.com |


Minisforum Neptune Series HX77G: AMD Radeon RX 6600M, 1.6 kg
Review » Minisforum Neptune Series HX77G review: The mini gaming PC with an AMD Ryzen 7 7735HS, AMD Radeon RX 6600M and 2x USB4
GMK NucBox K2: AMD Radeon 680M, 0.4 kg
Review » GMK NucBox K2 Ryzen 7 7735HS mini PC review: Optimized for high performance-per-dollar
Acer Nitro 17 AN17-41-R9LN: NVIDIA GeForce RTX 4070 Laptop GPU, 17.30", 3 kg
Review » Acer Nitro 17 Ryzen edition review: The QHD gaming laptop with an RTX 4070
Acer Nitro 16 AN16-41: NVIDIA GeForce RTX 4070 Laptop GPU, 16.00", 2.7 kg
Review » Acer Nitro 16 AN16-41 review: An RTX 4070 gaming laptop with good battery life
Asus TUF A15 FA507: NVIDIA GeForce RTX 4050 Laptop GPU, 15.60", 2.2 kg
Review » Asus TUF Gaming A15 laptop review - A budget gamer with an RTX 4050 and a 144 Hz screen
Lenovo Yoga Pro 7 14ARP G8: AMD Radeon 680M, 14.50", 1.5 kg
Review » Lenovo Yoga Pro 7 14 review - The almost perfect ultrabook with AMD Zen 3+
Beelink SER6 Pro Ryzen 7 7735HS: AMD Radeon 680M, 0.5 kg
Review » Beelink SER6 Pro Ryzen 7 7735HS mini PC review: Now with integrated DisplayPort
Lenovo Slim Pro 7 14ARP8: NVIDIA GeForce RTX 3050 6GB Laptop GPU, 14.50", 1.6 kg
Review » New CPU name, old CPU performance: Lenovo Slim 7 Pro Ryzen 7 7735HS laptop review
Asus TUF Gaming A16 FA617: AMD Radeon RX 7600S, 16.00", 2.2 kg
Review » Asus TUF Gaming A16 Advantage Edition in review: AMD notebook under the auspices of the 7
Blackview GamiBook 8: AMD Radeon 680M, 16.00", 1.8 kg
External Review » Blackview GamiBook 8
MSI Thin A15 B7VF: NVIDIA GeForce RTX 4060 Laptop GPU, 15.60", 1.9 kg
External Review » MSI Thin A15 B7VF
Lenovo IdeaPad Slim 5 15ARP10: AMD Radeon 680M, 15.10", 1.5 kg
External Review » Lenovo IdeaPad Slim 5 15ARP10
Acer Nitro V15 ANV15-41, R7 7735HS: NVIDIA GeForce RTX 4050 Laptop GPU, 15.60", 2.1 kg
External Review » Acer Nitro V15 ANV15-41, R7 7735HS
Lenovo Thinkpad E16 G2: AMD Radeon 680M, 16.00", 1.8 kg
External Review » Lenovo Thinkpad E16 G2
Acer Nitro V15 ANV15-41: NVIDIA GeForce RTX 4060 Laptop GPU, 15.60", 2.1 kg
External Review » Acer Nitro V15 ANV15-41
Acer Nitro 17 AN17-41-R38P: NVIDIA GeForce RTX 4060 Laptop GPU, 17.30", 3.1 kg
External Review » Acer Nitro 17 AN17-41-R38P
Acer Nitro 16 AN16-41, R7 7735HS RTX 4060: NVIDIA GeForce RTX 4060 Laptop GPU, 16.00", 2.7 kg
External Review » Acer Nitro 16 AN16-41, R7 7735HS RTX 4060
Asus ROG Zephyrus G14 GA402NU: NVIDIA GeForce RTX 4050 Laptop GPU, 14.00", 1.7 kg
External Review » Asus ROG Zephyrus G14 GA402NU
MSI Bravo 15 C7VF: NVIDIA GeForce RTX 4060 Laptop GPU, 15.60", 2.3 kg
External Review » MSI Bravo 15 C7VF
Lenovo IdeaPad 5 Pro 16ARP8: AMD Radeon 680M, 16.00", 1.9 kg
External Review » Lenovo IdeaPad 5 Pro 16ARP8
Lenovo Yoga Pro 7 14ARP G8: AMD Radeon 680M, 14.50", 1.5 kg
External Review » Lenovo Yoga Pro 7 14ARP G8
Acer Nitro 16 AN16-41: NVIDIA GeForce RTX 4070 Laptop GPU, 16.00", 2.7 kg
External Review » Acer Nitro 16 AN16-41
Acer Nitro 16 AN16-41-R8UR: NVIDIA GeForce RTX 4070 Laptop GPU, 16.00", 2.7 kg
External Review » Acer Nitro 16 AN16-41-R8UR
MSI Bravo 15 C7UDX: NVIDIA GeForce RTX 3050 6GB Laptop GPU, 15.60", 2.3 kg
External Review » MSI Bravo 15 C7UDX
Asus TUF Gaming A15 FA507NV: NVIDIA GeForce RTX 4060 Laptop GPU, 15.60", 2.2 kg
External Review » Asus TUF Gaming A15 FA507NV
MSI Bravo 15 C7V: NVIDIA GeForce RTX 4050 Laptop GPU, 15.60", 2.3 kg
External Review » MSI Bravo 15 C7V
Acer Nitro 17 AN17-41-R9LN: NVIDIA GeForce RTX 4070 Laptop GPU, 17.30", 3 kg
External Review » Acer Nitro 17 AN17-41-R9LN
Asus TUF Gaming A15 FA507NU: NVIDIA GeForce RTX 4050 Laptop GPU, 15.60", 2.2 kg
External Review » Asus TUF Gaming A15 FA507NU
Lenovo Slim Pro 7 14ARP8: NVIDIA GeForce RTX 3050 6GB Laptop GPU, 14.50", 1.6 kg
External Review » Lenovo Slim Pro 7 14ARP8
Asus TUF Gaming A17 FA707NU-HX032W: NVIDIA GeForce RTX 4050 Laptop GPU, 17.30", 2.6 kg
External Review » Asus TUF Gaming A17 FA707NU-HX032W
Asus TUF Gaming A16 FA617: AMD Radeon RX 7600S, 16.00", 2.2 kg
External Review » Asus TUF Gaming A16 FA617
Acer Nitro 5 AN515-47-R79X: NVIDIA GeForce RTX 3050 4GB Laptop GPU, 15.60", 2.5 kg
External Review » Acer Nitro 5 AN515-47-R79X
GMK NucBox K16: AMD Radeon 680M, 0.6 kg
» Three-year old Ryzen 7 7735HS still holds up well against the new Ryzen AI 7 445
Lenovo ThinkPad E14 Gen 6 21M3002KGE: AMD Radeon 680M, 14.00", 1.6 kg
» Enough with the cheap screens, Lenovo: Low-end screen of ThinkPad E14 Gen 6 should not be a thing anymore
Asus TUF Gaming Advantage A16: AMD Radeon RX 7600S, 0.00"
» Asus Tuf A16 gaming laptop with insane battery life and more GPU power than RTX 4060 is now $380 less than list price
Acer Nitro 17 AN17-41-R9LN: NVIDIA GeForce RTX 4070 Laptop GPU, 17.30", 3 kg
» RTX 4060-equipped Acer Nitro 17 gaming laptop in "certified-refurbished" condition is on sale for less than $750
Asus TUF Gaming A16 FA617: AMD Radeon RX 7600S, 16.00", 2.2 kg
» All-AMD Asus TUF Gaming A16 gaming laptop discounted by over 31% at Best Buy
Lenovo Slim Pro 7 14ARP8: NVIDIA GeForce RTX 3050 6GB Laptop GPU, 14.50", 1.6 kg
» GeForce RTX 3050 vs. GTX 1660 Ti: Two GPUs for two different purposes
Lenovo Yoga Pro 7 14ARP G8: AMD Radeon 680M, 14.50", 1.5 kg
» Lenovo's new Yoga Pro 7 14 AMD offers an almost unbeatable value for money
» Mobile CPU Comparison
Comparison of all mobile CPU series
» Mobile Processors - Benchmarklist
Benchmarklist of all known CPUs that are used in laptops (desktop and laptop CPUs)