Acer Nitro 17 Ryzen edition review: The QHD gaming laptop with an RTX 4070
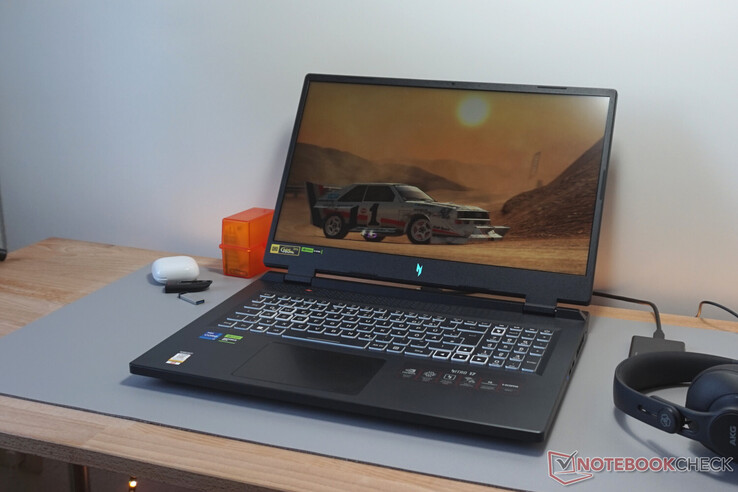
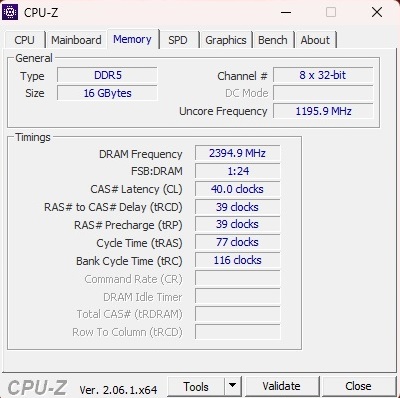
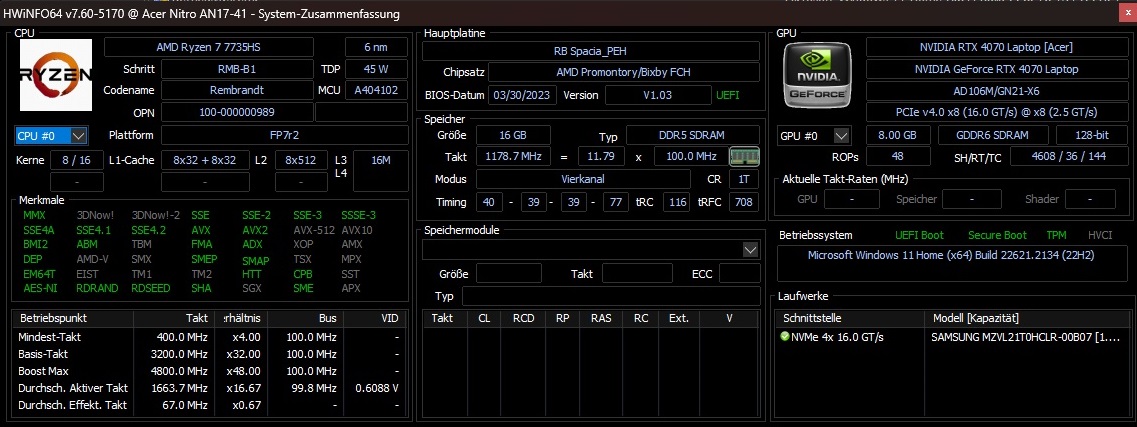
After previously testing a model with the Core i7-13700H and GeForce RTX 4060, now we are taking a look at the laptop's similarly priced brother, the AN17-41-R9LN with an AMD processor and a slightly more powerful GeForce RTX 4070 (also 8 GB GDDR6 VRAM). Similar to the Intel version, a 16:9 QHD panel with a refresh rate of 165 Hz and a resolution of 2,560 x 1,440 pixels is used as a screen. In addition, there are 2x 8 GB DDR5-4800 RAM and a 1 TB NVMe SSD installed. There are also no surprises in its operating system with the laptop having Windows 11 Home installed.
Competitors to the Nitro 17 include other 17-inch gaming laptops with an RTX 4070, such as the MSI Pulse 17 B13VGK, the Schenker XMG Focus 17 (E23) or the Asus ROG Strix G17 G713PI - all of which can be found in the tables as comparison devices.
Possible competitors compared
Rating | Date | Model | Weight | Height | Size | Resolution | Price |
|---|---|---|---|---|---|---|---|
| 86.9 % v7 (old) | 09 / 2023 | Acer Nitro 17 AN17-41-R9LN R7 7735HS, GeForce RTX 4070 Laptop GPU | 3 kg | 29 mm | 17.30" | 2560x1440 | |
| 87.2 % v7 (old) | 07 / 2023 | Acer Nitro 17 AN17-51-71ER i7-13700H, GeForce RTX 4060 Laptop GPU | 3 kg | 30.3 mm | 17.30" | 2560x1440 | |
| 86.3 % v7 (old) | 07 / 2023 | MSI Pulse 17 B13VGK i7-13700H, GeForce RTX 4070 Laptop GPU | 2.7 kg | 27.2 mm | 17.30" | 1920x1080 | |
| 85.9 % v7 (old) | 06 / 2023 | Schenker XMG Focus 17 (E23) i9-13900HX, GeForce RTX 4070 Laptop GPU | 2.9 kg | 29.3 mm | 17.30" | 2560x1440 | |
| 88.4 % v7 (old) | 04 / 2023 | Asus ROG Strix G17 G713PI R9 7945HX, GeForce RTX 4070 Laptop GPU | 2.8 kg | 30.7 mm | 17.30" | 2560x1440 |
Since the device's case is identical to its Intel counterpart apart from its connectivity options (the AMD variant doesn't have a Thunderbolt 4 port and instead has 2x USB 4), we will not go further into its case, features and input devices in this article. You can find the corresponding information in the review of the AN17-51-71ER.


SD card reader
| SD Card Reader | |
| average JPG Copy Test (av. of 3 runs) | |
| Average of class Gaming (20.9 - 210, n=54, last 2 years) | |
| Schenker XMG Focus 17 (E23) | |
| Acer Nitro 17 AN17-41-R9LN (AV PRO microSD 128 GB V60) | |
| Acer Nitro 17 AN17-51-71ER | |
| maximum AS SSD Seq Read Test (1GB) | |
| Average of class Gaming (25.5 - 261, n=51, last 2 years) | |
| Schenker XMG Focus 17 (E23) | |
| Acer Nitro 17 AN17-41-R9LN (AV PRO microSD 128 GB V60) | |
| Acer Nitro 17 AN17-51-71ER | |
Communication
Webcam


Display
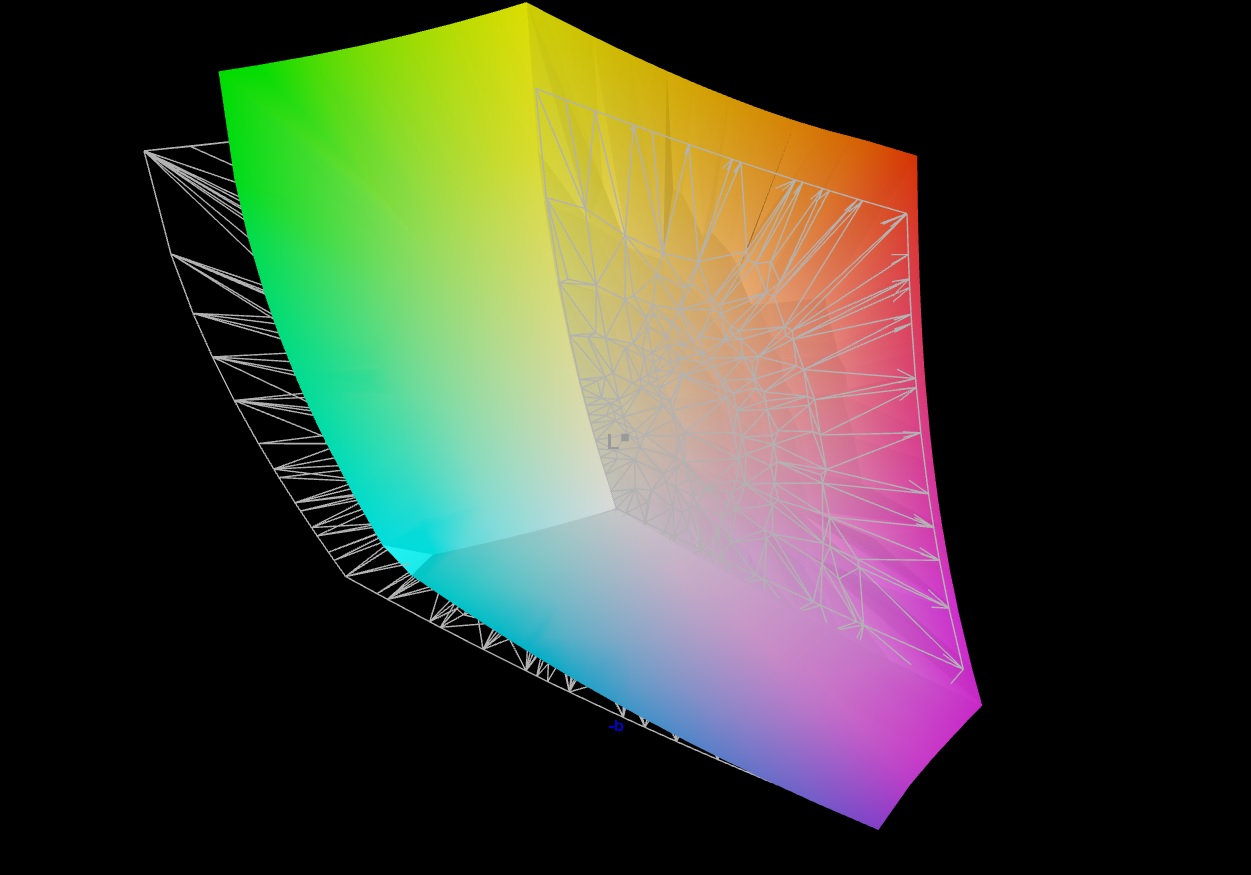
The AMD model features the same QHD display as the Intel version, which we welcome as a result of its good measurement results and picture values.
| |||||||||||||||||||||||||
Brightness Distribution: 88 %
Center on Battery: 350 cd/m²
Contrast: 1000:1 (Black: 0.35 cd/m²)
ΔE ColorChecker Calman: 2.03 | ∀{0.5-29.43 Ø4.71}
calibrated: 0.56
ΔE Greyscale Calman: 2.4 | ∀{0.09-98 Ø4.96}
86% AdobeRGB 1998 (Argyll 3D)
100% sRGB (Argyll 3D)
98% Display P3 (Argyll 3D)
Gamma: 2.071
CCT: 6961 K
| Acer Nitro 17 AN17-41-R9LN NE173QHM-NY6 (BOE0B7C), IPS, 2560x1440, 17.3" | Acer Nitro 17 AN17-51-71ER BOE0B7C NE173QHM-NY6, , 2560x1440, 17.3" | MSI Pulse 17 B13VGK AU Optronics B173HAN04.9, IPS, 1920x1080, 17.3" | Schenker XMG Focus 17 (E23) BOE09F9 NE173QHM-NZ1, IPS, 2560x1440, 17.3" | Asus ROG Strix G17 G713PI BOE0B69, IPS, 2560x1440, 17.3" | |
|---|---|---|---|---|---|
| Display | 0% | -53% | -1% | 0% | |
| Display P3 Coverage (%) | 98 | 98.3 0% | 38.4 -61% | 96.6 -1% | 98.3 0% |
| sRGB Coverage (%) | 100 | 100 0% | 57.5 -43% | 99.9 0% | 100 0% |
| AdobeRGB 1998 Coverage (%) | 86 | 85.7 0% | 39.7 -54% | 84.5 -2% | 85.9 0% |
| Response Times | 2% | -146% | -21% | 32% | |
| Response Time Grey 50% / Grey 80% * (ms) | 14.3 ? | 14.8 ? -3% | 31.2 ? -118% | 16.4 ? -15% | 5.3 ? 63% |
| Response Time Black / White * (ms) | 8.6 ? | 8 ? 7% | 23.6 ? -174% | 10.8 ? -26% | 8.6 ? -0% |
| PWM Frequency (Hz) | |||||
| Screen | -86% | -112% | -7% | 11% | |
| Brightness middle (cd/m²) | 350 | 361 3% | 254 -27% | 349 0% | 327 -7% |
| Brightness (cd/m²) | 337 | 326 -3% | 250 -26% | 318 -6% | 320 -5% |
| Brightness Distribution (%) | 88 | 87 -1% | 91 3% | 82 -7% | 89 1% |
| Black Level * (cd/m²) | 0.35 | 0.6 -71% | 0.14 60% | 0.56 -60% | 0.38 -9% |
| Contrast (:1) | 1000 | 602 -40% | 1814 81% | 623 -38% | 861 -14% |
| Colorchecker dE 2000 * | 2.03 | 3.83 -89% | 4.52 -123% | 1.08 47% | 1.01 50% |
| Colorchecker dE 2000 max. * | 5.02 | 5.71 -14% | 21.22 -323% | 3.05 39% | 4.01 20% |
| Colorchecker dE 2000 calibrated * | 0.56 | 3.48 -521% | 4.52 -707% | 1.08 -93% | 0.41 27% |
| Greyscale dE 2000 * | 2.4 | 3.29 -37% | 1 58% | 1.14 52% | 1.6 33% |
| Gamma | 2.071 106% | 2.29 96% | 2.44 90% | 2.41 91% | 2.168 101% |
| CCT | 6961 93% | 6679 97% | 6502 100% | 6687 97% | 6659 98% |
| Total Average (Program / Settings) | -28% /
-55% | -104% /
-104% | -10% /
-8% | 14% /
11% |
* ... smaller is better
Its IPS panel might not be the brightest at 337 cd/m² on average, but as long as you stay indoors, its brightness levels are fine. Its reaction times, black value (0.35 cd/m²) and contrast (1.000:1) also prove to be no reason for the laptop to hide from its competitors - although, there is still a little room for improvement.
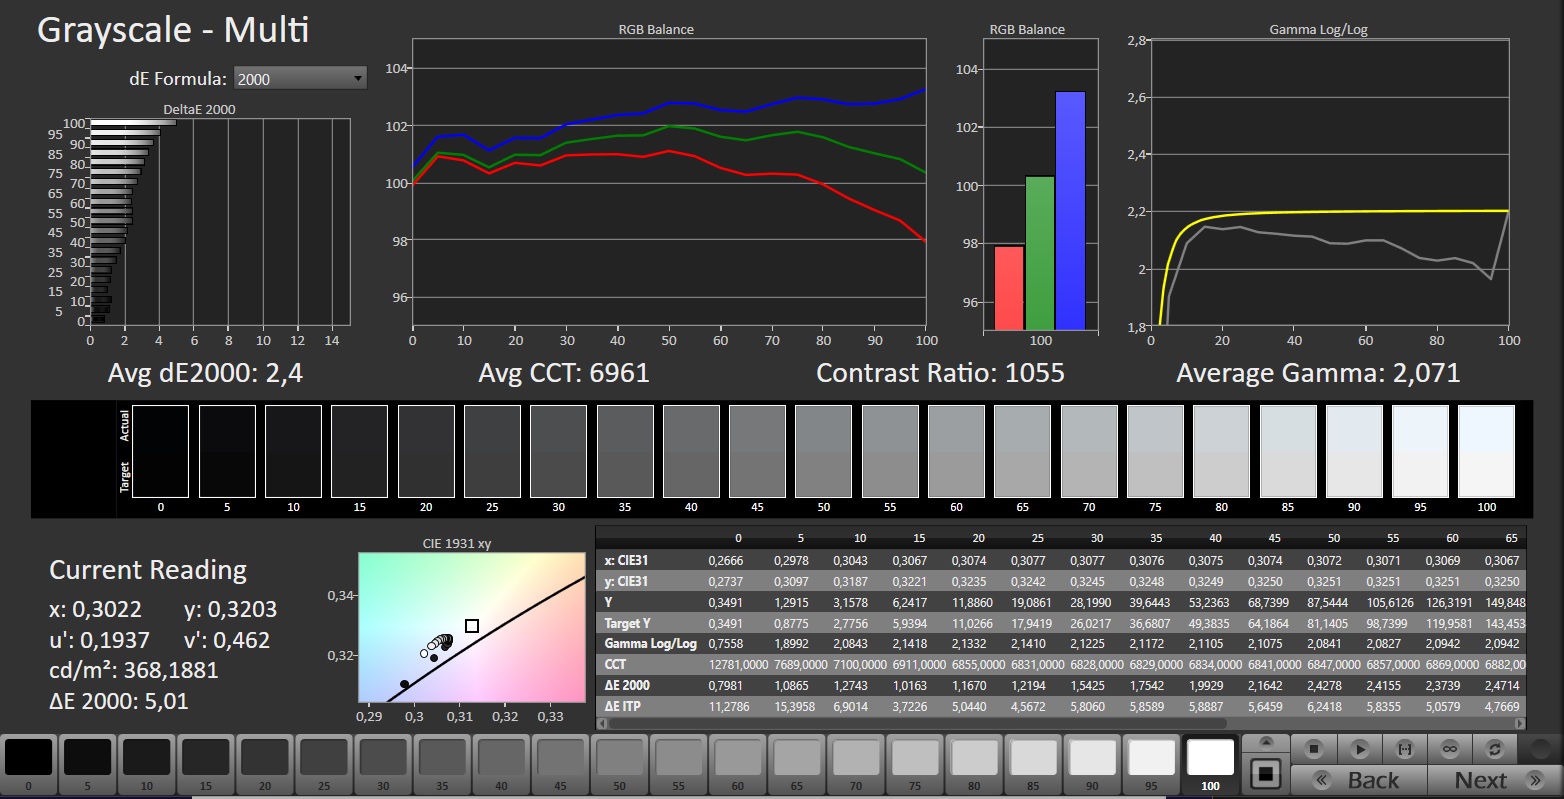
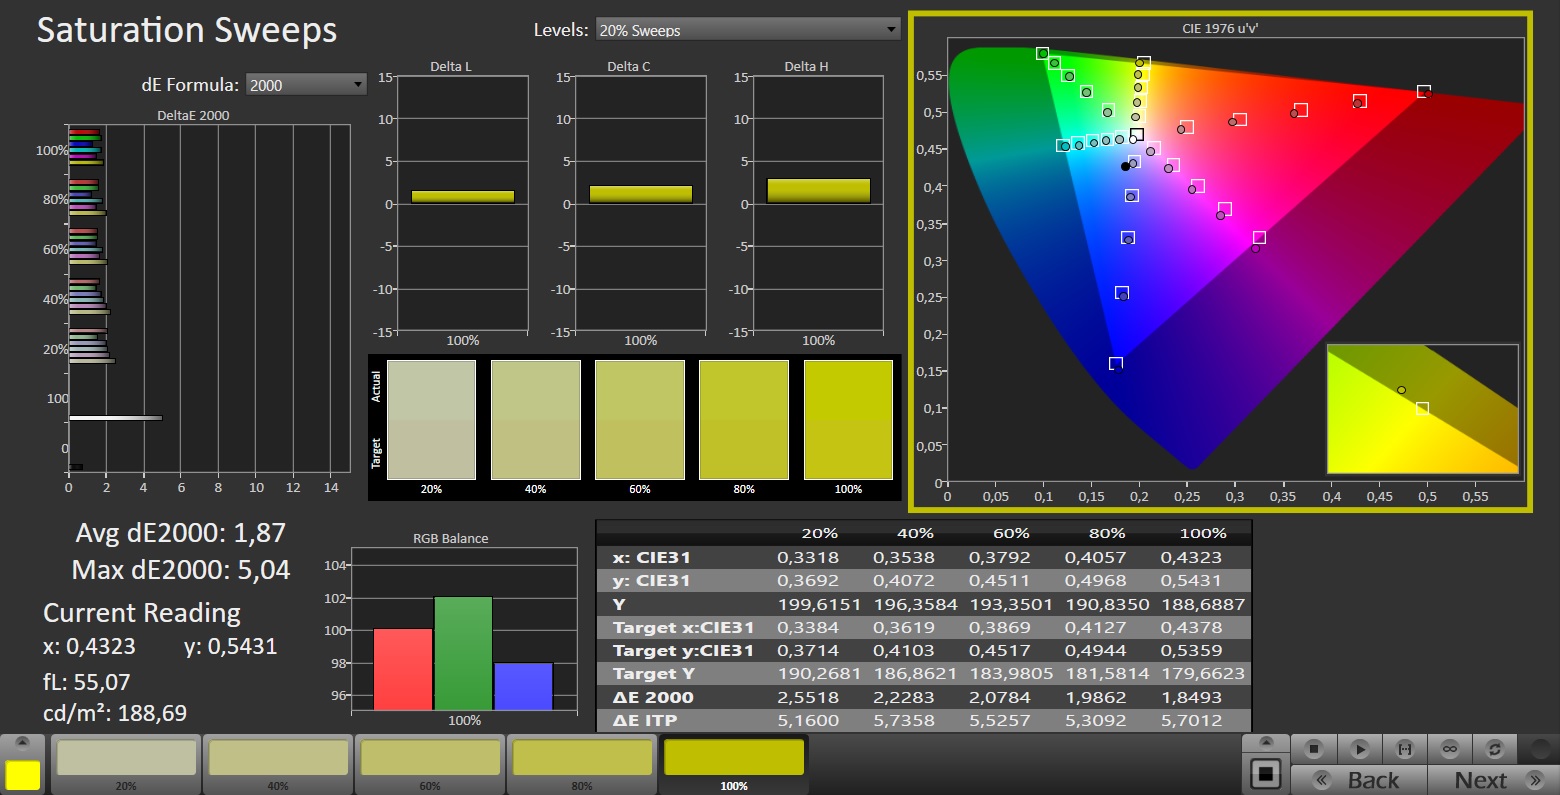
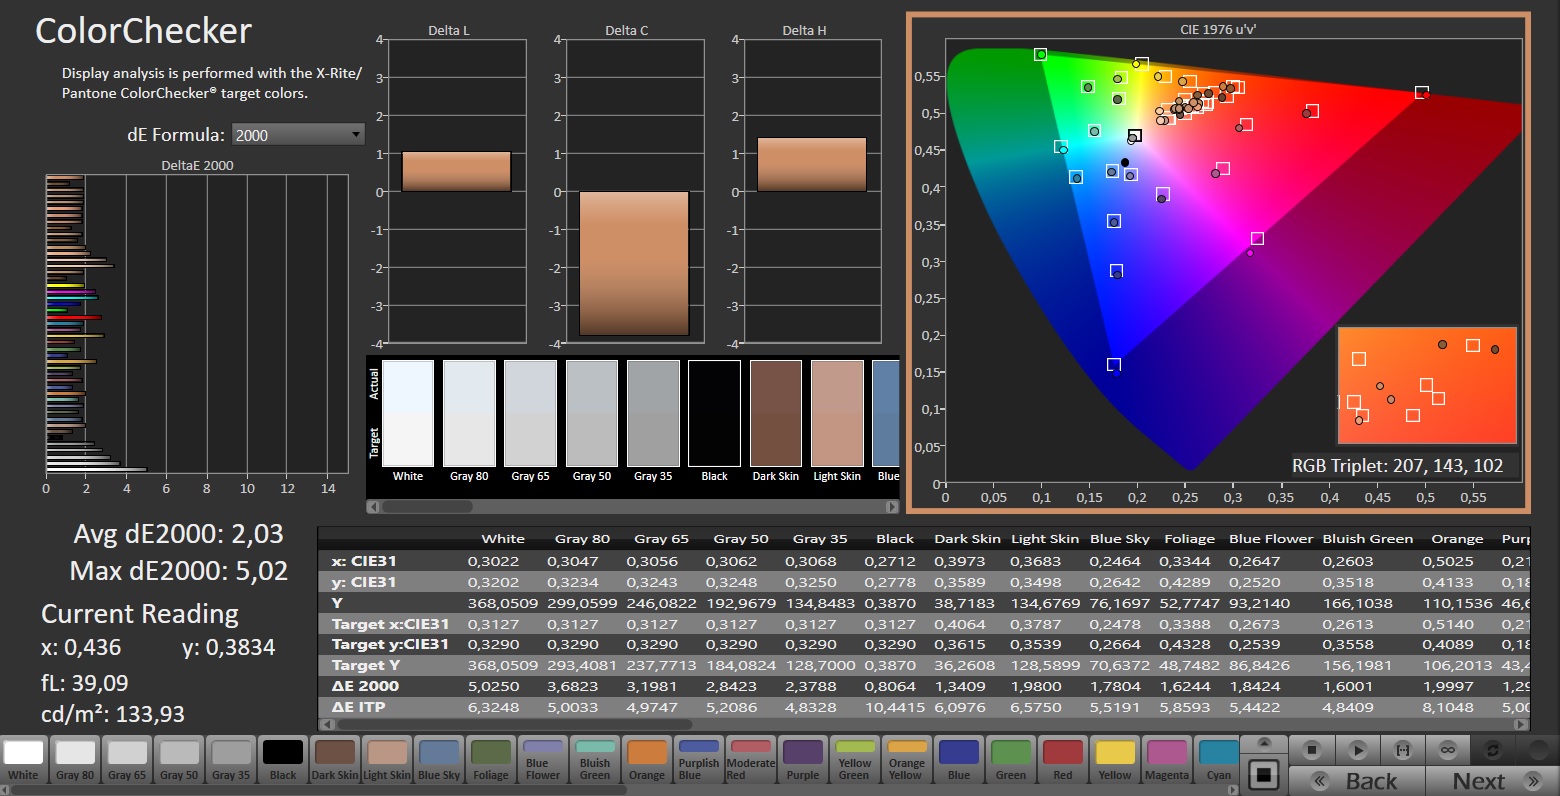
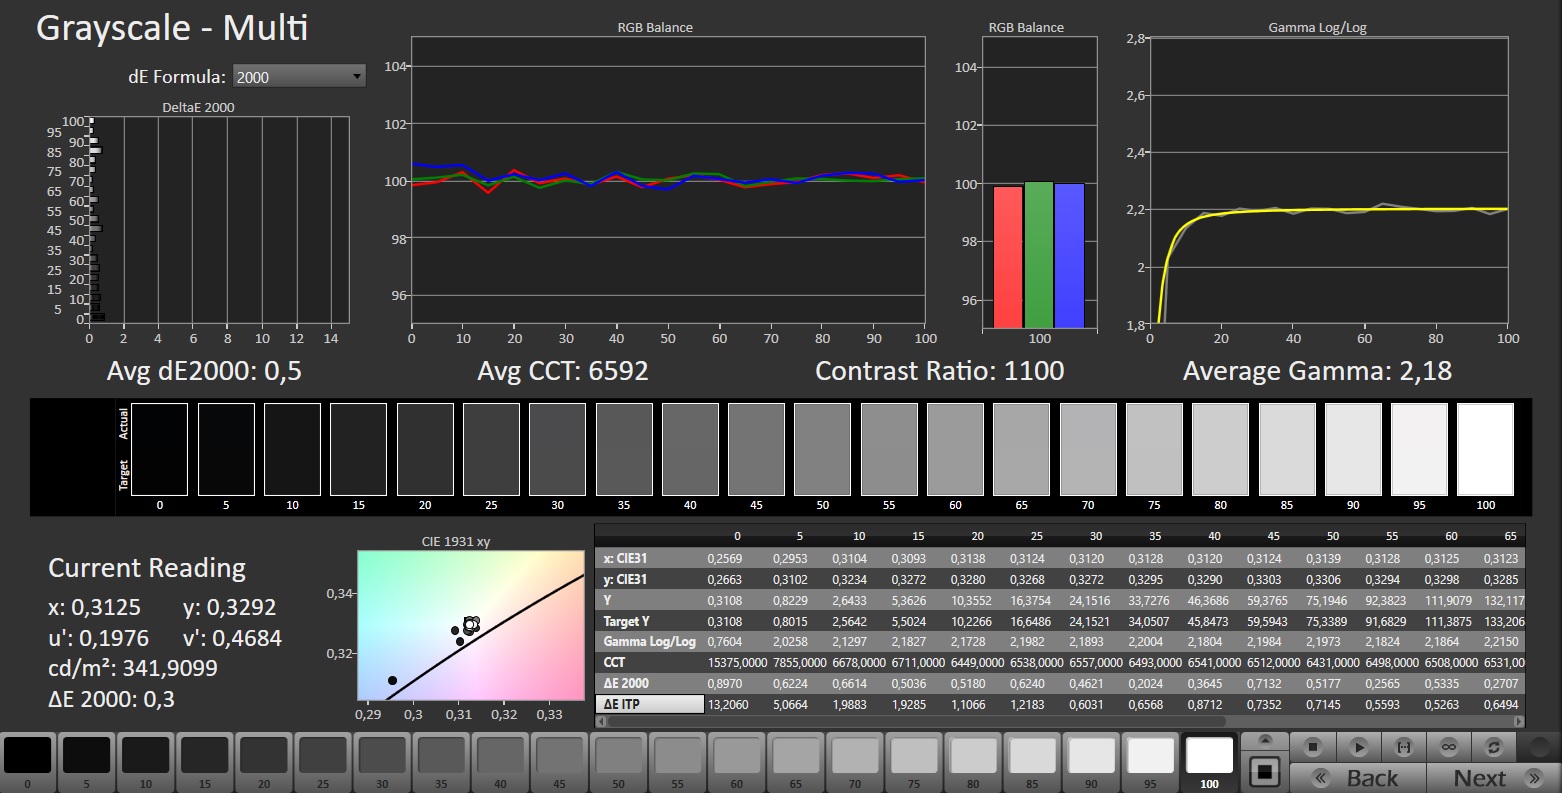
For a gaming laptop, its color spaces (100 % sRGB, 98 % P3 and 86 % AdobeRGB) are unusually good. Its color accuracy is good, too and doesn't require much calibration.

The laptop's viewing angles are typical for an IPS panel, so quite good. Unfortunately, our test device had a bit of a problem with screen bleeding along the edges of the display.
Display Response Times
| ↔ Response Time Black to White | ||
|---|---|---|
| 8.6 ms ... rise ↗ and fall ↘ combined | ↗ 3.8 ms rise | 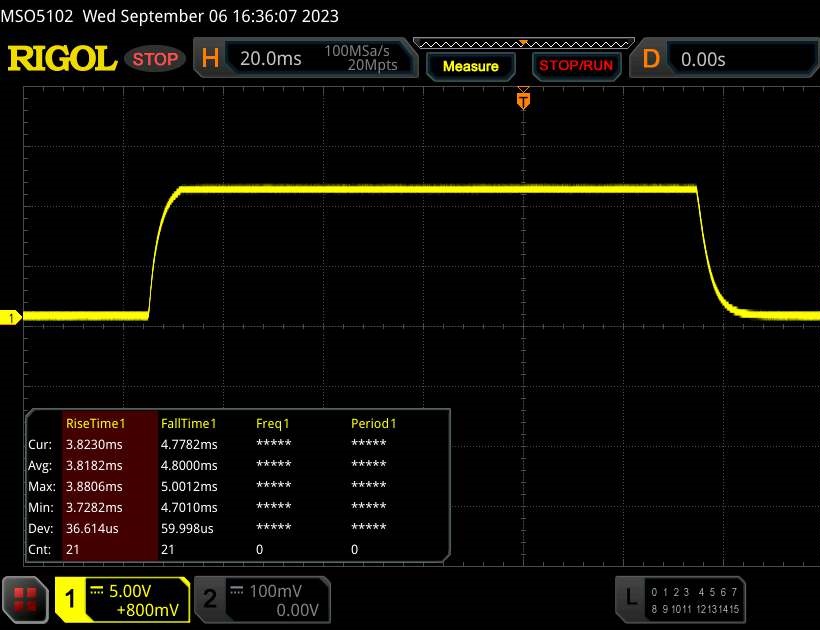 |
| ↘ 4.8 ms fall | ||
| The screen shows fast response rates in our tests and should be suited for gaming. In comparison, all tested devices range from 0.1 (minimum) to 240 (maximum) ms. » 24 % of all devices are better. This means that the measured response time is better than the average of all tested devices (19.8 ms). | ||
| ↔ Response Time 50% Grey to 80% Grey | ||
| 14.3 ms ... rise ↗ and fall ↘ combined | ↗ 7.1 ms rise | 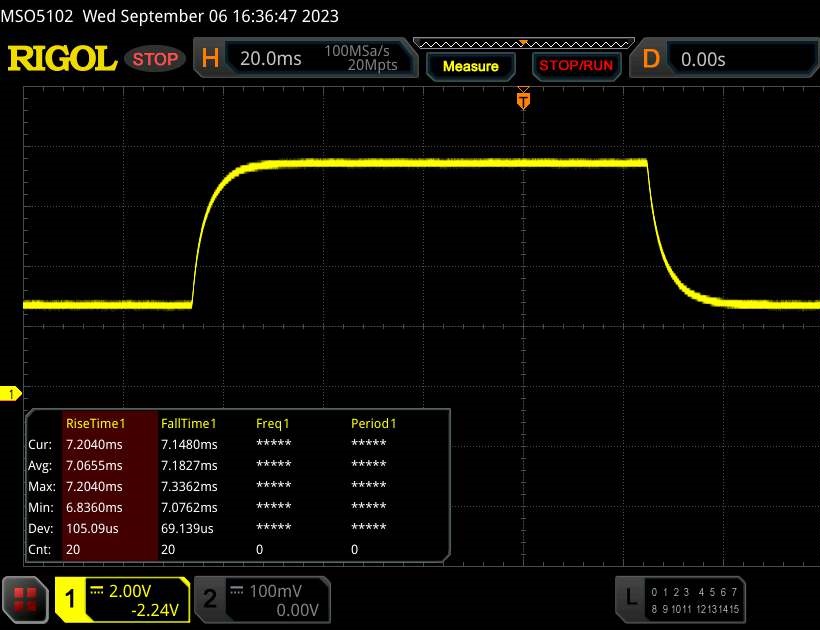 |
| ↘ 7.2 ms fall | ||
| The screen shows good response rates in our tests, but may be too slow for competitive gamers. In comparison, all tested devices range from 0.165 (minimum) to 636 (maximum) ms. » 28 % of all devices are better. This means that the measured response time is better than the average of all tested devices (31 ms). | ||
Screen Flickering / PWM (Pulse-Width Modulation)
| Screen flickering / PWM not detected | 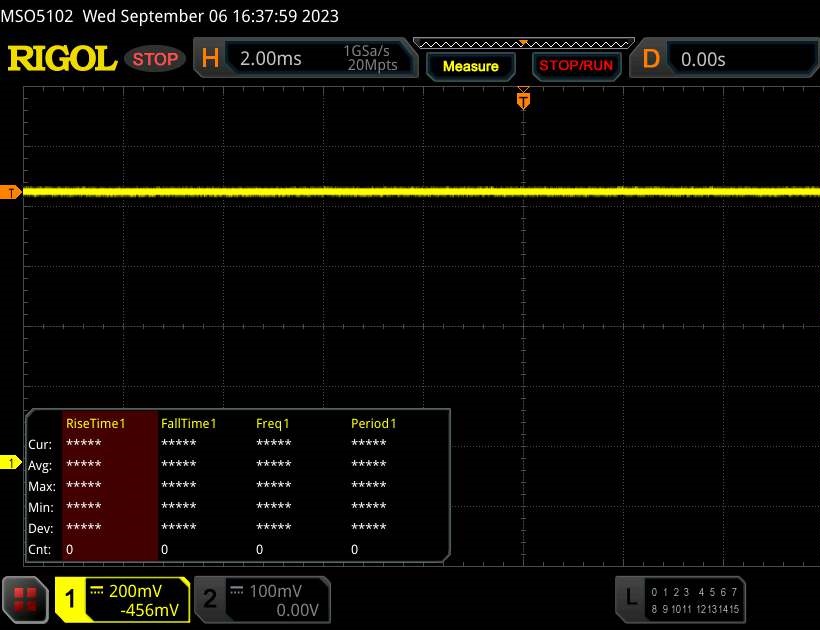 | ||
In comparison: 52 % of all tested devices do not use PWM to dim the display. If PWM was detected, an average of 7754 (minimum: 5 - maximum: 343500) Hz was measured. | |||
Performance
Although the Ryzen 7 7735HS has to make do with the older Zen 3+ architecture (some 7000 models already rely on Zen 4), we would still count the Nitro 17 AN17-41-R9LN to the upper mid-range field. Its 16 GB RAM and 1 TB SSD are no longer a highlight in the year 2023, but they are still adequate.

Testing conditions
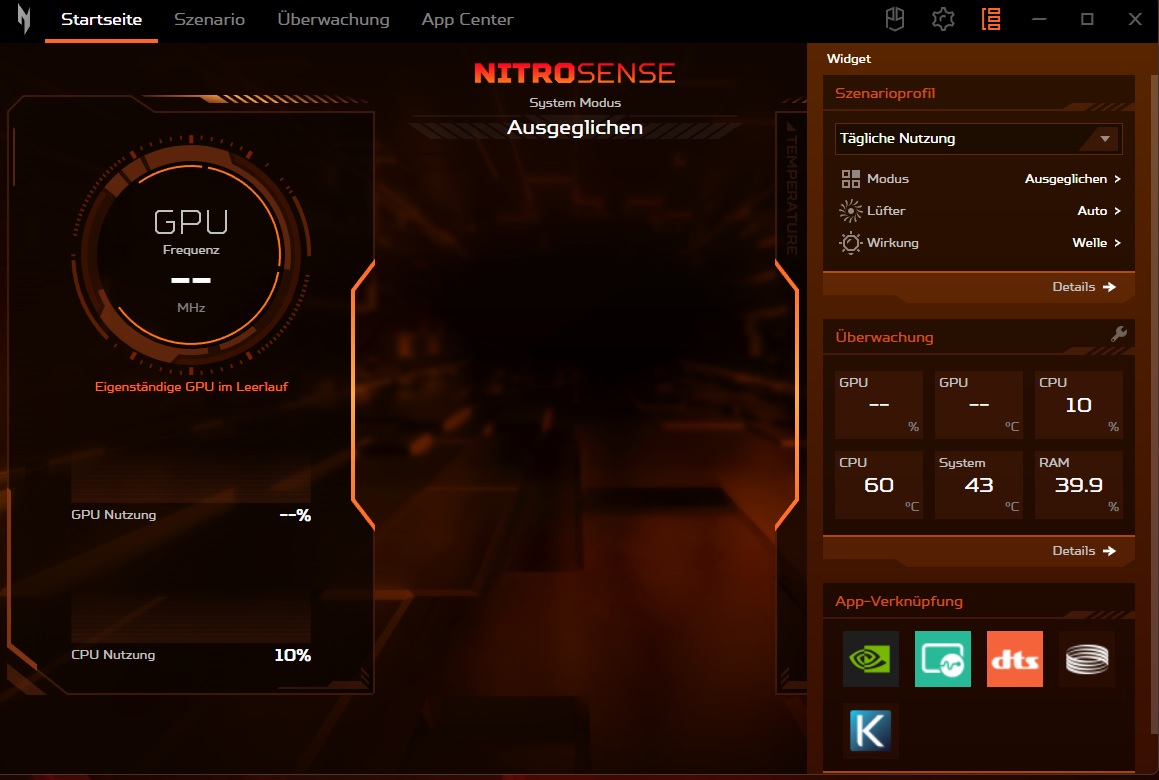
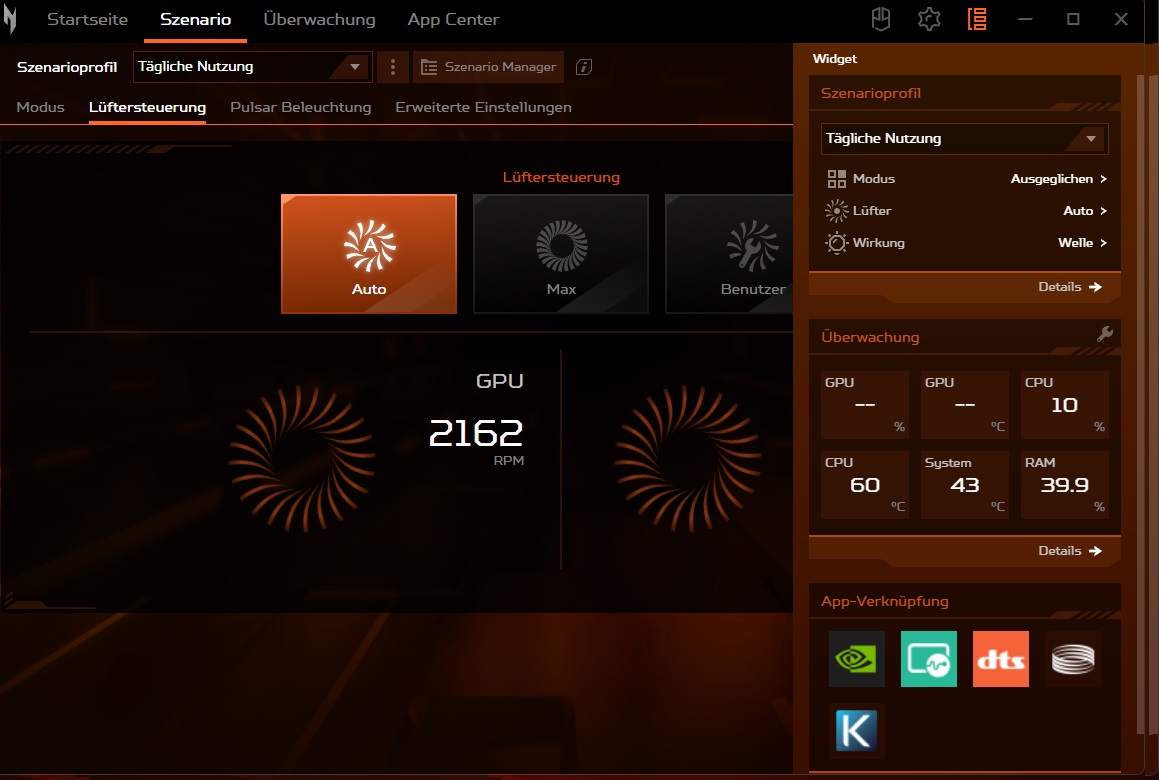
Acer has pre-installed a tool called Nitro Sense, which can be used to make numerous changes to the system (e.g. the keyboard illumination). The different performance modes are especially important for everyday use. Since no real frame rate increase could be determined from 3D applications onwards but the noise emissions increased significantly, we performed all measurements in the Balanced mode - which represents the sweet spot, so to speak. The fan control was always in automatic mode.


| Witcher 3 (FHD/Ultra) | Quiet | Balanced | Performance | Turbo |
|---|---|---|---|---|
| Performance | 60 - 100 fps | ~110 fps | ~111 fps | ~112 fps |
| Noise | ~38 dB(A) | ~44 dB(A) | ~54 dB(A) | ~61 dB(A) |
Processor
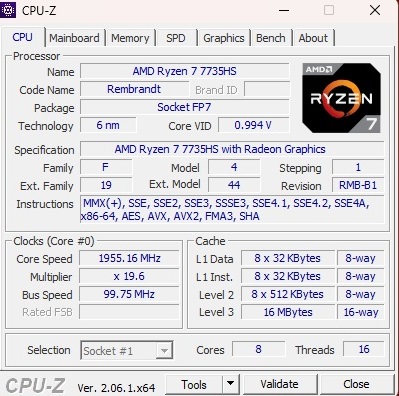
The Ryzen 7 7735HS is an octa-core processor which has 16 MB of L3 cache and can process up to 16 threads at once thanks to SMT. AMD has indicated the 6 nm model as having a clock rate of 3.2 to 4.75 GHz under load, which is neither little nor a lot. One of its biggest advantages is its comparatively powerful iGPU. During undemanding tasks (the device supports Advanced Optimus), only the Radeon 680M built into the processor is active - which can compete with older entry-level and partly also mid-range GPUs.
The Ryzen 7 7735HS did well but not exceedingly during the benchmarks. Its performance was (as expected) slightly worse than its (more expensive) Intel competitor, the Core i7-13700H, which features 14 cores and can process 20 threads simultaneously. Compared to a Core i9-13900HX or a Ryzen 9 7945HX with Zen 4 architecture, the 7735HS didn't stand a chance and did quite a bit worse. Even so, the CPU performance remained very consistent according to our Cinebench loop - this can't be said for all other laptops.
Cinebench R15 Multi continuous test
* ... smaller is better
AIDA64: FP32 Ray-Trace | FPU Julia | CPU SHA3 | CPU Queen | FPU SinJulia | FPU Mandel | CPU AES | CPU ZLib | FP64 Ray-Trace | CPU PhotoWorxx
| Performance rating | |
| Asus ROG Strix G17 G713PI | |
| Average of class Gaming | |
| Schenker XMG Focus 17 (E23) | |
| Acer Nitro 17 AN17-51-71ER | |
| MSI Pulse 17 B13VGK | |
| Acer Nitro 17 AN17-41-R9LN | |
| Average AMD Ryzen 7 7735HS | |
| AIDA64 / FP32 Ray-Trace | |
| Asus ROG Strix G17 G713PI | |
| Average of class Gaming (10227 - 85542, n=105, last 2 years) | |
| Schenker XMG Focus 17 (E23) | |
| MSI Pulse 17 B13VGK | |
| Acer Nitro 17 AN17-51-71ER | |
| Acer Nitro 17 AN17-41-R9LN | |
| Average AMD Ryzen 7 7735HS (11831 - 17161, n=16) | |
| AIDA64 / FPU Julia | |
| Asus ROG Strix G17 G713PI | |
| Average of class Gaming (51376 - 238426, n=105, last 2 years) | |
| Schenker XMG Focus 17 (E23) | |
| Acer Nitro 17 AN17-41-R9LN | |
| Average AMD Ryzen 7 7735HS (75370 - 105483, n=16) | |
| MSI Pulse 17 B13VGK | |
| Acer Nitro 17 AN17-51-71ER | |
| AIDA64 / CPU SHA3 | |
| Asus ROG Strix G17 G713PI | |
| Average of class Gaming (2180 - 10115, n=105, last 2 years) | |
| Schenker XMG Focus 17 (E23) | |
| Acer Nitro 17 AN17-51-71ER | |
| MSI Pulse 17 B13VGK | |
| Acer Nitro 17 AN17-41-R9LN | |
| Average AMD Ryzen 7 7735HS (2499 - 3494, n=16) | |
| AIDA64 / CPU Queen | |
| Asus ROG Strix G17 G713PI | |
| Schenker XMG Focus 17 (E23) | |
| Average of class Gaming (49785 - 173351, n=90, last 2 years) | |
| Acer Nitro 17 AN17-41-R9LN | |
| Acer Nitro 17 AN17-51-71ER | |
| Average AMD Ryzen 7 7735HS (87486 - 108729, n=15) | |
| MSI Pulse 17 B13VGK | |
| AIDA64 / FPU SinJulia | |
| Asus ROG Strix G17 G713PI | |
| Average of class Gaming (4424 - 33636, n=105, last 2 years) | |
| Schenker XMG Focus 17 (E23) | |
| Acer Nitro 17 AN17-41-R9LN | |
| Average AMD Ryzen 7 7735HS (11233 - 13097, n=16) | |
| MSI Pulse 17 B13VGK | |
| Acer Nitro 17 AN17-51-71ER | |
| AIDA64 / FPU Mandel | |
| Asus ROG Strix G17 G713PI | |
| Average of class Gaming (25115 - 128721, n=105, last 2 years) | |
| Acer Nitro 17 AN17-41-R9LN | |
| Schenker XMG Focus 17 (E23) | |
| Average AMD Ryzen 7 7735HS (41400 - 58232, n=16) | |
| MSI Pulse 17 B13VGK | |
| Acer Nitro 17 AN17-51-71ER | |
| AIDA64 / CPU AES | |
| Asus ROG Strix G17 G713PI | |
| Acer Nitro 17 AN17-51-71ER | |
| Average of class Gaming (39258 - 247074, n=105, last 2 years) | |
| Schenker XMG Focus 17 (E23) | |
| MSI Pulse 17 B13VGK | |
| Average AMD Ryzen 7 7735HS (44013 - 137629, n=16) | |
| Acer Nitro 17 AN17-41-R9LN | |
| AIDA64 / CPU ZLib | |
| Asus ROG Strix G17 G713PI | |
| Schenker XMG Focus 17 (E23) | |
| Average of class Gaming (574 - 2531, n=105, last 2 years) | |
| Acer Nitro 17 AN17-51-71ER | |
| MSI Pulse 17 B13VGK | |
| Acer Nitro 17 AN17-41-R9LN | |
| Average AMD Ryzen 7 7735HS (651 - 906, n=16) | |
| AIDA64 / FP64 Ray-Trace | |
| Asus ROG Strix G17 G713PI | |
| Average of class Gaming (5509 - 45446, n=105, last 2 years) | |
| Schenker XMG Focus 17 (E23) | |
| MSI Pulse 17 B13VGK | |
| Acer Nitro 17 AN17-51-71ER | |
| Acer Nitro 17 AN17-41-R9LN | |
| Average AMD Ryzen 7 7735HS (1459 - 9094, n=16) | |
| AIDA64 / CPU PhotoWorxx | |
| Schenker XMG Focus 17 (E23) | |
| Average of class Gaming (12271 - 89891, n=105, last 2 years) | |
| MSI Pulse 17 B13VGK | |
| Acer Nitro 17 AN17-51-71ER | |
| Asus ROG Strix G17 G713PI | |
| Acer Nitro 17 AN17-41-R9LN | |
| Average AMD Ryzen 7 7735HS (17524 - 30542, n=16) | |
System performance
The laptop's system performance was good enough for it to come in somewhere in the middle among the comparison devices. 7,240 points in PCMark 10 make this a nimble and all-round capable system.
CrossMark: Overall | Productivity | Creativity | Responsiveness
| PCMark 10 / Score | |
| Average of class Gaming (5828 - 12414, n=93, last 2 years) | |
| MSI Pulse 17 B13VGK | |
| Asus ROG Strix G17 G713PI | |
| Acer Nitro 17 AN17-41-R9LN | |
| Average AMD Ryzen 7 7735HS, NVIDIA GeForce RTX 4070 Laptop GPU (7220 - 7240, n=2) | |
| Acer Nitro 17 AN17-51-71ER | |
| Schenker XMG Focus 17 (E23) | |
| PCMark 10 / Essentials | |
| Asus ROG Strix G17 G713PI | |
| Acer Nitro 17 AN17-41-R9LN | |
| Average of class Gaming (8810 - 11935, n=97, last 2 years) | |
| Average AMD Ryzen 7 7735HS, NVIDIA GeForce RTX 4070 Laptop GPU (10579 - 10690, n=2) | |
| MSI Pulse 17 B13VGK | |
| Acer Nitro 17 AN17-51-71ER | |
| Schenker XMG Focus 17 (E23) | |
| PCMark 10 / Productivity | |
| Average of class Gaming (6845 - 25323, n=95, last 2 years) | |
| Asus ROG Strix G17 G713PI | |
| MSI Pulse 17 B13VGK | |
| Schenker XMG Focus 17 (E23) | |
| Average AMD Ryzen 7 7735HS, NVIDIA GeForce RTX 4070 Laptop GPU (8893 - 9146, n=2) | |
| Acer Nitro 17 AN17-41-R9LN | |
| Acer Nitro 17 AN17-51-71ER | |
| PCMark 10 / Digital Content Creation | |
| Average of class Gaming (7602 - 19954, n=95, last 2 years) | |
| Acer Nitro 17 AN17-51-71ER | |
| MSI Pulse 17 B13VGK | |
| Acer Nitro 17 AN17-41-R9LN | |
| Average AMD Ryzen 7 7735HS, NVIDIA GeForce RTX 4070 Laptop GPU (10558 - 10834, n=2) | |
| Schenker XMG Focus 17 (E23) | |
| Asus ROG Strix G17 G713PI | |
| CrossMark / Overall | |
| Asus ROG Strix G17 G713PI | |
| Schenker XMG Focus 17 (E23) | |
| Average of class Gaming (1366 - 2409, n=94, last 2 years) | |
| MSI Pulse 17 B13VGK | |
| Acer Nitro 17 AN17-51-71ER | |
| Average AMD Ryzen 7 7735HS, NVIDIA GeForce RTX 4070 Laptop GPU (n=1) | |
| CrossMark / Productivity | |
| Asus ROG Strix G17 G713PI | |
| Schenker XMG Focus 17 (E23) | |
| Average of class Gaming (1386 - 2254, n=94, last 2 years) | |
| MSI Pulse 17 B13VGK | |
| Acer Nitro 17 AN17-51-71ER | |
| Average AMD Ryzen 7 7735HS, NVIDIA GeForce RTX 4070 Laptop GPU (n=1) | |
| CrossMark / Creativity | |
| Asus ROG Strix G17 G713PI | |
| Schenker XMG Focus 17 (E23) | |
| Average of class Gaming (1343 - 2786, n=94, last 2 years) | |
| MSI Pulse 17 B13VGK | |
| Acer Nitro 17 AN17-51-71ER | |
| Average AMD Ryzen 7 7735HS, NVIDIA GeForce RTX 4070 Laptop GPU (n=1) | |
| CrossMark / Responsiveness | |
| MSI Pulse 17 B13VGK | |
| Schenker XMG Focus 17 (E23) | |
| Average of class Gaming (1226 - 2334, n=94, last 2 years) | |
| Asus ROG Strix G17 G713PI | |
| Acer Nitro 17 AN17-51-71ER | |
| Average AMD Ryzen 7 7735HS, NVIDIA GeForce RTX 4070 Laptop GPU (n=1) | |
| PCMark 10 Score | 7240 points | |
Help | ||
| AIDA64 / Memory Copy | |
| Schenker XMG Focus 17 (E23) | |
| Average of class Gaming (21750 - 129946, n=105, last 2 years) | |
| MSI Pulse 17 B13VGK | |
| Acer Nitro 17 AN17-51-71ER | |
| Asus ROG Strix G17 G713PI | |
| Acer Nitro 17 AN17-41-R9LN | |
| Average AMD Ryzen 7 7735HS (30324 - 52012, n=16) | |
| AIDA64 / Memory Read | |
| Schenker XMG Focus 17 (E23) | |
| Average of class Gaming (22956 - 118858, n=105, last 2 years) | |
| MSI Pulse 17 B13VGK | |
| Acer Nitro 17 AN17-51-71ER | |
| Asus ROG Strix G17 G713PI | |
| Acer Nitro 17 AN17-41-R9LN | |
| Average AMD Ryzen 7 7735HS (33938 - 51856, n=16) | |
| AIDA64 / Memory Write | |
| Average of class Gaming (22297 - 135096, n=105, last 2 years) | |
| Schenker XMG Focus 17 (E23) | |
| Acer Nitro 17 AN17-51-71ER | |
| MSI Pulse 17 B13VGK | |
| Asus ROG Strix G17 G713PI | |
| Acer Nitro 17 AN17-41-R9LN | |
| Average AMD Ryzen 7 7735HS (33175 - 55284, n=16) | |
| AIDA64 / Memory Latency | |
| Acer Nitro 17 AN17-51-71ER | |
| Average of class Gaming (75.3 - 259, n=105, last 2 years) | |
| MSI Pulse 17 B13VGK | |
| Average AMD Ryzen 7 7735HS (78.2 - 109.8, n=16) | |
| Schenker XMG Focus 17 (E23) | |
| Acer Nitro 17 AN17-41-R9LN | |
| Asus ROG Strix G17 G713PI | |
* ... smaller is better
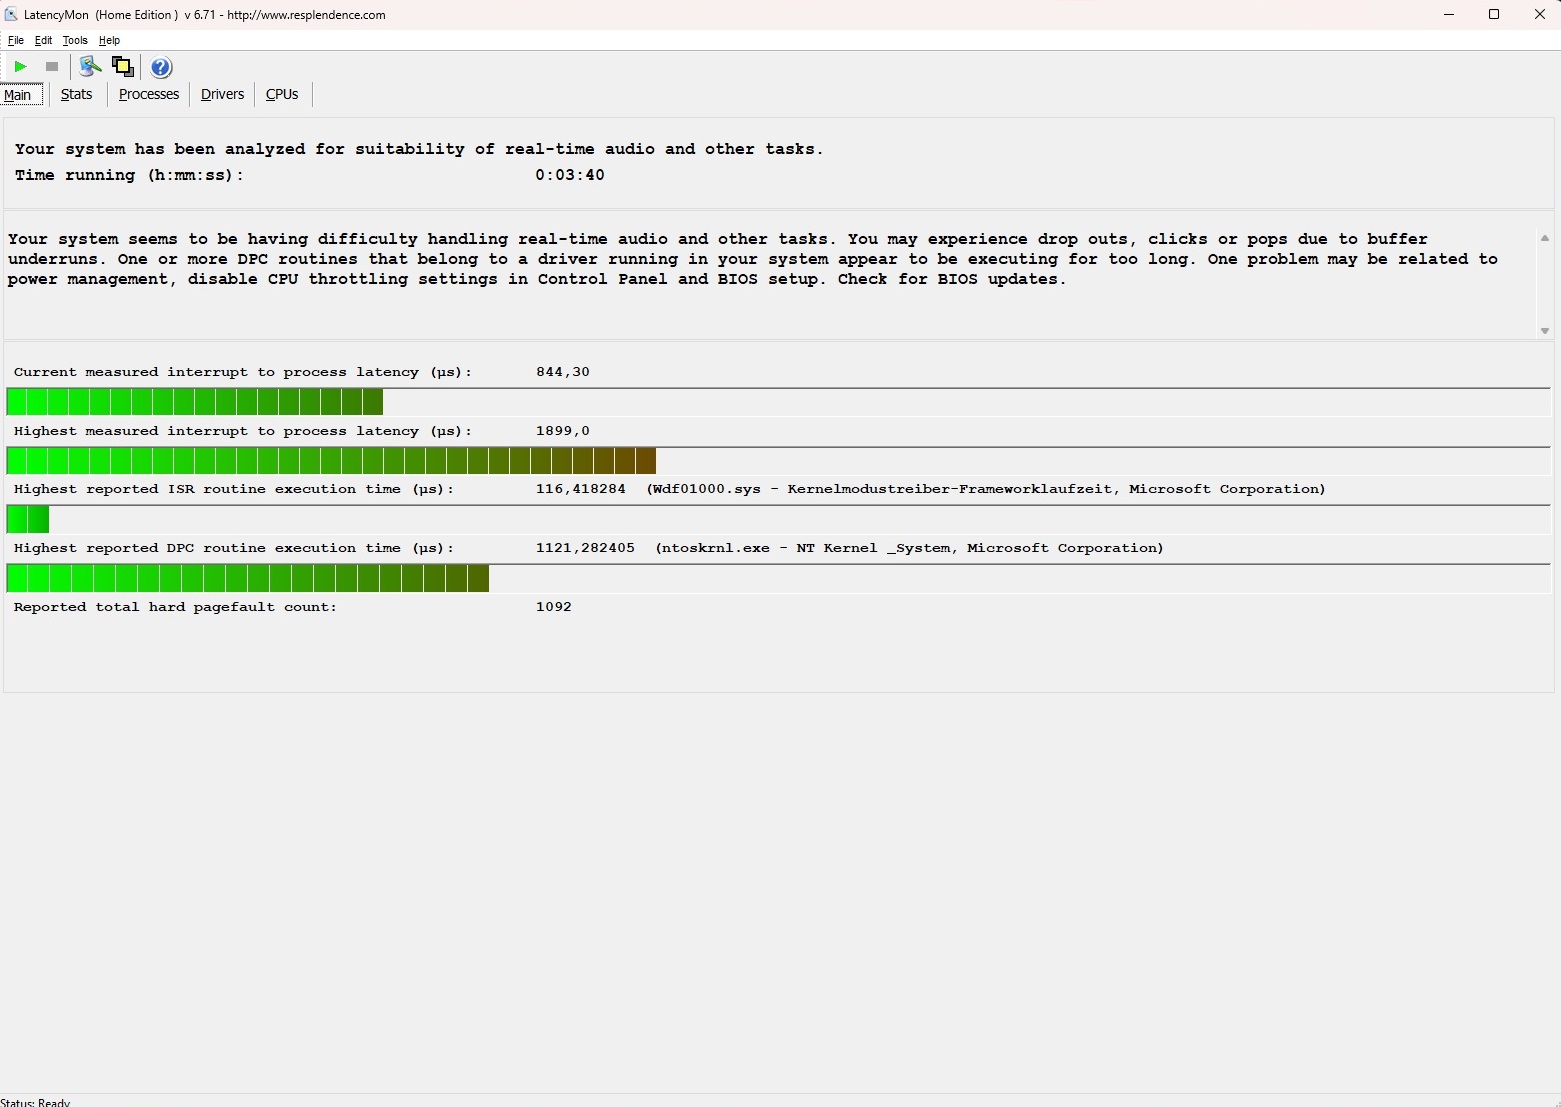
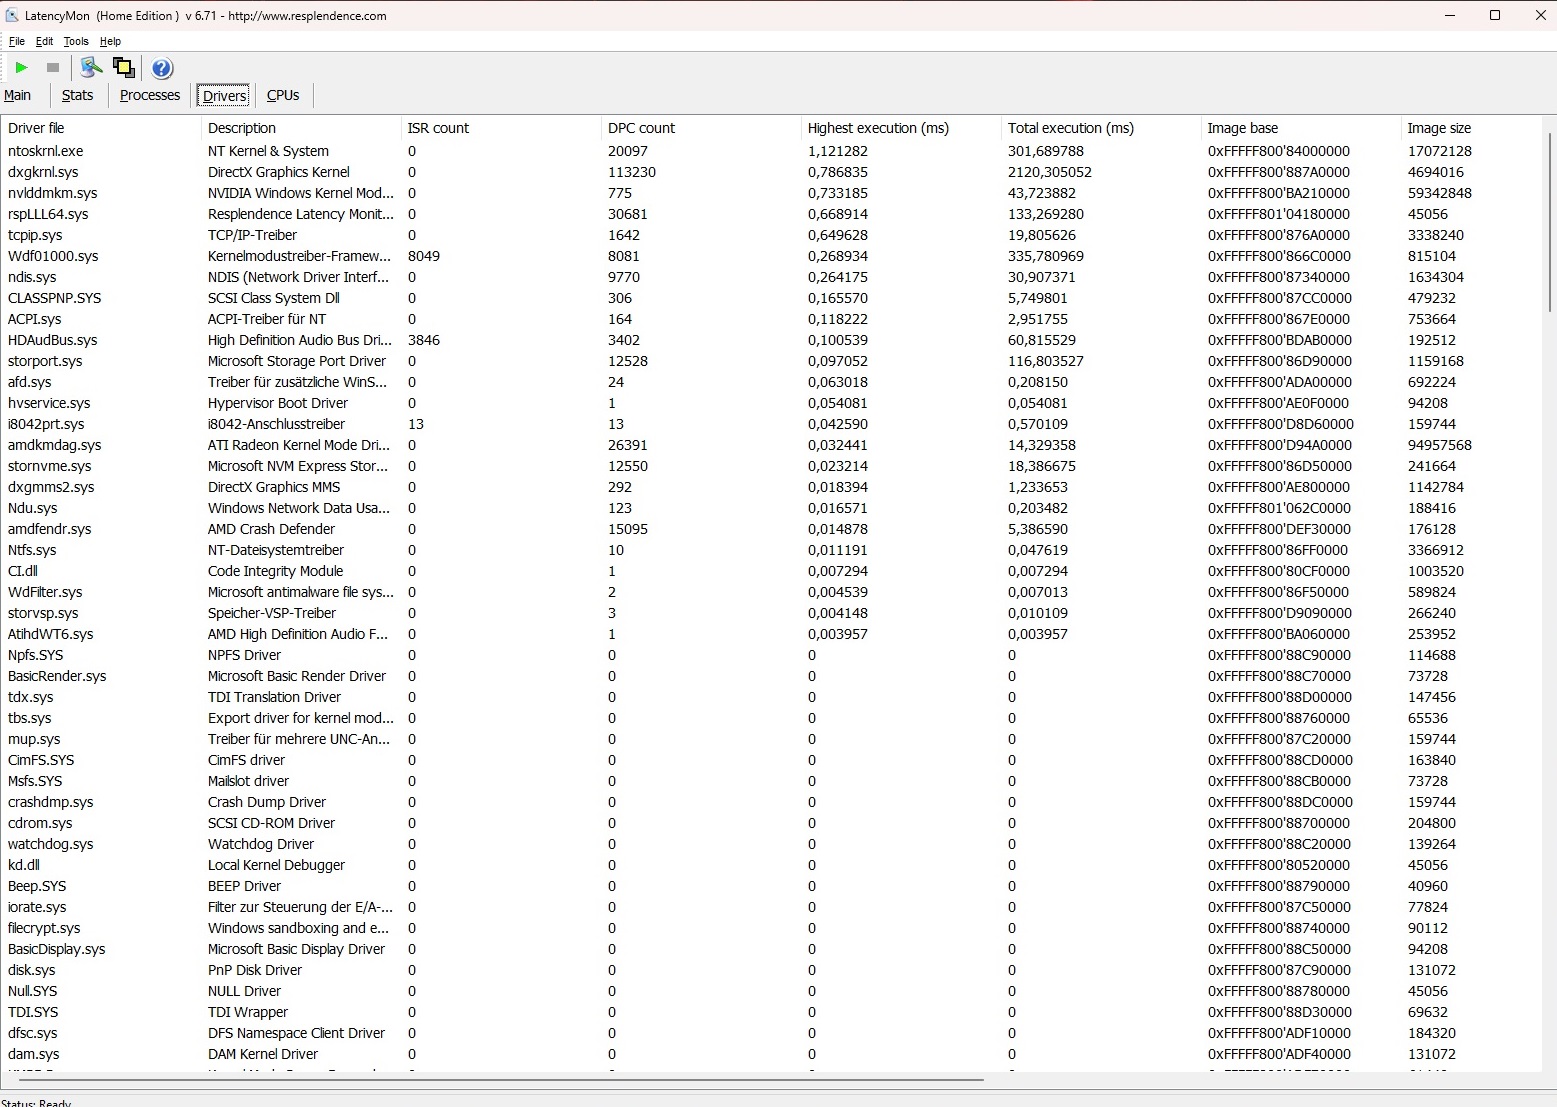
DPC latency
The Nitro 17 has to accept criticism for its high latencies. According to the LatencyMon tool, the laptop is only conditionally suitable for real-time video and audio editing in its delivered state.
| DPC Latencies / LatencyMon - interrupt to process latency (max), Web, Youtube, Prime95 | |
| Acer Nitro 17 AN17-41-R9LN | |
| Asus ROG Strix G17 G713PI | |
| Acer Nitro 17 AN17-51-71ER | |
| MSI Pulse 17 B13VGK | |
| Schenker XMG Focus 17 (E23) | |
* ... smaller is better
Storage devices
The laptop is fitted with an NVMe drive from Samsung. The PM9A1 model delivered very good results in the AS SSD benchmark as well as in its read and write rates. Unfortunately, its performance sank considerably after a while and then remained very unstable (see DiskSpd-Loop).

* ... smaller is better
Reading continuous performance: DiskSpd Read Loop, Queue Depth 8
Graphics card
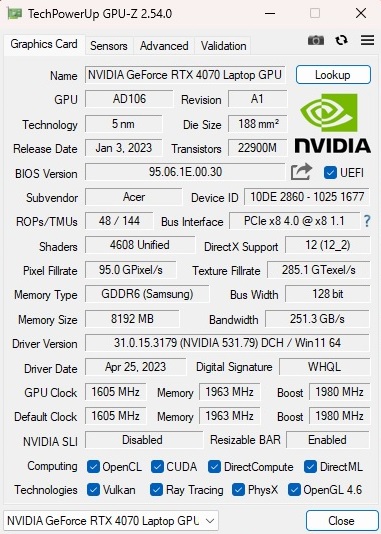
The GeForce RTX 4070 from Nvidia's Ada Lovelace generation takes care of complex graphics calculations. Due to its limited RAM (8 GB GDDR6) and relatively narrow interface (128 bits), we would class this gaming laptop as an upper mid-range device and not a high-end one. The RTX 4070 has a TGP of 140 watts, which is the maximum for this graphics chip.
Its benchmark results were relatively unspectacular, as the Nitro 17's GPU performance is about the same as the RTX 4070 average. Its performance win over the RTX 4060 model is limited, as can be seen in our table.
| 3DMark Performance rating - Percent | |
| Average of class Gaming | |
| Schenker XMG Focus 17 (E23) -1! | |
| Asus ROG Strix G17 G713PI -1! | |
| MSI Pulse 17 B13VGK | |
| Average NVIDIA GeForce RTX 4070 Laptop GPU | |
| Acer Nitro 17 AN17-41-R9LN | |
| Acer Nitro 17 AN17-51-71ER -1! | |
| 3DMark 11 Performance | 30265 points | |
| 3DMark Ice Storm Standard Score | 215395 points | |
| 3DMark Cloud Gate Standard Score | 59285 points | |
| 3DMark Fire Strike Score | 25639 points | |
| 3DMark Time Spy Score | 10950 points | |
Help | ||
* ... smaller is better
Gaming performance
The situation is similar when it comes to gaming. Here, too, its performance was similar to the previously determined average, and the RTX 4070 barely did any better than the RTX 4060 in some cases.
| The Witcher 3 - 1920x1080 Ultra Graphics & Postprocessing (HBAO+) | |
| Average of class Gaming (104.7 - 240, n=7, last 2 years) | |
| Asus ROG Strix G17 G713PI | |
| Schenker XMG Focus 17 (E23) | |
| Average NVIDIA GeForce RTX 4070 Laptop GPU (69.8 - 133.7, n=57) | |
| Acer Nitro 17 AN17-41-R9LN | |
| MSI Pulse 17 B13VGK | |
| Acer Nitro 17 AN17-51-71ER | |
| Final Fantasy XV Benchmark - 1920x1080 High Quality | |
| Average of class Gaming (41 - 215, n=95, last 2 years) | |
| Schenker XMG Focus 17 (E23) | |
| Asus ROG Strix G17 G713PI | |
| MSI Pulse 17 B13VGK | |
| Average NVIDIA GeForce RTX 4070 Laptop GPU (41 - 131.9, n=65) | |
| Acer Nitro 17 AN17-41-R9LN | |
| Acer Nitro 17 AN17-51-71ER | |
If you limit yourself to Full HD resolution, i.e. 1,920 x 1,080 pixels, even demanding games like Immortals of Aveum can be run at maximum details and can achieve at least 40 FPS. Most games run at more than 60 FPS in FHD. The RTX 4070 is also strong enough for native QHD resolution with a few exceptions, and the display's 165 Hz refresh rate is rarely utilized.
| Armored Core 6 - 2560x1440 Maximum Preset | |
| XMG Pro 15 E23 | |
| Average NVIDIA GeForce RTX 4070 Laptop GPU (76.2 - 85, n=2) | |
| Acer Nitro 17 AN17-41-R9LN | |
| Average of class Gaming (n=1last 2 years) | |
| Immortals of Aveum - 2560x1440 Ultra AF:16x | |
| XMG Pro 15 E23 | |
| Average NVIDIA GeForce RTX 4070 Laptop GPU (32 - 35, n=2) | |
| Acer Nitro 17 AN17-41-R9LN | |
| Atlas Fallen - 2560x1440 Very High Preset | |
| XMG Pro 15 E23 | |
| Average NVIDIA GeForce RTX 4070 Laptop GPU (80.6 - 89.5, n=2) | |
| Acer Nitro 17 AN17-41-R9LN | |
| Baldur's Gate 3 - 2560x1440 Ultra Preset AA:T | |
| Average of class Gaming (60 - 175.5, n=85, last 2 years) | |
| Average NVIDIA GeForce RTX 4070 Laptop GPU (54.4 - 89.6, n=25) | |
| XMG Pro 15 E23 | |
| Acer Nitro 17 AN17-41-R9LN | |
| Ratchet & Clank Rift Apart - 2560x1440 Very High Preset AA:T | |
| XMG Pro 15 E23 | |
| Average NVIDIA GeForce RTX 4070 Laptop GPU (48.7 - 49.1, n=3) | |
| Acer Nitro 17 AN17-41-R9LN | |
| Sons of the Forest - 2560x1440 Ultra Preset AA:T | |
| Average NVIDIA GeForce RTX 4070 Laptop GPU (61 - 69.5, n=2) | |
| Acer Nitro 17 AN17-41-R9LN | |
| Atomic Heart - 2560x1440 Atomic Preset | |
| Average NVIDIA GeForce RTX 4070 Laptop GPU (51.6 - 58.9, n=3) | |
| Acer Nitro 17 AN17-41-R9LN | |
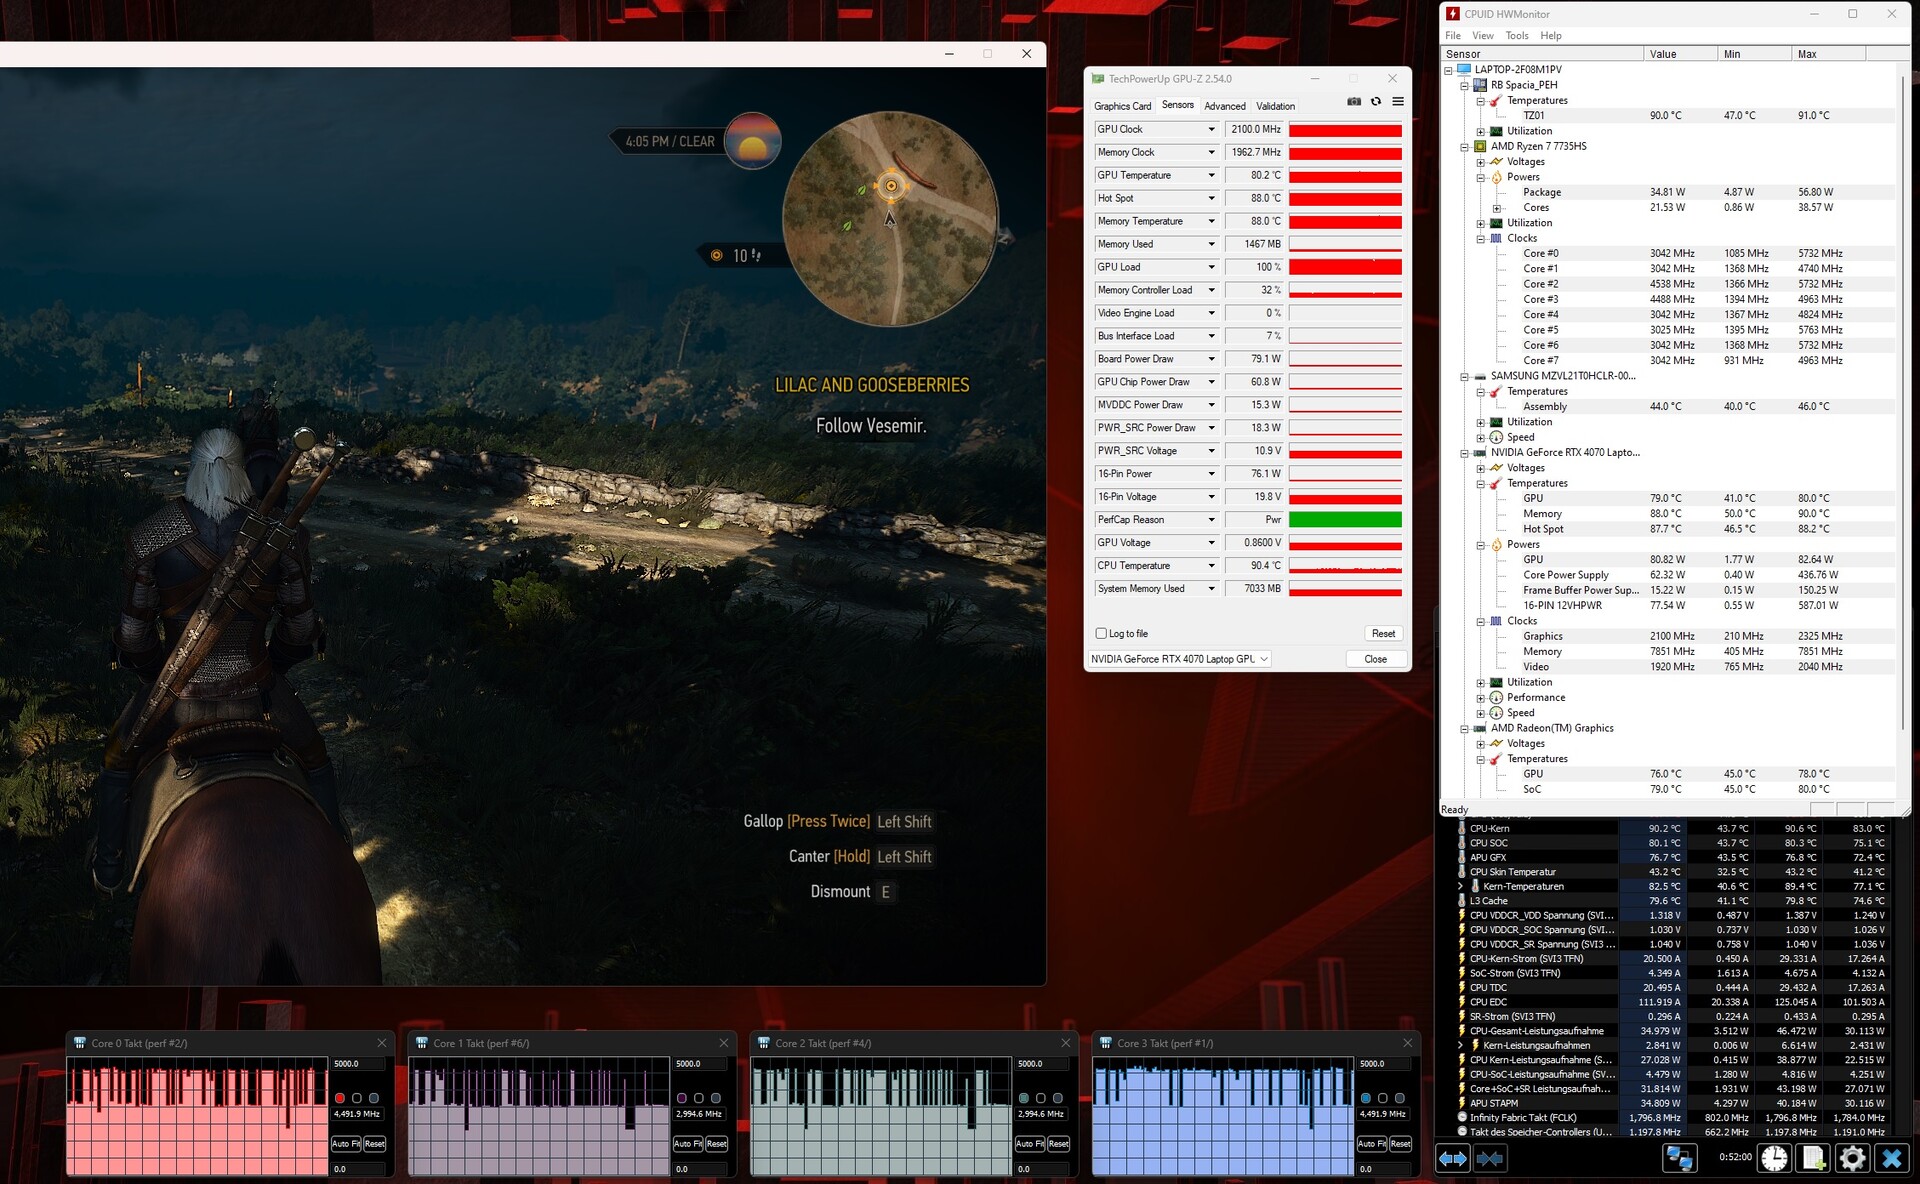
We tested how the 3D performance behaved over a period of about 60 minutes with the help of The Witcher 3 (FHD/Ultra). You can see from the table below that there were no frame rate drops.
Witcher 3 FPS diagram
| low | med. | high | ultra | QHD | |
|---|---|---|---|---|---|
| GTA V (2015) | 168.5 | 152.8 | 94.4 | ||
| The Witcher 3 (2015) | 110 | ||||
| Dota 2 Reborn (2015) | 135.8 | 122.8 | 114.5 | 108.3 | |
| Final Fantasy XV Benchmark (2018) | 144.4 | 106.3 | |||
| X-Plane 11.11 (2018) | 106.3 | 98 | 78.4 | ||
| Strange Brigade (2018) | 278 | 225 | 195 | ||
| Atomic Heart (2023) | 132.5 | 95 | 74.2 | 51.6 | |
| Sons of the Forest (2023) | 73.3 | 71.9 | 71.1 | 61 | |
| Ratchet & Clank Rift Apart (2023) | 72.3 | 60.2 | 56.3 | 48.7 | |
| Atlas Fallen (2023) | 124.7 | 119.9 | 105.3 | 80.6 | |
| Immortals of Aveum (2023) | 57.1 | 46.9 | 32 | ||
| Armored Core 6 (2023) | 92.1 | 91.1 | 87.2 | 76.2 | |
| Baldur's Gate 3 (2023) | 113.9 | 95.3 | 94.4 | 62.5 |
Emissions
Noise emissions
While noise emission levels were quite uncomfortable in Performance mode (54 dB) and Turbo mode (61 dB), the fans were still audible in Balanced mode (44 dB) but not uncomfortably so. This means we would recommend using this setting. In idle mode, the 17-inch laptop generally behaves quite quietly. Either the fans are completely switched off or you can only hear a subtle whooshing noise. The fans rarely spin annoyingly fast.
Noise level
| Idle |
| 25 / 27 / 29 dB(A) |
| Load |
| 42 / 45 dB(A) |
 | ||
30 dB silent 40 dB(A) audible 50 dB(A) loud |
||
min: | ||
| Acer Nitro 17 AN17-41-R9LN R7 7735HS, GeForce RTX 4070 Laptop GPU | Acer Nitro 17 AN17-51-71ER i7-13700H, GeForce RTX 4060 Laptop GPU | MSI Pulse 17 B13VGK i7-13700H, GeForce RTX 4070 Laptop GPU | Schenker XMG Focus 17 (E23) i9-13900HX, GeForce RTX 4070 Laptop GPU | Asus ROG Strix G17 G713PI R9 7945HX, GeForce RTX 4070 Laptop GPU | |
|---|---|---|---|---|---|
| Noise | -4% | 7% | -10% | -5% | |
| off / environment * (dB) | 24 | 24 -0% | 24 -0% | 24 -0% | 25 -4% |
| Idle Minimum * (dB) | 25 | 24 4% | 24 4% | 24 4% | 26 -4% |
| Idle Average * (dB) | 27 | 24 11% | 24 11% | 24 11% | 29 -7% |
| Idle Maximum * (dB) | 29 | 32.32 -11% | 24 17% | 26.47 9% | 30 -3% |
| Load Average * (dB) | 42 | 35.18 16% | 32.49 23% | 55.72 -33% | 46 -10% |
| Witcher 3 ultra * (dB) | 44 | 54.78 -25% | 46.51 -6% | 57.94 -32% | 46 -5% |
| Load Maximum * (dB) | 45 | 54.78 -22% | 46.51 -3% | 57.94 -29% | 47 -4% |
* ... smaller is better
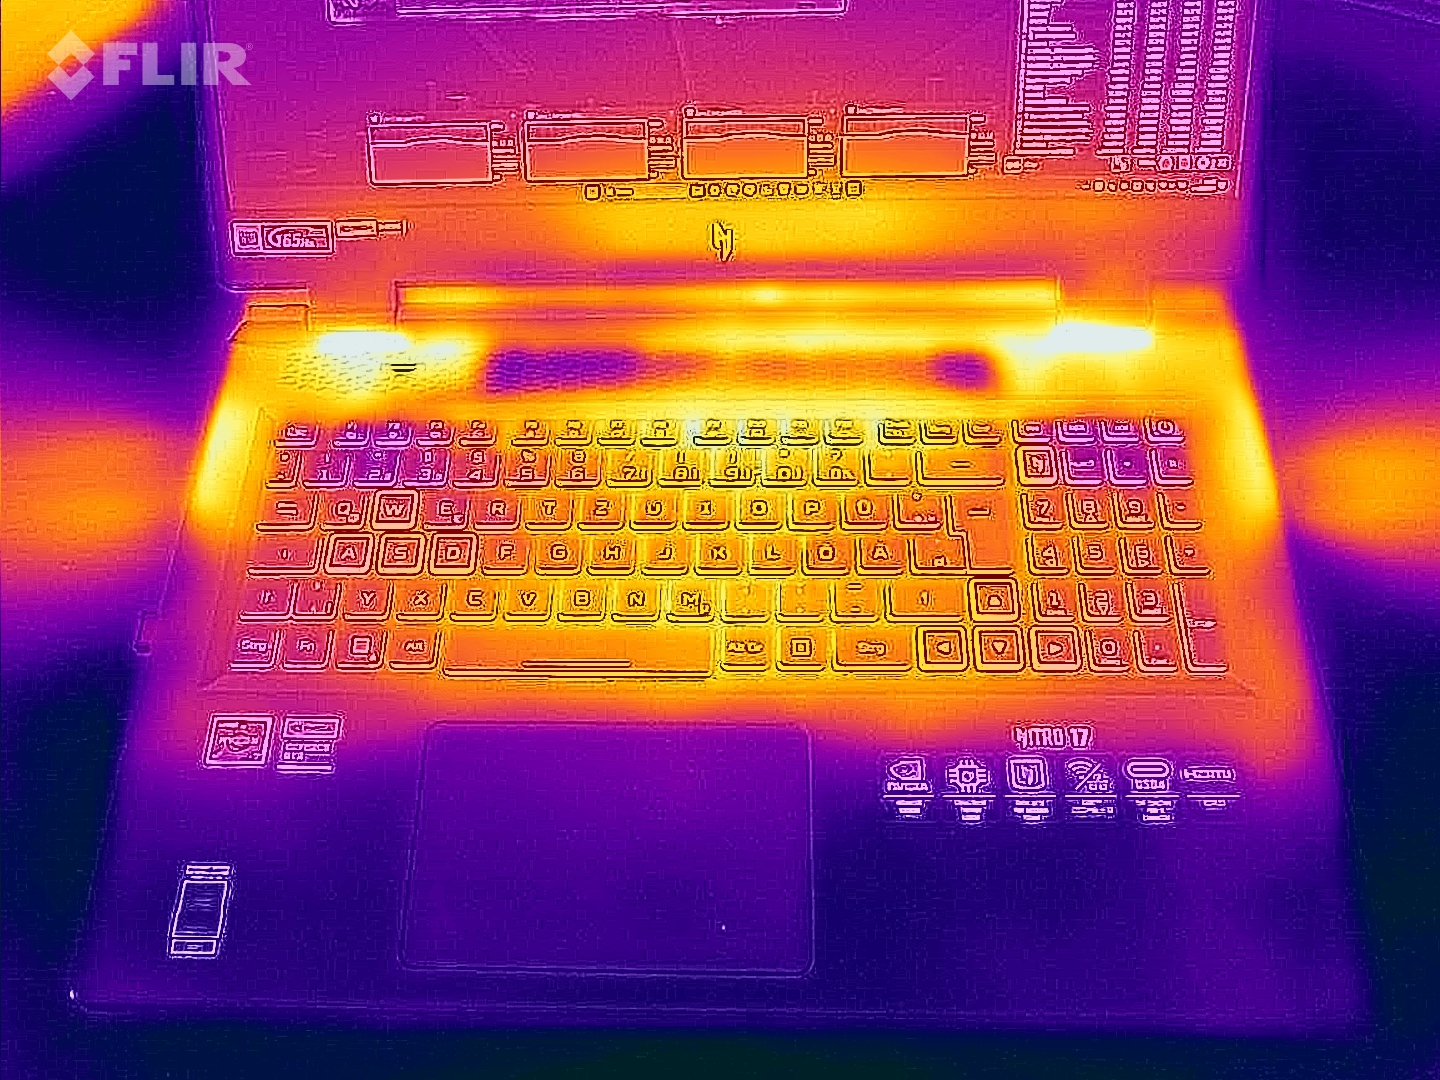
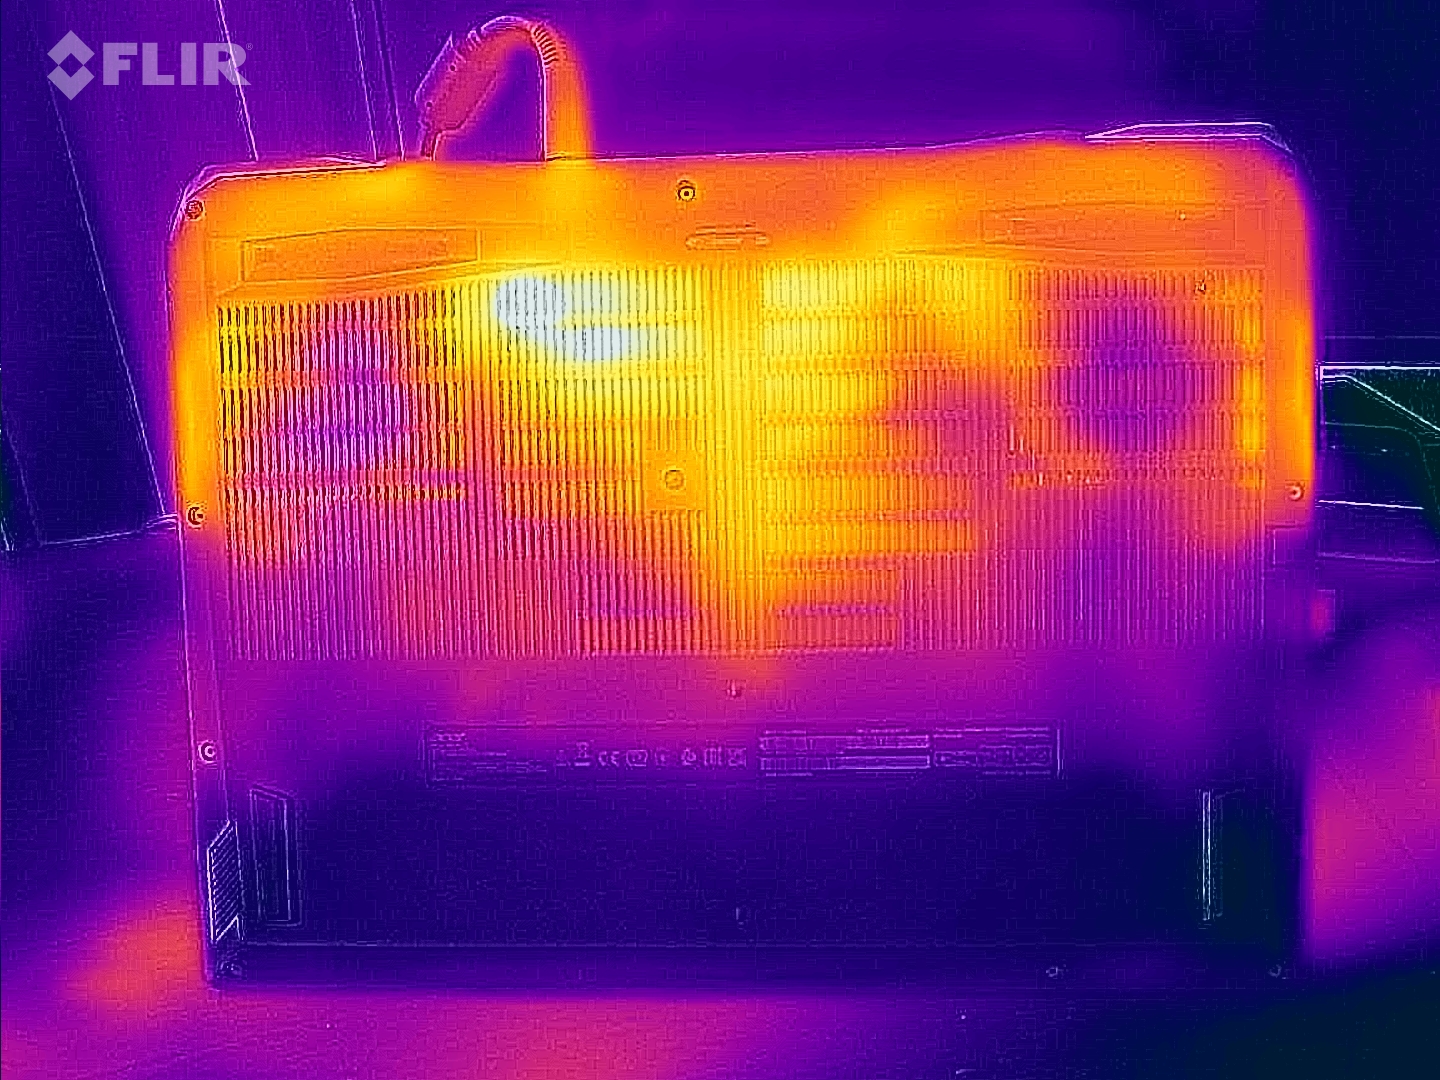
Temperature
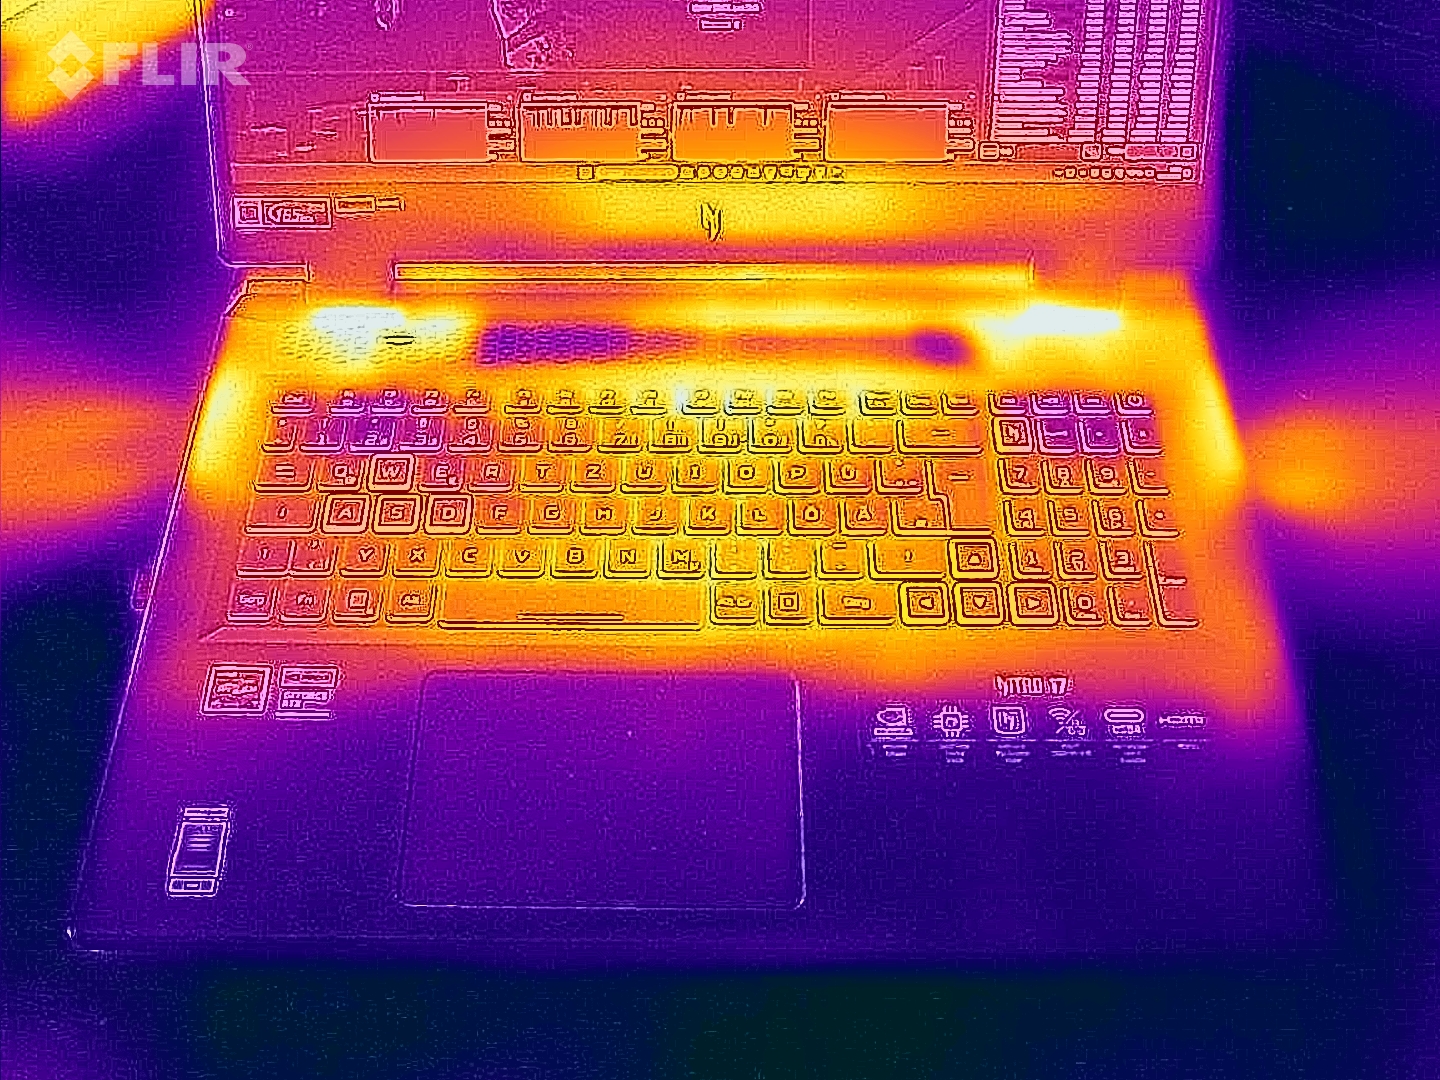
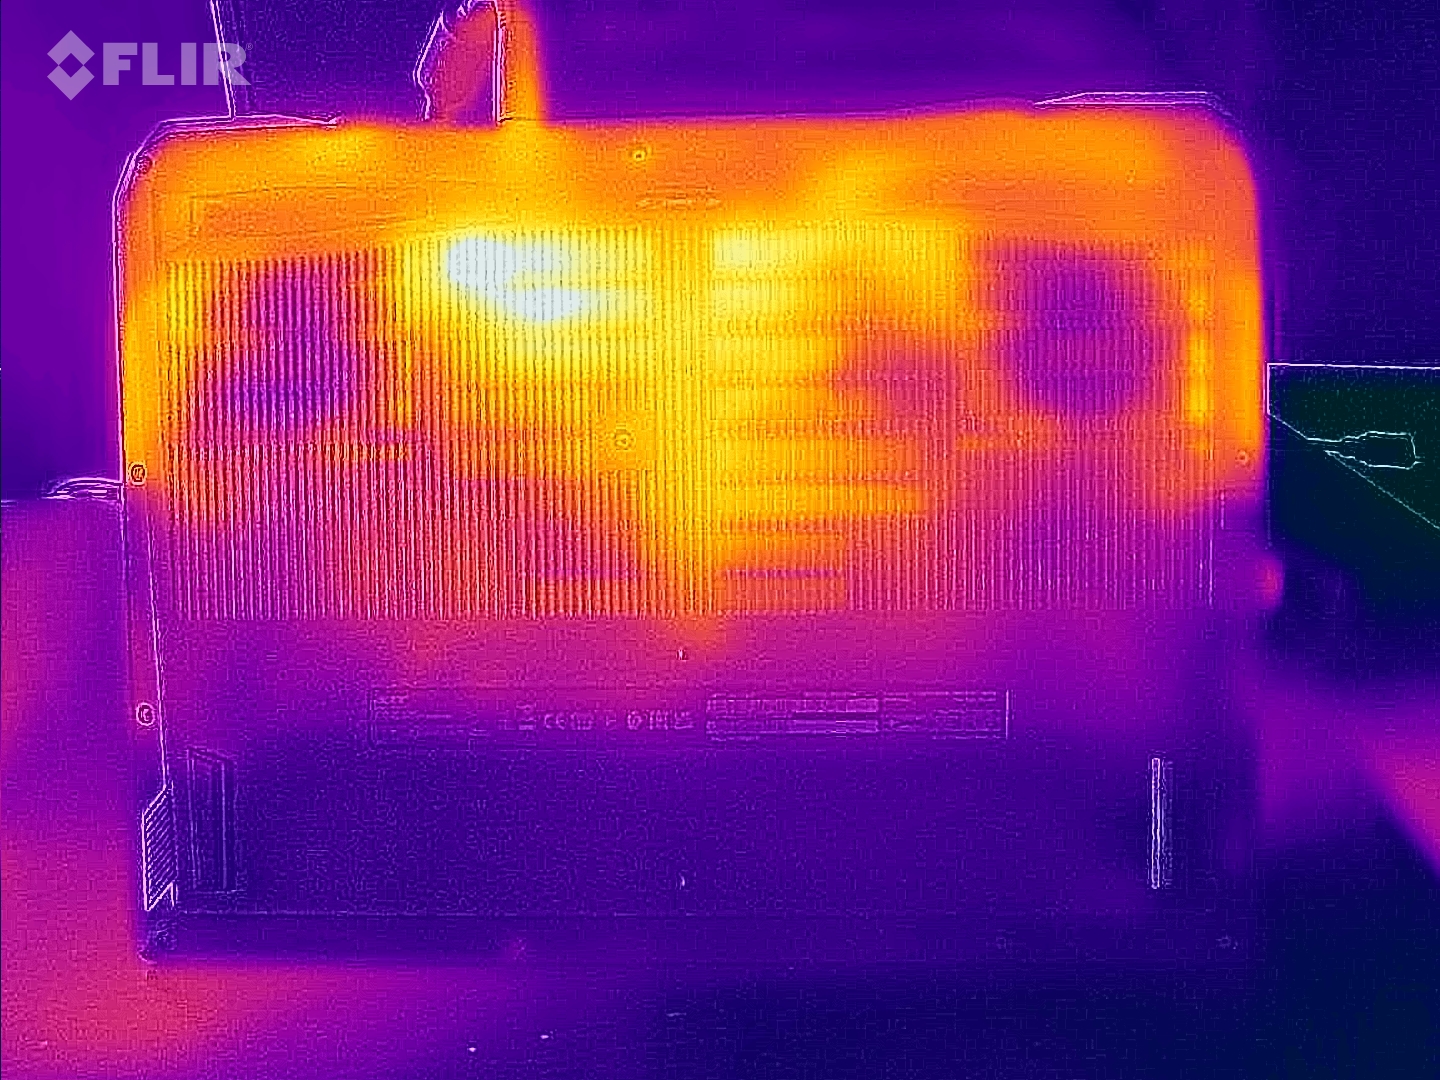
The laptop's temperatures are similar to those of its competitors. During the Witcher 3 gaming test, we noted a maximum of 46 °C on the top of the case and a maximum of 55 °C on the bottom. In idle mode, the whole case remains quite cool. We mostly measured temperatures below 30 °C.
(-) The maximum temperature on the upper side is 47 °C / 117 F, compared to the average of 40.4 °C / 105 F, ranging from 21.2 to 68.8 °C for the class Gaming.
(-) The bottom heats up to a maximum of 53 °C / 127 F, compared to the average of 43.2 °C / 110 F
(+) In idle usage, the average temperature for the upper side is 28.4 °C / 83 F, compared to the device average of 33.9 °C / 93 F.
(-) Playing The Witcher 3, the average temperature for the upper side is 38.1 °C / 101 F, compared to the device average of 33.9 °C / 93 F.
(+) The palmrests and touchpad are reaching skin temperature as a maximum (34 °C / 93.2 F) and are therefore not hot.
(-) The average temperature of the palmrest area of similar devices was 28.8 °C / 83.8 F (-5.2 °C / -9.4 F).
| Acer Nitro 17 AN17-41-R9LN AMD Ryzen 7 7735HS, NVIDIA GeForce RTX 4070 Laptop GPU | Acer Nitro 17 AN17-51-71ER Intel Core i7-13700H, NVIDIA GeForce RTX 4060 Laptop GPU | MSI Pulse 17 B13VGK Intel Core i7-13700H, NVIDIA GeForce RTX 4070 Laptop GPU | Schenker XMG Focus 17 (E23) Intel Core i9-13900HX, NVIDIA GeForce RTX 4070 Laptop GPU | Asus ROG Strix G17 G713PI AMD Ryzen 9 7945HX, NVIDIA GeForce RTX 4070 Laptop GPU | |
|---|---|---|---|---|---|
| Heat | -3% | -1% | -13% | 4% | |
| Maximum Upper Side * (°C) | 47 | 46 2% | 48 -2% | 50 -6% | 42 11% |
| Maximum Bottom * (°C) | 53 | 51 4% | 50 6% | 56 -6% | 41 23% |
| Idle Upper Side * (°C) | 30 | 34 -13% | 30 -0% | 37 -23% | 33 -10% |
| Idle Bottom * (°C) | 31 | 33 -6% | 33 -6% | 36 -16% | 34 -10% |
* ... smaller is better
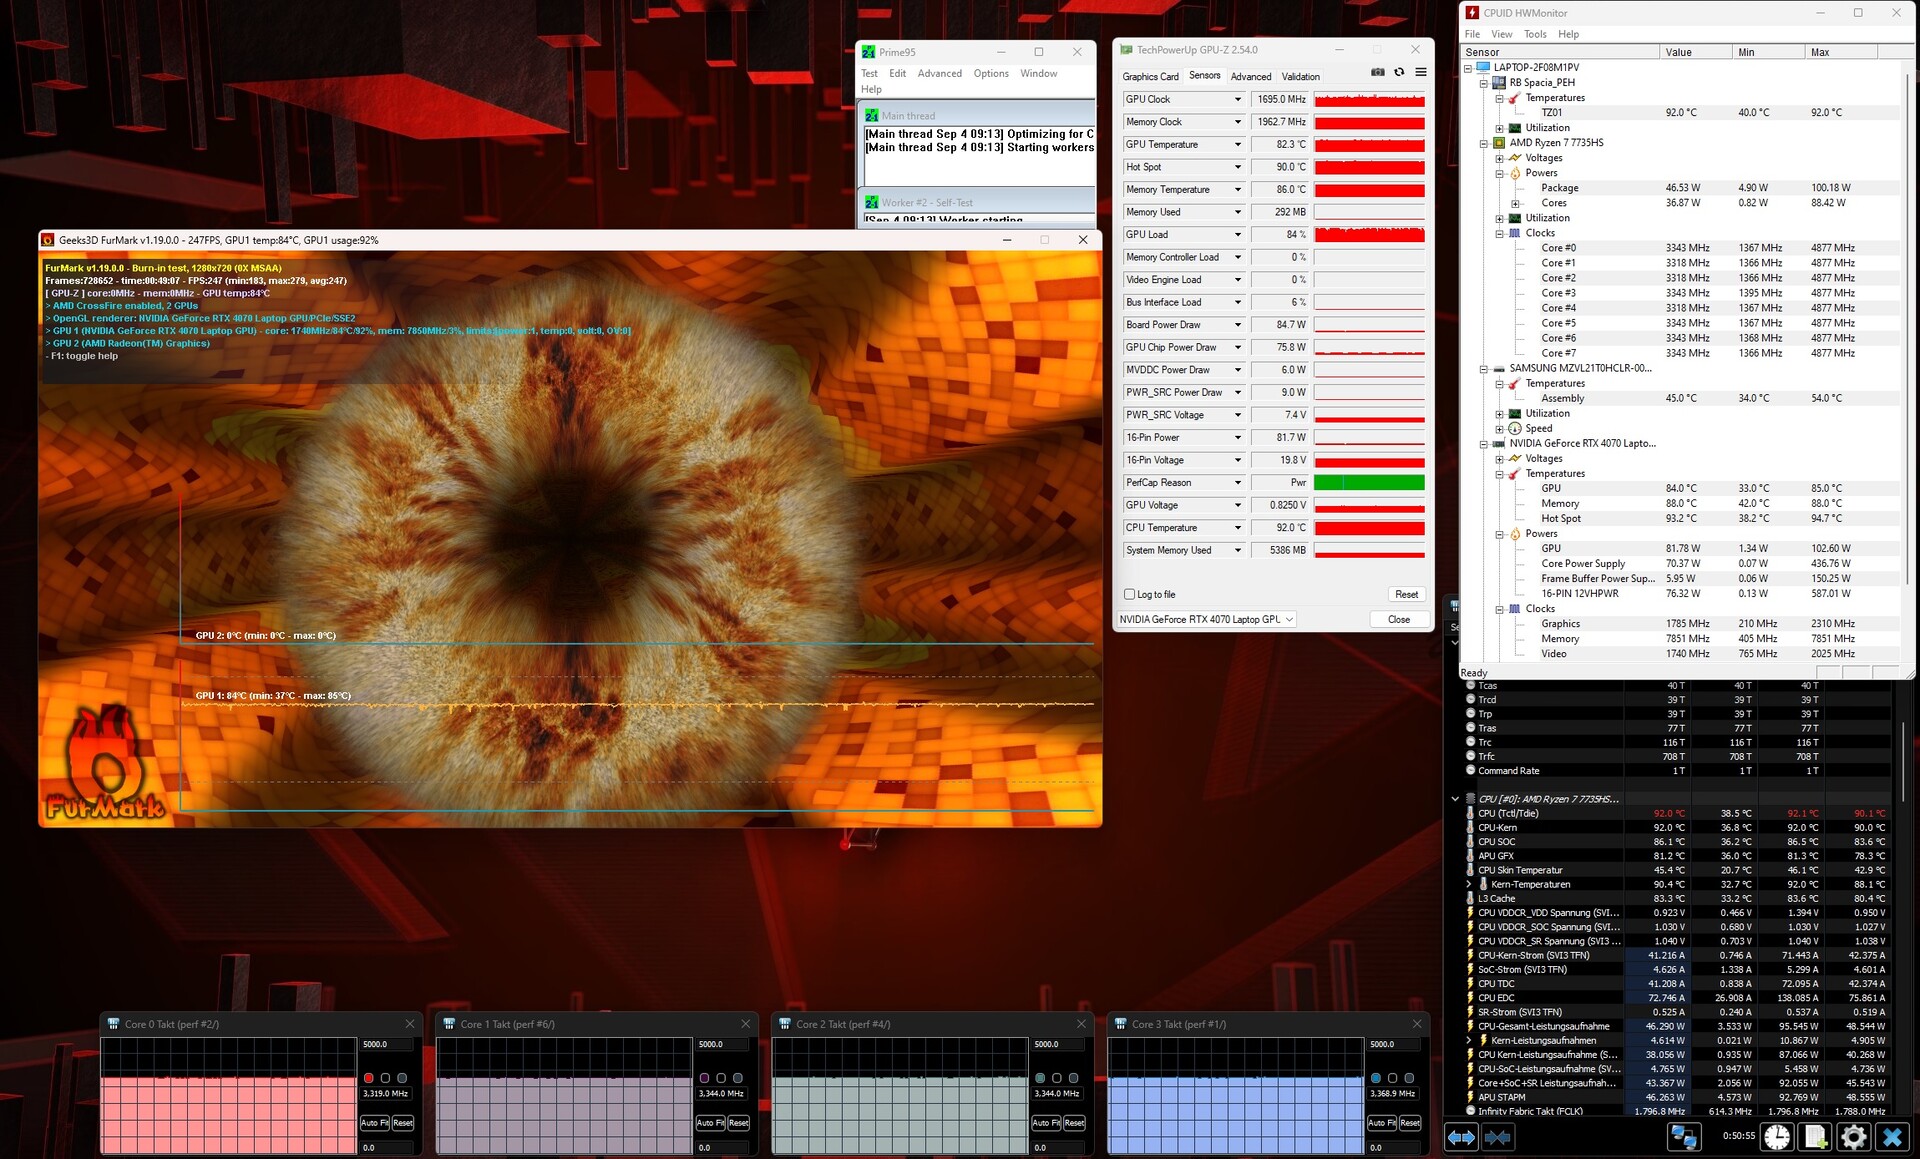
Stress test
The stress test using the tools Furmark & Prime95 ended with no nasty surprises. While the Ryzen 7 7735HS levelled at about 3.3 GHz (but got quite warm at around 90 °C), the RTX 4070 made itself comfortable at 1,700 MHz and just over 80 °C.
Speakers
Acer Nitro 17 AN17-41-R9LN audio analysis
(+) | speakers can play relatively loud (83 dB)
Bass 100 - 315 Hz
(-) | nearly no bass - on average 28.6% lower than median
(±) | linearity of bass is average (14.2% delta to prev. frequency)
Mids 400 - 2000 Hz
(+) | balanced mids - only 1.4% away from median
(+) | mids are linear (4% delta to prev. frequency)
Highs 2 - 16 kHz
(+) | balanced highs - only 4.3% away from median
(+) | highs are linear (3.3% delta to prev. frequency)
Overall 100 - 16.000 Hz
(±) | linearity of overall sound is average (17.7% difference to median)
Compared to same class
» 52% of all tested devices in this class were better, 10% similar, 38% worse
» The best had a delta of 6%, average was 18%, worst was 132%
Compared to all devices tested
» 35% of all tested devices were better, 8% similar, 57% worse
» The best had a delta of 4%, average was 23%, worst was 134%
MSI Pulse 17 B13VGK audio analysis
(+) | speakers can play relatively loud (85.01 dB)
Bass 100 - 315 Hz
(±) | reduced bass - on average 13.2% lower than median
(±) | linearity of bass is average (12.3% delta to prev. frequency)
Mids 400 - 2000 Hz
(±) | higher mids - on average 9.4% higher than median
(+) | mids are linear (5.7% delta to prev. frequency)
Highs 2 - 16 kHz
(+) | balanced highs - only 2.9% away from median
(+) | highs are linear (6.7% delta to prev. frequency)
Overall 100 - 16.000 Hz
(±) | linearity of overall sound is average (15.8% difference to median)
Compared to same class
» 37% of all tested devices in this class were better, 7% similar, 56% worse
» The best had a delta of 6%, average was 18%, worst was 132%
Compared to all devices tested
» 24% of all tested devices were better, 5% similar, 70% worse
» The best had a delta of 4%, average was 23%, worst was 134%
Power management
Power consumption
The laptop's power consumption rates were as to be expected. 10 to 16 watts of idle consumption and 79 to 220 watts of load consumption could also come from a device with an i7-13700H. We cannot understand why Acer includes a bulky 330-watt power supply with the laptop. A more compact 230-watt model would have done just as well.
| Off / Standby | |
| Idle | |
| Load |
|
Key:
min: | |
| Acer Nitro 17 AN17-41-R9LN R7 7735HS, GeForce RTX 4070 Laptop GPU | Acer Nitro 17 AN17-51-71ER i7-13700H, GeForce RTX 4060 Laptop GPU | MSI Pulse 17 B13VGK i7-13700H, GeForce RTX 4070 Laptop GPU | Schenker XMG Focus 17 (E23) i9-13900HX, GeForce RTX 4070 Laptop GPU | Asus ROG Strix G17 G713PI R9 7945HX, GeForce RTX 4070 Laptop GPU | Average of class Gaming | |
|---|---|---|---|---|---|---|
| Power Consumption | -3% | 12% | -71% | -50% | -43% | |
| Idle Minimum * (Watt) | 10 | 8.3 17% | 9 10% | 17 -70% | 15 -50% | 13 ? -30% |
| Idle Average * (Watt) | 11 | 13.5 -23% | 10.2 7% | 18 -64% | 20 -82% | 19 ? -73% |
| Idle Maximum * (Watt) | 16 | 14.8 7% | 10.8 32% | 25.8 -61% | 29 -81% | 24.6 ? -54% |
| Load Average * (Watt) | 79 | 77 3% | 72 9% | 178 -125% | 121 -53% | 110.7 ? -40% |
| Witcher 3 ultra * (Watt) | 147.5 | 154 -4% | 130 12% | 265 -80% | 179.8 -22% | |
| Load Maximum * (Watt) | 220 | 263 -20% | 221 -0% | 275 -25% | 246 -12% | 259 ? -18% |
* ... smaller is better
Power consumption Witcher 3 / stress test
Power consumption with external monitor
Runtimes
A 90 Wh battery capacity competes with its rivals from MSI (Pulse 17) and Asus (Strix G17). Thanks to its powerful battery and built-in graphics switching, you would actually expect good runtimes from this laptop. Interestingly, the rates are significantly lower than those of the Intel counterpart. In our real-world WLAN test with the display brightness reduced to 150 cd/m², the AMD edition only lasted just under 5 hours instead of 8 (we suspect faulty or suboptimal power-saving mechanisms in battery mode).
| Acer Nitro 17 AN17-41-R9LN R7 7735HS, GeForce RTX 4070 Laptop GPU, 90 Wh | Acer Nitro 17 AN17-51-71ER i7-13700H, GeForce RTX 4060 Laptop GPU, 90 Wh | MSI Pulse 17 B13VGK i7-13700H, GeForce RTX 4070 Laptop GPU, 90 Wh | Schenker XMG Focus 17 (E23) i9-13900HX, GeForce RTX 4070 Laptop GPU, 73 Wh | Asus ROG Strix G17 G713PI R9 7945HX, GeForce RTX 4070 Laptop GPU, 90 Wh | Average of class Gaming | |
|---|---|---|---|---|---|---|
| Battery runtime | 58% | 73% | -25% | -17% | 37% | |
| WiFi v1.3 (h) | 5.2 | 8.2 58% | 9 73% | 3.9 -25% | 4.3 -17% | 7.11 ? 37% |
| H.264 (h) | 6.9 | 3.1 | 2.8 | 8.32 ? | ||
| Witcher 3 ultra (h) | 2.5 | 1 | 1.1 | |||
| Load (h) | 2.2 | 1 | 1.502 ? |
Pros
Cons
Verdict
For the most part, Acer's Nitro 17 AN17-41-R9LN is an impressive 17-inch gaming laptop. Its combination of an AMD CPU (Ryzen 7 7735HS) and an Nvidia GPU (GeForce RTX 4070) creates quite a nice harmony which is enough to run most games in its native resolution of 2,560 x 1,440 with maximum settings. Although, it isn't the most future-proof as a result of its meagre 8 GB VRAM.
In many other ways, the manufacturer has delivered a good gaming laptop. Its connectivity options and input devices should be sufficient for most buyers. A colorful and relatively quick QHD display completes the setup.
The laptop's noise emissions are, as always, highly dependent on which mode is in use. In our test, the "balanced" setting showed the best compromise between performance and noise.
Acer could do with improving the Nitro 17's case and sound quality a bit. Its integrated 2.0 system is missing a lot of bass. The laptop's latencies and battery life (considerably shorter than on the Intel version) also prove to be issues which the manufacturer could do with resolving.
Despite its weaker CPU performance and barely better 3D performance compared to the RTX 4060 model based on Intel, we would still recommend going for the AMD model, as most games are known to be GPU-limited.
An equal or slightly better alternative could be the Asus ROG Strix G17 G713PI which also features an RTX 4070 - but it also has a Ryzen 9 7945HX installed which is a more modern and considerably faster CPU. In turn, it also costs more.
Price and availability
The Acer Nitro 17 AN17-41-R9LN with a Ryzen 7 7735HS, GeForce RTX 4070 and a QHD display can be found on Amazon for around US$1,900.
Acer Nitro 17 AN17-41-R9LN
- 09/07/2023 v7 (old)
Florian Glaser
Transparency
The selection of devices to be reviewed is made by our editorial team. The test sample was provided to the author as a loan by the manufacturer or retailer for the purpose of this review. The lender had no influence on this review, nor did the manufacturer receive a copy of this review before publication. There was no obligation to publish this review. As an independent media company, Notebookcheck is not subjected to the authority of manufacturers, retailers or publishers.
This is how Notebookcheck is testing
Every year, Notebookcheck independently reviews hundreds of laptops and smartphones using standardized procedures to ensure that all results are comparable. We have continuously developed our test methods for around 20 years and set industry standards in the process. In our test labs, high-quality measuring equipment is utilized by experienced technicians and editors. These tests involve a multi-stage validation process. Our complex rating system is based on hundreds of well-founded measurements and benchmarks, which maintains objectivity. Further information on our test methods can be found here.
Price comparison

