Acer's quiet Nitro 17 laptop reviewed: The RTX 4060, perfectly configured

The Acer Nitro 17 AN17-51-71ER is a solid, mid-range gaming laptop. With an Intel Core i7 instead of an i9, only four zones on the RGB keyboard and a lot of plastic, compromises are necessary, but they help keep the RRP below $2000.
In return, Acer advertizes the laptop as having stable frame rates the kind of which can be expected from a well-configured Nvidia GeForce RTX 4000 series device. Almost even more crucial is the reputedly perfect cooling. Four air vents, liquid metal cooling and easy-to-use control software provide a strong basis for this.
Fortunately, a few annoying weaknesses found in its direct predecessor, the Acer Nitro 5 AN517, are now nowhere to be seen. They won't be missed.
Our review reveals how well the Nitro 17 stands up to competitors such as the Medion Erazer Defender P40 or the Lenovo Legion Pro 5. Both laptops share similar specs to our review device and come equipped with an RTX 4060 with a maximum TGP of 140 watts. Likewise, the cooling will have to prove itself in the test.
Possible competitors compared
Rating | Date | Model | Weight | Height | Size | Resolution | Price |
|---|---|---|---|---|---|---|---|
| 87.2 % v7 (old) | 07 / 2023 | Acer Nitro 17 AN17-51-71ER i7-13700H, GeForce RTX 4060 Laptop GPU | 3 kg | 30.3 mm | 17.30" | 2560x1440 | |
| 87.9 % v7 (old) | 05 / 2023 | Lenovo Legion Pro 5 16IRX8 i7-13700HX, GeForce RTX 4060 Laptop GPU | 2.5 kg | 26.8 mm | 16.00" | 2560x1600 | |
| 86.9 % v7 (old) | 06 / 2023 | Asus TUF Gaming A16 FA617XS R9 7940HS, Radeon RX 7600S | 2.2 kg | 22.1 mm | 16.00" | 1920x1200 | |
| 85.9 % v7 (old) | 06 / 2023 | Schenker XMG Focus 17 (E23) i9-13900HX, GeForce RTX 4070 Laptop GPU | 2.9 kg | 29.3 mm | 17.30" | 2560x1440 | |
| 84.6 % v7 (old) | 05 / 2023 | Medion Erazer Defender P40 i7-13700HX, GeForce RTX 4060 Laptop GPU | 2.9 kg | 33 mm | 17.30" | 2560x1440 | |
| 83.9 % v7 (old) | 11 / 2022 | Acer Nitro 5 AN515-46-R1A1 R7 6800H, GeForce RTX 3070 Ti Laptop GPU | 2.5 kg | 26.8 mm | 15.60" | 1920x1080 | |
| 83.2 % v7 (old) | 01 / 2023 | MSI Pulse GL76 12UGK i7-12700H, GeForce RTX 3070 Laptop GPU | 2.6 kg | 24.2 mm | 17.30" | 1920x1080 |
Case - An over-sized 17-inch laptop
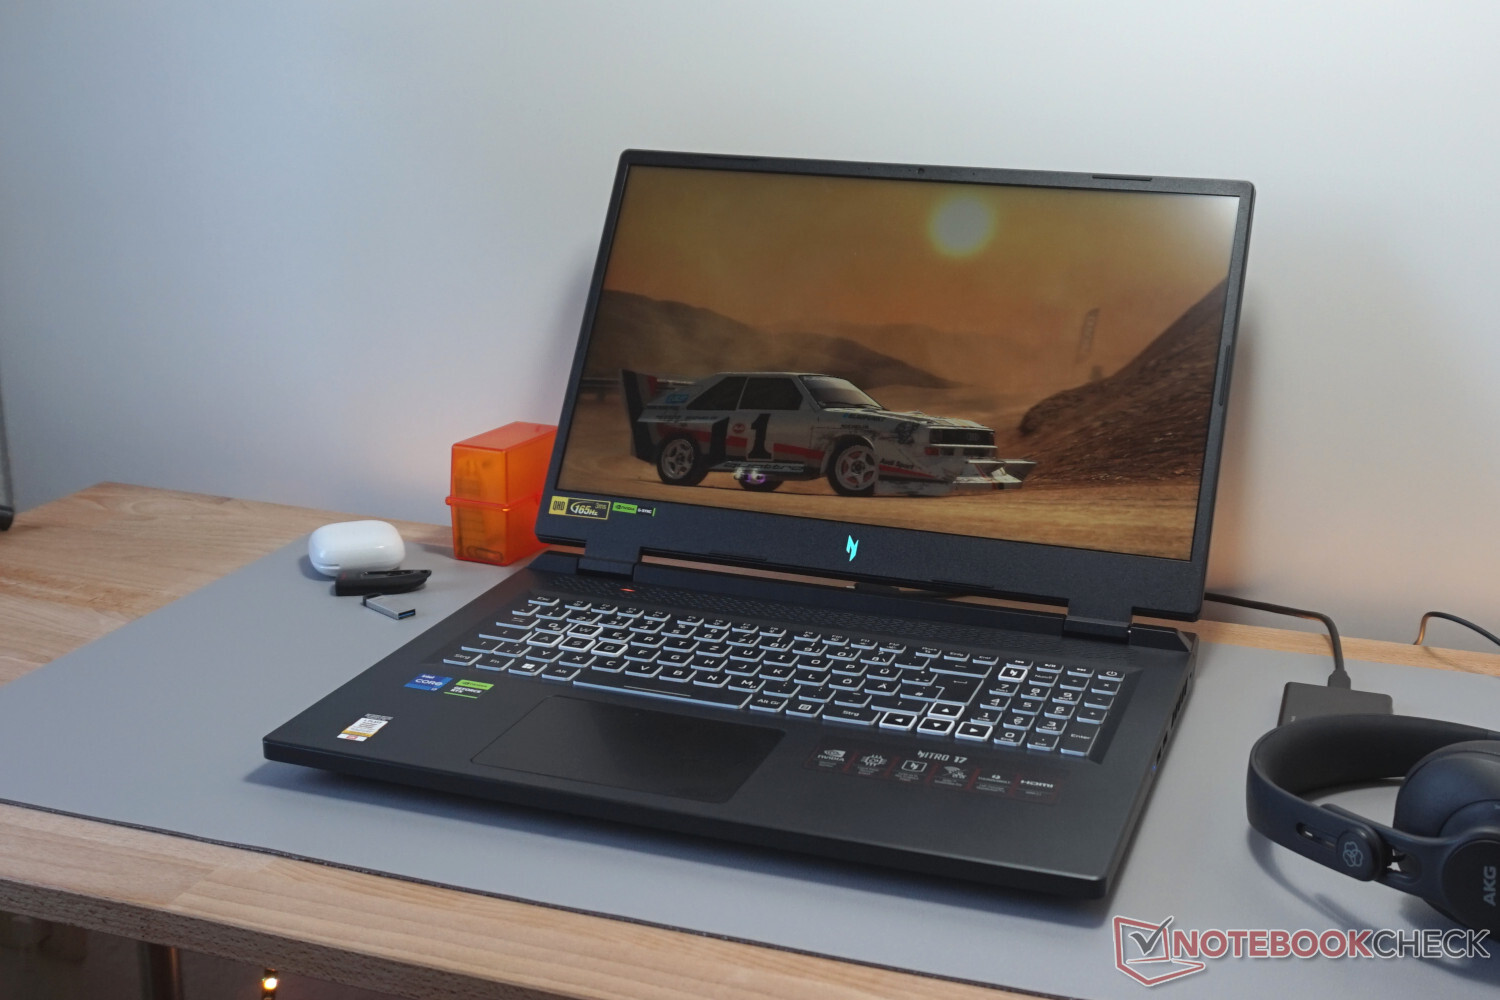
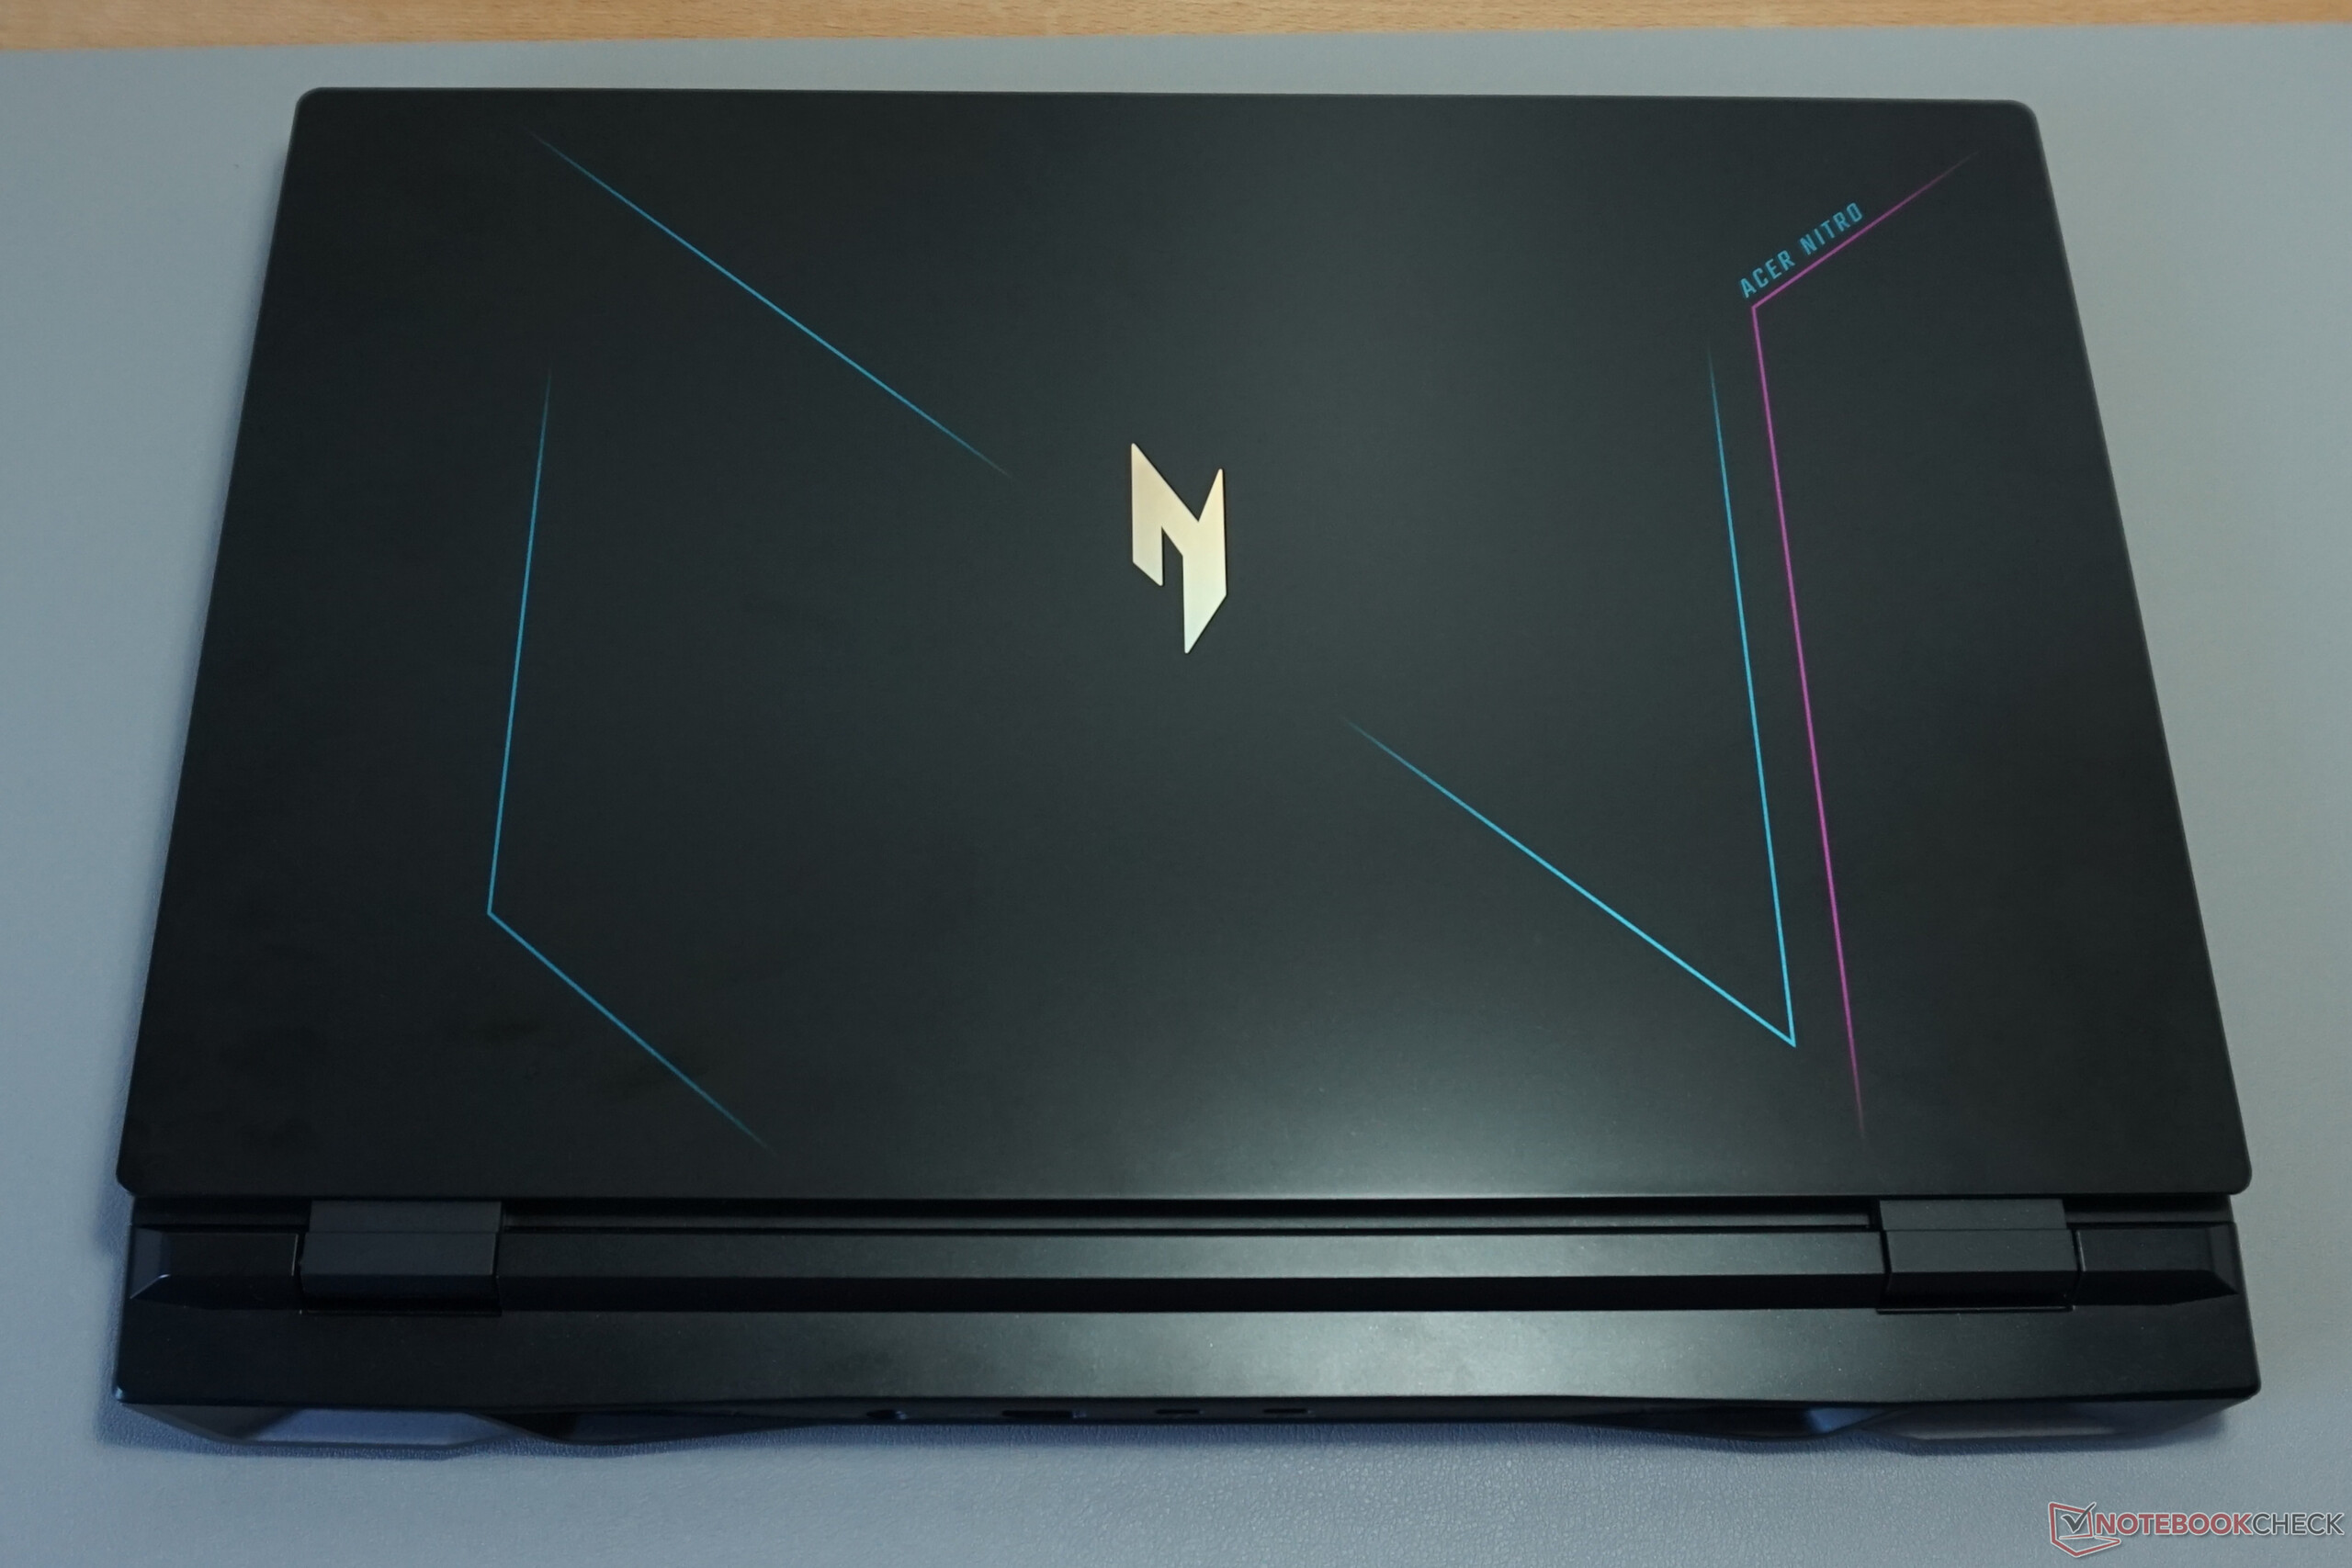
The iridescent "N" on both the lid and below the display give away the Acer Nitro 17's gaming credentials. In addition, there are a few small color accents, but that's it. The search for LED lighting effects or colorful, stand-out elements on the sleek, plastic case, ends in vain.
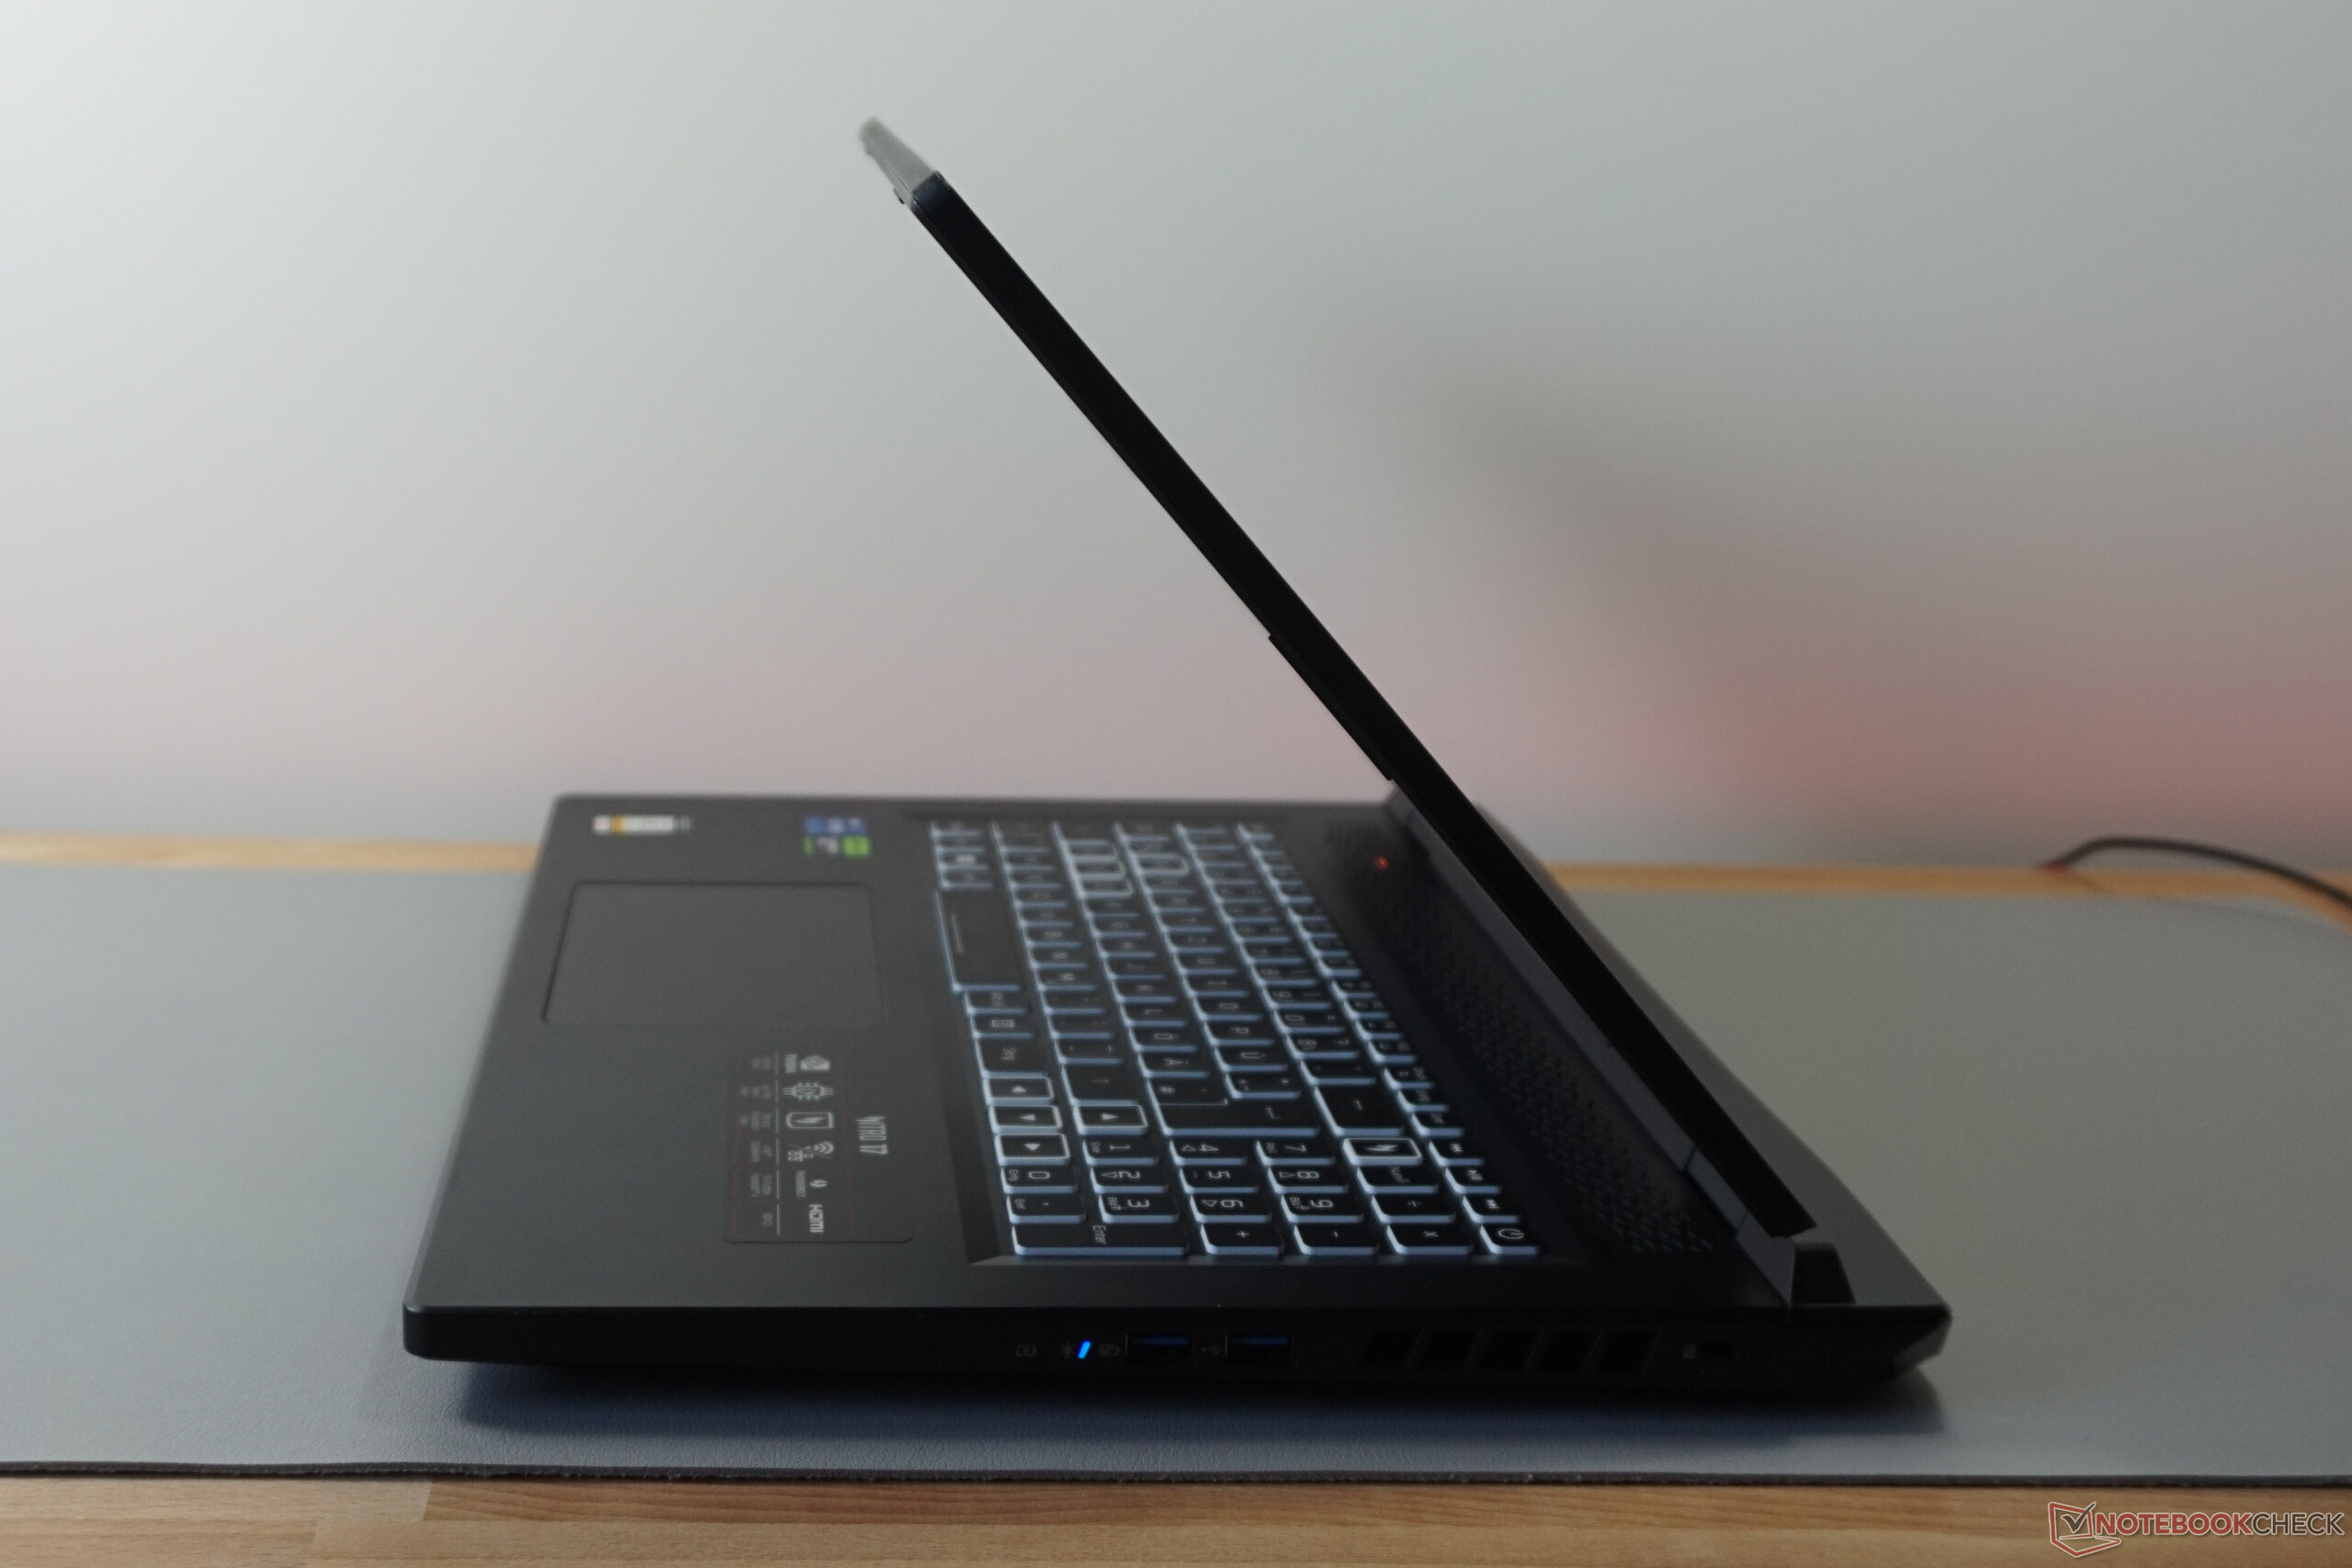
The lack of metal components doesn't detract from the device's robustness. The case doesn't flex, can only be twisted minimally and, likewise, noises cannot be coaxed from it either. In addition, the display frame can only be bent slightly. The screen remains stable when being lifted or moved and can be opened to an angle of over 150°. Everything seems neatly put together.
At the same time, Acer's laptop is heavy and really big. Even among the 17-inch machines, it's hard to find another model that is thicker. Compared to its already big predecessor, the Acer Nitro 517, a few millimeters have been added. As seen in the previous gen model, the large cooling makes its presence felt. The laptop also continues to put weight on. Out-and-about, almost 4.3 kg have to lugged around as the PSU is also really heavy at 1.2 kg.


Features - No complaints with the Nitro 17
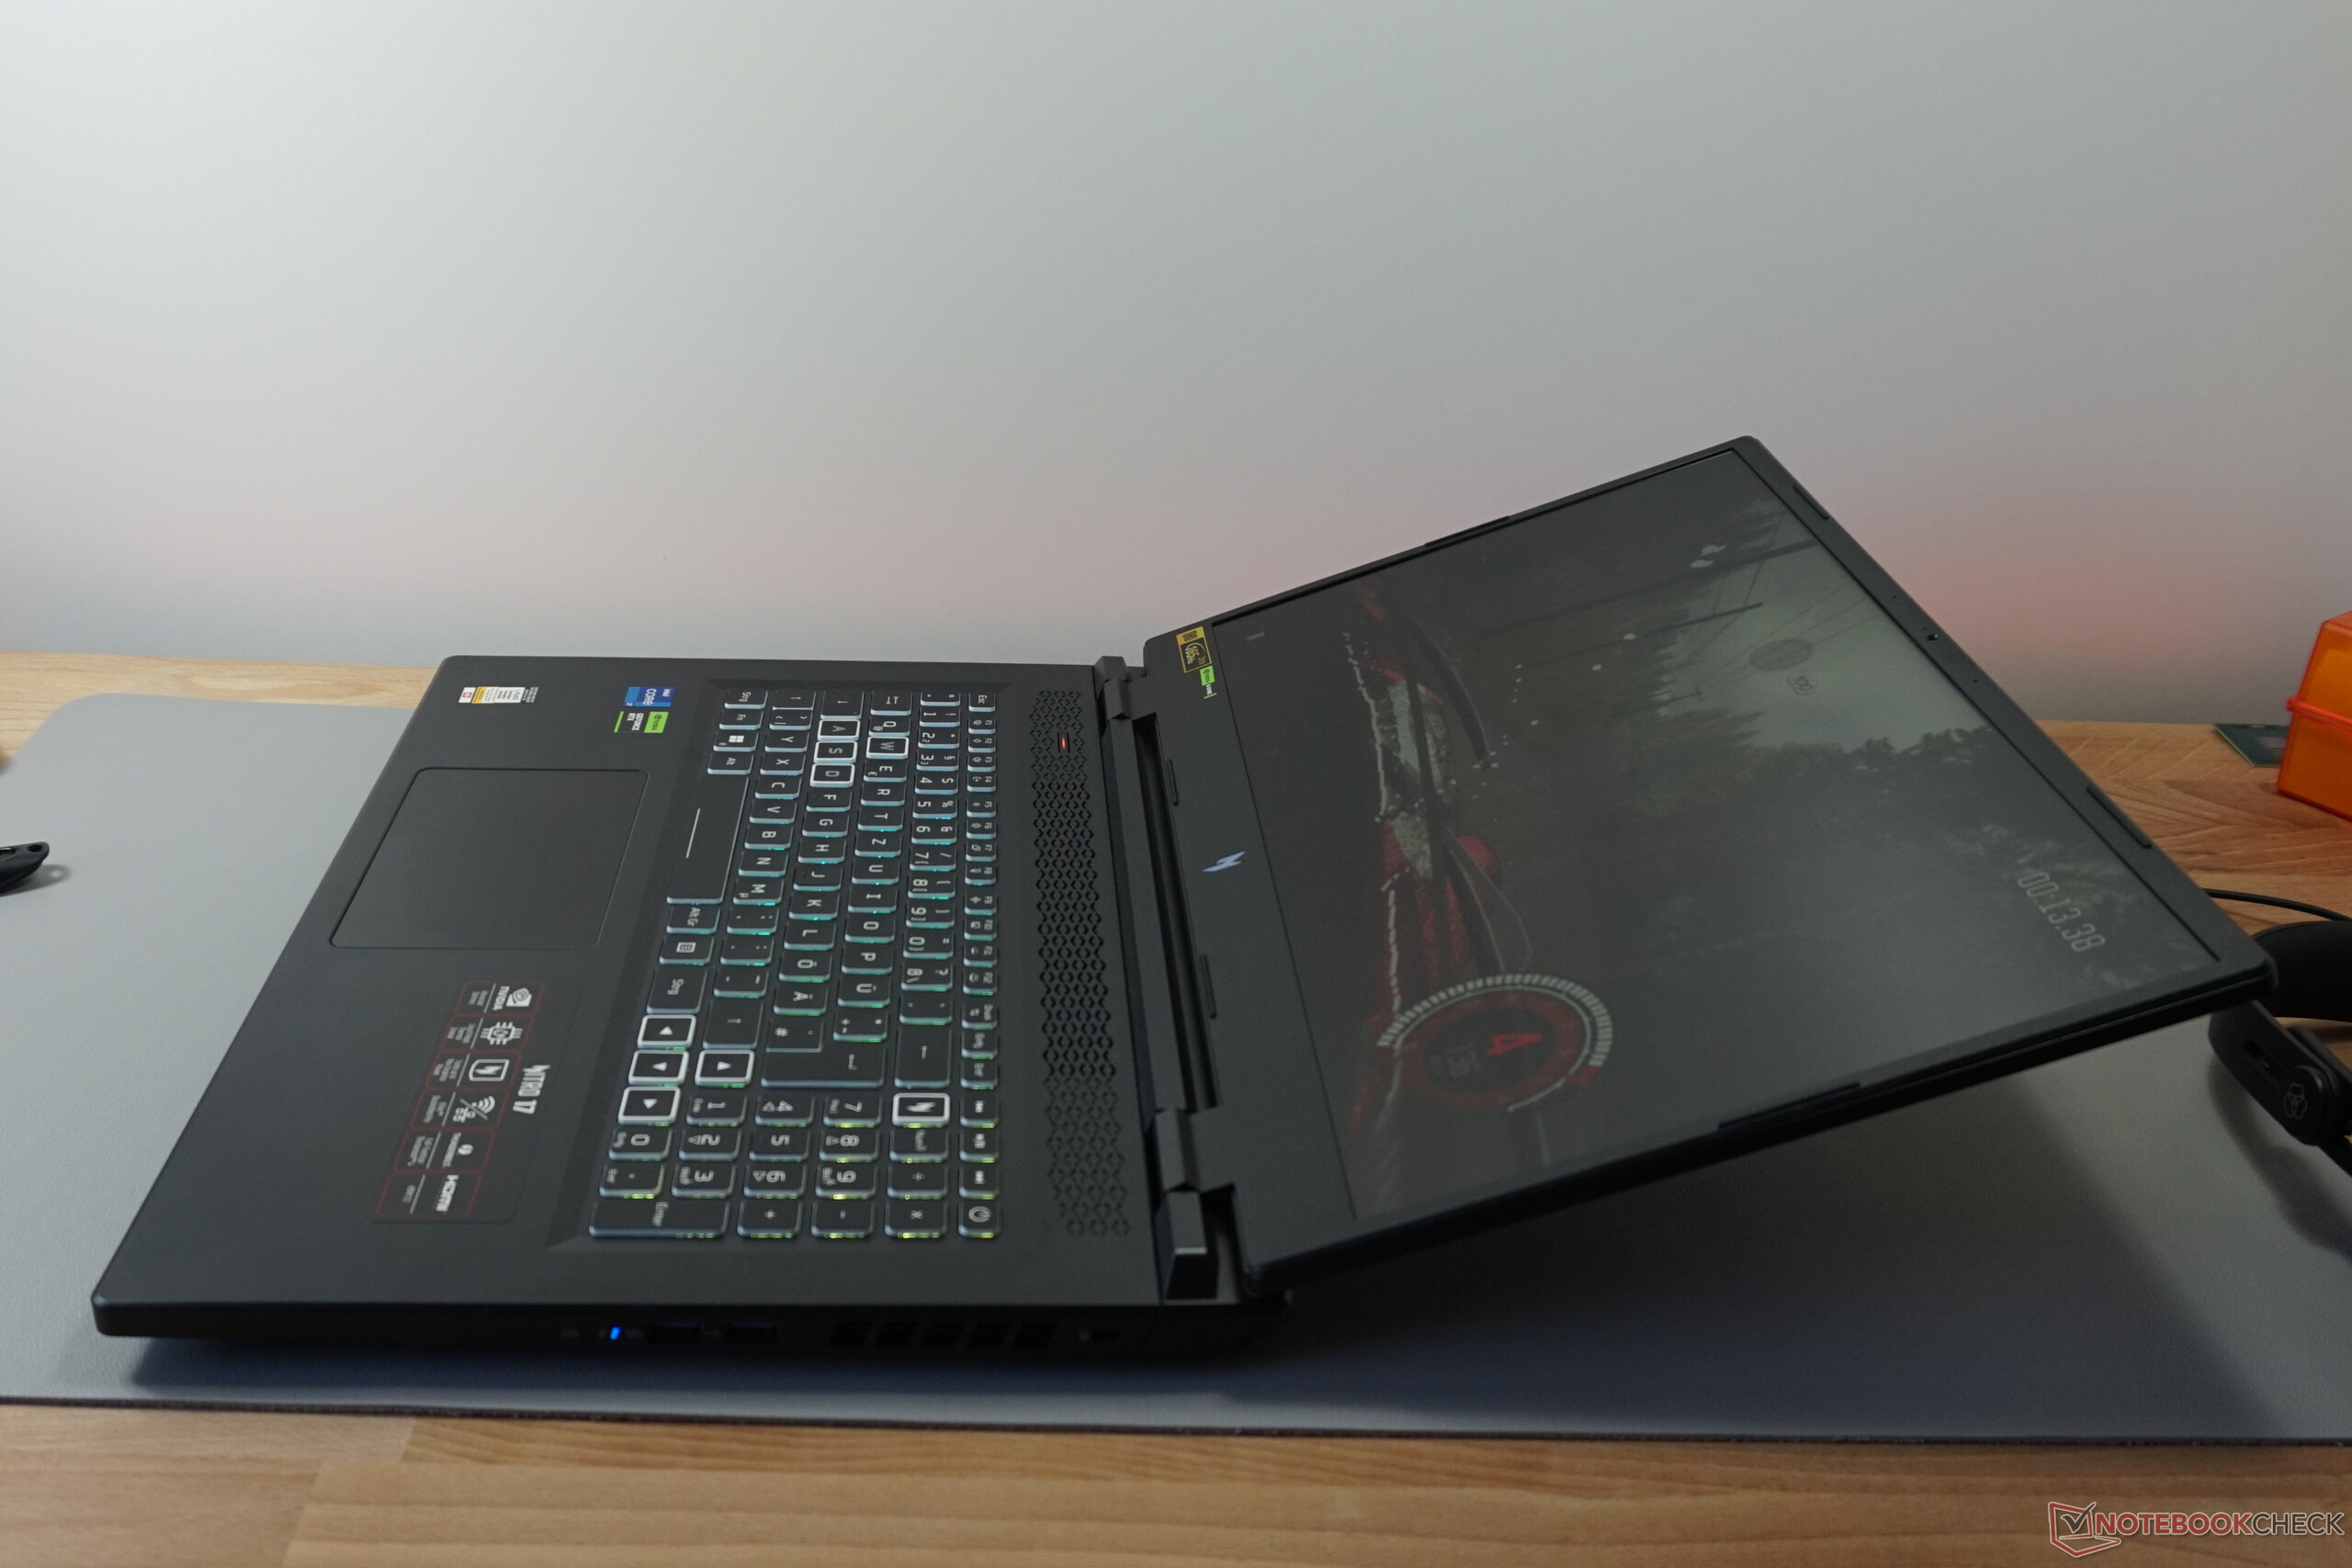
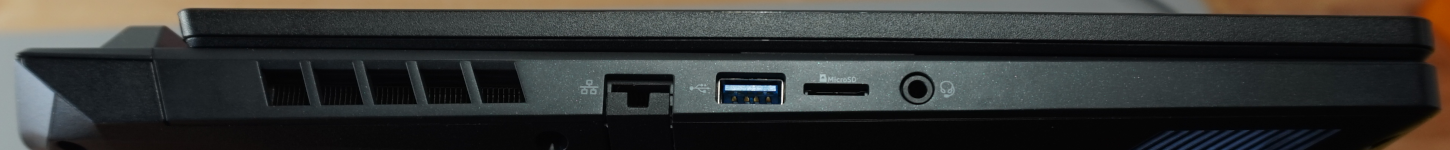
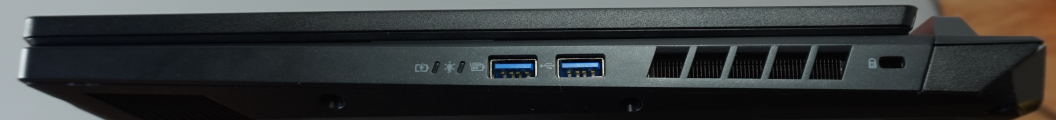
While criticism of its predecessor was justified for not having a card reader or a second USB-C port, the Acer Nitro 17 does everything right. All of the video outputs, including Thunderbolt 4, USB-C with DisplayPort support and HDMI, can be found on the rear of the device. On the left and right of the laptop, we have USB-A ports. Both of the right-hand ports even allow 10 Gbit/s, which is sufficient for, among other things, fast USB sticks and many portable SSDs.
It's a mystery why the card reader is only a microSD variant as there is more than enough space for a bigger one. The LAN port would also like to have managed 2.5 Gbit/s instead of only 1 Gbit/s. For the quality and price, the Acer Nitro 17's selection of ports is absolutely fine. The quantity and performance thereof should fit the task, regardless of the application scenario.

SD card reader

We obtained significantly below-average measurements with the AV PRO microSD 128 GB V60 reference card. The built-in microSD card reader is up to a third slower than the gaming laptop average.
For a 32 GB card that means there is an additional waiting time of more than 2 minutes when reading data.
| SD Card Reader | |
| average JPG Copy Test (av. of 3 runs) | |
| Average of class Gaming (20.9 - 210, n=54, last 2 years) | |
| Medion Erazer Defender P40 (AV PRO microSD 128 GB V60) | |
| Schenker XMG Focus 17 (E23) | |
| Acer Nitro 17 AN17-51-71ER | |
| maximum AS SSD Seq Read Test (1GB) | |
| Average of class Gaming (25.5 - 261, n=51, last 2 years) | |
| Medion Erazer Defender P40 (AV PRO microSD 128 GB V60) | |
| Schenker XMG Focus 17 (E23) | |
| Acer Nitro 17 AN17-51-71ER | |
Communication
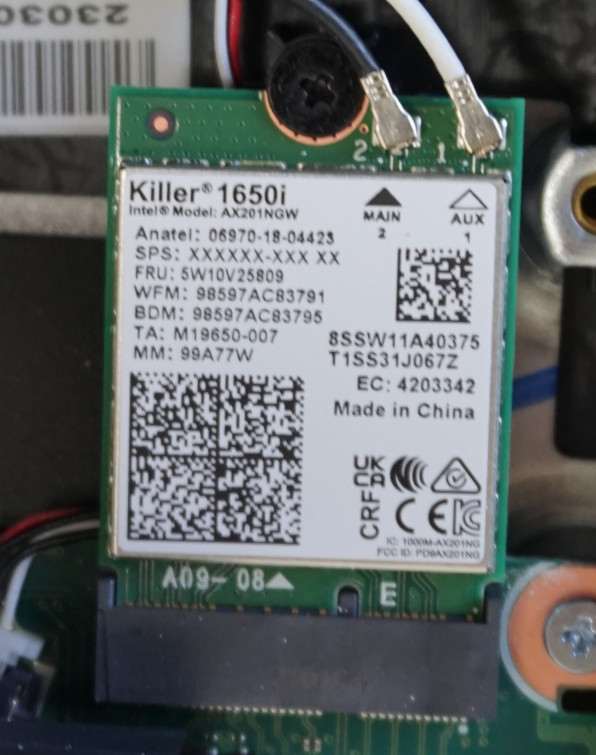
The WLAN module, for which we ascertained the expected results, is without critcism. However, Wi-Fi 6E is not on board, meaning multiple, overlapping networks will result in a considerable reduction in bandwidth.
Webcam
The basic HD camera is sufficient for undemanding video calls although the low resolution is apparent to the receiver. The strong color deviations we measured resulted from the camera's good brightening function. It adapted quickly to changing lighting conditions and delivered good-quality images, even in low light. But, this is by no means really ideal and we would still recommend grabbing an external camera.
Likewise, the microphone does its job satisfactorily. The sound is recorded at a consistent volume and can be easily heard both from varying distances and in multiple directions of speech. However, when adjusting the volume, it's difficult to ignore the tinny undertone and slight distortions.


Maintenance
Eleven, easily accessible crosshead screws have to be removed, allowing the base plate to be prised off with little resistance. The best place to start seems to be the rear connecting console since there are very few plastic clips which additionally secure the base. No additional tools are necessary.
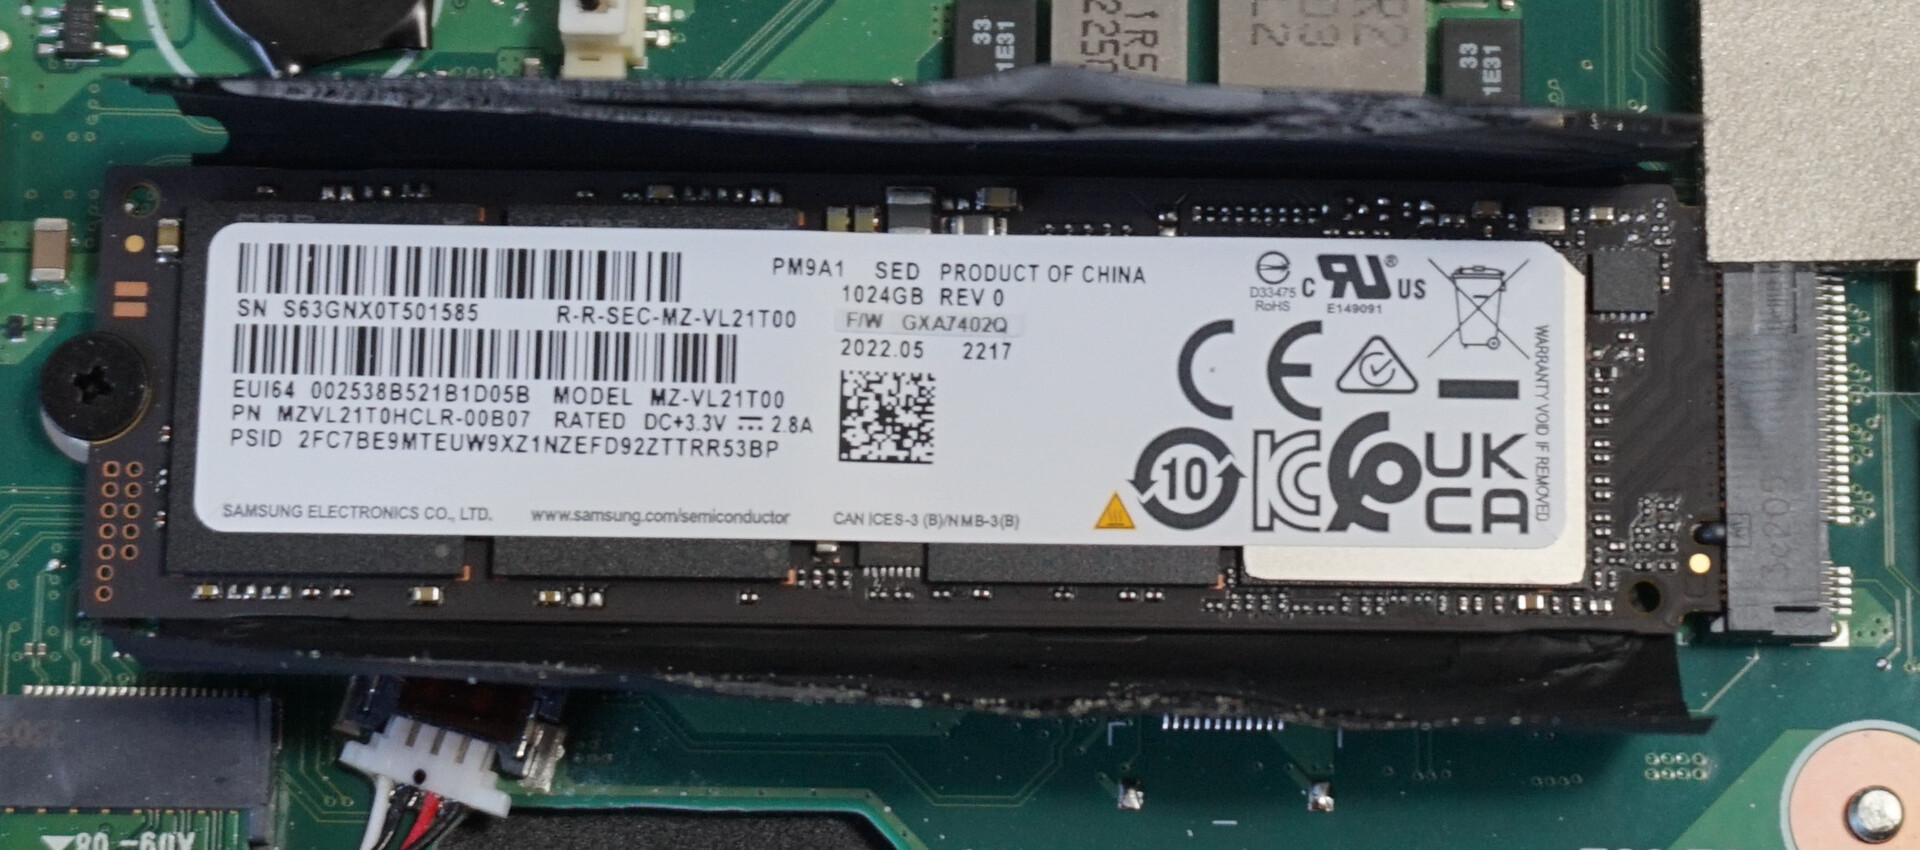
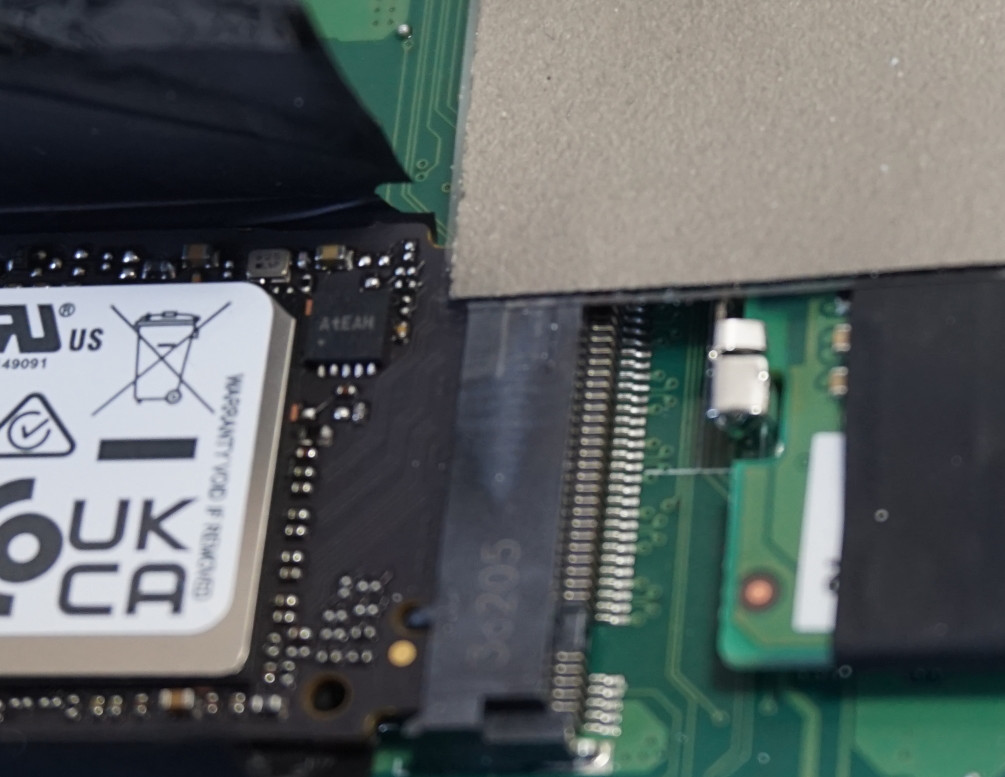
The internals are quite roomy which is not surprising considering the space on offer. There is a slot for an additional M.2 NVMe SSD. WLAN, the first SSD and RAM are just as easily accessed as the battery and can also be swapped relatively effortlessly.
What is noticeable compared to the predecessor is the lack of additional heat sinks over the SSD slot. On top of that, the RAM's cooling pad in our review device is glued over the mass storage connector. This influenced our stress test and can be seen below. By contrast, the gaming benchmarks remain largely unaffected by this.

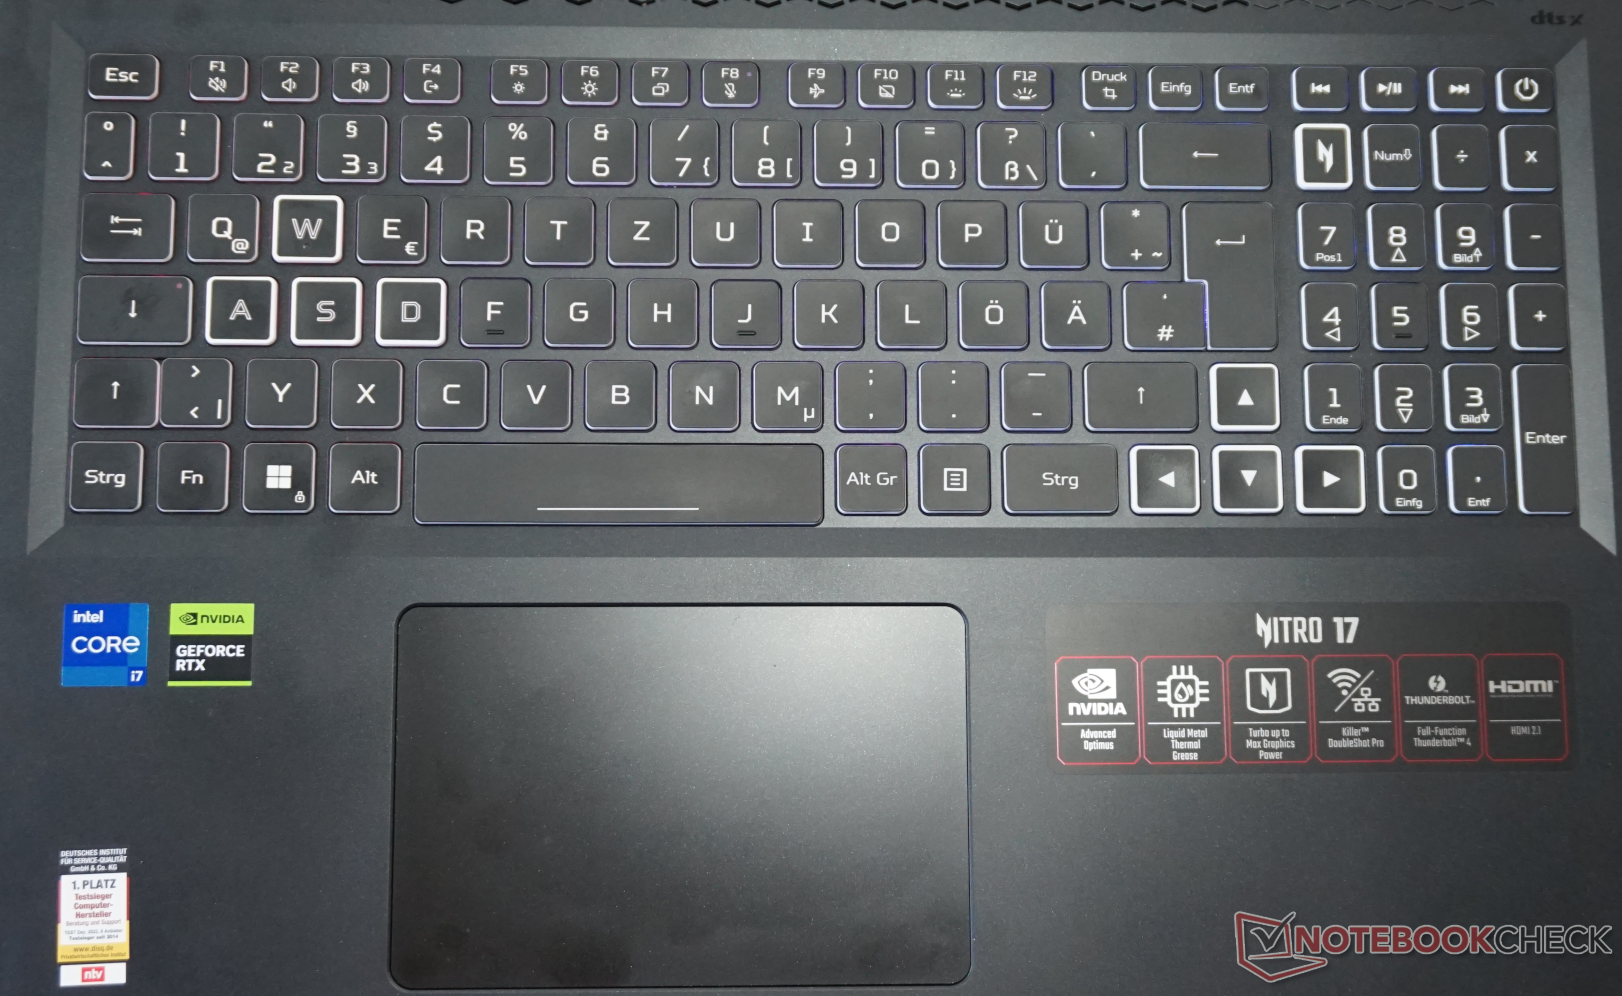
Input devices - Made for a gaming laptop
The typically flat-format, rubber dome keyboard made the kind of very positive impression you would associate with such an input device. The key travel of 1.4 mm (our measurement) ensures a pleasant typing experience but the resistance could be a bit firmer. Since the keyboard frame only flexes minimally when energetic typing pressure is applied, sustained typing sessions are not a problem.
The key's white sides are visually striking and their high contrast really makes them stand out. Furthermore, the "WASD" keys, arrow keys and the special key for the NitroSense software have additional highlighting. The key lighting is even but the customisation options are limited to four zones and a few effects. A wide range of colors makes these look pretty good.
Conversely, the touchpad is a disappointment. At almost 8 x 12 cm, it is well-proportioned but its accuracy as well as the pressure points of the hidden keys in the bottom area are less than impressive. In addition, we noticed a slight clattering sound when placing and lifting our fingers. Therefore, we definitely recommend using a separate mouse.

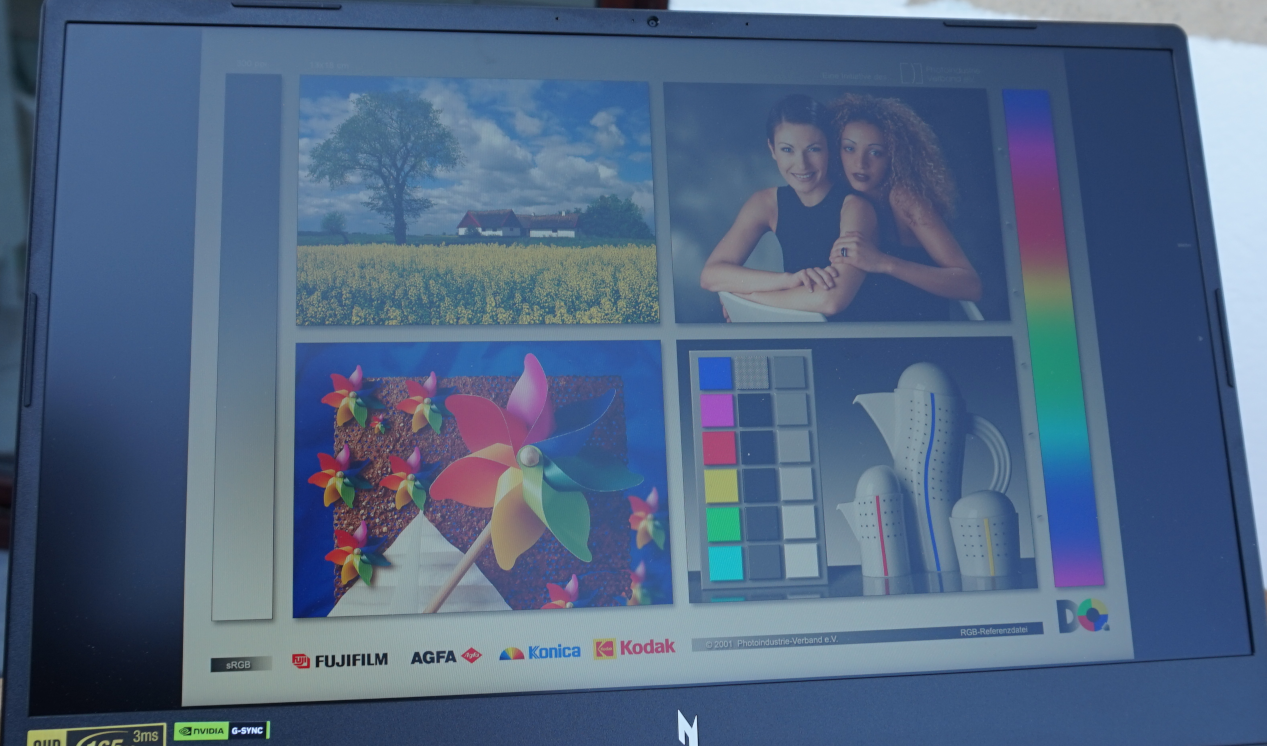
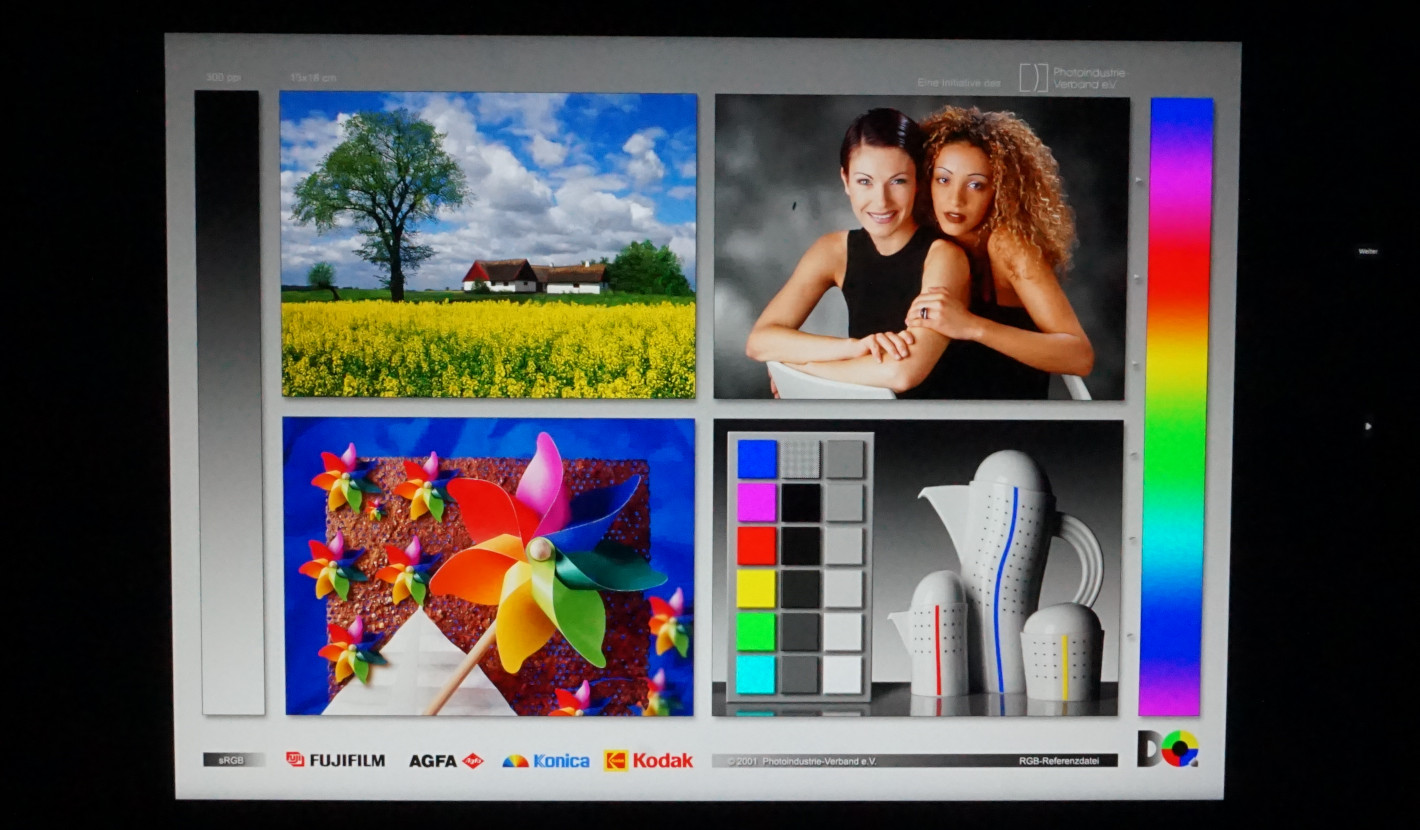
Display - All in all, just the ticket for gaming

The Nitro 17's IPS panel can no longer be said to possess the latent weaknesses seen in the previous generation model. A great deal of effort is required to be able to make out individual pixels on the QHD resolution, 17.3-inch display. Normal work can also be done on the device without having to increase the size of either text or symbols.
The 165 Hz frame rate is also pretty perfect for gaming. Response times are also very decent. In addition, the screen displays strong, vibrant colors which are accurately reproduced even without the need for calibration. At 360 cd/m², the brightness is also more than sufficient for desktop use.
However, the contrast could be better and looks poor due to a black level value of only 600:1. This is especially noticeable in a completely dark room. A black background is always slightly illuminated and visible screen bleeding is present on the top right of the display.
Of course, it is possible to find displays with more colors, more frames per second, and higher pixel density but, for a mid-range gaming laptop, the image values are very coherent.
| |||||||||||||||||||||||||
Brightness Distribution: 87 %
Center on Battery: 360 cd/m²
Contrast: 602:1 (Black: 0.6 cd/m²)
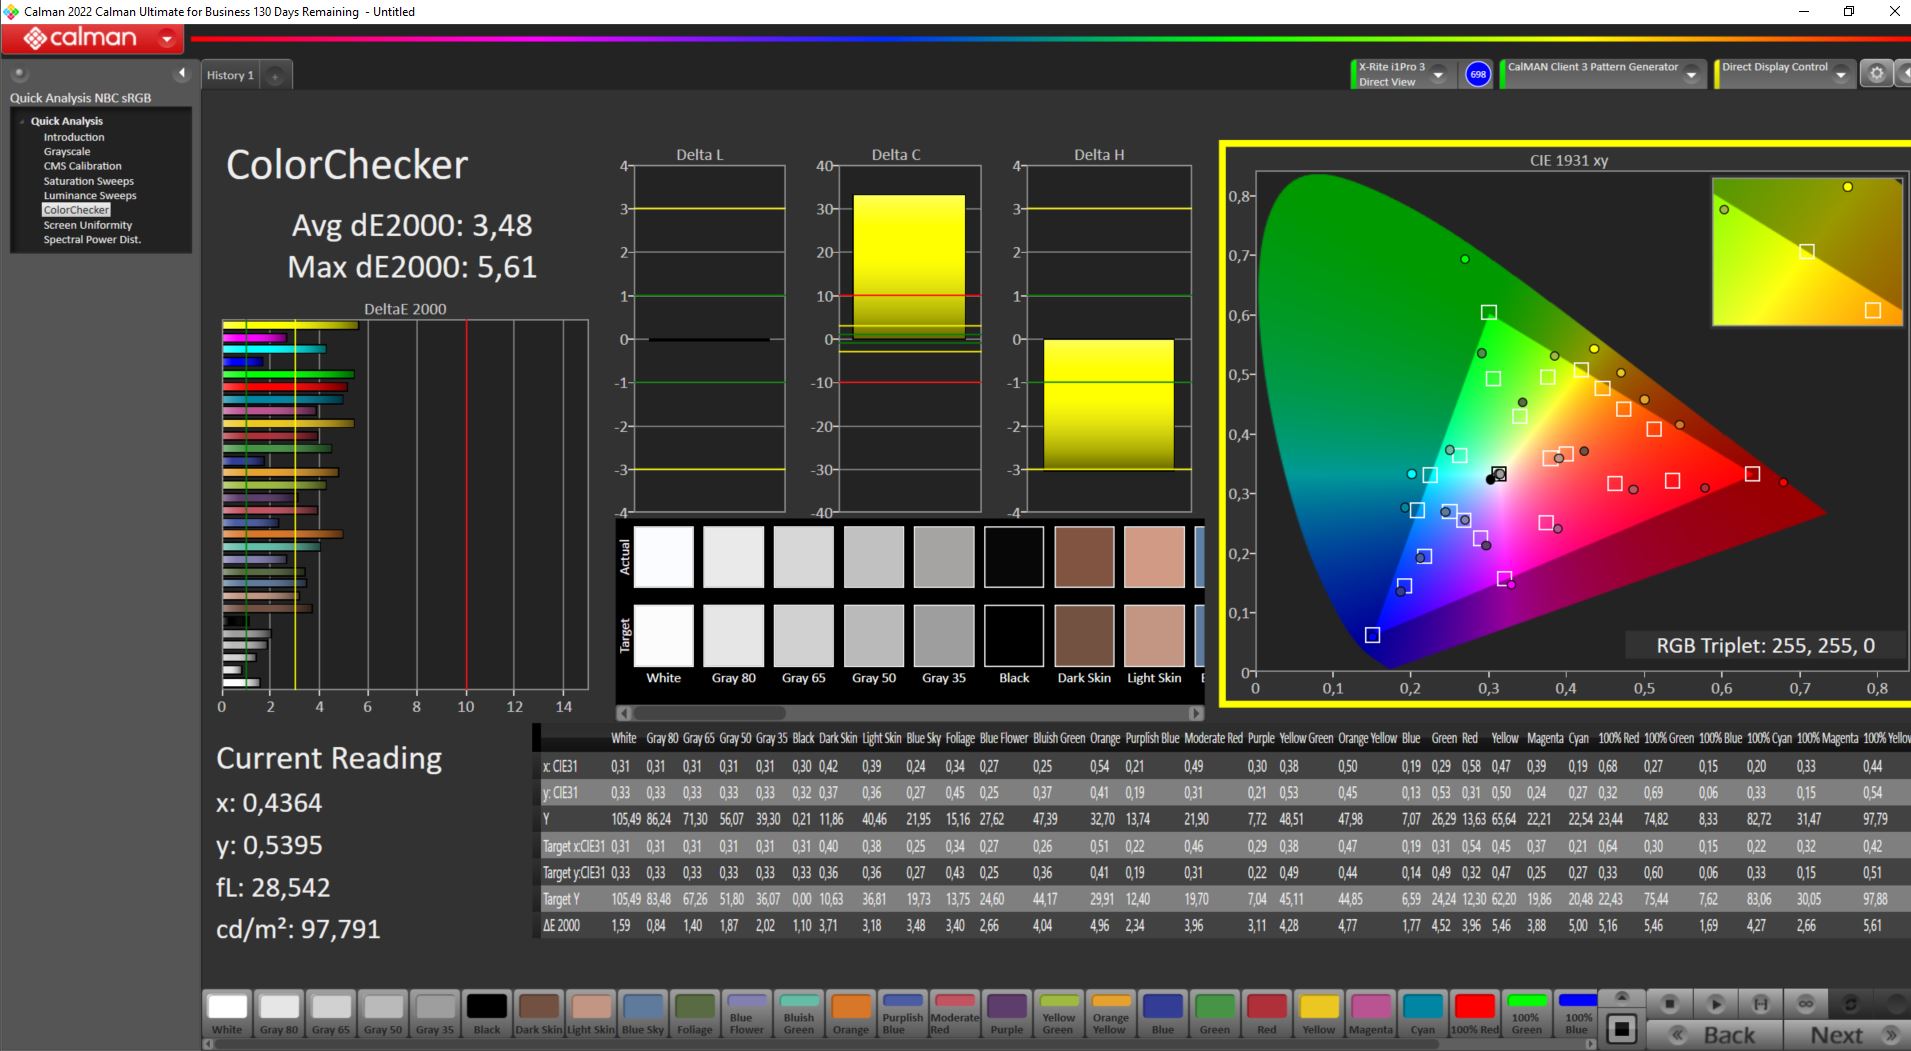
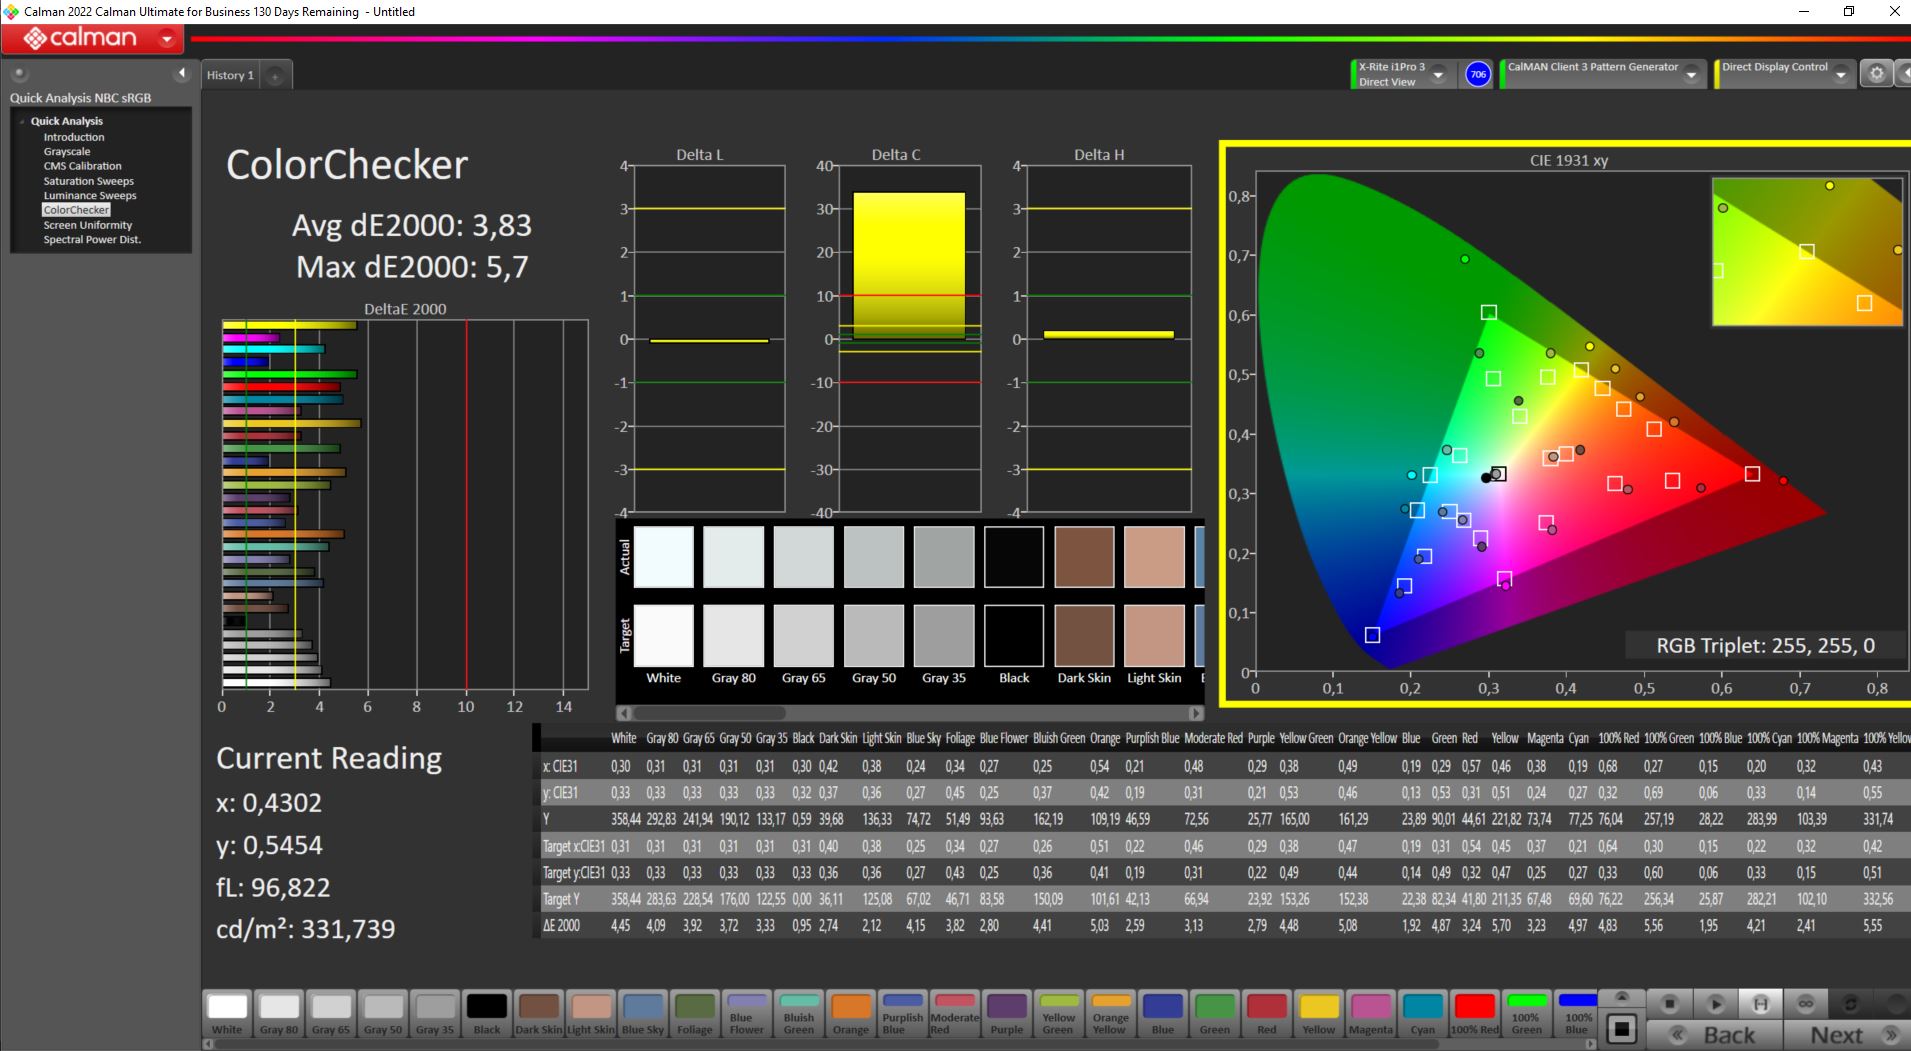
ΔE ColorChecker Calman: 3.83 | ∀{0.5-29.43 Ø4.72}
calibrated: 3.48
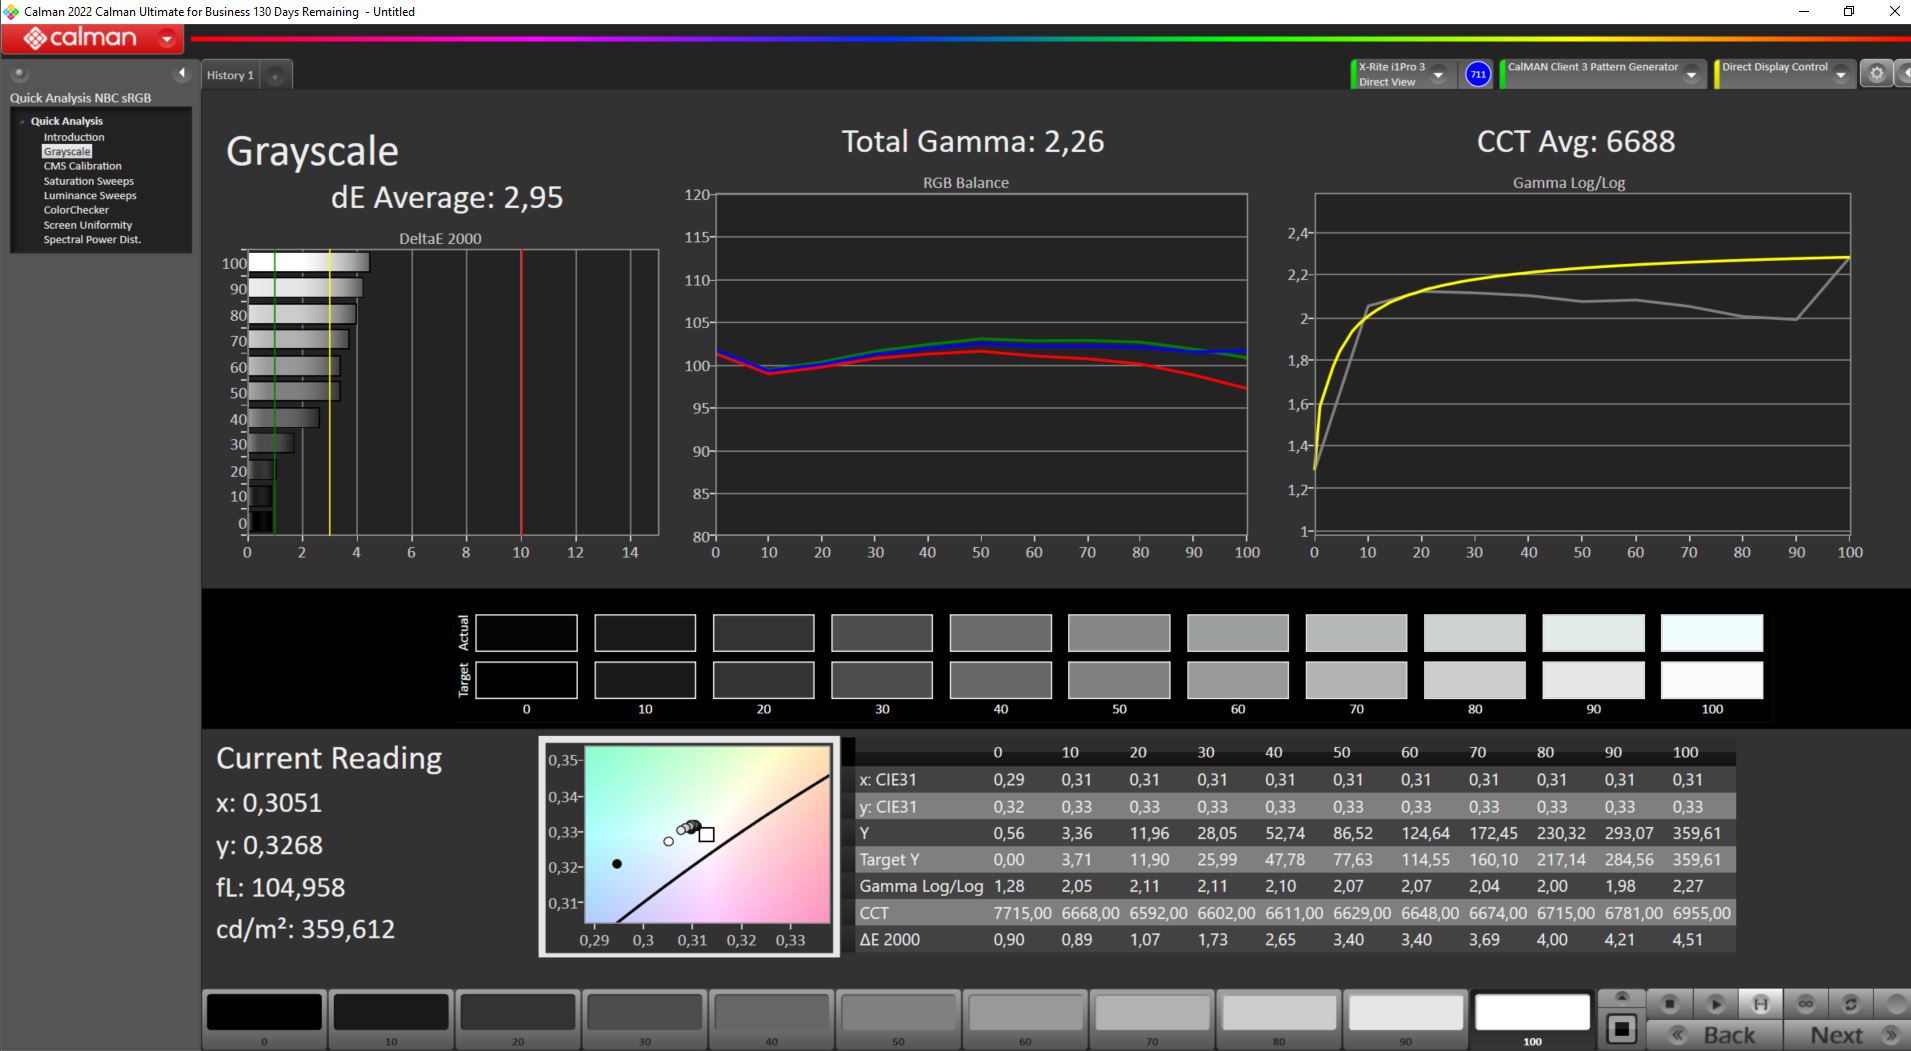
ΔE Greyscale Calman: 3.29 | ∀{0.09-98 Ø4.97}
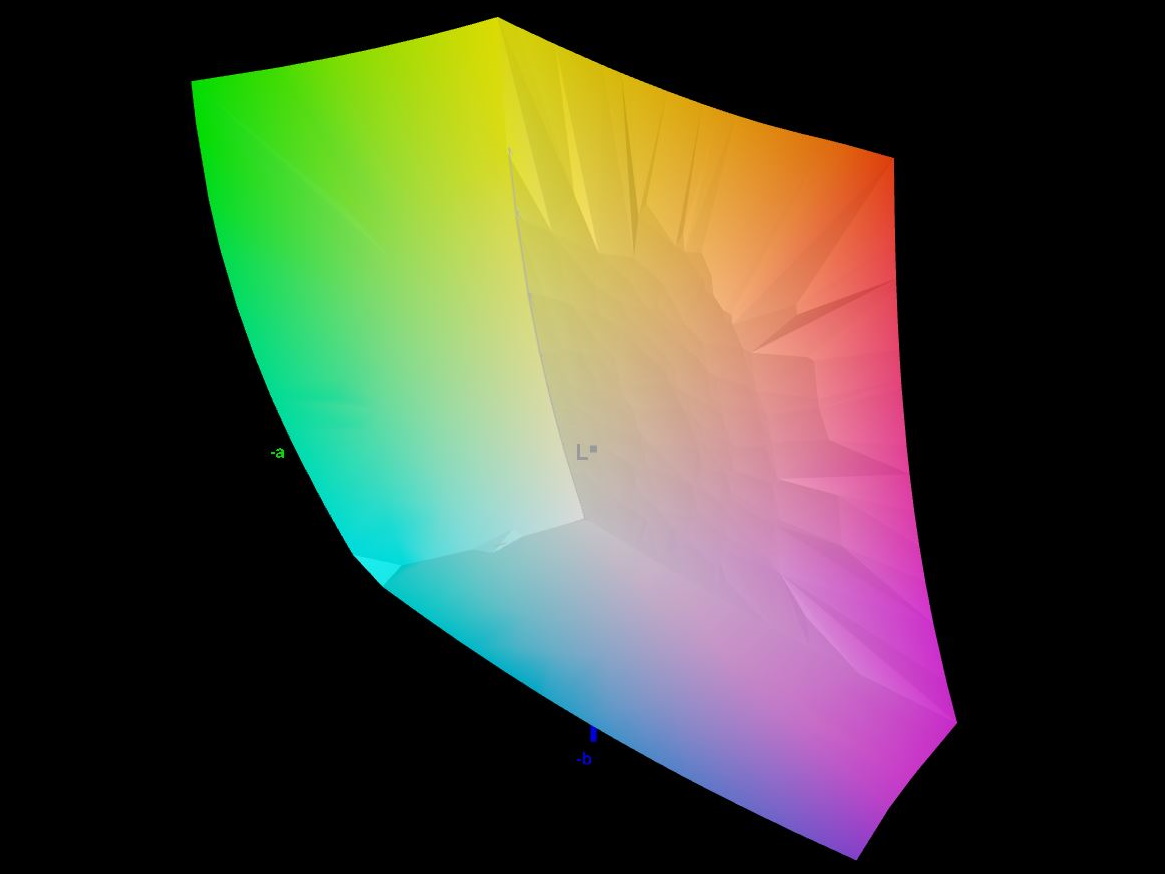
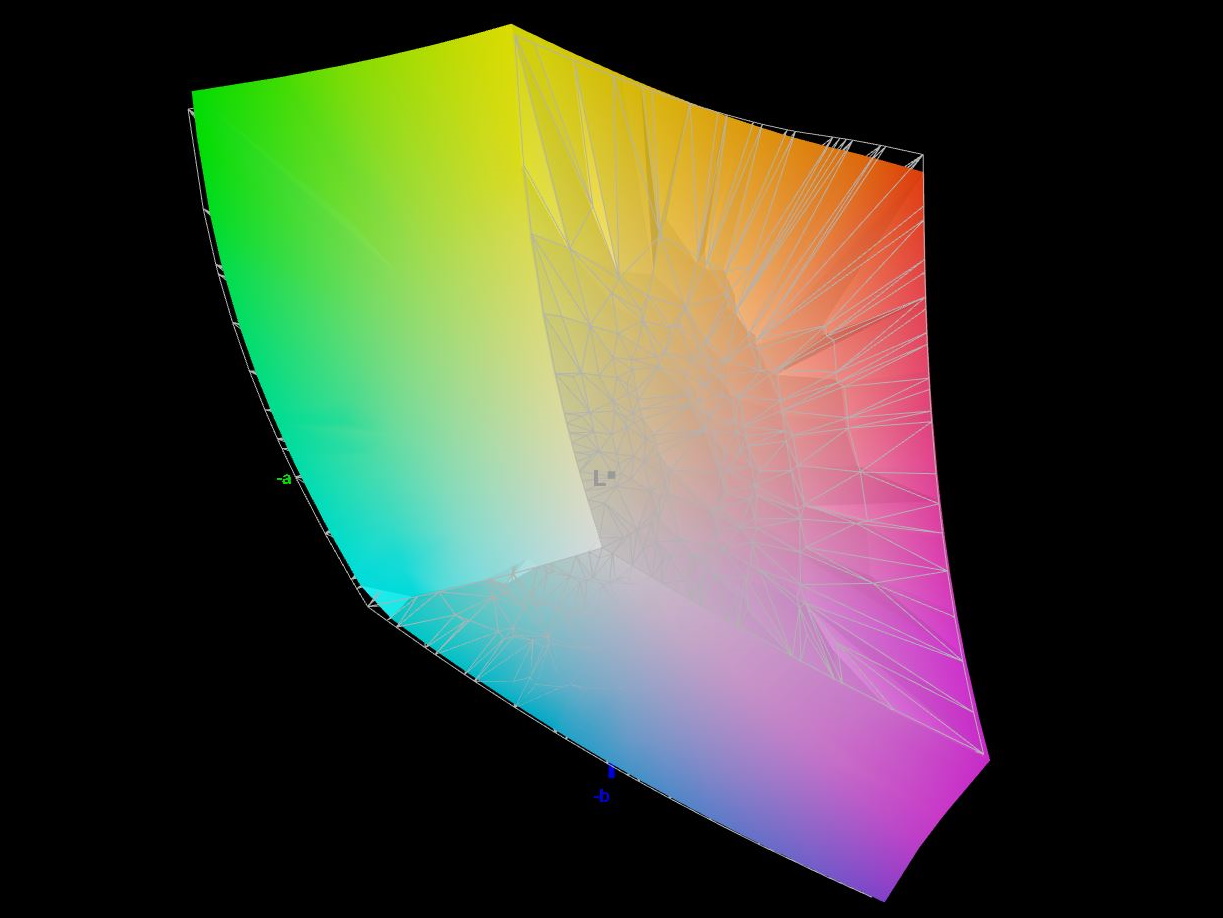
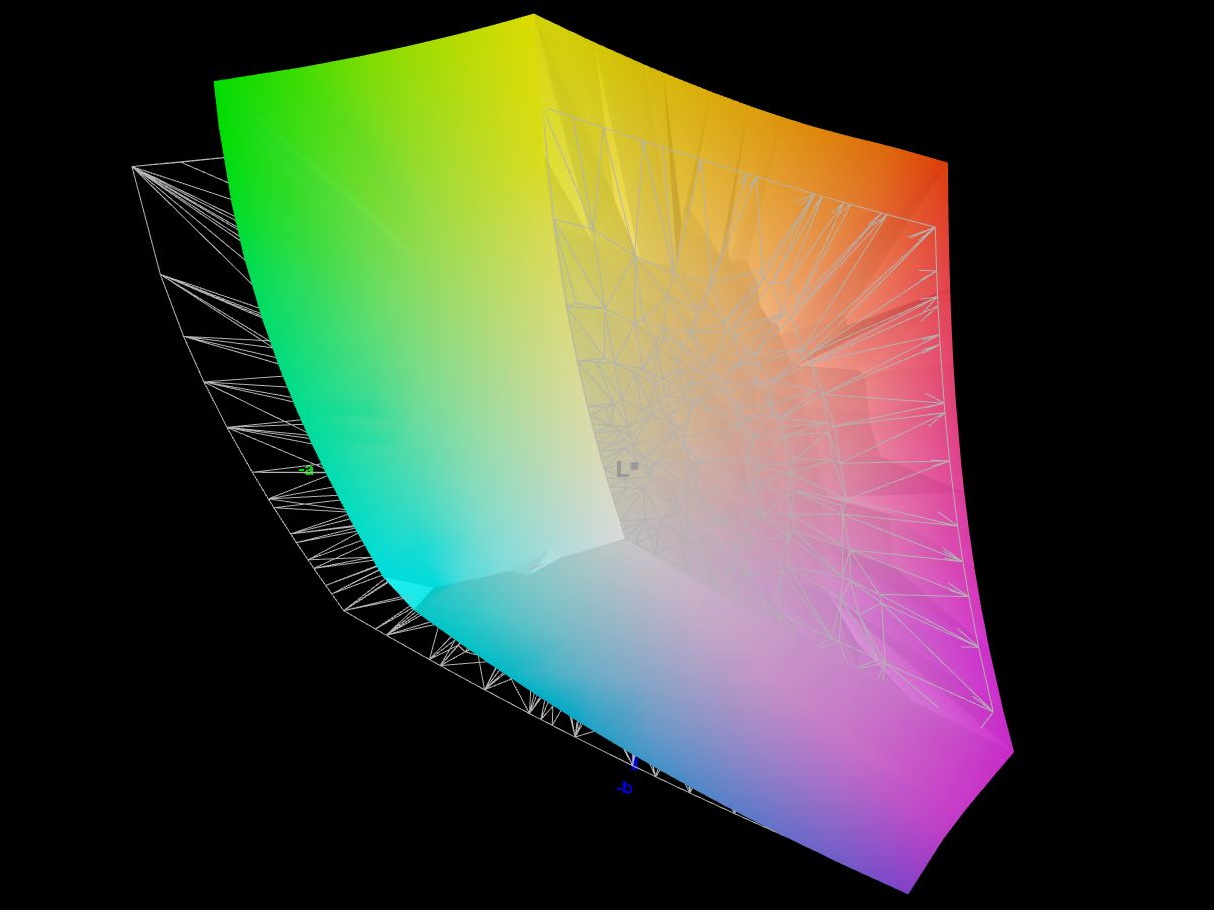
85.7% AdobeRGB 1998 (Argyll 3D)
100% sRGB (Argyll 3D)
98.3% Display P3 (Argyll 3D)
Gamma: 2.29
CCT: 6679 K
| Acer Nitro 17 AN17-51-71ER BOE0B7C NE173QHM-NY6, , 2560x1440, 17.3" | Lenovo Legion Pro 5 16IRX8 AU Optronics B160QAN03.1, IPS, 2560x1600, 16" | Asus TUF Gaming A16 FA617XS BOE NE160WUM-NX2, IPS, 1920x1200, 16" | Schenker XMG Focus 17 (E23) BOE09F9 NE173QHM-NZ1, IPS, 2560x1440, 17.3" | Medion Erazer Defender P40 BOE CQ NE173QHM-NZ3, IPS, 2560x1440, 17.3" | Acer Nitro 5 AN515-46-R1A1 AU Optronics B156HAN12.H, IPS, 1920x1080, 15.6" | MSI Pulse GL76 12UGK Sharp LQ173M1JW08, IPS, 1920x1080, 17.3" | |
|---|---|---|---|---|---|---|---|
| Display | -14% | -17% | -1% | -17% | -17% | -14% | |
| Display P3 Coverage (%) | 98.3 | 71.2 -28% | 69.3 -30% | 96.6 -2% | 68.3 -31% | 68.8 -30% | 71.9 -27% |
| sRGB Coverage (%) | 100 | 98.8 -1% | 97.3 -3% | 99.9 0% | 98.1 -2% | 98.1 -2% | 99.9 0% |
| AdobeRGB 1998 Coverage (%) | 85.7 | 73.3 -14% | 70.7 -18% | 84.5 -1% | 69.8 -19% | 69.7 -19% | 73.7 -14% |
| Response Times | -14% | -15% | -23% | -4% | 6% | 15% | |
| Response Time Grey 50% / Grey 80% * (ms) | 14.8 ? | 14.5 ? 2% | 15.6 ? -5% | 16.4 ? -11% | 14.6 ? 1% | 13 ? 12% | 4.6 ? 69% |
| Response Time Black / White * (ms) | 8 ? | 10.4 ? -30% | 10 ? -25% | 10.8 ? -35% | 8.7 ? -9% | 8 ? -0% | 11.2 ? -40% |
| PWM Frequency (Hz) | |||||||
| Screen | 41% | 41% | 28% | 45% | 19% | 4% | |
| Brightness middle (cd/m²) | 361 | 405.7 12% | 301 -17% | 349 -3% | 364 1% | 327 -9% | 337.7 -6% |
| Brightness (cd/m²) | 326 | 368 13% | 294 -10% | 318 -2% | 343 5% | 320 -2% | 331 2% |
| Brightness Distribution (%) | 87 | 87 0% | 94 8% | 82 -6% | 86 -1% | 93 7% | 82 -6% |
| Black Level * (cd/m²) | 0.6 | 0.38 37% | 0.21 65% | 0.56 7% | 0.28 53% | 0.24 60% | 0.31 48% |
| Contrast (:1) | 602 | 1068 77% | 1433 138% | 623 3% | 1300 116% | 1363 126% | 1089 81% |
| Colorchecker dE 2000 * | 3.83 | 1.65 57% | 1.79 53% | 1.08 72% | 1.67 56% | 3.26 15% | 4.12 -8% |
| Colorchecker dE 2000 max. * | 5.71 | 4.2 26% | 3.48 39% | 3.05 47% | 2.78 51% | 8.73 -53% | 8.89 -56% |
| Colorchecker dE 2000 calibrated * | 3.48 | 0.53 85% | 1.2 66% | 1.08 69% | 1.14 67% | 0.87 75% | 0.98 72% |
| Greyscale dE 2000 * | 3.29 | 1.2 64% | 2.5 24% | 1.14 65% | 1.4 57% | 4.87 -48% | 6.3 -91% |
| Gamma | 2.29 96% | 2.3 96% | 2.265 97% | 2.41 91% | 2.091 105% | 2.3 96% | 2.48 89% |
| CCT | 6679 97% | 6453 101% | 6157 106% | 6687 97% | 6568 99% | 7070 92% | 6542 99% |
| Total Average (Program / Settings) | 4% /
21% | 3% /
20% | 1% /
15% | 8% /
25% | 3% /
9% | 2% /
2% |
* ... smaller is better
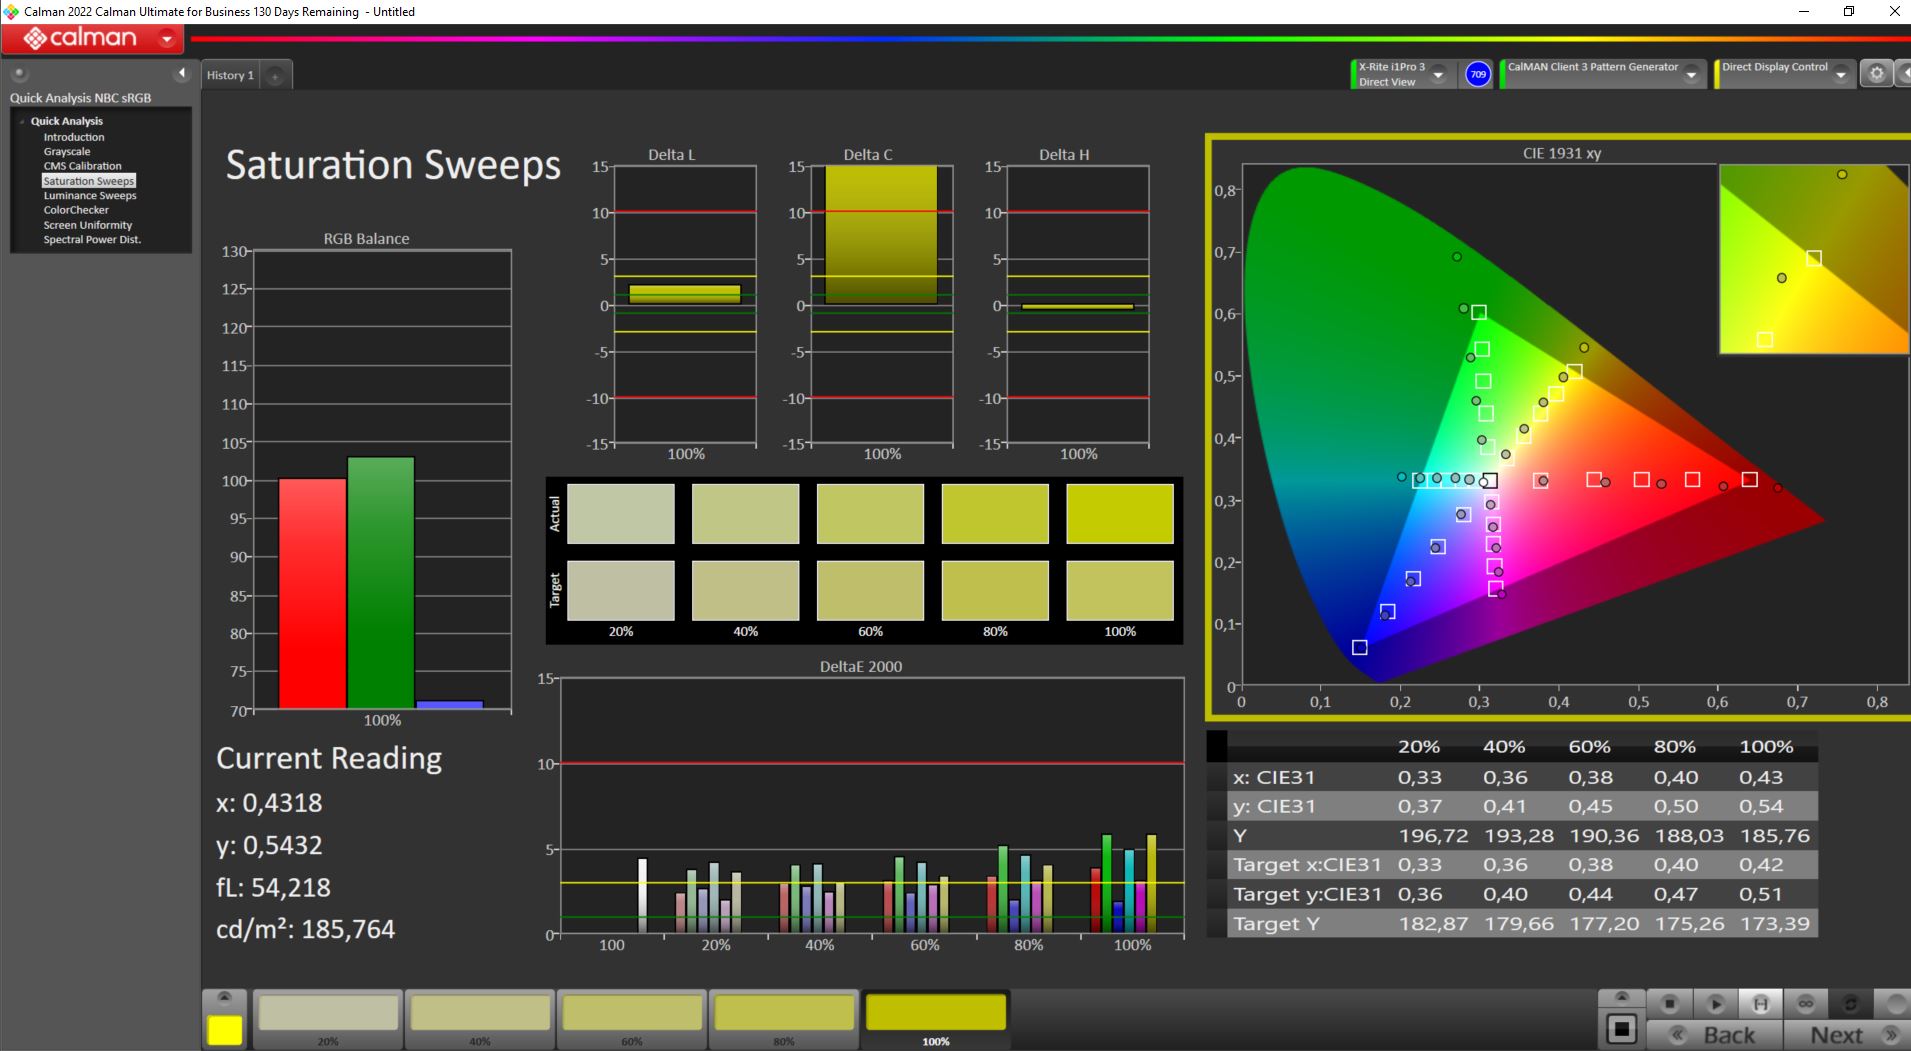
In terms of color reproduction, the Acer Nitro 17 does an excellent job. The sRGB color space - which is important for gaming - is covered completely. Even DCI P3, which is used in film production, is almost completely reproduced.
In comparison to similar gaming-focused laptops, these are excellent results.
After reducing the brightness to 50 %, the 0.21 black level (instead of 0.59), is much better. In doing so, the contrast also increases to almost 900:1. Especially in the evening, when full brightness is normally not a must, the image reproduction improves accordingly. Even the color deviation DeltaE of 3.5 is lower than at full brightness.
We measured a DelatE deviation of 3.8 from the desired color reproduction. A calibration didn't lead to further improvements. Although well-trained eyes can make out discrepancies, especially when it comes to yellow and orange tones, there is nothing wrong with the color reproduction.
As long as the user doesn't intend to the device for professional photo or video editing, the display reproduces colors very naturally.


Display Response Times
| ↔ Response Time Black to White | ||
|---|---|---|
| 8 ms ... rise ↗ and fall ↘ combined | ↗ 3.4 ms rise | 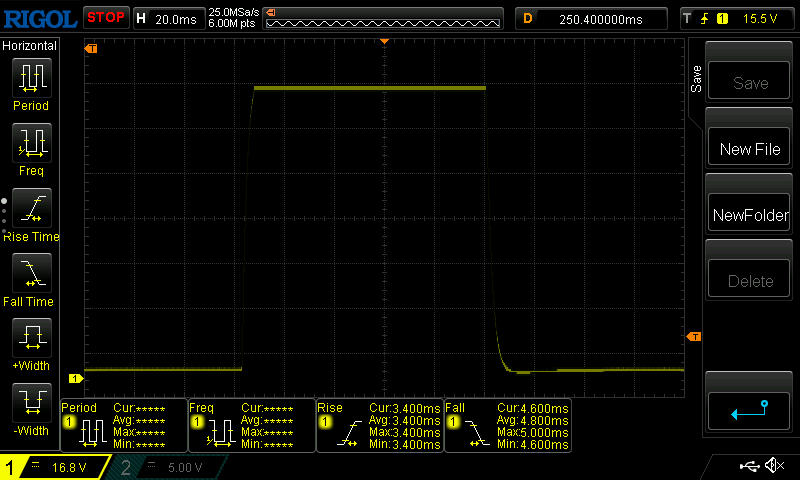 |
| ↘ 4.6 ms fall | ||
| The screen shows fast response rates in our tests and should be suited for gaming. In comparison, all tested devices range from 0.1 (minimum) to 240 (maximum) ms. » 22 % of all devices are better. This means that the measured response time is better than the average of all tested devices (19.8 ms). | ||
| ↔ Response Time 50% Grey to 80% Grey | ||
| 14.8 ms ... rise ↗ and fall ↘ combined | ↗ 7 ms rise | 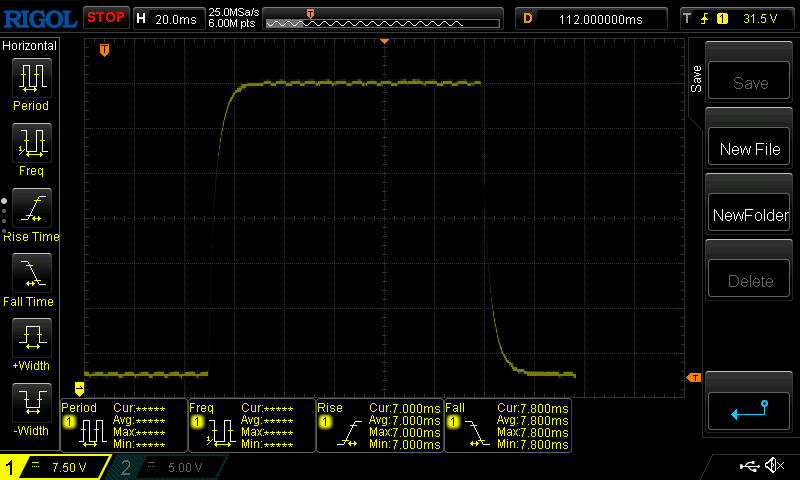 |
| ↘ 7.8 ms fall | ||
| The screen shows good response rates in our tests, but may be too slow for competitive gamers. In comparison, all tested devices range from 0.165 (minimum) to 636 (maximum) ms. » 29 % of all devices are better. This means that the measured response time is better than the average of all tested devices (31 ms). | ||
Screen Flickering / PWM (Pulse-Width Modulation)
| Screen flickering / PWM not detected |  | ||
In comparison: 52 % of all tested devices do not use PWM to dim the display. If PWM was detected, an average of 7747 (minimum: 5 - maximum: 343500) Hz was measured. | |||
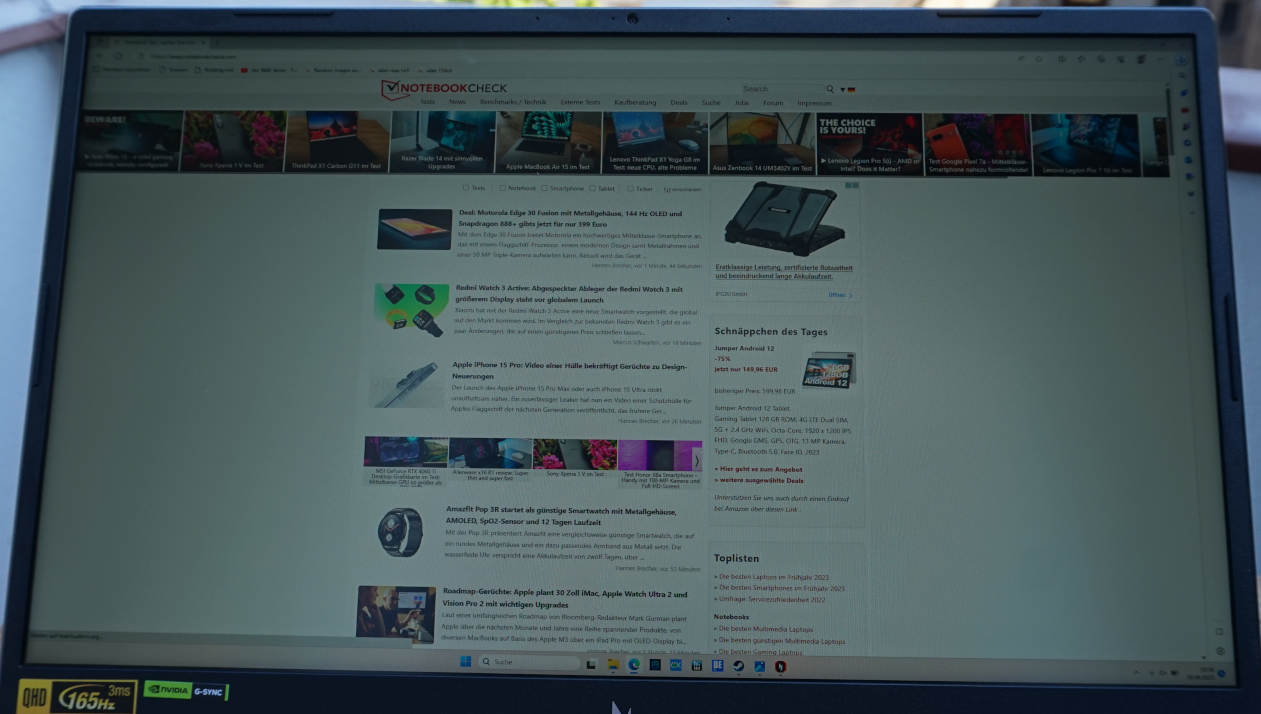
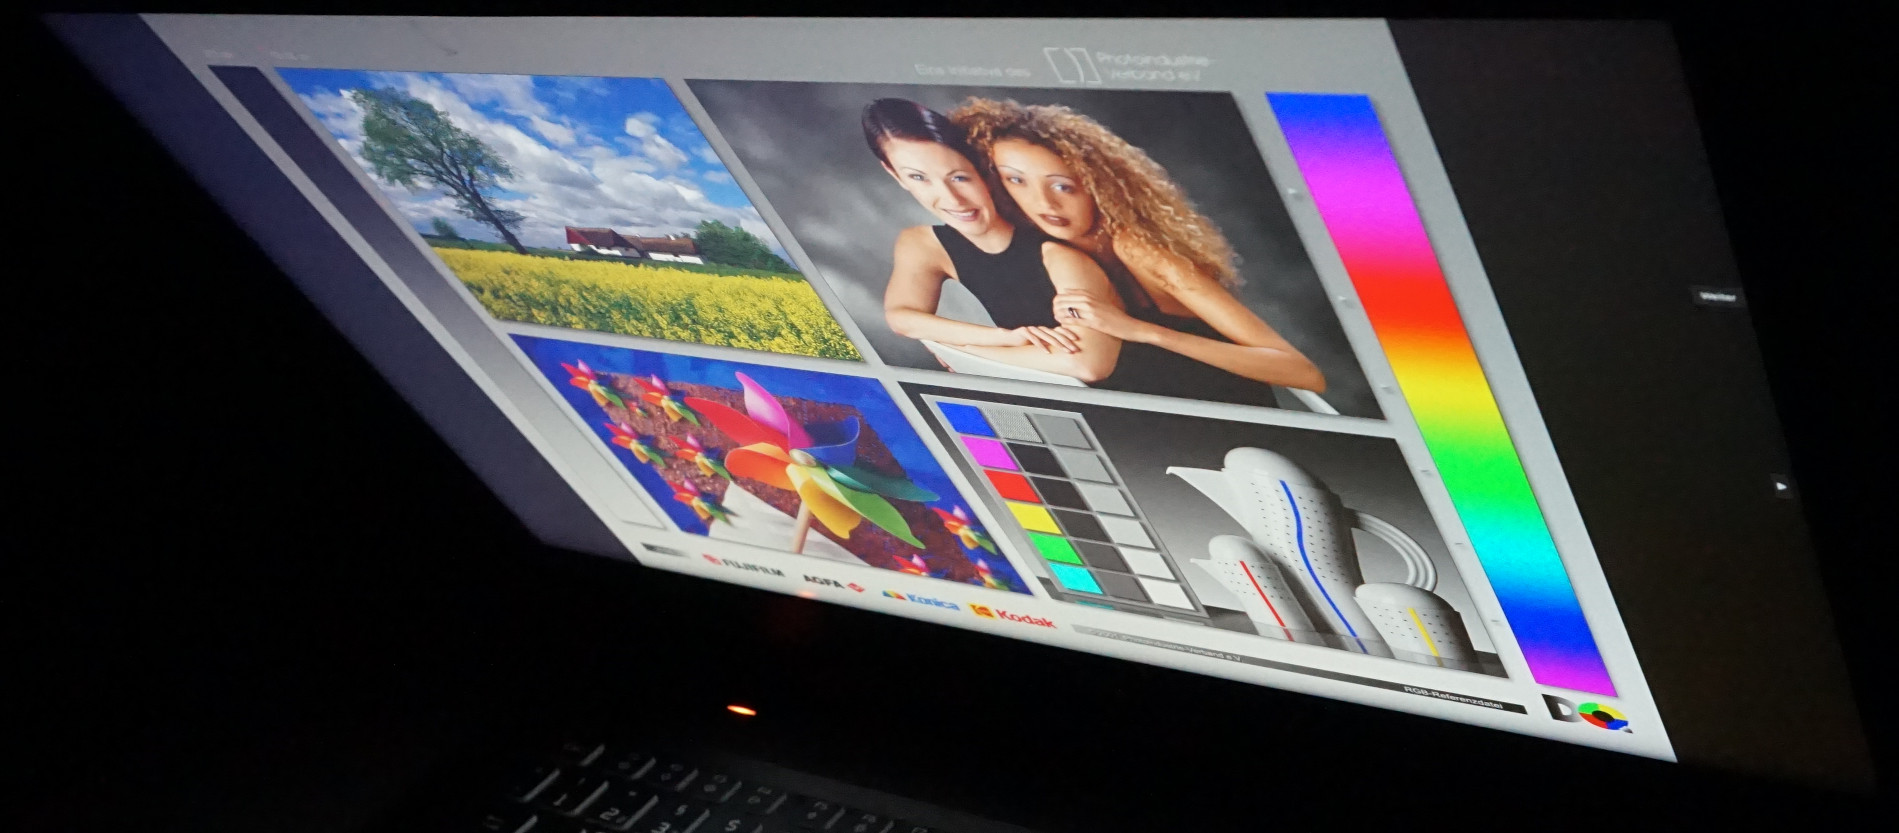
Outdoors, on a balcony or in a shaded area in the garden, text and even photos are legible. Of course, the colors don't appear, as desired. As expected, not much can be seen in sunlight, but text is legible - just.
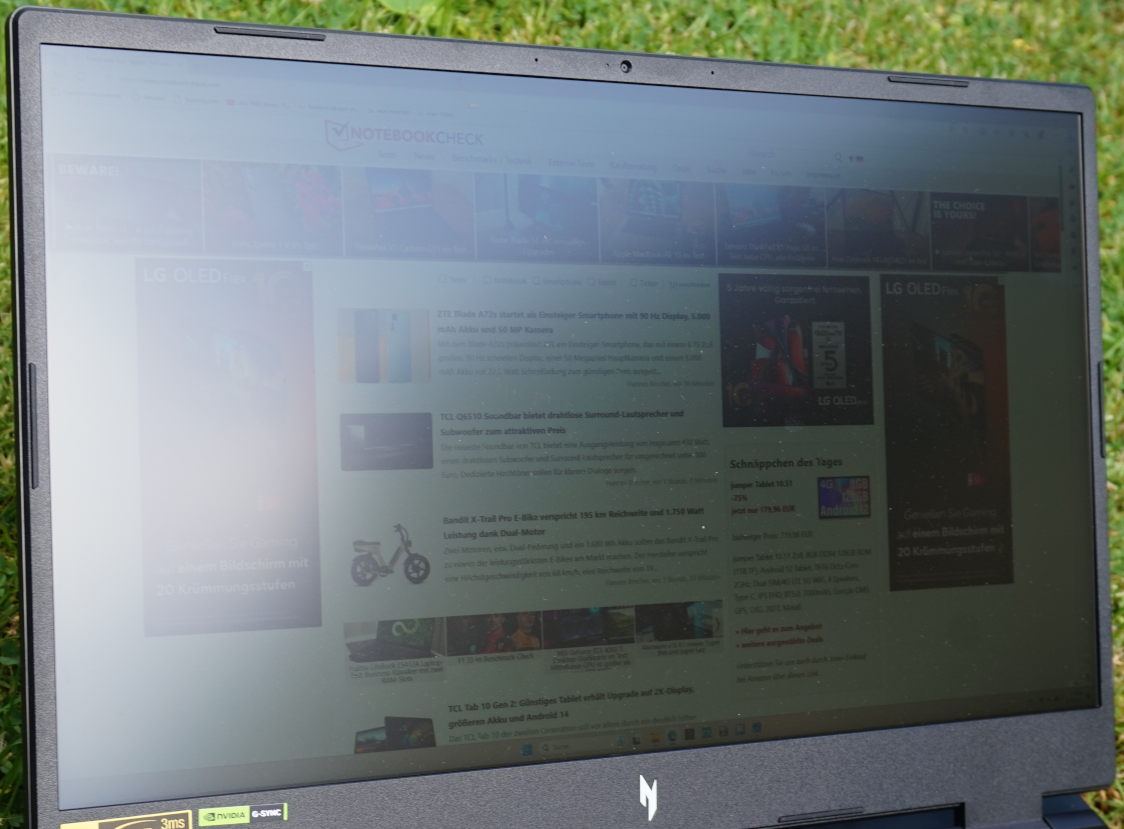
Even from an acute angle, no color deviations can be seen. A slight gray haze covers the image from an angle of around 45°.

Performance - The Nitro 17 sits in the middle of the gaming pack
With the 13th generation of the Intel Core i7 (Raptor Lake) and the Nvidia GeForce RTX 4060, most current games are playable at the display's native QHD resolution, but with a few limitations here and there. As long as your demands are not set too high, the gaming laptop will provide great entertainment for quite some time.
In addition to our review candidate, there are currently a few other variants of the Nitro 17 available that come with either the Intel Core i5-13500H or the i7-13700H as well as the RTX 4050 or an RTX 4060. Current titles should easily be playable with the lowest spec model, albeit at Full HD.
Test conditions
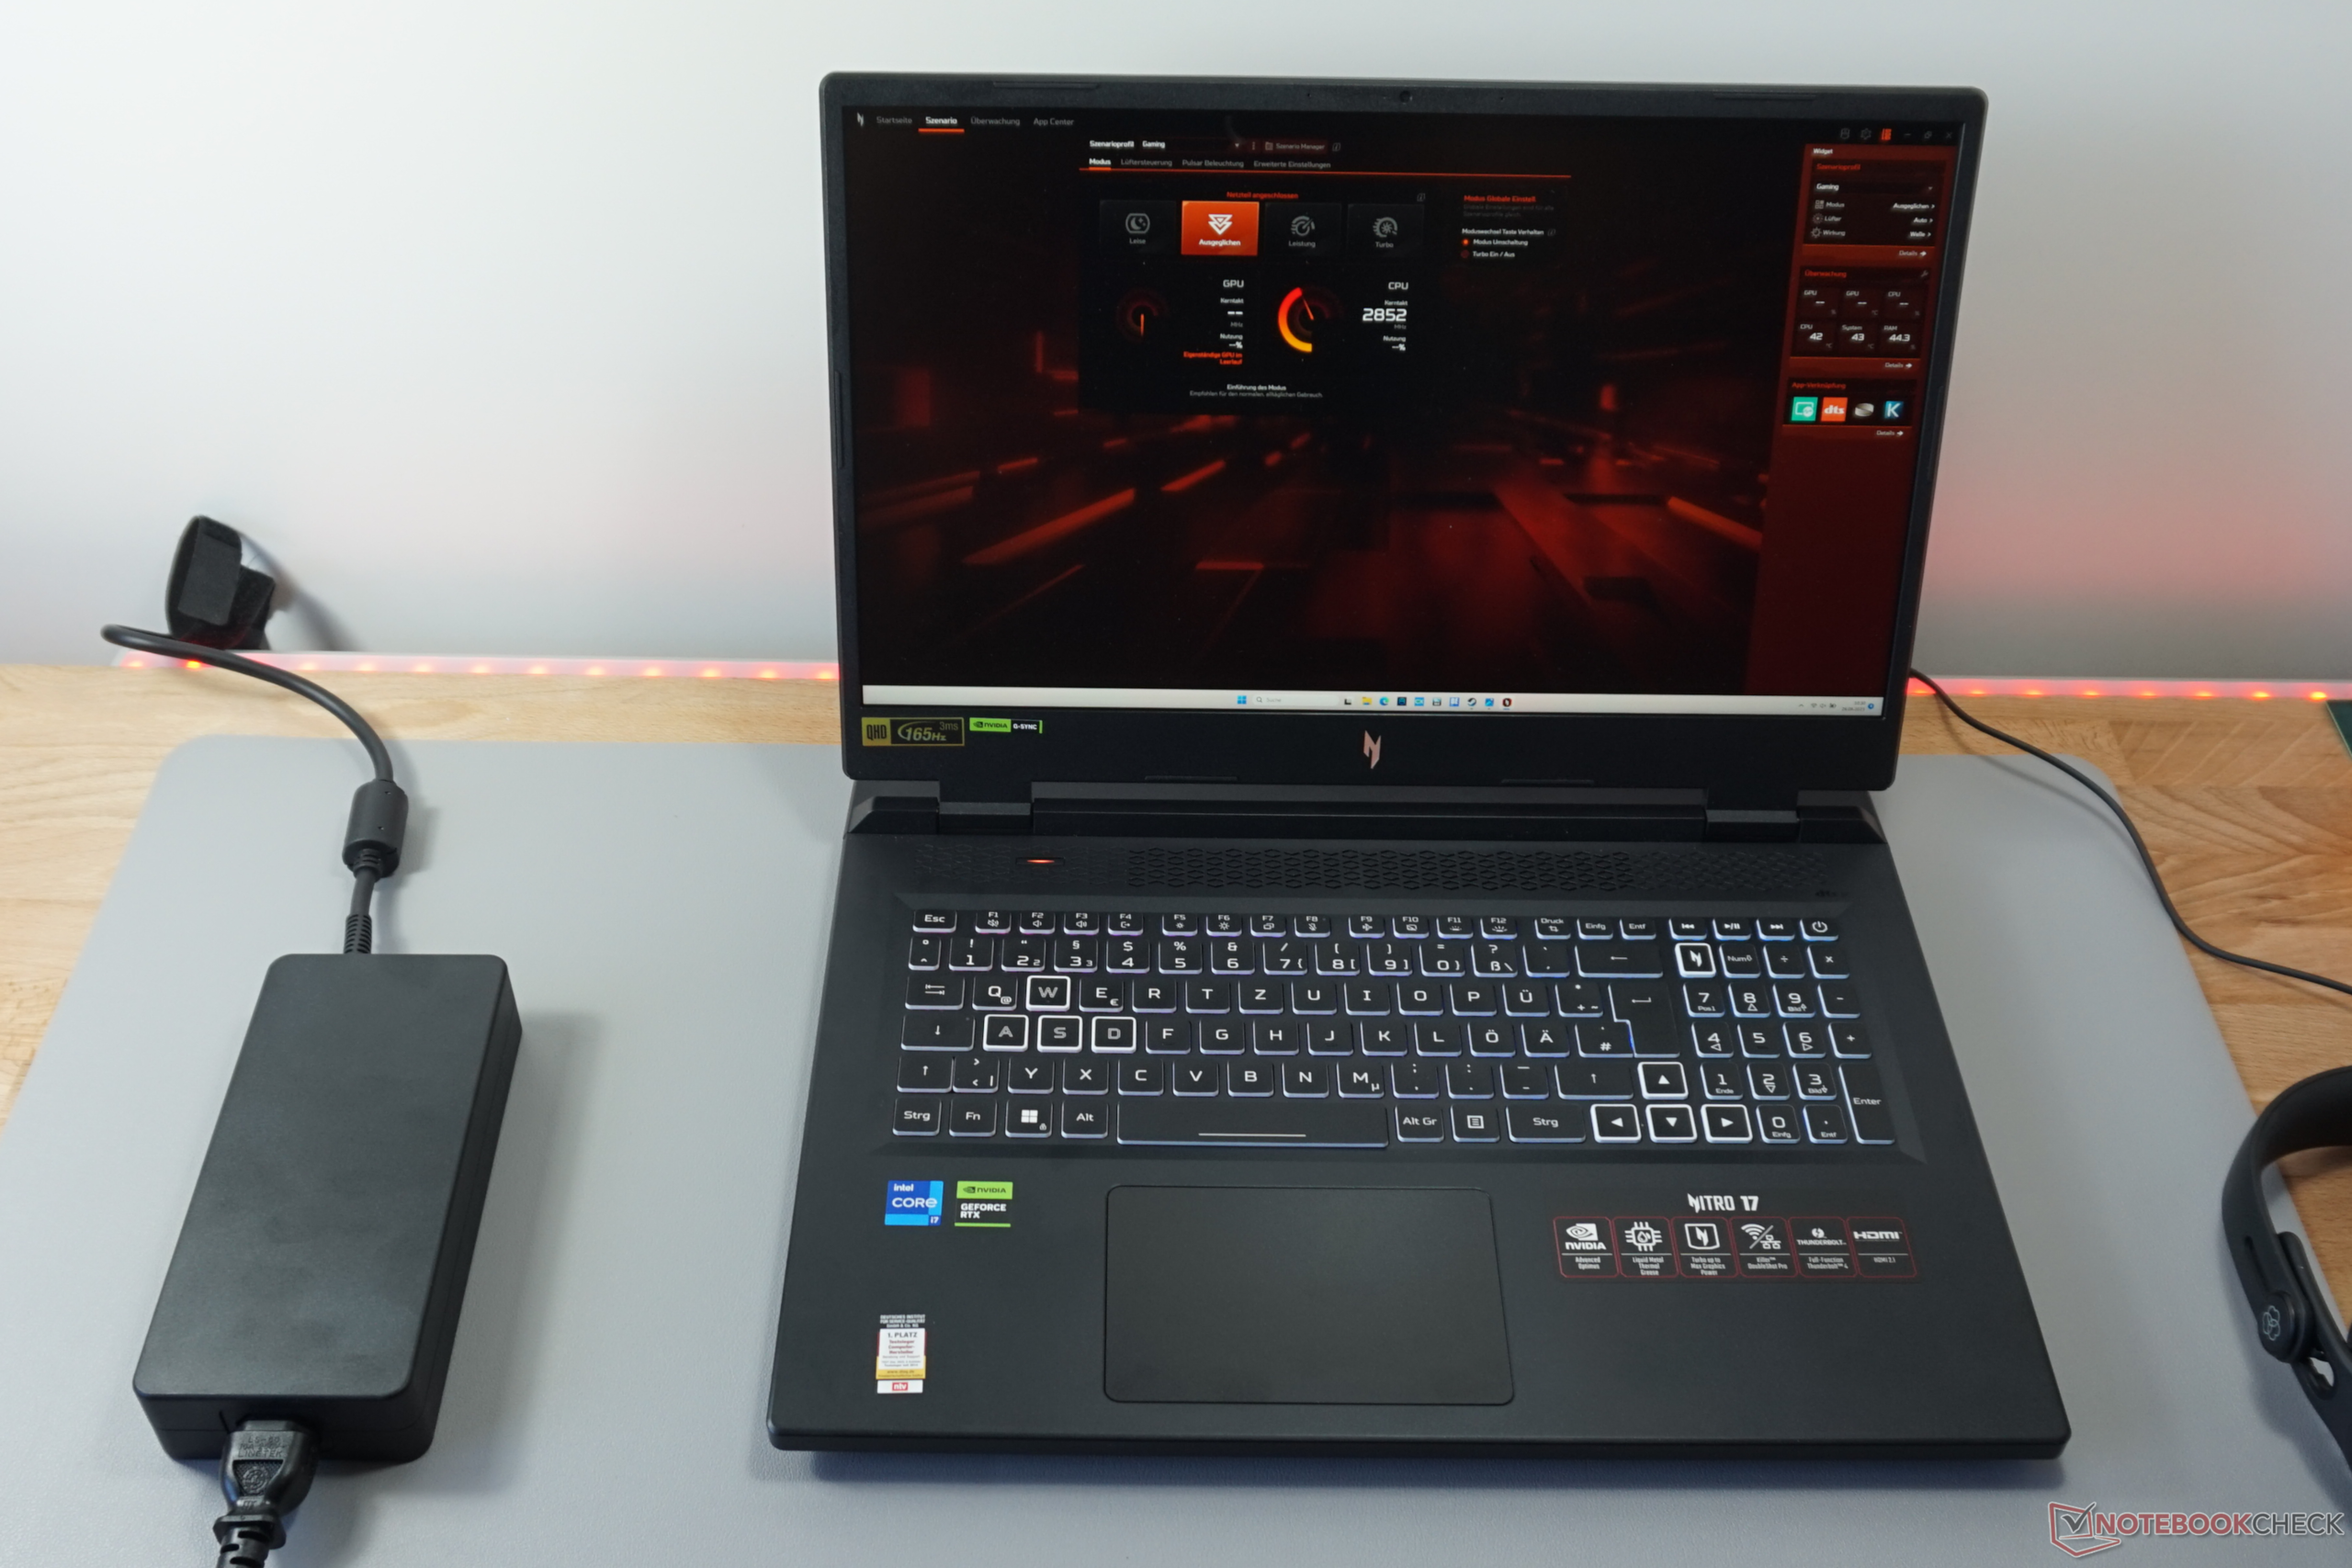
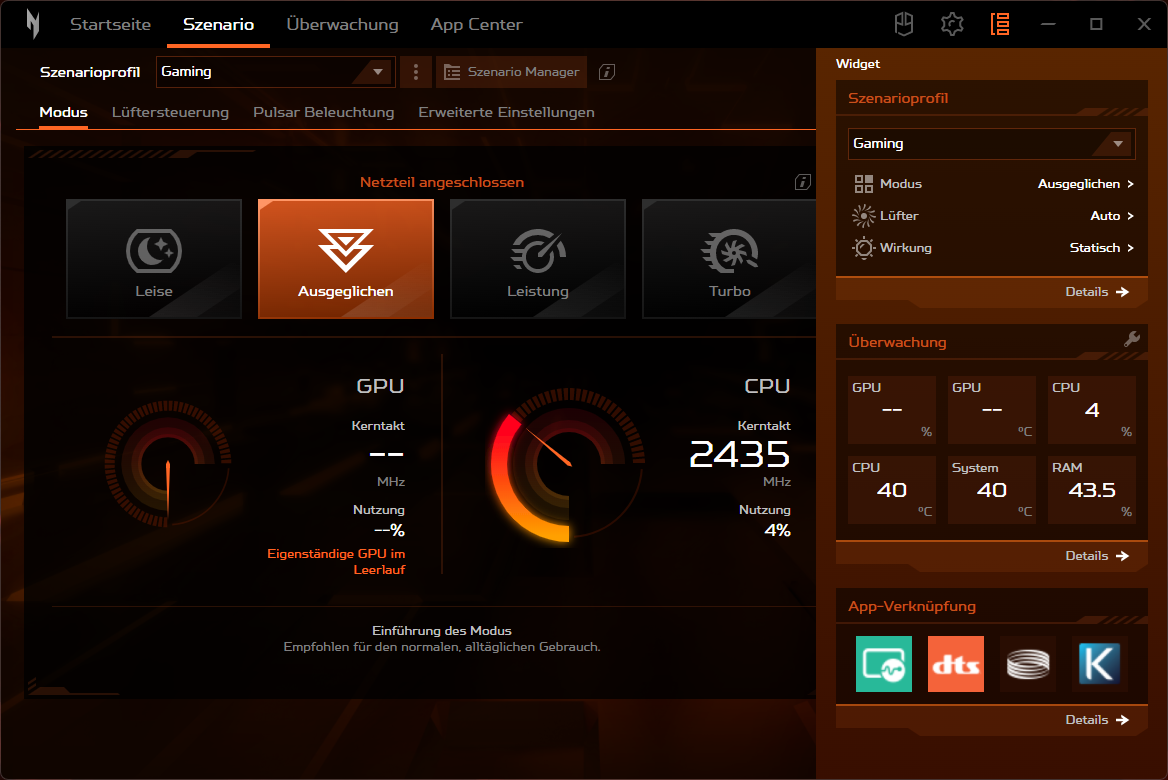
Various scenarios can be defined by using the NitroSense software. While the CPU and GPU's behaviour is set to four possible operating modes, fan behaviour, key lighting and sound profile can be selected accordingly.
For a realistic determination of the benchmarks, we selected the "Performance" mode. Acer recommends this in its instructions for optimum operation, also over extended periods of time. The fan noise in "Turbo" is much louder. In our tests, we were able to achieve nearly identical test results in both "Balanced" and "Performance" modes at roughly half the noise level. However, the performance dip in "Quiet" is considerable while the fans remain audible, at the very least.
This means the balanced operating mode ought to be ideal for most application scenarios. The sound in games, via the built-in speakers, is perfectly audible and the fan noise is not particularly annoying.
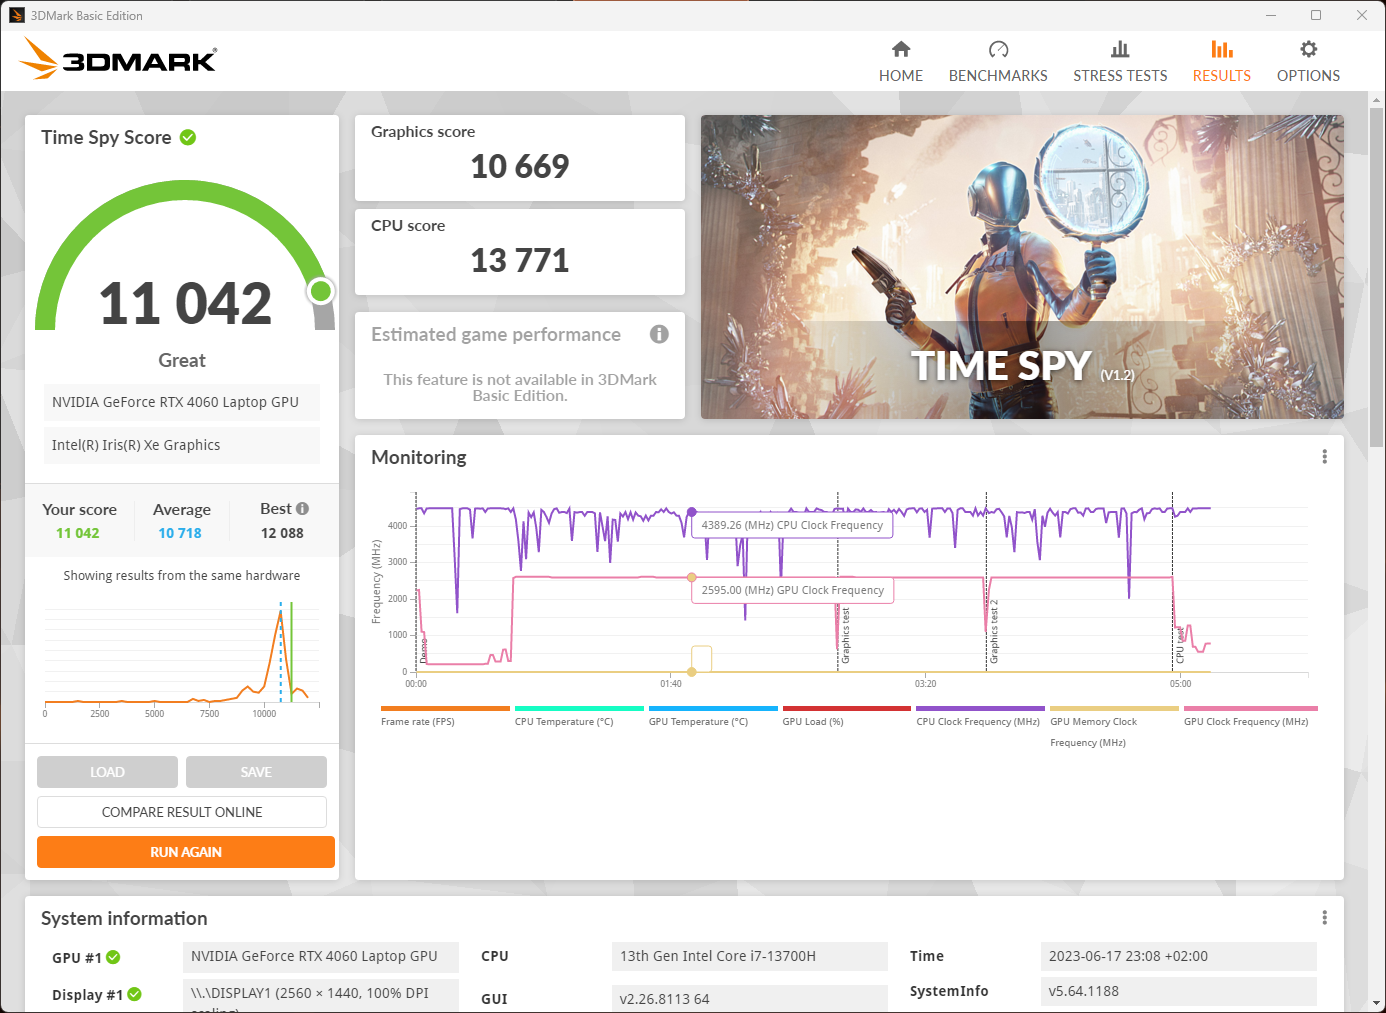
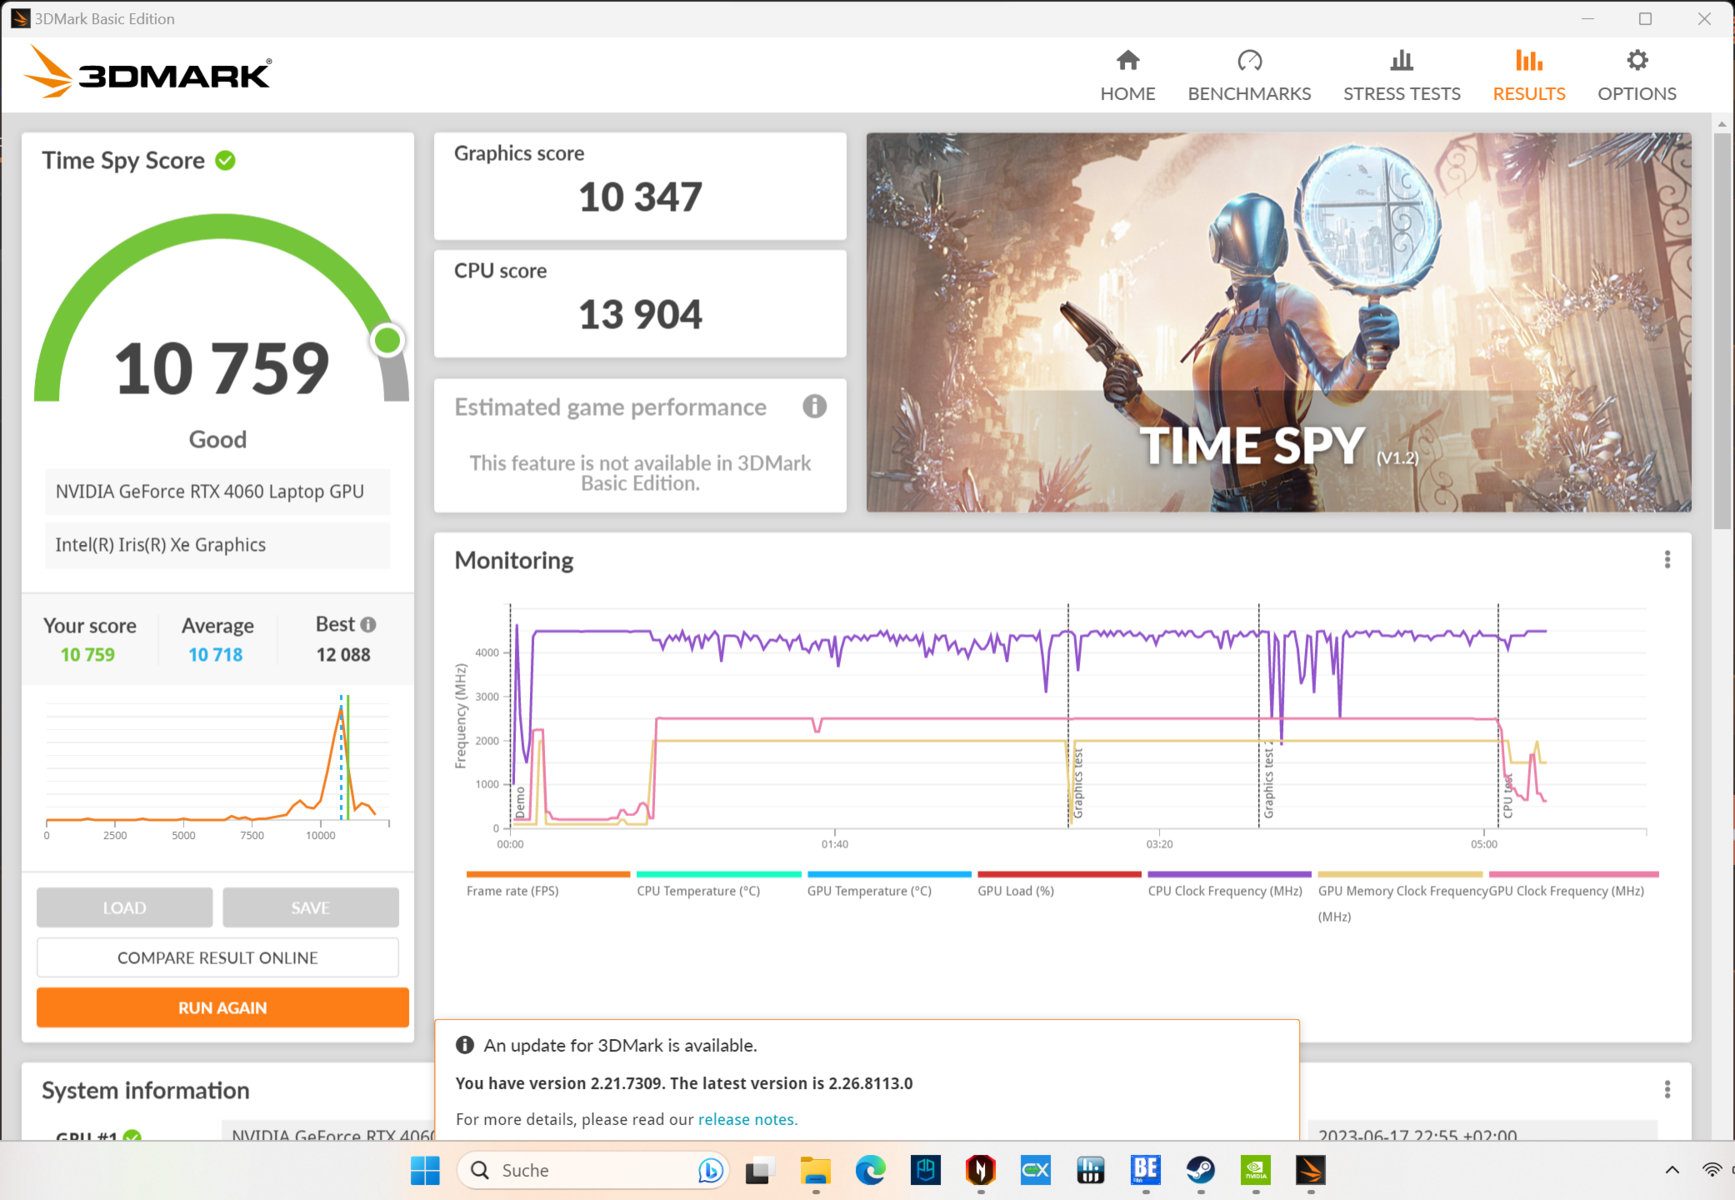
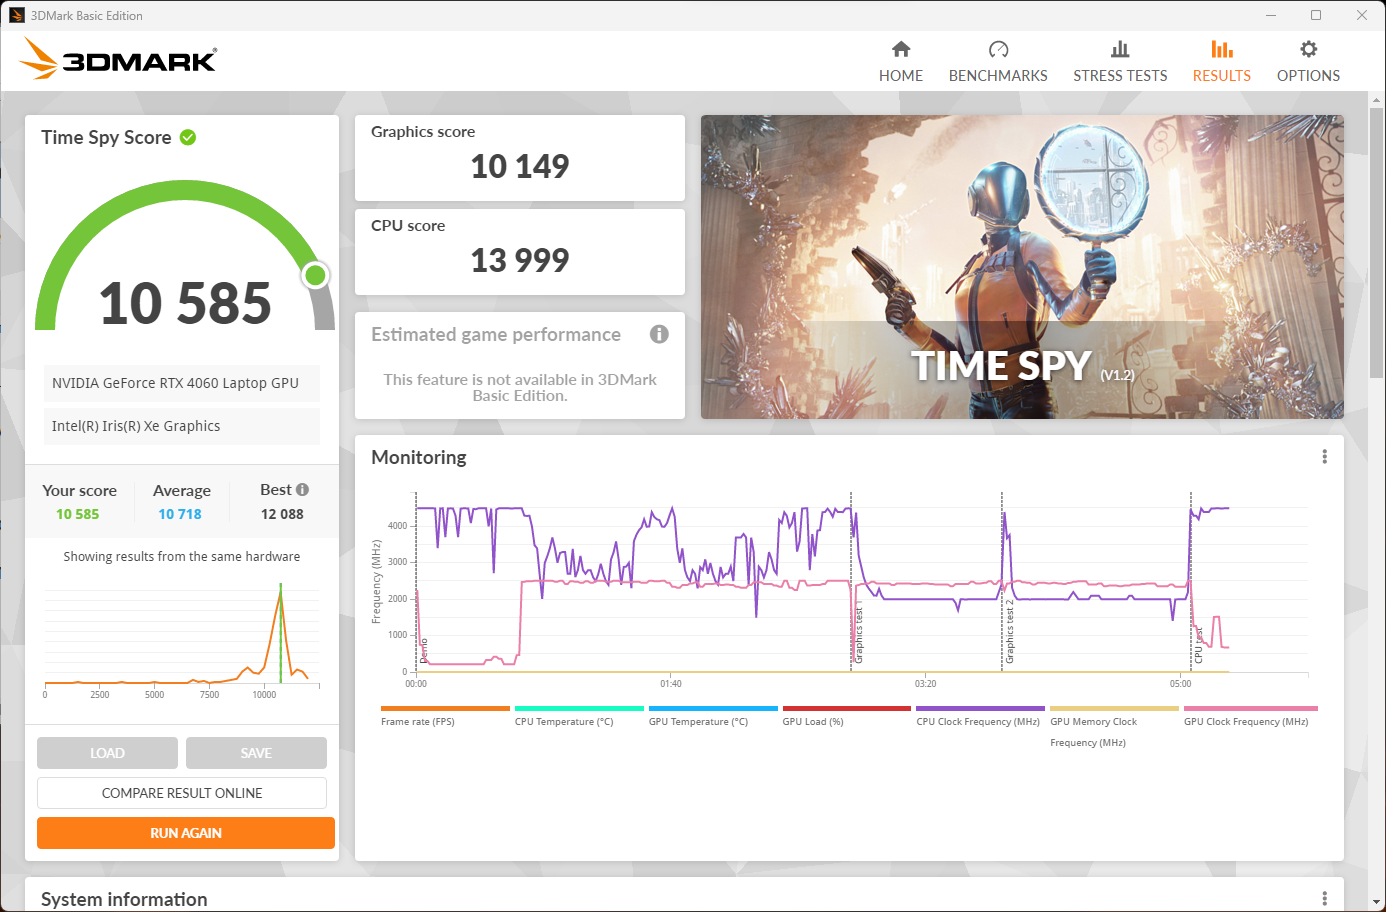
| Turbo | Performance | Balanced | Quiet | |
| CPU PL2 | 115 watts | 115 watts | 115 watts | 115 watts |
| CPU PL1 | 100 watts | 80 watts | 70 watts | 45 watts |
| Volume (Time Spy) | 58 dB | 55 dB | 43 dB | 38 dB |
| Score (Time Spy) | 11,042 | 10,759 | 10,608 | 4,210 |
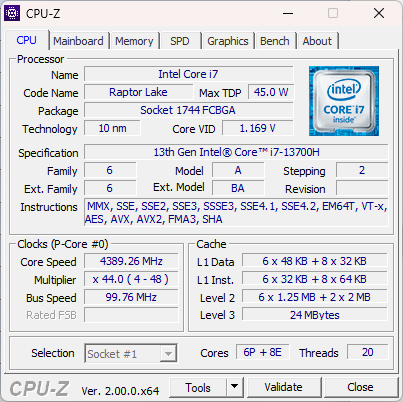
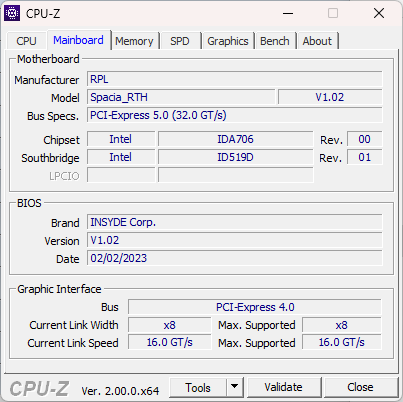
Processor
With the Intel Core i7-13700, the Acer Nitro 17 has gone for a very powerful but not superlative CPU. Its design largely corresponds to the predecessor, the i7-12700H with six performance and eight efficiency cores making a total of 20 threads. The cache has also remained the same size. In contrast, the clock rate has seen a slight improvement from 4.7 to 5.0 GHz.
Other gaming laptops can fall back on a better-specced CPU, for example, the Intel Core i7-13700HX. However, that means the cooling has to be done right. For instance, a Medion Erazer Defender P40 began our CineBench R15 continuous loop with 10 % better values but was neck and neck after the second run. In the end, the Nitro 17 was almost 20 % better. In this regard, the continuous performance is on an impressively high level.
Conversely, for many processes and tasks, the power available for a short time counts. In this respect, the i7-13700H is powerful for a mobile CPU but it is left standing by the 7th generation AMD processors or even the "HX" series Intel models. A similar picture emerged when it came to single-core performance. Being limited to 115 watts instead of up to the 157 watts seen in the "HX" series prevents better results. In addition, in "Performance" mode, a sudden reduction in power consumption takes place which explains the below-average results in this area. However, regarding the gaming rating, this doesn't play a decisive role.
You can find further information and measurement data in our CPU benchmark list.
Cinebench R15 Multi Continuous Test
Cinebench R23: Multi Core | Single Core
Cinebench R20: CPU (Multi Core) | CPU (Single Core)
Cinebench R15: CPU Multi 64Bit | CPU Single 64Bit
Blender: v2.79 BMW27 CPU
7-Zip 18.03: 7z b 4 | 7z b 4 -mmt1
Geekbench 5.5: Multi-Core | Single-Core
HWBOT x265 Benchmark v2.2: 4k Preset
LibreOffice : 20 Documents To PDF
R Benchmark 2.5: Overall mean
| CPU Performance rating | |
| Schenker XMG Focus 17 (E23) | |
| Average of class Gaming | |
| Lenovo Legion Pro 5 16IRX8 | |
| Asus TUF Gaming A16 FA617XS | |
| Medion Erazer Defender P40 | |
| MSI Pulse GL76 12UGK | |
| Average Intel Core i7-13700H | |
| Acer Nitro 17 AN17-51-71ER | |
| Acer Nitro 5 AN515-46-R1A1 | |
| Cinebench R23 / Multi Core | |
| Schenker XMG Focus 17 (E23) | |
| Average of class Gaming (10488 - 40970, n=106, last 2 years) | |
| Medion Erazer Defender P40 | |
| Lenovo Legion Pro 5 16IRX8 | |
| Acer Nitro 17 AN17-51-71ER | |
| MSI Pulse GL76 12UGK | |
| Asus TUF Gaming A16 FA617XS | |
| Average Intel Core i7-13700H (5890 - 20034, n=29) | |
| Acer Nitro 5 AN515-46-R1A1 | |
| Cinebench R23 / Single Core | |
| Average of class Gaming (1166 - 2387, n=106, last 2 years) | |
| Schenker XMG Focus 17 (E23) | |
| Average Intel Core i7-13700H (1323 - 1914, n=29) | |
| Asus TUF Gaming A16 FA617XS | |
| MSI Pulse GL76 12UGK | |
| Medion Erazer Defender P40 | |
| Lenovo Legion Pro 5 16IRX8 | |
| Acer Nitro 17 AN17-51-71ER | |
| Acer Nitro 5 AN515-46-R1A1 | |
| Cinebench R20 / CPU (Multi Core) | |
| Average of class Gaming (4029 - 16108, n=105, last 2 years) | |
| Schenker XMG Focus 17 (E23) | |
| Medion Erazer Defender P40 | |
| Acer Nitro 17 AN17-51-71ER | |
| Lenovo Legion Pro 5 16IRX8 | |
| Asus TUF Gaming A16 FA617XS | |
| MSI Pulse GL76 12UGK | |
| Average Intel Core i7-13700H (2322 - 7674, n=29) | |
| Acer Nitro 5 AN515-46-R1A1 | |
| Cinebench R20 / CPU (Single Core) | |
| Average of class Gaming (442 - 904, n=105, last 2 years) | |
| Schenker XMG Focus 17 (E23) | |
| Asus TUF Gaming A16 FA617XS | |
| Average Intel Core i7-13700H (508 - 741, n=29) | |
| MSI Pulse GL76 12UGK | |
| Lenovo Legion Pro 5 16IRX8 | |
| Medion Erazer Defender P40 | |
| Acer Nitro 5 AN515-46-R1A1 | |
| Acer Nitro 17 AN17-51-71ER | |
| Cinebench R15 / CPU Multi 64Bit | |
| Schenker XMG Focus 17 (E23) | |
| Average of class Gaming (1578 - 6271, n=104, last 2 years) | |
| Lenovo Legion Pro 5 16IRX8 | |
| Medion Erazer Defender P40 | |
| Acer Nitro 17 AN17-51-71ER | |
| MSI Pulse GL76 12UGK | |
| Asus TUF Gaming A16 FA617XS | |
| Average Intel Core i7-13700H (905 - 2982, n=29) | |
| Acer Nitro 5 AN515-46-R1A1 | |
| Cinebench R15 / CPU Single 64Bit | |
| Average of class Gaming (188.8 - 344, n=105, last 2 years) | |
| Schenker XMG Focus 17 (E23) | |
| Asus TUF Gaming A16 FA617XS | |
| Lenovo Legion Pro 5 16IRX8 | |
| Average Intel Core i7-13700H (213 - 278, n=29) | |
| MSI Pulse GL76 12UGK | |
| Acer Nitro 5 AN515-46-R1A1 | |
| Medion Erazer Defender P40 | |
| Acer Nitro 17 AN17-51-71ER | |
| Blender / v2.79 BMW27 CPU | |
| Acer Nitro 5 AN515-46-R1A1 | |
| Average Intel Core i7-13700H (169 - 555, n=29) | |
| Medion Erazer Defender P40 | |
| MSI Pulse GL76 12UGK | |
| Asus TUF Gaming A16 FA617XS | |
| Acer Nitro 17 AN17-51-71ER | |
| Lenovo Legion Pro 5 16IRX8 | |
| Average of class Gaming (80 - 330, n=103, last 2 years) | |
| Schenker XMG Focus 17 (E23) | |
| 7-Zip 18.03 / 7z b 4 | |
| Schenker XMG Focus 17 (E23) | |
| Average of class Gaming (33491 - 148086, n=104, last 2 years) | |
| Lenovo Legion Pro 5 16IRX8 | |
| Medion Erazer Defender P40 | |
| Acer Nitro 17 AN17-51-71ER | |
| Asus TUF Gaming A16 FA617XS | |
| MSI Pulse GL76 12UGK | |
| Acer Nitro 5 AN515-46-R1A1 | |
| Average Intel Core i7-13700H (27322 - 76344, n=29) | |
| 7-Zip 18.03 / 7z b 4 -mmt1 | |
| Schenker XMG Focus 17 (E23) | |
| Asus TUF Gaming A16 FA617XS | |
| Average of class Gaming (4199 - 7436, n=104, last 2 years) | |
| Average Intel Core i7-13700H (4825 - 6238, n=29) | |
| Acer Nitro 5 AN515-46-R1A1 | |
| Lenovo Legion Pro 5 16IRX8 | |
| MSI Pulse GL76 12UGK | |
| Medion Erazer Defender P40 | |
| Acer Nitro 17 AN17-51-71ER | |
| Geekbench 5.5 / Multi-Core | |
| Schenker XMG Focus 17 (E23) | |
| Average of class Gaming (6460 - 27010, n=104, last 2 years) | |
| Medion Erazer Defender P40 | |
| Lenovo Legion Pro 5 16IRX8 | |
| Acer Nitro 17 AN17-51-71ER | |
| Asus TUF Gaming A16 FA617XS | |
| MSI Pulse GL76 12UGK | |
| Average Intel Core i7-13700H (6165 - 14215, n=29) | |
| Acer Nitro 5 AN515-46-R1A1 | |
| Geekbench 5.5 / Single-Core | |
| Average of class Gaming (986 - 2474, n=104, last 2 years) | |
| Asus TUF Gaming A16 FA617XS | |
| Schenker XMG Focus 17 (E23) | |
| Average Intel Core i7-13700H (1362 - 1919, n=29) | |
| Lenovo Legion Pro 5 16IRX8 | |
| MSI Pulse GL76 12UGK | |
| Medion Erazer Defender P40 | |
| Acer Nitro 5 AN515-46-R1A1 | |
| Acer Nitro 17 AN17-51-71ER | |
| HWBOT x265 Benchmark v2.2 / 4k Preset | |
| Average of class Gaming (11.5 - 44.3, n=104, last 2 years) | |
| Schenker XMG Focus 17 (E23) | |
| Lenovo Legion Pro 5 16IRX8 | |
| Medion Erazer Defender P40 | |
| Asus TUF Gaming A16 FA617XS | |
| Acer Nitro 17 AN17-51-71ER | |
| MSI Pulse GL76 12UGK | |
| Acer Nitro 5 AN515-46-R1A1 | |
| Average Intel Core i7-13700H (6.72 - 21.2, n=29) | |
| LibreOffice / 20 Documents To PDF | |
| Acer Nitro 17 AN17-51-71ER | |
| Schenker XMG Focus 17 (E23) | |
| Acer Nitro 5 AN515-46-R1A1 | |
| Medion Erazer Defender P40 | |
| Average of class Gaming (33.2 - 88.8, n=104, last 2 years) | |
| Average Intel Core i7-13700H (31.3 - 62.4, n=29) | |
| MSI Pulse GL76 12UGK | |
| Asus TUF Gaming A16 FA617XS | |
| Lenovo Legion Pro 5 16IRX8 | |
| R Benchmark 2.5 / Overall mean | |
| Acer Nitro 17 AN17-51-71ER | |
| Medion Erazer Defender P40 | |
| Acer Nitro 5 AN515-46-R1A1 | |
| Lenovo Legion Pro 5 16IRX8 | |
| MSI Pulse GL76 12UGK | |
| Average Intel Core i7-13700H (0.4308 - 0.607, n=29) | |
| Average of class Gaming (0.3439 - 0.759, n=105, last 2 years) | |
| Asus TUF Gaming A16 FA617XS | |
| Schenker XMG Focus 17 (E23) | |
* ... smaller is better
AIDA64: FP32 Ray-Trace | FPU Julia | CPU SHA3 | CPU Queen | FPU SinJulia | FPU Mandel | CPU AES | CPU ZLib | FP64 Ray-Trace | CPU PhotoWorxx
| Performance rating | |
| Average of class Gaming | |
| Schenker XMG Focus 17 (E23) | |
| Asus TUF Gaming A16 FA617XS | |
| Lenovo Legion Pro 5 16IRX8 | |
| Acer Nitro 17 AN17-51-71ER | |
| Acer Nitro 5 AN515-46-R1A1 | |
| MSI Pulse GL76 12UGK | |
| Medion Erazer Defender P40 | |
| Average Intel Core i7-13700H | |
| AIDA64 / FP32 Ray-Trace | |
| Average of class Gaming (10227 - 85542, n=103, last 2 years) | |
| Asus TUF Gaming A16 FA617XS | |
| Schenker XMG Focus 17 (E23) | |
| Lenovo Legion Pro 5 16IRX8 | |
| Acer Nitro 17 AN17-51-71ER | |
| MSI Pulse GL76 12UGK | |
| Acer Nitro 5 AN515-46-R1A1 | |
| Medion Erazer Defender P40 | |
| Average Intel Core i7-13700H (4986 - 18908, n=29) | |
| AIDA64 / FPU Julia | |
| Average of class Gaming (51376 - 238426, n=103, last 2 years) | |
| Asus TUF Gaming A16 FA617XS | |
| Schenker XMG Focus 17 (E23) | |
| Lenovo Legion Pro 5 16IRX8 | |
| Acer Nitro 5 AN515-46-R1A1 | |
| Acer Nitro 17 AN17-51-71ER | |
| MSI Pulse GL76 12UGK | |
| Medion Erazer Defender P40 | |
| Average Intel Core i7-13700H (25360 - 92359, n=29) | |
| AIDA64 / CPU SHA3 | |
| Average of class Gaming (2180 - 9817, n=103, last 2 years) | |
| Schenker XMG Focus 17 (E23) | |
| Lenovo Legion Pro 5 16IRX8 | |
| Asus TUF Gaming A16 FA617XS | |
| Acer Nitro 17 AN17-51-71ER | |
| MSI Pulse GL76 12UGK | |
| Medion Erazer Defender P40 | |
| Acer Nitro 5 AN515-46-R1A1 | |
| Average Intel Core i7-13700H (1339 - 4224, n=29) | |
| AIDA64 / CPU Queen | |
| Schenker XMG Focus 17 (E23) | |
| Asus TUF Gaming A16 FA617XS | |
| Average of class Gaming (49785 - 173351, n=89, last 2 years) | |
| Lenovo Legion Pro 5 16IRX8 | |
| Medion Erazer Defender P40 | |
| Acer Nitro 5 AN515-46-R1A1 | |
| MSI Pulse GL76 12UGK | |
| Acer Nitro 17 AN17-51-71ER | |
| Average Intel Core i7-13700H (59324 - 107159, n=29) | |
| AIDA64 / FPU SinJulia | |
| Asus TUF Gaming A16 FA617XS | |
| Average of class Gaming (4424 - 33636, n=103, last 2 years) | |
| Schenker XMG Focus 17 (E23) | |
| Lenovo Legion Pro 5 16IRX8 | |
| Acer Nitro 5 AN515-46-R1A1 | |
| Acer Nitro 17 AN17-51-71ER | |
| Medion Erazer Defender P40 | |
| MSI Pulse GL76 12UGK | |
| Average Intel Core i7-13700H (4800 - 11050, n=29) | |
| AIDA64 / FPU Mandel | |
| Average of class Gaming (25115 - 128721, n=103, last 2 years) | |
| Asus TUF Gaming A16 FA617XS | |
| Acer Nitro 5 AN515-46-R1A1 | |
| Schenker XMG Focus 17 (E23) | |
| Lenovo Legion Pro 5 16IRX8 | |
| Acer Nitro 17 AN17-51-71ER | |
| MSI Pulse GL76 12UGK | |
| Medion Erazer Defender P40 | |
| Average Intel Core i7-13700H (12321 - 45118, n=29) | |
| AIDA64 / CPU AES | |
| Acer Nitro 17 AN17-51-71ER | |
| MSI Pulse GL76 12UGK | |
| Acer Nitro 5 AN515-46-R1A1 | |
| Average of class Gaming (39258 - 247074, n=103, last 2 years) | |
| Schenker XMG Focus 17 (E23) | |
| Lenovo Legion Pro 5 16IRX8 | |
| Asus TUF Gaming A16 FA617XS | |
| Average Intel Core i7-13700H (28769 - 151254, n=29) | |
| Medion Erazer Defender P40 | |
| AIDA64 / CPU ZLib | |
| Schenker XMG Focus 17 (E23) | |
| Average of class Gaming (574 - 2531, n=103, last 2 years) | |
| Lenovo Legion Pro 5 16IRX8 | |
| Acer Nitro 17 AN17-51-71ER | |
| MSI Pulse GL76 12UGK | |
| Asus TUF Gaming A16 FA617XS | |
| Medion Erazer Defender P40 | |
| Average Intel Core i7-13700H (389 - 1215, n=29) | |
| Acer Nitro 5 AN515-46-R1A1 | |
| AIDA64 / FP64 Ray-Trace | |
| Average of class Gaming (5509 - 45446, n=103, last 2 years) | |
| Asus TUF Gaming A16 FA617XS | |
| Schenker XMG Focus 17 (E23) | |
| Lenovo Legion Pro 5 16IRX8 | |
| Acer Nitro 17 AN17-51-71ER | |
| MSI Pulse GL76 12UGK | |
| Acer Nitro 5 AN515-46-R1A1 | |
| Medion Erazer Defender P40 | |
| Average Intel Core i7-13700H (2540 - 10135, n=29) | |
| AIDA64 / CPU PhotoWorxx | |
| Schenker XMG Focus 17 (E23) | |
| Average of class Gaming (12271 - 89891, n=103, last 2 years) | |
| Average Intel Core i7-13700H (12872 - 52727, n=29) | |
| Acer Nitro 17 AN17-51-71ER | |
| Lenovo Legion Pro 5 16IRX8 | |
| Medion Erazer Defender P40 | |
| Asus TUF Gaming A16 FA617XS | |
| Acer Nitro 5 AN515-46-R1A1 | |
| MSI Pulse GL76 12UGK | |
System Performance
When surfing the internet, creating, rendering and more, the performance remains consistently high. Waiting times are short and loading processes, the installation or de-installation of programs don't present the system with any particular problems. In terms of the PCMark and CrossMark scores, there seems to be a slight advantage to using the balanced mode. The low heat production as a result of the limited power consumption during repeated load, really shows its advantages. This means this processor even manages to sit noticeably above the values we recorded in all our tested i7-13700H processors.
CrossMark: Overall | Productivity | Creativity | Responsiveness
| PCMark 10 / Score | |
| Average of class Gaming (5828 - 11730, n=92, last 2 years) | |
| Asus TUF Gaming A16 FA617XS | |
| Lenovo Legion Pro 5 16IRX8 | |
| MSI Pulse GL76 12UGK | |
| Acer Nitro 17 AN17-51-71ER (Ausgeglichen) | |
| Average Intel Core i7-13700H, NVIDIA GeForce RTX 4060 Laptop GPU (7157 - 7661, n=5) | |
| Acer Nitro 17 AN17-51-71ER | |
| Schenker XMG Focus 17 (E23) | |
| Medion Erazer Defender P40 | |
| Acer Nitro 5 AN515-46-R1A1 | |
| PCMark 10 / Essentials | |
| MSI Pulse GL76 12UGK | |
| Lenovo Legion Pro 5 16IRX8 | |
| Asus TUF Gaming A16 FA617XS | |
| Average Intel Core i7-13700H, NVIDIA GeForce RTX 4060 Laptop GPU (10179 - 11200, n=5) | |
| Average of class Gaming (8810 - 11935, n=96, last 2 years) | |
| Acer Nitro 17 AN17-51-71ER (Ausgeglichen) | |
| Acer Nitro 5 AN515-46-R1A1 | |
| Acer Nitro 17 AN17-51-71ER | |
| Schenker XMG Focus 17 (E23) | |
| Medion Erazer Defender P40 | |
| PCMark 10 / Productivity | |
| Average of class Gaming (6845 - 21327, n=94, last 2 years) | |
| Asus TUF Gaming A16 FA617XS | |
| Acer Nitro 17 AN17-51-71ER (Ausgeglichen) | |
| MSI Pulse GL76 12UGK | |
| Medion Erazer Defender P40 | |
| Schenker XMG Focus 17 (E23) | |
| Average Intel Core i7-13700H, NVIDIA GeForce RTX 4060 Laptop GPU (8238 - 10249, n=5) | |
| Lenovo Legion Pro 5 16IRX8 | |
| Acer Nitro 5 AN515-46-R1A1 | |
| Acer Nitro 17 AN17-51-71ER | |
| PCMark 10 / Digital Content Creation | |
| Average of class Gaming (7602 - 19954, n=94, last 2 years) | |
| Lenovo Legion Pro 5 16IRX8 | |
| Asus TUF Gaming A16 FA617XS | |
| Acer Nitro 17 AN17-51-71ER | |
| MSI Pulse GL76 12UGK | |
| Average Intel Core i7-13700H, NVIDIA GeForce RTX 4060 Laptop GPU (10308 - 11862, n=5) | |
| Acer Nitro 17 AN17-51-71ER (Ausgeglichen) | |
| Schenker XMG Focus 17 (E23) | |
| Medion Erazer Defender P40 | |
| Acer Nitro 5 AN515-46-R1A1 | |
| CrossMark / Overall | |
| Schenker XMG Focus 17 (E23) | |
| Average of class Gaming (1366 - 2409, n=93, last 2 years) | |
| MSI Pulse GL76 12UGK | |
| Medion Erazer Defender P40 | |
| Asus TUF Gaming A16 FA617XS | |
| Average Intel Core i7-13700H, NVIDIA GeForce RTX 4060 Laptop GPU (1629 - 1849, n=5) | |
| Lenovo Legion Pro 5 16IRX8 | |
| Acer Nitro 17 AN17-51-71ER (Ausgeglichen) | |
| Acer Nitro 17 AN17-51-71ER | |
| Acer Nitro 5 AN515-46-R1A1 | |
| CrossMark / Productivity | |
| Schenker XMG Focus 17 (E23) | |
| Average of class Gaming (1386 - 2254, n=93, last 2 years) | |
| MSI Pulse GL76 12UGK | |
| Asus TUF Gaming A16 FA617XS | |
| Medion Erazer Defender P40 | |
| Average Intel Core i7-13700H, NVIDIA GeForce RTX 4060 Laptop GPU (1561 - 1743, n=5) | |
| Lenovo Legion Pro 5 16IRX8 | |
| Acer Nitro 17 AN17-51-71ER (Ausgeglichen) | |
| Acer Nitro 17 AN17-51-71ER | |
| Acer Nitro 5 AN515-46-R1A1 | |
| CrossMark / Creativity | |
| Schenker XMG Focus 17 (E23) | |
| Average of class Gaming (1343 - 2729, n=93, last 2 years) | |
| Medion Erazer Defender P40 | |
| Asus TUF Gaming A16 FA617XS | |
| MSI Pulse GL76 12UGK | |
| Average Intel Core i7-13700H, NVIDIA GeForce RTX 4060 Laptop GPU (1691 - 2064, n=5) | |
| Acer Nitro 17 AN17-51-71ER (Ausgeglichen) | |
| Lenovo Legion Pro 5 16IRX8 | |
| Acer Nitro 17 AN17-51-71ER | |
| Acer Nitro 5 AN515-46-R1A1 | |
| CrossMark / Responsiveness | |
| MSI Pulse GL76 12UGK | |
| Schenker XMG Focus 17 (E23) | |
| Average of class Gaming (1226 - 2334, n=93, last 2 years) | |
| Lenovo Legion Pro 5 16IRX8 | |
| Acer Nitro 17 AN17-51-71ER | |
| Medion Erazer Defender P40 | |
| Average Intel Core i7-13700H, NVIDIA GeForce RTX 4060 Laptop GPU (1381 - 1656, n=5) | |
| Acer Nitro 17 AN17-51-71ER (Ausgeglichen) | |
| Asus TUF Gaming A16 FA617XS | |
| Acer Nitro 5 AN515-46-R1A1 | |
| PCMark 10 Score | 7157 points | |
Help | ||
| AIDA64 / Memory Copy | |
| Schenker XMG Focus 17 (E23) | |
| Average of class Gaming (21750 - 129946, n=103, last 2 years) | |
| Average Intel Core i7-13700H (24334 - 78081, n=29) | |
| Asus TUF Gaming A16 FA617XS | |
| Lenovo Legion Pro 5 16IRX8 | |
| Acer Nitro 17 AN17-51-71ER | |
| Medion Erazer Defender P40 | |
| Acer Nitro 5 AN515-46-R1A1 | |
| MSI Pulse GL76 12UGK | |
| AIDA64 / Memory Read | |
| Schenker XMG Focus 17 (E23) | |
| Average of class Gaming (22956 - 118858, n=103, last 2 years) | |
| Lenovo Legion Pro 5 16IRX8 | |
| Medion Erazer Defender P40 | |
| Acer Nitro 17 AN17-51-71ER | |
| Average Intel Core i7-13700H (23681 - 79656, n=29) | |
| Asus TUF Gaming A16 FA617XS | |
| Acer Nitro 5 AN515-46-R1A1 | |
| MSI Pulse GL76 12UGK | |
| AIDA64 / Memory Write | |
| Average of class Gaming (22297 - 135096, n=103, last 2 years) | |
| Schenker XMG Focus 17 (E23) | |
| Asus TUF Gaming A16 FA617XS | |
| Average Intel Core i7-13700H (22986 - 99898, n=29) | |
| Lenovo Legion Pro 5 16IRX8 | |
| Acer Nitro 17 AN17-51-71ER | |
| Medion Erazer Defender P40 | |
| Acer Nitro 5 AN515-46-R1A1 | |
| MSI Pulse GL76 12UGK | |
| AIDA64 / Memory Latency | |
| Acer Nitro 17 AN17-51-71ER | |
| Average of class Gaming (75.3 - 259, n=103, last 2 years) | |
| Average Intel Core i7-13700H (82.4 - 136.8, n=29) | |
| MSI Pulse GL76 12UGK | |
| Medion Erazer Defender P40 | |
| Schenker XMG Focus 17 (E23) | |
| Asus TUF Gaming A16 FA617XS | |
| Acer Nitro 5 AN515-46-R1A1 | |
| Lenovo Legion Pro 5 16IRX8 | |
* ... smaller is better
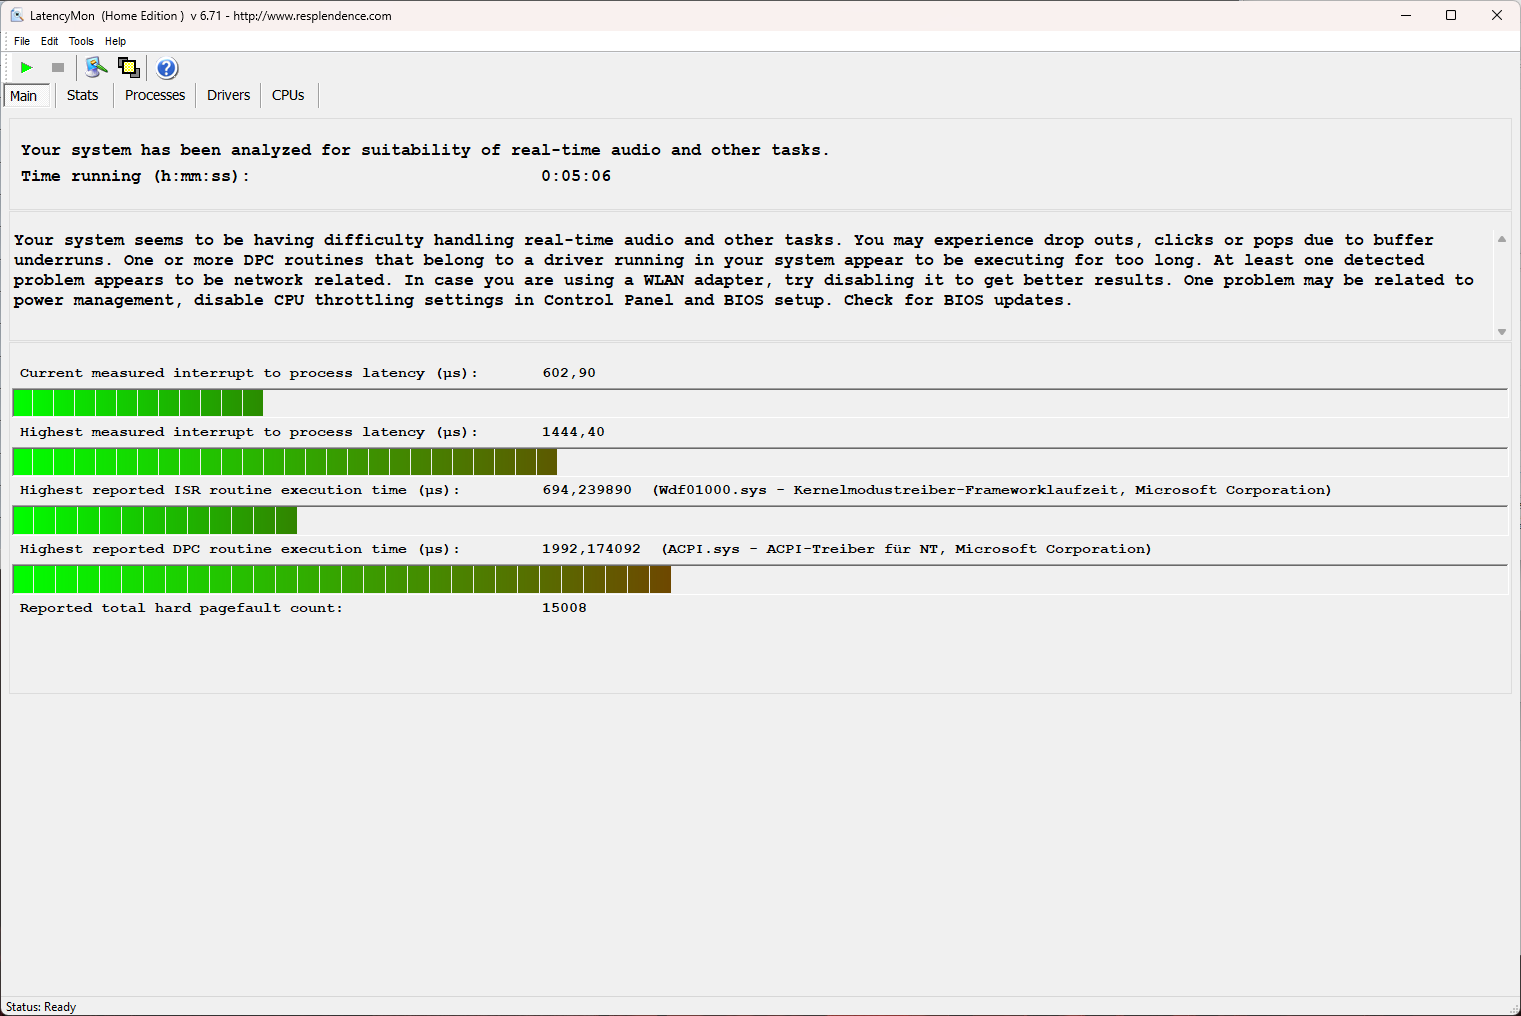
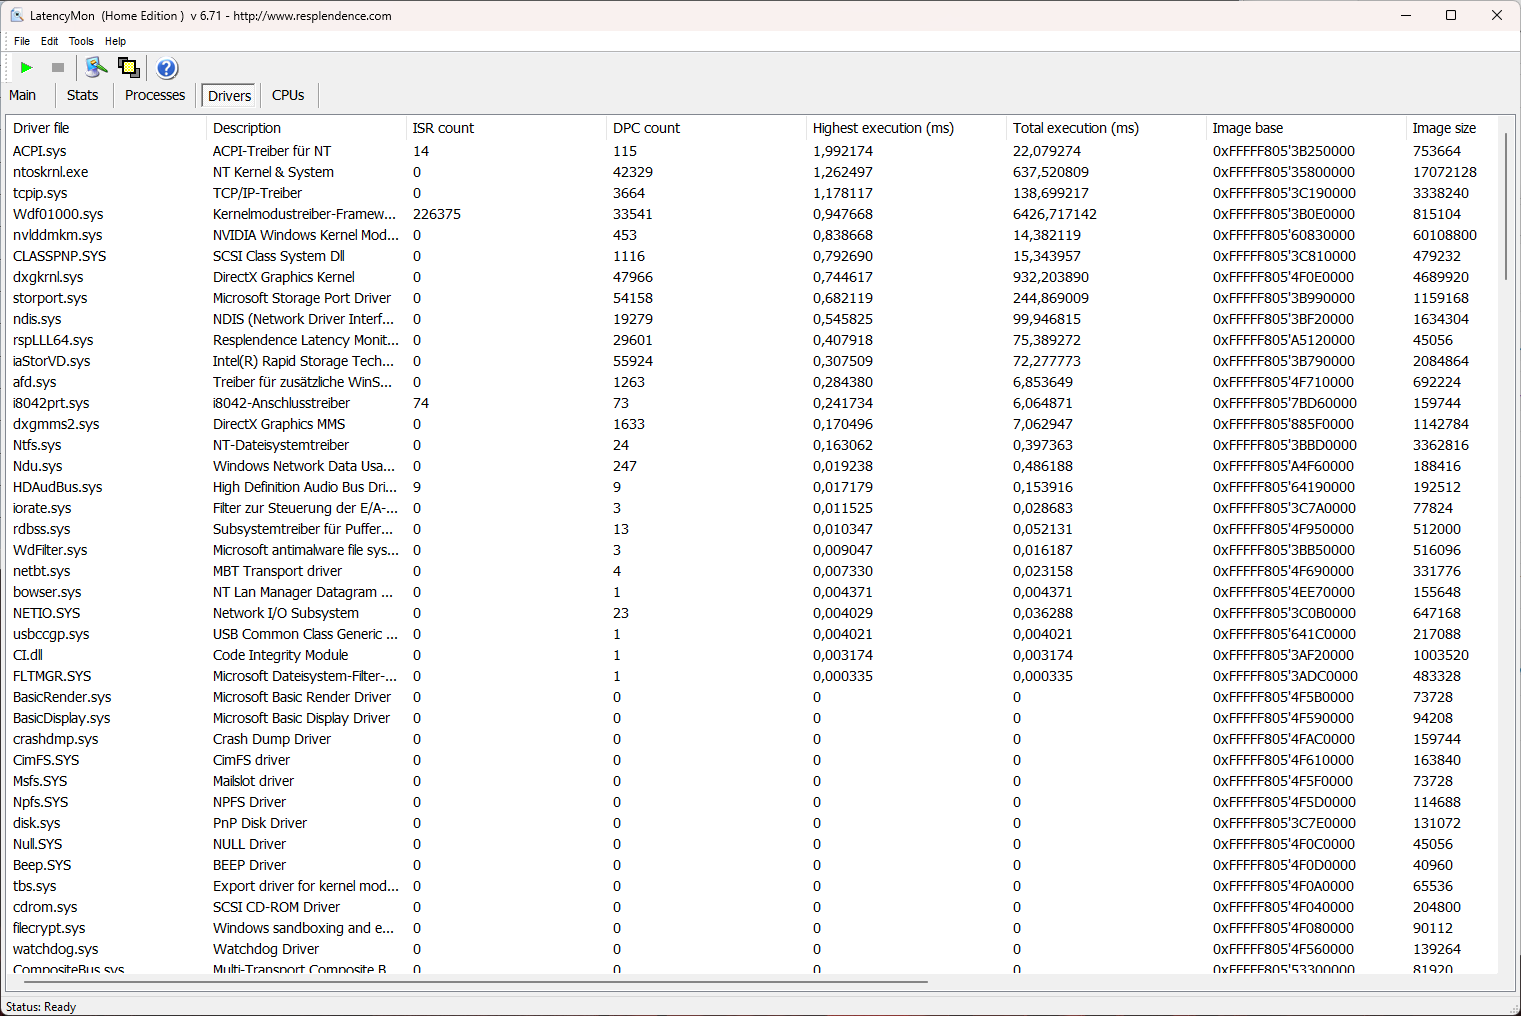
DPC latencies
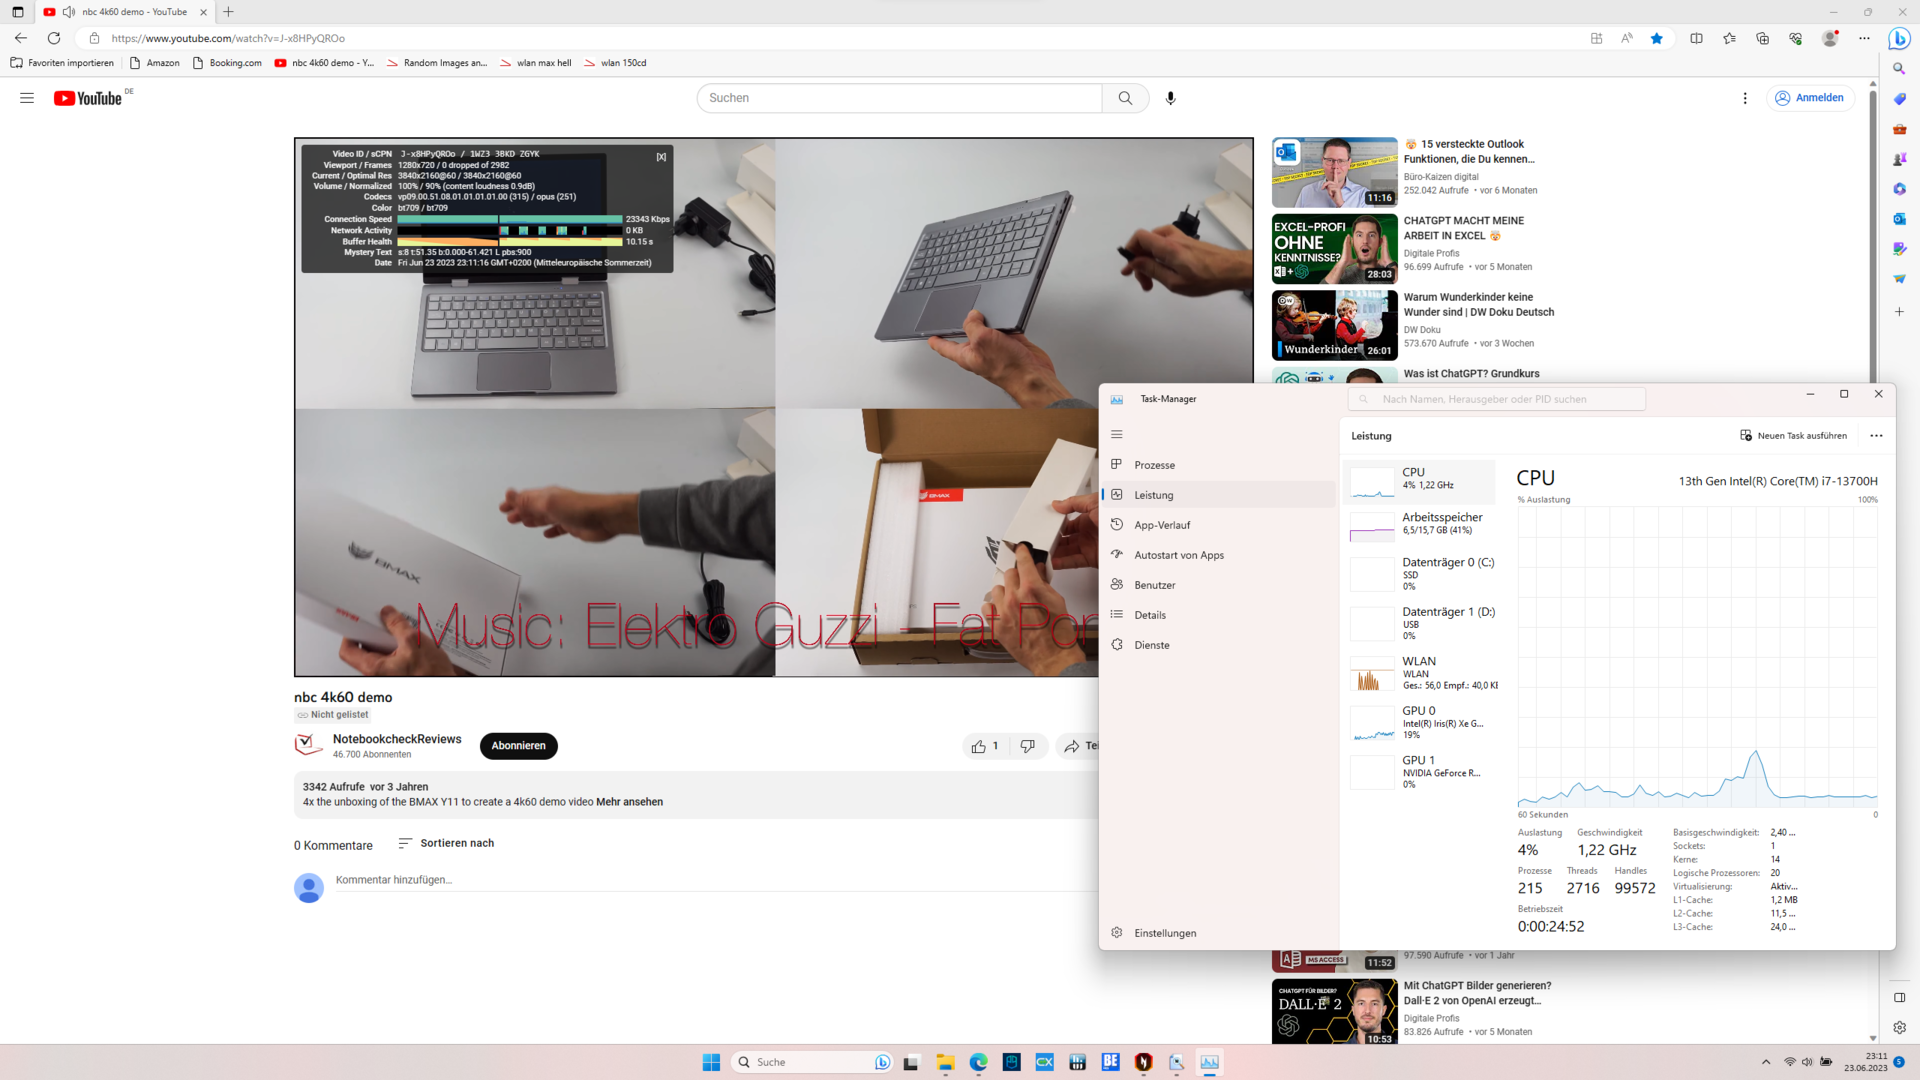
The Nitro 17 is not necessarily suitable for real-time audio editing but it was still able to handle it with minimal glitches. All in all, the results were good. Also, when it came to 4K video playback, we were unable to detect any dropped frames.
Driver updates and software changes could both significantly improve or worsen performance compared to our determined results.
| DPC Latencies / LatencyMon - interrupt to process latency (max), Web, Youtube, Prime95 | |
| Acer Nitro 5 AN515-46-R1A1 | |
| Medion Erazer Defender P40 | |
| Acer Nitro 17 AN17-51-71ER | |
| Asus TUF Gaming A16 FA617XS | |
| Schenker XMG Focus 17 (E23) | |
| MSI Pulse GL76 12UGK | |
| Lenovo Legion Pro 5 16IRX8 | |
* ... smaller is better
Mass storage
In our performance tests, Samsung's PCIe 4.0 SSD returned impressive results, putting itself quite some distance from the competition, especially when it came to the read and write speeds of 4 kbit blocks.
By contrast, the sequential read endurance test result was really poor. After initially acceptable transfer speeds, the values fell to less than 500 MB/s (red line) which represents a fraction of the possible theoretical performance. The removal of the cooling pad from the RAM - which reached as far as the SSD's controller in our test device - brought about a 50 % improvement (black line). If the fans are set to maximum, the SSD finally behaves as you would expect (yellow line).
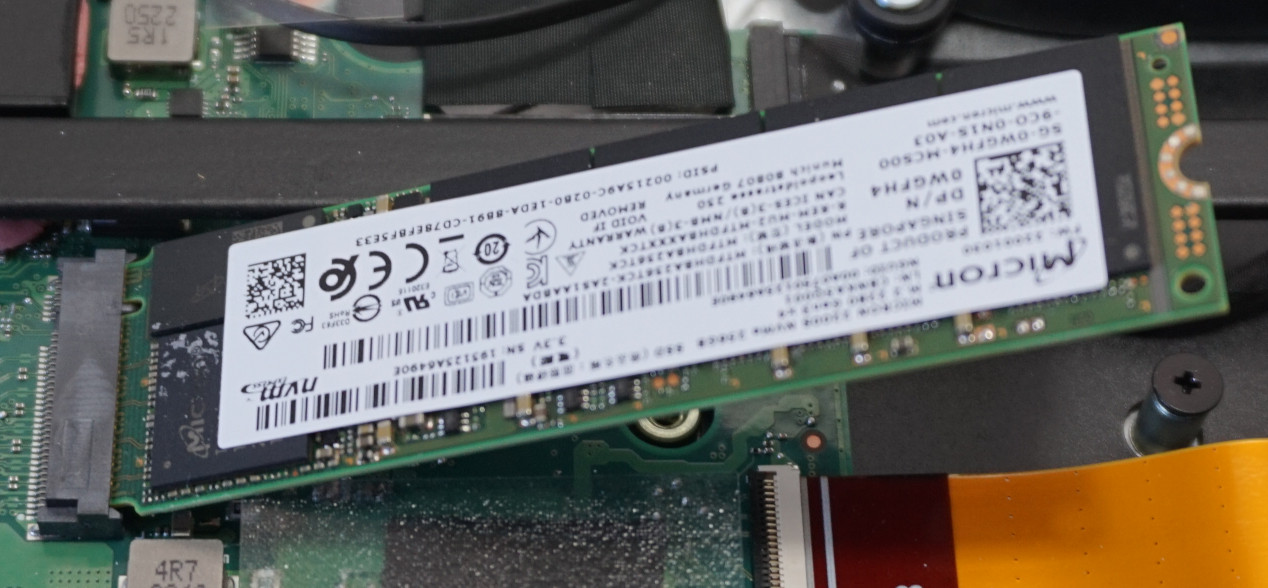
The comparison with the Lenovo Legion Pro 5 shows how the test should go. The cooling, which was found on the predecessor's base plate, is missing here and is something clearly reflected in our results.
However, this appears to have a negligible influence on the gaming performance. At the very least, we weren't able to determine any deviations to speak of, compared to competitors equipped with similar hardware.

| Acer Nitro 17 AN17-51-71ER Samsung PM9A1 MZVL21T0HCLR | Lenovo Legion Pro 5 16IRX8 SK hynix PC801 HFS512GEJ9X115N | Asus TUF Gaming A16 FA617XS Micron 2400 MTFDKBA512QFM | Schenker XMG Focus 17 (E23) Crucial P5 Plus 1TB CT1000P5PSSD8 | Medion Erazer Defender P40 Phison PS5021-E21 1TB | Acer Nitro 5 AN515-46-R1A1 Micron 3400 1TB MTFDKBA1T0TFH | MSI Pulse GL76 12UGK Micron 3400 1TB MTFDKBA1T0TFH | Average Samsung PM9A1 MZVL21T0HCLR | Average of class Gaming | |
|---|---|---|---|---|---|---|---|---|---|
| Drive Performance rating | |||||||||
| Percent (pt) | 87.2 | 84.6 -3% | 41.7 -52% | 72.4 -17% | 75 -14% | 72.2 -17% | 78.5 -10% | 74 -15% | 74.6 -14% |
| DiskSpd | -6% | -50% | -11% | -7% | -11% | -1% | -11% | -9% | |
| seq read (MB/s) | 3670 | 5346 46% | 2253 -39% | 3510 -4% | 2501 -32% | 3770 3% | 3889 6% | 3766 ? 3% | 3512 ? -4% |
| seq write (MB/s) | 4284 | 1495 -65% | 1671 -61% | 3961 -8% | 4675 9% | 4216 -2% | 4579 7% | 3581 ? -16% | 3938 ? -8% |
| seq q8 t1 read (MB/s) | 5276 | 7127 35% | 4294 -19% | 6520 24% | 5009 -5% | 6689 27% | 6697 27% | 6483 ? 23% | 7451 ? 41% |
| seq q8 t1 write (MB/s) | 5114 | 4903 -4% | 1773 -65% | 4907 -4% | 4797 -6% | 4664 -9% | 4956 -3% | 4810 ? -6% | 5905 ? 15% |
| 4k q1 t1 read (MB/s) | 70.6 | 65.9 -7% | 32.8 -54% | 53.6 -24% | 51.1 -28% | 59.5 -16% | 69.8 -1% | 76.5 ? 8% | 70.1 ? -1% |
| 4k q1 t1 write (MB/s) | 267 | 328 23% | 132 -51% | 205 -23% | 281 5% | 151.1 -43% | 263 -1% | 188.5 ? -29% | 195.9 ? -27% |
| 4k q32 t16 read (MB/s) | 3726 | 2889 -22% | 1705 -54% | 2835 -24% | 3335 -10% | 2819 -24% | 2861 -23% | 2586 ? -31% | 2279 ? -39% |
| 4k q32 t16 write (MB/s) | 3355 | 1457 -57% | 1585 -53% | 2664 -21% | 3737 11% | 2670 -20% | 2700 -20% | 1959 ? -42% | 1844 ? -45% |
| AS SSD | -7% | -94% | -22% | -17% | -20% | -31% | -20% | -18% | |
| Score Total (Points) | 8345 | 9125 9% | 4261 -49% | 6631 -21% | 7599 -9% | 7145 -14% | 7307 -12% | 6892 ? -17% | 6891 ? -17% |
| Score Read (Points) | 3277 | 3235 -1% | 1830 -44% | 2593 -21% | 2625 -20% | 2804 -14% | 2792 -15% | 2433 ? -26% | 2250 ? -31% |
| Score Write (Points) | 3417 | 4288 25% | 1604 -53% | 2674 -22% | 3618 6% | 2979 -13% | 3117 -9% | 3284 ? -4% | 3562 ? 4% |
| Seq Read (MB/s) | 4853 | 5856.12 21% | 3690.93 -24% | 3344 -31% | 3667.76 -24% | 4920.82 1% | 4843.81 0% | 4901 ? 1% | 5567 ? 15% |
| Seq Write (MB/s) | 4373 | 4750.28 9% | 1633.49 -63% | 4175 -5% | 3884.67 -11% | 3550.64 -19% | 4200.32 -4% | 3334 ? -24% | 3949 ? -10% |
| 4K Read (MB/s) | 73.43 | 77.12 5% | 42.75 -42% | 53.4 -27% | 63.89 -13% | 56.67 -23% | 67.56 -8% | 72.4 ? -1% | 71 ? -3% |
| 4K Write (MB/s) | 234.6 | 276.66 18% | 118.17 -50% | 177.9 -24% | 207.32 -12% | 135.96 -42% | 213.7 -9% | 186 ? -21% | 216 ? -8% |
| 4K-64 Read (MB/s) | 2718 | 2572.63 -5% | 1429.83 -47% | 2205 -19% | 2194.79 -19% | 2254.97 -17% | 2240.41 -18% | 1871 ? -31% | 1623 ? -40% |
| 4K-64 Write (MB/s) | 2745 | 3536.78 29% | 1411.25 -49% | 2078 -24% | 3021.8 10% | 2488.35 -9% | 2483.08 -10% | 2764 ? 1% | 2952 ? 8% |
| Access Time Read * (ms) | 0.044 | 0.058 | 0.03 | 0.08 | 0.057 | 0.038 | 0.0377 ? | 0.06402 ? | |
| Access Time Write * (ms) | 0.019 | 0.053 -179% | 0.118 -521% | 0.023 -21% | 0.033 -74% | 0.029 -53% | 0.061 -221% | 0.03431 ? -81% | 0.03815 ? -101% |
| Total Average (Program / Settings) | -5% /
-6% | -65% /
-73% | -17% /
-17% | -13% /
-12% | -16% /
-16% | -14% /
-17% | -15% /
-16% | -14% /
-14% |
* ... smaller is better
Continuous performance Read: DiskSpd Read Loop, Queue Depth 8
Graphics card
The RTX 4060 is a mid-range GPU that can reliably compete with the previous generation's RTX 3070 Ti. That is remarkable as the number of shaders as well as the various cores for ray tracing or tensor calculations have been reduced by something approaching 50 %. At 8 GB, only the VRAM has remained the same and could be a little meagre, especially when it comes to 4K resolutions - at least for individual game titles.
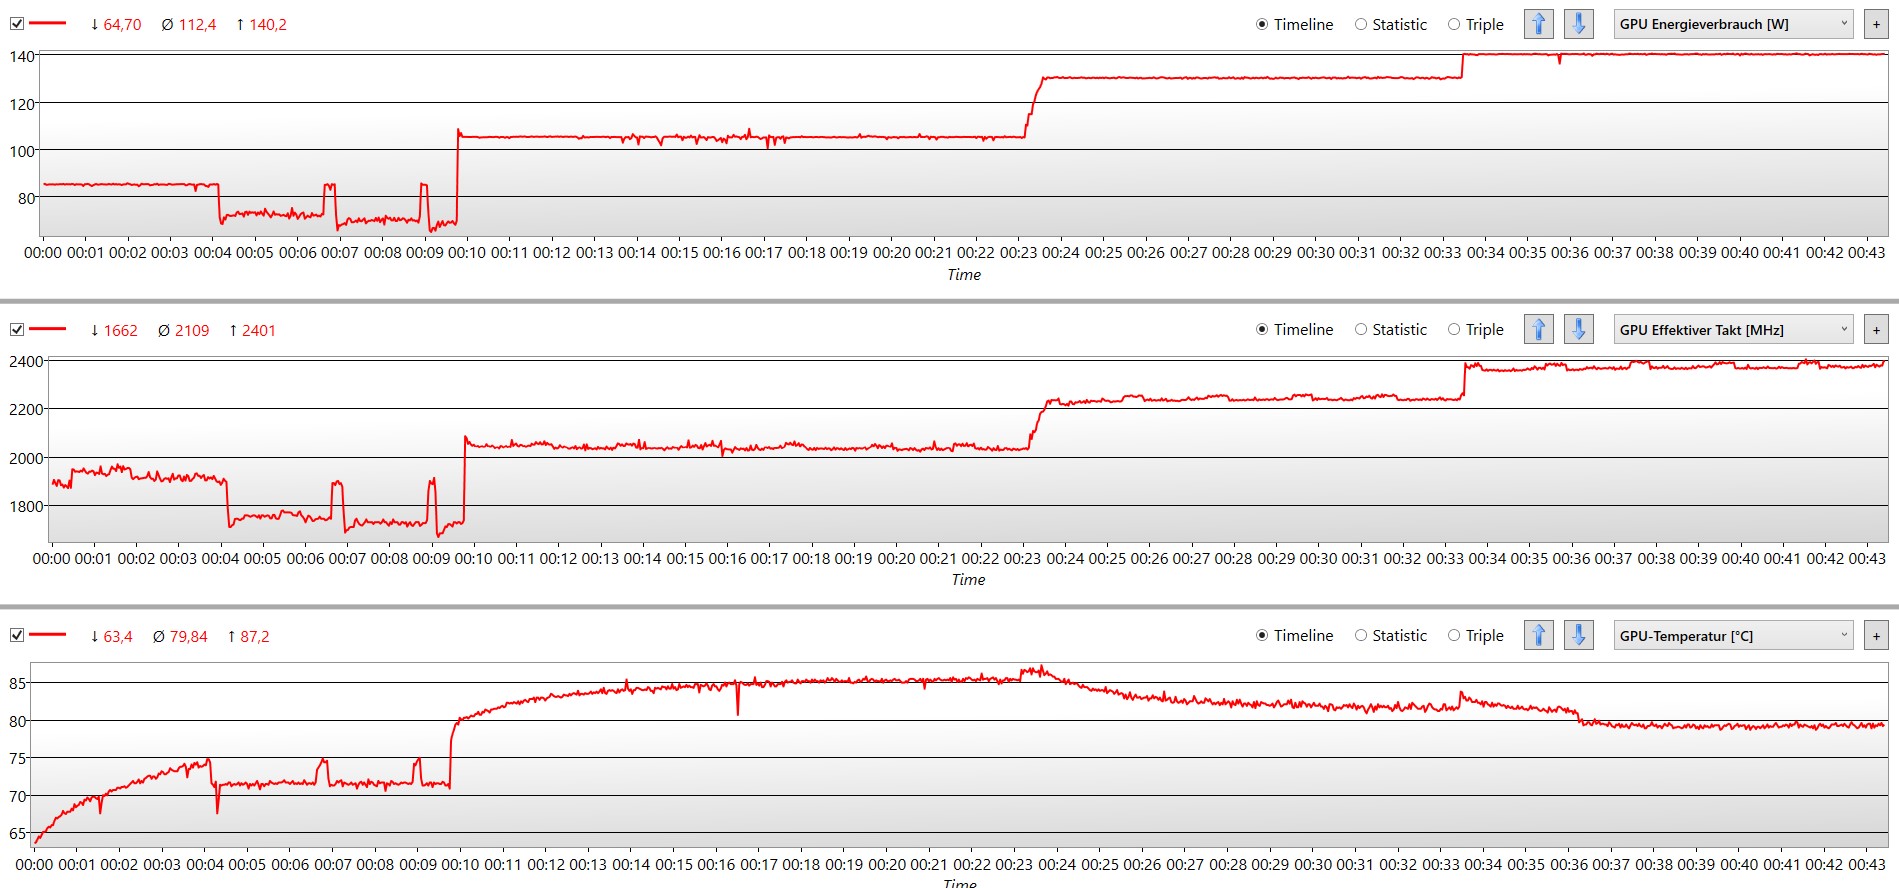
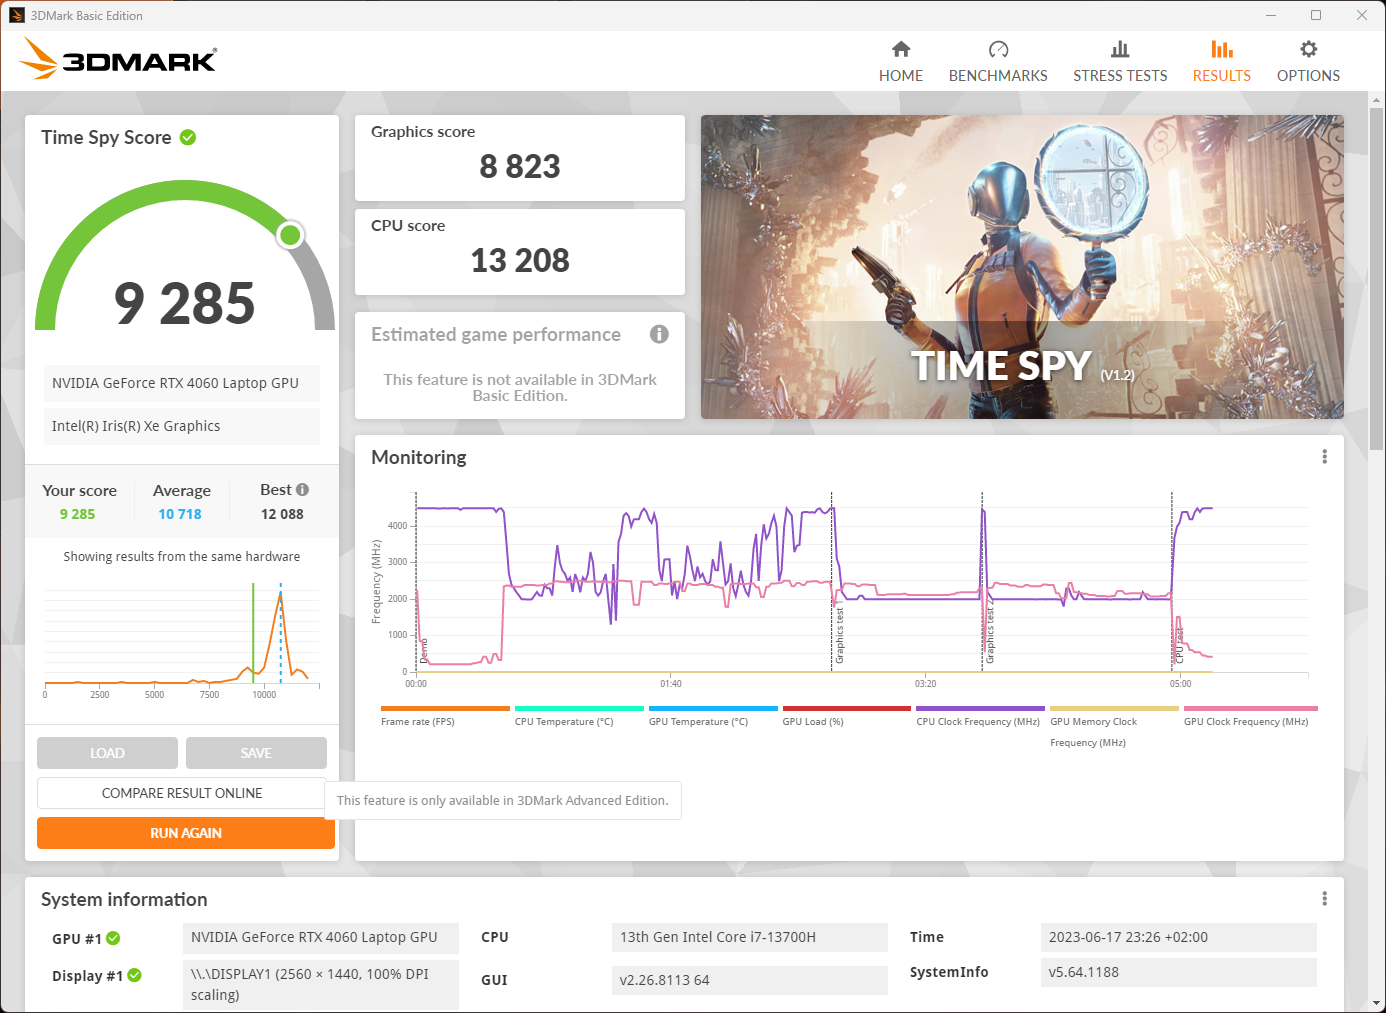
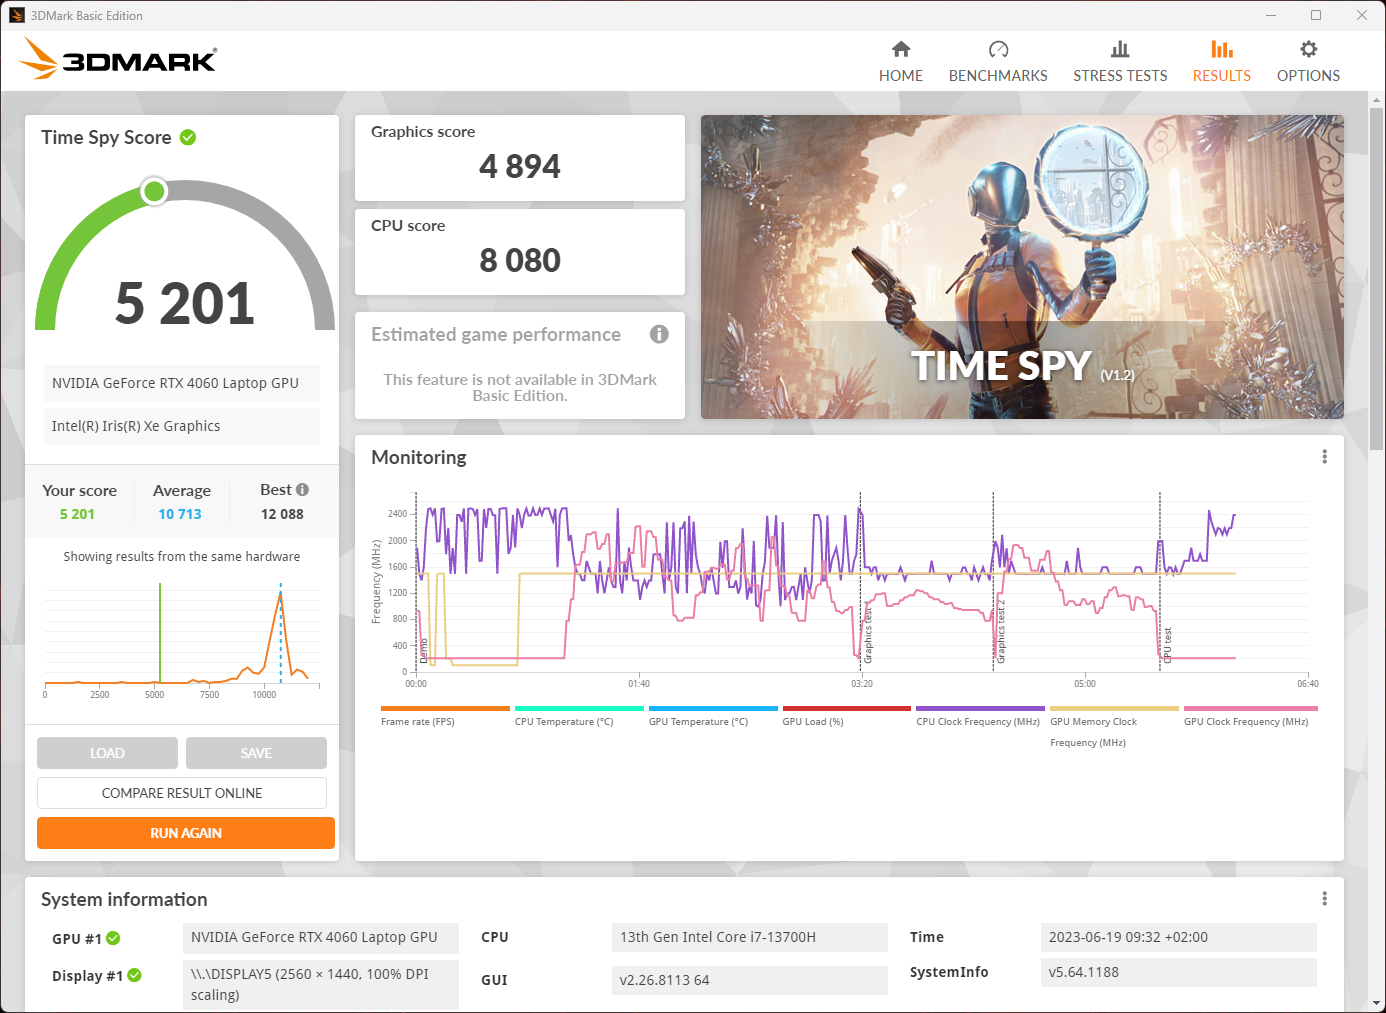
The Acer Nitro 17's graphics chip is supplied with a maximum of 140 watts, whereby 25 watts are diverted from the processor as a dynamic boost. The graphic on the right shows the value in the "Turbo" mode is also stable in the long term. In the other modes, the power consumption is reduced. In "Quiet", 85 watts are required. In "Balanced" mode, 105 watts are permitted and in "Performance", a maximum of 130 watts are accessed. Battery mode is missing in the diagram. We subsequently recorded 15 watts which are sufficient even for The Witcher 3 at the highest detail settings.
The 3DMark was carried out at a maximum power supply of 130 watts ("Performance" mode) and sat at a level comparable to competitors such as the Erazer Defender P40 or Legion Pro 5 with an identical GPU. Also in this area, the balanced mode results are partially better than those recorded in the performance mode although the graphics card is only supplied with 105 watts. Since the processor is simultaneously not completely responsible for heat production, the GPU can reliably run in this mode at maximum power. By contrast, in the "Performance" mode, when the critical temperature is reached, the clock speed is limited for a short period and that is something that doesn't happen as quickly in the balanced mode.
In an extensive analysis of the current Nvidia RTX-4000 GPUs, we highlighted that the low-spec RTX 4050 and RTX 4060 barely experience a performance boost when the power consumption is increased to over 100 watts.
You can find additional benchmarks and information in our GPU benchmark list.
| 3DMark Performance rating - Percent | |
| Average of class Gaming | |
| Schenker XMG Focus 17 (E23) | |
| Acer Nitro 5 AN515-46-R1A1 | |
| Medion Erazer Defender P40 | |
| Acer Nitro 17 AN17-51-71ER | |
| Acer Nitro 17 AN17-51-71ER | |
| Average NVIDIA GeForce RTX 4060 Laptop GPU | |
| Asus TUF Gaming A16 FA617XS | |
| Lenovo Legion Pro 5 16IRX8 -1! | |
| MSI Pulse GL76 12UGK -1! | |
| 3DMark 11 - 1280x720 Performance GPU | |
| Average of class Gaming (21841 - 80022, n=103, last 2 years) | |
| Schenker XMG Focus 17 (E23) | |
| Lenovo Legion Pro 5 16IRX8 | |
| Acer Nitro 5 AN515-46-R1A1 | |
| Medion Erazer Defender P40 | |
| Acer Nitro 17 AN17-51-71ER (Ausgeglichen) | |
| Acer Nitro 17 AN17-51-71ER | |
| Average NVIDIA GeForce RTX 4060 Laptop GPU (28136 - 38912, n=57) | |
| MSI Pulse GL76 12UGK | |
| Asus TUF Gaming A16 FA617XS | |
| 3DMark 11 Performance | 31129 points | |
| 3DMark Cloud Gate Standard Score | 61140 points | |
| 3DMark Fire Strike Score | 23561 points | |
| 3DMark Time Spy Score | 10759 points | |
Help | ||
* ... smaller is better
Gaming performance
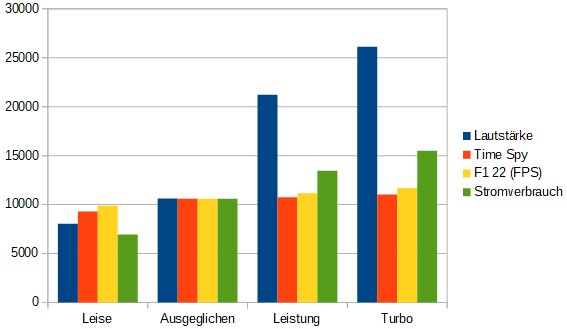
When it comes to gaming performance, there are no major surprises. Once again, with its more powerful CPU, the Medion Erazer Defender P40 just loses out. There's likely to be a more significant gap to the Acer Nitro 5 AN515, with its RTX 3070 Ti. Once more, in new games such as F1 22, both gaming laptops see eye to eye. We barely determined any difference between balanced and performance modes. It was more or less a draw when it came to the 3DMark score. In Witcher 3, the balanced mode trailed by around 2 %. F1 22 did around 5 % worse.
Additionally, in the graphic on the right, we also added the system's power consumption and the recorded noise level related to the gain in performance. To achieve this, all the values were normalised in the 3DMark Time Spy balanced mode result and the logarithmic noise level scale was converted into linear values. From this, it is possible to see that a minimal improvement in performance is easier on the ears than the electricity bill. As we already mentioned in our graphics card analysis, the clearly shows that the maxing out of the RTX 4060's TGP is responsible for more in the way of emissions but not quite as much additional power.
| The Witcher 3 - 1920x1080 Ultra Graphics & Postprocessing (HBAO+) | |
| Average of class Gaming (104.7 - 240, n=6, last 2 years) | |
| Schenker XMG Focus 17 (E23) | |
| Acer Nitro 5 AN515-46-R1A1 | |
| Lenovo Legion Pro 5 16IRX8 | |
| Acer Nitro 17 AN17-51-71ER | |
| Medion Erazer Defender P40 | |
| Asus TUF Gaming A16 FA617XS | |
| MSI Pulse GL76 12UGK | |
| Strange Brigade - 1920x1080 ultra AA:ultra AF:16 | |
| Average of class Gaming (76.3 - 456, n=86, last 2 years) | |
| Schenker XMG Focus 17 (E23) | |
| Acer Nitro 17 AN17-51-71ER | |
| Medion Erazer Defender P40 | |
| Acer Nitro 5 AN515-46-R1A1 | |
| MSI Pulse GL76 12UGK | |
| Asus TUF Gaming A16 FA617XS | |
| Hogwarts Legacy | |
| 1920x1080 High Preset AA:High T | |
| Schenker XMG Focus 17 (E23) | |
| Average NVIDIA GeForce RTX 4060 Laptop GPU (70.8 - 107.7, n=6) | |
| Acer Nitro 17 AN17-51-71ER | |
| Asus TUF Gaming A16 FA617XS | |
| 1920x1080 Ultra Preset AA:High T | |
| Average of class Gaming (n=1last 2 years) | |
| Average NVIDIA GeForce RTX 4060 Laptop GPU (61.9 - 91.9, n=6) | |
| Schenker XMG Focus 17 (E23) | |
| Acer Nitro 17 AN17-51-71ER | |
| Asus TUF Gaming A16 FA617XS | |
In the Witcher 3 endurance test, the system performance remained stable. The fluctuations result from the game's day and night cycle. The recorded fps rates in balanced mode are almost identical. This trumps, for example, the Medion Erazer Defender P40 which consumes more power.
A minimal tendency toward decreasing values can be seen in the balanced mode (green). The fans speed limitation ensures a slight drop in the frame rate in the course of an hour. In the end, even in the energy-saving mode, the values are quite a bit over 80fps.
Witcher 3 FPS diagram
| low | med. | high | ultra | QHD | |
|---|---|---|---|---|---|
| GTA V (2015) | 177.8 | 114.1 | |||
| The Witcher 3 (2015) | 210 | 105 | |||
| Dota 2 Reborn (2015) | 153.4 | 135.7 | |||
| Final Fantasy XV Benchmark (2018) | 103.3 | 73.7 | |||
| X-Plane 11.11 (2018) | 111.7 | ||||
| Far Cry 5 (2018) | 151 | 142 | 101 | ||
| Strange Brigade (2018) | 227 | 195.2 | 129.3 | ||
| Cyberpunk 2077 1.6 (2022) | 86.4 | 79.4 | 49.1 | ||
| F1 22 (2022) | 198.4 | 64.2 | 40.9 | ||
| Hogwarts Legacy (2023) | 76 | 65 | 45 | ||
| Star Wars Jedi Survivor (2023) | 66 | 60 | 39 |
Emissions - Gaming also in quiet environments
Noise emissions
In performance mode, the fan noise is loud and tends to be unbearable in turbo mode. Staying, as we did, in performance mode, a decent pair of headphones will do the job of suppressing the permanent noise. We did not observe any spontaneous whining or frequent fan speed changes.
The Nitro 17 is actually never completely silent. Even in battery mode, the fans are occasionally audible with them getting a little louder when selecting "Balanced". The noise heard here is well below room volume and can be easily drowned out by the built-in speakers. Gaming at quite acceptable performance levels is always possible, even in quiet surroundings and without headphones.
Noise level
| Idle |
| 24 / 24 / 32.32 dB(A) |
| Load |
| 35.18 / 54.78 dB(A) |
 | ||
30 dB silent 40 dB(A) audible 50 dB(A) loud |
||
min: | ||
| Acer Nitro 17 AN17-51-71ER GeForce RTX 4060 Laptop GPU, i7-13700H, Samsung PM9A1 MZVL21T0HCLR | Lenovo Legion Pro 5 16IRX8 GeForce RTX 4060 Laptop GPU, i7-13700HX, SK hynix PC801 HFS512GEJ9X115N | Asus TUF Gaming A16 FA617XS Radeon RX 7600S, R9 7940HS, Micron 2400 MTFDKBA512QFM | Schenker XMG Focus 17 (E23) GeForce RTX 4070 Laptop GPU, i9-13900HX, Crucial P5 Plus 1TB CT1000P5PSSD8 | Medion Erazer Defender P40 GeForce RTX 4060 Laptop GPU, i7-13700HX, Phison PS5021-E21 1TB | Acer Nitro 5 AN515-46-R1A1 GeForce RTX 3070 Ti Laptop GPU, R7 6800H, Micron 3400 1TB MTFDKBA1T0TFH | MSI Pulse GL76 12UGK GeForce RTX 3070 Laptop GPU, i7-12700H, Micron 3400 1TB MTFDKBA1T0TFH | |
|---|---|---|---|---|---|---|---|
| Noise | 6% | -2% | -7% | -13% | -16% | -3% | |
| off / environment * (dB) | 24 | 23 4% | 25 -4% | 24 -0% | 25 -4% | 25 -4% | 24.1 -0% |
| Idle Minimum * (dB) | 24 | 23.1 4% | 25 -4% | 24 -0% | 26 -8% | 25 -4% | 26.9 -12% |
| Idle Average * (dB) | 24 | 23.1 4% | 26 -8% | 24 -0% | 27 -13% | 28.6 -19% | 26.9 -12% |
| Idle Maximum * (dB) | 32.32 | 26.6 18% | 28 13% | 26.47 18% | 32 1% | 44.3 -37% | 27 16% |
| Load Average * (dB) | 35.18 | 34.7 1% | 43 -22% | 55.72 -58% | 53 -51% | 47.6 -35% | 43.8 -25% |
| Witcher 3 ultra * (dB) | 54.78 | 47.6 13% | 51 7% | 57.94 -6% | 56 -2% | 44.7 18% | |
| Load Maximum * (dB) | 54.78 | 54.8 -0% | 53 3% | 57.94 -6% | 64 -17% | 53.6 2% | 58.3 -6% |
* ... smaller is better
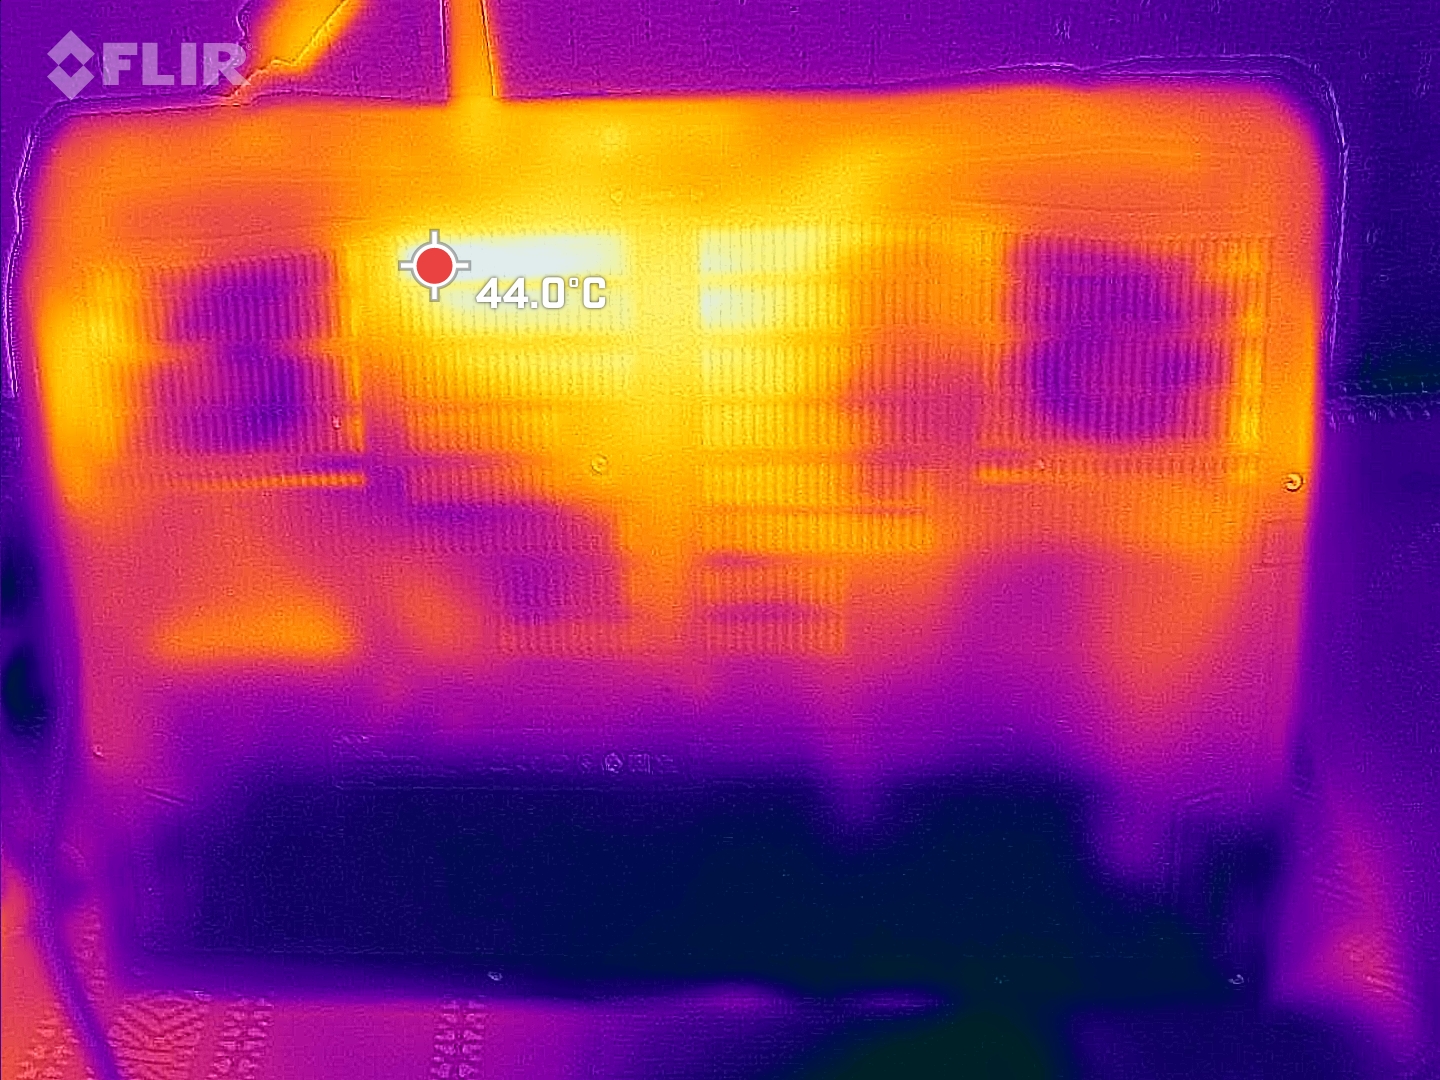
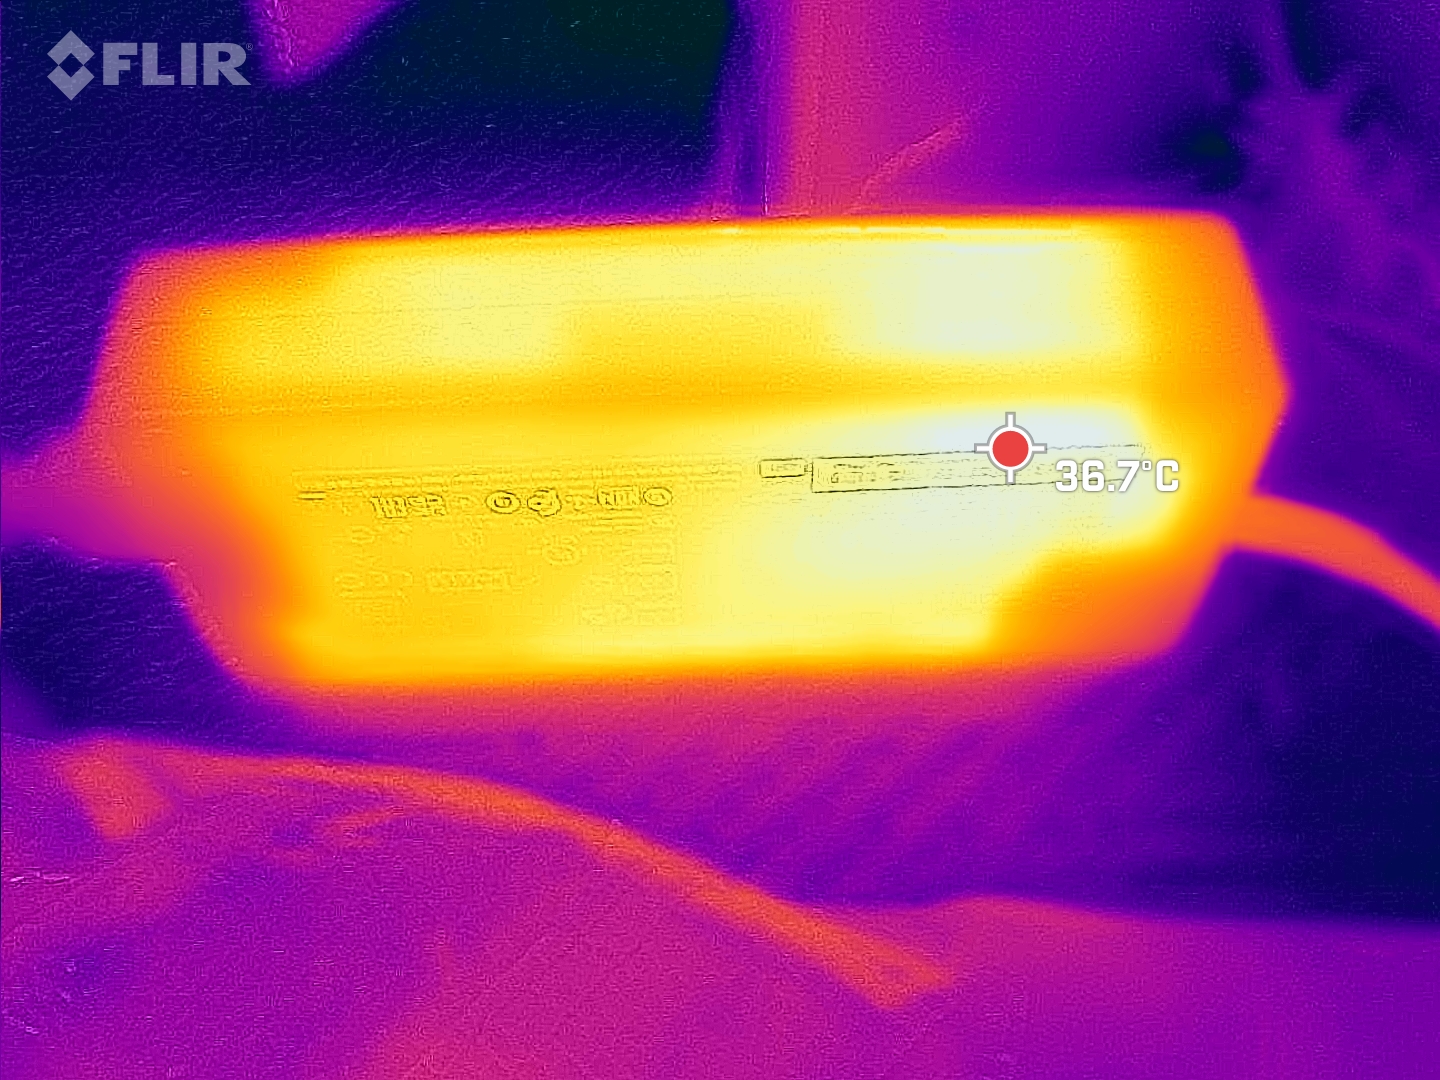
Temperature
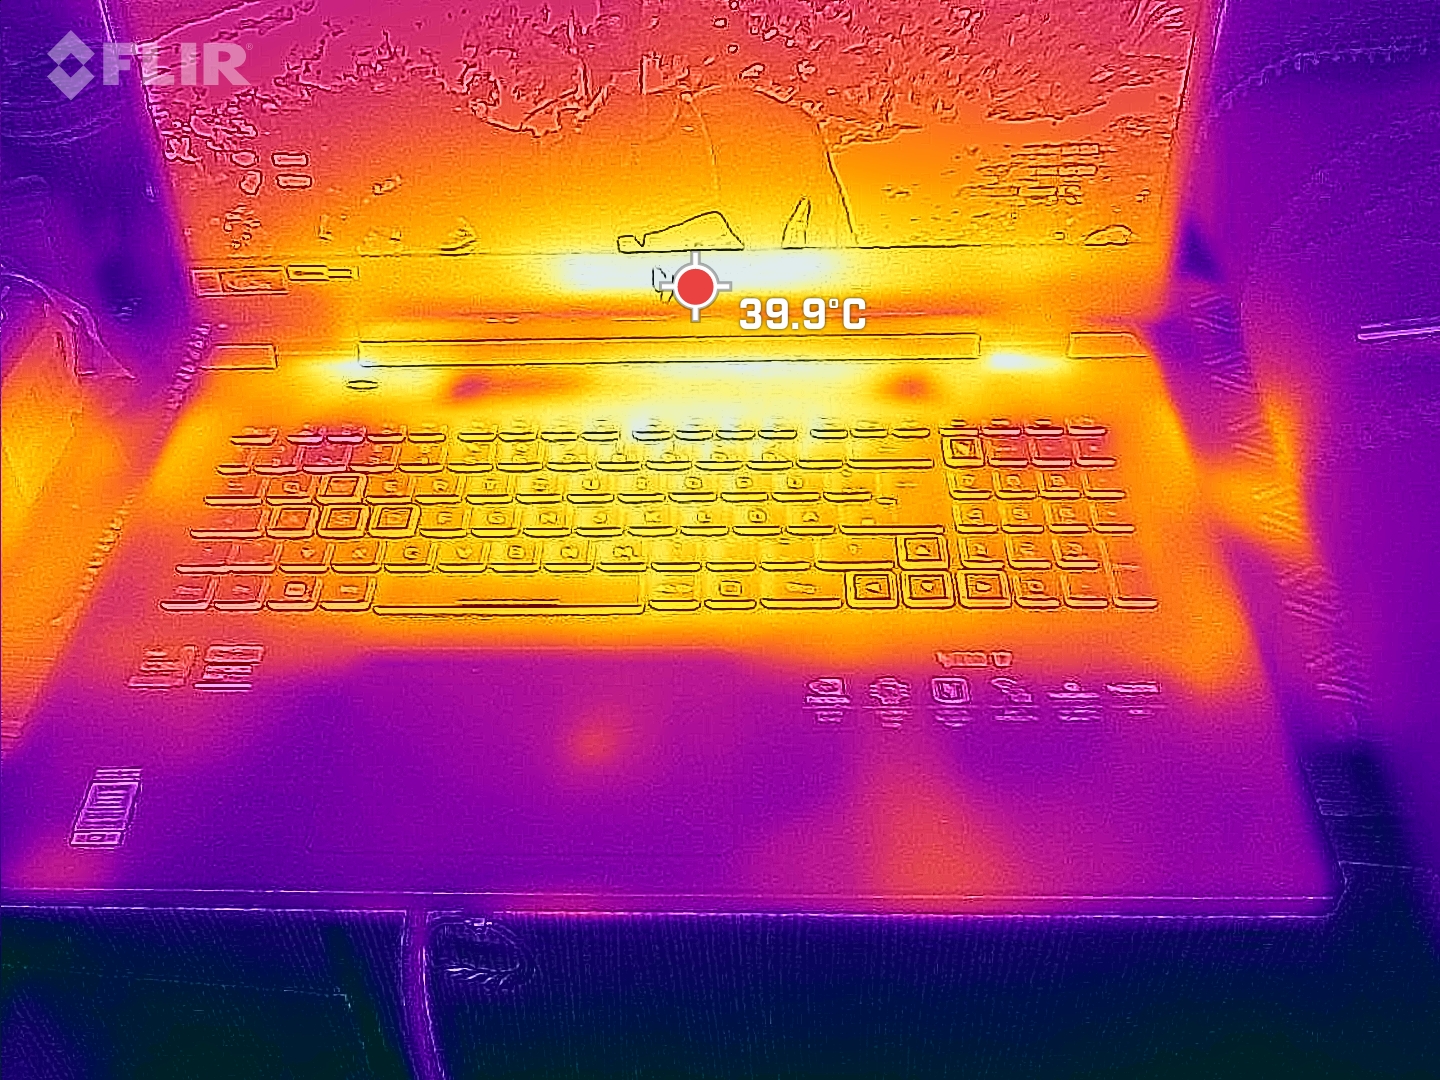
In the center of the keyboard, we measured well over 40 °C with the temperatures rising a little further on the underside of the device. When gaming, it can't really be called a pleasant experience and the laptop should only really be used on a hard surface. This also applies to undemanding tasks. Even in this area, considerable heat production is tangible.
The "Balanced" mode doesn't improve matters. With these settings, we even measured a higher temperature than when using the faster and louder modes. The only thing that helps on hot days is to manually (and very easily) increase the fan speed by using NitroSense.
(-) The maximum temperature on the upper side is 46 °C / 115 F, compared to the average of 40.4 °C / 105 F, ranging from 21.2 to 68.8 °C for the class Gaming.
(-) The bottom heats up to a maximum of 51 °C / 124 F, compared to the average of 43.2 °C / 110 F
(+) In idle usage, the average temperature for the upper side is 31.2 °C / 88 F, compared to the device average of 33.9 °C / 93 F.
(-) Playing The Witcher 3, the average temperature for the upper side is 38.2 °C / 101 F, compared to the device average of 33.9 °C / 93 F.
(+) The palmrests and touchpad are reaching skin temperature as a maximum (33 °C / 91.4 F) and are therefore not hot.
(-) The average temperature of the palmrest area of similar devices was 28.8 °C / 83.8 F (-4.2 °C / -7.6 F).
| Acer Nitro 17 AN17-51-71ER Intel Core i7-13700H, NVIDIA GeForce RTX 4060 Laptop GPU | Lenovo Legion Pro 5 16IRX8 Intel Core i7-13700HX, NVIDIA GeForce RTX 4060 Laptop GPU | Asus TUF Gaming A16 FA617XS AMD Ryzen 9 7940HS, AMD Radeon RX 7600S | Schenker XMG Focus 17 (E23) Intel Core i9-13900HX, NVIDIA GeForce RTX 4070 Laptop GPU | Medion Erazer Defender P40 Intel Core i7-13700HX, NVIDIA GeForce RTX 4060 Laptop GPU | Acer Nitro 5 AN515-46-R1A1 AMD Ryzen 7 6800H, NVIDIA GeForce RTX 3070 Ti Laptop GPU | MSI Pulse GL76 12UGK Intel Core i7-12700H, NVIDIA GeForce RTX 3070 Laptop GPU | |
|---|---|---|---|---|---|---|---|
| Heat | 5% | 3% | -9% | 12% | 4% | 1% | |
| Maximum Upper Side * (°C) | 46 | 42.8 7% | 53 -15% | 50 -9% | 42 9% | 48.1 -5% | 44.2 4% |
| Maximum Bottom * (°C) | 51 | 50 2% | 48 6% | 56 -10% | 45 12% | 49.7 3% | 45.2 11% |
| Idle Upper Side * (°C) | 34 | 29.6 13% | 30 12% | 37 -9% | 28 18% | 30 12% | 35.4 -4% |
| Idle Bottom * (°C) | 33 | 34 -3% | 30 9% | 36 -9% | 30 9% | 31.7 4% | 35 -6% |
* ... smaller is better
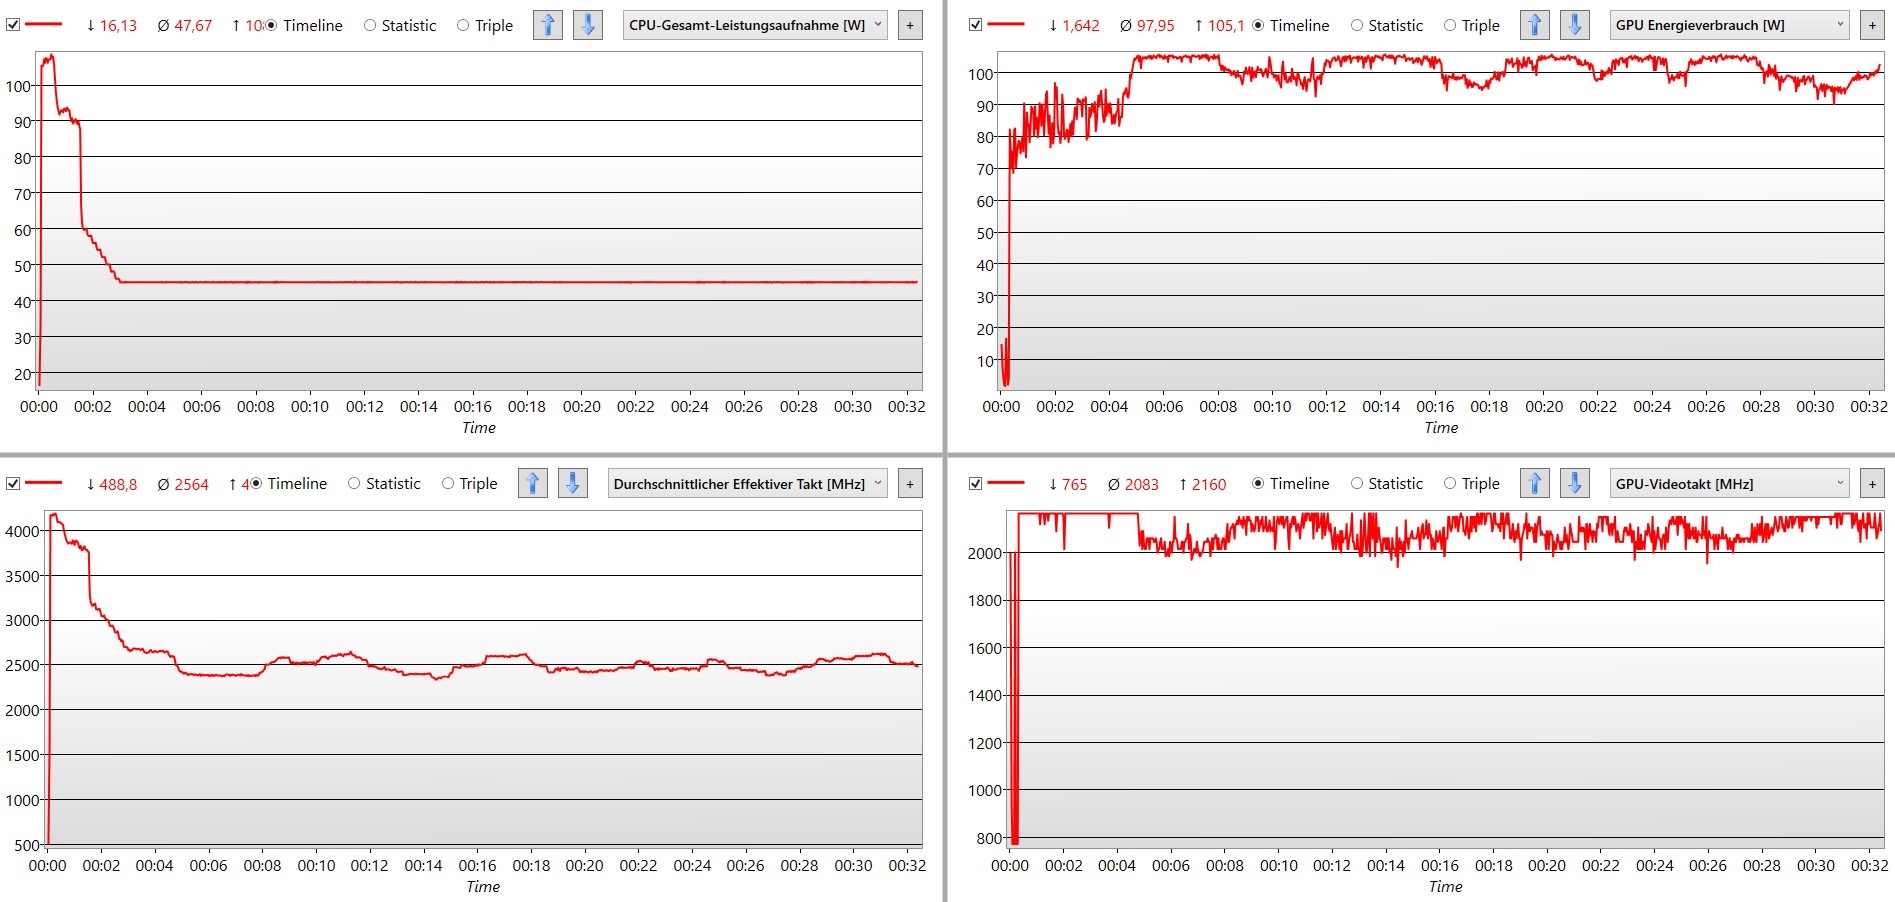
Stress test
If the system's maximum performance is required, the processor's power consumption increases to over 100 watts for a short time and then sinks permanently to 45 watts. After a short time, the clock speed also goes no higher than 2.5 GHz.
Conversely, the graphics chip is permanently supplied with 105 watts. Based on the maximum supply of 130 watts in "Performance" mode and minus dynamic boost - which the CPU cannot do without in the stress test - this represents the maximum possible load. The clock speeds also remain on a high but stable level and only sit minimally below their theoretical maximum. This makes the Acer Nitro 17 well-equipped to handle graphically intensive tasks, even in continuous use.
At the same time, the temperatures of the components remain below 90 °C.
Speakers
The small Nitro 17 stereo speakers do a good job of reproducing deep bass sounds - for a laptop. Likewise, voices sound good and can be heard precisely and in great detail. This means the most important frequency ranges for games are well covered.
Even music can be listened to on the laptop, even if the lower mids and high basses lack power. The result is that rock music and guitar or drum-based tracks are a little less than exciting.
Acer Nitro 17 AN17-51-71ER audio analysis
(±) | speaker loudness is average but good (79.1 dB)
Bass 100 - 315 Hz
(-) | nearly no bass - on average 22% lower than median
(-) | bass is not linear (16.5% delta to prev. frequency)
Mids 400 - 2000 Hz
(±) | higher mids - on average 5.2% higher than median
(+) | mids are linear (4.1% delta to prev. frequency)
Highs 2 - 16 kHz
(+) | balanced highs - only 1.6% away from median
(+) | highs are linear (5.5% delta to prev. frequency)
Overall 100 - 16.000 Hz
(±) | linearity of overall sound is average (16.9% difference to median)
Compared to same class
» 44% of all tested devices in this class were better, 11% similar, 45% worse
» The best had a delta of 6%, average was 18%, worst was 132%
Compared to all devices tested
» 30% of all tested devices were better, 8% similar, 62% worse
» The best had a delta of 4%, average was 23%, worst was 134%
Apple MacBook Pro 16 2021 M1 Pro audio analysis
(+) | speakers can play relatively loud (84.7 dB)
Bass 100 - 315 Hz
(+) | good bass - only 3.8% away from median
(+) | bass is linear (5.2% delta to prev. frequency)
Mids 400 - 2000 Hz
(+) | balanced mids - only 1.3% away from median
(+) | mids are linear (2.1% delta to prev. frequency)
Highs 2 - 16 kHz
(+) | balanced highs - only 1.9% away from median
(+) | highs are linear (2.7% delta to prev. frequency)
Overall 100 - 16.000 Hz
(+) | overall sound is linear (4.6% difference to median)
Compared to same class
» 0% of all tested devices in this class were better, 0% similar, 100% worse
» The best had a delta of 5%, average was 17%, worst was 45%
Compared to all devices tested
» 0% of all tested devices were better, 0% similar, 100% worse
» The best had a delta of 4%, average was 23%, worst was 134%
Energy management - The Acer Nitro 17 has efficient hardware
Power consumption
In idle use, the Nitro 17 is very economical with a minimum of 8 watts and a maximum of 15. Other gaming laptops such as the Schenker XMG Focus 17 (E23) continuously draw more than 17 watts. The Witcher 3 test highlighted the component's efficiency. For example, the Medion Erazer Defender P40 requires almost an additional 30 watts but can only manage lower frame rates.
We measured a maximum of 263 watts meaning the monstrous, heavy 330-watt PSU is more than sufficient.
| Off / Standby | |
| Idle | |
| Load |
|
Key:
min: | |
| Acer Nitro 17 AN17-51-71ER i7-13700H, GeForce RTX 4060 Laptop GPU, Samsung PM9A1 MZVL21T0HCLR, , 2560x1440, 17.3" | Lenovo Legion Pro 5 16IRX8 i7-13700HX, GeForce RTX 4060 Laptop GPU, SK hynix PC801 HFS512GEJ9X115N, IPS, 2560x1600, 16" | Asus TUF Gaming A16 FA617XS R9 7940HS, Radeon RX 7600S, Micron 2400 MTFDKBA512QFM, IPS, 1920x1200, 16" | Schenker XMG Focus 17 (E23) i9-13900HX, GeForce RTX 4070 Laptop GPU, Crucial P5 Plus 1TB CT1000P5PSSD8, IPS, 2560x1440, 17.3" | Medion Erazer Defender P40 i7-13700HX, GeForce RTX 4060 Laptop GPU, Phison PS5021-E21 1TB, IPS, 2560x1440, 17.3" | MSI Pulse GL76 12UGK i7-12700H, GeForce RTX 3070 Laptop GPU, Micron 3400 1TB MTFDKBA1T0TFH, IPS, 1920x1080, 17.3" | Average NVIDIA GeForce RTX 4060 Laptop GPU | Average of class Gaming | |
|---|---|---|---|---|---|---|---|---|
| Power Consumption | -80% | 10% | -70% | -11% | -24% | -19% | -40% | |
| Idle Minimum * (Watt) | 8.3 | 24.5 -195% | 7 16% | 17 -105% | 8 4% | 12.4 -49% | 11.5 ? -39% | 13 ? -57% |
| Idle Average * (Watt) | 13.5 | 29.2 -116% | 10 26% | 18 -33% | 12 11% | 13.1 3% | 16 ? -19% | 18.7 ? -39% |
| Idle Maximum * (Watt) | 14.8 | 34.3 -132% | 15 -1% | 25.8 -74% | 18 -22% | 25.3 -71% | 20.3 ? -37% | 24.3 ? -64% |
| Load Average * (Watt) | 77 | 98.7 -28% | 86 -12% | 178 -131% | 101 -31% | 105.4 -37% | 92.9 ? -21% | 110.2 ? -43% |
| Witcher 3 ultra * (Watt) | 154 | 178.6 -16% | 160.6 -4% | 265 -72% | 180.8 -17% | 150 3% | ||
| Load Maximum * (Watt) | 263 | 249.6 5% | 172 35% | 275 -5% | 284 -8% | 240.5 9% | 210 ? 20% | 258 ? 2% |
* ... smaller is better
Power consumption Witcher 3 / stress test
Power consumption with an external monitor
Battery life
When it comes to battery life, the low idle power consumption makes itself noticeable. For a gaming laptop, the Acer Nitro 17 has great stamina as it managed over 8 hours in the Wi-Fi test with constantly changing websites. However, increasing the brightness to maximum reduces the battery life by around 2 hours.
When gaming in battery mode, the Nitro scored well. Instead of simply switching off the GPU and completely overwhelming the processor with a game, Acer's laptop helps itself to only a maximum of 25 watts and the GPU 15. This means we were able to play the tested The Witcher 3 for almost 2.5 hours before the laptop gave up the ghost.
| Acer Nitro 17 AN17-51-71ER i7-13700H, GeForce RTX 4060 Laptop GPU, 90 Wh | Lenovo Legion Pro 5 16IRX8 i7-13700HX, GeForce RTX 4060 Laptop GPU, 80 Wh | Asus TUF Gaming A16 FA617XS R9 7940HS, Radeon RX 7600S, 90 Wh | Medion Erazer Defender P40 i7-13700HX, GeForce RTX 4060 Laptop GPU, 73 Wh | Acer Nitro 5 AN515-46-R1A1 R7 6800H, GeForce RTX 3070 Ti Laptop GPU, 57.5 Wh | MSI Pulse GL76 12UGK i7-12700H, GeForce RTX 3070 Laptop GPU, 90 Wh | Average of class Gaming | |
|---|---|---|---|---|---|---|---|
| Battery runtime | -59% | 66% | -21% | -23% | -28% | 6% | |
| H.264 (h) | 6.9 | 12.4 80% | 5.7 -17% | 5.7 -17% | 8.64 ? 25% | ||
| WiFi v1.3 (h) | 8.2 | 3.4 -59% | 12.4 51% | 6.2 -24% | 5.8 -29% | 5.9 -28% | 7.15 ? -13% |
| Witcher 3 ultra (h) | 2.5 |
Pros
Cons
Verdict - The Nitro 17 doesn't possess any real weaknesses

Especially when compared to its predecessor, the Acer Nitro 5 AN517-5552 - a device we reviewed last year - the Acer Nitro 17 has made great improvements. The color reproduction, maximum fan noise and selection of ports are now competitive.
In particular, the balanced mode impressively demonstrates the positive effect of slightly reducing the power consumption. The fan noise drops to a tolerable level and the power consumption is reduced. This means you can play without headphones and annoying noise. The frame rates and synthetic benchmarks barely dip. However, using these settings, our sensors measured the highest temperatures.
Strong benchmark results, quiet fans and solid specs - the Acer Nitro 17 is a perfect mid-range device.
Of course, there are a few (unnecessary) flaws. The very poor webcam is no longer up-to-date. Without a passive cooling element the SSD quickly reaches its limits. Even though it's not possible to detect any influence on the gaming performance, the laptop's constant increase in temperature should have a negative impact on the device's lifespan. In addition, the Acer Nitro 17 is heavier and larger than most of the other gaming laptops with a similarly large display.
Anyone looking for more power from comparable components should take a look at the Lenovo Legion Pro 5 16IRX8, a good but also louder alternative, with this laptop also being slimmer and lighter. No longer the youngest kid on the block, but still on par in most games, is the (usually) cheaper Acer Nitro AN517-41-R5Z7 with the RTX 3070.
Price and availability
Both our Acer Nitro 17 AN17-51-71ER review model as well as the smallest variant of the Acer Nitro 17 AN17-51-59VT with an Intel Core i5-13500H and an RTX 4050 are currently unavailable in the US on Acer's online store, Amazon and Best Buy. However, our review model can currently be had on Acer's UK store for £1599.99.
Acer Nitro 17 AN17-51-71ER
- 09/07/2023 v7 (old)
Mario Petzold
Transparency
The selection of devices to be reviewed is made by our editorial team. The test sample was provided to the author as a loan by the manufacturer or retailer for the purpose of this review. The lender had no influence on this review, nor did the manufacturer receive a copy of this review before publication. There was no obligation to publish this review. As an independent media company, Notebookcheck is not subjected to the authority of manufacturers, retailers or publishers.
This is how Notebookcheck is testing
Every year, Notebookcheck independently reviews hundreds of laptops and smartphones using standardized procedures to ensure that all results are comparable. We have continuously developed our test methods for around 20 years and set industry standards in the process. In our test labs, high-quality measuring equipment is utilized by experienced technicians and editors. These tests involve a multi-stage validation process. Our complex rating system is based on hundreds of well-founded measurements and benchmarks, which maintains objectivity. Further information on our test methods can be found here.
Price comparison

