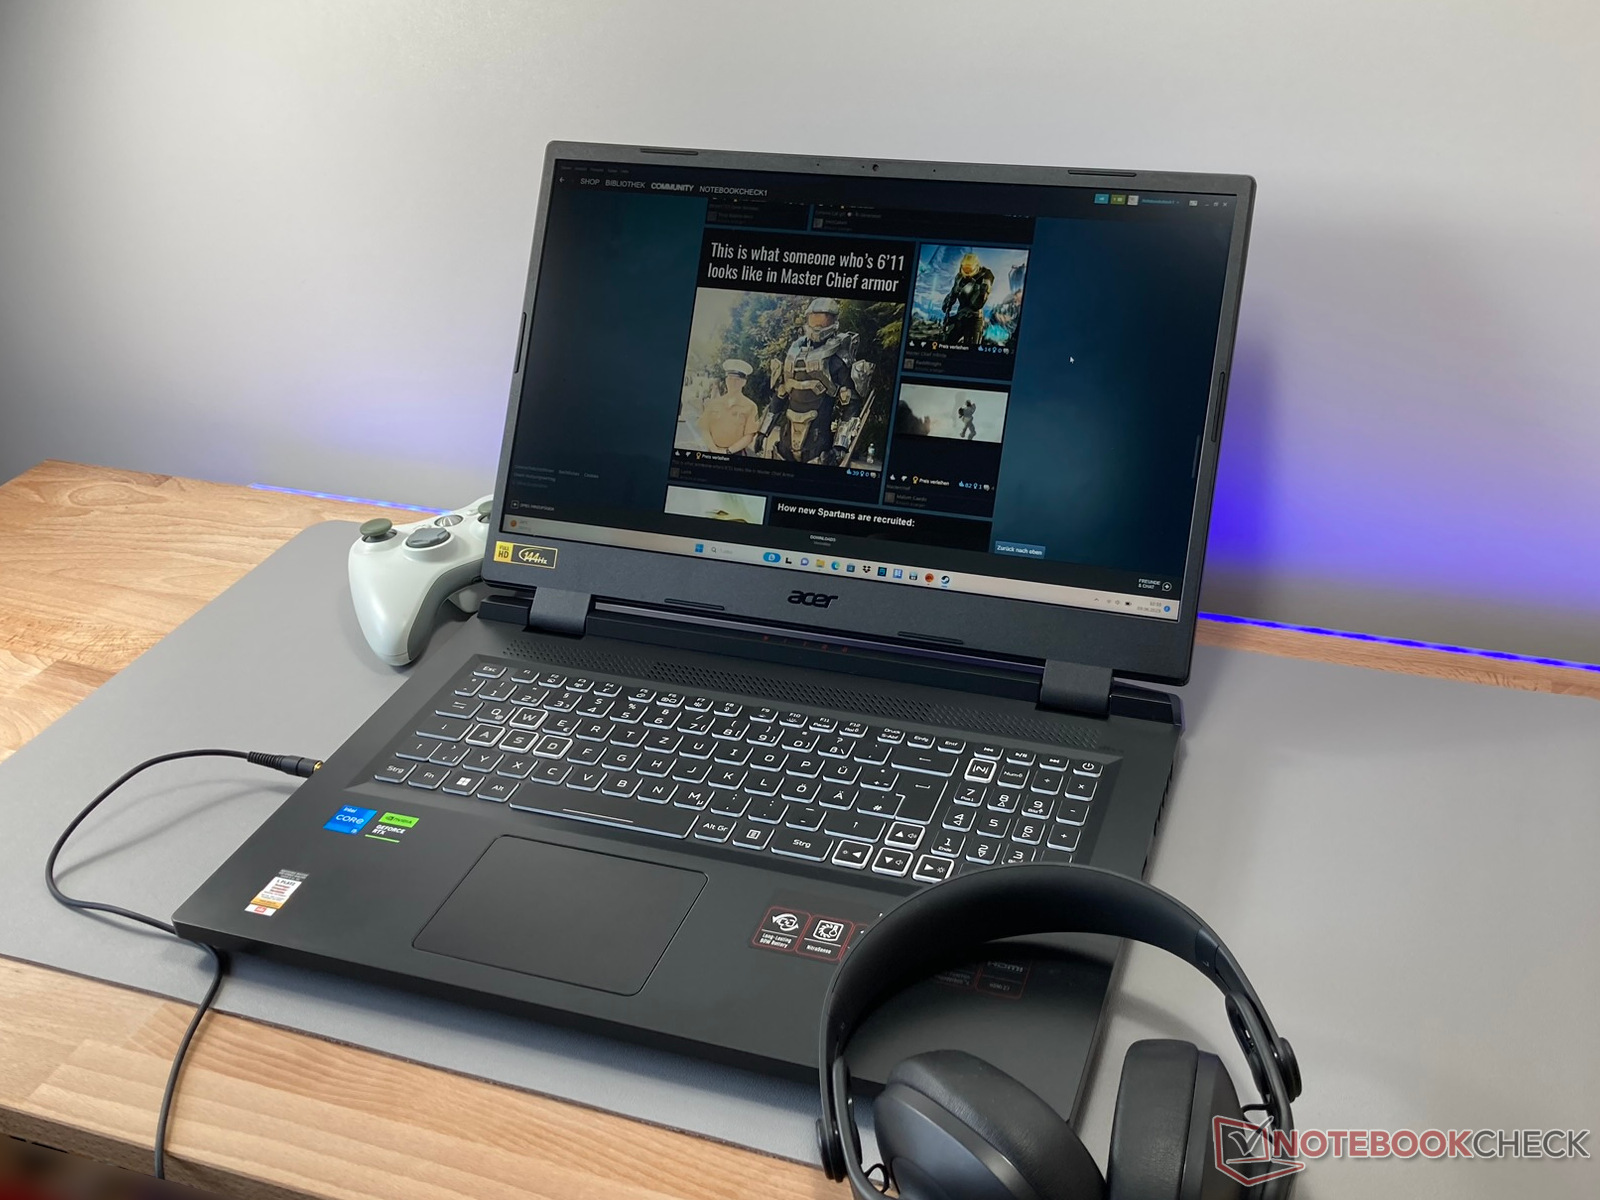
Acer Nitro 5 AN517 review: A gaming laptop with a quiet RTX 4050
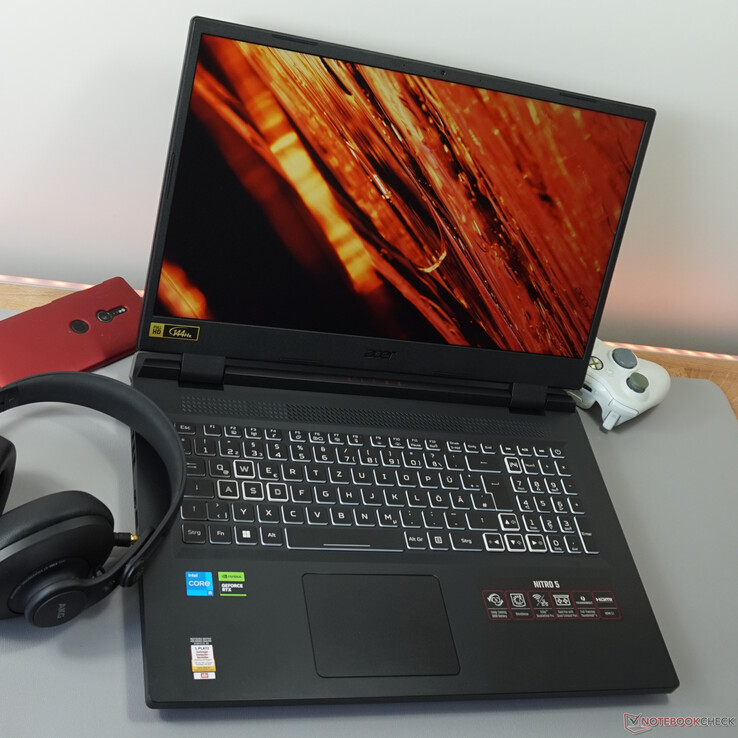
The relatively large Acer Nitro 5 AN517 is home to an Alder Lake processor - which is no longer the newest kid on the block - and is combined with an Nvidia GeForce RTX 4000 series graphics card. The result is a solid, entry-level gaming laptop that is decently specced with RGB lighting, a 144 Hz panel and a Thunderbolt 4 port.
Last year, we reviewed the very similar predecessor, the Acer Nitro 5 AN517-55-738R with an RTX 3060; amongst other things, it caught the eye due to excessive noise levels. It's exactly in this area where Acer has made improvements and simultaneously manages to benefit from the RTX 4050's efficiency, as found in our review model. Our review reveals which level of quiet gaming you can expect.
Competitors with comparable technology are the Medion Erazer Scout E20 which is equipped with a newer, bigger processor or the Asus TUF Gaming A16 which has gone for AMD components.
Possible competitors compared
Rating | Date | Model | Weight | Height | Size | Resolution | Price |
|---|---|---|---|---|---|---|---|
| 85.5 % v7 (old) | 06 / 2023 | Acer Nitro 5 AN517-55-5552 i5-12500H, GeForce RTX 4050 Laptop GPU | 3 kg | 28.9 mm | 17.30" | 1920x1080 | |
| 86.9 % v7 (old) | 06 / 2023 | Asus TUF Gaming A16 FA617XS R9 7940HS, Radeon RX 7600S | 2.2 kg | 22.1 mm | 16.00" | 1920x1200 | |
| 83.9 % v7 (old) | 08 / 2022 | Acer Nitro 5 AN517-55-738R i7-12700H, GeForce RTX 3060 Laptop GPU | 3.1 kg | 28.6 mm | 17.30" | 1920x1080 | |
| 83 % v7 (old) | 05 / 2023 | Medion Erazer Scout E20 i7-13700H, GeForce RTX 4050 Laptop GPU | 2.8 kg | 29 mm | 17.30" | 1920x1080 | |
| 82.9 % v7 (old) | 03 / 2023 | MSI Katana 15 B12VEK i7-12650H, GeForce RTX 4050 Laptop GPU | 2.3 kg | 24.9 mm | 15.60" | 1920x1080 | |
| 82.4 % v7 (old) | 04 / 2023 | MSI Cyborg 15 A12VF i7-12650H, GeForce RTX 4060 Laptop GPU | 2 kg | 22.9 mm | 15.60" | 1920x1080 |
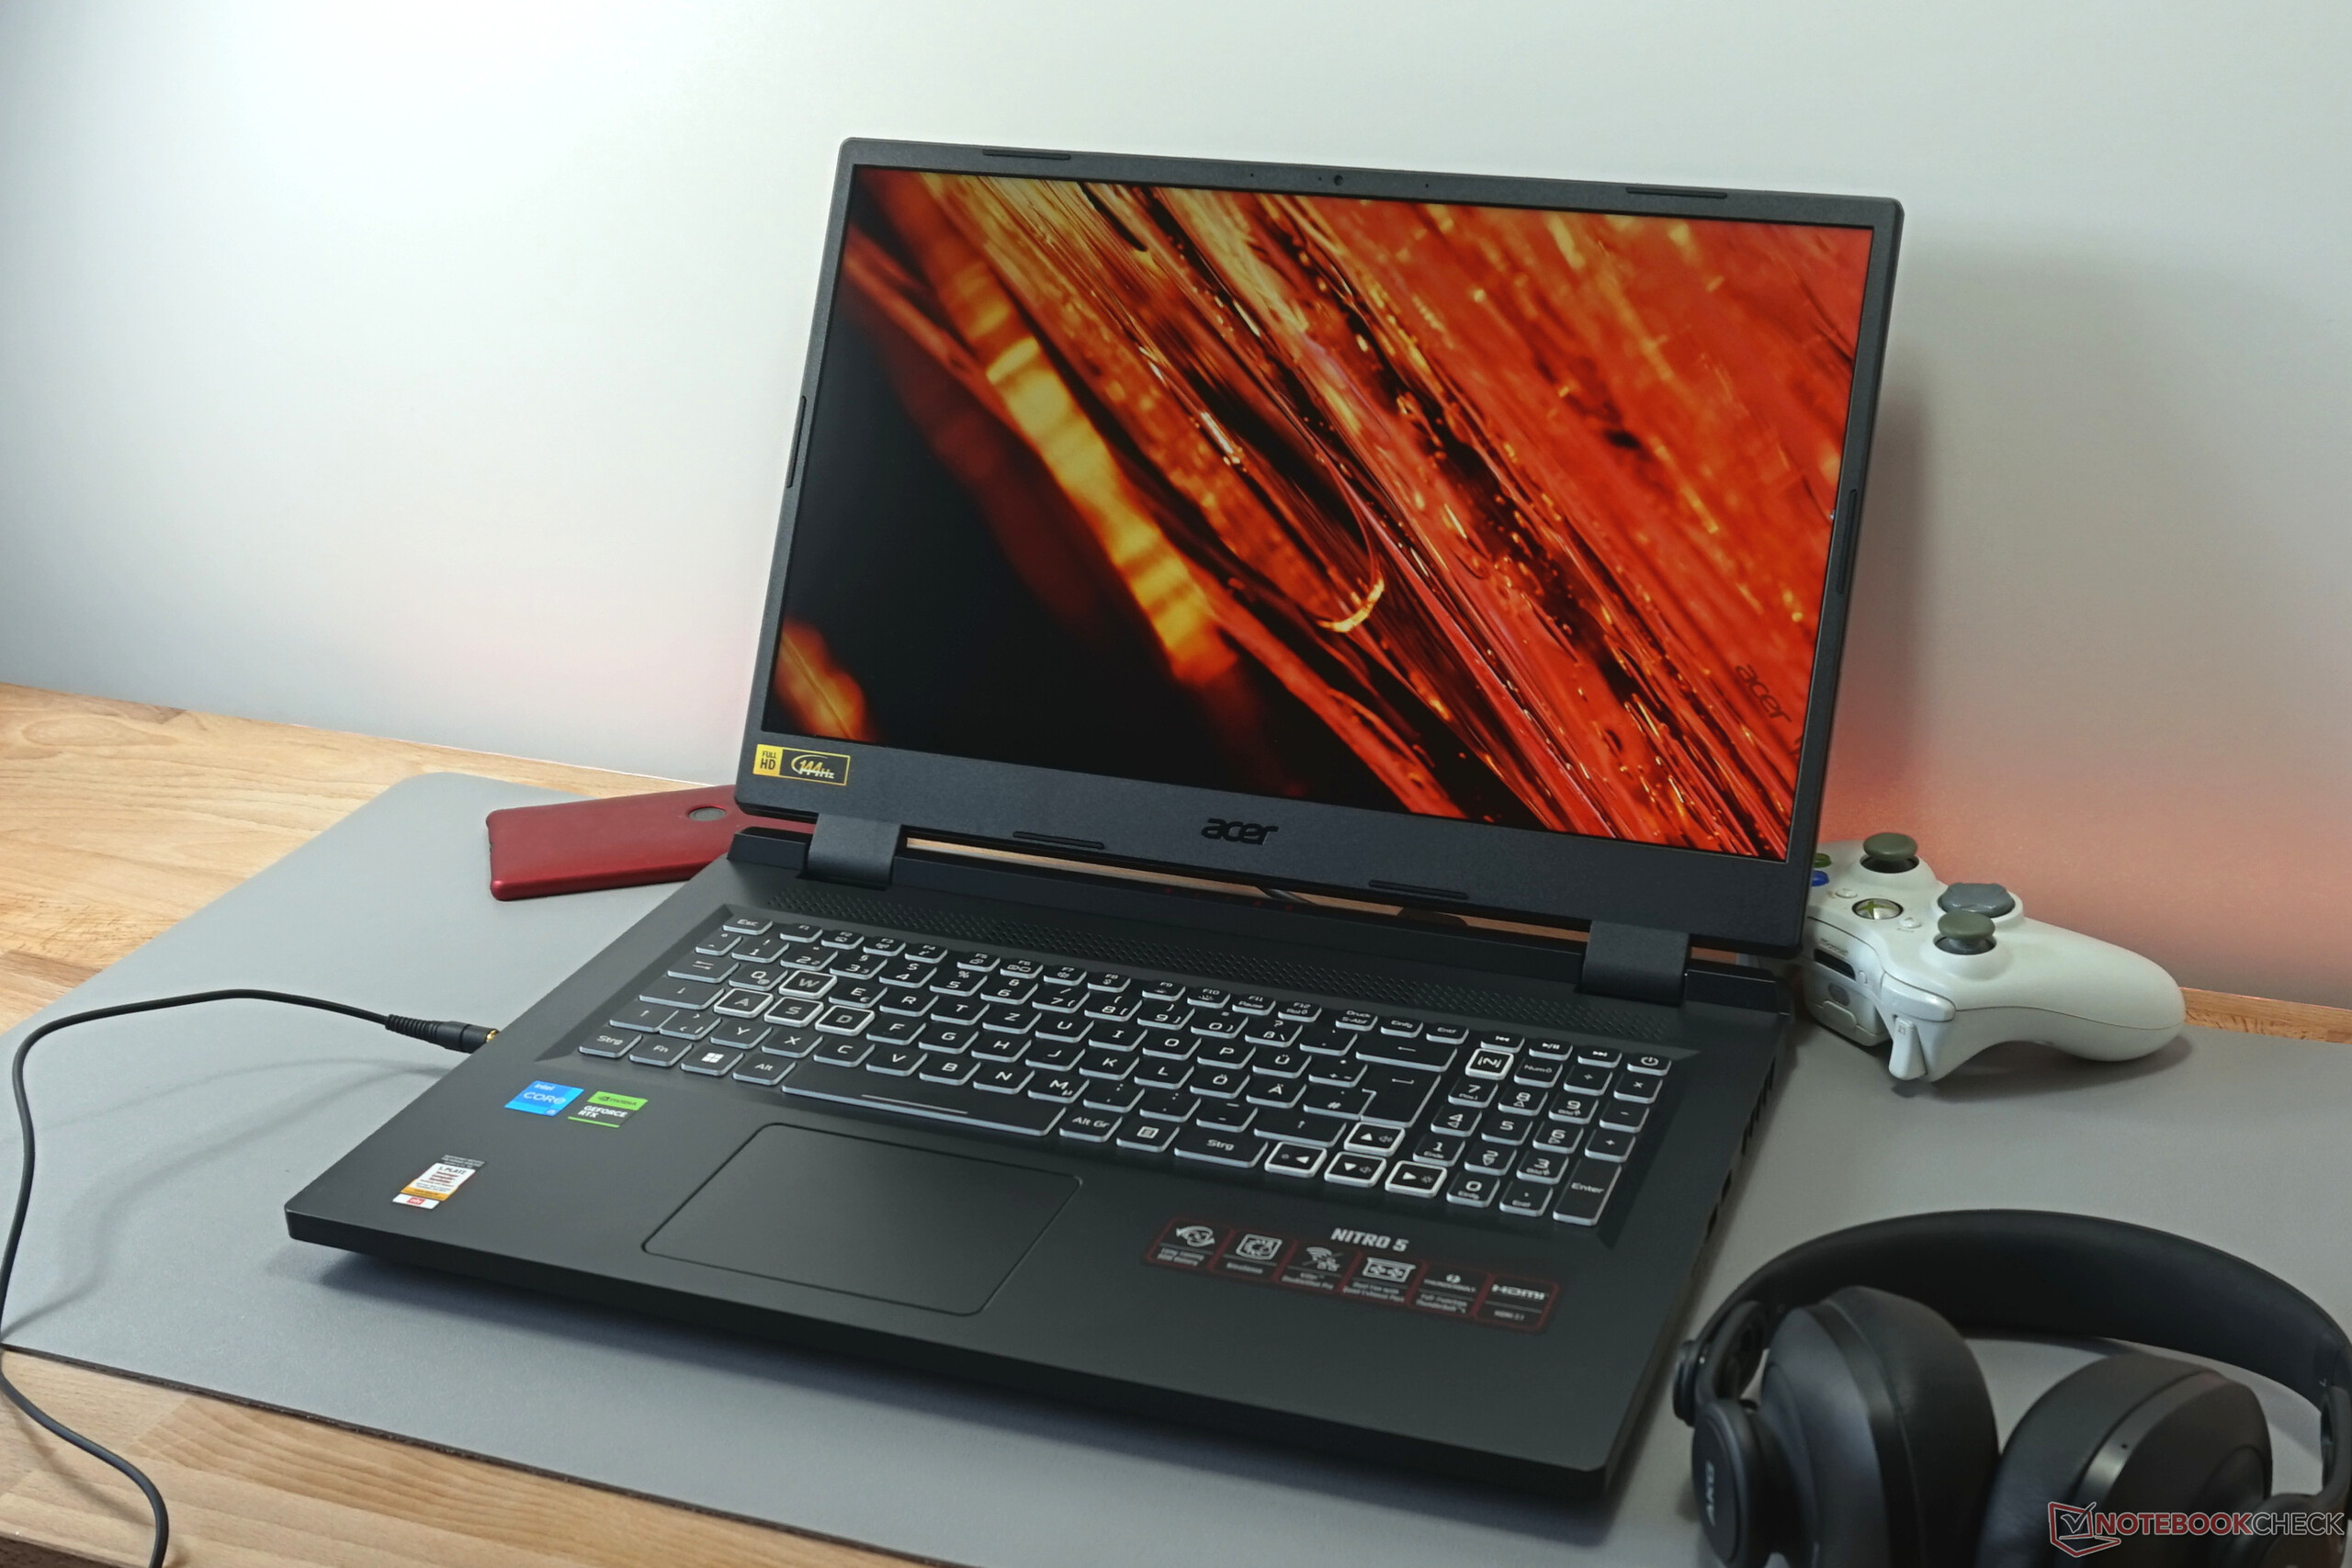
Case - The large Nitro 5 needs space
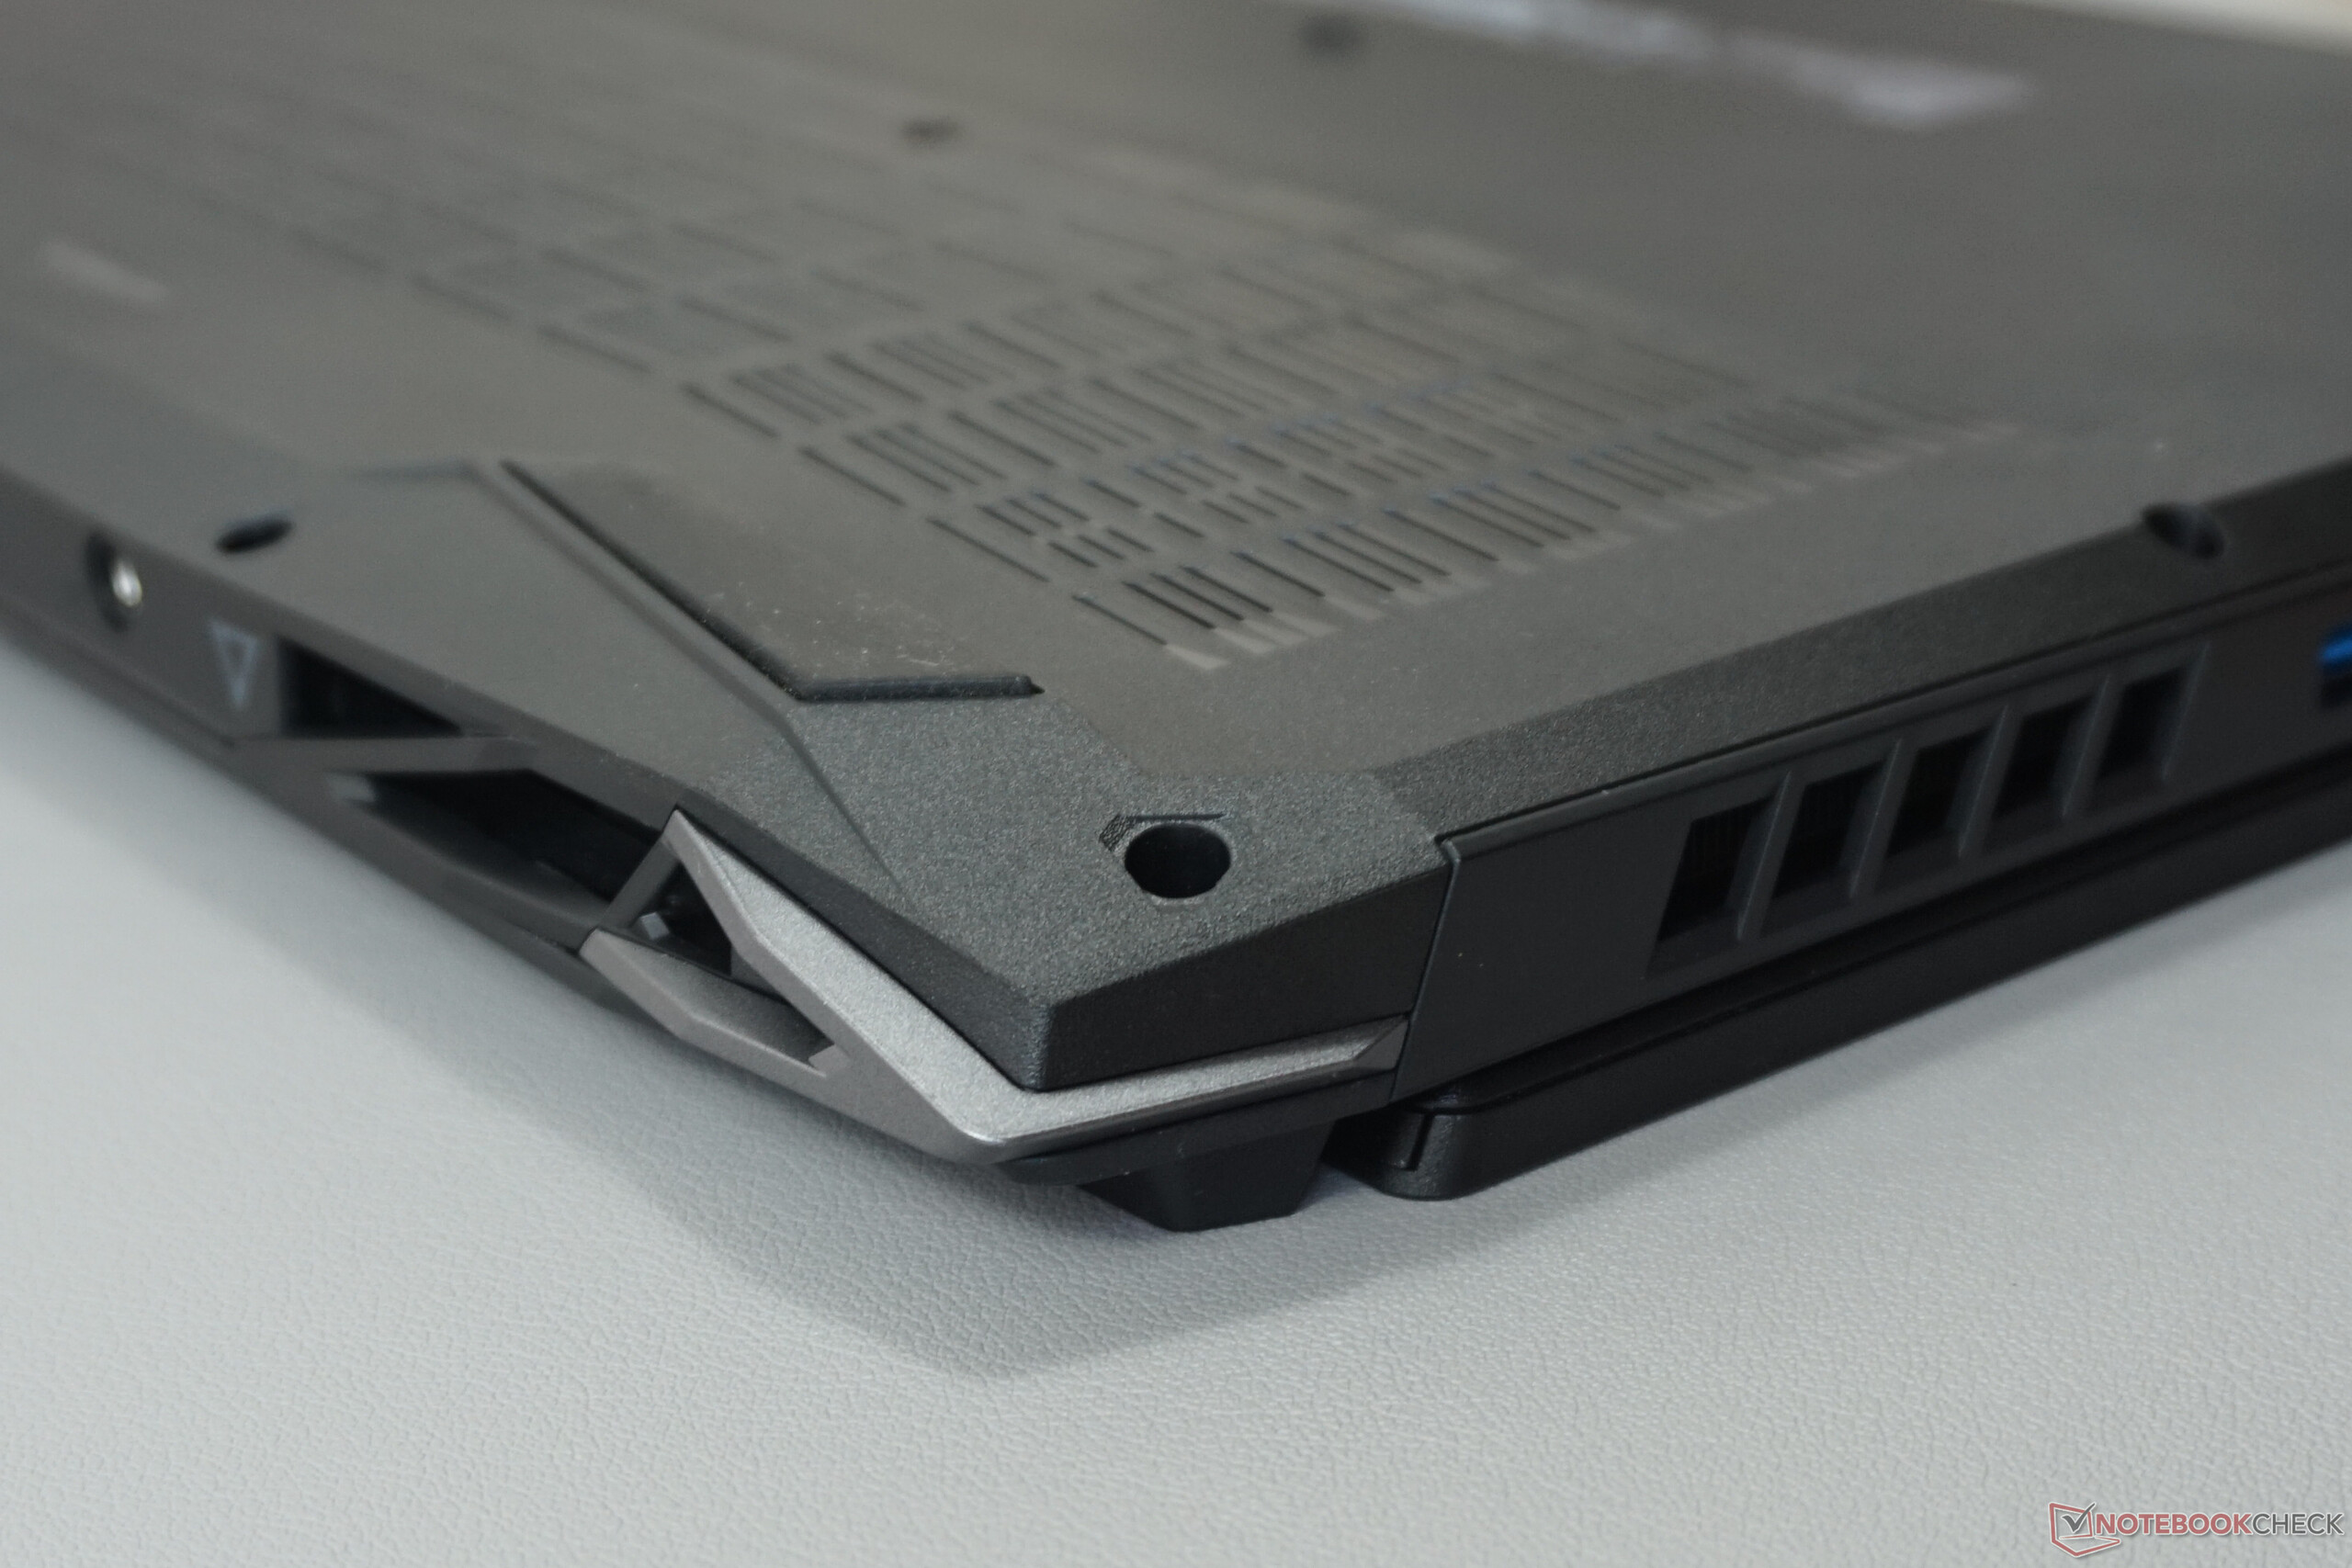
The well-above-average depth of Acer Nitro 5 is considerable, even for a 17.3-inch device. So it's not surprising that the device is somewhat heavier than similarly equipped competitors. In return, the laptop is very solidly built.
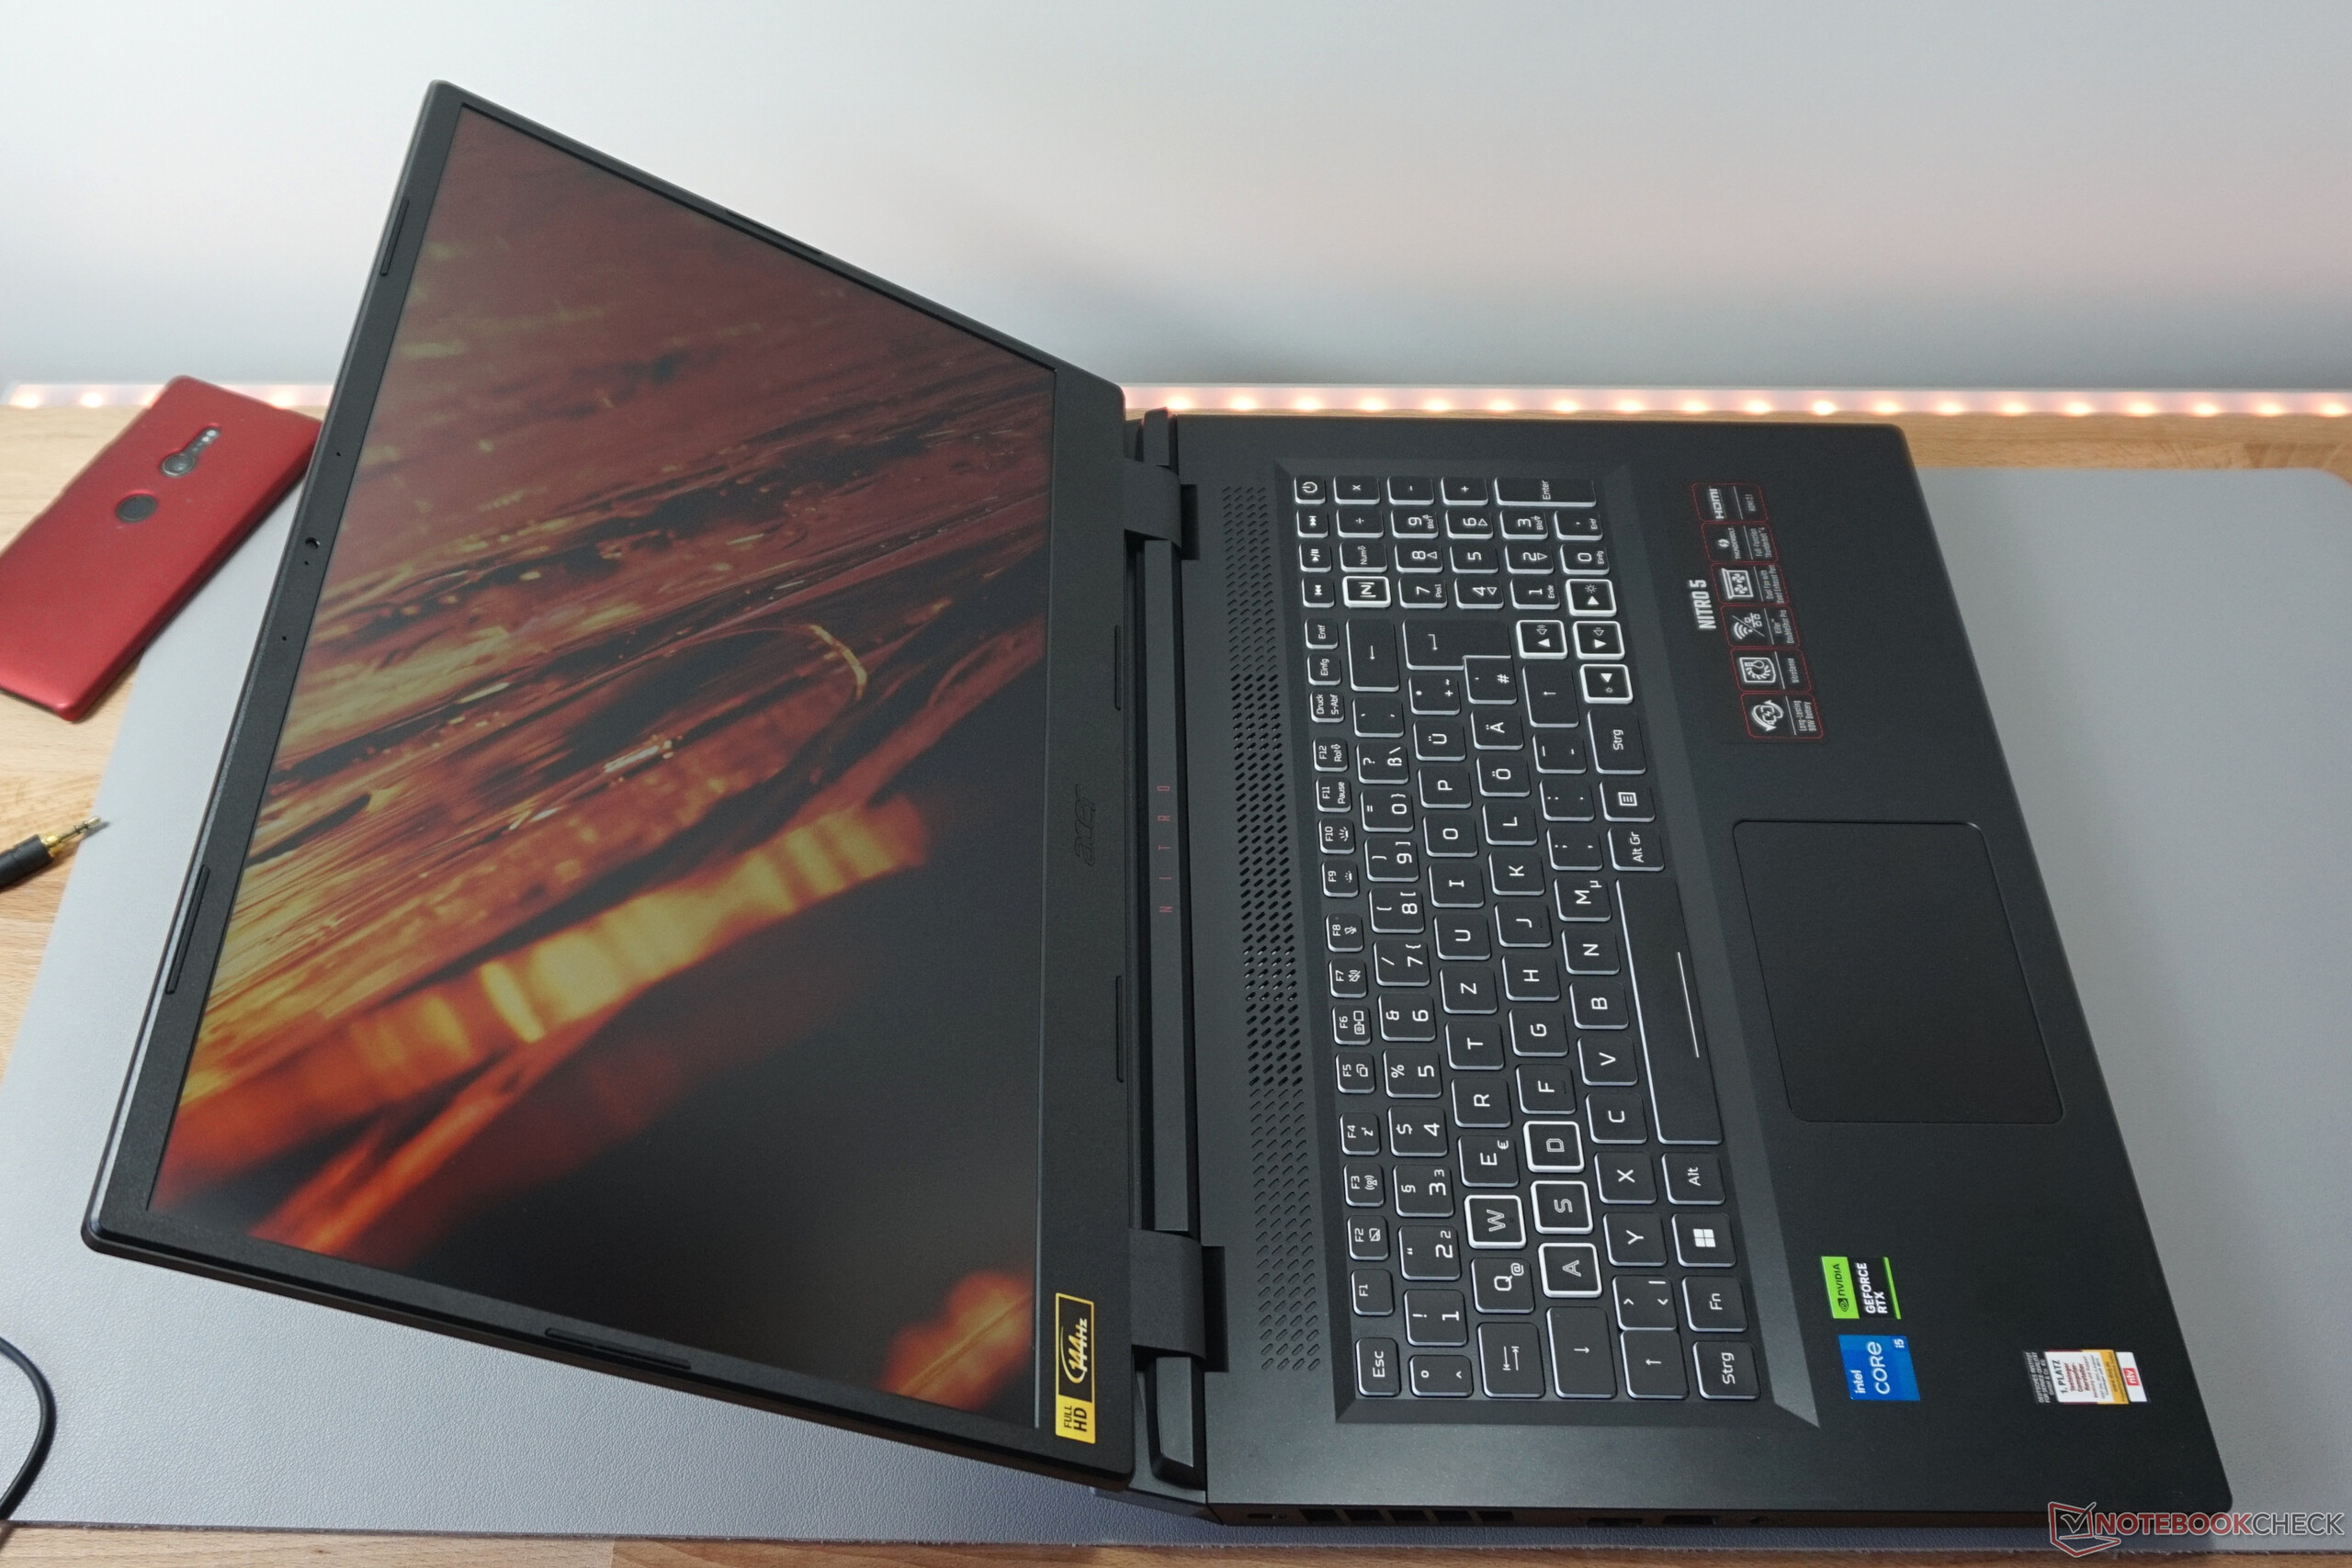
The hinges are firm, they can be opened to an angle of up to 145 °, and prevent the large display from wobbling. The entire case consists of plastic which doesn't negatively affect the unit's torsional rigidity. The screen's frame can be twisted slightly. By contrast, the base remains absolutely solid at all times - and quiet.
Of course, opinions could be divided regarding the design. However, the slightly offset silver corners and thin colored stripes appear somewhat less than adventurous. It's questionable whether the difference to a completely black case would even be noticeable.


Features - A gaming laptop with the necessary extras
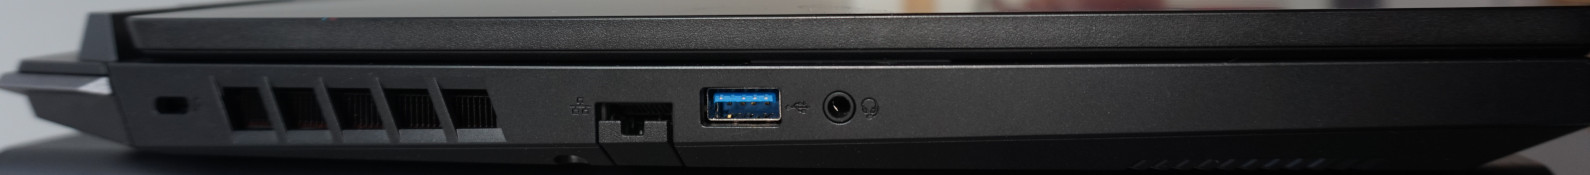
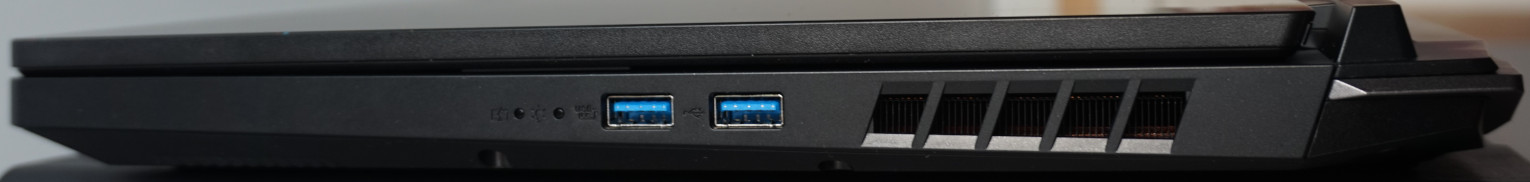
The selection of ports is limited but, pleasingly, the most important ones are at hand. Left and right are the USB-A ports with the right-hand side being home to two. They have a maximum transfer rate of 10 Gbit/s (USB 3.2 Gen2). On the rear of the laptop, you can find an HDMI and Thunderbolt 4 port as well as two video outputs. In addition, the TB4 has a suitable interface in order to be able to use an external SSD at its maximum speed.
A card slot is missing and a third video output - sometimes used as a Mini DP but usually as an additional USB-C port with DP support - is absent. In addition, the LAN port only has a data transfer rate of 1 Gbit/s.

Communication
The Killer Wi-Fi 6 AX1650i Wi-Fi module works as expected. If the distance to the router is short, it's possible to reach speeds of more than 1.5 Gbit/s.
Wi-Fi 6E is not supported, meaning a noticeable reduction in the theoretically possible data transfer speeds should be expected, especially in areas with multiple wireless networks.
Webcam
The webcam performs poorly with HD resolution, a maximum of 30fps and barely acceptable image quality. But, at least there is decent brightening in low-light conditions, without producing too much image noise.
Under close inspection, the dual-array microphone fares much better. It does a good job recording the user's voice from multiple directions and distances at a relatively stable volume and there is an absence of distortions, noise or metal undertones. This makes the laptop well-equipped to handle video calls or gaming chats.


Servicing
Opening the Acer Nitro 5 isn't particularly problematic: Firstly, the removal of twelve identically-sized crosshead screws is necessary. After doing that, it is possible to take off the base by removing it from the rear corners - and all with minimal effort.
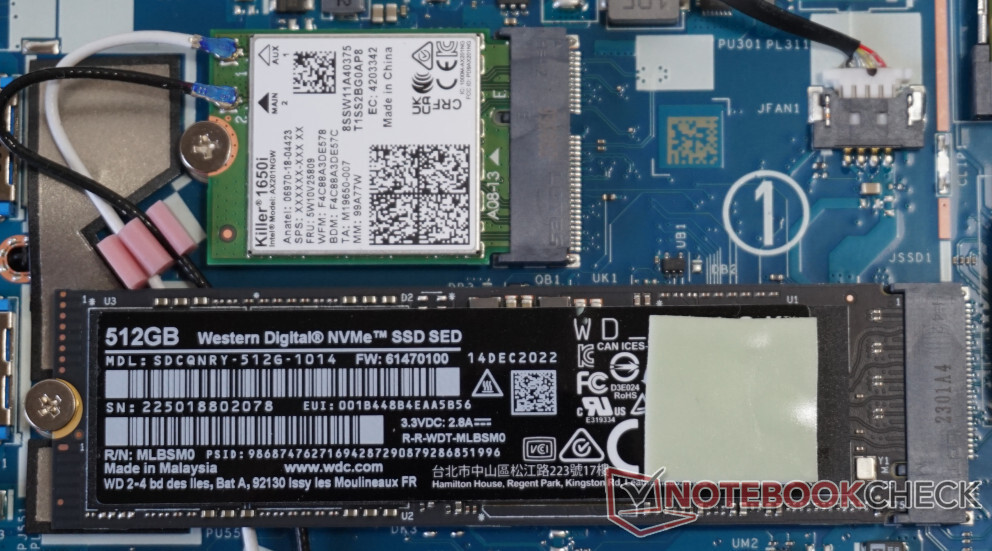
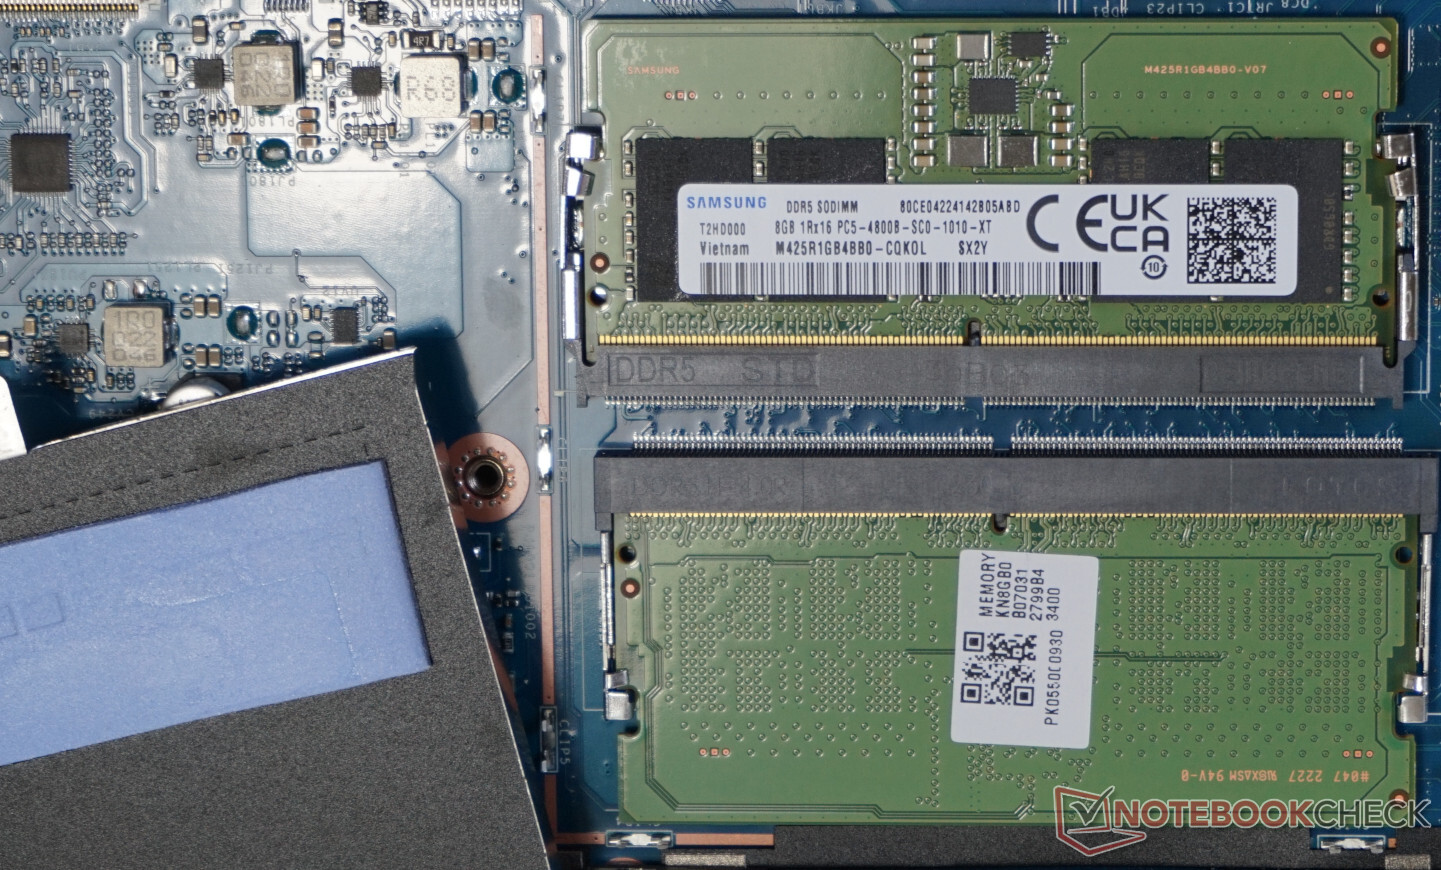
A quick glance inside reveals a large spacious area. However, the free available space could have been used a little better, especially in the area around the battery, for something like M.2 SSDs. Both slots are also easily accessible. The second slot can be put into operation at a later time and is clearly marked with the number "2". The Wi-Fi module, memory chips and battery can all be easily replaced.
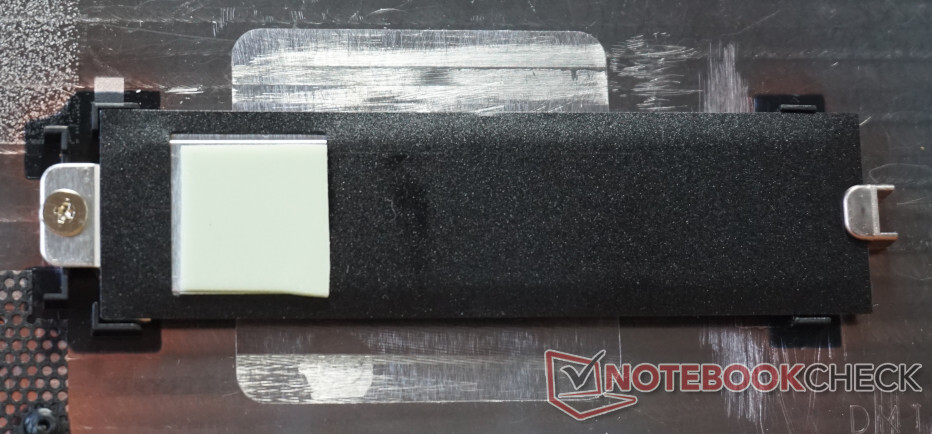
A large number of passive cooling elements catch the eye. The RAM under the cover is equipped with large thermal pads. In addition, there is also a pad of this type on the SSD's controller and it comes into contact with a cooling element in the base plate when the lid is closed. Such an element and a thermal pad are also pre-fitted for the second M.2 slot.


Input devices
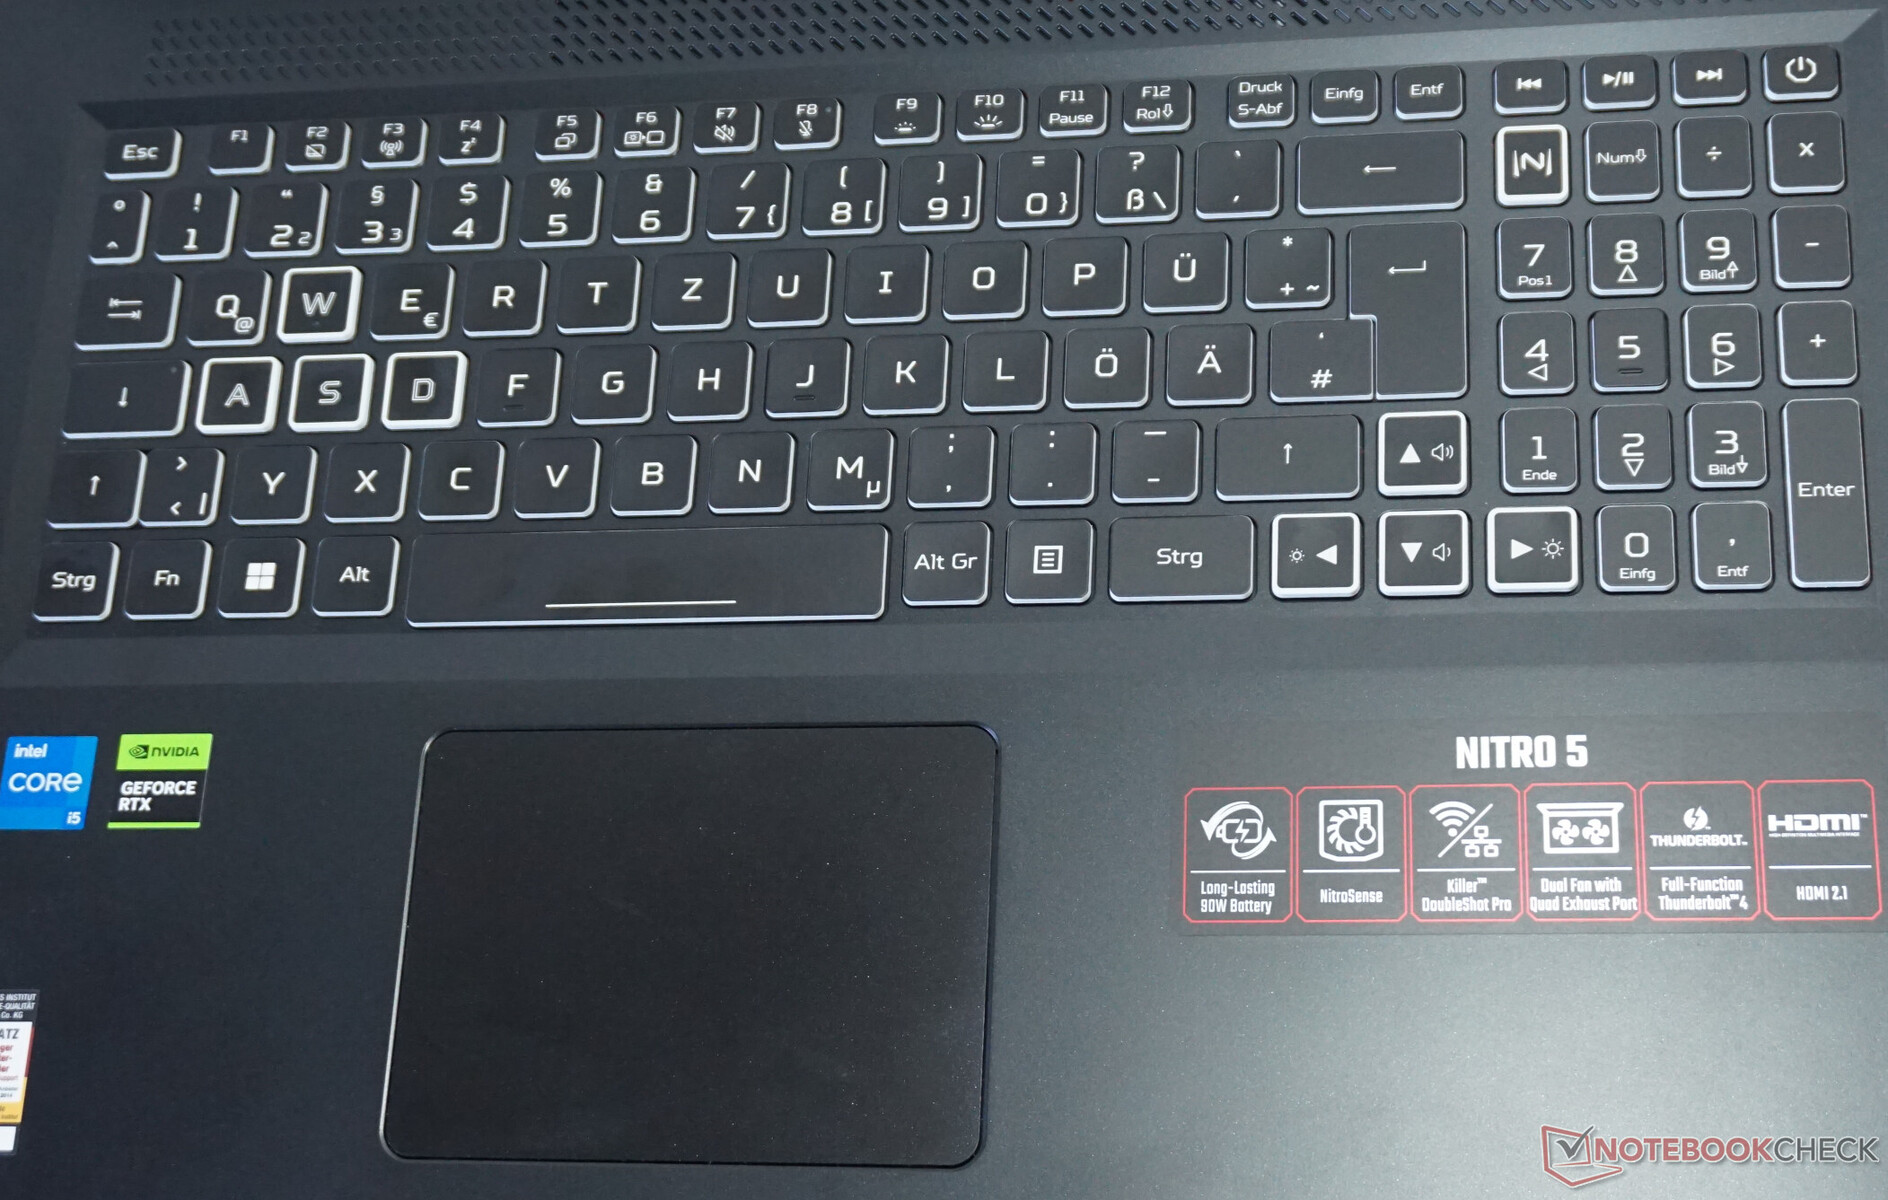
The typing experience is pleasant. Not like a mechanical keyboard, of course, but it still boasts a key travel of 1.5 mm (our measurement), with even and reassuring resistance as well as a stable keyboard frame.
Furthermore, the visual design is also well done: Thanks to white edges, the keys stand out from one another. The arrow keys, "WASD" and a special key for Acer's "NitroSense" software have an additional marking which makes finding them noticeably easier, especially out of the corner of your eye.
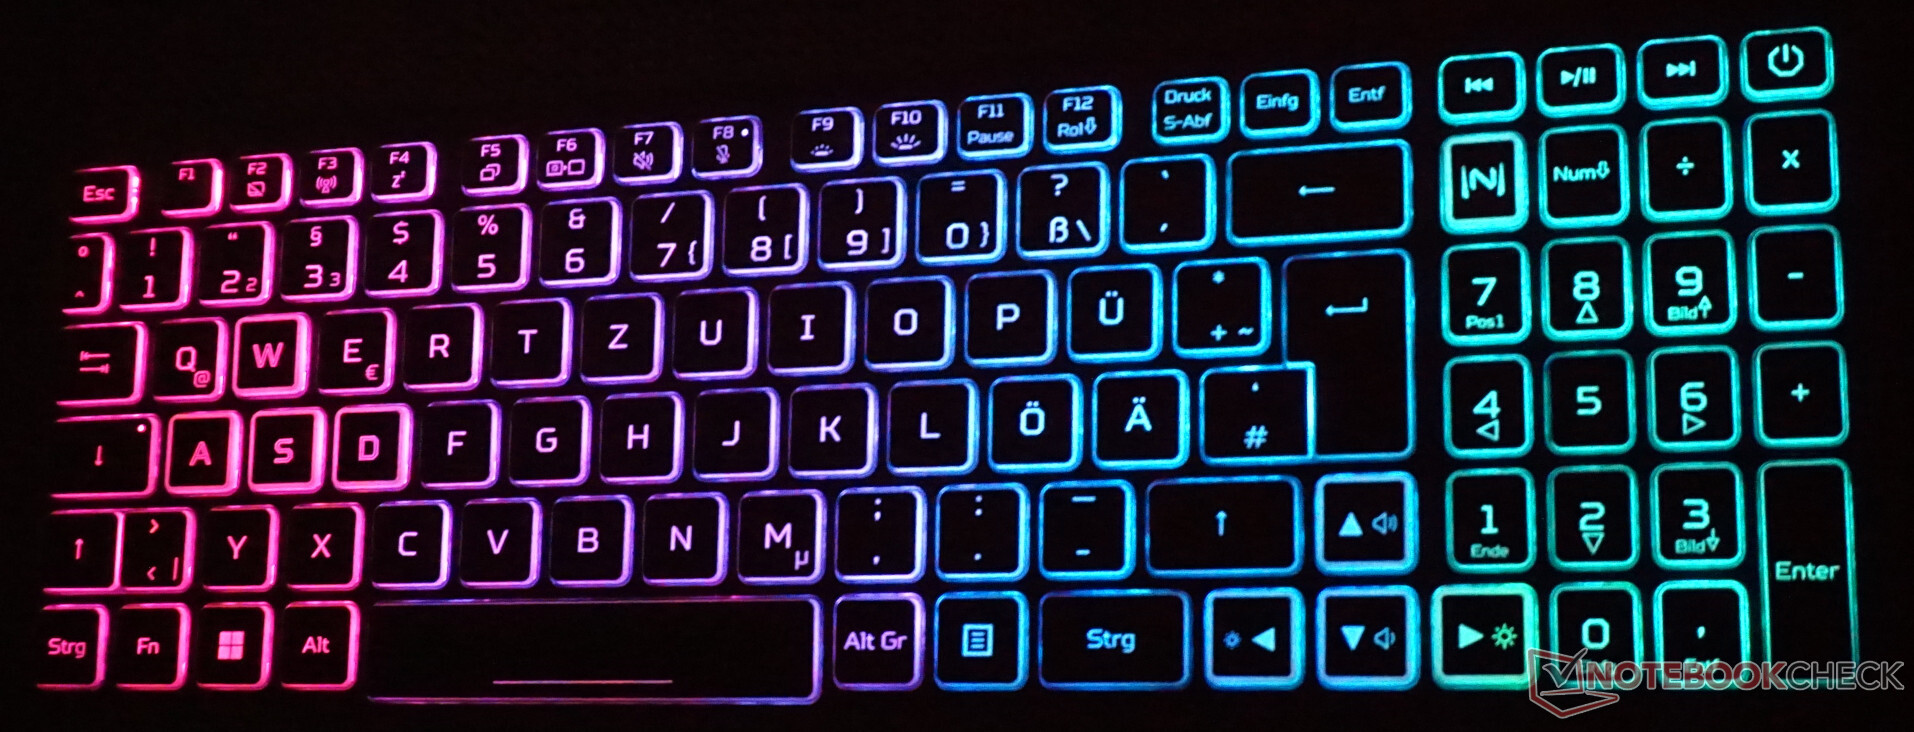
The colorful key lighting only uses four customisable areas. At the same time, a large and finely graded color spectrum is available making the rainbow effect, amongst other things, really effective.
The touchpad is much less impressive and, at 10 x 8 cm, it's not particularly large. The hidden keys don't always respond immediately. This was repeatedly noticeable with inaccurate representations of finger movements. However, as with most gaming laptops, this shouldn't crop up when gaming.
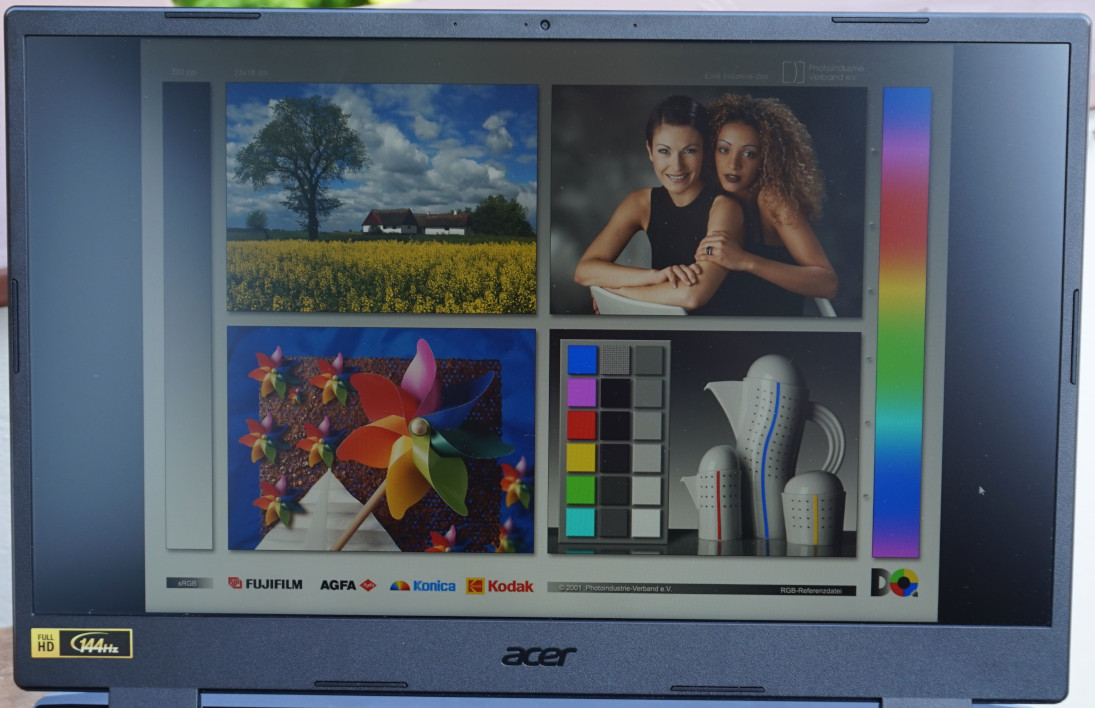
Display - Too dark and bland for a gaming laptop


The Acer Nitro 5's very basic IPS panel almost reminds us of an office monitor if it weren't for the refresh rate of 144 Hz. And this is in harmony with the Full HD resolution as well as the limited graphics performance. In addition, the measured response times are also decent.
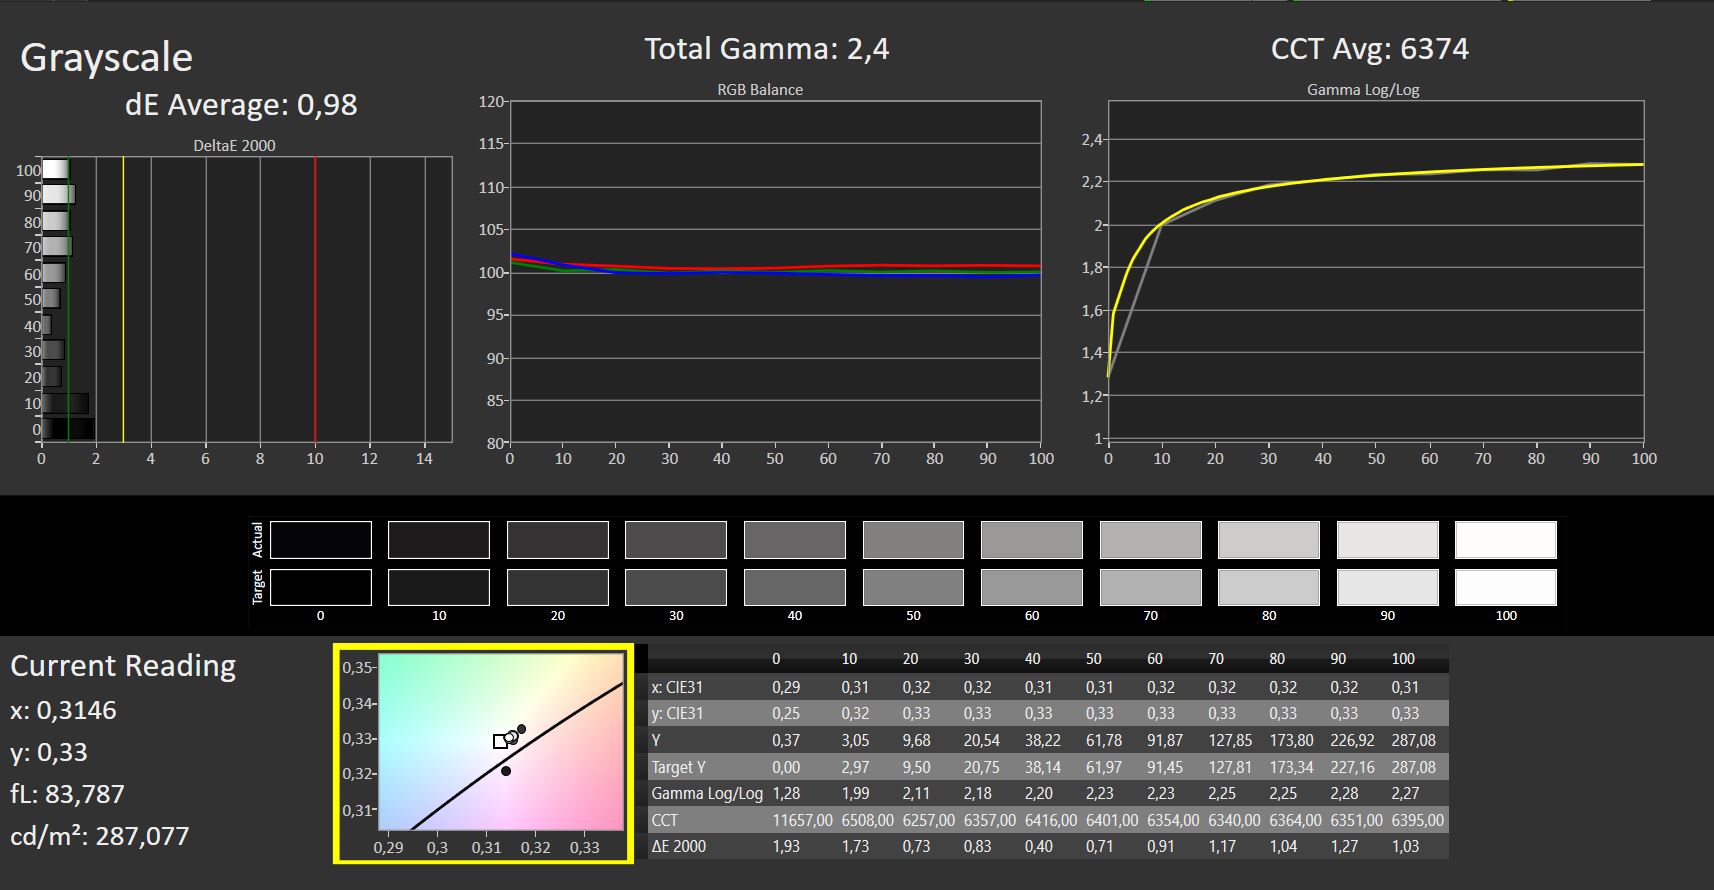
Unfortunately, all the other aspects are below average. A medium brightness of almost 250 cd/m² and relatively bad black levels result in poor contrast. When viewing a dark image in a dark room, significant screen bleeding can be seen around the display.
The variety of colors, the color reproduction accuracy and the illumination are also consistently poor. That doesn't negatively impact playing games but it does result in some effects being less than eye-popping.
In addition, it restricts the laptop's versatility. The screen is not a serious option, even for modestly ambitious hobby photographers.
| |||||||||||||||||||||||||
Brightness Distribution: 81 %
Center on Battery: 285 cd/m²
Contrast: 491:1 (Black: 0.58 cd/m²)
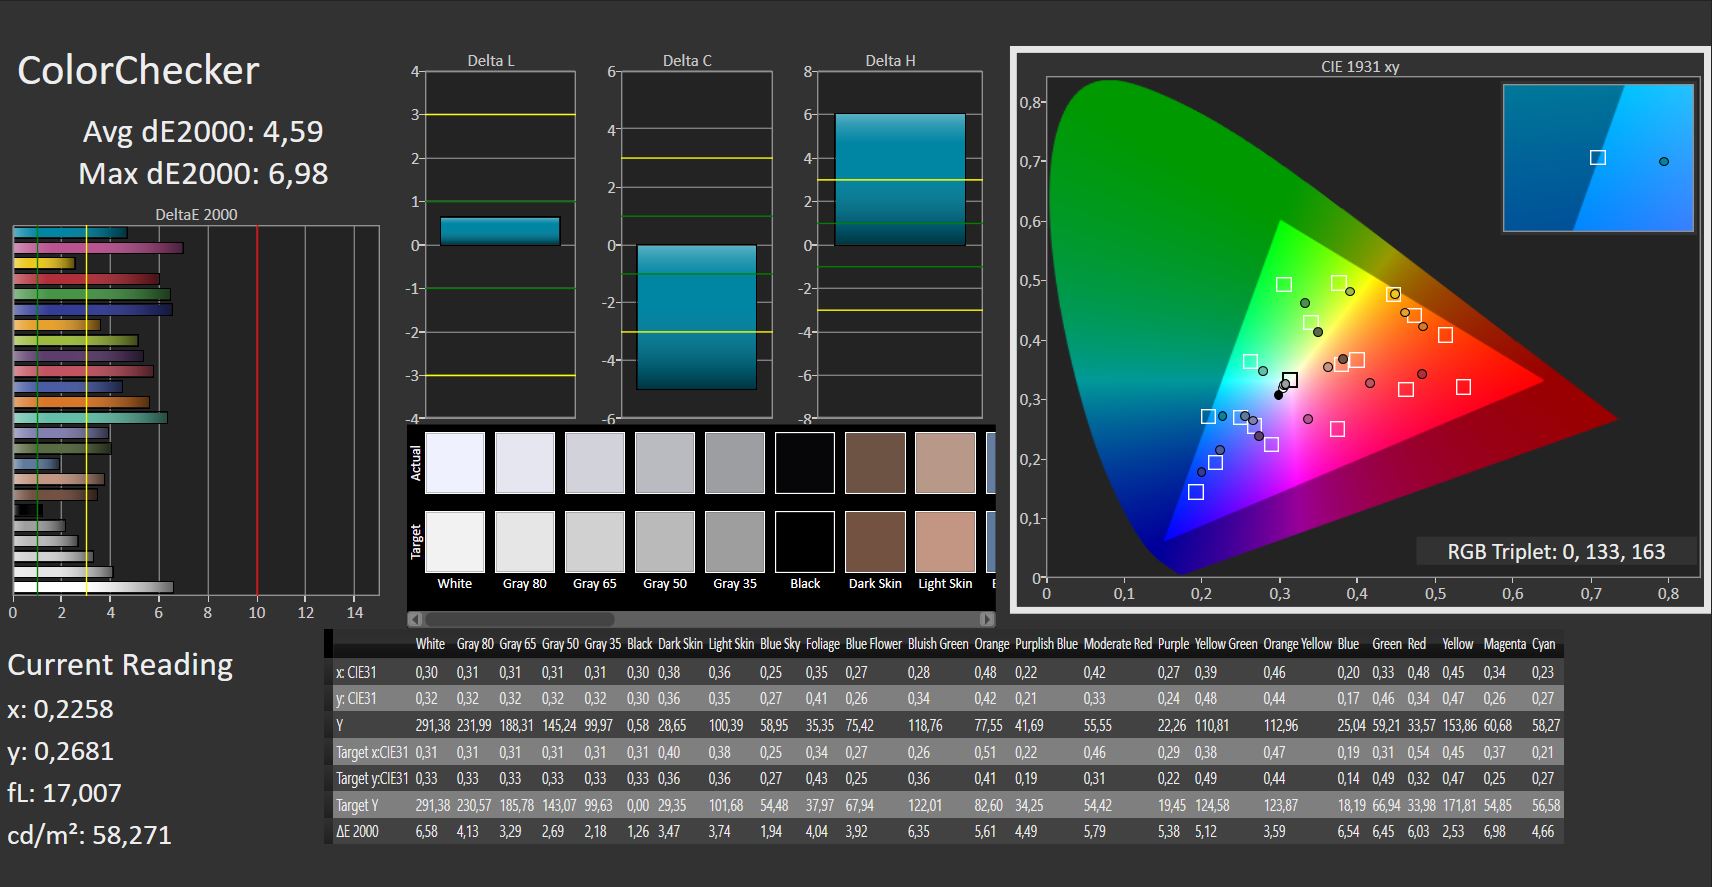
ΔE ColorChecker Calman: 4.59 | ∀{0.5-29.43 Ø4.73}
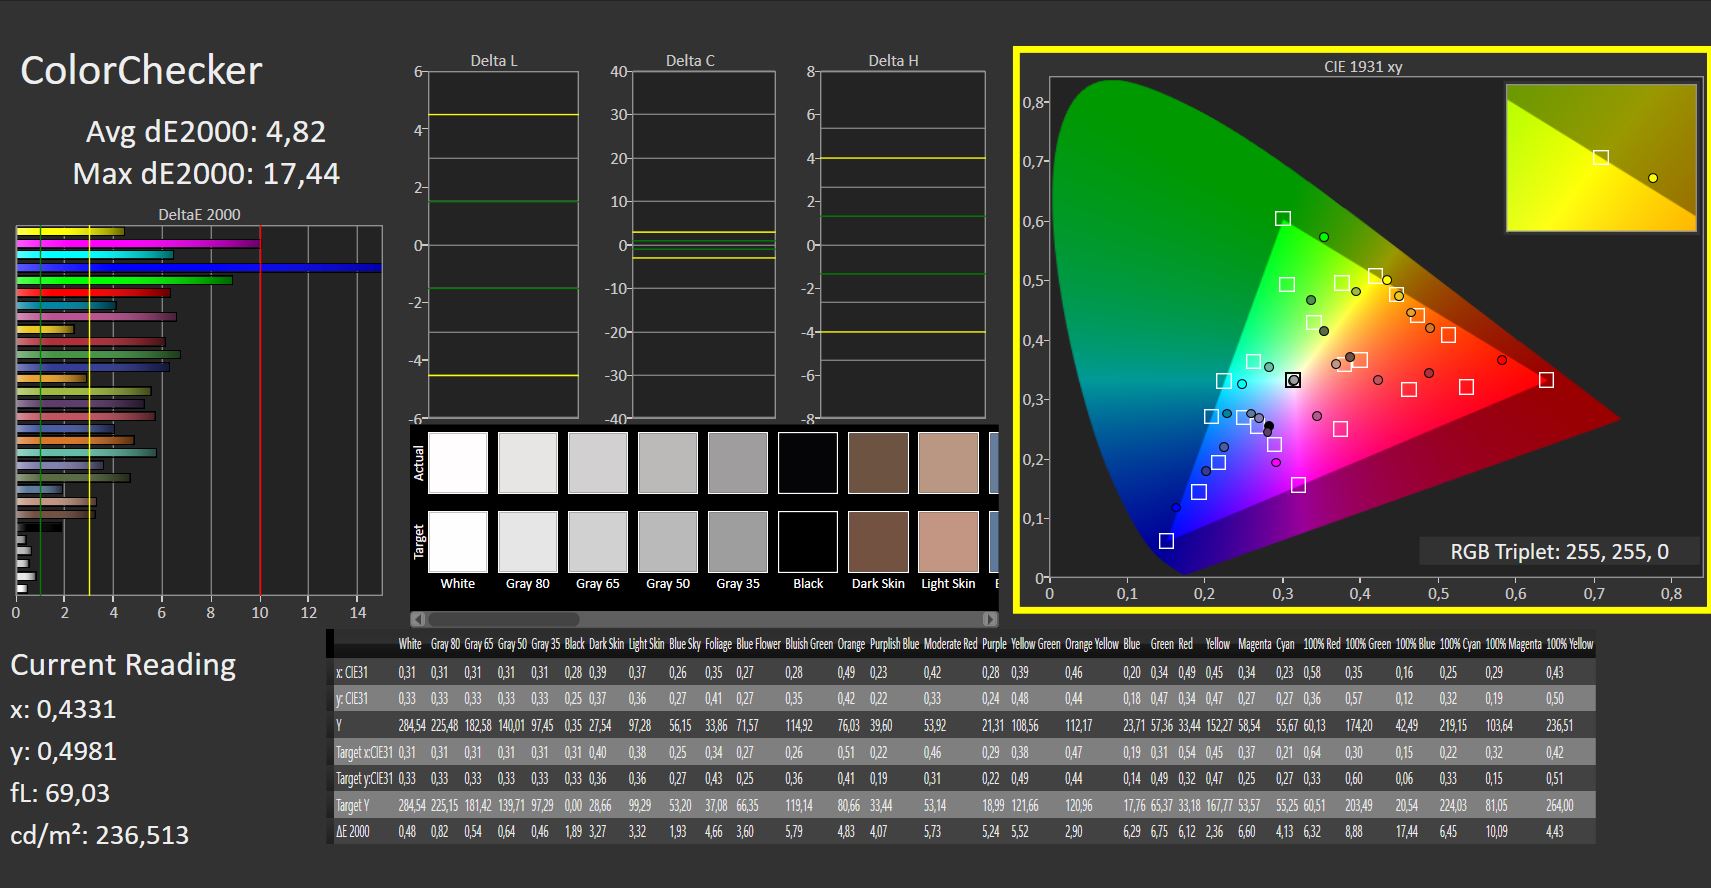
calibrated: 4.82
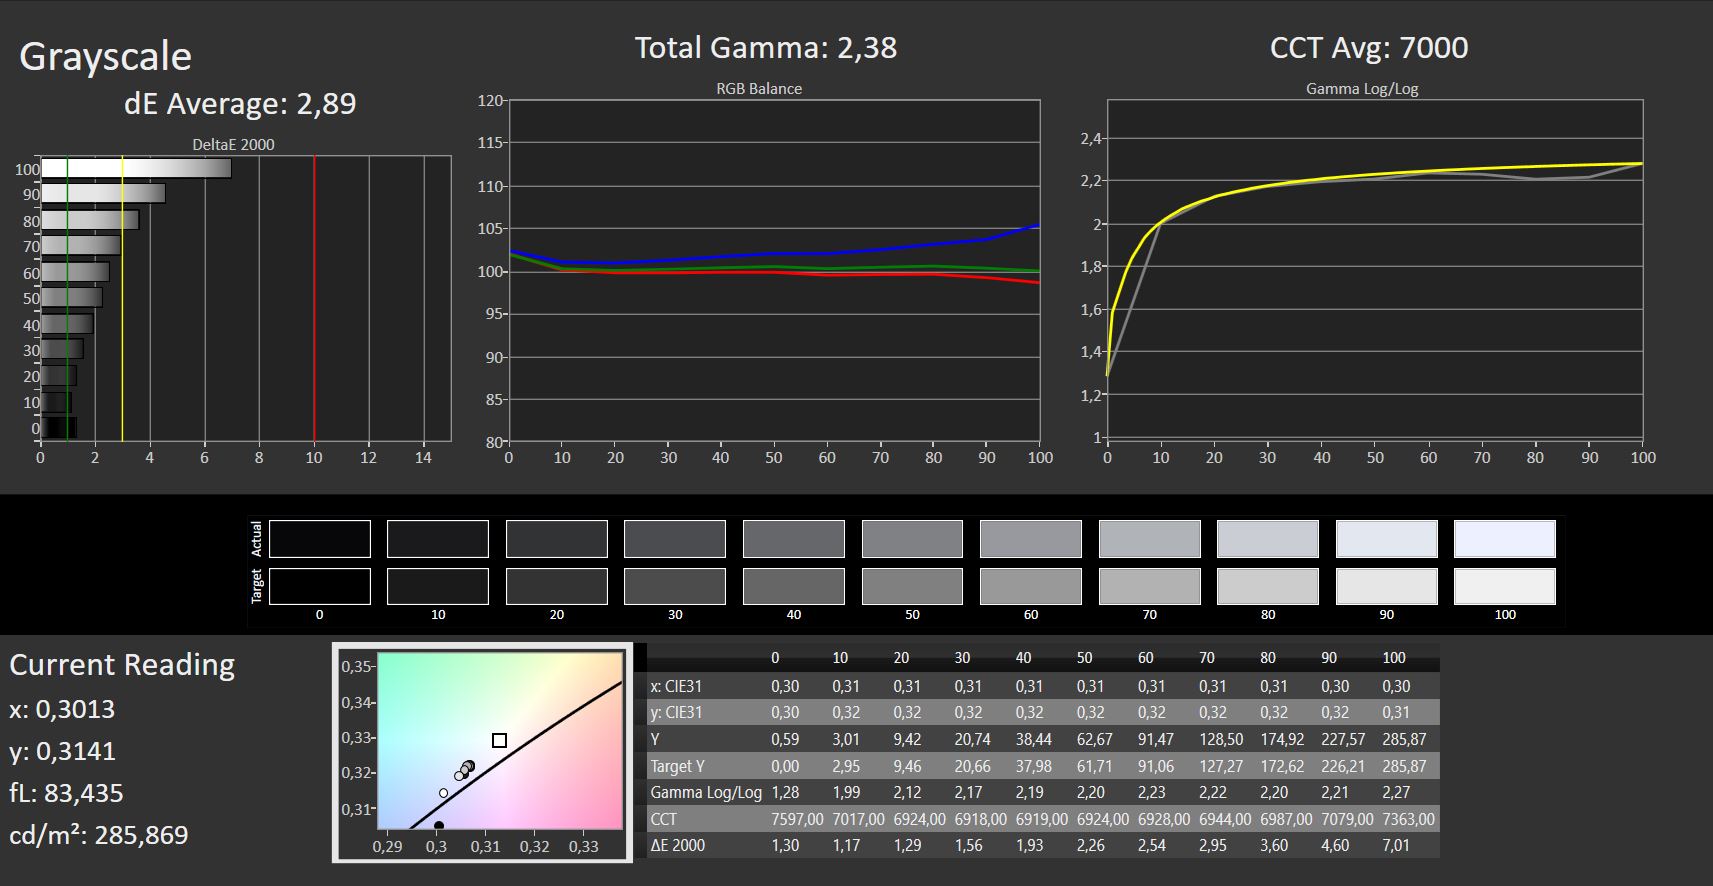
ΔE Greyscale Calman: 2.89 | ∀{0.09-98 Ø4.97}
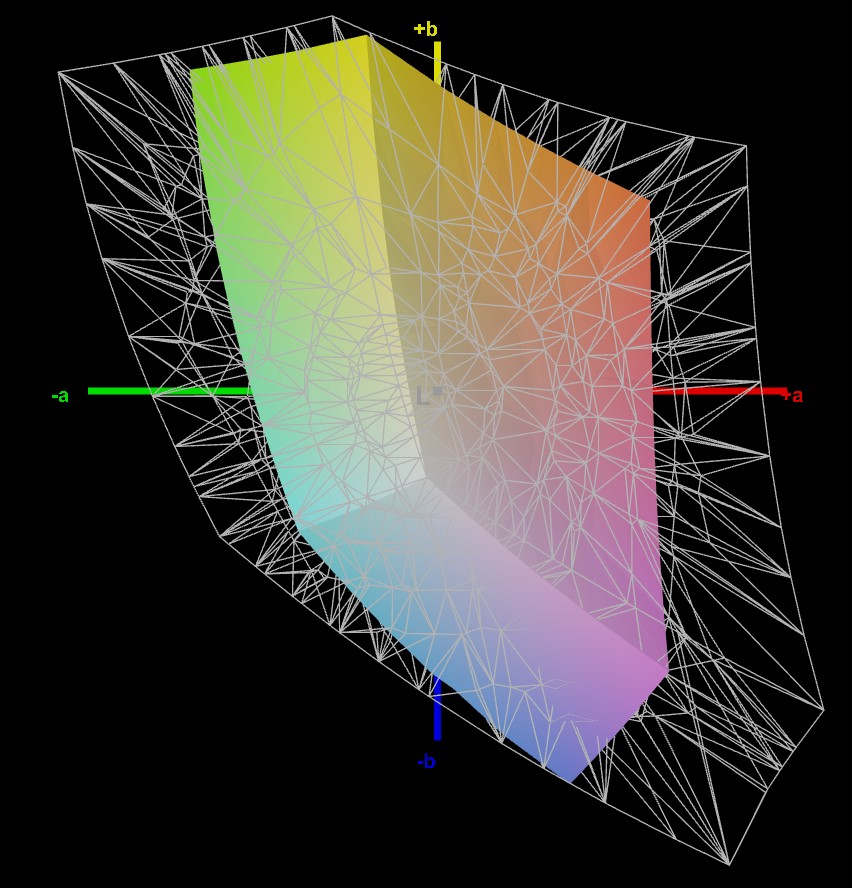
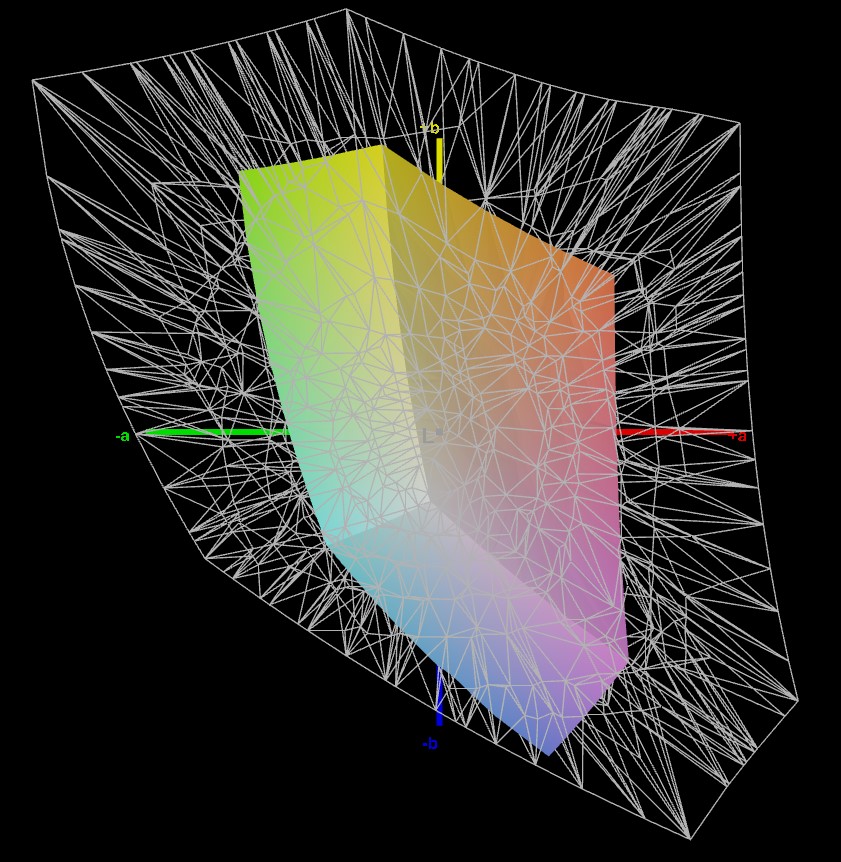
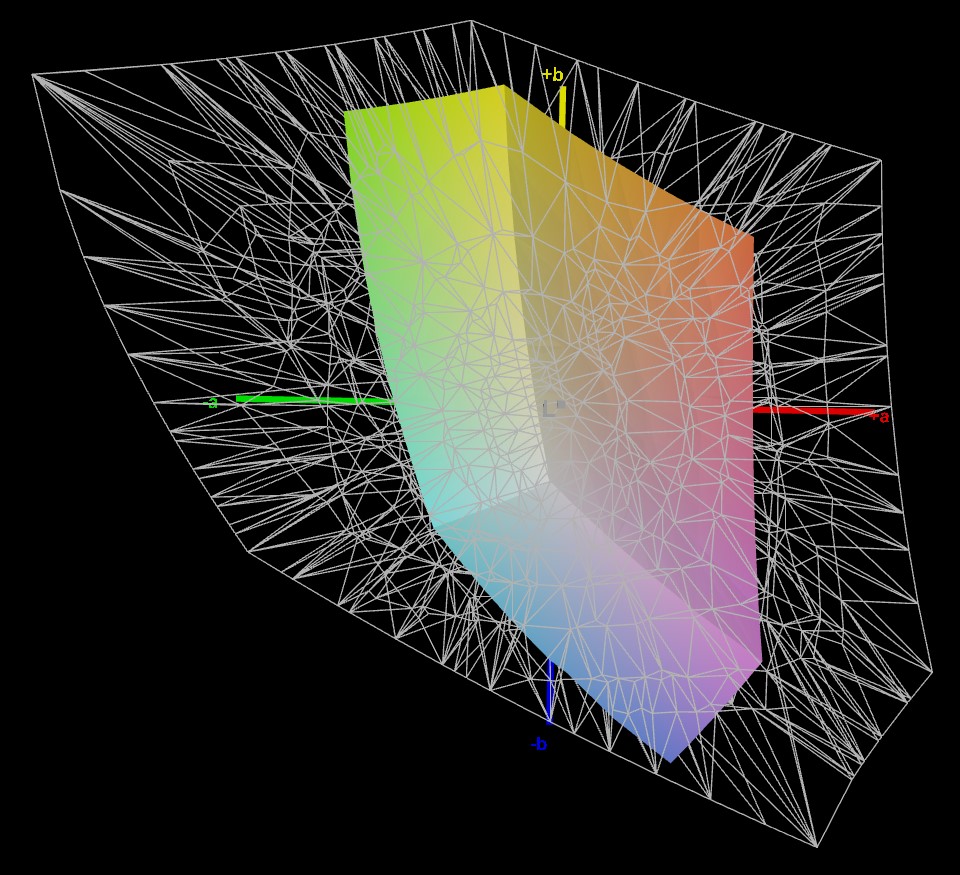
38.9% AdobeRGB 1998 (Argyll 3D)
56.4% sRGB (Argyll 3D)
37.6% Display P3 (Argyll 3D)
Gamma: 2.38
CCT: 7000 K
| Acer Nitro 5 AN517-55-5552 BOE0A6F NV173FHM-NX4, IPS, 1920x1080, 17.3" | Asus TUF Gaming A16 FA617XS BOE NE160WUM-NX2, IPS, 1920x1200, 16" | Acer Nitro 5 AN517-55-738R B173HAN04.0, IPS, 1920x1080, 17.3" | Medion Erazer Scout E20 LG Philips LGD0611, IPS, 1920x1080, 17.3" | MSI Katana 15 B12VEK AUOAF90 (B156HAN08.4), IPS, 1920x1080, 15.6" | MSI Cyborg 15 A12VF AU Optronics B156HAN15.1, IPS, 1920x1080, 15.6" | |
|---|---|---|---|---|---|---|
| Display | 80% | 55% | 72% | 1% | 12% | |
| Display P3 Coverage (%) | 37.6 | 69.3 84% | 58.9 57% | 65.1 73% | 38.1 1% | 42.3 12% |
| sRGB Coverage (%) | 56.4 | 97.3 73% | 86.4 53% | 96.7 71% | 56.8 1% | 62.6 11% |
| AdobeRGB 1998 Coverage (%) | 38.9 | 70.7 82% | 60.5 56% | 66.5 71% | 39.3 1% | 43.7 12% |
| Response Times | 21% | 55% | 22% | -104% | -11% | |
| Response Time Grey 50% / Grey 80% * (ms) | 18 ? | 15.6 ? 13% | 6 ? 67% | 14.8 ? 18% | 38.8 ? -116% | 22 ? -22% |
| Response Time Black / White * (ms) | 14 ? | 10 ? 29% | 8 ? 43% | 10.4 ? 26% | 26.8 ? -91% | 14 ? -0% |
| PWM Frequency (Hz) | ||||||
| Screen | 55% | 24% | 41% | 3% | 24% | |
| Brightness middle (cd/m²) | 285 | 301 6% | 286 0% | 312 9% | 261 -8% | 247 -13% |
| Brightness (cd/m²) | 257 | 294 14% | 278 8% | 303 18% | 258 0% | 234 -9% |
| Brightness Distribution (%) | 81 | 94 16% | 89 10% | 91 12% | 92 14% | 89 10% |
| Black Level * (cd/m²) | 0.58 | 0.21 64% | 0.32 45% | 0.25 57% | 0.19 67% | 0.25 57% |
| Contrast (:1) | 491 | 1433 192% | 894 82% | 1248 154% | 1374 180% | 988 101% |
| Colorchecker dE 2000 * | 4.59 | 1.79 61% | 3.05 34% | 2.65 42% | 5.57 -21% | 3.78 18% |
| Colorchecker dE 2000 max. * | 6.98 | 3.48 50% | 5.83 16% | 6.44 8% | 20.6 -195% | 6.42 8% |
| Colorchecker dE 2000 calibrated * | 4.82 | 1.2 75% | 3.13 35% | 0.96 80% | 4.63 4% | 3.94 18% |
| Greyscale dE 2000 * | 2.89 | 2.5 13% | 3.17 -10% | 3.2 -11% | 3.19 -10% | 2.16 25% |
| Gamma | 2.38 92% | 2.265 97% | 2.29 96% | 2.246 98% | 2.45 90% | 2.33 94% |
| CCT | 7000 93% | 6157 106% | 6916 94% | 7258 90% | 6146 106% | 6906 94% |
| Total Average (Program / Settings) | 52% /
55% | 45% /
35% | 45% /
45% | -33% /
-12% | 8% /
16% |
* ... smaller is better
The screen can display roughly more than half of sRGB, the color space typically used in games. As a result, fine color grading, such as a representation of the sky, can end up looking blocky. It would be right to expect at least near to complete sRGB coverage, as seen in the predecessor, the Nitro 5 AN517-55-738R. But, unfortunately, that is not the case here. It's just good enough for games but still disappointing.
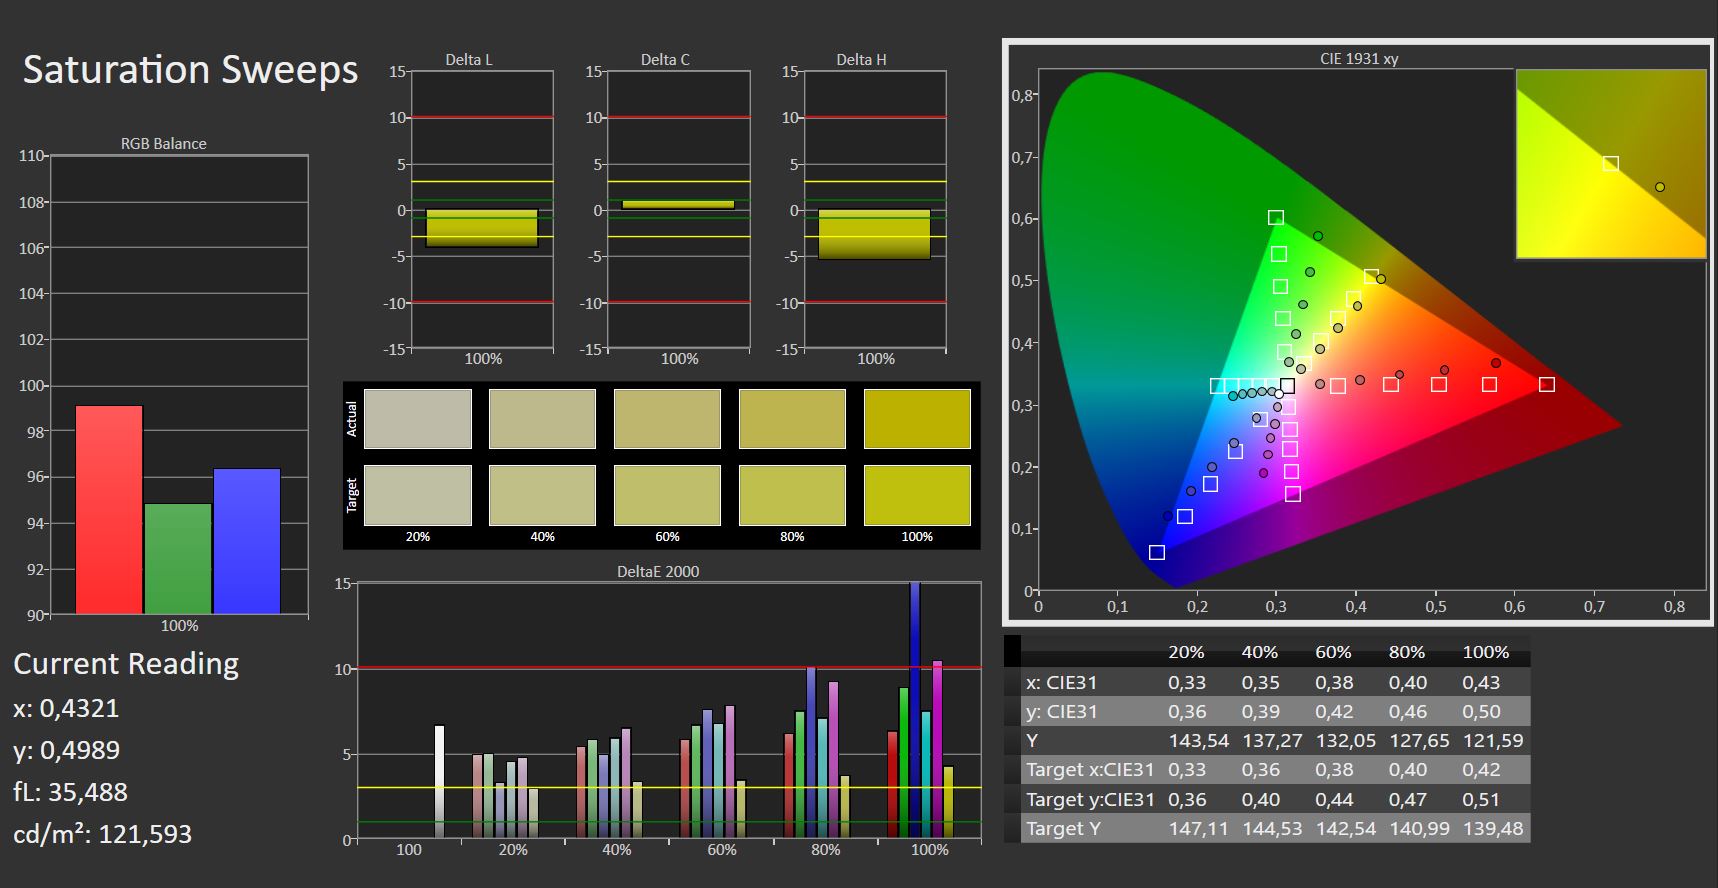
We measured a color reproduction deviation, especially when it came to blue tones and this even was also visible to less experienced eyes. However, a better result could not be expected in view of the overall poor color reproduction. An average DeltaE of just under 5, which cannot be improved through calibration, is quite decent, if the focus is basically only on gaming.

Display Response Times
| ↔ Response Time Black to White | ||
|---|---|---|
| 14 ms ... rise ↗ and fall ↘ combined | ↗ 7 ms rise |  |
| ↘ 7 ms fall | ||
| The screen shows good response rates in our tests, but may be too slow for competitive gamers. In comparison, all tested devices range from 0.1 (minimum) to 240 (maximum) ms. » 34 % of all devices are better. This means that the measured response time is better than the average of all tested devices (19.9 ms). | ||
| ↔ Response Time 50% Grey to 80% Grey | ||
| 18 ms ... rise ↗ and fall ↘ combined | ↗ 8 ms rise |  |
| ↘ 10 ms fall | ||
| The screen shows good response rates in our tests, but may be too slow for competitive gamers. In comparison, all tested devices range from 0.165 (minimum) to 636 (maximum) ms. » 32 % of all devices are better. This means that the measured response time is better than the average of all tested devices (31.1 ms). | ||
Screen Flickering / PWM (Pulse-Width Modulation)
| Screen flickering / PWM not detected |  | ||
In comparison: 52 % of all tested devices do not use PWM to dim the display. If PWM was detected, an average of 7794 (minimum: 5 - maximum: 343500) Hz was measured. | |||
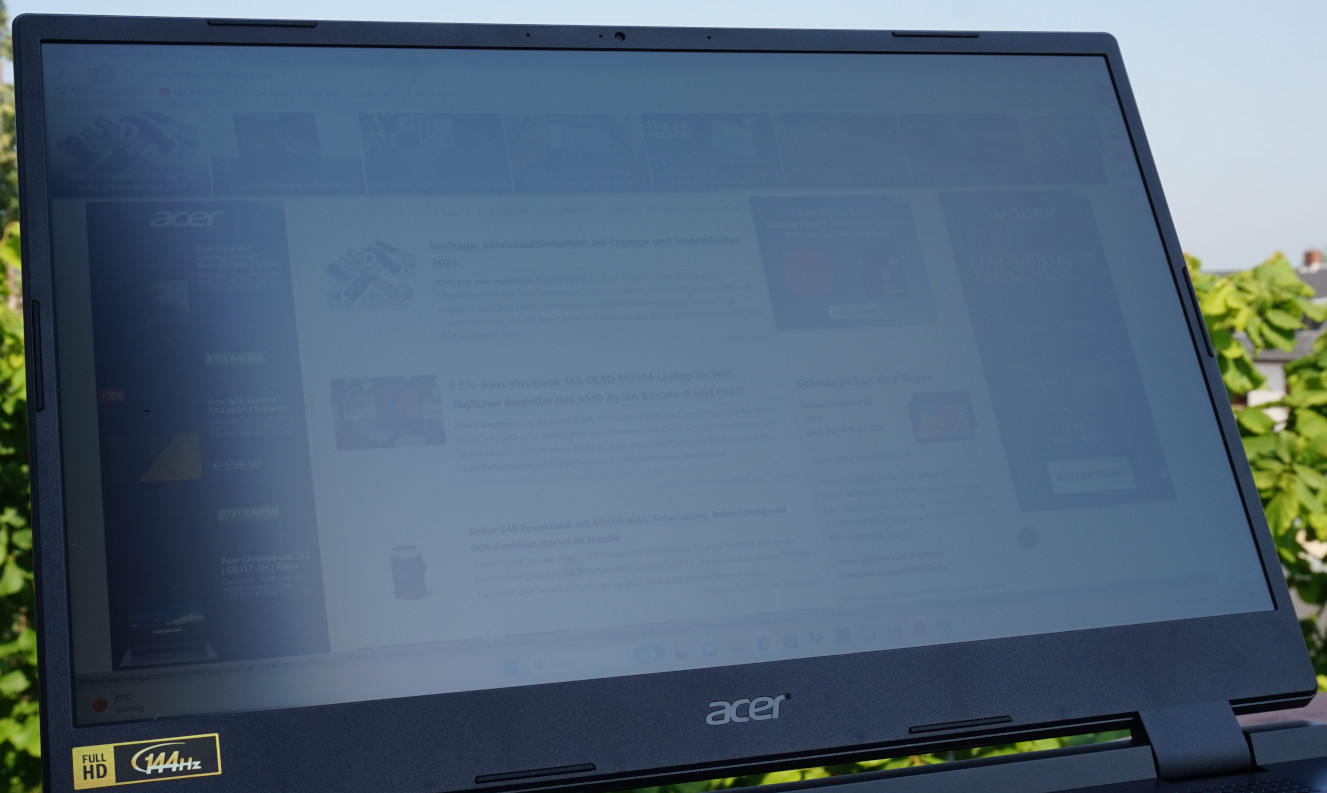
In the shade, photos and text are clearly legible, if a little grayish. As soon as sunlight falls onto the screen or the sky is reflected from behind, even text can only be difficult to decipher.

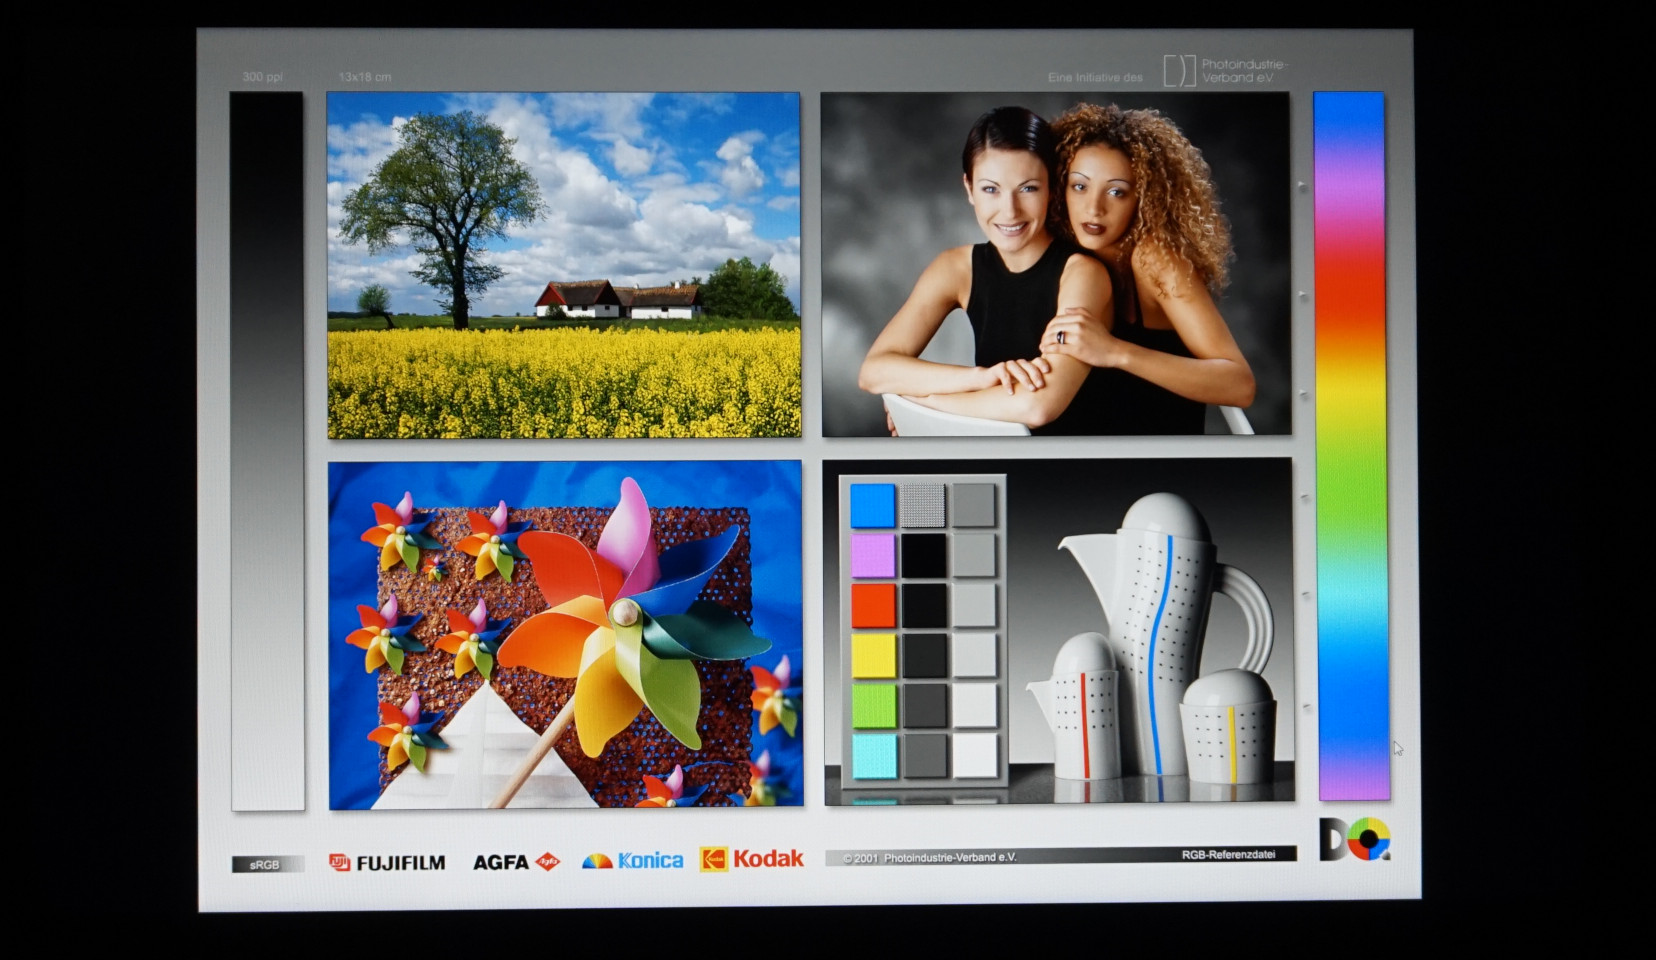
The display disappointment didn't subside when we turned to the viewing angles: At an angle of around 45 °, significant color distortions are visible, shifting towards yellow or blue. For an IPS panel, this is unusually poor performance.


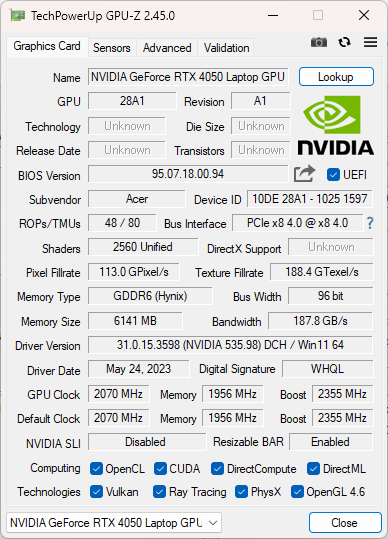
Performance - The Acer Nitro 517 is impressive but only thanks to the RTX 4050
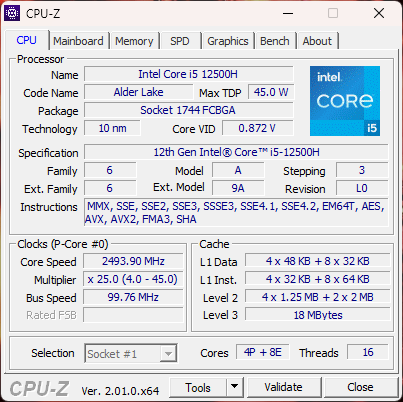
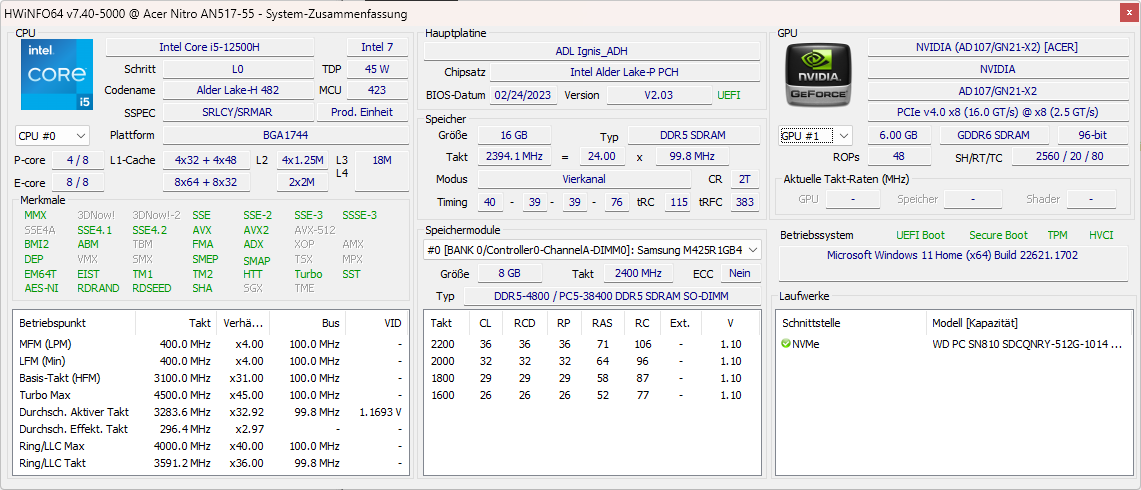
With the smallest GPU in the RTX 4000 series, the RTX 4050, the Nitro belongs to the entry-level class of gaming laptops. This is joined by a chip already launched at the start of 2022, the Intel Core i5-12500H. It wasn't a top model, even when it was introduced but still offers sufficient computational power for its intended use. Additionally, both components can be supplied with a lot of power, at least on paper. The CPU consumes up to 115 watts and the GPU even manages 140 watts with dynamic boost.
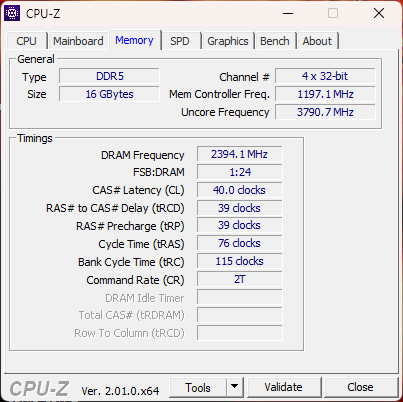
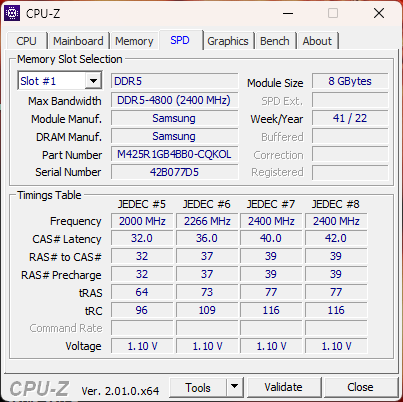
As well as that, we have 16 GB of DDR5 4800 RAM from Samsung which is fast enough for high frame rates in less demanding games. For Full HD gaming, the basics seem to be relatively coherent as long as you can live without one or two details here or there.
Test conditions
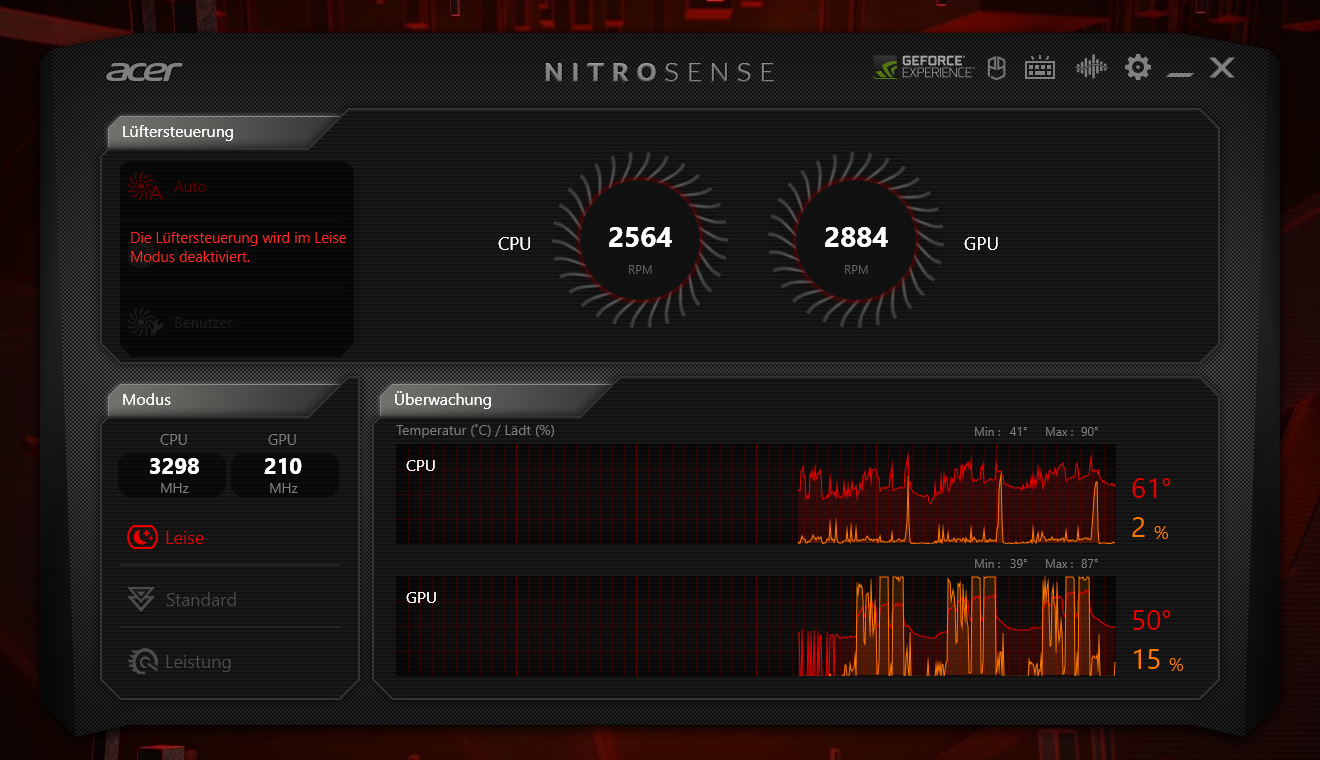
Acer's provided "NitroSense" control software is accessible via a designated button and allows access to the various performance mode settings as well as fan management. In addition, the key lighting can be adjusted, speaker sound profiles can be selected and a few basic settings can be made.
For our gaming tests and benchmarks, we selected the "Performance" profile and kept the automatic fan. Using the "Standard" profile the noise levels are reduced substantially and in "Quiet" mode the cooling sound's volume drops further but remains continuously audible.
| Performance | Standard | Quiet | Battery mode | |
| PL1 | 95 watts | 80 watts | 80 watts | 70 watts |
| PL2 | 115 watts | 115 watts | 115 watts | 115 watts |
Processor
The Intel Core i5-12500H is a small processor - at least for a gaming laptop - and offers twelve cores of which four are performance cores and eight efficiency cores with a total of 16 threads. That is sufficient for high-level multitasking. The laptop is still easy to use, even alongside demanding programs. The maximum clock speed only sits at 4.5 GHz, and, at 18 MB, the L3 cache is not especially large.
Despite these rather modest specs, the Cinebench R15 loop ran very well. For example, the Medion Erazer Defender P40 manages 30% more at the start with its considerably faster i7-13700HX. Towards the end of the loop, it's not even a 10% advantage. This is where the generous cooling comes to the fore and can be seen from the almost flatline series of measurements. The processor can consume 95 watts for a longer period and 115 watts for short periods without a dramatic increase in temperatures.
Also in "Quiet" mode (the green line in the Cinebench loop) - during which disruptive noises were hardly audible - solid results were returned which were, on average, on par with the MSI Cyborg 15 A12VF. The Nitro consumes less power despite the MSI having a larger CPU. The fact that the Nitro 5 continues to perform well here is due to a reduction to 70 watts while the brief maximum of 115 watts remains unchanged. In "Standard" and battery modes, the power limit is 80 watts.
Additional benchmarks and information can be found here in our CPU benchmark list.
Cinebench R15 Multi continuous test
Cinebench R23: Multi Core | Single Core
Cinebench R20: CPU (Multi Core) | CPU (Single Core)
Cinebench R15: CPU Multi 64Bit | CPU Single 64Bit
Blender: v2.79 BMW27 CPU
7-Zip 18.03: 7z b 4 | 7z b 4 -mmt1
Geekbench 5.5: Multi-Core | Single-Core
HWBOT x265 Benchmark v2.2: 4k Preset
LibreOffice : 20 Documents To PDF
R Benchmark 2.5: Overall mean
| CPU Performance rating | |
| Average of class Gaming | |
| Asus TUF Gaming A16 FA617XS | |
| Medion Erazer Scout E20 | |
| MSI Cyborg 15 A12VF | |
| MSI Katana 15 B12VEK | |
| Acer Nitro 5 AN517-55-738R | |
| Acer Nitro 5 AN517-55-5552 | |
| Average Intel Core i5-12500H | |
| Cinebench R23 / Multi Core | |
| Average of class Gaming (10488 - 40970, n=112, last 2 years) | |
| Asus TUF Gaming A16 FA617XS | |
| Medion Erazer Scout E20 | |
| MSI Katana 15 B12VEK | |
| MSI Cyborg 15 A12VF | |
| Acer Nitro 5 AN517-55-5552 | |
| Acer Nitro 5 AN517-55-738R | |
| Average Intel Core i5-12500H (11330 - 14686, n=9) | |
| Cinebench R23 / Single Core | |
| Average of class Gaming (1166 - 2356, n=112, last 2 years) | |
| Medion Erazer Scout E20 | |
| Acer Nitro 5 AN517-55-738R | |
| Asus TUF Gaming A16 FA617XS | |
| MSI Cyborg 15 A12VF | |
| MSI Katana 15 B12VEK | |
| Average Intel Core i5-12500H (1558 - 1701, n=9) | |
| Acer Nitro 5 AN517-55-5552 | |
| Cinebench R20 / CPU (Multi Core) | |
| Average of class Gaming (4029 - 16108, n=111, last 2 years) | |
| Asus TUF Gaming A16 FA617XS | |
| Medion Erazer Scout E20 | |
| Acer Nitro 5 AN517-55-738R | |
| MSI Katana 15 B12VEK | |
| MSI Cyborg 15 A12VF | |
| Acer Nitro 5 AN517-55-5552 | |
| Average Intel Core i5-12500H (4687 - 5640, n=9) | |
| Cinebench R20 / CPU (Single Core) | |
| Average of class Gaming (442 - 895, n=111, last 2 years) | |
| Medion Erazer Scout E20 | |
| Asus TUF Gaming A16 FA617XS | |
| Acer Nitro 5 AN517-55-738R | |
| MSI Cyborg 15 A12VF | |
| MSI Katana 15 B12VEK | |
| Average Intel Core i5-12500H (602 - 656, n=9) | |
| Acer Nitro 5 AN517-55-5552 | |
| Cinebench R15 / CPU Multi 64Bit | |
| Average of class Gaming (1578 - 6271, n=111, last 2 years) | |
| Medion Erazer Scout E20 | |
| Asus TUF Gaming A16 FA617XS | |
| Acer Nitro 5 AN517-55-738R | |
| MSI Katana 15 B12VEK | |
| Acer Nitro 5 AN517-55-5552 | |
| MSI Cyborg 15 A12VF | |
| Average Intel Core i5-12500H (1970 - 2283, n=10) | |
| Cinebench R15 / CPU Single 64Bit | |
| Average of class Gaming (188.8 - 343, n=111, last 2 years) | |
| Asus TUF Gaming A16 FA617XS | |
| Medion Erazer Scout E20 | |
| Acer Nitro 5 AN517-55-738R | |
| MSI Katana 15 B12VEK | |
| MSI Cyborg 15 A12VF | |
| Average Intel Core i5-12500H (220 - 250, n=9) | |
| Acer Nitro 5 AN517-55-5552 | |
| Blender / v2.79 BMW27 CPU | |
| MSI Cyborg 15 A12VF | |
| Average Intel Core i5-12500H (223 - 288, n=9) | |
| MSI Katana 15 B12VEK | |
| Acer Nitro 5 AN517-55-5552 | |
| Acer Nitro 5 AN517-55-738R | |
| Medion Erazer Scout E20 | |
| Asus TUF Gaming A16 FA617XS | |
| Average of class Gaming (80 - 330, n=109, last 2 years) | |
| 7-Zip 18.03 / 7z b 4 | |
| Average of class Gaming (33491 - 148086, n=110, last 2 years) | |
| Asus TUF Gaming A16 FA617XS | |
| Medion Erazer Scout E20 | |
| MSI Katana 15 B12VEK | |
| MSI Cyborg 15 A12VF | |
| Acer Nitro 5 AN517-55-738R | |
| Acer Nitro 5 AN517-55-5552 | |
| Average Intel Core i5-12500H (44105 - 54380, n=9) | |
| 7-Zip 18.03 / 7z b 4 -mmt1 | |
| Asus TUF Gaming A16 FA617XS | |
| Average of class Gaming (4199 - 7436, n=110, last 2 years) | |
| Medion Erazer Scout E20 | |
| MSI Cyborg 15 A12VF | |
| Acer Nitro 5 AN517-55-738R | |
| MSI Katana 15 B12VEK | |
| Average Intel Core i5-12500H (5151 - 5563, n=9) | |
| Acer Nitro 5 AN517-55-5552 | |
| Geekbench 5.5 / Multi-Core | |
| Average of class Gaming (6460 - 27010, n=110, last 2 years) | |
| Acer Nitro 5 AN517-55-738R | |
| Medion Erazer Scout E20 | |
| Asus TUF Gaming A16 FA617XS | |
| MSI Katana 15 B12VEK | |
| MSI Cyborg 15 A12VF | |
| Acer Nitro 5 AN517-55-5552 | |
| Average Intel Core i5-12500H (7962 - 10828, n=9) | |
| Geekbench 5.5 / Single-Core | |
| Average of class Gaming (986 - 2474, n=110, last 2 years) | |
| Asus TUF Gaming A16 FA617XS | |
| Medion Erazer Scout E20 | |
| MSI Cyborg 15 A12VF | |
| Acer Nitro 5 AN517-55-738R | |
| MSI Katana 15 B12VEK | |
| Average Intel Core i5-12500H (1471 - 1693, n=9) | |
| Acer Nitro 5 AN517-55-5552 | |
| HWBOT x265 Benchmark v2.2 / 4k Preset | |
| Average of class Gaming (11.5 - 44.3, n=110, last 2 years) | |
| Asus TUF Gaming A16 FA617XS | |
| MSI Katana 15 B12VEK | |
| Medion Erazer Scout E20 | |
| Acer Nitro 5 AN517-55-5552 | |
| MSI Cyborg 15 A12VF | |
| MSI Cyborg 15 A12VF | |
| Average Intel Core i5-12500H (12 - 16.6, n=9) | |
| Acer Nitro 5 AN517-55-738R | |
| LibreOffice / 20 Documents To PDF | |
| Acer Nitro 5 AN517-55-5552 | |
| Acer Nitro 5 AN517-55-738R | |
| Average of class Gaming (19 - 88.8, n=110, last 2 years) | |
| Average Intel Core i5-12500H (40.1 - 58.5, n=9) | |
| MSI Katana 15 B12VEK | |
| Medion Erazer Scout E20 | |
| Asus TUF Gaming A16 FA617XS | |
| MSI Cyborg 15 A12VF | |
| R Benchmark 2.5 / Overall mean | |
| Acer Nitro 5 AN517-55-5552 | |
| Average Intel Core i5-12500H (0.4748 - 0.535, n=9) | |
| MSI Katana 15 B12VEK | |
| MSI Cyborg 15 A12VF | |
| Acer Nitro 5 AN517-55-738R | |
| Medion Erazer Scout E20 | |
| Average of class Gaming (0.3439 - 0.759, n=111, last 2 years) | |
| Asus TUF Gaming A16 FA617XS | |
* ... smaller is better
AIDA64: FP32 Ray-Trace | FPU Julia | CPU SHA3 | CPU Queen | FPU SinJulia | FPU Mandel | CPU AES | CPU ZLib | FP64 Ray-Trace | CPU PhotoWorxx
| Performance rating | |
| Average of class Gaming | |
| Asus TUF Gaming A16 FA617XS | |
| Medion Erazer Scout E20 | |
| MSI Katana 15 B12VEK | |
| MSI Cyborg 15 A12VF | |
| Acer Nitro 5 AN517-55-5552 | |
| Average Intel Core i5-12500H | |
| Acer Nitro 5 AN517-55-738R | |
| AIDA64 / FP32 Ray-Trace | |
| Average of class Gaming (10227 - 85542, n=109, last 2 years) | |
| Asus TUF Gaming A16 FA617XS (v6.75.6100) | |
| MSI Katana 15 B12VEK (v6.85.6300) | |
| Medion Erazer Scout E20 (v6.75.6100) | |
| Acer Nitro 5 AN517-55-5552 (v6.75.6100) | |
| MSI Cyborg 15 A12VF (v6.75.6100) | |
| Average Intel Core i5-12500H (6851 - 13947, n=9) | |
| Acer Nitro 5 AN517-55-738R (v6.50.5800) | |
| AIDA64 / FPU Julia | |
| Average of class Gaming (51376 - 238426, n=109, last 2 years) | |
| Asus TUF Gaming A16 FA617XS (v6.75.6100) | |
| MSI Katana 15 B12VEK (v6.85.6300) | |
| Medion Erazer Scout E20 | |
| MSI Cyborg 15 A12VF (v6.75.6100) | |
| Acer Nitro 5 AN517-55-5552 (v6.75.6100) | |
| Average Intel Core i5-12500H (29874 - 68178, n=9) | |
| Acer Nitro 5 AN517-55-738R (v6.50.5800) | |
| AIDA64 / CPU SHA3 | |
| Average of class Gaming (2180 - 9817, n=109, last 2 years) | |
| Asus TUF Gaming A16 FA617XS (v6.75.6100) | |
| MSI Katana 15 B12VEK (v6.85.6300) | |
| Medion Erazer Scout E20 (v6.75.6100) | |
| Acer Nitro 5 AN517-55-5552 (v6.75.6100) | |
| MSI Cyborg 15 A12VF (v6.75.6100) | |
| Average Intel Core i5-12500H (2287 - 3337, n=9) | |
| Acer Nitro 5 AN517-55-738R (v6.50.5800) | |
| AIDA64 / CPU Queen | |
| Asus TUF Gaming A16 FA617XS (v6.75.6100) | |
| Average of class Gaming (49785 - 173351, n=100, last 2 years) | |
| Medion Erazer Scout E20 (v6.75.6100) | |
| Acer Nitro 5 AN517-55-738R (v6.50.5800) | |
| MSI Katana 15 B12VEK (v6.85.6300) | |
| MSI Cyborg 15 A12VF (v6.75.6100) | |
| Average Intel Core i5-12500H (77935 - 80703, n=9) | |
| Acer Nitro 5 AN517-55-5552 (v6.75.6100) | |
| AIDA64 / FPU SinJulia | |
| Asus TUF Gaming A16 FA617XS (v6.75.6100) | |
| Average of class Gaming (4424 - 33636, n=109, last 2 years) | |
| Medion Erazer Scout E20 (v6.75.6100) | |
| Acer Nitro 5 AN517-55-738R (v6.50.5800) | |
| MSI Katana 15 B12VEK (v6.85.6300) | |
| MSI Cyborg 15 A12VF (v6.75.6100) | |
| Acer Nitro 5 AN517-55-5552 (v6.75.6100) | |
| Average Intel Core i5-12500H (6590 - 7431, n=9) | |
| AIDA64 / FPU Mandel | |
| Average of class Gaming (25115 - 128721, n=109, last 2 years) | |
| Asus TUF Gaming A16 FA617XS (v6.75.6100) | |
| MSI Katana 15 B12VEK (v6.85.6300) | |
| Medion Erazer Scout E20 (v6.75.6100) | |
| Acer Nitro 5 AN517-55-5552 (v6.75.6100) | |
| MSI Cyborg 15 A12VF (v6.75.6100) | |
| Average Intel Core i5-12500H (18252 - 34041, n=9) | |
| Acer Nitro 5 AN517-55-738R (v6.50.5800) | |
| AIDA64 / CPU AES | |
| Average of class Gaming (39258 - 247074, n=109, last 2 years) | |
| Average Intel Core i5-12500H (50298 - 111567, n=9) | |
| Asus TUF Gaming A16 FA617XS (v6.75.6100) | |
| Medion Erazer Scout E20 (v6.75.6100) | |
| MSI Katana 15 B12VEK (v6.85.6300) | |
| MSI Cyborg 15 A12VF (v6.75.6100) | |
| Acer Nitro 5 AN517-55-5552 (v6.75.6100) | |
| Acer Nitro 5 AN517-55-738R (v6.50.5800) | |
| AIDA64 / CPU ZLib | |
| Average of class Gaming (574 - 2531, n=109, last 2 years) | |
| Asus TUF Gaming A16 FA617XS (v6.75.6100) | |
| Medion Erazer Scout E20 (v6.75.6100) | |
| Acer Nitro 5 AN517-55-738R (v6.50.5800) | |
| Acer Nitro 5 AN517-55-5552 (v6.75.6100) | |
| MSI Cyborg 15 A12VF (v6.75.6100) | |
| MSI Katana 15 B12VEK (v6.85.6300) | |
| Average Intel Core i5-12500H (746 - 924, n=9) | |
| AIDA64 / FP64 Ray-Trace | |
| Average of class Gaming (5509 - 45446, n=109, last 2 years) | |
| Asus TUF Gaming A16 FA617XS (v6.75.6100) | |
| MSI Katana 15 B12VEK (v6.85.6300) | |
| Medion Erazer Scout E20 (v6.75.6100) | |
| Acer Nitro 5 AN517-55-5552 (v6.75.6100) | |
| MSI Cyborg 15 A12VF (v6.75.6100) | |
| Average Intel Core i5-12500H (3848 - 7405, n=9) | |
| Acer Nitro 5 AN517-55-738R (v6.50.5800) | |
| AIDA64 / CPU PhotoWorxx | |
| Average of class Gaming (12271 - 89891, n=109, last 2 years) | |
| Medion Erazer Scout E20 (v6.75.6100) | |
| MSI Katana 15 B12VEK (v6.85.6300) | |
| MSI Cyborg 15 A12VF (v6.75.6100) | |
| Acer Nitro 5 AN517-55-5552 (v6.75.6100) | |
| Average Intel Core i5-12500H (13686 - 43813, n=9) | |
| Asus TUF Gaming A16 FA617XS (v6.75.6100) | |
| Acer Nitro 5 AN517-55-738R (v6.50.5800) | |
System performance
With the not-very-powerful CPU, the CrossMark and PCMark results are also not exactly thrilling. Comparable gaming laptops can achieve an extra few percentage points.
Nevertheless, we're dealing with a powerful 16-thread processor which has no difficulties handling multitasking, launching programs, and installation and de-installation processes. Opening the browser, playing videos and additional everyday tasks can all be done without any lags to speak of.
CrossMark: Overall | Productivity | Creativity | Responsiveness
| PCMark 10 / Score | |
| Average of class Gaming (5828 - 11574, n=95, last 2 years) | |
| Asus TUF Gaming A16 FA617XS | |
| Medion Erazer Scout E20 | |
| MSI Cyborg 15 A12VF | |
| MSI Katana 15 B12VEK | |
| Acer Nitro 5 AN517-55-5552 | |
| Average Intel Core i5-12500H, NVIDIA GeForce RTX 4050 Laptop GPU (6220 - 6719, n=2) | |
| Gigabyte G7 KE | |
| PCMark 10 / Essentials | |
| Medion Erazer Scout E20 | |
| Asus TUF Gaming A16 FA617XS | |
| MSI Cyborg 15 A12VF | |
| Average of class Gaming (8810 - 12600, n=99, last 2 years) | |
| Gigabyte G7 KE | |
| MSI Katana 15 B12VEK | |
| Acer Nitro 5 AN517-55-5552 | |
| Average Intel Core i5-12500H, NVIDIA GeForce RTX 4050 Laptop GPU (9418 - 9985, n=2) | |
| PCMark 10 / Productivity | |
| Average of class Gaming (6845 - 18766, n=97, last 2 years) | |
| Asus TUF Gaming A16 FA617XS | |
| MSI Cyborg 15 A12VF | |
| Medion Erazer Scout E20 | |
| MSI Katana 15 B12VEK | |
| Gigabyte G7 KE | |
| Acer Nitro 5 AN517-55-5552 | |
| Average Intel Core i5-12500H, NVIDIA GeForce RTX 4050 Laptop GPU (8822 - 8980, n=2) | |
| PCMark 10 / Digital Content Creation | |
| Average of class Gaming (7602 - 19657, n=97, last 2 years) | |
| Asus TUF Gaming A16 FA617XS | |
| Medion Erazer Scout E20 | |
| Acer Nitro 5 AN517-55-5552 | |
| MSI Cyborg 15 A12VF | |
| MSI Katana 15 B12VEK | |
| Average Intel Core i5-12500H, NVIDIA GeForce RTX 4050 Laptop GPU (7862 - 9180, n=2) | |
| Gigabyte G7 KE | |
| CrossMark / Overall | |
| Average of class Gaming (1366 - 2409, n=97, last 2 years) | |
| Medion Erazer Scout E20 | |
| Gigabyte G7 KE | |
| MSI Cyborg 15 A12VF | |
| Asus TUF Gaming A16 FA617XS | |
| Acer Nitro 5 AN517-55-5552 | |
| MSI Katana 15 B12VEK | |
| Average Intel Core i5-12500H, NVIDIA GeForce RTX 4050 Laptop GPU (1702 - 1726, n=2) | |
| CrossMark / Productivity | |
| Medion Erazer Scout E20 | |
| Average of class Gaming (1386 - 2254, n=97, last 2 years) | |
| Gigabyte G7 KE | |
| MSI Cyborg 15 A12VF | |
| Asus TUF Gaming A16 FA617XS | |
| Acer Nitro 5 AN517-55-5552 | |
| Average Intel Core i5-12500H, NVIDIA GeForce RTX 4050 Laptop GPU (1648 - 1675, n=2) | |
| MSI Katana 15 B12VEK | |
| CrossMark / Creativity | |
| Average of class Gaming (1343 - 2729, n=97, last 2 years) | |
| Medion Erazer Scout E20 | |
| Asus TUF Gaming A16 FA617XS | |
| MSI Cyborg 15 A12VF | |
| MSI Katana 15 B12VEK | |
| Gigabyte G7 KE | |
| Acer Nitro 5 AN517-55-5552 | |
| Average Intel Core i5-12500H, NVIDIA GeForce RTX 4050 Laptop GPU (1752 - 1775, n=2) | |
| CrossMark / Responsiveness | |
| Gigabyte G7 KE | |
| Medion Erazer Scout E20 | |
| Acer Nitro 5 AN517-55-5552 | |
| Average Intel Core i5-12500H, NVIDIA GeForce RTX 4050 Laptop GPU (1718 - 1736, n=2) | |
| Average of class Gaming (1226 - 2334, n=97, last 2 years) | |
| MSI Cyborg 15 A12VF | |
| MSI Katana 15 B12VEK | |
| Asus TUF Gaming A16 FA617XS | |
| PCMark 10 Score | 6719 points | |
Help | ||
| AIDA64 / Memory Copy | |
| Average of class Gaming (21750 - 129946, n=109, last 2 years) | |
| Asus TUF Gaming A16 FA617XS | |
| Medion Erazer Scout E20 | |
| MSI Cyborg 15 A12VF | |
| MSI Katana 15 B12VEK | |
| Acer Nitro 5 AN517-55-5552 | |
| Average Intel Core i5-12500H (23850 - 66598, n=9) | |
| Acer Nitro 5 AN517-55-738R | |
| AIDA64 / Memory Read | |
| Average of class Gaming (22956 - 118858, n=109, last 2 years) | |
| Medion Erazer Scout E20 | |
| MSI Katana 15 B12VEK | |
| MSI Cyborg 15 A12VF | |
| Asus TUF Gaming A16 FA617XS | |
| Acer Nitro 5 AN517-55-5552 | |
| Average Intel Core i5-12500H (24879 - 68013, n=9) | |
| Acer Nitro 5 AN517-55-738R | |
| AIDA64 / Memory Write | |
| Average of class Gaming (22297 - 135096, n=109, last 2 years) | |
| Asus TUF Gaming A16 FA617XS | |
| Medion Erazer Scout E20 | |
| MSI Katana 15 B12VEK | |
| MSI Cyborg 15 A12VF | |
| Acer Nitro 5 AN517-55-5552 | |
| Acer Nitro 5 AN517-55-738R | |
| Average Intel Core i5-12500H (23543 - 58797, n=9) | |
| AIDA64 / Memory Latency | |
| Average of class Gaming (75.3 - 259, n=109, last 2 years) | |
| Acer Nitro 5 AN517-55-5552 | |
| Average Intel Core i5-12500H (83.8 - 114.7, n=9) | |
| Medion Erazer Scout E20 | |
| MSI Katana 15 B12VEK | |
| MSI Cyborg 15 A12VF | |
| Asus TUF Gaming A16 FA617XS | |
| Acer Nitro 5 AN517-55-738R | |
* ... smaller is better
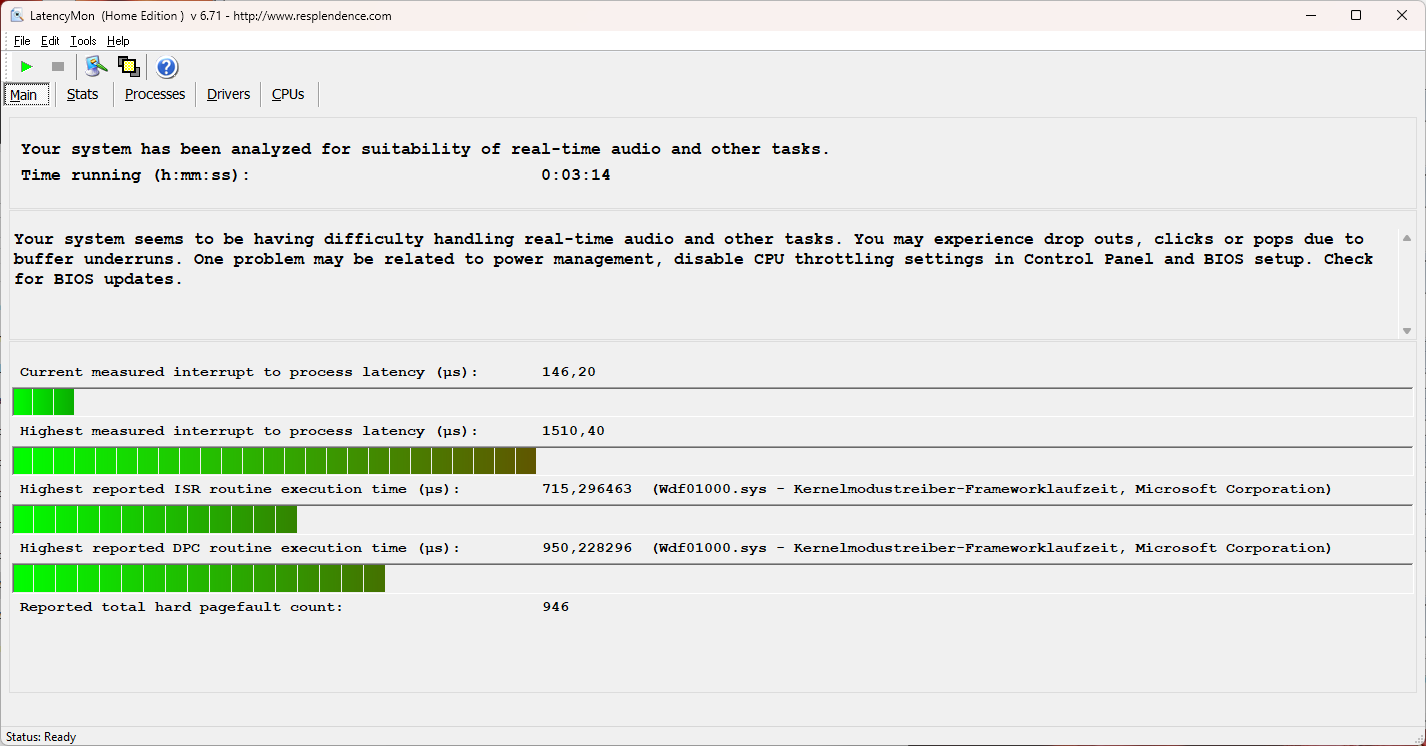
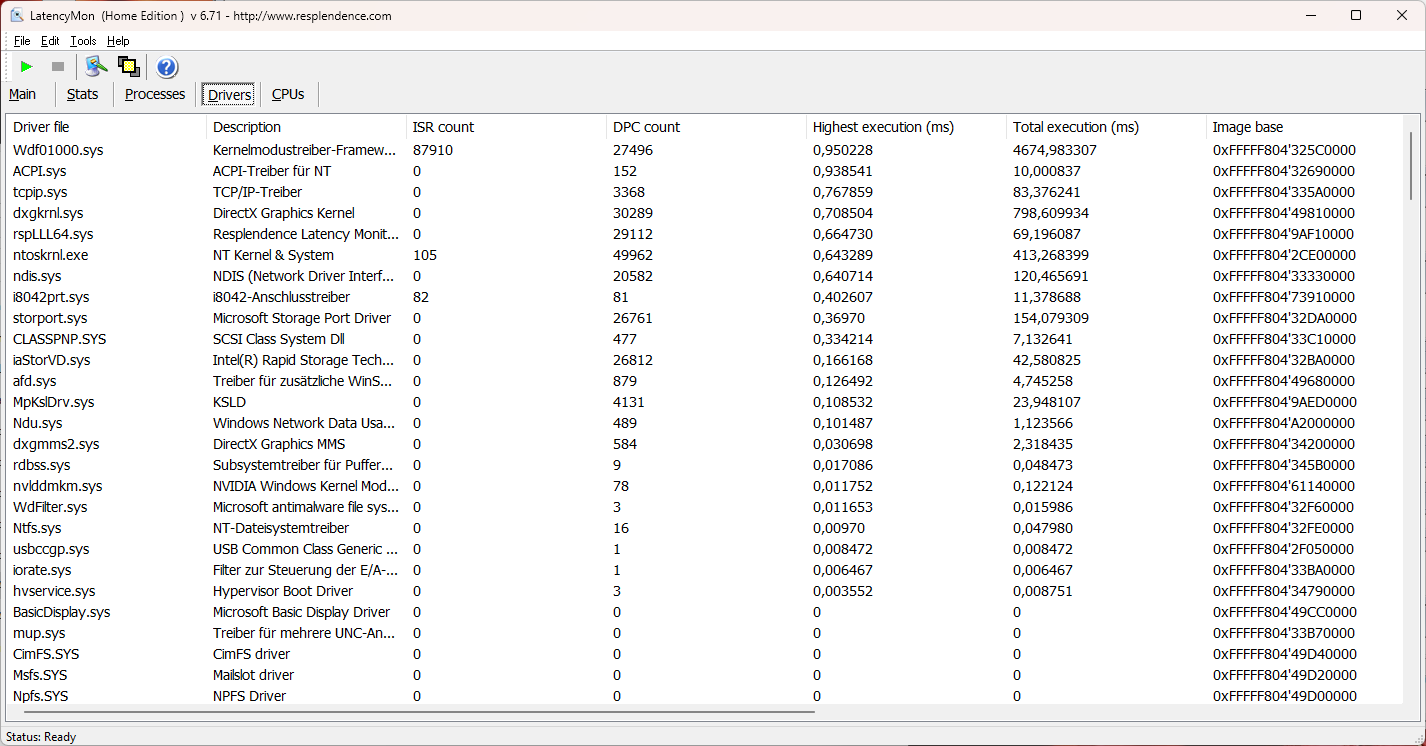
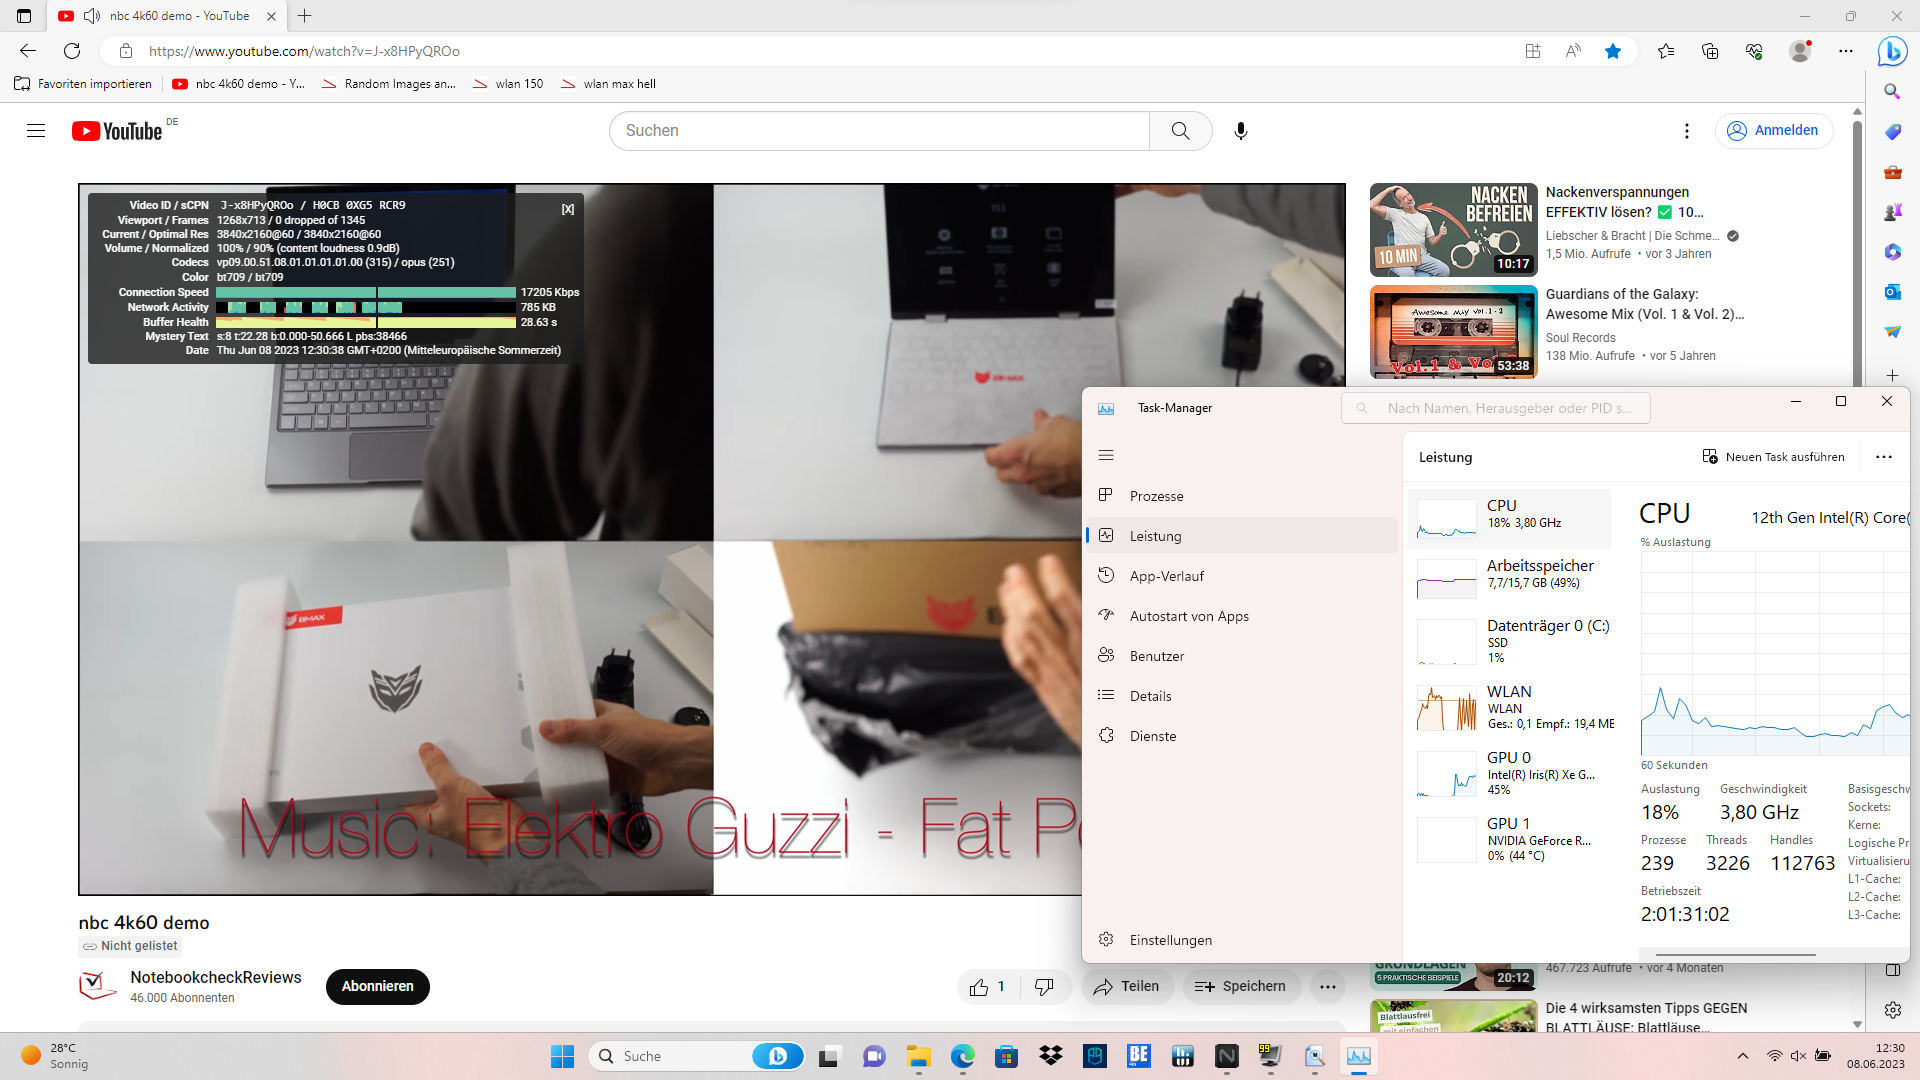
DPC latencies
Our LatencyMon test was very solid. For special tests such as real-time audio editing, the Acer Nitro 5 offers only limited suitability but is still able to handle it with very few glitches.
Currently, the Nvidia driver contributes to the measured performance dips. Updates and generally changed or deleted drivers could further improve or significantly worsen the results.
4K video playback ran in parallel without problems. Skipped frames were not detected. The iGPU is overloaded at almost 40% and the blame for this can be put down to most Alder Lake processors.
| DPC Latencies / LatencyMon - interrupt to process latency (max), Web, Youtube, Prime95 | |
| MSI Katana 15 B12VEK | |
| Medion Erazer Scout E20 | |
| Acer Nitro 5 AN517-55-5552 | |
| MSI Cyborg 15 A12VF | |
| Asus TUF Gaming A16 FA617XS | |
| Acer Nitro 5 AN517-55-738R | |
* ... smaller is better
Mass storage
The M.2 NVMe SSD from Western Digital achieved an excellent result that is better than the average of our reviewed gaming laptop's mass storage.
Despite a passively cooled controller it was unable to maintain a very high access rate in the continuous test but still, achieved an average of over 6 GB/s.

* ... smaller is better
Continuous Performance Read: DiskSpd Read Loop, Queue Depth 8
Graphics card
The Nvidia GeForce RTX 4050 is the RTX 4000 series entry-level model with a performance level comparable to an RTX 3060. Unlike the previous generation, the GPU's TDP sits at 140 watts including 25 watts dynamic boost. It was a maximum of 105 watts with the RTX 3050 (but also 140 watts with the RTX 3060).
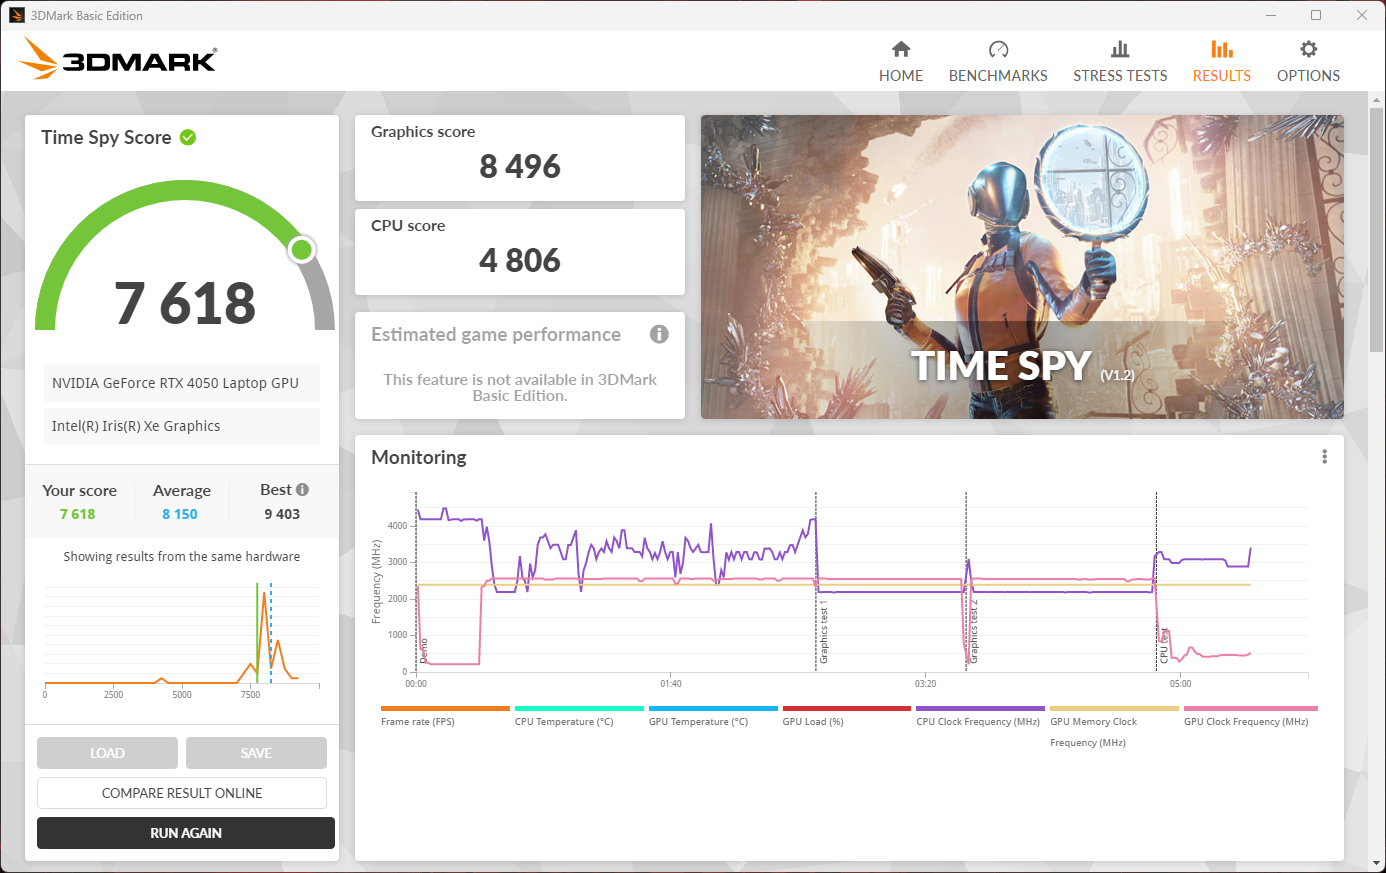
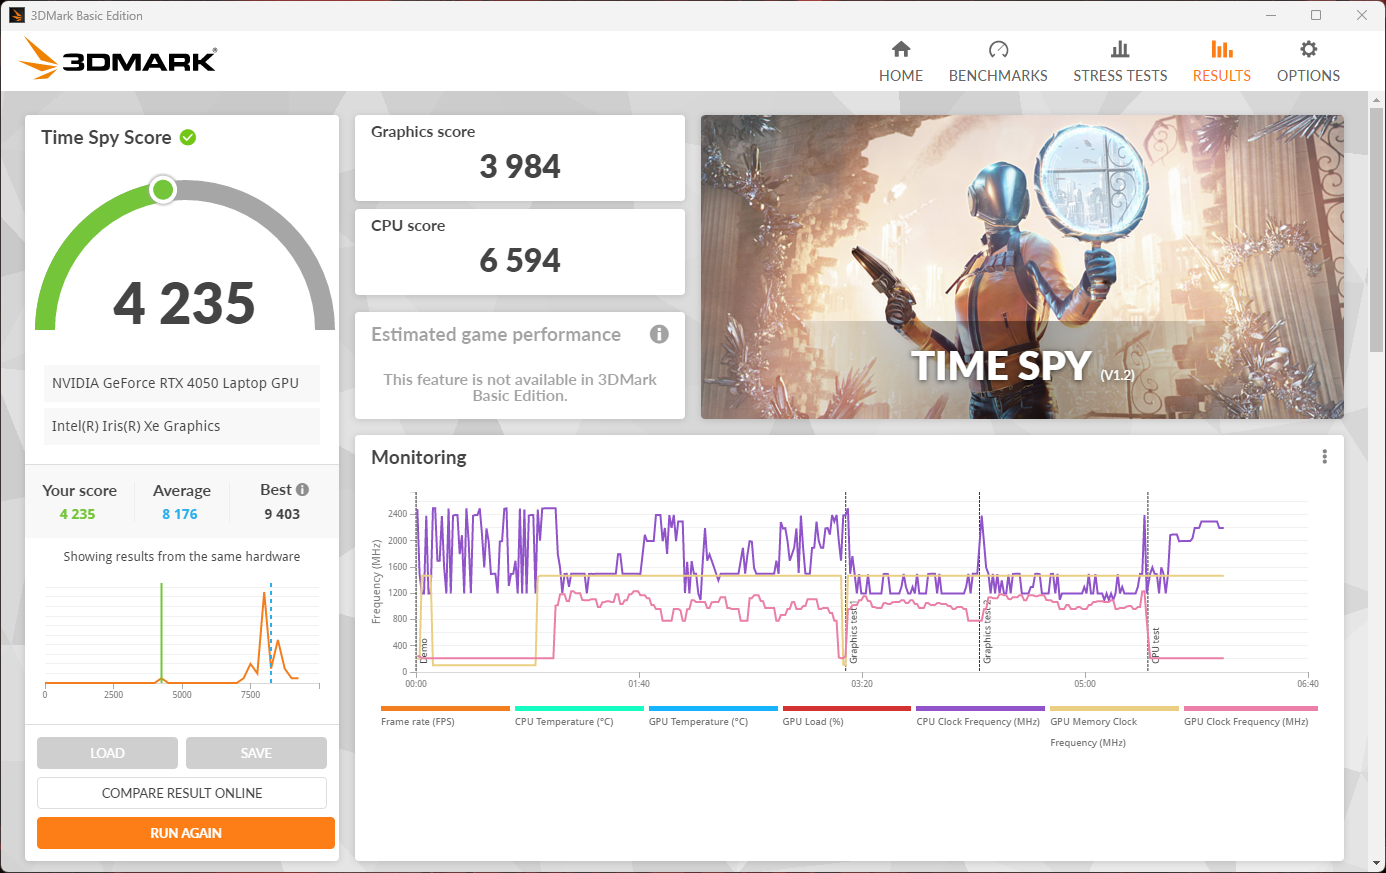
The Acer Nitro 5's RTX 4050 only reaches this value in extreme situations. In the graphics card stress test, we briefly measured the maximum possible 140 watts, but, otherwise, the power consumption at the highest performance and maximum fan speed sat at around 100 watts because reaching the GPU's critical temperature is responsible for a drop in the clock speed. For a longer period of time, for example, in the Witcher 3 continuous test, only 80 watts is consistently available and in quiet mode, it's only 50 watts.
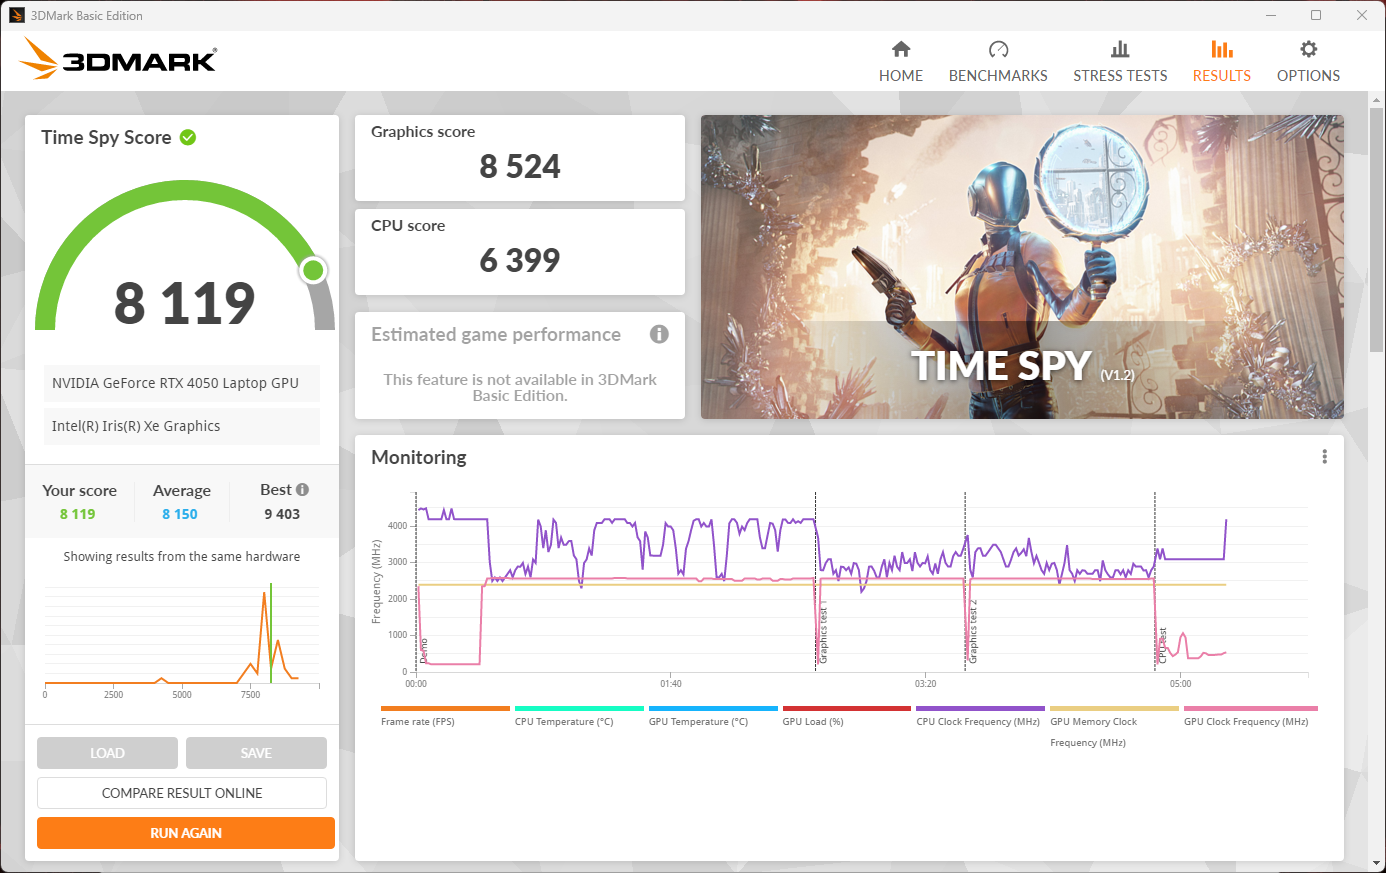
At the same time, our Witcher 3 measurements and synthetic benchmarks displayed no performance drops to speak of, if the fans are set to "Quiet". In real-life gaming situations, the average frame rate dropped by less than 10% and only 15% in 3DMark Time Spy. In Blender benchmarks, the values differentiate by only 1 second.
Graphics performance remained high in quiet mode and graphically demanding applications ran smoothly although the power consumption was greatly reduced. In return, this significantly lowers the cooling requirements.
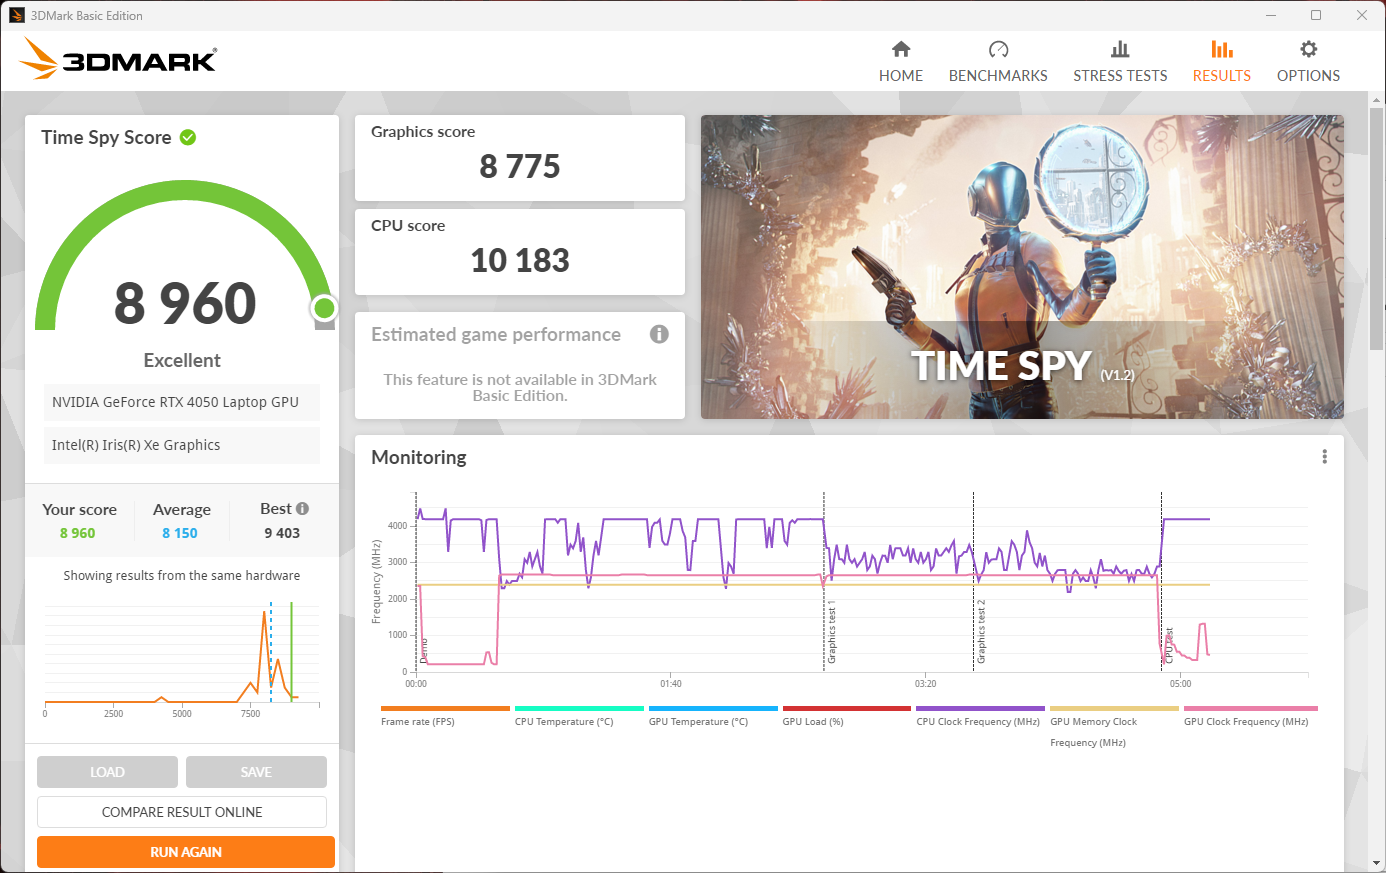
| 3DMark 11 Performance | 27855 points | |
| 3DMark Cloud Gate Standard Score | 56305 points | |
| 3DMark Fire Strike Score | 19904 points | |
| 3DMark Time Spy Score | 8960 points | |
Help | ||
* ... smaller is better
Gaming performance
When it comes to gaming performance, the Nitro 5 AN517 achieves decent frame rates, even in current games. If you can do without a few details here and there, demanding games can run at over 60fps. This corresponds to the results we received with similarly equipped gaming laptops. The previous generation Nitro 5, with an RTX 3060, is mostly on the same level. Similarly, that also applies to the AMD Asus TUF Gaming A16. The system performance is consistent with the device's Full HD display resolution.
The Nitro's benchmarks are especially interesting when it comes to quiet cooling with some of the results remaining almost identical. Sometimes they are minimally below the maximum performance measurements. Only in GTA V did we notice the frame rate drop by around 22%. This meant there was a difference of only 6% in six games. Taking GTA V out of the picture, the difference was a mere 3%, although the fan noise levels dropped by around a third.
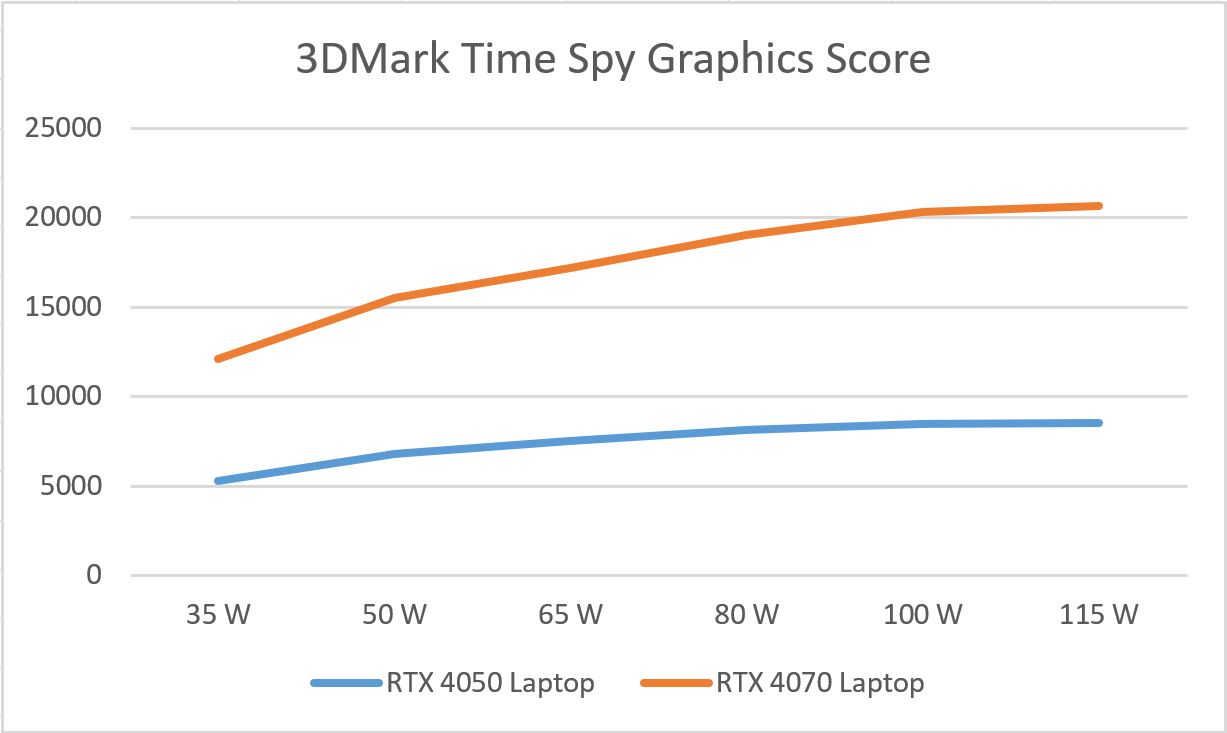
That means that with an additional 40 to 50-watt power consumption and considerably more noise production, only tiny performance gains should be expected. The RTX 4050 seems to be very efficient but with hardly any benefits when it runs at its maximum possible power requirements. Our analysis of GPU's performance values under differing loads. The graphic for the article is displayed on the right.
| The Witcher 3 - 1920x1080 Ultra Graphics & Postprocessing (HBAO+) | |
| Average of class Gaming (95 - 240, n=8, last 2 years) | |
| Medion Erazer Defender P40 | |
| Asus TUF Gaming A16 FA617XS (neu) | |
| Acer Nitro 5 AN517-55-5552 | |
| Acer Nitro 5 AN517-55-5552 (Leiser Modus) | |
| Medion Erazer Scout E20 | |
| Acer Nitro 5 AN517-55-738R | |
| MSI Katana 15 B12VEK | |
| MSI Cyborg 15 A12VF | |
| GTA V - 1920x1080 Highest AA:4xMSAA + FX AF:16x | |
| Average of class Gaming (48.3 - 186.9, n=102, last 2 years) | |
| Medion Erazer Defender P40 | |
| Medion Erazer Scout E20 | |
| Asus TUF Gaming A16 FA617XS | |
| MSI Katana 15 B12VEK | |
| MSI Cyborg 15 A12VF | |
| Acer Nitro 5 AN517-55-5552 | |
| Acer Nitro 5 AN517-55-738R | |
| Acer Nitro 5 AN517-55-5552 (Leiser Modus) | |
| Final Fantasy XV Benchmark - 1920x1080 High Quality | |
| Average of class Gaming (41 - 215, n=103, last 2 years) | |
| Medion Erazer Defender P40 (1.3) | |
| Asus TUF Gaming A16 FA617XS (1.3) | |
| Acer Nitro 5 AN517-55-5552 (1.3) | |
| MSI Katana 15 B12VEK (1.3) | |
| Medion Erazer Scout E20 (1.3) | |
| MSI Cyborg 15 A12VF (1.3) | |
| Acer Nitro 5 AN517-55-5552 (Leiser Modus) | |
| Acer Nitro 5 AN517-55-738R (1.3) | |
| Strange Brigade - 1920x1080 ultra AA:ultra AF:16 | |
| Average of class Gaming (76.3 - 456, n=93, last 2 years) | |
| Medion Erazer Defender P40 (1.47.22.14 D3D12) | |
| Asus TUF Gaming A16 FA617XS (1.47.22.14 D3D12) | |
| Acer Nitro 5 AN517-55-5552 (1.47.22.14 D3D12) | |
| MSI Katana 15 B12VEK (1.47.22.14 D3D12) | |
| Acer Nitro 5 AN517-55-5552 (Leiser Modus) | |
| Medion Erazer Scout E20 (1.47.22.14 D3D12) | |
| Acer Nitro 5 AN517-55-738R (1.47.22.14 D3D12) | |
| MSI Cyborg 15 A12VF (1.47.22.14 D3D12) | |
| Dota 2 Reborn - 1920x1080 ultra (3/3) best looking | |
| Acer Nitro 5 AN517-55-738R | |
| Average of class Gaming (84.8 - 248, n=112, last 2 years) | |
| Medion Erazer Defender P40 | |
| MSI Katana 15 B12VEK | |
| Medion Erazer Scout E20 | |
| MSI Cyborg 15 A12VF | |
| Acer Nitro 5 AN517-55-5552 | |
| Acer Nitro 5 AN517-55-5552 (Leiser Modus) | |
| Asus TUF Gaming A16 FA617XS | |
| The Witcher 3 | |
| 1920x1080 High Graphics & Postprocessing (Nvidia HairWorks Off) | |
| Average of class Gaming (181 - 341, n=3, last 2 years) | |
| Asus TUF Gaming A16 FA617XS | |
| Acer Nitro 5 AN517-55-5552 | |
| MSI Katana 15 B12VEK | |
| Acer Nitro 5 AN517-55-738R | |
| Medion Erazer Scout E20 | |
| Average NVIDIA GeForce RTX 4050 Laptop GPU (87 - 177, n=28) | |
| MSI Cyborg 15 A12VF | |
| 1920x1080 Ultra Graphics & Postprocessing (HBAO+) | |
| Average of class Gaming (95 - 240, n=8, last 2 years) | |
| Asus TUF Gaming A16 FA617XS | |
| Acer Nitro 5 AN517-55-5552 | |
| Medion Erazer Scout E20 | |
| Acer Nitro 5 AN517-55-738R | |
| MSI Katana 15 B12VEK | |
| MSI Cyborg 15 A12VF | |
| Average NVIDIA GeForce RTX 4050 Laptop GPU (18.5 - 94.7, n=40) | |
| Hogwarts Legacy | |
| 1920x1080 High Preset AA:High T | |
| Average of class Gaming (n=1last 2 years) | |
| MSI Cyborg 15 A12VF | |
| Asus TUF Gaming A16 FA617XS | |
| Acer Nitro 5 AN517-55-5552 | |
| Average NVIDIA GeForce RTX 4050 Laptop GPU (44.8 - 93.6, n=8) | |
| 1920x1080 Ultra Preset AA:High T | |
| Average of class Gaming (76 - 108.3, n=2, last 2 years) | |
| MSI Cyborg 15 A12VF | |
| Asus TUF Gaming A16 FA617XS | |
| Average NVIDIA GeForce RTX 4050 Laptop GPU (39 - 77.3, n=8) | |
| Acer Nitro 5 AN517-55-5552 | |
| Sons of the Forest | |
| 1920x1080 Ultra Preset AA:T | |
| Asus TUF Gaming A16 FA617XS | |
| Acer Nitro 5 AN517-55-5552 | |
| Average NVIDIA GeForce RTX 4050 Laptop GPU (61.9 - 76, n=4) | |
| MSI Cyborg 15 A12VF | |
| 1920x1080 High Preset AA:T | |
| Asus TUF Gaming A16 FA617XS | |
| Acer Nitro 5 AN517-55-5552 | |
| Average NVIDIA GeForce RTX 4050 Laptop GPU (63.5 - 76, n=4) | |
| MSI Cyborg 15 A12VF | |
| Star Wars Jedi Survivor | |
| 1920x1080 High Preset | |
| Medion Erazer Scout E20 | |
| Average NVIDIA GeForce RTX 4050 Laptop GPU (51.6 - 65.9, n=7) | |
| Acer Nitro 5 AN517-55-5552 | |
| Average of class Gaming (n=1last 2 years) | |
| 1920x1080 Epic Preset | |
| Acer Nitro 5 AN517-55-5552 | |
| Average NVIDIA GeForce RTX 4050 Laptop GPU (48.4 - 56, n=7) | |
| Medion Erazer Scout E20 | |
In the Witcher 3 endurance test, the Acer Nitro 5 AN517 showed no weaknesses with frame rates remaining consistently stable. The slight fluctuations correspond to the rhythm of the day and night cycles in the game.
By contrast, using "Quiet" mode, we observed a slight drop. At first, the green line (quiet) stayed almost congruent with the red line (Performance). With the lower clock speed and power supply, there was a 7% lower fps measurement after one hour.
In addition, there were small dips. Since the fans cannot simply be turned up in "Quiet", the clock speed had to be reduced for a short time once more. Nevertheless, this value remained at a high level and only sat below 60fps once. The Medion Erazer Scout E20, with the same graphics card, only achieved comparable fps values in performance mode.
Witcher 3 FPS diagram
| low | med. | high | ultra | |
|---|---|---|---|---|
| GTA V (2015) | 162.4 | 88.8 | ||
| The Witcher 3 (2015) | 164 | 88 | ||
| Dota 2 Reborn (2015) | 129 | 123.1 | ||
| Final Fantasy XV Benchmark (2018) | 83.6 | |||
| X-Plane 11.11 (2018) | 79.7 | |||
| Far Cry 5 (2018) | 123 | 116 | ||
| Strange Brigade (2018) | 174.8 | 152 | ||
| Cyberpunk 2077 1.6 (2022) | 91.3 | 79.4 | ||
| F1 22 (2022) | 149 | 55 | ||
| Hogwarts Legacy (2023) | 67 | 53 | ||
| Sons of the Forest (2023) | 75 | 73 | ||
| Star Wars Jedi Survivor (2023) | 56 | 53 |
Emissions - The quiet, warm, Nitro 5
Noise emissions
Even when the system is under light load, the fans turn on. This results in background noise that neither disturbs gaming sessions nor your own thoughts.
Conversely, the gaming laptop gets really loud using the "Performance" setting. It's possible to tell when someone is gaming, even from behind a closed door. That changes considerably in "Quiet". Wie measured only a third of the original noise level.
The sounds produced sit above the noise levels found, for example, in a business laptop with its fans. However, you never feel the need to grab a pair of headphones. Some desktop PCs and most gaming laptops will be much louder.

Noise level
| Idle |
| 25.7 / 31.5 / 31.2 dB(A) |
| Load |
| 62.9 / 67.5 dB(A) |
 | ||
30 dB silent 40 dB(A) audible 50 dB(A) loud |
||
min: | ||
| Acer Nitro 5 AN517-55-5552 GeForce RTX 4050 Laptop GPU, i5-12500H, WDC PC SN810 512GB | Asus TUF Gaming A16 FA617XS Radeon RX 7600S, R9 7940HS, Micron 2400 MTFDKBA512QFM | Acer Nitro 5 AN517-55-738R GeForce RTX 3060 Laptop GPU, i7-12700H, Samsung PM9A1 MZVL2512HCJQ | Medion Erazer Scout E20 GeForce RTX 4050 Laptop GPU, i7-13700H, Phison PS5021-E21 1TB | MSI Katana 15 B12VEK GeForce RTX 4050 Laptop GPU, i7-12650H, Micron 2400 MTFDKBA1T0QFM | MSI Cyborg 15 A12VF GeForce RTX 4060 Laptop GPU, i7-12650H, Samsung PM9B1 1024GB MZVL41T0HBLB | |
|---|---|---|---|---|---|---|
| Noise | 14% | 8% | 6% | 20% | -4% | |
| off / environment * (dB) | 25.7 | 25 3% | 25.5 1% | 25 3% | 24 7% | 27 -5% |
| Idle Minimum * (dB) | 25.7 | 25 3% | 25.5 1% | 26 -1% | 24 7% | 27 -5% |
| Idle Average * (dB) | 31.5 | 26 17% | 25.5 19% | 27 14% | 24 24% | 37.5 -19% |
| Idle Maximum * (dB) | 31.2 | 28 10% | 27 13% | 32 -3% | 24 23% | 38 -22% |
| Load Average * (dB) | 62.9 | 43 32% | 52.6 16% | 57 9% | 37.71 40% | 56.3 10% |
| Load Maximum * (dB) | 67.5 | 53 21% | 68.2 -1% | 57 16% | 54.55 19% | 56.3 17% |
| Witcher 3 ultra * (dB) | 51 | 50 | 45.75 |
* ... smaller is better
Temperature
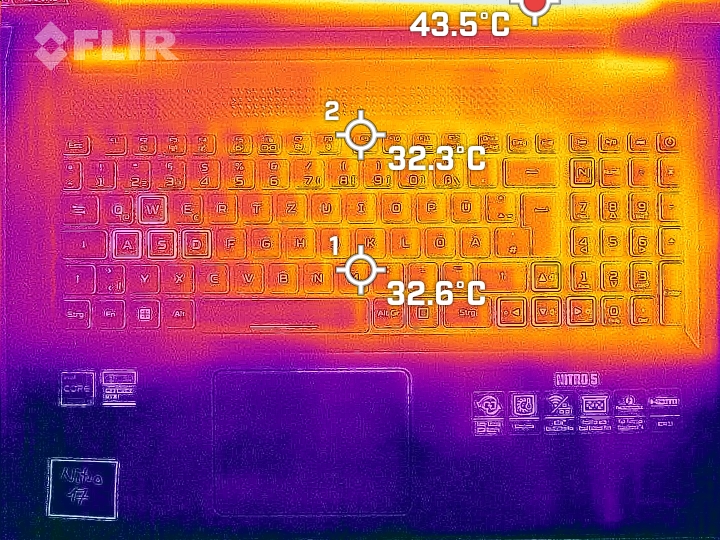
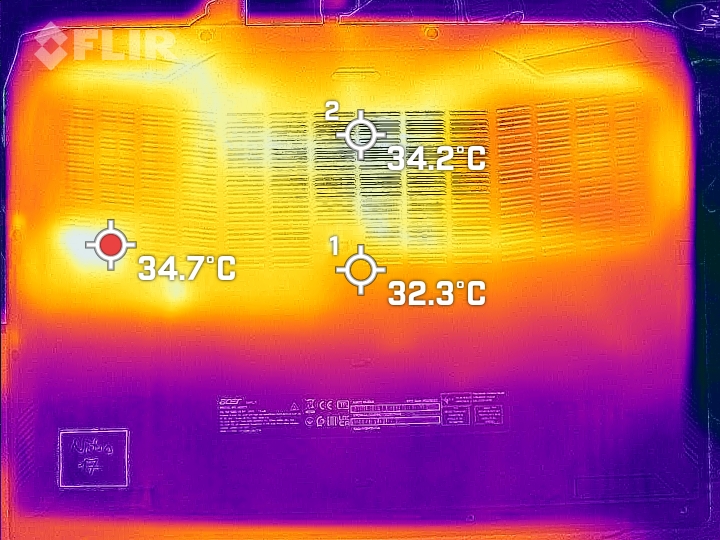
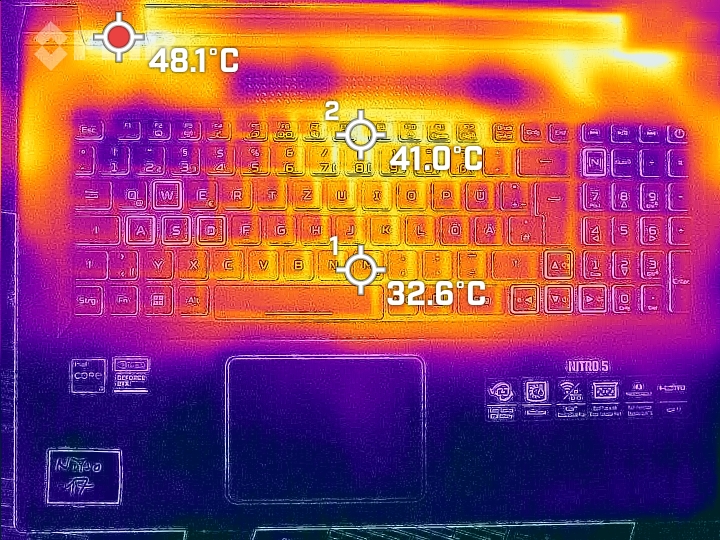
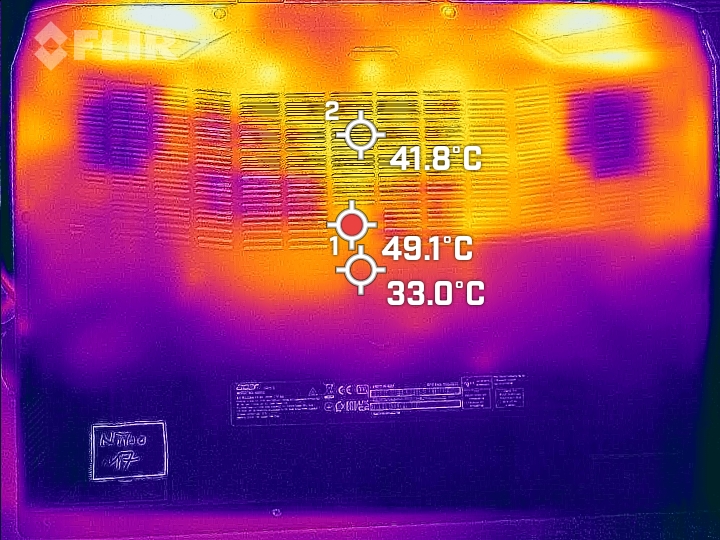
As you can already guess from the image seen in the "Maintenance" section, the hand rest remains cool, even running under the rather theoretical scenario of maximum load. We only measured a little over 30 °C in the middle. By contrast, in Witcher 3 no significant temperature increases took place.
This means at least the keyboard area stays below 40 °C. Something which is not ideal but still manageable nonetheless. In the rear area, where the fans are located, the temperature rises but remains below 50 °C, something the predecessor was unable to achieve.
In the other performance modes, heat dissipation remains comparable. This means you can expect a warm keyboard.
(±) The maximum temperature on the upper side is 42.4 °C / 108 F, compared to the average of 40.4 °C / 105 F, ranging from 21.2 to 68.8 °C for the class Gaming.
(-) The bottom heats up to a maximum of 48.2 °C / 119 F, compared to the average of 43.2 °C / 110 F
(+) In idle usage, the average temperature for the upper side is 29.2 °C / 85 F, compared to the device average of 33.9 °C / 93 F.
(±) Playing The Witcher 3, the average temperature for the upper side is 32.2 °C / 90 F, compared to the device average of 33.9 °C / 93 F.
(+) The palmrests and touchpad are cooler than skin temperature with a maximum of 27.4 °C / 81.3 F and are therefore cool to the touch.
(±) The average temperature of the palmrest area of similar devices was 28.8 °C / 83.8 F (+1.4 °C / 2.5 F).
| Acer Nitro 5 AN517-55-5552 Intel Core i5-12500H, NVIDIA GeForce RTX 4050 Laptop GPU | Asus TUF Gaming A16 FA617XS AMD Ryzen 9 7940HS, AMD Radeon RX 7600S | Acer Nitro 5 AN517-55-738R Intel Core i7-12700H, NVIDIA GeForce RTX 3060 Laptop GPU | Medion Erazer Scout E20 Intel Core i7-13700H, NVIDIA GeForce RTX 4050 Laptop GPU | MSI Katana 15 B12VEK Intel Core i7-12650H, NVIDIA GeForce RTX 4050 Laptop GPU | MSI Cyborg 15 A12VF Intel Core i7-12650H, NVIDIA GeForce RTX 4060 Laptop GPU | |
|---|---|---|---|---|---|---|
| Heat | -3% | -10% | 9% | -9% | 9% | |
| Maximum Upper Side * (°C) | 42.4 | 53 -25% | 48.3 -14% | 41 3% | 47 -11% | 47.5 -12% |
| Maximum Bottom * (°C) | 48.2 | 48 -0% | 52 -8% | 39 19% | 48 -0% | 35.5 26% |
| Idle Upper Side * (°C) | 31.6 | 30 5% | 34.5 -9% | 31 2% | 35 -11% | 27.7 12% |
| Idle Bottom * (°C) | 33.1 | 30 9% | 35.8 -8% | 29 12% | 38 -15% | 29.5 11% |
* ... smaller is better
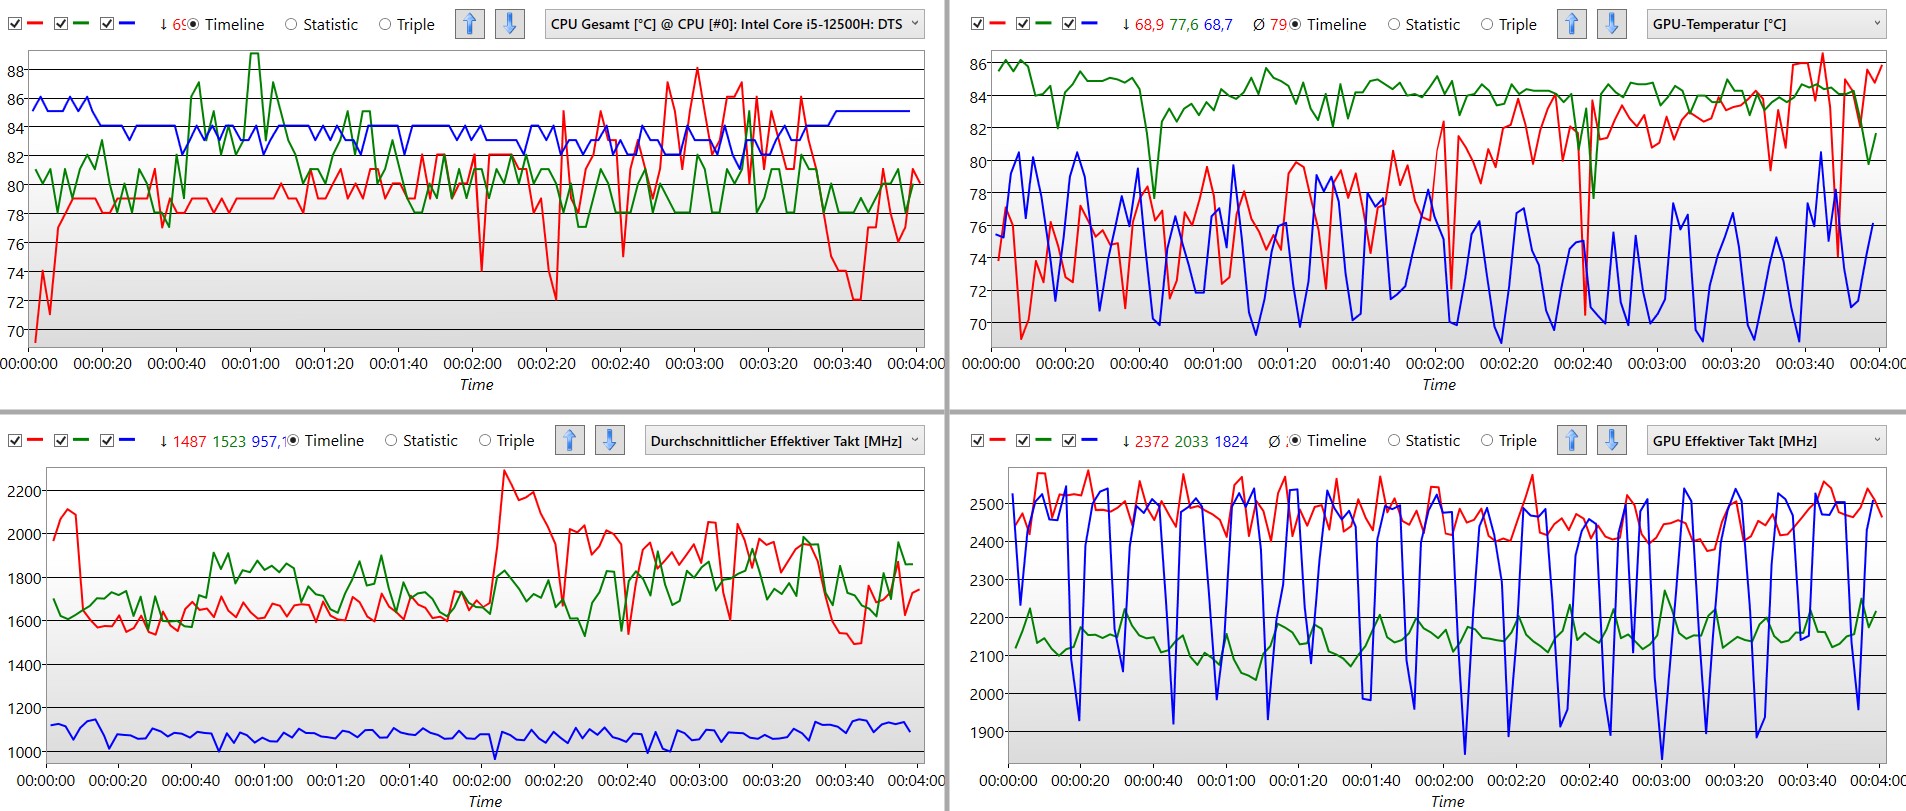
Stress test
Even under maximum load, the processor does not reach the maximum possible power consumption of 115 watts. For a few moments, we measured almost 100 watts while the temperature rose to 100 °C which, in turn, reduced the power consumption.
By contrast, the CPU can briefly consume 140 watts and manages to stay permanently well below 90 °C at more than 100 watts. That's exactly how to make a gaming laptop.
The comparison of the performance modes is interesting, especially when set to "Quiet" (blue line): The processor's performance is clearly restricted while the graphics chip still manages to reach the level that is normally only permitted when using the "Performance" mode. Even though it looks erratic in our diagram, the GPU clock rate only fluctuates between 1,800 and over 2,500 MHz. At the same time, the temperature stays significantly above 80 °C.
The "Quiet" mode allows for high graphics performance without excessive heat production since the processor's power is very constrained.
Speakers
The small stereo speakers meet the minimum requirements. In particular, voice playback is well done. From the spoken word to sophisticated vocals, it sounds good.
Bass is largely absent and also the mids are weakly defined. The Nitro 5's speakers are not really suitable for music but are quite sufficient for video streaming or games.
Acer Nitro 5 AN517-55-5552 audio analysis
(±) | speaker loudness is average but good (80.4 dB)
Bass 100 - 315 Hz
(-) | nearly no bass - on average 23.4% lower than median
(±) | linearity of bass is average (14.9% delta to prev. frequency)
Mids 400 - 2000 Hz
(+) | balanced mids - only 2.2% away from median
(+) | mids are linear (5.8% delta to prev. frequency)
Highs 2 - 16 kHz
(+) | balanced highs - only 4.6% away from median
(+) | highs are linear (4.8% delta to prev. frequency)
Overall 100 - 16.000 Hz
(±) | linearity of overall sound is average (17.1% difference to median)
Compared to same class
» 46% of all tested devices in this class were better, 12% similar, 43% worse
» The best had a delta of 6%, average was 18%, worst was 132%
Compared to all devices tested
» 31% of all tested devices were better, 8% similar, 61% worse
» The best had a delta of 4%, average was 24%, worst was 134%
Apple MacBook Pro 16 2021 M1 Pro audio analysis
(+) | speakers can play relatively loud (84.7 dB)
Bass 100 - 315 Hz
(+) | good bass - only 3.8% away from median
(+) | bass is linear (5.2% delta to prev. frequency)
Mids 400 - 2000 Hz
(+) | balanced mids - only 1.3% away from median
(+) | mids are linear (2.1% delta to prev. frequency)
Highs 2 - 16 kHz
(+) | balanced highs - only 1.9% away from median
(+) | highs are linear (2.7% delta to prev. frequency)
Overall 100 - 16.000 Hz
(+) | overall sound is linear (4.6% difference to median)
Compared to same class
» 0% of all tested devices in this class were better, 0% similar, 100% worse
» The best had a delta of 5%, average was 17%, worst was 45%
Compared to all devices tested
» 0% of all tested devices were better, 0% similar, 100% worse
» The best had a delta of 4%, average was 24%, worst was 134%
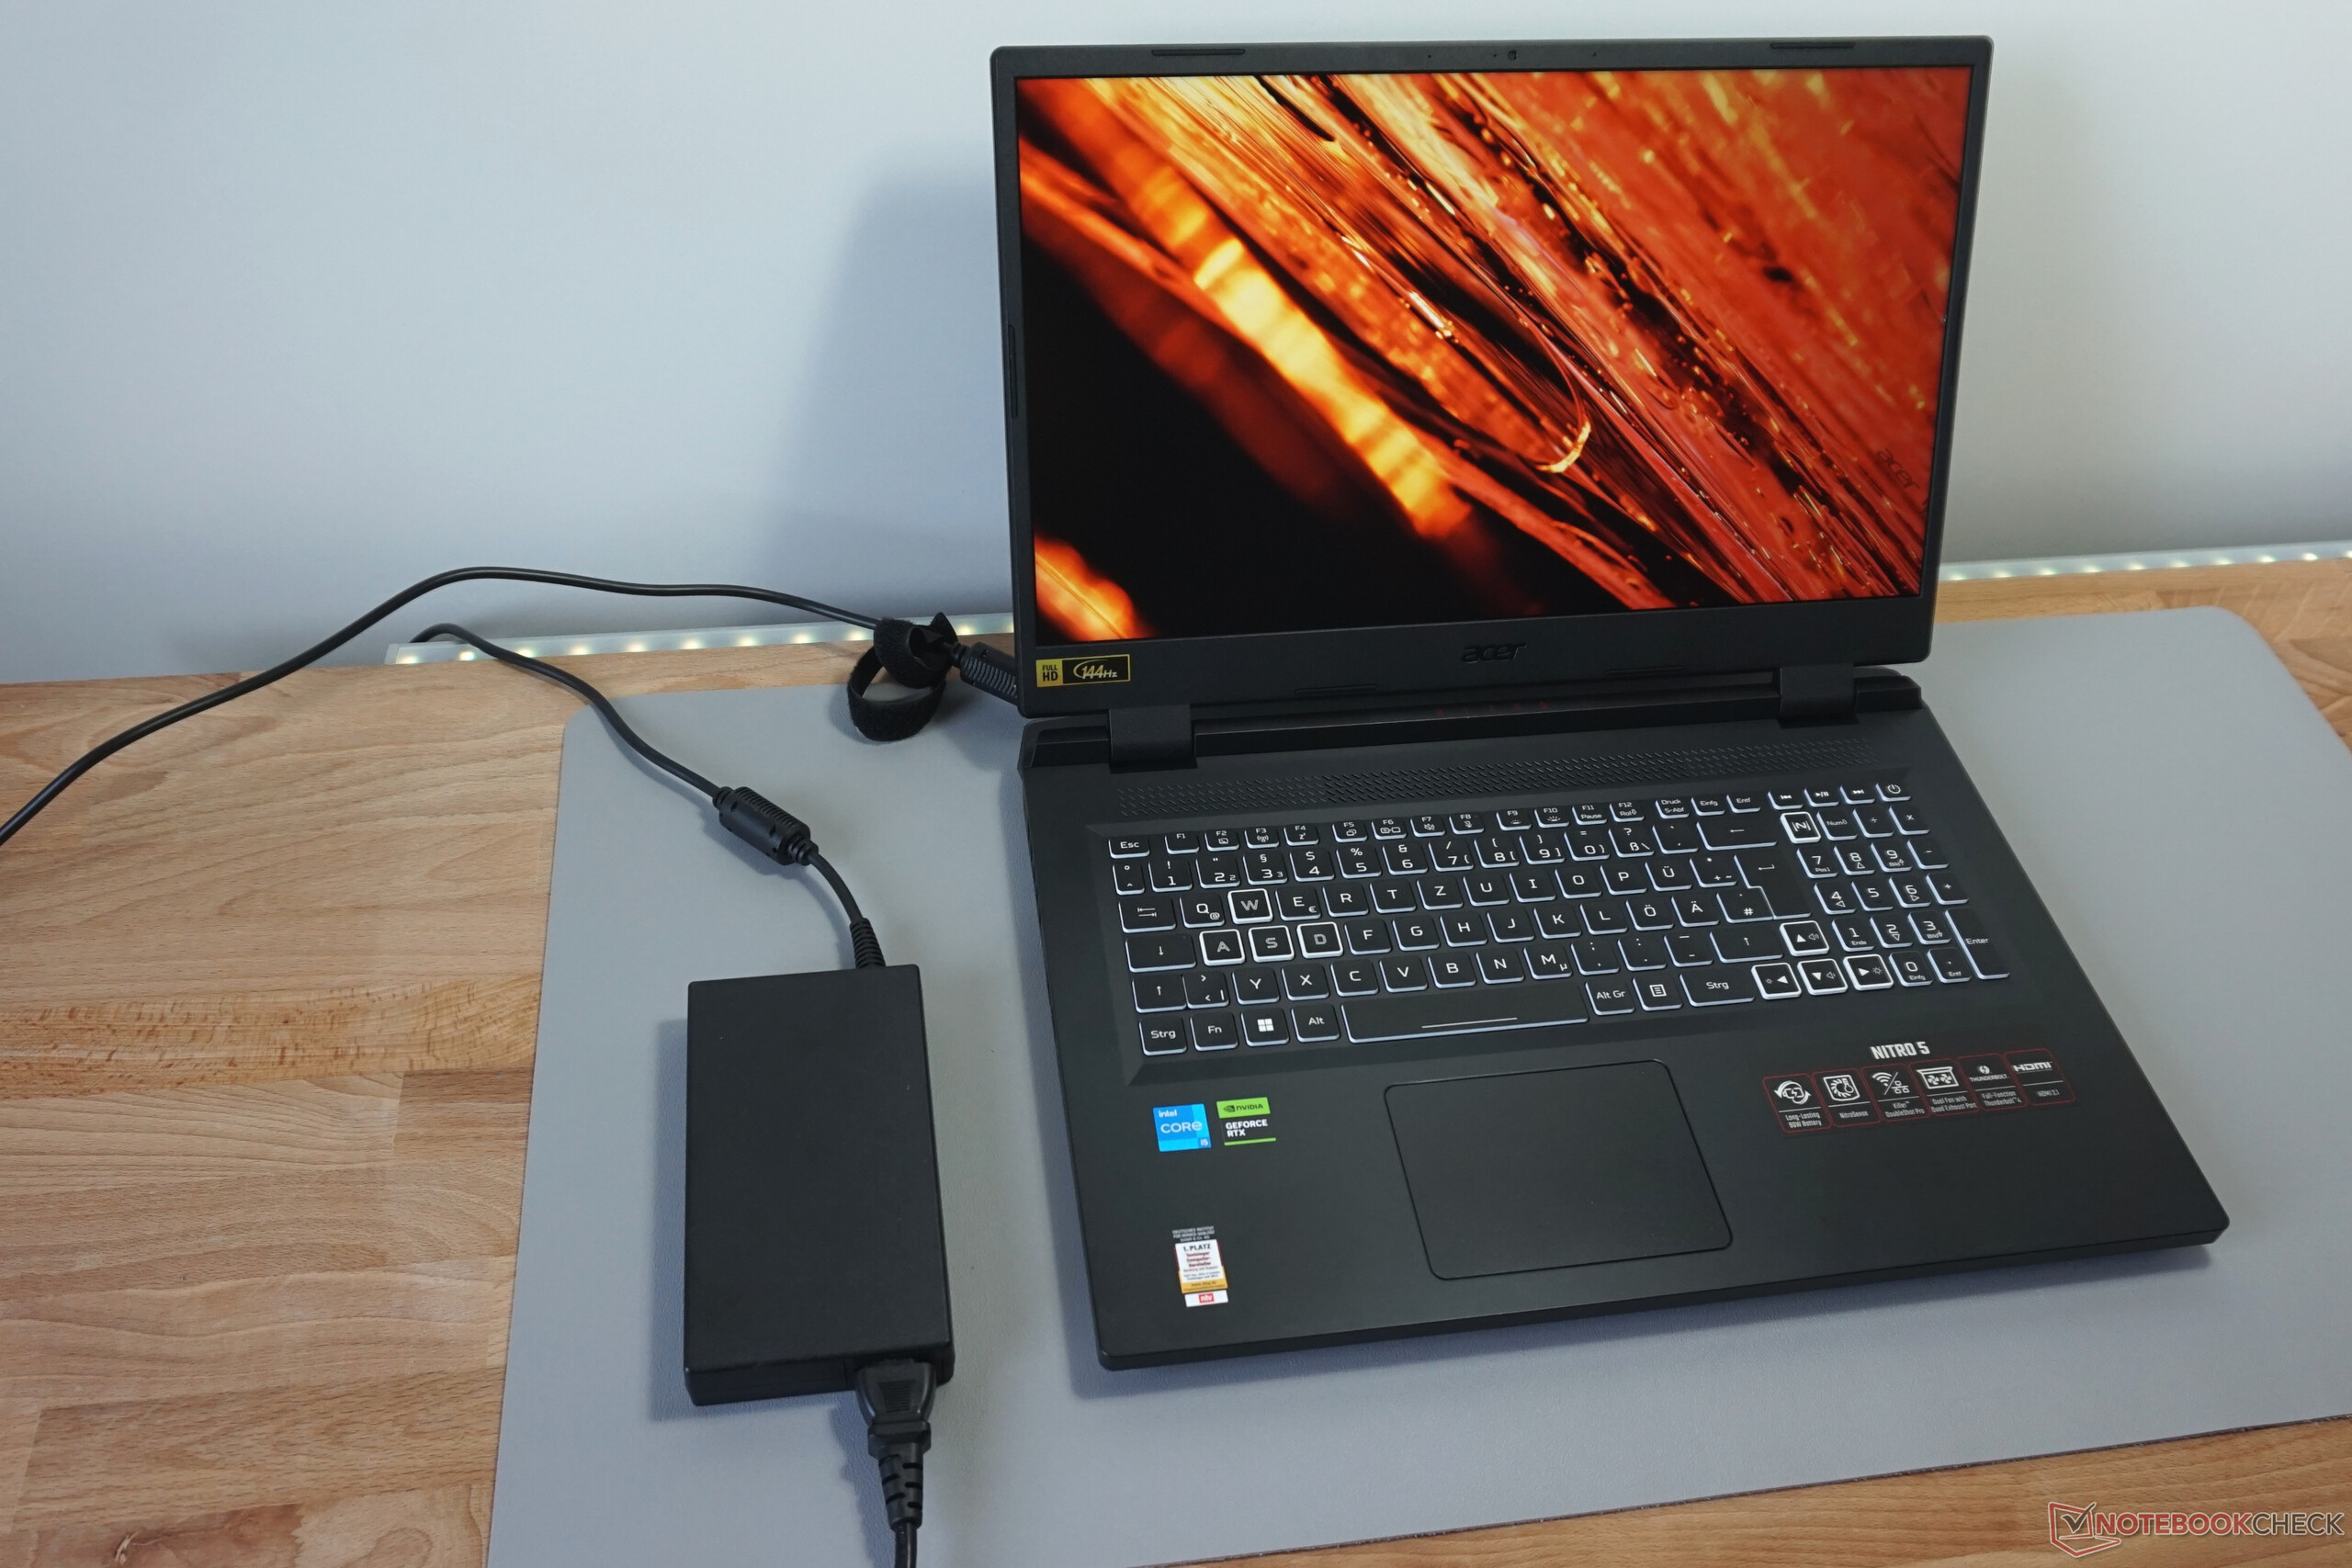
Energy management
Power consumption
The fact the processor is not up to date is noticeable in terms of consumption. At just over 7 watts, the minimum power consumption is good but could be somewhat lower, like the Medion Erazer Scout with its i7-13700H. Even with typical use, 150 watts is a rather poor value. The average of the RTX 4050 laptops sits below 100 watts. However, in quiet mode, the total power consumption is also around 100 watts.
The maximum power consumption of 244 watts was only recorded in one single peak measurement. The 230-watt PSU should, therefore, be sufficient and have enough reserves in order to charge the battery.
| Off / Standby | |
| Idle | |
| Load |
|
Key:
min: | |
| Acer Nitro 5 AN517-55-5552 i5-12500H, GeForce RTX 4050 Laptop GPU, WDC PC SN810 512GB, IPS, 1920x1080, 17.3" | Asus TUF Gaming A16 FA617XS R9 7940HS, Radeon RX 7600S, Micron 2400 MTFDKBA512QFM, IPS, 1920x1200, 16" | Acer Nitro 5 AN517-55-738R i7-12700H, GeForce RTX 3060 Laptop GPU, Samsung PM9A1 MZVL2512HCJQ, IPS, 1920x1080, 17.3" | Medion Erazer Scout E20 i7-13700H, GeForce RTX 4050 Laptop GPU, Phison PS5021-E21 1TB, IPS, 1920x1080, 17.3" | MSI Katana 15 B12VEK i7-12650H, GeForce RTX 4050 Laptop GPU, Micron 2400 MTFDKBA1T0QFM, IPS, 1920x1080, 15.6" | MSI Cyborg 15 A12VF i7-12650H, GeForce RTX 4060 Laptop GPU, Samsung PM9B1 1024GB MZVL41T0HBLB, IPS, 1920x1080, 15.6" | Average NVIDIA GeForce RTX 4050 Laptop GPU | Average of class Gaming | |
|---|---|---|---|---|---|---|---|---|
| Power Consumption | 13% | -14% | 7% | 17% | 33% | -6% | -35% | |
| Idle Minimum * (Watt) | 7.6 | 7 8% | 9.7 -28% | 5 34% | 8.5 -12% | 6 21% | 9.95 ? -31% | 13.2 ? -74% |
| Idle Average * (Watt) | 11.3 | 10 12% | 14.6 -29% | 11 3% | 10.2 10% | 8.8 22% | 15.8 ? -40% | 18.9 ? -67% |
| Idle Maximum * (Watt) | 15.4 | 15 3% | 16.7 -8% | 22 -43% | 11.3 27% | 11.9 23% | 20.1 ? -31% | 24.3 ? -58% |
| Load Average * (Watt) | 151 | 86 43% | 166 -10% | 96 36% | 84 44% | 89 41% | 88 ? 42% | 108 ? 28% |
| Witcher 3 ultra * (Watt) | 137.8 | 160.6 -17% | 145.2 -5% | 128 7% | 90.3 34% | |||
| Load Maximum * (Watt) | 244 | 172 30% | 235 4% | 201 18% | 189 23% | 99 59% | 176.3 ? 28% | 254 ? -4% |
* ... smaller is better
Power consumption Witcher 3 / stress test
Power consumption with an external monitor
Battery life
The Acer Nitro 5's battery life is very practical: Even at maximum screen brightness, the laptop managed considerably more than 8 hours in our Wi-Fi test while switching websites. With limited brightness, you can expect an extra hour. However, at 90 Wh, the battery capacity is also very high.
The Asus TUF Gaming 16 - which can get 12 hours and more from the same-sized battery - shows that a gaming laptop can run much more efficiently.
| Acer Nitro 5 AN517-55-5552 i5-12500H, GeForce RTX 4050 Laptop GPU, 90 Wh | Asus TUF Gaming A16 FA617XS R9 7940HS, Radeon RX 7600S, 90 Wh | Acer Nitro 5 AN517-55-738R i7-12700H, GeForce RTX 3060 Laptop GPU, 90.61 Wh | Medion Erazer Scout E20 i7-13700H, GeForce RTX 4050 Laptop GPU, 53.35 Wh | MSI Katana 15 B12VEK i7-12650H, GeForce RTX 4050 Laptop GPU, 53.5 Wh | MSI Cyborg 15 A12VF i7-12650H, GeForce RTX 4060 Laptop GPU, 53.5 Wh | Average of class Gaming | |
|---|---|---|---|---|---|---|---|
| Battery runtime | 50% | -30% | -44% | -48% | -6% | -7% | |
| H.264 (h) | 7.4 | 12.4 68% | 5.3 -28% | 4.6 -38% | 4.4 -41% | 8 8% | 8.26 ? 12% |
| WiFi v1.3 (h) | 9.4 | 12.4 32% | 6.5 -31% | 4.7 -50% | 4.3 -54% | 7.5 -20% | 7.02 ? -25% |
Pros
Cons
Verdict - The Nitro 5's efficient GPU is well implemented
With the straightforward i5-12500H and the entry-level RTX 4050 graphics card, the Acer Nitro 5 delivers not bad, but at best, average performance. Then "Quiet" mode is switched on:
With audible, but never annoying fan noises, the gaming performances dips minimally, especially in games, where we only determined a difference of a few percentage points. The Nitro plays current games smoothly in Full HD resolution, at high detail settings and never exceeds the noise levels found in its peers.
Quiet fans and Full HD gaming are not mutually exclusive in the Acer Nitro 5.
This is possible due to Nvidia's efficient graphics chip which doesn't benefit from higher power consumption. However, this is also possible thanks to the very big case and a similarly large cooling system which possesses clever settings. On top of that, there is an RGB keyboard, Thunderbolt 4 and two, 10 Gbit/s USB ports.
What is really disappointing is the display: While resolution and size fit perfectly to the Acer laptop's size, color reproduction, contrast and peak brightness are clearly below-average, even for entry-level standards which come into their own in terms of price.
If it's only about gaming performance, there are faster laptops. For example, the Medion Erazer Scout E20 is also equipped with an RTX 4050 and also has a significantly better display. However, it is not as quiet as the Nitro and is minimally more expensive.
Price and availability
The Acer Nitro 5 (RTX 4050, 16 GB of DDR5 RAM) is available on Amazon for around $1225.
Acer Nitro 5 AN517-55-5552
- 06/13/2023 v7 (old)
Mario Petzold
Transparency
The selection of devices to be reviewed is made by our editorial team. The test sample was provided to the author as a loan by the manufacturer or retailer for the purpose of this review. The lender had no influence on this review, nor did the manufacturer receive a copy of this review before publication. There was no obligation to publish this review. As an independent media company, Notebookcheck is not subjected to the authority of manufacturers, retailers or publishers.
This is how Notebookcheck is testing
Every year, Notebookcheck independently reviews hundreds of laptops and smartphones using standardized procedures to ensure that all results are comparable. We have continuously developed our test methods for around 20 years and set industry standards in the process. In our test labs, high-quality measuring equipment is utilized by experienced technicians and editors. These tests involve a multi-stage validation process. Our complex rating system is based on hundreds of well-founded measurements and benchmarks, which maintains objectivity. Further information on our test methods can be found here.
Price comparison

