MSI Cyborg 15 A12VF review: Gaming laptop with low-power RTX 4060
The mobile gaming laptop from MSI doesn't want - and also isn't able - to establish any new performance records. The Core i7-12650H and GeForce RTX 4060 are run with conservative power limits and a low TGP (45 Watt), resulting in a fairly low power consumption. A 120-Watt power supply is all that is needed for the laptop. The competitors include laptops such as the Asus TUF Gaming A16 FA617, the Aorus 15 XE5, the MSI Katana 15 B12VEK, the HP Victus 15, and the Schenker XMG Fusion 15.
Possible Competitors in Comparison
Rating | Date | Model | Weight | Height | Size | Resolution | Price |
|---|---|---|---|---|---|---|---|
| 82.4 % v7 (old) | 04 / 2023 | MSI Cyborg 15 A12VF i7-12650H, GeForce RTX 4060 Laptop GPU | 2 kg | 22.9 mm | 15.60" | 1920x1080 | |
| 86.2 % v7 (old) | 02 / 2023 | Asus TUF Gaming A16 FA617 R7 7735HS, Radeon RX 7600S | 2.2 kg | 27 mm | 16.00" | 1920x1200 | |
| 85.5 % v7 (old) | 12 / 2022 | Aorus 15 XE5 i7-12700H, GeForce RTX 3070 Ti Laptop GPU | 2.3 kg | 24 mm | 15.60" | 2560x1440 | |
| 87.4 % v7 (old) | 08 / 2022 | Schenker XMG Fusion 15 (Mid 22) i7-11800H, GeForce RTX 3070 Laptop GPU | 1.9 kg | 21.65 mm | 15.60" | 2560x1440 | |
| 82.9 % v7 (old) | 03 / 2023 | MSI Katana 15 B12VEK i7-12650H, GeForce RTX 4050 Laptop GPU | 2.3 kg | 24.9 mm | 15.60" | 1920x1080 | |
| 81 % v7 (old) | 12 / 2022 | HP Victus 15 fa0020nr i7-12700H, GeForce RTX 3050 Ti Laptop GPU | 2.3 kg | 23.6 mm | 15.60" | 1920x1080 |
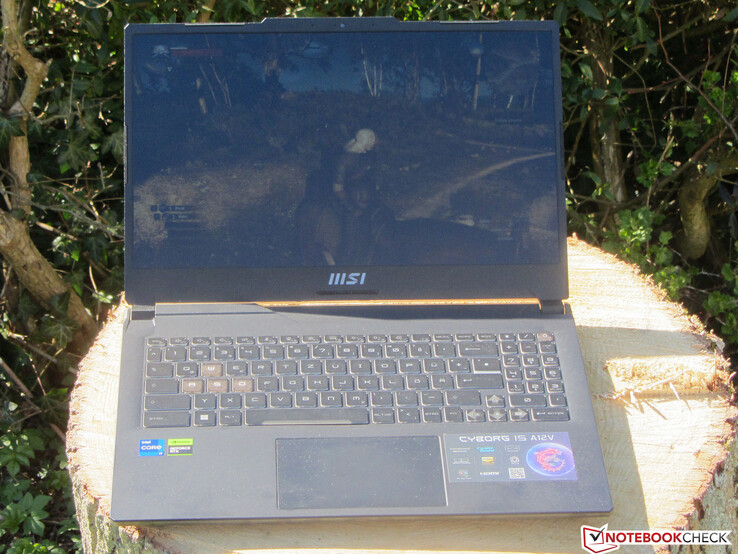
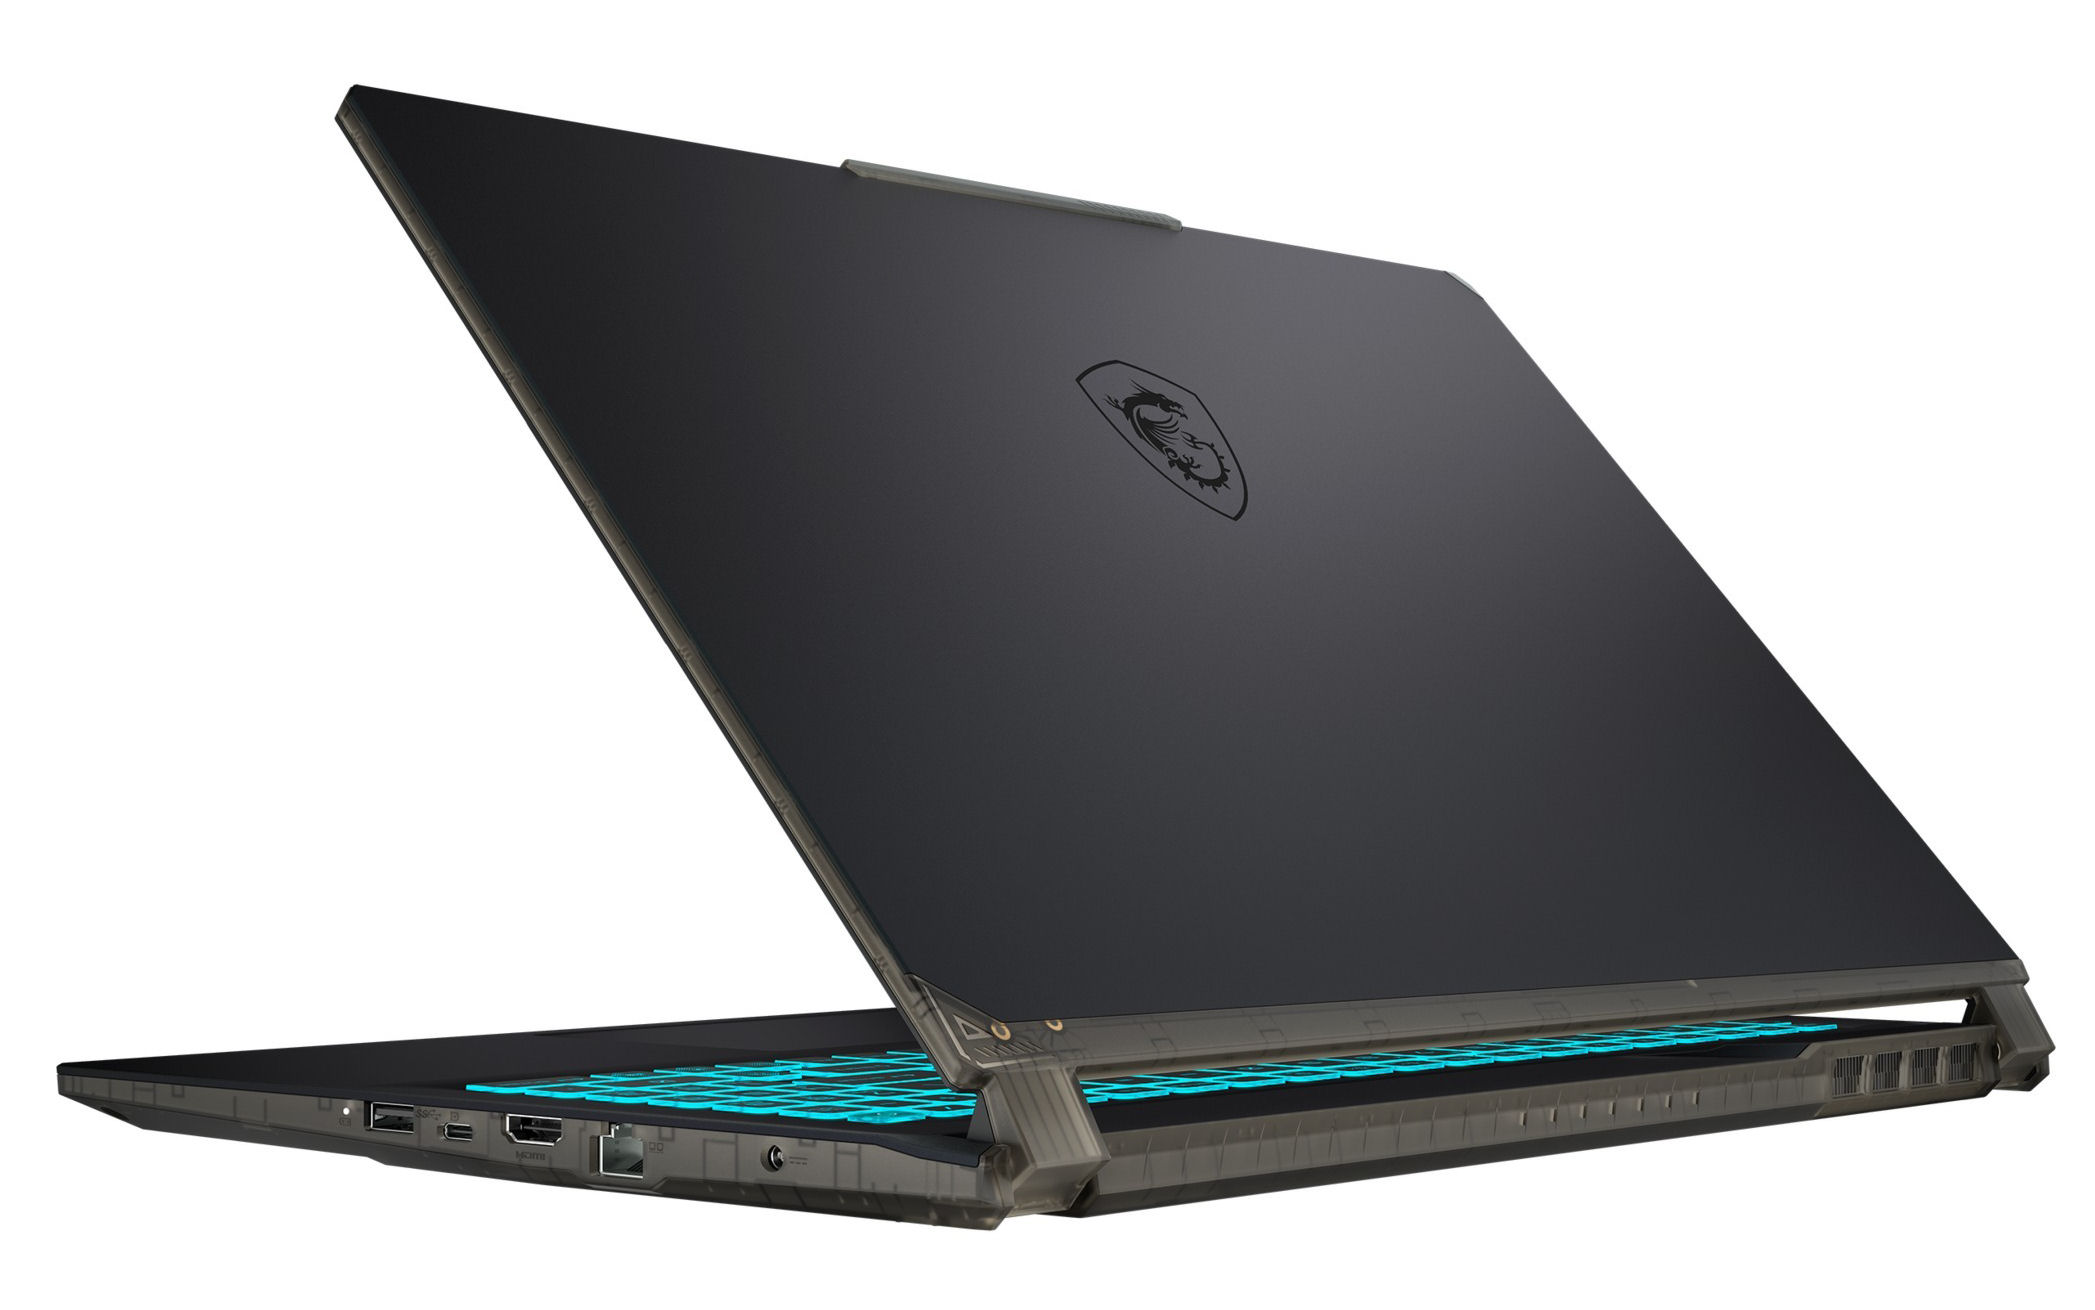
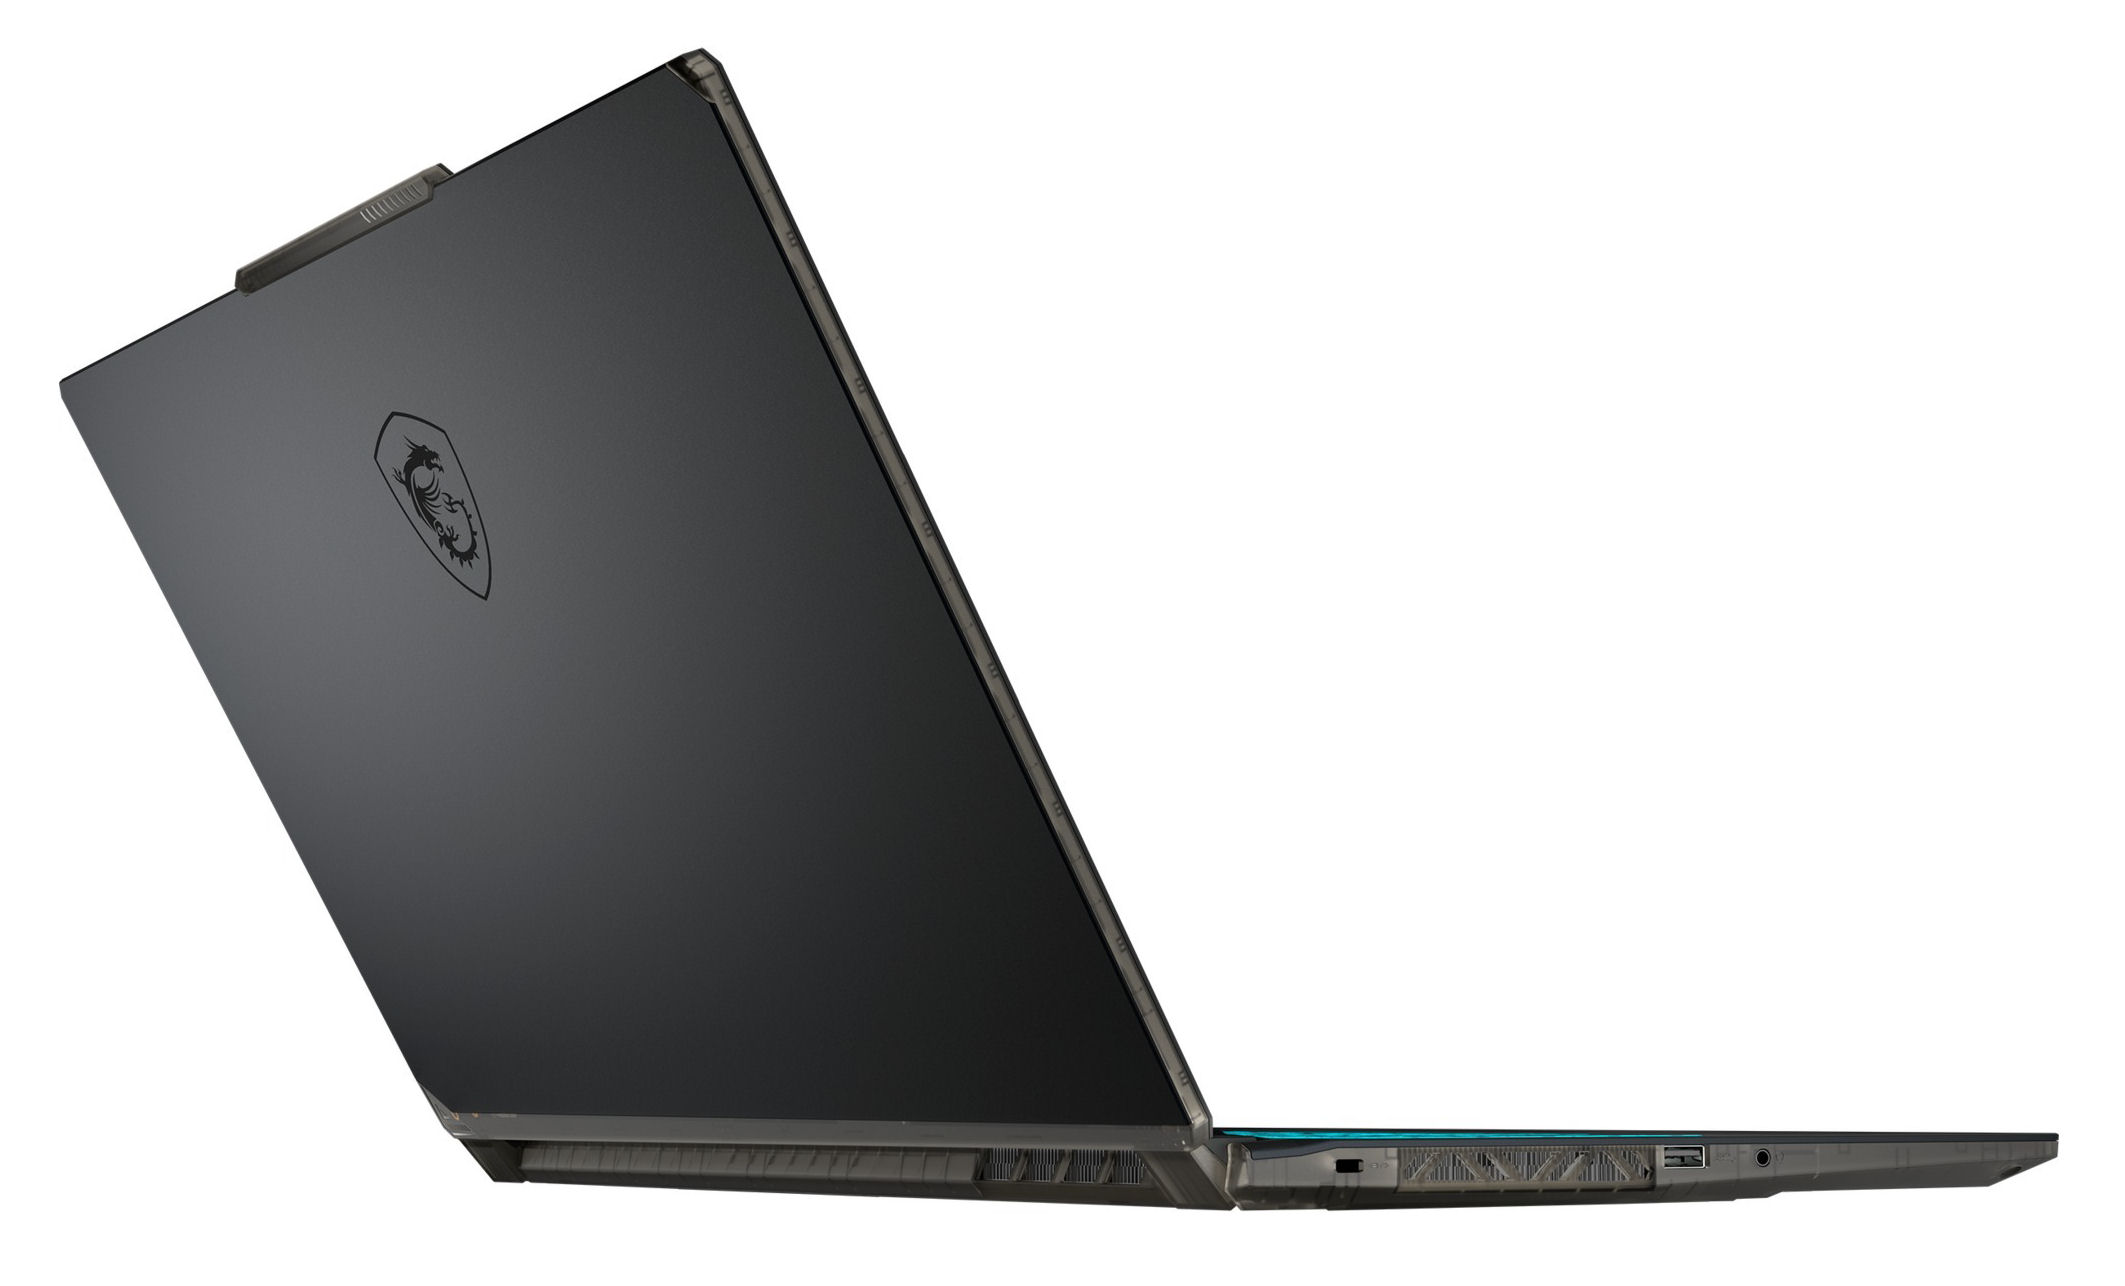
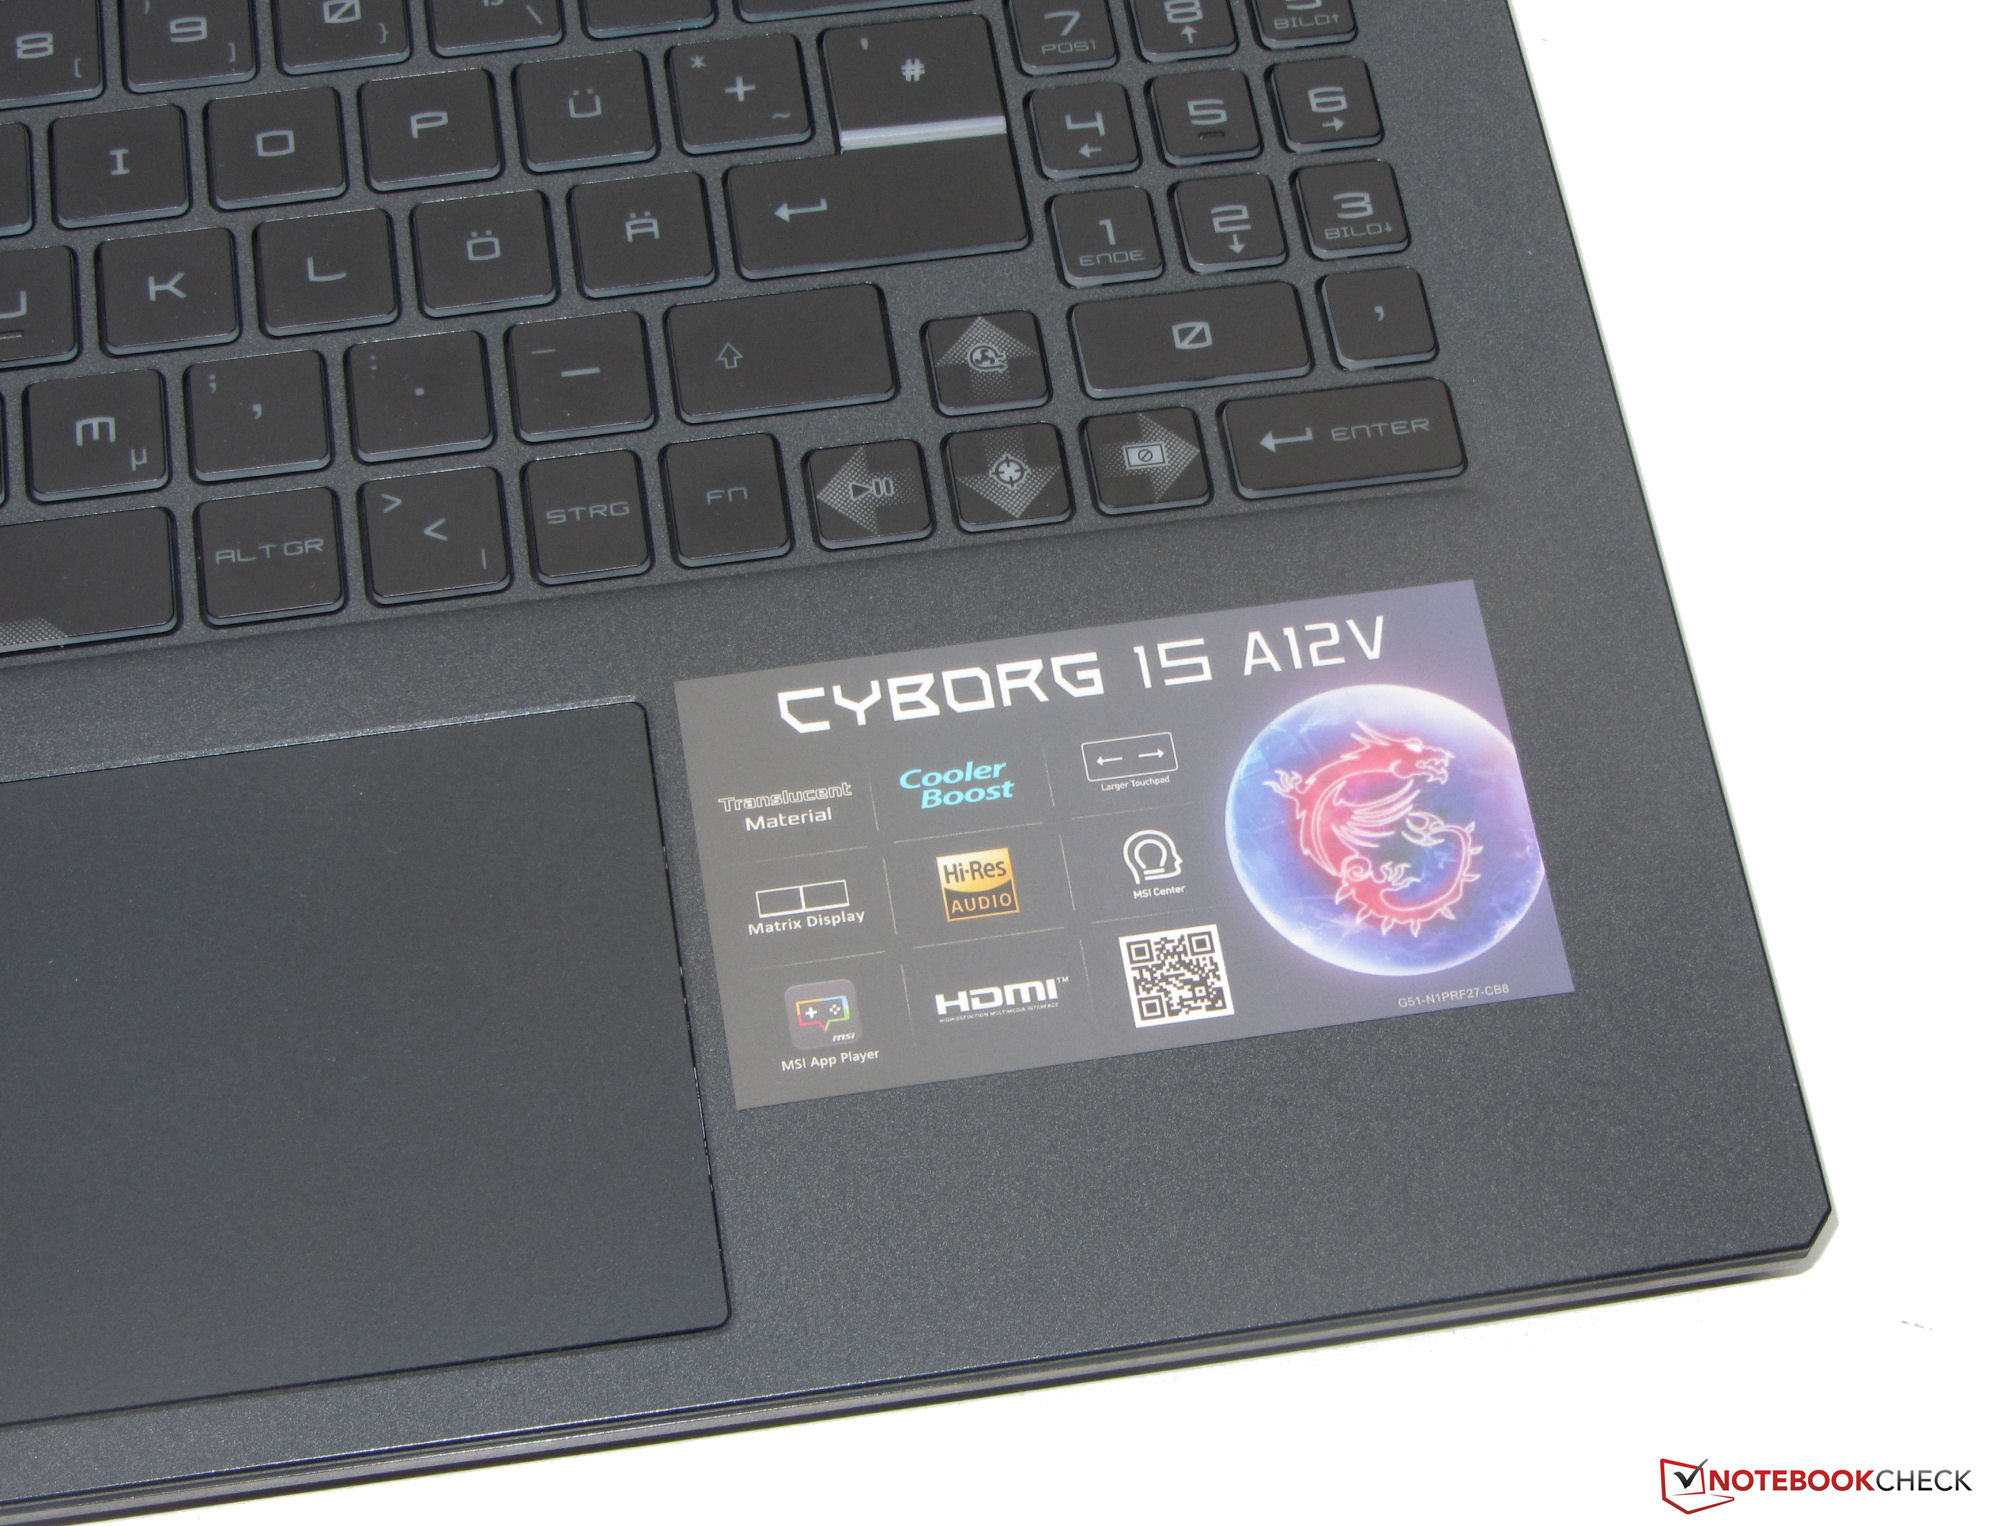
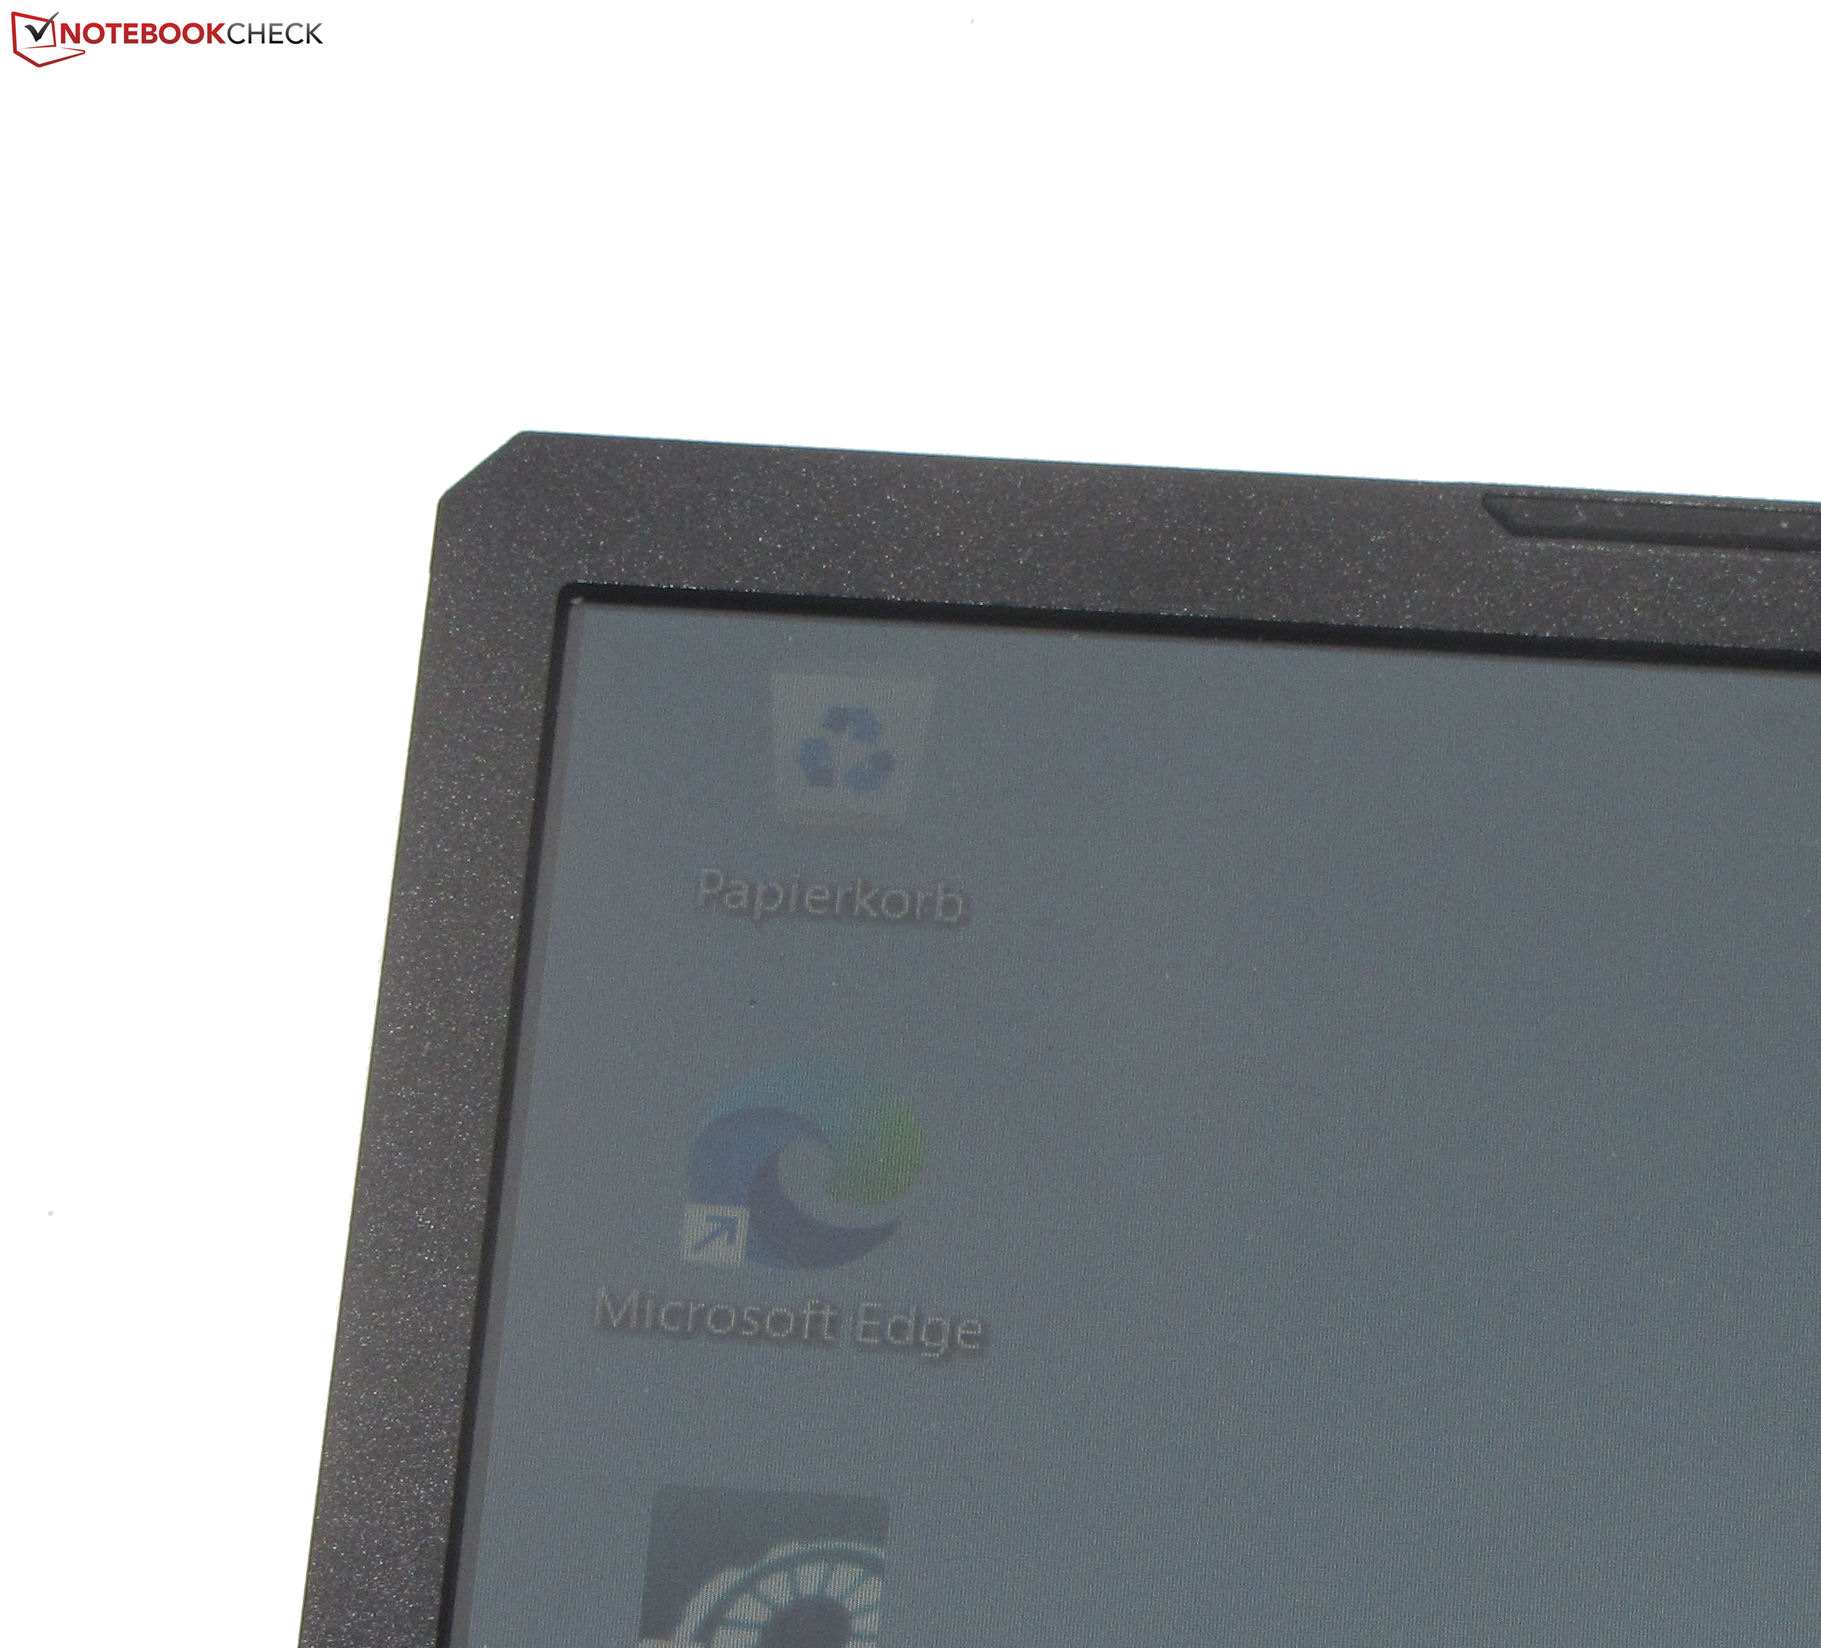
Case - A12VF with 180-degree opening angle
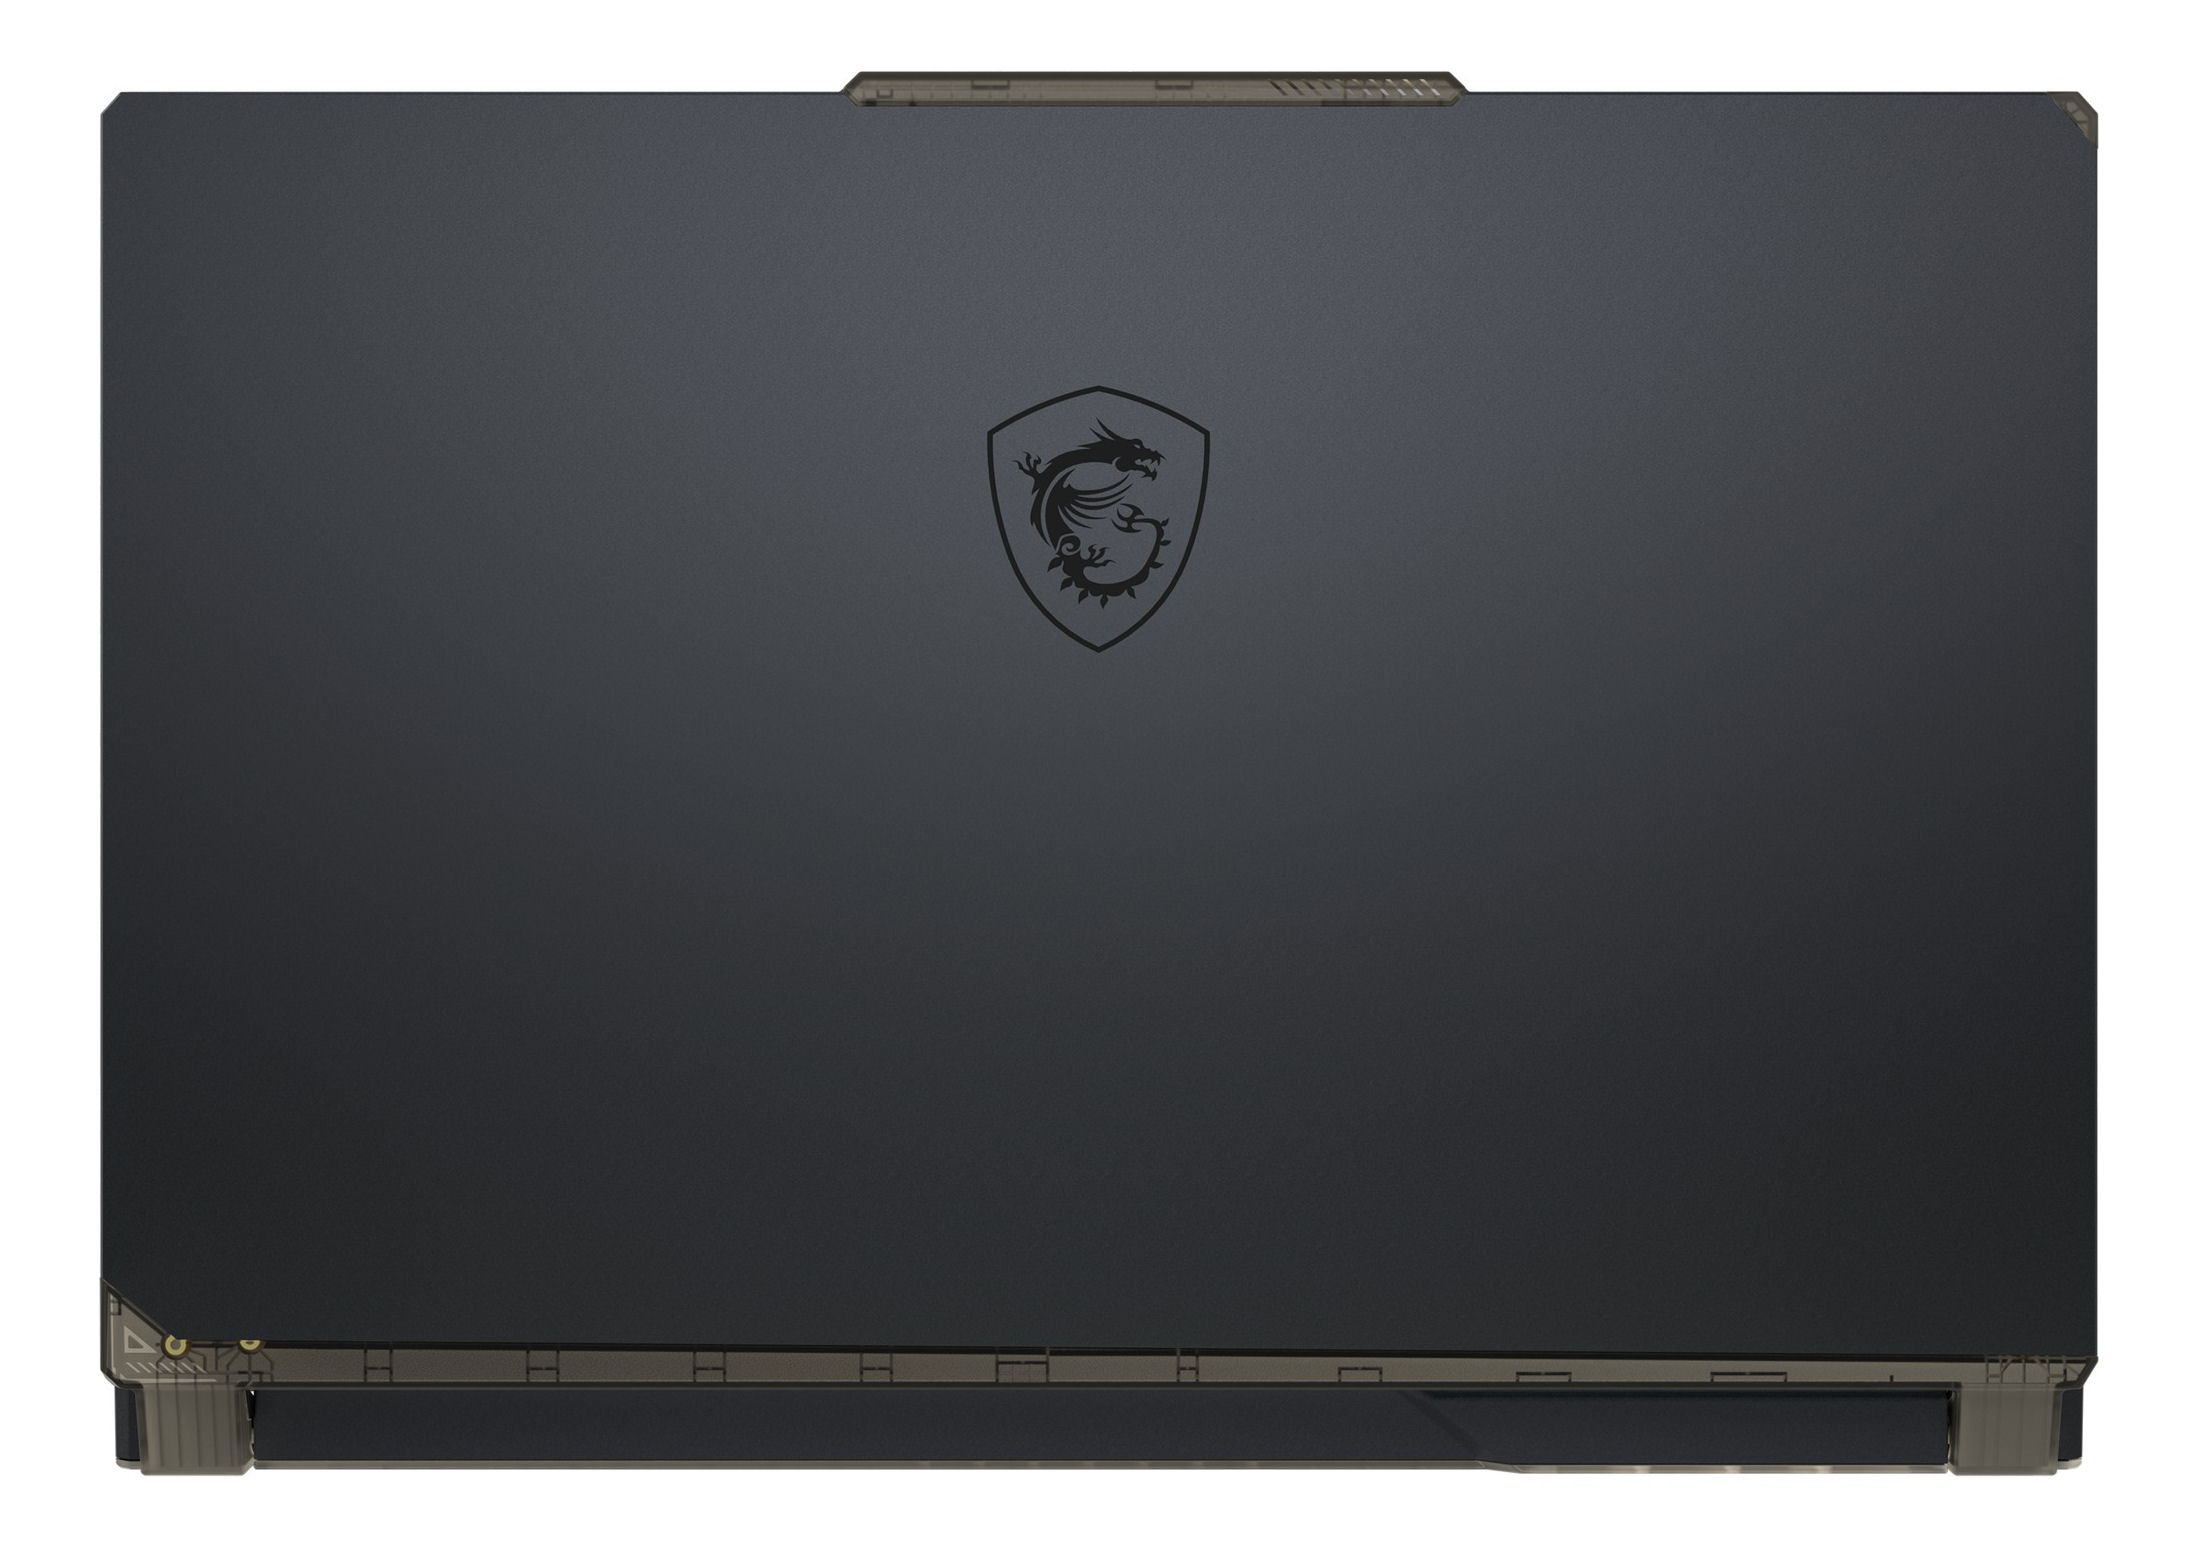
Most parts of the compact case are made of plastic, with metal only being used for the back of the case lid. MSI uses a mainly discrete design, and the laptop wouldn't look out of place in professional office surroundings. The black base color is loosened up by some transparent case elements such as the case bottom, with the keyboard illumination in turquoise blue also adding some color.
The laptop doesn't reveal any faults in the workmanship. The gaps are even, and we don't notice any material protrusions. While the base unit and lid can be warped, this remains within limits. The hinges hold the lid tightly in place, with a maximum opening angle of 180 degrees. The laptop can be opened using a single hand.
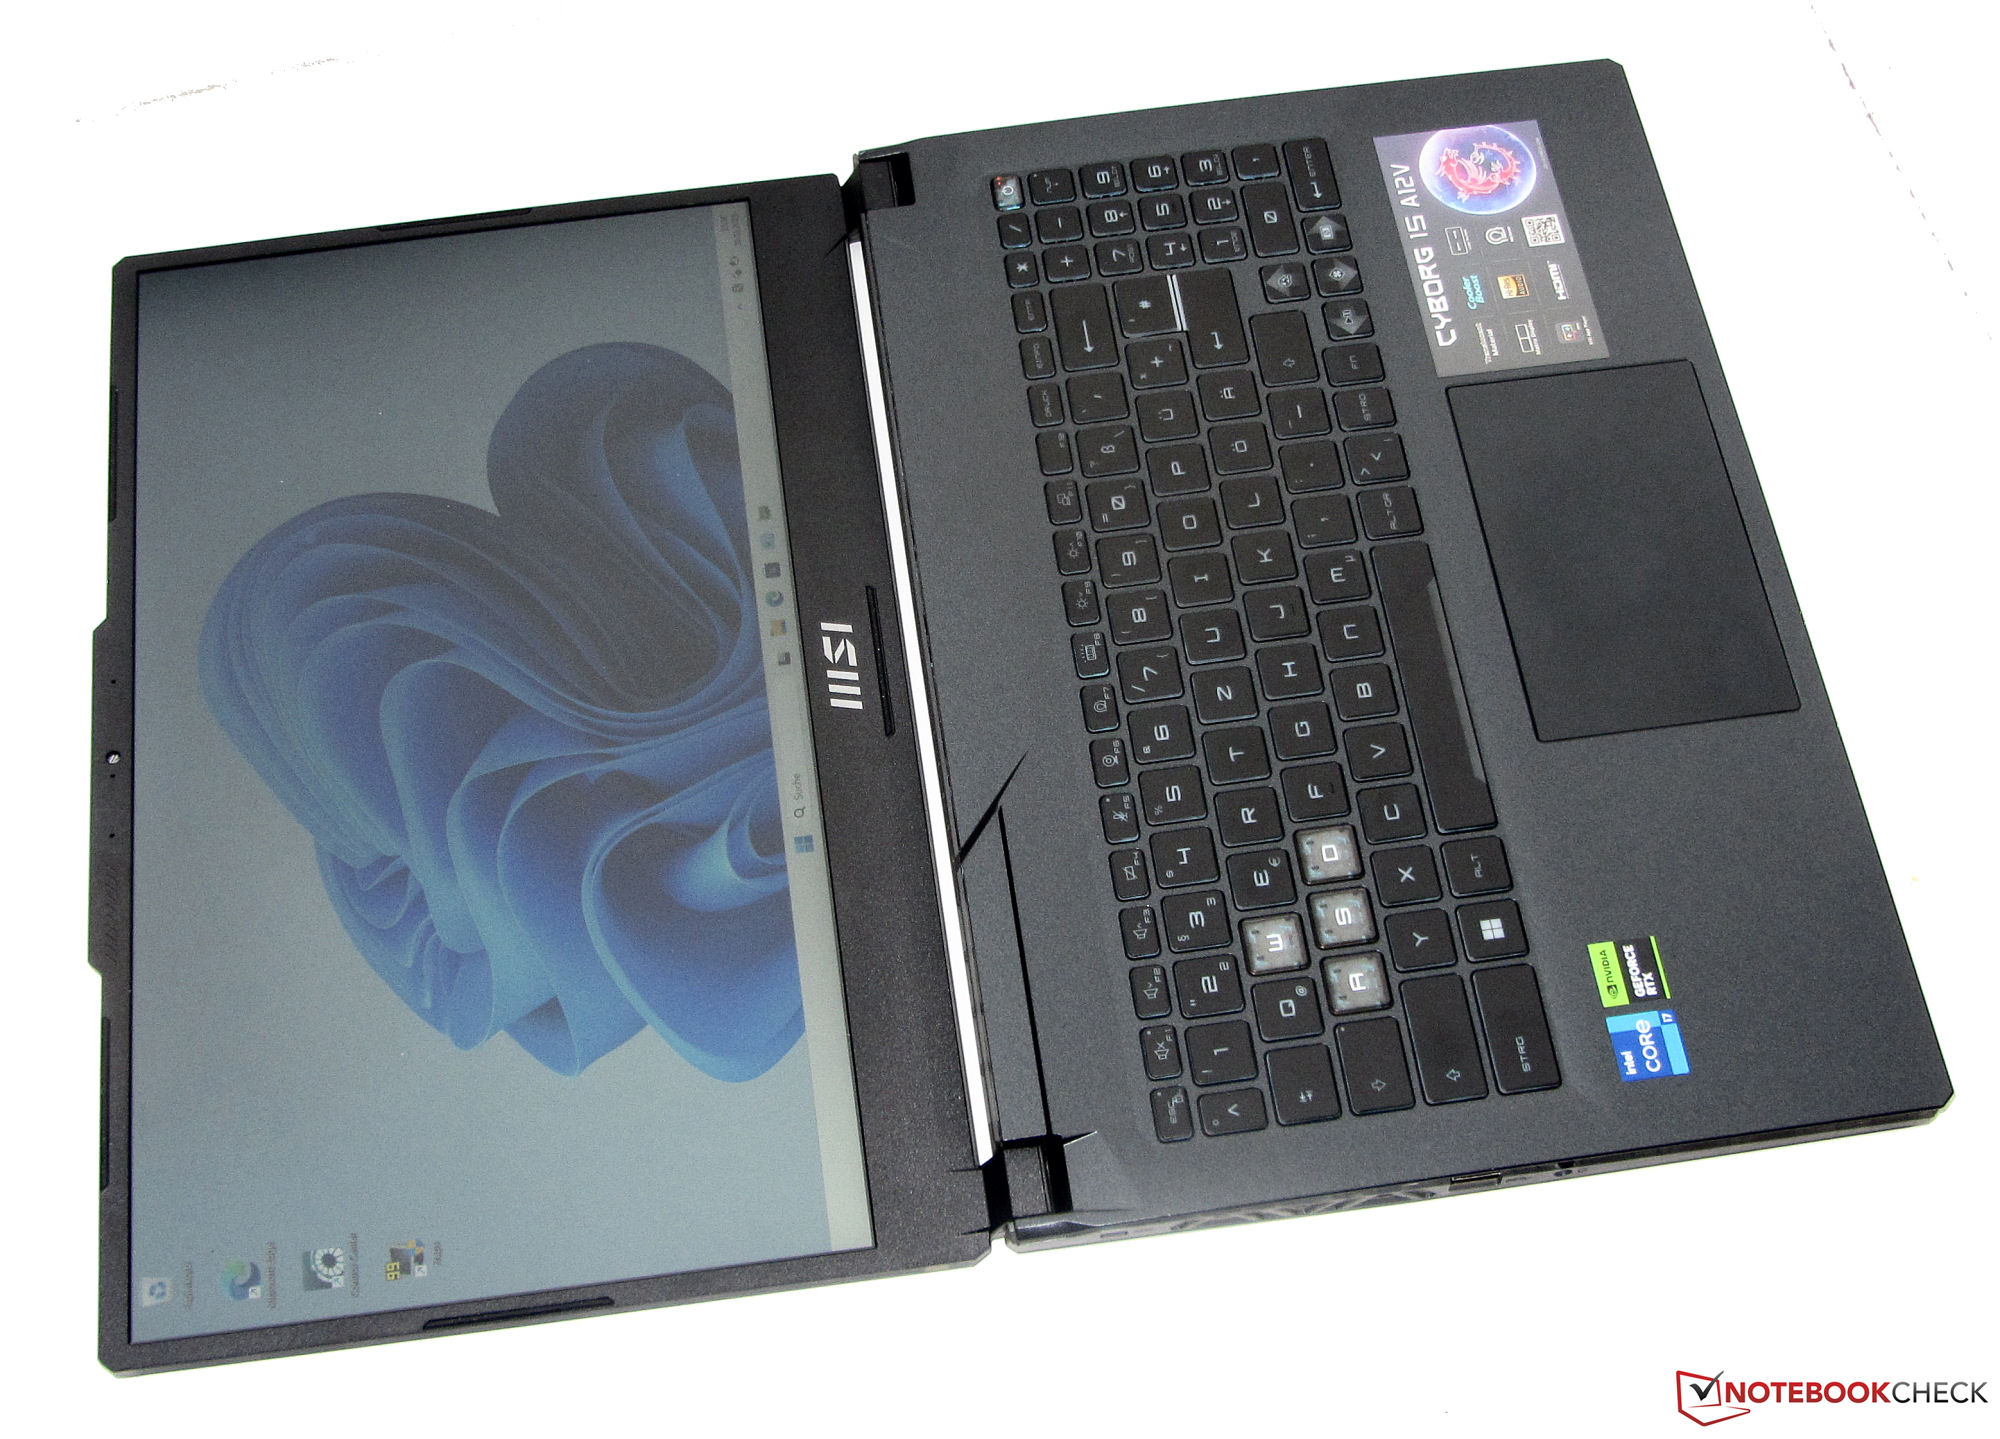
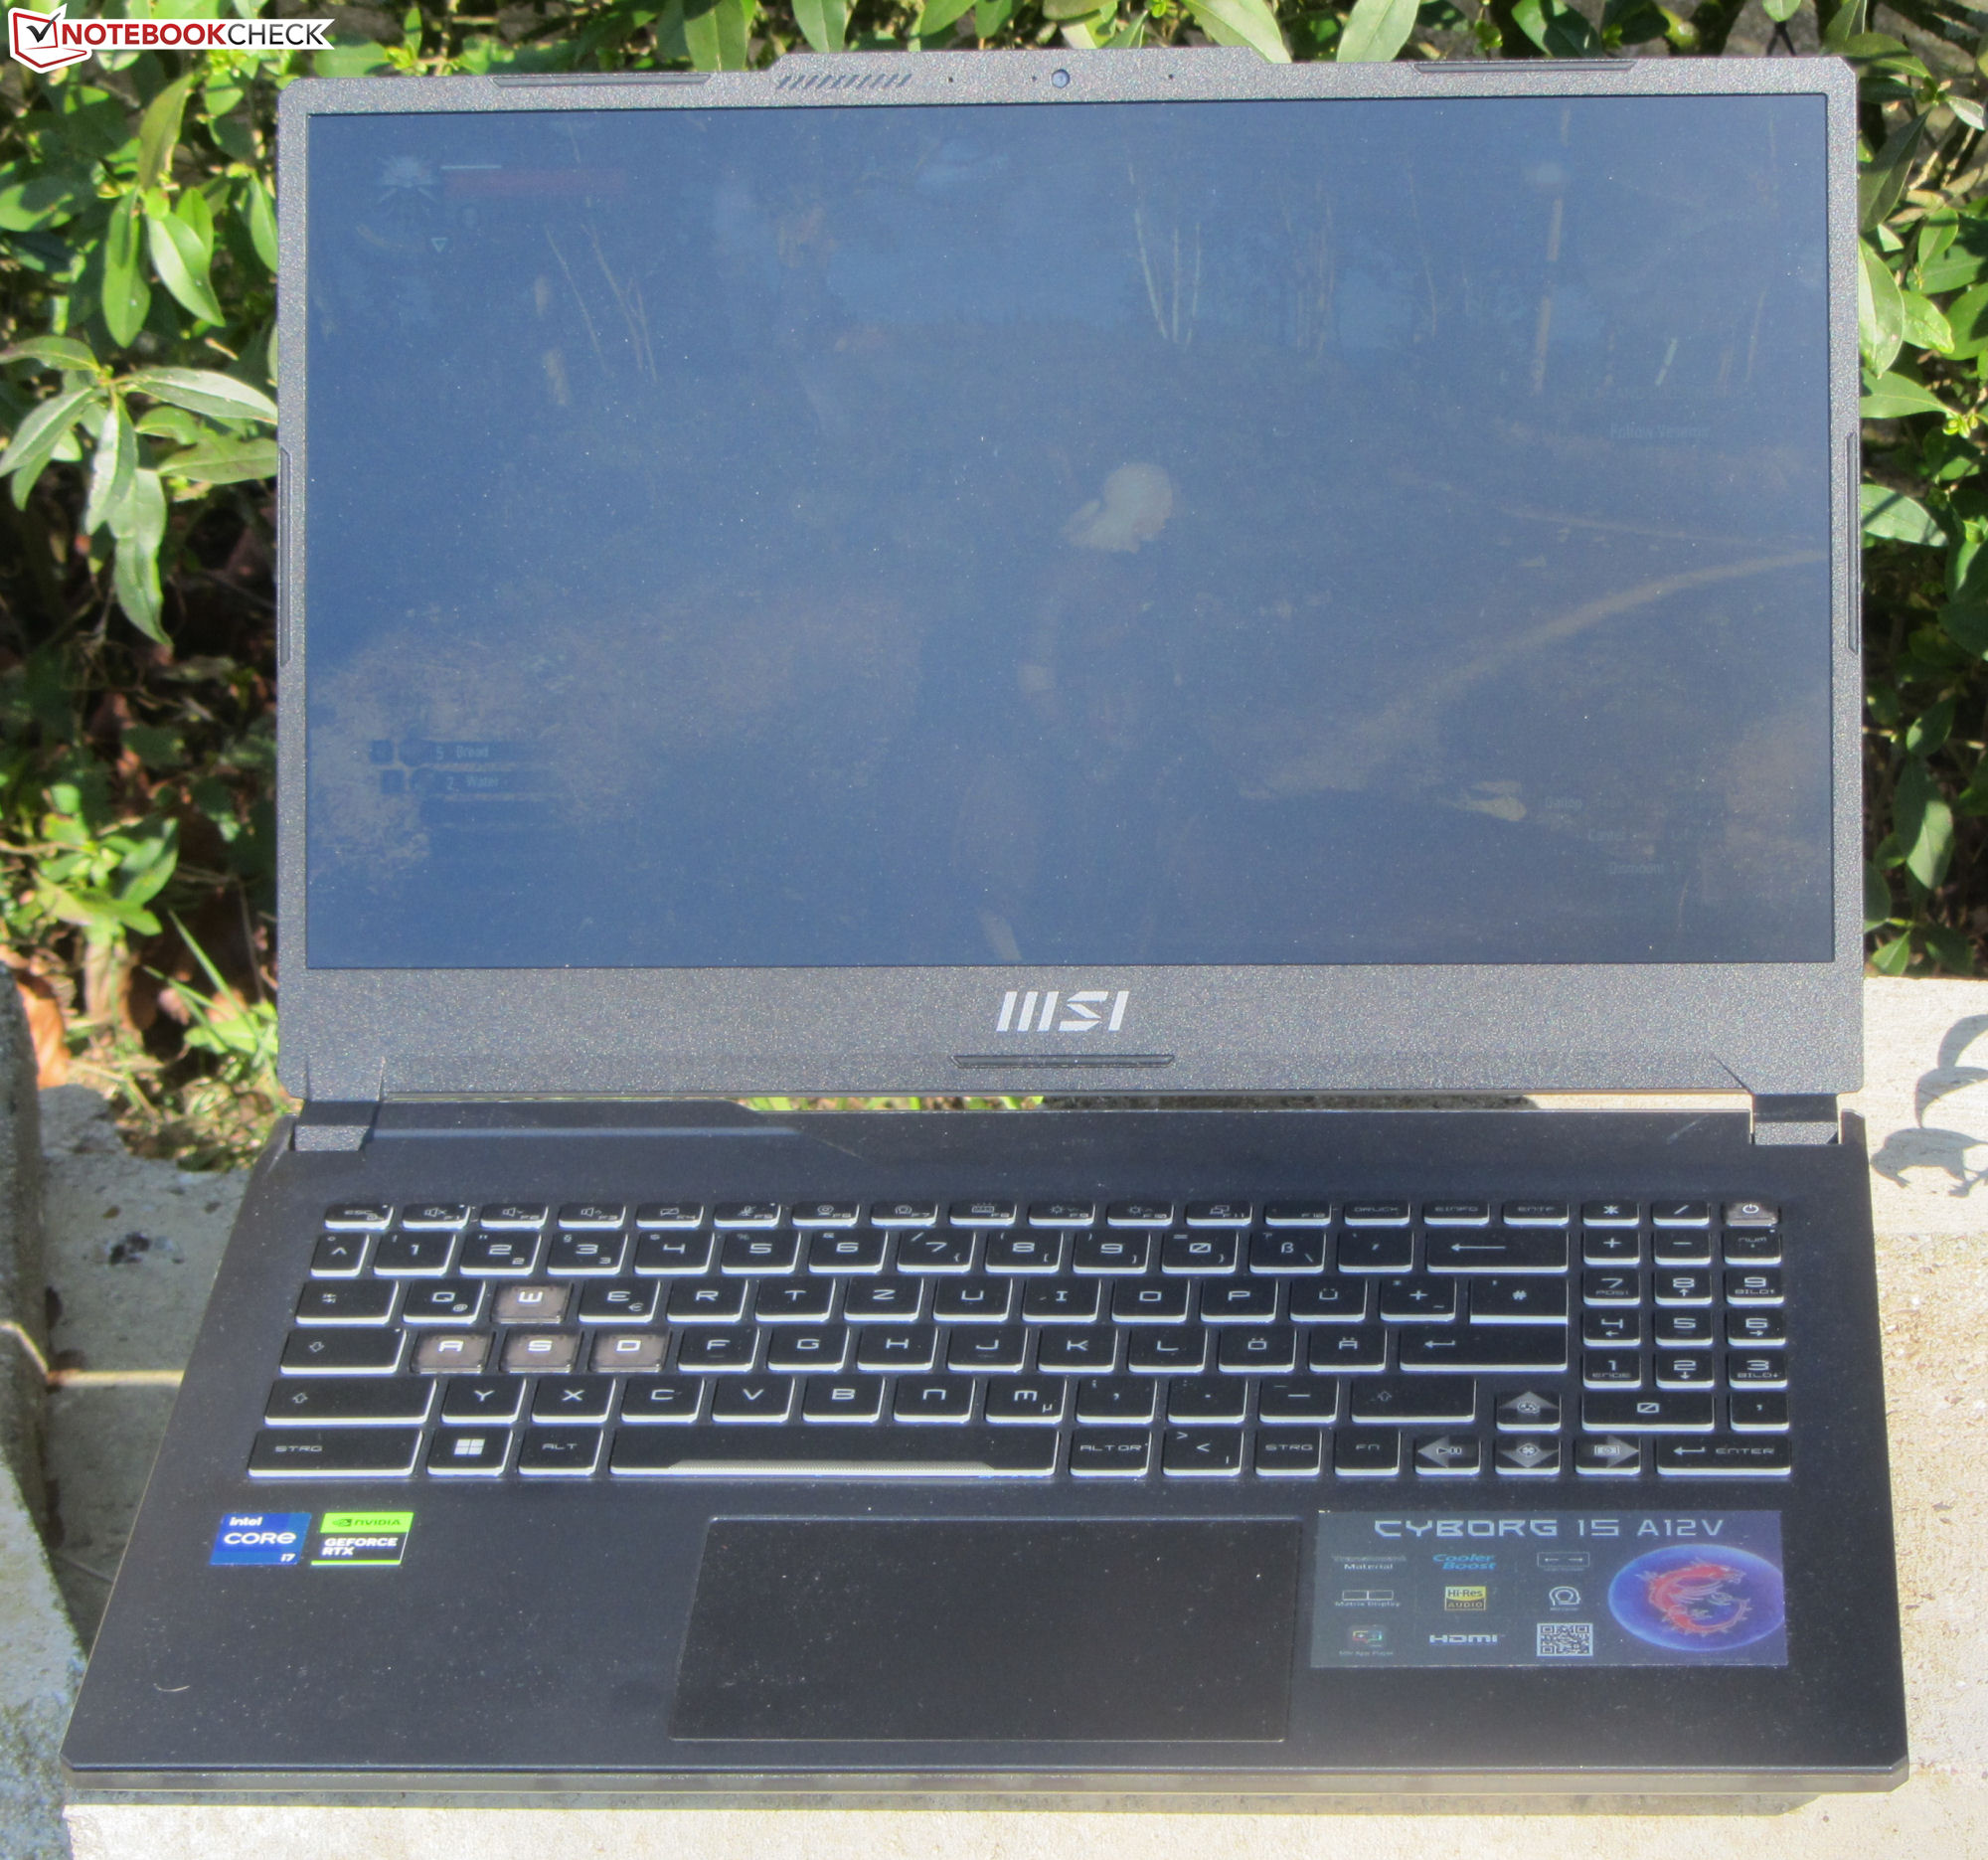
While the dimensions of the MSI laptop are similar to those of the competitors, it is one of the lighter gaming laptops in the 15.6-inch format.
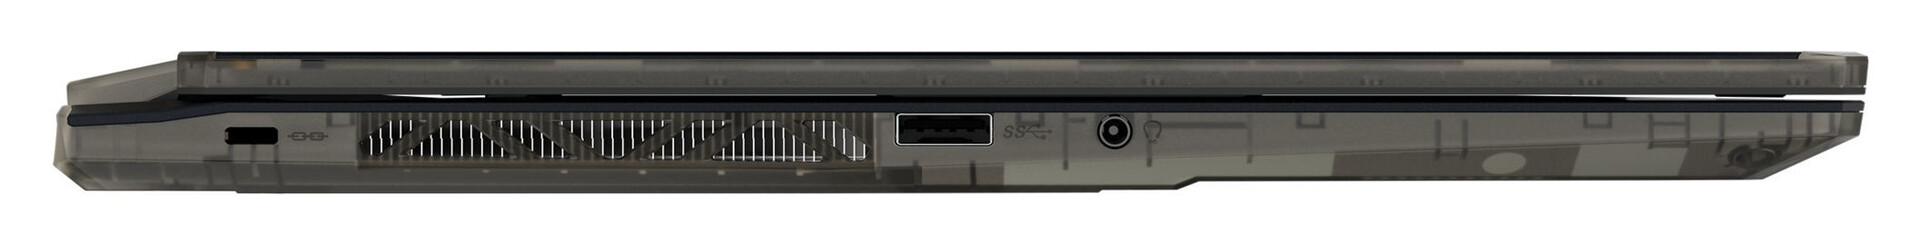
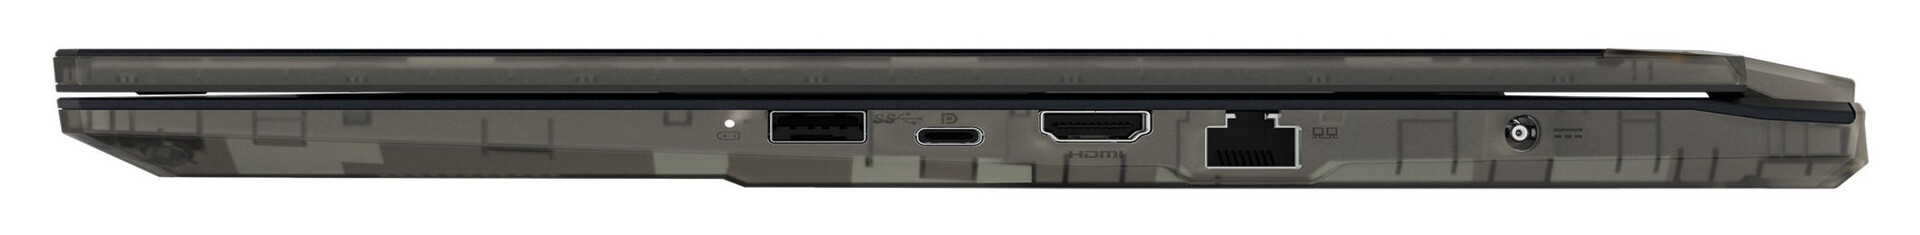
Equipment - The MSI laptop doesn't offer Thunderbolt
The connection equipment is limited, with two available USB-A ports (USB 3.2 Gen 1) and a single USB-C port (USB 3.2 Gen 1). The latter also supports DisplayPort. Together there are two video output options (1x DP, 1x HDMI). In addition, there is a combined audio port, a Gigabit Ethernet port, and an opening for a cable lock. A storage card reader is not available.
Communication
The WLAN transfer rates determined under optimal conditions (with no additional WLAN devices in close proximity and a short distance between the laptop and server PC) turn out excellent and correspond to the capabilities of the Wi-Fi chip (Intel AX201). Wired network connections are handled by a Gigabit Ethernet chip (RTL8168/8111; 1 Gbit/s) from Realtek.
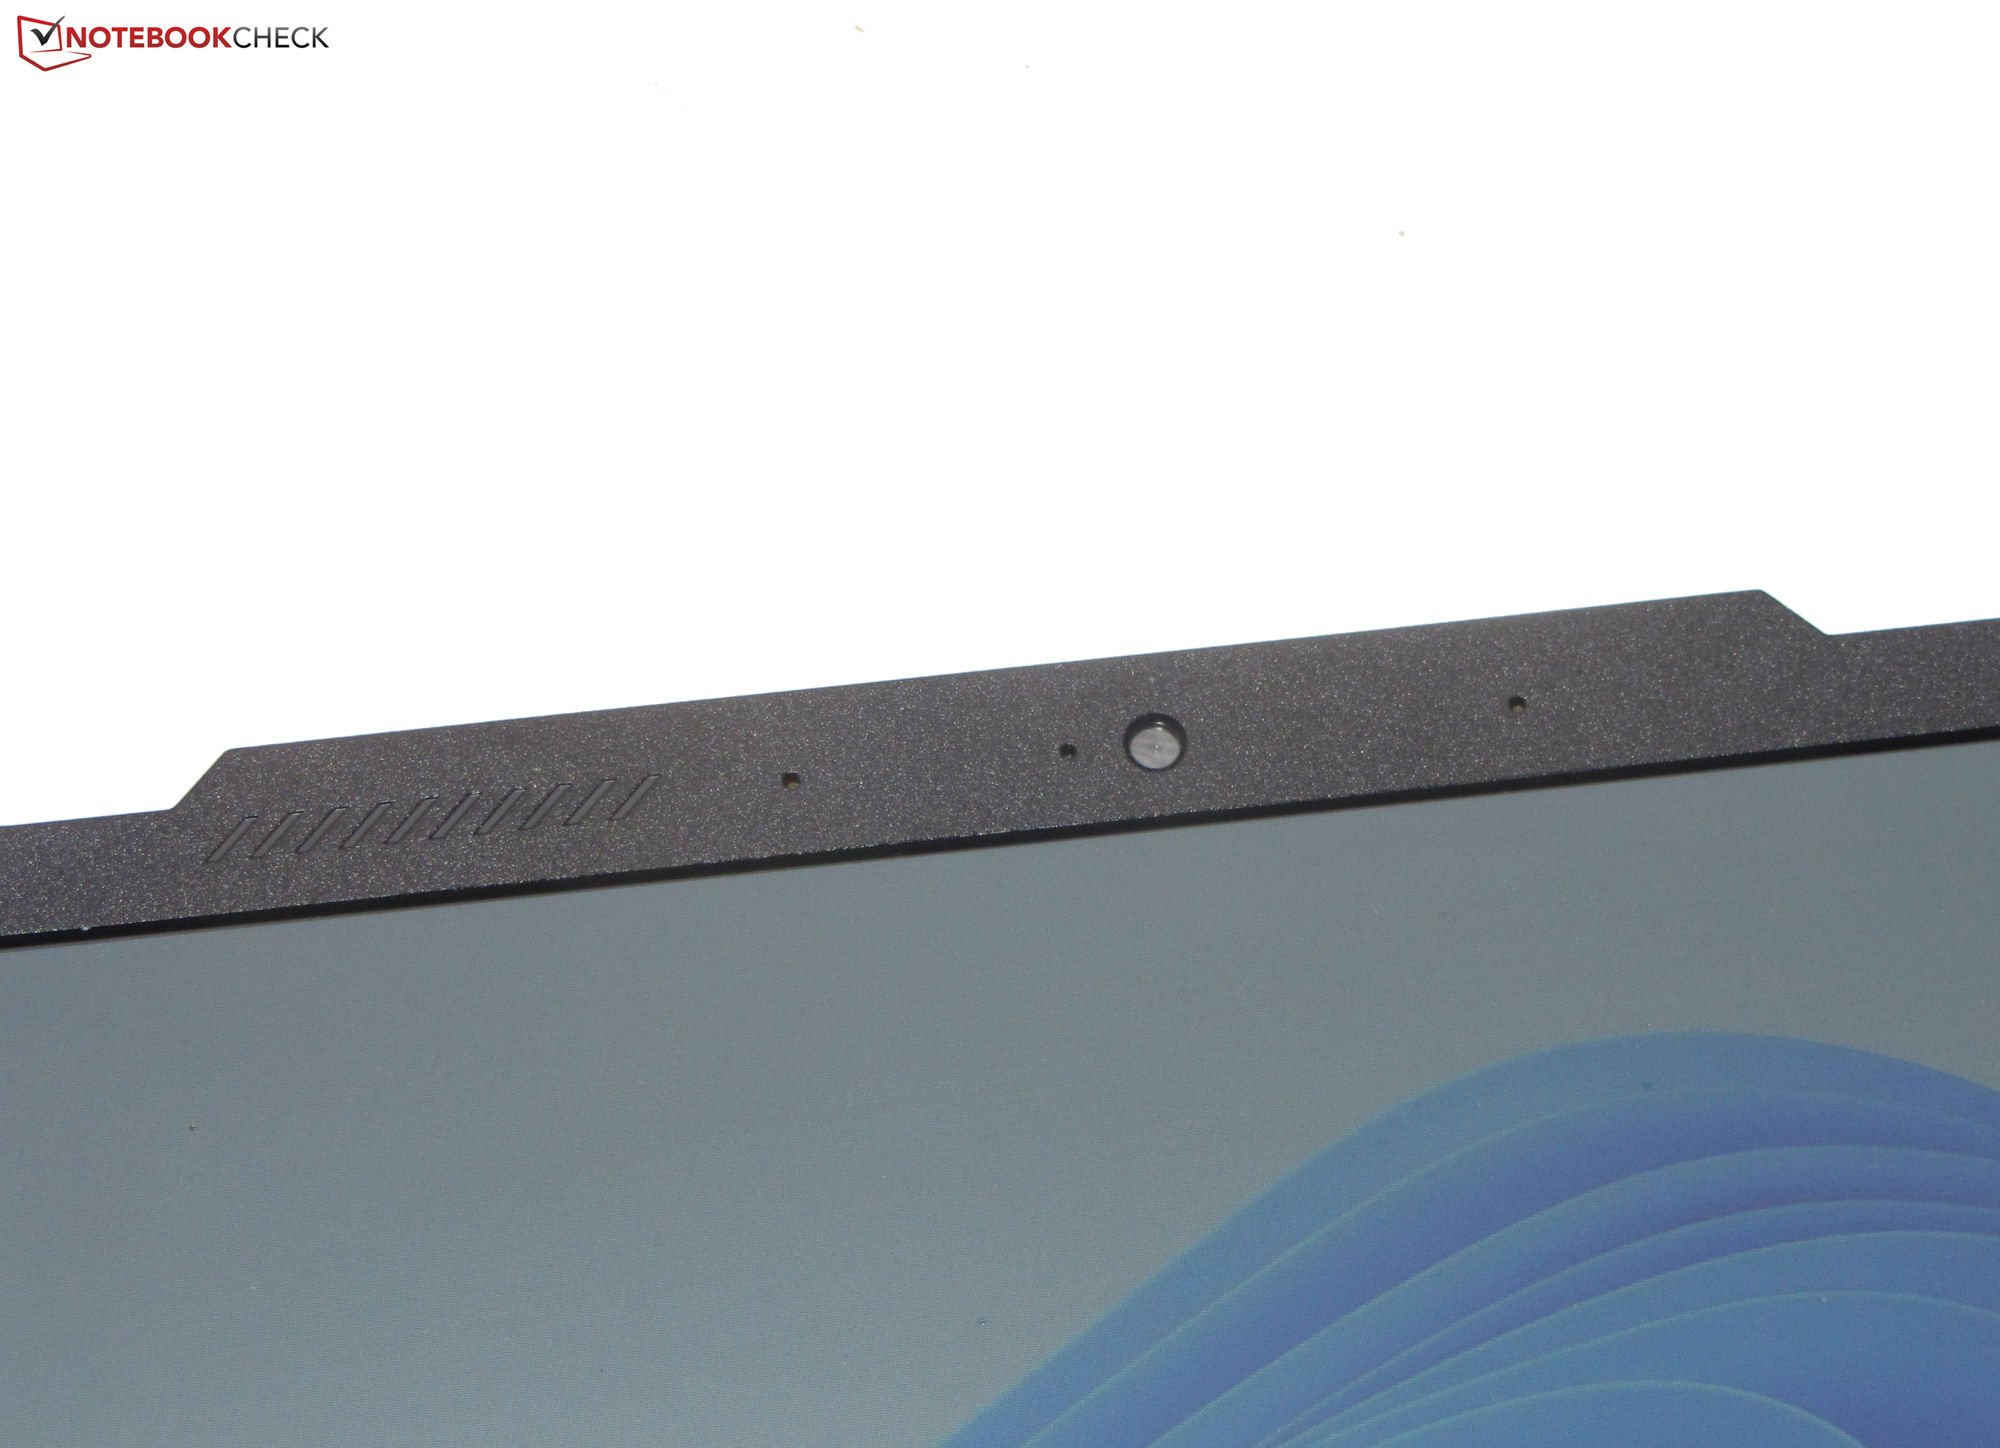
Webcam
The webcam (0.9 MP, max. 1,280 x 720 pixels) doesn't offer a mechanical cover. The quality it delivers is standard fare. The color accuracy is lacking, and with a color deviation of about 16, the target of DeltaE < 3 is missed.


Accessories
The laptop does not include any additional accessories besides the usual documentation (quick start instructions and warranty information).
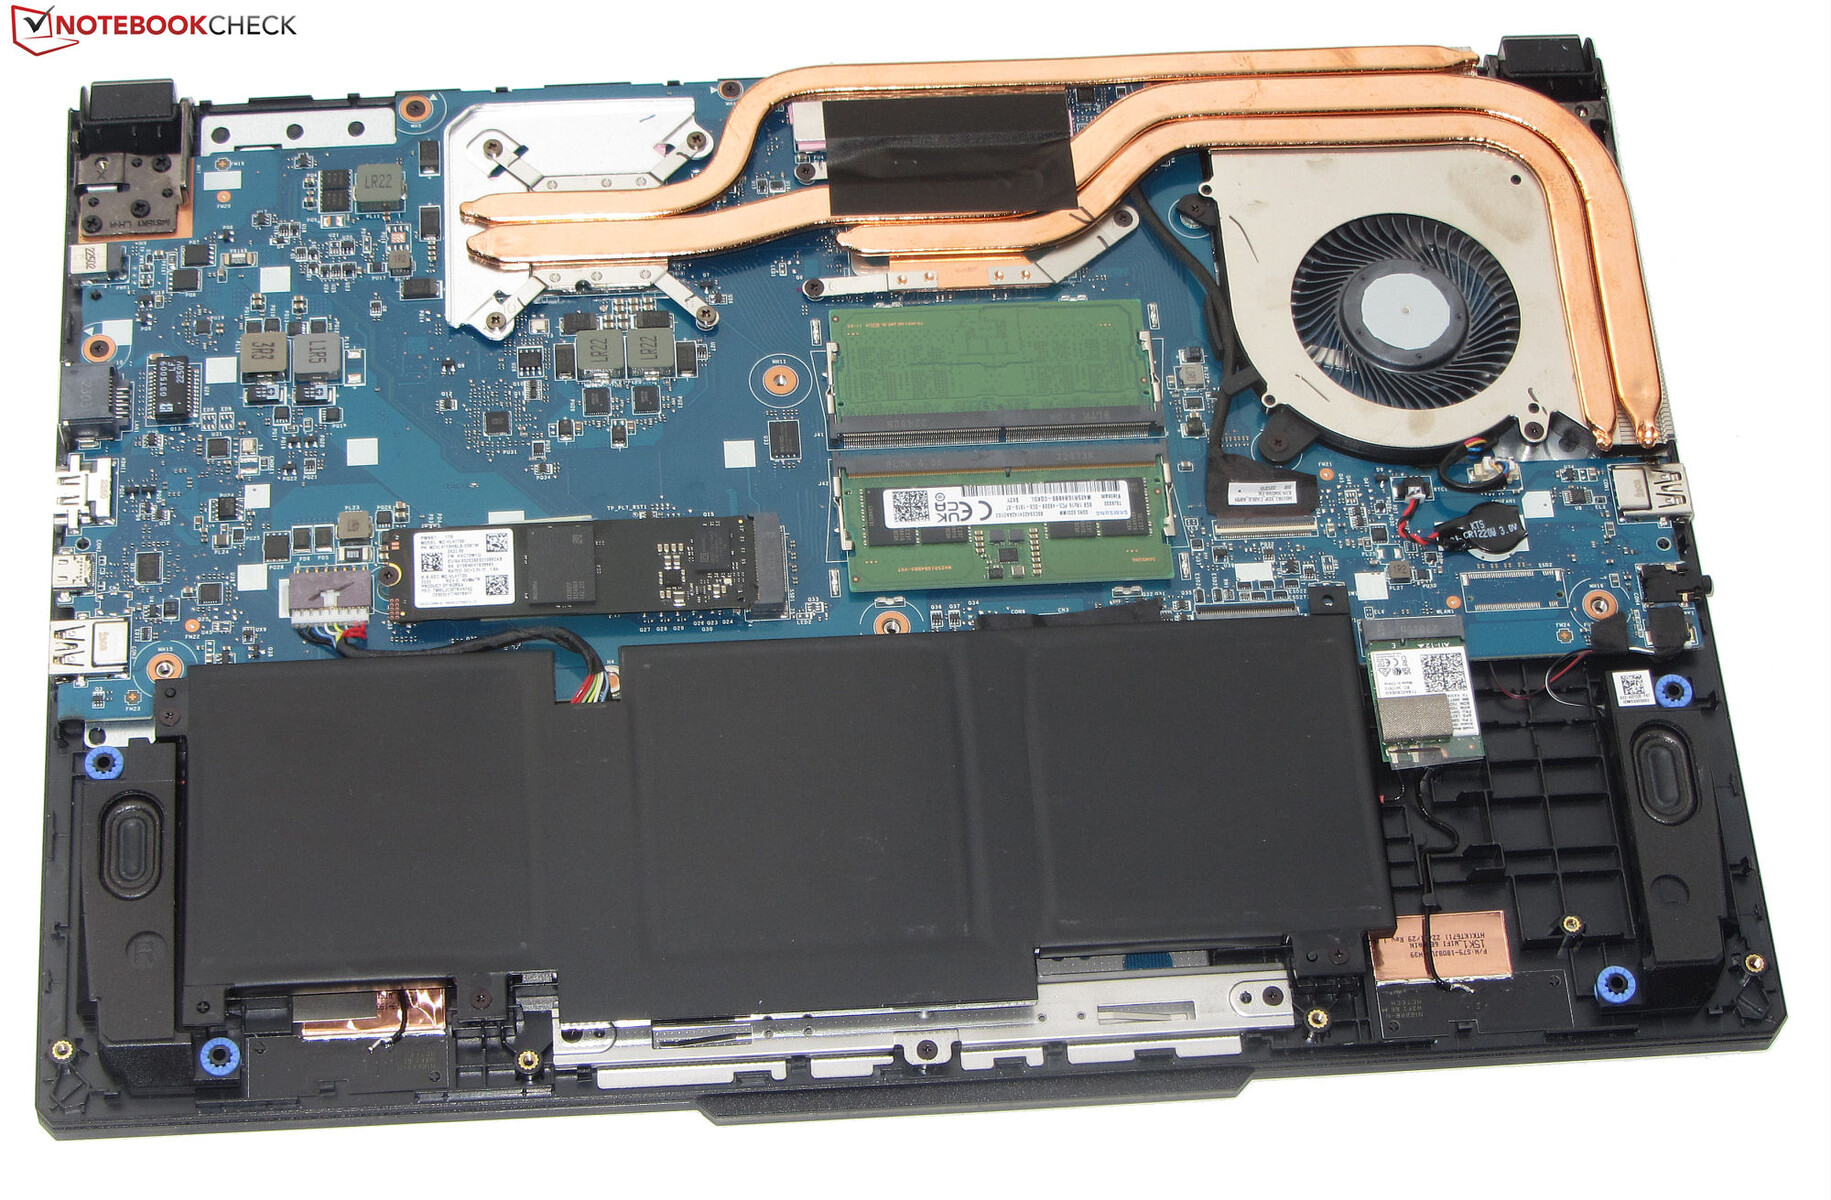
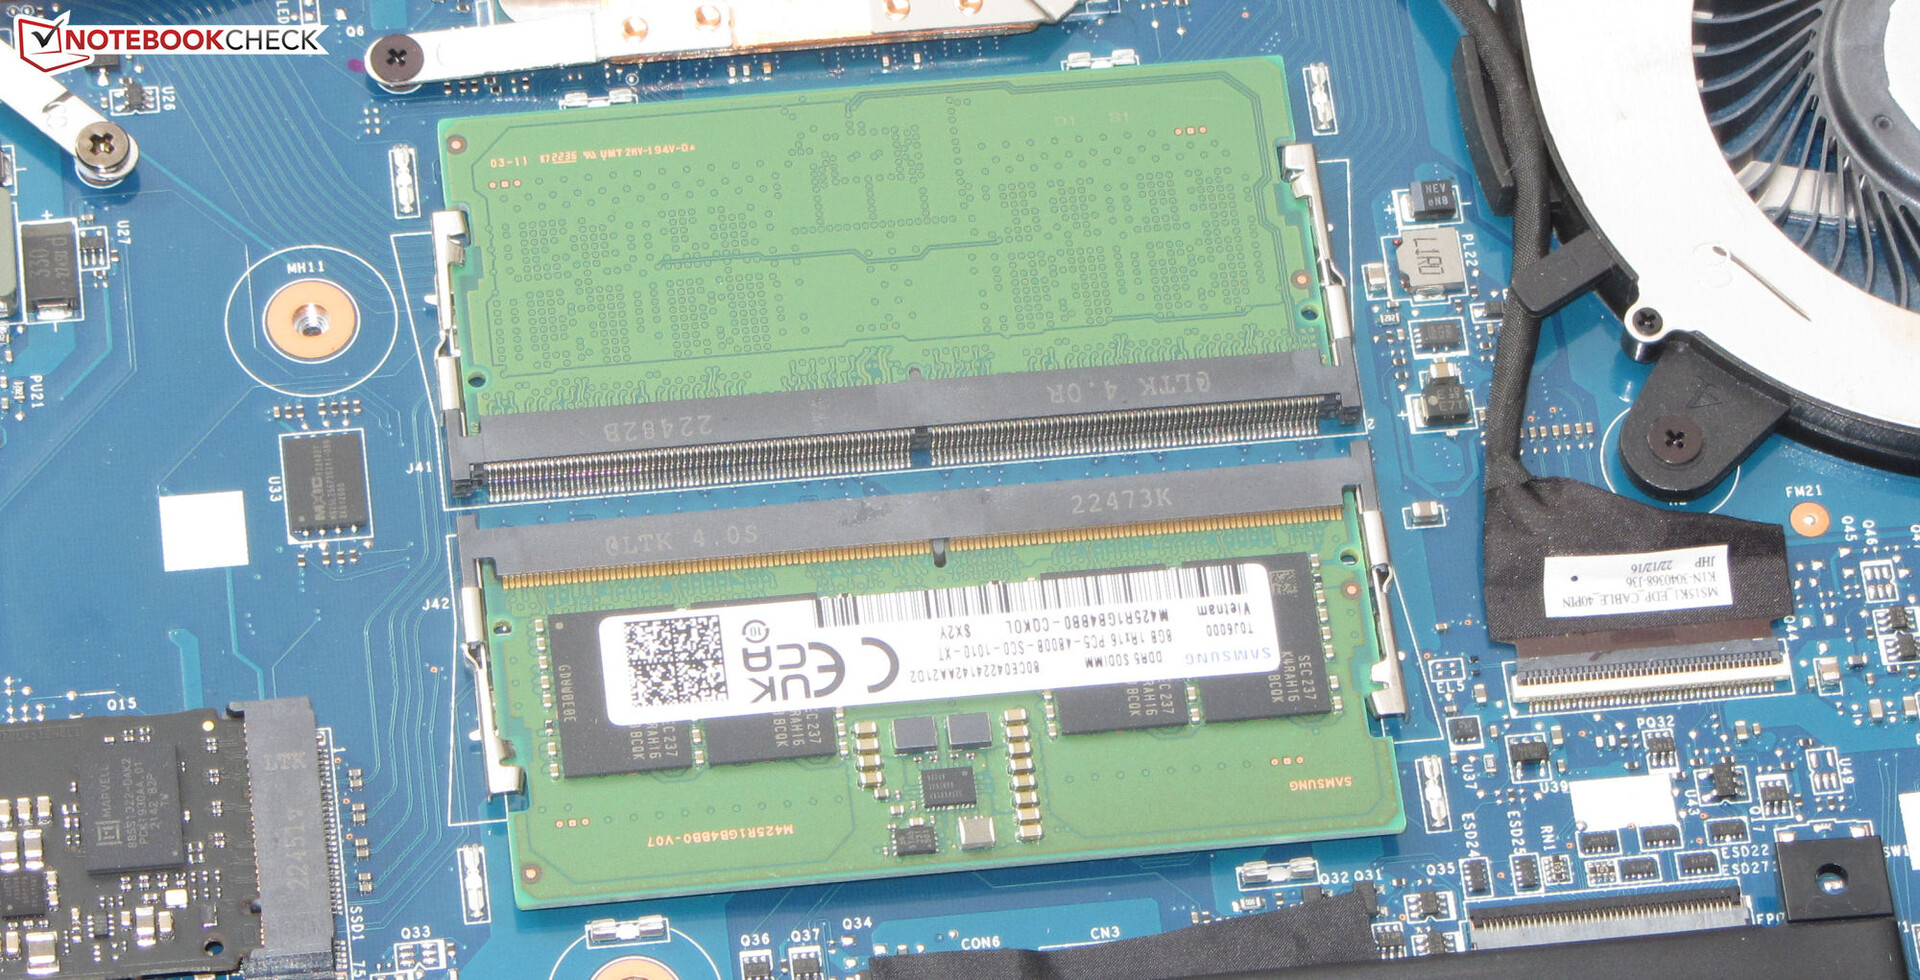
Maintenance
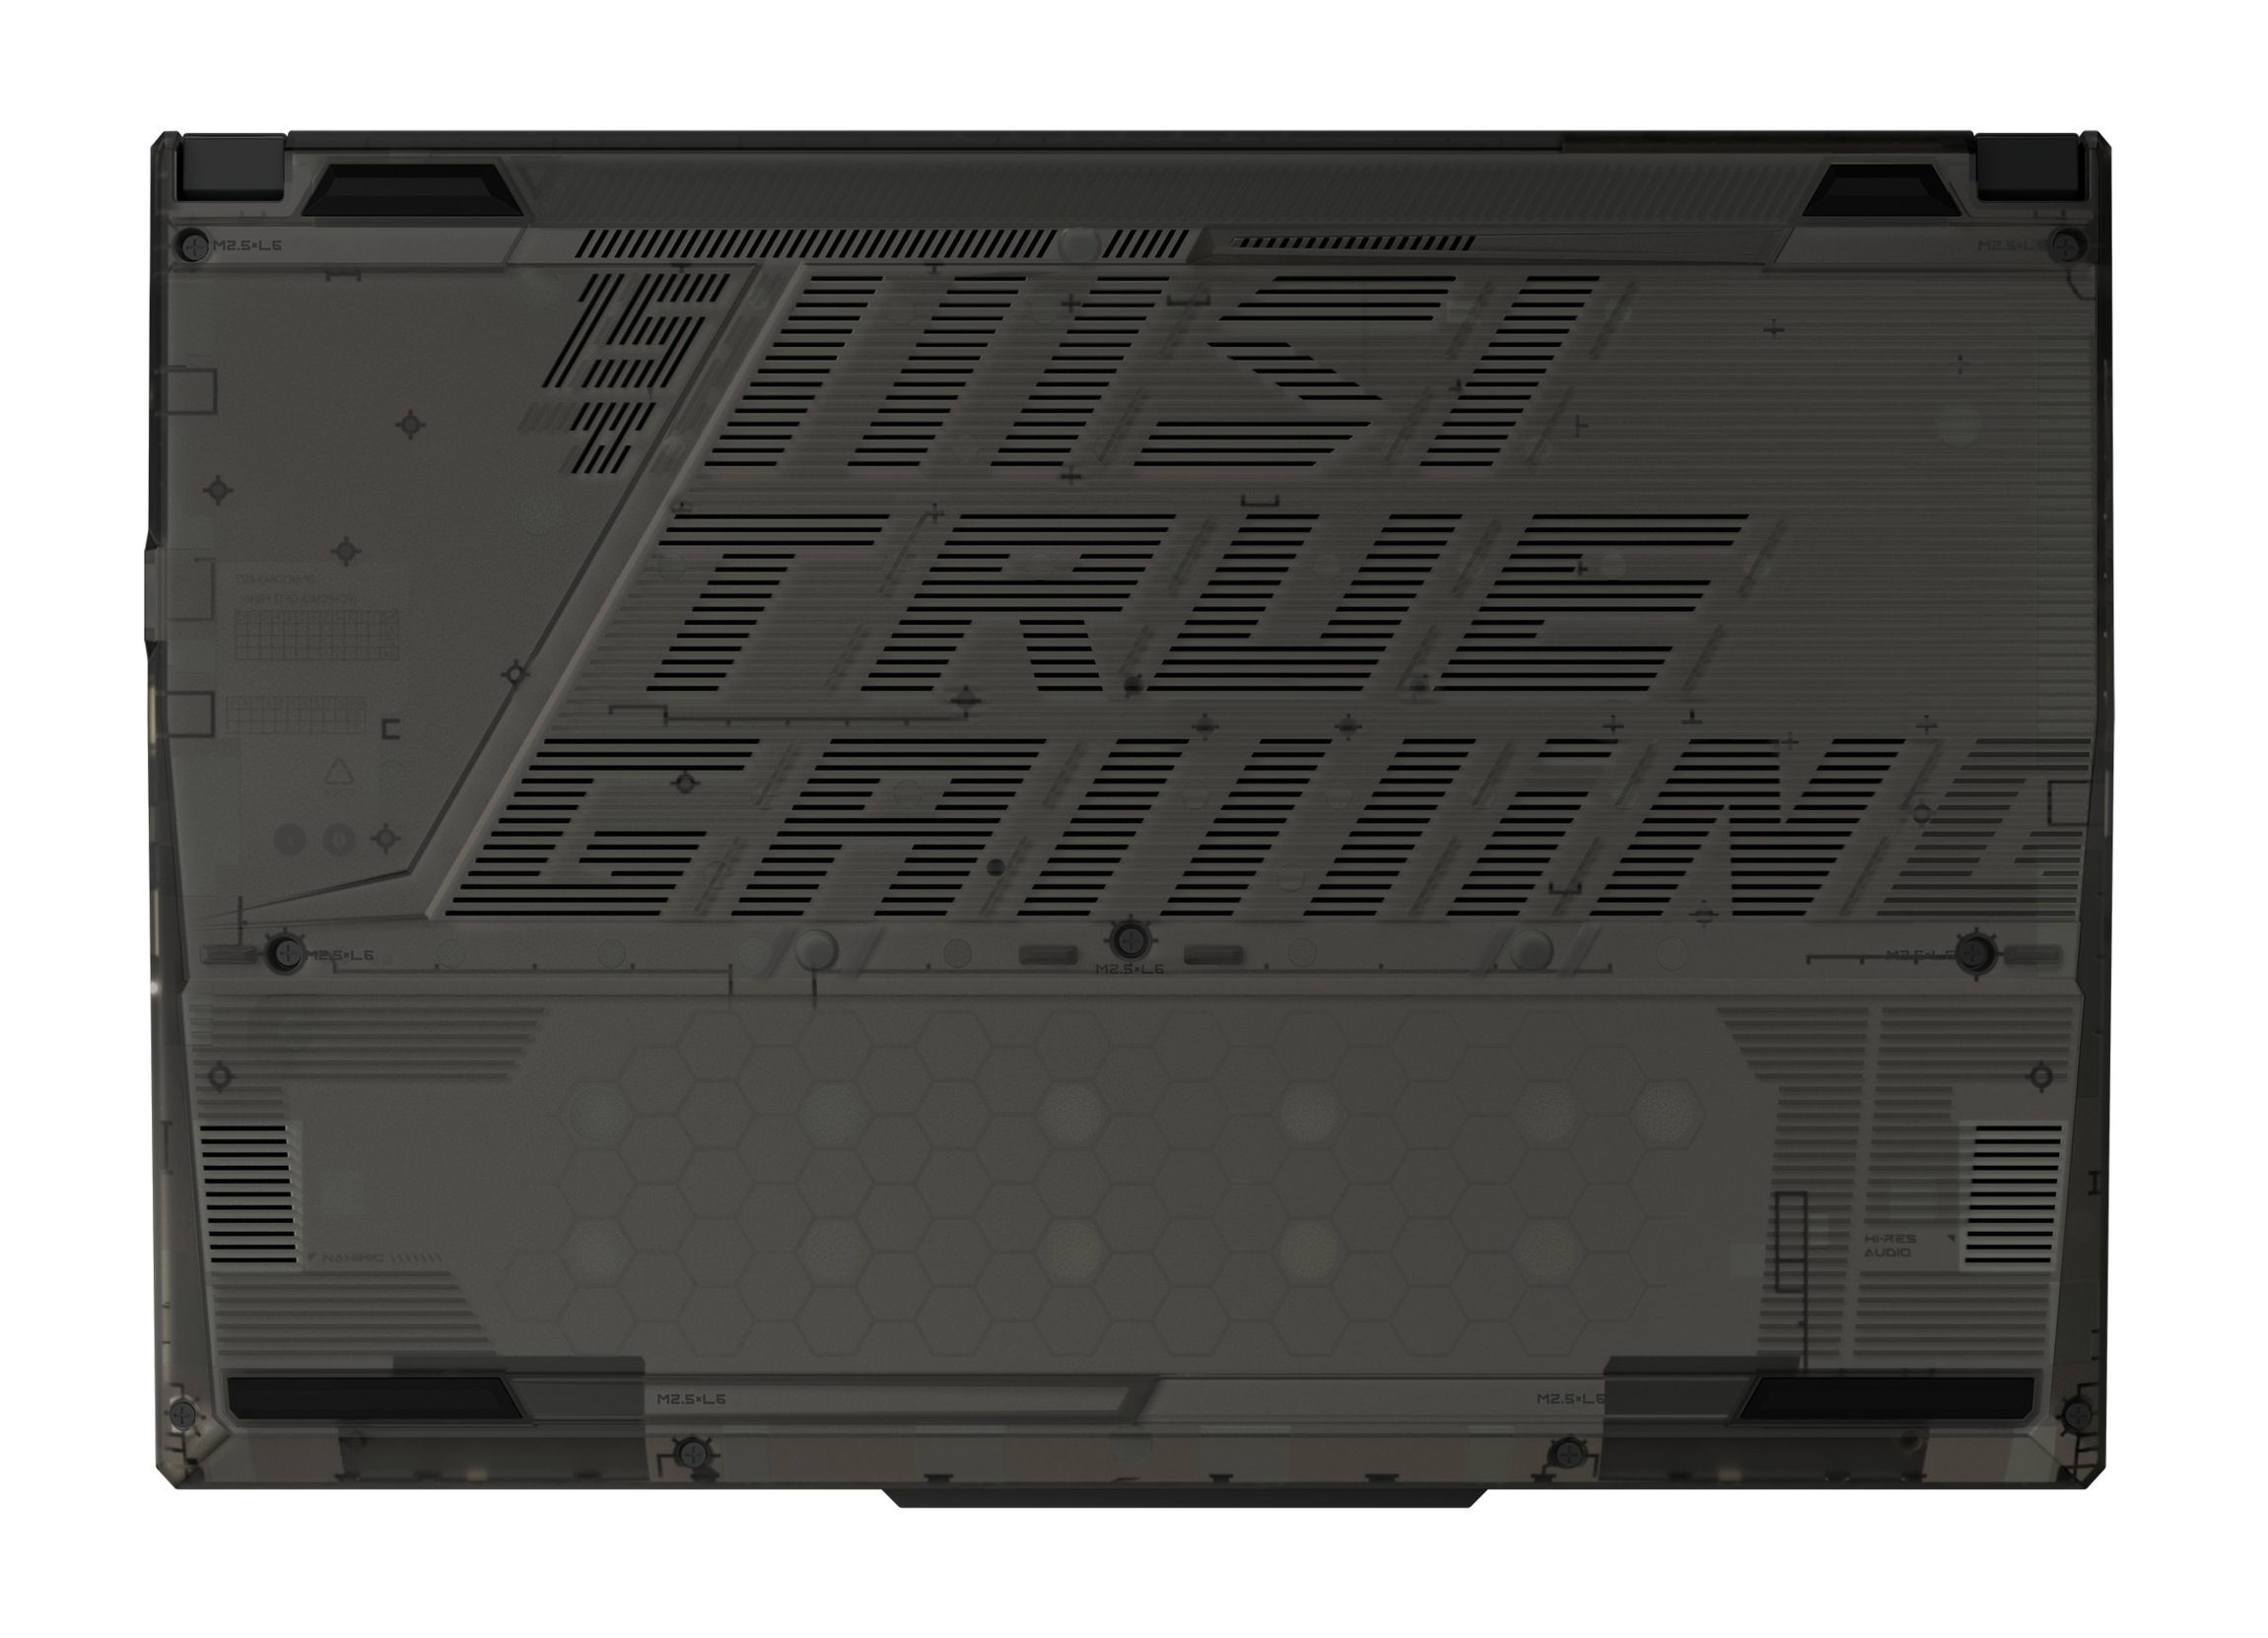
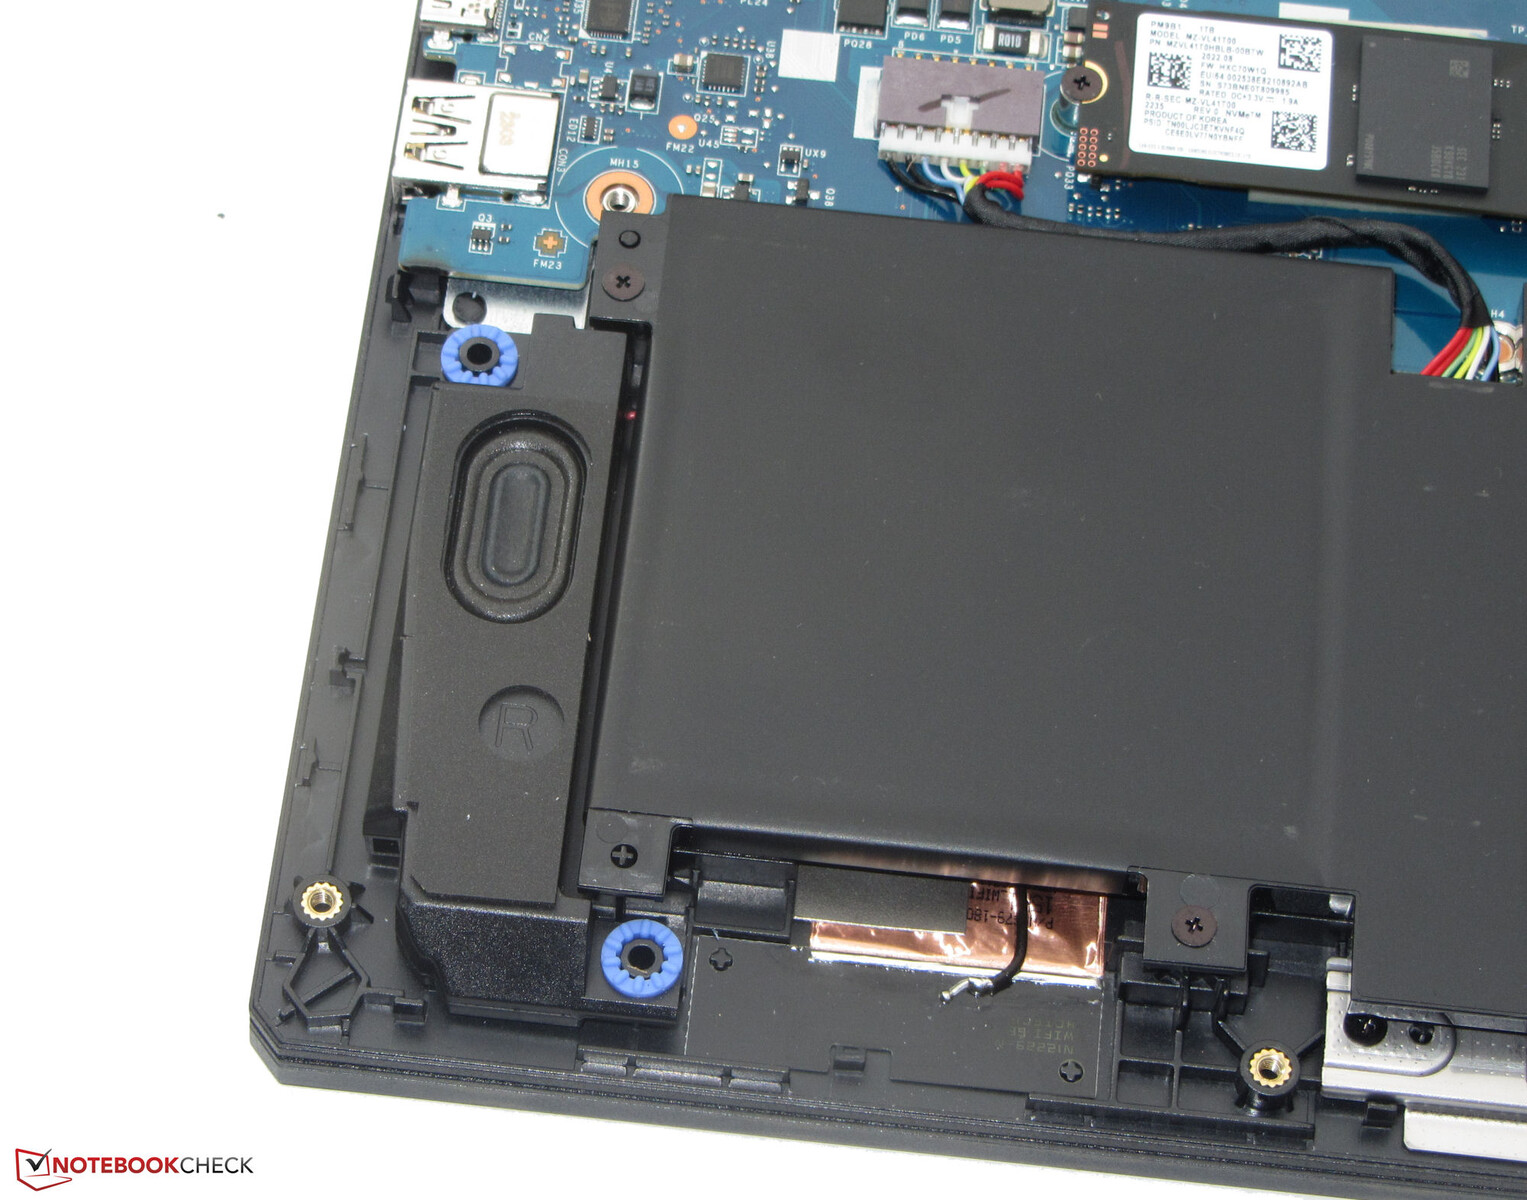
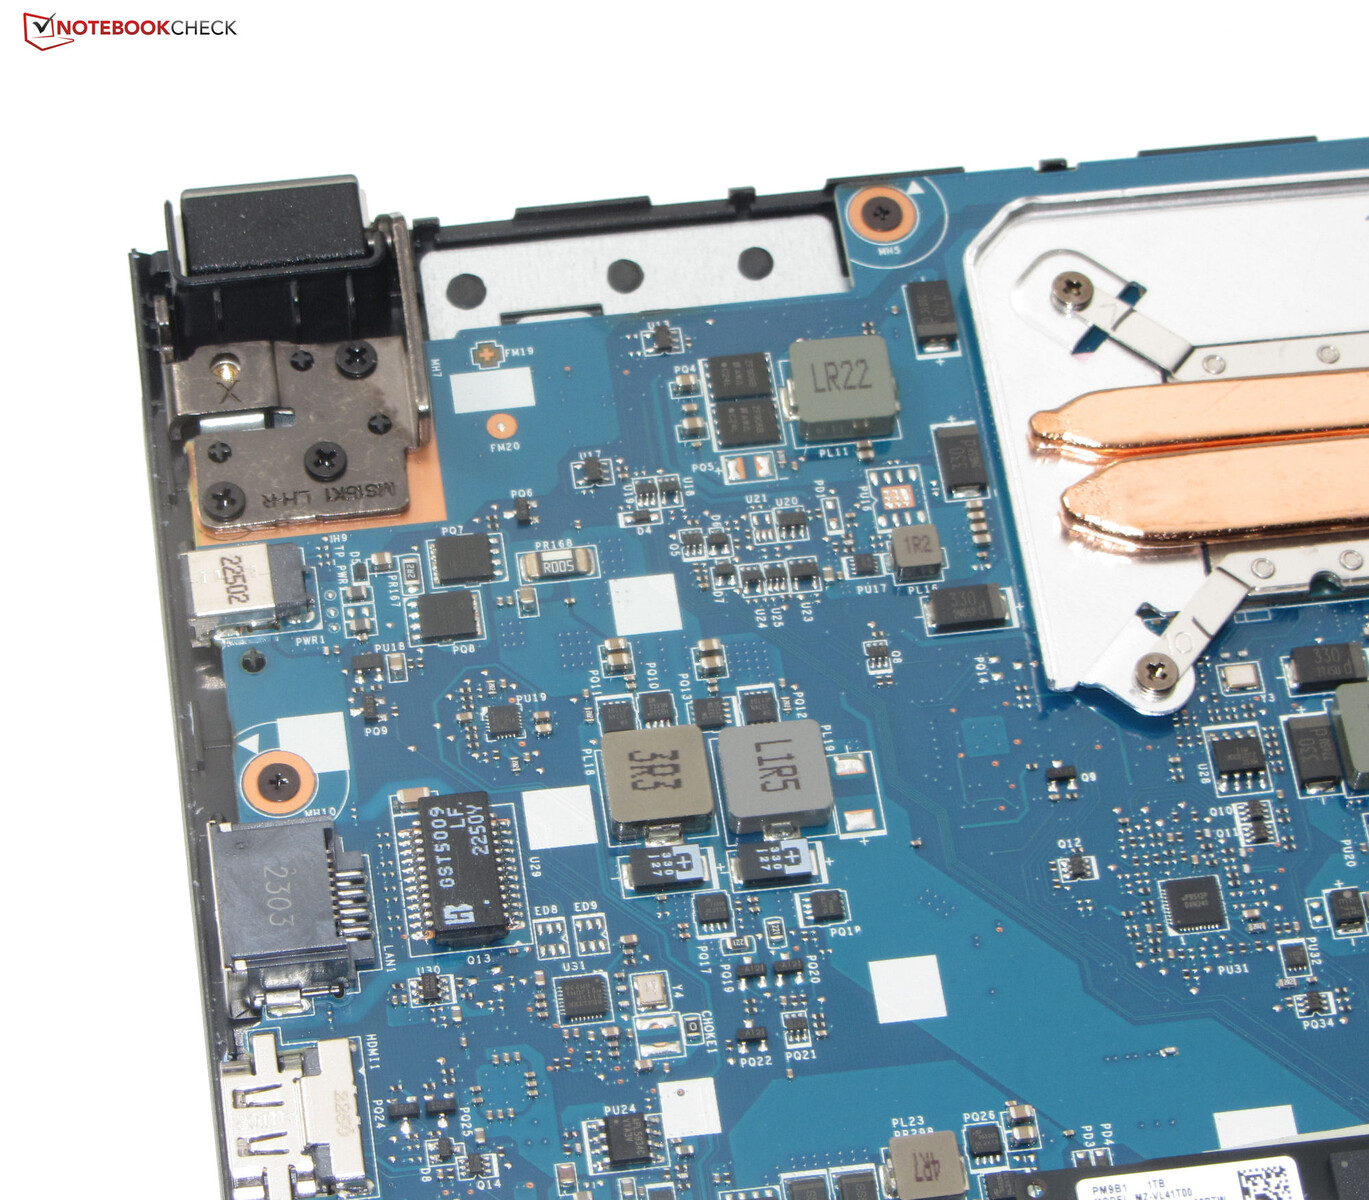
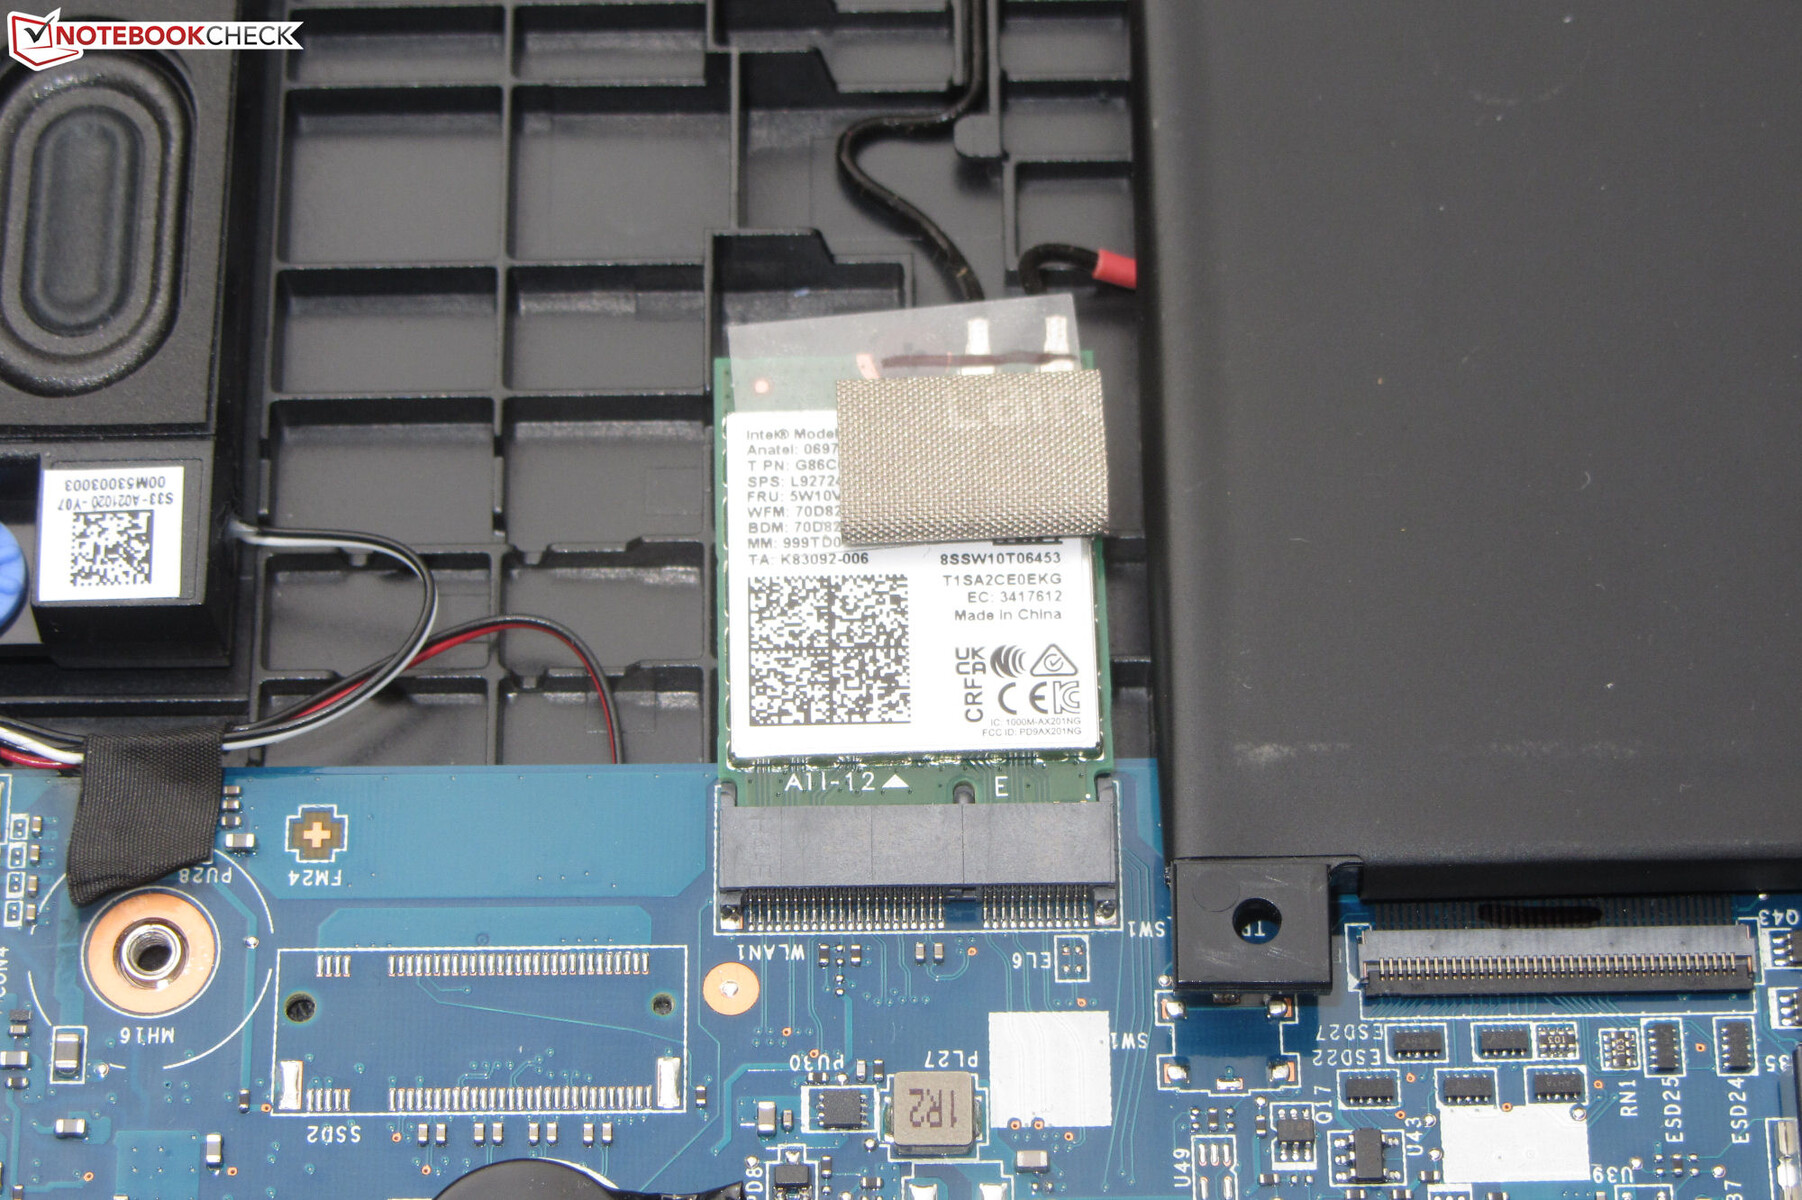
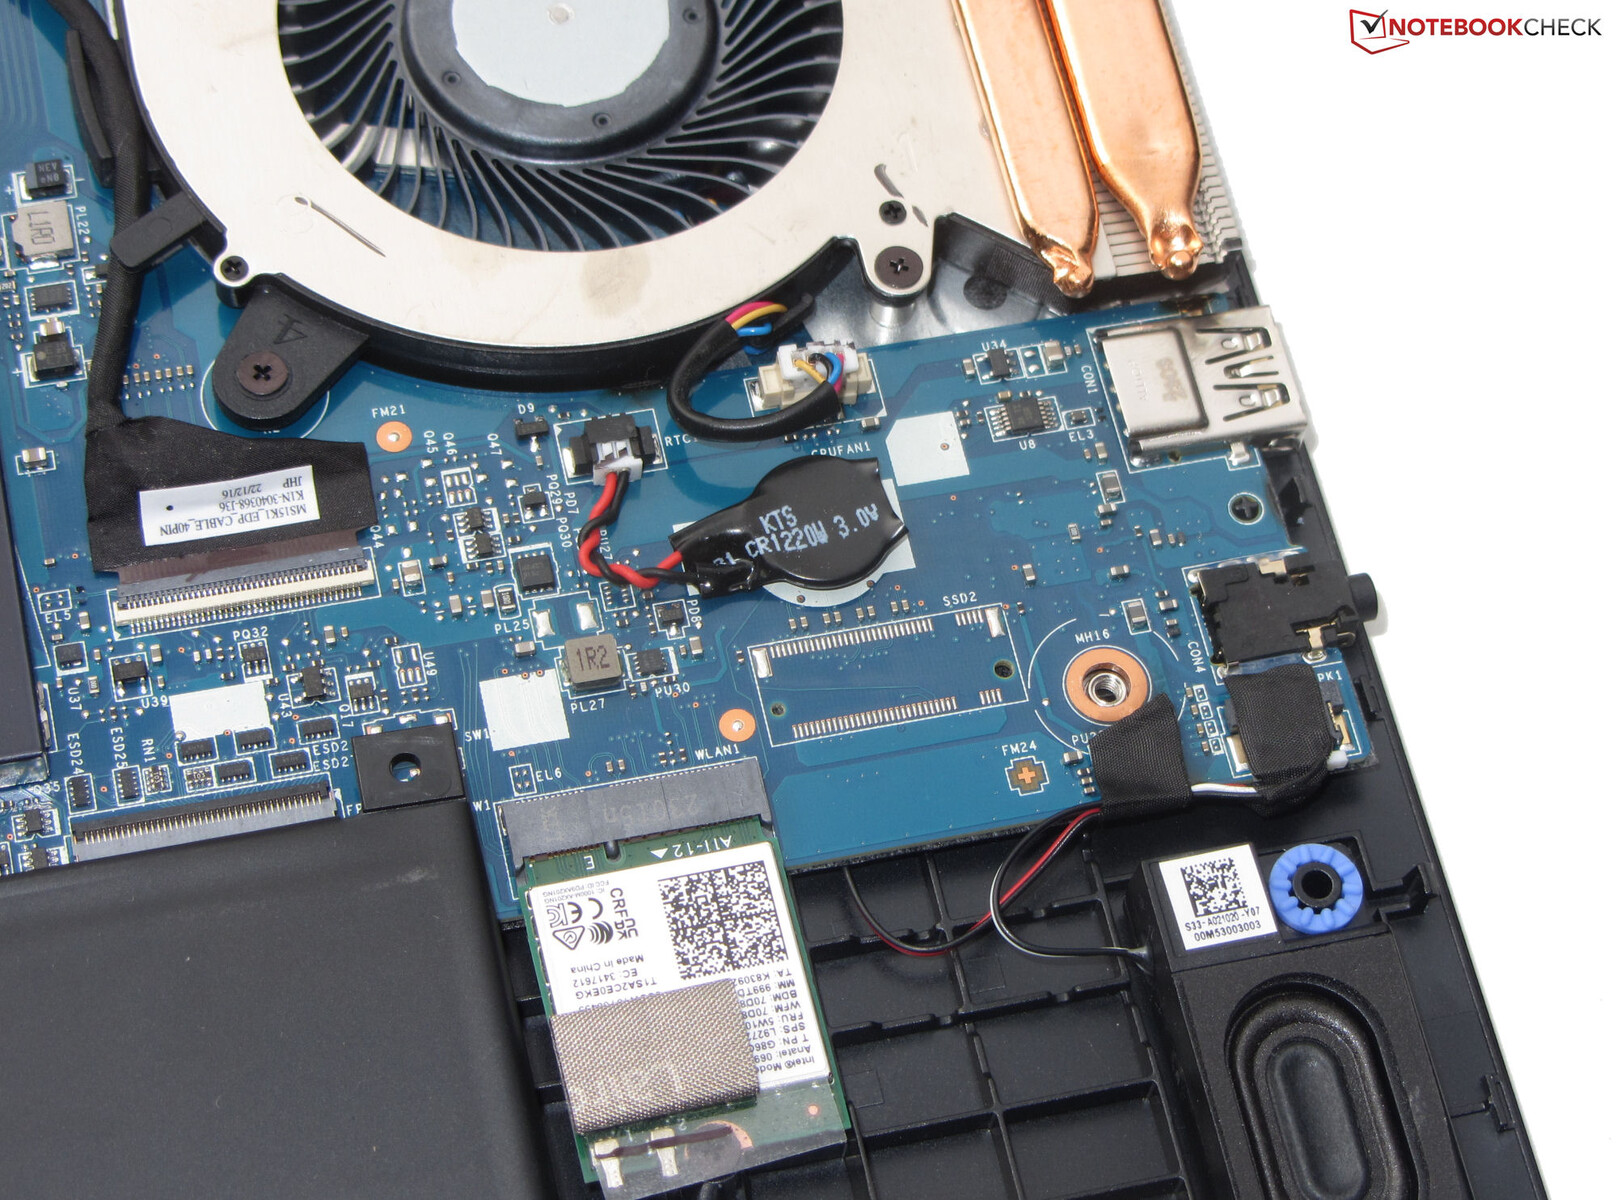
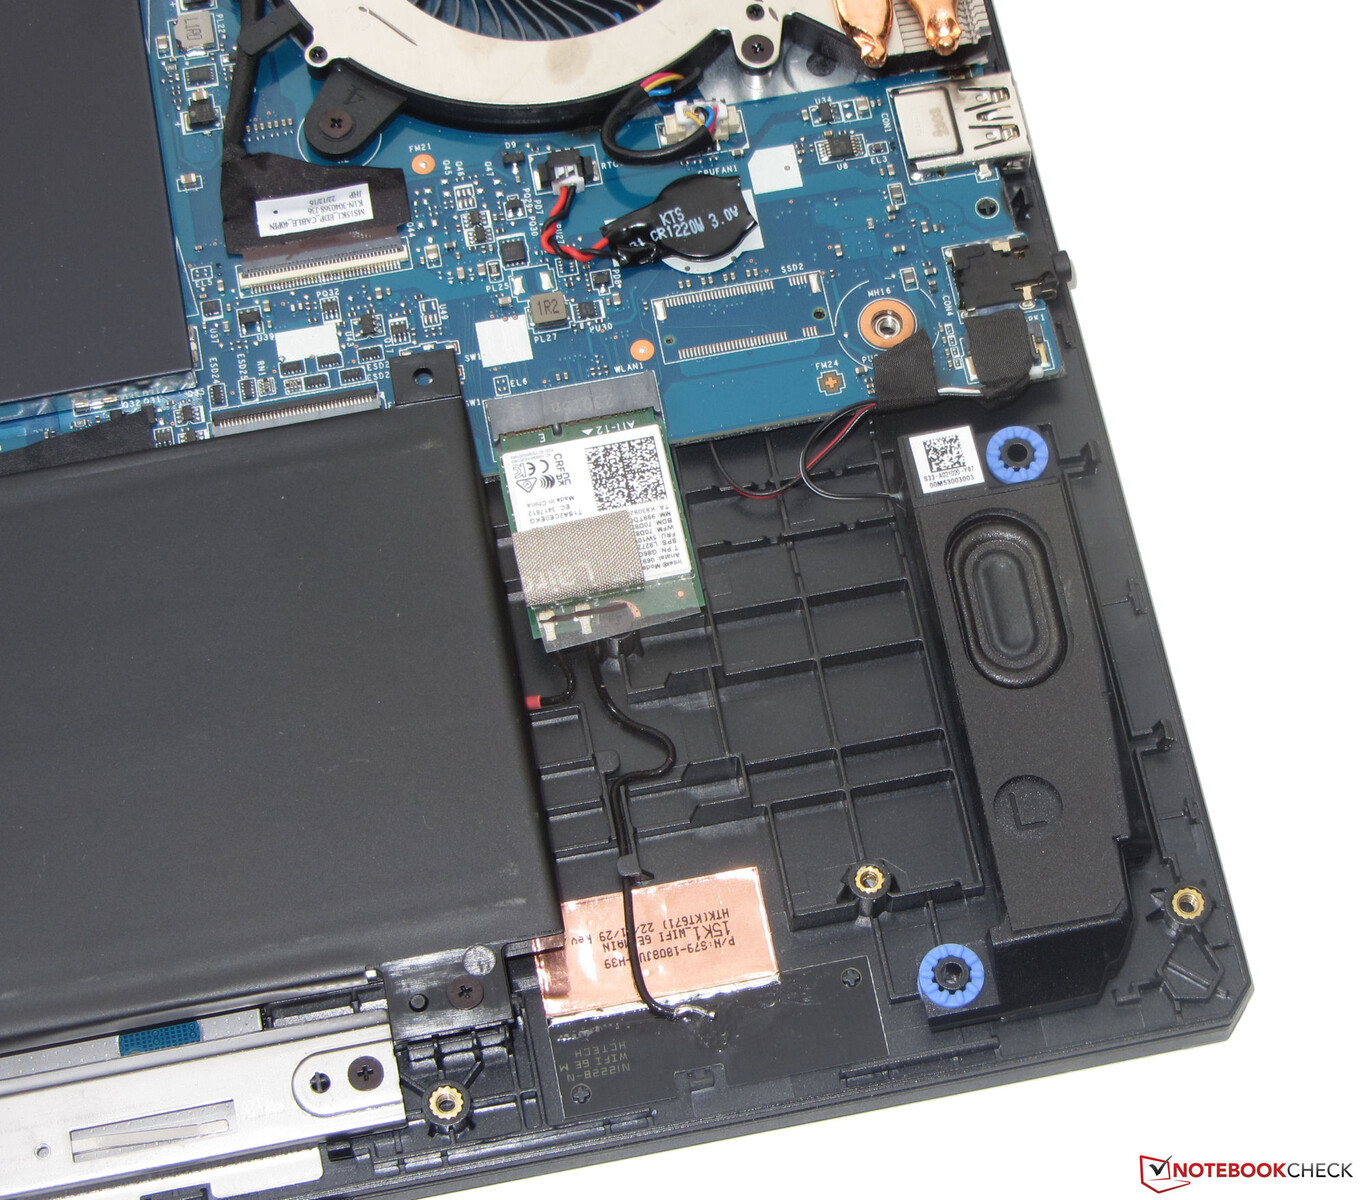
After removing all the screws on the bottom, the case bottom can be removed with the help of a small prying tool or spatula. But you have to be careful, since it is held by fairly tight plastic clips. After removing the bottom, you get access to the working memory banks (both occupied), SSD (PCIe 4), BIOS battery, WLAN module, fan, speakers, and battery.
Warranty
MSI offers a 2-year warranty period for the 15.6-inch laptop in Germany. You can also purchase a warranty extension by one or two years for about 120 and 250 Euros (~$133 and $276) respectively.
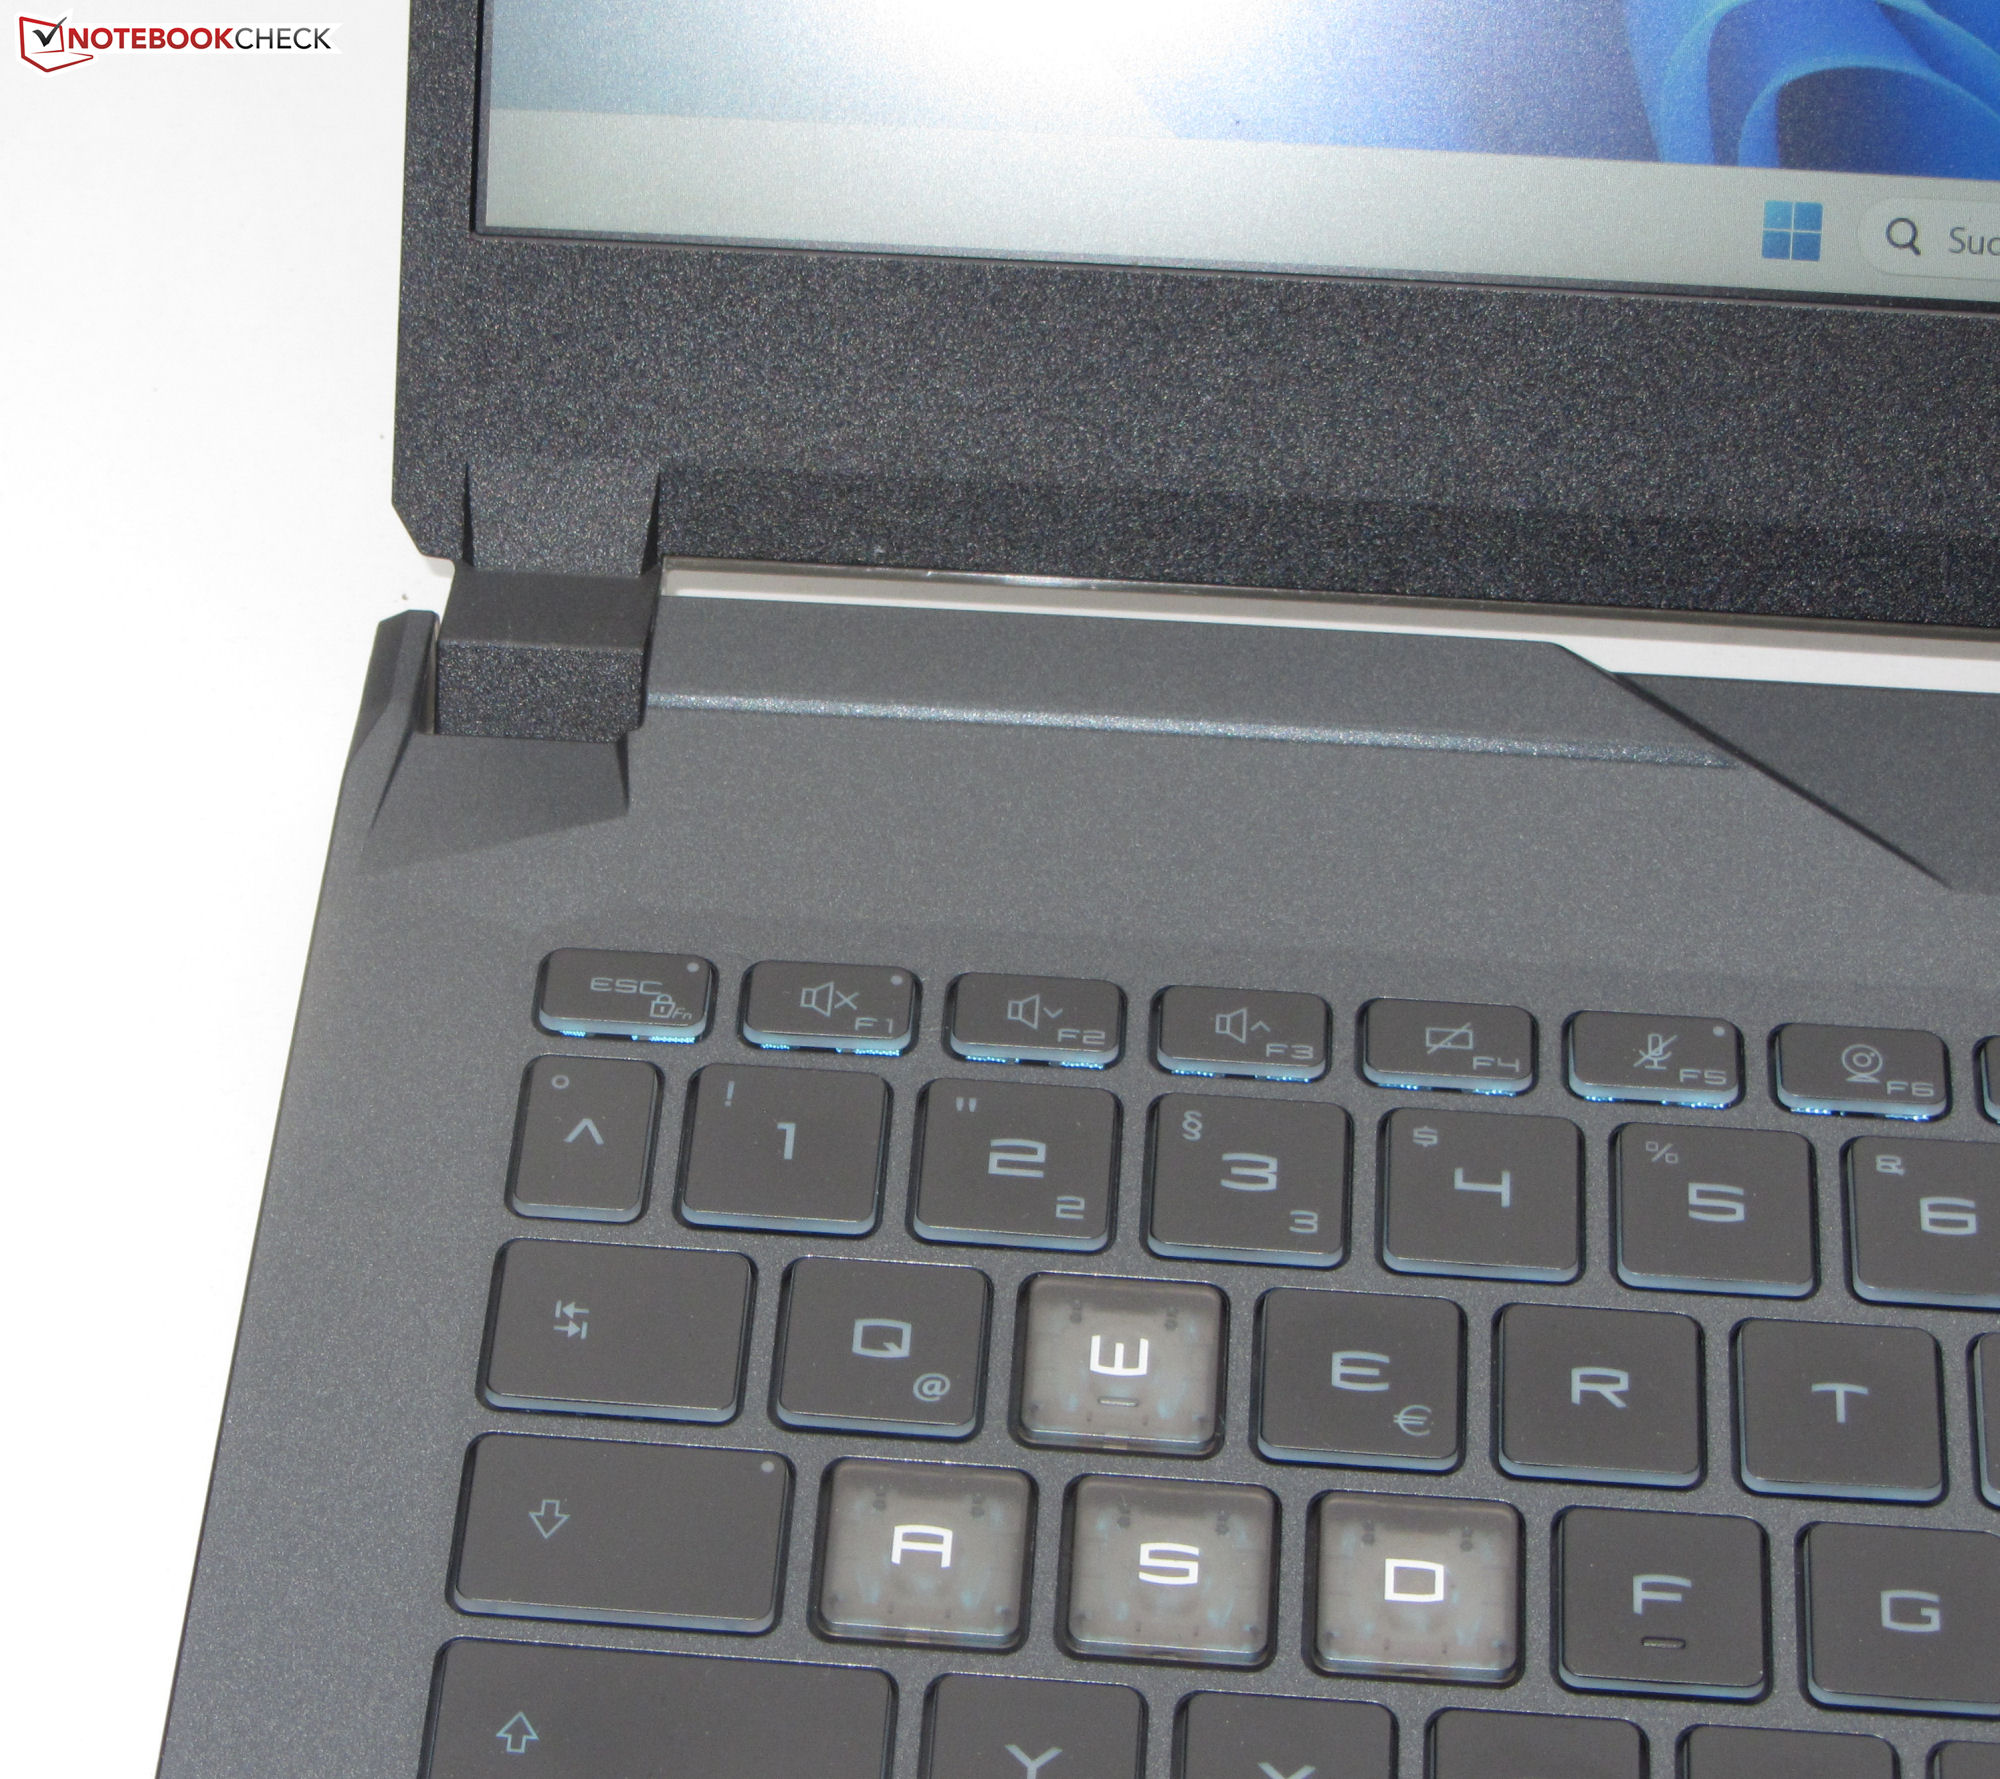
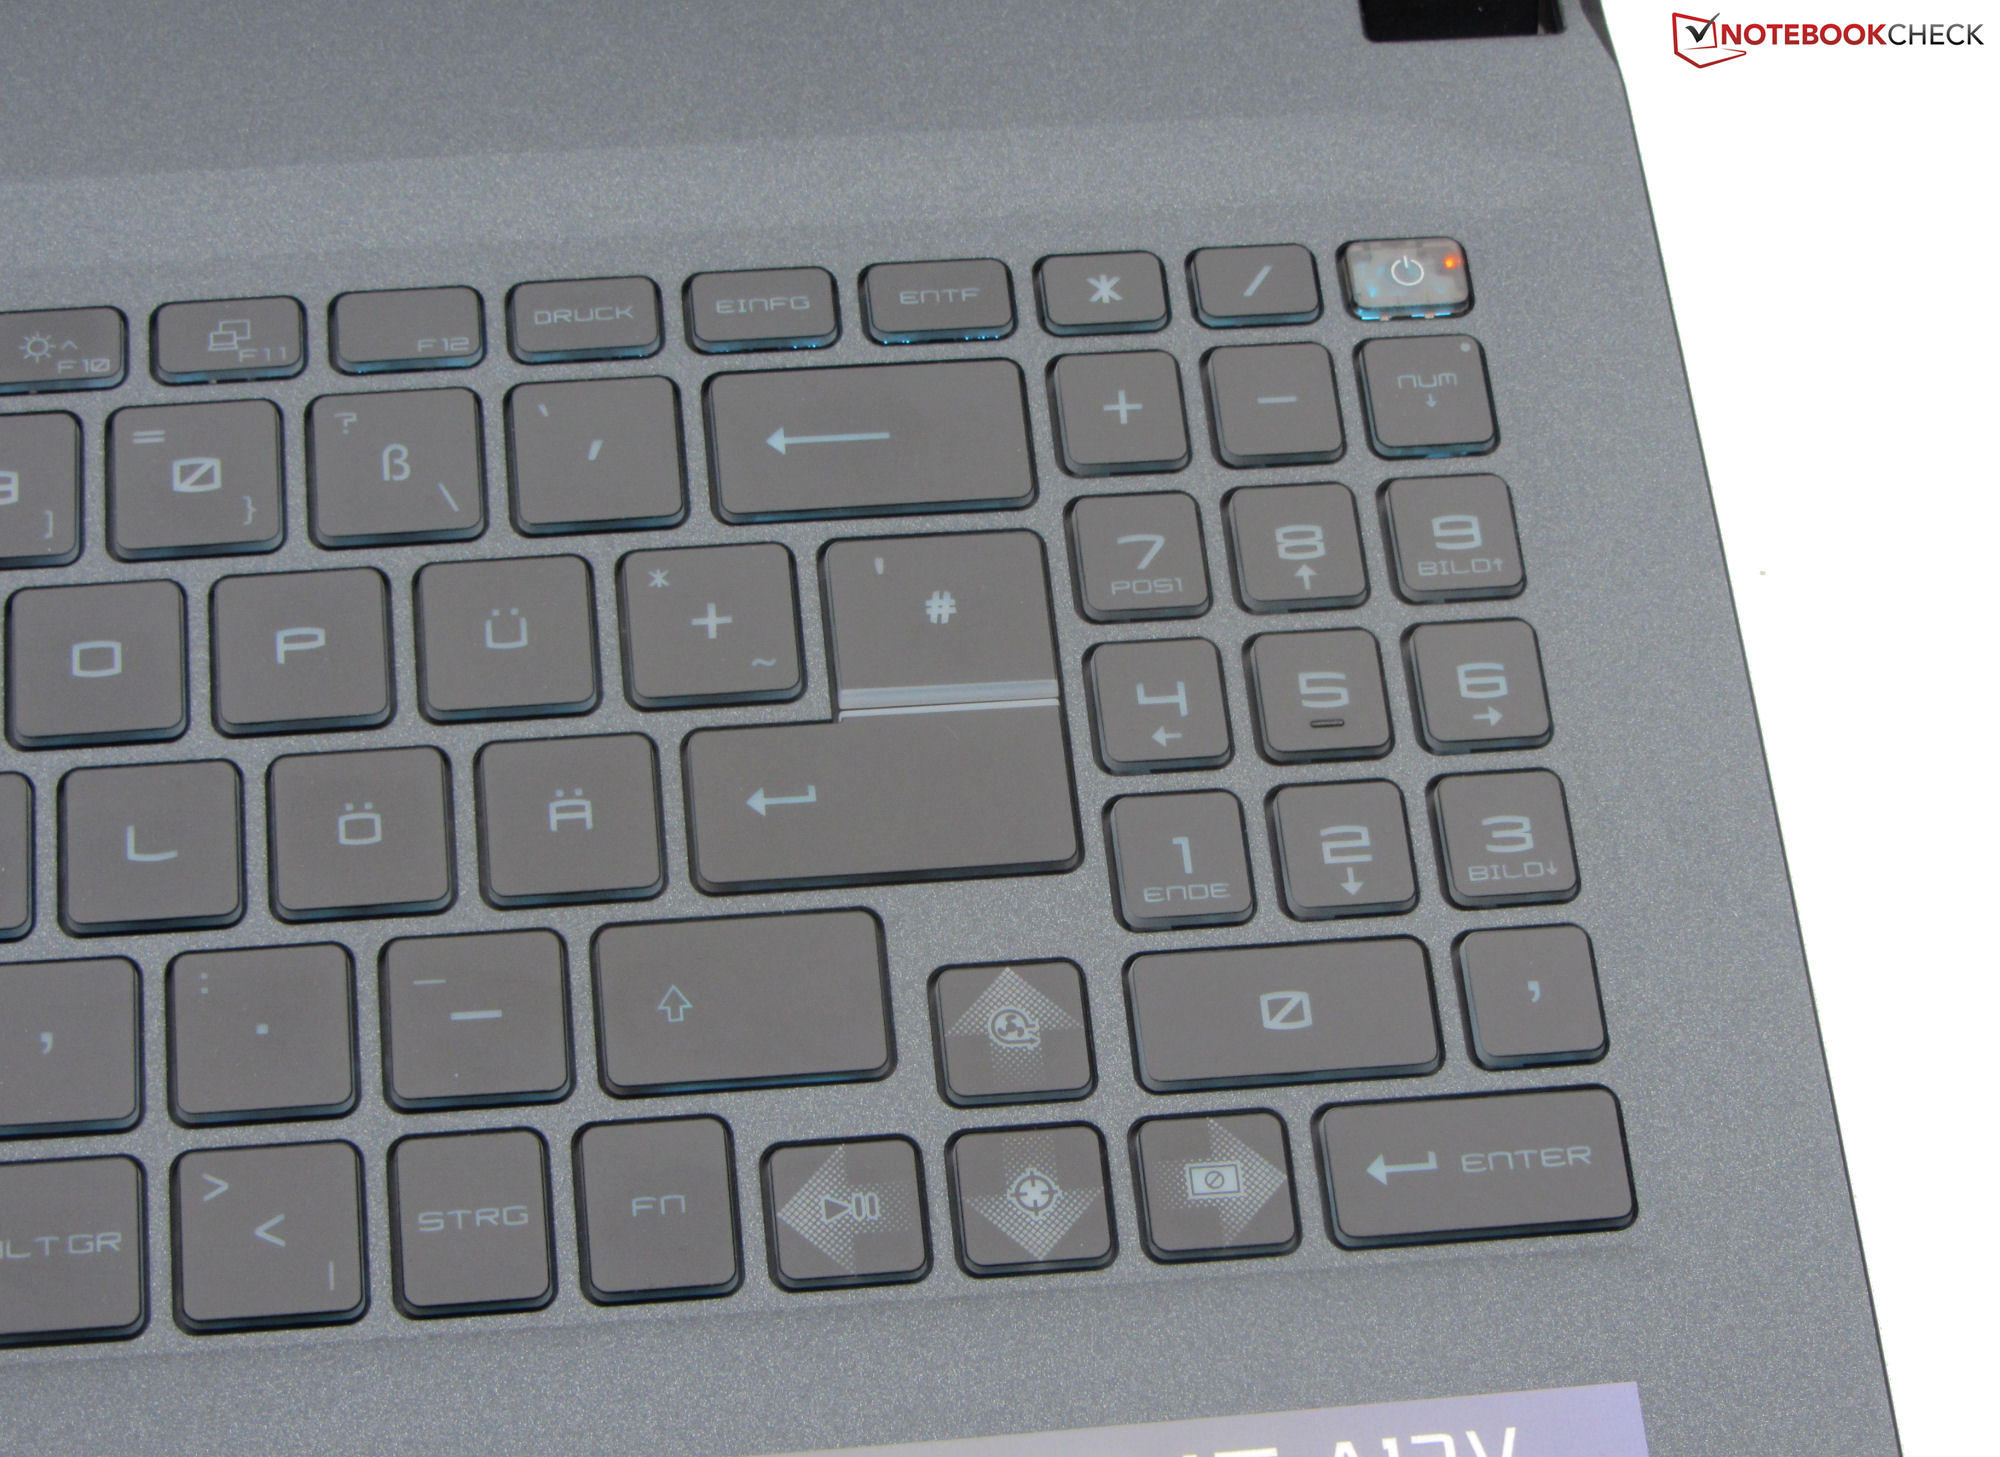
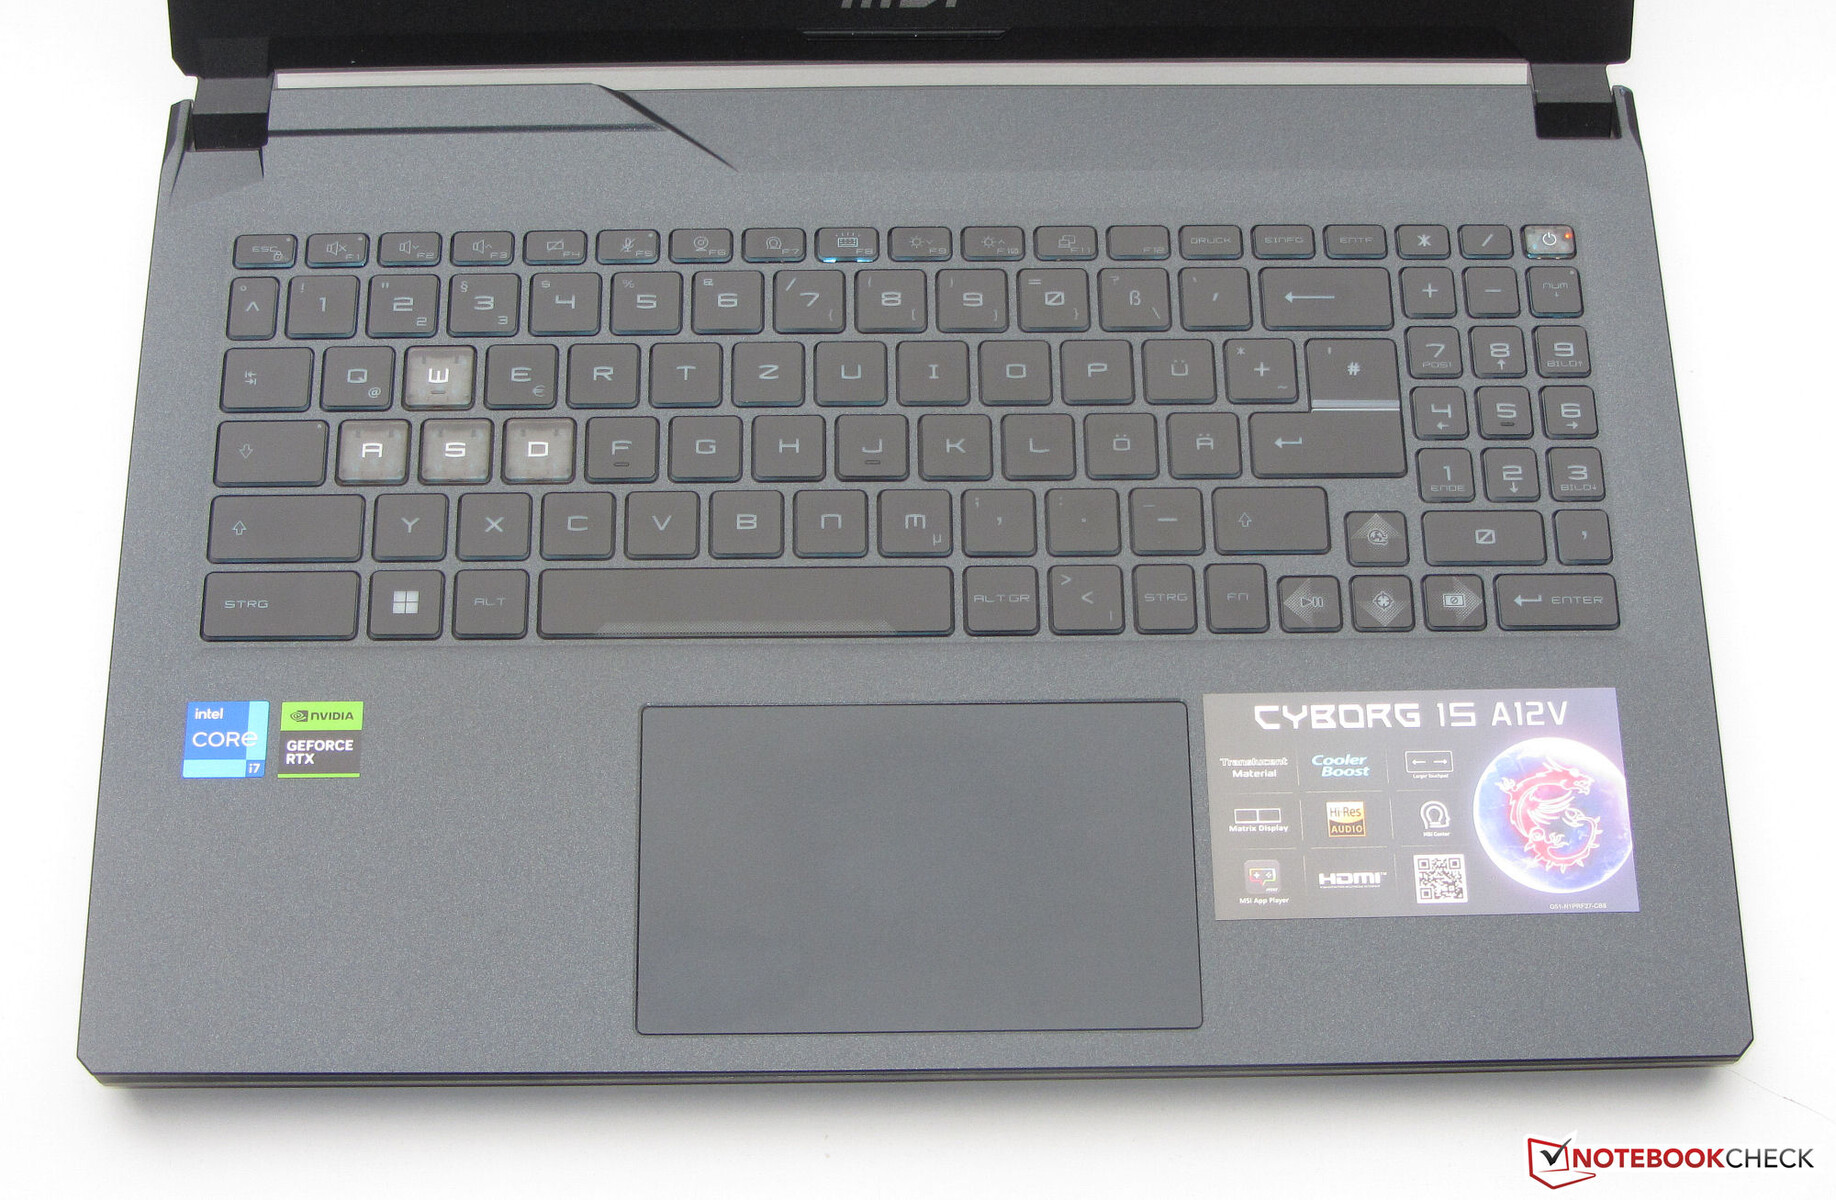
Input Devices - The Cyborg distinguishes the WASD keys for gaming
Keyboard
The flat and smooth keys of the illuminated chiclet keyboard offer a short stroke and clear pressure point. The key resistance is decent. The keyboard has some slight give while typing, but this does not turn out to be annoying. As typical for MSI devices, the "Fn" key is not placed at the same position as usual in other laptop keyboards. The single-color keyboard illumination offers three steps of brightness and is controlled via a Function key. Overall, MSI delivers a keyboard that is suitable for everyday operation.
Touchpad
The smooth surface of the multitouch capable Clickpad (~12 x 7.5 cm, ~4.7 x 2.8 in) facilitates sliding of the fingers. It responds to inputs at the corners and also offers a short stroke and clear pressure point.
Display - FHD panel with low color space coverage

The 144-Hz panel in 16:9 format only offers mediocre response times. On the other hand, the fact that it doesn't show PWM flickering at any brightness level is a positive point. The brightness and contrast of the matte 15.6-inch FHD display miss the corresponding targets of >1,000:1 and 300 cd/m² respectively, even though the contrast comes close.
The competitors do a better job here, and the rest of the devices in our comparison field have brighter displays.
| |||||||||||||||||||||||||
Brightness Distribution: 89 %
Center on Battery: 250 cd/m²
Contrast: 988:1 (Black: 0.25 cd/m²)
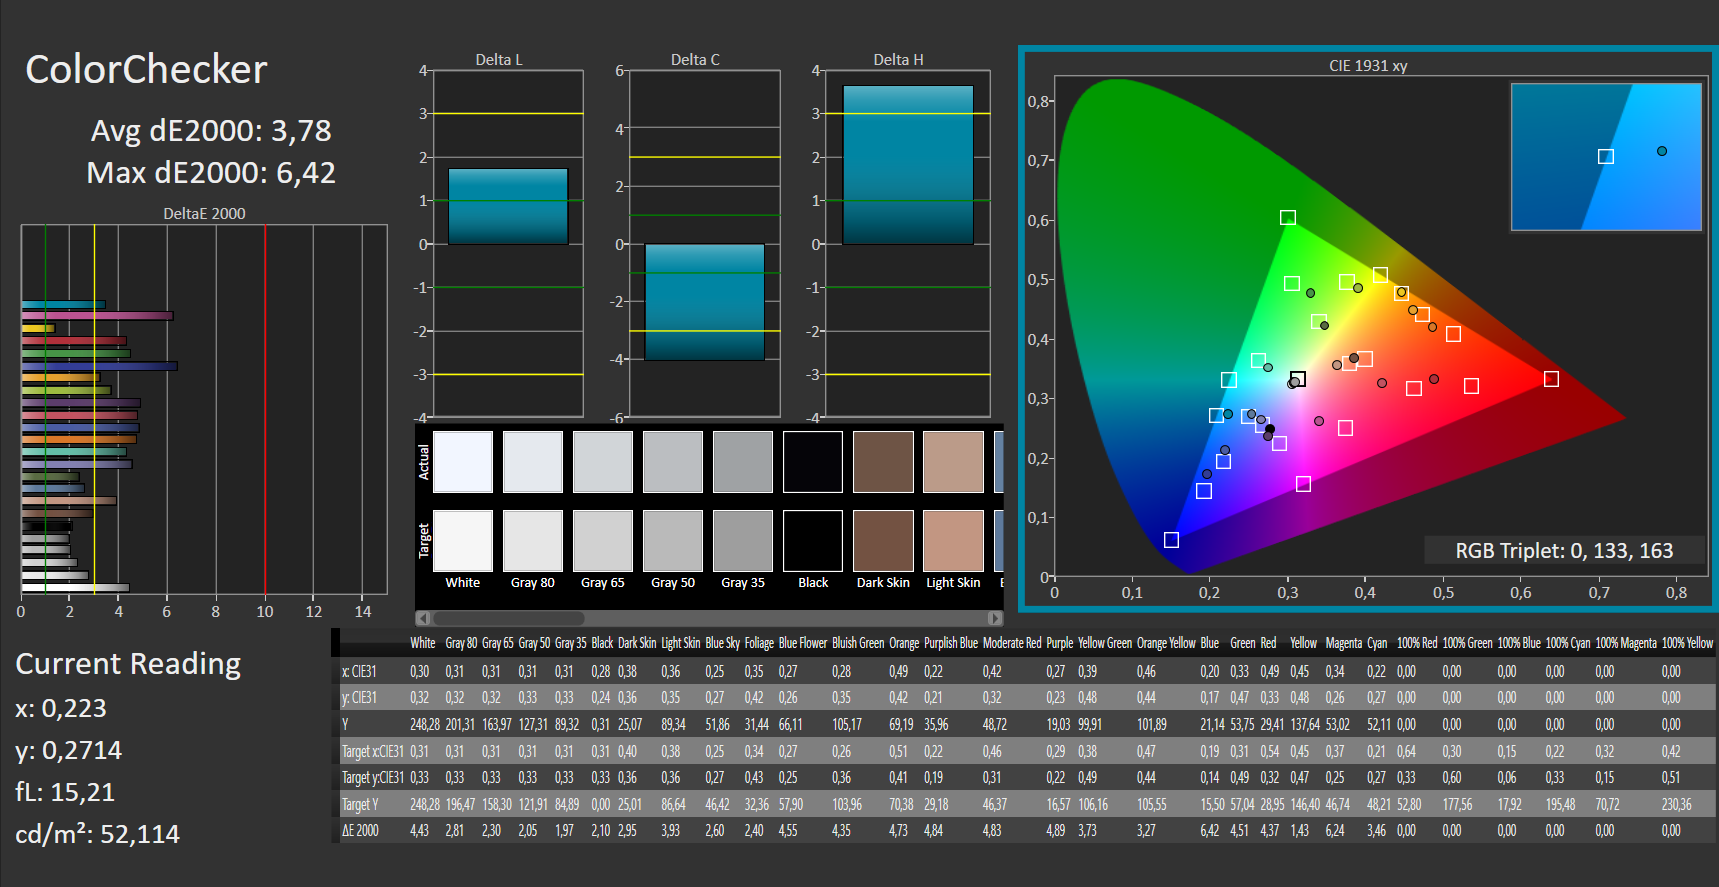
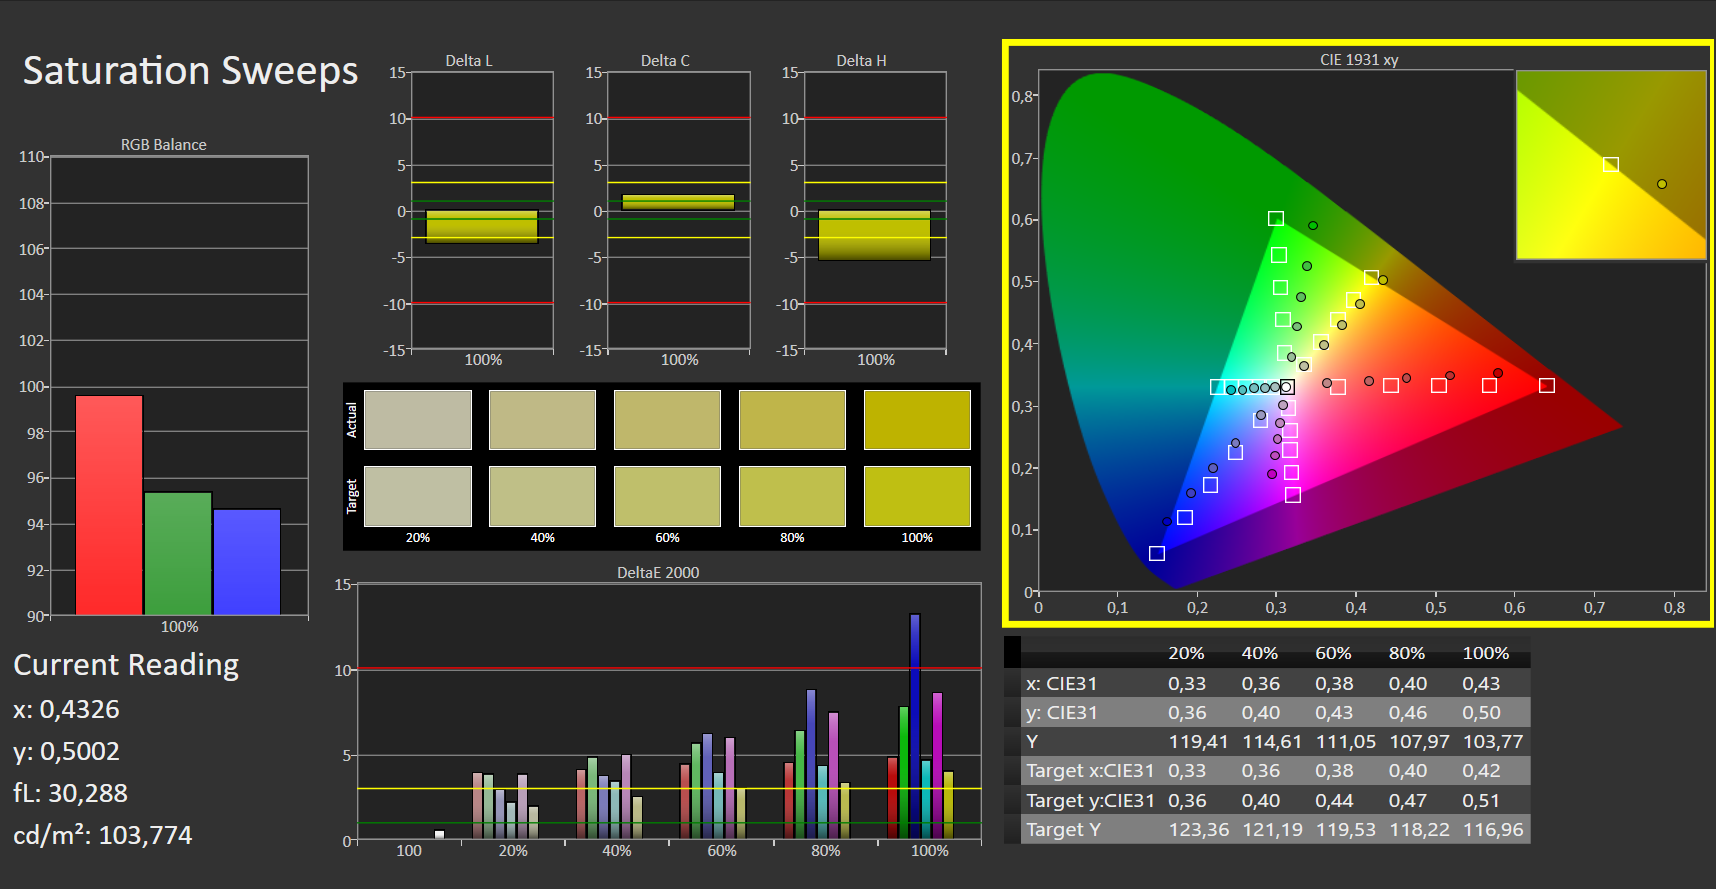
ΔE ColorChecker Calman: 3.78 | ∀{0.5-29.43 Ø4.72}
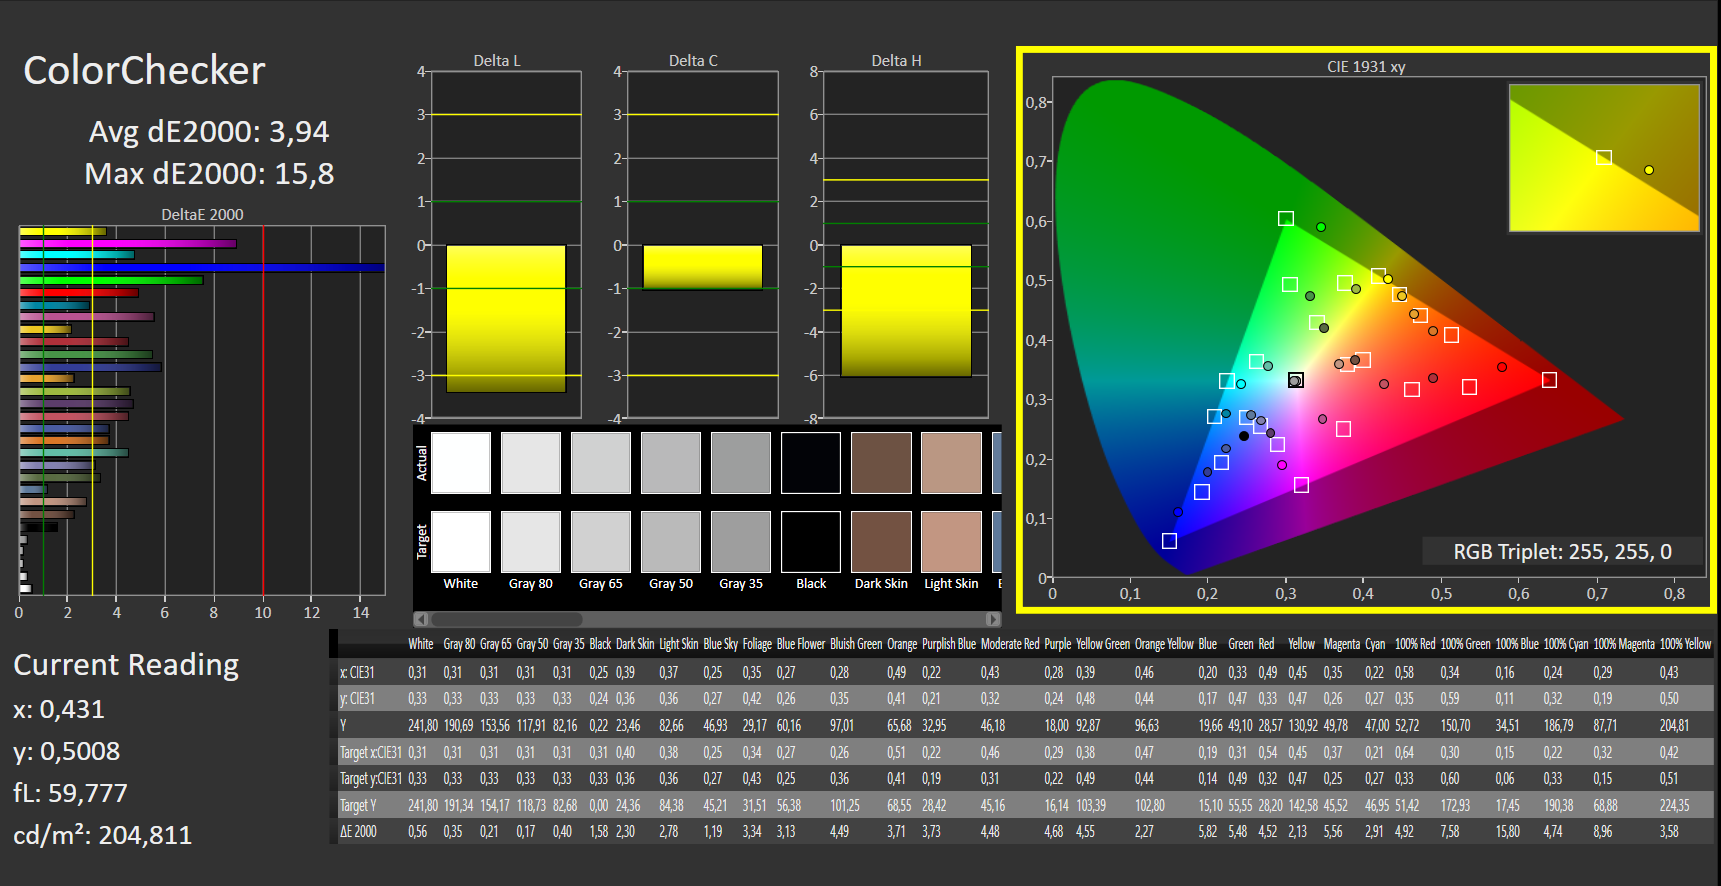
calibrated: 3.94
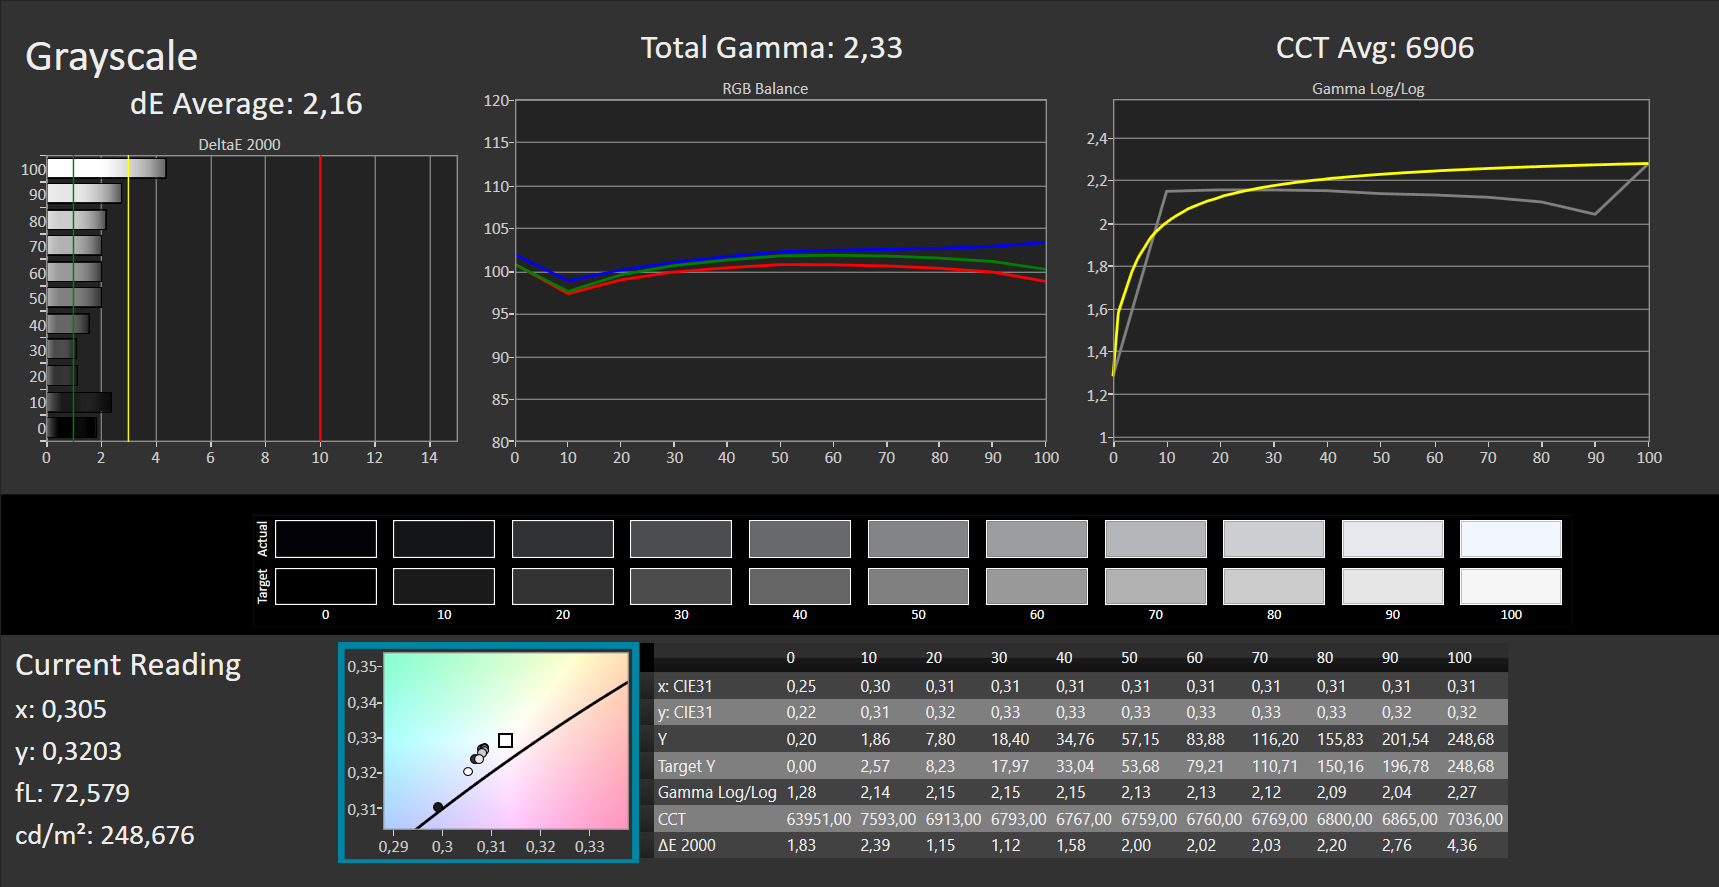
ΔE Greyscale Calman: 2.16 | ∀{0.09-98 Ø4.97}
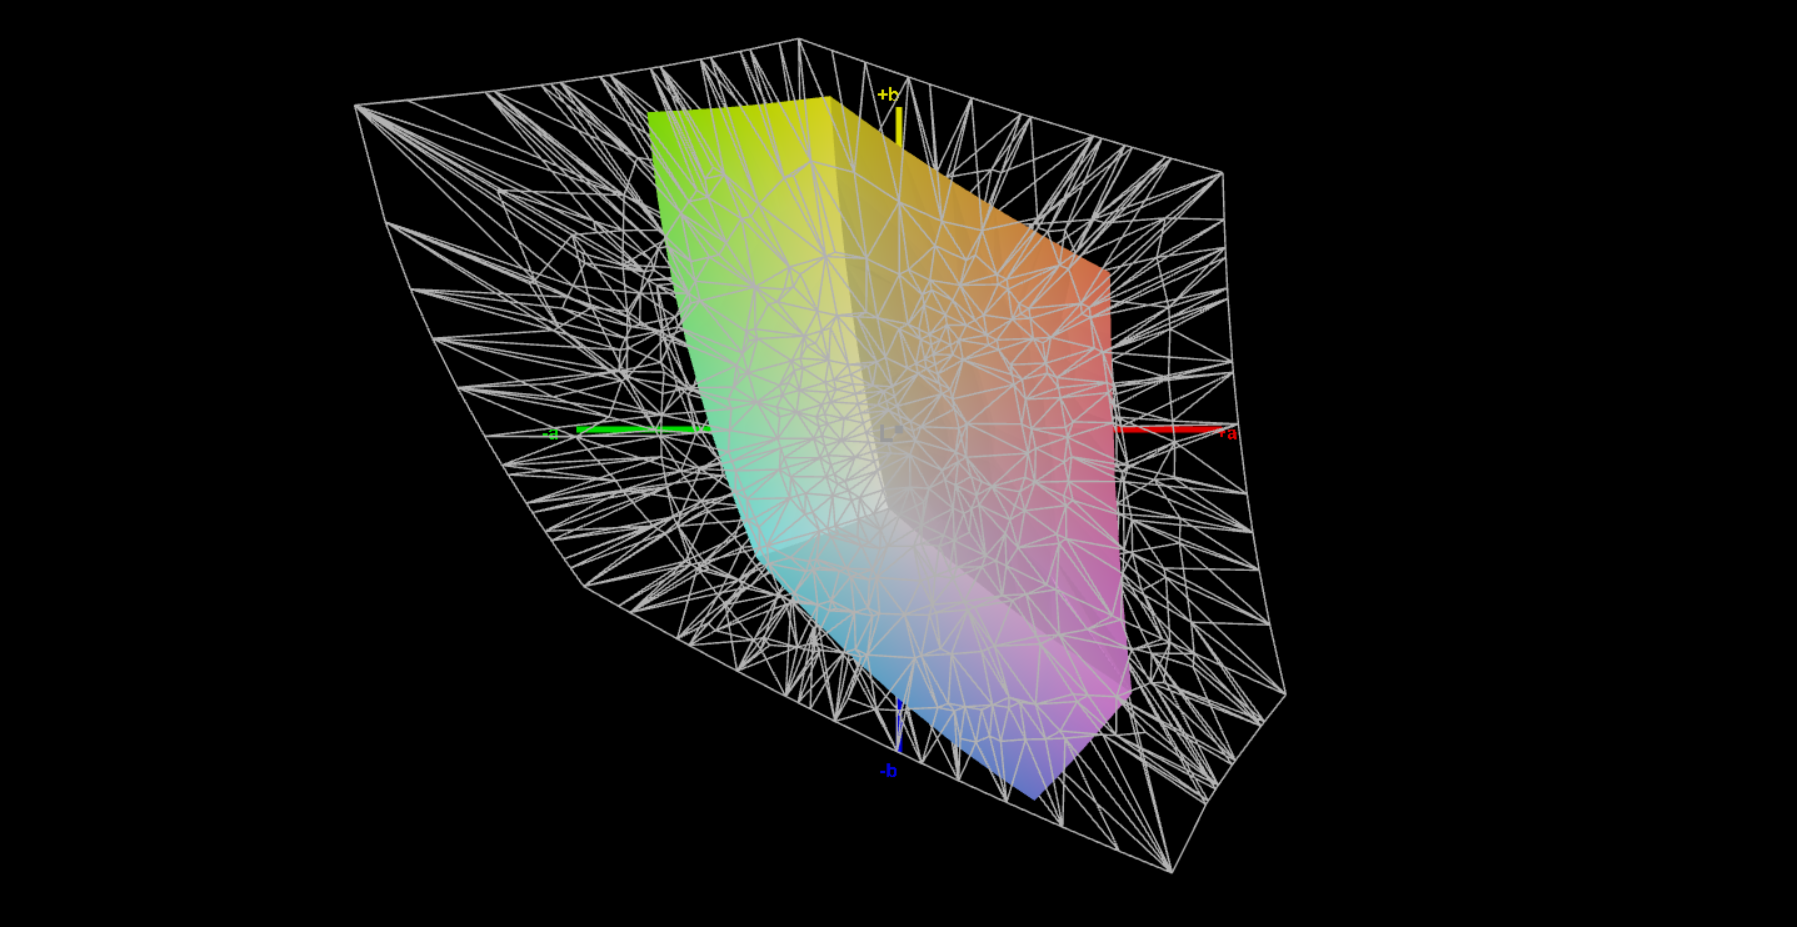
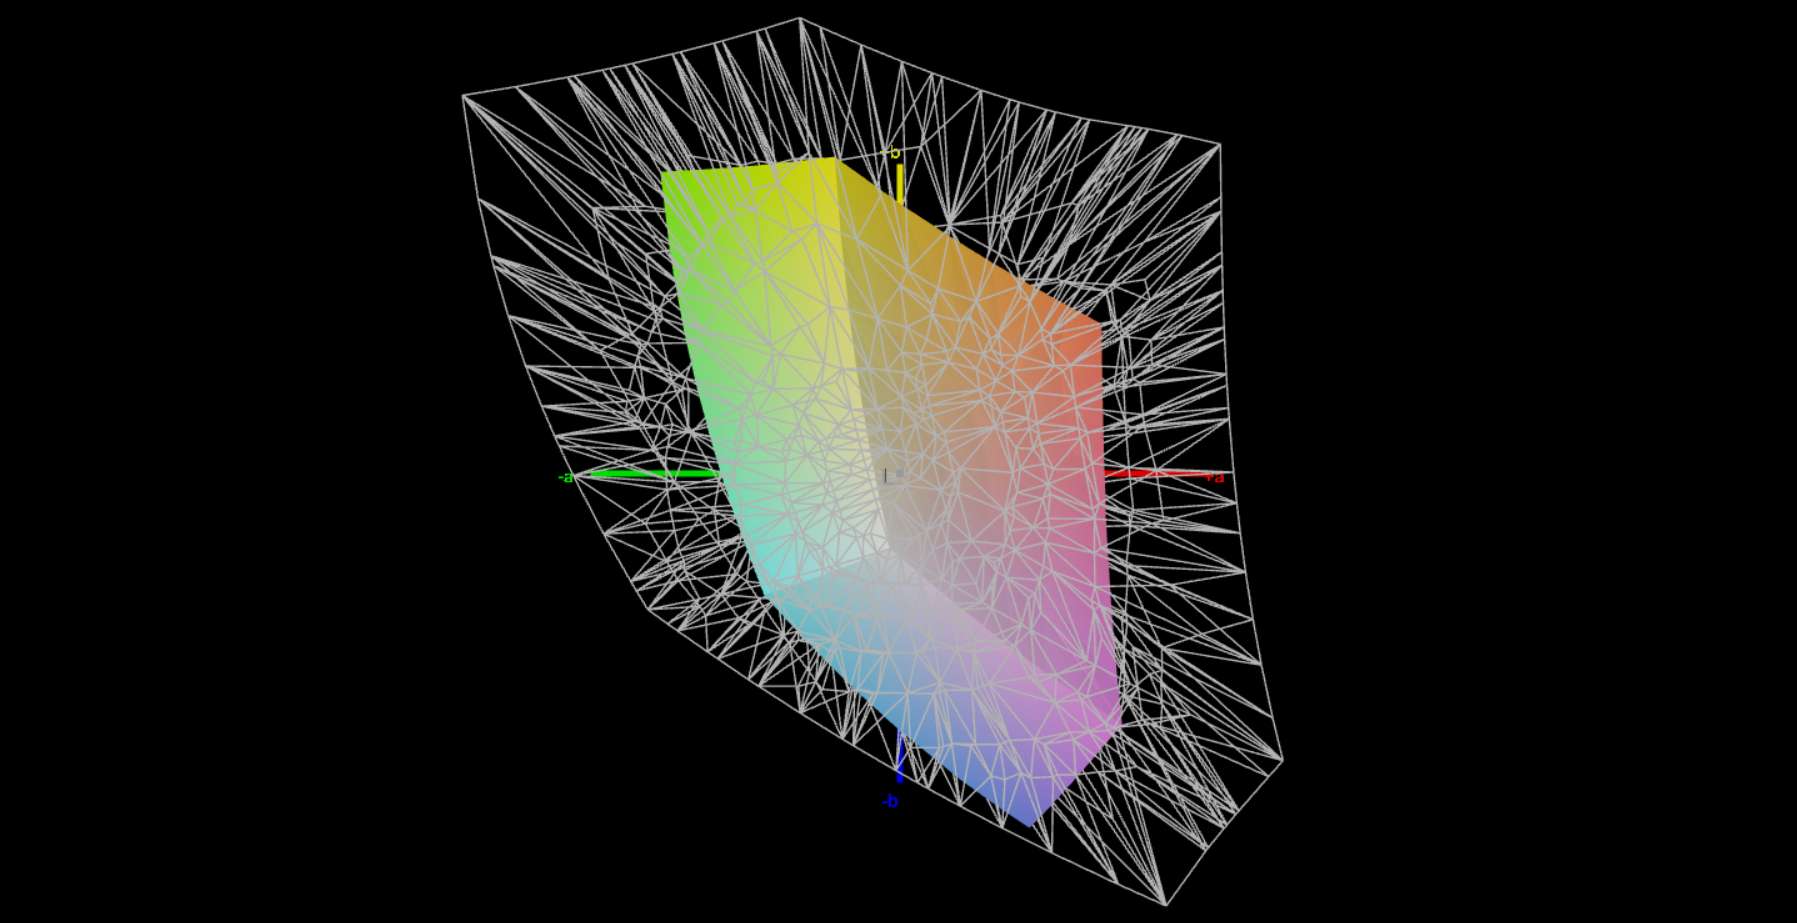
43.7% AdobeRGB 1998 (Argyll 3D)
62.6% sRGB (Argyll 3D)
42.3% Display P3 (Argyll 3D)
Gamma: 2.33
CCT: 6906 K
| MSI Cyborg 15 A12VF AU Optronics B156HAN15.1, IPS, 1920x1080, 15.6" | Asus TUF Gaming A16 FA617 NE160WUM-NX2 (BOE0B33), IPS-Level, 1920x1200, 16" | Aorus 15 XE5 Chi Mei N156KME-GNA, IPS, 2560x1440, 15.6" | Schenker XMG Fusion 15 (Mid 22) BOE CQ NE156QHM-NY2, IPS, 2560x1440, 15.6" | MSI Katana 15 B12VEK AUOAF90 (B156HAN08.4), IPS, 1920x1080, 15.6" | HP Victus 15 fa0020nr CMN1521, IPS, 1920x1080, 15.6" | |
|---|---|---|---|---|---|---|
| Display | 61% | 93% | 56% | -10% | -1% | |
| Display P3 Coverage (%) | 42.3 | 69.4 64% | 95.2 125% | 67.3 59% | 38.1 -10% | 42 -1% |
| sRGB Coverage (%) | 62.6 | 97.8 56% | 99.9 60% | 96.7 54% | 56.8 -9% | 62.7 0% |
| AdobeRGB 1998 Coverage (%) | 43.7 | 70.9 62% | 84.5 93% | 68.2 56% | 39.3 -10% | 43.4 -1% |
| Response Times | 26% | 37% | 49% | -84% | -77% | |
| Response Time Grey 50% / Grey 80% * (ms) | 22 ? | 17 ? 23% | 14.4 ? 35% | 11.6 ? 47% | 38.8 ? -76% | 35.2 ? -60% |
| Response Time Black / White * (ms) | 14 ? | 10.1 ? 28% | 8.6 ? 39% | 7 ? 50% | 26.8 ? -91% | 27.2 ? -94% |
| PWM Frequency (Hz) | ||||||
| Screen | 31% | 1% | -8% | -28% | -13% | |
| Brightness middle (cd/m²) | 247 | 308 25% | 336 36% | 326 32% | 261 6% | 284.3 15% |
| Brightness (cd/m²) | 234 | 293 25% | 316 35% | 303 29% | 258 10% | 262 12% |
| Brightness Distribution (%) | 89 | 90 1% | 89 0% | 89 0% | 92 3% | 87 -2% |
| Black Level * (cd/m²) | 0.25 | 0.23 8% | 0.34 -36% | 0.33 -32% | 0.19 24% | 0.17 32% |
| Contrast (:1) | 988 | 1339 36% | 988 0% | 988 0% | 1374 39% | 1672 69% |
| Colorchecker dE 2000 * | 3.78 | 1.47 61% | 3.36 11% | 2.73 28% | 5.57 -47% | 4.52 -20% |
| Colorchecker dE 2000 max. * | 6.42 | 2.98 54% | 6.67 -4% | 9.54 -49% | 20.6 -221% | 18.67 -191% |
| Colorchecker dE 2000 calibrated * | 3.94 | 1.02 74% | 0.74 81% | 1.36 65% | 4.63 -18% | 1.55 61% |
| Greyscale dE 2000 * | 2.16 | 2.2 -2% | 4.7 -118% | 5.2 -141% | 3.19 -48% | 4.1 -90% |
| Gamma | 2.33 94% | 2.228 99% | 2.244 98% | 2.074 106% | 2.45 90% | 2.3 96% |
| CCT | 6906 94% | 6228 104% | 6897 94% | 6911 94% | 6146 106% | 6529 100% |
| Total Average (Program / Settings) | 39% /
37% | 44% /
26% | 32% /
14% | -41% /
-32% | -30% /
-19% |
* ... smaller is better
In the state of delivery, the color reproduction of the display is very decent, with the deviation of 3.8 just barely missing the target of DeltaE < 3. While a calibration increases the color deviation, it also ensures a more balanced grayscale.
The panel is unable to cover the AdobeRGB (44%), sRGB (63%), and DCI-P3 (42%) color spaces. It is therefore not suited for application scenarios that depend on color accuracy. Competitors such as the Asus TUF Gaming A16 FA617 and XMG Fusion 15 are more suitable here, and their displays are able to cover the sRGB color space.


Display Response Times
| ↔ Response Time Black to White | ||
|---|---|---|
| 14 ms ... rise ↗ and fall ↘ combined | ↗ 7 ms rise |  |
| ↘ 7 ms fall | ||
| The screen shows good response rates in our tests, but may be too slow for competitive gamers. In comparison, all tested devices range from 0.1 (minimum) to 240 (maximum) ms. » 34 % of all devices are better. This means that the measured response time is better than the average of all tested devices (19.8 ms). | ||
| ↔ Response Time 50% Grey to 80% Grey | ||
| 22 ms ... rise ↗ and fall ↘ combined | ↗ 9 ms rise |  |
| ↘ 13 ms fall | ||
| The screen shows good response rates in our tests, but may be too slow for competitive gamers. In comparison, all tested devices range from 0.165 (minimum) to 636 (maximum) ms. » 34 % of all devices are better. This means that the measured response time is better than the average of all tested devices (31 ms). | ||
Screen Flickering / PWM (Pulse-Width Modulation)
| Screen flickering / PWM not detected |  | ||
In comparison: 52 % of all tested devices do not use PWM to dim the display. If PWM was detected, an average of 7753 (minimum: 5 - maximum: 343500) Hz was measured. | |||
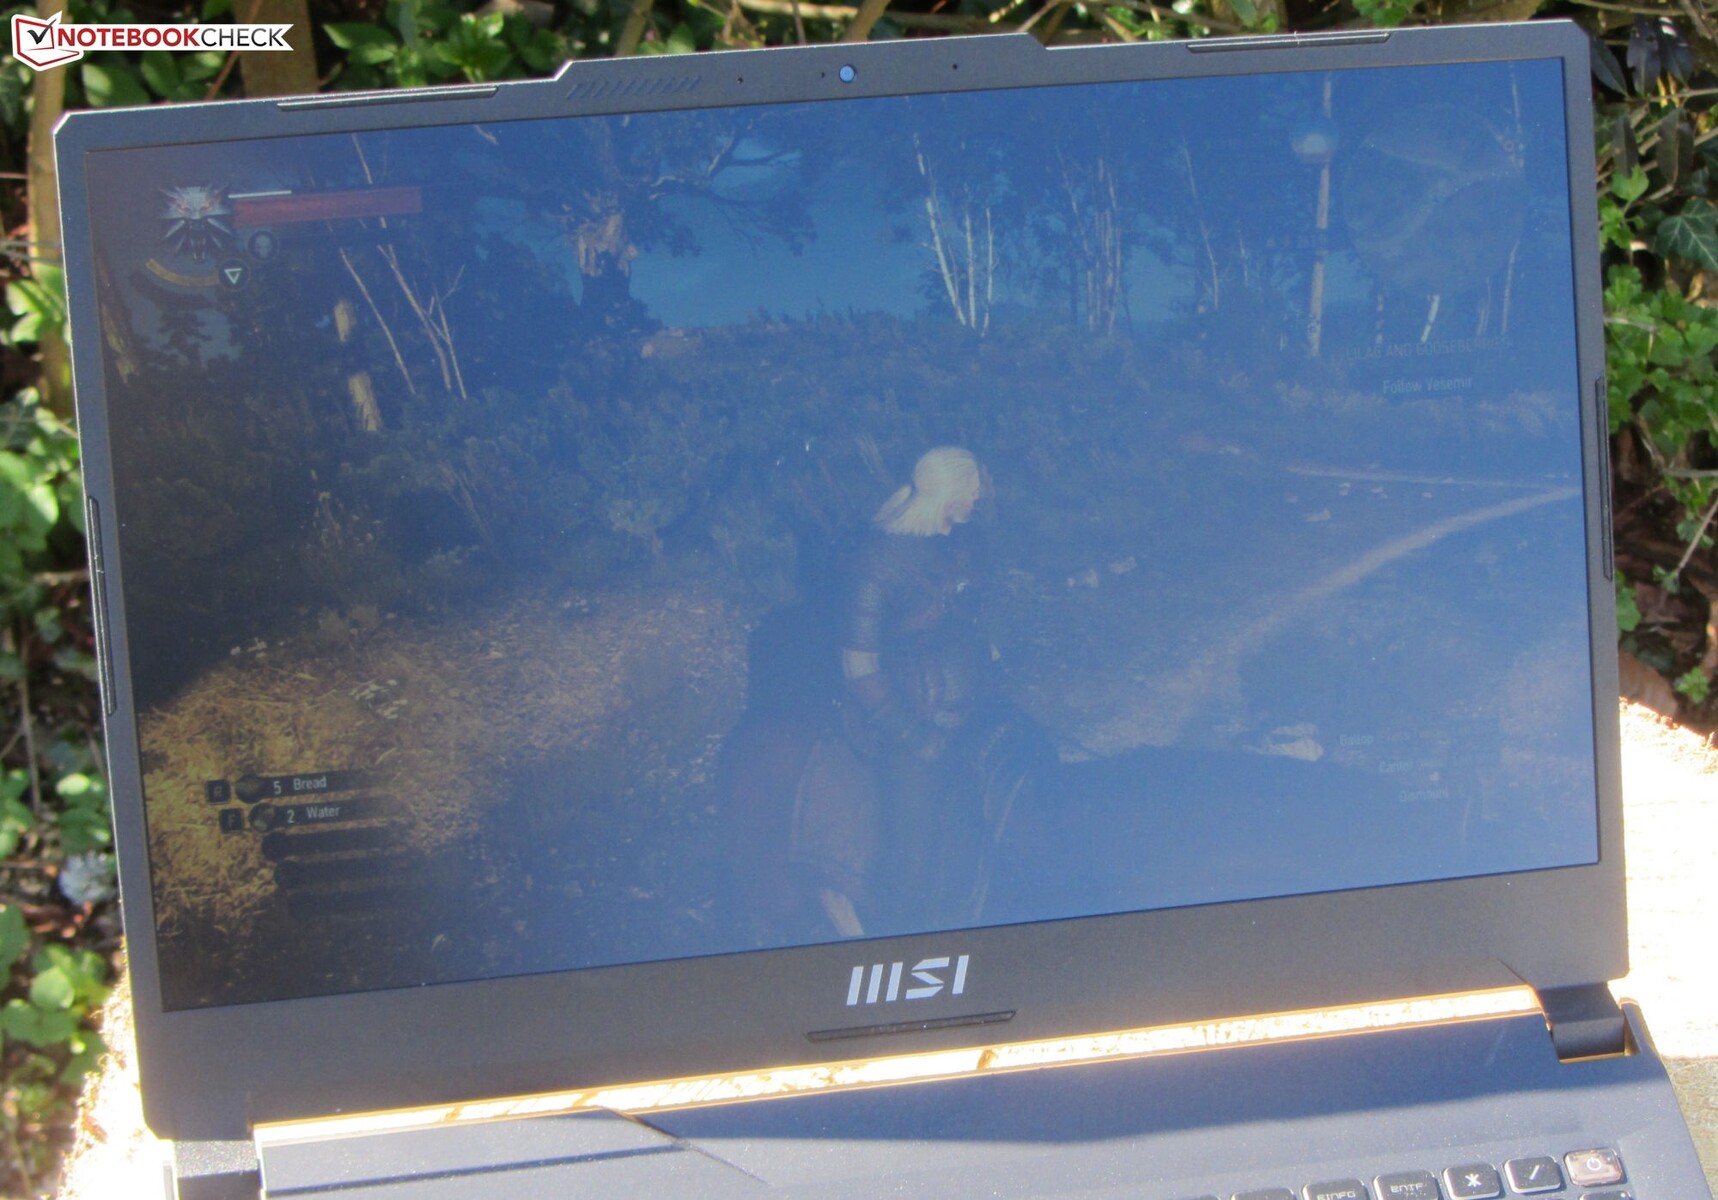
The viewing angles of the IPS panel are stable, and it can be read easily from any angle. Outdoors, the display contents can be read when the sun isn't too bright.

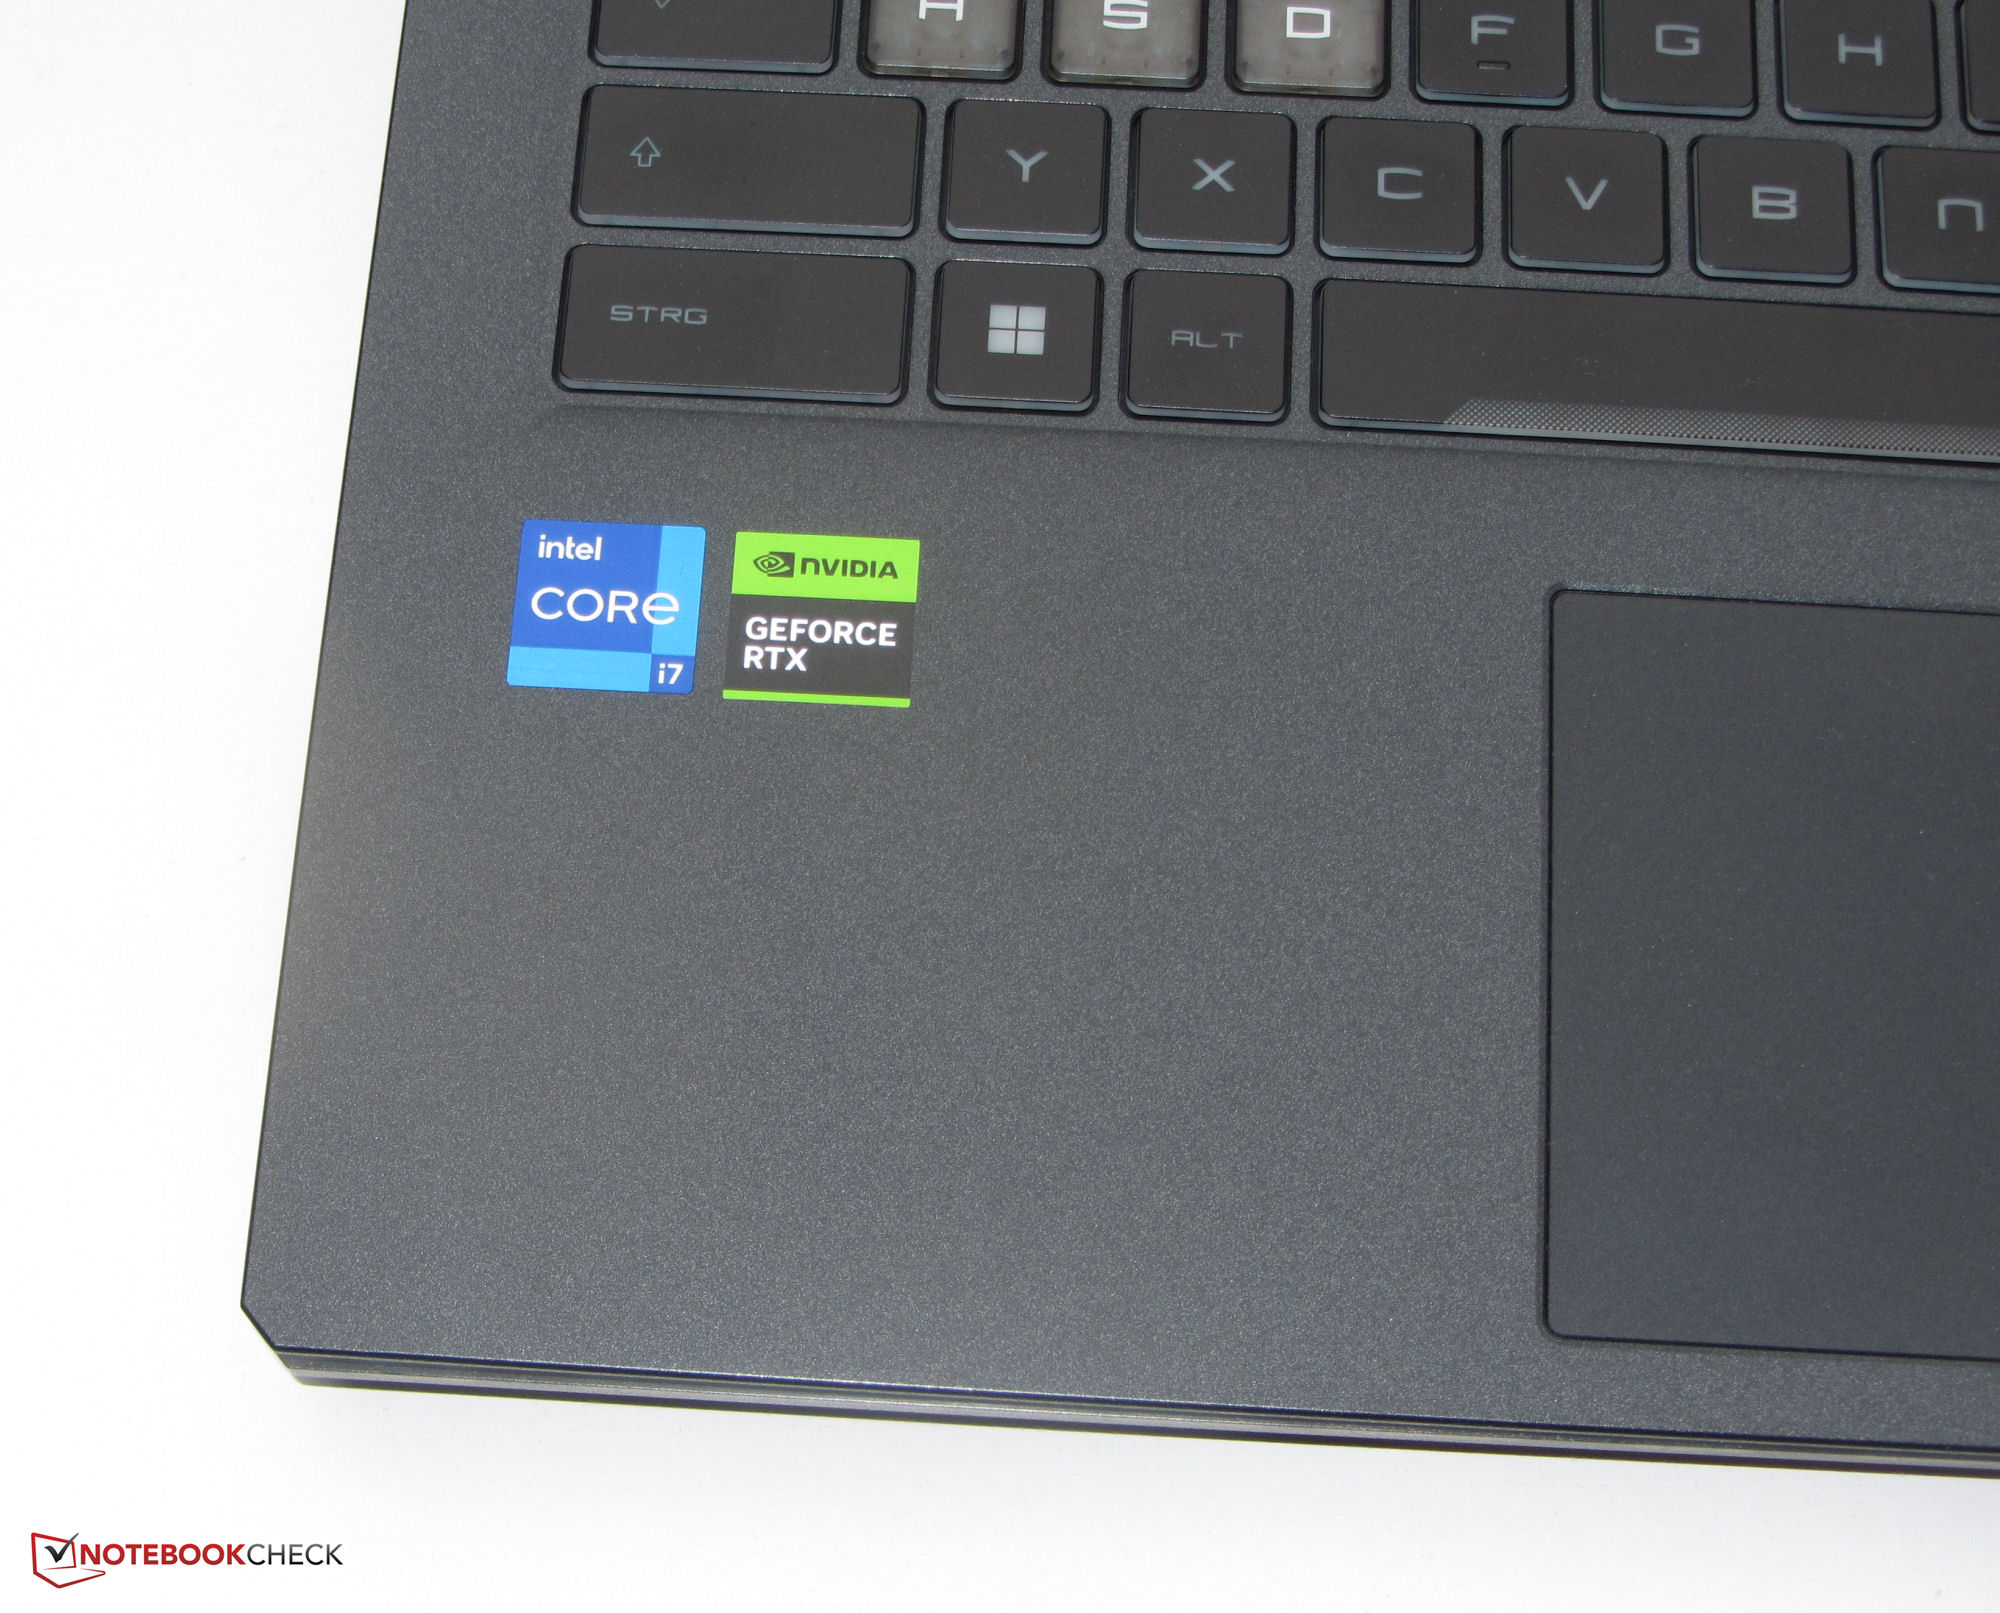
Performance - Alder Lake and Ada Lovelace on a tight leash
With the Cyborg 15 A12VF series, MSI offers mobile gaming laptops that use the GeForce RTX 4060 Laptop graphics core in a lower power configuration with a TGP of 45 watts. This is accompanied by Alder Lake processors from Intel. The price points of the A12VF models available at the time of this test range between around 1,250 and 1,800 Euros (~$1,382 - $1,989). The price of our test unit lies at the top end of this scale.
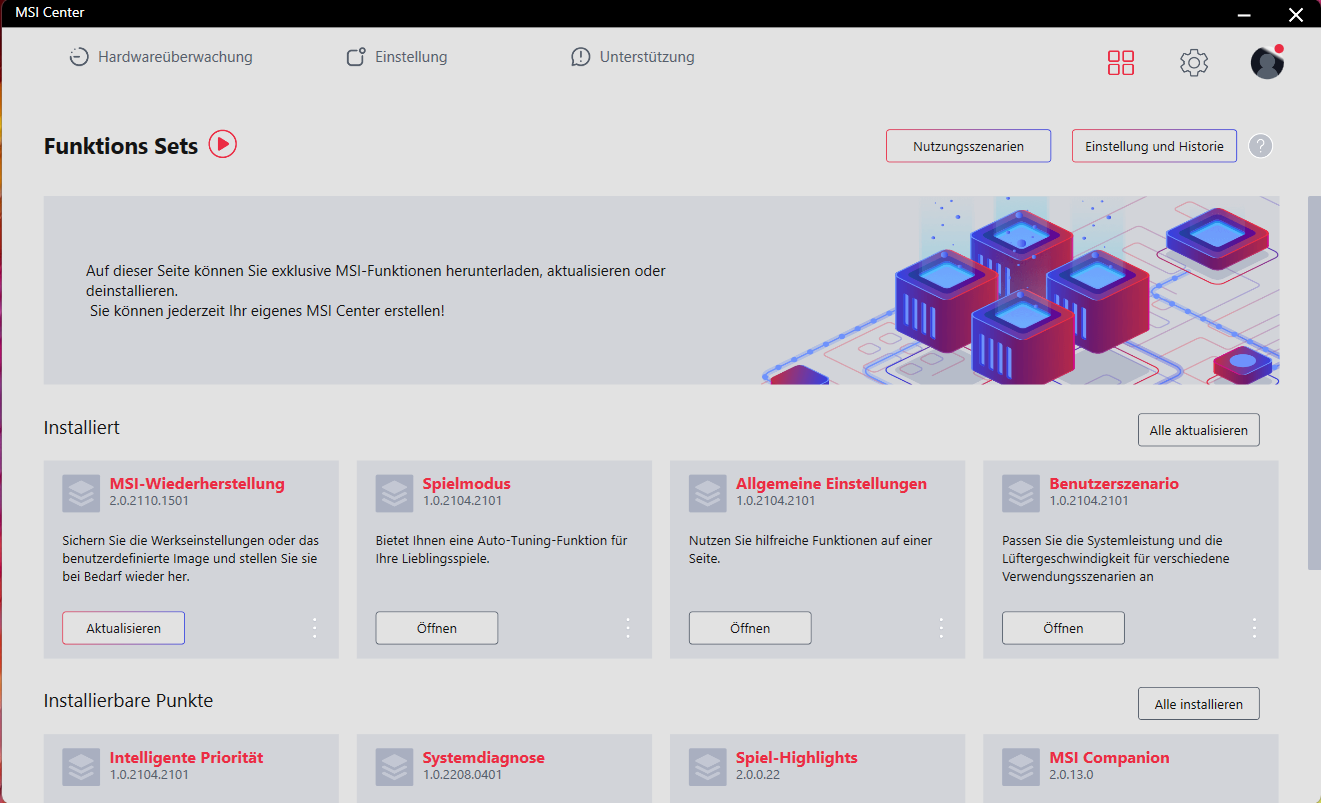
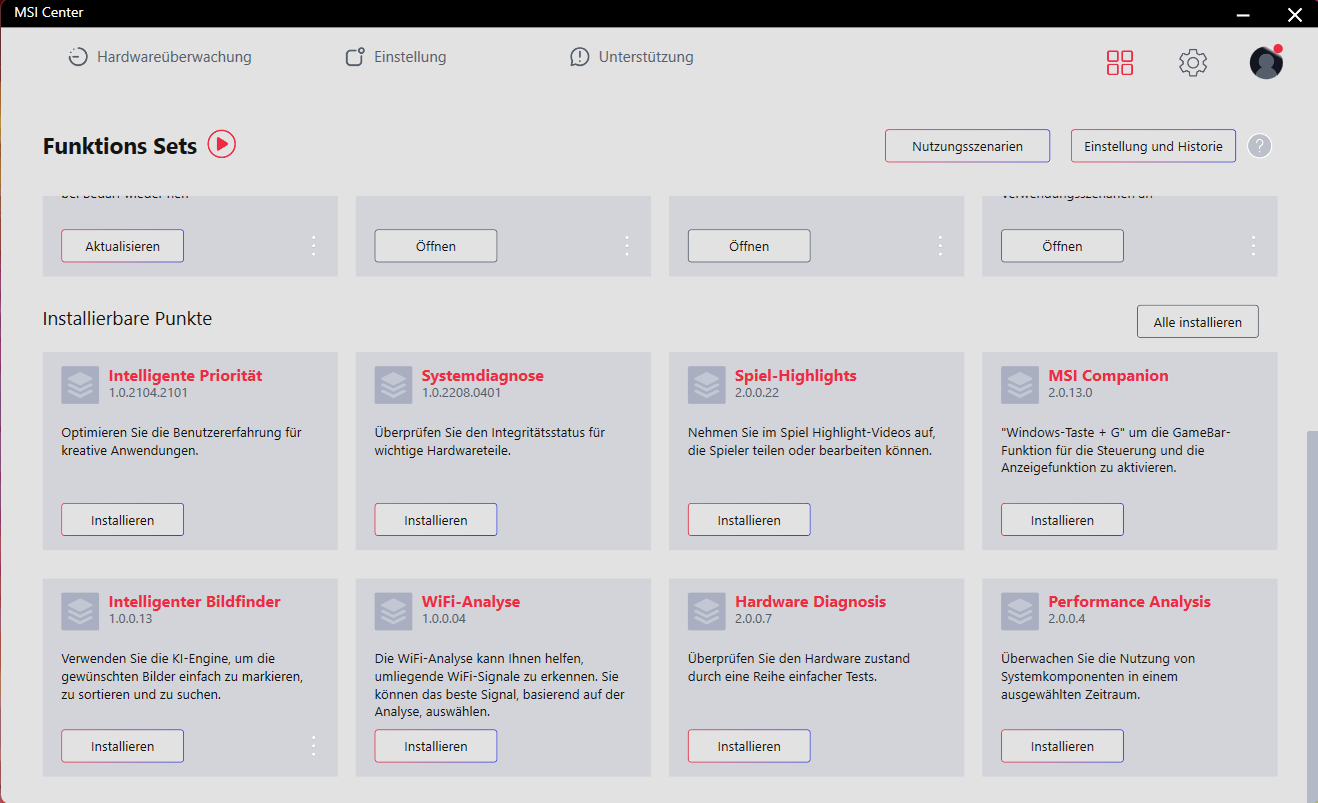
Test Conditions
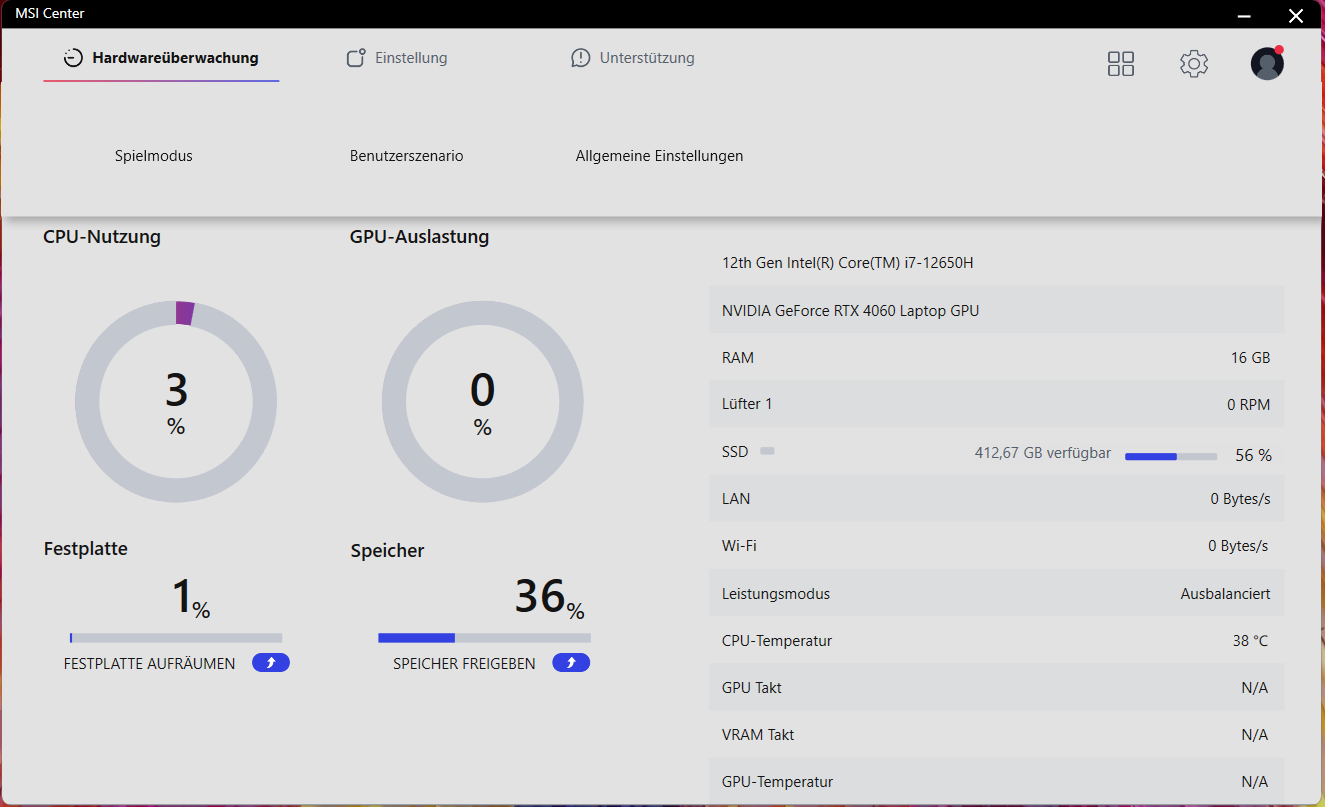
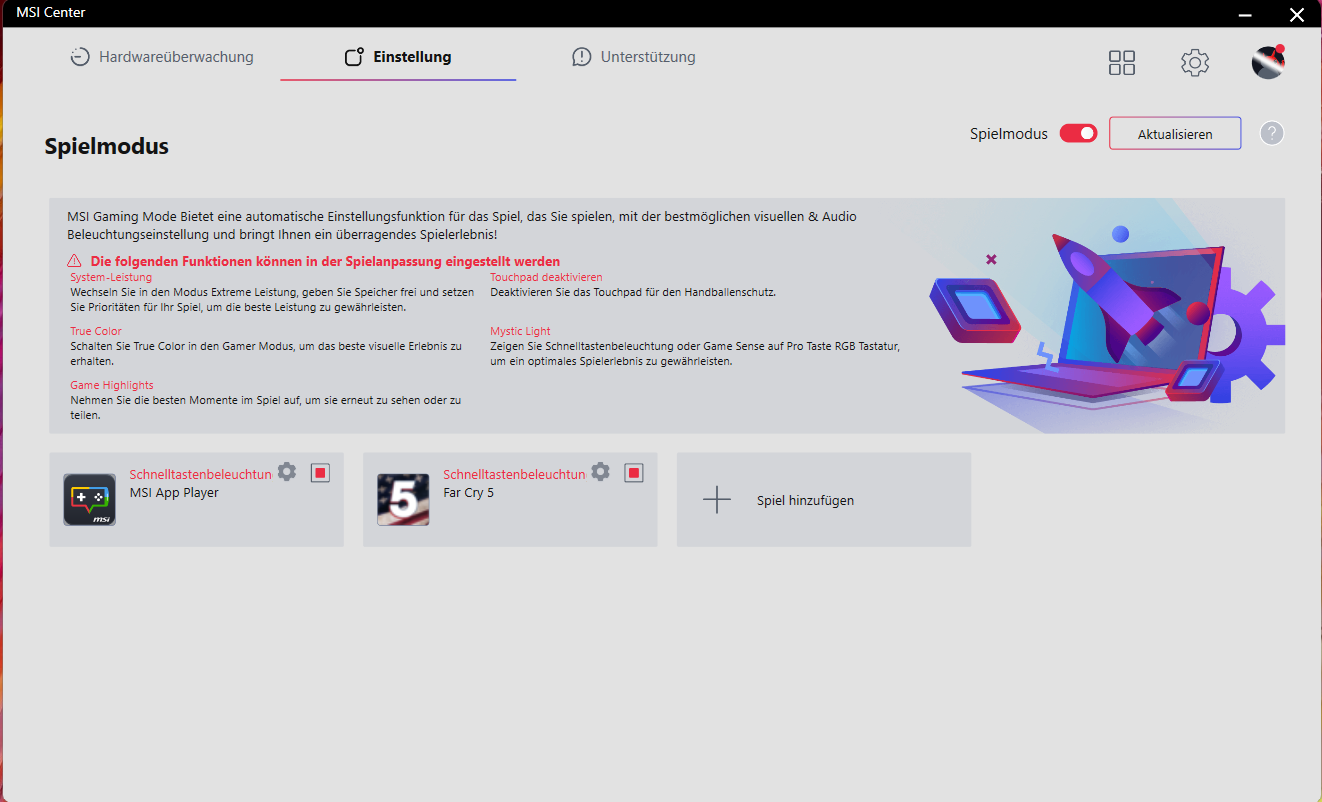
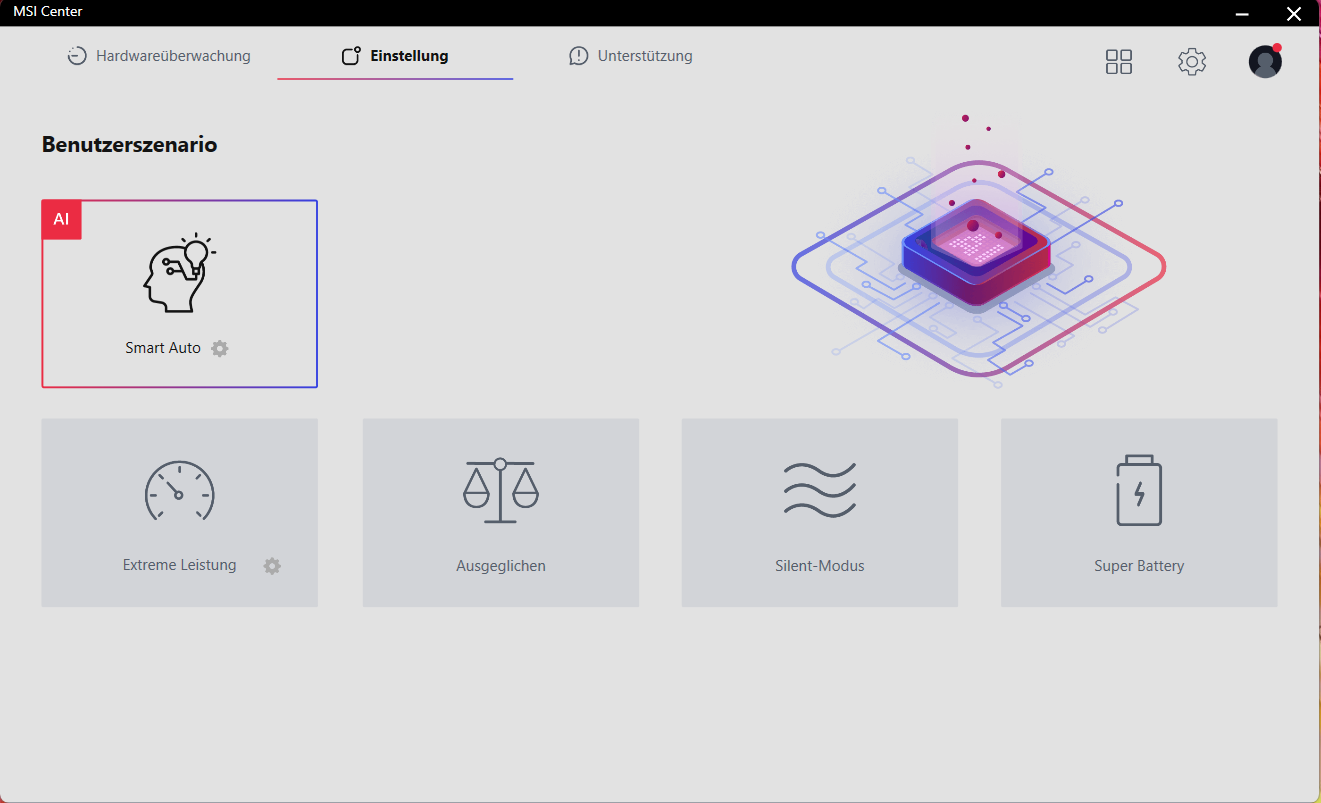
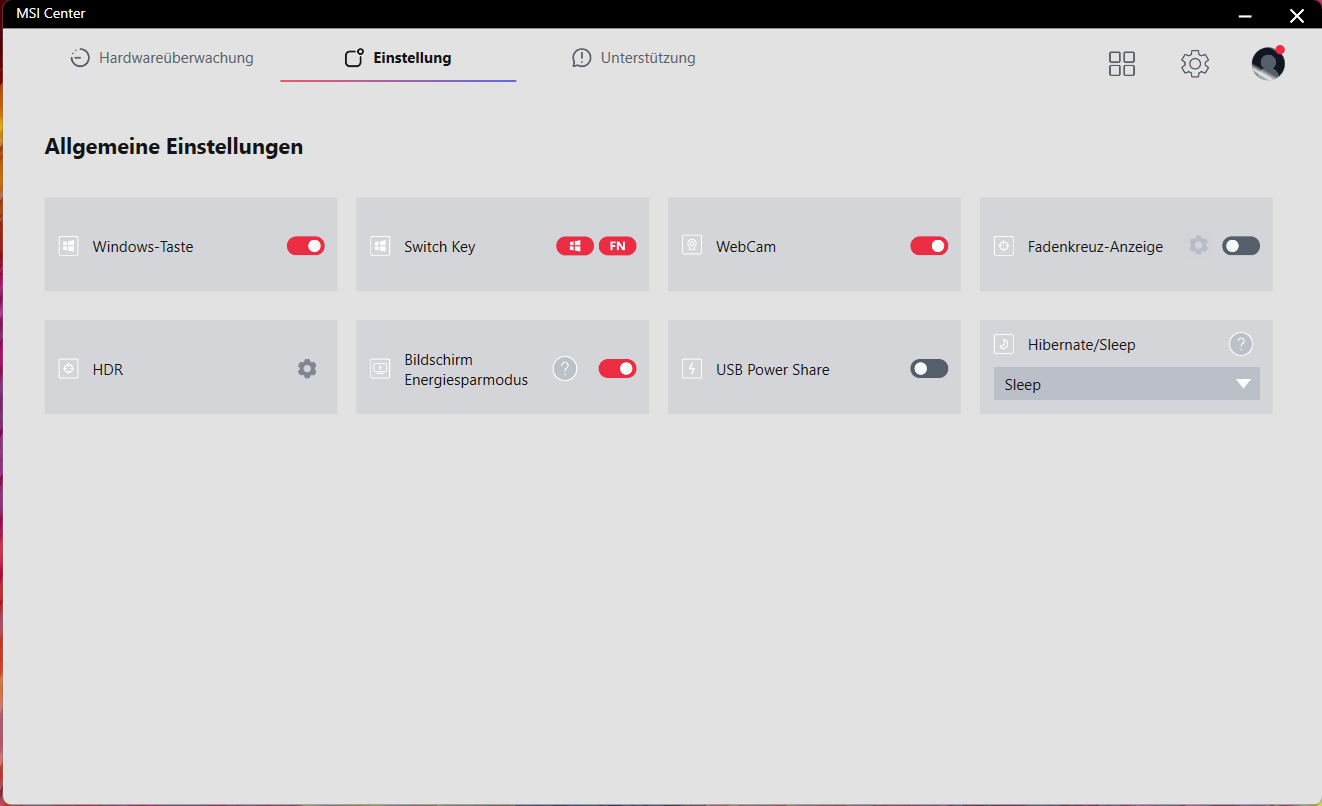
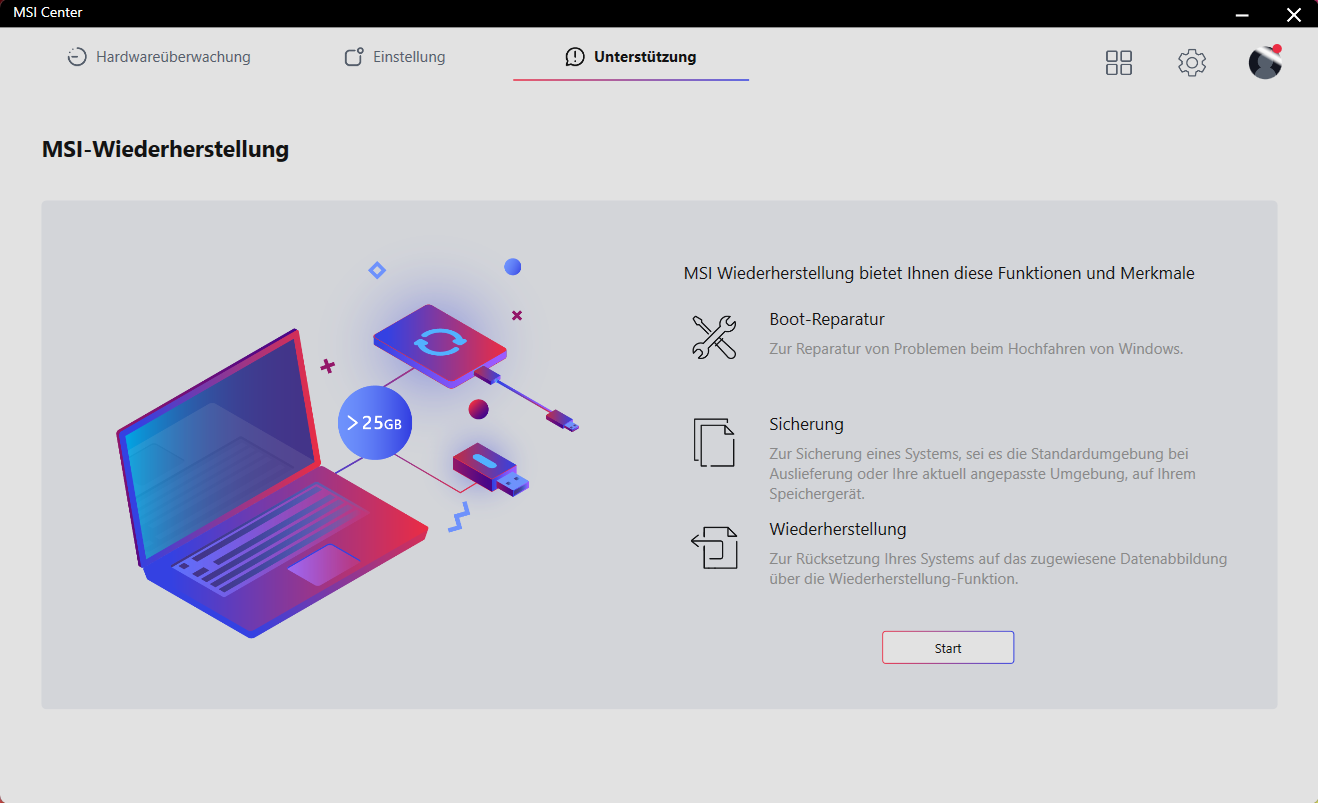
The preinstalled MSI Center software (see pictures) or "Fn" + "F7" key combination allows you to switch between the four performance profiles (see table below). We used the "Extreme Performance" profile for the benchmarks and "Super Battery" for the battery tests. Alternatively, an AI-based "Smart Auto" function that automatically selects the profile that best suits the current usage scenario is also available.
| Extreme Performance | Balanced | Silent Mode | Super Battery | |
|---|---|---|---|---|
| Power Limit 1 | 55 Watt | 45 Watt | 20 Watt | 15 Watt |
| Power Limit 2 | 78 Watt | 70 Watt | 20 Watt | 15 Watt |
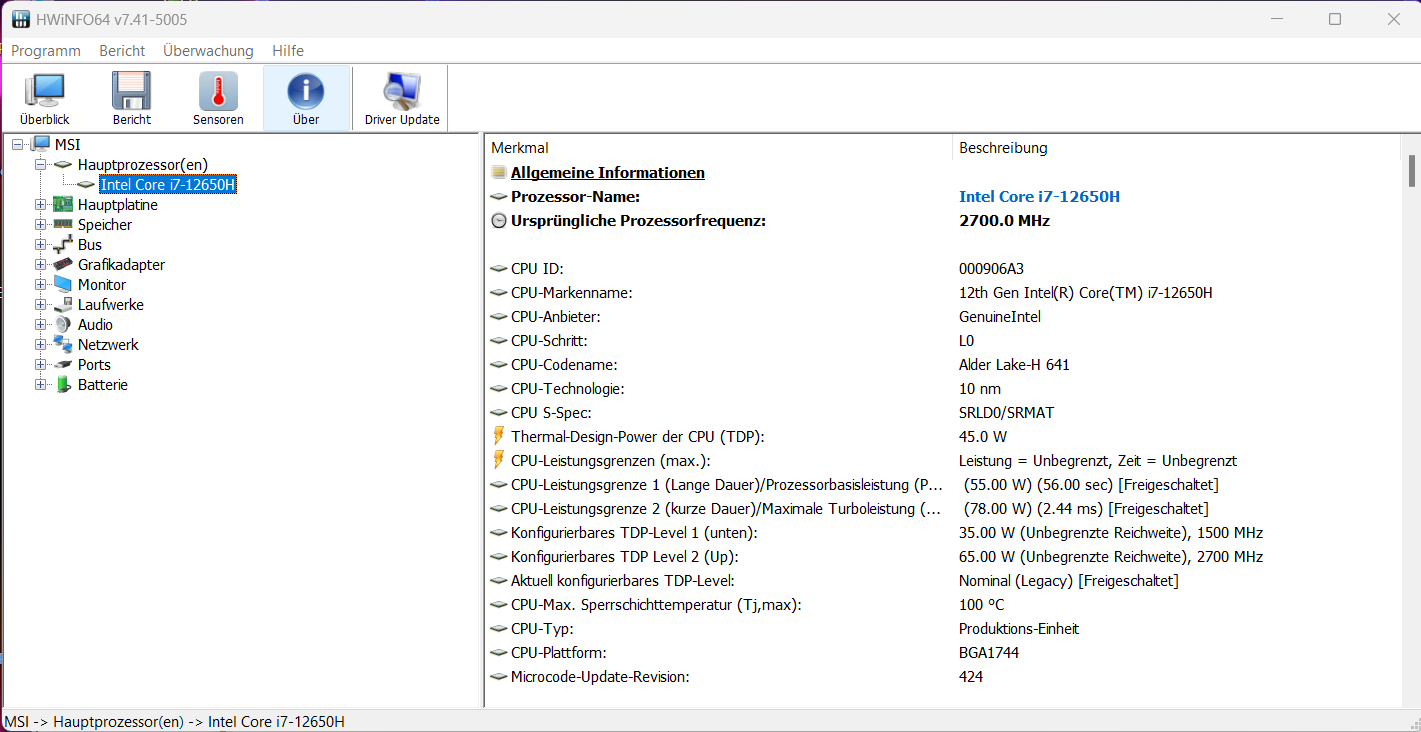
Processor
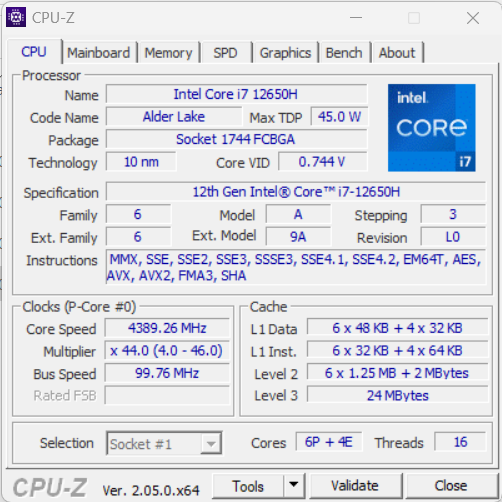
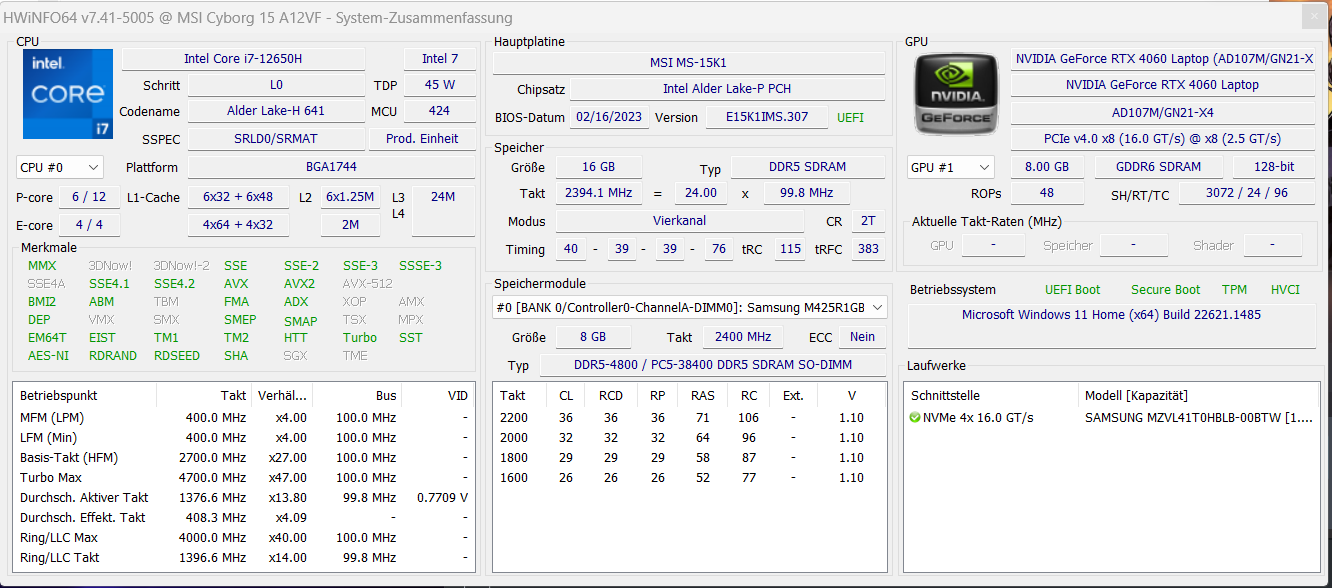
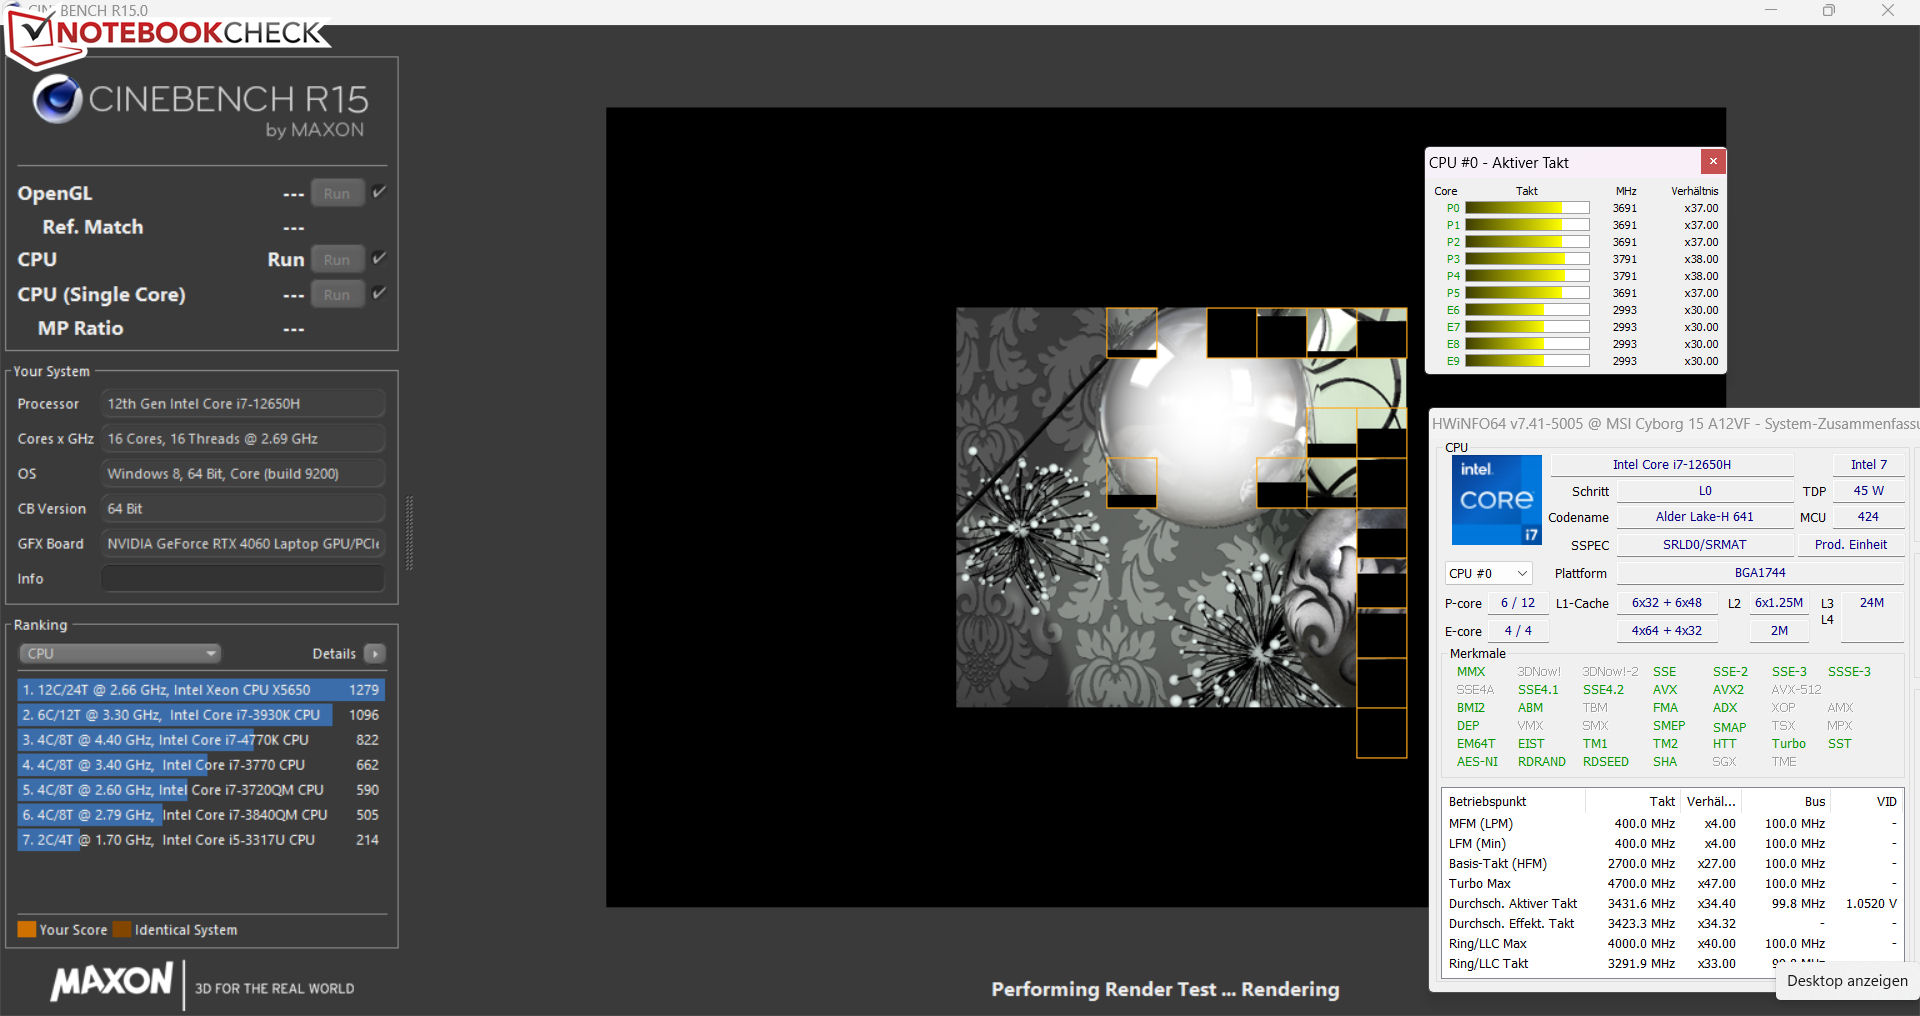
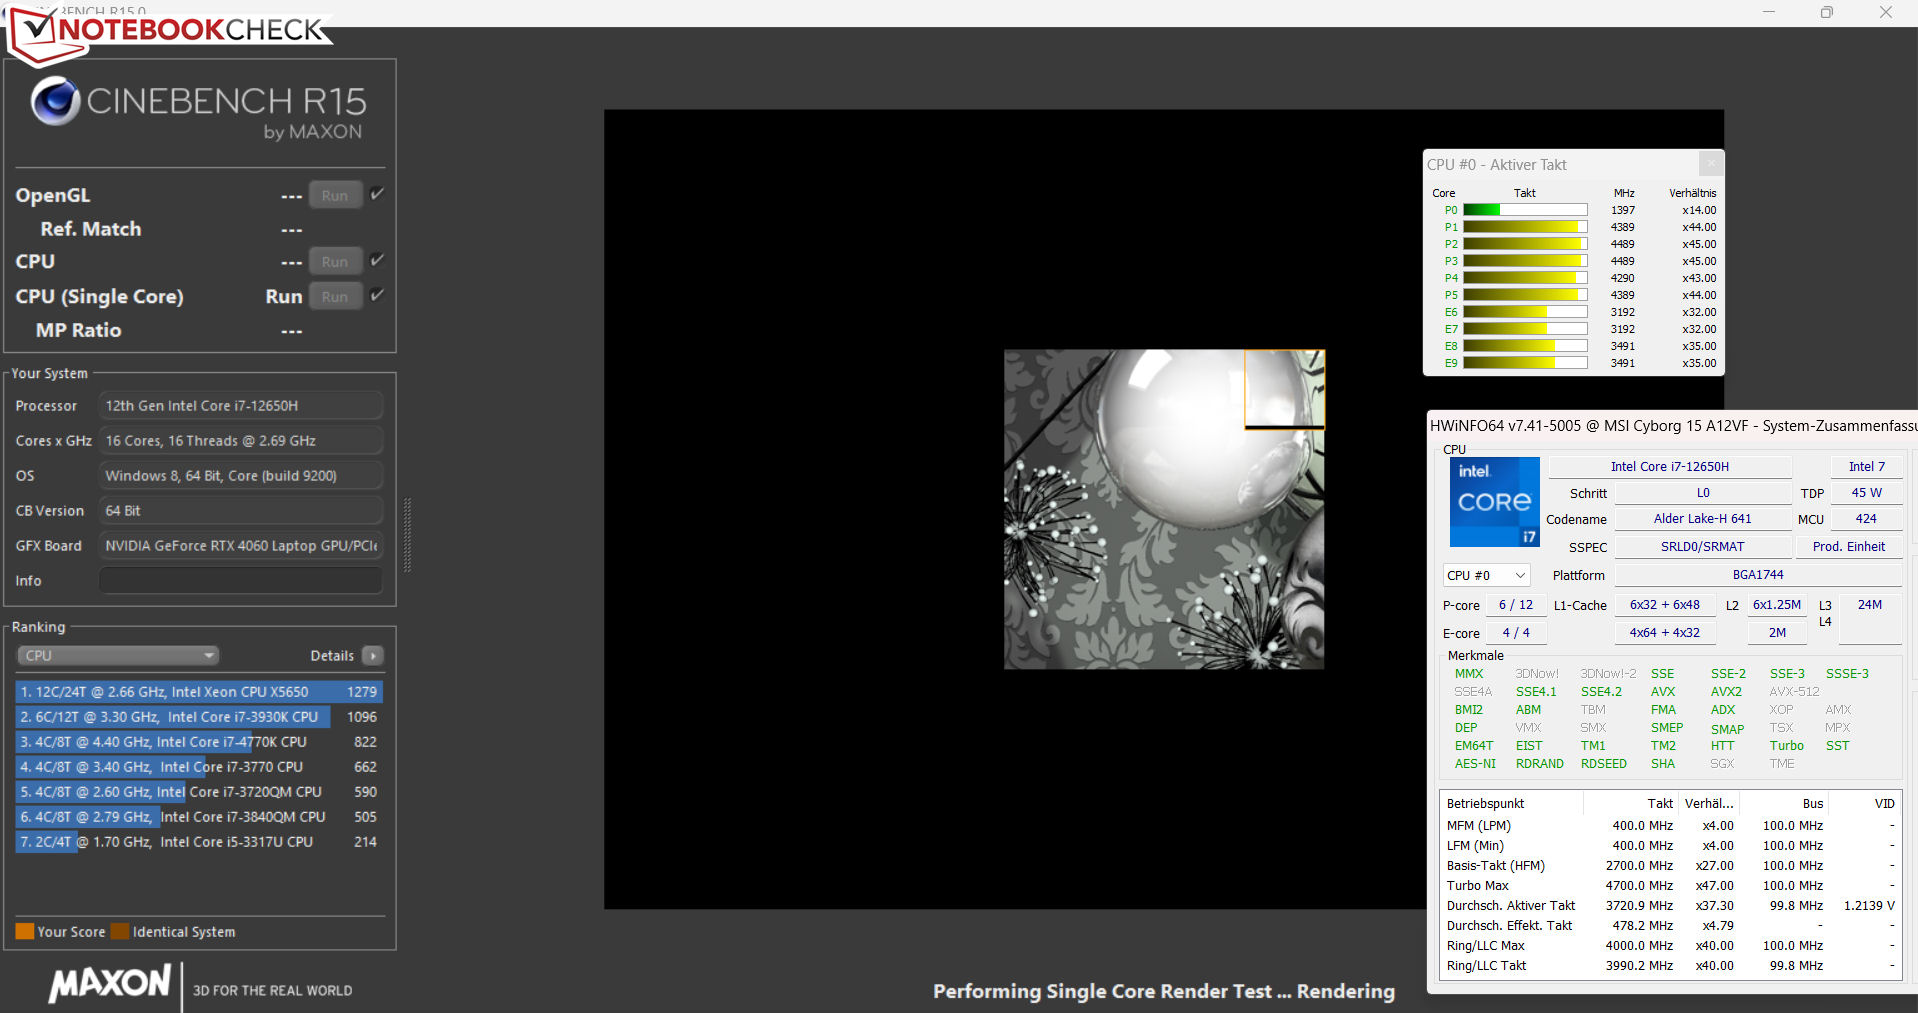
The Core i7-12650H Alder Lake processor consists of six Performance cores (hyperthreading, 2.3 to 4.7 GHz) and four Efficiency cores (no hyperthreading, 1.7 to 3.5 GHz), resulting in a total of sixteen logical CPU cores.
In mains operation, the CPU runs though the CPU tests of the Cinebench R15 benchmark at medium high to high (multithread) and high to maximum (single-thread) clock speeds. In battery operation, the single-thread performance drops slightly (205 points), and the multithread performance drops more significantly (994 points). Overall, the benchmark results range slightly above the average for the CPU that we determined so far.
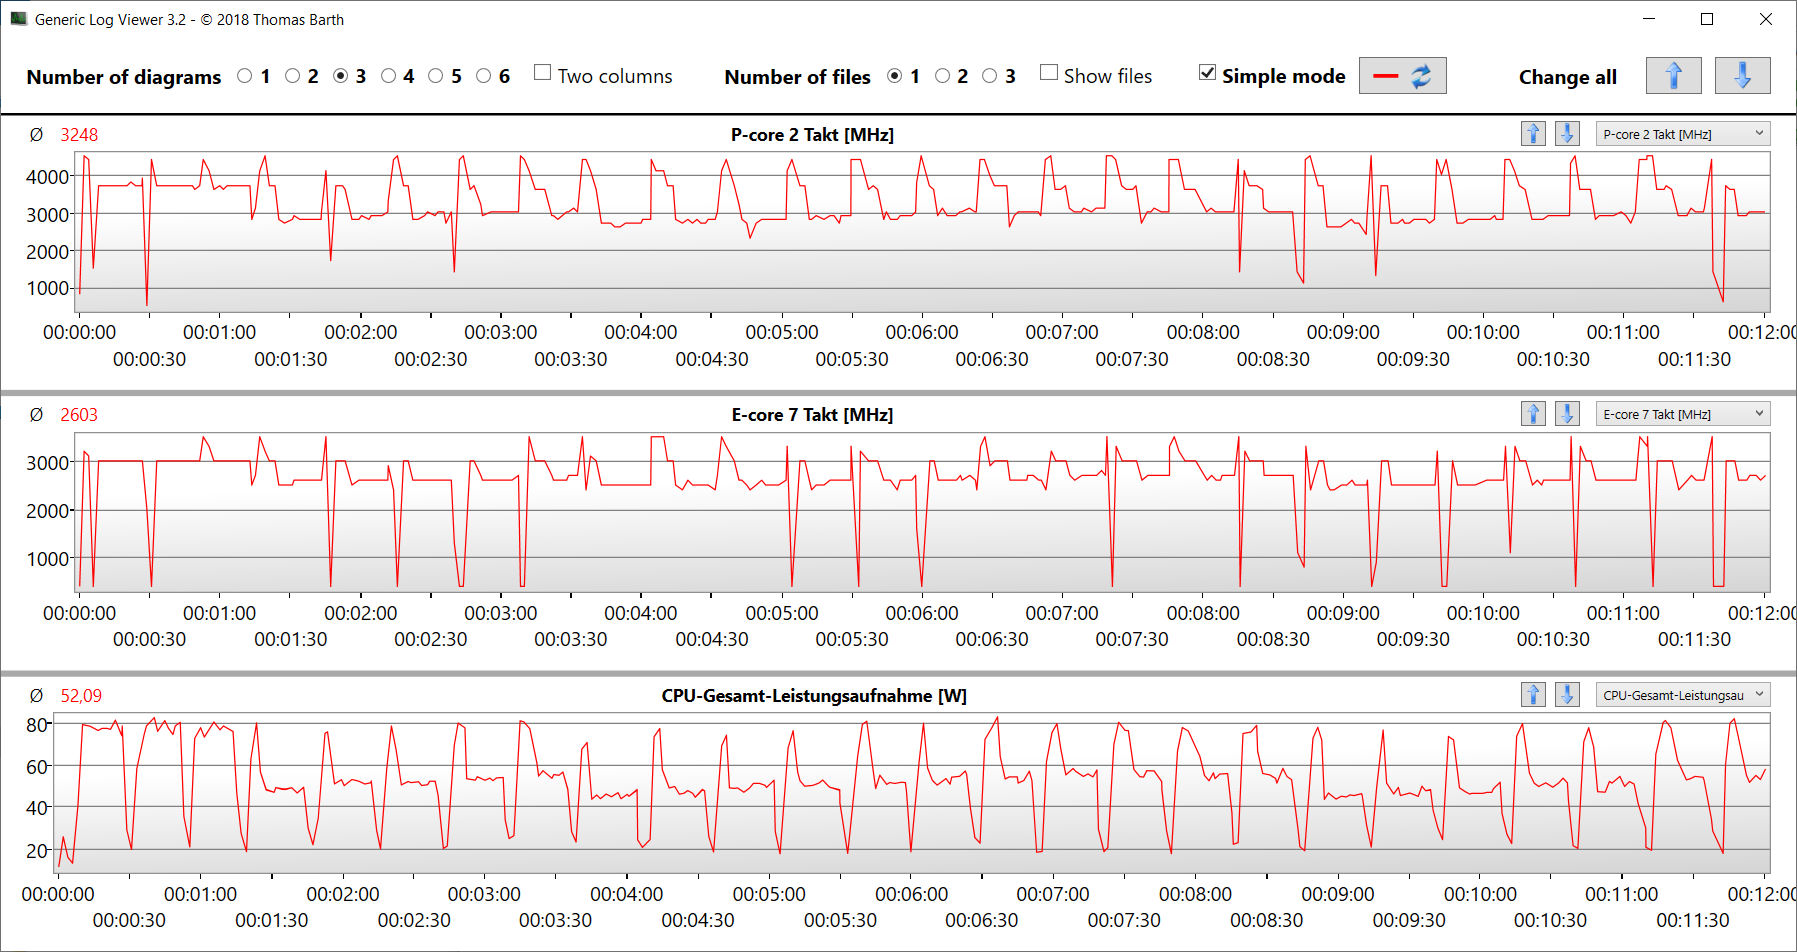
The CB15 loop test shows that constant multithread load causes the Turbo speed to drop slightly after the second run and that the processor is unable to maintain a constant level.
Cinebench R15 Multi Constant Load Test

* ... smaller is better
AIDA64: FP32 Ray-Trace | FPU Julia | CPU SHA3 | CPU Queen | FPU SinJulia | FPU Mandel | CPU AES | CPU ZLib | FP64 Ray-Trace | CPU PhotoWorxx
| Performance rating | |
| Average of class Gaming | |
| Asus TUF Gaming A16 FA617 | |
| Aorus 15 XE5 | |
| Schenker XMG Fusion 15 (Mid 22) | |
| MSI Katana 15 B12VEK | |
| MSI Cyborg 15 A12VF | |
| HP Victus 15 fa0020nr | |
| Average Intel Core i7-12650H | |
| AIDA64 / FP32 Ray-Trace | |
| Average of class Gaming (10227 - 85542, n=104, last 2 years) | |
| Asus TUF Gaming A16 FA617 | |
| MSI Katana 15 B12VEK | |
| Aorus 15 XE5 | |
| HP Victus 15 fa0020nr | |
| Schenker XMG Fusion 15 (Mid 22) | |
| MSI Cyborg 15 A12VF | |
| Average Intel Core i7-12650H (5422 - 15620, n=14) | |
| AIDA64 / FPU Julia | |
| Average of class Gaming (51376 - 238426, n=104, last 2 years) | |
| Asus TUF Gaming A16 FA617 | |
| MSI Katana 15 B12VEK | |
| MSI Cyborg 15 A12VF | |
| Aorus 15 XE5 | |
| HP Victus 15 fa0020nr | |
| Schenker XMG Fusion 15 (Mid 22) | |
| Average Intel Core i7-12650H (26386 - 76434, n=14) | |
| AIDA64 / CPU SHA3 | |
| Average of class Gaming (2180 - 9817, n=104, last 2 years) | |
| Schenker XMG Fusion 15 (Mid 22) | |
| Asus TUF Gaming A16 FA617 | |
| MSI Katana 15 B12VEK | |
| Aorus 15 XE5 | |
| MSI Cyborg 15 A12VF | |
| HP Victus 15 fa0020nr | |
| Average Intel Core i7-12650H (1479 - 3244, n=14) | |
| AIDA64 / CPU Queen | |
| Average of class Gaming (49785 - 173351, n=91, last 2 years) | |
| Asus TUF Gaming A16 FA617 | |
| Aorus 15 XE5 | |
| HP Victus 15 fa0020nr | |
| MSI Katana 15 B12VEK | |
| Schenker XMG Fusion 15 (Mid 22) | |
| MSI Cyborg 15 A12VF | |
| Average Intel Core i7-12650H (59278 - 89537, n=14) | |
| AIDA64 / FPU SinJulia | |
| Average of class Gaming (4424 - 33636, n=104, last 2 years) | |
| Asus TUF Gaming A16 FA617 | |
| Schenker XMG Fusion 15 (Mid 22) | |
| MSI Katana 15 B12VEK | |
| Aorus 15 XE5 | |
| MSI Cyborg 15 A12VF | |
| HP Victus 15 fa0020nr | |
| Average Intel Core i7-12650H (4690 - 8726, n=14) | |
| AIDA64 / FPU Mandel | |
| Average of class Gaming (25115 - 128721, n=104, last 2 years) | |
| Asus TUF Gaming A16 FA617 | |
| MSI Katana 15 B12VEK | |
| Schenker XMG Fusion 15 (Mid 22) | |
| HP Victus 15 fa0020nr | |
| MSI Cyborg 15 A12VF | |
| Aorus 15 XE5 | |
| Average Intel Core i7-12650H (15001 - 37738, n=14) | |
| AIDA64 / CPU AES | |
| Schenker XMG Fusion 15 (Mid 22) | |
| Aorus 15 XE5 | |
| Average of class Gaming (39258 - 247074, n=104, last 2 years) | |
| MSI Katana 15 B12VEK | |
| MSI Cyborg 15 A12VF | |
| Asus TUF Gaming A16 FA617 | |
| HP Victus 15 fa0020nr | |
| Average Intel Core i7-12650H (32702 - 92530, n=14) | |
| AIDA64 / CPU ZLib | |
| Average of class Gaming (574 - 2531, n=104, last 2 years) | |
| MSI Cyborg 15 A12VF | |
| Asus TUF Gaming A16 FA617 | |
| MSI Katana 15 B12VEK | |
| Aorus 15 XE5 | |
| HP Victus 15 fa0020nr | |
| Average Intel Core i7-12650H (443 - 891, n=14) | |
| Schenker XMG Fusion 15 (Mid 22) | |
| AIDA64 / FP64 Ray-Trace | |
| Average of class Gaming (5509 - 45446, n=104, last 2 years) | |
| Asus TUF Gaming A16 FA617 | |
| MSI Katana 15 B12VEK | |
| Schenker XMG Fusion 15 (Mid 22) | |
| Aorus 15 XE5 | |
| HP Victus 15 fa0020nr | |
| MSI Cyborg 15 A12VF | |
| Average Intel Core i7-12650H (3096 - 8448, n=14) | |
| AIDA64 / CPU PhotoWorxx | |
| Average of class Gaming (12271 - 89891, n=104, last 2 years) | |
| MSI Katana 15 B12VEK | |
| MSI Cyborg 15 A12VF | |
| Aorus 15 XE5 | |
| Average Intel Core i7-12650H (22046 - 44164, n=14) | |
| Asus TUF Gaming A16 FA617 | |
| Schenker XMG Fusion 15 (Mid 22) | |
| HP Victus 15 fa0020nr | |
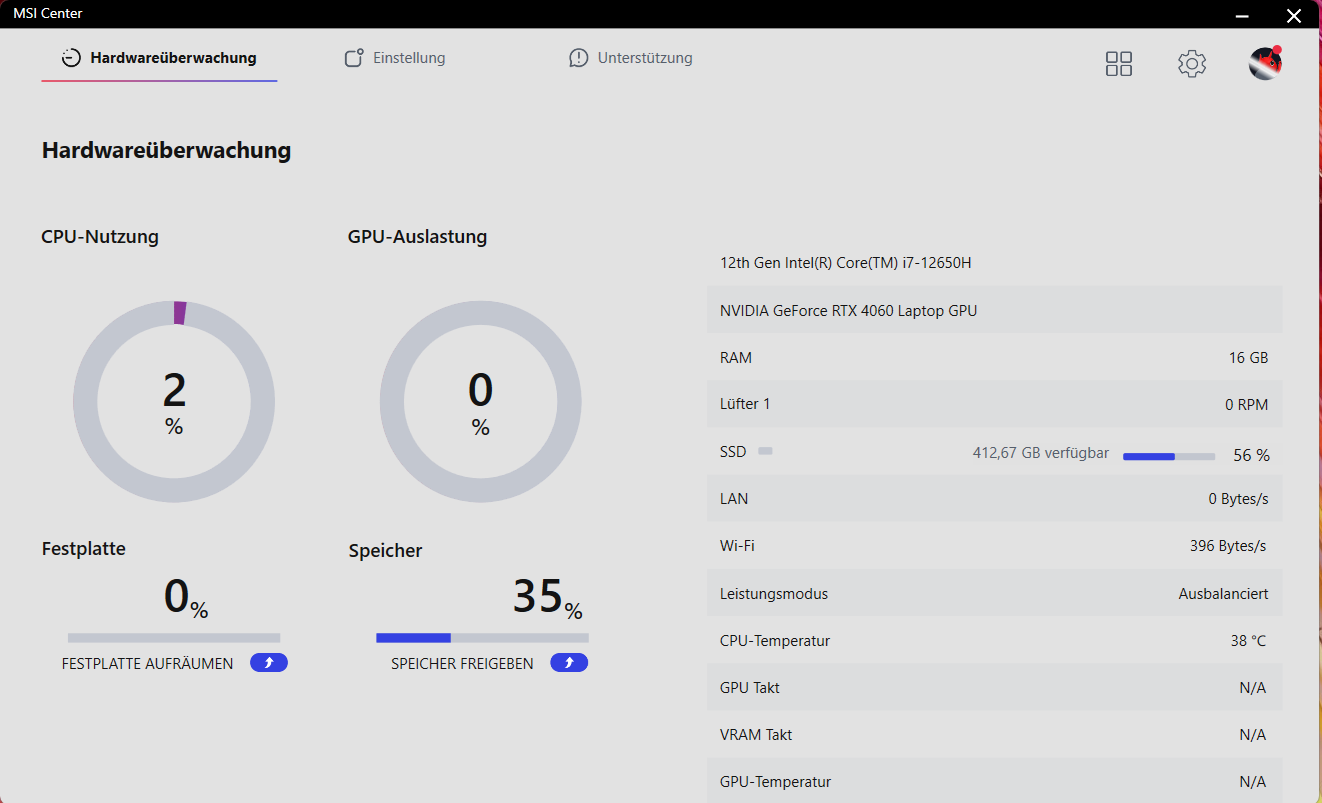
System Performance
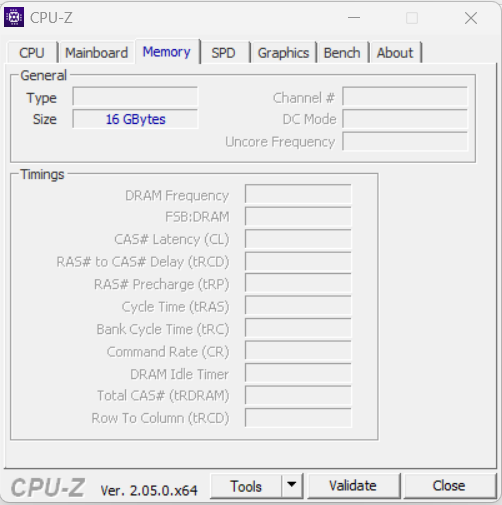
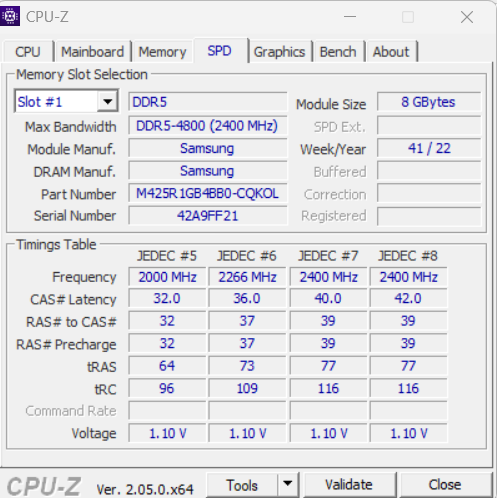
You cannot expect an extreme performance from the smoothly running system, since it focusses more on other aspects such a compact size, mobility, and a low power consumption. Nonetheless, the hardware that is used is able to handle demanding application areas such as rendering, video processing, and gaming. The transfer rates of the working memory are at a normal level for DDR5-4800 RAM. They are accompanied by good PC-Mark results.
CrossMark: Overall | Productivity | Creativity | Responsiveness
| PCMark 10 / Score | |
| Average of class Gaming (5828 - 11574, n=93, last 2 years) | |
| Aorus 15 XE5 | |
| Asus TUF Gaming A16 FA617 | |
| MSI Cyborg 15 A12VF | |
| Average Intel Core i7-12650H, NVIDIA GeForce RTX 4060 Laptop GPU (n=1) | |
| HP Victus 15 fa0020nr | |
| MSI Katana 15 B12VEK | |
| Schenker XMG Fusion 15 (Mid 22) | |
| PCMark 10 / Essentials | |
| Aorus 15 XE5 | |
| MSI Cyborg 15 A12VF | |
| Average Intel Core i7-12650H, NVIDIA GeForce RTX 4060 Laptop GPU (n=1) | |
| Average of class Gaming (8810 - 11935, n=97, last 2 years) | |
| Asus TUF Gaming A16 FA617 | |
| HP Victus 15 fa0020nr | |
| MSI Katana 15 B12VEK | |
| Schenker XMG Fusion 15 (Mid 22) | |
| PCMark 10 / Productivity | |
| Average of class Gaming (6845 - 21327, n=95, last 2 years) | |
| Aorus 15 XE5 | |
| MSI Cyborg 15 A12VF | |
| Average Intel Core i7-12650H, NVIDIA GeForce RTX 4060 Laptop GPU (n=1) | |
| MSI Katana 15 B12VEK | |
| Asus TUF Gaming A16 FA617 | |
| HP Victus 15 fa0020nr | |
| Schenker XMG Fusion 15 (Mid 22) | |
| PCMark 10 / Digital Content Creation | |
| Average of class Gaming (7602 - 19657, n=95, last 2 years) | |
| Aorus 15 XE5 | |
| Asus TUF Gaming A16 FA617 | |
| HP Victus 15 fa0020nr | |
| MSI Cyborg 15 A12VF | |
| Average Intel Core i7-12650H, NVIDIA GeForce RTX 4060 Laptop GPU (n=1) | |
| MSI Katana 15 B12VEK | |
| Schenker XMG Fusion 15 (Mid 22) | |
| CrossMark / Overall | |
| Average of class Gaming (1366 - 2409, n=93, last 2 years) | |
| Aorus 15 XE5 | |
| MSI Cyborg 15 A12VF | |
| Average Intel Core i7-12650H, NVIDIA GeForce RTX 4060 Laptop GPU (n=1) | |
| MSI Katana 15 B12VEK | |
| Schenker XMG Fusion 15 (Mid 22) | |
| HP Victus 15 fa0020nr | |
| CrossMark / Productivity | |
| Aorus 15 XE5 | |
| Average of class Gaming (1386 - 2254, n=93, last 2 years) | |
| MSI Cyborg 15 A12VF | |
| Average Intel Core i7-12650H, NVIDIA GeForce RTX 4060 Laptop GPU (n=1) | |
| MSI Katana 15 B12VEK | |
| Schenker XMG Fusion 15 (Mid 22) | |
| HP Victus 15 fa0020nr | |
| CrossMark / Creativity | |
| Average of class Gaming (1343 - 2729, n=93, last 2 years) | |
| Aorus 15 XE5 | |
| MSI Cyborg 15 A12VF | |
| Average Intel Core i7-12650H, NVIDIA GeForce RTX 4060 Laptop GPU (n=1) | |
| MSI Katana 15 B12VEK | |
| HP Victus 15 fa0020nr | |
| Schenker XMG Fusion 15 (Mid 22) | |
| CrossMark / Responsiveness | |
| Aorus 15 XE5 | |
| Average of class Gaming (1226 - 2334, n=93, last 2 years) | |
| MSI Cyborg 15 A12VF | |
| Average Intel Core i7-12650H, NVIDIA GeForce RTX 4060 Laptop GPU (n=1) | |
| Schenker XMG Fusion 15 (Mid 22) | |
| MSI Katana 15 B12VEK | |
| HP Victus 15 fa0020nr | |
| PCMark 8 Home Score Accelerated v2 | 5364 points | |
| PCMark 8 Work Score Accelerated v2 | 6432 points | |
| PCMark 10 Score | 7098 points | |
Help | ||
| AIDA64 / Memory Copy | |
| Average of class Gaming (21750 - 129946, n=104, last 2 years) | |
| MSI Cyborg 15 A12VF | |
| MSI Katana 15 B12VEK | |
| Average Intel Core i7-12650H (43261 - 69735, n=14) | |
| Aorus 15 XE5 | |
| Asus TUF Gaming A16 FA617 | |
| Schenker XMG Fusion 15 (Mid 22) | |
| HP Victus 15 fa0020nr | |
| AIDA64 / Memory Read | |
| Average of class Gaming (22956 - 118858, n=104, last 2 years) | |
| MSI Katana 15 B12VEK | |
| MSI Cyborg 15 A12VF | |
| Aorus 15 XE5 | |
| Average Intel Core i7-12650H (47313 - 67412, n=14) | |
| Asus TUF Gaming A16 FA617 | |
| Schenker XMG Fusion 15 (Mid 22) | |
| HP Victus 15 fa0020nr | |
| AIDA64 / Memory Write | |
| Average of class Gaming (22297 - 135096, n=104, last 2 years) | |
| Aorus 15 XE5 | |
| MSI Katana 15 B12VEK | |
| MSI Cyborg 15 A12VF | |
| Asus TUF Gaming A16 FA617 | |
| Average Intel Core i7-12650H (45617 - 59361, n=14) | |
| Schenker XMG Fusion 15 (Mid 22) | |
| HP Victus 15 fa0020nr | |
| AIDA64 / Memory Latency | |
| Average of class Gaming (75.3 - 259, n=104, last 2 years) | |
| Aorus 15 XE5 | |
| MSI Katana 15 B12VEK | |
| Schenker XMG Fusion 15 (Mid 22) | |
| MSI Cyborg 15 A12VF | |
| Asus TUF Gaming A16 FA617 | |
| Average Intel Core i7-12650H (71.6 - 103.9, n=14) | |
| HP Victus 15 fa0020nr | |
* ... smaller is better
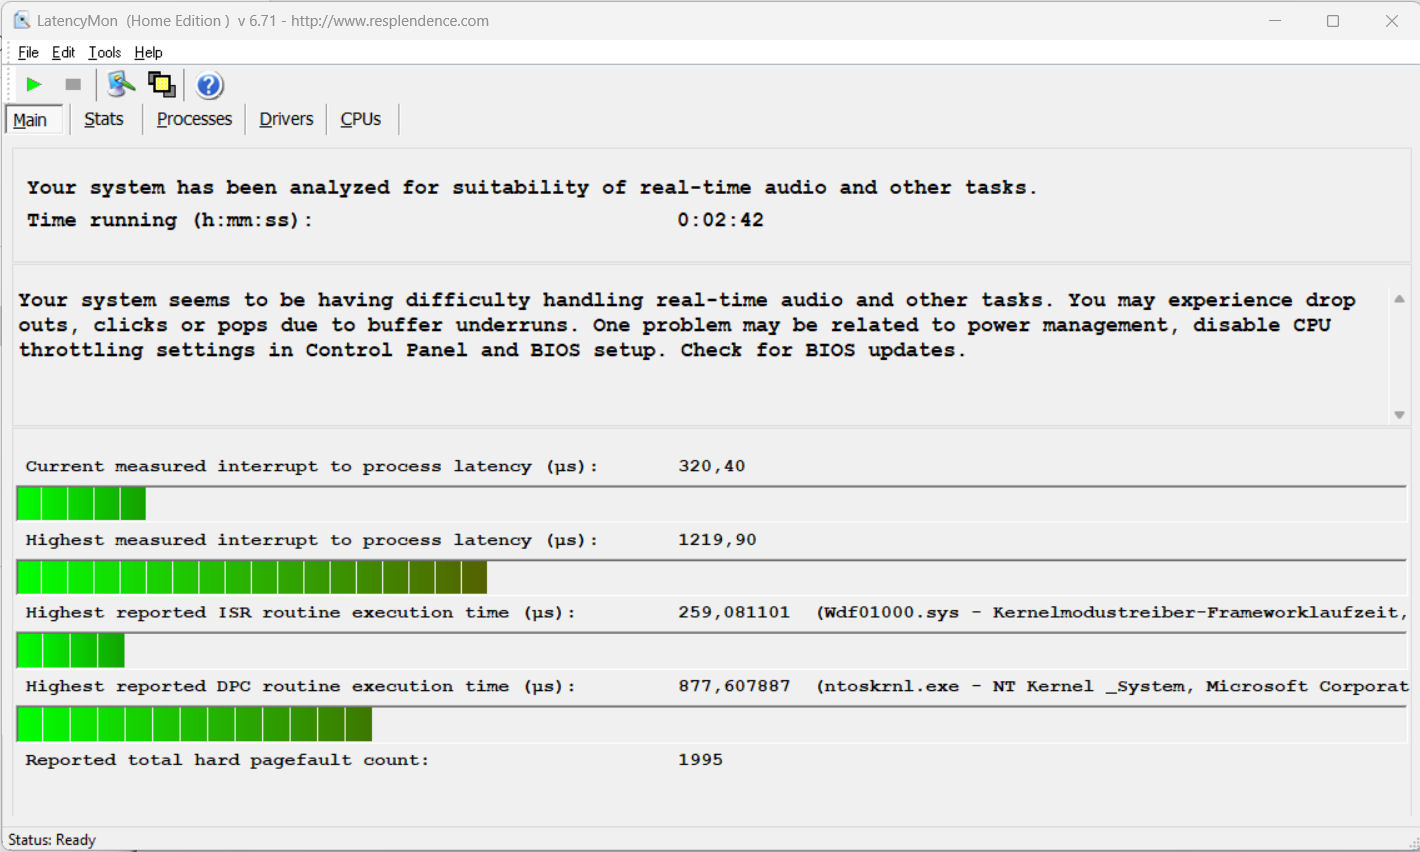
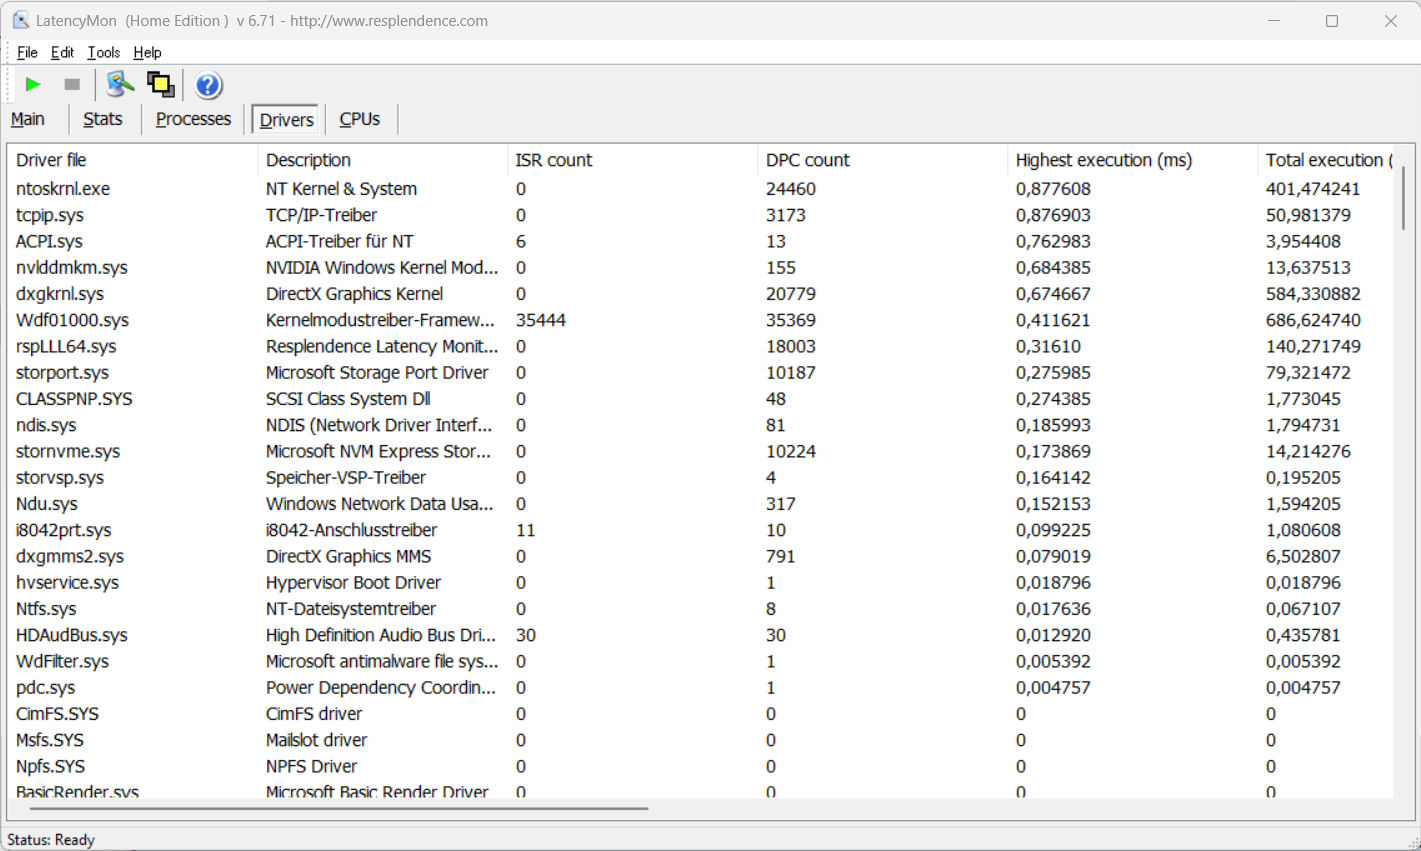
DPC Latencies
The standardized Latency Monitor test (web surfing, 4k video reproduction, Prime95 high load) reveals some conspicuous latencies, and the system doesn't appear suited for real-time video and audio processing. Future software updates might lead to some improvements or even make things worse.
| DPC Latencies / LatencyMon - interrupt to process latency (max), Web, Youtube, Prime95 | |
| MSI Katana 15 B12VEK | |
| Schenker XMG Fusion 15 (Mid 22) | |
| HP Victus 15 fa0020nr | |
| MSI Cyborg 15 A12VF | |
| Aorus 15 XE5 | |
| Asus TUF Gaming A16 FA617 | |
* ... smaller is better
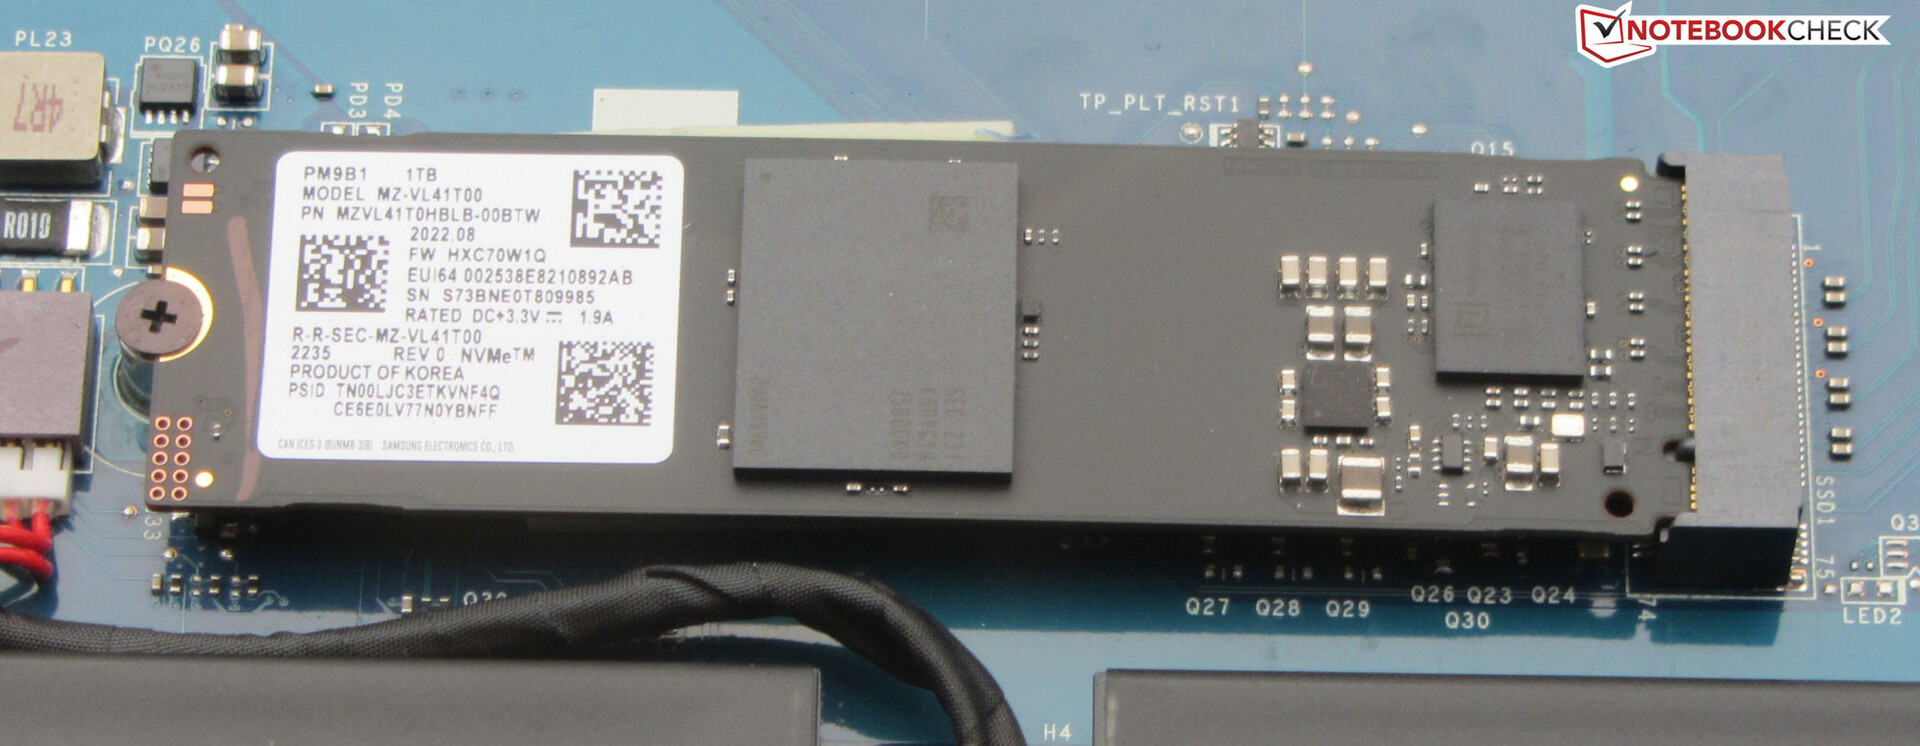
Storage Solution
MSI has equipped the Cyborg with a PCIe 4 SSD (M.2-2280) from Samsung that offers a storage capacity of 1 TB. Even though it delivers good transfer rates, it is not one of the top models among SSDs.
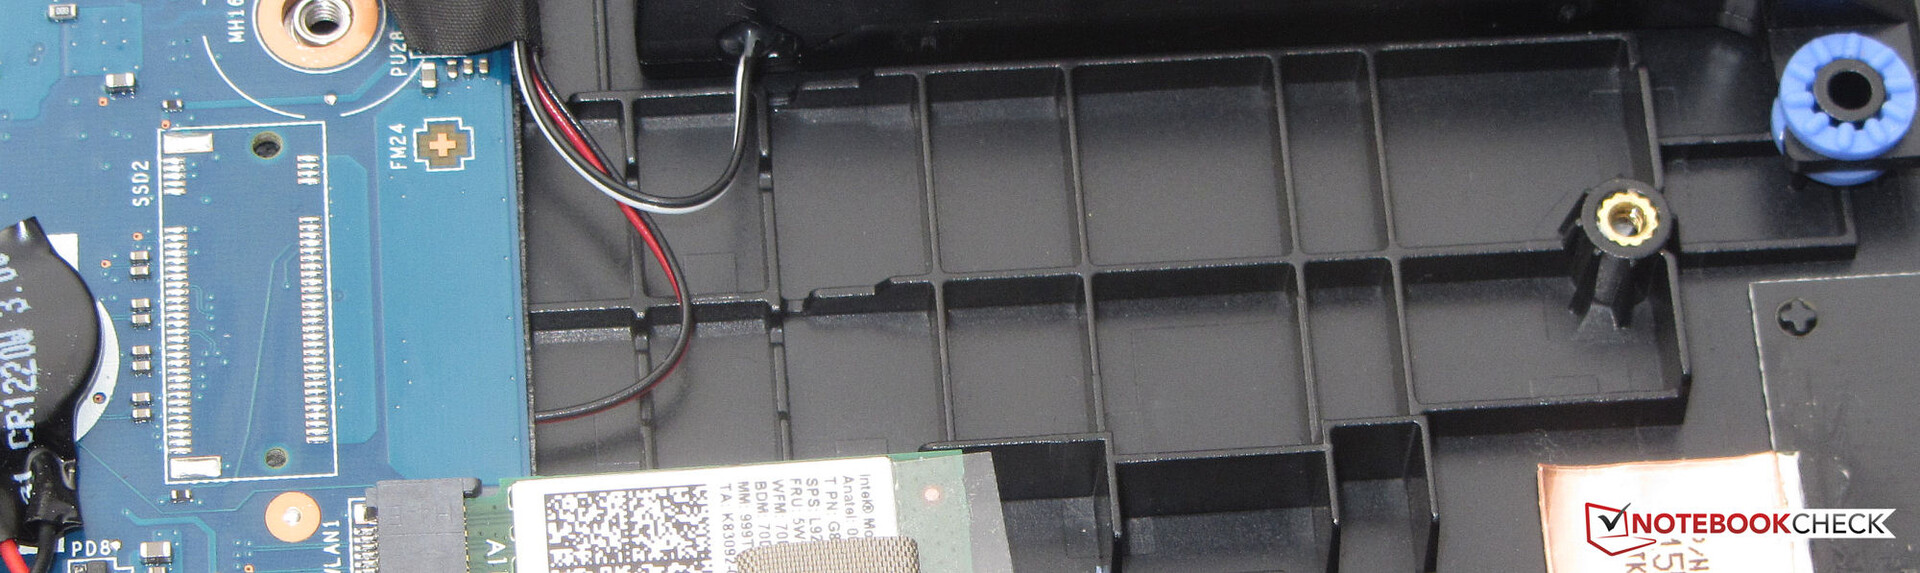
While there is space for a second SSD in the laptop, MSI saves on the necessary slot to connect it. This decision is hard to justify in a laptop of this price class. The option to add a second storage module has become standard at this point, particularly for a gaming laptop.

* ... smaller is better
Disk Throttling: DiskSpd Read Loop, Queue Depth 8
Graphics Card
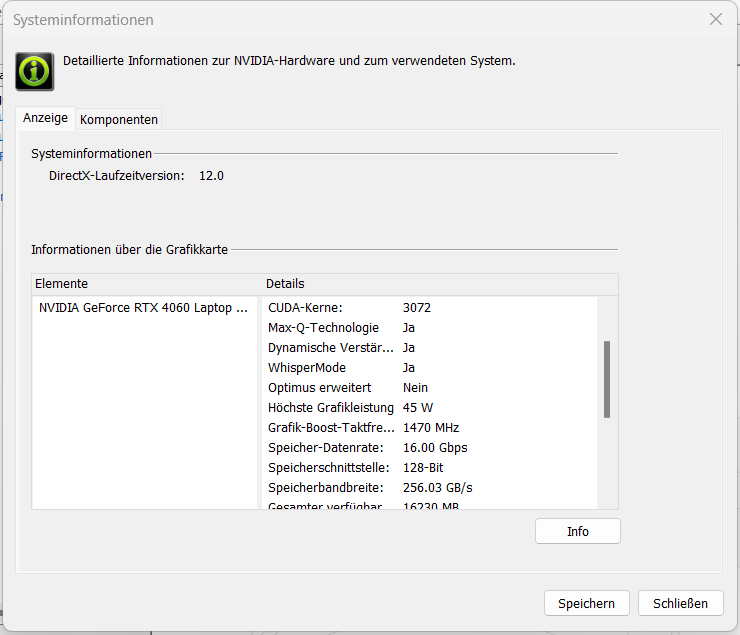
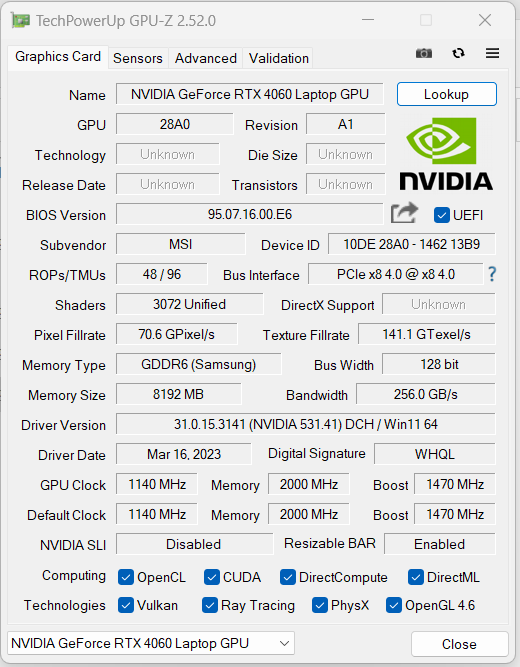
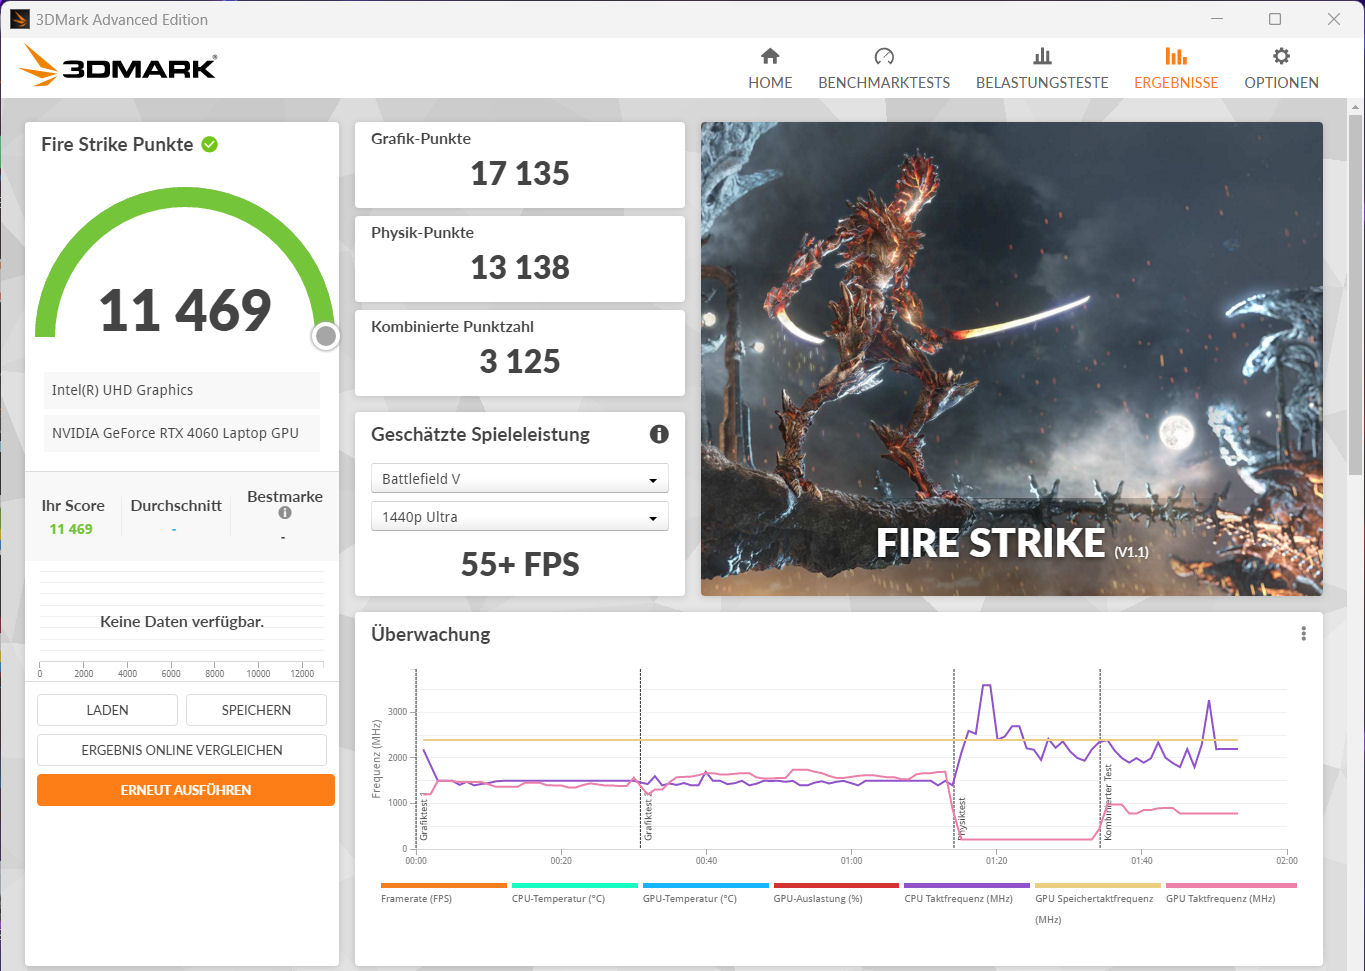
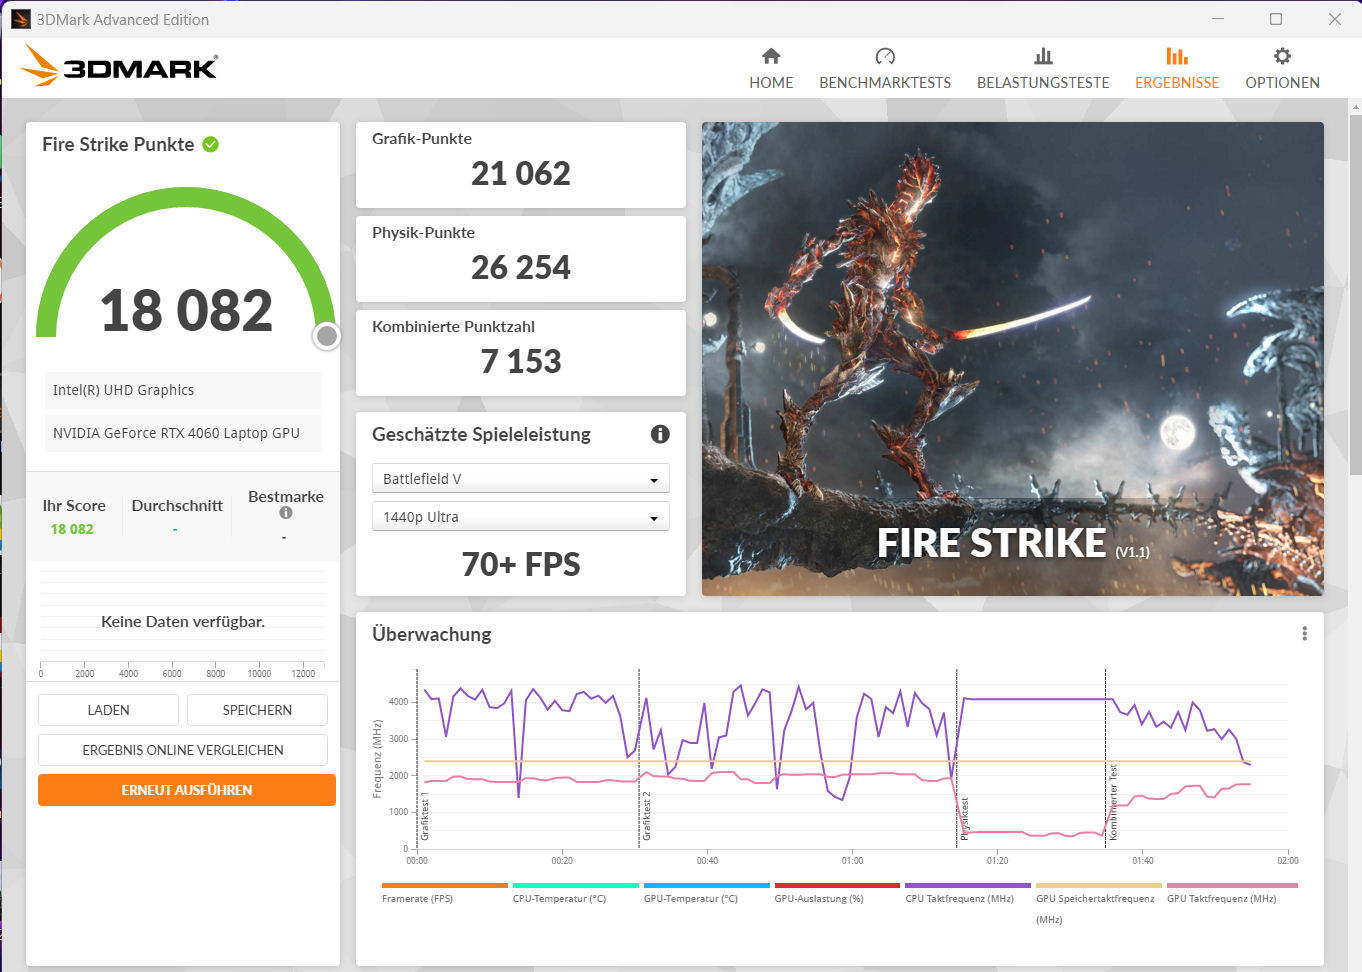
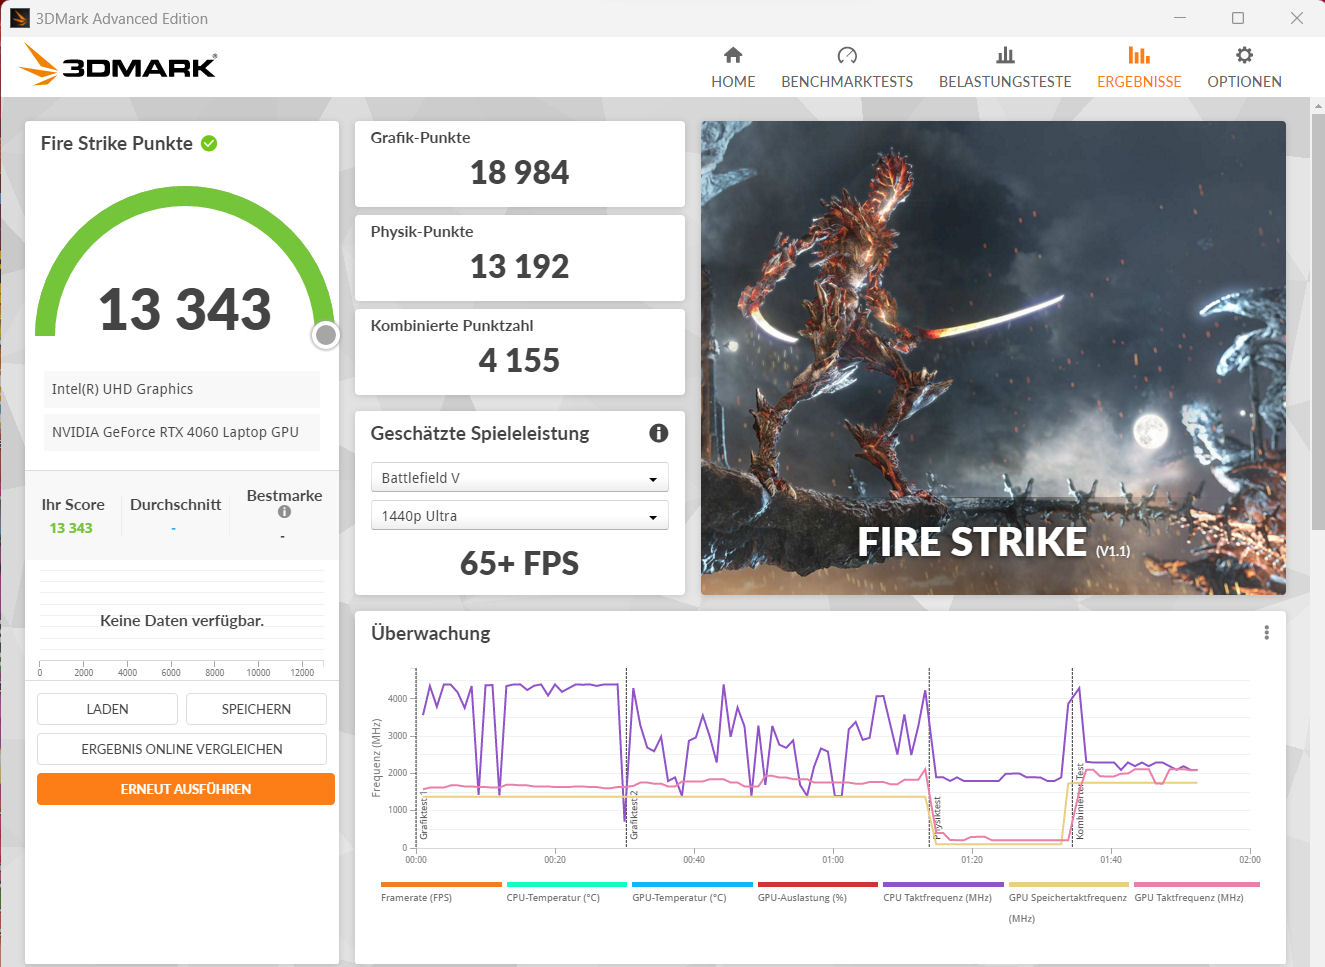
The GeForce RTX 4060 Laptop GPU offers 3,072 shaders, a 128-bit bus, and 8,192 MB of fast GDDR6 memory. MSI configures a TGP of 45 watts (35 Watt + 10 Watt Dynamic), which is a value at the bottom end of its capabilities. But at least the TGP is fully used, according to our The Witcher 3 test. The laptop doesn't offer a dGPU mode.
It is not surprising that the benchmark results range below the current average for RTX 4060 GPUs, but we have to consider them in connection to the power consumption. With a TGP that is more than twice as high, the RTX 4060 GPU (TGP: 105 Watt) of the MSI Katana 17 achieves results that are "only" 30 to 40% higher on average. This means that the 45-Watt RTX 4060 runs very efficiently here.
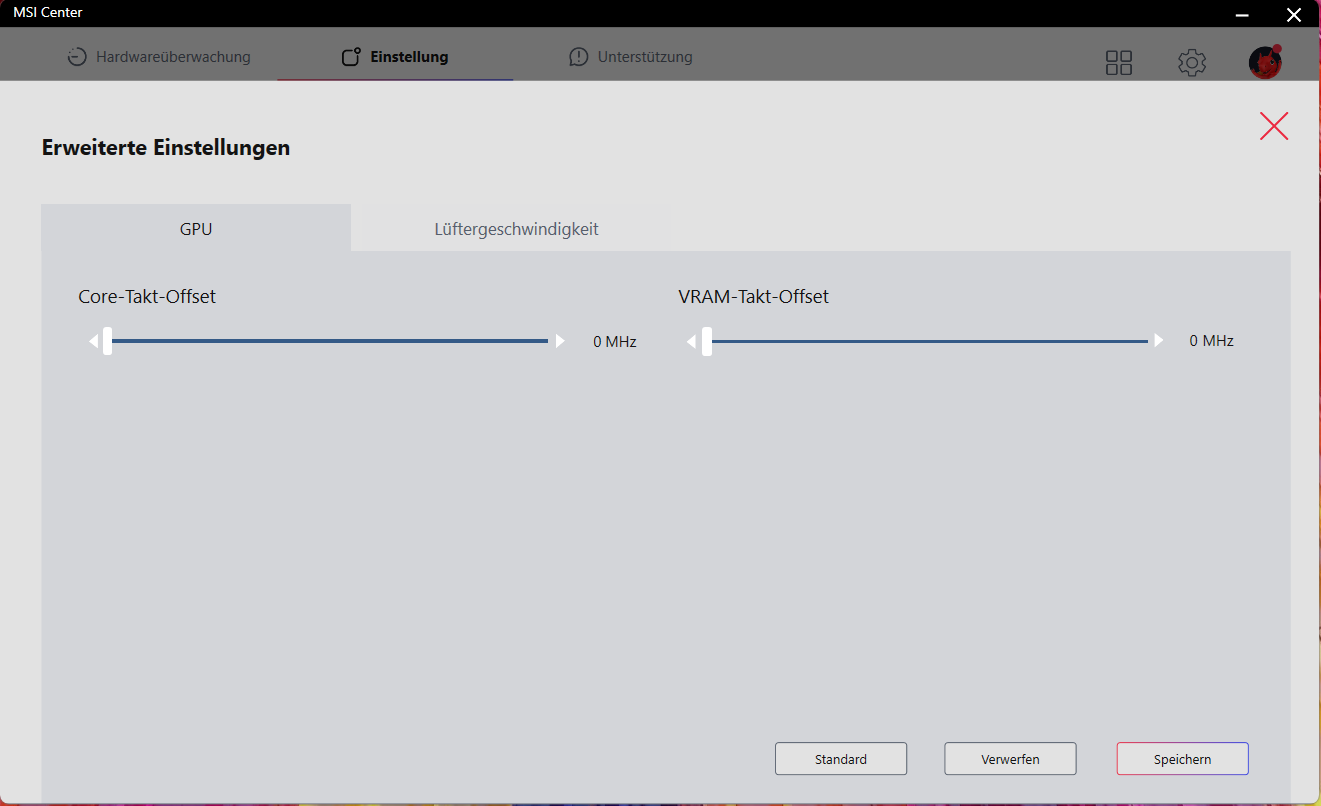
The MSI Center offers overclocking options for GPU and graphics storage, but only when the "Extreme Performance" profile is activated (you have to click on the gear symbol). You always use this option at your own risk, and if there are some problems or instabilities, you have to remove the overclocking.

| 3DMark 06 Standard Score | 48240 points | |
| 3DMark 11 Performance | 26146 points | |
| 3DMark Cloud Gate Standard Score | 57304 points | |
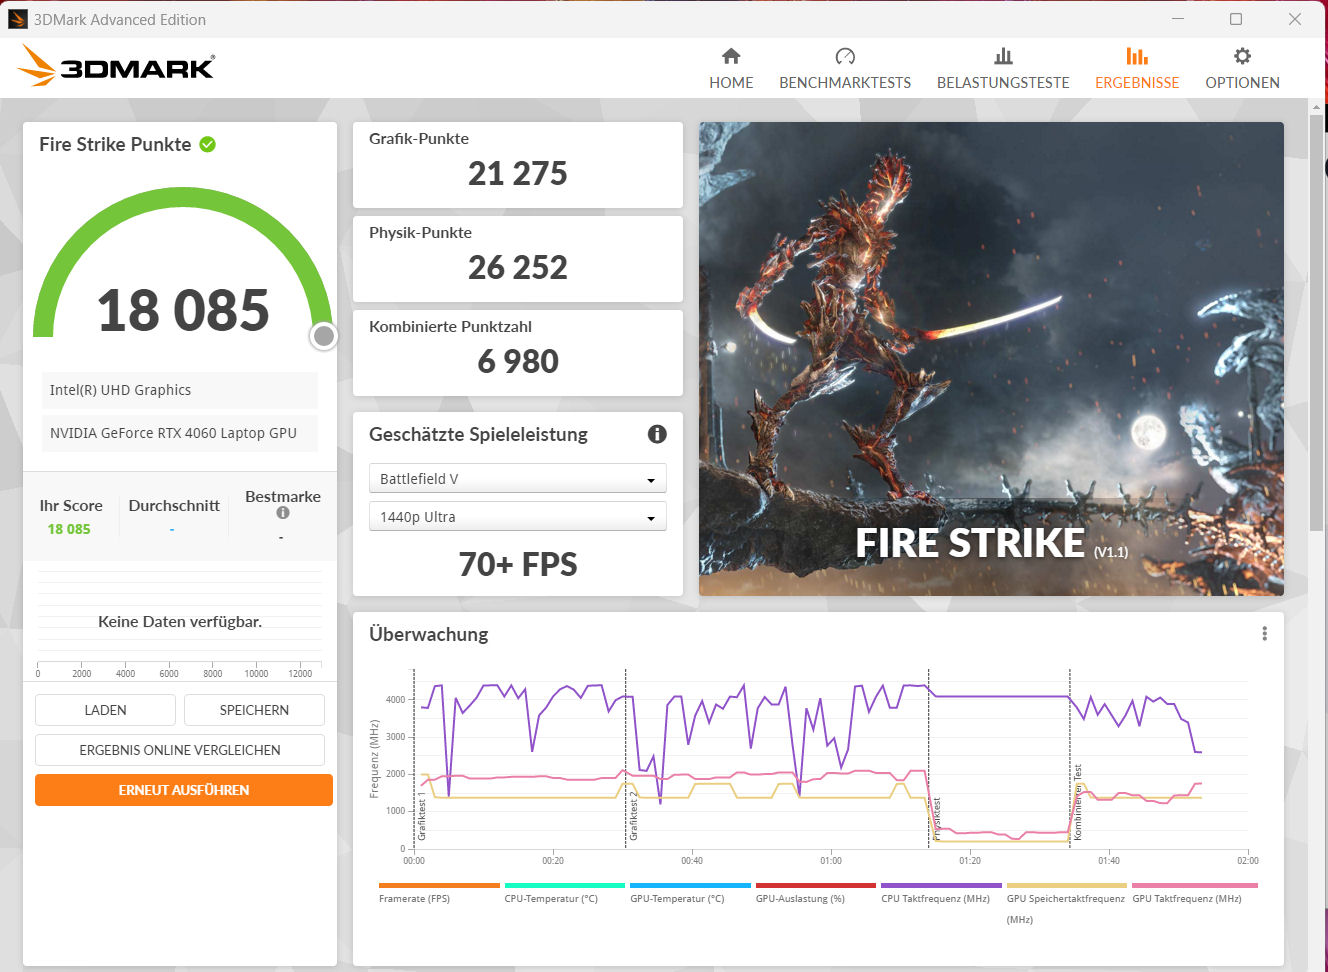
| 3DMark Fire Strike Score | 18086 points | |
| 3DMark Time Spy Score | 7918 points | |
Help | ||
* ... smaller is better
Gaming Performance
The laptop is designed for FHD gaming at high to maximum settings. You could use higher resolutions if you connect the corresponding monitor - but only at partially reduced settings. The frame rates of the games we tested range below the average that we determined for RTX 4060 GPUs.
| The Witcher 3 - 1920x1080 Ultra Graphics & Postprocessing (HBAO+) | |
| Average of class Gaming (104.7 - 240, n=6, last 2 years) | |
| MSI Katana 17 B13VFK | |
| Average NVIDIA GeForce RTX 4060 Laptop GPU (77 - 159.7, n=42) | |
| Aorus 15 XE5 | |
| Schenker XMG Fusion 15 (Mid 22) | |
| Asus TUF Gaming A16 FA617 | |
| MSI Katana 15 B12VEK | |
| MSI Cyborg 15 A12VF | |
| HP Victus 15 fa0020nr | |
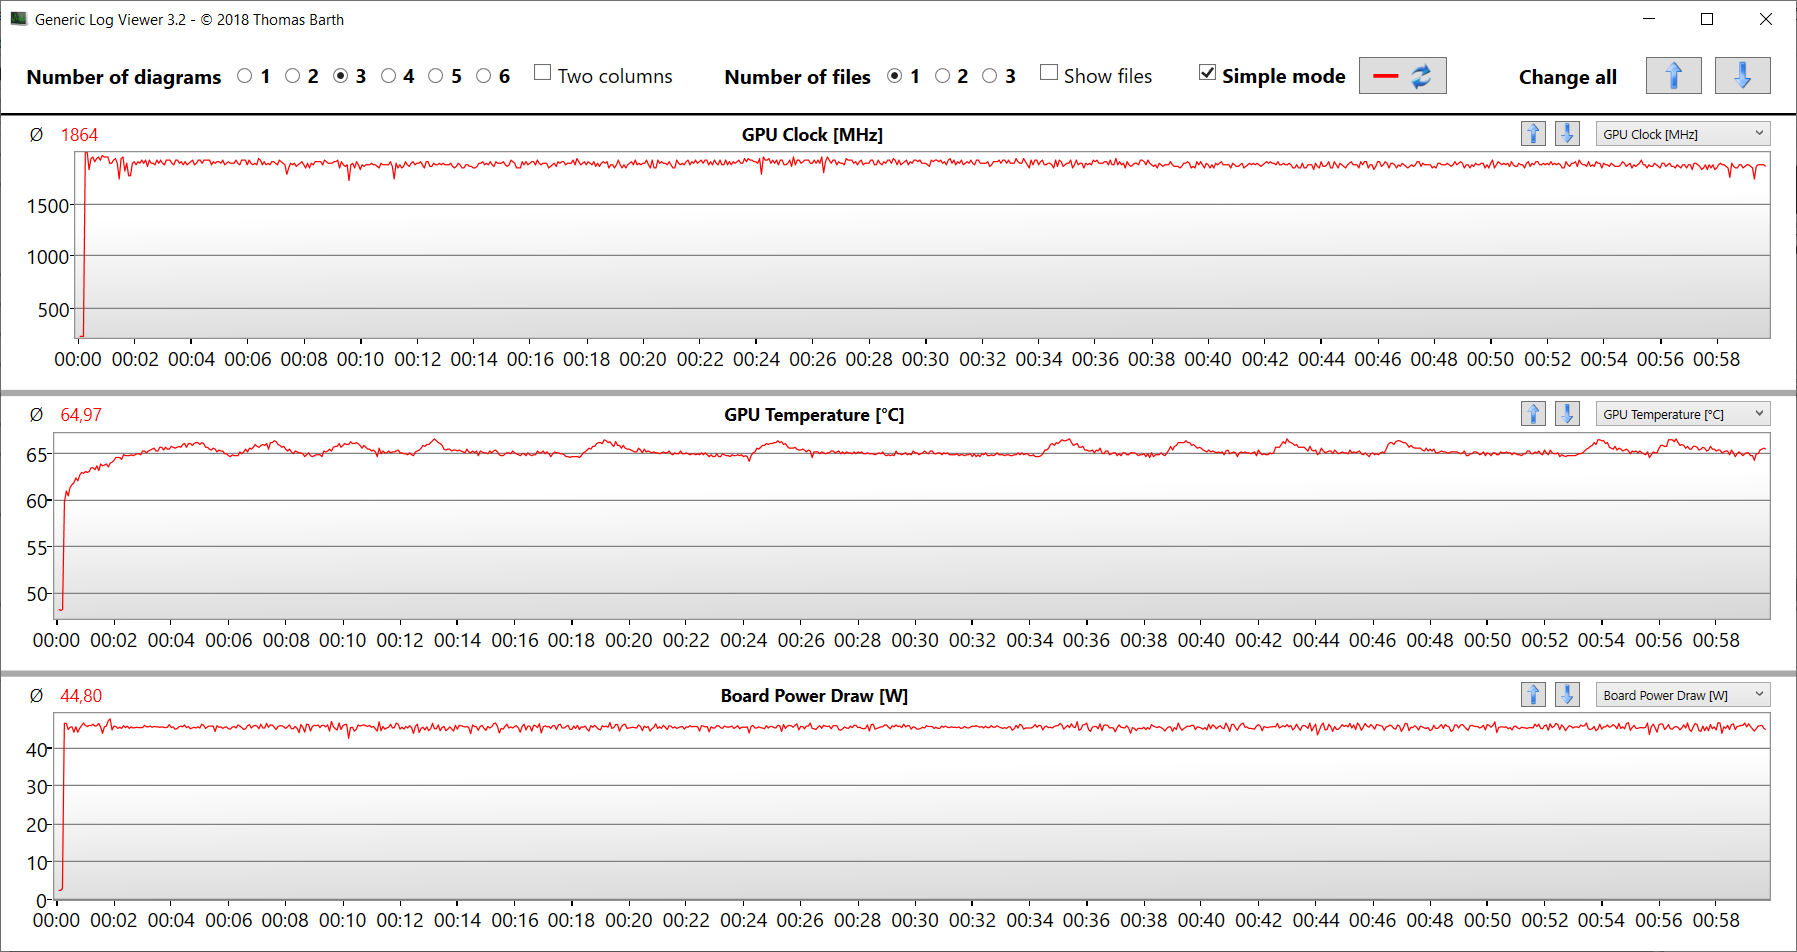
In order to evaluate whether the frame rates remain largely constant over a longer time period, we run the game "The Witcher 3" for about 60 minutes in Full-HD resolution and at maximum quality settings. The gaming character is not moved. We do not notice any drop in the frame rates.
The Witcher 3 FPS Chart
| low | med. | high | ultra | |
|---|---|---|---|---|
| GTA V (2015) | 185.8 | 181.5 | 164.9 | 89.3 |
| The Witcher 3 (2015) | 321.6 | 235.7 | 140.7 | 77.4 |
| Dota 2 Reborn (2015) | 161.7 | 152.6 | 140 | 135.4 |
| Final Fantasy XV Benchmark (2018) | 172.8 | 105.6 | 76.9 | |
| X-Plane 11.11 (2018) | 141.3 | 120.8 | 96.8 | |
| Far Cry 5 (2018) | 168 | 116 | 109 | 102 |
| Strange Brigade (2018) | 395 | 206 | 160.5 | 137.3 |
| God of War (2022) | 57.5 | 52 | 41.8 | |
| Rainbow Six Extraction (2022) | 186 | 145 | 141 | 108 |
| Cyberpunk 2077 1.6 (2022) | 88.5 | 72.3 | 63.5 | 57.9 |
| Ghostwire Tokyo (2022) | 114.4 | 113.7 | 112.7 | 108.4 |
| F1 22 (2022) | 169.8 | 162.3 | 124.7 | 48.7 |
| The Quarry (2022) | 116.9 | 88.1 | 72.7 | 57.2 |
| Uncharted Legacy of Thieves Collection (2022) | 71.1 | 70.3 | 67.7 | 65.6 |
| Call of Duty Modern Warfare 2 2022 (2022) | 103 | 93 | 70 | 68 |
| Spider-Man Miles Morales (2022) | 89.2 | 82 | 72.5 | 66.4 |
| The Callisto Protocol (2022) | 112.8 | 82.4 | 77.8 | 54.4 |
| Need for Speed Unbound (2022) | 104.9 | 92.6 | 74.9 | 65 |
| High On Life (2023) | 163.2 | 123 | 92.1 | 71.2 |
| The Witcher 3 v4 (2023) | 148.6 | 117.9 | 59.2 | 50.3 |
| Dead Space Remake (2023) | 62.8 | 61 | 53.7 | 53.3 |
| Hogwarts Legacy (2023) | 108 | 87.7 | 74.2 | 62.5 |
| Returnal (2023) | 84 | 80 | 72 | 62 |
| Atomic Heart (2023) | 133.9 | 103.3 | 62.8 | 49.6 |
| Company of Heroes 3 (2023) | 152.3 | 136.9 | 101.6 | 100 |
| Sons of the Forest (2023) | 78.2 | 61.5 | 59.5 | 58.5 |
| Resident Evil 4 Remake (2023) | 106.9 | 75.9 | 69.4 | 50.9 |
| The Last of Us (2023) | 74.6 | 62.5 | 55.4 | 45.2 |
Emissions - The MSI laptop heats up only moderately
Noise Levels
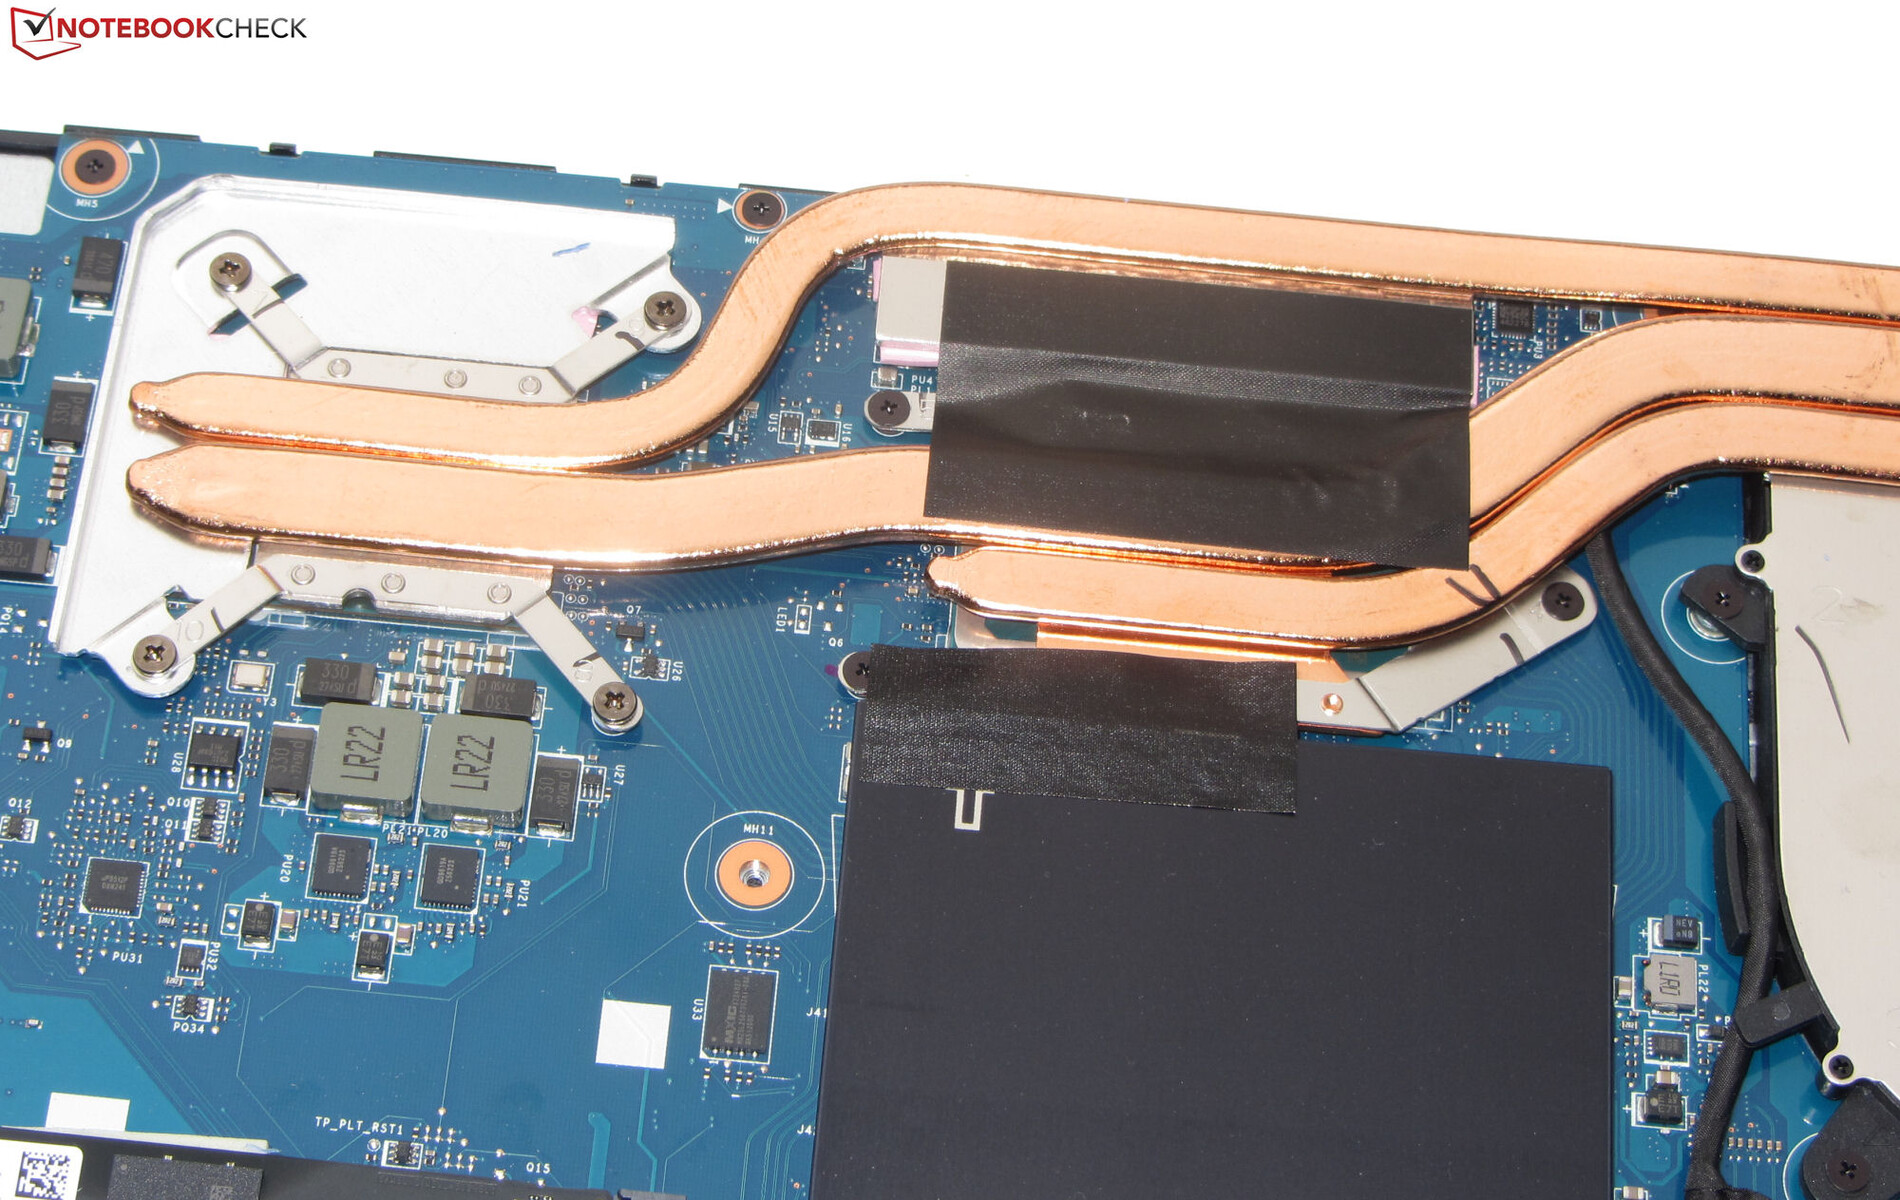
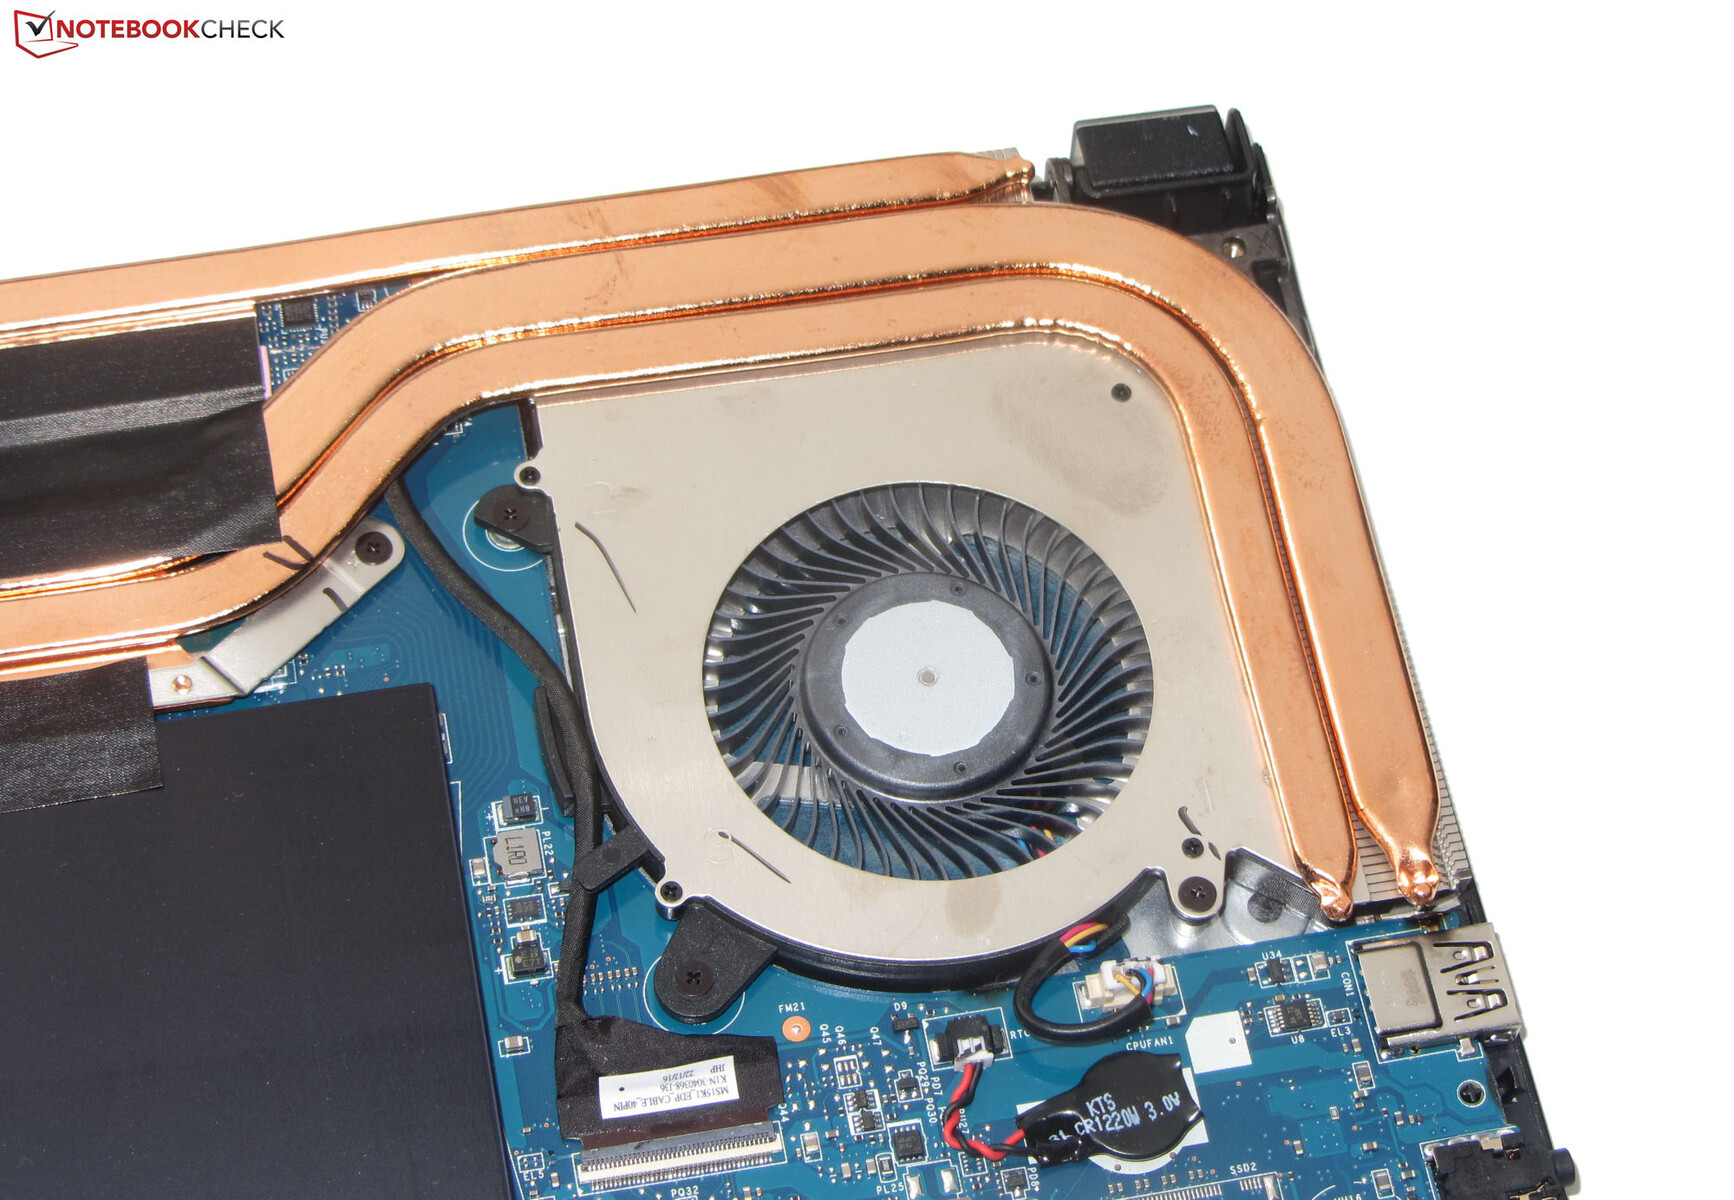
The hardware of the Cyborg is configured for a low power consumption and with that also for low heat development. While we should expect a quietly running cooling system here, we find some room for improvement in this regard.
On average, the noise development during gaming operation ranges at a moderate level. However, the laptop can become very loud under peak load. In the "Extreme Performance" mode, the maximum noise level can increase up to 56.3 dB(A). In terms of the noise development, the "Balanced" profile might recommend itself.
What is more annoying turns out to be the behavior during idle operation and in everyday operation (Office, Internet): The fan keeps running constantly in a clearly audible range, and we measure noise levels of up to 38 dB(A). This goes for all the performance profiles with the exception of the "Super Battery" profile, which often keeps the fan turned off.
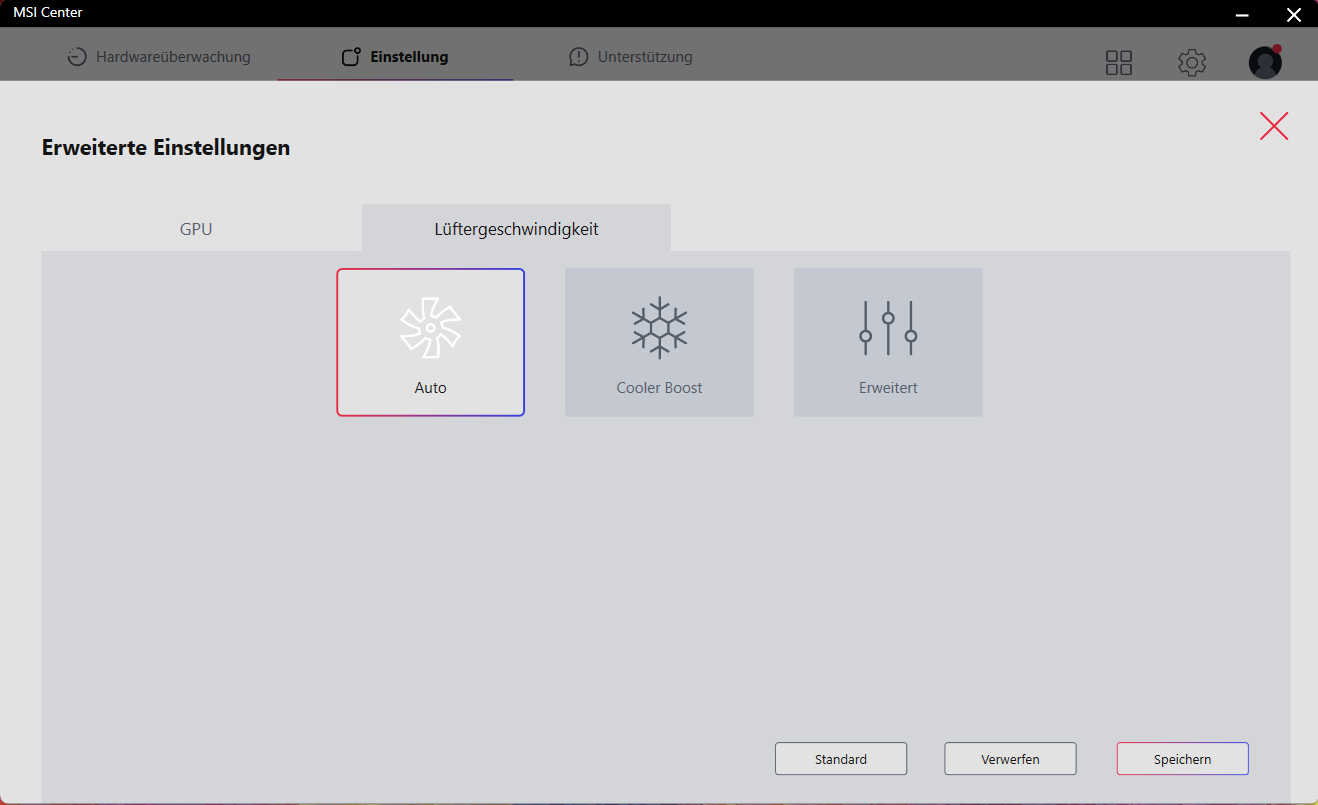
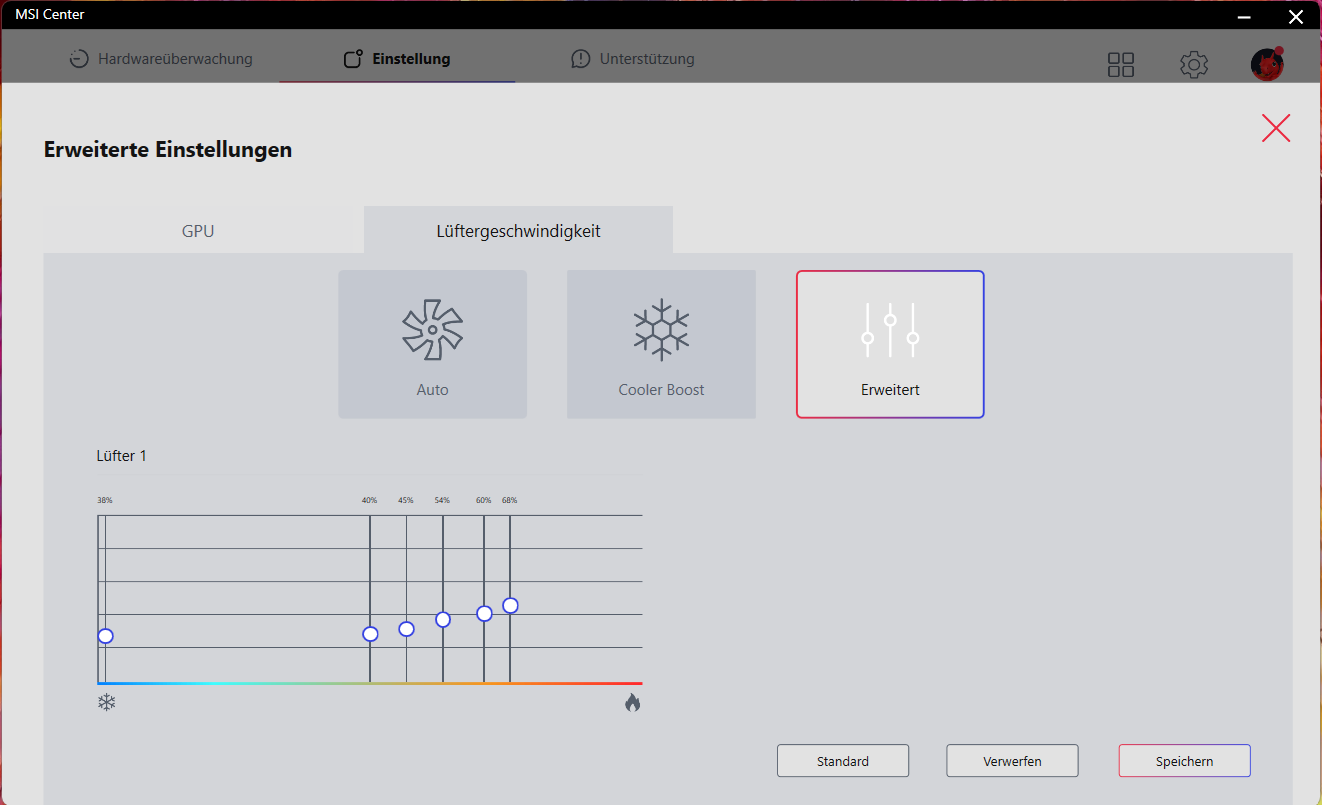
The MSI Center allows some limited access to the fan control, but only with the "Extreme Performance" profile activated (you have to click on the gear symbol). The "Auto" and "Cooler Boost" (with the fan running constantly at full speed) profiles are available. In addition, you can also adjust the fan curve.
Noise level
| Idle |
| 27 / 37.5 / 38 dB(A) |
| Load |
| 56.3 / 56.3 dB(A) |
 | ||
30 dB silent 40 dB(A) audible 50 dB(A) loud |
||
min: | ||
| MSI Cyborg 15 A12VF GeForce RTX 4060 Laptop GPU, i7-12650H, Samsung PM9B1 1024GB MZVL41T0HBLB | Asus TUF Gaming A16 FA617 Radeon RX 7600S, R7 7735HS, Micron 2400 MTFDKBA1T0QFM | Aorus 15 XE5 GeForce RTX 3070 Ti Laptop GPU, i7-12700H, Gigabyte AG470S1TB-SI B10 | Schenker XMG Fusion 15 (Mid 22) GeForce RTX 3070 Laptop GPU, i7-11800H, Samsung SSD 980 Pro 1TB MZ-V8P1T0BW | MSI Katana 15 B12VEK GeForce RTX 4050 Laptop GPU, i7-12650H, Micron 2400 MTFDKBA1T0QFM | HP Victus 15 fa0020nr GeForce RTX 3050 Ti Laptop GPU, i7-12700H, Samsung PM9A1 MZVL2512HCJQ | |
|---|---|---|---|---|---|---|
| Noise | 20% | 14% | 14% | 22% | 20% | |
| off / environment * (dB) | 27 | 24 11% | 24 11% | 26 4% | 24 11% | 24.8 8% |
| Idle Minimum * (dB) | 27 | 24 11% | 26 4% | 26 4% | 24 11% | 26.2 3% |
| Idle Average * (dB) | 37.5 | 25 33% | 28 25% | 28 25% | 24 36% | 29.2 22% |
| Idle Maximum * (dB) | 38 | 28 26% | 30 21% | 31 18% | 24 37% | 29.4 23% |
| Load Average * (dB) | 56.3 | 42 25% | 48 15% | 45 20% | 37.71 33% | 29.9 47% |
| Load Maximum * (dB) | 56.3 | 50 11% | 52 8% | 48 15% | 54.55 3% | 45.5 19% |
| Witcher 3 ultra * (dB) | 50 | 52 | 46 | 45.75 | 41.1 |
* ... smaller is better
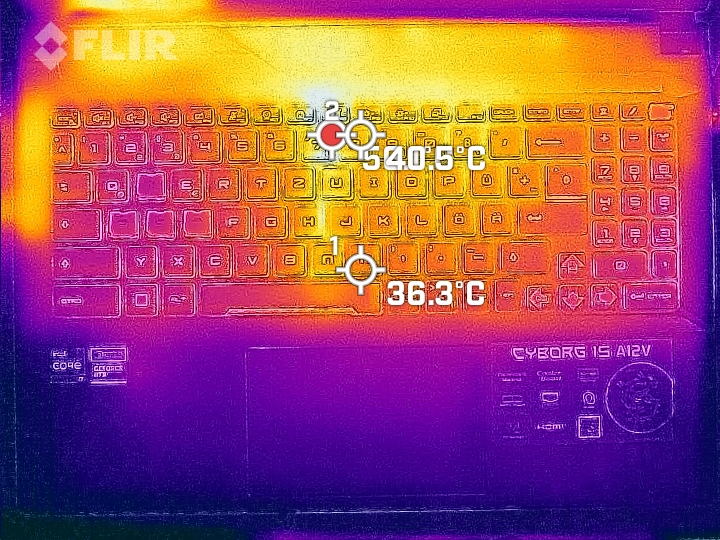
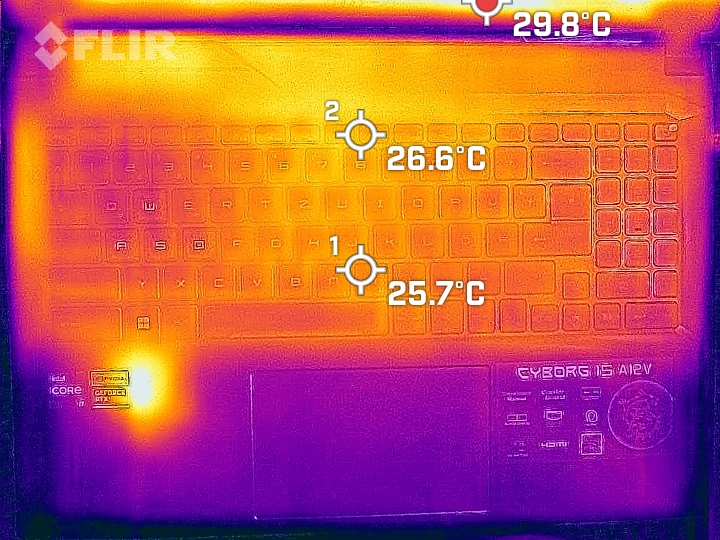
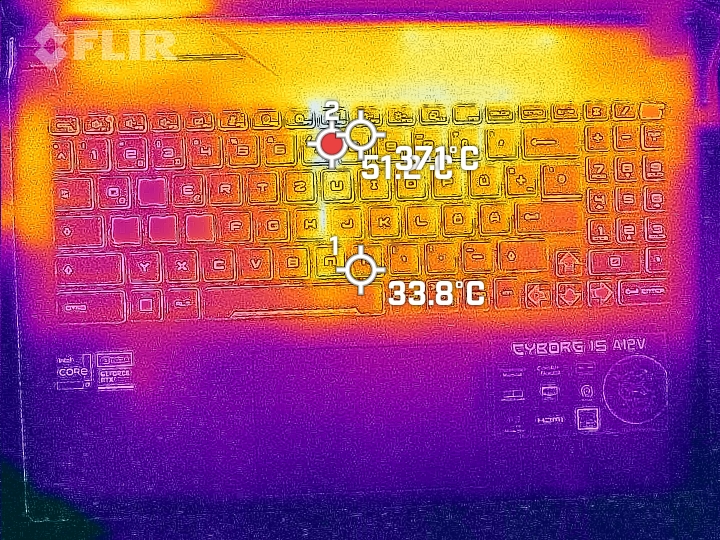
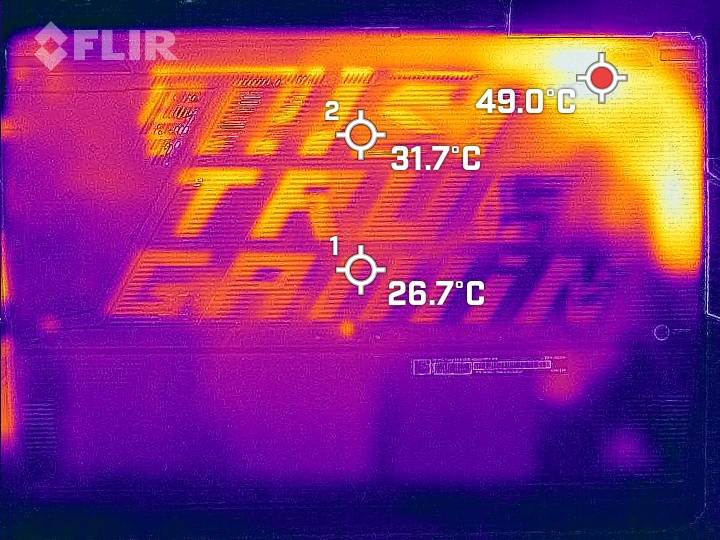
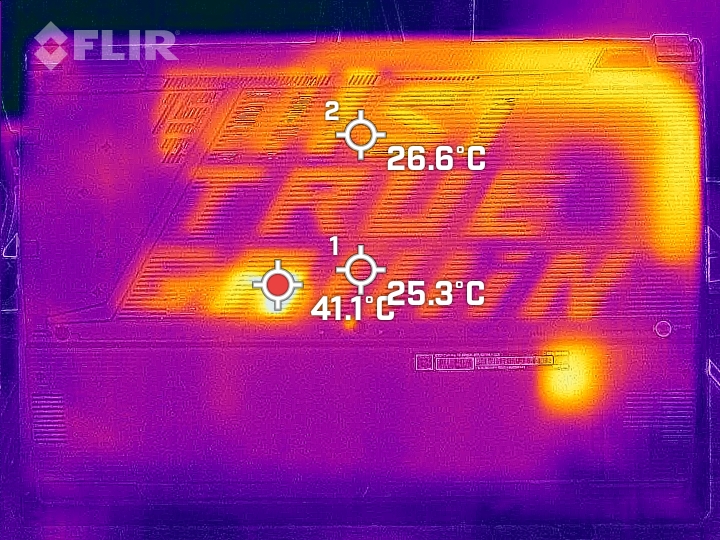
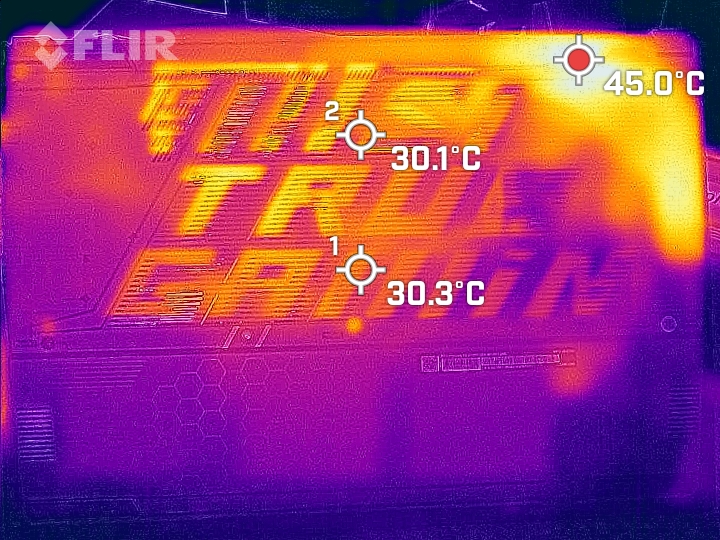
Temperatures
The laptop heats up moderately at best. The highest temperatures (40 to 47.5 °C, 104 to 117.5 °F) are reached in three measurement points during the stress test. In everyday operation, the temperatures remain within the green range.
(-) The maximum temperature on the upper side is 47.5 °C / 118 F, compared to the average of 40.4 °C / 105 F, ranging from 21.2 to 68.8 °C for the class Gaming.
(+) The bottom heats up to a maximum of 35.5 °C / 96 F, compared to the average of 43.2 °C / 110 F
(+) In idle usage, the average temperature for the upper side is 25.9 °C / 79 F, compared to the device average of 33.9 °C / 93 F.
(±) Playing The Witcher 3, the average temperature for the upper side is 35.6 °C / 96 F, compared to the device average of 33.9 °C / 93 F.
(+) The palmrests and touchpad are cooler than skin temperature with a maximum of 27.8 °C / 82 F and are therefore cool to the touch.
(±) The average temperature of the palmrest area of similar devices was 28.8 °C / 83.8 F (+1 °C / 1.8 F).
| MSI Cyborg 15 A12VF Intel Core i7-12650H, NVIDIA GeForce RTX 4060 Laptop GPU | Asus TUF Gaming A16 FA617 AMD Ryzen 7 7735HS, AMD Radeon RX 7600S | Aorus 15 XE5 Intel Core i7-12700H, NVIDIA GeForce RTX 3070 Ti Laptop GPU | Schenker XMG Fusion 15 (Mid 22) Intel Core i7-11800H, NVIDIA GeForce RTX 3070 Laptop GPU | MSI Katana 15 B12VEK Intel Core i7-12650H, NVIDIA GeForce RTX 4050 Laptop GPU | HP Victus 15 fa0020nr Intel Core i7-12700H, NVIDIA GeForce RTX 3050 Ti Laptop GPU | |
|---|---|---|---|---|---|---|
| Heat | -32% | -34% | -37% | -22% | 16% | |
| Maximum Upper Side * (°C) | 47.5 | 54 -14% | 46 3% | 52 -9% | 47 1% | 37.2 22% |
| Maximum Bottom * (°C) | 35.5 | 47 -32% | 57 -61% | 63 -77% | 48 -35% | 35.4 -0% |
| Idle Upper Side * (°C) | 27.7 | 40 -44% | 38 -37% | 37 -34% | 35 -26% | 22.4 19% |
| Idle Bottom * (°C) | 29.5 | 40 -36% | 42 -42% | 38 -29% | 38 -29% | 22.6 23% |
* ... smaller is better
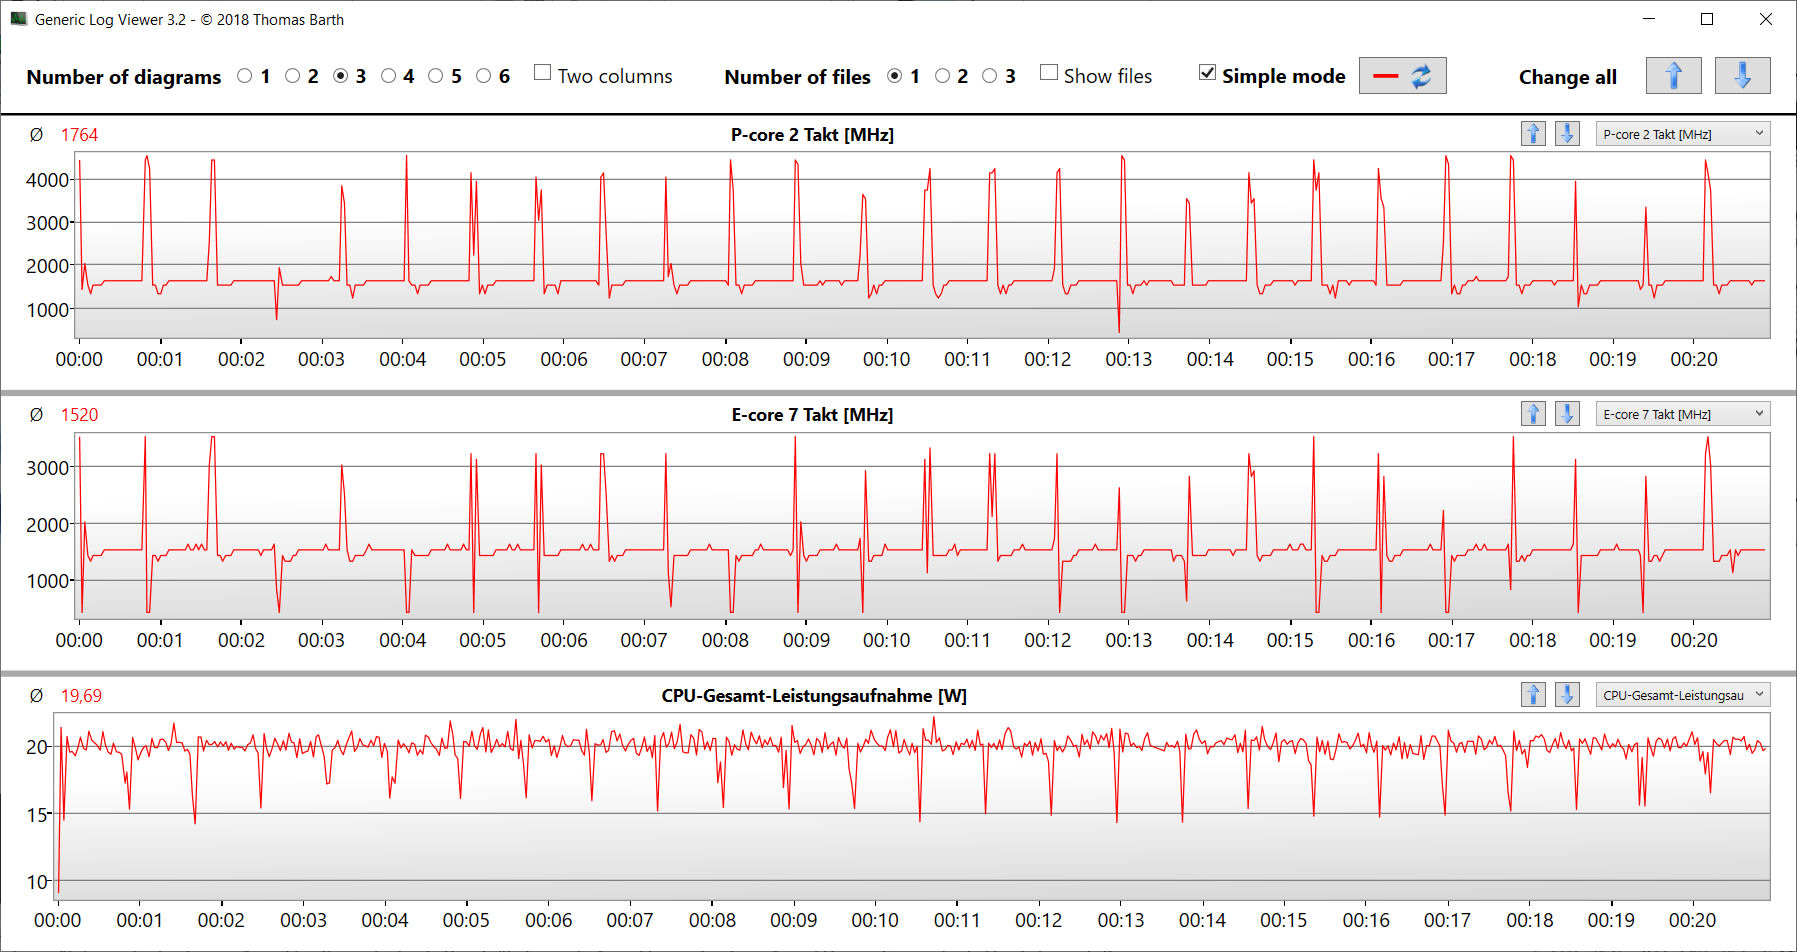
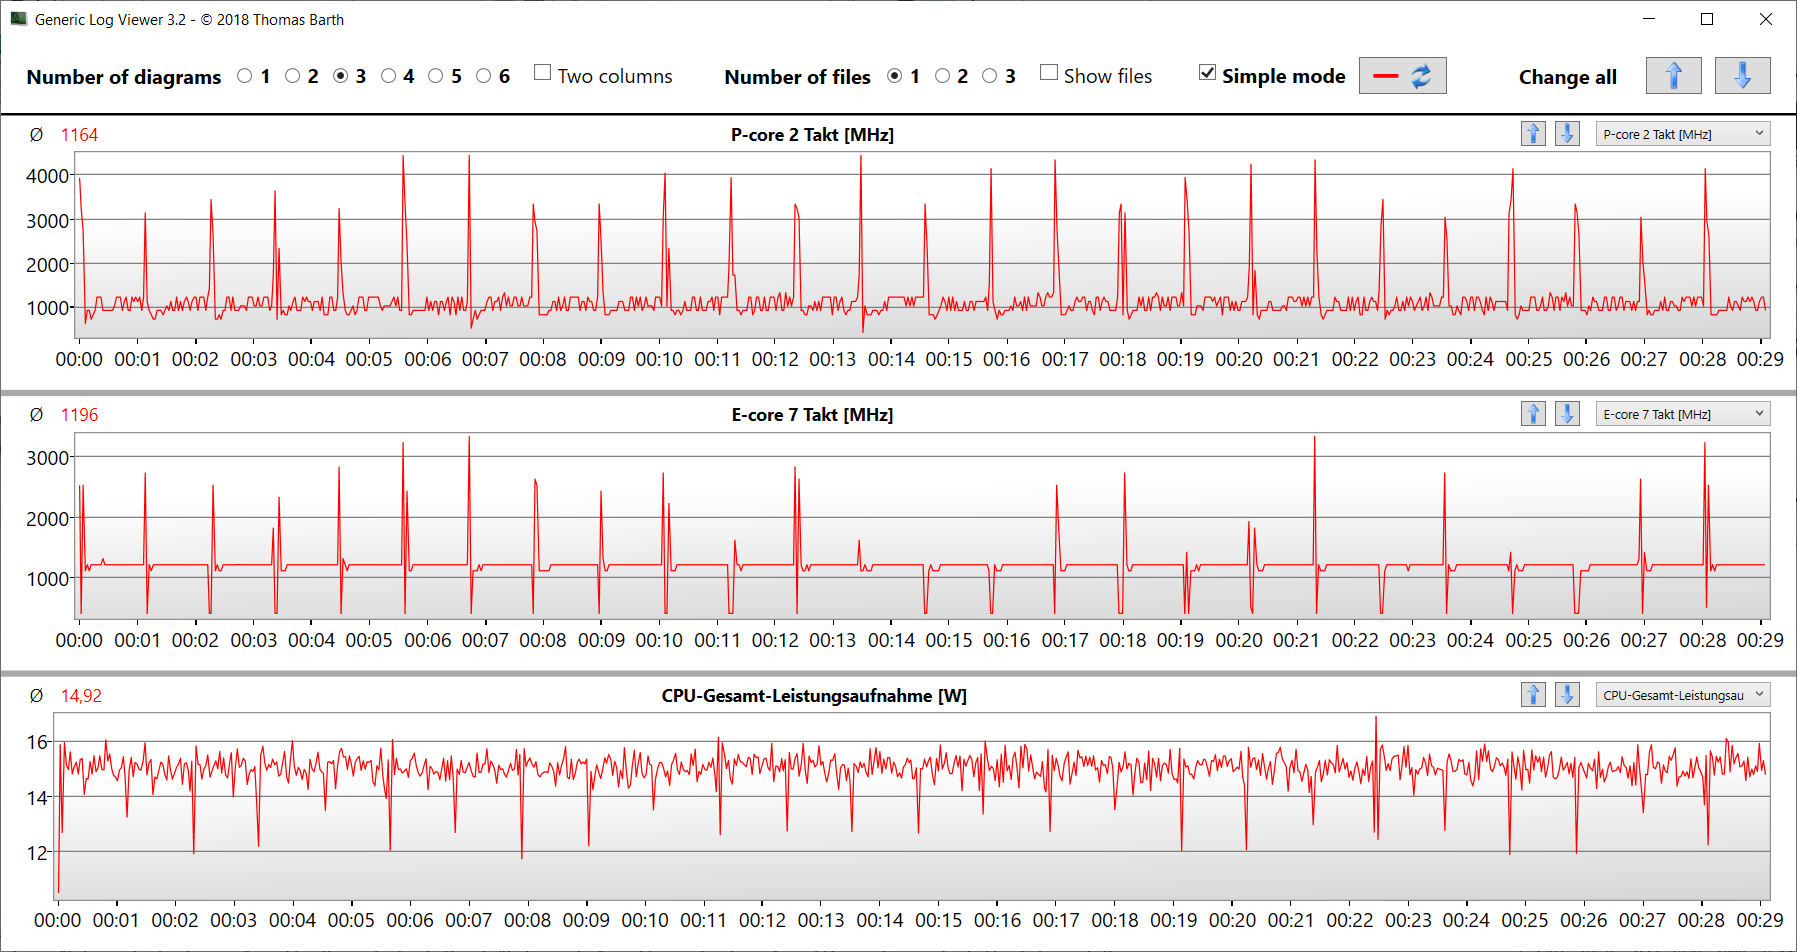
Stress Test
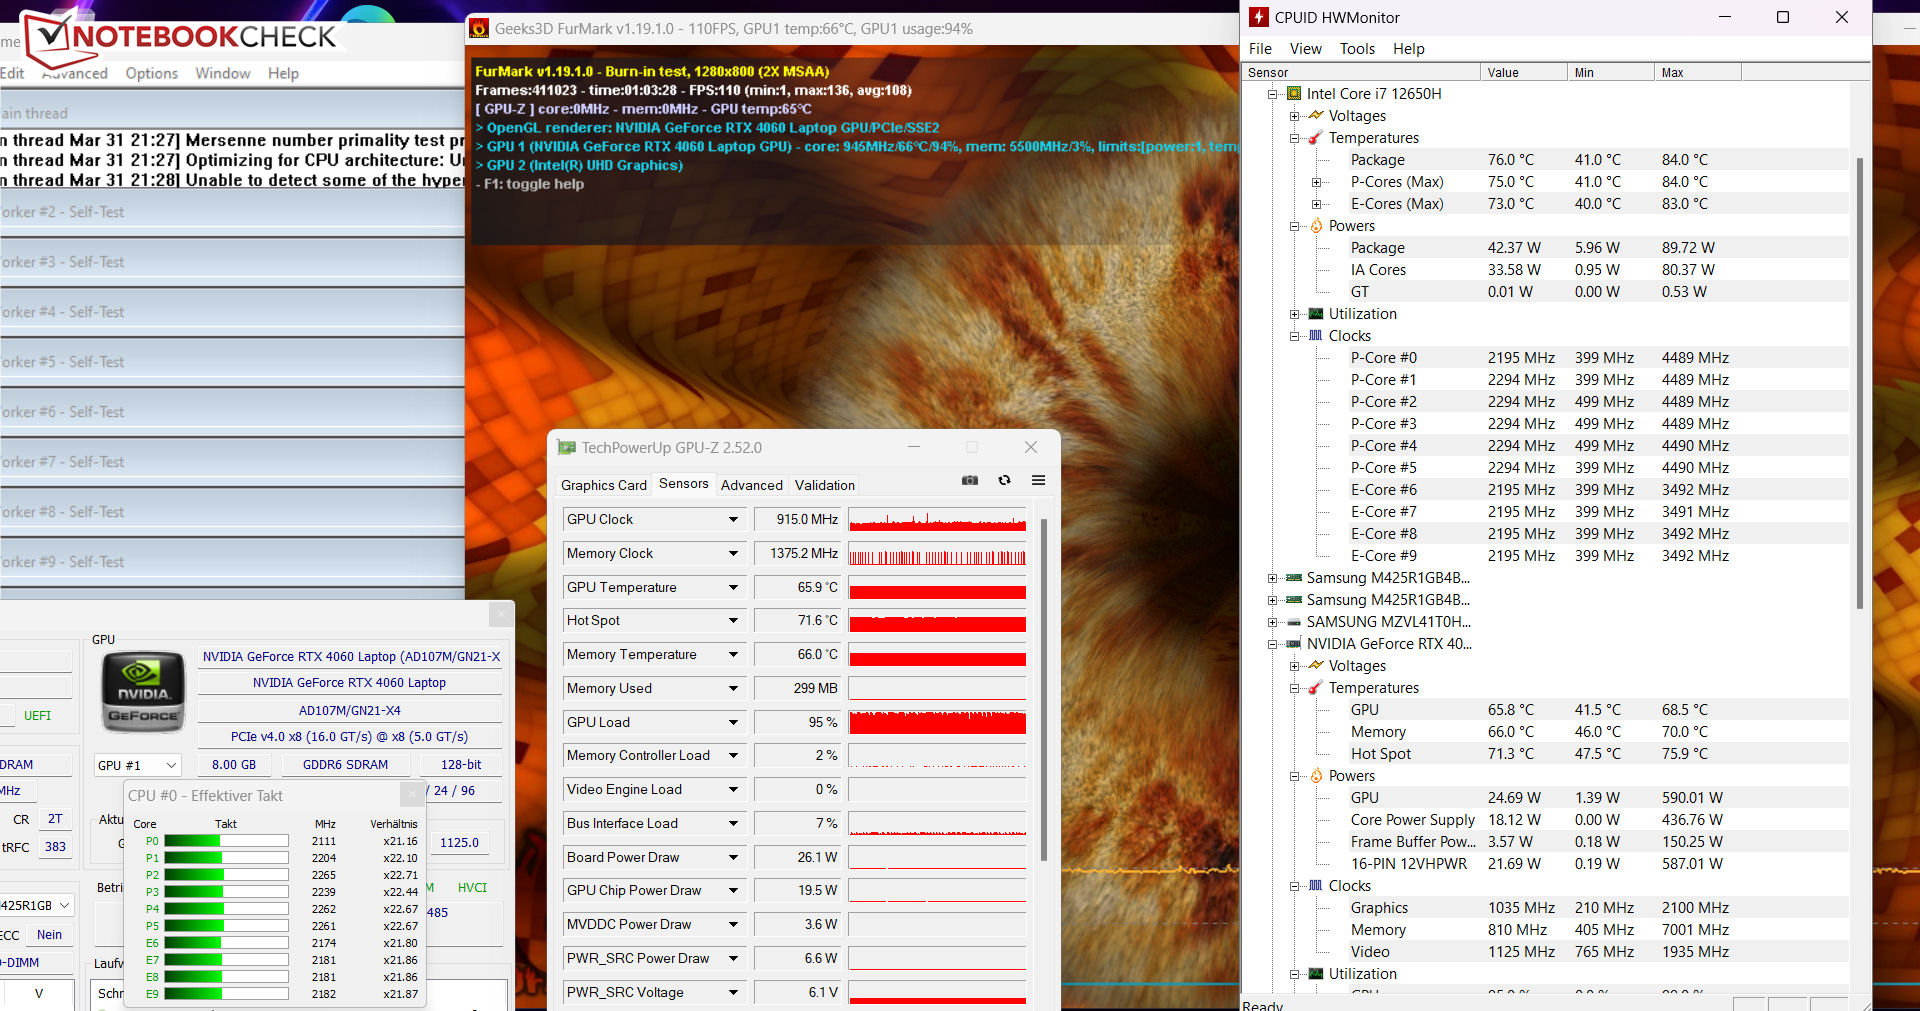
The stress test (with Prime95 and Furmark running constantly) represents an extreme scenario to evaluate the system stability under full load. The CPU (P: 3.3 to 3.5 GHz, E: 2.8 GHz) and GPU (1,000 to 1,500 MHz) begin the test at medium-high clock speeds, with the values dropping during the course of the test.
Speakers
The stereo speakers produce a decent sound, but it hardly contains any bass. For a better sound experience, headphones or external speakers are recommended.
MSI Cyborg 15 A12VF audio analysis
(±) | speaker loudness is average but good (77.79 dB)
Bass 100 - 315 Hz
(-) | nearly no bass - on average 19.8% lower than median
(±) | linearity of bass is average (12.2% delta to prev. frequency)
Mids 400 - 2000 Hz
(+) | balanced mids - only 1.8% away from median
(+) | mids are linear (5% delta to prev. frequency)
Highs 2 - 16 kHz
(+) | balanced highs - only 4.2% away from median
(+) | highs are linear (3.9% delta to prev. frequency)
Overall 100 - 16.000 Hz
(+) | overall sound is linear (14.2% difference to median)
Compared to same class
» 25% of all tested devices in this class were better, 7% similar, 68% worse
» The best had a delta of 6%, average was 18%, worst was 132%
Compared to all devices tested
» 17% of all tested devices were better, 4% similar, 79% worse
» The best had a delta of 4%, average was 23%, worst was 134%
Asus TUF Gaming A16 FA617 audio analysis
(+) | speakers can play relatively loud (82 dB)
Bass 100 - 315 Hz
(±) | reduced bass - on average 14.4% lower than median
(±) | linearity of bass is average (8.3% delta to prev. frequency)
Mids 400 - 2000 Hz
(±) | higher mids - on average 6.5% higher than median
(+) | mids are linear (3.8% delta to prev. frequency)
Highs 2 - 16 kHz
(±) | reduced highs - on average 6% lower than median
(±) | linearity of highs is average (10.4% delta to prev. frequency)
Overall 100 - 16.000 Hz
(±) | linearity of overall sound is average (18.8% difference to median)
Compared to same class
» 62% of all tested devices in this class were better, 8% similar, 30% worse
» The best had a delta of 6%, average was 18%, worst was 132%
Compared to all devices tested
» 43% of all tested devices were better, 8% similar, 49% worse
» The best had a delta of 4%, average was 23%, worst was 134%
Power Management - Gaming laptop with a good battery life
Power Consumption
Overall, the MSI laptop proves to be very efficient in terms of the power consumption. Across the whole load range, the consumption remains lower than that of the competitors. It runs through our The Witcher 3 and stress tests with a relatively constant power consumption. The power supply is sufficiently sized at 120 watts.
| Off / Standby | |
| Idle | |
| Load |
|
Key:
min: | |
| MSI Cyborg 15 A12VF i7-12650H, GeForce RTX 4060 Laptop GPU, Samsung PM9B1 1024GB MZVL41T0HBLB, IPS, 1920x1080, 15.6" | Asus TUF Gaming A16 FA617 R7 7735HS, Radeon RX 7600S, Micron 2400 MTFDKBA1T0QFM, IPS-Level, 1920x1200, 16" | Aorus 15 XE5 i7-12700H, GeForce RTX 3070 Ti Laptop GPU, Gigabyte AG470S1TB-SI B10, IPS, 2560x1440, 15.6" | Schenker XMG Fusion 15 (Mid 22) i7-11800H, GeForce RTX 3070 Laptop GPU, Samsung SSD 980 Pro 1TB MZ-V8P1T0BW, IPS, 2560x1440, 15.6" | MSI Katana 15 B12VEK i7-12650H, GeForce RTX 4050 Laptop GPU, Micron 2400 MTFDKBA1T0QFM, IPS, 1920x1080, 15.6" | HP Victus 15 fa0020nr i7-12700H, GeForce RTX 3050 Ti Laptop GPU, Samsung PM9A1 MZVL2512HCJQ, IPS, 1920x1080, 15.6" | Average NVIDIA GeForce RTX 4060 Laptop GPU | Average of class Gaming | |
|---|---|---|---|---|---|---|---|---|
| Power Consumption | -42% | -222% | -84% | -30% | -40% | -72% | -102% | |
| Idle Minimum * (Watt) | 6 | 8 -33% | 31 -417% | 12 -100% | 8.5 -42% | 5.1 15% | 11.5 ? -92% | 13 ? -117% |
| Idle Average * (Watt) | 8.8 | 11 -25% | 35 -298% | 17 -93% | 10.2 -16% | 15.1 -72% | 16 ? -82% | 18.6 ? -111% |
| Idle Maximum * (Watt) | 11.9 | 16 -34% | 46 -287% | 24 -102% | 11.3 5% | 18.9 -59% | 20.3 ? -71% | 24.2 ? -103% |
| Load Average * (Watt) | 89 | 97 -9% | 120 -35% | 106 -19% | 84 6% | 114.5 -29% | 92.9 ? -4% | 108.7 ? -22% |
| Witcher 3 ultra * (Watt) | 90.3 | 161.5 -79% | 202 -124% | 159.9 -77% | 128 -42% | 113.9 -26% | ||
| Load Maximum * (Watt) | 99 | 168 -70% | 268 -171% | 208 -110% | 189 -91% | 165.8 -67% | 210 ? -112% | 255 ? -158% |
* ... smaller is better
Power Consumption The Witcher 3 / Stress Test
Power Consumption With External Monitor
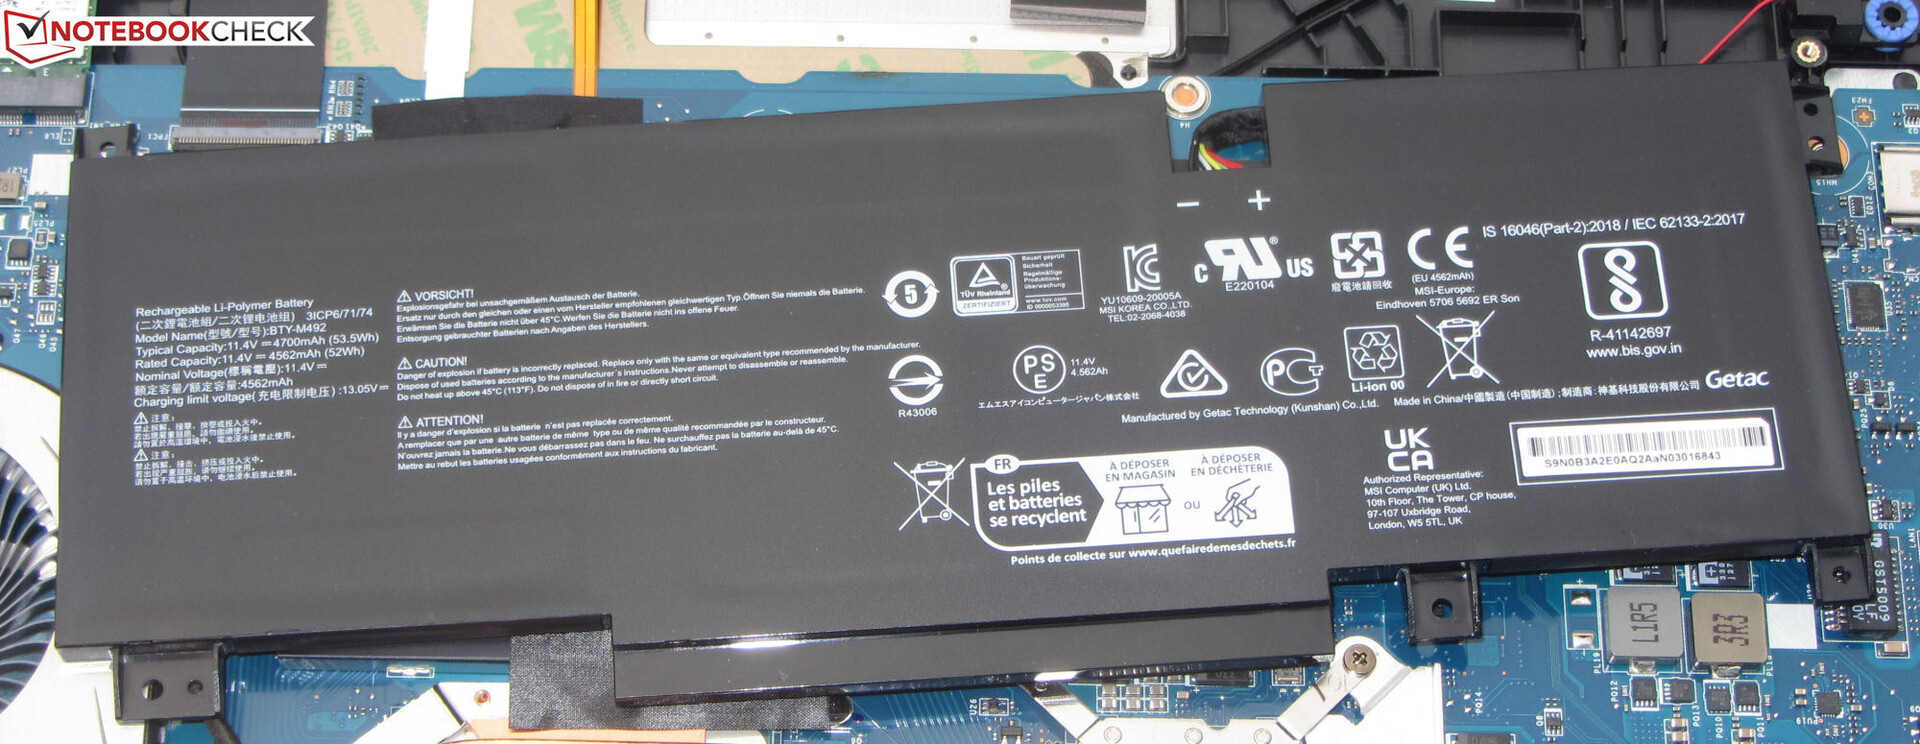
Battery Life
In the WLAN test where websites are loaded via script, and the video test with the short film Big Buck Bunny (H.264 coding, FHD) running in a loop, the 15.6-inch laptop reaches runtimes of 7:32 h and 8:00 h respectively. During both tests, the power saving functions of the laptop are deactivated, and the display brightness is reduced to about 150 cd/m². To run the video test, the wireless communication modules are also deactivated.
The MSI laptop offers a good battery life overall, despite its relatively small battery capacity of 53.5 Wh. The fact that it is unable to keep up with the TUF Gaming A16 is due to the combination of a large 90-Wh battery and energy efficient AMD APU offered by that laptop. If we calculate the runtime per Watthour, the Cyborg is ahead.
| MSI Cyborg 15 A12VF i7-12650H, GeForce RTX 4060 Laptop GPU, 53.5 Wh | Asus TUF Gaming A16 FA617 R7 7735HS, Radeon RX 7600S, 90 Wh | Aorus 15 XE5 i7-12700H, GeForce RTX 3070 Ti Laptop GPU, 99 Wh | Schenker XMG Fusion 15 (Mid 22) i7-11800H, GeForce RTX 3070 Laptop GPU, 93.48 Wh | MSI Katana 15 B12VEK i7-12650H, GeForce RTX 4050 Laptop GPU, 53.5 Wh | HP Victus 15 fa0020nr i7-12700H, GeForce RTX 3050 Ti Laptop GPU, 70 Wh | Average of class Gaming | |
|---|---|---|---|---|---|---|---|
| Battery runtime | 25% | -19% | -4% | -41% | -68% | -17% | |
| Reader / Idle (h) | 13.6 | 20.2 49% | 10 -26% | 15.5 14% | 2.6 -81% | 8.71 ? -36% | |
| H.264 (h) | 8 | 6.2 -22% | 7.5 -6% | 4.4 -45% | 8.64 ? 8% | ||
| WiFi v1.3 (h) | 7.5 | 12.1 61% | 6.8 -9% | 7.4 -1% | 4.3 -43% | 2.1 -72% | 7.07 ? -6% |
| Load (h) | 2.3 | 1.5 -35% | 1.9 -17% | 1.8 -22% | 1.5 -35% | 1.1 -52% | 1.502 ? -35% |
Pros
Cons
Verdict - Gaming laptop with a low power consumption

The focus of the MSI Cyborg 15 lies on a compromise of performance, mobility, and power consumption. Due to the reduced performance settings, the Core i7-12650H and GeForce RTX 4060 perform below their capabilities. Nonetheless, their computing power is still sufficient for FHD gaming at high to maximum settings even then.
While we like the concept of the Cyborg 15, its implementation still leaves room for improvement. A current high-end GPU still offers sufficient performance for FHD gaming even at a low TGP of 45 watts.
The power consumption, which is low for a gaming laptop, can be translated into a good battery life. Realistic values of 7 to 8 h are still possible, despite the relatively small battery capacity of 53.5 Wh. Unfortunately the USB-C port doesn't offer any support for Power Delivery, which would be a sensible feature in the case of the Cyborg.
While the laptop doesn't get particularly hot, its maximum noise level is at the usual high level for the laptop class. In addition, the fan remains constantly audible during idle operation. We would have expected more here. This might be the price of forgoing a second fan together with the corresponding heat pipe. Besides the cooling system, the display (FHD, 144 Hz, IPS) represents another weakness of the laptop, with the brightness and color space coverage turning out too low.
An alternative might be the Asus TUF Gaming A16 FA617. It offers a comparable computing performance but scores with a significantly longer battery life, better screen, and a lower maximum noise development. On the other hand, that laptop consumes significantly more power under load than the Cyborg 15.
Price and Availability
MSI Cyborg 15 A12VF
- 04/09/2023 v7 (old)
Sascha Mölck
Transparency
The selection of devices to be reviewed is made by our editorial team. The test sample was provided to the author as a loan by the manufacturer or retailer for the purpose of this review. The lender had no influence on this review, nor did the manufacturer receive a copy of this review before publication. There was no obligation to publish this review. As an independent media company, Notebookcheck is not subjected to the authority of manufacturers, retailers or publishers.
This is how Notebookcheck is testing
Every year, Notebookcheck independently reviews hundreds of laptops and smartphones using standardized procedures to ensure that all results are comparable. We have continuously developed our test methods for around 20 years and set industry standards in the process. In our test labs, high-quality measuring equipment is utilized by experienced technicians and editors. These tests involve a multi-stage validation process. Our complex rating system is based on hundreds of well-founded measurements and benchmarks, which maintains objectivity. Further information on our test methods can be found here.
Price comparison

