
Verdict
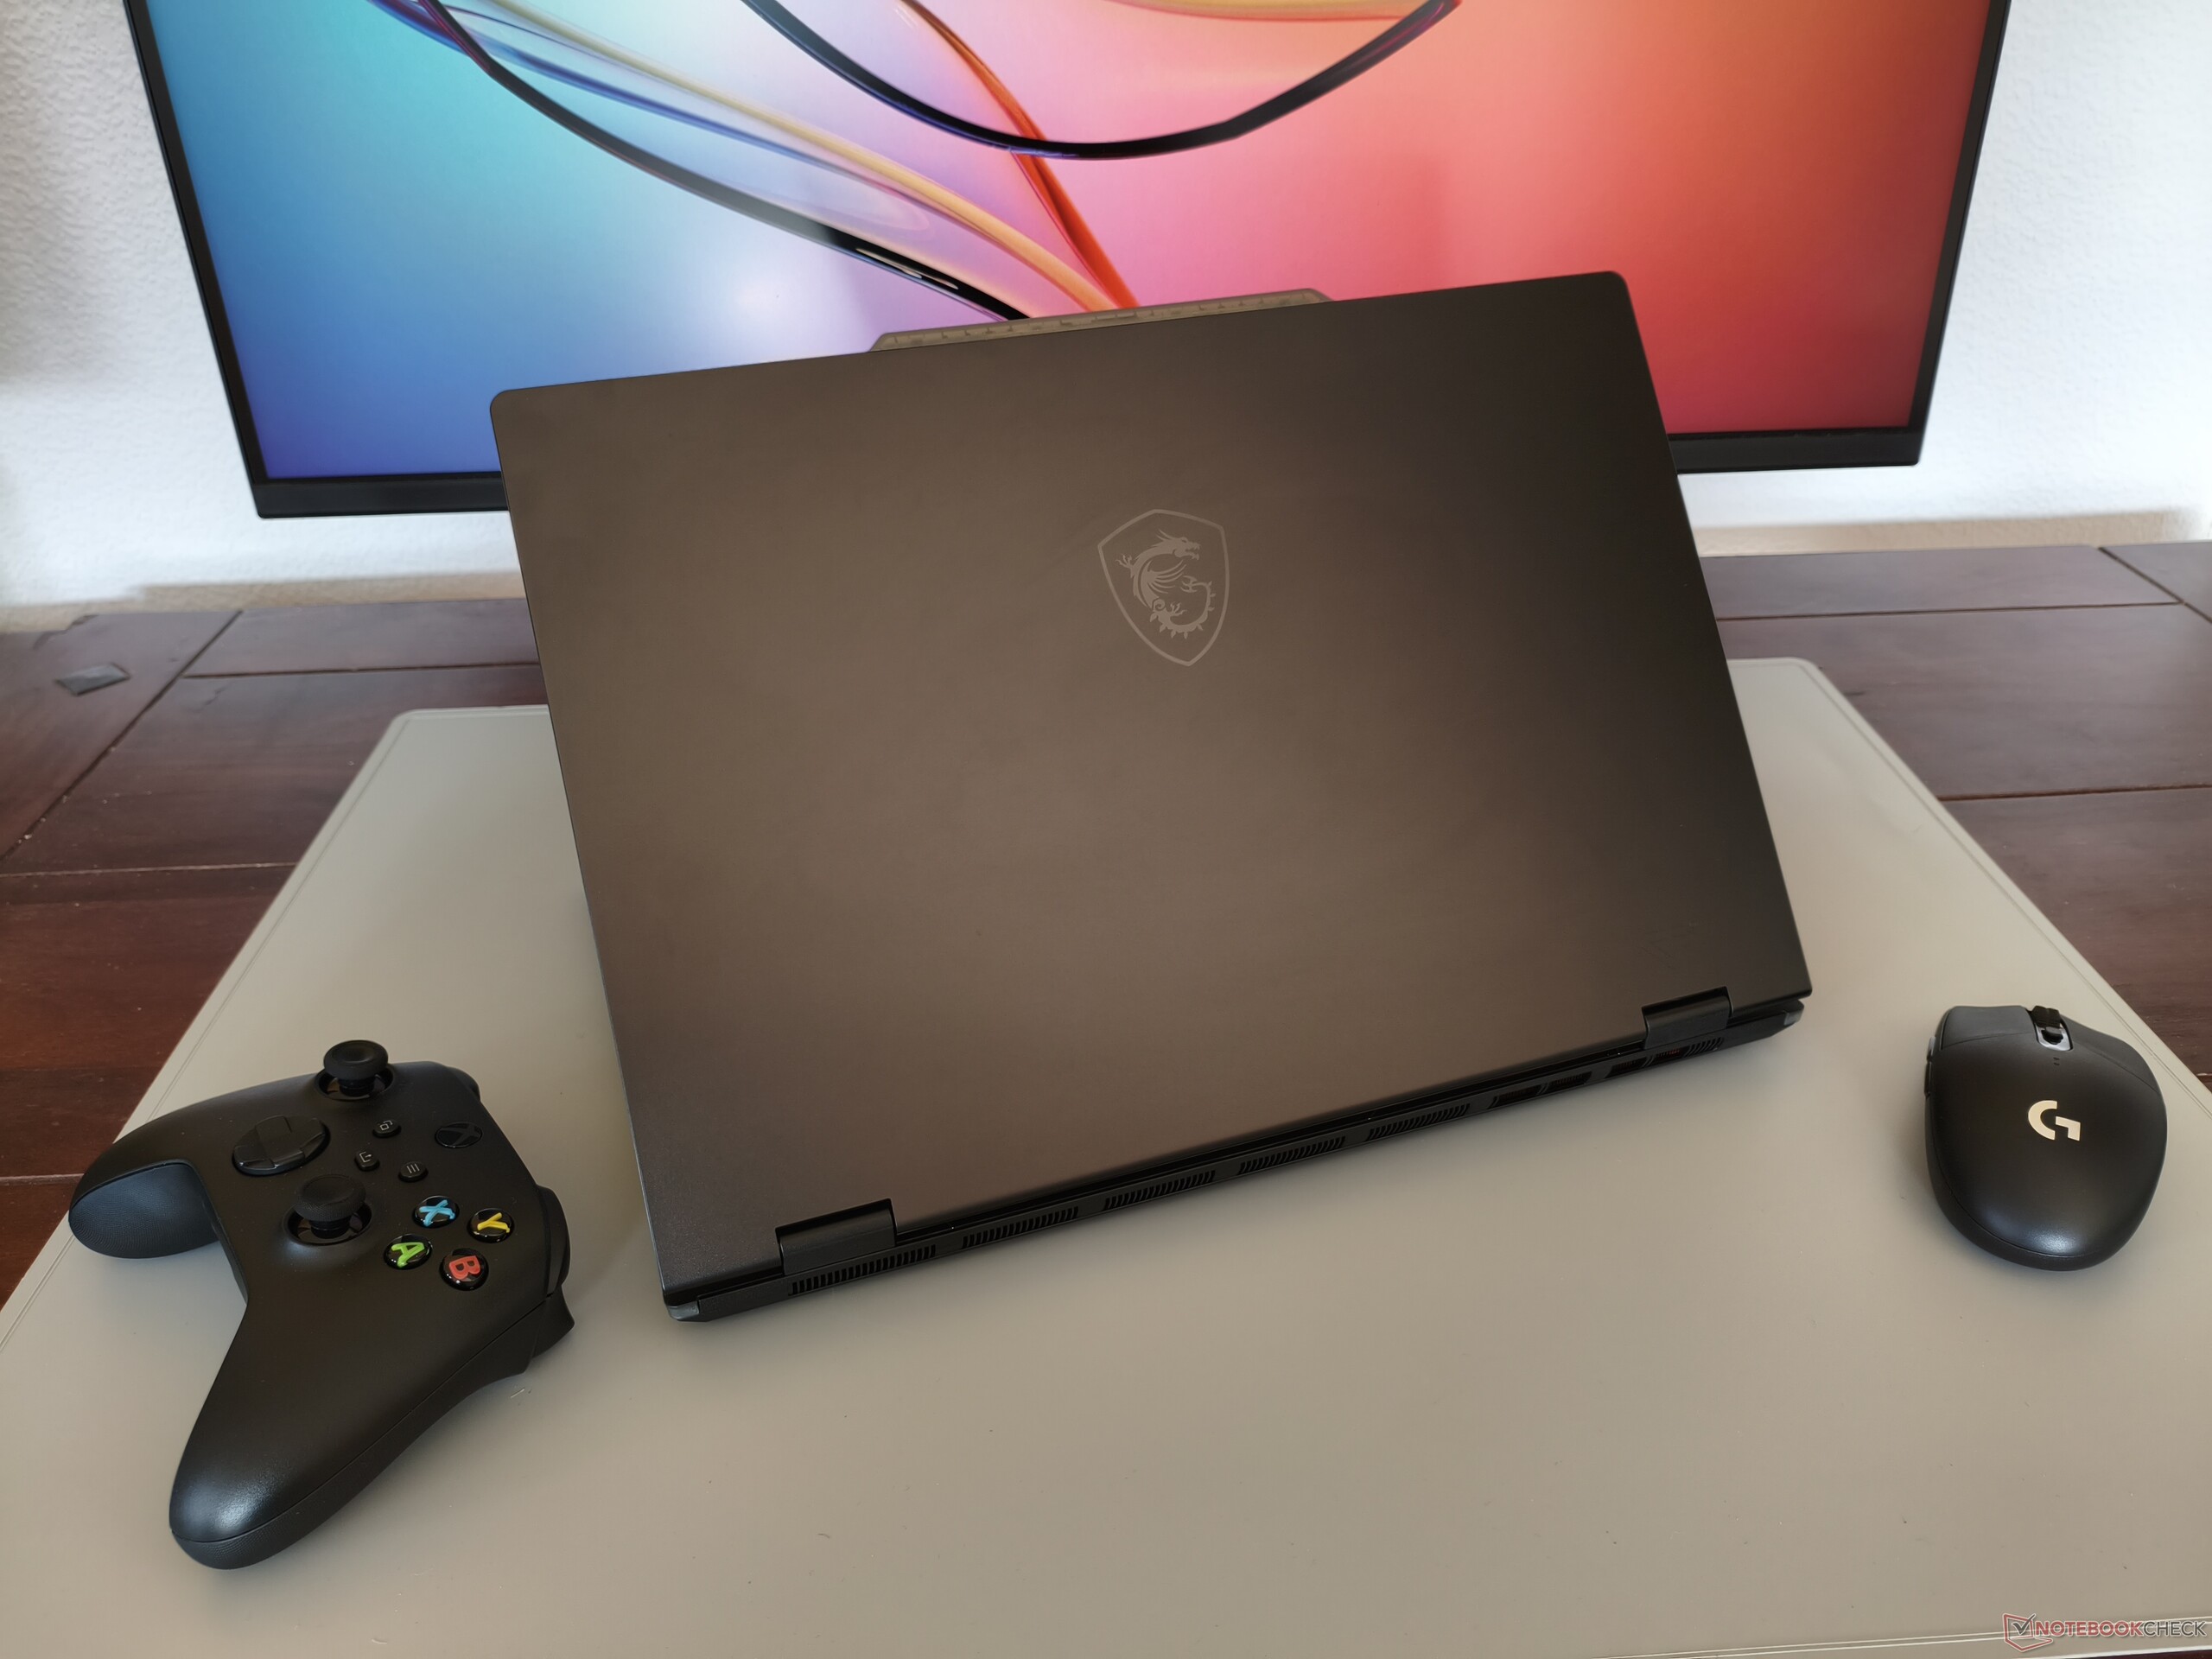
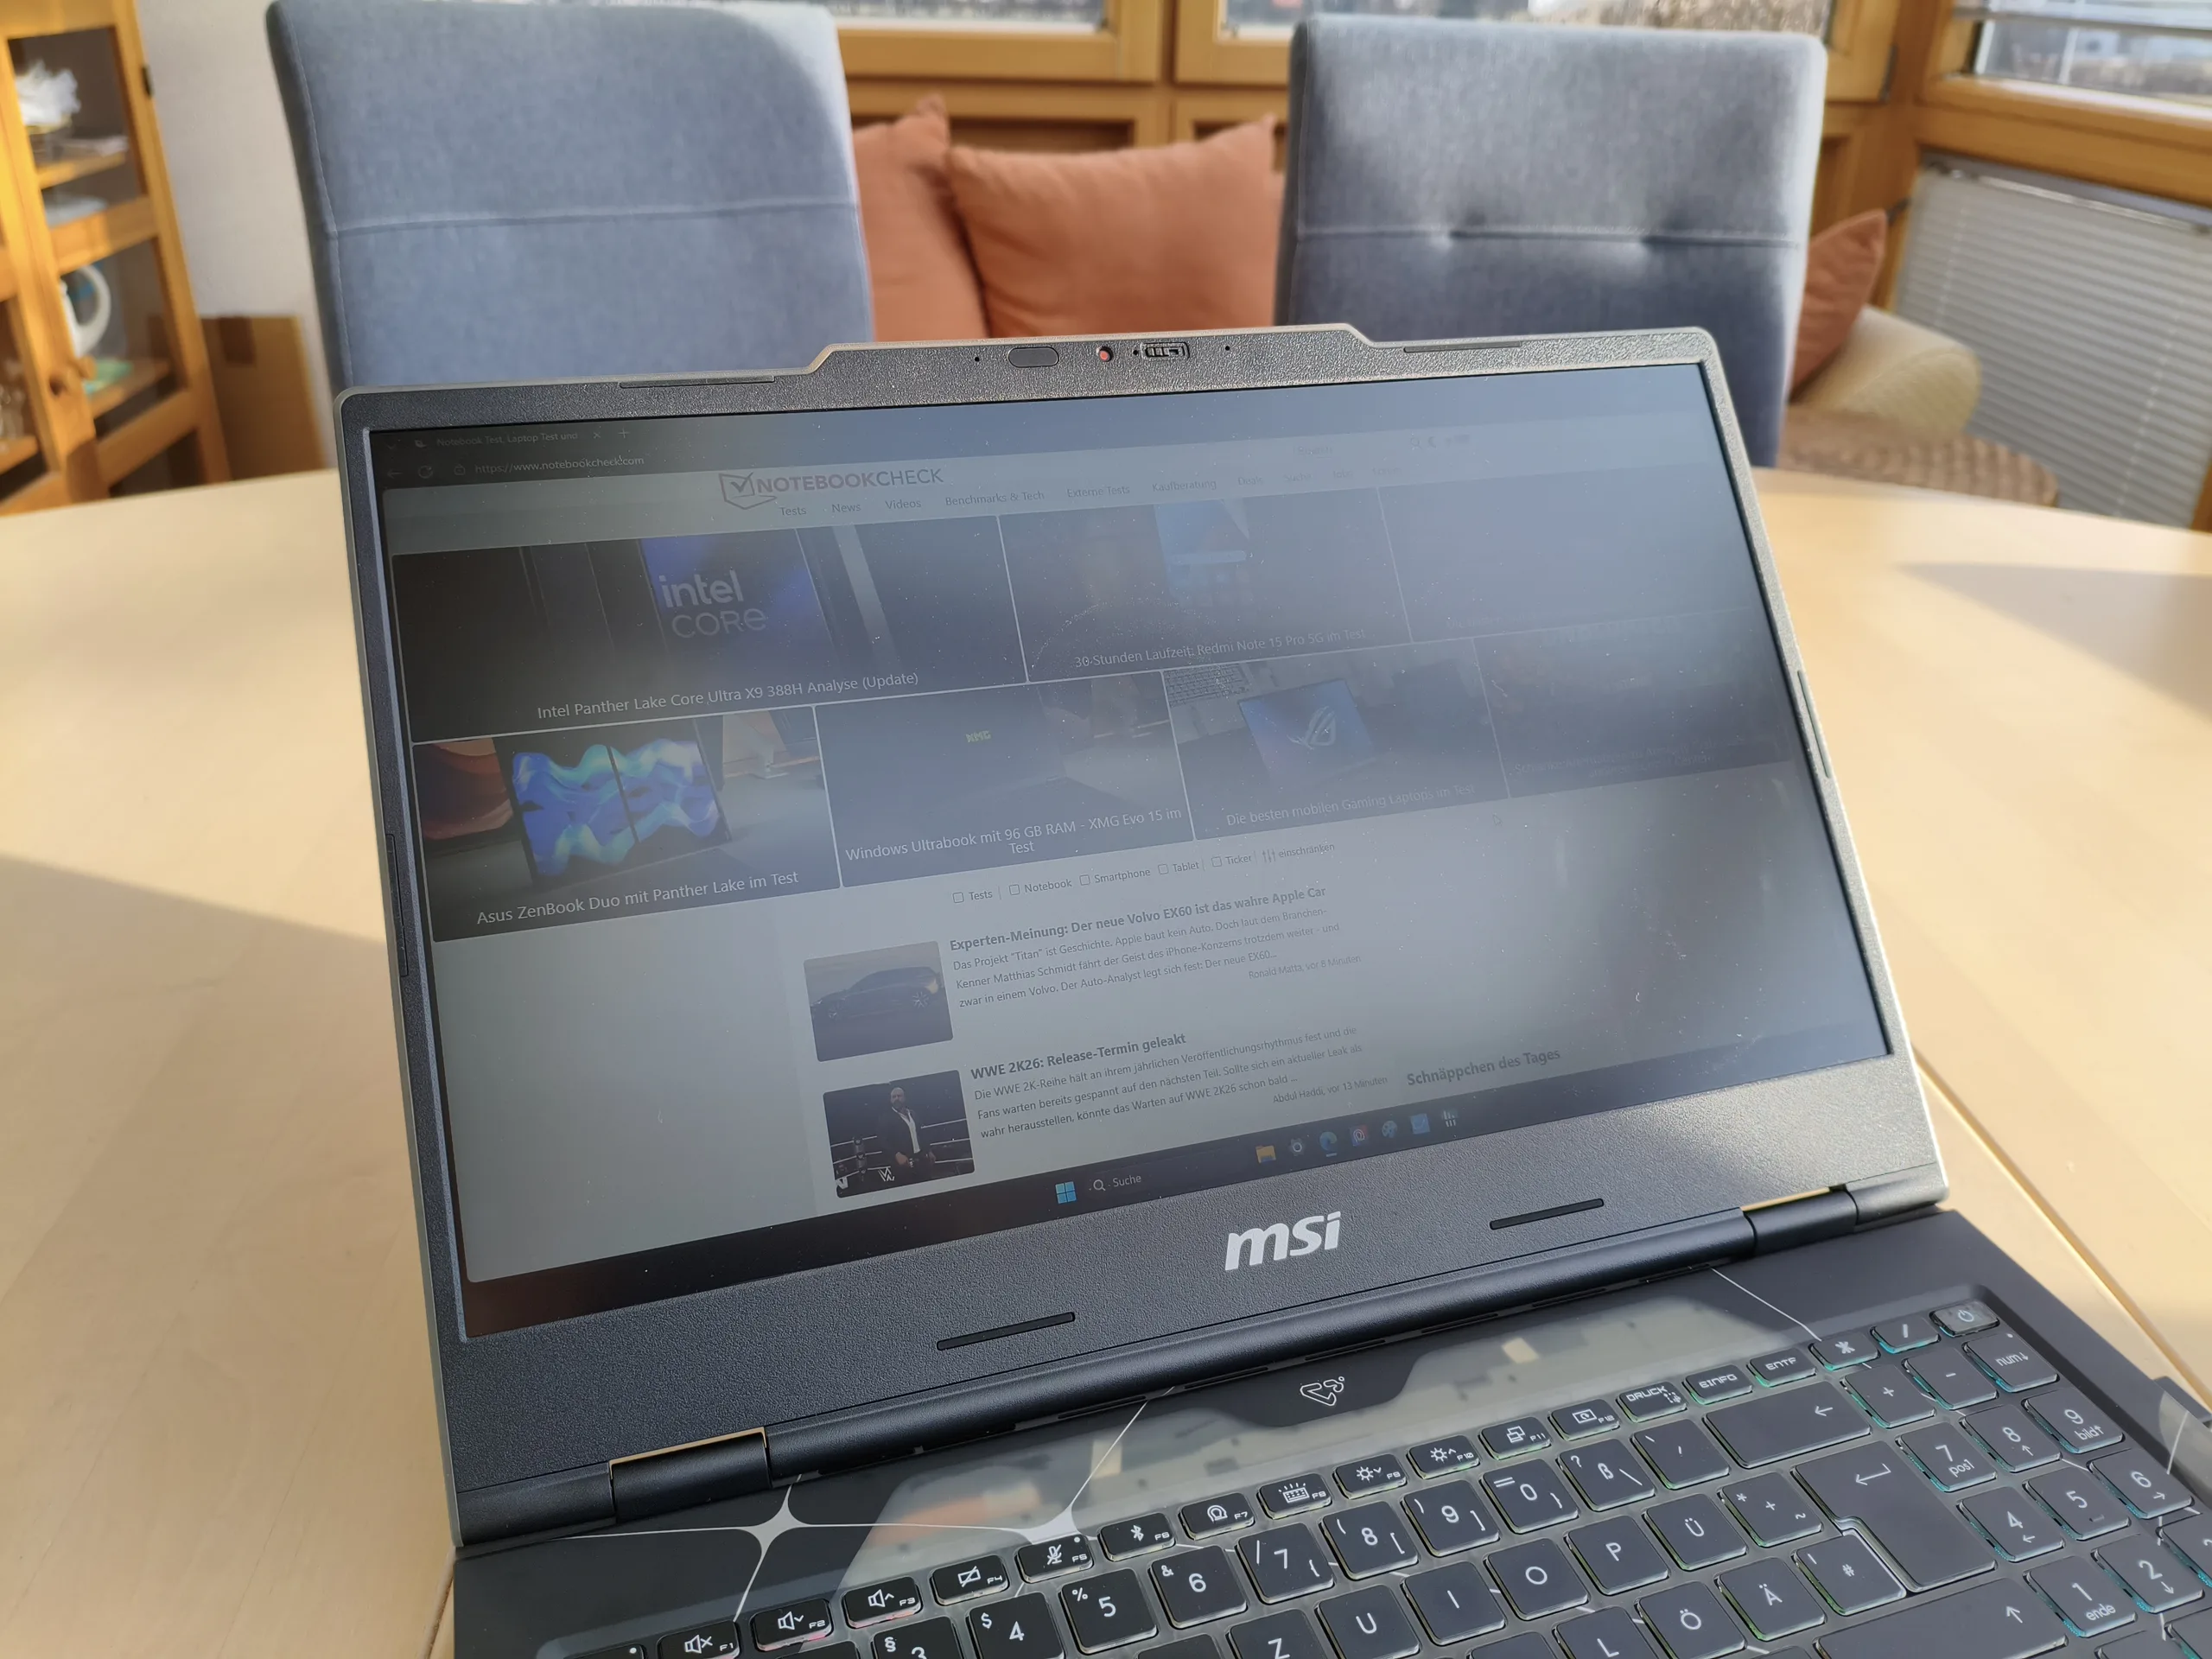
If you are looking for a gaming notebook that stands out from the crowd, the Cyborg 15 is the right choice. While the display lid is still relatively unspectacular, the top of the base unit is very striking with its pattern and transparent elements. For comparison: the 2023 tested predecessor with RTX 4060 was more discreet here. Unfortunately, hardly anything has changed with the display. The new version also has to make do with a small color space, which would be more suitable for a 400-Euro (~$472) office notebook.
The power of the graphics card is also worthy of discussion: As MSI only gives the RTX 5050 a meagre 45 watts TGP, the GPU performance falls short of its potential, as we will show in the course of the article, although the noise development is limited. The rest of the equipment is solid, but not lavish for the price, with a Core 7 240H, 16 GB DDR5 RAM (2x 8 GB) and a 512 GB SSD. Meanwhile, there are plus points for the webcam's privacy shutter, which is not a given for gaming laptops in particular.
The Cyborg 15's competitors include other RTX 5050 and RTX 5060 laptops such as the Acer Nitro V 15, the HP Victus 15 and the Lenovo LOQ 15, which all land in similar rating regions. If you are willing to spend a little more money, you should read the test of the Lenovo Legion 5 15, which almost received a very good rating.
Pros
Cons
Price and availability
The tested MSI Cyborg 15 B2RWEKG is available from around 1,100 Euros (~$1298) from various online stores (e.g. Galaxus).
- $1,298.94MSI Cyborg 15 B2RWEKG-293US .6" Gaming Notebook - Full HD - 144 Hz - Intel Core 7 240H - 16 GB - 1 TB SSD - Translucent Black
- $1,191.83MSI Cyborg 15 B2RWEKG-258US 15.6" Full HD 144Hz Gaming Laptop, Intel Core 5 210H 2.2GHz, 16GB RAM, 1TB SSD, NVIDIA GeForce RTX 5050 8GB, Windows 11 Home, Translucent Black
- $1,399.99msi 15.6 Inch Cyborg 15 Gaming Laptop Intel Core 7 240H NVIDIA GeForce RTX 5060 32GB RAM 1TB SSD 144Hz FHD Display WiFi 6 Bluetooth Windows 11 12 Month CPS Warranty
Specifications
Housing
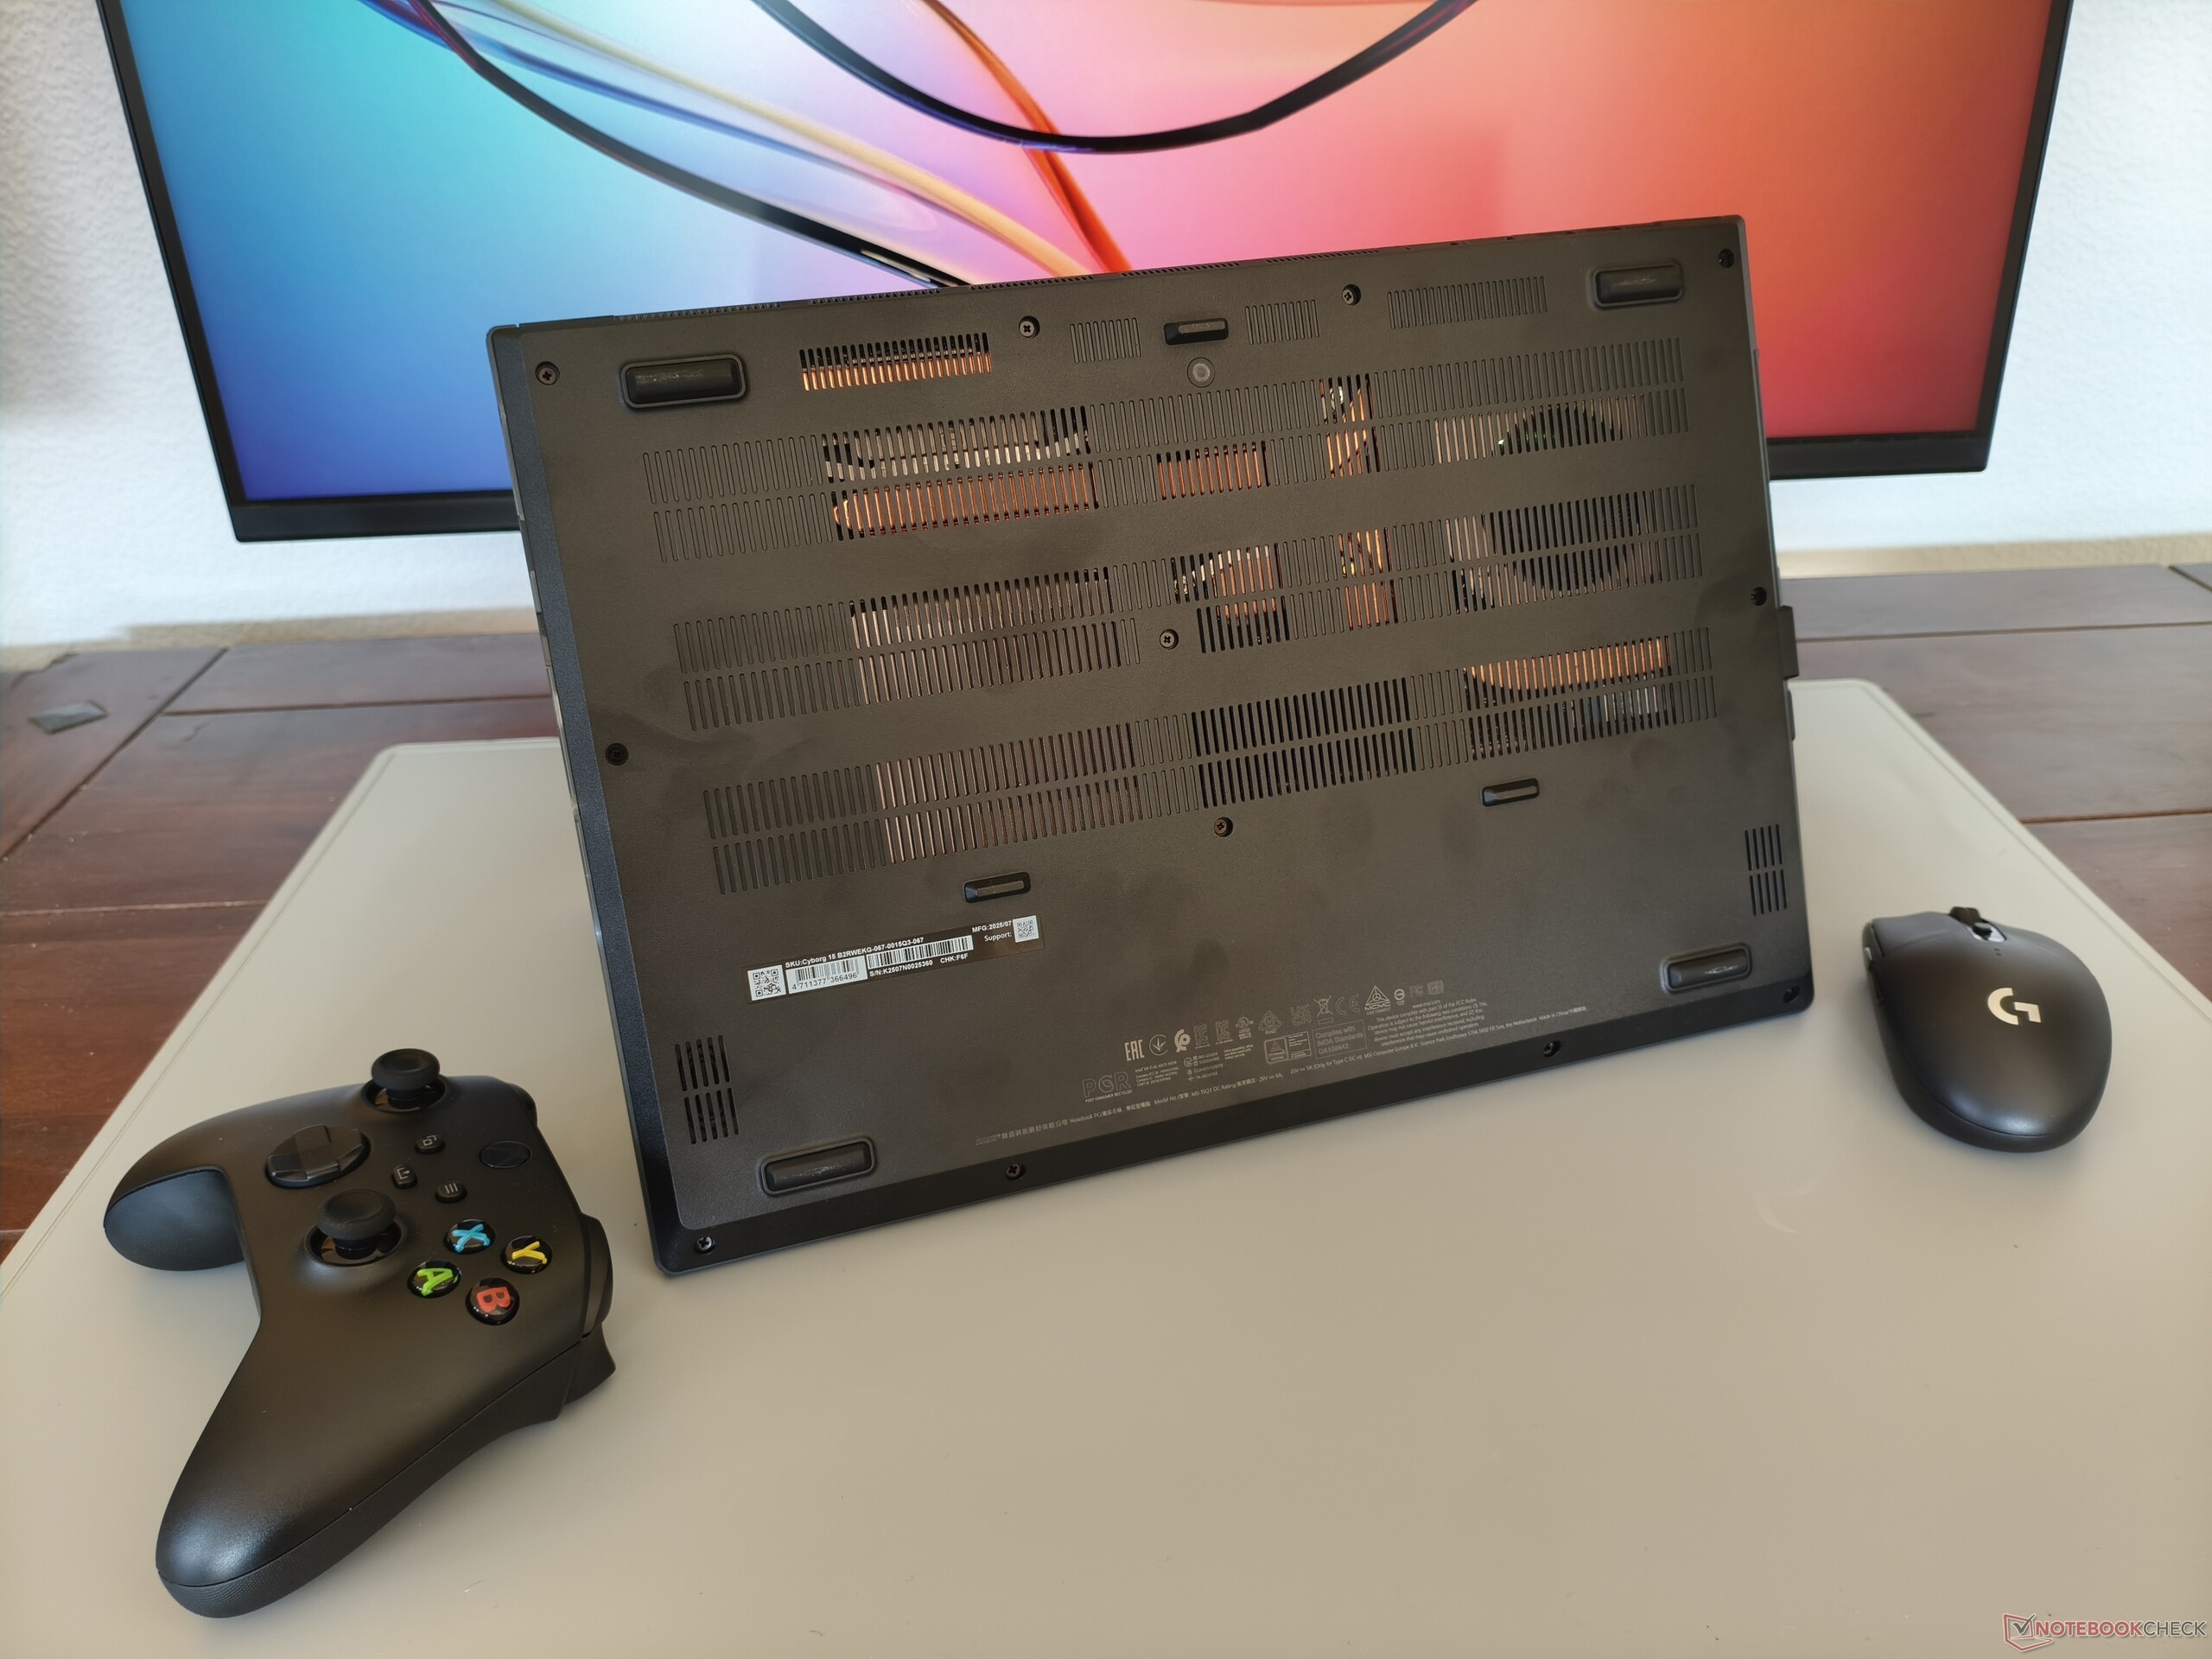
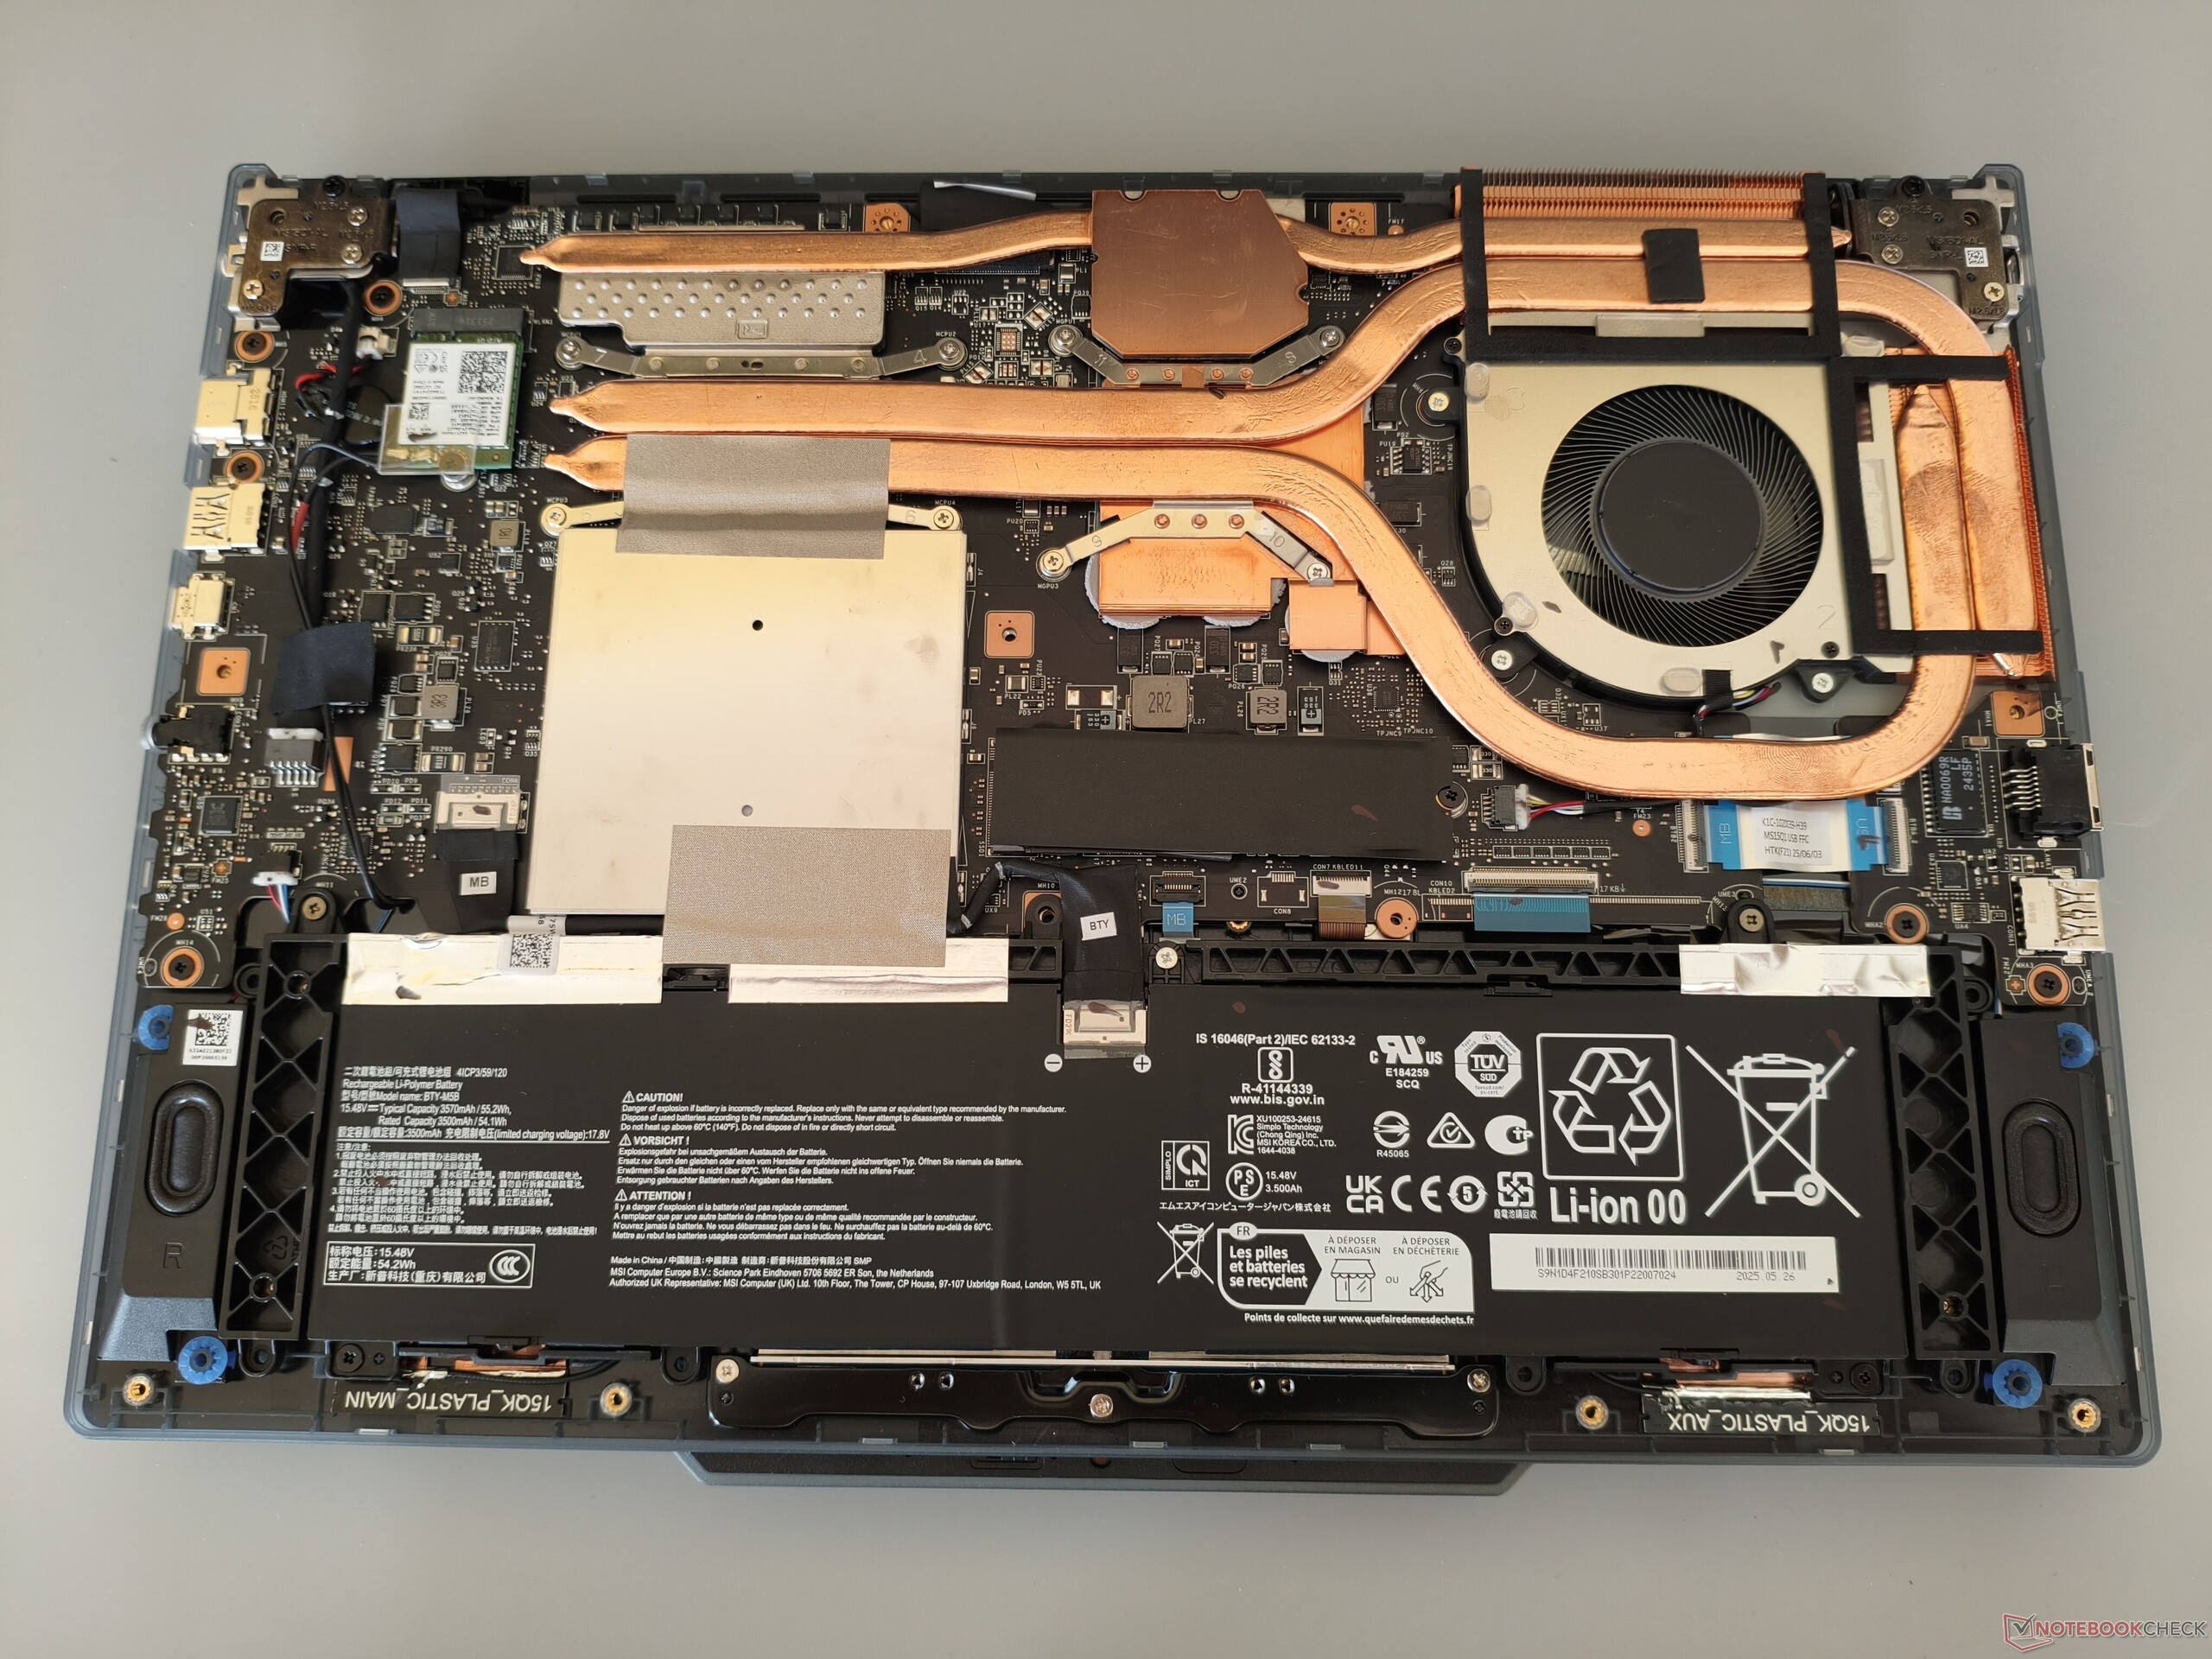
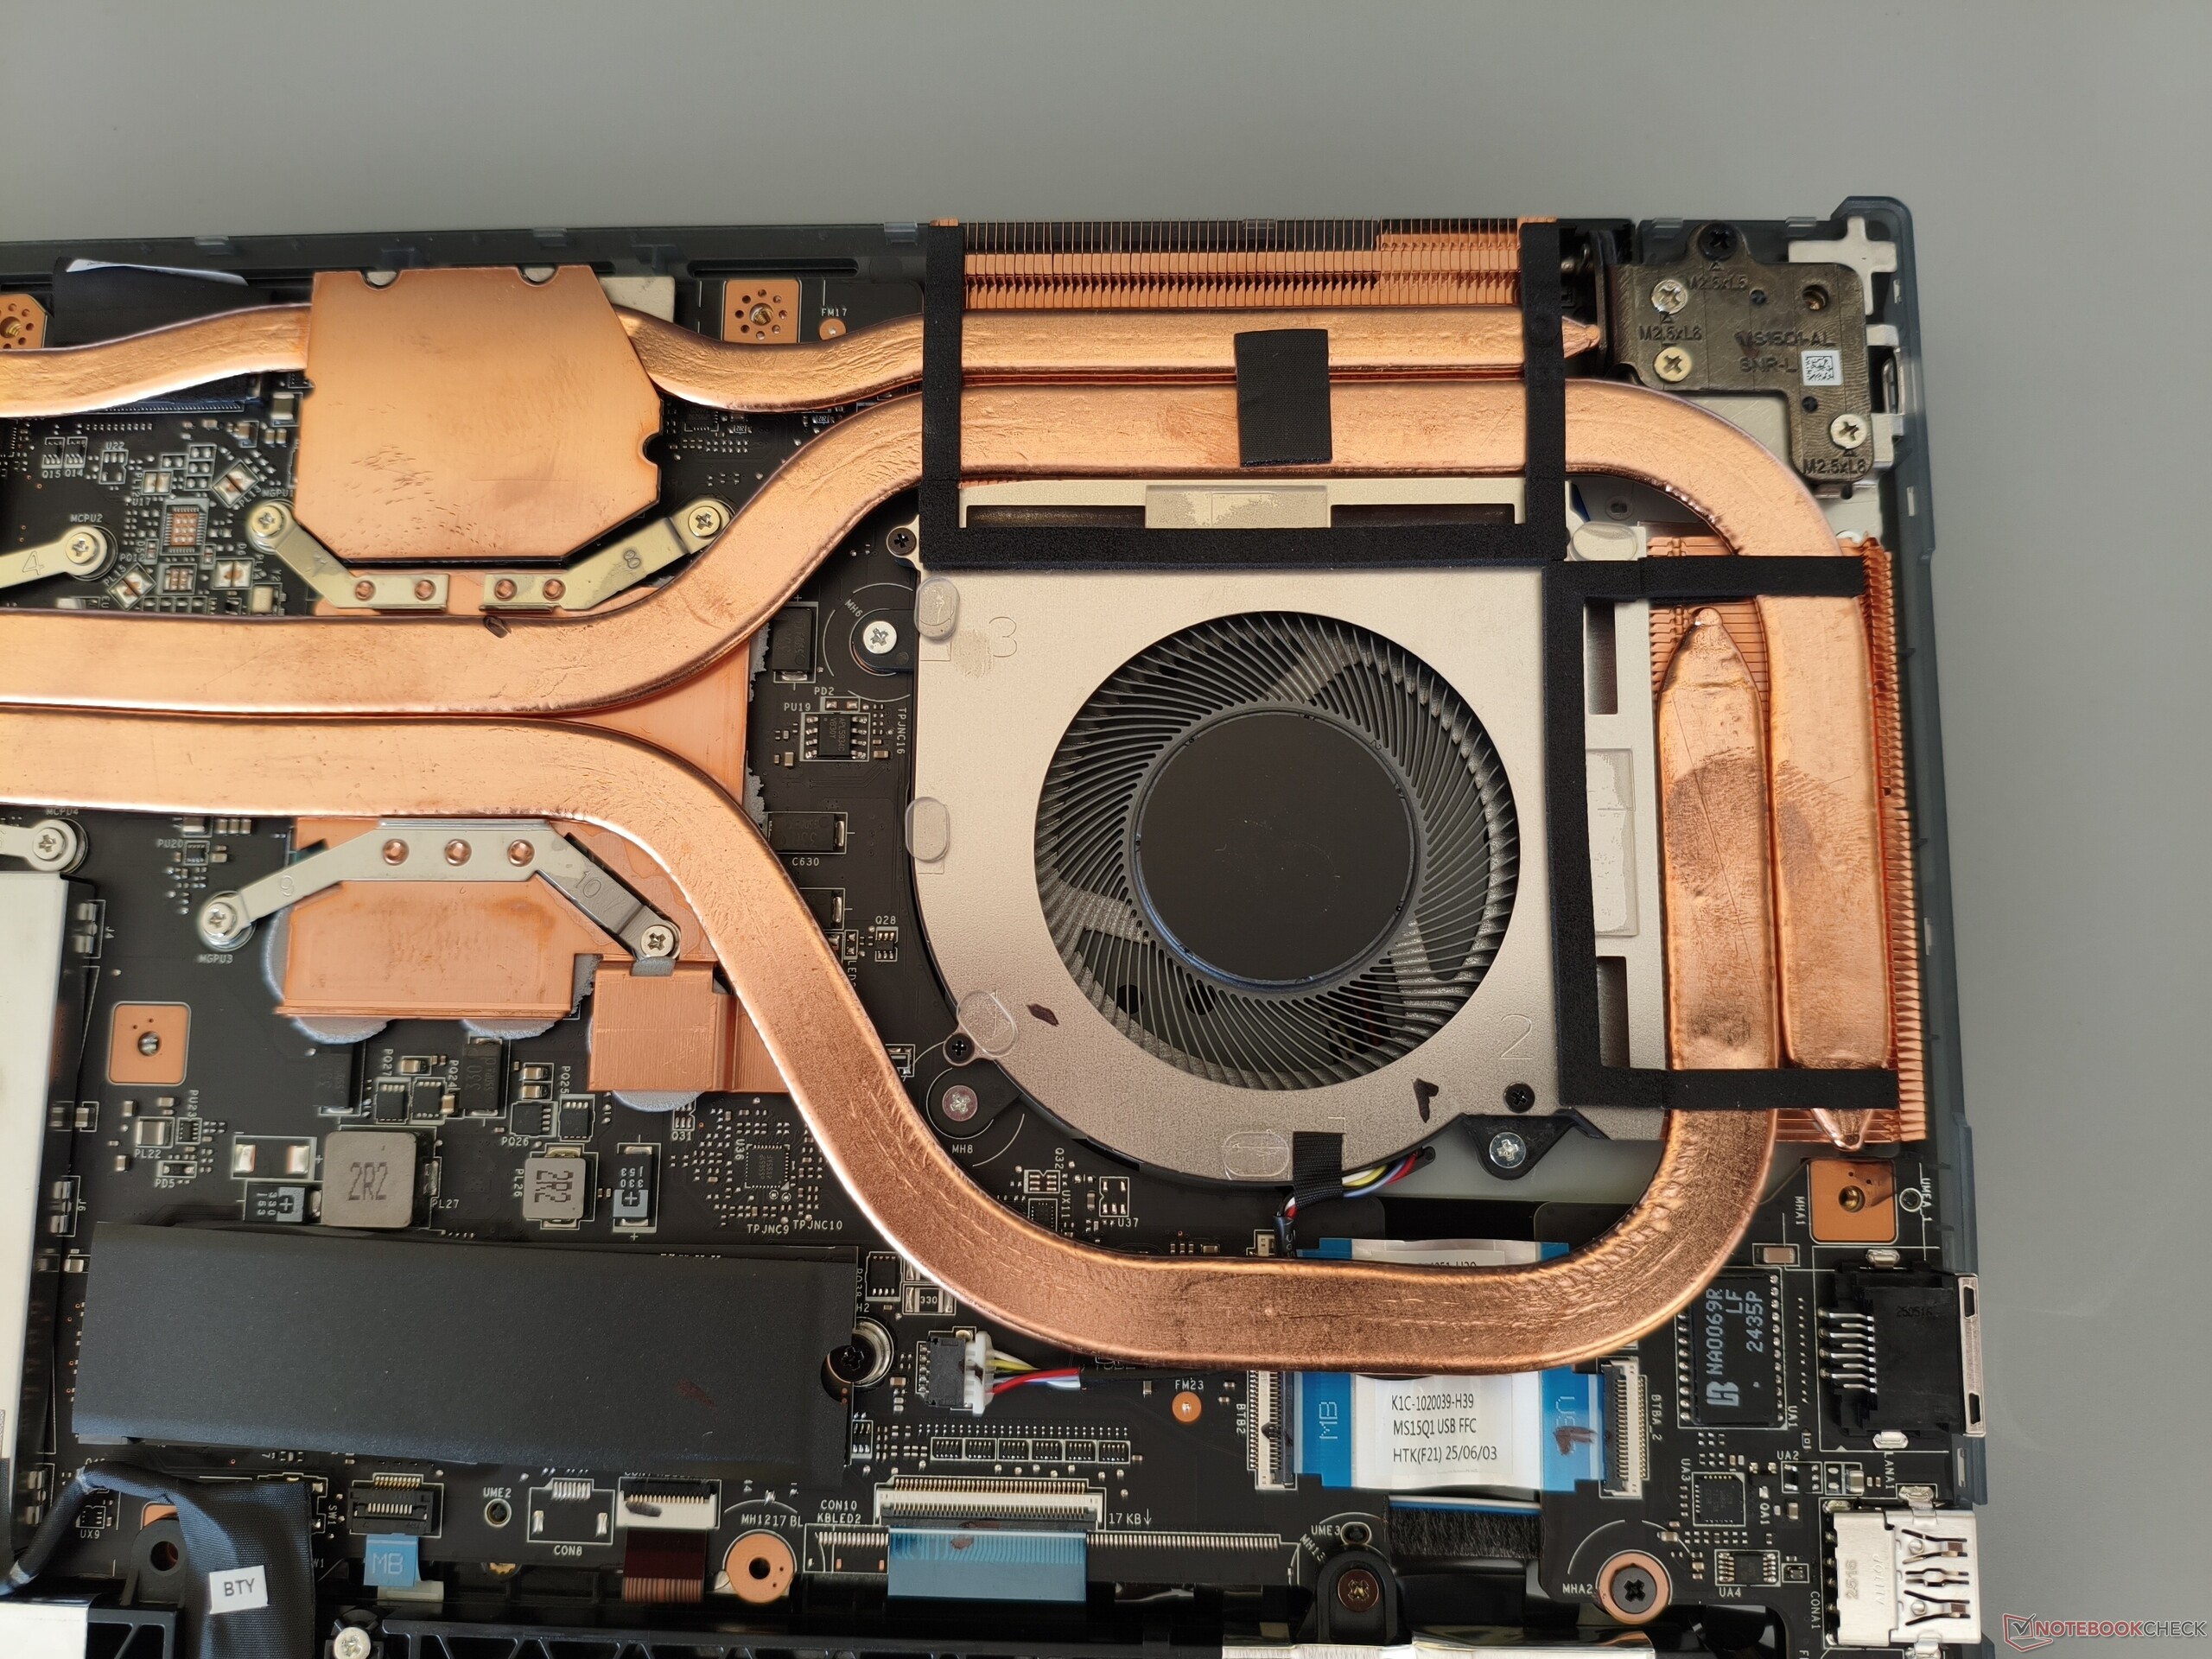
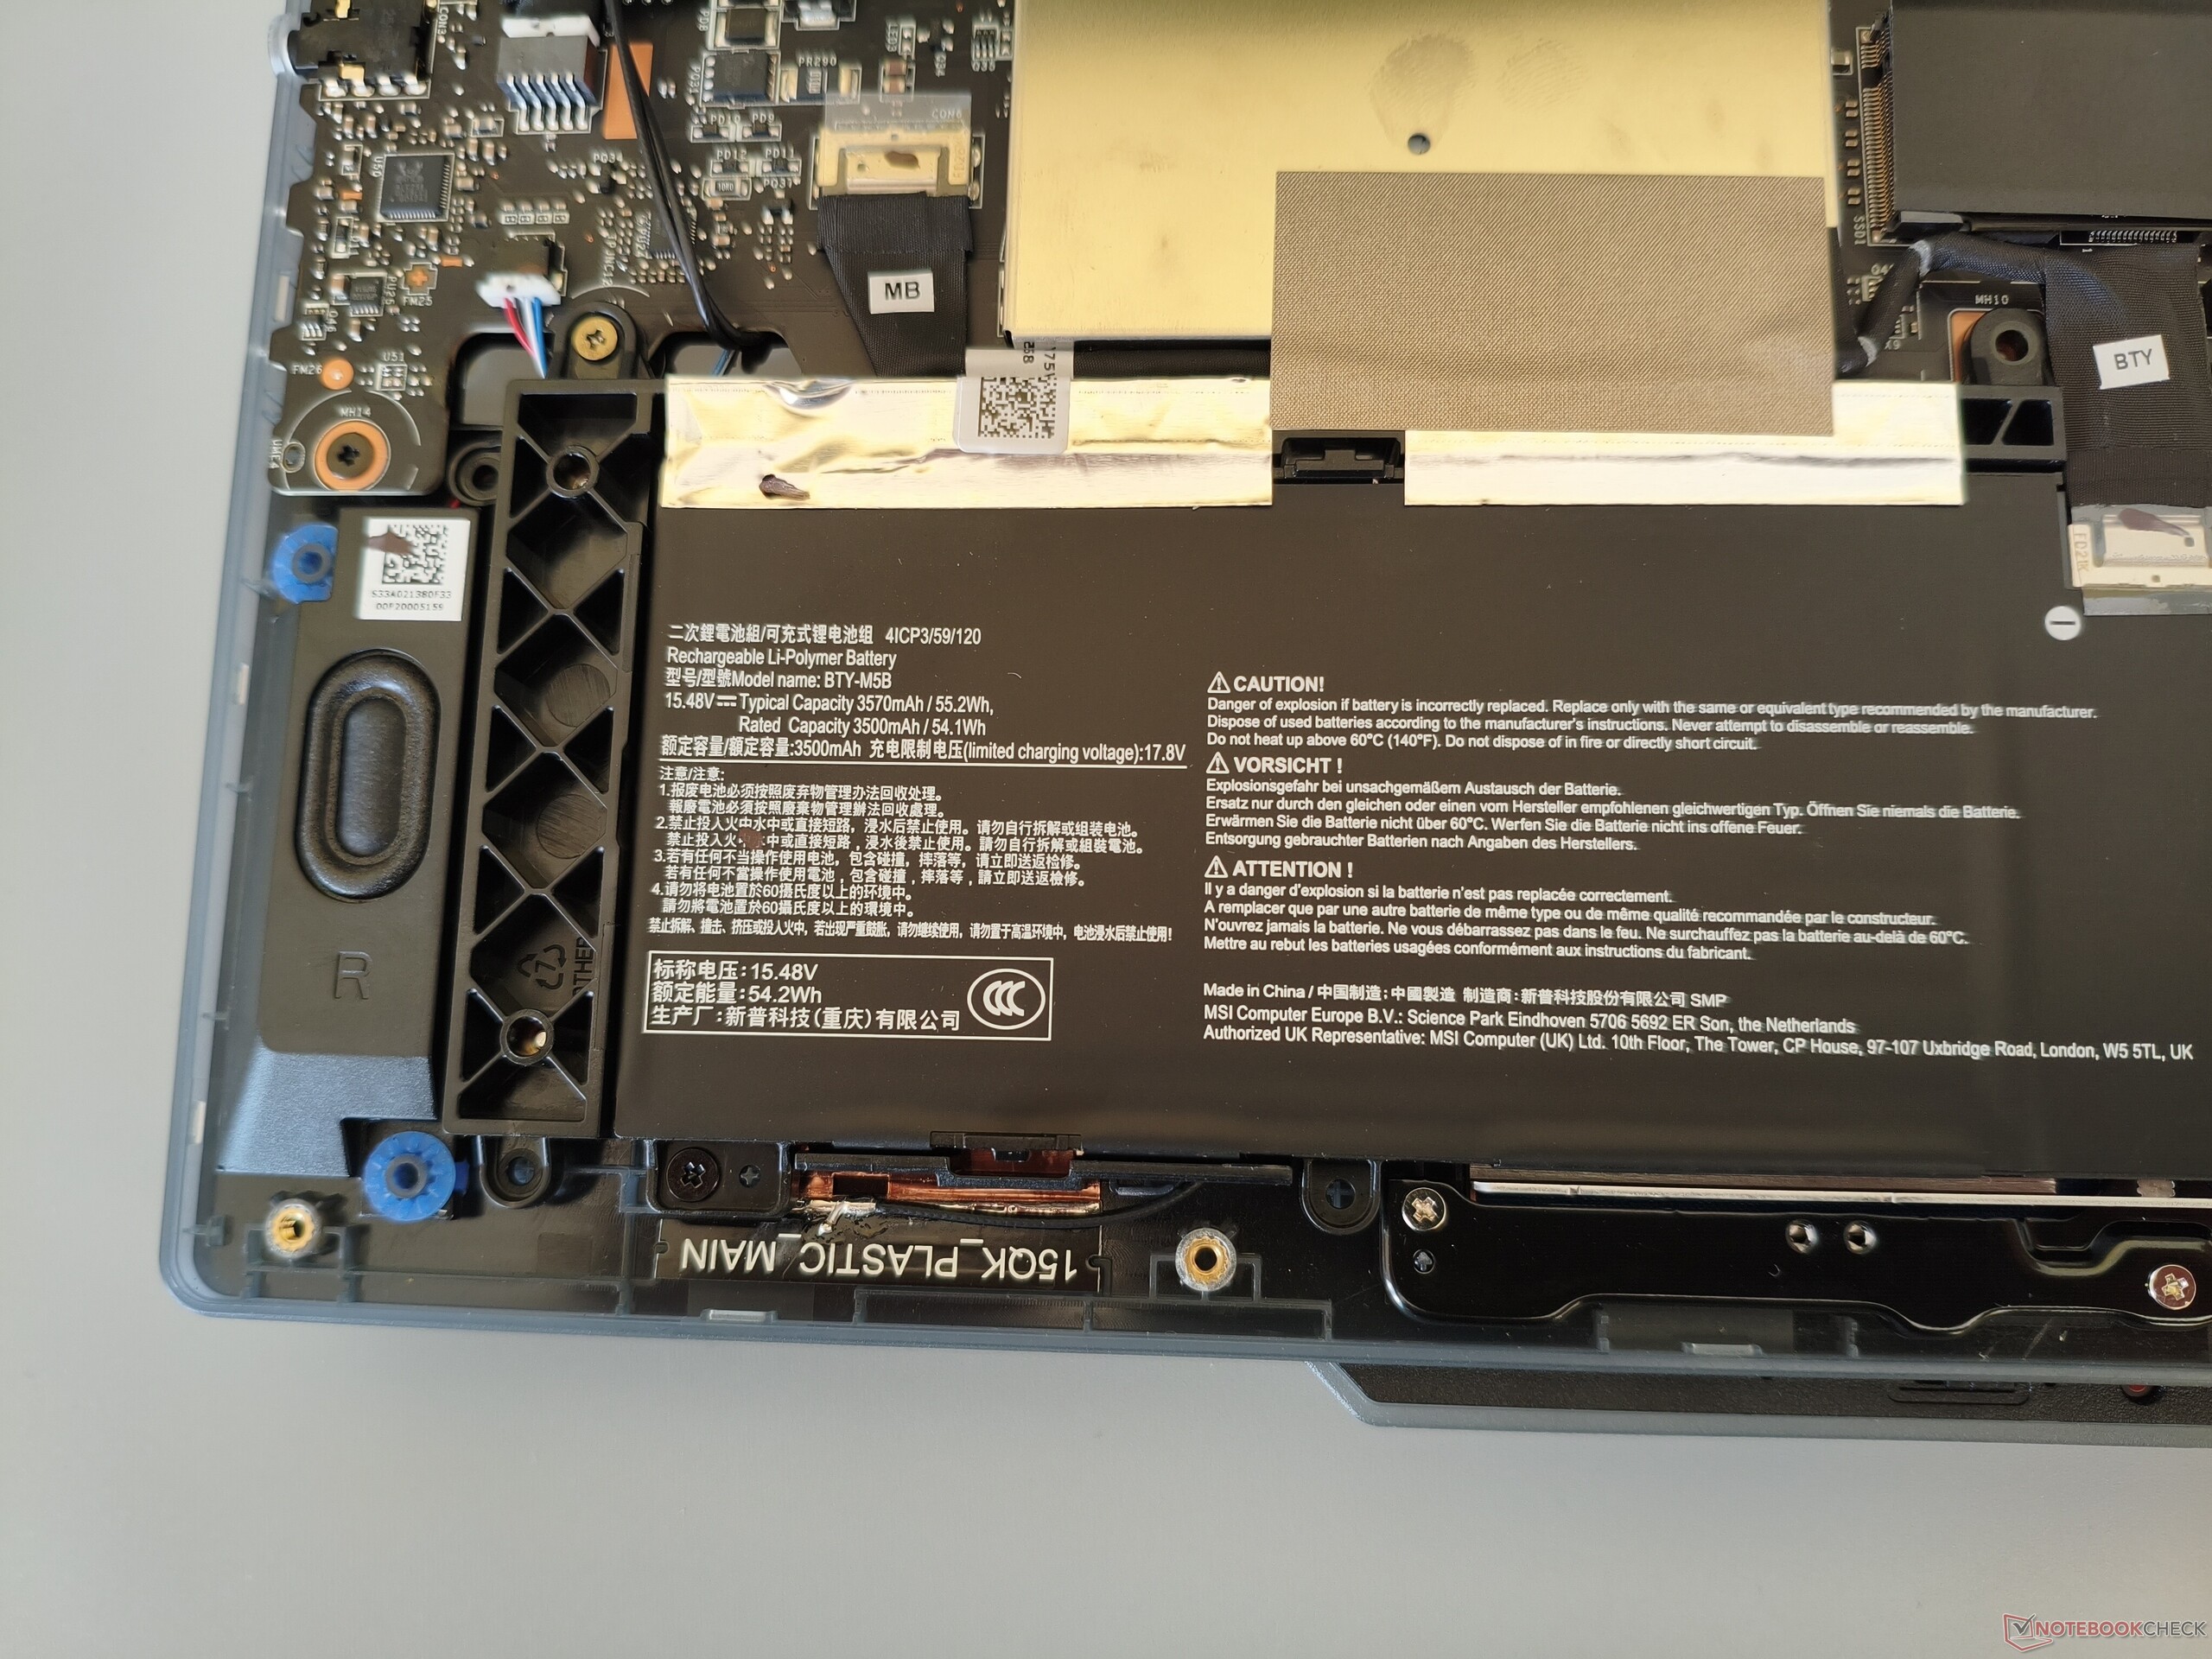
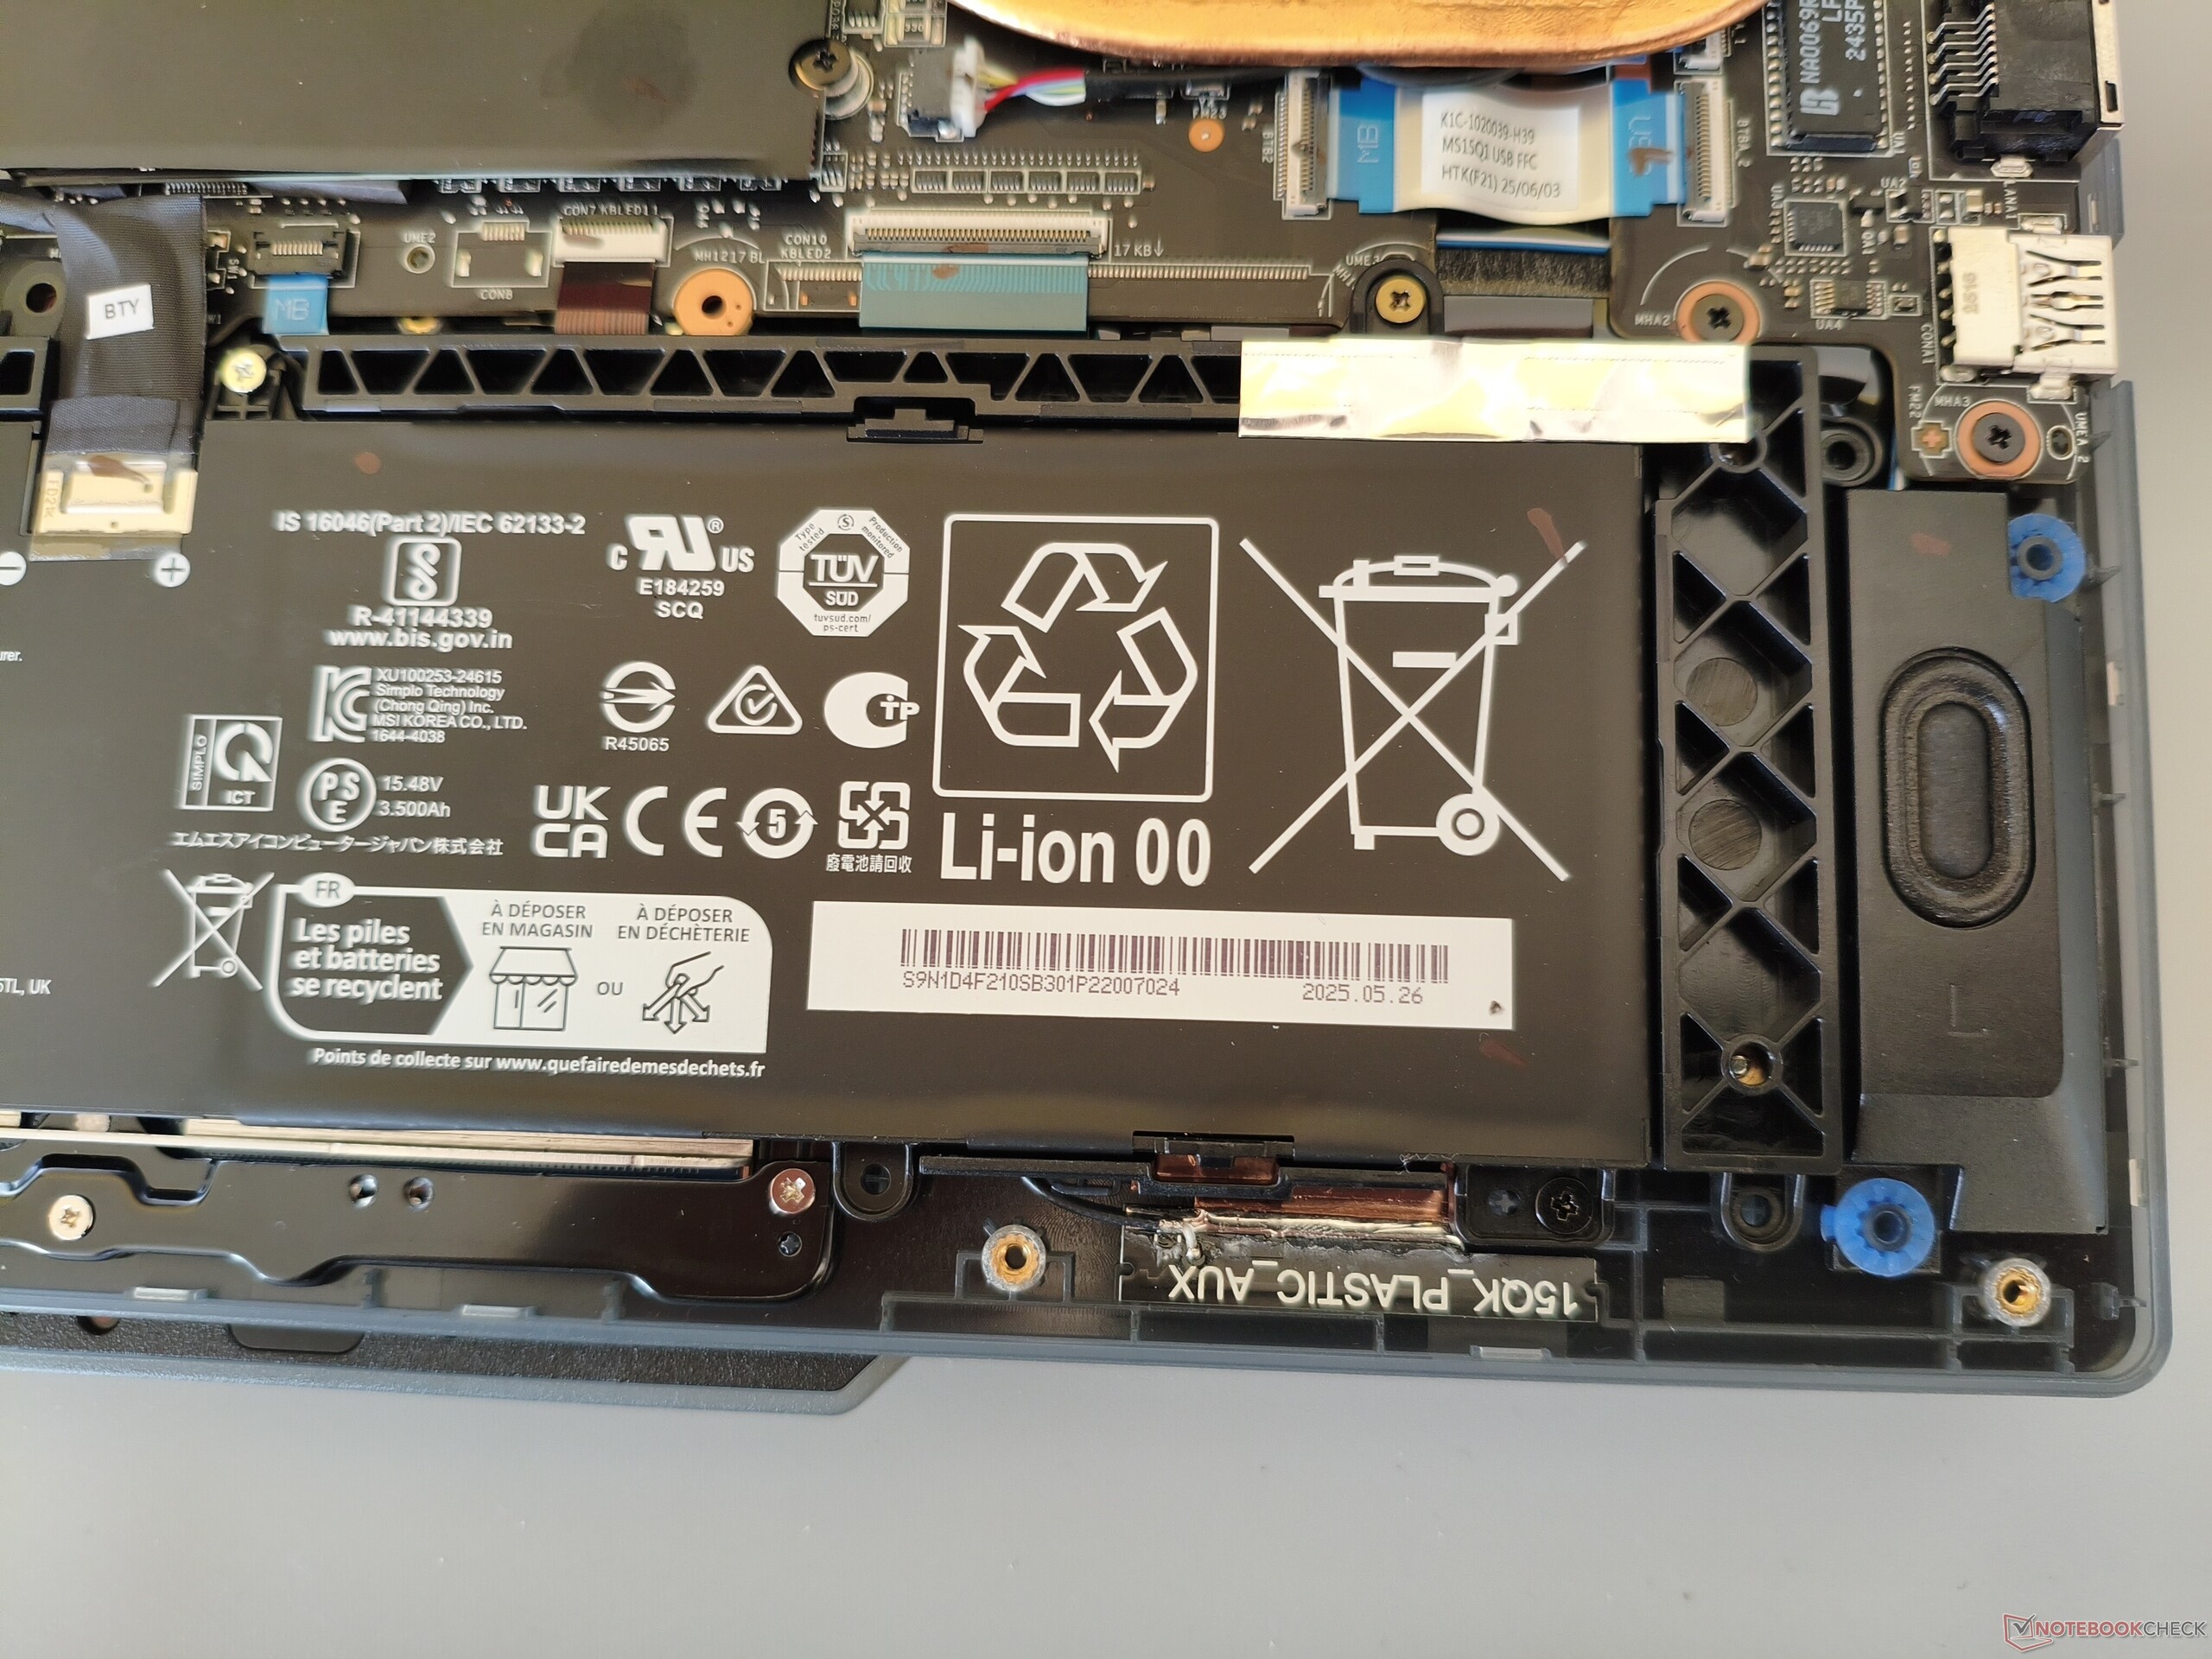
A mix of metal (lid) and plastic (base unit) is used for the casing. For the most part, workmanship and stability give no cause for criticism. MSI deserves particular praise for the generous opening angle of 180°. With a weight of just under 2.2 kg (~4.9 lbs), the Cyborg 15 sits comfortably in the middle of the competition, which weighs between 1.9 and 2.4 kg (~4.2 and 5.3 lbs). To open the case, 12 Phillips screws have to be removed. You can find out what it looks like under the hood in the pictures below.
Equipment
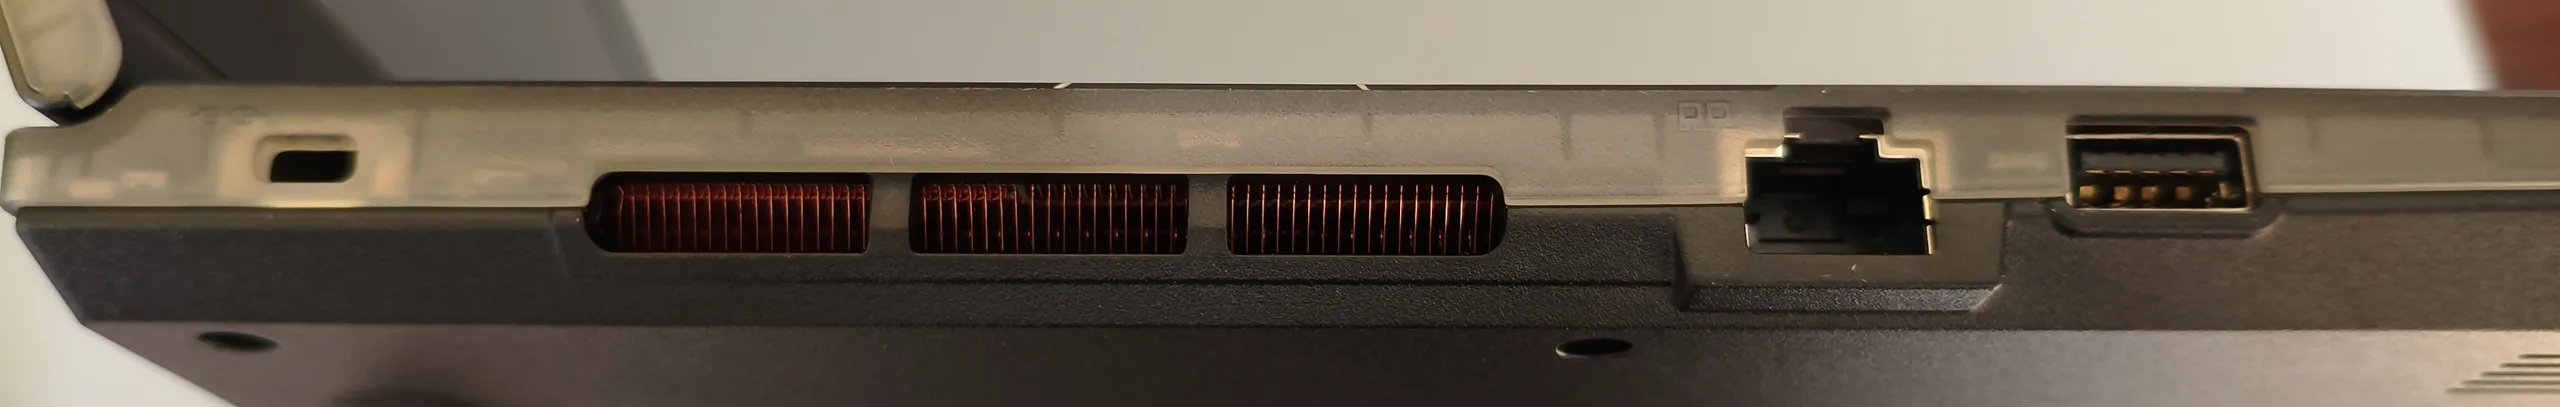
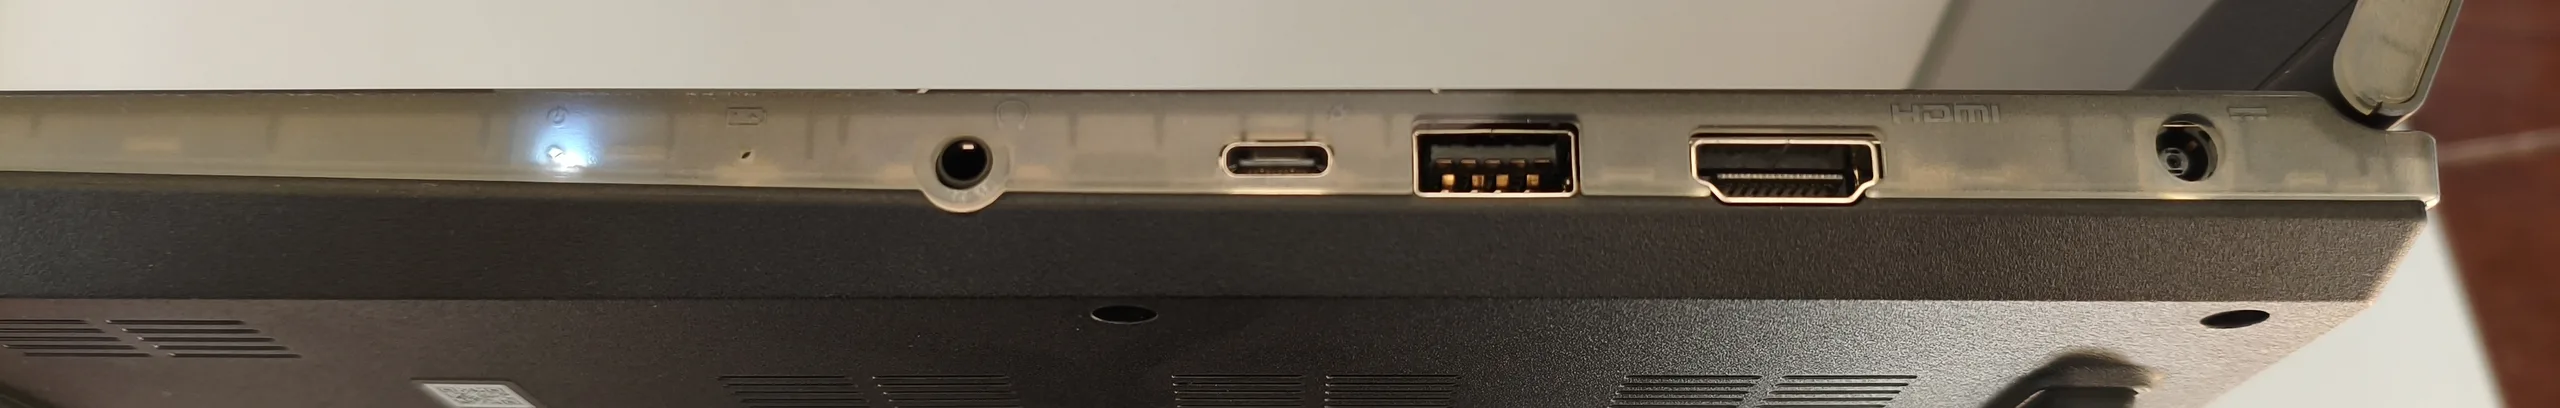
The connectivity turns out to be rather meagre. Although there is a Gigabit LAN port, there is no card reader. Meanwhile, we would have liked to see more modern standards for the USB ports; Thunderbolt, for example, is not on board. In any case, the wireless module from Intel is pleasingly fast, especially when receiving data. As with most laptops, the webcam leaves a lot to be desired in terms of image sharpness, among other things.
Communication
Webcam


Maintenance

Input devices
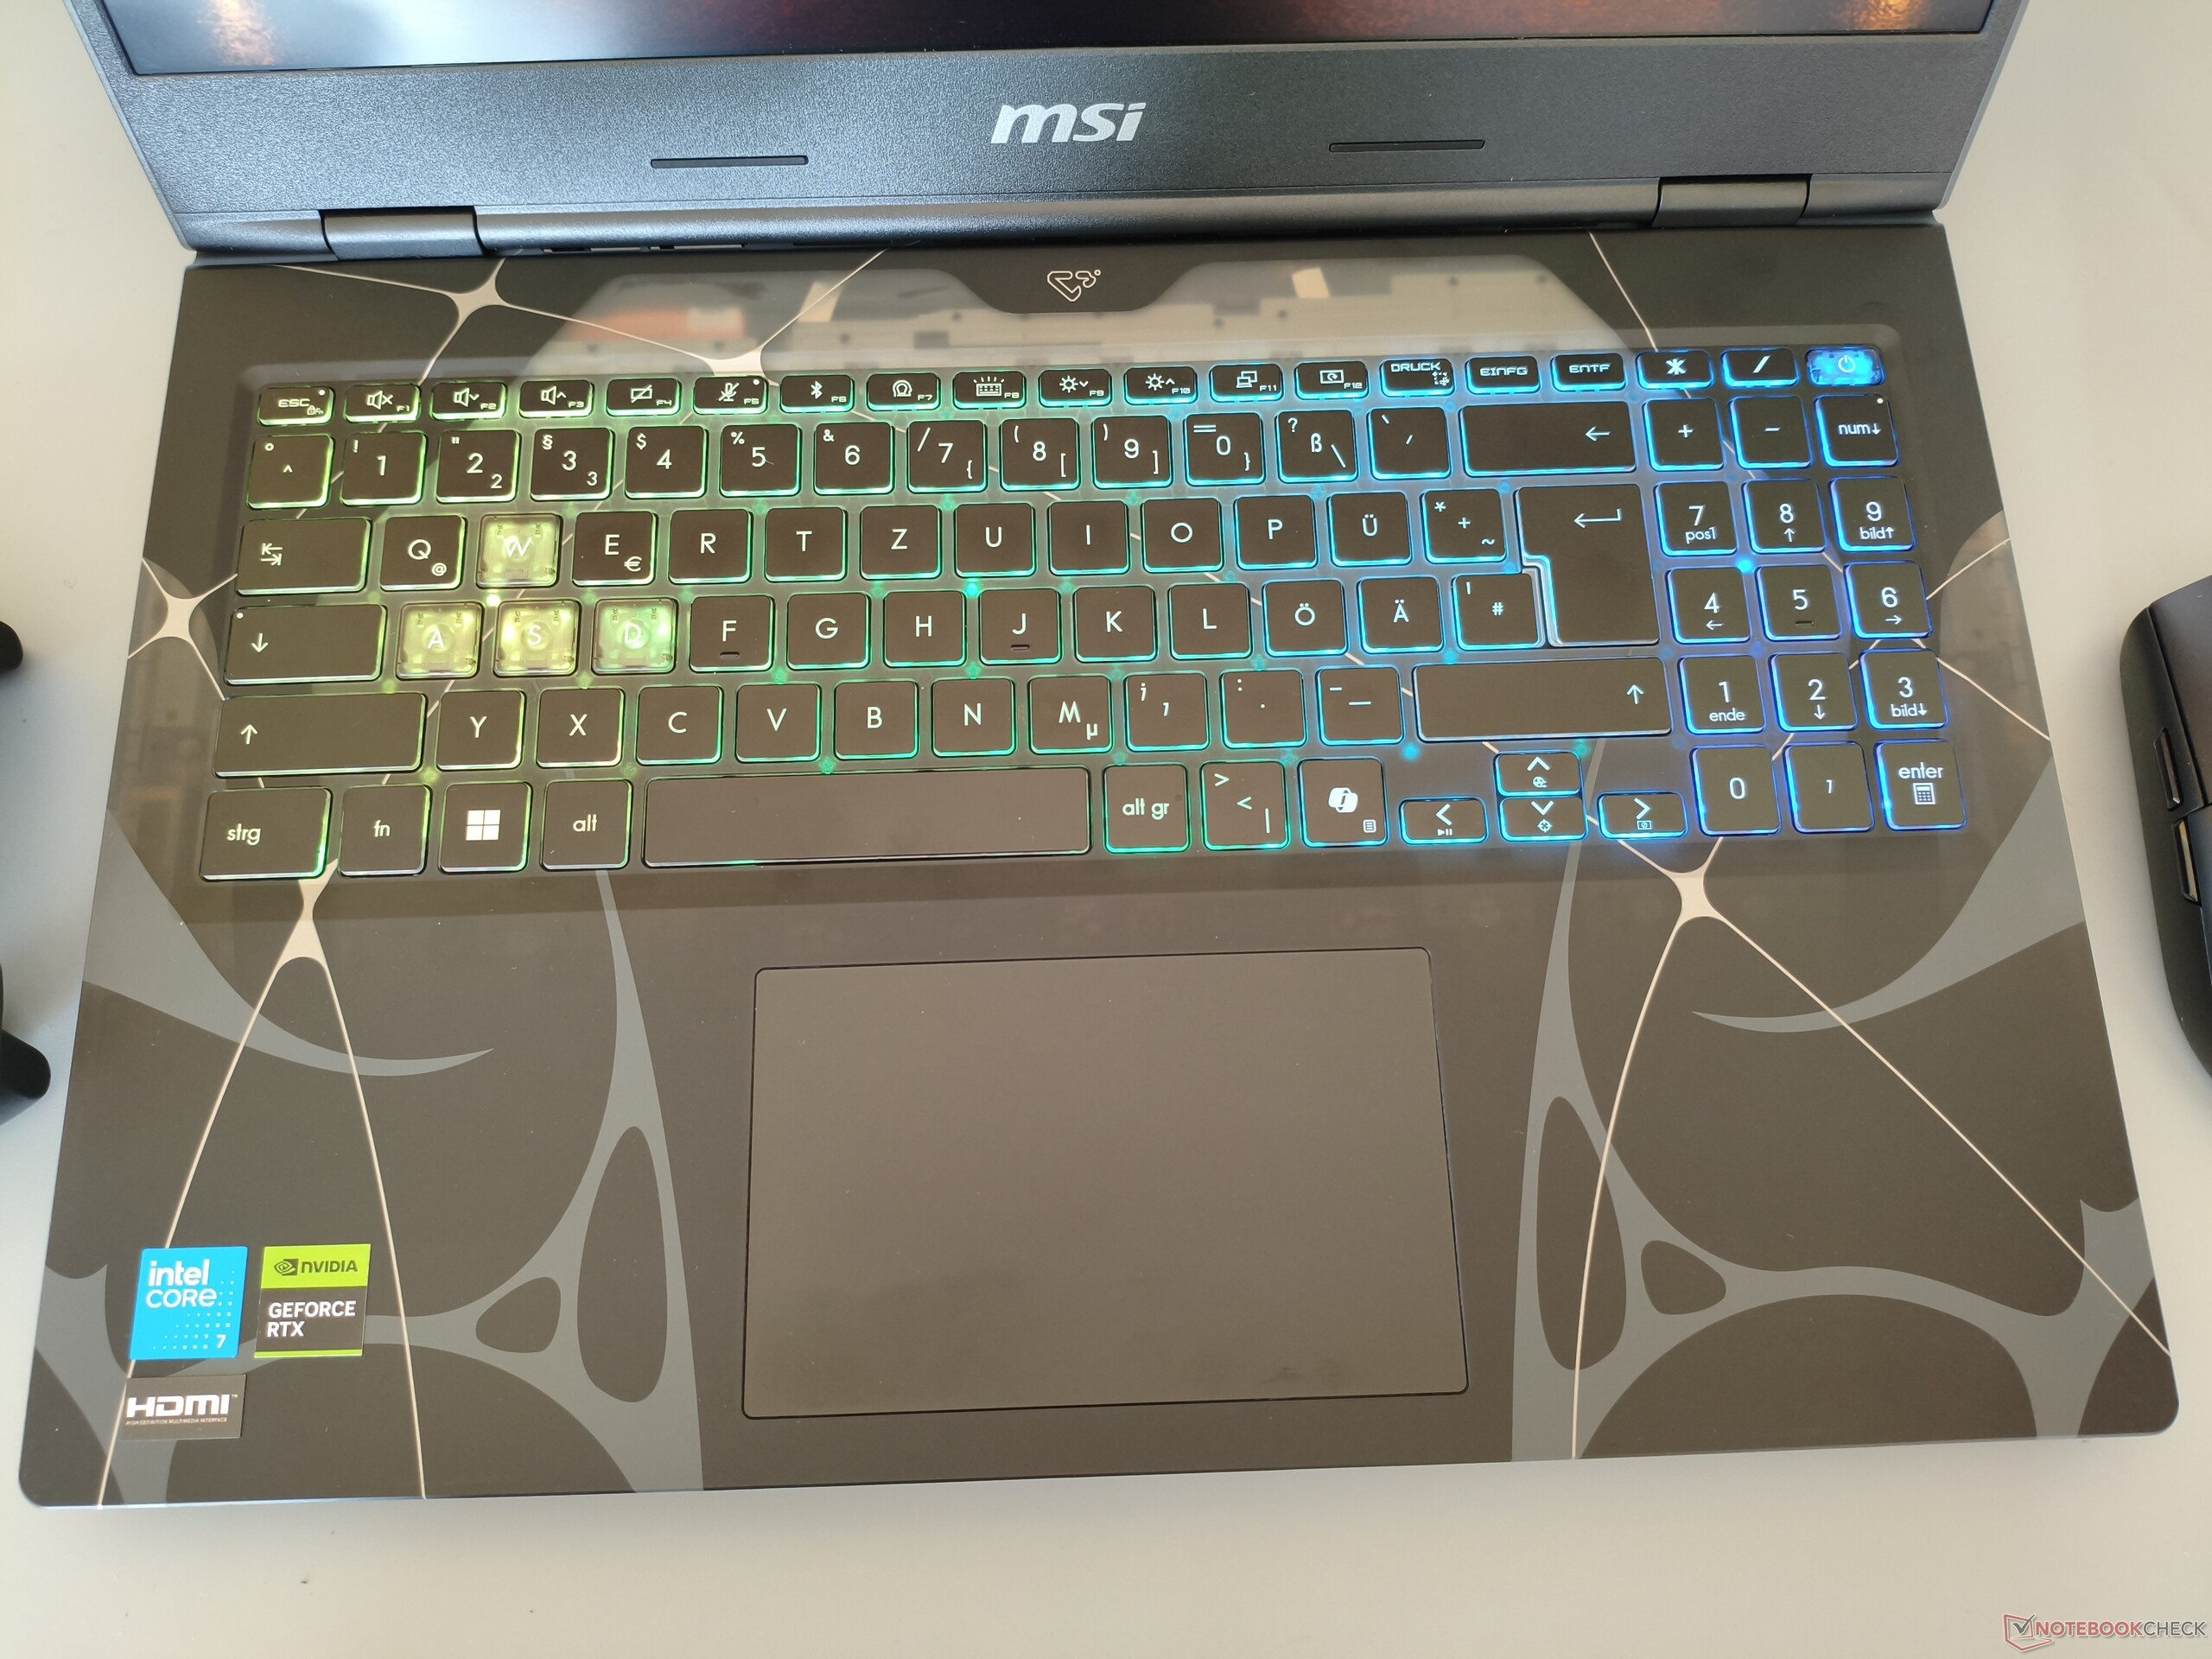
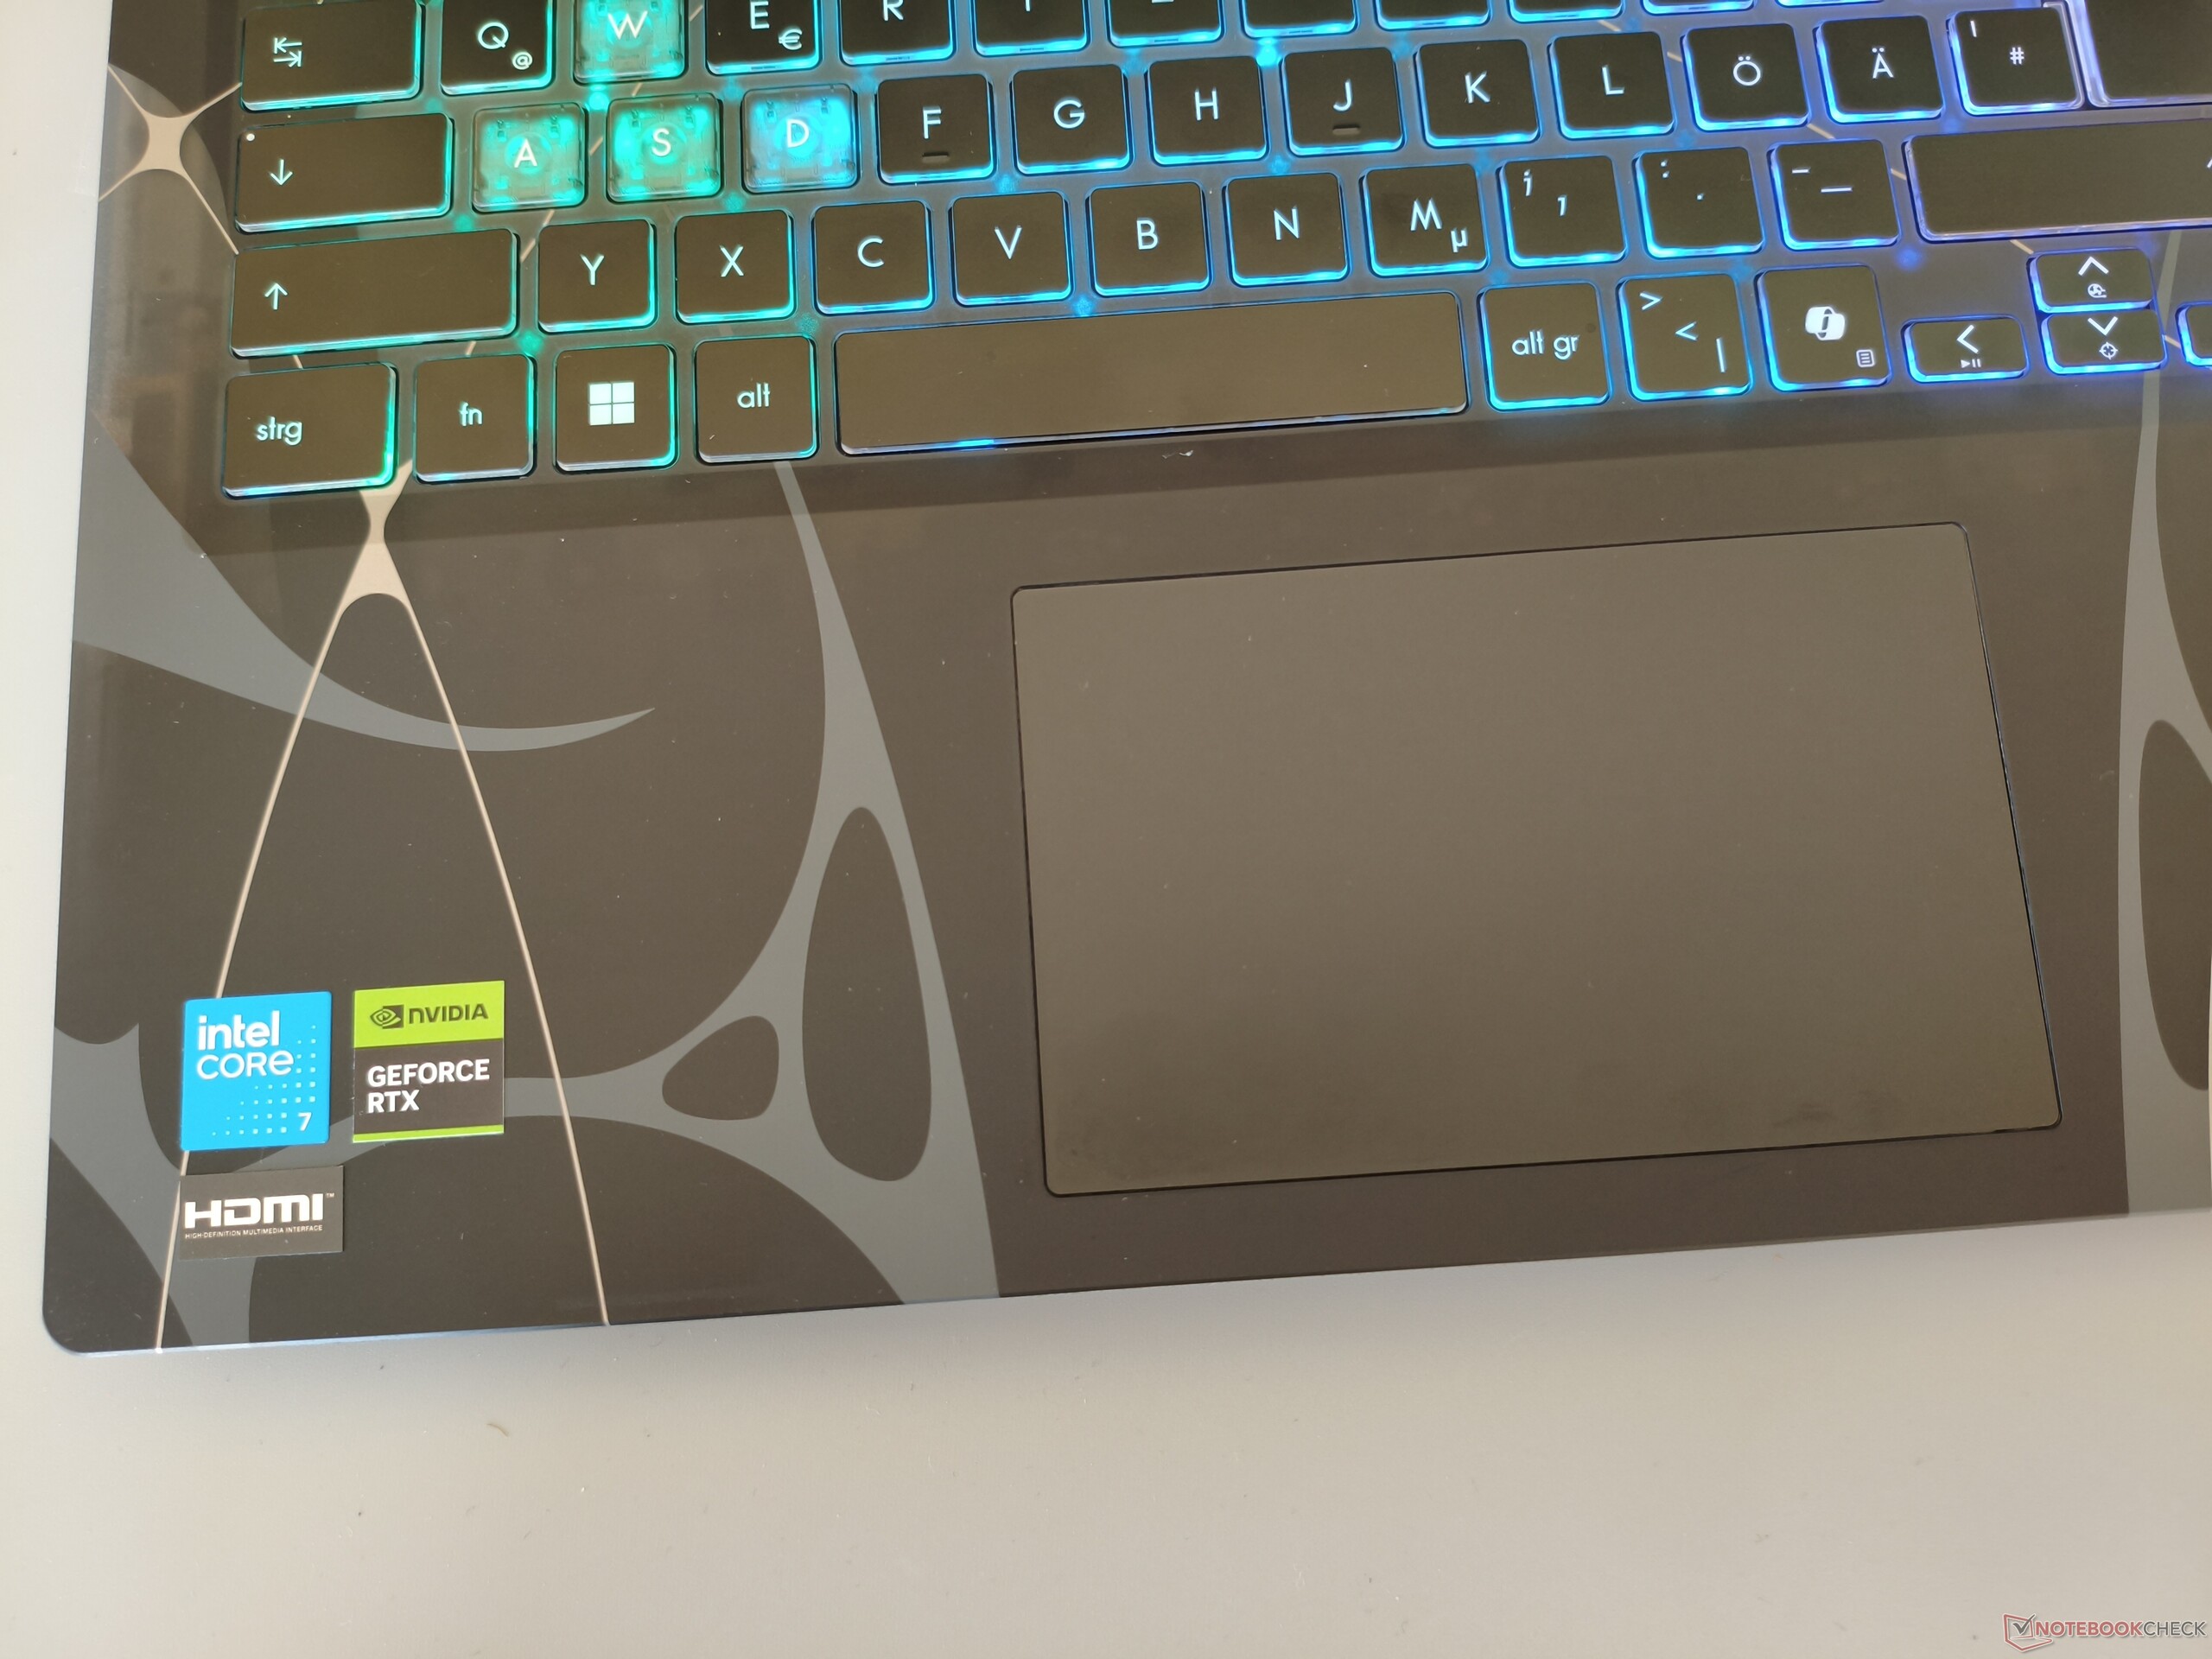
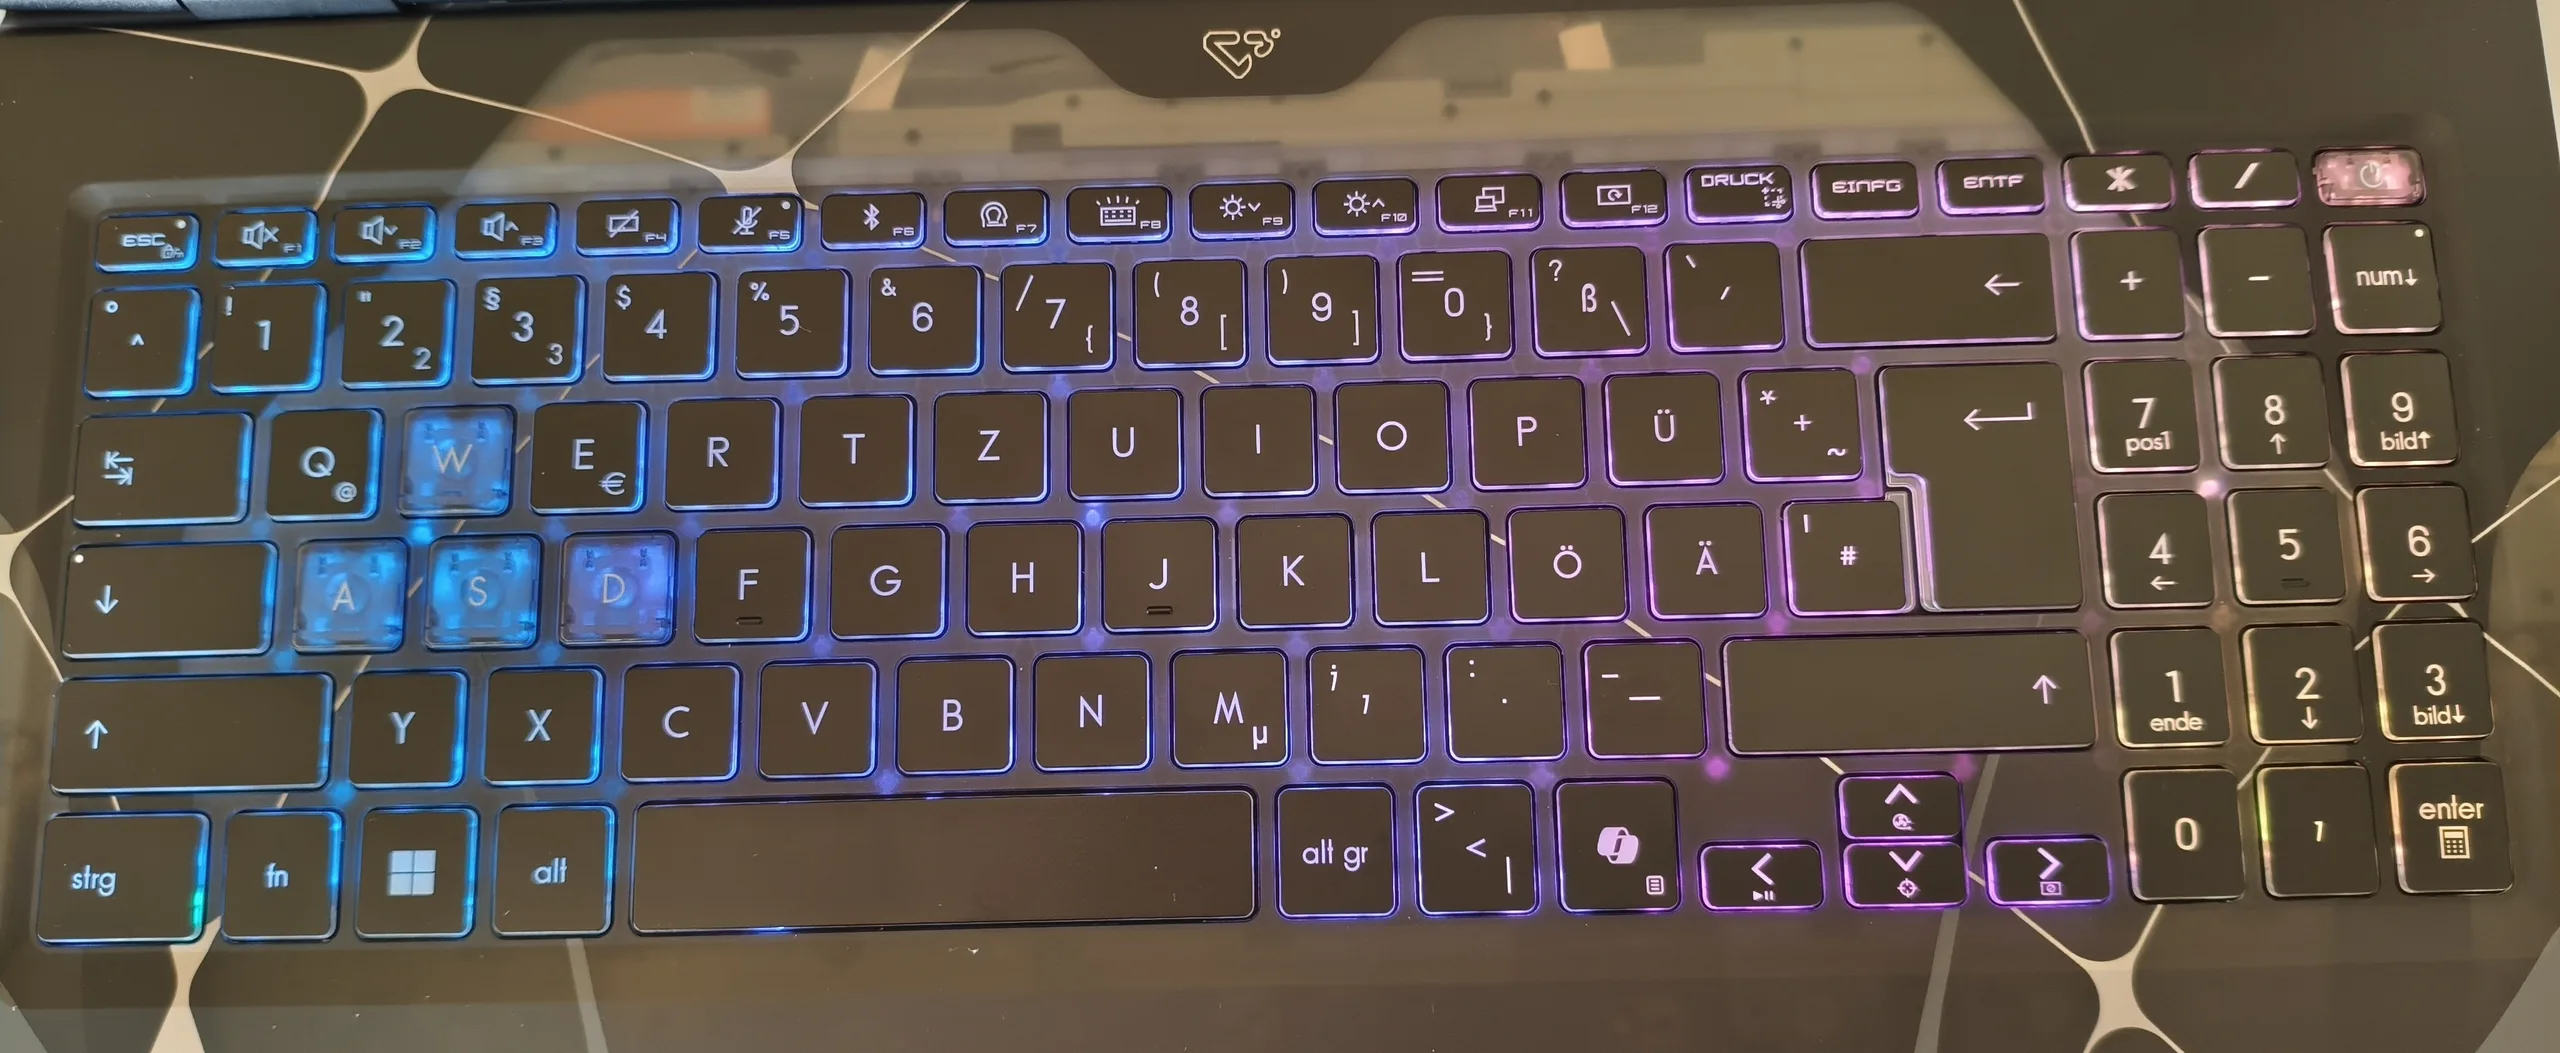
The keyboard requires a certain amount of familiarization due to the idiosyncratic layout typical of MSI. The fact that the numeric keypad only has three columns instead of four also takes some getting used to. We would describe the typing feel itself as solid. Gamers can also look forward to relatively powerful RGB lighting. The touchpad measures 12 x 7.6 cm (~4.7 x 3.0 in), which is more than sufficient for a 15-inch device. The mouse replacement performs at a satisfactory level in the test in terms of precision, gliding properties and gestures.
Display
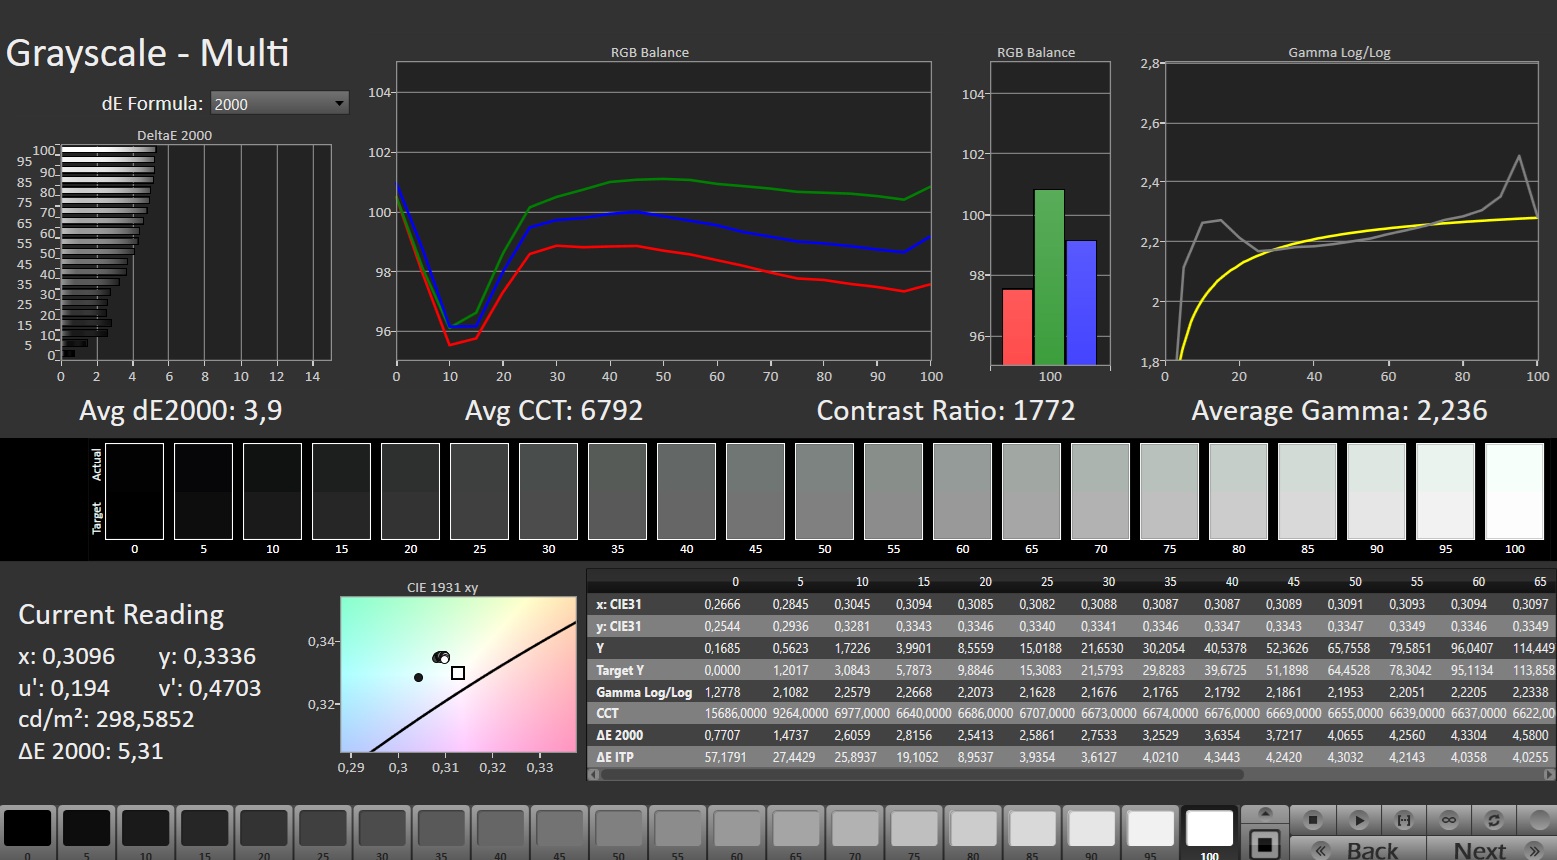
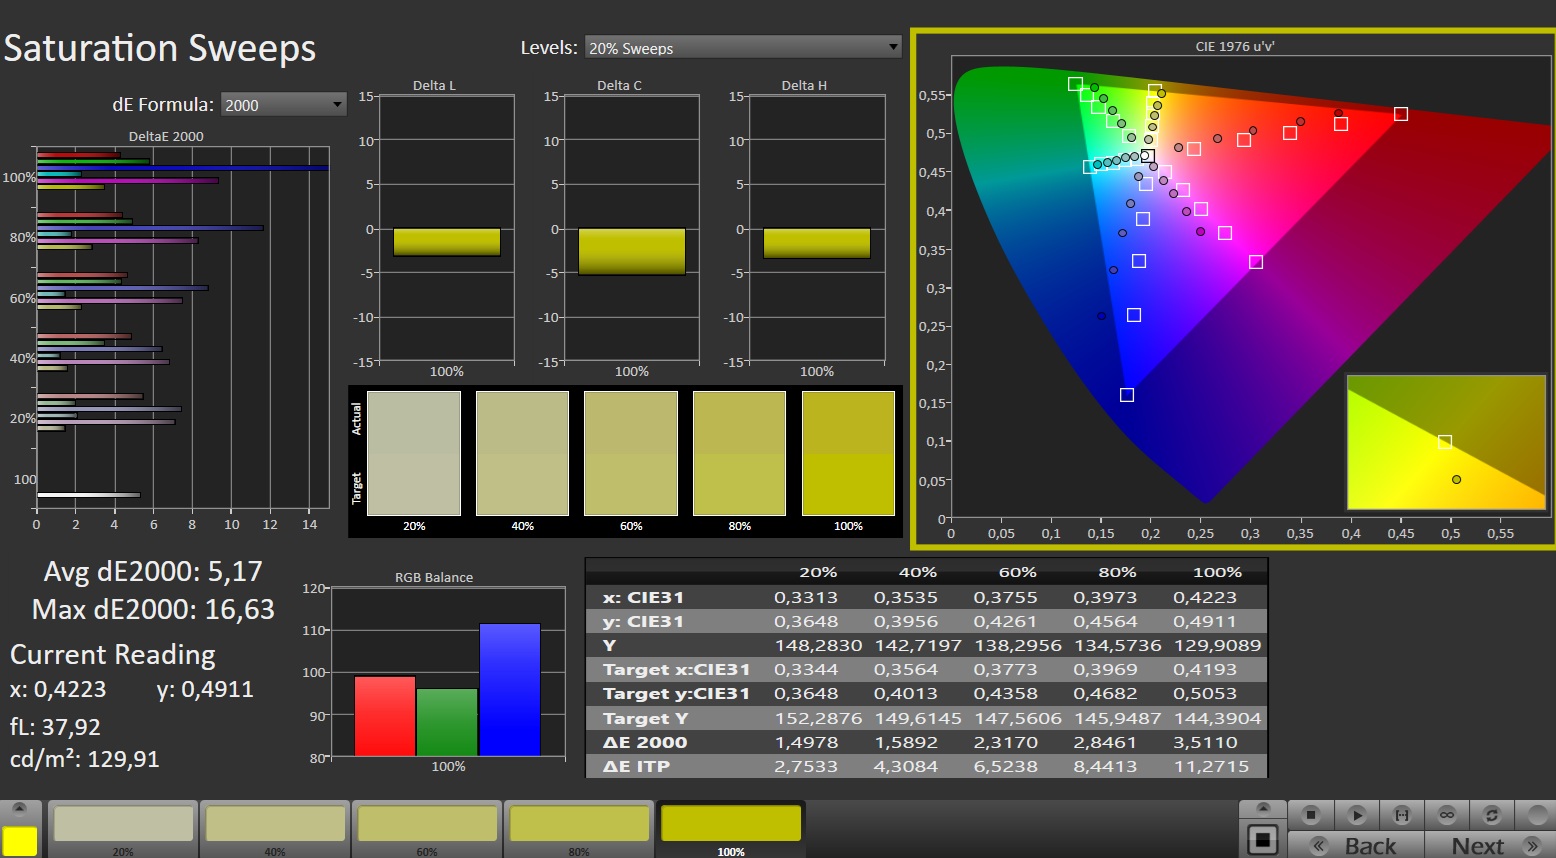
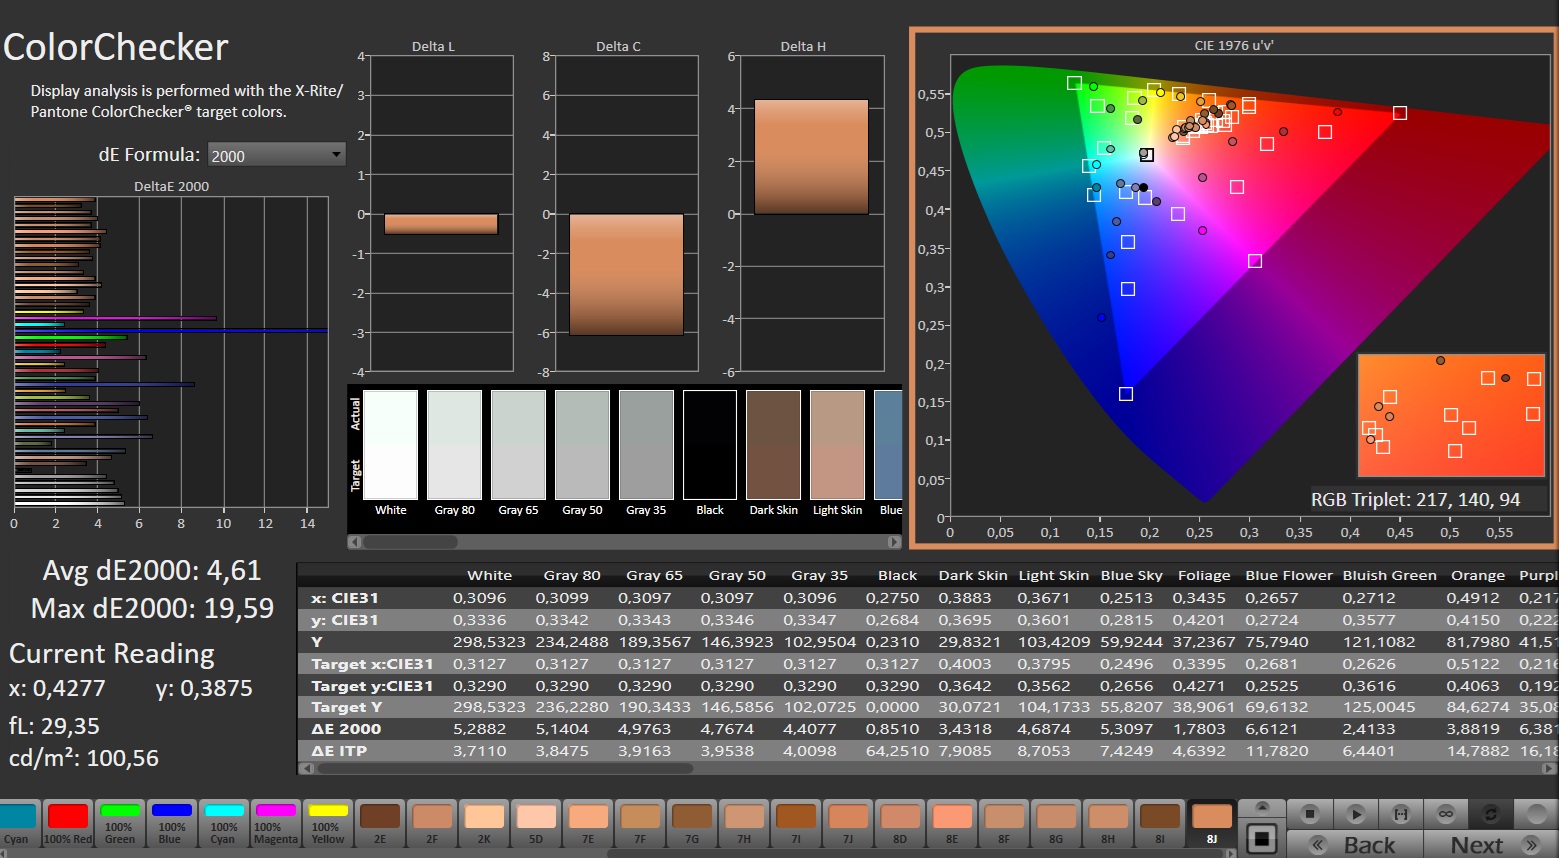
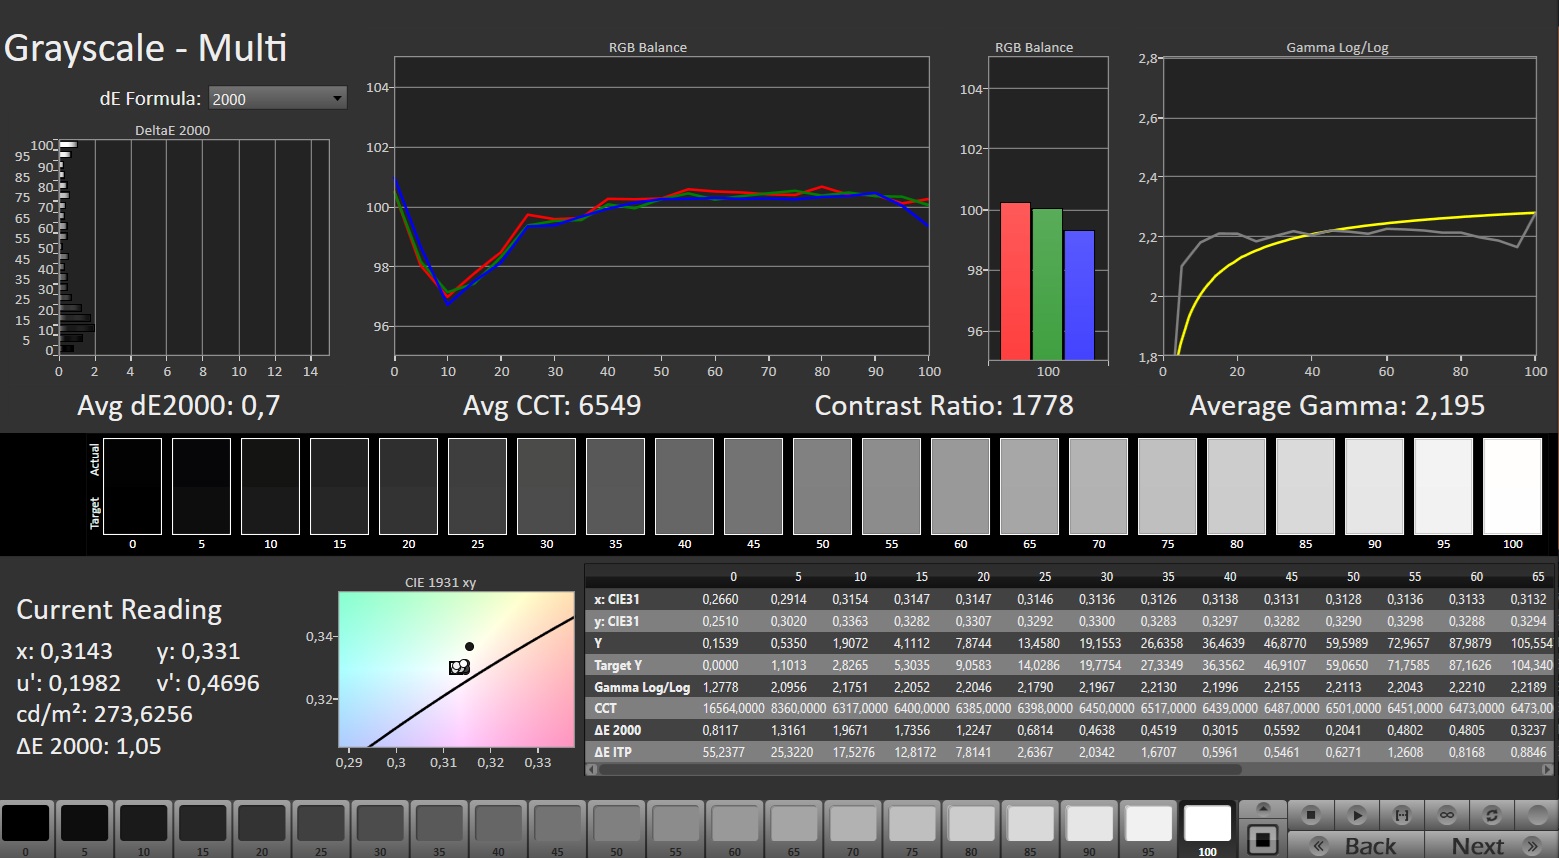
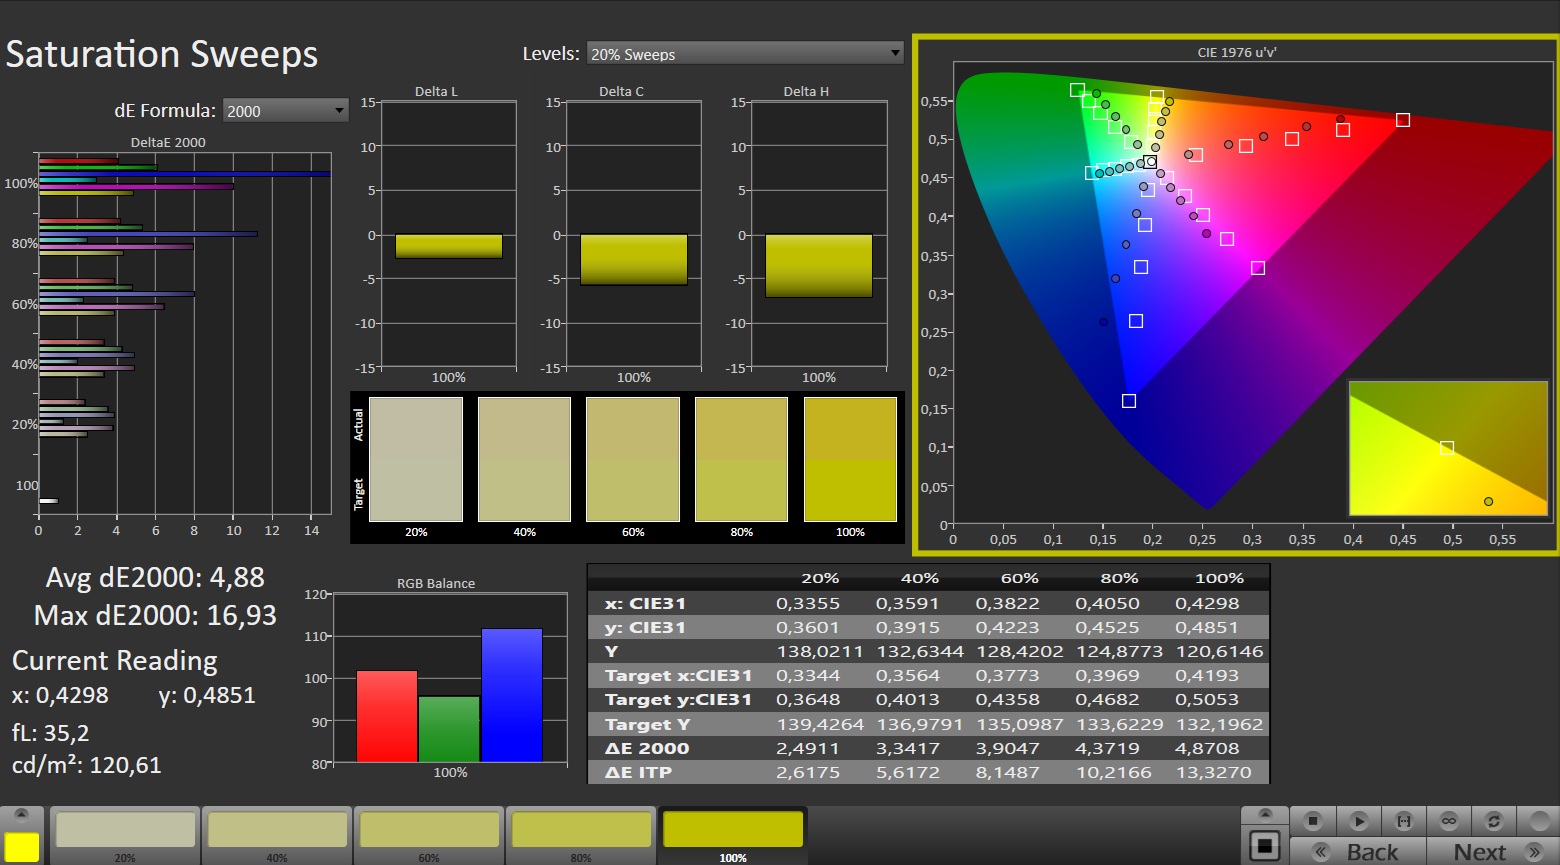
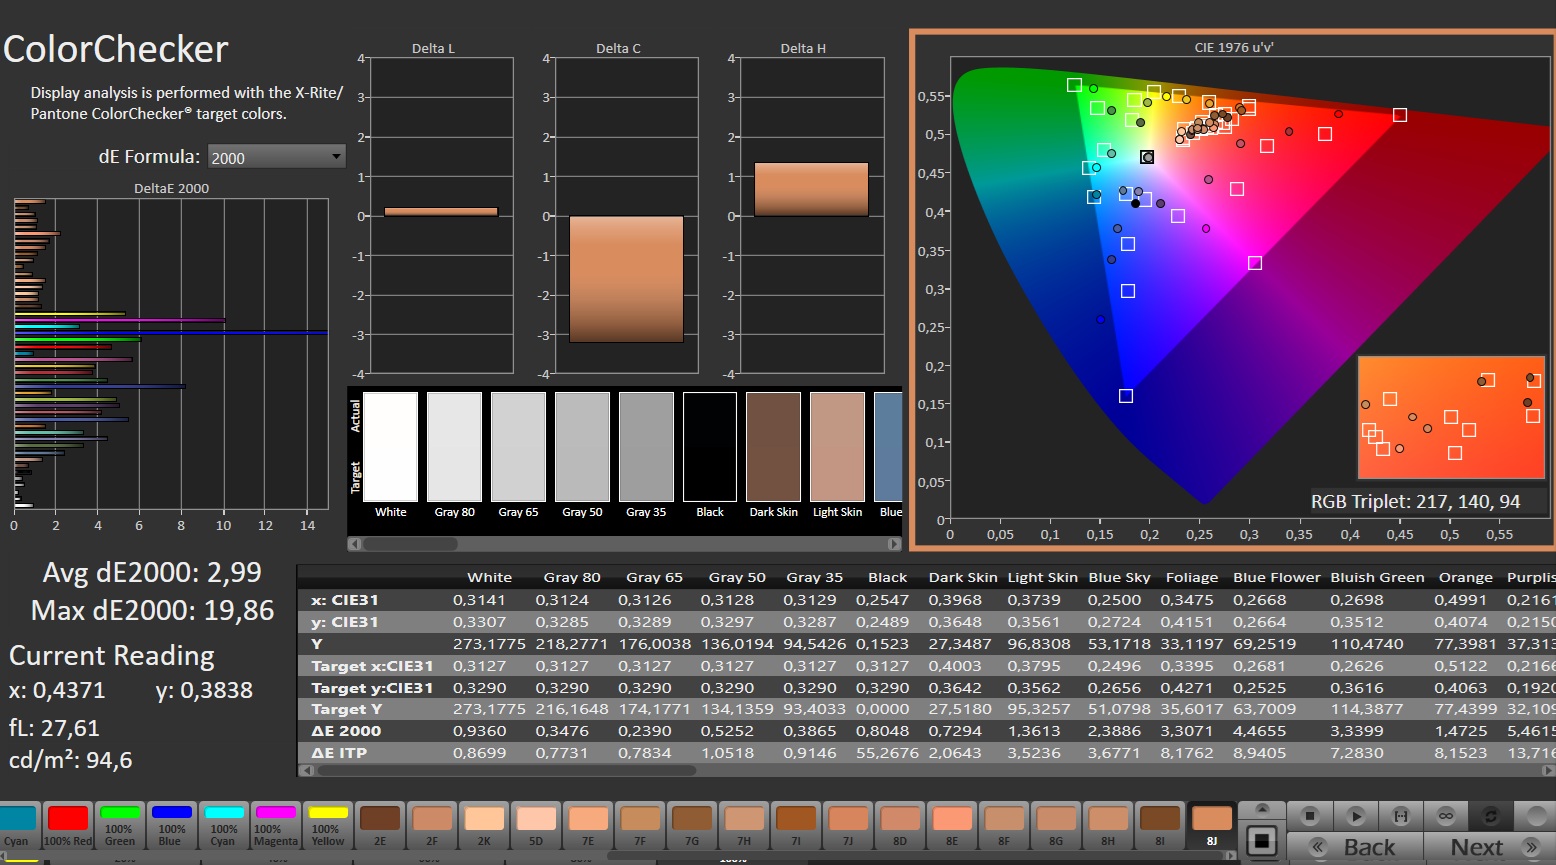
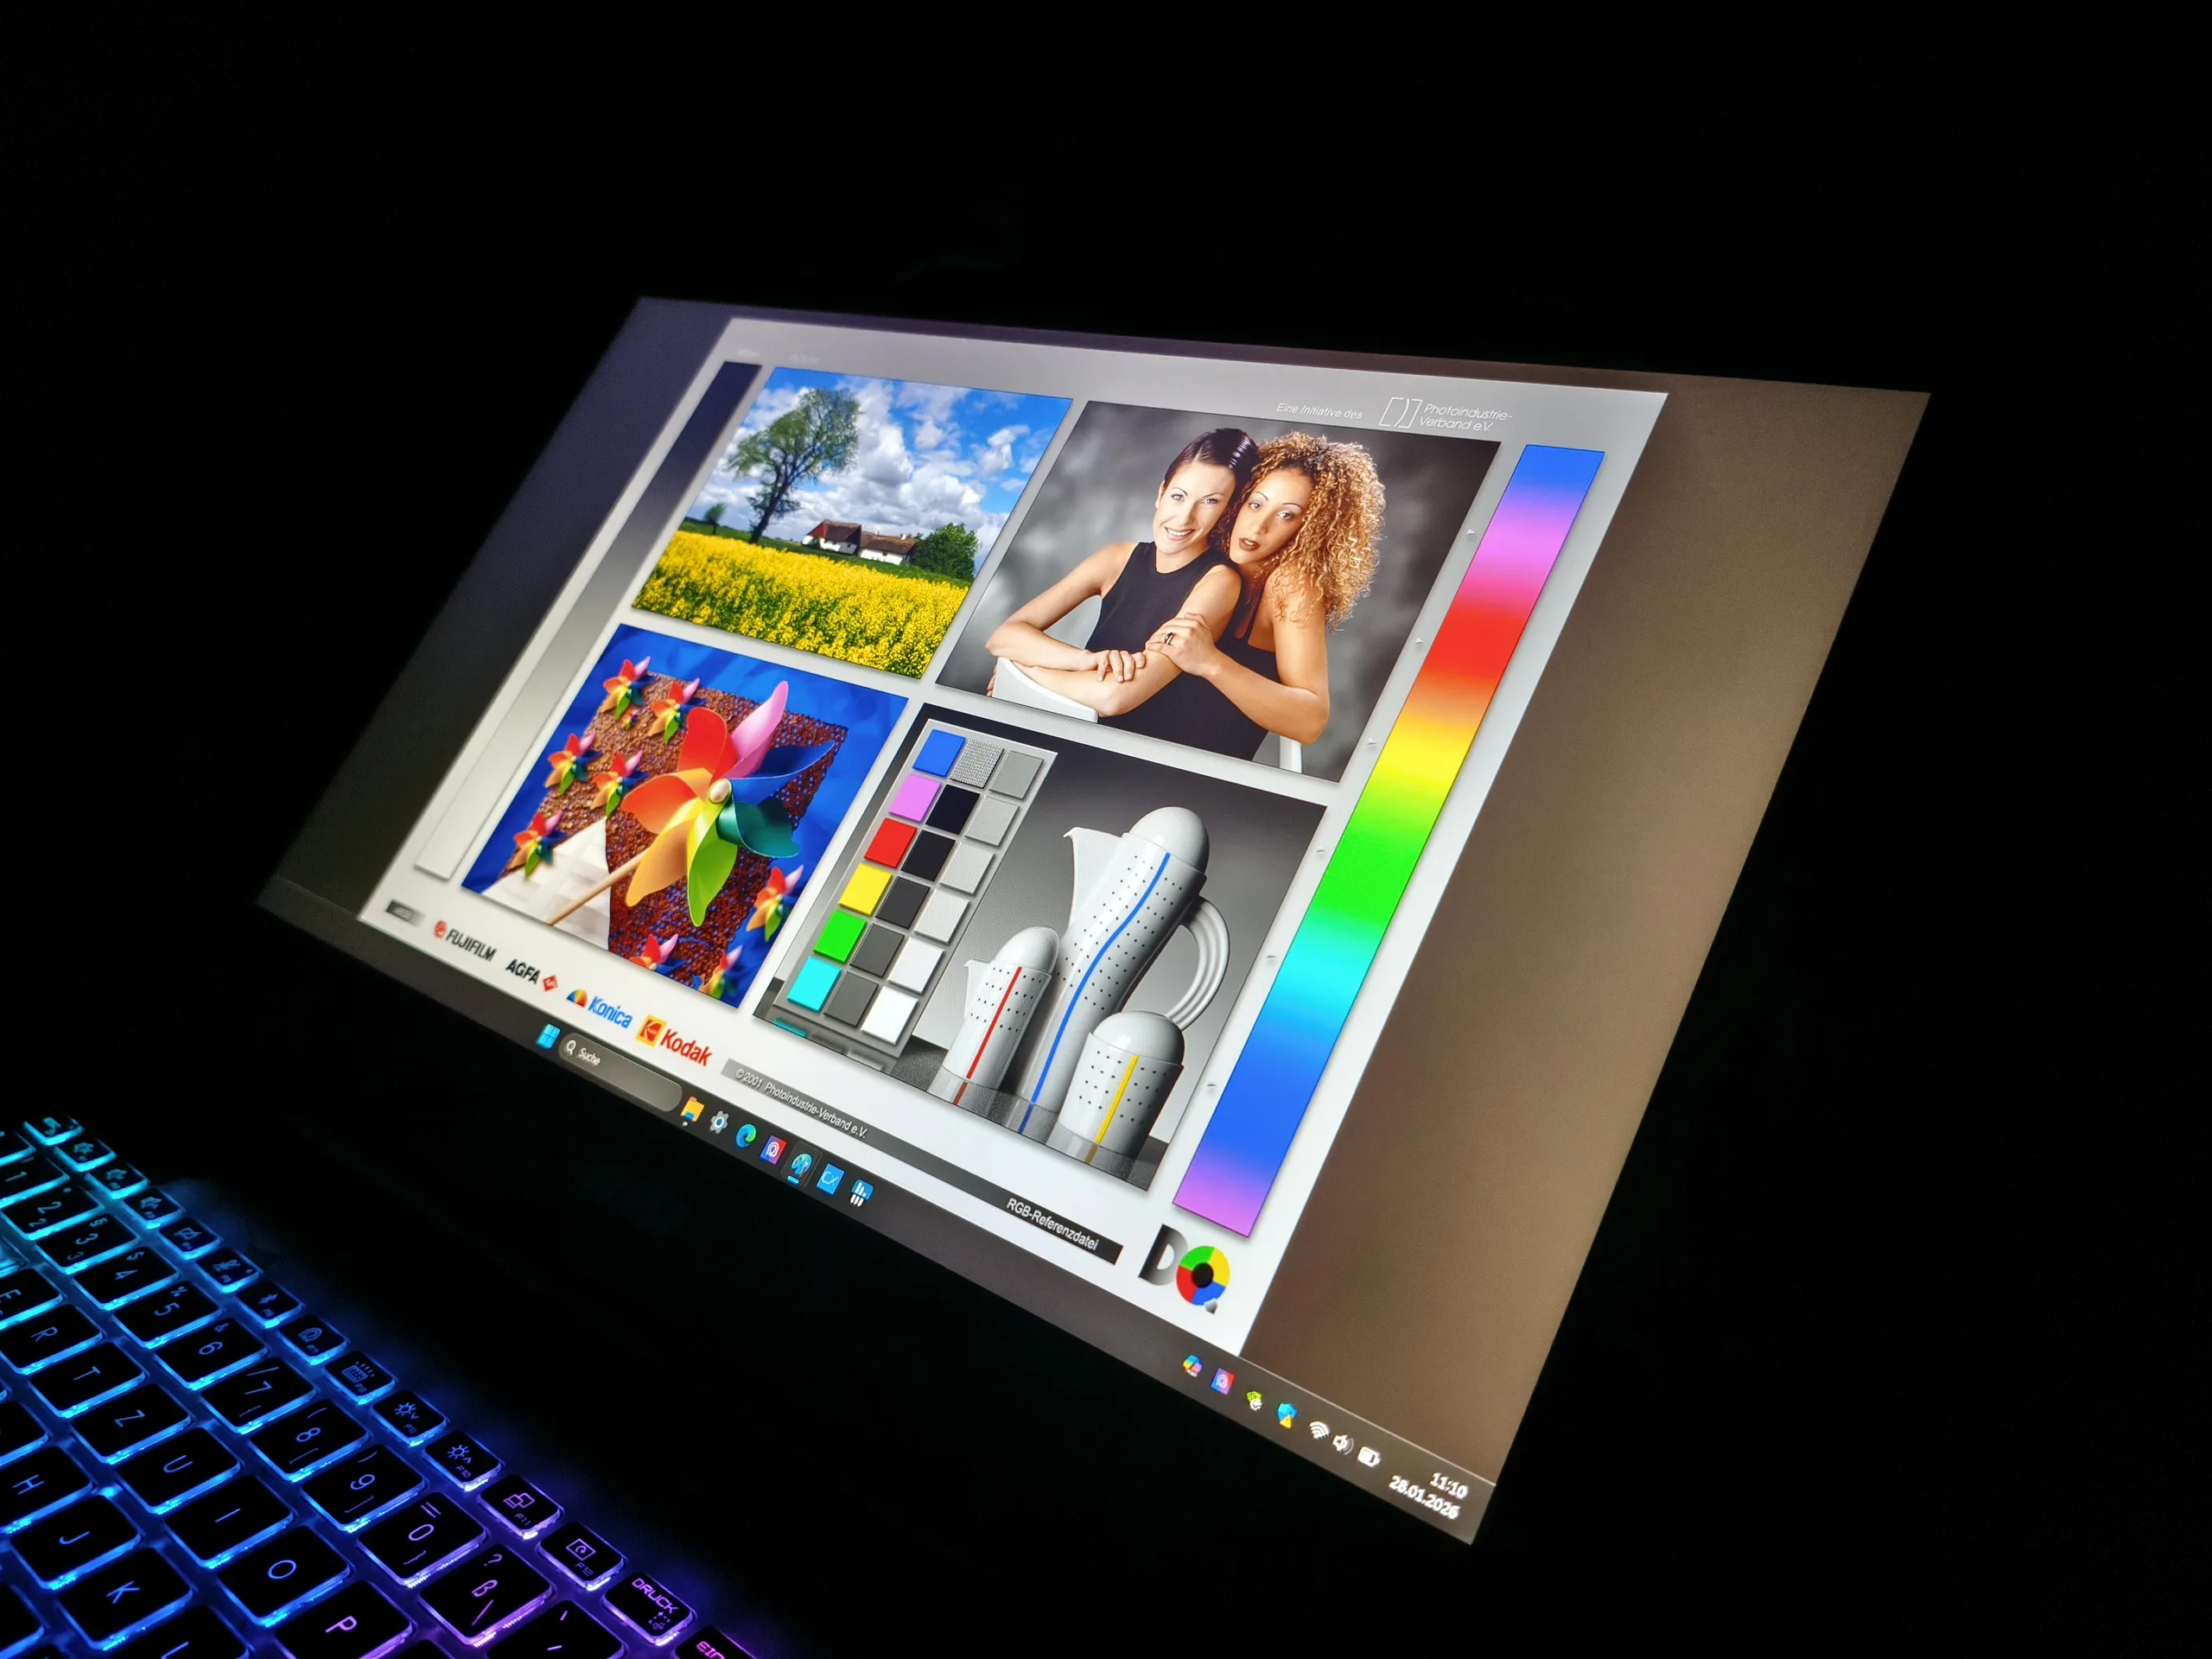
As mentioned at the beginning, the screen quality of the Full HD panel (144 Hz) leaves something to be desired. Although the contrast is quite respectable (almost 1,700:1) thanks to the low black value of 0.17 cd/m², the luminosity of around 270 cd/m² is not impressive. Due to the small color space (only 65% sRGB), buyers also have to live with a rather pale picture impression. The Lenovo LOQ 15 shows how things can be better in this price range, while other aspects such as the response time and viewing angles are average.
| |||||||||||||||||||||||||
Brightness Distribution: 87 %
Center on Battery: 286 cd/m²
Contrast: 1682:1 (Black: 0.17 cd/m²)
ΔE ColorChecker Calman: 4.61 | ∀{0.5-29.43 Ø4.71}
calibrated: 2.99
ΔE Greyscale Calman: 3.9 | ∀{0.09-98 Ø4.96}
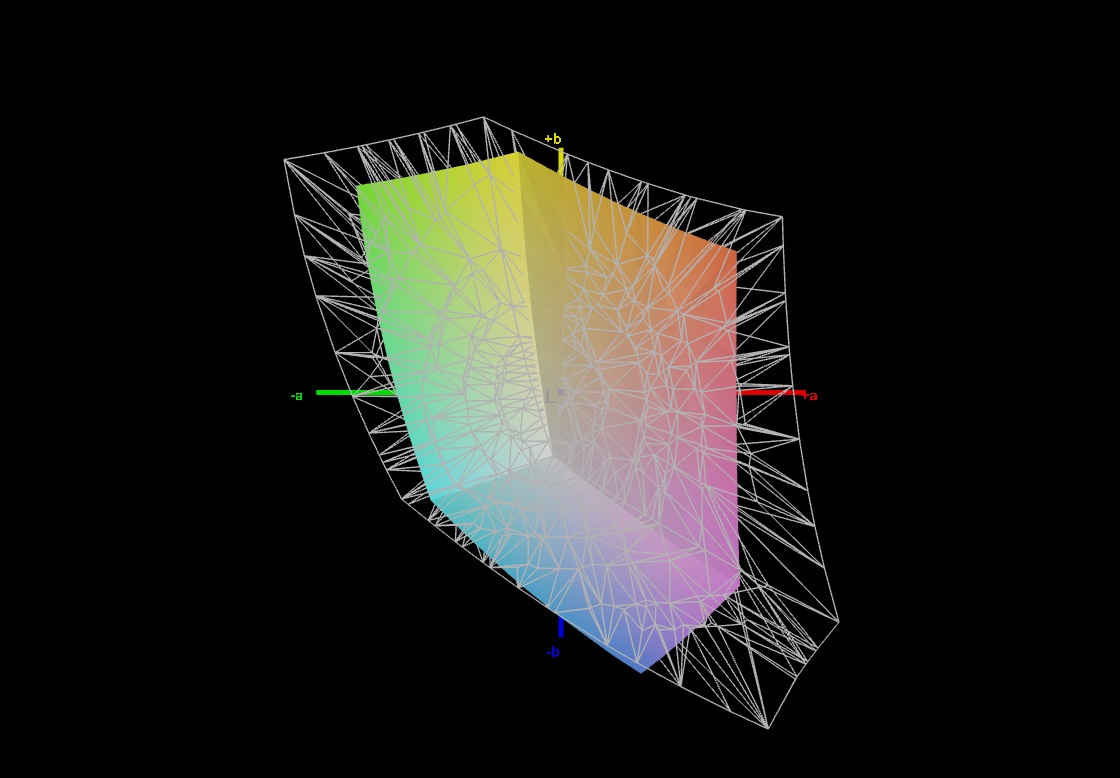
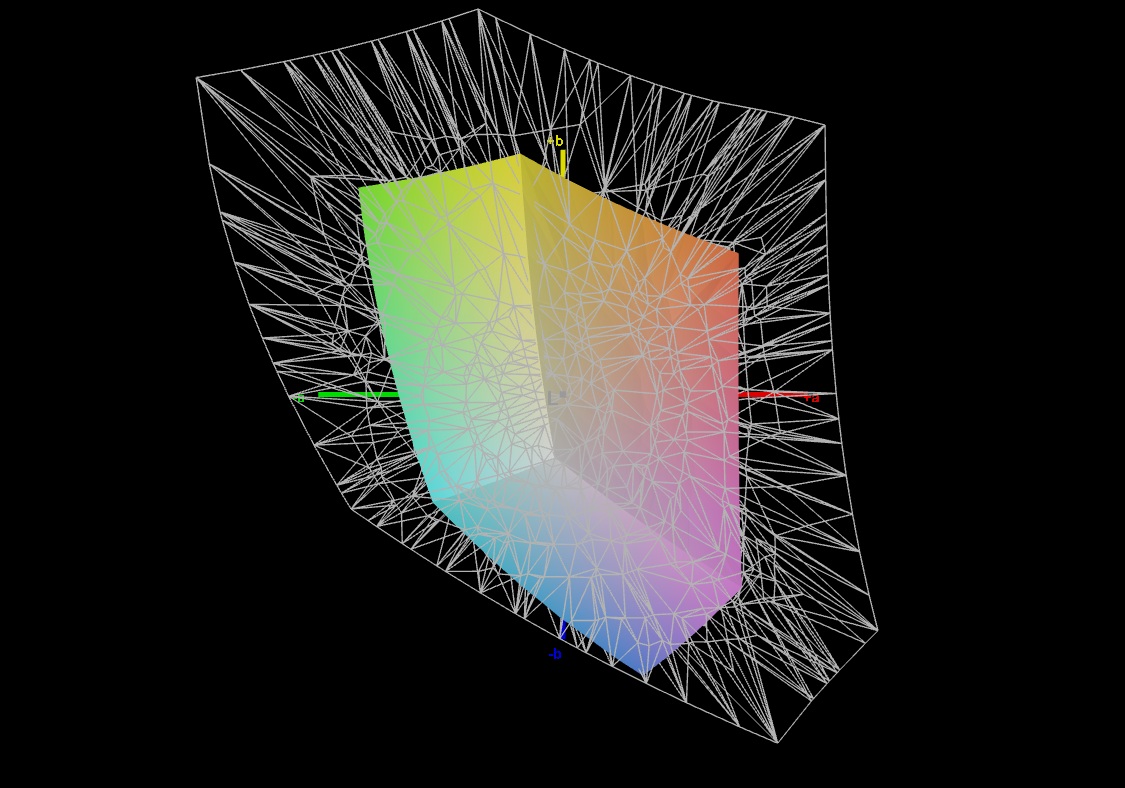
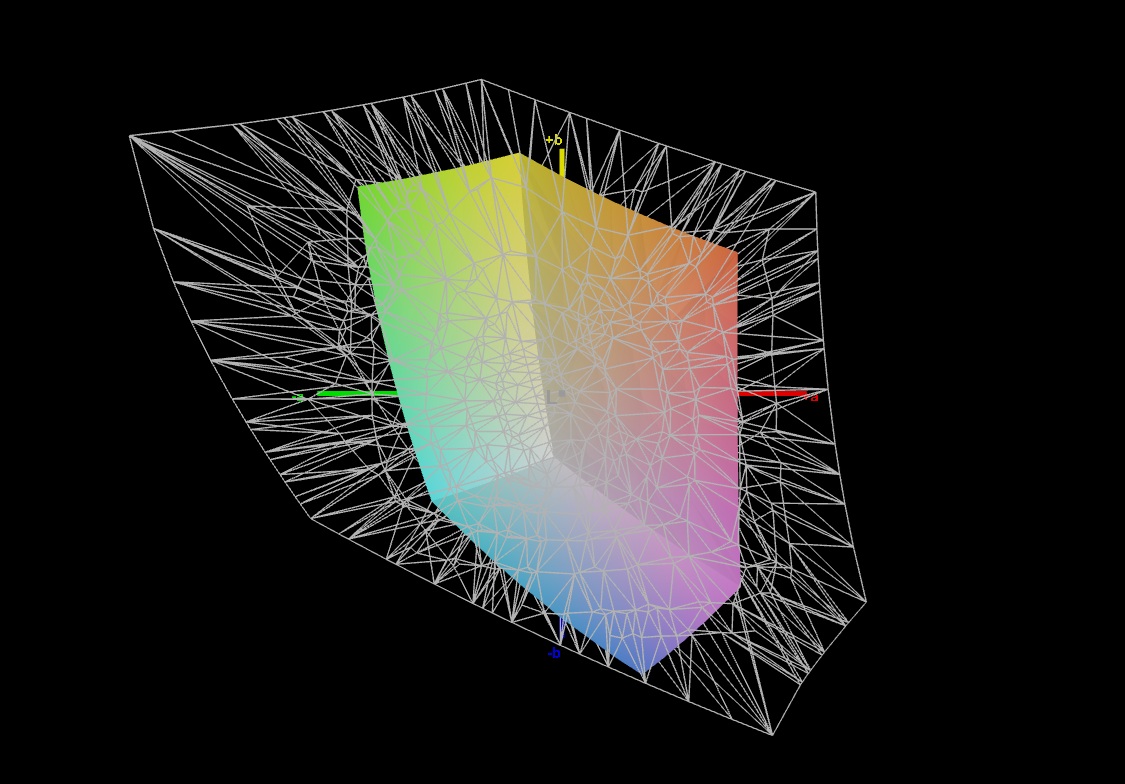
44.9% AdobeRGB 1998 (Argyll 3D)
64.8% sRGB (Argyll 3D)
43.4% Display P3 (Argyll 3D)
Gamma: 2.236
CCT: 6792 K
| MSI Cyborg 15 B2RWEKG CMN N156HRA-EA1, IPS, 1920x1080, 15.6", 144 Hz | MSI Cyborg 15 A12VF AU Optronics B156HAN15.1, IPS, 1920x1080, 15.6", 144 Hz | Acer Nitro V 15 ANV15-52-50S2 BOEhydis NE156FHM-NXA, IPS, 1920x1080, 15.6", 165 Hz | HP Victus 15-fa2160ng CMN1560, IPS, 1920x1080, 15.6", 144 Hz | Lenovo LOQ 15AHP10 CSOT MNF601BA1-4, IPS, 1920x1080, 15.6", 144 Hz | Lenovo Legion 5 15AHP G10 LEN151WQXGA, OLED, 2560x1600, 15.1", 165 Hz | |
|---|---|---|---|---|---|---|
| Display | -3% | -7% | -8% | 54% | 101% | |
| Display P3 Coverage (%) | 43.4 | 42.3 -3% | 40.3 -7% | 43 -1% | 67.3 55% | 99.9 130% |
| sRGB Coverage (%) | 64.8 | 62.6 -3% | 60.3 -7% | 64.3 -1% | 99.2 53% | 100 54% |
| AdobeRGB 1998 Coverage (%) | 44.9 | 43.7 -3% | 41.6 -7% | 34.7 -23% | 69.1 54% | 98.3 119% |
| Response Times | 25% | -23% | -2% | -15% | 98% | |
| Response Time Grey 50% / Grey 80% * (ms) | 27.6 ? | 22 ? 20% | 39 ? -41% | 28.6 ? -4% | 33.9 ? -23% | 0.42 ? 98% |
| Response Time Black / White * (ms) | 20 ? | 14 ? 30% | 20.8 ? -4% | 20 ? -0% | 21.2 ? -6% | 0.4 ? 98% |
| PWM Frequency (Hz) | 1152 ? | |||||
| PWM Amplitude * (%) | 11 | |||||
| Screen | -2% | -2% | -5% | 30% | 67% | |
| Brightness middle (cd/m²) | 286 | 247 -14% | 382 34% | 324 13% | 318 11% | 492 72% |
| Brightness (cd/m²) | 272 | 234 -14% | 347 28% | 303 11% | 300 10% | 495 82% |
| Brightness Distribution (%) | 87 | 89 2% | 86 -1% | 87 0% | 89 2% | 92 6% |
| Black Level * (cd/m²) | 0.17 | 0.25 -47% | 0.31 -82% | 0.26 -53% | 0.2 -18% | |
| Contrast (:1) | 1682 | 988 -41% | 1232 -27% | 1246 -26% | 1590 -5% | |
| Colorchecker dE 2000 * | 4.61 | 3.78 18% | 4.34 6% | 4.7 -2% | 1.33 71% | 0.9 80% |
| Colorchecker dE 2000 max. * | 19.59 | 6.42 67% | 19.19 2% | 18.19 7% | 4.42 77% | 1.8 91% |
| Colorchecker dE 2000 calibrated * | 2.99 | 3.94 -32% | 3.56 -19% | 2.93 2% | 0.94 69% | |
| Greyscale dE 2000 * | 3.9 | 2.16 45% | 2.4 38% | 3.9 -0% | 1.9 51% | 1.2 69% |
| Gamma | 2.236 98% | 2.33 94% | 2.165 102% | 2.21 100% | 2.187 101% | 2.16 102% |
| CCT | 6792 96% | 6906 94% | 7024 93% | 7541 86% | 6678 97% | 6291 103% |
| Total Average (Program / Settings) | 7% /
2% | -11% /
-6% | -5% /
-6% | 23% /
29% | 89% /
82% |
* ... smaller is better
Display Response Times
| ↔ Response Time Black to White | ||
|---|---|---|
| 20 ms ... rise ↗ and fall ↘ combined | ↗ 10.6 ms rise | 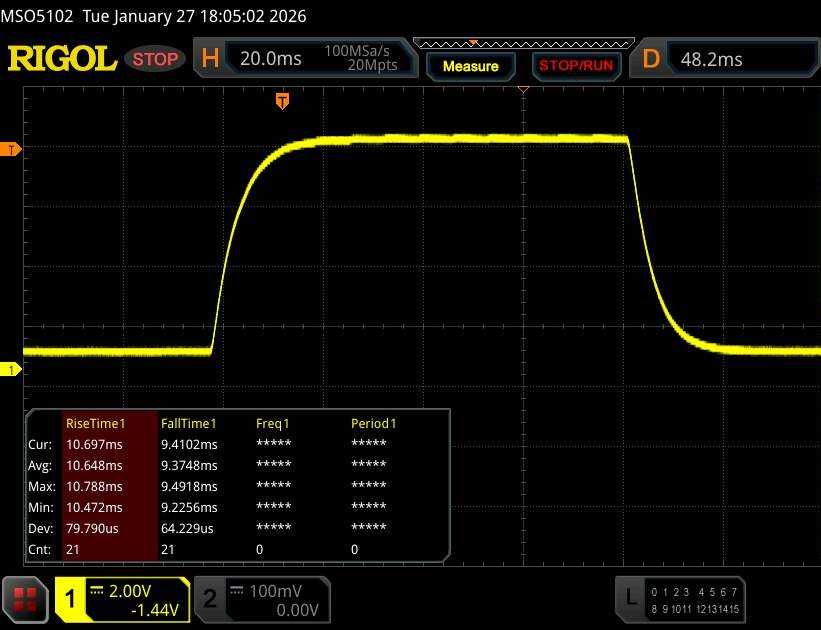 |
| ↘ 9.4 ms fall | ||
| The screen shows good response rates in our tests, but may be too slow for competitive gamers. In comparison, all tested devices range from 0.1 (minimum) to 240 (maximum) ms. » 44 % of all devices are better. This means that the measured response time is similar to the average of all tested devices (19.8 ms). | ||
| ↔ Response Time 50% Grey to 80% Grey | ||
| 27.6 ms ... rise ↗ and fall ↘ combined | ↗ 12.9 ms rise | 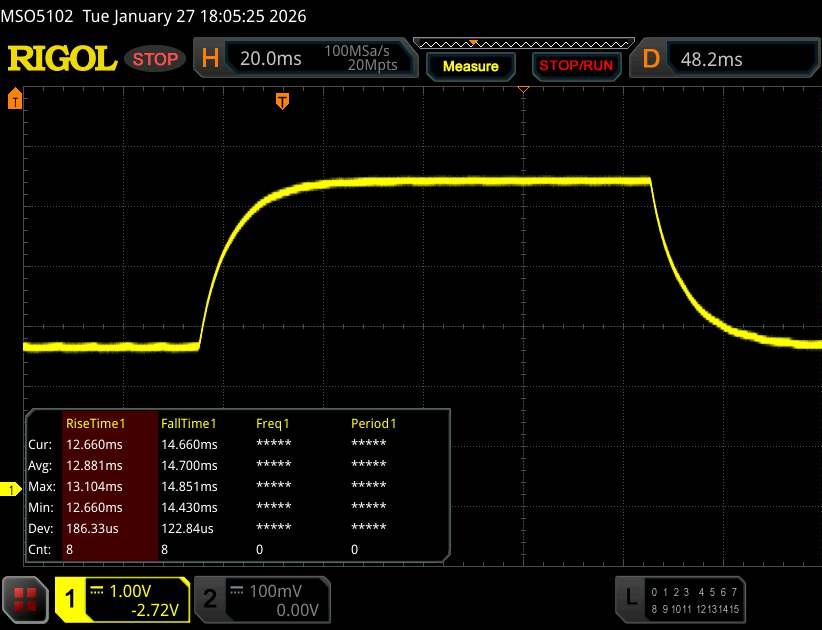 |
| ↘ 14.7 ms fall | ||
| The screen shows relatively slow response rates in our tests and may be too slow for gamers. In comparison, all tested devices range from 0.165 (minimum) to 636 (maximum) ms. » 38 % of all devices are better. This means that the measured response time is better than the average of all tested devices (30.9 ms). | ||
Screen Flickering / PWM (Pulse-Width Modulation)
| Screen flickering / PWM not detected | 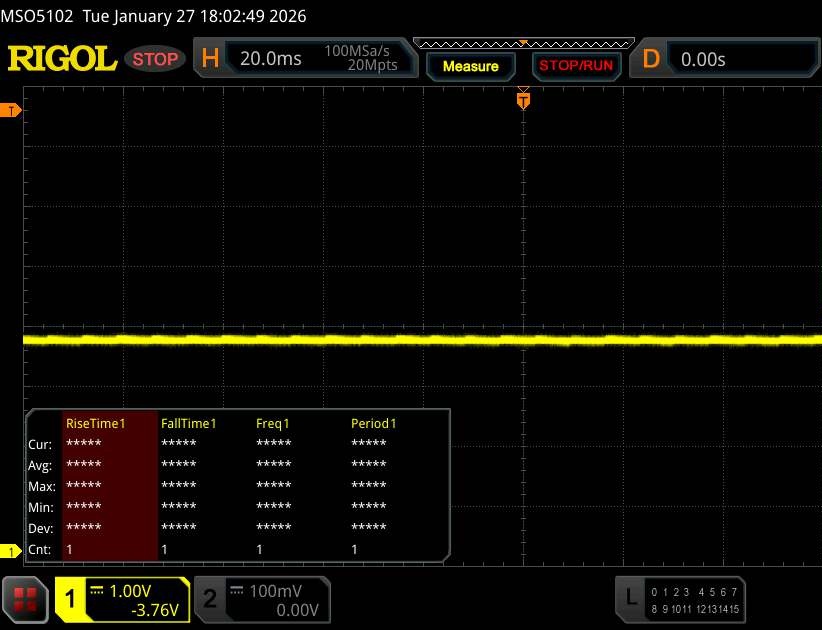 | ||
In comparison: 52 % of all tested devices do not use PWM to dim the display. If PWM was detected, an average of 7744 (minimum: 5 - maximum: 343500) Hz was measured. | |||
Performance
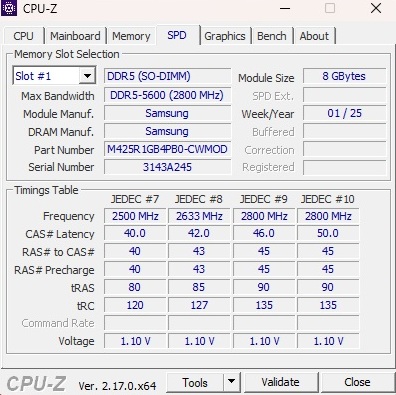
The performance of the Cyborg 15 is in the mid-range. If the RAM or mass storage should ever run out, they can be upgraded thanks to two SO-DIMM banks and an M.2-2280 slot.
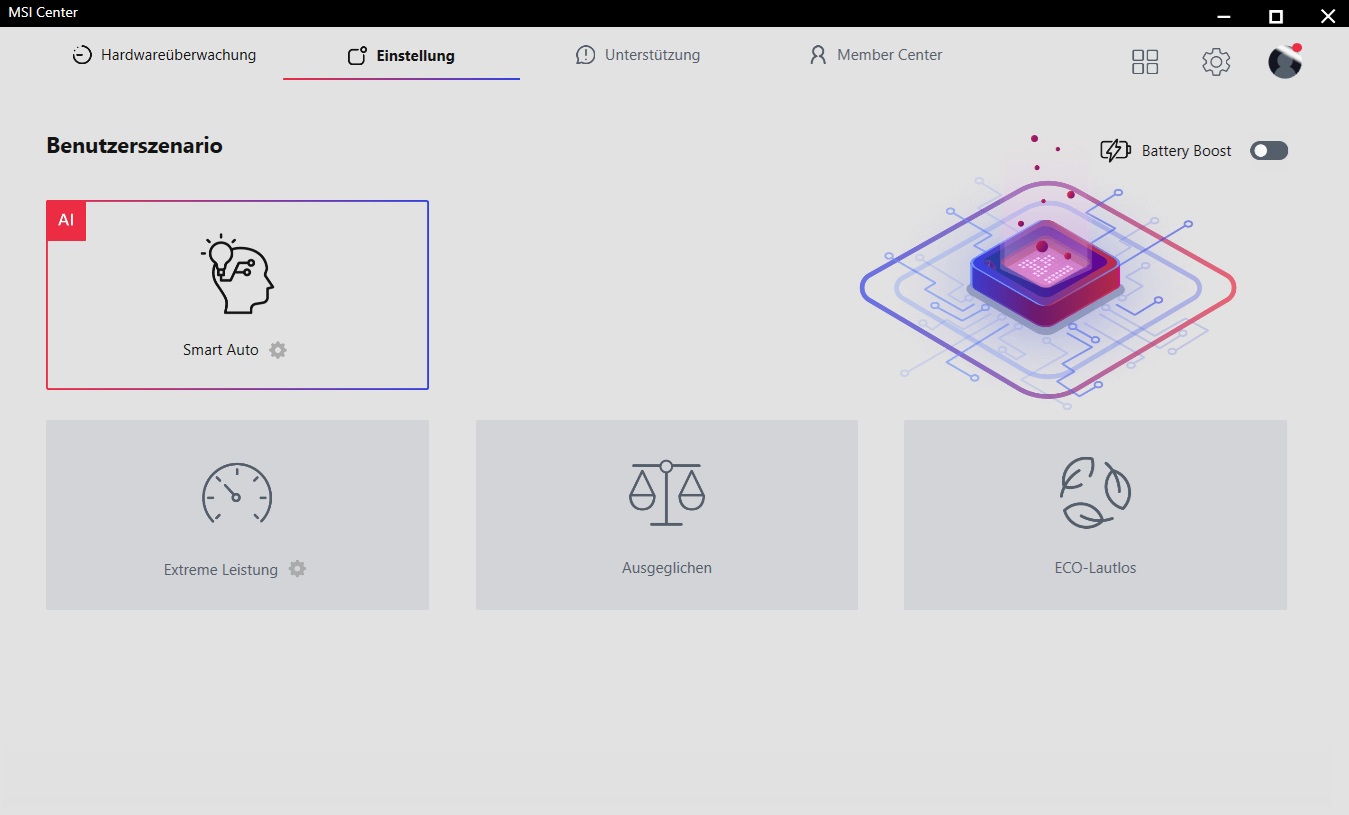
Test conditions
The pre-installed MSI Center offers various user scenarios, ranging from ECO Silent to Extreme Performance. Our measurements were carried out with the AI mode Smart Auto (the differences between the profiles can be found in the table below).
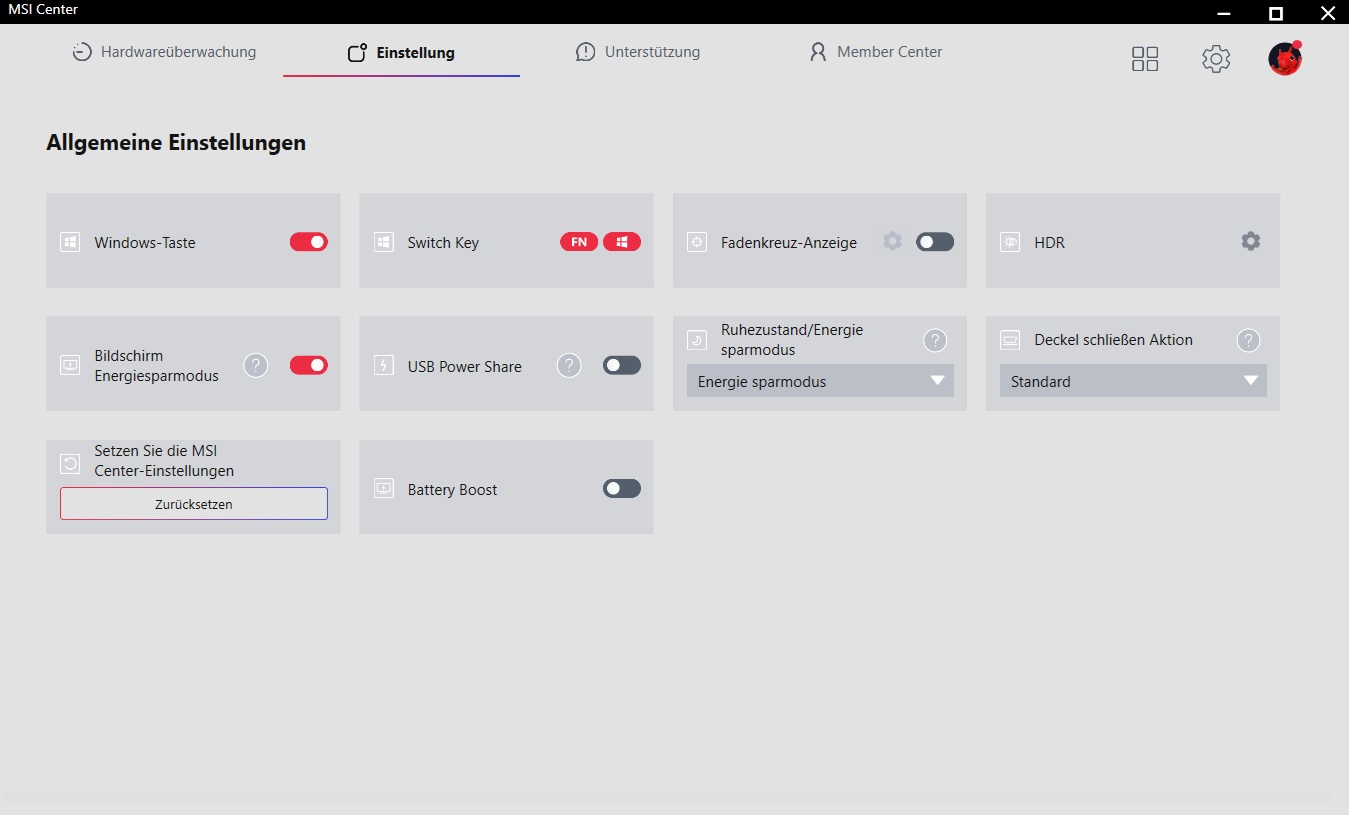
| Mode | Smart Auto | Extreme performance | Balanced | ECO Silent |
| Cyberpunk 2077 Noise | 45 dB(A) | 48 dB(A) | 45 dB(A) | 37 dB(A) |
| Cyberpunk 2077 frame rate (FHD/Ultra) | 55.3 fps | 56.3 fps | 55.2 fps | 36.2 fps |
| GPU Power Draw | ~40 W | ~45 W | ~40 W | ~35 W |
| CPU PL1 | 45 W | 45 W | 35 W | 15 W |
| CPU PL2 | 45 W | 45 W | 35 W | 15 W |
| Cinebench R15 Multi Score | 1913 Points | 1931 Points | 1669 Points | 731 Points |
Processor
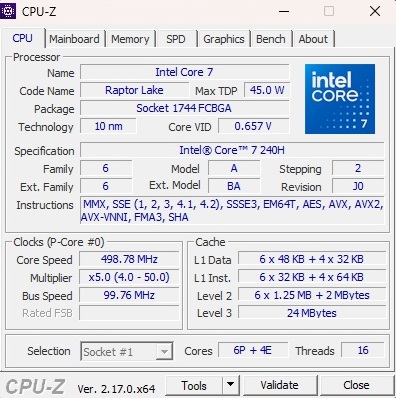
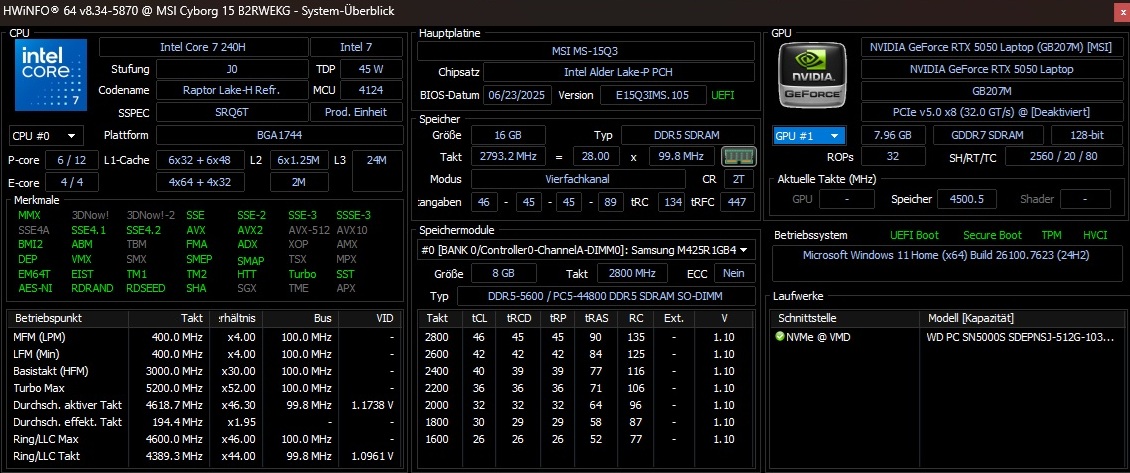
With the installed Core 7 240H is a 10 nm model from the Raptor Lake generation, which contains six performance cores including Hyper-Threading and four efficiency cores without HT, making a total of 16 parallel threads possible. In the CPU course, the chip is positioned between the Core i5-13420H of the Victus 15 or Acer Nitro V 15 and the Core i7-12650H of the old Cyborg 15. The competition from AMD is pulling ahead, at least in the form of the Ryzen 7 250 (Lenovo LOQ 15) or Ryzen 7 260 (Lenovo Legion 5 15).
Cinebench R15 Multi endurance test
* ... smaller is better
AIDA64: FP32 Ray-Trace | FPU Julia | CPU SHA3 | CPU Queen | FPU SinJulia | FPU Mandel | CPU AES | CPU ZLib | FP64 Ray-Trace | CPU PhotoWorxx
| Performance rating | |
| Average of class Gaming | |
| Lenovo Legion 5 15AHP G10 | |
| Lenovo LOQ 15AHP10 | |
| Average Intel Core 7 240H | |
| MSI Cyborg 15 A12VF | |
| MSI Cyborg 15 B2RWEKG | |
| Acer Nitro V 15 ANV15-52-50S2 | |
| HP Victus 15-fa2160ng | |
| AIDA64 / FP32 Ray-Trace | |
| Average of class Gaming (10227 - 85542, n=102, last 2 years) | |
| Lenovo Legion 5 15AHP G10 | |
| Lenovo LOQ 15AHP10 | |
| Average Intel Core 7 240H (11867 - 15972, n=4) | |
| MSI Cyborg 15 A12VF | |
| Acer Nitro V 15 ANV15-52-50S2 | |
| MSI Cyborg 15 B2RWEKG | |
| HP Victus 15-fa2160ng | |
| AIDA64 / FPU Julia | |
| Average of class Gaming (51376 - 372155, n=102, last 2 years) | |
| Lenovo Legion 5 15AHP G10 | |
| Lenovo LOQ 15AHP10 | |
| Average Intel Core 7 240H (59260 - 80238, n=4) | |
| MSI Cyborg 15 A12VF | |
| Acer Nitro V 15 ANV15-52-50S2 | |
| MSI Cyborg 15 B2RWEKG | |
| HP Victus 15-fa2160ng | |
| AIDA64 / CPU SHA3 | |
| Average of class Gaming (2180 - 10115, n=102, last 2 years) | |
| Lenovo Legion 5 15AHP G10 | |
| Lenovo LOQ 15AHP10 | |
| MSI Cyborg 15 A12VF | |
| Average Intel Core 7 240H (2455 - 3287, n=4) | |
| Acer Nitro V 15 ANV15-52-50S2 | |
| HP Victus 15-fa2160ng | |
| MSI Cyborg 15 B2RWEKG | |
| AIDA64 / CPU Queen | |
| Lenovo Legion 5 15AHP G10 | |
| Average of class Gaming (49785 - 173351, n=86, last 2 years) | |
| Lenovo LOQ 15AHP10 | |
| MSI Cyborg 15 A12VF | |
| Average Intel Core 7 240H (75356 - 81422, n=2) | |
| MSI Cyborg 15 B2RWEKG | |
| Acer Nitro V 15 ANV15-52-50S2 | |
| HP Victus 15-fa2160ng | |
| AIDA64 / FPU SinJulia | |
| Lenovo Legion 5 15AHP G10 | |
| Average of class Gaming (4424 - 33636, n=102, last 2 years) | |
| Lenovo LOQ 15AHP10 | |
| Average Intel Core 7 240H (7777 - 9366, n=4) | |
| MSI Cyborg 15 A12VF | |
| MSI Cyborg 15 B2RWEKG | |
| Acer Nitro V 15 ANV15-52-50S2 | |
| HP Victus 15-fa2160ng | |
| AIDA64 / FPU Mandel | |
| Average of class Gaming (25115 - 196829, n=102, last 2 years) | |
| Lenovo Legion 5 15AHP G10 | |
| Lenovo LOQ 15AHP10 | |
| Average Intel Core 7 240H (29381 - 39967, n=4) | |
| MSI Cyborg 15 A12VF | |
| Acer Nitro V 15 ANV15-52-50S2 | |
| MSI Cyborg 15 B2RWEKG | |
| HP Victus 15-fa2160ng | |
| AIDA64 / CPU AES | |
| Average of class Gaming (39258 - 247074, n=102, last 2 years) | |
| Lenovo Legion 5 15AHP G10 | |
| Lenovo LOQ 15AHP10 | |
| MSI Cyborg 15 A12VF | |
| Average Intel Core 7 240H (50528 - 67855, n=4) | |
| MSI Cyborg 15 B2RWEKG | |
| Acer Nitro V 15 ANV15-52-50S2 | |
| HP Victus 15-fa2160ng | |
| AIDA64 / CPU ZLib | |
| Average of class Gaming (574 - 2531, n=102, last 2 years) | |
| Lenovo Legion 5 15AHP G10 | |
| Lenovo LOQ 15AHP10 | |
| MSI Cyborg 15 A12VF | |
| Average Intel Core 7 240H (725 - 951, n=4) | |
| Acer Nitro V 15 ANV15-52-50S2 | |
| HP Victus 15-fa2160ng | |
| MSI Cyborg 15 B2RWEKG | |
| AIDA64 / FP64 Ray-Trace | |
| Average of class Gaming (5509 - 45446, n=102, last 2 years) | |
| Lenovo Legion 5 15AHP G10 | |
| Lenovo LOQ 15AHP10 | |
| Average Intel Core 7 240H (6389 - 8569, n=4) | |
| MSI Cyborg 15 A12VF | |
| Acer Nitro V 15 ANV15-52-50S2 | |
| MSI Cyborg 15 B2RWEKG | |
| HP Victus 15-fa2160ng | |
| AIDA64 / CPU PhotoWorxx | |
| Average of class Gaming (12271 - 89891, n=102, last 2 years) | |
| Lenovo Legion 5 15AHP G10 | |
| Average Intel Core 7 240H (21710 - 44874, n=4) | |
| MSI Cyborg 15 B2RWEKG | |
| MSI Cyborg 15 A12VF | |
| Lenovo LOQ 15AHP10 | |
| HP Victus 15-fa2160ng | |
| Acer Nitro V 15 ANV15-52-50S2 | |
System performance
The Cyborg 15 also lands in the midfield in terms of system performance. The computer responds pleasantly quickly in everyday use.
PCMark 10: Productivity | Digital Content Creation
CrossMark: Overall | Productivity | Creativity | Responsiveness
WebXPRT 3: Overall
WebXPRT 4: Overall
Mozilla Kraken 1.1: Total
| Performance rating | |
| Average of class Gaming | |
| Lenovo Legion 5 15AHP G10 | |
| MSI Cyborg 15 A12VF | |
| Lenovo LOQ 15AHP10 -2! | |
| MSI Cyborg 15 B2RWEKG | |
| Average Intel Core 7 240H, NVIDIA GeForce RTX 5050 Laptop | |
| Acer Nitro V 15 ANV15-52-50S2 | |
| HP Victus 15-fa2160ng | |
| PCMark 10 / Productivity | |
| Average of class Gaming (6845 - 25323, n=95, last 2 years) | |
| MSI Cyborg 15 B2RWEKG | |
| Average Intel Core 7 240H, NVIDIA GeForce RTX 5050 Laptop (n=1) | |
| Acer Nitro V 15 ANV15-52-50S2 | |
| Lenovo Legion 5 15AHP G10 | |
| MSI Cyborg 15 A12VF | |
| Lenovo LOQ 15AHP10 | |
| HP Victus 15-fa2160ng | |
| PCMark 10 / Digital Content Creation | |
| Average of class Gaming (7602 - 19954, n=95, last 2 years) | |
| Lenovo Legion 5 15AHP G10 | |
| Lenovo LOQ 15AHP10 | |
| MSI Cyborg 15 A12VF | |
| HP Victus 15-fa2160ng | |
| Acer Nitro V 15 ANV15-52-50S2 | |
| MSI Cyborg 15 B2RWEKG | |
| Average Intel Core 7 240H, NVIDIA GeForce RTX 5050 Laptop (n=1) | |
| CrossMark / Overall | |
| Average of class Gaming (1366 - 2409, n=94, last 2 years) | |
| MSI Cyborg 15 A12VF | |
| Lenovo Legion 5 15AHP G10 | |
| Lenovo LOQ 15AHP10 | |
| MSI Cyborg 15 B2RWEKG | |
| Average Intel Core 7 240H, NVIDIA GeForce RTX 5050 Laptop (n=1) | |
| Acer Nitro V 15 ANV15-52-50S2 | |
| HP Victus 15-fa2160ng | |
| CrossMark / Productivity | |
| Average of class Gaming (1386 - 2254, n=94, last 2 years) | |
| Lenovo LOQ 15AHP10 | |
| MSI Cyborg 15 A12VF | |
| Lenovo Legion 5 15AHP G10 | |
| MSI Cyborg 15 B2RWEKG | |
| Average Intel Core 7 240H, NVIDIA GeForce RTX 5050 Laptop (n=1) | |
| Acer Nitro V 15 ANV15-52-50S2 | |
| HP Victus 15-fa2160ng | |
| CrossMark / Creativity | |
| Average of class Gaming (1343 - 2786, n=94, last 2 years) | |
| Lenovo Legion 5 15AHP G10 | |
| MSI Cyborg 15 A12VF | |
| MSI Cyborg 15 B2RWEKG | |
| Average Intel Core 7 240H, NVIDIA GeForce RTX 5050 Laptop (n=1) | |
| Lenovo LOQ 15AHP10 | |
| HP Victus 15-fa2160ng | |
| Acer Nitro V 15 ANV15-52-50S2 | |
| CrossMark / Responsiveness | |
| Average of class Gaming (1226 - 2334, n=94, last 2 years) | |
| Lenovo LOQ 15AHP10 | |
| MSI Cyborg 15 A12VF | |
| Lenovo Legion 5 15AHP G10 | |
| MSI Cyborg 15 B2RWEKG | |
| Average Intel Core 7 240H, NVIDIA GeForce RTX 5050 Laptop (n=1) | |
| Acer Nitro V 15 ANV15-52-50S2 | |
| HP Victus 15-fa2160ng | |
| WebXPRT 3 / Overall | |
| Average of class Gaming (220 - 532, n=98, last 2 years) | |
| Lenovo Legion 5 15AHP G10 | |
| MSI Cyborg 15 A12VF | |
| MSI Cyborg 15 B2RWEKG | |
| Average Intel Core 7 240H, NVIDIA GeForce RTX 5050 Laptop (n=1) | |
| HP Victus 15-fa2160ng | |
| Acer Nitro V 15 ANV15-52-50S2 | |
| WebXPRT 4 / Overall | |
| Average of class Gaming (165 - 354, n=98, last 2 years) | |
| Lenovo Legion 5 15AHP G10 | |
| MSI Cyborg 15 B2RWEKG | |
| Average Intel Core 7 240H, NVIDIA GeForce RTX 5050 Laptop (n=1) | |
| MSI Cyborg 15 A12VF | |
| HP Victus 15-fa2160ng | |
| Acer Nitro V 15 ANV15-52-50S2 | |
| Mozilla Kraken 1.1 / Total | |
| Acer Nitro V 15 ANV15-52-50S2 | |
| HP Victus 15-fa2160ng | |
| MSI Cyborg 15 A12VF | |
| MSI Cyborg 15 B2RWEKG | |
| Average Intel Core 7 240H, NVIDIA GeForce RTX 5050 Laptop (n=1) | |
| Lenovo LOQ 15AHP10 | |
| Lenovo Legion 5 15AHP G10 | |
| Average of class Gaming (391 - 590, n=100, last 2 years) | |
* ... smaller is better
| AIDA64 / Memory Copy | |
| Average of class Gaming (21750 - 129946, n=102, last 2 years) | |
| Lenovo Legion 5 15AHP G10 | |
| MSI Cyborg 15 B2RWEKG | |
| Average Intel Core 7 240H (34965 - 69215, n=4) | |
| MSI Cyborg 15 A12VF | |
| Lenovo LOQ 15AHP10 | |
| HP Victus 15-fa2160ng | |
| Acer Nitro V 15 ANV15-52-50S2 | |
| AIDA64 / Memory Read | |
| Average of class Gaming (22956 - 118858, n=102, last 2 years) | |
| MSI Cyborg 15 B2RWEKG | |
| MSI Cyborg 15 A12VF | |
| Lenovo Legion 5 15AHP G10 | |
| Average Intel Core 7 240H (39706 - 71870, n=4) | |
| HP Victus 15-fa2160ng | |
| Lenovo LOQ 15AHP10 | |
| Acer Nitro V 15 ANV15-52-50S2 | |
| AIDA64 / Memory Write | |
| Lenovo Legion 5 15AHP G10 | |
| Average of class Gaming (22297 - 135096, n=102, last 2 years) | |
| Average Intel Core 7 240H (33560 - 80488, n=4) | |
| MSI Cyborg 15 B2RWEKG | |
| MSI Cyborg 15 A12VF | |
| Lenovo LOQ 15AHP10 | |
| HP Victus 15-fa2160ng | |
| Acer Nitro V 15 ANV15-52-50S2 | |
| AIDA64 / Memory Latency | |
| Average Intel Core 7 240H (97.1 - 125.6, n=4) | |
| Average of class Gaming (75.3 - 165.4, n=102, last 2 years) | |
| HP Victus 15-fa2160ng | |
| MSI Cyborg 15 B2RWEKG | |
| Acer Nitro V 15 ANV15-52-50S2 | |
| Lenovo LOQ 15AHP10 | |
| Lenovo Legion 5 15AHP G10 | |
| MSI Cyborg 15 A12VF | |
* ... smaller is better
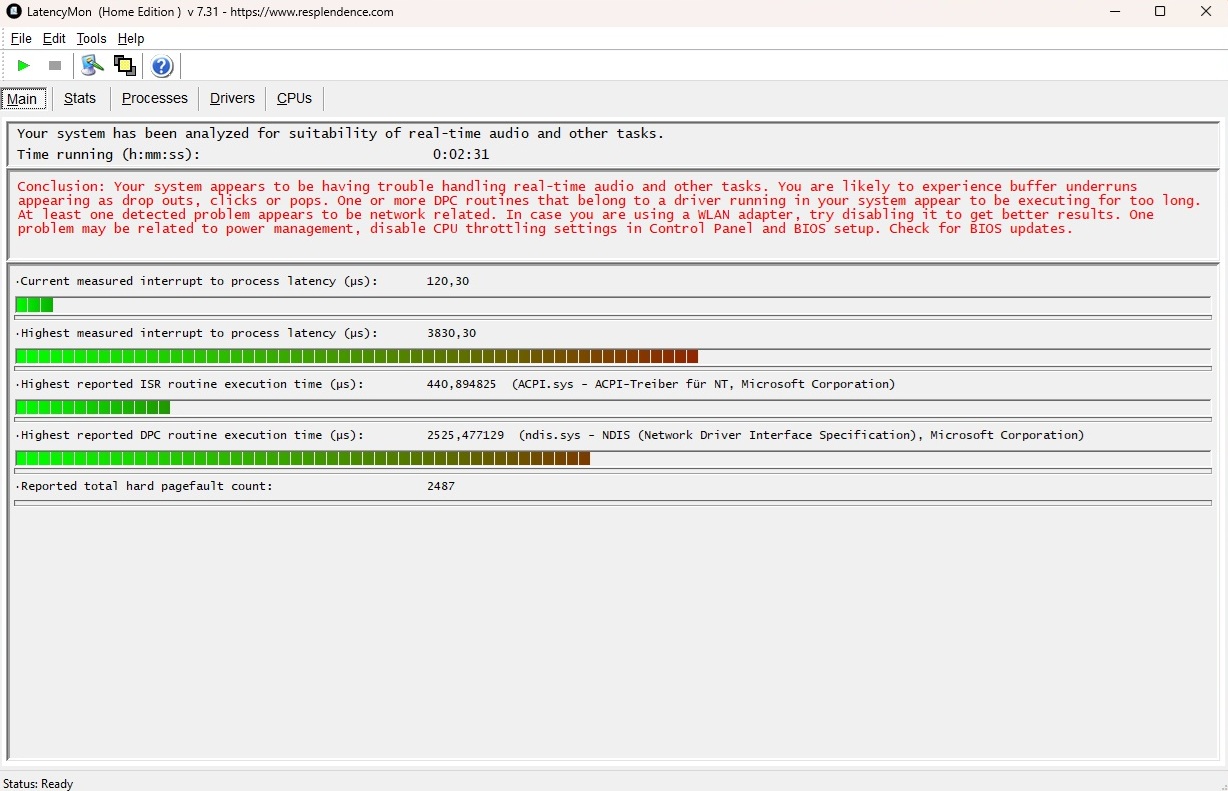
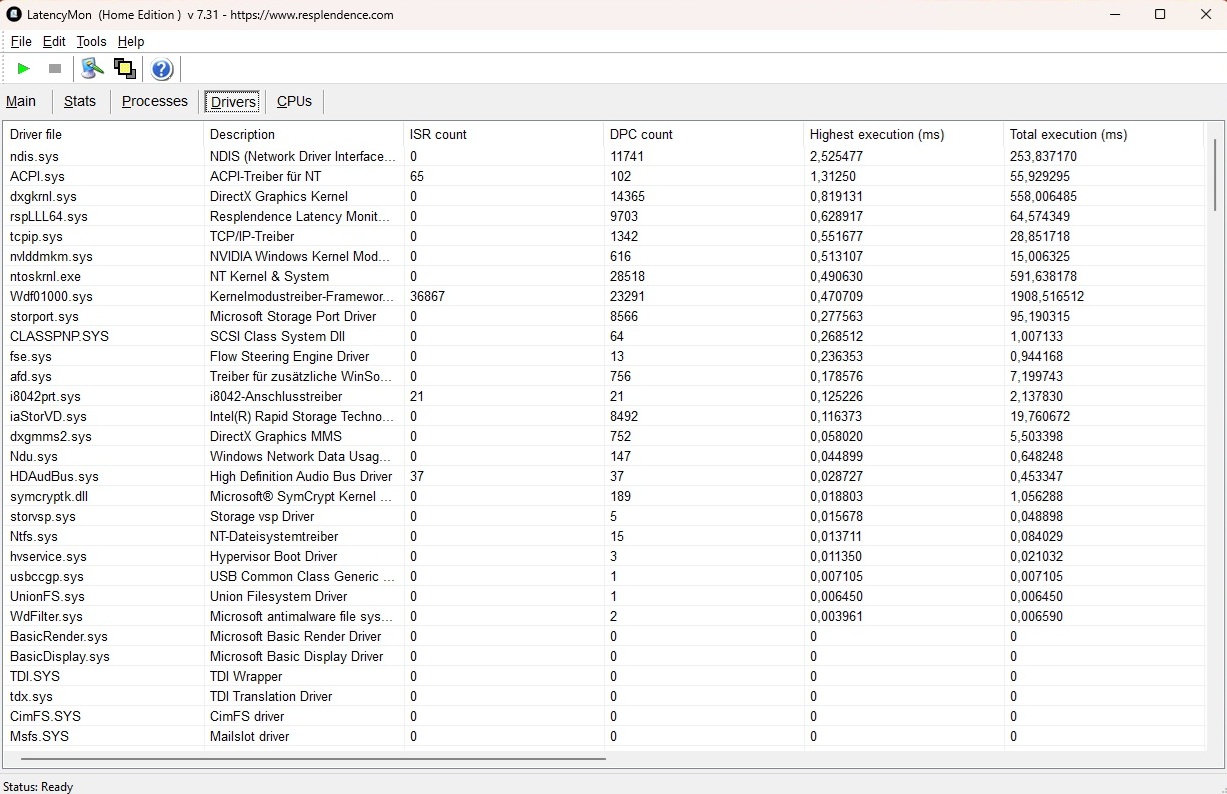
DPC latencies
As is so often the case, there is some catching up to do when it comes to latency. However, many notebooks fall short here, as can be seen in the table.
| DPC Latencies / LatencyMon - interrupt to process latency (max), Web, Youtube, Prime95 | |
| MSI Cyborg 15 B2RWEKG | |
| Acer Nitro V 15 ANV15-52-50S2 | |
| HP Victus 15-fa2160ng | |
| Lenovo Legion 5 15AHP G10 | |
| Lenovo LOQ 15AHP10 | |
| MSI Cyborg 15 A12VF | |
* ... smaller is better
Mass storage
512 GB of storage capacity is a bit meagre in 2026. Nevertheless, the integrated NVMe SSD from Western Digital is relatively fast and also delivered a fairly consistent performance in the endurance test, which cannot be said of every competitor.

* ... smaller is better
Read continuous performance: DiskSpd Read Loop, Queue Depth 8
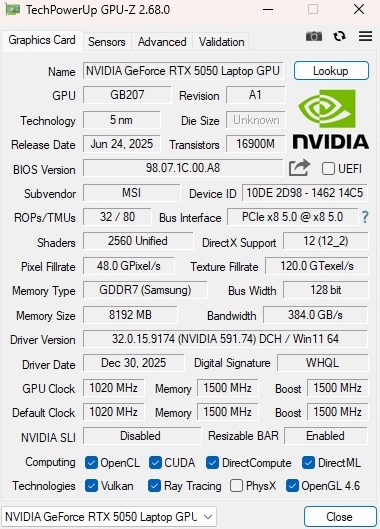
GPU performance
The GeForce RTX 5050 marks Nvidia's entry into the mobile gaming world. While the Blackwell chip is specified with up to 100 watts TGP in other devices, the Cyborg 15 only achieves a maximum of 45 watts - a pretty meagre value. It is therefore not surprising that the 15-incher is just under 20% behind its RTX 5050 counterparts in the GPU course and even slightly behind its predecessor with the RTX 4060.
| 3DMark 11 Performance | 20180 points | |
| 3DMark Cloud Gate Standard Score | 49085 points | |
| 3DMark Fire Strike Score | 18022 points | |
| 3DMark Time Spy Score | 7561 points | |
Help | ||
* ... smaller is better
Gaming performance
The situation is similar in the gaming benchmarks, although the Acer Nitro V 15 is also weaker here. If you limit yourself to the native resolution of 1,920 x 1,080 pixels, most current games at least run smoothly with medium to high details. If you want to squeeze more FPS out of the system, you can use features such as upscaling as usual. Including DLSS Balanced Black Ops 7 runs at 40 FPS instead of 24 FPS when using the Extreme preset, for example. Quadruple frame generation even catapults the performance to an impressive 103 FPS, although the subjective feeling of speed may vary slightly.
| GTA V - 1920x1080 Highest AA:4xMSAA + FX AF:16x | |
| Average of class Gaming (67.1 - 186.9, n=90, last 2 years) | |
| Lenovo Legion 5 15AHP G10 | |
| Average NVIDIA GeForce RTX 5050 Laptop (88.1 - 129.7, n=8) | |
| Lenovo LOQ 15AHP10 | |
| MSI Cyborg 15 B2RWEKG | |
| MSI Cyborg 15 A12VF | |
| HP Victus 15-fa2160ng | |
| low | med. | high | ultra | |
|---|---|---|---|---|
| GTA V (2015) | 175.1 | 162 | 93.6 | |
| Dota 2 Reborn (2015) | 99.5 | 82.8 | 84.8 | |
| X-Plane 11.11 (2018) | 80.4 | 66.9 | ||
| Baldur's Gate 3 (2023) | 76.3 | 66.1 | 59.4 | |
| Cyberpunk 2077 (2023) | 76 | 62.6 | 55.3 | |
| Stalker 2 (2024) | 46.4 | 40.2 | 28.8 | |
| Indiana Jones and the Great Circle (2024) | 59.5 | 50.1 | 30.6 | |
| Monster Hunter Wilds (2025) | 45.5 | 41.4 | 32.1 | |
| The Outer Worlds 2 (2025) | 64.8 | 51.1 | 26.4 | |
| ARC Raiders (2025) | 81.7 | 64.5 | 43.5 | |
| Anno 117: Pax Romana (2025) | 56 | 40.7 | 20.2 | |
| Call of Duty Black Ops 7 (2025) | 87 | 70 | 24 |
| Call of Duty Black Ops 7 | |
| 1920x1080 Extreme Preset + Raytracing | |
| Average of class Gaming (24 - 69, n=12, last 2 years) | |
| Tulpar T6 V3.5 | |
| Acer Nitro V14 AI ANV14-62-R9LT | |
| Average NVIDIA GeForce RTX 5050 Laptop (24 - 27, n=2) | |
| MSI Cyborg 15 B2RWEKG | |
| 1920x1080 Ultra Preset | |
| Average of class Gaming (70 - 170, n=12, last 2 years) | |
| Tulpar T6 V3.5 | |
| Acer Nitro V14 AI ANV14-62-R9LT | |
| Average NVIDIA GeForce RTX 5050 Laptop (70 - 75, n=2) | |
| MSI Cyborg 15 B2RWEKG | |
| The Outer Worlds 2 | |
| 1920x1080 Very High Preset AA:T | |
| Average of class Gaming (26.4 - 58.4, n=11, last 2 years) | |
| Tulpar T6 V3.5 | |
| Average NVIDIA GeForce RTX 5050 Laptop (26.4 - 33.2, n=3) | |
| Acer Nitro V14 AI ANV14-62-R9LT | |
| MSI Cyborg 15 B2RWEKG | |
| 1920x1080 High Preset AA:T | |
| Average of class Gaming (51.1 - 94.5, n=11, last 2 years) | |
| Tulpar T6 V3.5 | |
| Average NVIDIA GeForce RTX 5050 Laptop (51.1 - 60, n=3) | |
| Acer Nitro V14 AI ANV14-62-R9LT | |
| MSI Cyborg 15 B2RWEKG | |
| ARC Raiders | |
| 1920x1080 Epic Preset + Epic Raytracing AA:TSR | |
| Average of class Gaming (43.5 - 98.6, n=11, last 2 years) | |
| Tulpar T6 V3.5 | |
| Average NVIDIA GeForce RTX 5050 Laptop (43.5 - 58.2, n=4) | |
| Acer Nitro V14 AI ANV14-62-R9LT | |
| MSI Cyborg 15 B2RWEKG | |
| 1920x1080 High Preset AA:TSR | |
| Average of class Gaming (64.5 - 144.4, n=11, last 2 years) | |
| Tulpar T6 V3.5 | |
| Average NVIDIA GeForce RTX 5050 Laptop (64.5 - 85.9, n=4) | |
| Acer Nitro V14 AI ANV14-62-R9LT | |
| MSI Cyborg 15 B2RWEKG | |
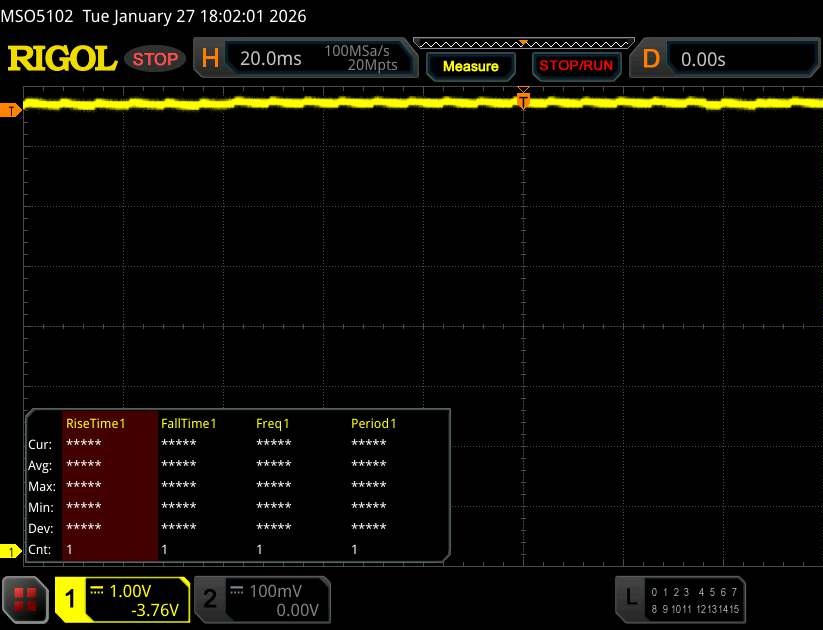
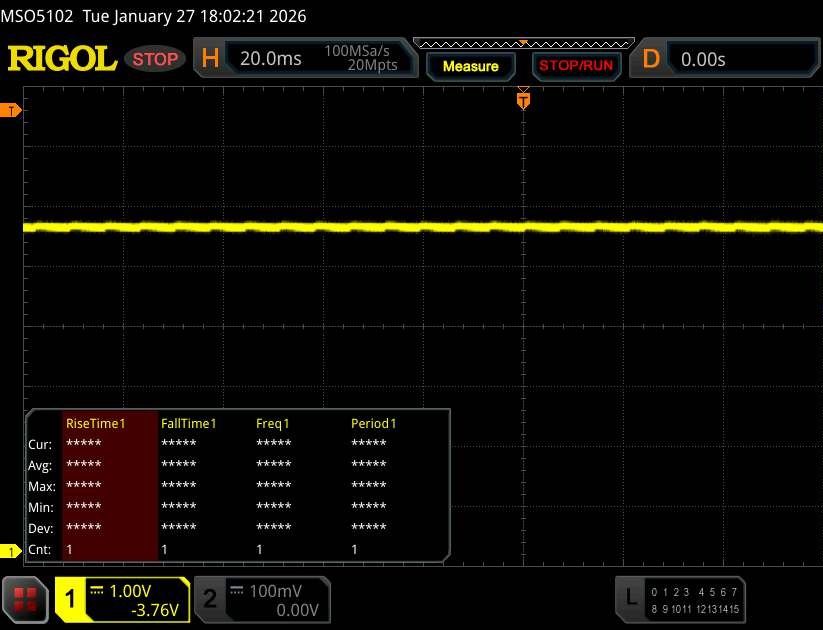
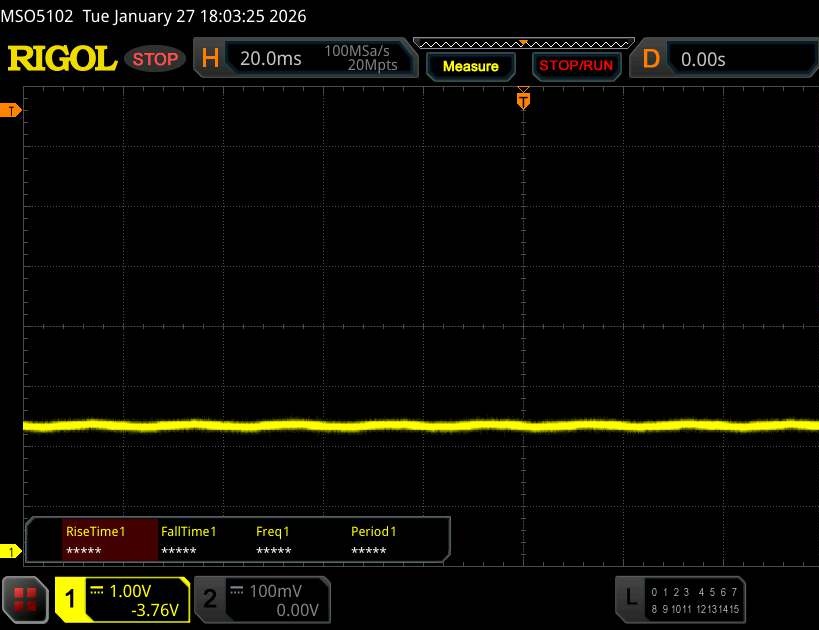
Cyberpunk 2077 ultra FPS chart
Emissions
Noise emissions
Since the CPU and GPU do not reach maximum values, the 15-incher remains quieter than most competitors under load. 45 dB(A) in Cyberpunk 2077 is clearly audible, but not disturbingly loud. In idle mode, the Cyborg 15 is relatively quiet for long stretches, and the fan is even completely off at times.
Noise level
| Idle |
| 25 / 28 / 33 dB(A) |
| Load |
| 44 / 50 dB(A) |
 | ||
30 dB silent 40 dB(A) audible 50 dB(A) loud |
||
min: | ||
| MSI Cyborg 15 B2RWEKG Core 7 240H, GeForce RTX 5050 Laptop | MSI Cyborg 15 A12VF i7-12650H, GeForce RTX 4060 Laptop GPU | Acer Nitro V 15 ANV15-52-50S2 i5-13420H, GeForce RTX 5050 Laptop | HP Victus 15-fa2160ng i5-13420H, GeForce RTX 5050 Laptop | Lenovo LOQ 15AHP10 R7 250, GeForce RTX 5060 Laptop | Lenovo Legion 5 15AHP G10 R7 260, GeForce RTX 5060 Laptop | |
|---|---|---|---|---|---|---|
| Noise | -19% | -7% | 1% | -32% | 4% | |
| off / environment * (dB) | 24 | 27 -13% | 24 -0% | 24 -0% | 25 -4% | 25.5 -6% |
| Idle Minimum * (dB) | 25 | 27 -8% | 28 -12% | 28 -12% | 43 -72% | 25.5 -2% |
| Idle Average * (dB) | 28 | 37.5 -34% | 29 -4% | 29 -4% | 45 -61% | 25.5 9% |
| Idle Maximum * (dB) | 33 | 38 -15% | 33 -0% | 30 9% | 48 -45% | 26.9 18% |
| Load Average * (dB) | 44 | 56.3 -28% | 48 -9% | 40 9% | 53 -20% | 34.6 21% |
| Cyberpunk 2077 ultra * (dB) | 45 | 52 -16% | 46 -2% | 51 -13% | 50.1 -11% | |
| Load Maximum * (dB) | 50 | 56.3 -13% | 54 -8% | 48 4% | 53 -6% | 50.1 -0% |
* ... smaller is better
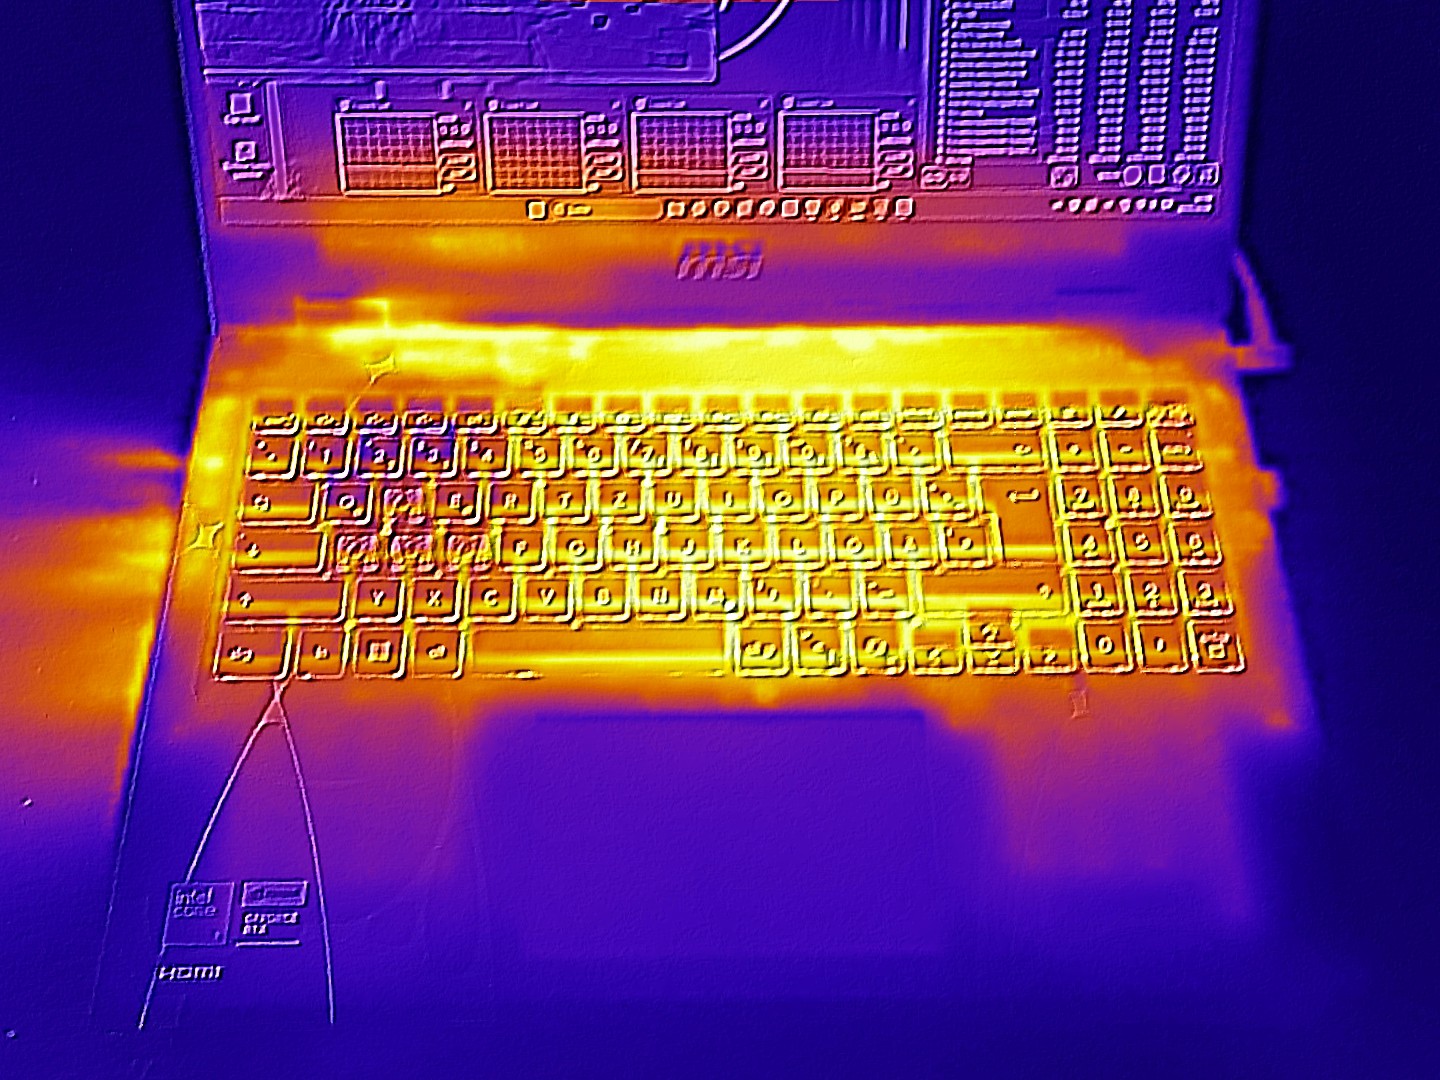
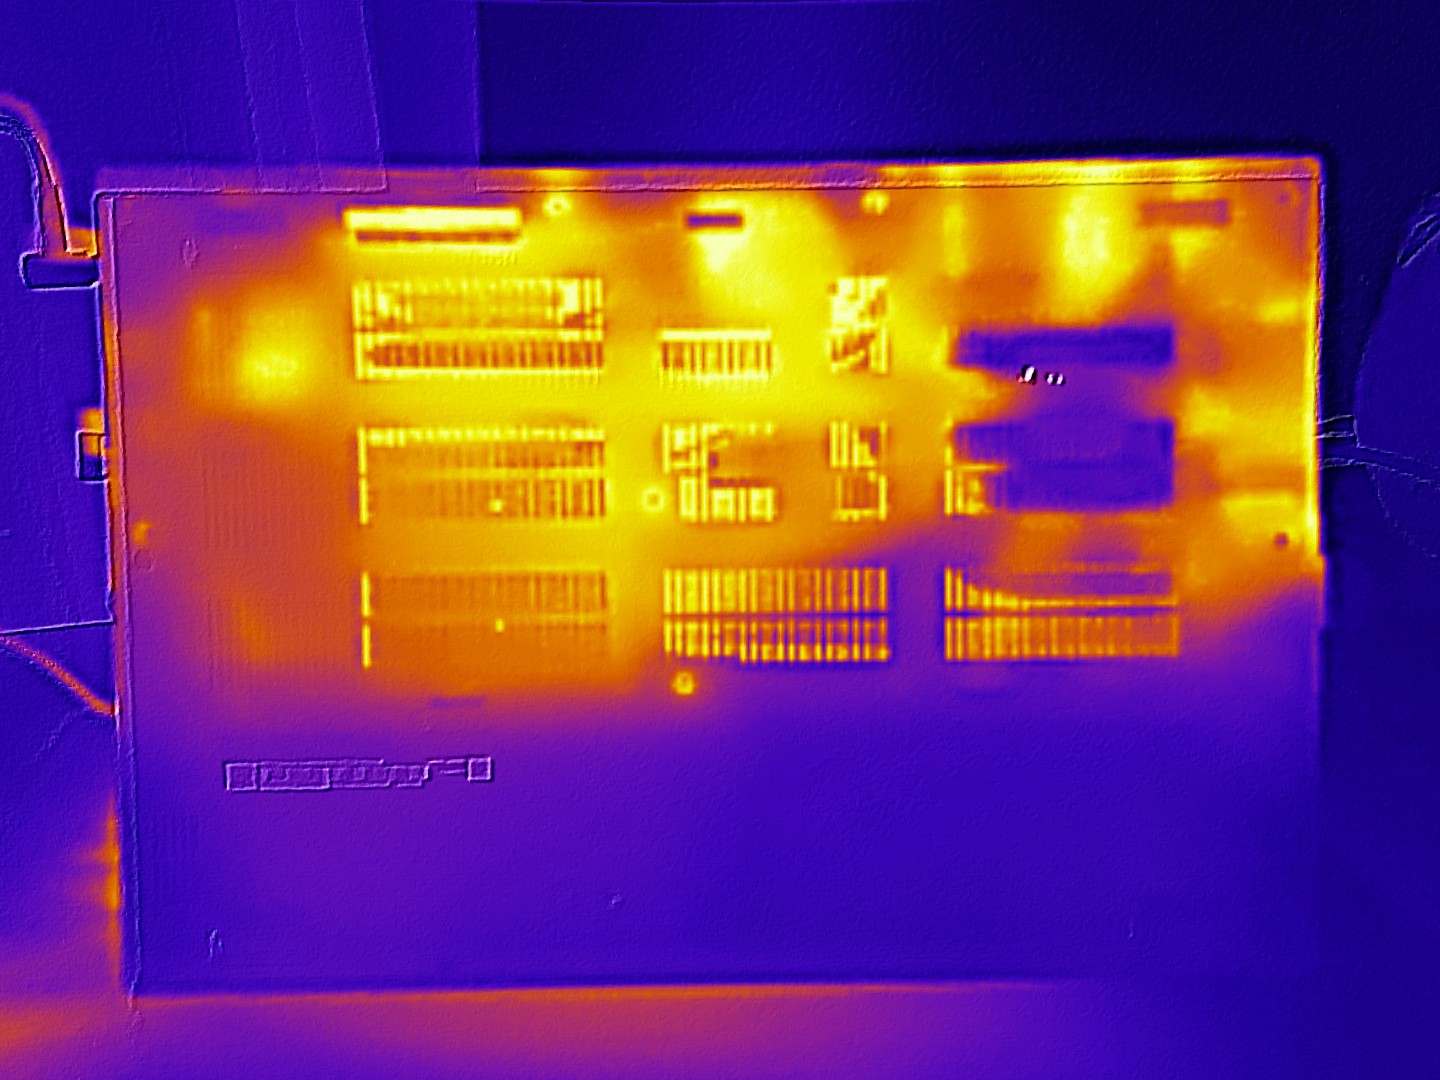
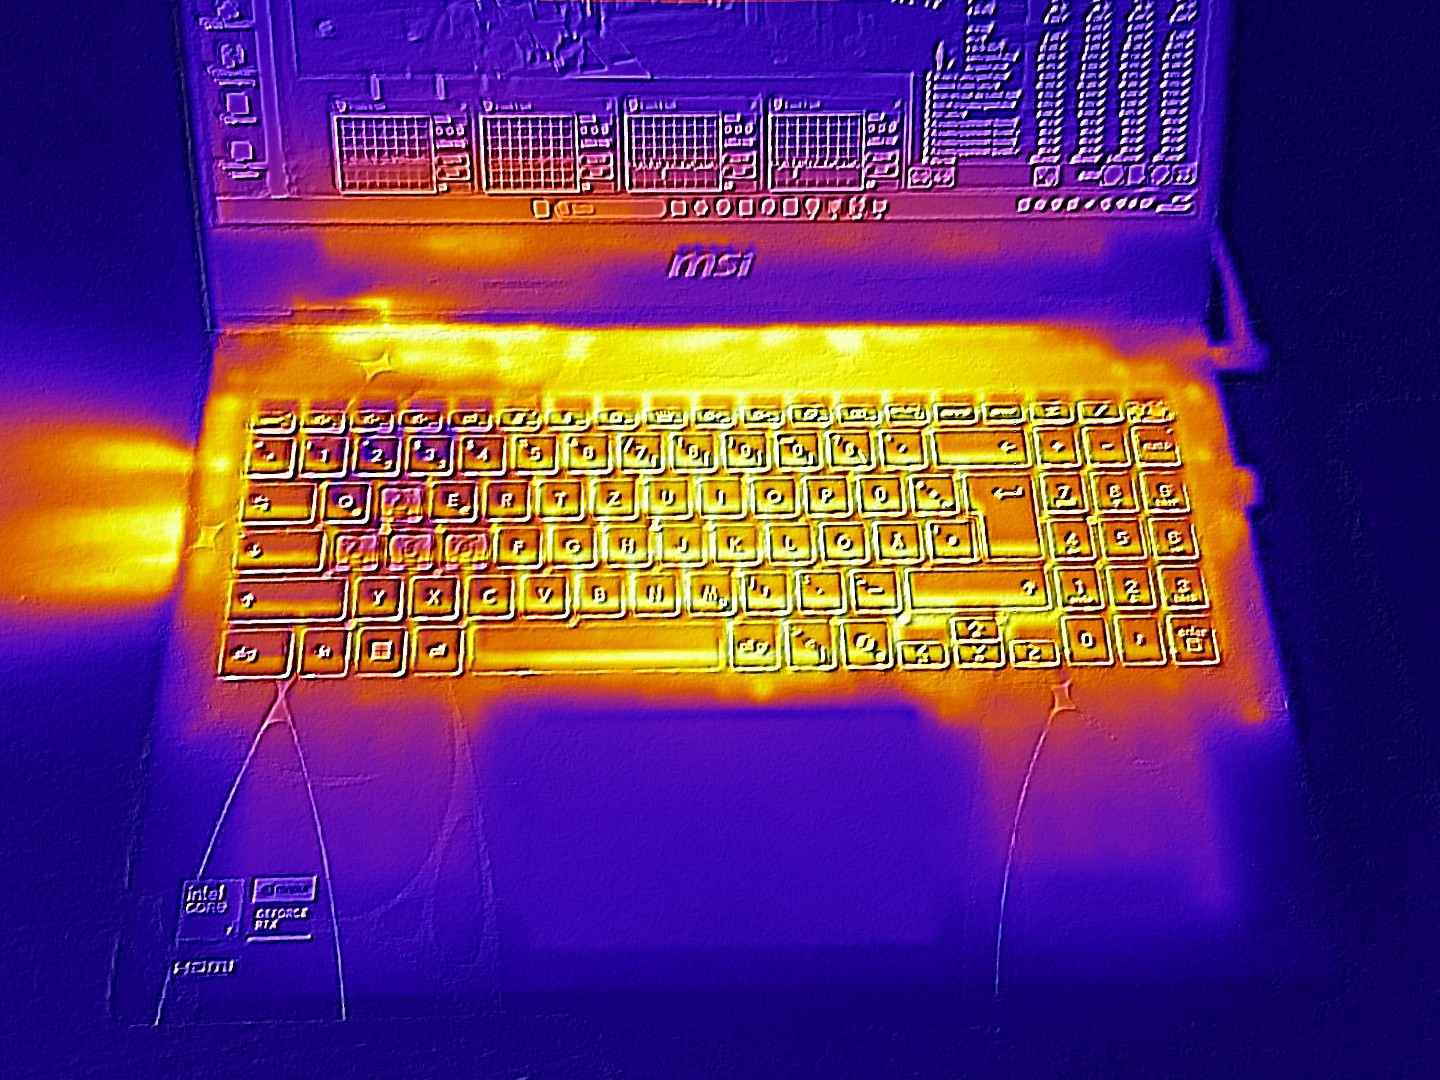
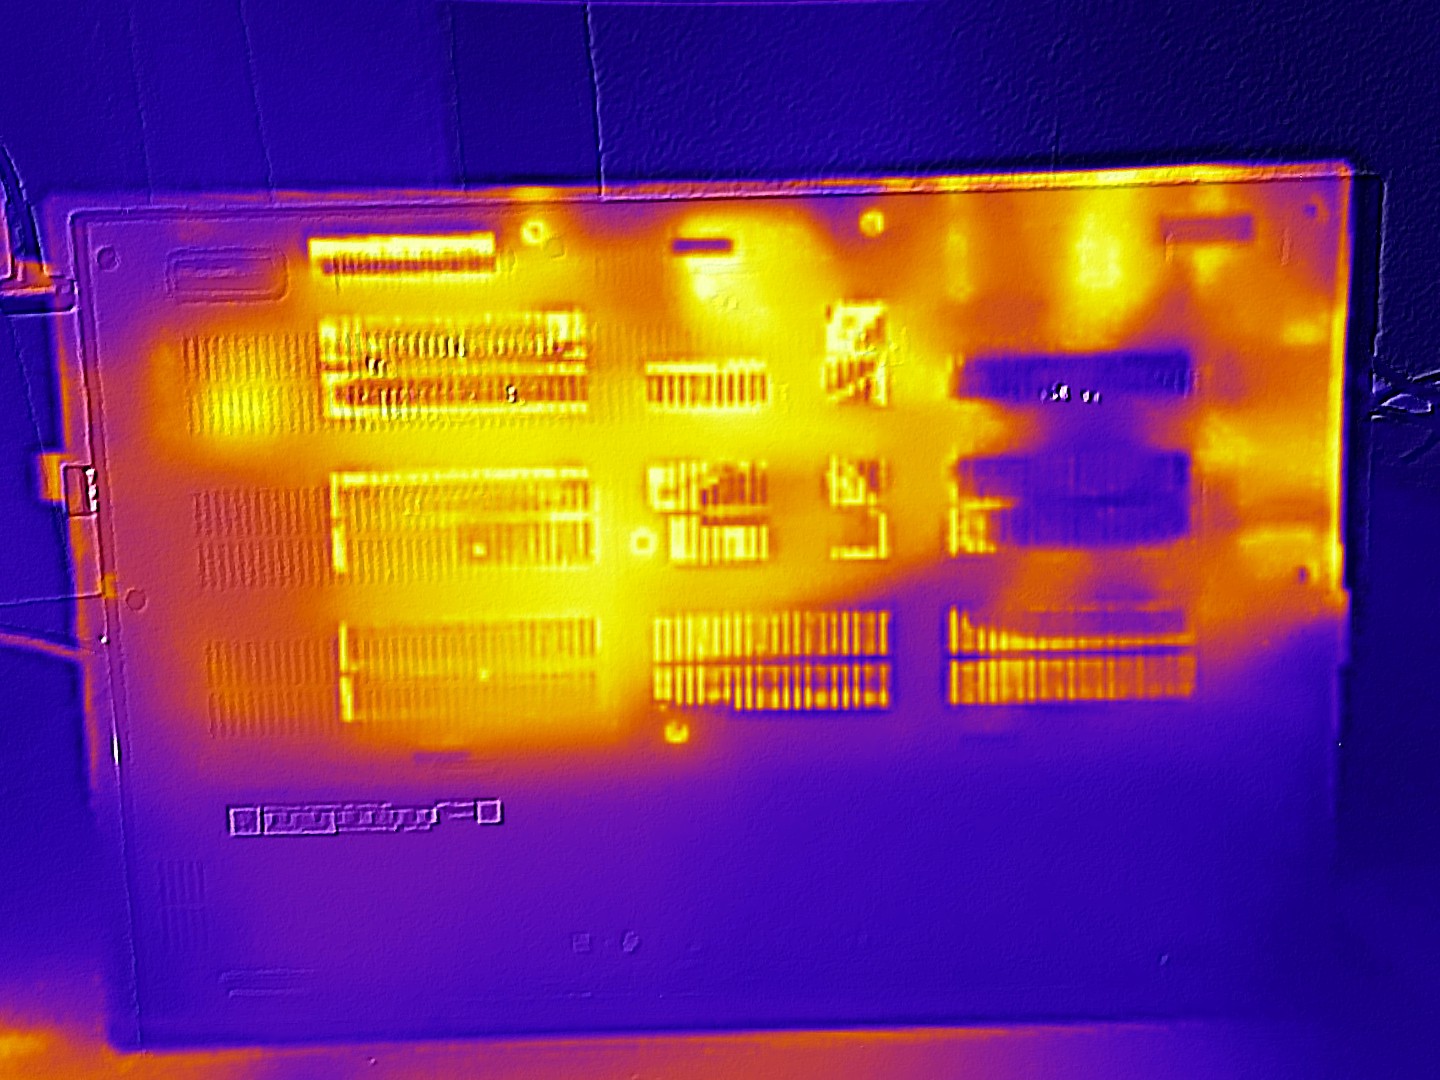
Temperature
The temperatures are also okay. The top and bottom heat up to a maximum of 46 and 45 °C (~114.8 and 113 °F) respectively under high load. Certain weaknesses are evident in idle mode, where the Cyborg 15 tends to be warmer than its competitors.
(-) The maximum temperature on the upper side is 46 °C / 115 F, compared to the average of 40.4 °C / 105 F, ranging from 21.2 to 68.8 °C for the class Gaming.
(±) The bottom heats up to a maximum of 45 °C / 113 F, compared to the average of 43.2 °C / 110 F
(±) In idle usage, the average temperature for the upper side is 32.6 °C / 91 F, compared to the device average of 33.9 °C / 93 F.
(-) 3: The average temperature for the upper side is 39 °C / 102 F, compared to the average of 33.9 °C / 93 F for the class Gaming.
(+) The palmrests and touchpad are reaching skin temperature as a maximum (32 °C / 89.6 F) and are therefore not hot.
(-) The average temperature of the palmrest area of similar devices was 28.8 °C / 83.8 F (-3.2 °C / -5.8 F).
| MSI Cyborg 15 B2RWEKG Core 7 240H, GeForce RTX 5050 Laptop | MSI Cyborg 15 A12VF i7-12650H, GeForce RTX 4060 Laptop GPU | Acer Nitro V 15 ANV15-52-50S2 i5-13420H, GeForce RTX 5050 Laptop | HP Victus 15-fa2160ng i5-13420H, GeForce RTX 5050 Laptop | Lenovo LOQ 15AHP10 R7 250, GeForce RTX 5060 Laptop | Lenovo Legion 5 15AHP G10 R7 260, GeForce RTX 5060 Laptop | |
|---|---|---|---|---|---|---|
| Heat | 16% | 9% | 9% | -0% | 9% | |
| Maximum Upper Side * (°C) | 46 | 47.5 -3% | 46 -0% | 43 7% | 49 -7% | 42.2 8% |
| Maximum Bottom * (°C) | 45 | 35.5 21% | 49 -9% | 43 4% | 58 -29% | 51.7 -15% |
| Idle Upper Side * (°C) | 36 | 27.7 23% | 28 22% | 37 -3% | 32 11% | 28.5 21% |
| Idle Bottom * (°C) | 38 | 29.5 22% | 30 21% | 28 26% | 29 24% | 29.2 23% |
* ... smaller is better
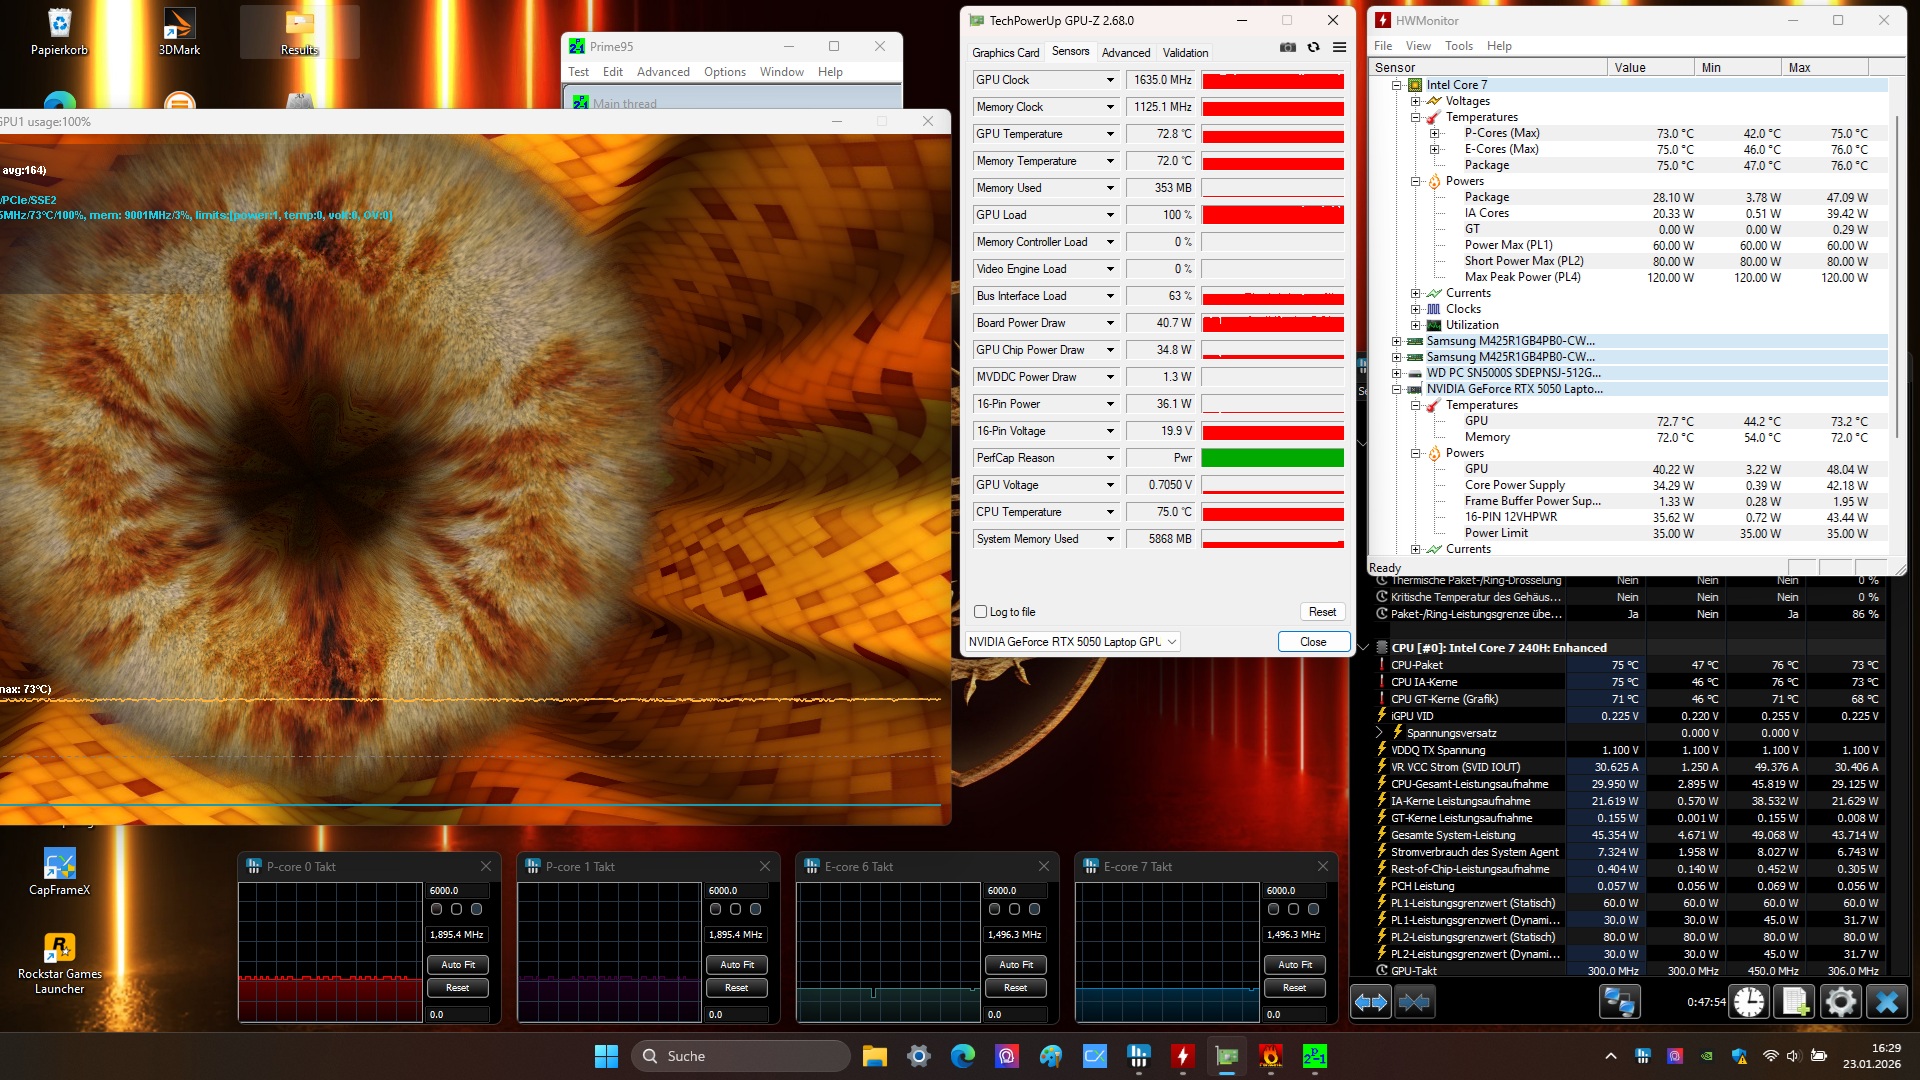
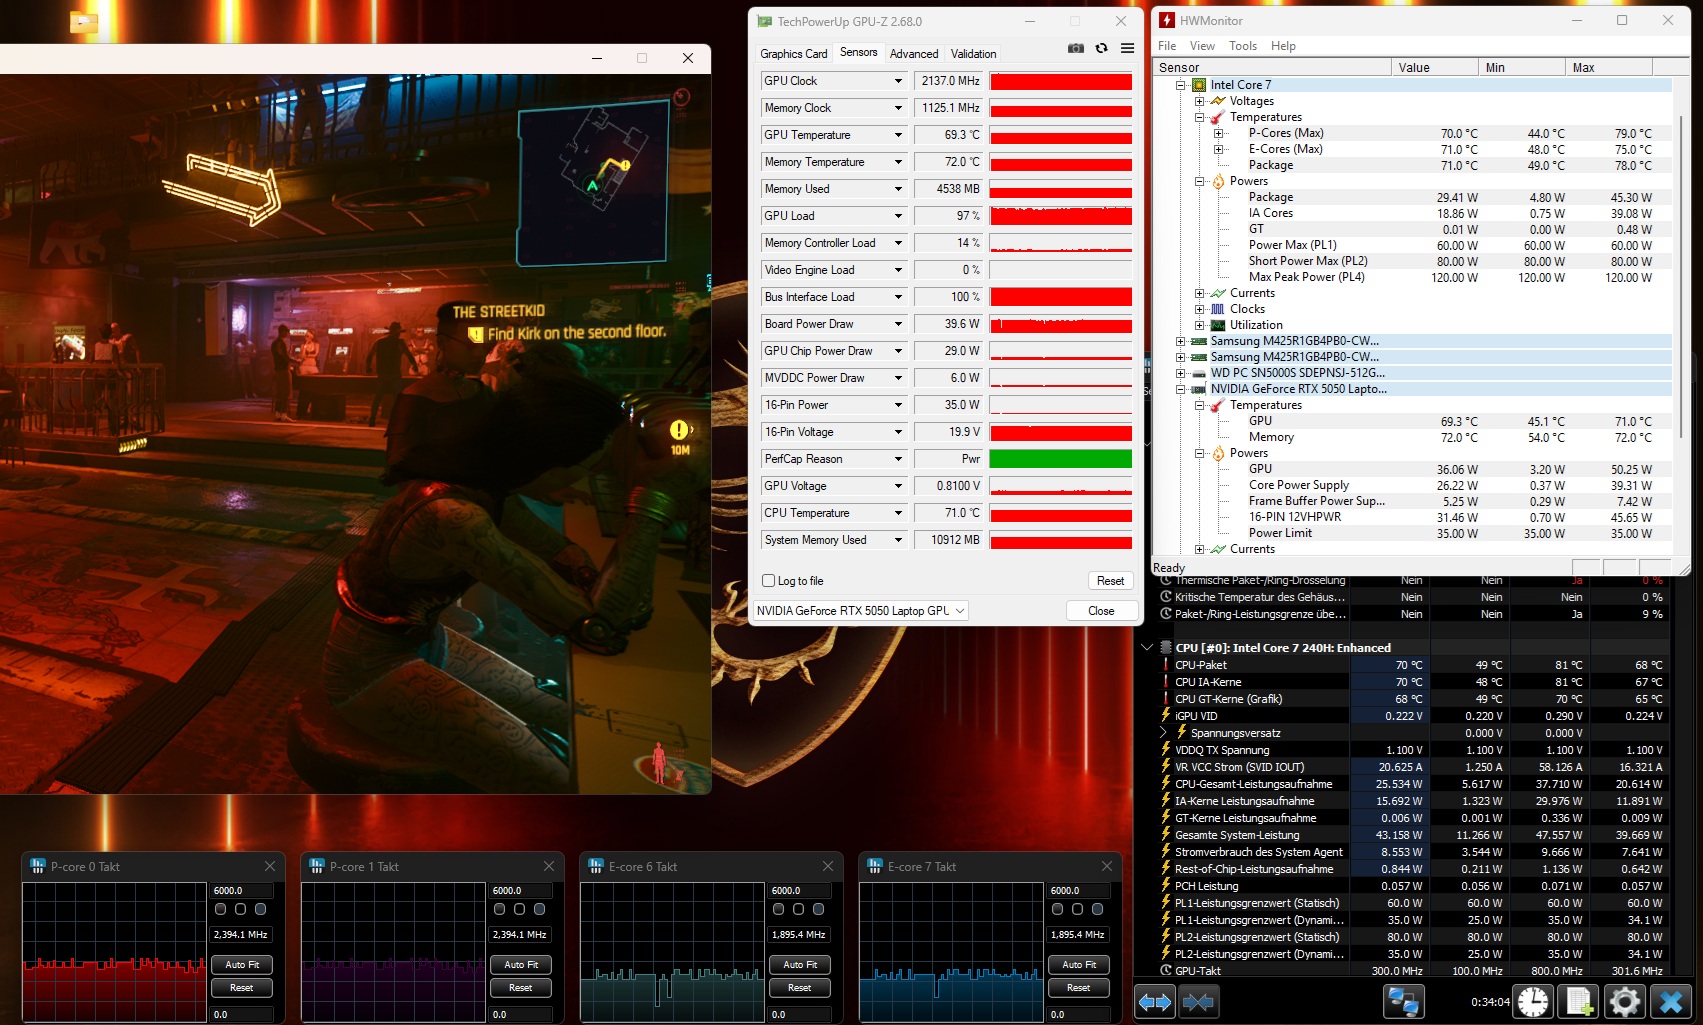
Stress test
In the stress test with the FurMark and Prime95 tools, the Core 7 240H and GeForce RTX 5050 stabilized at a moderate 73 °C (163.4 °F).
Speaker
The speakers are slightly better than the gaming average, although the Cyborg 15 also suffers from a rather weak bass.
MSI Cyborg 15 B2RWEKG audio analysis
(+) | speakers can play relatively loud (87 dB)
Bass 100 - 315 Hz
(-) | nearly no bass - on average 23.6% lower than median
(±) | linearity of bass is average (12.5% delta to prev. frequency)
Mids 400 - 2000 Hz
(+) | balanced mids - only 2.9% away from median
(+) | mids are linear (5.3% delta to prev. frequency)
Highs 2 - 16 kHz
(+) | balanced highs - only 3.8% away from median
(+) | highs are linear (5.1% delta to prev. frequency)
Overall 100 - 16.000 Hz
(+) | overall sound is linear (14.1% difference to median)
Compared to same class
» 24% of all tested devices in this class were better, 8% similar, 68% worse
» The best had a delta of 6%, average was 18%, worst was 132%
Compared to all devices tested
» 17% of all tested devices were better, 4% similar, 79% worse
» The best had a delta of 4%, average was 23%, worst was 134%
Acer Nitro V 15 ANV15-52-50S2 audio analysis
(+) | speakers can play relatively loud (83 dB)
Bass 100 - 315 Hz
(-) | nearly no bass - on average 27.5% lower than median
(-) | bass is not linear (15% delta to prev. frequency)
Mids 400 - 2000 Hz
(+) | balanced mids - only 4.7% away from median
(+) | mids are linear (4.4% delta to prev. frequency)
Highs 2 - 16 kHz
(+) | balanced highs - only 2% away from median
(+) | highs are linear (4.5% delta to prev. frequency)
Overall 100 - 16.000 Hz
(±) | linearity of overall sound is average (17.9% difference to median)
Compared to same class
» 55% of all tested devices in this class were better, 9% similar, 36% worse
» The best had a delta of 6%, average was 18%, worst was 132%
Compared to all devices tested
» 37% of all tested devices were better, 8% similar, 55% worse
» The best had a delta of 4%, average was 23%, worst was 134%
Energy management
Energy consumption
While the idle consumption is not out of line, the 15-inch laptop is relatively frugal under load compared to other RTX 5050 laptops.
| Off / Standby | |
| Idle | |
| Load |
|
Key:
min: | |
| MSI Cyborg 15 B2RWEKG Core 7 240H, GeForce RTX 5050 Laptop | MSI Cyborg 15 A12VF i7-12650H, GeForce RTX 4060 Laptop GPU | Acer Nitro V 15 ANV15-52-50S2 i5-13420H, GeForce RTX 5050 Laptop | HP Victus 15-fa2160ng i5-13420H, GeForce RTX 5050 Laptop | Lenovo LOQ 15AHP10 R7 250, GeForce RTX 5060 Laptop | Lenovo Legion 5 15AHP G10 R7 260, GeForce RTX 5060 Laptop | Average of class Gaming | |
|---|---|---|---|---|---|---|---|
| Power Consumption | 29% | -6% | -3% | -35% | -18% | -39% | |
| Idle Minimum * (Watt) | 14.9 | 6 60% | 16.8 -13% | 7.9 47% | 20 -34% | 6.9 54% | 13.1 ? 12% |
| Idle Average * (Watt) | 16.3 | 8.8 46% | 17.6 -8% | 9.2 44% | 20.7 -27% | 10.7 34% | 19 ? -17% |
| Idle Maximum * (Watt) | 22.2 | 11.9 46% | 19.8 11% | 13.5 39% | 22.7 -2% | 11.3 49% | 24.6 ? -11% |
| Load Average * (Watt) | 72 | 89 -24% | 66 8% | 78 -8% | 71 1% | 69.7 3% | 111.3 ? -55% |
| Cyberpunk 2077 ultra * (Watt) | 90.3 | 106.5 -18% | 128.4 -42% | 153.1 -70% | 162.6 -80% | ||
| Cyberpunk 2077 ultra external monitor * (Watt) | 89.6 | 105 -17% | 126.7 -41% | 151.1 -69% | 165 -84% | ||
| Load Maximum * (Watt) | 117 | 99 15% | 119 -2% | 187 -60% | 172 -47% | 233.6 -100% | 260 ? -122% |
| Witcher 3 ultra * (Watt) | 90.3 |
* ... smaller is better
Energy consumption Cyberpunk / Stress test
Energy consumption with external monitor
Battery life
Unfortunately, the battery life has to rank behind the predecessor. Just under 5.5 hours in our Wi-Fi test with the brightness reduced to 150 cd/m² is still acceptable when comparing the HP Victus 15 and the Lenovo LOQ 15.
| MSI Cyborg 15 B2RWEKG Core 7 240H, GeForce RTX 5050 Laptop, 55.2 Wh | MSI Cyborg 15 A12VF i7-12650H, GeForce RTX 4060 Laptop GPU, 53.5 Wh | Acer Nitro V 15 ANV15-52-50S2 i5-13420H, GeForce RTX 5050 Laptop, 76 Wh | HP Victus 15-fa2160ng i5-13420H, GeForce RTX 5050 Laptop, 70 Wh | Lenovo LOQ 15AHP10 R7 250, GeForce RTX 5060 Laptop, 60 Wh | Lenovo Legion 5 15AHP G10 R7 260, GeForce RTX 5060 Laptop, 80 Wh | Average of class Gaming | |
|---|---|---|---|---|---|---|---|
| Battery runtime | 39% | 2% | -20% | -17% | 80% | 31% | |
| WiFi v1.3 (h) | 5.4 | 7.5 39% | 5.5 2% | 4.3 -20% | 4.5 -17% | 9.7 80% | 7.08 ? 31% |
| Reader / Idle (h) | 13.6 | 6.9 | 7.84 ? | ||||
| H.264 (h) | 8 | 11.5 | 8.27 ? | ||||
| Load (h) | 2.3 | 1.3 | 1.2 | 1.496 ? | |||
| Cyberpunk 2077 ultra 150cd (h) | 0.9 |
Notebookcheck overall rating
The MSI Cyborg 15 is a visually striking 15-inch gamer that delivers a solid performance at a budget price, but is somewhat weak in the areas of display (color space) and GPU power (meager TGP).
MSI Cyborg 15 B2RWEKG
- 01/28/2026 v8
Florian Glaser
 Total Sustainability Score:
 Possible alternatives in comparison
Image | Model / Review | Price | Weight | Height | Display |
|---|---|---|---|---|---|
1. 75.2%  | MSI Cyborg 15 B2RWEKG Intel Core 7 240H ⎘ NVIDIA GeForce RTX 5050 Laptop ⎘ 16 GB Memory, 512 GB SSD | Amazon: List Price: 1099 EUR | 2.2 kg | 23.2 mm | 15.60" 1920x1080 141 PPI IPS |
2. 82.4% v7 (old)  | MSI Cyborg 15 A12VF Intel Core i7-12650H ⎘ NVIDIA GeForce RTX 4060 Laptop GPU ⎘ 16 GB Memory, 1024 GB SSD | Amazon: 1. $899.99 msi CYBORG1512043 Cyborg 15 ... 2. $999.00 msi Cyborg 15 Gaming Laptop:... 3. $1,269.00 MSI Cyborg 15 Gaming AI Lapt... List Price: 1799 Euro | 2 kg | 22.9 mm | 15.60" 1920x1080 141 PPI IPS |
3. 73.7%  | Acer Nitro V 15 ANV15-52-50S2 Intel Core i5-13420H ⎘ NVIDIA GeForce RTX 5050 Laptop ⎘ 16 GB Memory, 1024 GB SSD | Amazon: List Price: 1049 EUR | 2.1 kg | 23.5 mm | 15.60" 1920x1080 141 PPI IPS |
4. 75.8%  | HP Victus 15-fa2160ng Intel Core i5-13420H ⎘ NVIDIA GeForce RTX 5050 Laptop ⎘ 24 GB Memory, 512 GB SSD | Amazon: List Price: 1000 EUR | 2.4 kg | 23.5 mm | 15.60" 1920x1080 141 PPI IPS |
5. 77.5%  | Lenovo LOQ 15AHP10 AMD Ryzen 7 250 ⎘ NVIDIA GeForce RTX 5060 Laptop ⎘ 16 GB Memory, 1024 GB SSD | Amazon: | 2.4 kg | 24 mm | 15.60" 1920x1080 141 PPI IPS |
6. 87.2%  | Lenovo Legion 5 15AHP G10 AMD Ryzen 7 260 ⎘ NVIDIA GeForce RTX 5060 Laptop ⎘ 32 GB Memory, 1024 GB SSD | Amazon: List Price: 1449€ | 1.9 kg | 21.5 mm | 15.10" 2560x1600 200 PPI OLED |
Transparency
The selection of devices to be reviewed is made by our editorial team. The test sample was provided to the author as a loan by the manufacturer or retailer for the purpose of this review. The lender had no influence on this review, nor did the manufacturer receive a copy of this review before publication. There was no obligation to publish this review. As an independent media company, Notebookcheck is not subjected to the authority of manufacturers, retailers or publishers.
This is how Notebookcheck is testing
Every year, Notebookcheck independently reviews hundreds of laptops and smartphones using standardized procedures to ensure that all results are comparable. We have continuously developed our test methods for around 20 years and set industry standards in the process. In our test labs, high-quality measuring equipment is utilized by experienced technicians and editors. These tests involve a multi-stage validation process. Our complex rating system is based on hundreds of well-founded measurements and benchmarks, which maintains objectivity. Further information on our test methods can be found here.

