Verdict — The bare minimum for the office
As an entry-level office laptop, the MSI Venture 16 covers much of the basics expected for the category including easy serviceability, an integrated numpad, and a gray, inoffensive design. Its relatively thick build allows the Core-H CPU to run cooler than usual while many other budget business laptops may sport slower Core-U or Core-V options instead. Alternatives like the Dell 16 Plus or Lenovo ThinkPad E16 G3 are each lighter and with more display options than our MSI, but they also ship with slower CPUs.
On the other hand, several aspects of the Venture 16 can feel disappointing even from an office perspective. The relatively heavy weight, terrible 720p webcam, reliance on older barrel AC adapters, and lack of multiple USB-C ports may turn off travelers looking to up their mobile productivity. Additionally, the colors on the base IPS display are unfit for most graphics editing and so we recommend considering the far superior OLED panel for around $200 more.
Pros
Cons
Price and Availability
The MSI 16 AI with Core Ultra 7 255H, 1200p IPS touchscreen, 32 GB RAM, and 512 GB SSD can be found on Amazon for $1030. A similar configuration but with OLED can be found on Best Buy for $1200.
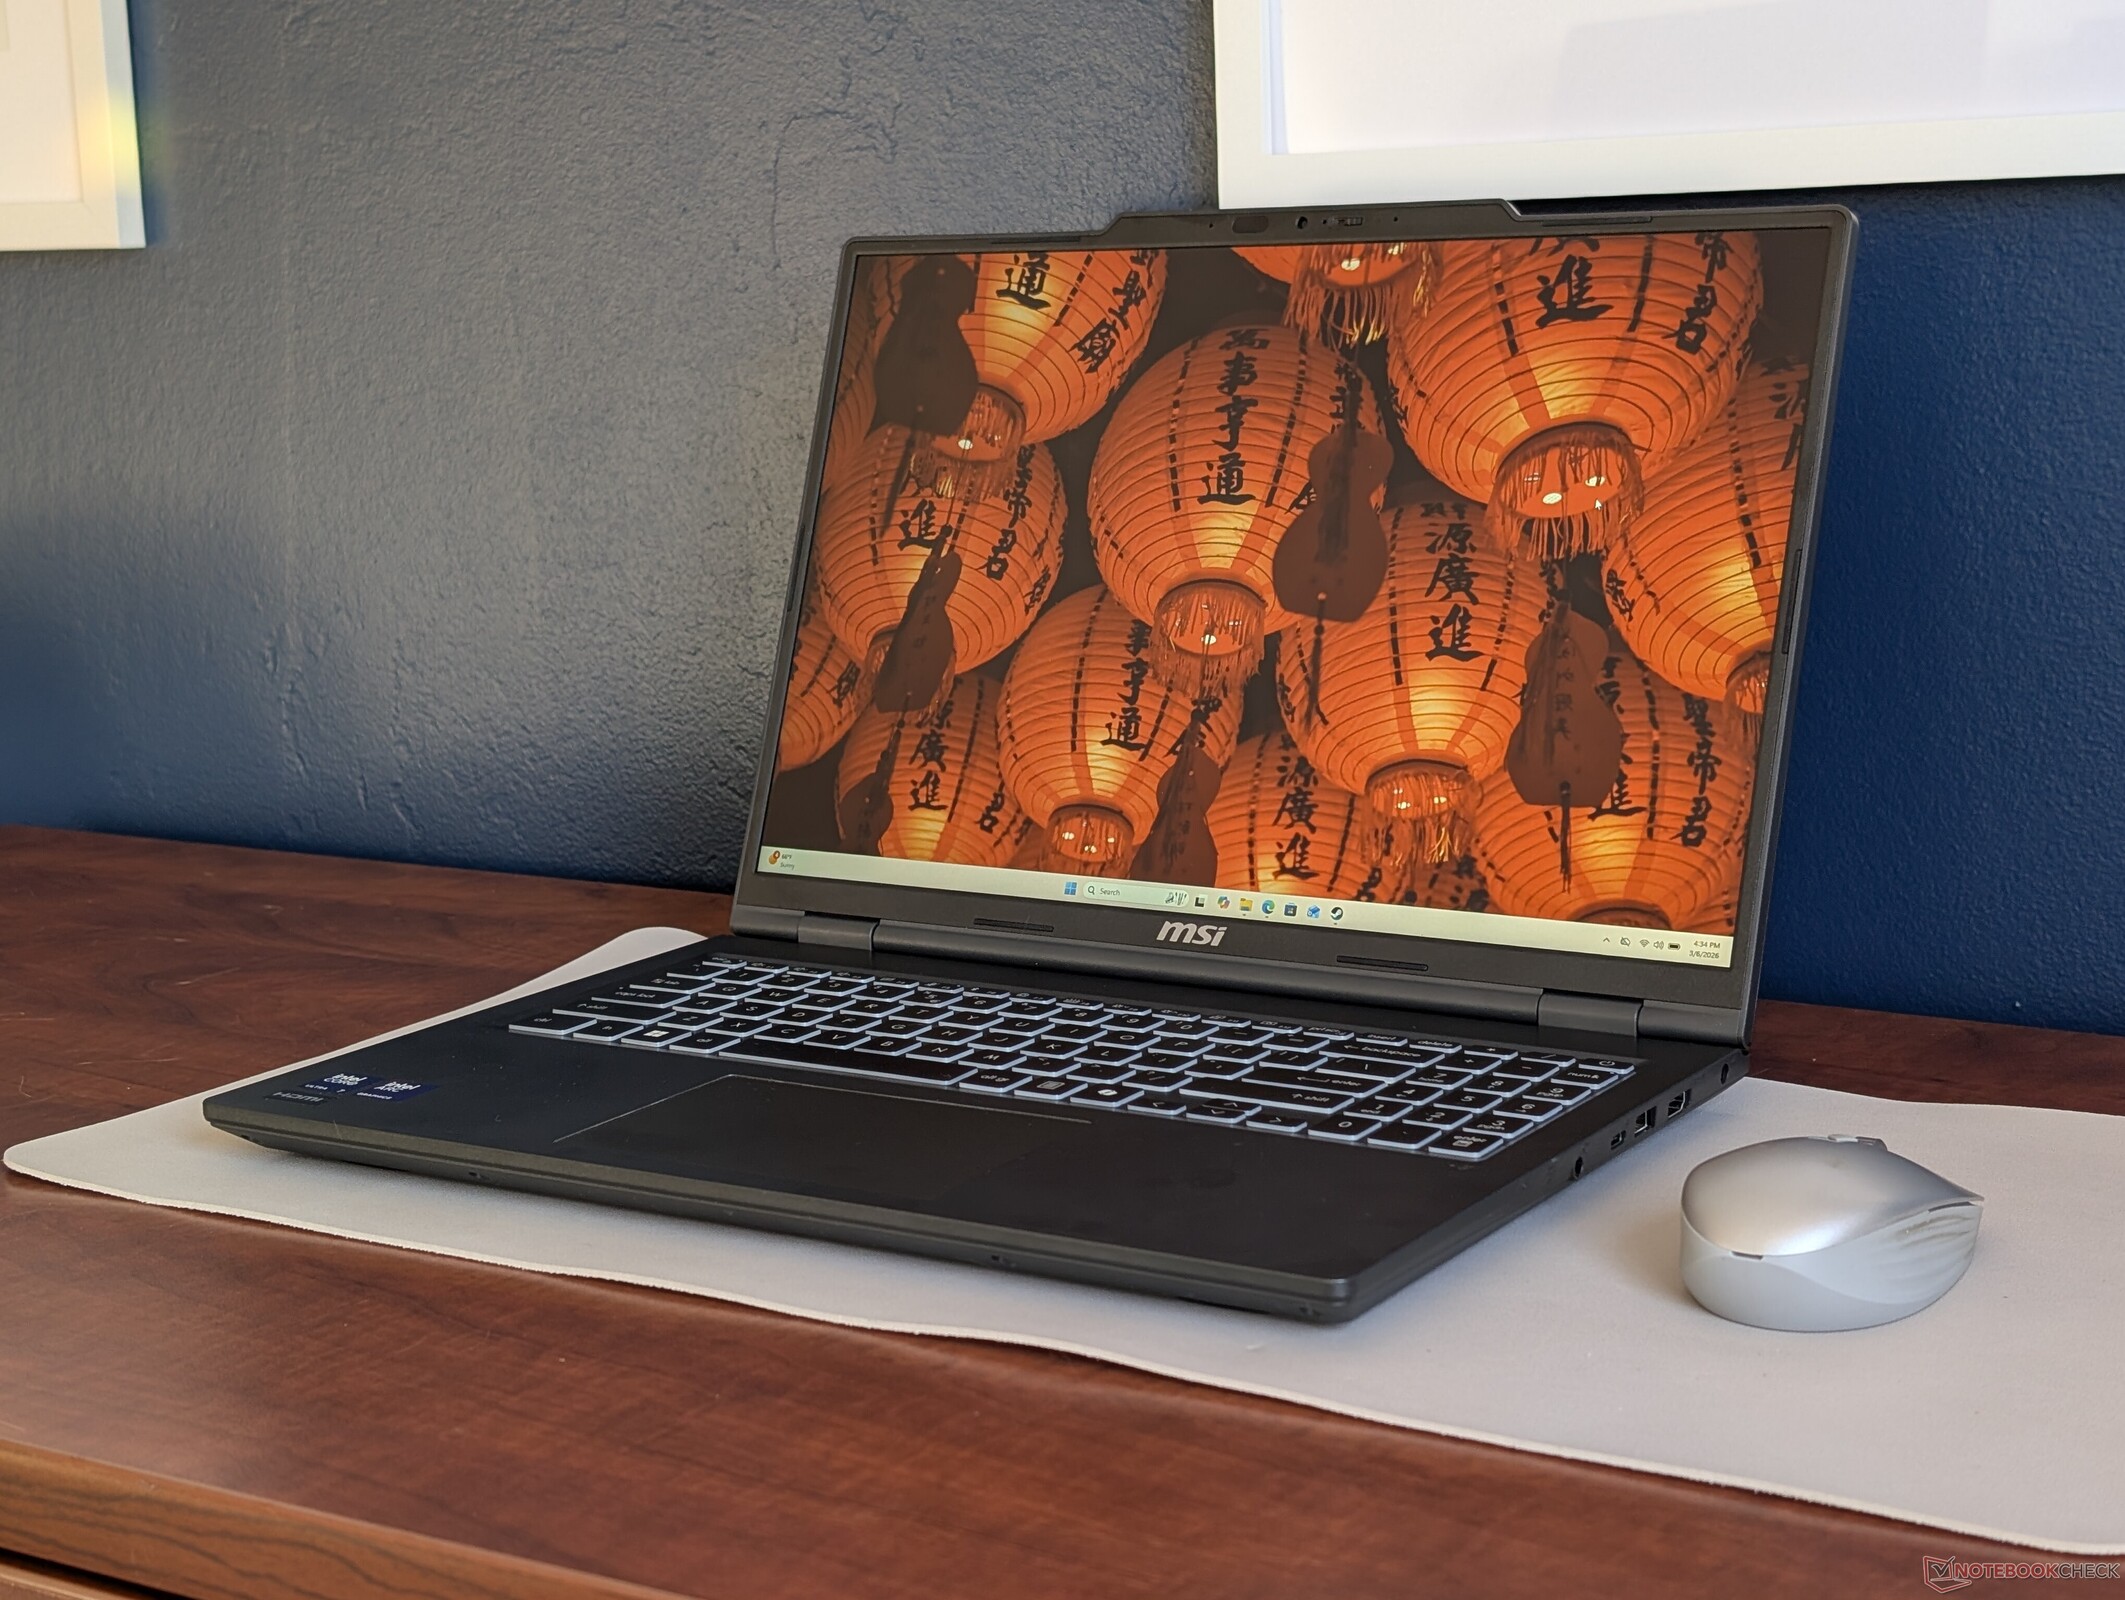
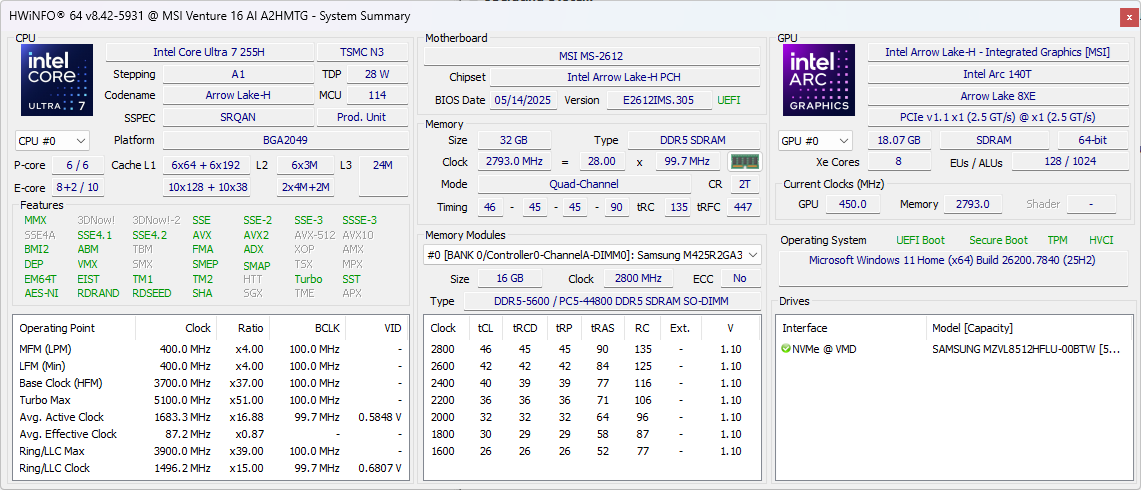
The Venture 16 is MSI's entry-level office laptop designed to complement the higher-end Prestige series. Our test unit comes equipped with the Arrow Lake-H Core Ultra 7 255H CPU and 1200p IPS touchscreen for approximately $900 USD retail while higher-end configurations may ship with the Core Ultra 9 285H and 1280p OLED display instead.
Alternatives to the Venture 16 include other budget-friendly office laptops like the Dell Inspiron series, HP ProBook or Pavilion series, or the Lenovo ThinkPad E series.
More MSI reviews:
Specifications
Case
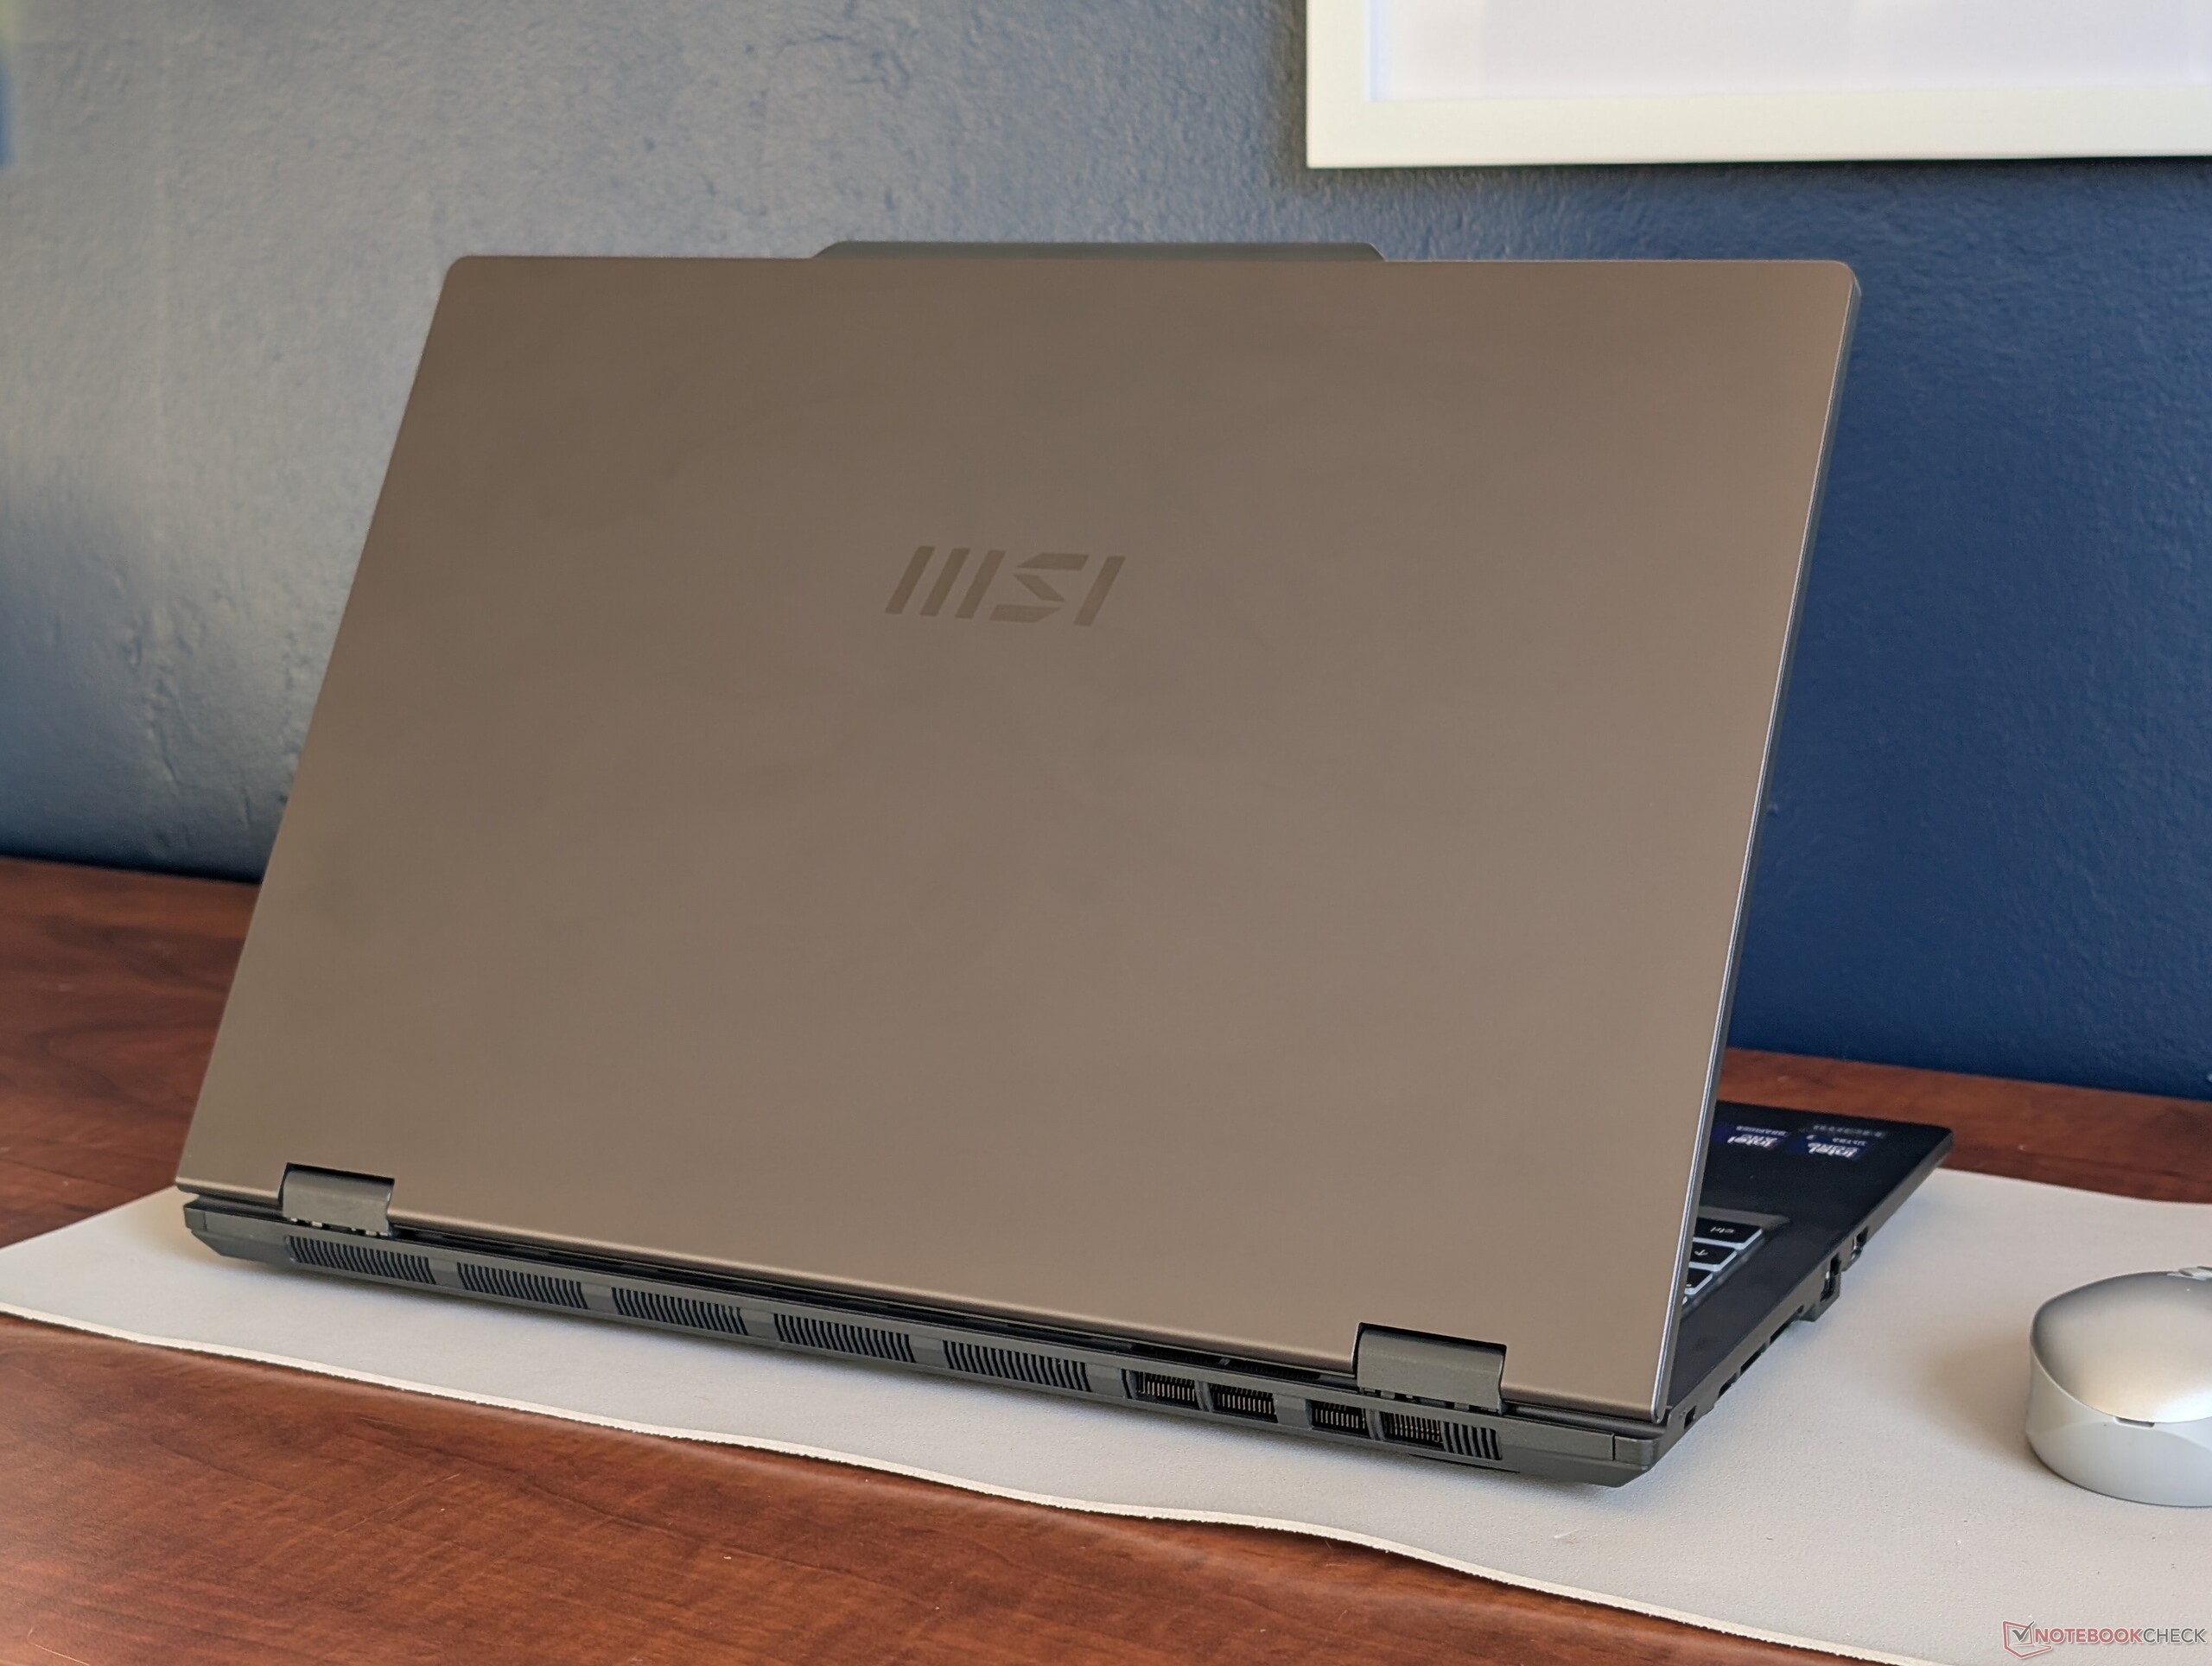
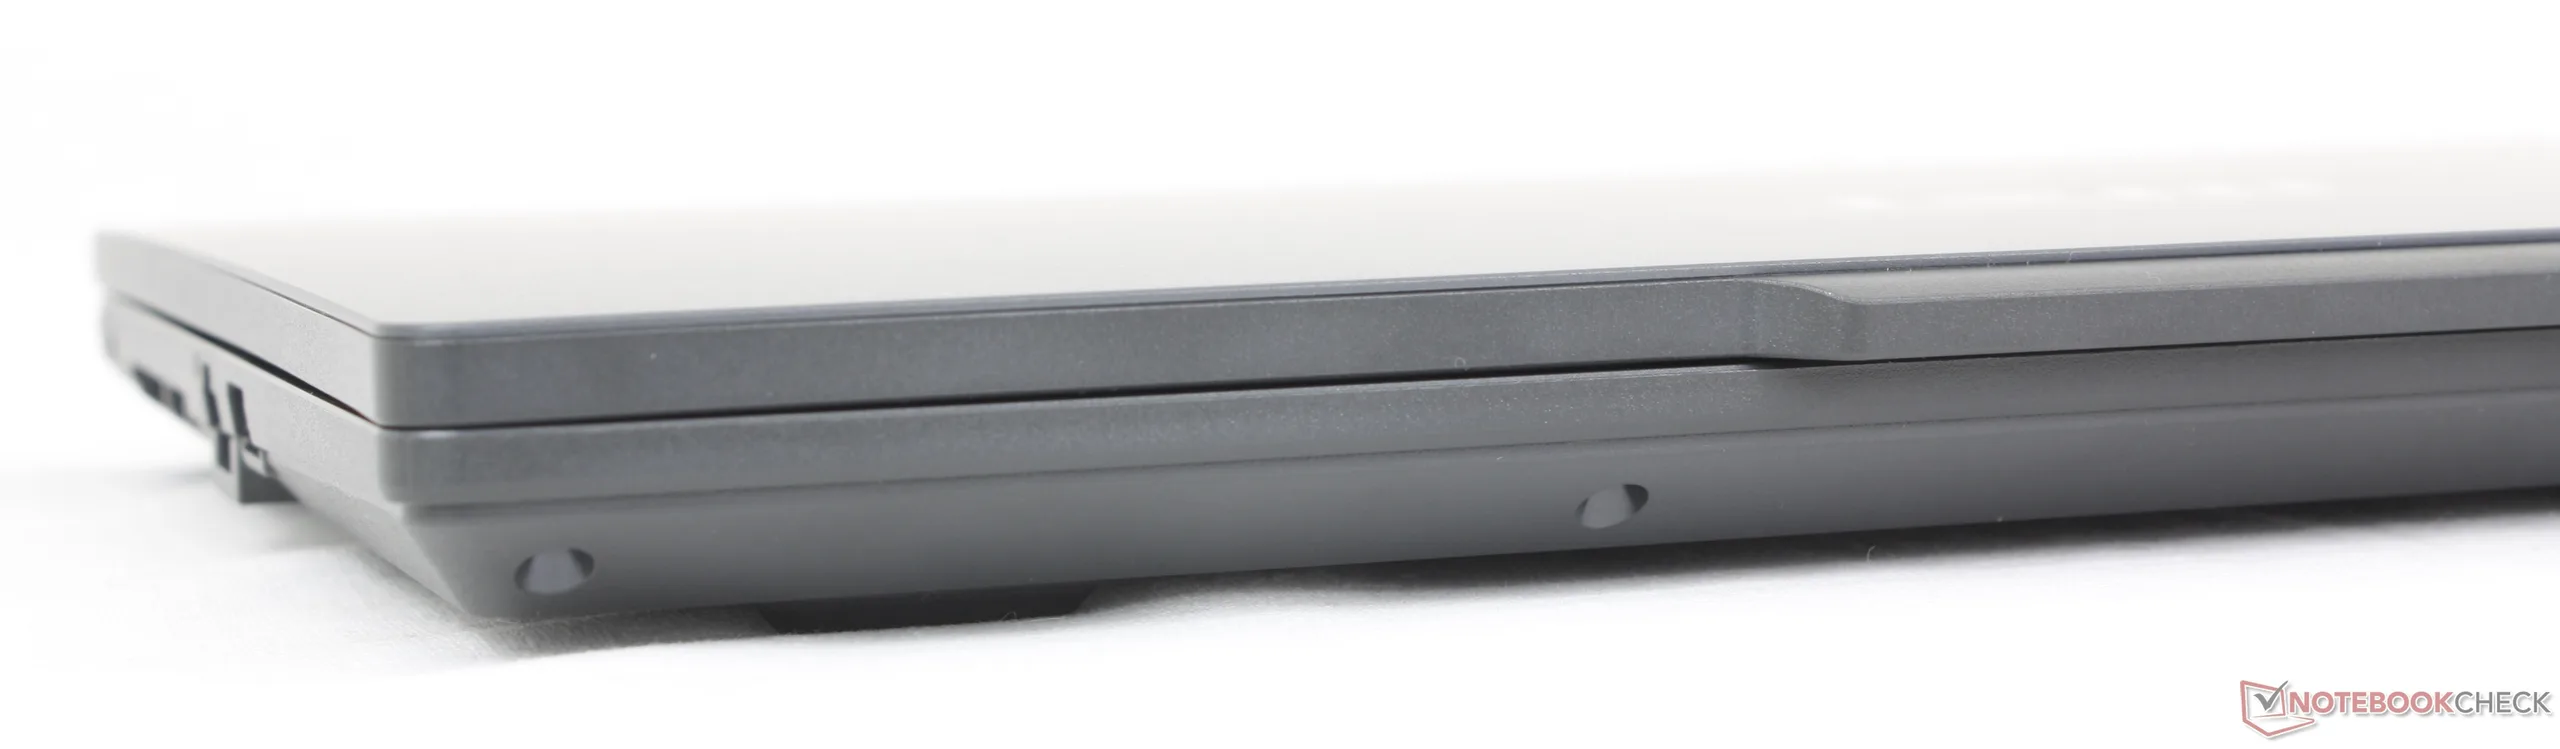
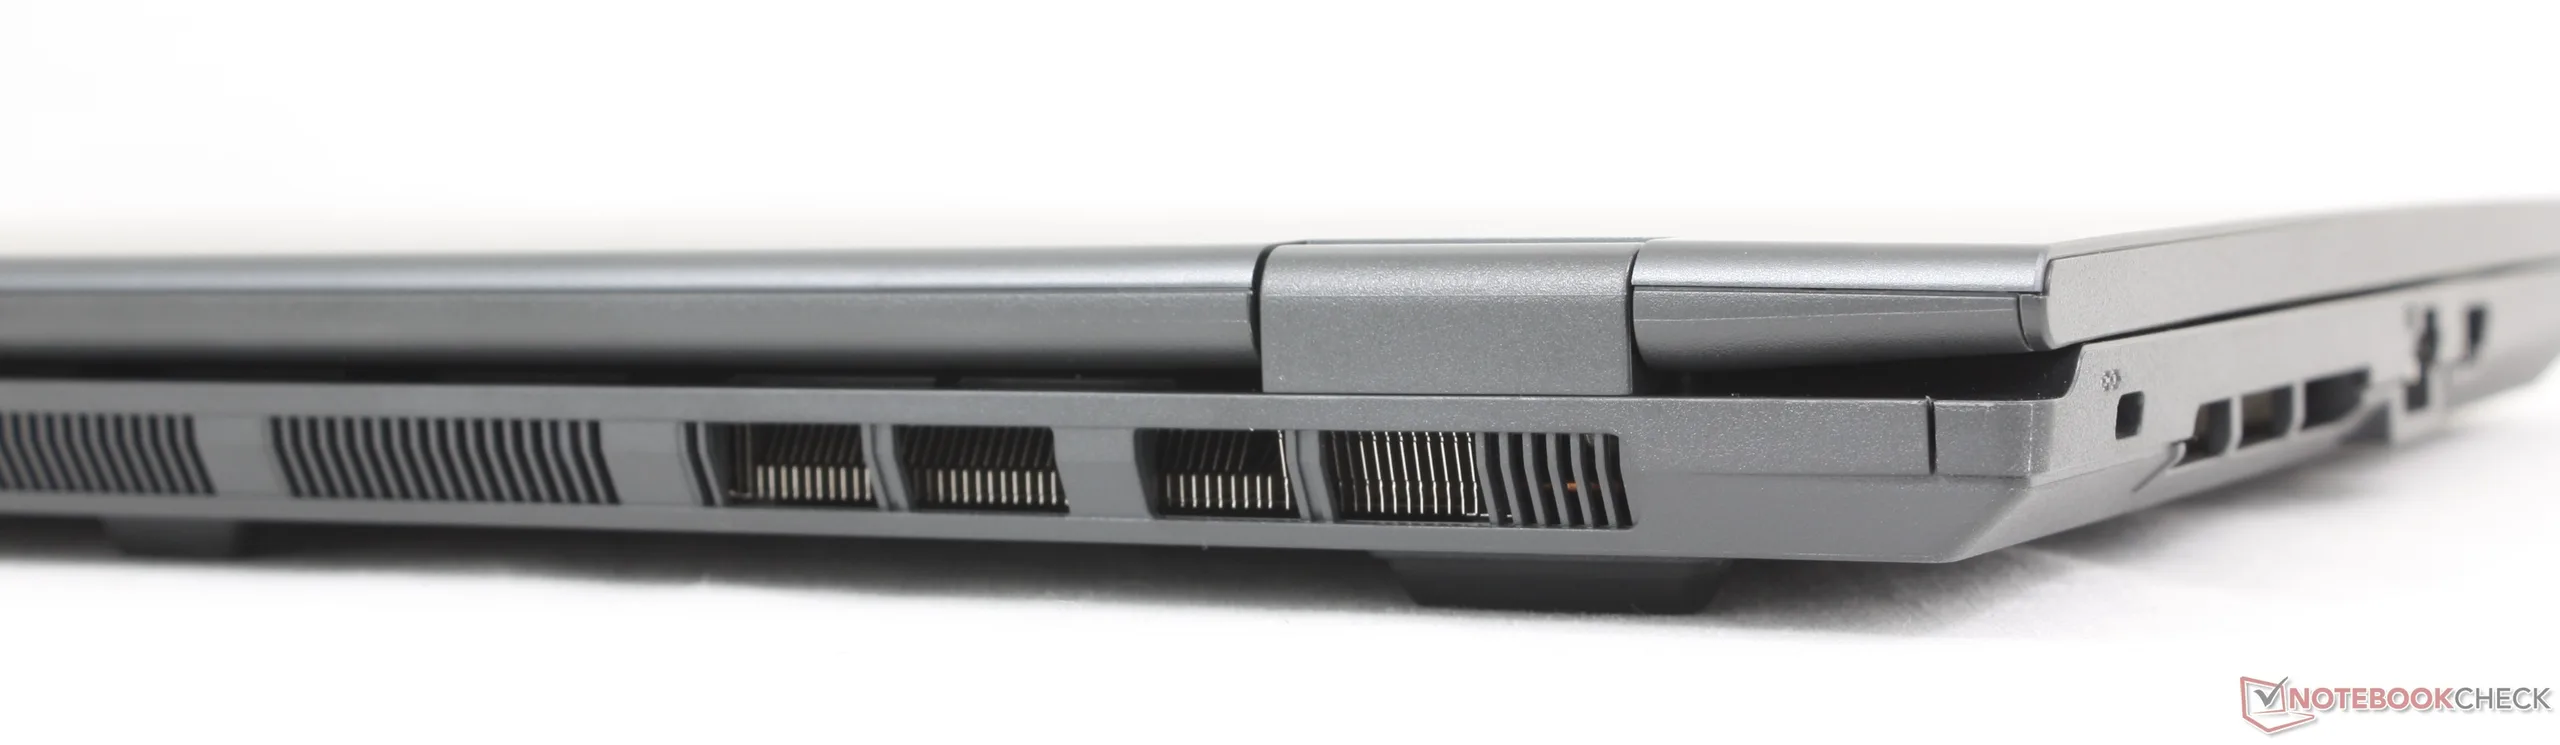
The chassis is predominantly smooth matte plastic with decent rigidity to keep costs low. Interestingly, the system is heavier and thicker than many other 16-inch laptops but with a smaller footprint due to its narrower bezels.
Connectivity
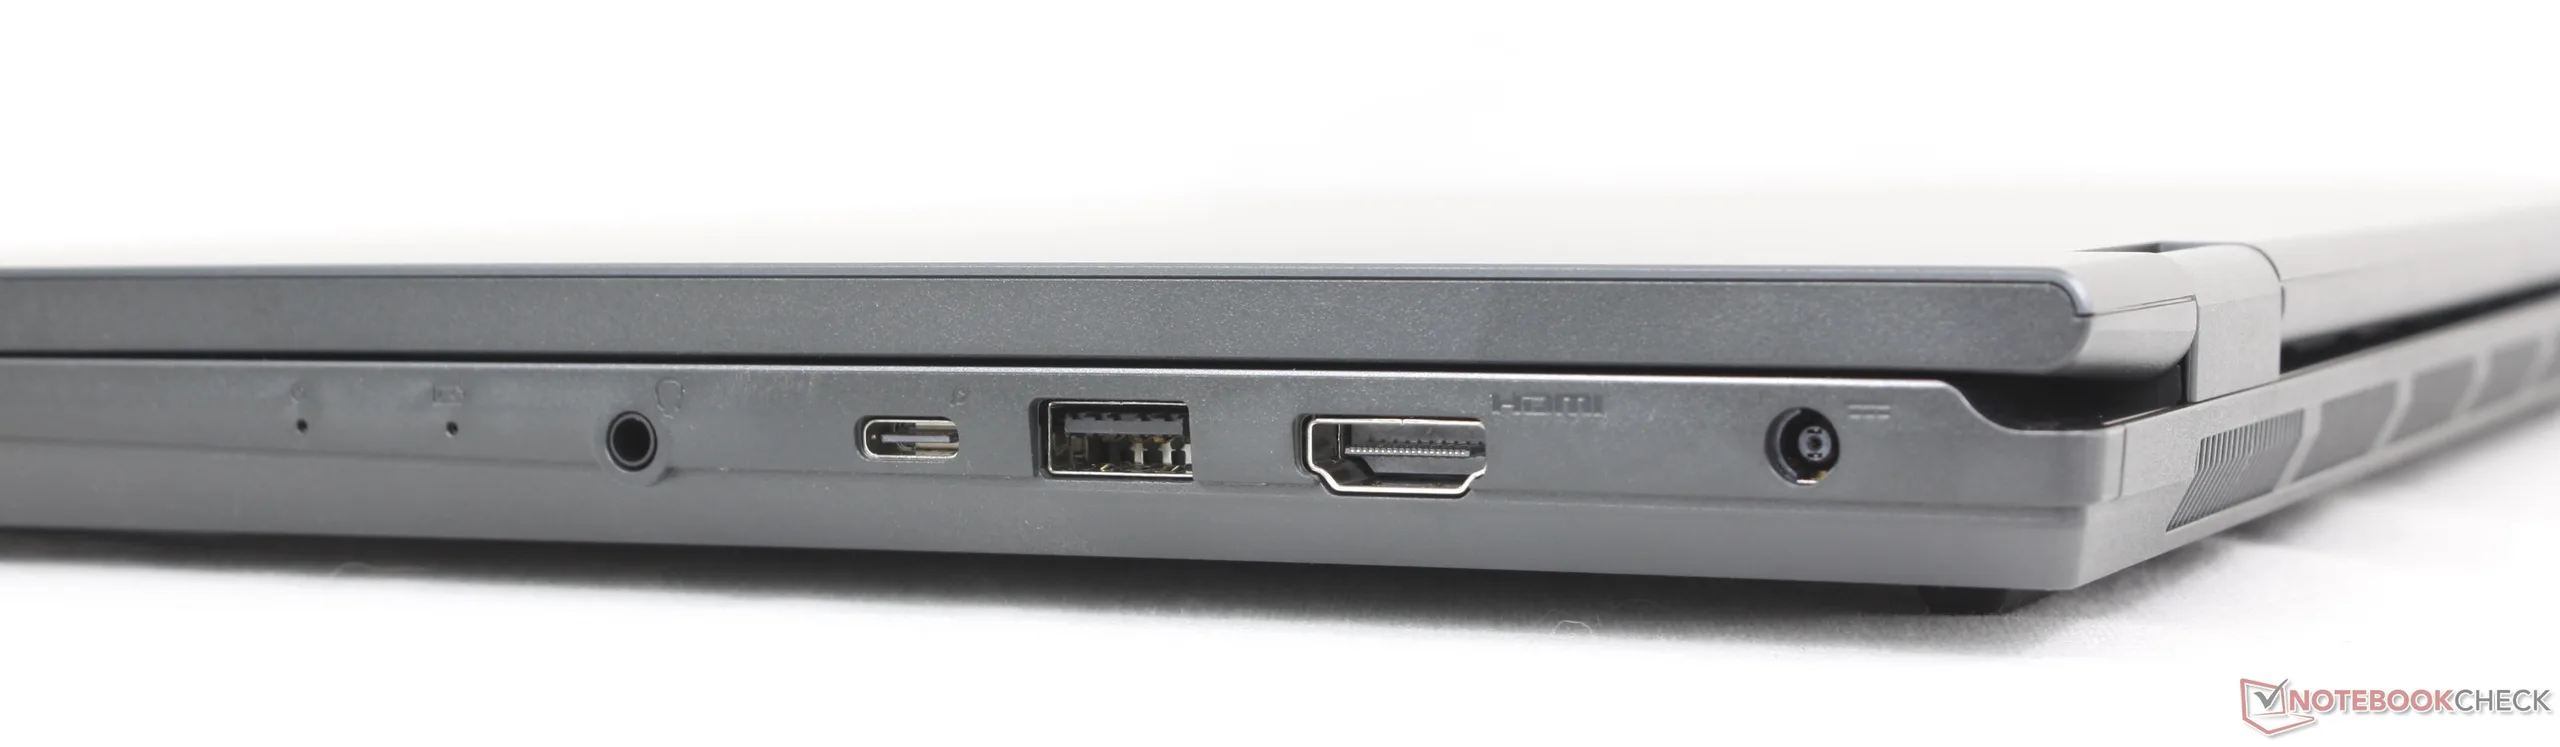
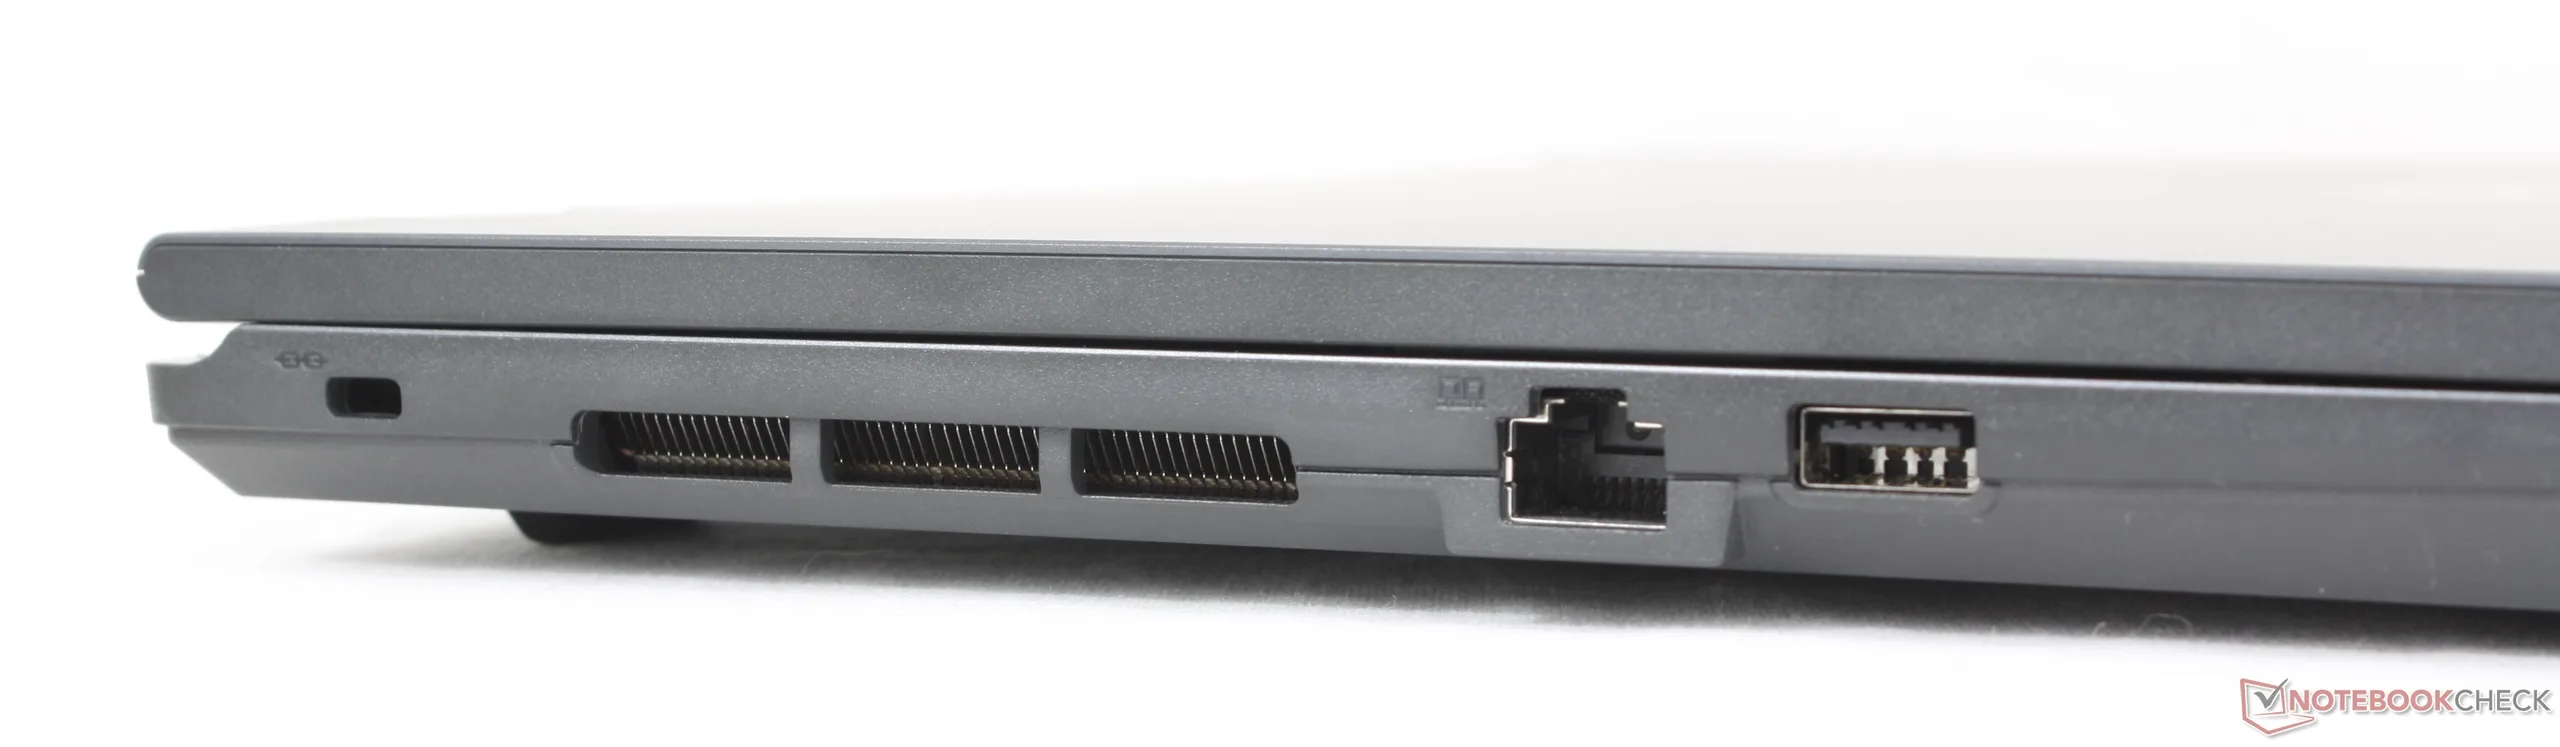
Port options could be better given the large 16-inch form factor. For example, there is only one USB-C port compared to two on most other laptops including the Dell 16 Plus.
Communication
| Networking | |
| iperf3 transmit AXE11000 | |
| Lenovo IdeaPad Slim 5 16AKP10 | |
| Dell 16 Plus 2-in-1 | |
| MSI Prestige 16 B1MG-001US | |
| HP Pavilion 16-ag0057ng | |
| Asus V16 V3607V | |
| MSI Venture 16 AI A2HMTG | |
| iperf3 receive AXE11000 | |
| Lenovo IdeaPad Slim 5 16AKP10 | |
| MSI Prestige 16 B1MG-001US | |
| Dell 16 Plus 2-in-1 | |
| HP Pavilion 16-ag0057ng | |
| Asus V16 V3607V | |
| MSI Venture 16 AI A2HMTG | |
| iperf3 transmit AXE11000 6GHz | |
| Dell 16 Plus 2-in-1 | |
| MSI Prestige 16 B1MG-001US | |
| MSI Venture 16 AI A2HMTG | |
| iperf3 receive AXE11000 6GHz | |
| Dell 16 Plus 2-in-1 | |
| MSI Venture 16 AI A2HMTG | |
| MSI Prestige 16 B1MG-001US | |
Webcam


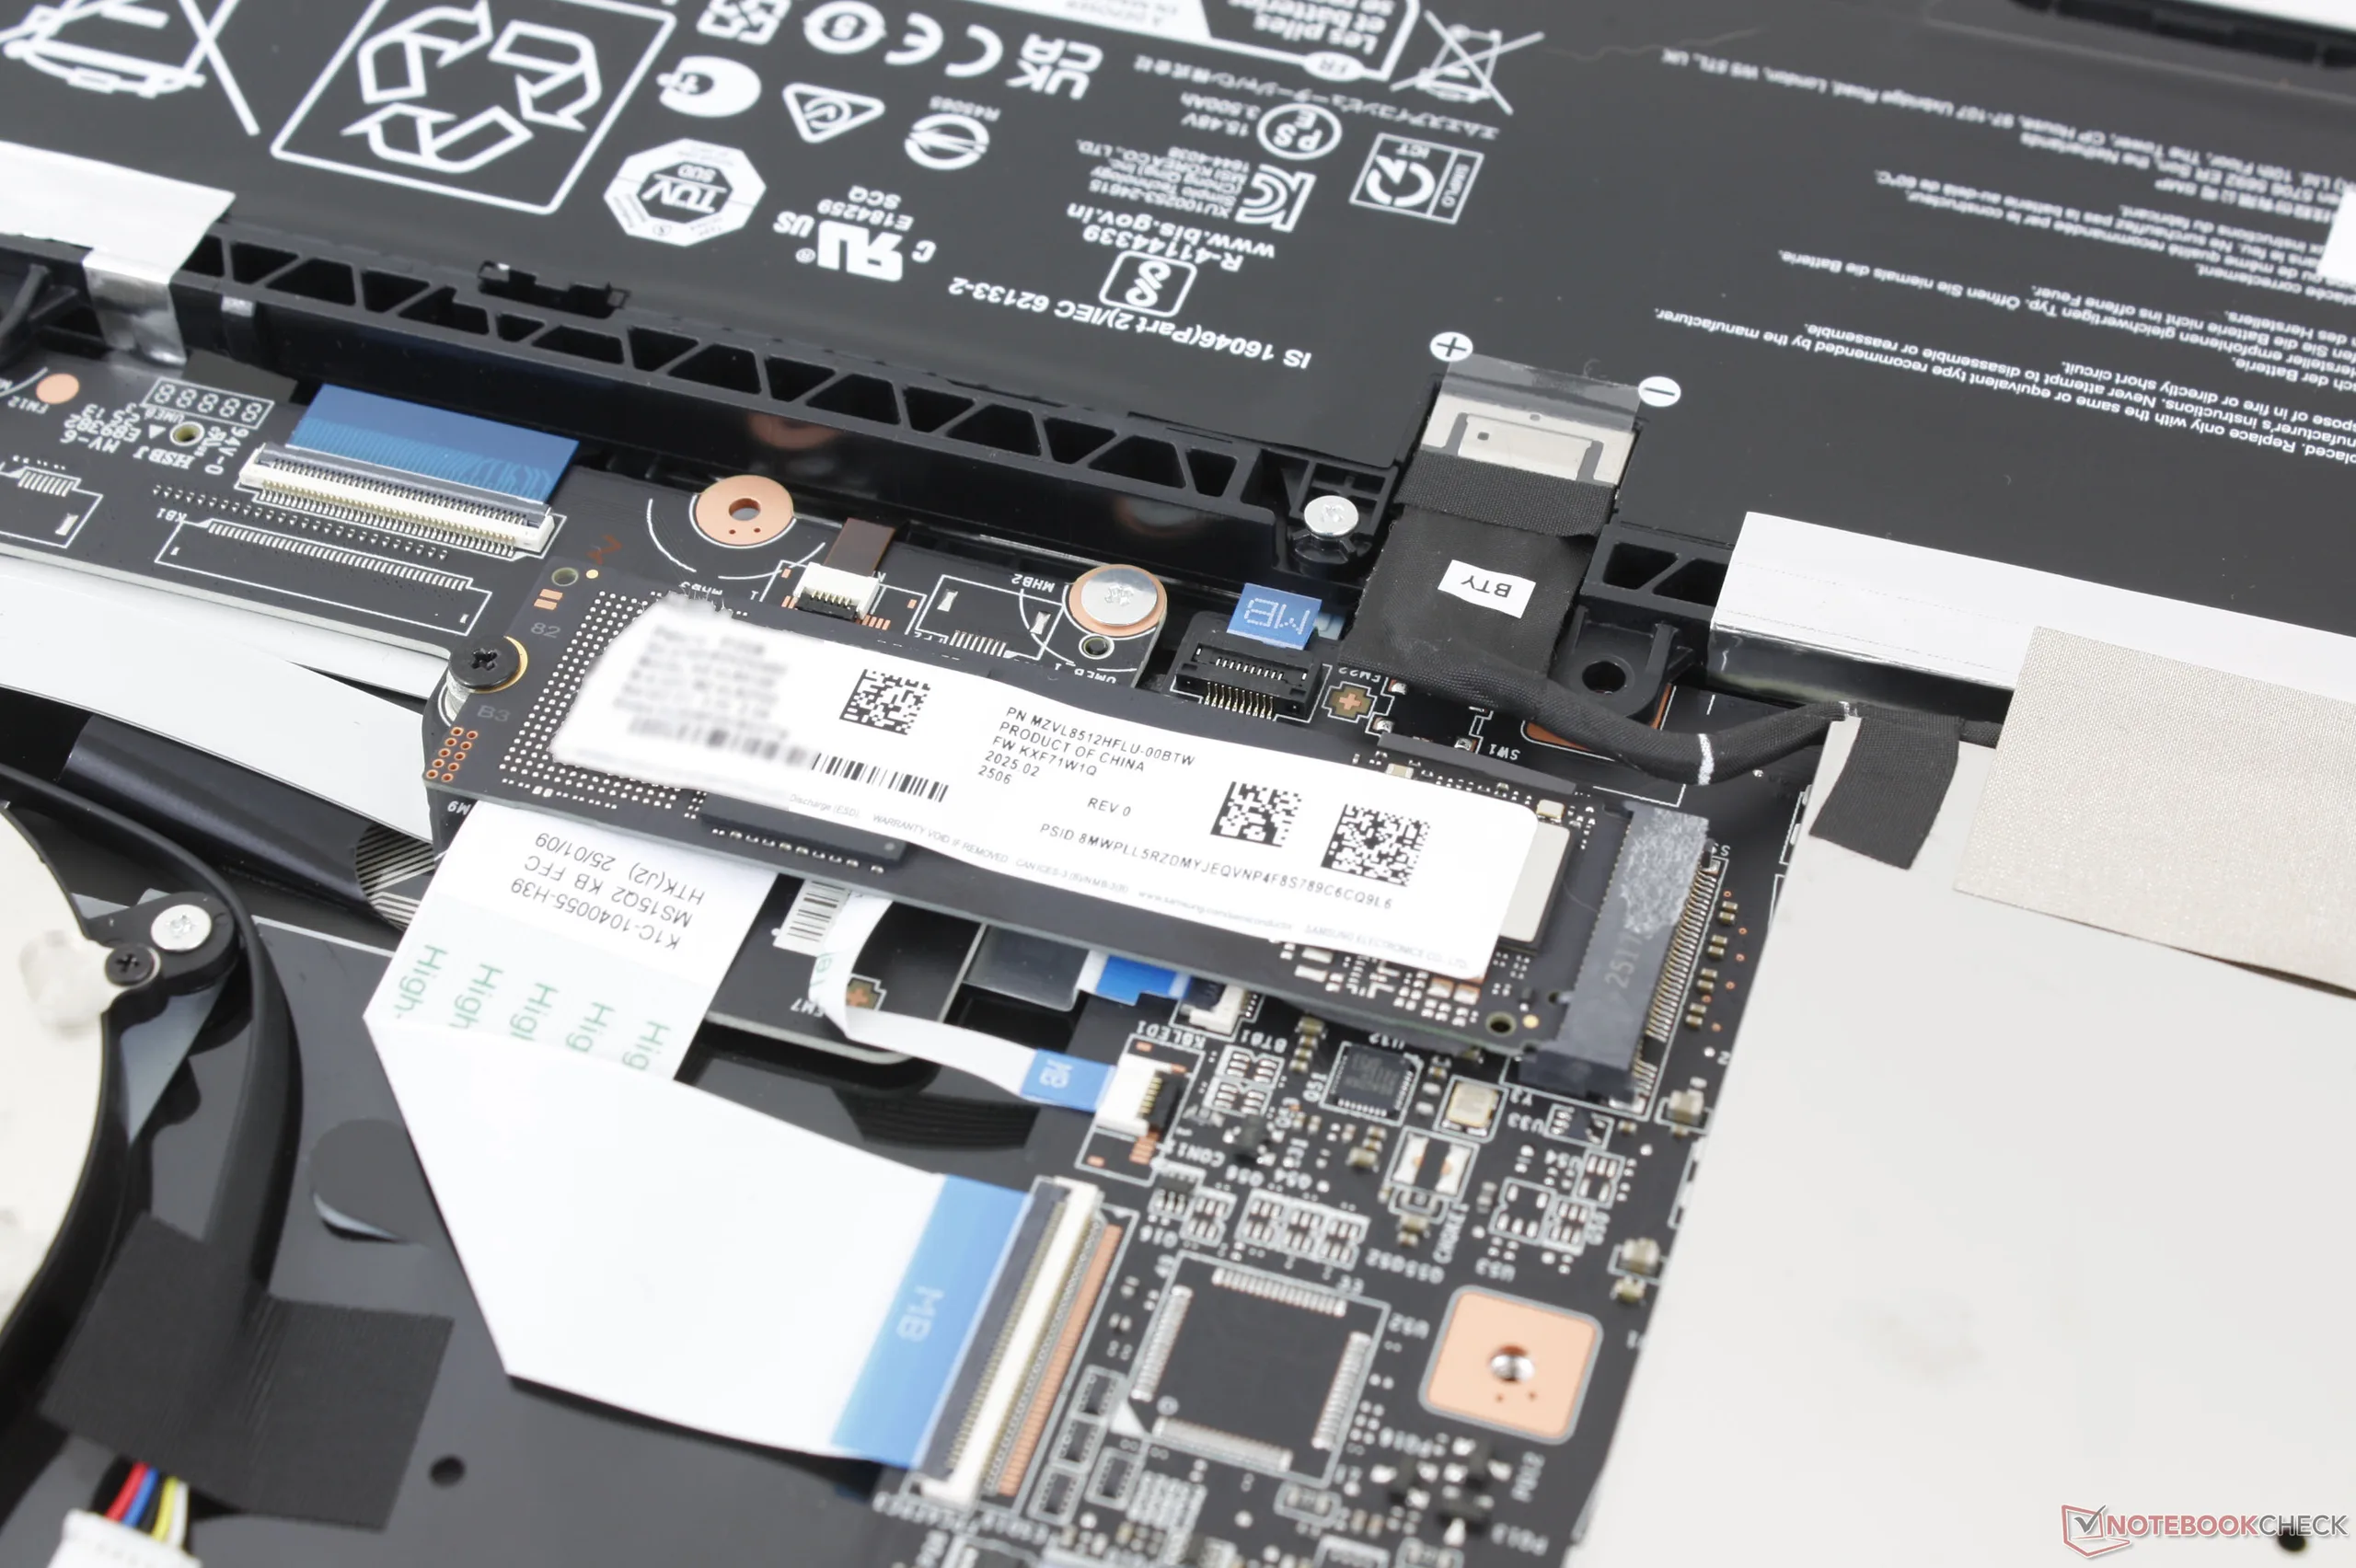
Maintenance
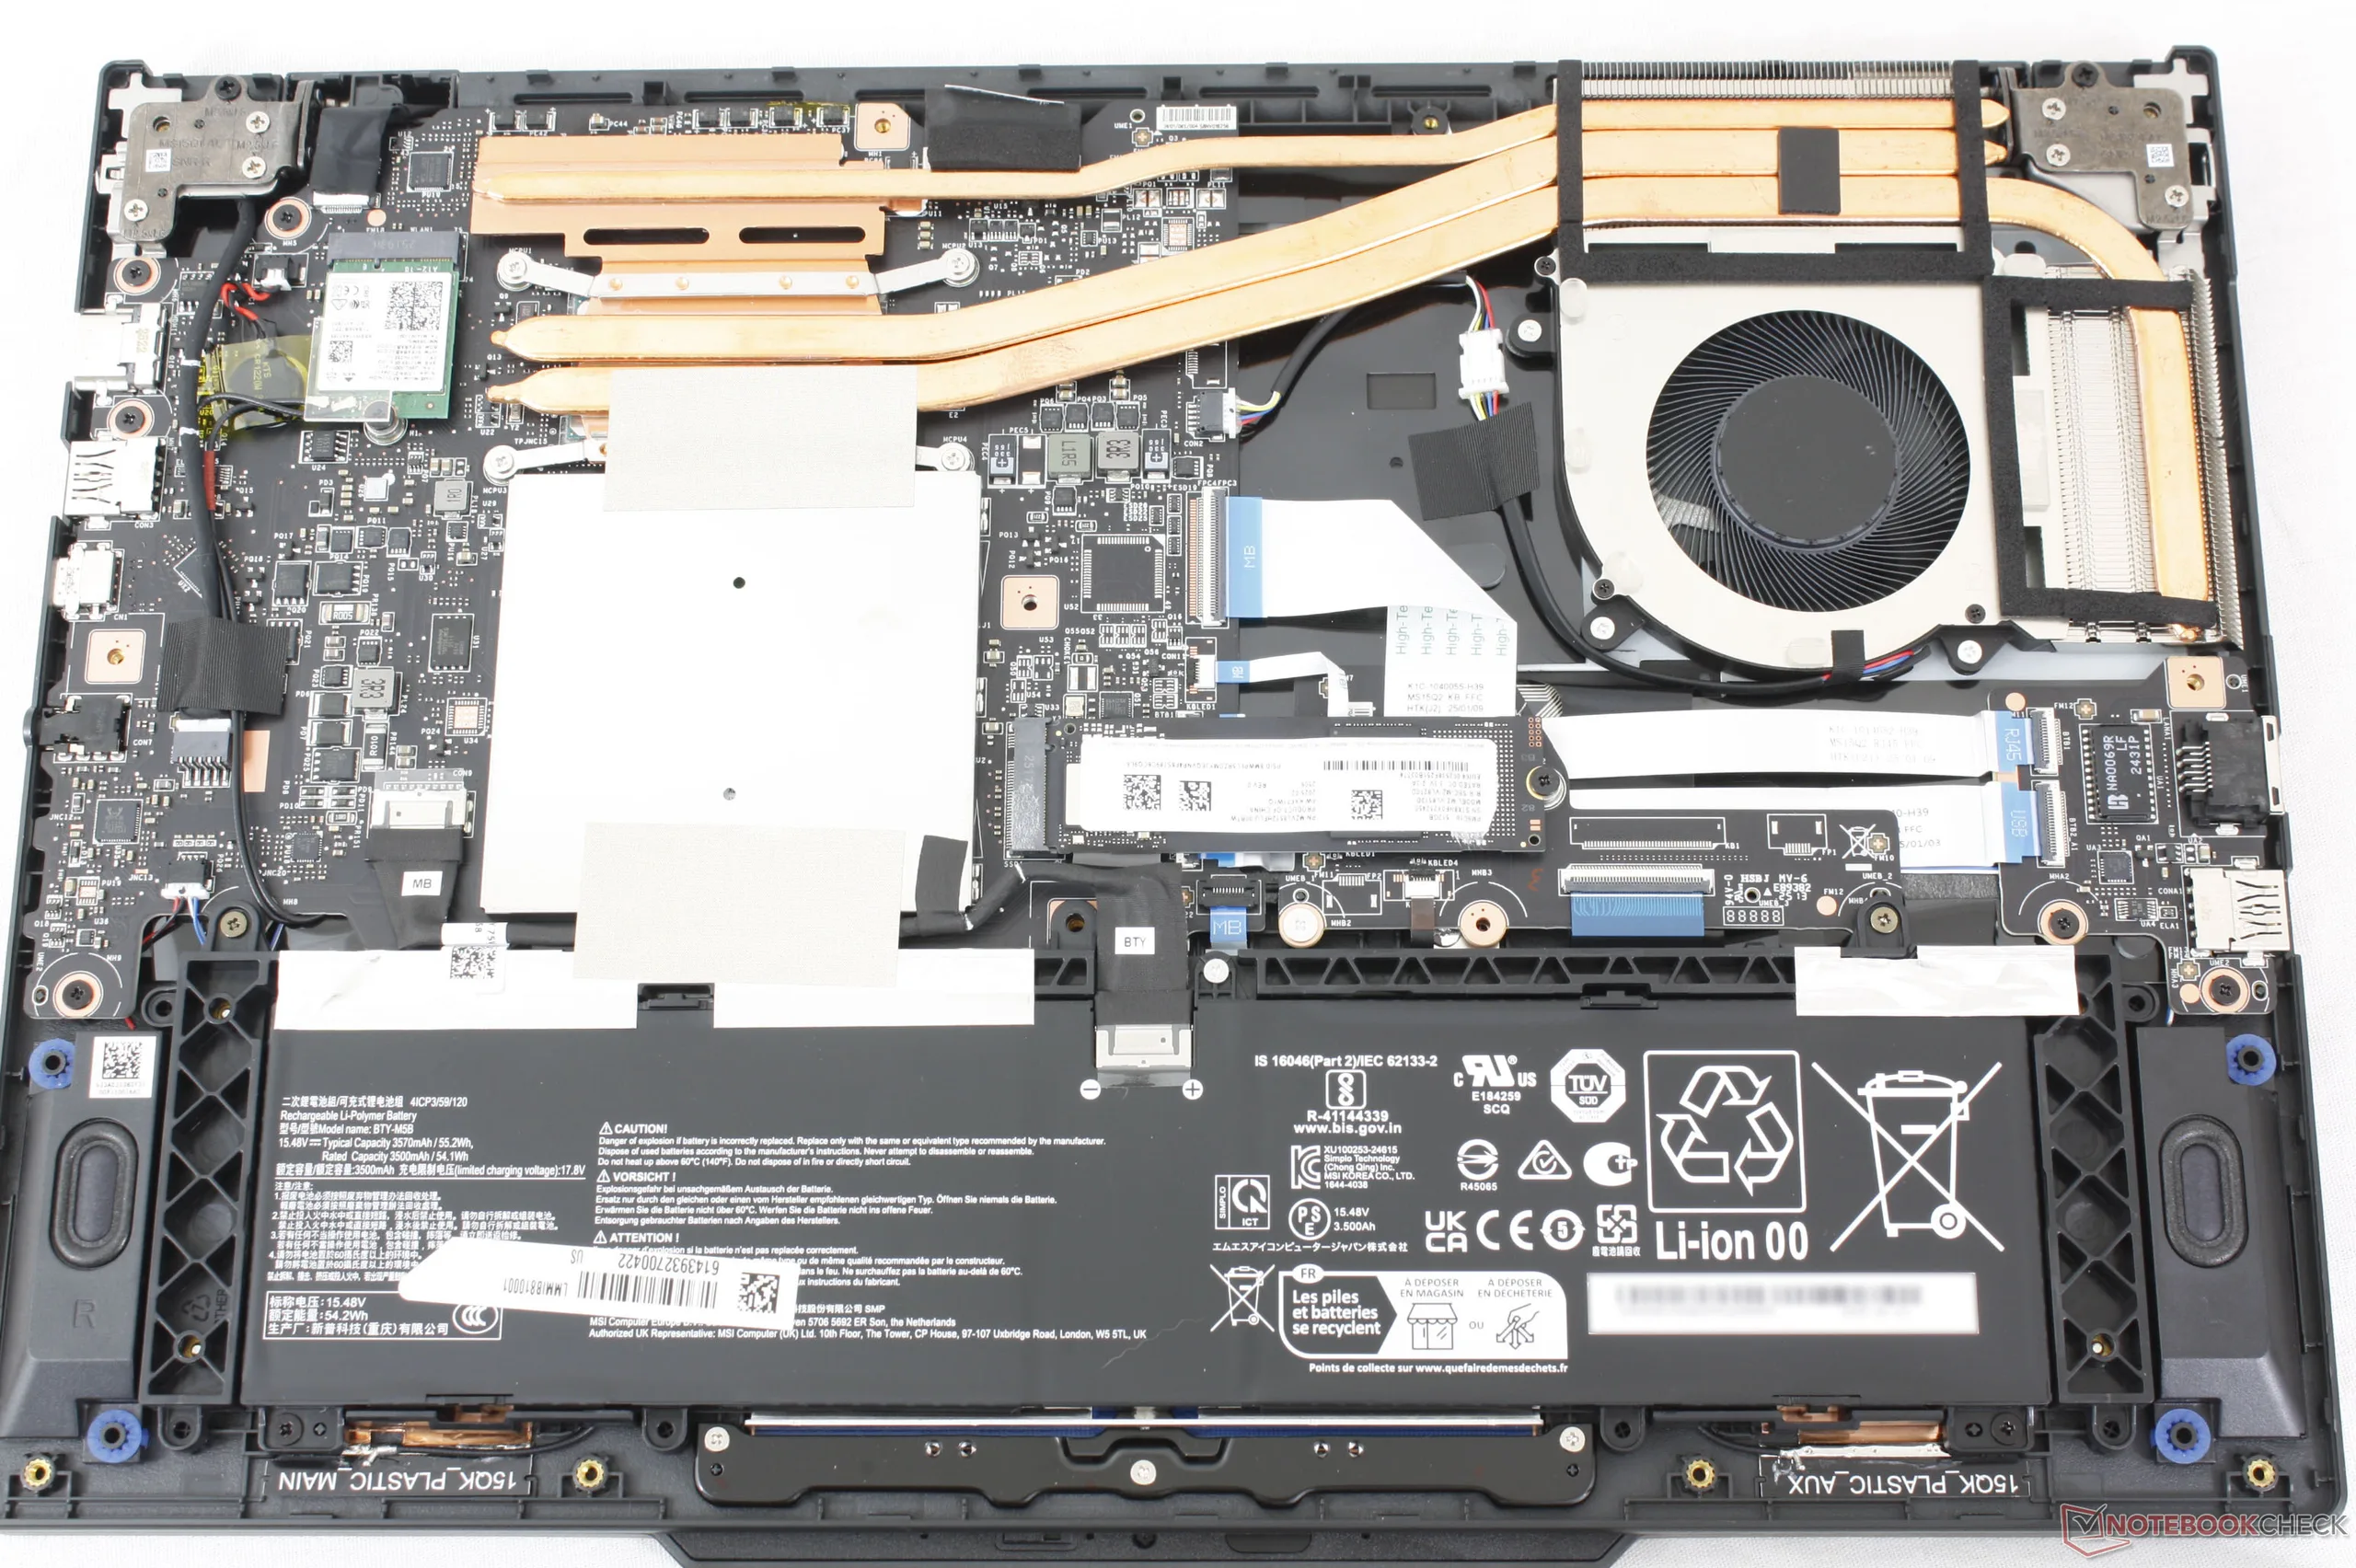
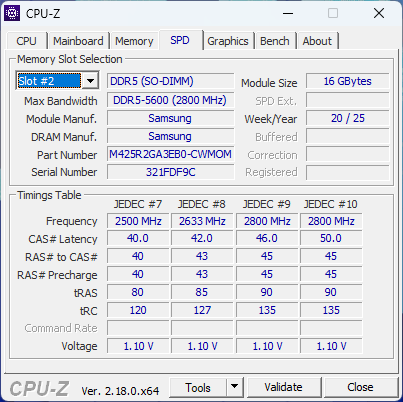
The bottom panel can be easily removed with just a Philips screwdriver. RAM is upgradeable via two DDR5 SODIMM slots while only a single M.2 2280 SSD is supported.
Sustainability
Though MSI does not explicitly list any recycled materials during manufacturing, the company nonetheless recognizes Energy Star and FSC certifications. The packaging utilizes plastic wrapping for the laptop and AC adapter.
Accessories And Warranty
There are no extras in the box other than the AC adapter and paperwork. The usual one-year limited manufacturer warranty applies if purchased in the US.
Input Devices
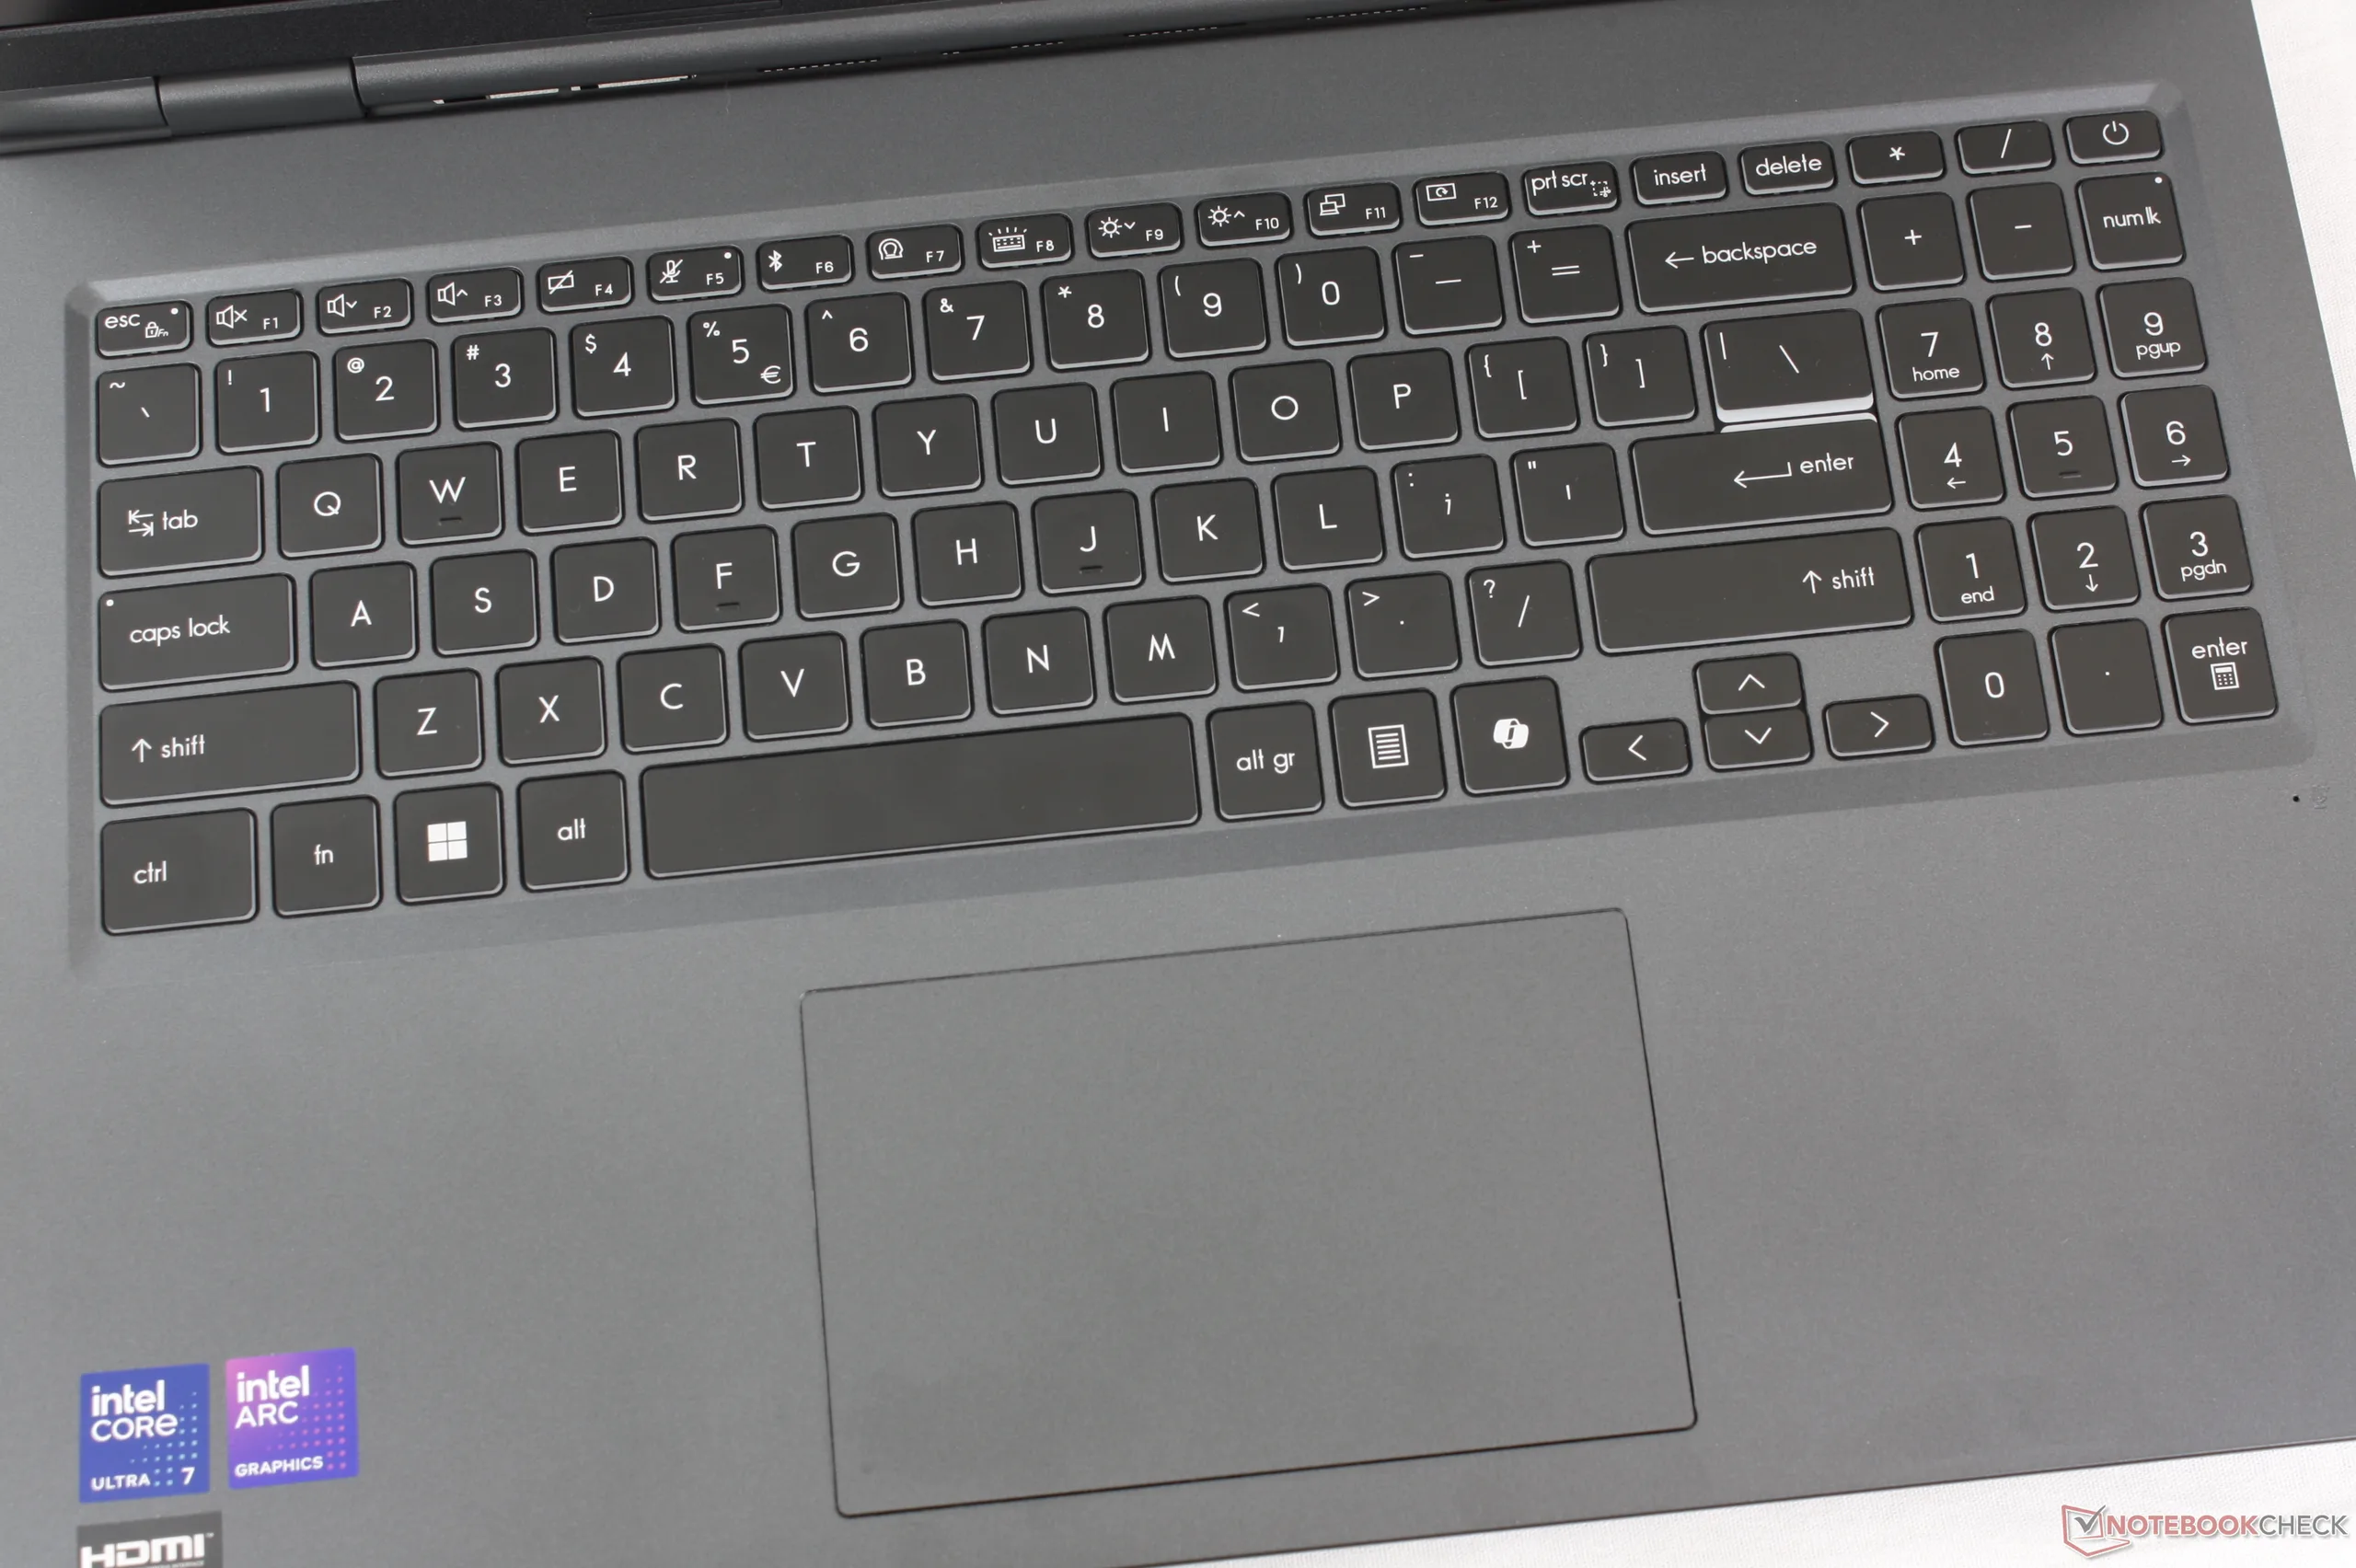
The typing experience is nearly the same as on the Prestige 16 as the Venture 16 utilizes similar keycaps and components. Feedback is relatively light with quiet clatter and shallower travel when compared to a traditional ThinkPad.
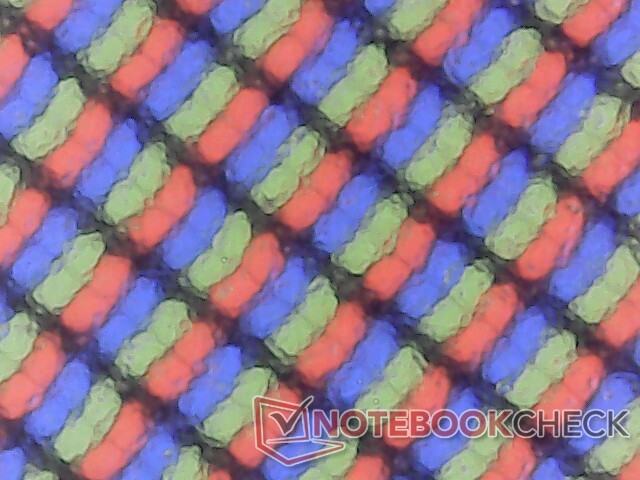
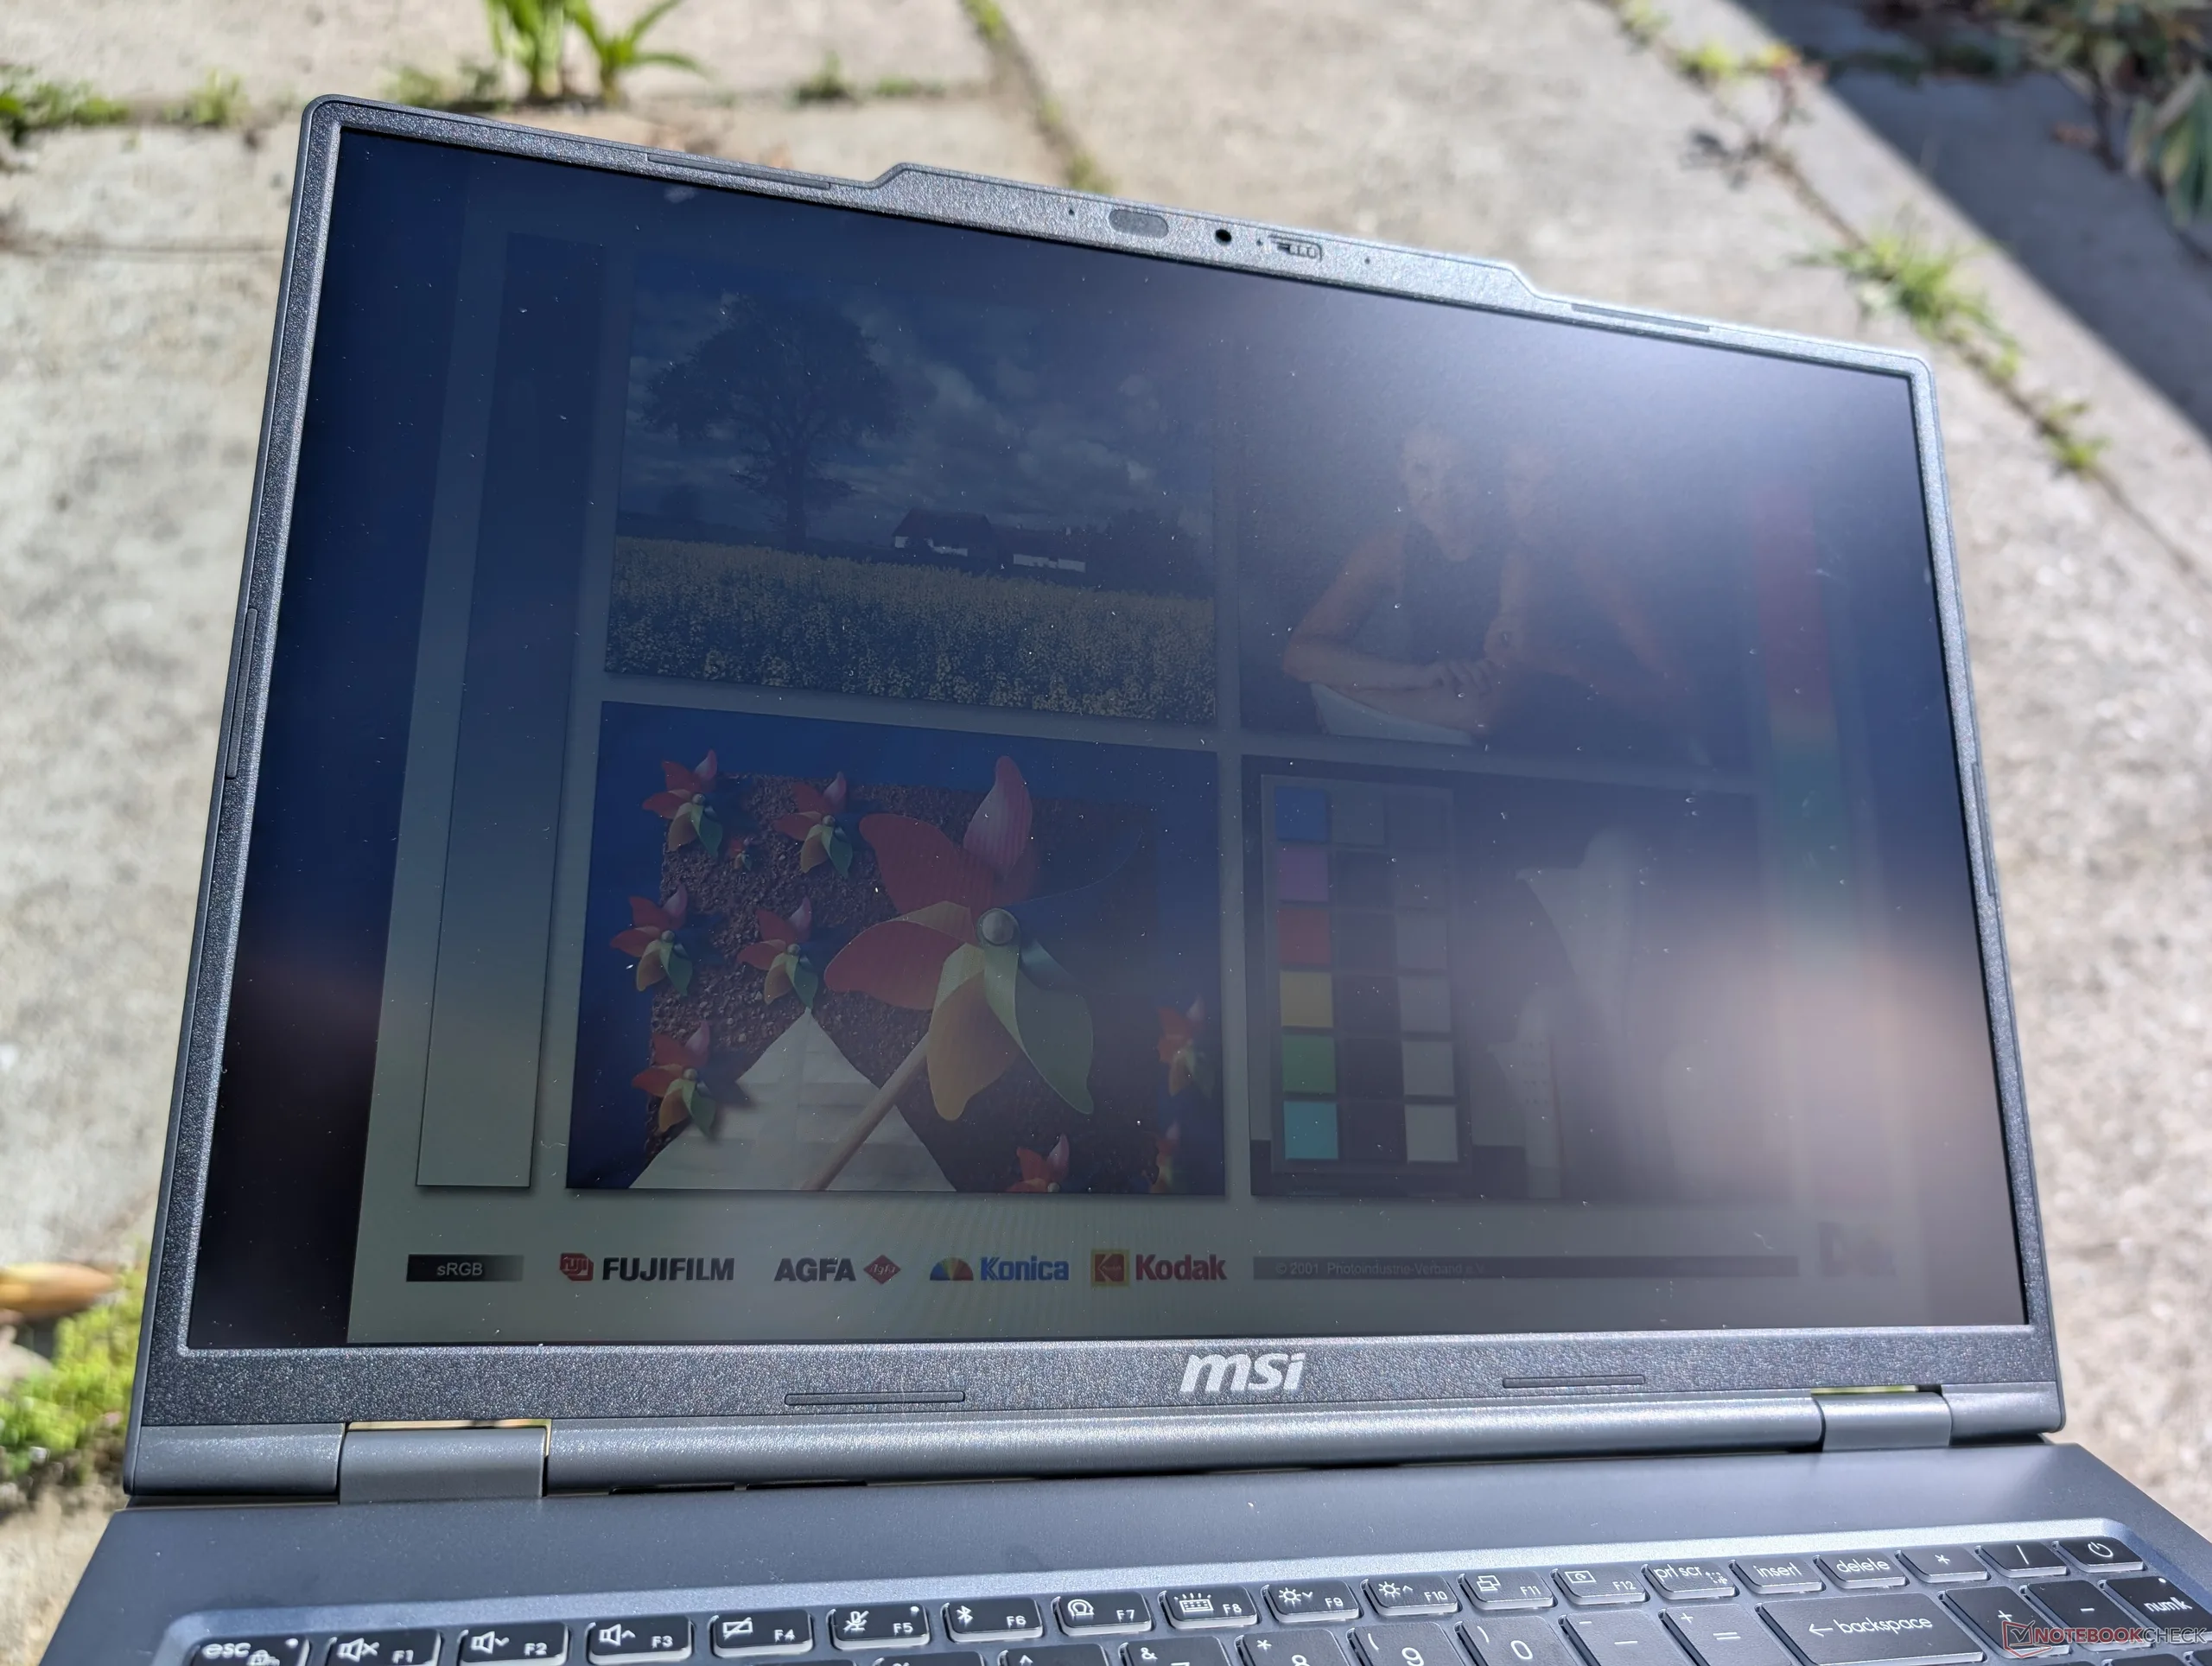
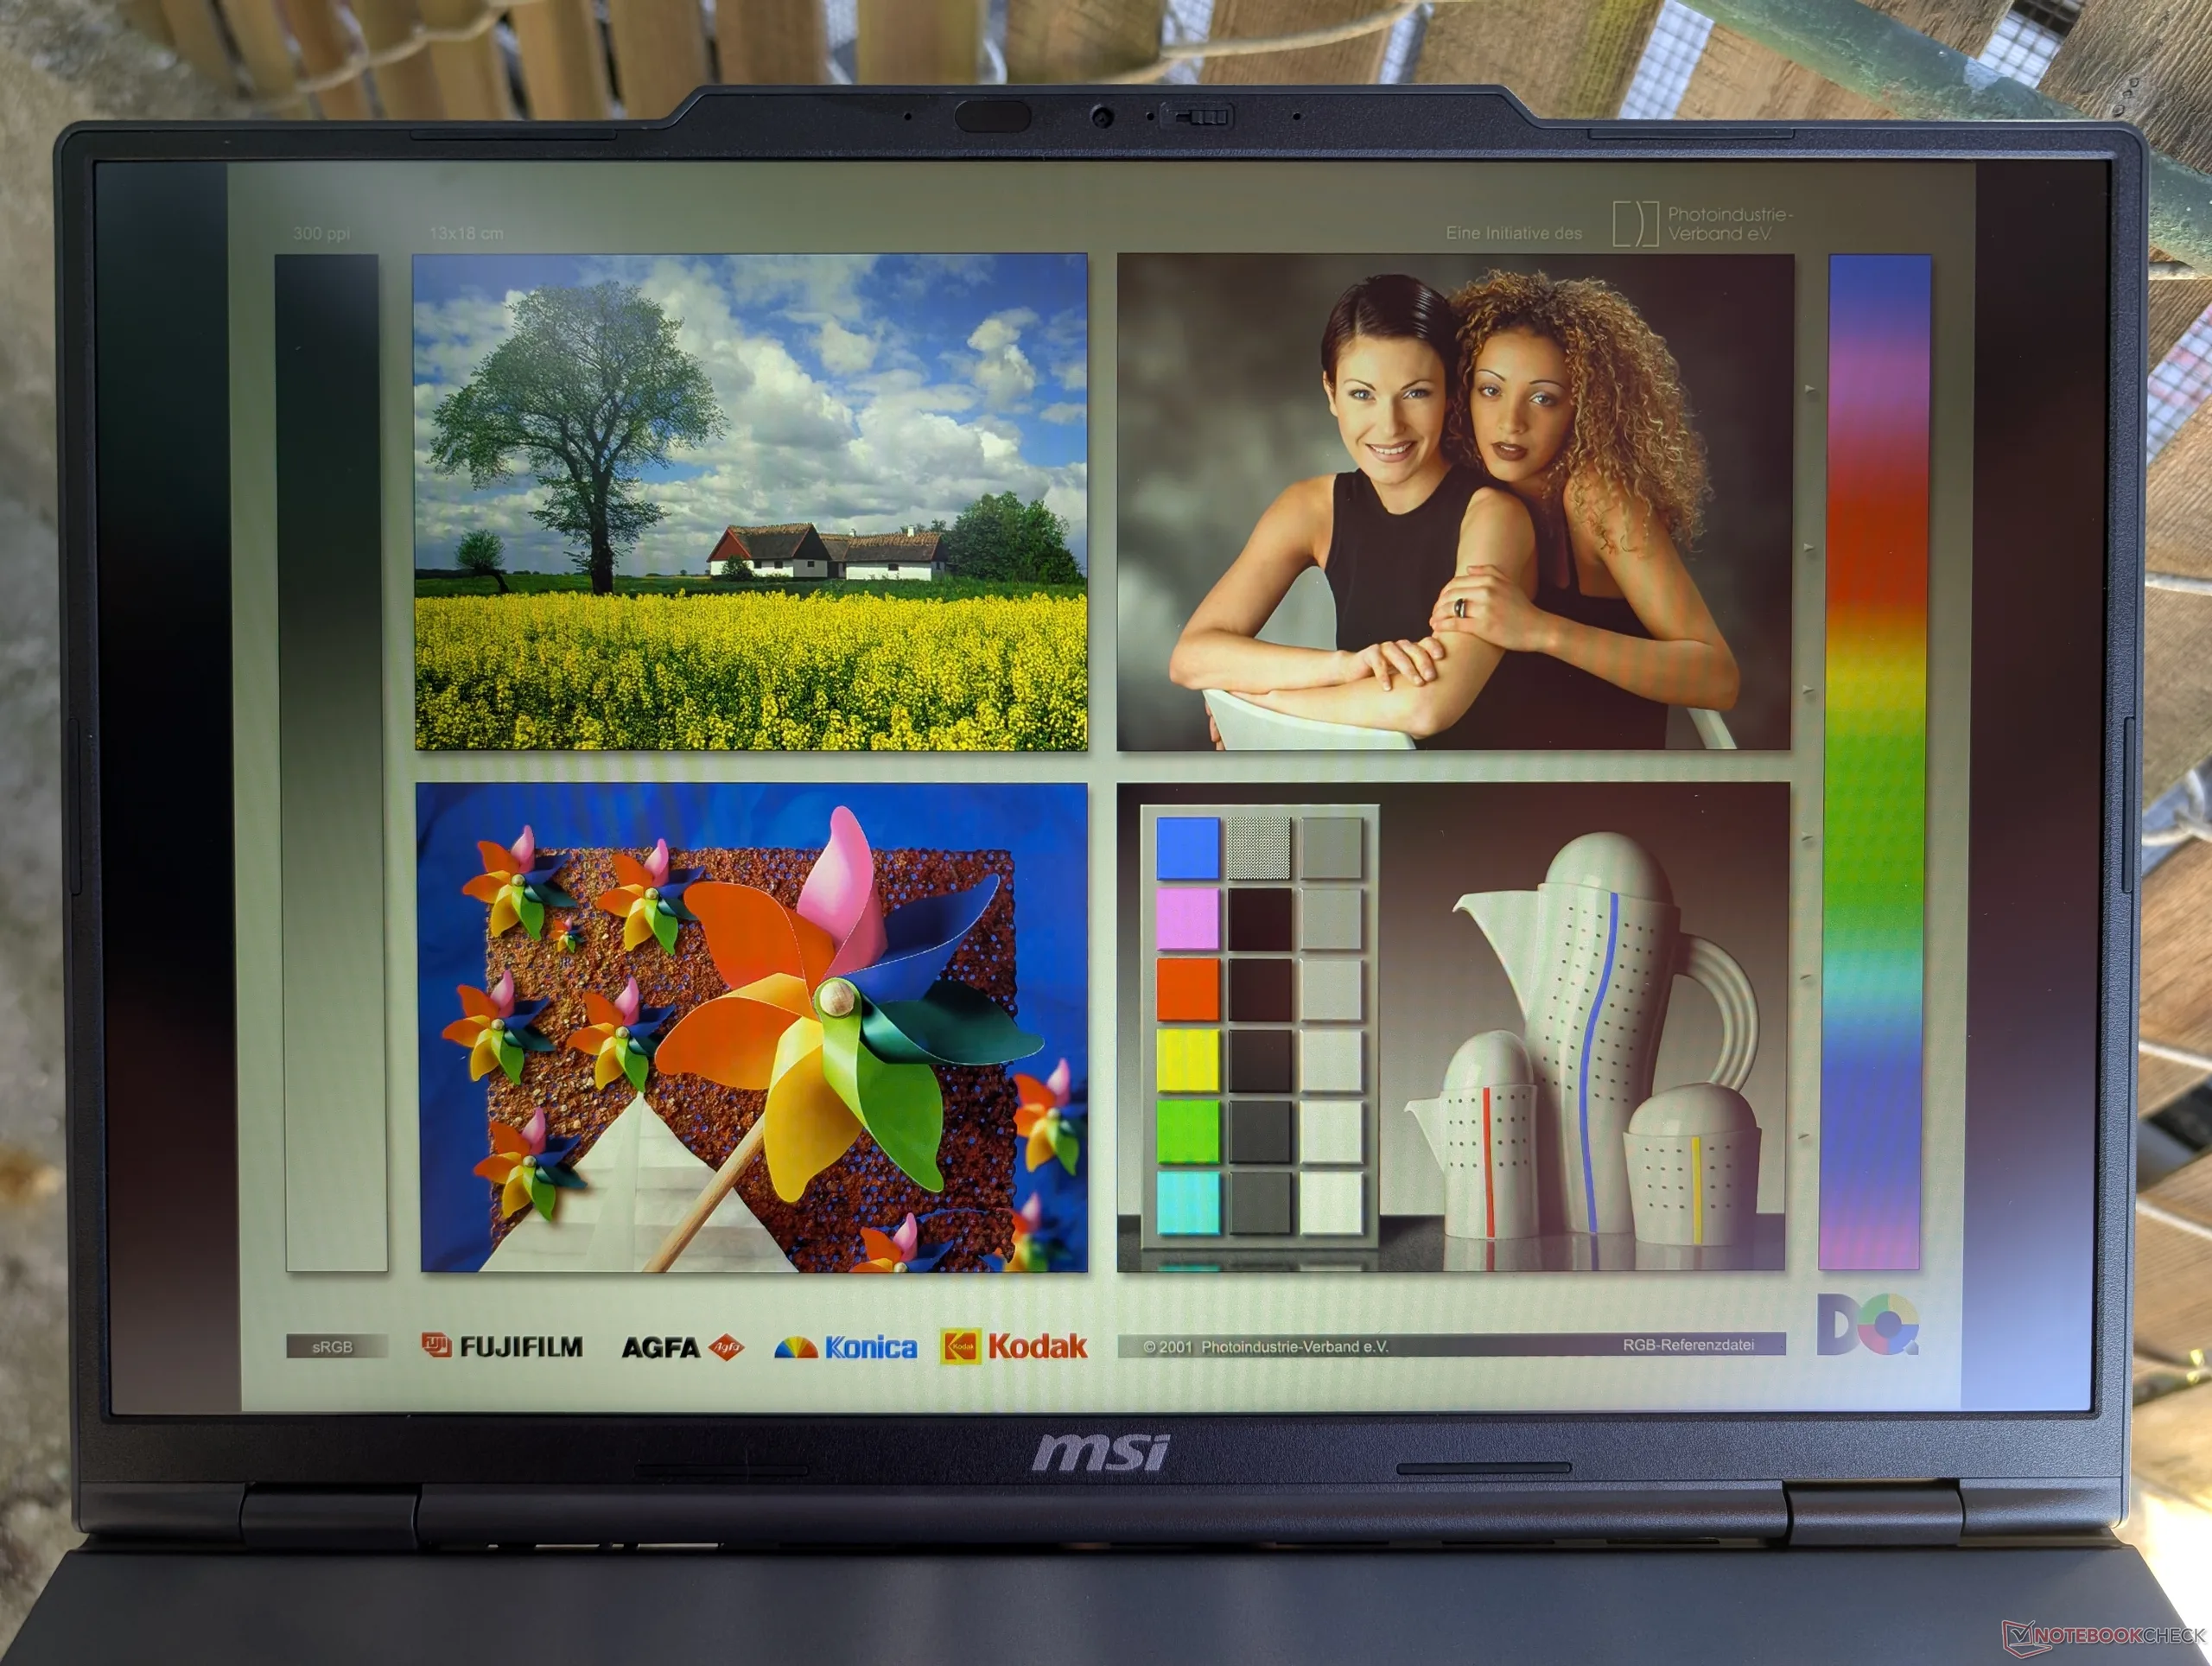
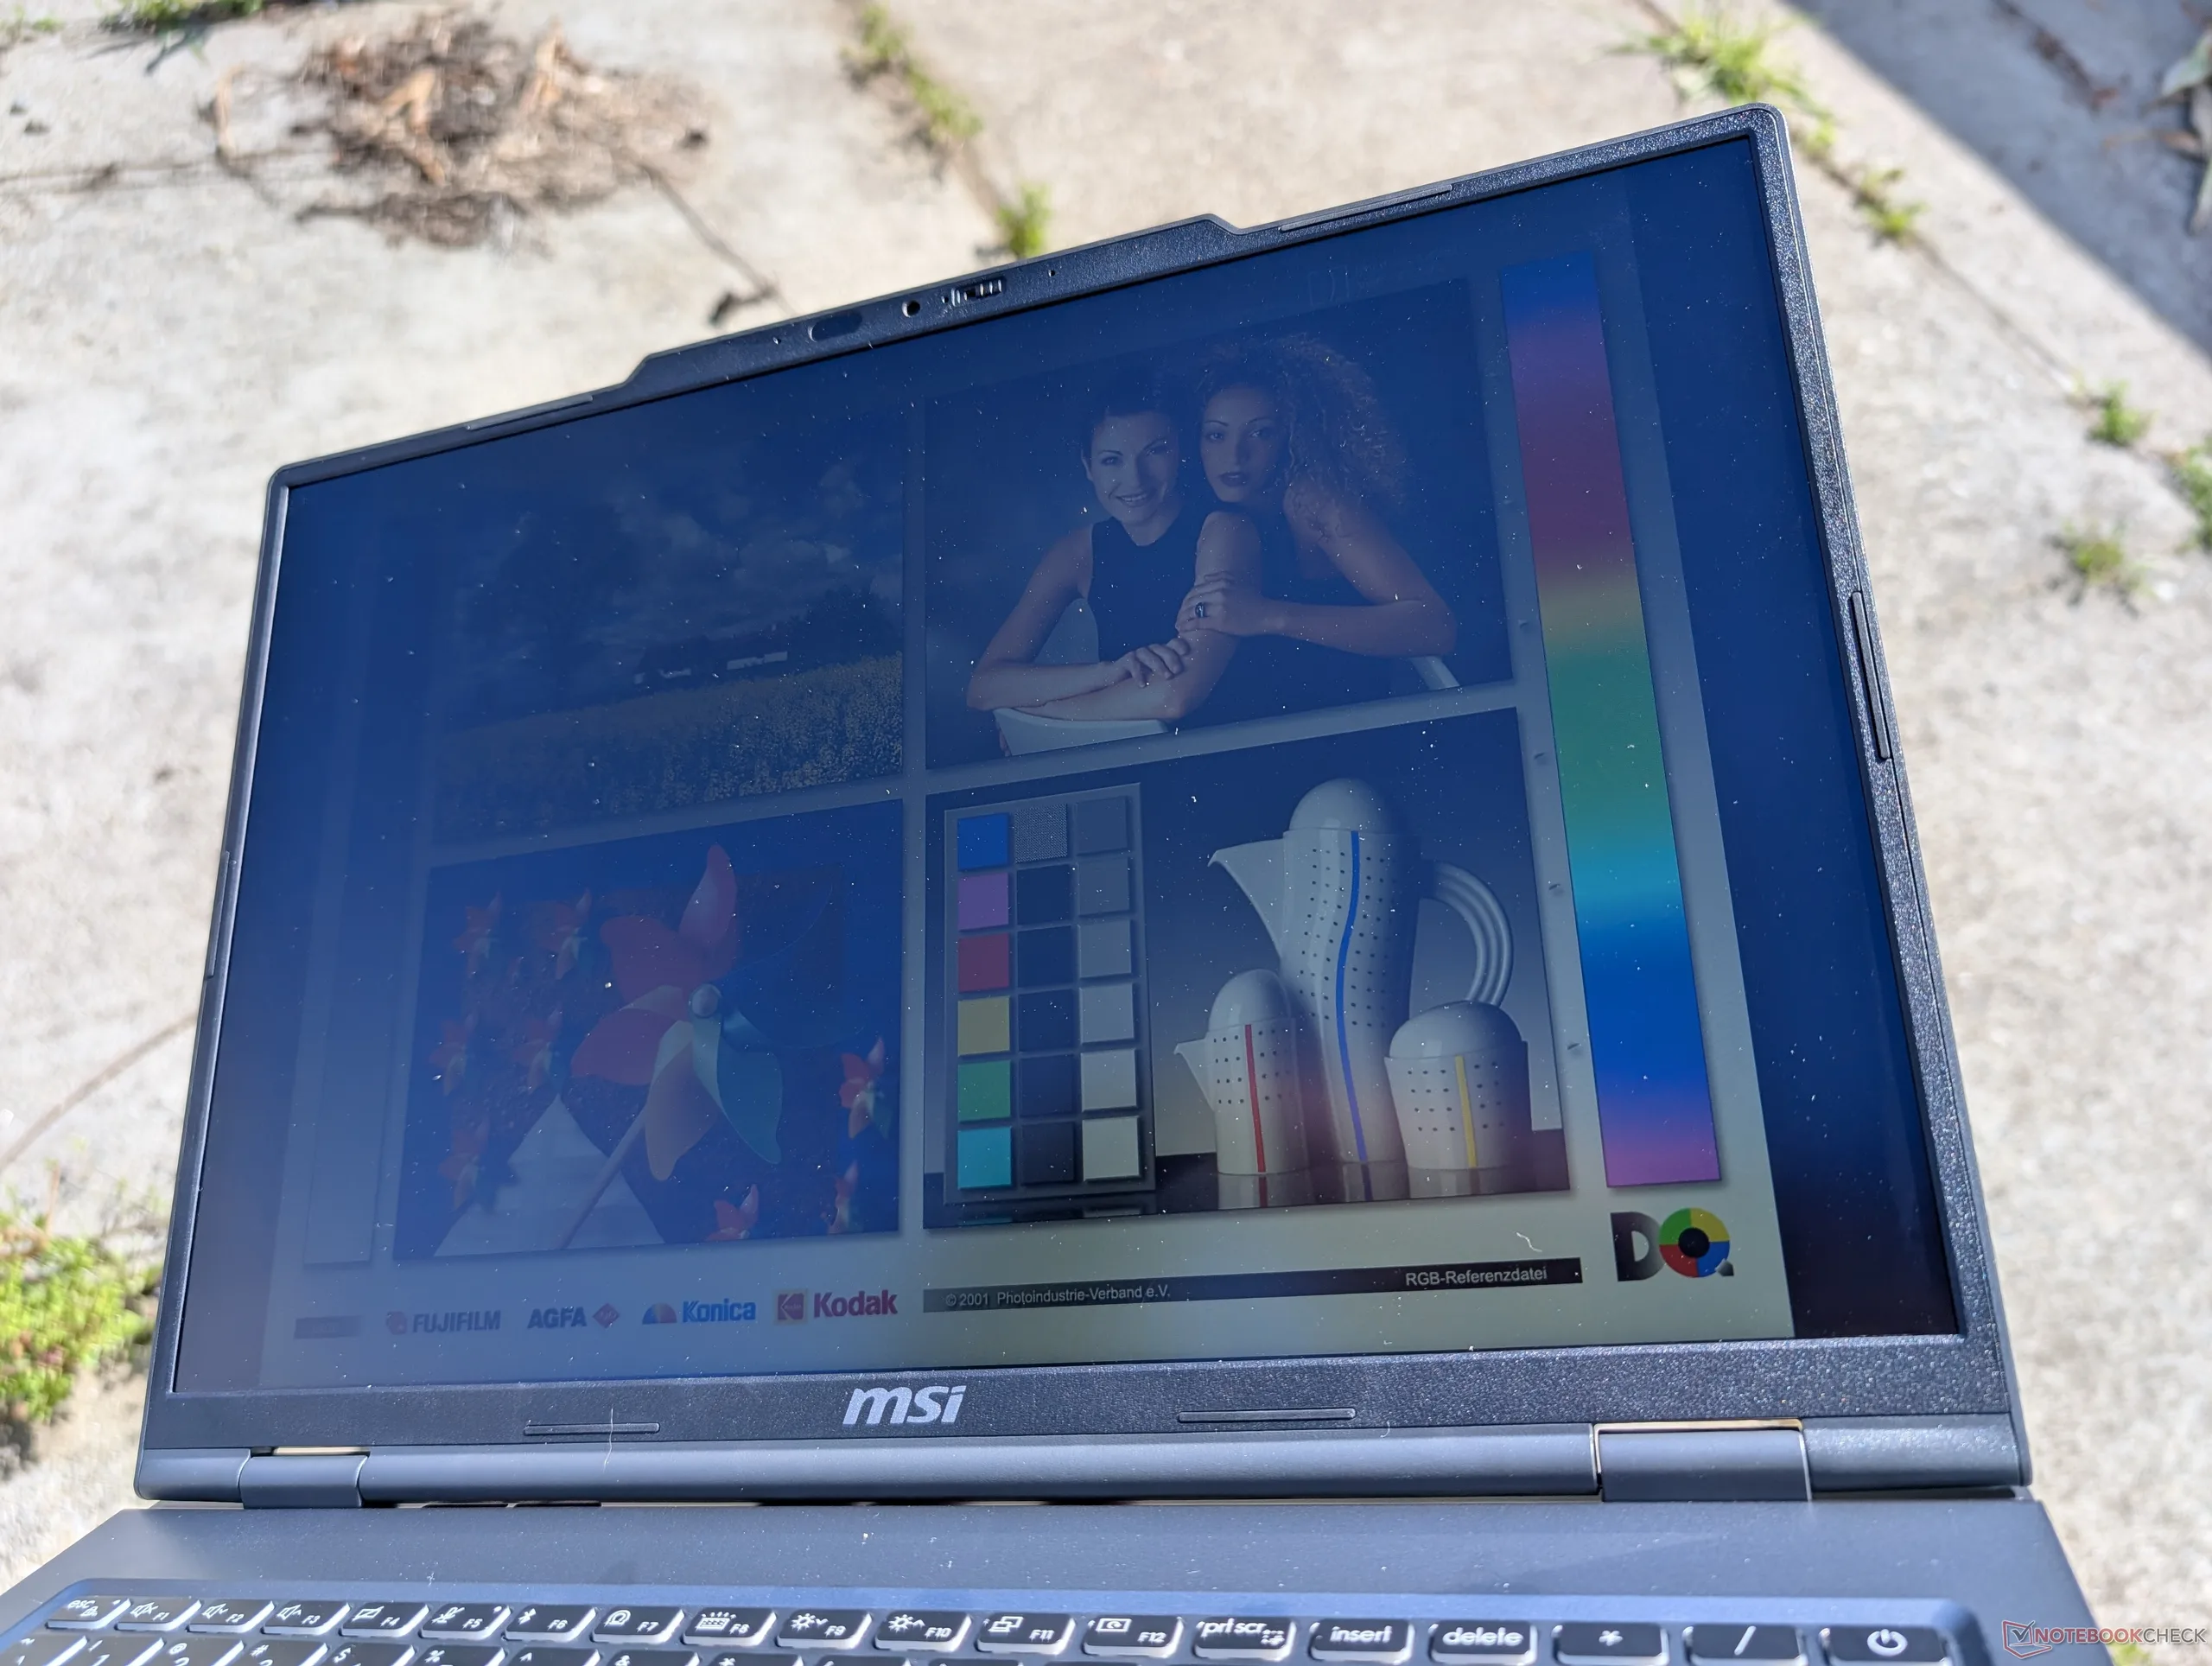
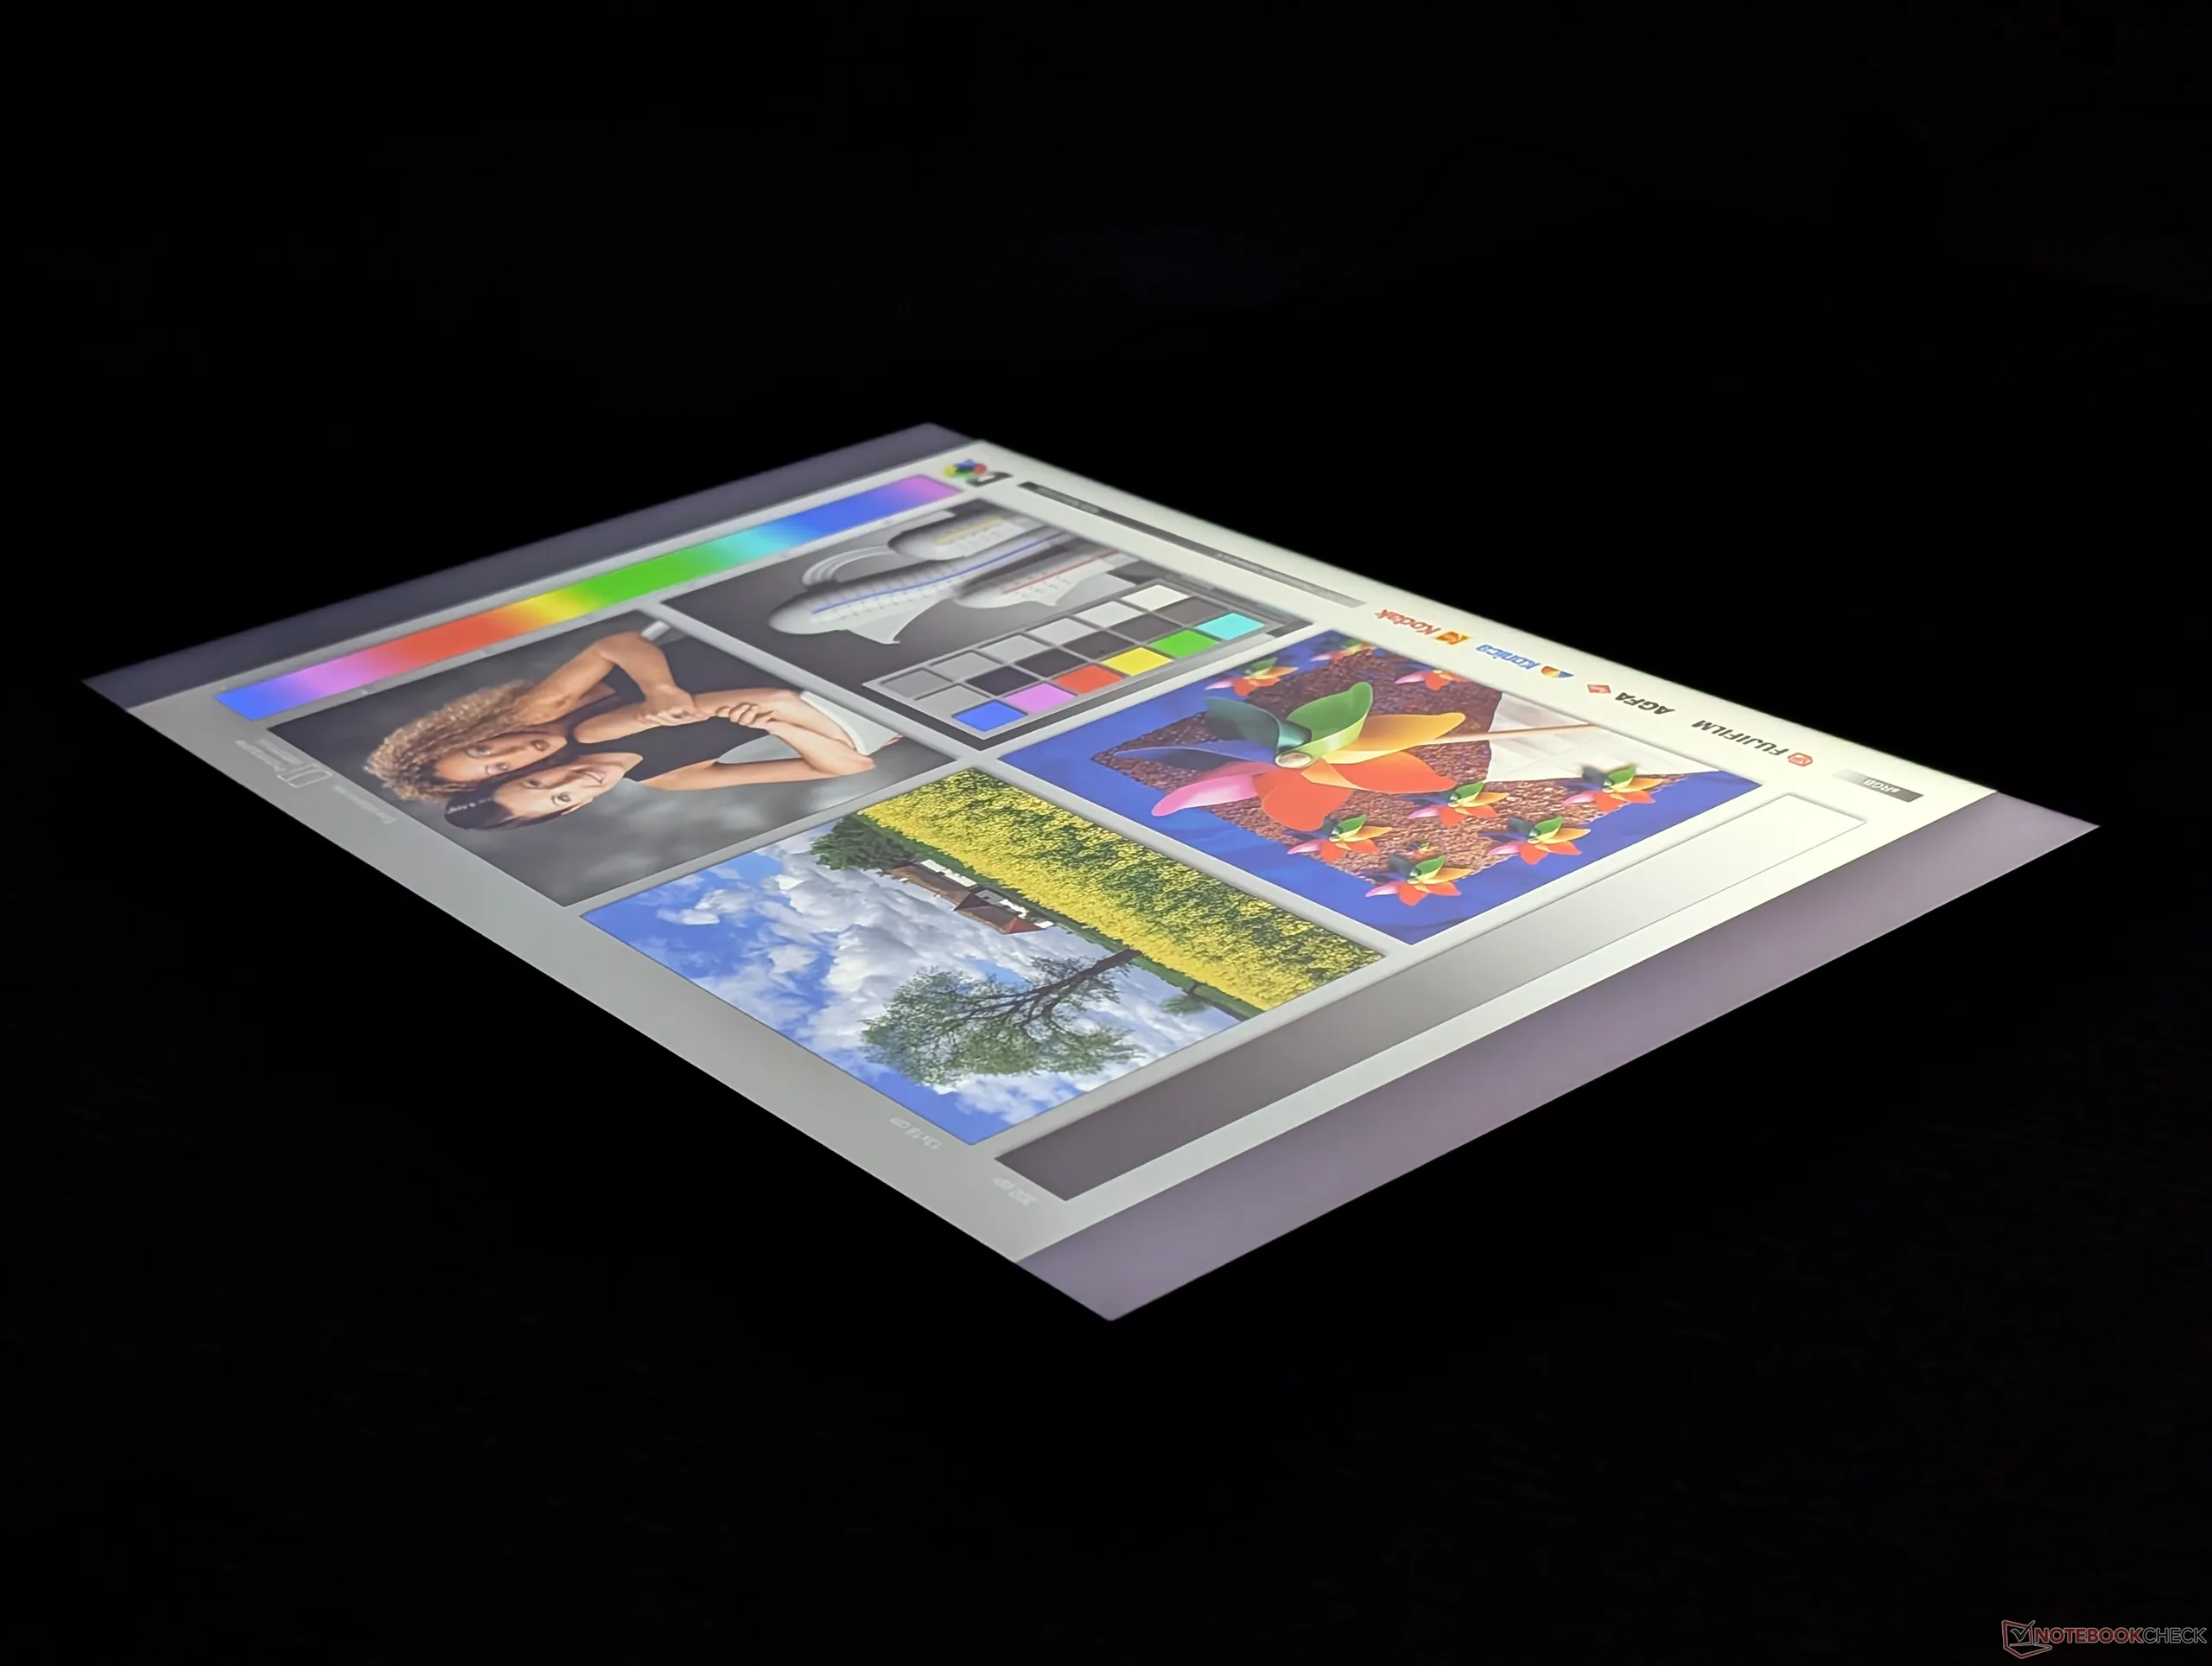
Display
Two display options are available as follows:
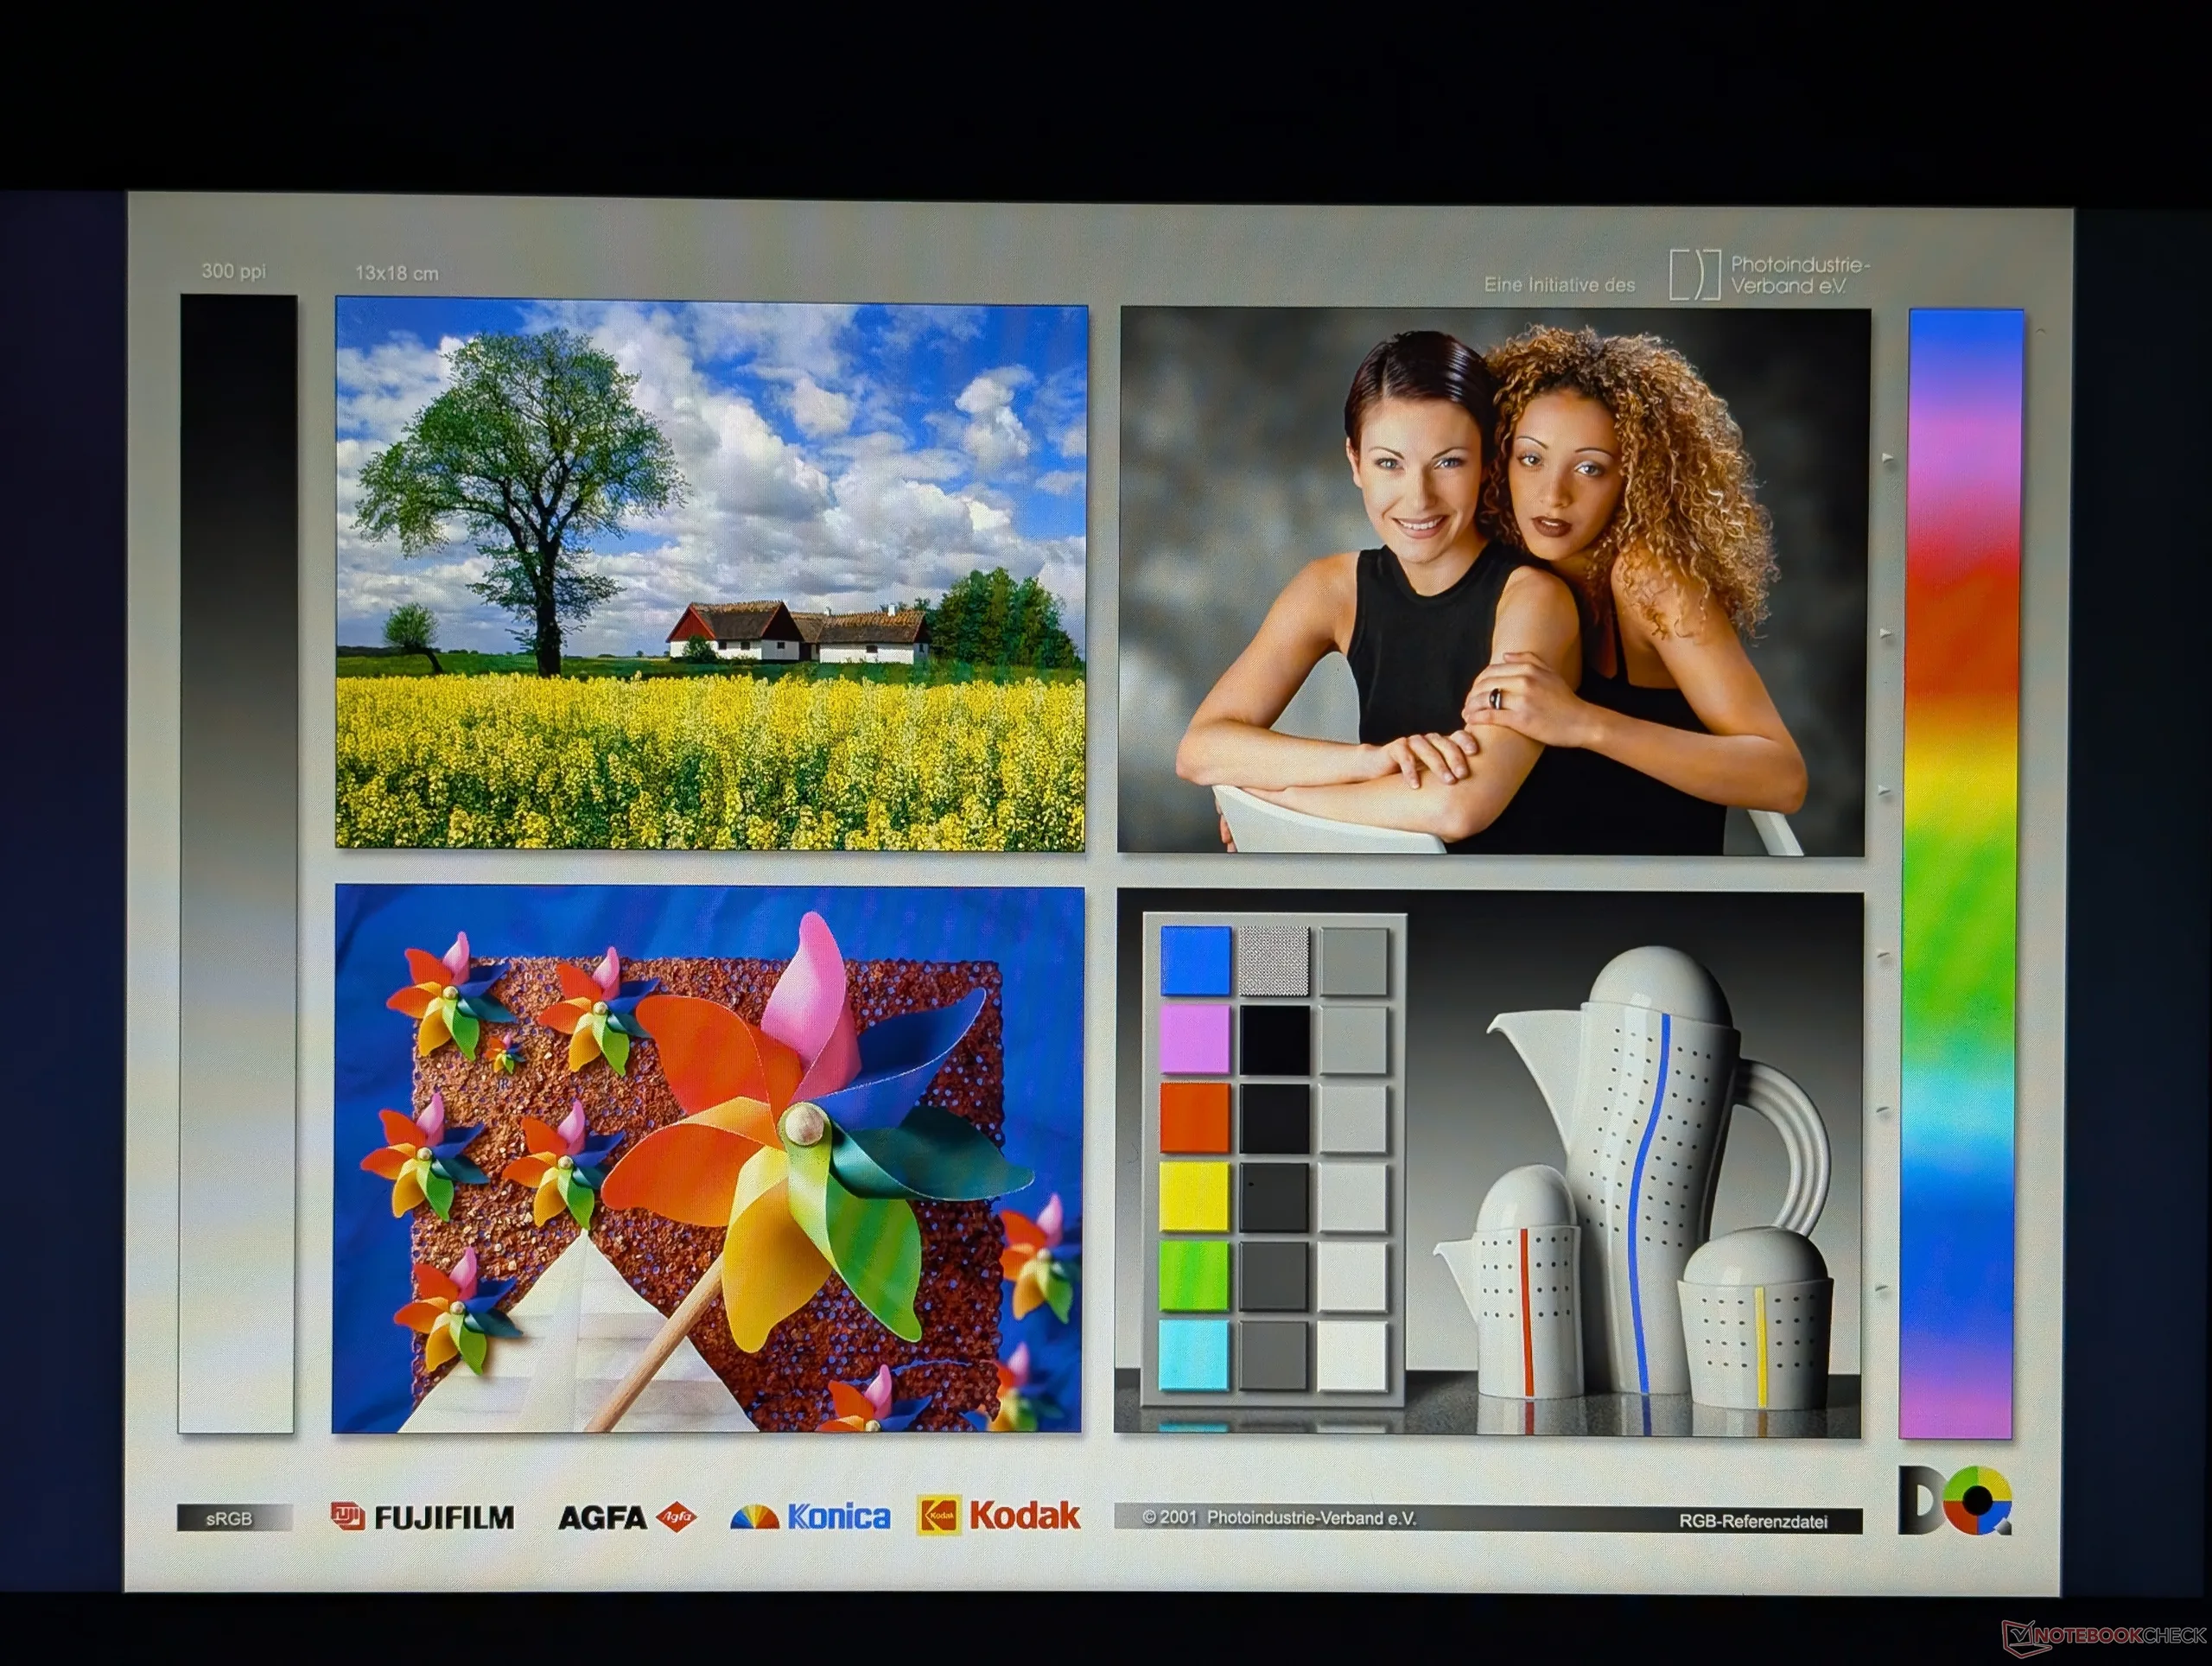
- 1920 x 1200, IPS, 60% sRGB, 60 Hz, touchscreen
- 2048 x 1280, OLED, 100% DCI-P3, 120 Hz, non-touch
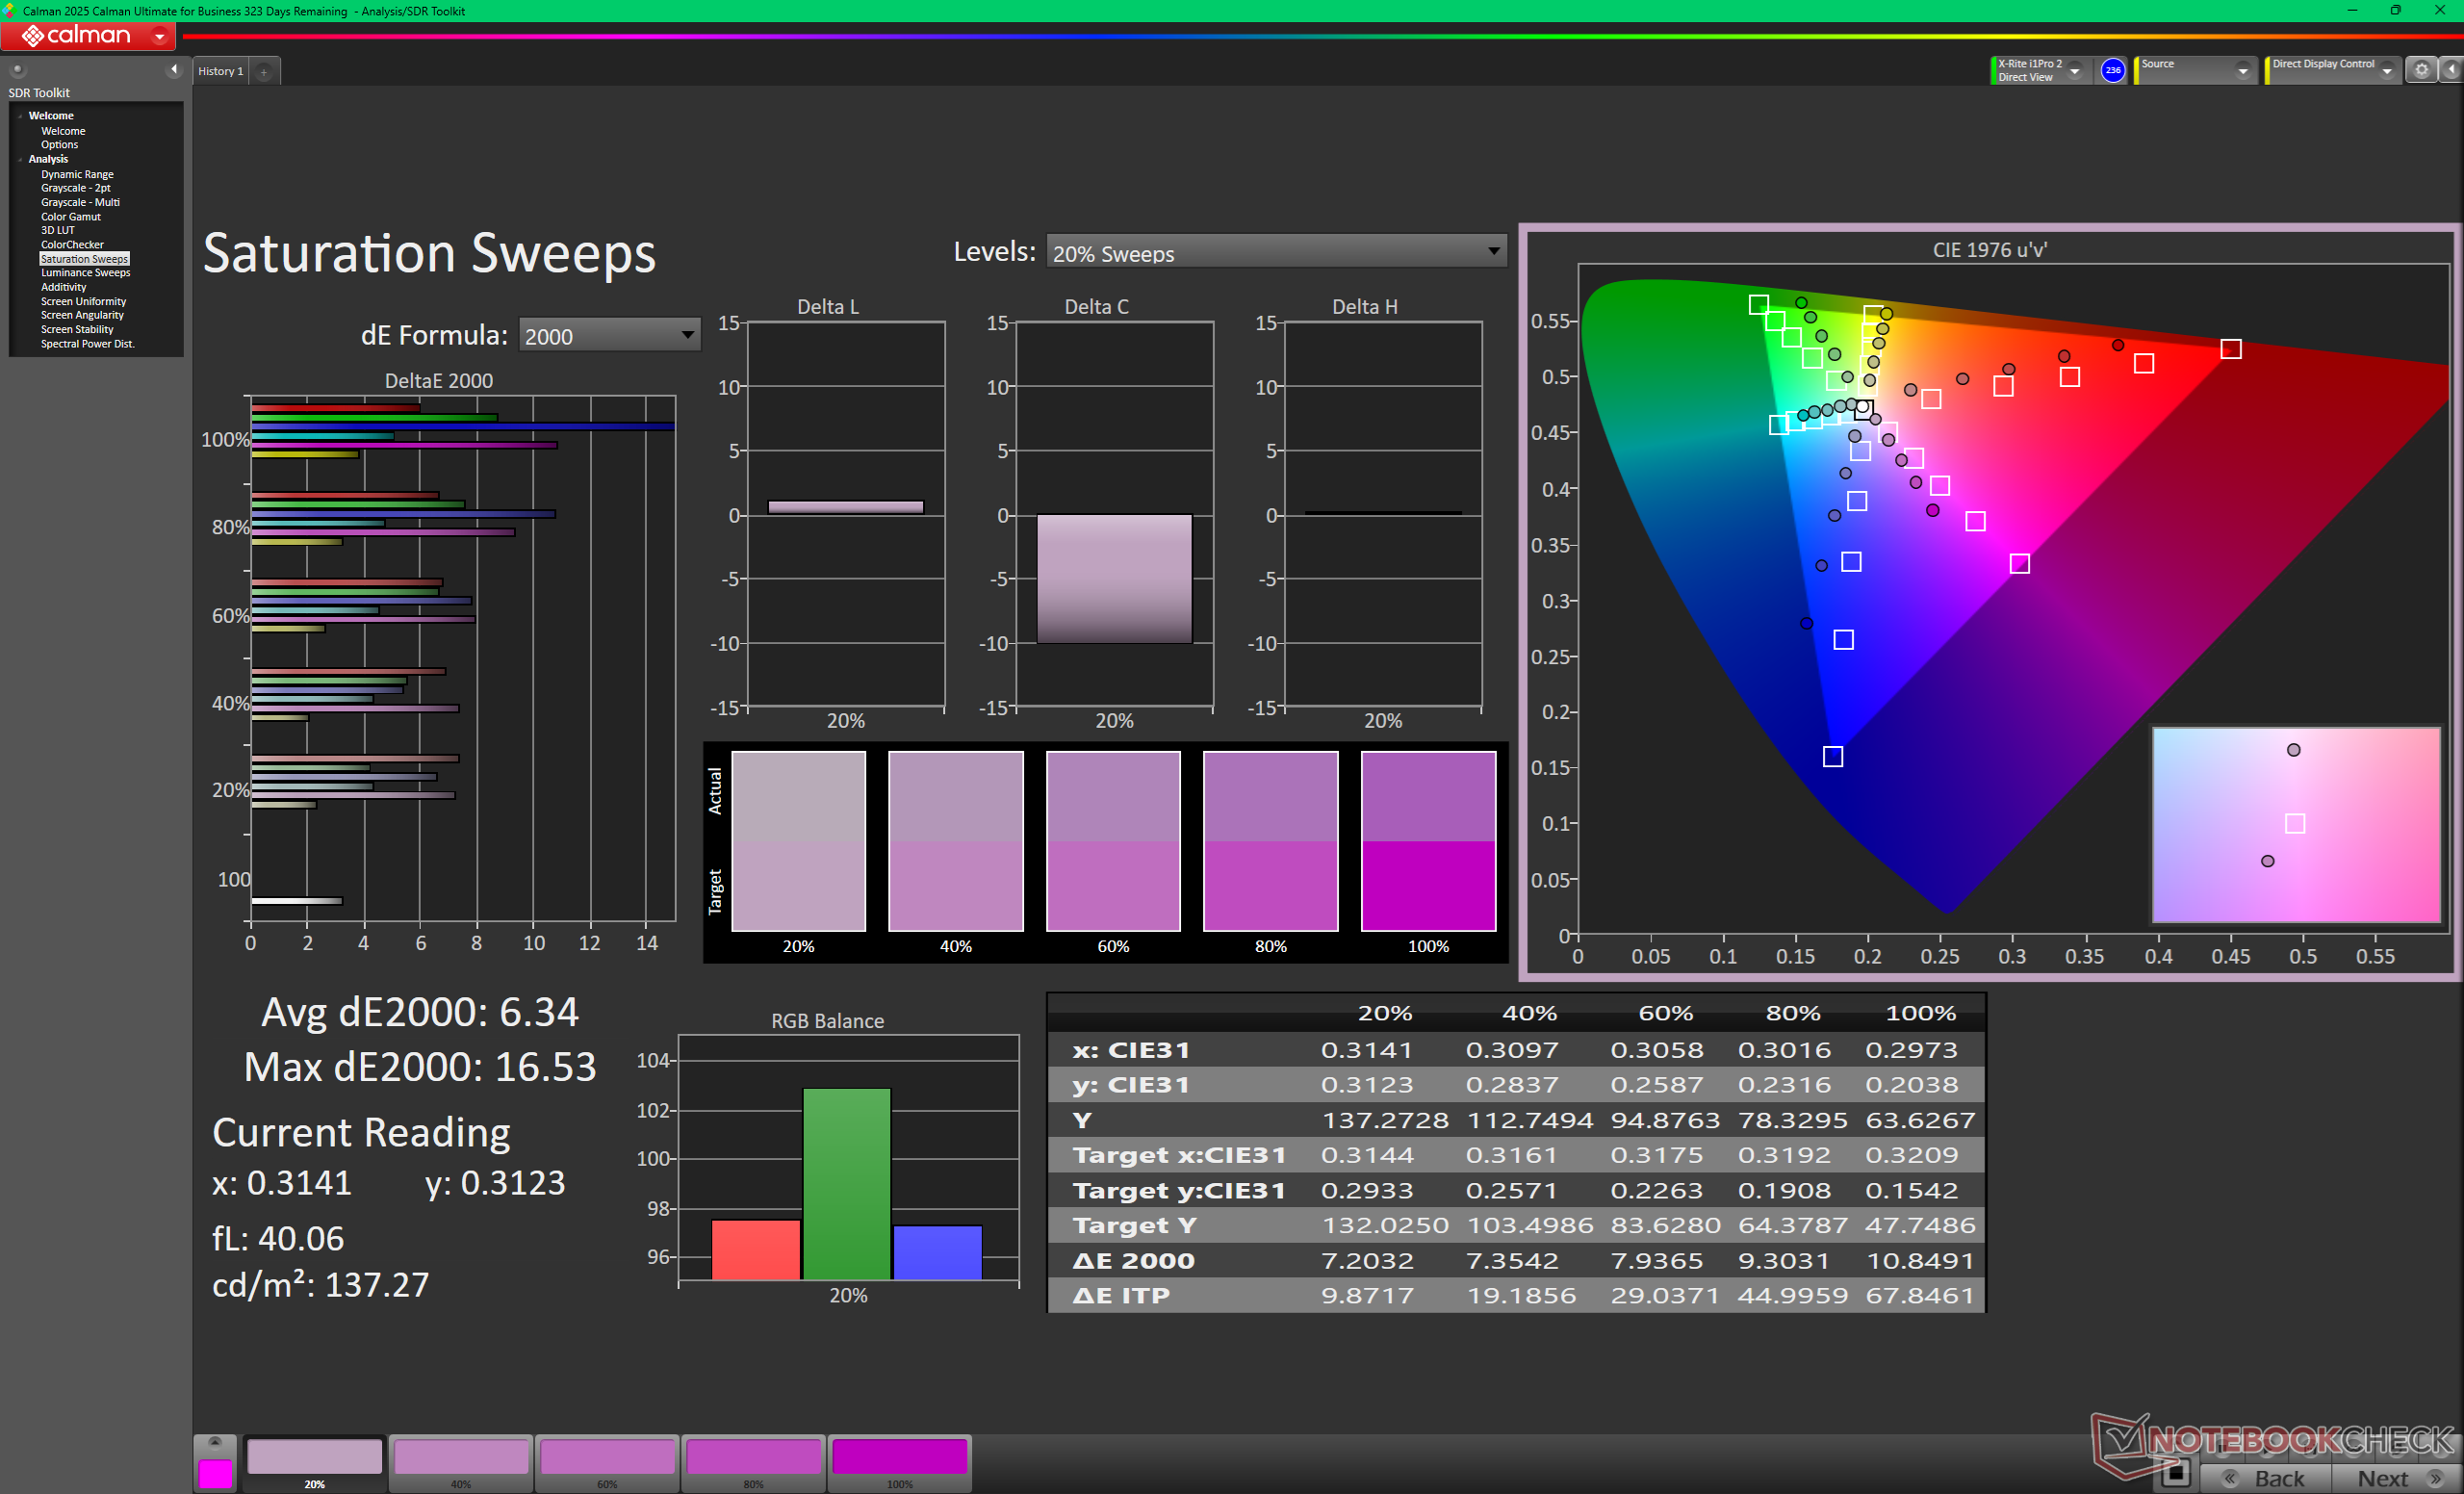
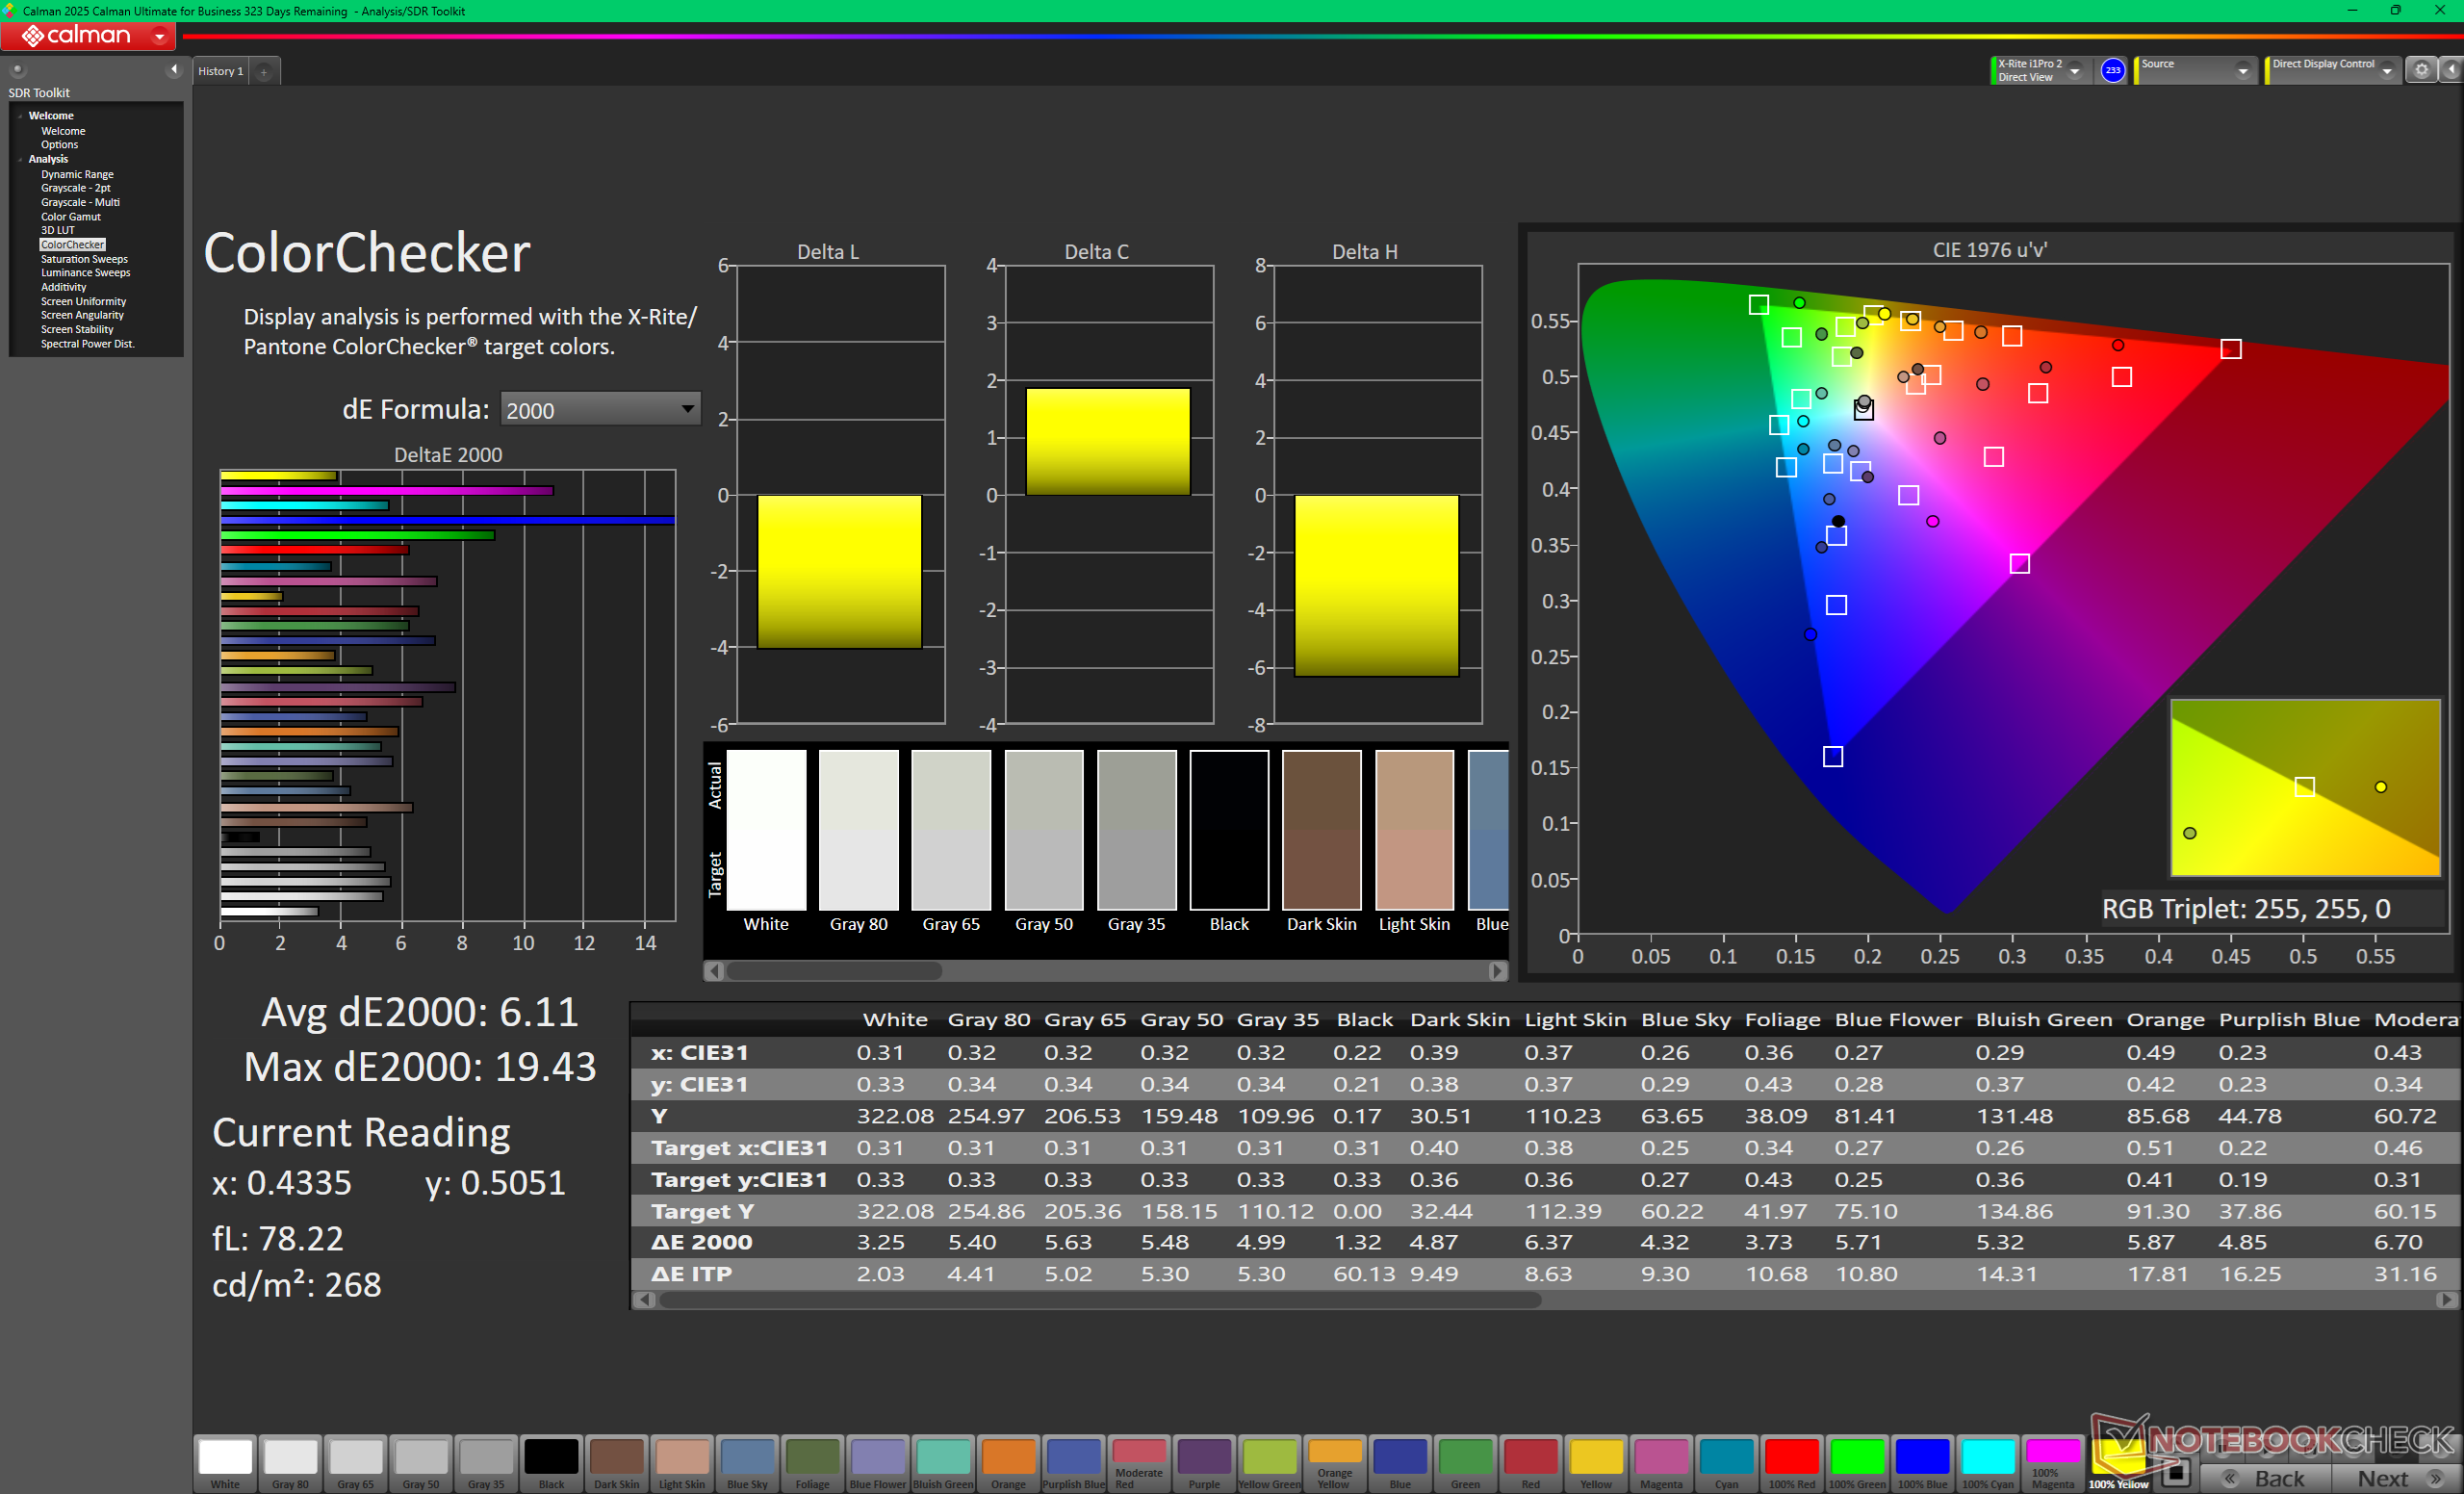
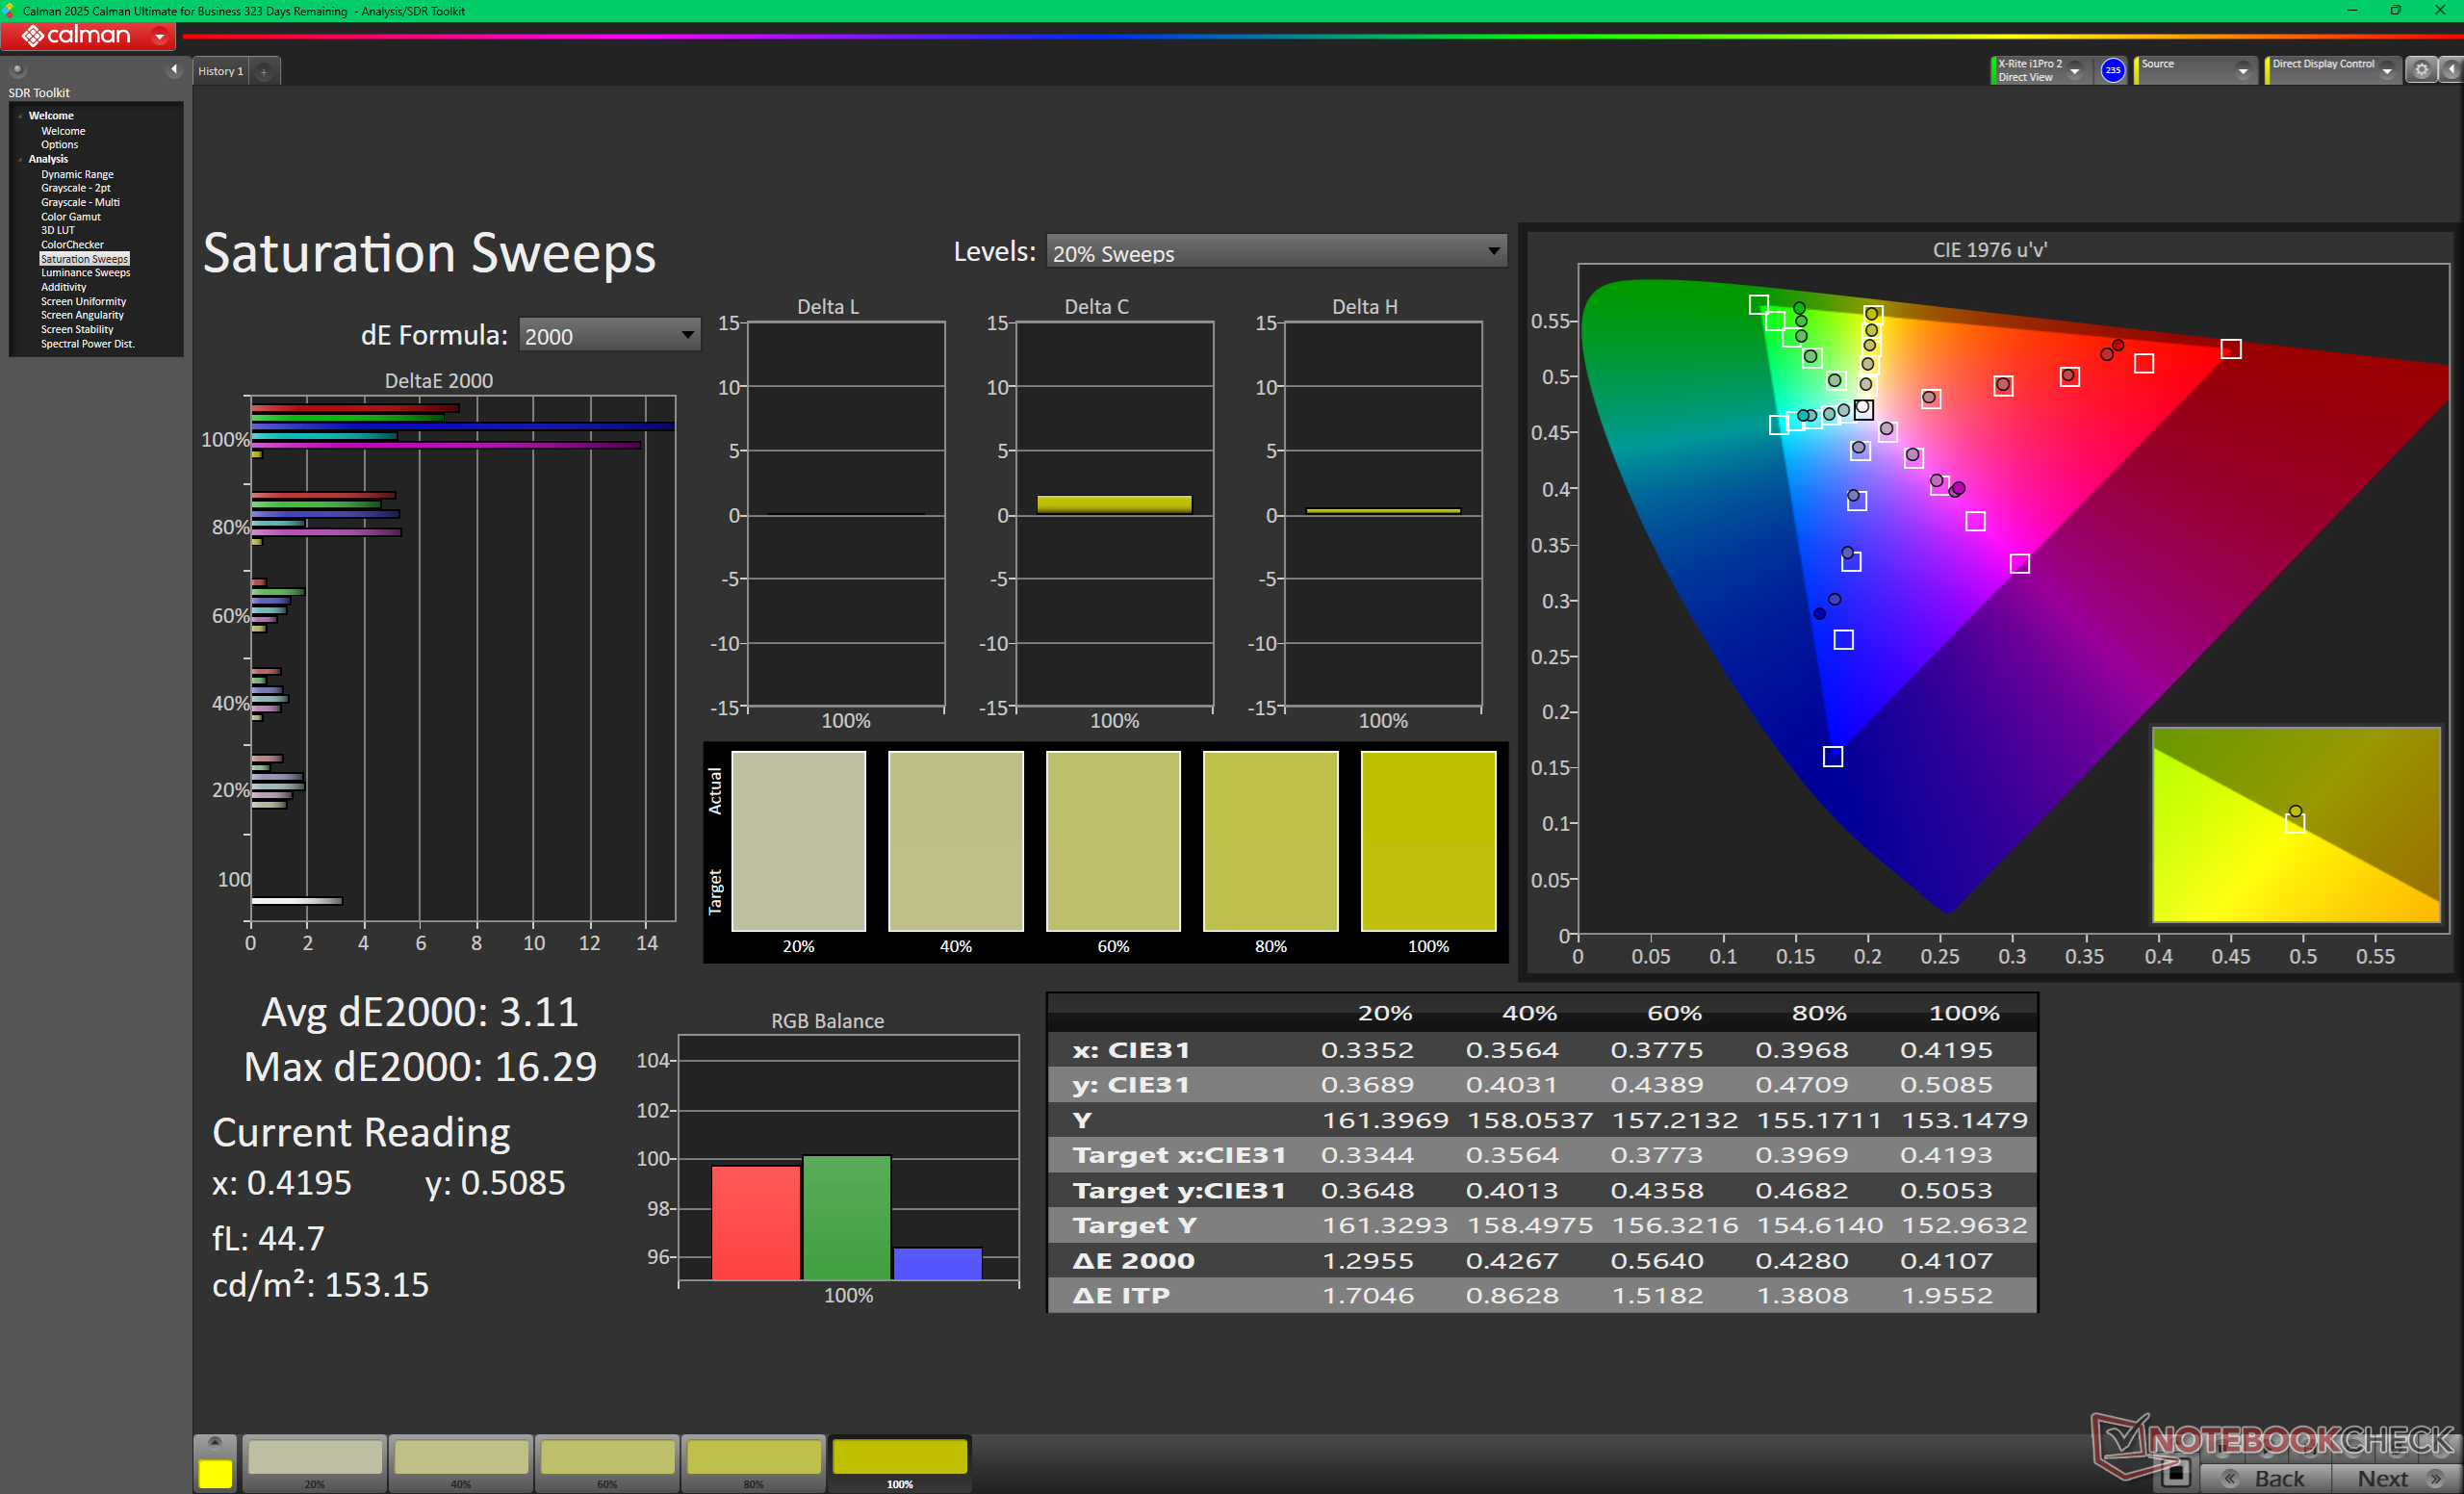
The base option lacks sRGB coverage and is limited to a 60 Hz refresh rate in contrast to the far superior OLED option. Contrast is otherwise pretty good for an IPS panel at over 1500:1.

| |||||||||||||||||||||||||
Brightness Distribution: 91 %
Center on Battery: 321.7 cd/m²
Contrast: 1787:1 (Black: 0.18 cd/m²)
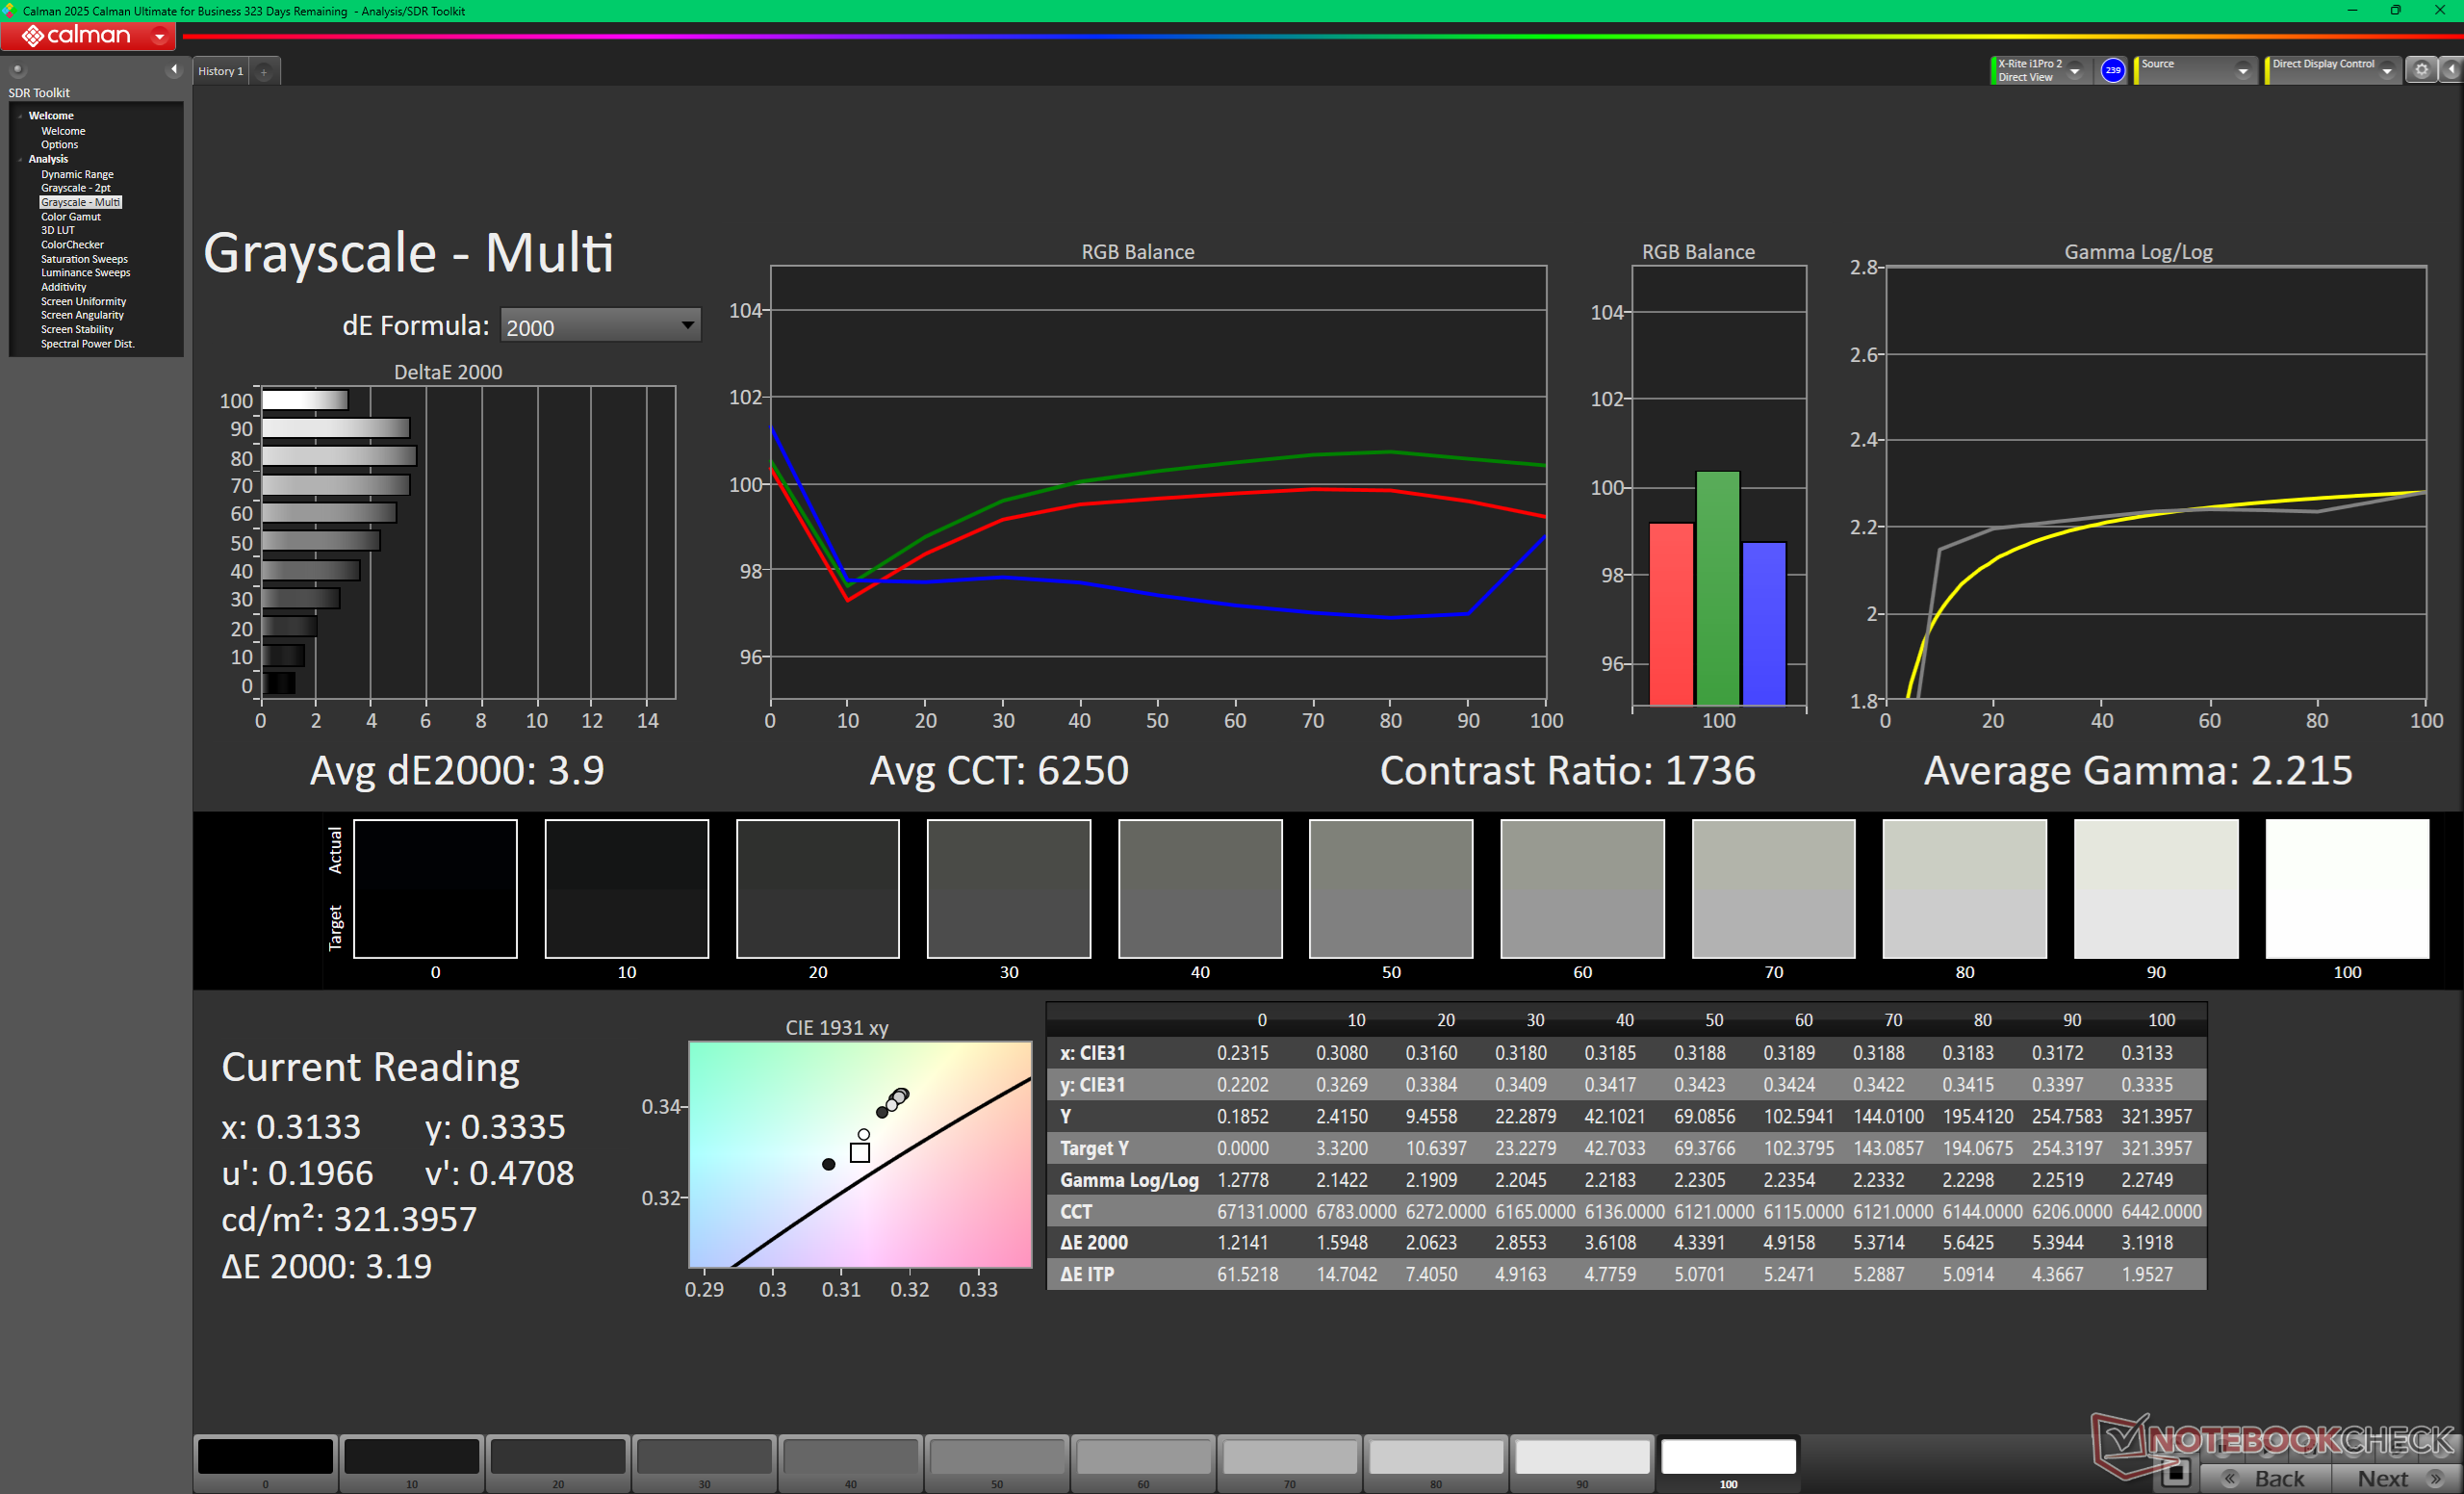
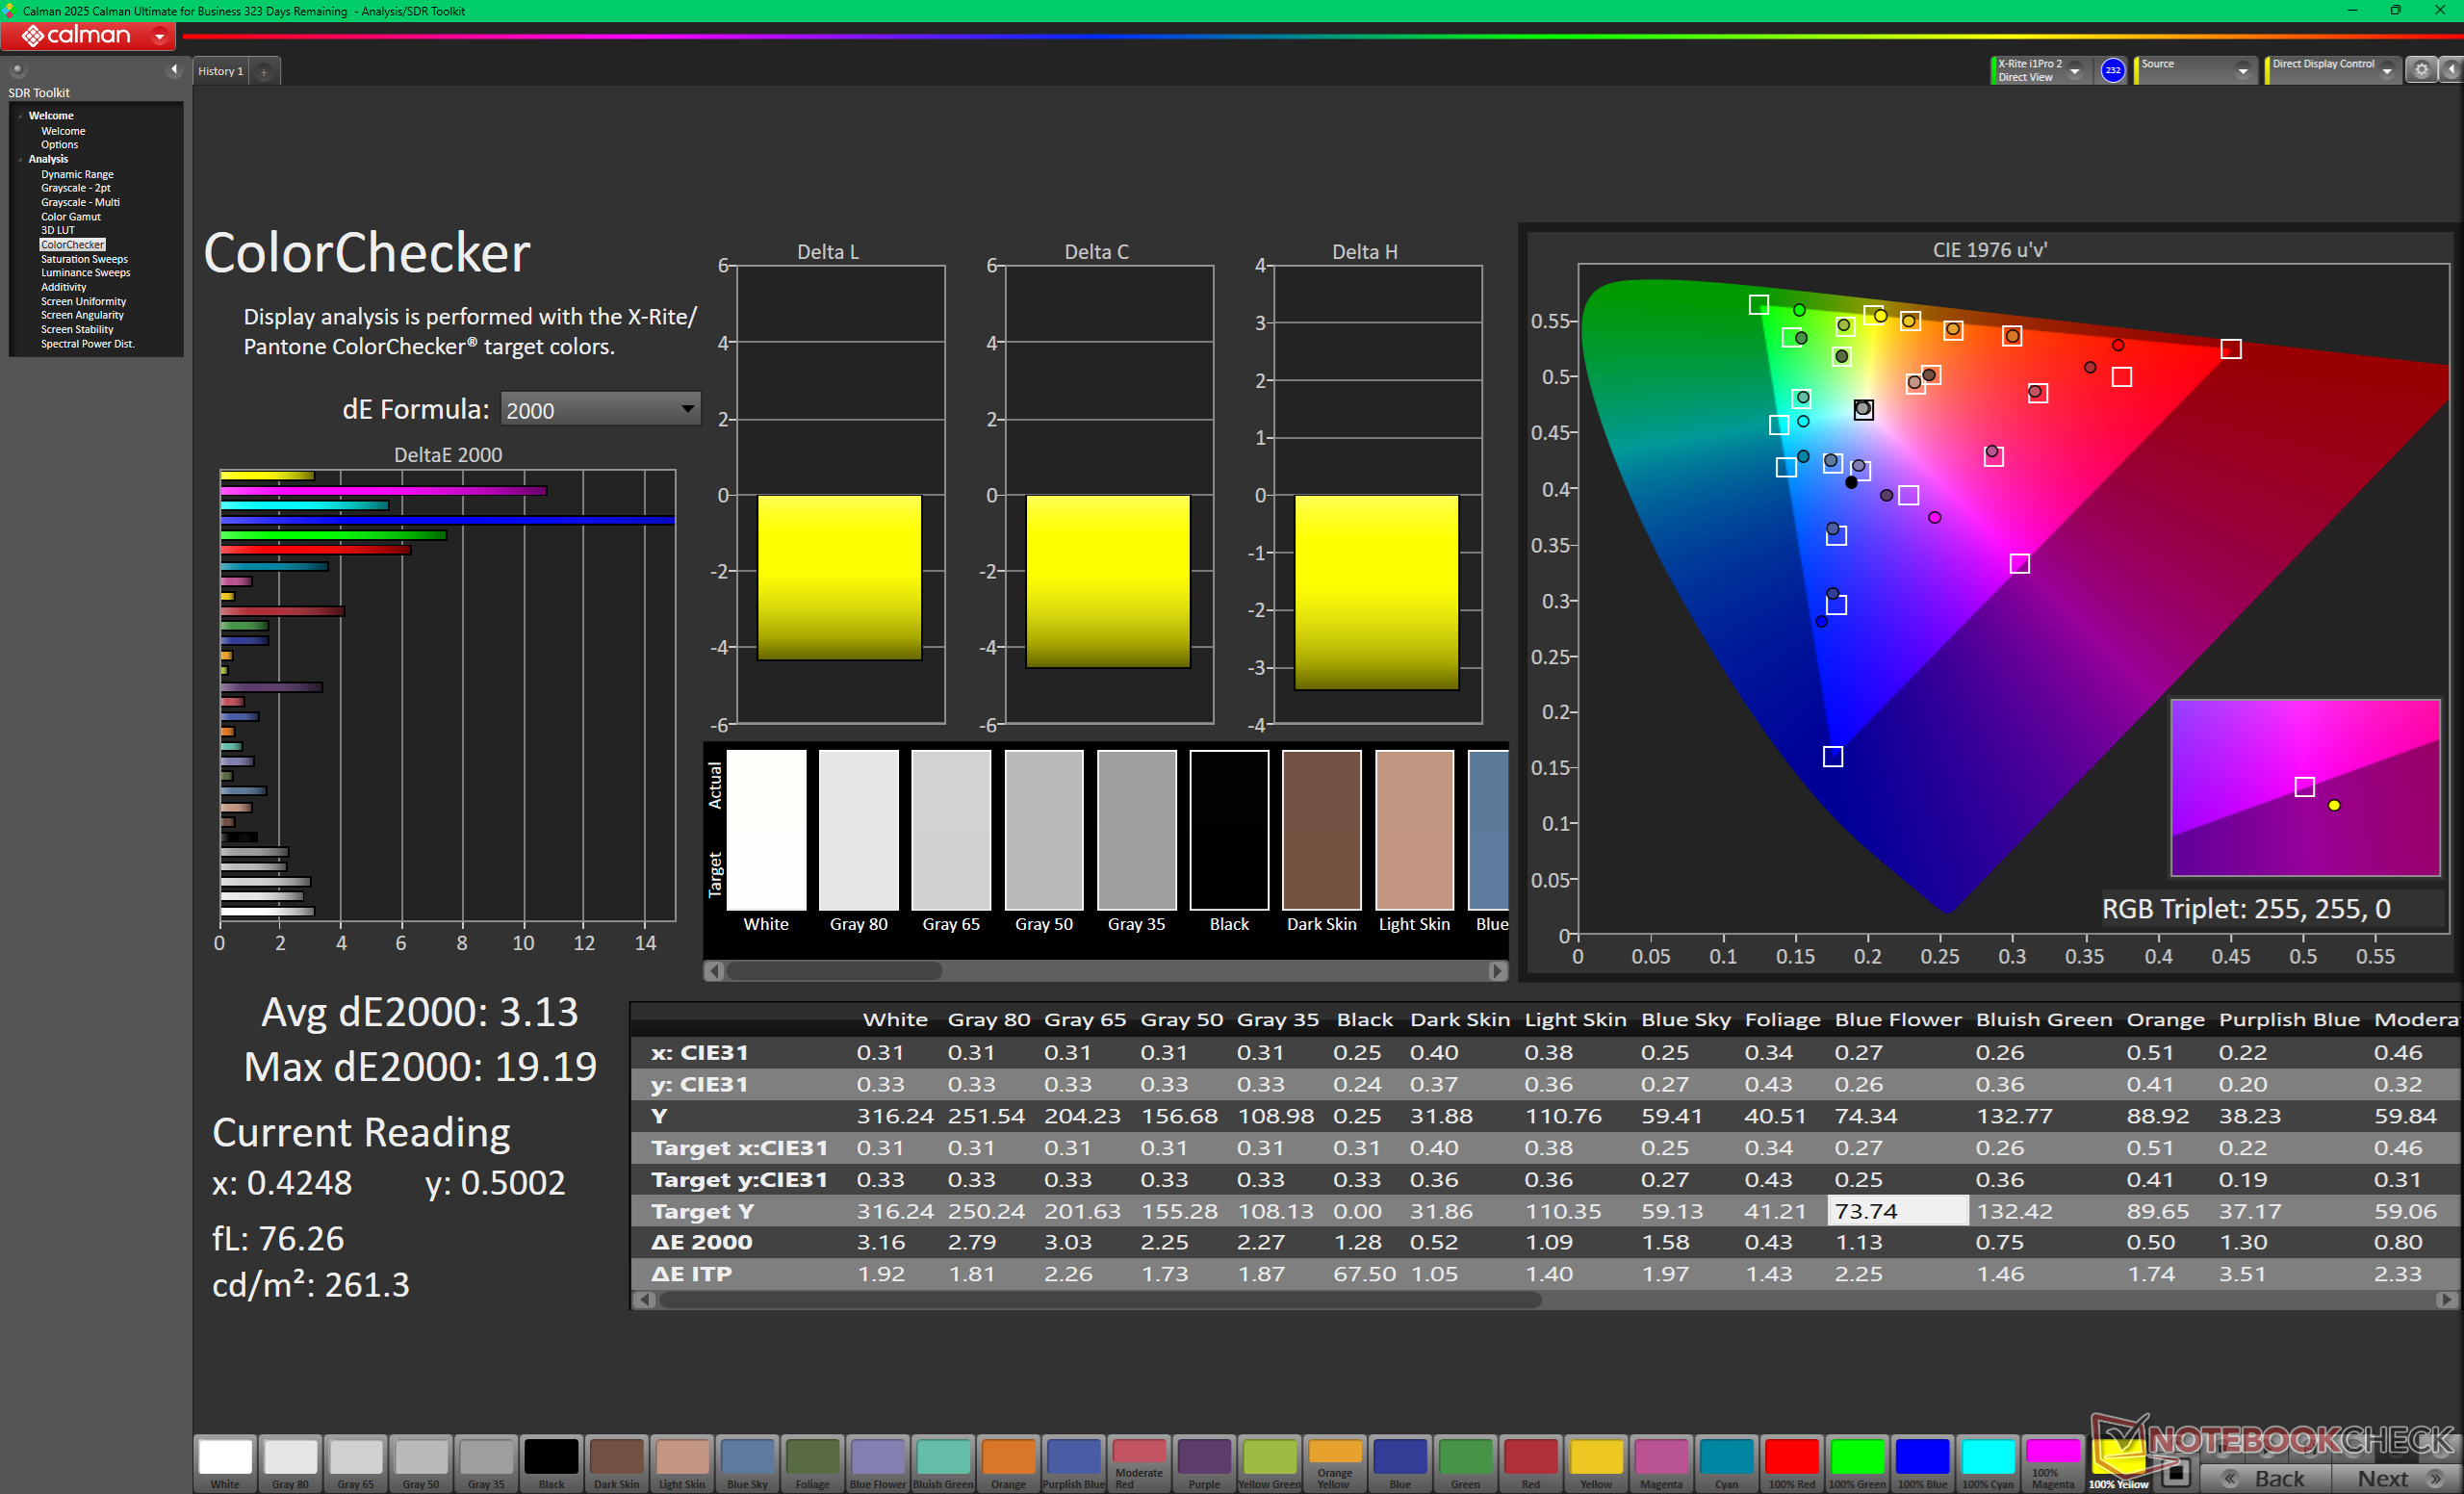
ΔE ColorChecker Calman: 6.11 | ∀{0.5-29.43 Ø4.72}
calibrated: 3.13
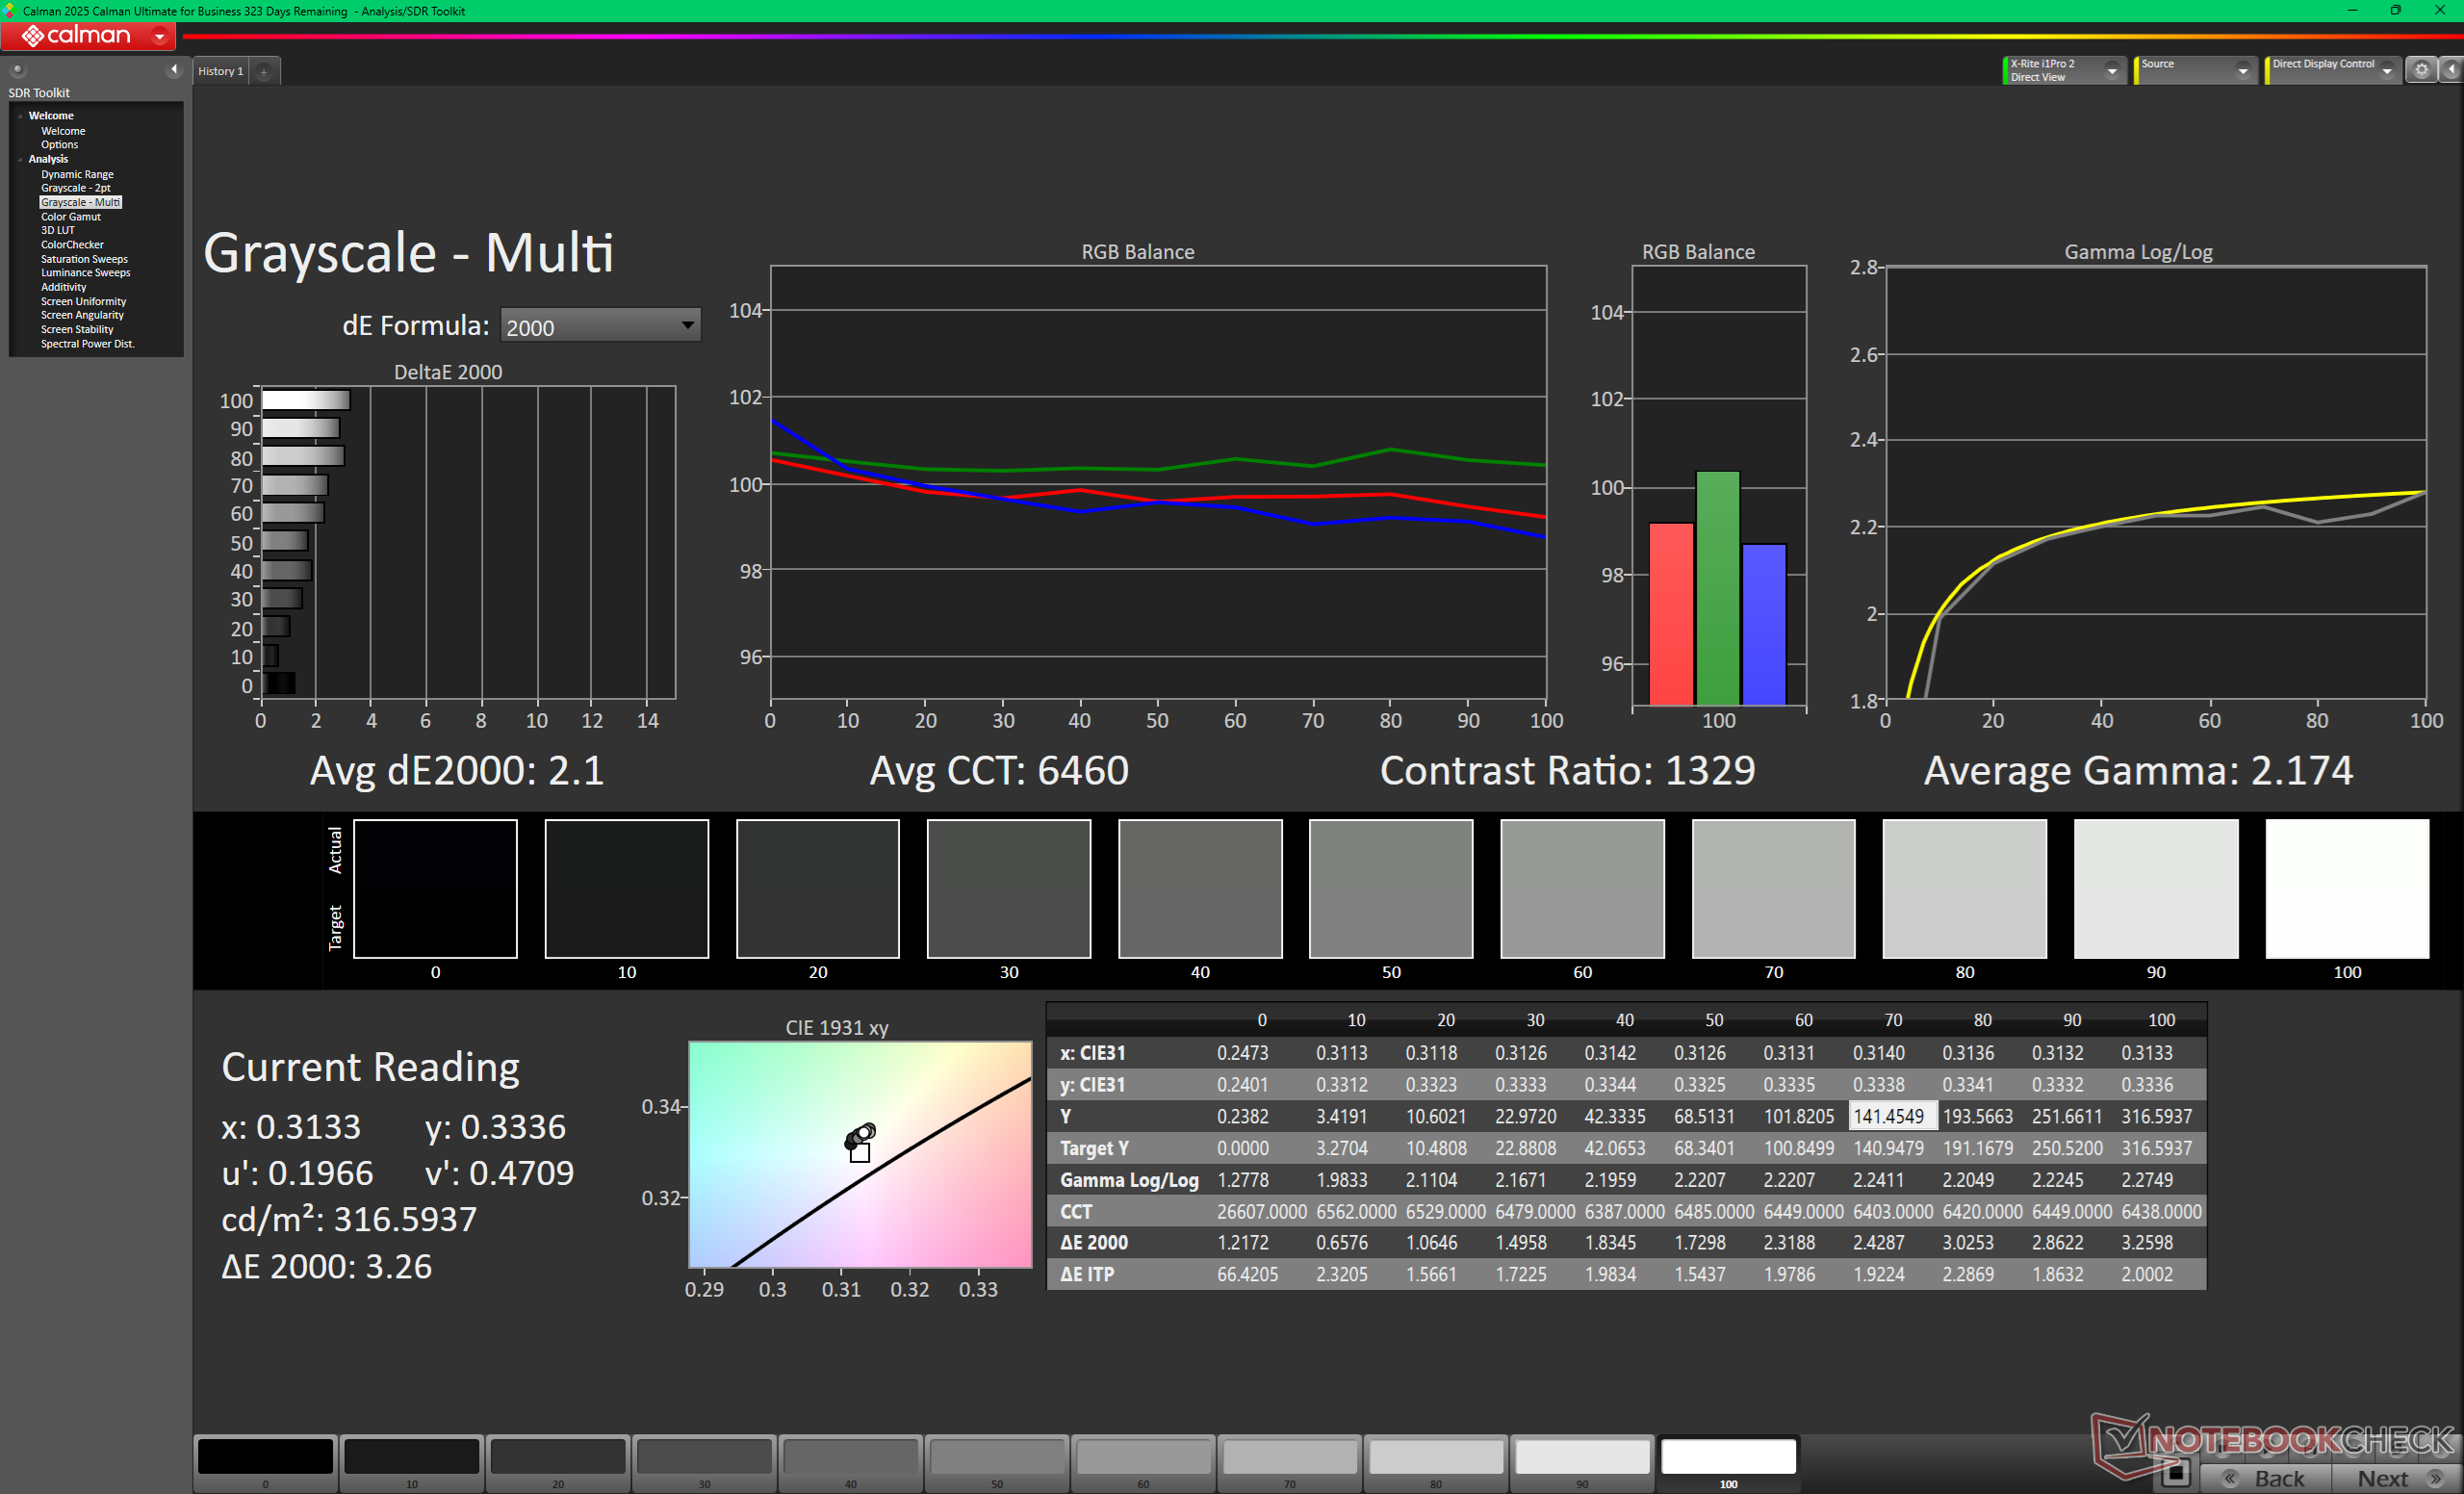
ΔE Greyscale Calman: 3.9 | ∀{0.09-98 Ø4.97}
40.7% AdobeRGB 1998 (Argyll 3D)
57.4% sRGB (Argyll 3D)
39.4% Display P3 (Argyll 3D)
Gamma: 2.22
CCT: 6250 K
| MSI Venture 16 AI A2HMTG BOE0D3E, IPS, 1920x1200, 16", 60 Hz | MSI Prestige 16 B1MG-001US AU Optronics B160QAN03.R, IPS, 2560x1600, 16", 60 Hz | Dell 16 Plus 2-in-1 AU Optronics B160QAT, Mini-LED, 2560x1600, 16", 90 Hz | Asus V16 V3607V MNG007QX2-2, IPS, 1920x1200, 16", 144 Hz | HP Pavilion 16-ag0057ng CMN1640, IPS, 1920x1200, 16", 60 Hz | Lenovo IdeaPad Slim 5 16AKP10 Lenovo LEN160WUM, IPS, 1920x1200, 16", 60 Hz | |
|---|---|---|---|---|---|---|
| Display | 109% | 119% | 4% | 7% | -1% | |
| Display P3 Coverage (%) | 39.4 | 96.7 145% | 99.5 153% | 40.9 4% | 41.6 6% | 39.1 -1% |
| sRGB Coverage (%) | 57.4 | 99.8 74% | 100 74% | 59.7 4% | 62.4 9% | 57.6 0% |
| AdobeRGB 1998 Coverage (%) | 40.7 | 84.6 108% | 94.2 131% | 42.2 4% | 43 6% | 40.4 -1% |
| Response Times | -85% | -148% | 13% | -14% | -16% | |
| Response Time Grey 50% / Grey 80% * (ms) | 26.7 ? | 49.4 ? -85% | 48.8 ? -83% | 22.9 ? 14% | 30.7 ? -15% | 31.9 ? -19% |
| Response Time Black / White * (ms) | 18.4 ? | 33.9 ? -84% | 57.6 ? -213% | 16.1 ? 12% | 20.8 ? -13% | 20.6 ? -12% |
| PWM Frequency (Hz) | 2807 ? | |||||
| PWM Amplitude * (%) | 50 | |||||
| Screen | 18% | 49% | -27% | 0% | -13% | |
| Brightness middle (cd/m²) | 321.7 | 473.6 47% | 432.1 34% | 313.3 -3% | 324 1% | 349 8% |
| Brightness (cd/m²) | 306 | 456 49% | 426 39% | 298 -3% | 295 -4% | 332 8% |
| Brightness Distribution (%) | 91 | 87 -4% | 97 7% | 88 -3% | 88 -3% | 91 0% |
| Black Level * (cd/m²) | 0.18 | 0.19 -6% | 0.5 -178% | 0.2 -11% | 0.33 -83% | |
| Contrast (:1) | 1787 | 2493 40% | 627 -65% | 1620 -9% | 1058 -41% | |
| Colorchecker dE 2000 * | 6.11 | 5.9 3% | 1.95 68% | 6.09 -0% | 5.13 16% | 5.57 9% |
| Colorchecker dE 2000 max. * | 19.43 | 9.37 52% | 3.87 80% | 19.31 1% | 16.11 17% | 19.96 -3% |
| Colorchecker dE 2000 calibrated * | 3.13 | 0.89 72% | 1.16 63% | 2.63 16% | 2.99 4% | 4.52 -44% |
| Greyscale dE 2000 * | 3.9 | 7.3 -87% | 2 49% | 4.1 -5% | 4.24 -9% | 2.7 31% |
| Gamma | 2.22 99% | 1.9 116% | 2.3 96% | 2.18 101% | 2.3 96% | 2.129 103% |
| CCT | 6250 104% | 7260 90% | 6222 104% | 6031 108% | 7318 89% | 6656 98% |
| Total Average (Program / Settings) | 14% /
23% | 7% /
34% | -3% /
-14% | -2% /
-0% | -10% /
-11% |
* ... smaller is better
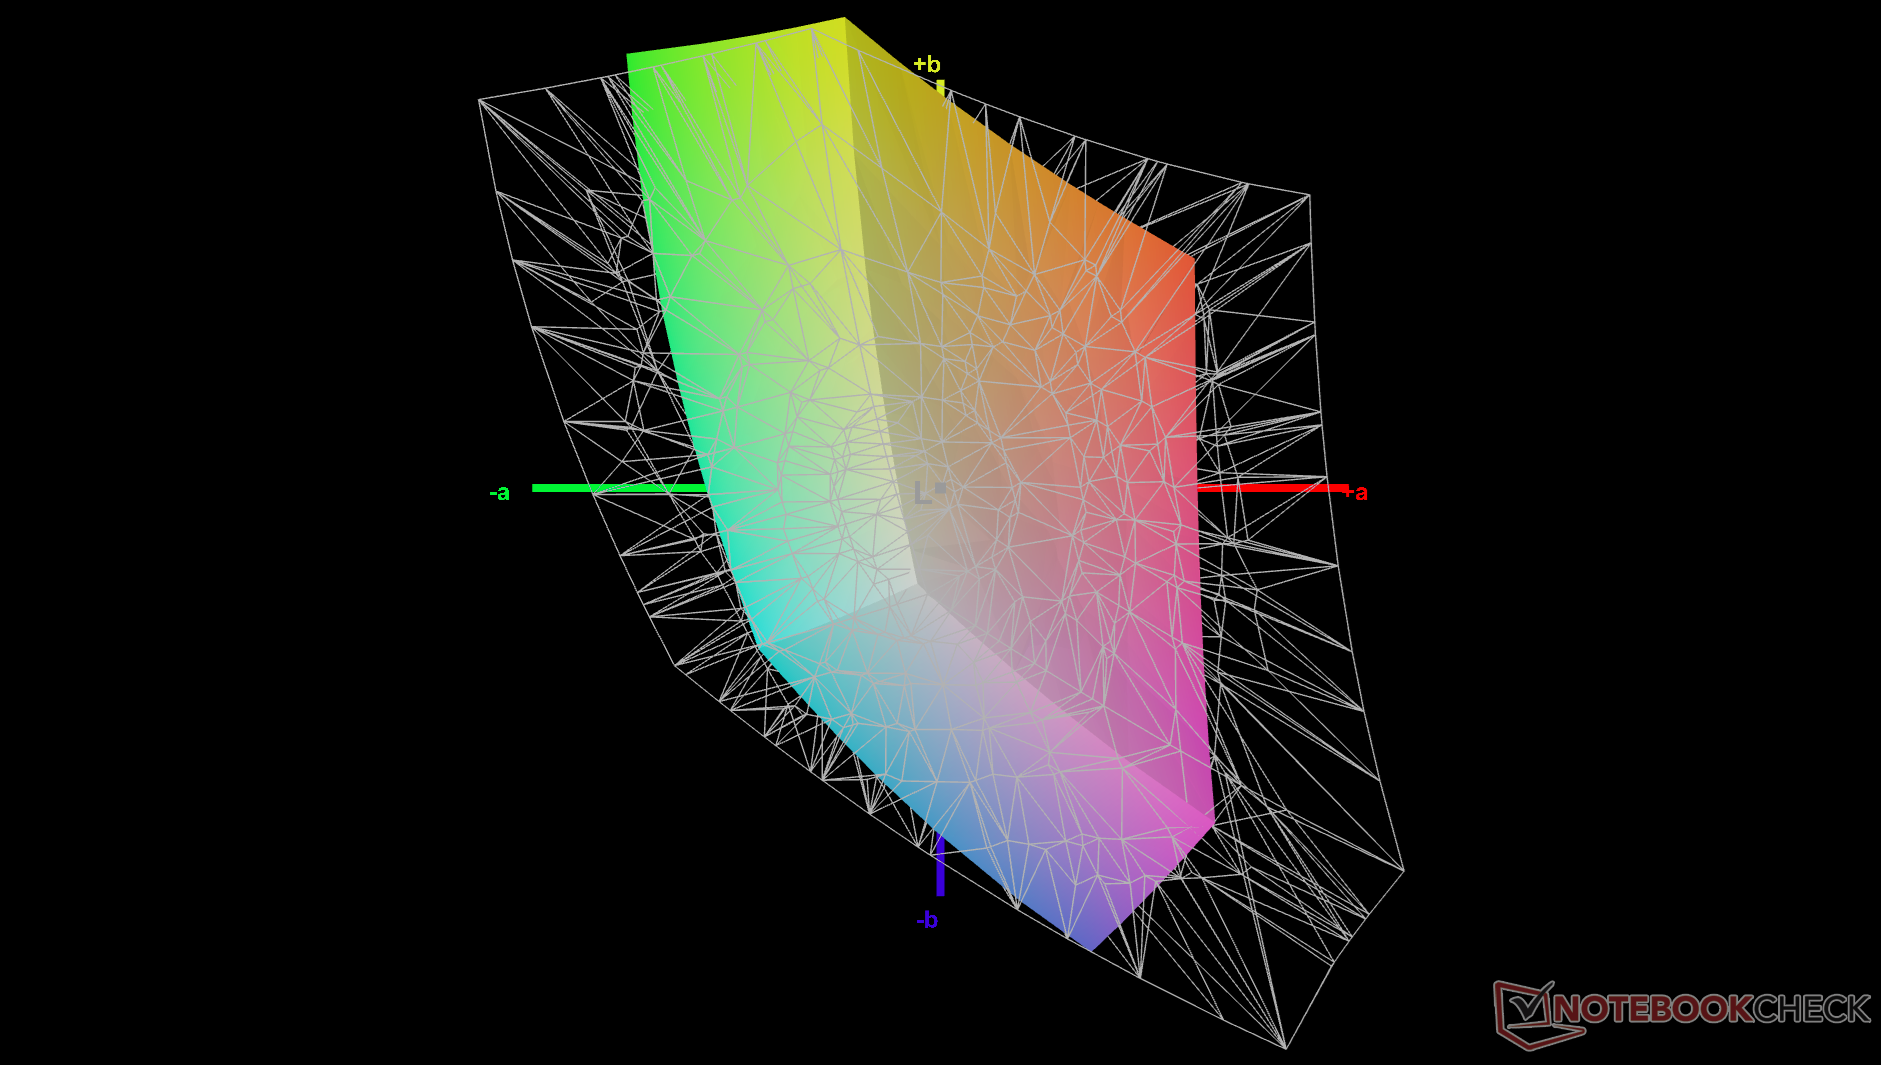
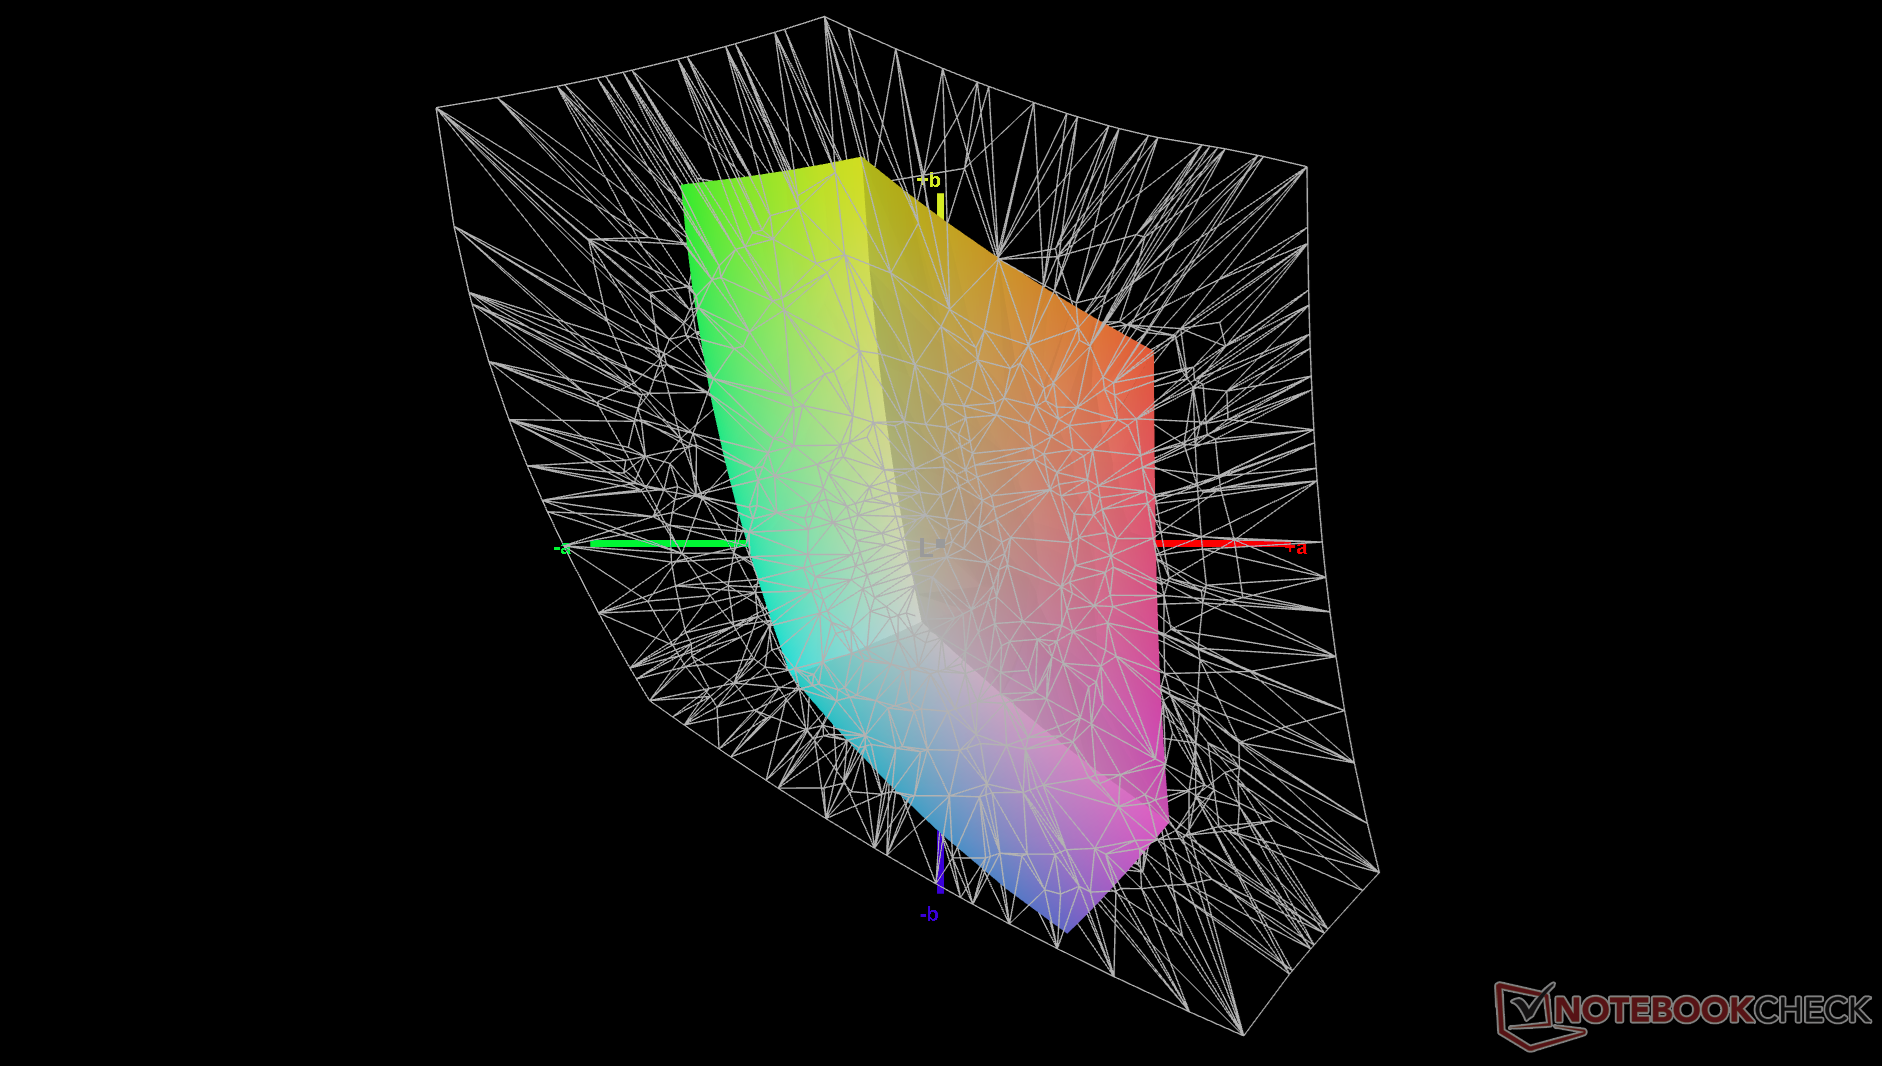
The display does not come calibrated which is to be expected from a budget model. Color temperature in particularly is on the warm side at 6250K even though average the grayscale deltaE is relatively low at just 3.9. Calibrating the panel ourselves addresses these concerns albeit not completely due to the limited sRGB coverage as shown by the CalMAN screenshots below. Our calibrated ICM profile is available to download above for free.
Display Response Times
| ↔ Response Time Black to White | ||
|---|---|---|
| 18.4 ms ... rise ↗ and fall ↘ combined | ↗ 9.9 ms rise | 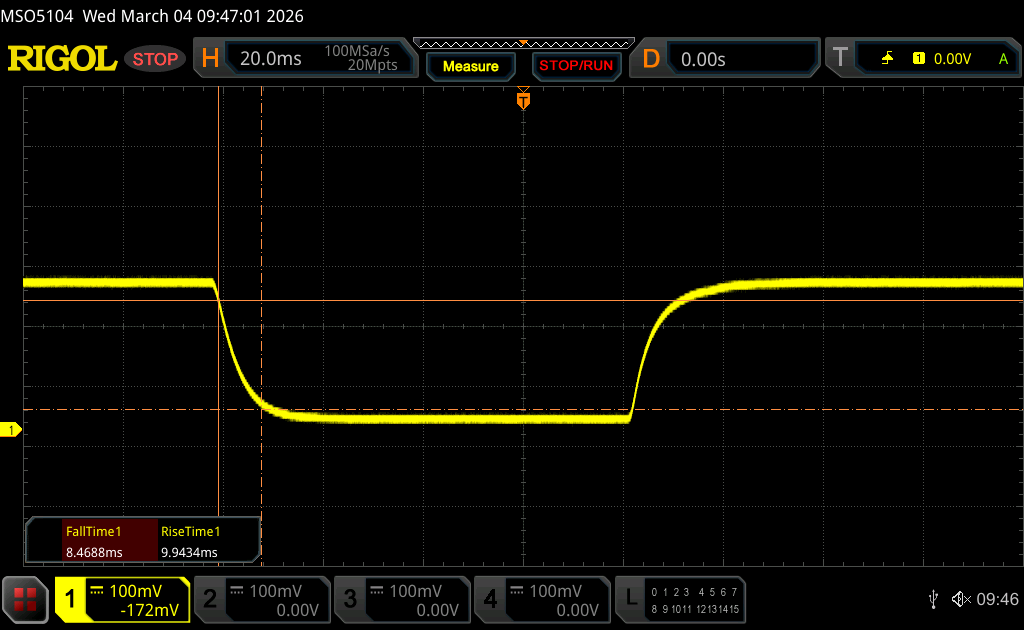 |
| ↘ 8.5 ms fall | ||
| The screen shows good response rates in our tests, but may be too slow for competitive gamers. In comparison, all tested devices range from 0.1 (minimum) to 240 (maximum) ms. » 41 % of all devices are better. This means that the measured response time is similar to the average of all tested devices (19.8 ms). | ||
| ↔ Response Time 50% Grey to 80% Grey | ||
| 26.7 ms ... rise ↗ and fall ↘ combined | ↗ 12.9 ms rise | 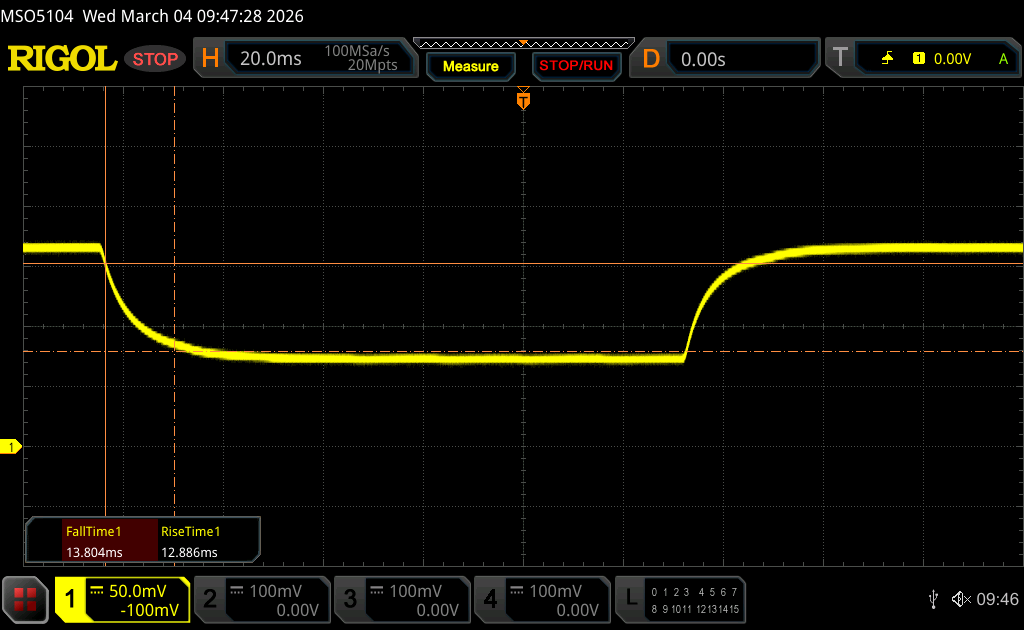 |
| ↘ 13.8 ms fall | ||
| The screen shows relatively slow response rates in our tests and may be too slow for gamers. In comparison, all tested devices range from 0.165 (minimum) to 636 (maximum) ms. » 37 % of all devices are better. This means that the measured response time is better than the average of all tested devices (31 ms). | ||
Screen Flickering / PWM (Pulse-Width Modulation)
| Screen flickering / PWM not detected | 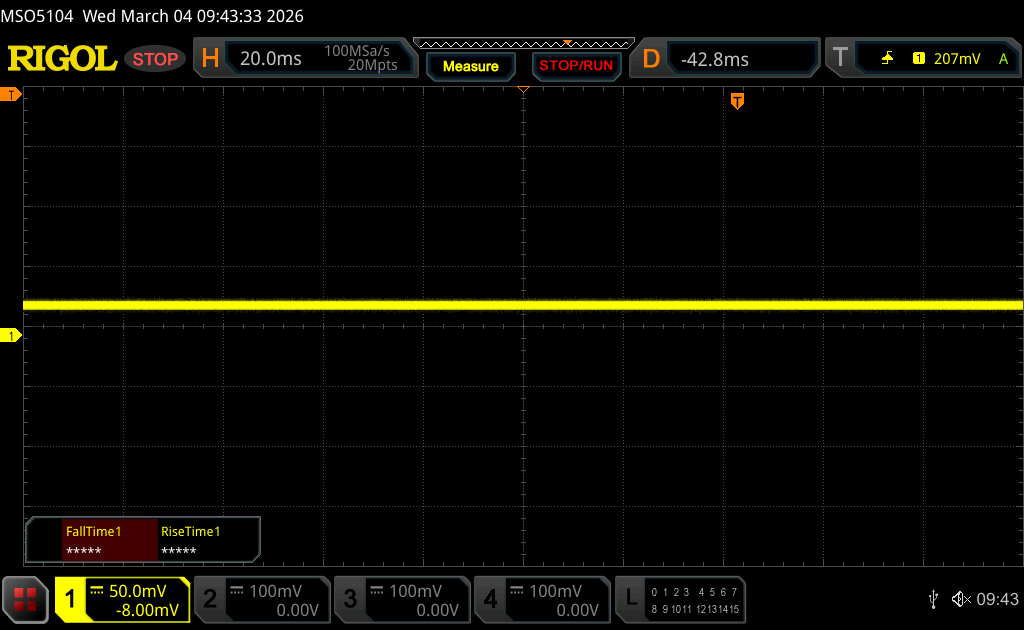 | ||
In comparison: 52 % of all tested devices do not use PWM to dim the display. If PWM was detected, an average of 7747 (minimum: 5 - maximum: 343500) Hz was measured. | |||
Performance

Testing Conditions
We set both Windows and MSI Center to Performance mode prior to running the benchmarks below.
Processor
Raw multi-thread performance from our Core Ultra 7 255H is about 15 to 20 percent faster than the Core Ultra 7 155H in the Prestige 16 to represent a reasonable year-over-year boost. When compared to other laptops with the same Core Ultra 7 255H processor, however, the MSI comes out slightly behind by just a few percentage points.
Upgrading to the Core Ultra 9 285H configuration is expected to improve multi-thread performance by 15 to 25 percent as shown by the comparison chart below.
Cinebench R15 Multi Loop
Cinebench R23: Multi Core | Single Core
Cinebench R20: CPU (Multi Core) | CPU (Single Core)
Cinebench R15: CPU Multi 64Bit | CPU Single 64Bit
Blender: v2.79 BMW27 CPU
7-Zip 18.03: 7z b 4 | 7z b 4 -mmt1
Geekbench 6.7: Multi-Core | Single-Core
Geekbench 5.5: Multi-Core | Single-Core
HWBOT x265 Benchmark v2.2: 4k Preset
LibreOffice : 20 Documents To PDF
R Benchmark 2.5: Overall mean
* ... smaller is better
AIDA64: FP32 Ray-Trace | FPU Julia | CPU SHA3 | CPU Queen | FPU SinJulia | FPU Mandel | CPU AES | CPU ZLib | FP64 Ray-Trace | CPU PhotoWorxx | CPU CheckMate
| Performance rating | |
| MSI Venture 16 AI A2HMTG -1! | |
| Average Intel Core Ultra 7 255H | |
| MSI Prestige 16 B1MG-001US -1! | |
| HP Pavilion 16-ag0057ng -1! | |
| Asus V16 V3607V -1! | |
| Dell 16 Plus 2-in-1 -1! | |
| Lenovo IdeaPad Slim 5 16AKP10 -1! | |
| AIDA64 / FP32 Ray-Trace | |
| Average Intel Core Ultra 7 255H (13863 - 24741, n=17) | |
| MSI Venture 16 AI A2HMTG (v8.20.8100) | |
| HP Pavilion 16-ag0057ng (v6.92.6600) | |
| MSI Prestige 16 B1MG-001US (v6.92.6600) | |
| Asus V16 V3607V (v6.92.6600) | |
| Lenovo IdeaPad Slim 5 16AKP10 (v6.92.6600) | |
| Dell 16 Plus 2-in-1 (v6.92.6600) | |
| AIDA64 / FPU Julia | |
| MSI Venture 16 AI A2HMTG (v8.20.8100) | |
| Average Intel Core Ultra 7 255H (71030 - 119222, n=17) | |
| MSI Prestige 16 B1MG-001US (v6.92.6600) | |
| HP Pavilion 16-ag0057ng (v6.92.6600) | |
| Asus V16 V3607V (v6.92.6600) | |
| Dell 16 Plus 2-in-1 (v6.92.6600) | |
| Lenovo IdeaPad Slim 5 16AKP10 (v6.92.6600) | |
| AIDA64 / CPU SHA3 | |
| Average Intel Core Ultra 7 255H (3408 - 5548, n=17) | |
| MSI Venture 16 AI A2HMTG (v8.20.8100) | |
| MSI Prestige 16 B1MG-001US (v6.92.6600) | |
| HP Pavilion 16-ag0057ng (v6.92.6600) | |
| Asus V16 V3607V (v6.92.6600) | |
| Dell 16 Plus 2-in-1 (v6.92.6600) | |
| Lenovo IdeaPad Slim 5 16AKP10 (v6.92.6600) | |
| AIDA64 / CPU Queen | |
| MSI Prestige 16 B1MG-001US (v6.92.6600) | |
| Asus V16 V3607V (v6.92.6600) | |
| HP Pavilion 16-ag0057ng (v6.92.6600) | |
| Average Intel Core Ultra 7 255H (59098 - 68460, n=16) | |
| Dell 16 Plus 2-in-1 (v6.92.6600) | |
| Lenovo IdeaPad Slim 5 16AKP10 (v6.92.6600) | |
| AIDA64 / FPU SinJulia | |
| MSI Prestige 16 B1MG-001US (v6.92.6600) | |
| HP Pavilion 16-ag0057ng (v6.92.6600) | |
| Asus V16 V3607V (v6.92.6600) | |
| MSI Venture 16 AI A2HMTG (v8.20.8100) | |
| Average Intel Core Ultra 7 255H (6716 - 9006, n=17) | |
| Lenovo IdeaPad Slim 5 16AKP10 (v6.92.6600) | |
| Dell 16 Plus 2-in-1 (v6.92.6600) | |
| AIDA64 / FPU Mandel | |
| MSI Venture 16 AI A2HMTG (v8.20.8100) | |
| Average Intel Core Ultra 7 255H (37031 - 63347, n=17) | |
| MSI Prestige 16 B1MG-001US (v6.92.6600) | |
| HP Pavilion 16-ag0057ng (v6.92.6600) | |
| Asus V16 V3607V (v6.92.6600) | |
| Dell 16 Plus 2-in-1 (v6.92.6600) | |
| Lenovo IdeaPad Slim 5 16AKP10 (v6.92.6600) | |
| AIDA64 / CPU AES | |
| MSI Prestige 16 B1MG-001US (v6.92.6600) | |
| Average Intel Core Ultra 7 255H (58402 - 83568, n=17) | |
| MSI Venture 16 AI A2HMTG (v8.20.8100) | |
| Asus V16 V3607V (v6.92.6600) | |
| HP Pavilion 16-ag0057ng (v6.92.6600) | |
| Dell 16 Plus 2-in-1 (v6.92.6600) | |
| Lenovo IdeaPad Slim 5 16AKP10 (v6.92.6600) | |
| AIDA64 / CPU ZLib | |
| Average Intel Core Ultra 7 255H (822 - 1316, n=17) | |
| MSI Prestige 16 B1MG-001US (v6.92.6600) | |
| MSI Venture 16 AI A2HMTG (v8.20.8100) | |
| Asus V16 V3607V (v6.92.6600) | |
| HP Pavilion 16-ag0057ng (v6.92.6600) | |
| Dell 16 Plus 2-in-1 (v6.92.6600) | |
| Lenovo IdeaPad Slim 5 16AKP10 (v6.92.6600) | |
| AIDA64 / FP64 Ray-Trace | |
| Average Intel Core Ultra 7 255H (7384 - 13231, n=17) | |
| MSI Venture 16 AI A2HMTG (v8.20.8100) | |
| HP Pavilion 16-ag0057ng (v6.92.6600) | |
| MSI Prestige 16 B1MG-001US (v6.92.6600) | |
| Asus V16 V3607V (v6.92.6600) | |
| Lenovo IdeaPad Slim 5 16AKP10 (v6.92.6600) | |
| Dell 16 Plus 2-in-1 (v6.92.6600) | |
| AIDA64 / CPU PhotoWorxx | |
| Average Intel Core Ultra 7 255H (23836 - 65787, n=17) | |
| Dell 16 Plus 2-in-1 (v6.92.6600) | |
| MSI Venture 16 AI A2HMTG (v8.20.8100) | |
| MSI Prestige 16 B1MG-001US (v6.92.6600) | |
| Lenovo IdeaPad Slim 5 16AKP10 (v6.92.6600) | |
| HP Pavilion 16-ag0057ng (v6.92.6600) | |
| Asus V16 V3607V (v6.92.6600) | |
| AIDA64 / CPU CheckMate | |
| MSI Venture 16 AI A2HMTG (v8.20.8100) | |
| Average Intel Core Ultra 7 255H (n=1) | |
System Performance
PCMark 10 scores are well above average due to an unusually high Productivity score even after updates and multiple retests. The result is almost definitely a bug and so the comparison scores below should be taken with a grain of salt.
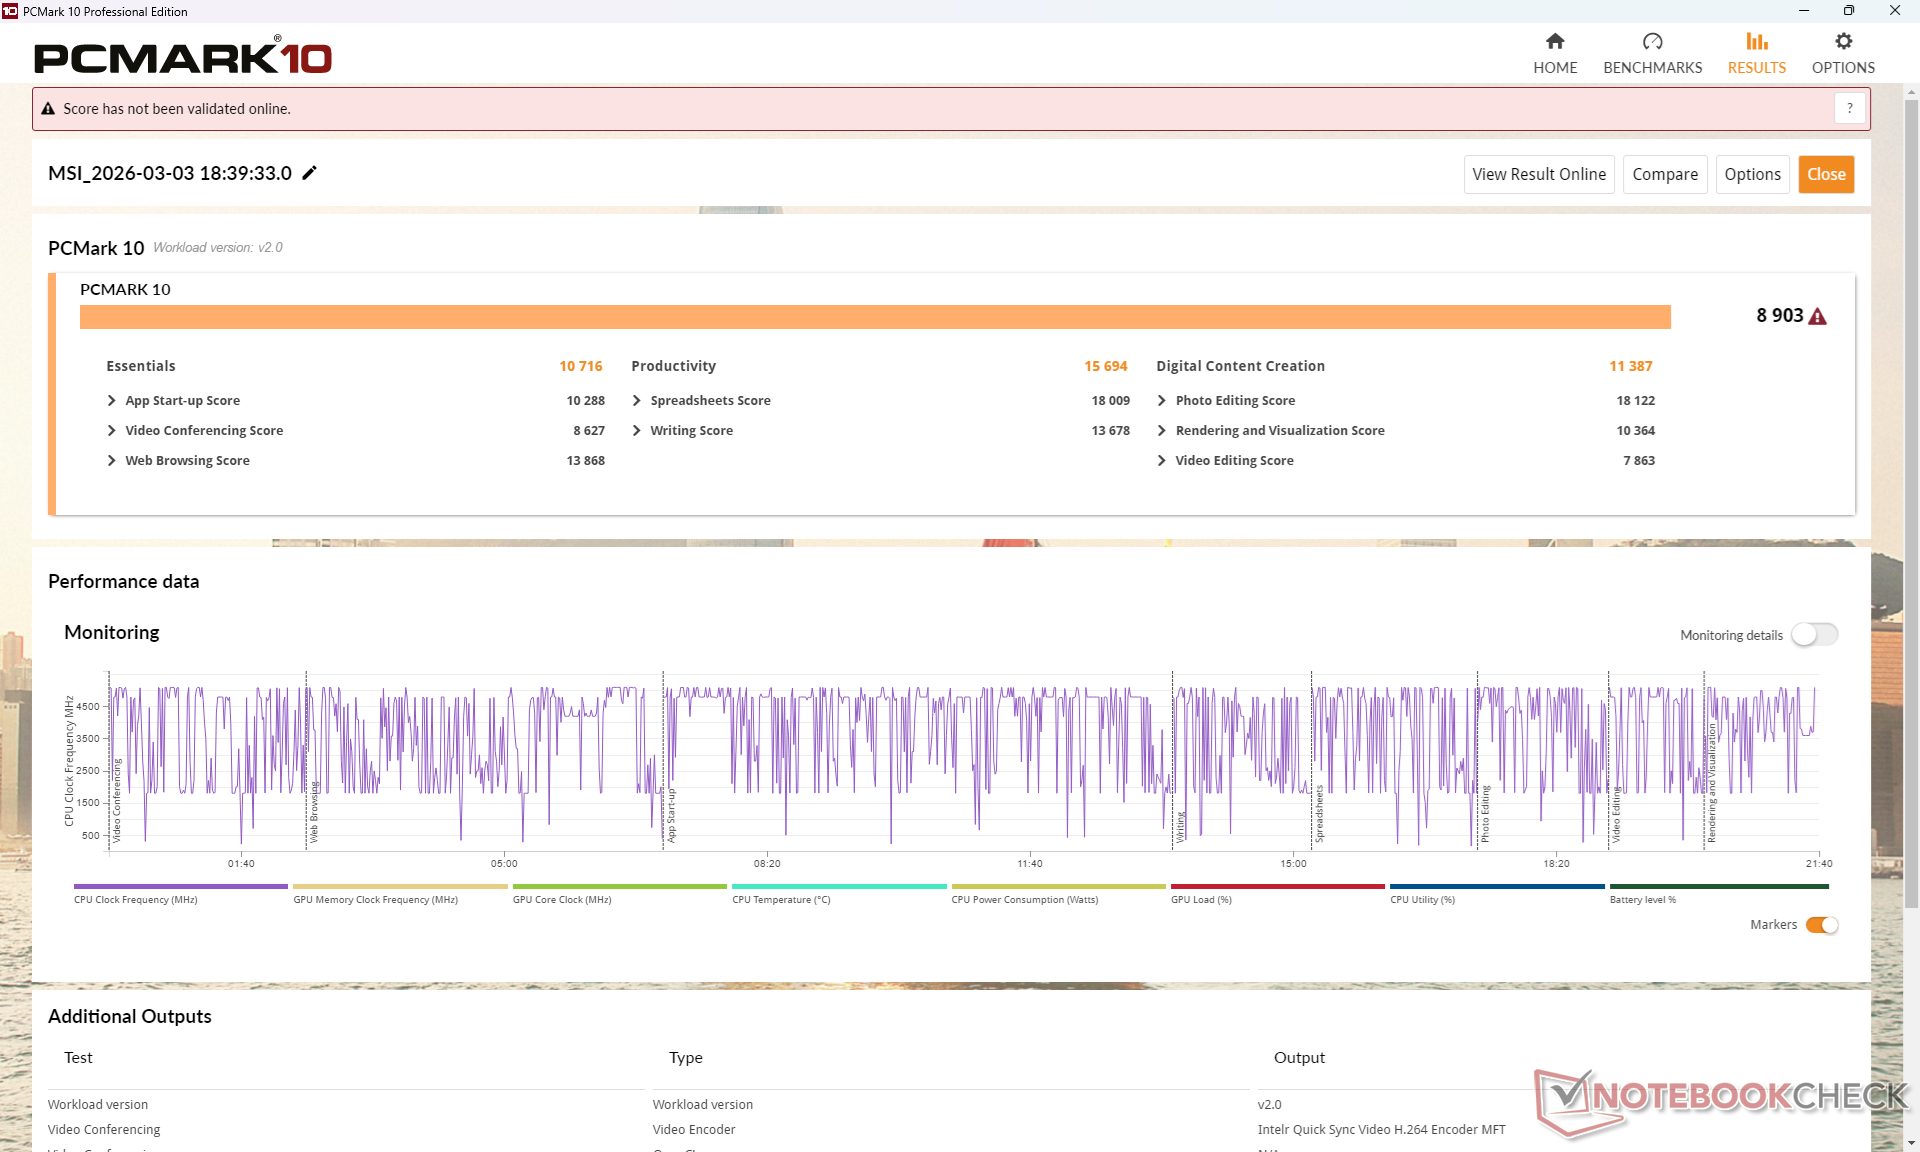
PCMark 10: Score | Essentials | Productivity | Digital Content Creation
CrossMark: Overall | Productivity | Creativity | Responsiveness
WebXPRT 3: Overall
WebXPRT 4: Overall
Mozilla Kraken 1.1: Total
Geekbench AI: Single Precision GPU 1.7 | Half Precision GPU 1.7 | Quantized GPU 1.7
| Performance rating | |
| MSI Venture 16 AI A2HMTG | |
| Average Intel Core Ultra 7 255H, Intel Arc Graphics 140T | |
| Dell 16 Plus 2-in-1 | |
| MSI Prestige 16 B1MG-001US -3! | |
| Asus V16 V3607V -4! | |
| HP Pavilion 16-ag0057ng -7! | |
| Lenovo IdeaPad Slim 5 16AKP10 -4! | |
| PCMark 10 / Score | |
| MSI Venture 16 AI A2HMTG | |
| Average Intel Core Ultra 7 255H, Intel Arc Graphics 140T (6878 - 9156, n=13) | |
| MSI Prestige 16 B1MG-001US | |
| Dell 16 Plus 2-in-1 | |
| Asus V16 V3607V | |
| HP Pavilion 16-ag0057ng | |
| Lenovo IdeaPad Slim 5 16AKP10 | |
| PCMark 10 / Essentials | |
| MSI Prestige 16 B1MG-001US | |
| Average Intel Core Ultra 7 255H, Intel Arc Graphics 140T (10637 - 11556, n=13) | |
| MSI Venture 16 AI A2HMTG | |
| Dell 16 Plus 2-in-1 | |
| HP Pavilion 16-ag0057ng | |
| Asus V16 V3607V | |
| Lenovo IdeaPad Slim 5 16AKP10 | |
| PCMark 10 / Productivity | |
| MSI Venture 16 AI A2HMTG | |
| Average Intel Core Ultra 7 255H, Intel Arc Graphics 140T (7598 - 15694, n=13) | |
| Asus V16 V3607V | |
| Lenovo IdeaPad Slim 5 16AKP10 | |
| HP Pavilion 16-ag0057ng | |
| MSI Prestige 16 B1MG-001US | |
| Dell 16 Plus 2-in-1 | |
| PCMark 10 / Digital Content Creation | |
| Average Intel Core Ultra 7 255H, Intel Arc Graphics 140T (10461 - 12552, n=13) | |
| MSI Venture 16 AI A2HMTG | |
| MSI Prestige 16 B1MG-001US | |
| Dell 16 Plus 2-in-1 | |
| Asus V16 V3607V | |
| HP Pavilion 16-ag0057ng | |
| Lenovo IdeaPad Slim 5 16AKP10 | |
| CrossMark / Overall | |
| MSI Venture 16 AI A2HMTG | |
| Average Intel Core Ultra 7 255H, Intel Arc Graphics 140T (1610 - 2018, n=13) | |
| Asus V16 V3607V | |
| MSI Prestige 16 B1MG-001US | |
| Dell 16 Plus 2-in-1 | |
| Lenovo IdeaPad Slim 5 16AKP10 | |
| CrossMark / Productivity | |
| MSI Venture 16 AI A2HMTG | |
| Average Intel Core Ultra 7 255H, Intel Arc Graphics 140T (1566 - 1908, n=13) | |
| Asus V16 V3607V | |
| MSI Prestige 16 B1MG-001US | |
| Dell 16 Plus 2-in-1 | |
| Lenovo IdeaPad Slim 5 16AKP10 | |
| CrossMark / Creativity | |
| MSI Venture 16 AI A2HMTG | |
| Average Intel Core Ultra 7 255H, Intel Arc Graphics 140T (1827 - 2396, n=13) | |
| Asus V16 V3607V | |
| MSI Prestige 16 B1MG-001US | |
| Dell 16 Plus 2-in-1 | |
| Lenovo IdeaPad Slim 5 16AKP10 | |
| CrossMark / Responsiveness | |
| MSI Prestige 16 B1MG-001US | |
| Asus V16 V3607V | |
| Average Intel Core Ultra 7 255H, Intel Arc Graphics 140T (1194 - 1781, n=13) | |
| MSI Venture 16 AI A2HMTG | |
| Dell 16 Plus 2-in-1 | |
| Lenovo IdeaPad Slim 5 16AKP10 | |
| WebXPRT 3 / Overall | |
| MSI Venture 16 AI A2HMTG | |
| Average Intel Core Ultra 7 255H, Intel Arc Graphics 140T (273 - 327, n=13) | |
| MSI Prestige 16 B1MG-001US | |
| Dell 16 Plus 2-in-1 | |
| HP Pavilion 16-ag0057ng | |
| HP Pavilion 16-ag0057ng | |
| Lenovo IdeaPad Slim 5 16AKP10 | |
| WebXPRT 4 / Overall | |
| MSI Venture 16 AI A2HMTG | |
| Average Intel Core Ultra 7 255H, Intel Arc Graphics 140T (247 - 317, n=13) | |
| Dell 16 Plus 2-in-1 | |
| Asus V16 V3607V | |
| MSI Prestige 16 B1MG-001US | |
| HP Pavilion 16-ag0057ng | |
| HP Pavilion 16-ag0057ng | |
| Mozilla Kraken 1.1 / Total | |
| Lenovo IdeaPad Slim 5 16AKP10 | |
| HP Pavilion 16-ag0057ng | |
| HP Pavilion 16-ag0057ng | |
| MSI Prestige 16 B1MG-001US | |
| Asus V16 V3607V | |
| Dell 16 Plus 2-in-1 | |
| MSI Venture 16 AI A2HMTG | |
| Average Intel Core Ultra 7 255H, Intel Arc Graphics 140T (427 - 510, n=13) | |
| Geekbench AI / Single Precision GPU 1.7 | |
| Dell 16 Plus 2-in-1 | |
| Average Intel Core Ultra 7 255H, Intel Arc Graphics 140T (6840 - 8478, n=7) | |
| MSI Venture 16 AI A2HMTG | |
| Geekbench AI / Half Precision GPU 1.7 | |
| Dell 16 Plus 2-in-1 | |
| Average Intel Core Ultra 7 255H, Intel Arc Graphics 140T (8108 - 12393, n=7) | |
| MSI Venture 16 AI A2HMTG | |
| Geekbench AI / Quantized GPU 1.7 | |
| Dell 16 Plus 2-in-1 | |
| Average Intel Core Ultra 7 255H, Intel Arc Graphics 140T (4705 - 5621, n=7) | |
| MSI Venture 16 AI A2HMTG | |
* ... smaller is better
| PCMark 10 Score | 8903 points | |
Help | ||
| AIDA64 / Memory Copy | |
| Dell 16 Plus 2-in-1 | |
| Average Intel Core Ultra 7 255H (39188 - 110930, n=17) | |
| MSI Prestige 16 B1MG-001US | |
| HP Pavilion 16-ag0057ng | |
| MSI Venture 16 AI A2HMTG | |
| Lenovo IdeaPad Slim 5 16AKP10 | |
| Asus V16 V3607V | |
| AIDA64 / Memory Read | |
| Dell 16 Plus 2-in-1 | |
| MSI Venture 16 AI A2HMTG | |
| Average Intel Core Ultra 7 255H (43703 - 90552, n=17) | |
| MSI Prestige 16 B1MG-001US | |
| Lenovo IdeaPad Slim 5 16AKP10 | |
| HP Pavilion 16-ag0057ng | |
| Asus V16 V3607V | |
| AIDA64 / Memory Write | |
| Dell 16 Plus 2-in-1 | |
| HP Pavilion 16-ag0057ng | |
| Lenovo IdeaPad Slim 5 16AKP10 | |
| MSI Venture 16 AI A2HMTG | |
| MSI Prestige 16 B1MG-001US | |
| Average Intel Core Ultra 7 255H (36438 - 87199, n=17) | |
| Asus V16 V3607V | |
| AIDA64 / Memory Latency | |
| MSI Prestige 16 B1MG-001US | |
| Average Intel Core Ultra 7 255H (107.6 - 147.2, n=17) | |
| HP Pavilion 16-ag0057ng | |
| MSI Venture 16 AI A2HMTG | |
| Dell 16 Plus 2-in-1 | |
| Asus V16 V3607V | |
| Lenovo IdeaPad Slim 5 16AKP10 | |
* ... smaller is better
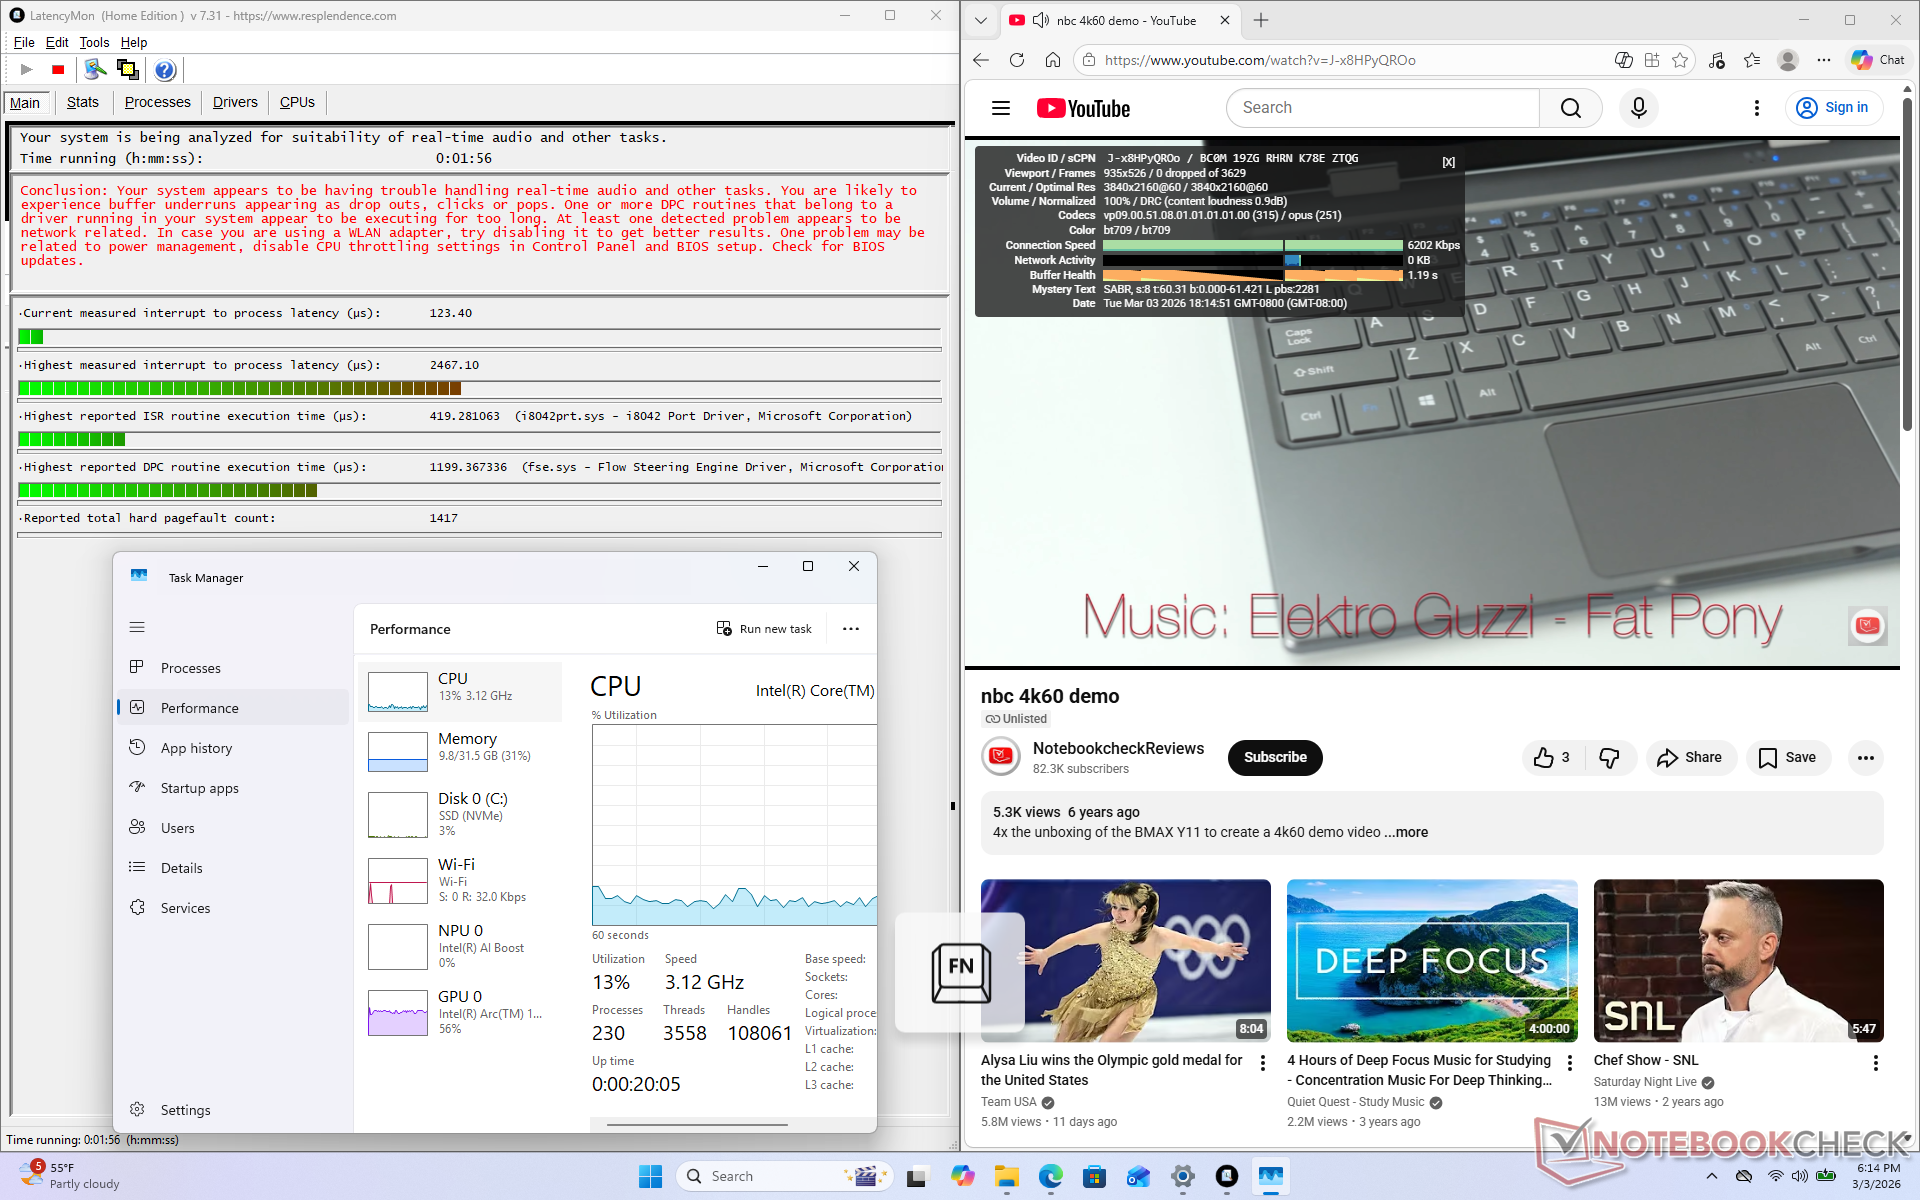
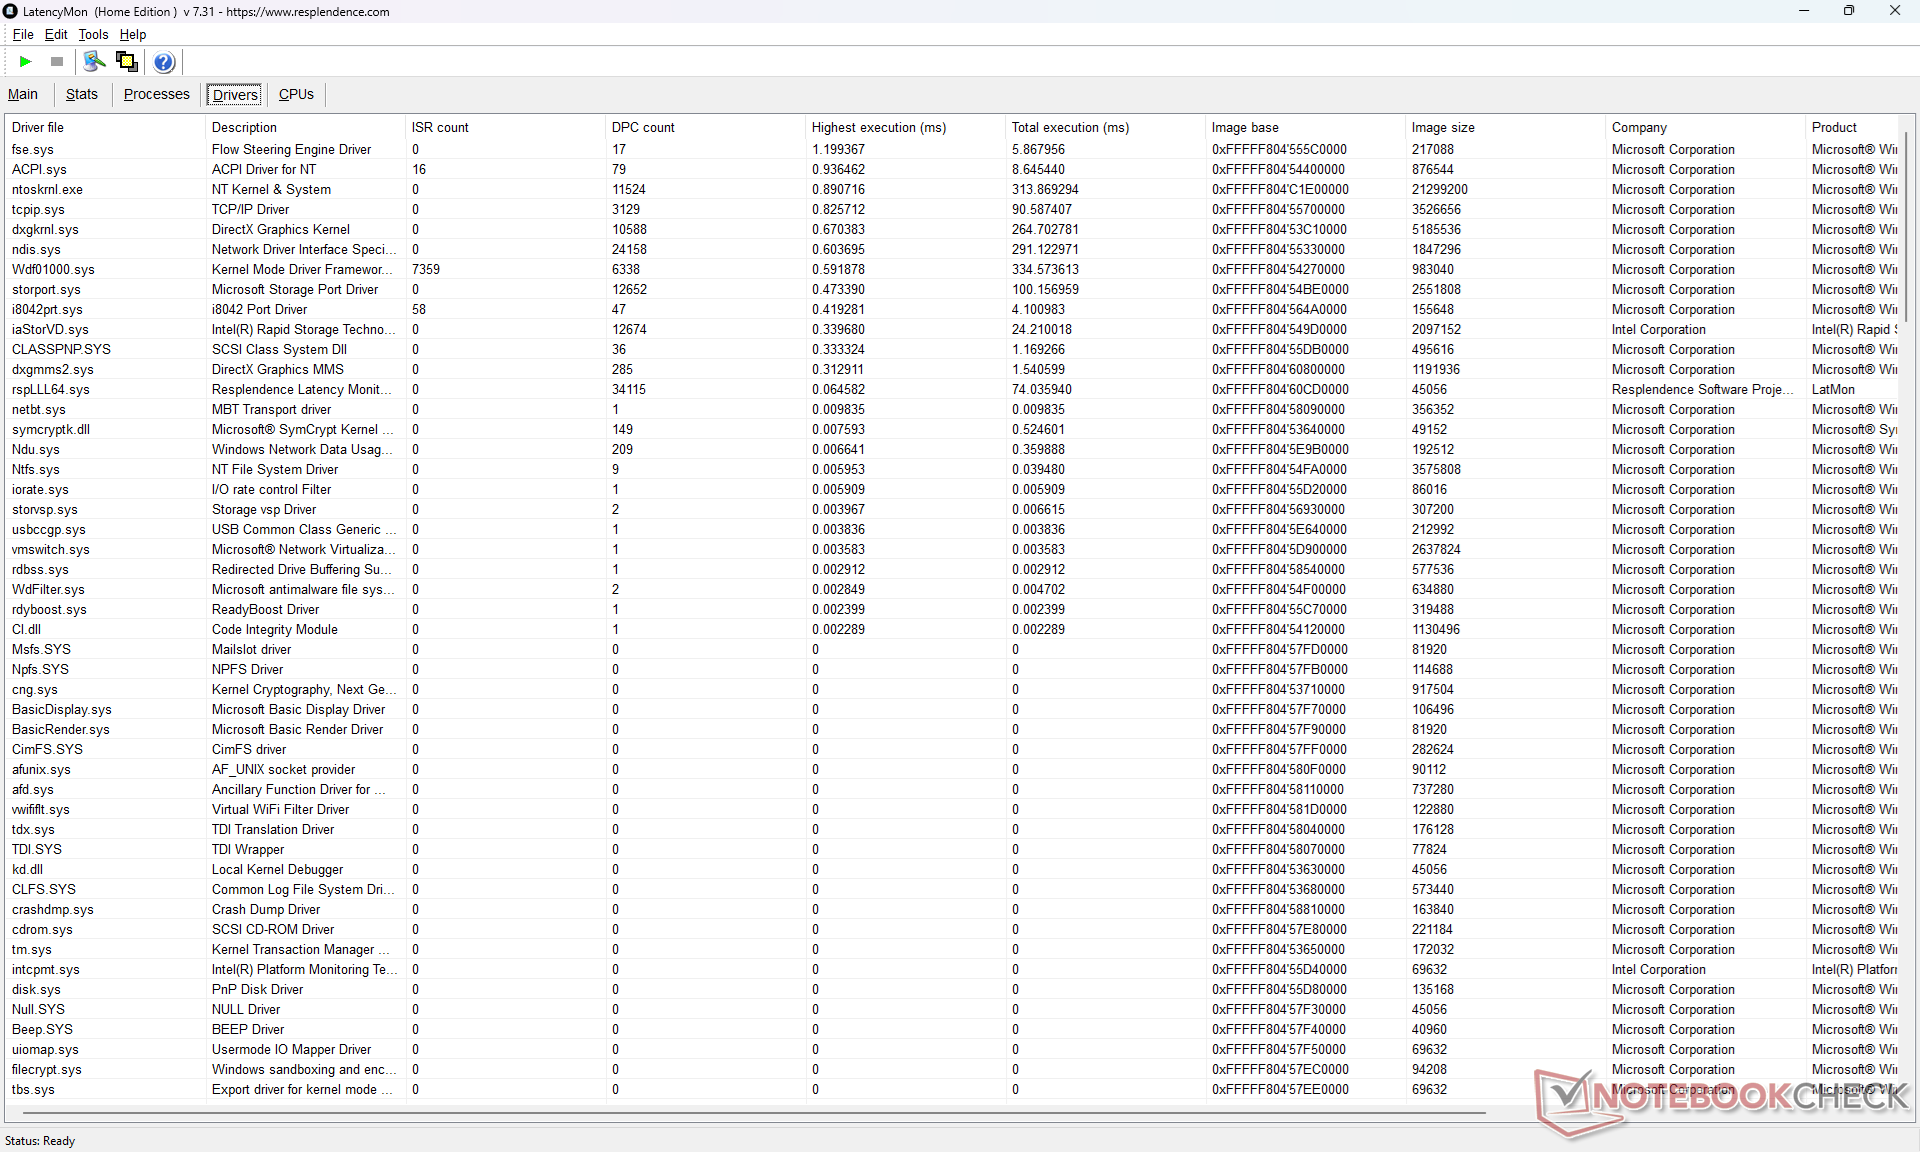
DPC Latency
LatencyMon reveals minor DPC issues but with otherwise no dropped frames during 4K60 video playback.
| DPC Latencies / LatencyMon - interrupt to process latency (max), Web, Youtube, Prime95 | |
| Lenovo IdeaPad Slim 5 16AKP10 | |
| Asus V16 V3607V | |
| MSI Venture 16 AI A2HMTG | |
| Dell 16 Plus 2-in-1 | |
| HP Pavilion 16-ag0057ng | |
| MSI Prestige 16 B1MG-001US | |
* ... smaller is better
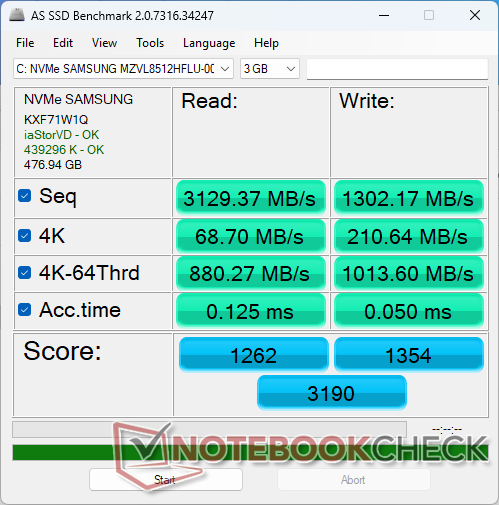
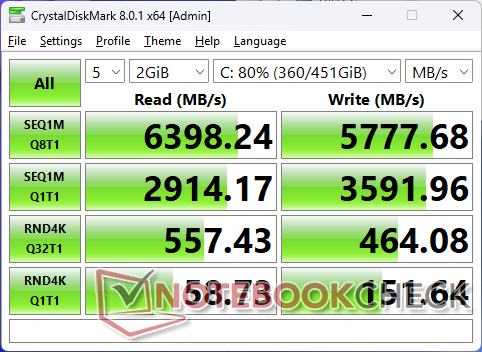
Storage Devices
The Samsung MZVL8512HFLU PCIe4 x4 NVMe SSD can sustain transfer rates of up to 7000 MB/s even without a dedicated heat sink.

| Drive Performance rating - Percent | |
| MSI Prestige 16 B1MG-001US | |
| Asus V16 V3607V | |
| MSI Venture 16 AI A2HMTG | |
| HP Pavilion 16-ag0057ng | |
| Lenovo IdeaPad Slim 5 16AKP10 | |
| Dell 16 Plus 2-in-1 | |
* ... smaller is better
Disk Throttling: DiskSpd Read Loop, Queue Depth 8
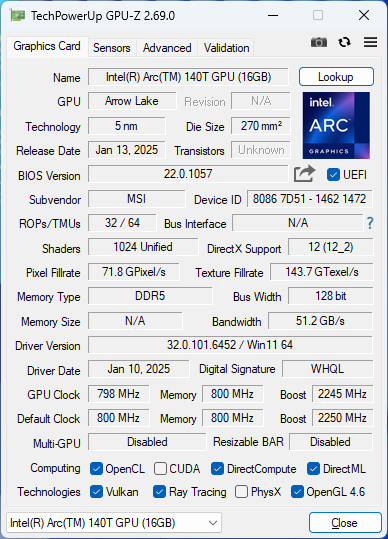
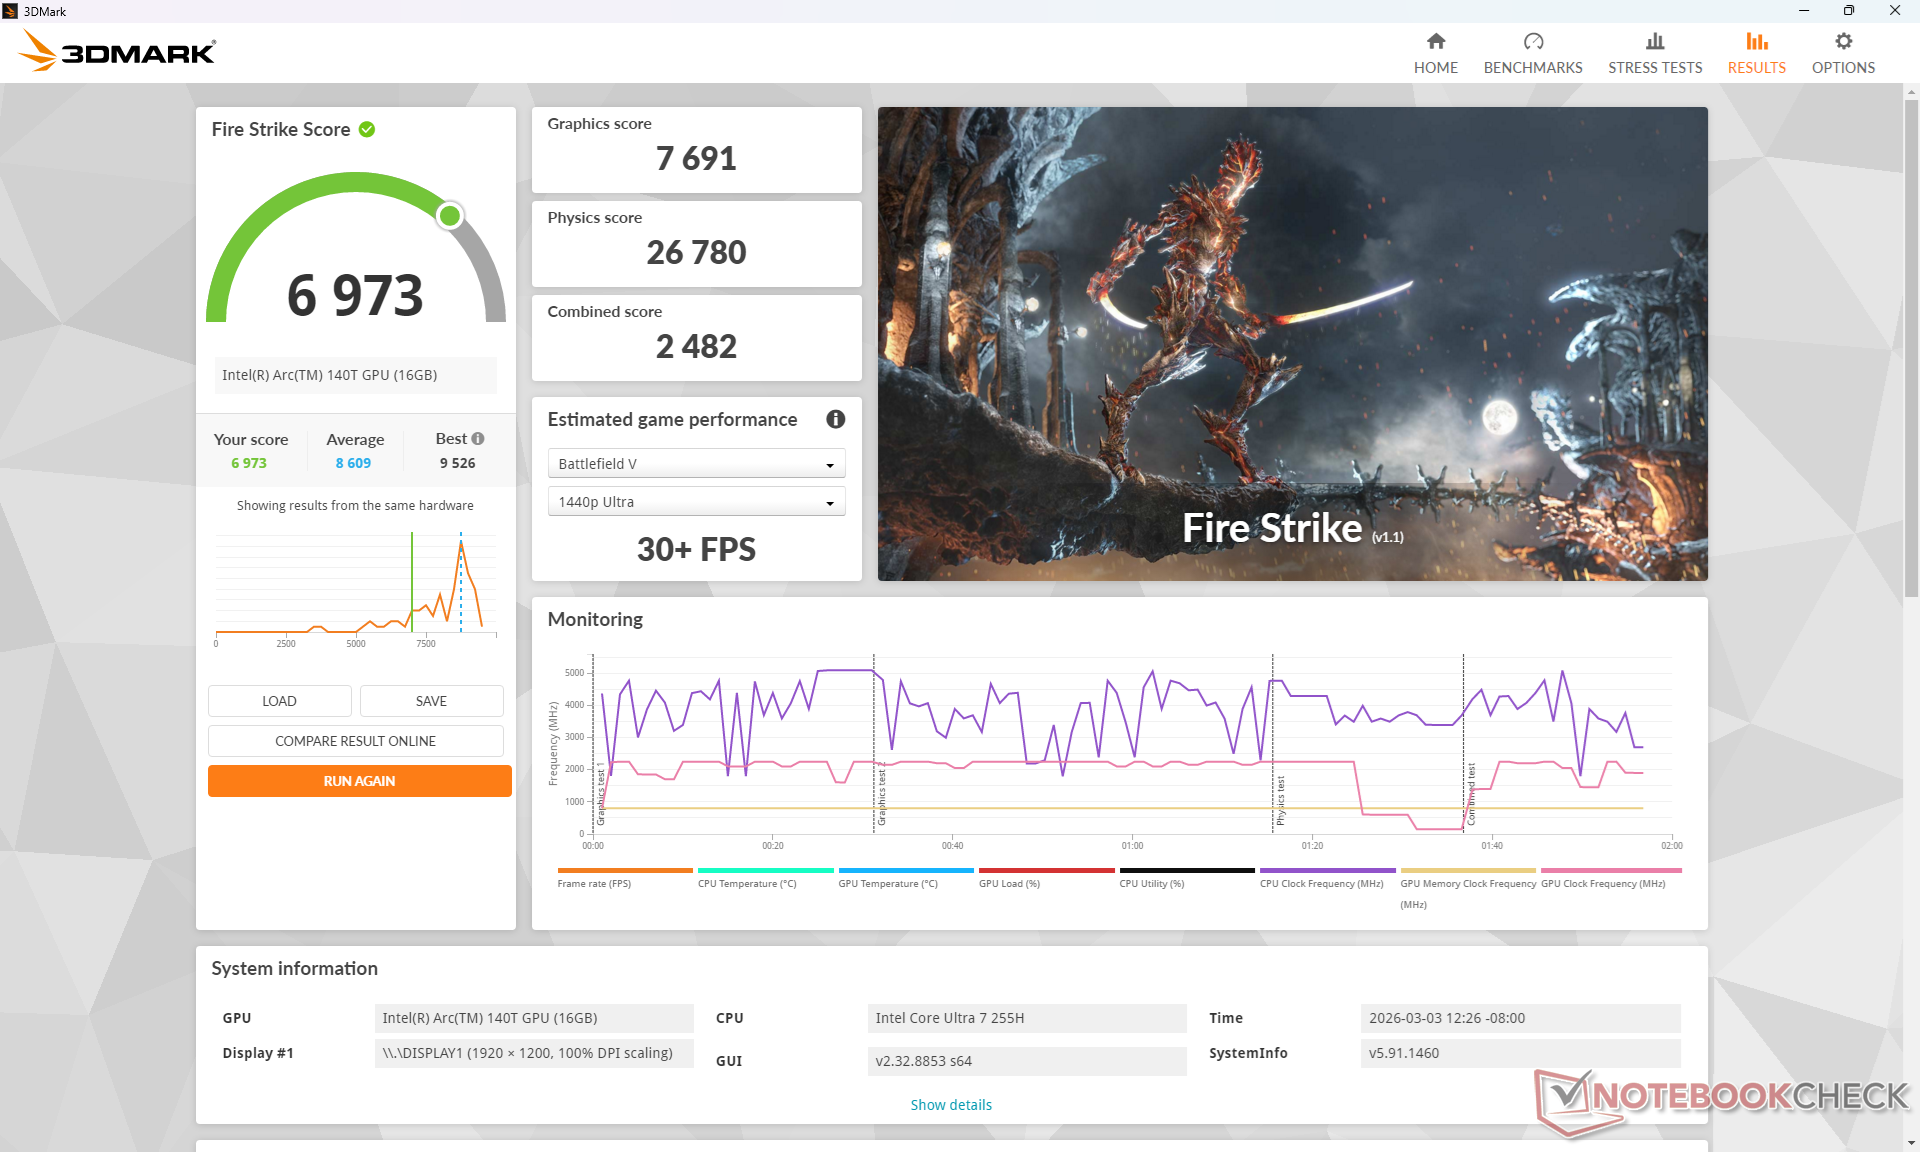
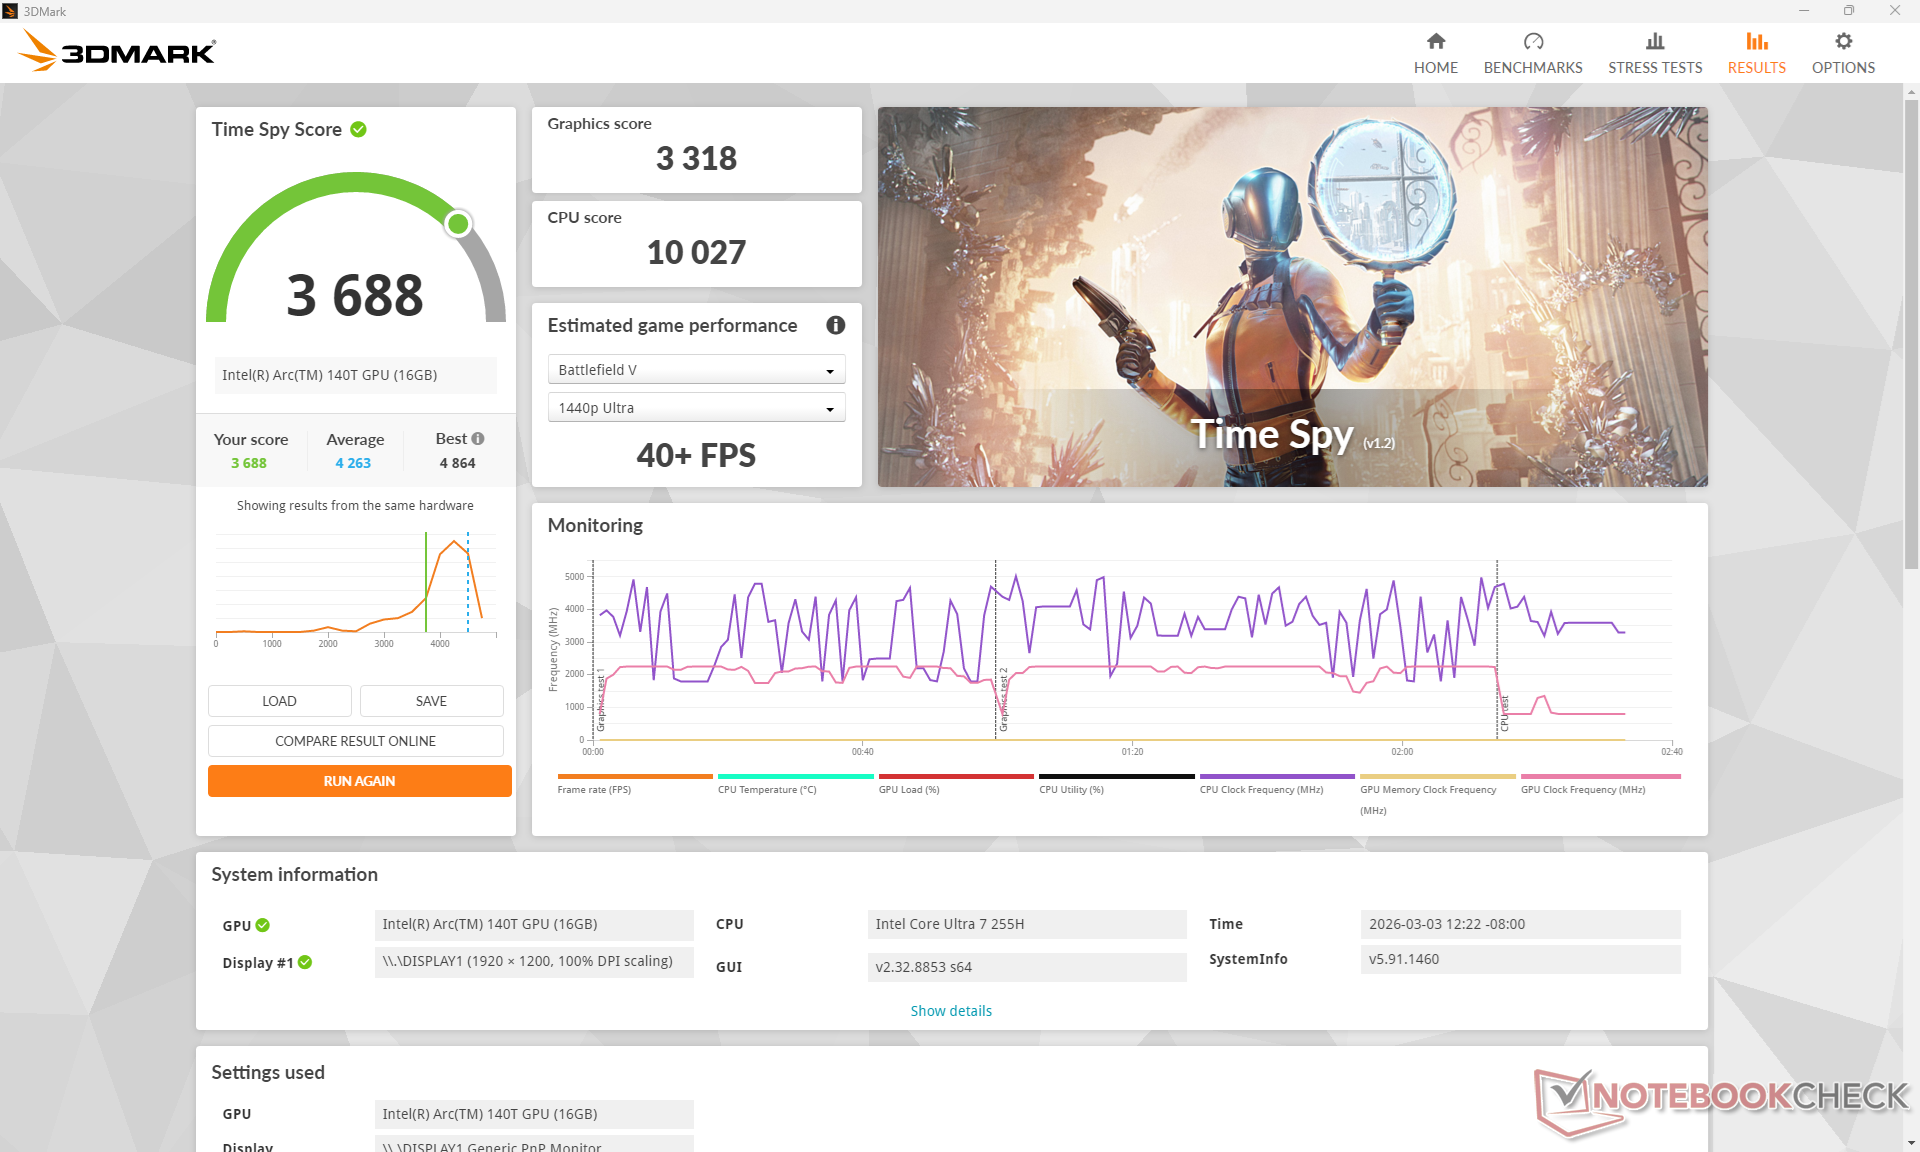
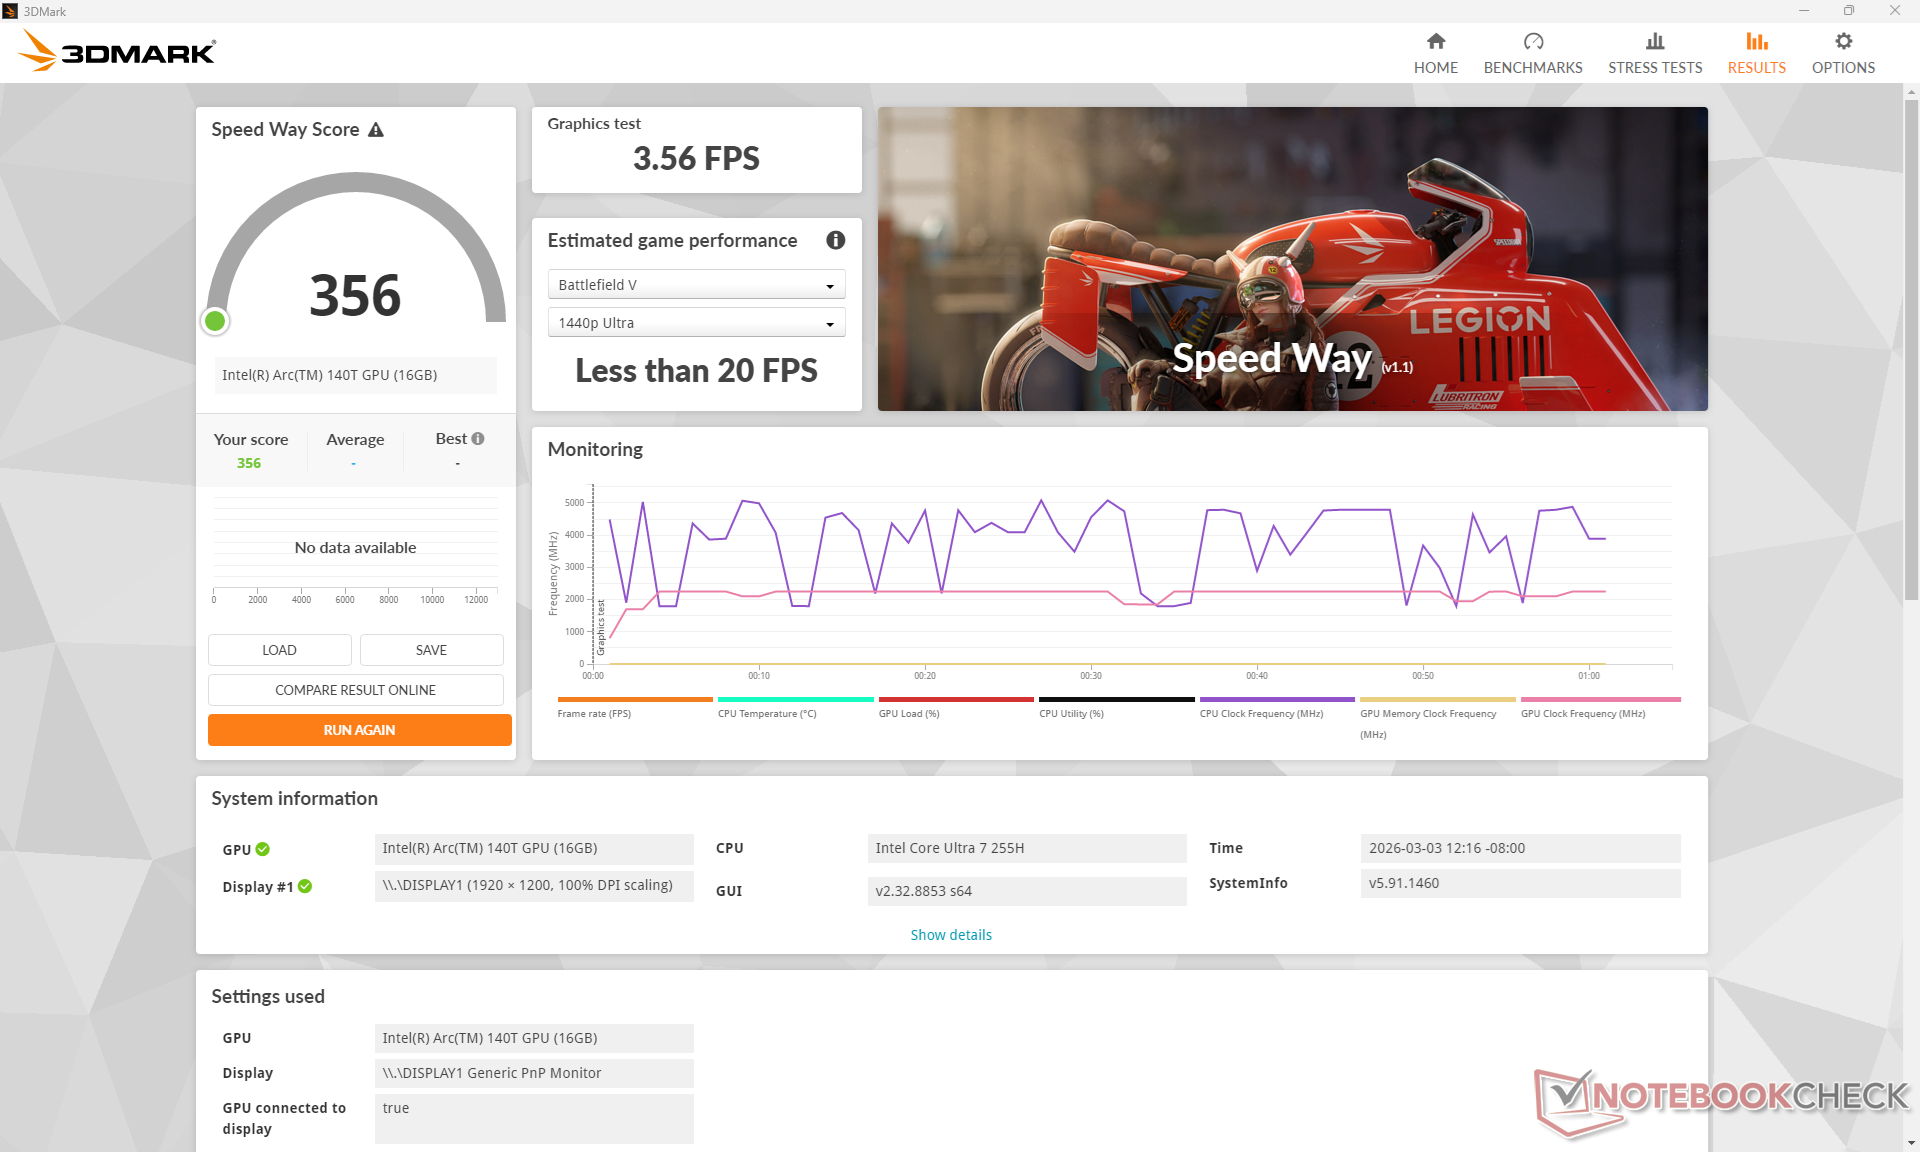
GPU Performance
Graphics performance, while still decent for an iGPU, is unfortunately 10 percent slower than the average laptop in our database with the same Arc 140T. Last year's MSI Prestige 16 with the older Arc 8 is consequently comparable to our MSI when it comes to gaming and GPU-heavy tasks.
| Power Profile | Graphics Score | Physics Score | Combined Score |
| Performance Mode | 7691 | 26780 | 2482 |
| Balanced Mode | 7416 (-4%) | 26626 (-1%) | 2521 (-0%) |
| Battery Power | 7319 (-5%) | 25231 (-6%) | 2459 (-0%) |
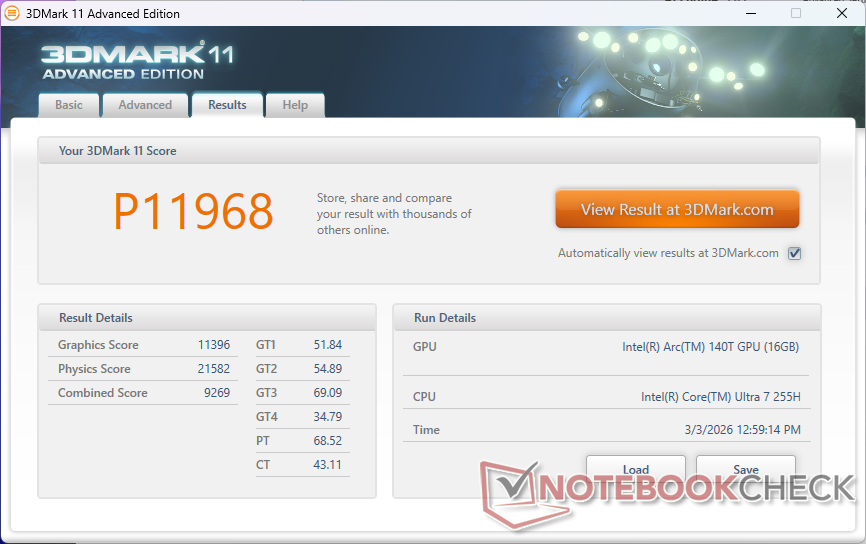
| 3DMark 11 Performance | 11968 points | |
| 3DMark Cloud Gate Standard Score | 35142 points | |
| 3DMark Fire Strike Score | 6973 points | |
| 3DMark Time Spy Score | 3688 points | |
Help | ||
| Blender | |
| v3.3 Classroom OPTIX/RTX | |
| Asus V16 V3607V | |
| v3.3 Classroom CUDA | |
| Asus V16 V3607V | |
| v3.3 Classroom CPU | |
| Lenovo IdeaPad Slim 5 16AKP10 | |
| Dell 16 Plus 2-in-1 | |
| HP Pavilion 16-ag0057ng | |
| Dynabook Tecra A60 A65-M | |
| Asus V16 V3607V | |
| MSI Prestige 16 B1MG-001US | |
| Asus ExpertBook B5 B5605CCA | |
| Average Intel Arc Graphics 140T (254 - 492, n=20) | |
| Acer Swift Go 16 AI SFG16-61-R5Y5 | |
| Acer Swift Go 16 AI SFG16-61-R5Y5 | |
| MSI Venture 16 AI A2HMTG | |
| Asus ZenBook S16 UM5606GA | |
| v3.3 Classroom oneAPI/Intel | |
| Average Intel Arc Graphics 140T (147 - 396, n=6) | |
| Dell 16 Plus 2-in-1 | |
| MSI Venture 16 AI A2HMTG | |
| v4.3 Barbershop CPU | |
| Dell 16 Plus 2-in-1 | |
| Asus V16 V3607V | |
| Dynabook Tecra A60 A65-M | |
| Acer Swift Go 16 AI SFG16-61-R5Y5 | |
| Average Intel Arc Graphics 140T (1349 - 1839, n=9) | |
| MSI Venture 16 AI A2HMTG | |
| v4.3 Barbershop oneAPI | |
| Dell 16 Plus 2-in-1 | |
| Average Intel Arc Graphics 140T (533 - 1037, n=5) | |
| MSI Venture 16 AI A2HMTG | |
| v4.3 Barbershop HIP | |
| Acer Swift Go 16 AI SFG16-61-R5Y5 | |
| v4.3 Barbershop OPTIX | |
| Asus V16 V3607V | |
* ... smaller is better
| Performance rating - Percent | |
| Asus V16 V3607V | |
| Dell 16 Plus 2-in-1 -1! | |
| MSI Prestige 16 B1MG-001US -1! | |
| MSI Venture 16 AI A2HMTG | |
| HP Pavilion 16-ag0057ng | |
| Lenovo IdeaPad Slim 5 16AKP10 | |
| Cyberpunk 2077 - 1920x1080 Ultra Preset (FSR off) | |
| Asus V16 V3607V | |
| Dell 16 Plus 2-in-1 | |
| MSI Venture 16 AI A2HMTG | |
| MSI Prestige 16 B1MG-001US | |
| HP Pavilion 16-ag0057ng | |
| Lenovo IdeaPad Slim 5 16AKP10 | |
| Baldur's Gate 3 - 1920x1080 Ultra Preset AA:T | |
| Asus V16 V3607V | |
| Dell 16 Plus 2-in-1 | |
| MSI Venture 16 AI A2HMTG | |
| MSI Prestige 16 B1MG-001US | |
| HP Pavilion 16-ag0057ng | |
| Lenovo IdeaPad Slim 5 16AKP10 | |
| GTA V - 1920x1080 Highest AA:4xMSAA + FX AF:16x | |
| Asus V16 V3607V | |
| MSI Venture 16 AI A2HMTG | |
| HP Pavilion 16-ag0057ng | |
| Lenovo IdeaPad Slim 5 16AKP10 | |
| Final Fantasy XV Benchmark - 1920x1080 High Quality | |
| Asus V16 V3607V | |
| Dell 16 Plus 2-in-1 | |
| MSI Venture 16 AI A2HMTG | |
| MSI Prestige 16 B1MG-001US | |
| HP Pavilion 16-ag0057ng | |
| Lenovo IdeaPad Slim 5 16AKP10 | |
| Strange Brigade - 1920x1080 ultra AA:ultra AF:16 | |
| Asus V16 V3607V | |
| Dell 16 Plus 2-in-1 | |
| MSI Venture 16 AI A2HMTG | |
| MSI Prestige 16 B1MG-001US | |
| HP Pavilion 16-ag0057ng | |
| Lenovo IdeaPad Slim 5 16AKP10 | |
| Dota 2 Reborn - 1920x1080 ultra (3/3) best looking | |
| Asus V16 V3607V | |
| Dell 16 Plus 2-in-1 | |
| MSI Venture 16 AI A2HMTG | |
| MSI Prestige 16 B1MG-001US | |
| HP Pavilion 16-ag0057ng | |
| Lenovo IdeaPad Slim 5 16AKP10 | |
| X-Plane 11.11 - 1920x1080 high (fps_test=3) | |
| Asus V16 V3607V | |
| MSI Venture 16 AI A2HMTG | |
| MSI Prestige 16 B1MG-001US | |
| Dell 16 Plus 2-in-1 | |
| Lenovo IdeaPad Slim 5 16AKP10 | |
| HP Pavilion 16-ag0057ng | |
| F1 24 | |
| 1920x1080 Low Preset AA:T AF:16x | |
| Dell 16 Plus 2-in-1 | |
| Asus ZenBook S16 UM5606GA | |
| Average Intel Arc Graphics 140T (53.5 - 93.4, n=15) | |
| MSI Venture 16 AI A2HMTG | |
| Asus ExpertBook B5 B5605CCA | |
| Dynabook Tecra A60 A65-M | |
| 1920x1080 Medium Preset AA:T AF:16x | |
| Dell 16 Plus 2-in-1 | |
| Asus ZenBook S16 UM5606GA | |
| Average Intel Arc Graphics 140T (47.4 - 85.7, n=15) | |
| MSI Venture 16 AI A2HMTG | |
| Asus ExpertBook B5 B5605CCA | |
| Dynabook Tecra A60 A65-M | |
| 1920x1080 High Preset AA:T AF:16x | |
| Dell 16 Plus 2-in-1 | |
| Asus ZenBook S16 UM5606GA | |
| Average Intel Arc Graphics 140T (37.5 - 64.9, n=14) | |
| MSI Venture 16 AI A2HMTG | |
| Asus ExpertBook B5 B5605CCA | |
| 1920x1080 Ultra High Preset AA:T AF:16x | |
| Dell 16 Plus 2-in-1 | |
| Average Intel Arc Graphics 140T (15.7 - 20.8, n=12) | |
| MSI Venture 16 AI A2HMTG | |
| Asus ZenBook S16 UM5606GA | |
Cyberpunk 2077 ultra FPS Chart
| low | med. | high | ultra | |
|---|---|---|---|---|
| GTA V (2015) | 167.9 | 155 | 41.1 | 16.7 |
| Dota 2 Reborn (2015) | 103.6 | 86.5 | 79.4 | 75.8 |
| Final Fantasy XV Benchmark (2018) | 68 | 39.2 | 26 | |
| X-Plane 11.11 (2018) | 55.8 | 44.6 | 39.7 | |
| Strange Brigade (2018) | 167.5 | 70.6 | 60.2 | 50.1 |
| Baldur's Gate 3 (2023) | 36.7 | 31 | 26.5 | 26.1 |
| Cyberpunk 2077 (2023) | 36.2 | 29.6 | 25.5 | 23 |
| F1 24 (2024) | 76.1 | 69.9 | 48 | 15.7 |
Emissions
System Noise
Fan noise tends to hover around 27 dB(A) when running everyday loads like browsing, but higher loads like games can induce a noise level of 45 dB(A). The fan is unfortunately high-pitched and so any pulsing can be quite noticeable.
Noise level
| Idle |
| 23.1 / 23.1 / 24.1 dB(A) |
| Load |
| 45.2 / 44.7 dB(A) |
 | ||
30 dB silent 40 dB(A) audible 50 dB(A) loud |
||
min: | ||
| MSI Venture 16 AI A2HMTG Ultra 7 255H, Arc 140T | MSI Prestige 16 B1MG-001US Ultra 7 155H, Arc 8-Core | Dell 16 Plus 2-in-1 Core Ultra 7 258V, Arc 140V | Asus V16 V3607V Core 7 240H, GeForce RTX 3050 6GB Laptop GPU | HP Pavilion 16-ag0057ng R5 8540U, Radeon 740M | Lenovo IdeaPad Slim 5 16AKP10 Ryzen AI 5 330, Radeon 820M | |
|---|---|---|---|---|---|---|
| Noise | -6% | 2% | -4% | 1% | -3% | |
| off / environment * (dB) | 22.9 | 24.5 -7% | 23.2 -1% | 23.3 -2% | 24 -5% | 24 -5% |
| Idle Minimum * (dB) | 23.1 | 24.5 -6% | 23 -0% | 23.5 -2% | 24 -4% | 24 -4% |
| Idle Average * (dB) | 23.1 | 26.3 -14% | 23 -0% | 23.7 -3% | 25 -8% | 25 -8% |
| Idle Maximum * (dB) | 24.1 | 26.3 -9% | 24.7 -2% | 23.7 2% | 26 -8% | 26 -8% |
| Load Average * (dB) | 45.2 | 36.5 19% | 32.5 28% | 48 -6% | 38 16% | 43 5% |
| Cyberpunk 2077 ultra * (dB) | 39.4 | 42.6 -8% | 40.5 -3% | 37 6% | 42 -7% | |
| Load Maximum * (dB) | 44.7 | 52.9 -18% | 45.6 -2% | 51 -14% | 39 13% | 43 4% |
| Witcher 3 ultra * (dB) | 46.3 |
* ... smaller is better
Temperature
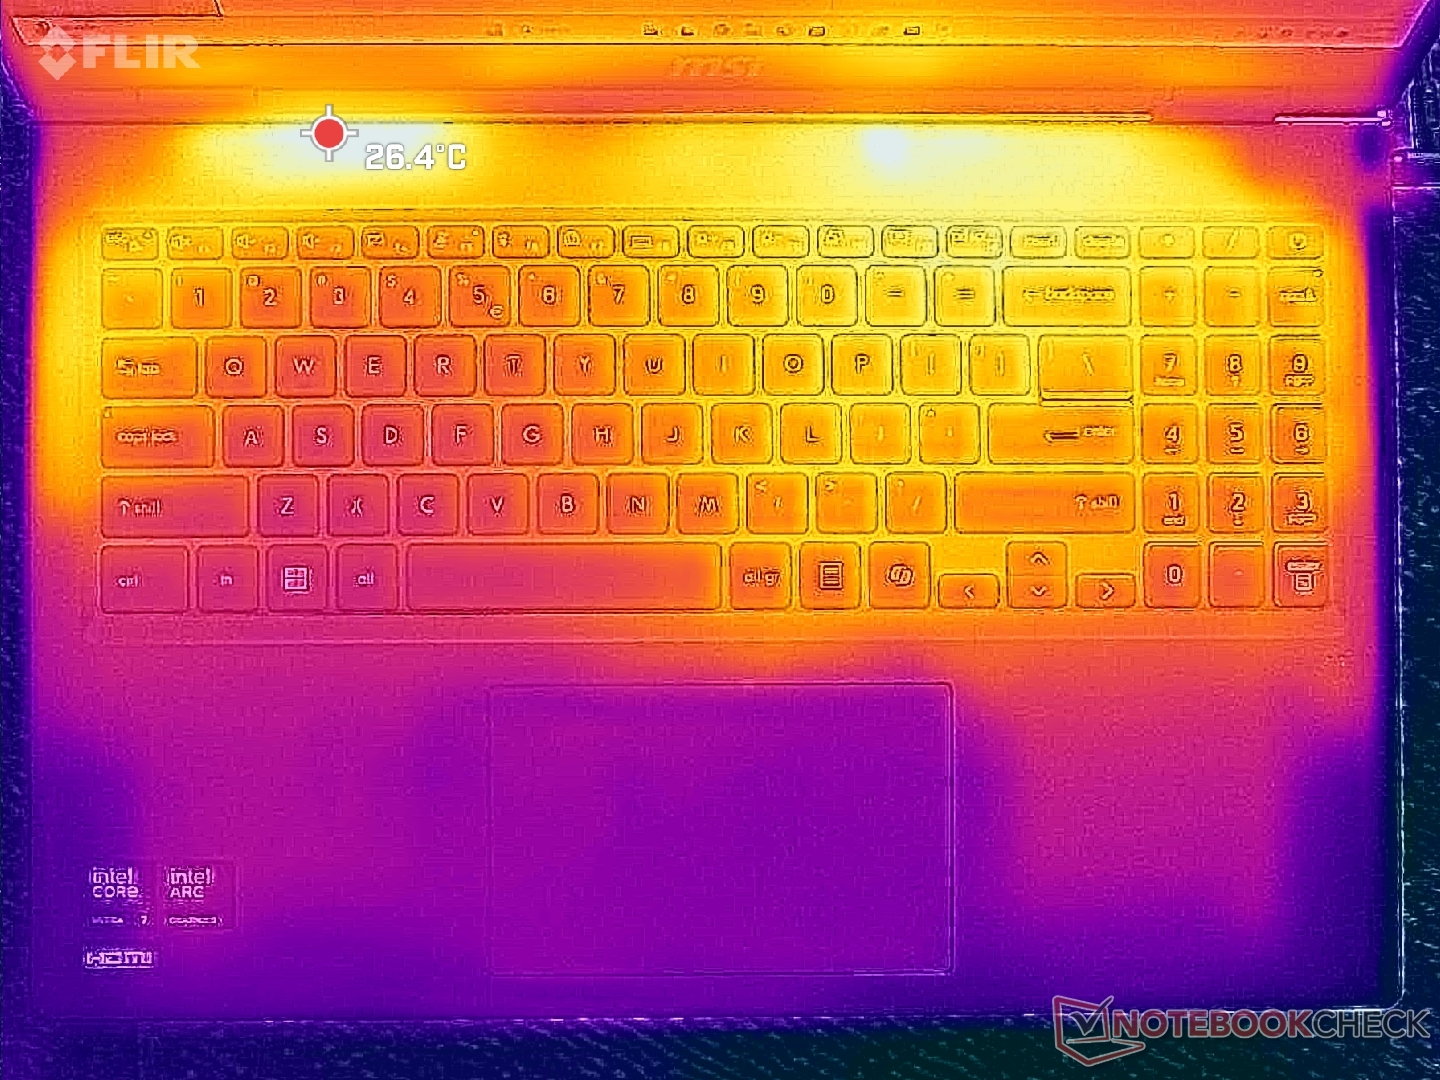
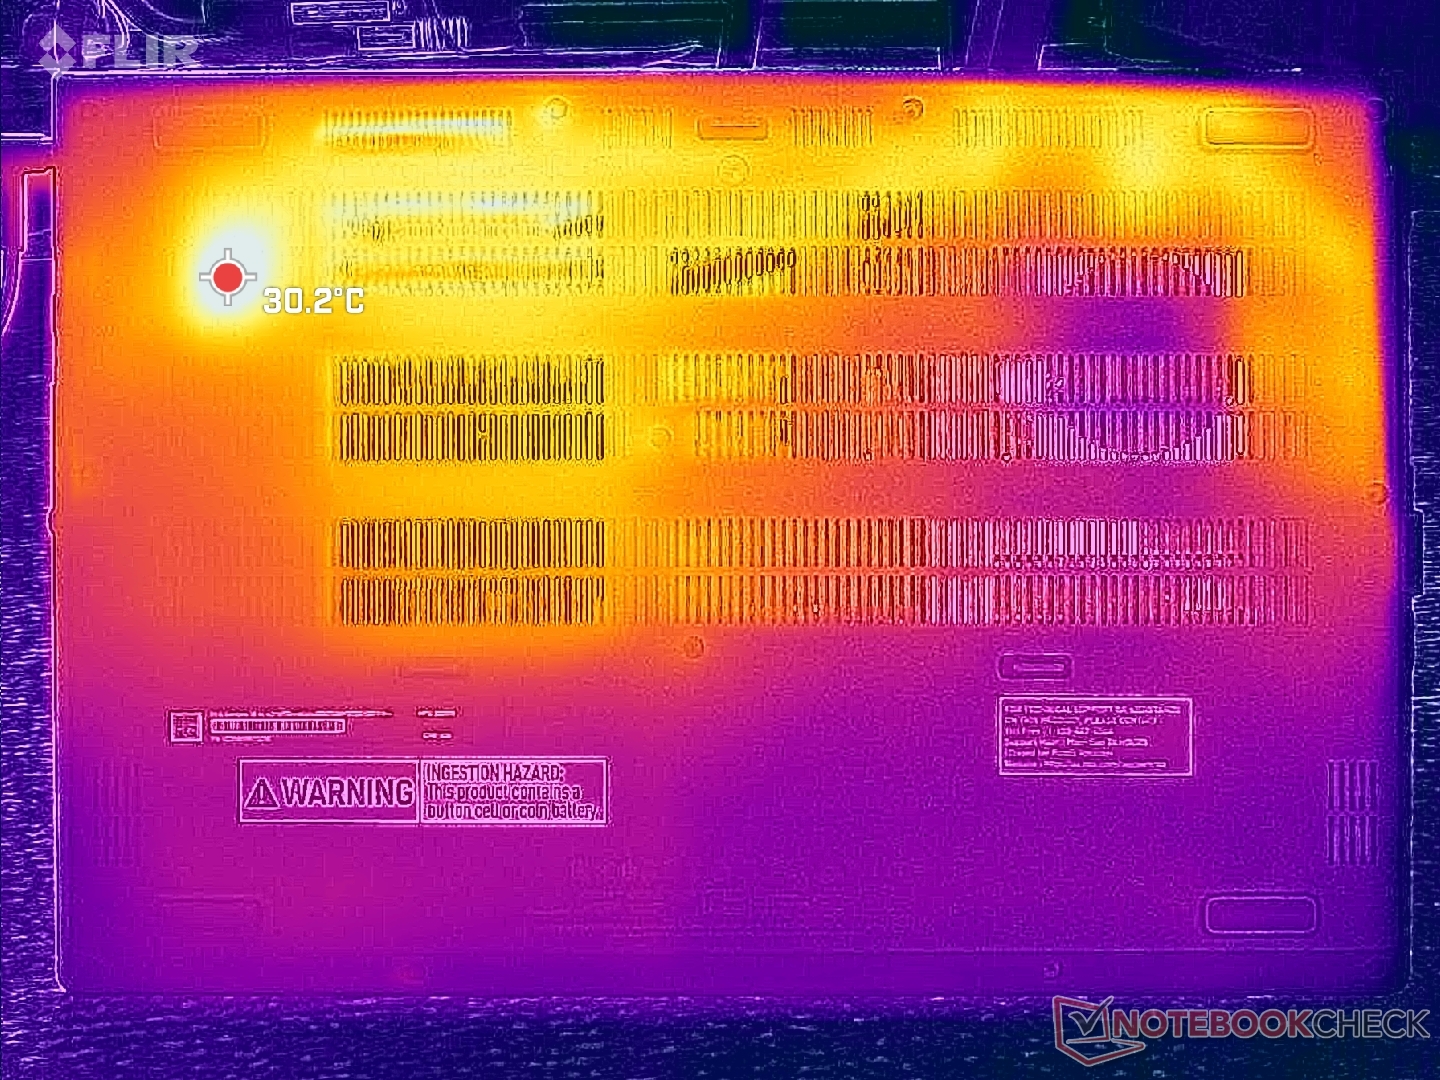
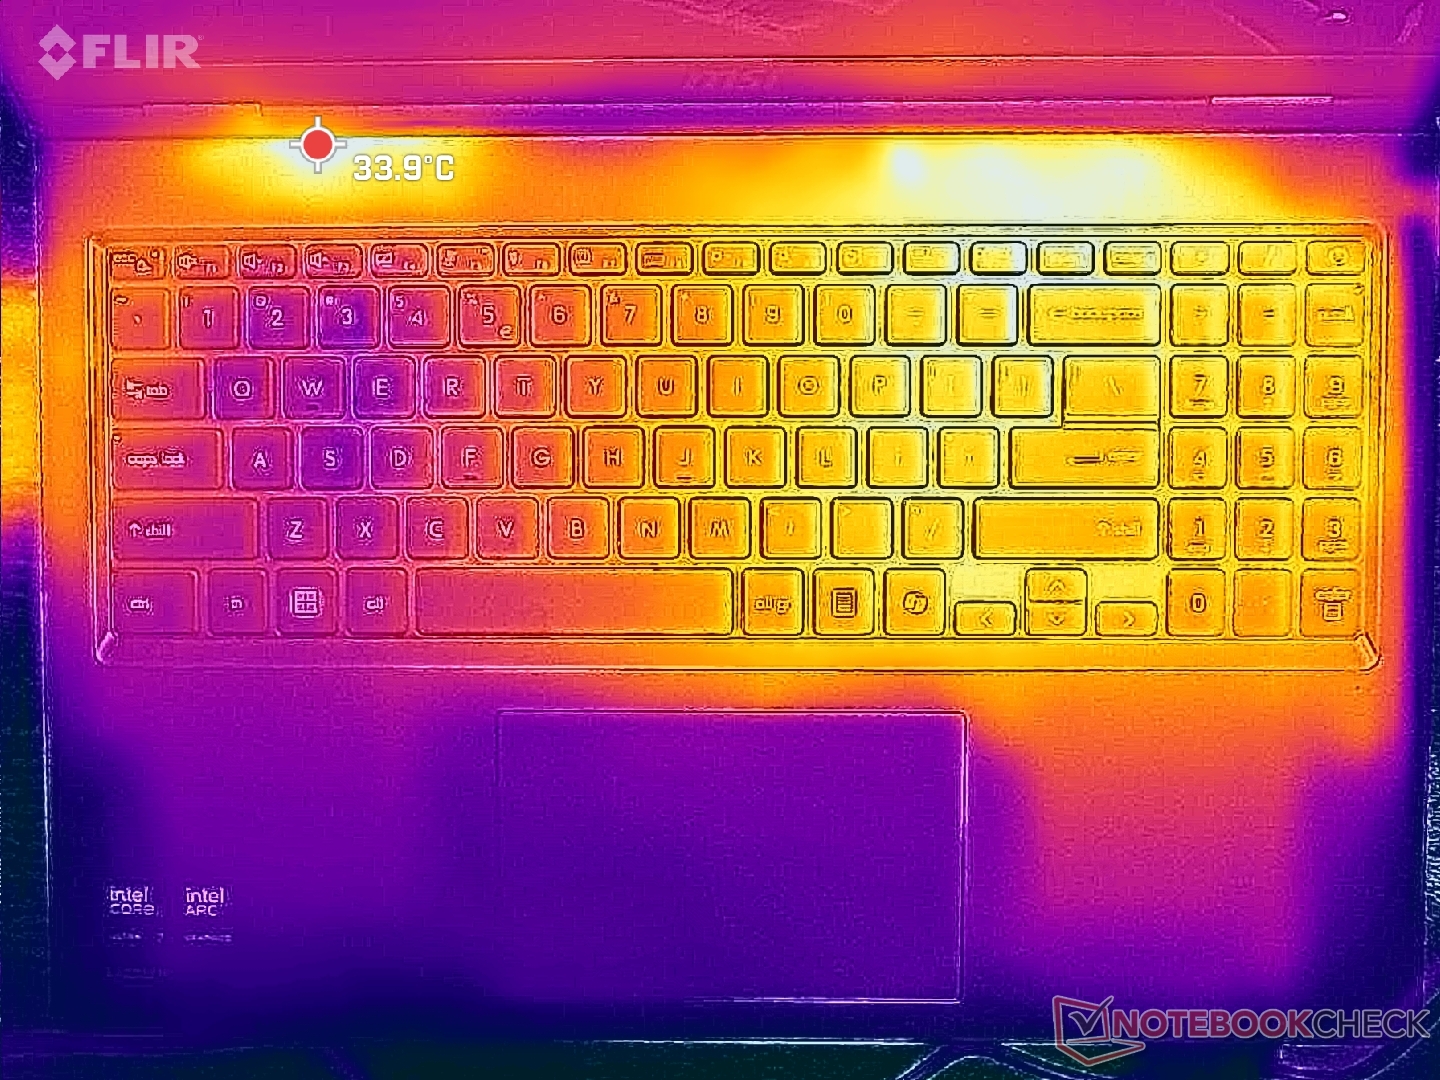
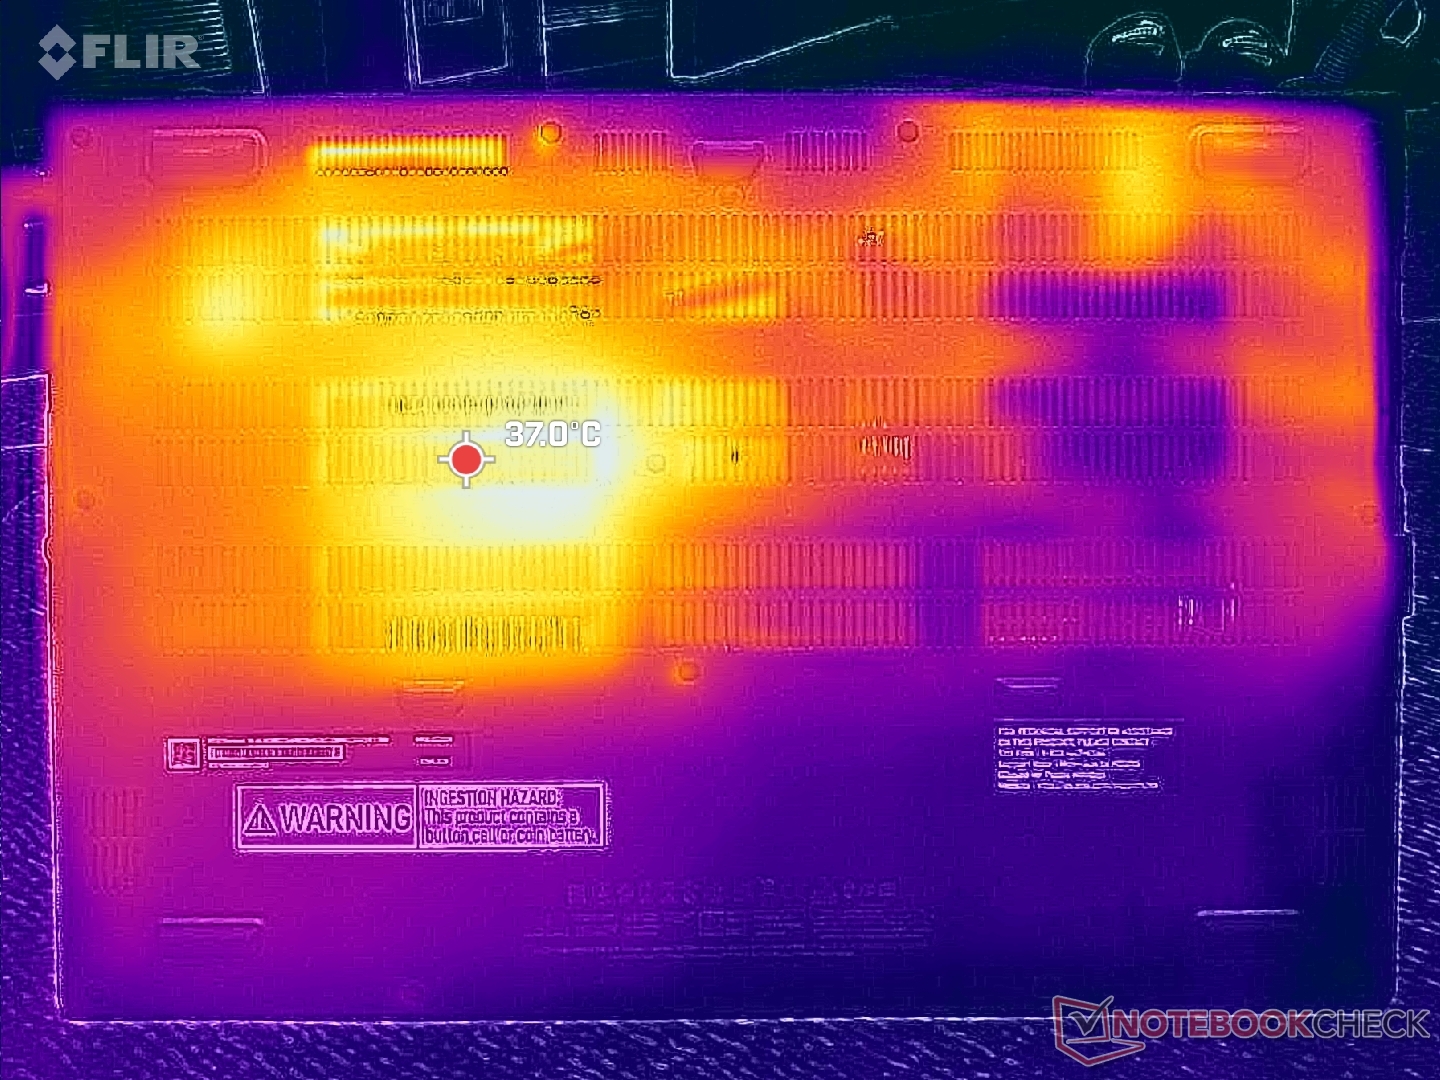
Surface temperature is warmer on the right half of the system than the left. Even so, hot spots reach just 35 C to 37 C due in part to the relatively thick profile.
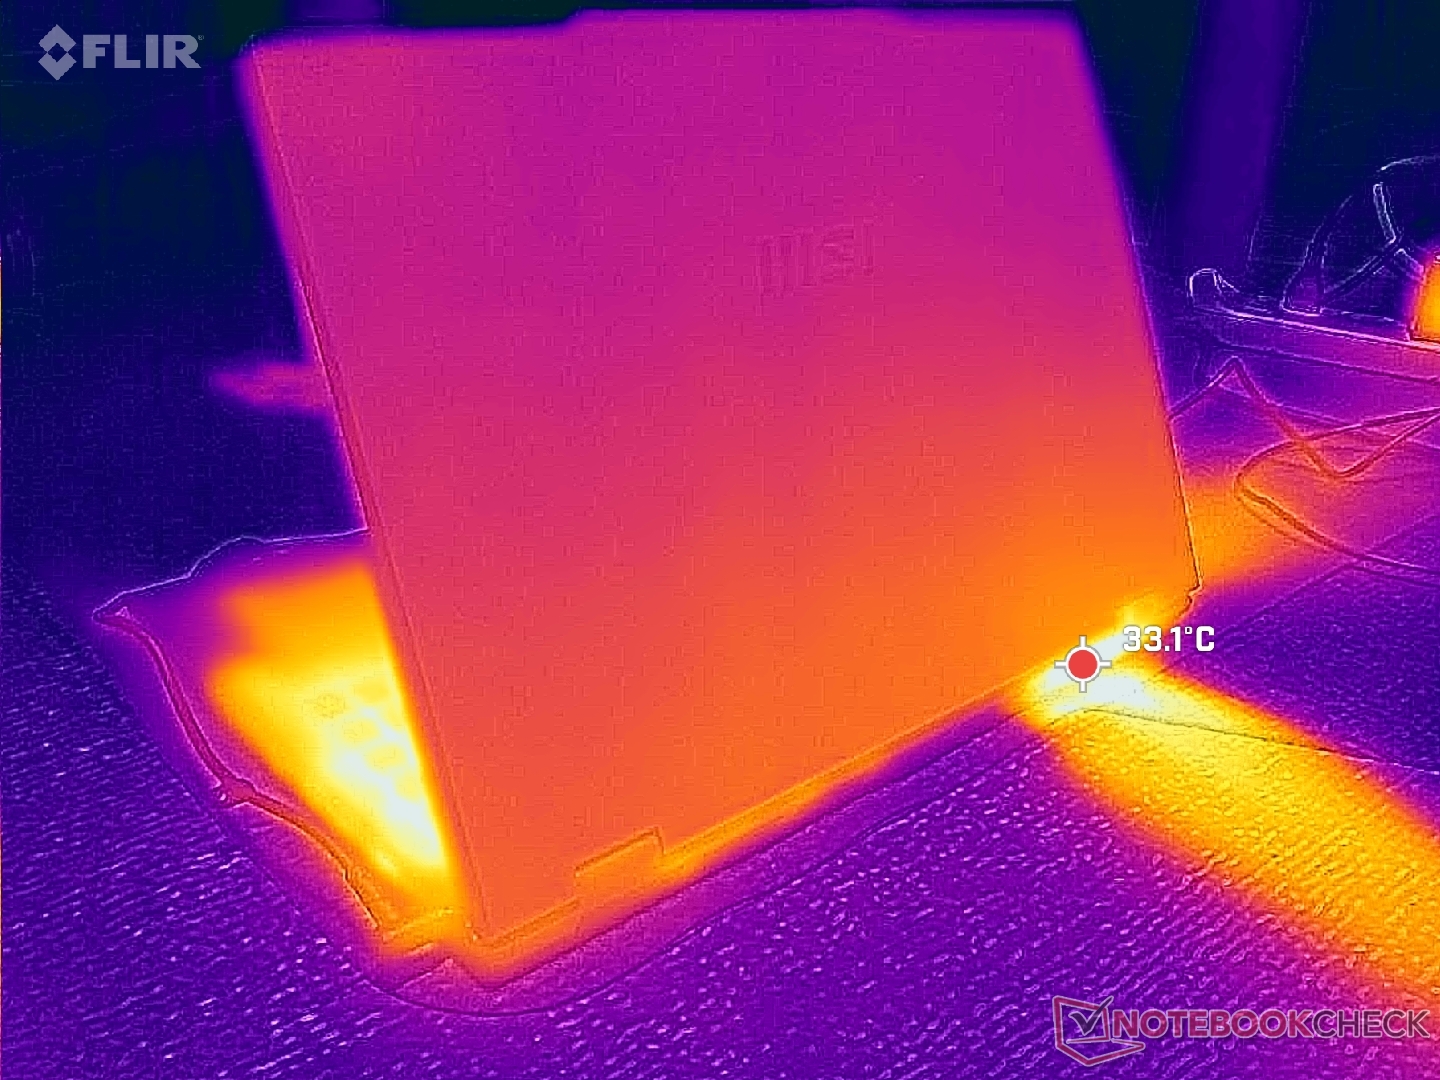
(+) The maximum temperature on the upper side is 35 °C / 95 F, compared to the average of 34.3 °C / 94 F, ranging from 21.2 to 62.5 °C for the class Office.
(+) The bottom heats up to a maximum of 37.4 °C / 99 F, compared to the average of 36.8 °C / 98 F
(+) In idle usage, the average temperature for the upper side is 26.8 °C / 80 F, compared to the device average of 29.5 °C / 85 F.
(+) The palmrests and touchpad are cooler than skin temperature with a maximum of 30.6 °C / 87.1 F and are therefore cool to the touch.
(-) The average temperature of the palmrest area of similar devices was 27.5 °C / 81.5 F (-3.1 °C / -5.6 F).
| MSI Venture 16 AI A2HMTG Ultra 7 255H, Arc 140T | MSI Prestige 16 B1MG-001US Ultra 7 155H, Arc 8-Core | Dell 16 Plus 2-in-1 Core Ultra 7 258V, Arc 140V | Asus V16 V3607V Core 7 240H, GeForce RTX 3050 6GB Laptop GPU | HP Pavilion 16-ag0057ng R5 8540U, Radeon 740M | Lenovo IdeaPad Slim 5 16AKP10 Ryzen AI 5 330, Radeon 820M | |
|---|---|---|---|---|---|---|
| Heat | -5% | -10% | 2% | -2% | 8% | |
| Maximum Upper Side * (°C) | 35 | 48.8 -39% | 44 -26% | 41.2 -18% | 42 -20% | 35 -0% |
| Maximum Bottom * (°C) | 37.4 | 47.6 -27% | 39.4 -5% | 34.4 8% | 44 -18% | 37 1% |
| Idle Upper Side * (°C) | 30.2 | 24.2 20% | 31.8 -5% | 28.8 5% | 26 14% | 26 14% |
| Idle Bottom * (°C) | 33 | 23.6 28% | 34.2 -4% | 29 12% | 28 15% | 27 18% |
* ... smaller is better
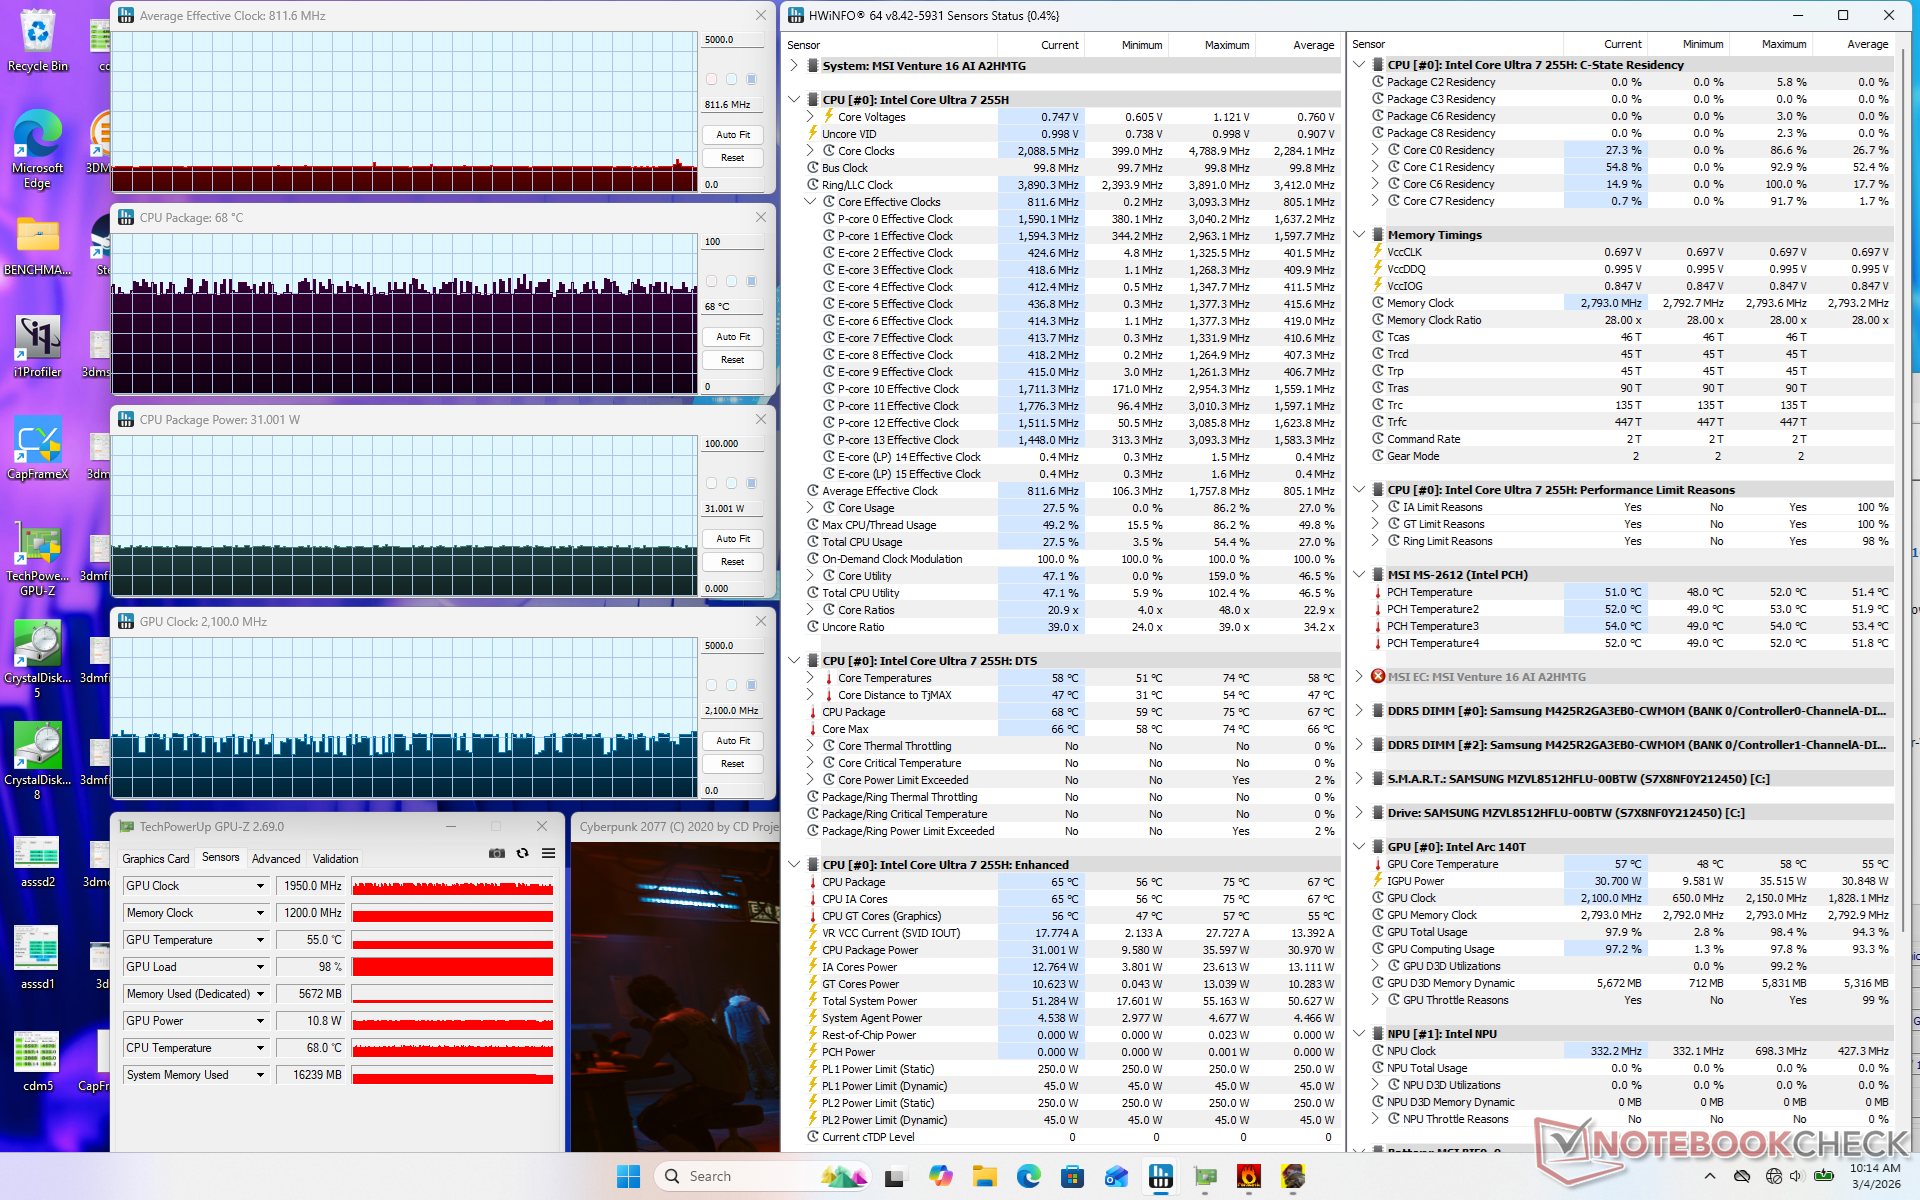
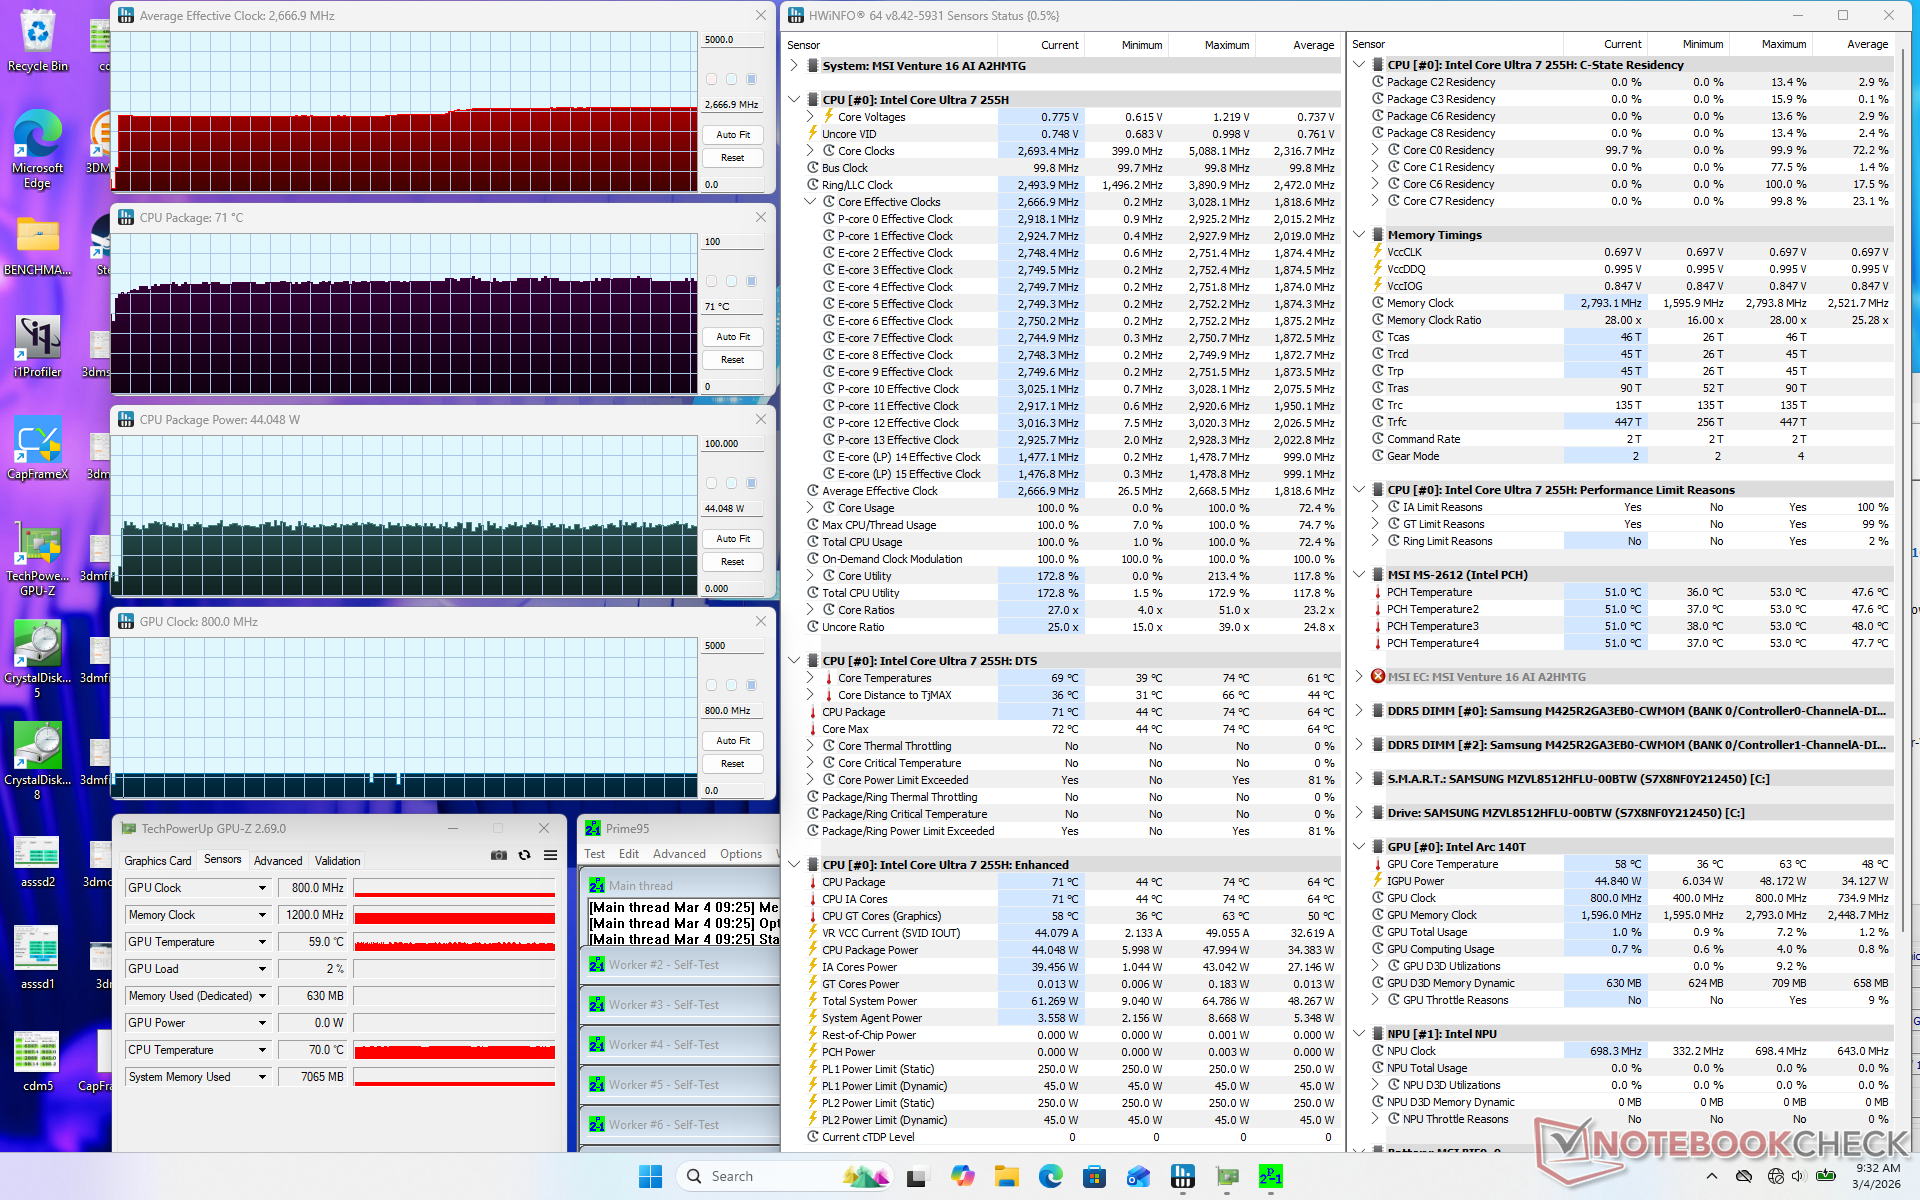
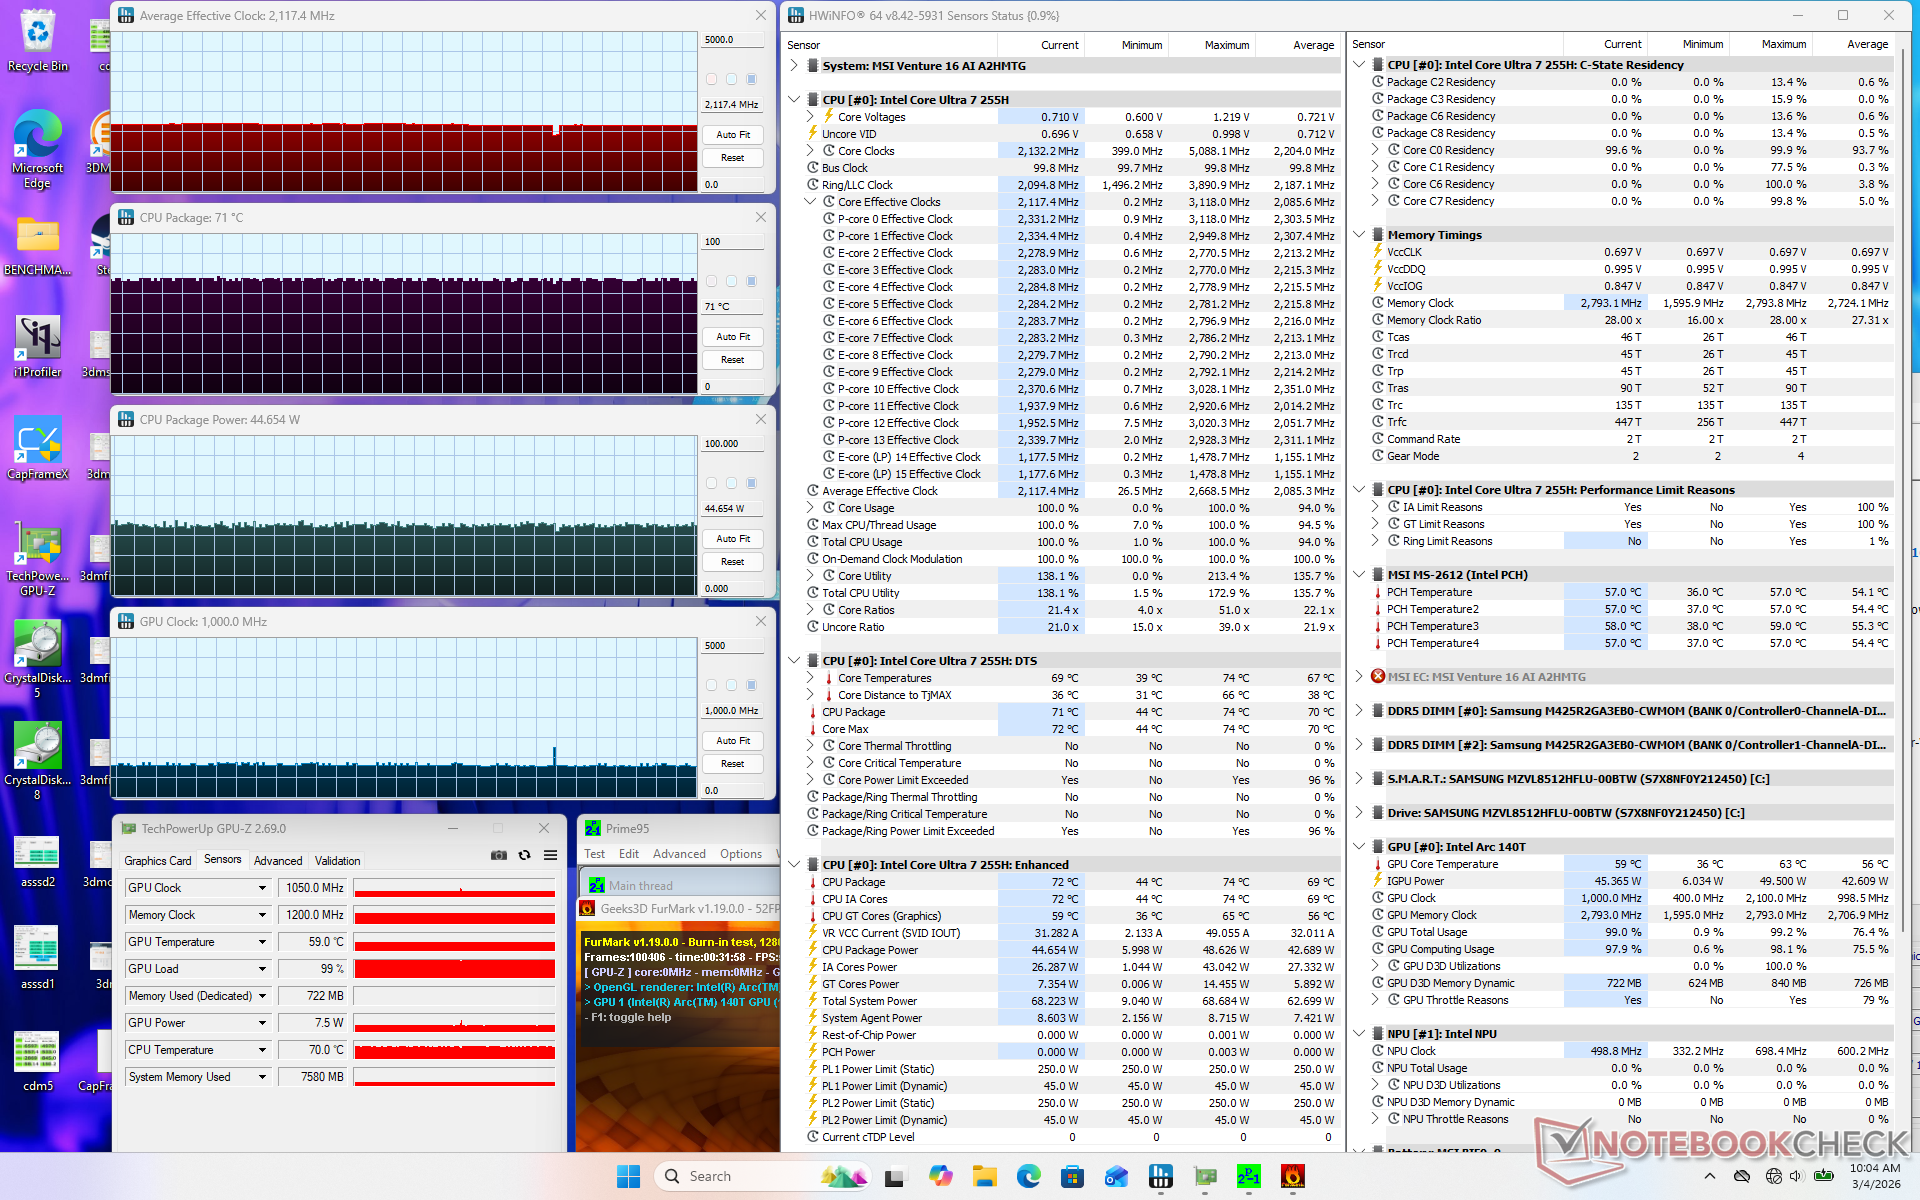
Stress Test
The CPU would stabilize at 2.7 GHz, 71 C, and 44 W when initiating Prime95 stress. Core temperature would remain in the low 70 C range even when under stress compared to the mid 80 C range on the Prestige 16 equipped with a similar Core H-series CPU.
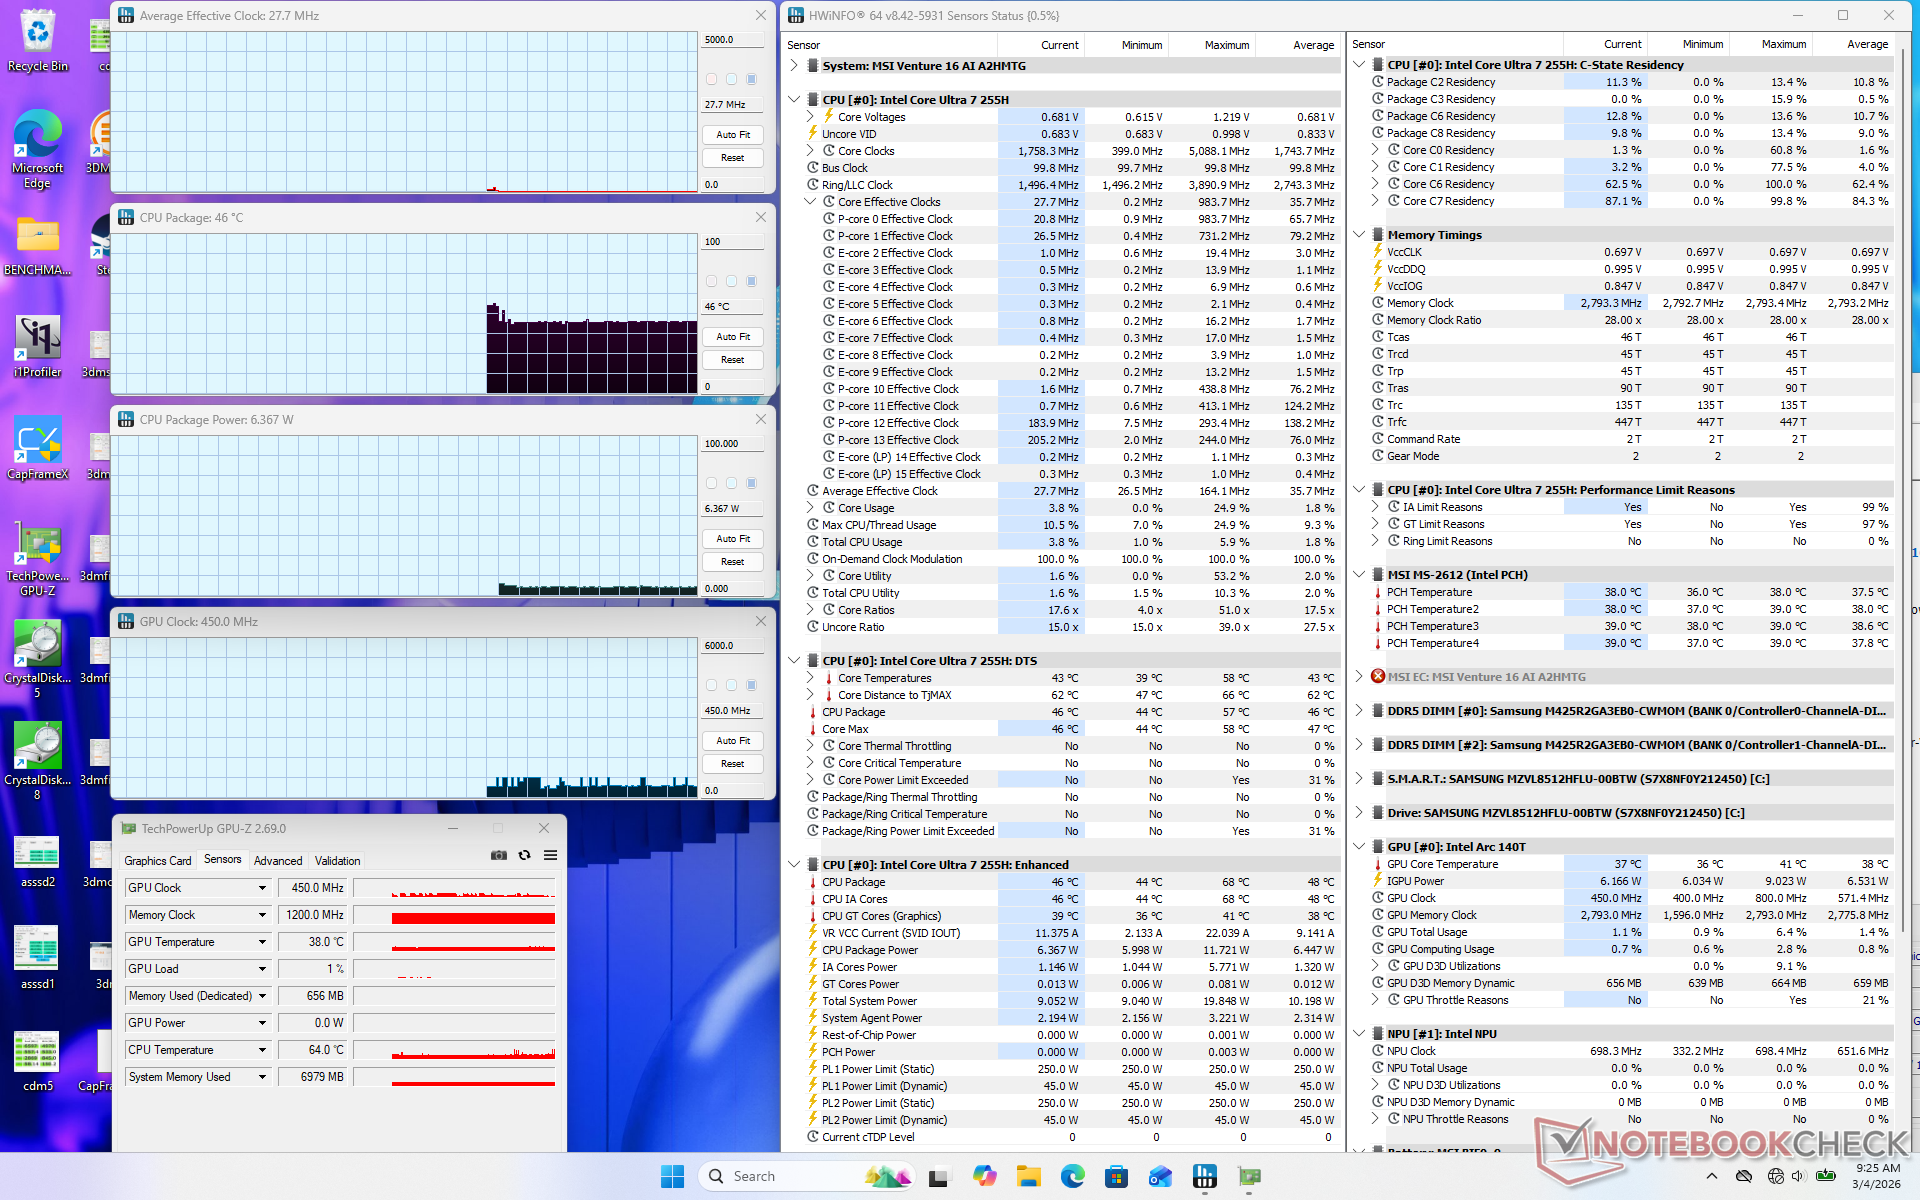
| Average CPU Clock (GHz) | GPU Clock (MHz) | Average CPU Temperature (°C) | |
| System Idle | -- | -- | 46 |
| Prime95 Stress | 2.7 | -- | 71 |
| Prime95 + FurMark Stress | 2.1 | 1000 | 71 |
| Cyberpunk 2077 Stress | 0.8 | 1400 - 2100 | 68 |
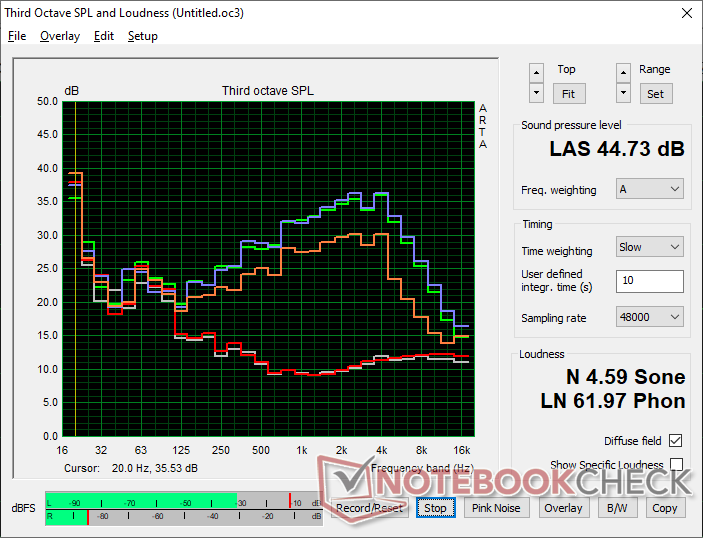
Speakers
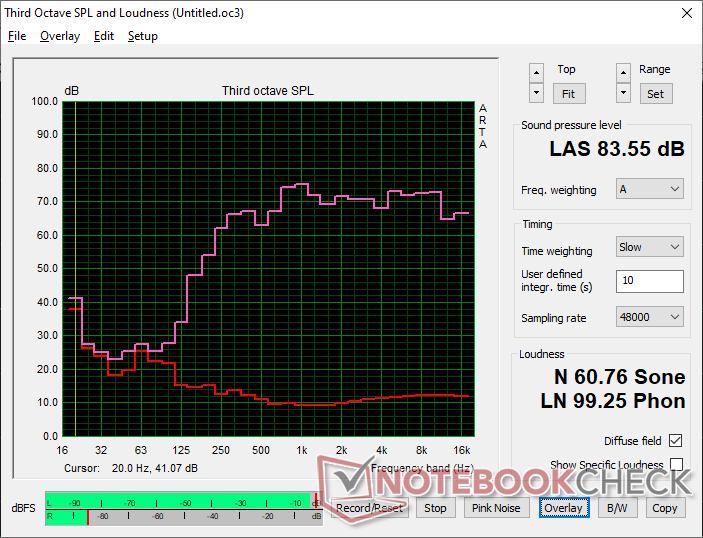
MSI Venture 16 AI A2HMTG audio analysis
(+) | speakers can play relatively loud (83.6 dB)
Bass 100 - 315 Hz
(-) | nearly no bass - on average 19.3% lower than median
(±) | linearity of bass is average (12.2% delta to prev. frequency)
Mids 400 - 2000 Hz
(+) | balanced mids - only 3.6% away from median
(+) | mids are linear (5.8% delta to prev. frequency)
Highs 2 - 16 kHz
(+) | balanced highs - only 3.5% away from median
(+) | highs are linear (2.8% delta to prev. frequency)
Overall 100 - 16.000 Hz
(+) | overall sound is linear (14% difference to median)
Compared to same class
» 9% of all tested devices in this class were better, 4% similar, 87% worse
» The best had a delta of 7%, average was 21%, worst was 53%
Compared to all devices tested
» 16% of all tested devices were better, 4% similar, 80% worse
» The best had a delta of 4%, average was 23%, worst was 134%
Apple MacBook Pro 16 2021 M1 Pro audio analysis
(+) | speakers can play relatively loud (84.7 dB)
Bass 100 - 315 Hz
(+) | good bass - only 3.8% away from median
(+) | bass is linear (5.2% delta to prev. frequency)
Mids 400 - 2000 Hz
(+) | balanced mids - only 1.3% away from median
(+) | mids are linear (2.1% delta to prev. frequency)
Highs 2 - 16 kHz
(+) | balanced highs - only 1.9% away from median
(+) | highs are linear (2.7% delta to prev. frequency)
Overall 100 - 16.000 Hz
(+) | overall sound is linear (4.6% difference to median)
Compared to same class
» 0% of all tested devices in this class were better, 0% similar, 100% worse
» The best had a delta of 5%, average was 17%, worst was 45%
Compared to all devices tested
» 0% of all tested devices were better, 0% similar, 100% worse
» The best had a delta of 4%, average was 23%, worst was 134%
Energy Management
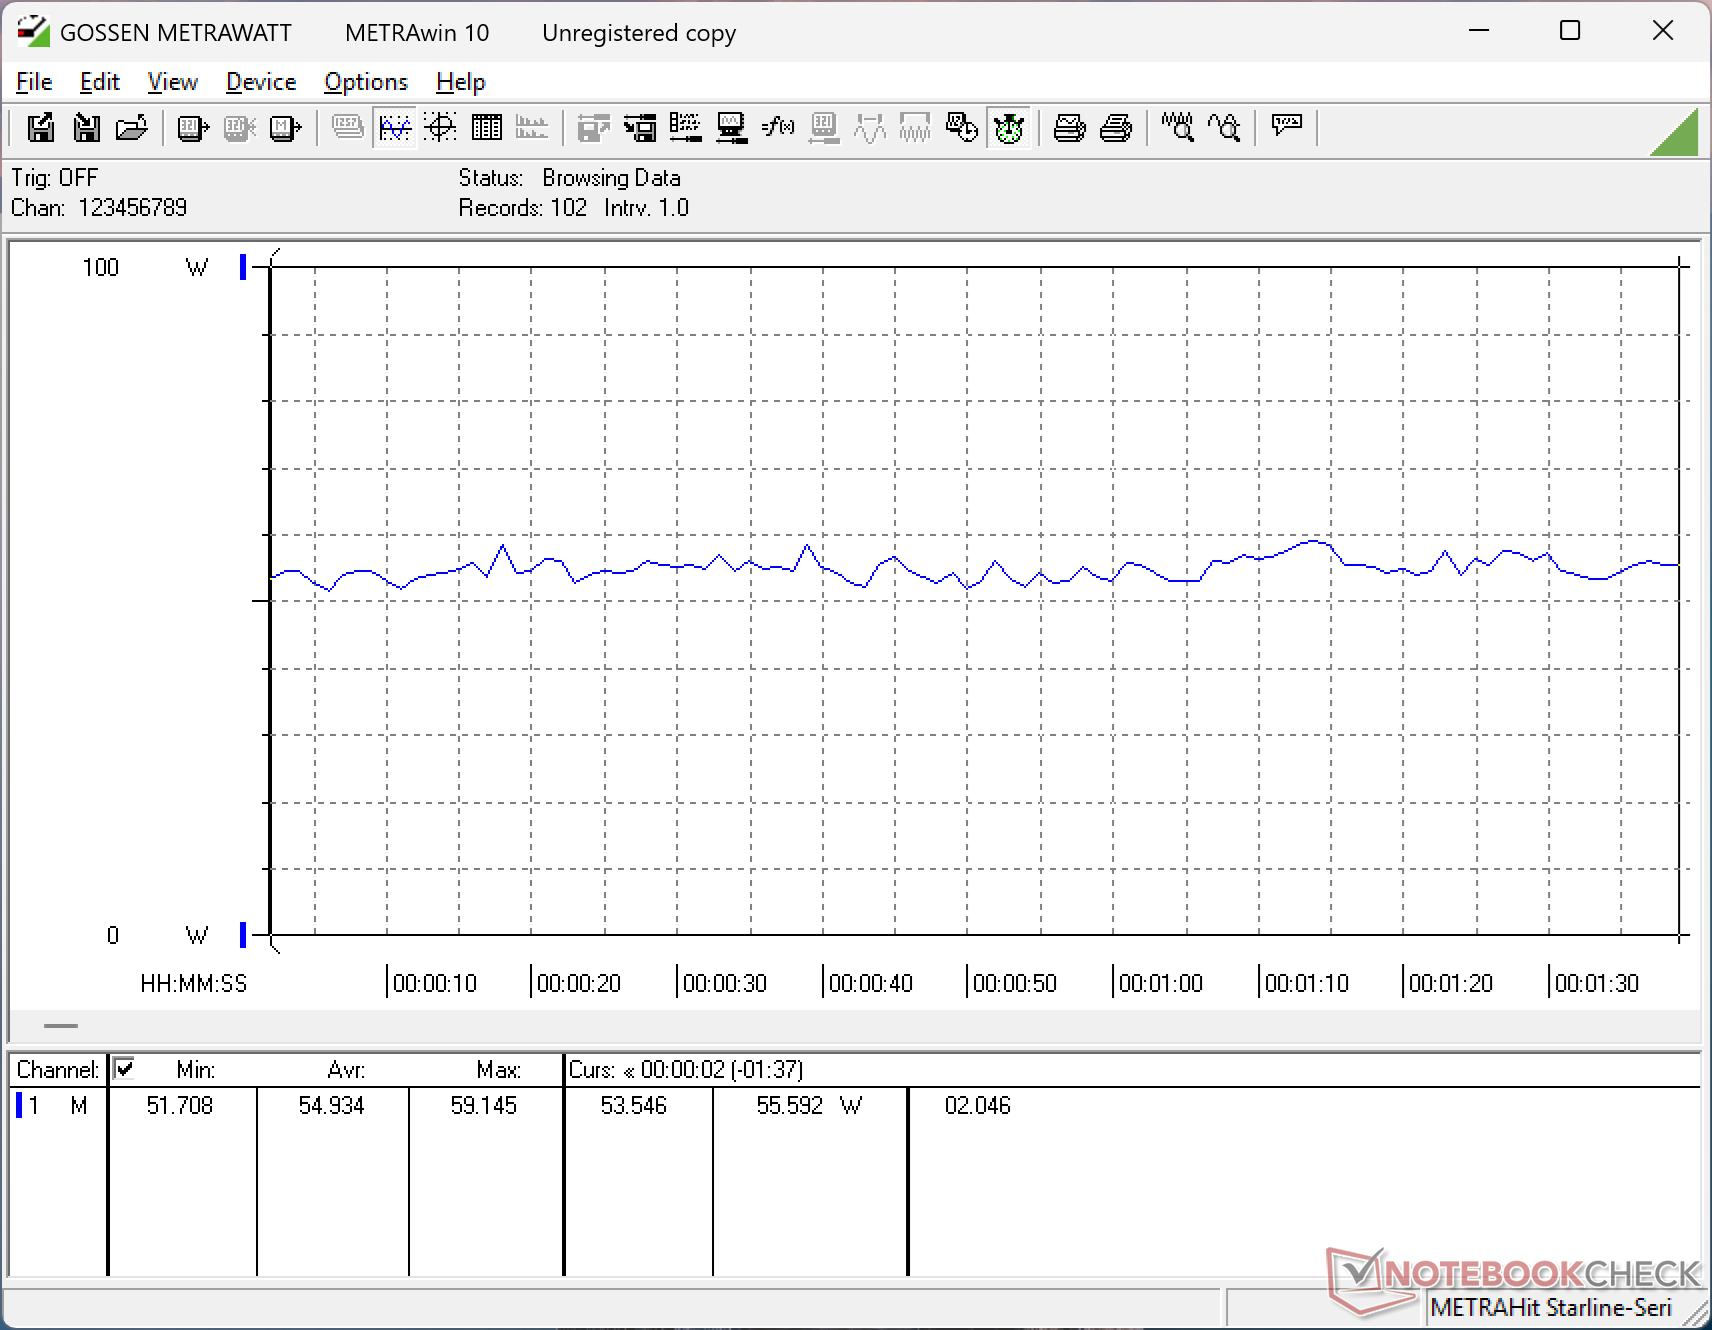
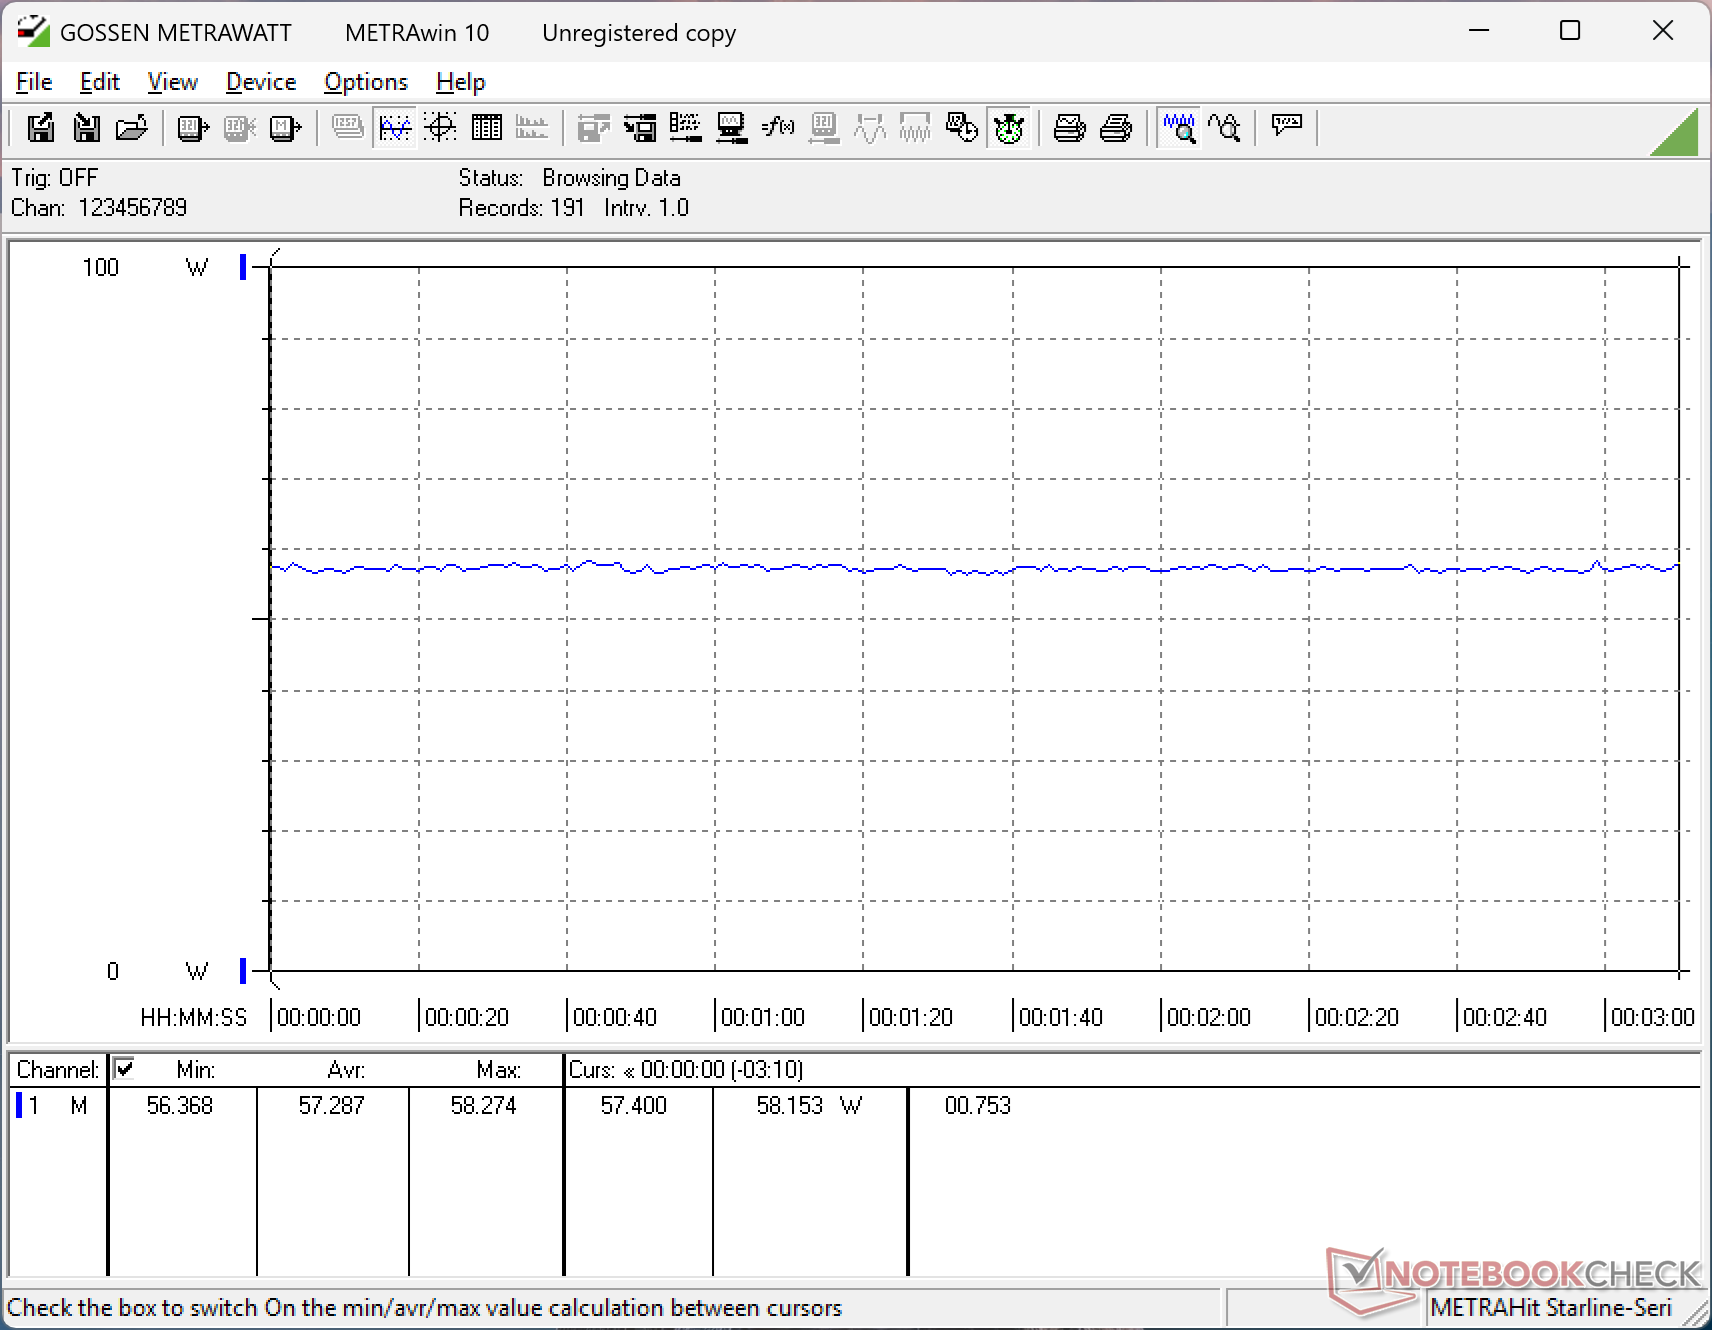
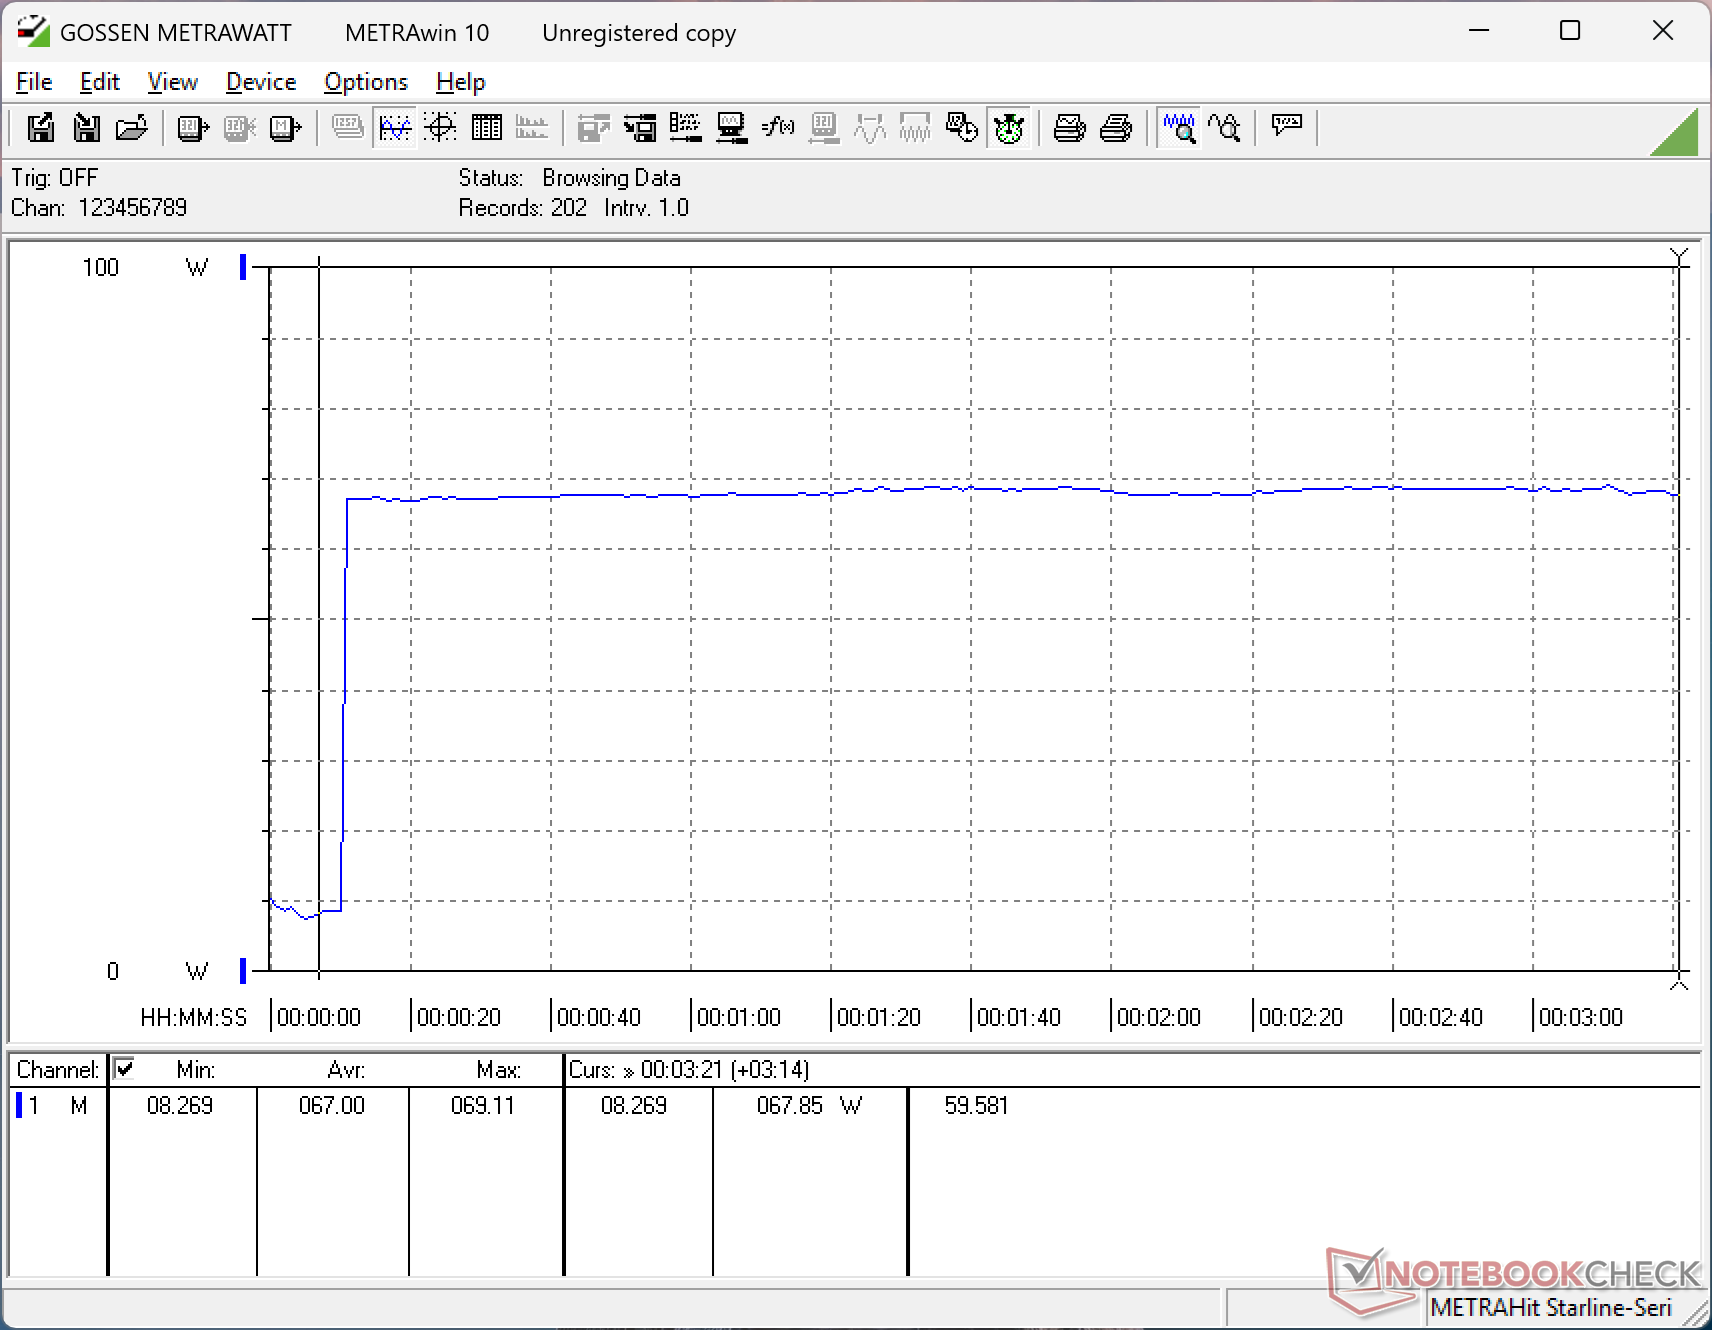
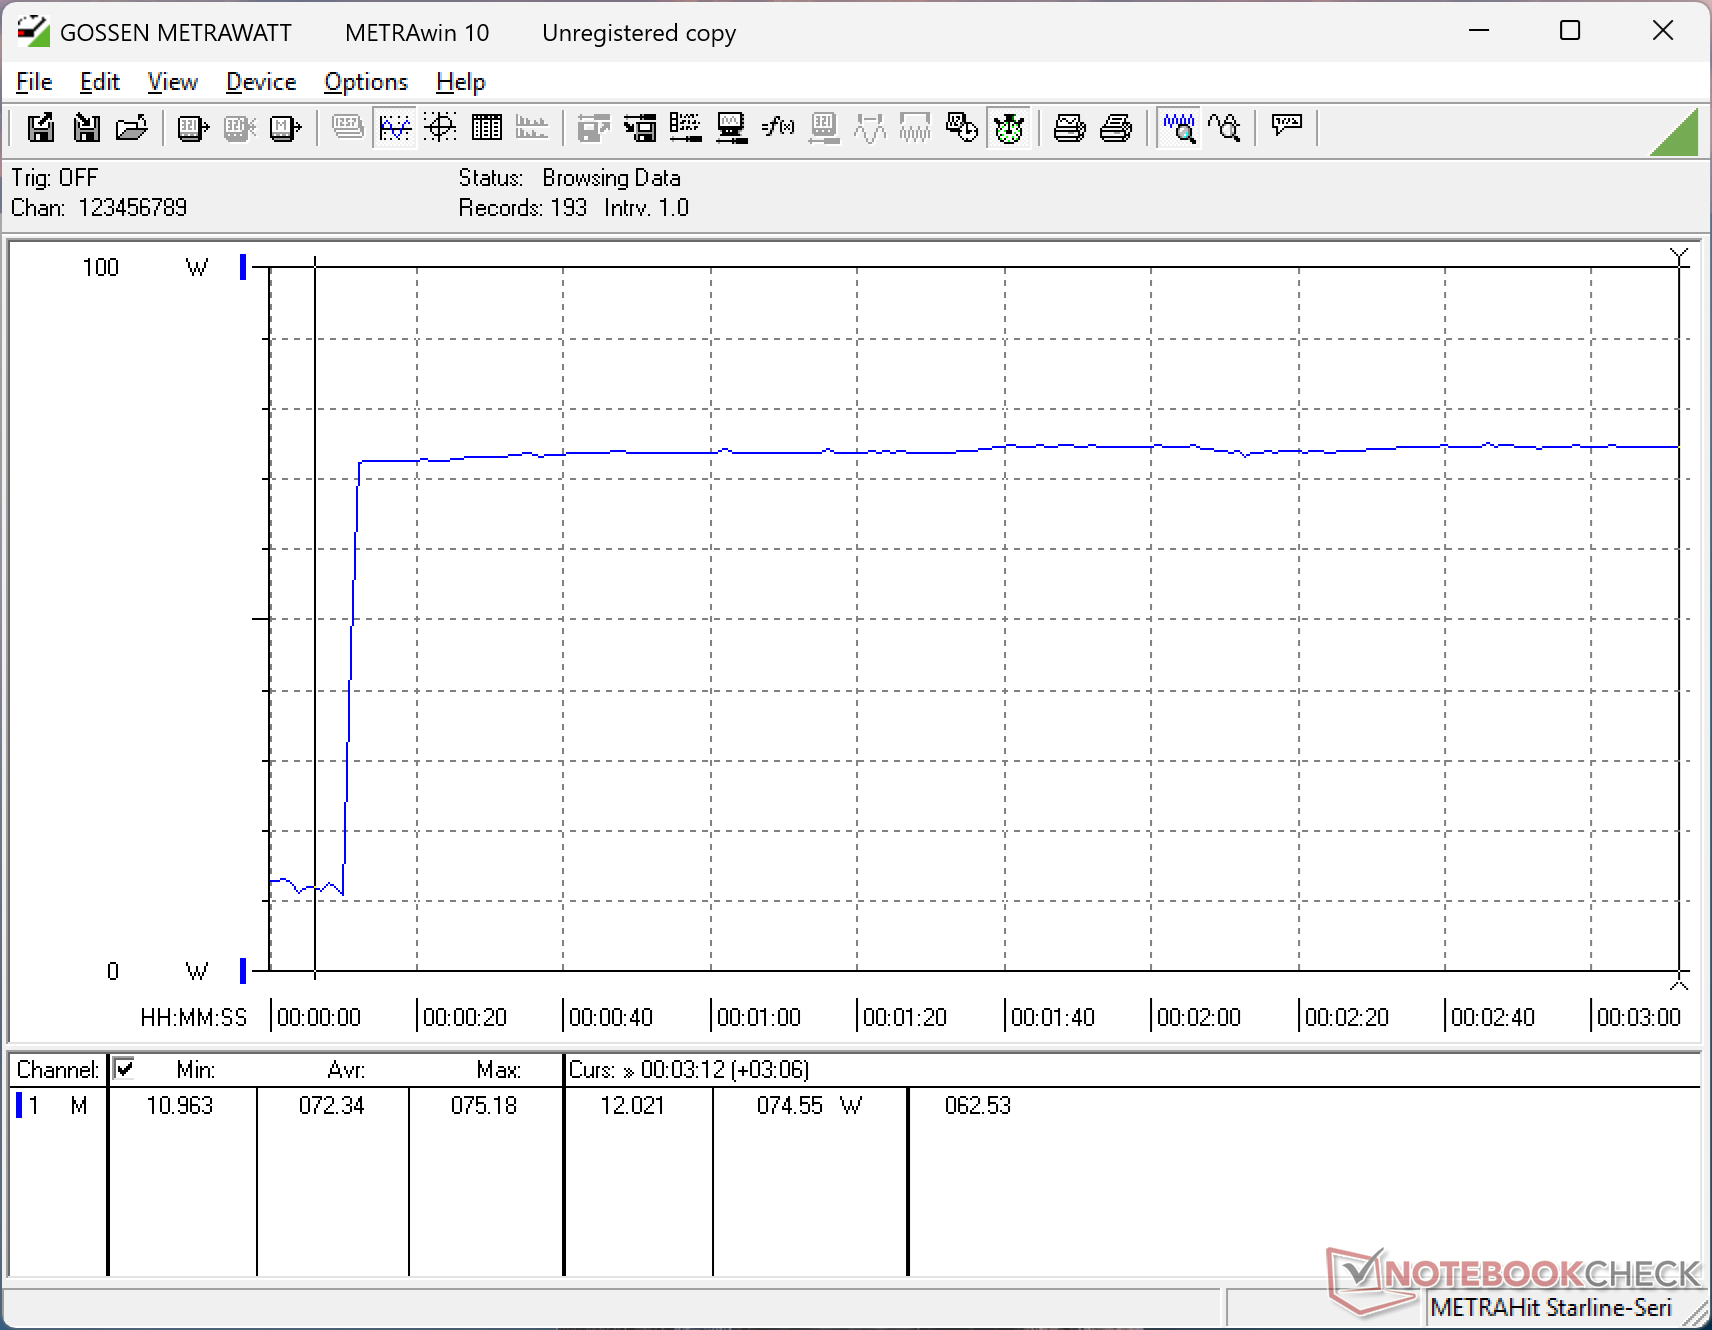
Power Consumption
Overall consumption is generally higher than many other budget-oriented 16-inch laptops largely due to the faster Core-H series CPU. For example, running Prime95 would demand almost 70 W compared to just 40 W on the Lunar Lake-V-powered Dell 16 Plus.
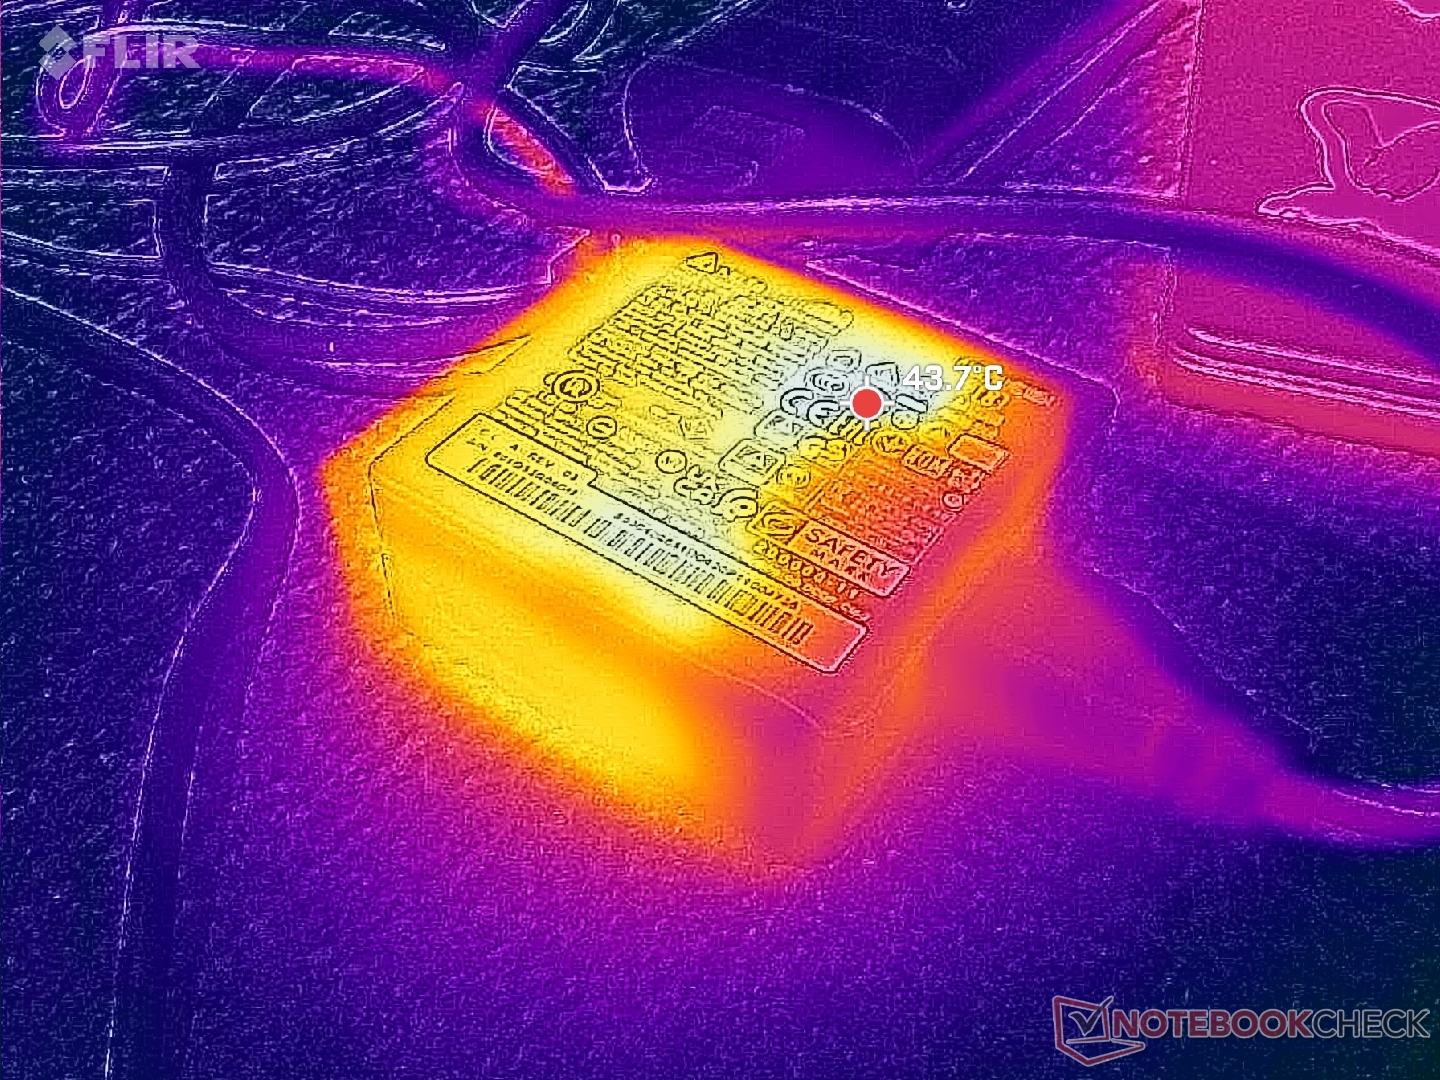
The 90 W AC adapter is quite compact at just ~7.5 x 7.5 x 2.8 cm. However, it's disappointing that the model relies on a barrel AC charger instead of universal USB-C.
| Off / Standby | |
| Idle | |
| Load |
|
Key:
min: | |
| MSI Venture 16 AI A2HMTG Ultra 7 255H, Arc 140T, , IPS, 1920x1200, 16" | MSI Prestige 16 B1MG-001US Ultra 7 155H, Arc 8-Core, Samsung PM9A1 MZVL22T0HBLB, IPS, 2560x1600, 16" | Dell 16 Plus 2-in-1 Core Ultra 7 258V, Arc 140V, Samsung BM9C1 1024GB, Mini-LED, 2560x1600, 16" | Asus V16 V3607V Core 7 240H, GeForce RTX 3050 6GB Laptop GPU, Samsung PM9C1 MZVL8512HELU, IPS, 1920x1200, 16" | HP Pavilion 16-ag0057ng R5 8540U, Radeon 740M, SK hynix BC901 HFS001TEJ4X164N, IPS, 1920x1200, 16" | Lenovo IdeaPad Slim 5 16AKP10 Ryzen AI 5 330, Radeon 820M, Western Digital PC SN5000S SDEPMSJ-512G, IPS, 1920x1200, 16" | |
|---|---|---|---|---|---|---|
| Power Consumption | -10% | -4% | -32% | 33% | 22% | |
| Idle Minimum * (Watt) | 5.9 | 3 49% | 7 -19% | 2.1 64% | 4 32% | 5.2 12% |
| Idle Average * (Watt) | 9 | 9.5 -6% | 13.2 -47% | 7.2 20% | 5 44% | 6 33% |
| Idle Maximum * (Watt) | 9.7 | 12 -24% | 13.4 -38% | 10.7 -10% | 6 38% | 7.7 21% |
| Load Average * (Watt) | 54.9 | 68.3 -24% | 43.9 20% | 99.4 -81% | 40 27% | 44 20% |
| Cyberpunk 2077 ultra * (Watt) | 57.3 | 44.9 22% | 92.1 -61% | 43 25% | 43 25% | |
| Cyberpunk 2077 ultra external monitor * (Watt) | 54.2 | 40.7 25% | 88.7 -64% | 39.1 28% | 40.4 25% | |
| Load Maximum * (Watt) | 72.3 | 104.8 -45% | 67.8 6% | 137.8 -91% | 46 36% | 58 20% |
| Witcher 3 ultra * (Watt) | 59.8 |
* ... smaller is better
Power Consumption Cyberpunk / Stress Test
Power Consumption external Monitor
Battery Life
WLAN runtime is decent at about 7 hours from the relatively small 55 Wh battery capacity.
| MSI Venture 16 AI A2HMTG Ultra 7 255H, Arc 140T, 55.2 Wh | MSI Prestige 16 B1MG-001US Ultra 7 155H, Arc 8-Core, 99.9 Wh | Dell 16 Plus 2-in-1 Core Ultra 7 258V, Arc 140V, 64 Wh | Asus V16 V3607V Core 7 240H, GeForce RTX 3050 6GB Laptop GPU, 63 Wh | HP Pavilion 16-ag0057ng R5 8540U, Radeon 740M, 59 Wh | Lenovo IdeaPad Slim 5 16AKP10 Ryzen AI 5 330, Radeon 820M, 60 Wh | |
|---|---|---|---|---|---|---|
| Battery runtime | 161% | 27% | 29% | 63% | 50% | |
| WiFi v1.3 (h) | 7 | 18.3 161% | 8.9 27% | 9 29% | 11.4 63% | 10.5 50% |
| Reader / Idle (h) | 25.1 | |||||
| Load (h) | 2.8 |
Notebookcheck Rating
The Venture 16 AI is one of the more basic MSI offerings with good serviceability but otherwise limited capabilities especially at the base configuration.
MSI Venture 16 AI A2HMTG
- 03/06/2026 v8
Allen Ngo
 Total Sustainability Score:
 Potential Competitors in Comparison
Image | Model / Review | Price | Weight | Height | Display |
|---|---|---|---|---|---|
1. 80.7%  | MSI Venture 16 AI A2HMTG Intel Core Ultra 7 255H ⎘ Intel Arc Graphics 140T ⎘ 32 GB Memory | Amazon: List Price: 1000 USD | 2.1 kg | 23.15 mm | 16.00" 1920x1200 142 PPI IPS |
2. 88.1% v7 (old)  | MSI Prestige 16 B1MG-001US Intel Core Ultra 7 155H ⎘ Intel Arc 8-Core iGPU ⎘ 32 GB Memory, 2048 GB SSD | Amazon: 1. $43.99 AC Adapter Charger Compatibl... 2. $130.00 16.0 inch WQXGA 2560(RGB)*16... 3. $1,479.00 MSI Prestige 16 AI+ Evo 16" ... List Price: 1300 USD | 1.6 kg | 19.1 mm | 16.00" 2560x1600 189 PPI IPS |
3. 83.5%  | Dell 16 Plus 2-in-1 Intel Core Ultra 7 258V ⎘ Intel Arc Graphics 140V ⎘ 32 GB Memory, 1024 GB SSD | Amazon: $1,149.99 List Price: 1500 USD | 2 kg | 16.99 mm | 16.00" 2560x1600 189 PPI Mini-LED |
4. 78.5%  | Asus V16 V3607V Intel Core 7 240H ⎘ NVIDIA GeForce RTX 3050 6GB Laptop GPU ⎘ 16 GB Memory, 512 GB SSD | Amazon: 1. $49.99 180W 150W 20V 9A Charger for... 2. $125.98 KrystalPix Replacement LCD f... 3. $125.98 KrystalPix Replacement LCD f... List Price: 900 USD | 2 kg | 22 mm | 16.00" 1920x1200 142 PPI IPS |
5. 77.3%  | HP Pavilion 16-ag0057ng AMD Ryzen 5 8540U ⎘ AMD Radeon 740M ⎘ 16 GB Memory, 1024 GB SSD | Amazon: List Price: 730 EUR | 1.7 kg | 18.6 mm | 16.00" 1920x1200 142 PPI IPS |
6. 80.8%  | Lenovo IdeaPad Slim 5 16AKP10 AMD Ryzen AI 5 330 ⎘ AMD Radeon 820M ⎘ 16 GB Memory, 512 GB SSD | Amazon: List Price: 700 EUR | 1.9 kg | 18.4 mm | 16.00" 1920x1200 142 PPI IPS |
Transparency
The selection of devices to be reviewed is made by our editorial team. The test sample was provided to the author as a loan by the manufacturer or retailer for the purpose of this review. The lender had no influence on this review, nor did the manufacturer receive a copy of this review before publication. There was no obligation to publish this review. As an independent media company, Notebookcheck is not subjected to the authority of manufacturers, retailers or publishers.
This is how Notebookcheck is testing
Every year, Notebookcheck independently reviews hundreds of laptops and smartphones using standardized procedures to ensure that all results are comparable. We have continuously developed our test methods for around 20 years and set industry standards in the process. In our test labs, high-quality measuring equipment is utilized by experienced technicians and editors. These tests involve a multi-stage validation process. Our complex rating system is based on hundreds of well-founded measurements and benchmarks, which maintains objectivity. Further information on our test methods can be found here.
