Verdict — Large And Powerful With Carefully Cut Corners
The Crosshair 18 HX is notable for being less expensive than most other 18-inch gaming laptops and even many 16-inch models for that matter. It achieves this by trimming away enthusiast-level niceties like vapor chamber cooling, fancy 4K or mini-LED options, metal alloy materials, or GeForce RTX 5080 or 5090 performance for lower starting prices. Gamers and editors who just want the spacious screen without the extreme prices may find the Crosshair 18 HX appealing especially since it still ships with the same Core Ultra 9 275HX CPU as found on pricier alternatives.
The biggest drawbacks to the model are arguably its native QHD+ resolution and overly plastic construction. PPI is relatively low for an 18-inch screen while the fingerprint-loving keyboard deck and base don't feel very luxurious. It's still a decent 1080p or 1440p gaming machine with a high quality P3 display that mainstream gamers and students can equally appreciate.
Pros
Cons
Price and Availability
The MSI Crosshair 18 HX as configured in this review is now available at Costco.com for $1700. Amazon has the Crosshair A18 HX AMD version for over $3000.
- $1,799.99msi Crosshair 18 HX AI 18" 2560x1600 240Hz Display Gaming Laptop, Intel Core Ultra 9 275HX (24 Cores, 2.1-5.4 GHz), NVIDIA RTX 5070 8GB GDDR7, 32GB RAM, 1TB NVMe SSD, Windows 11 Home
- $2,045.99msi Crosshair 18 HX AI Gaming Laptop 18" QHD+ 240Hz 100% DCI-P3 Intel 24-core Ultra 9 275HX (>i9-14900HX) 32GB DDR5 1TB SSD GeForce RTX 5070 (Up to 798 AI Tops) RGB Backlit WiFi6E Win11Pro ICP Hub
- $1,899.99msi Crosshair 18 HX AI 18" 2560x1600 240Hz Display Gaming Laptop, Intel Core Ultra 9 275HX, NVIDIA RTX 5070 8GB GDDR7, 32GB RAM, 2TB NVMe SSD, Windows 11 Home, w/ZYN HDMI Cable
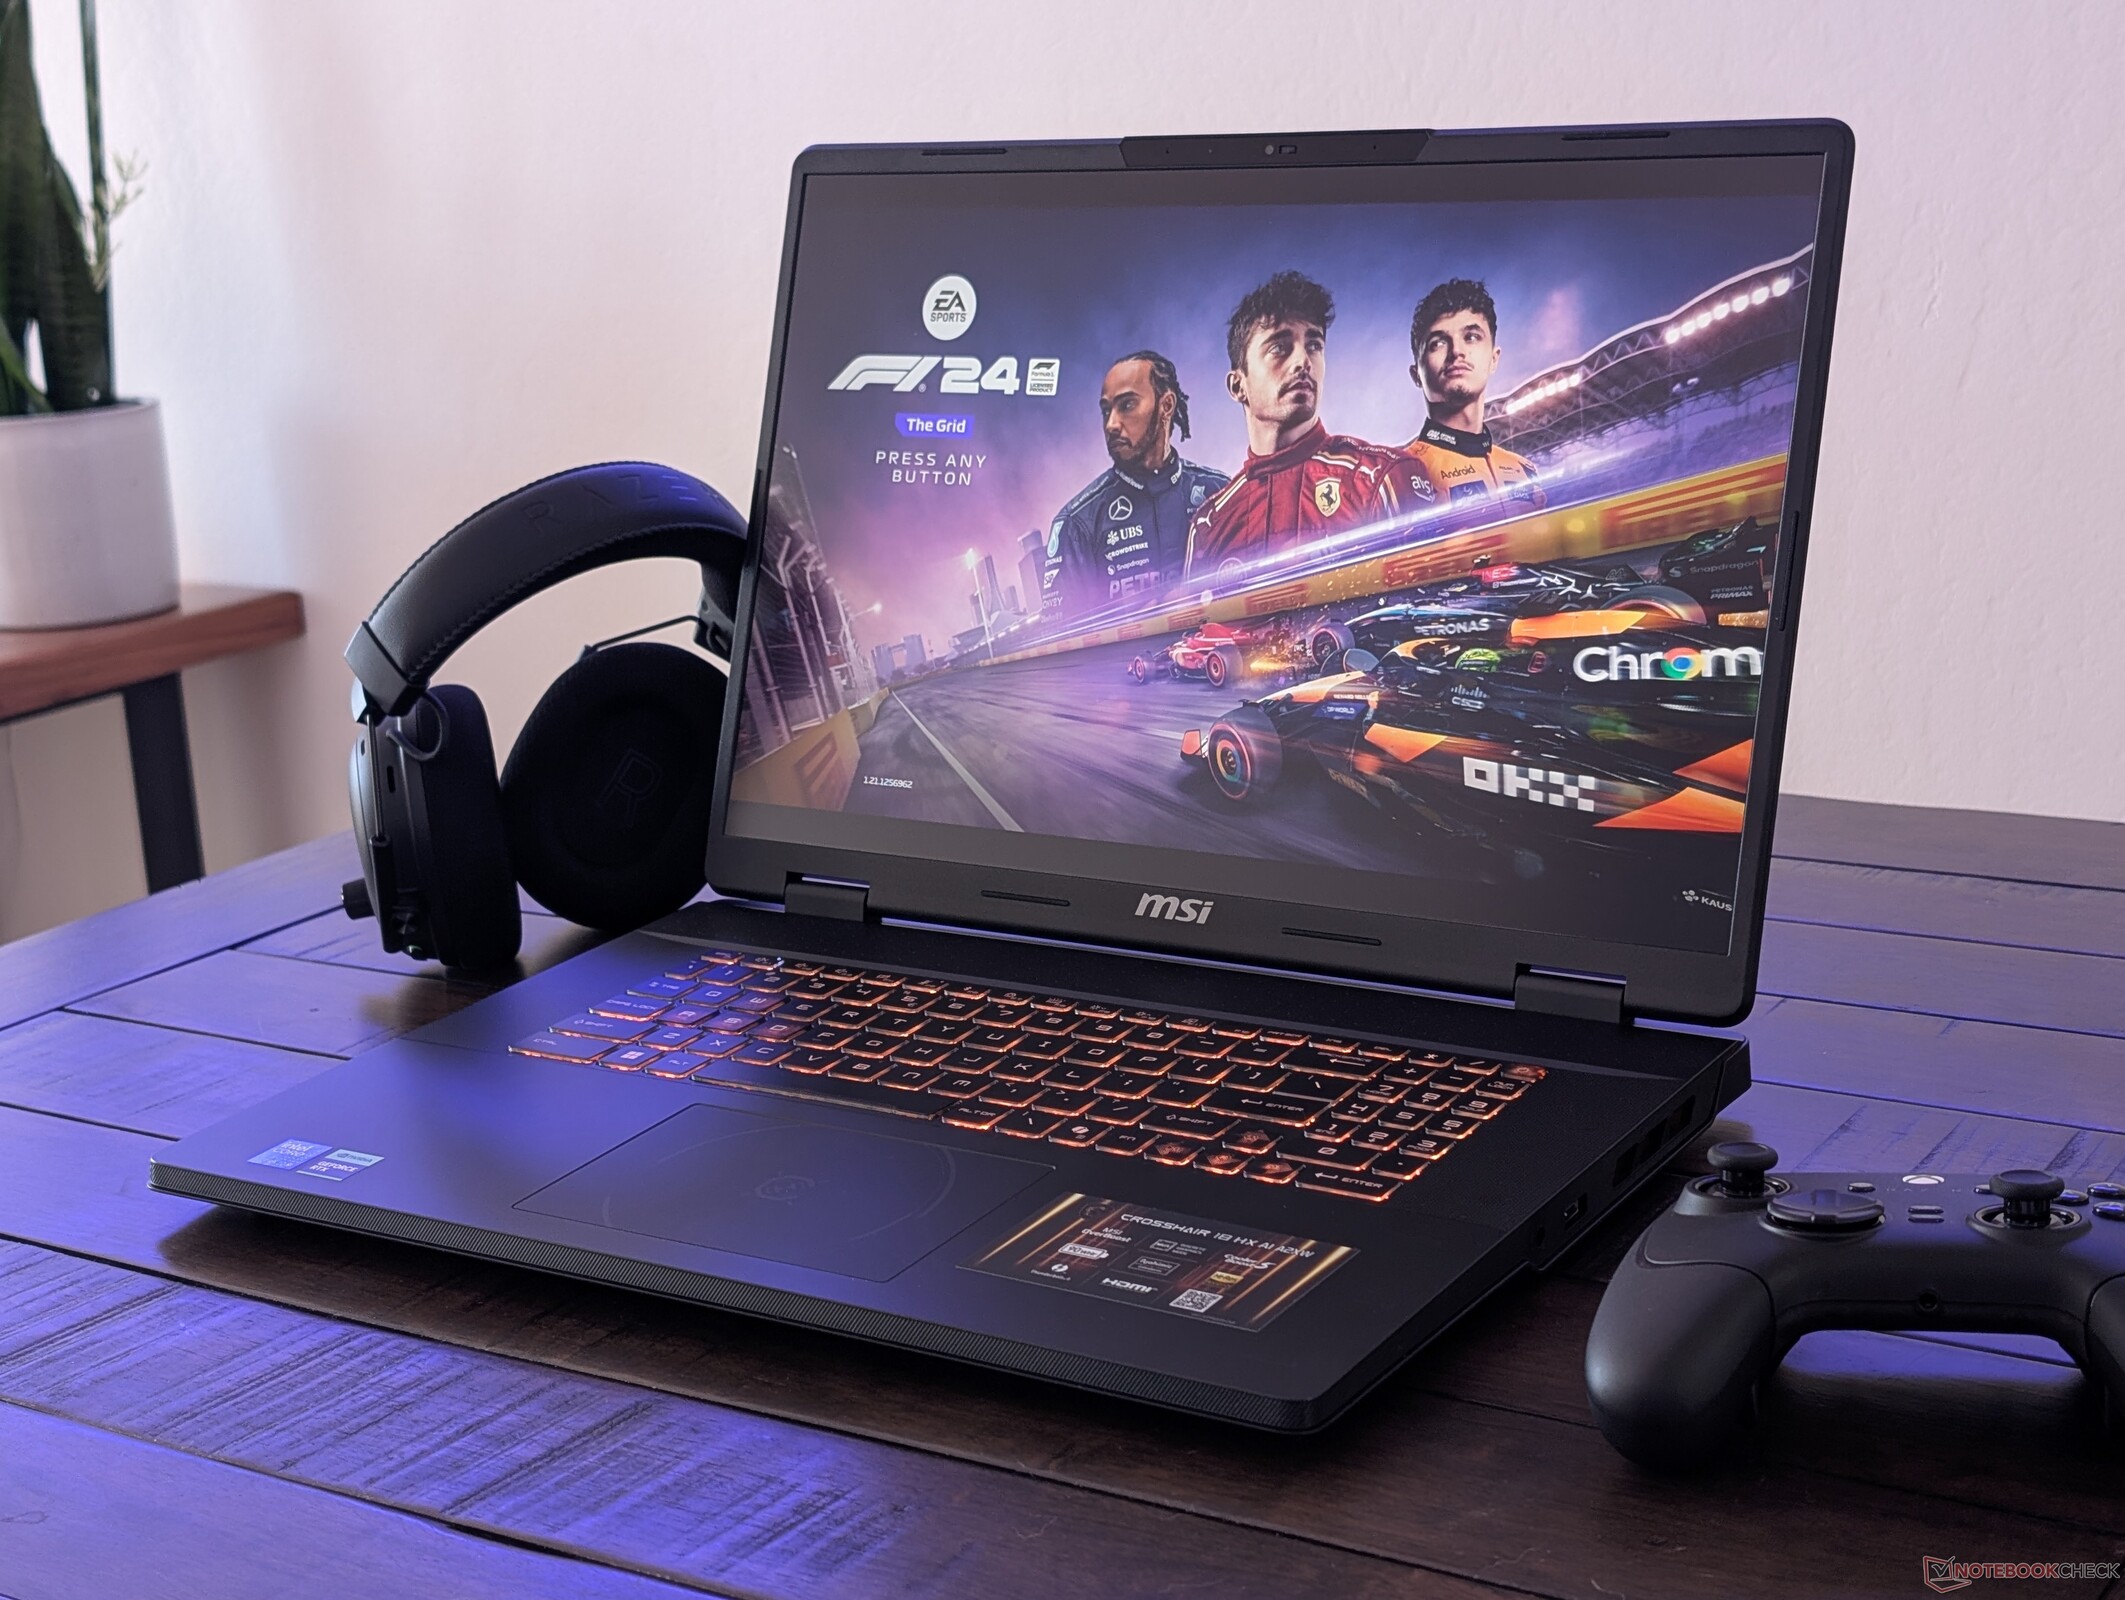
The Crosshair 18 HX is a large 18-inch midrange gaming laptop from MSI to contrast the pricier Vector 18, Stealth 18, Raider 18, or Titan 18 series. It tops out at the 115 W GeForce RTX 5070 GPU and QHD+ display to save on costs whereas most other 18-inch gaming laptops can be configured with faster RTX 5090 or 4K UHD options.
Our unit in review is a higher-end configuration with the Core Ultra 9 275HX, 115 W RTX 5070 GPU, and QHD+ 240 Hz display for approximately $1700. Lesser configurations may ship with the Core Ultra 7 255HX CPU and RTX 5060 instead.
Alternatives include other 18-inch gaming laptops like the Acer Predator Helios 18 or Asus ROG Strix G18, but such options also tend to be more expensive. The 18-inch Crosshair 18 shares many physical characteristics with the AMD-powered 17-inch Crosshair A17 including their keyboards and ports.
More MSI reviews:
Specifications
Case
The chassis is largely plastic to save on costs much like on the Crosshair A17. Our 18-inch model is about 200 g heavier than the A17 while sharing the same thickness.

Connectivity


Communication
Webcam
The camera is only 720p with no IR support to save on costs. A physical shutter comes standard.


Maintenance

Input Devices
The keyboard is identical to the one on the Crosshair A17 for the same typing experience. Meanwhile, the clickpad is slightly larger at ~13 x 8.2 cm.

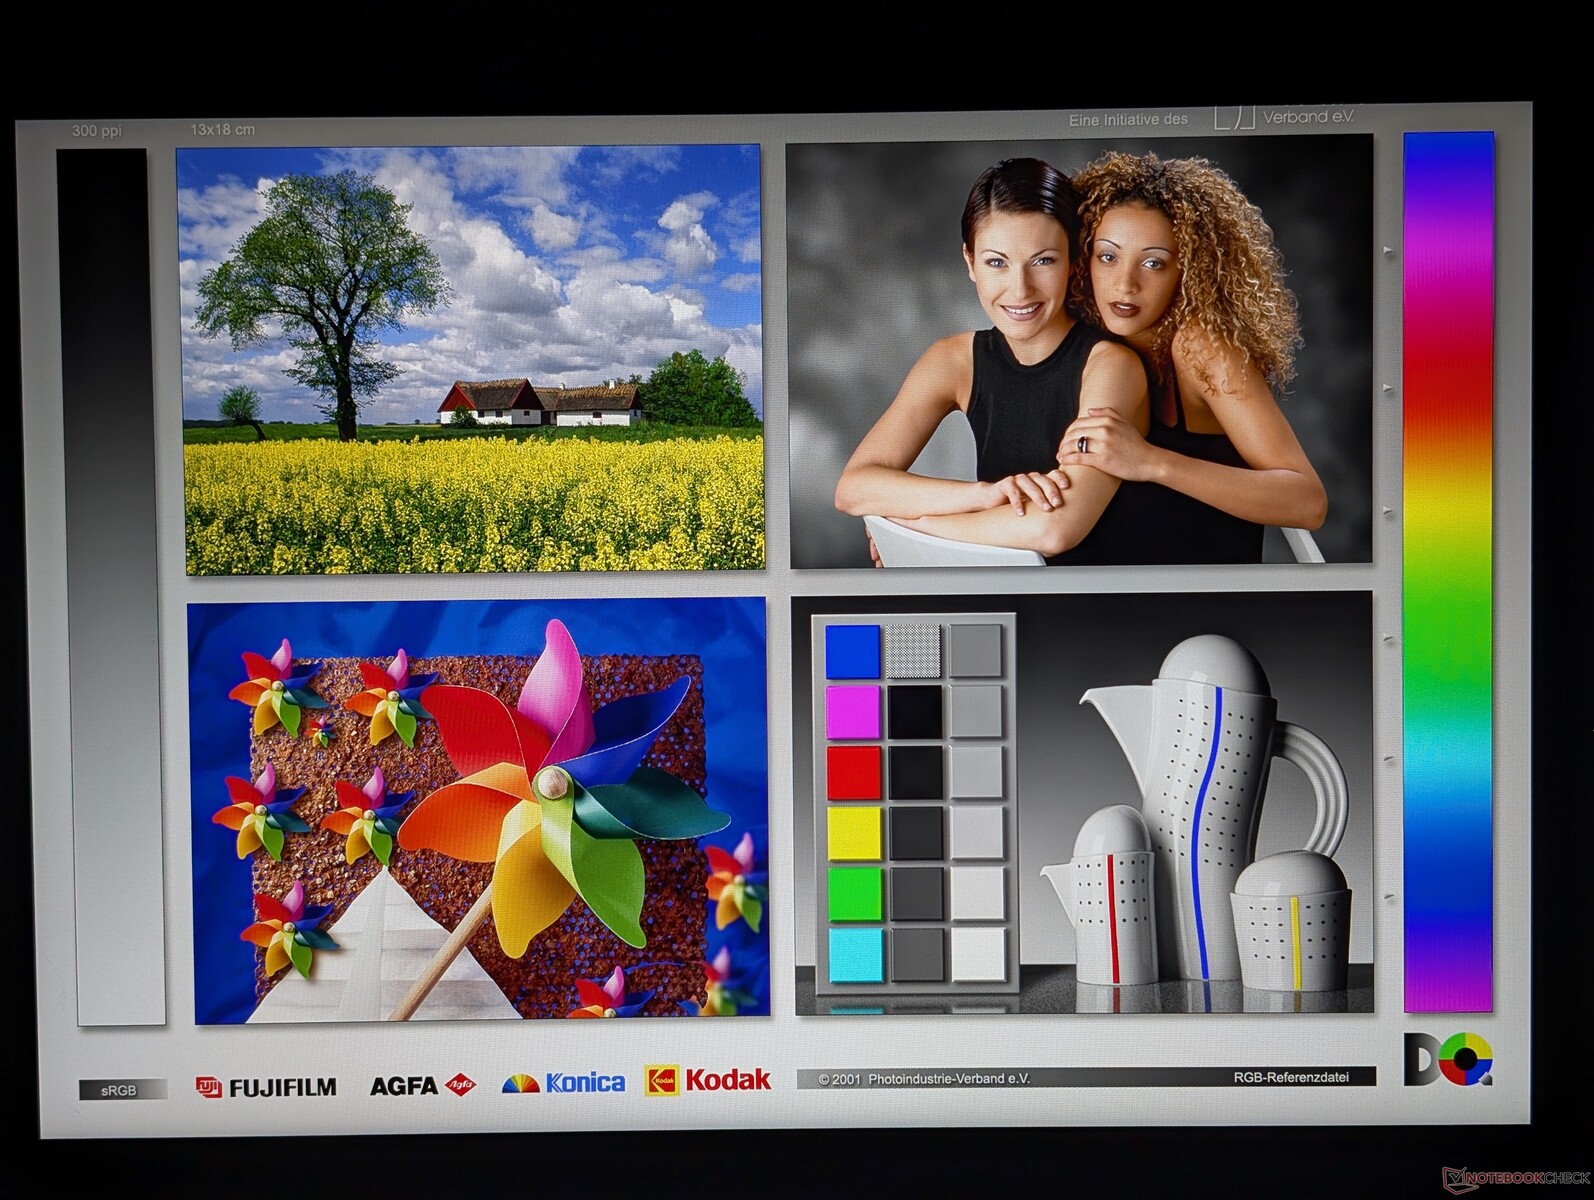
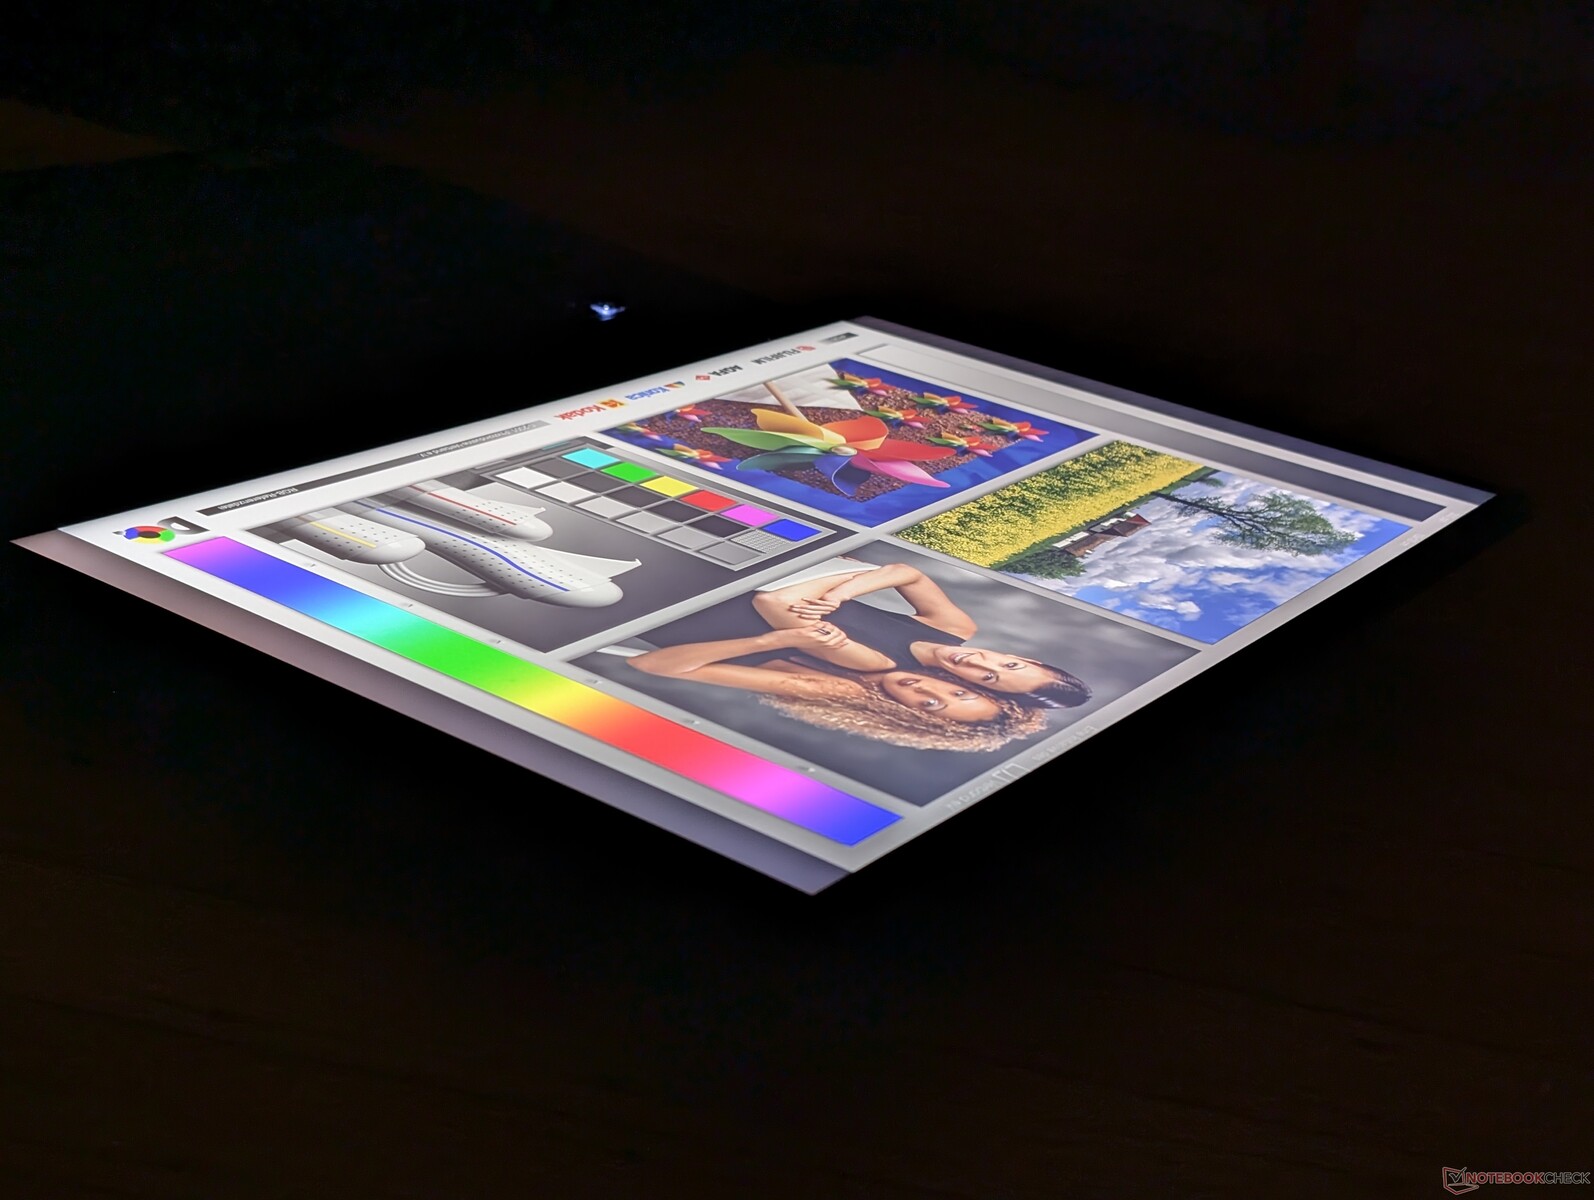
Display
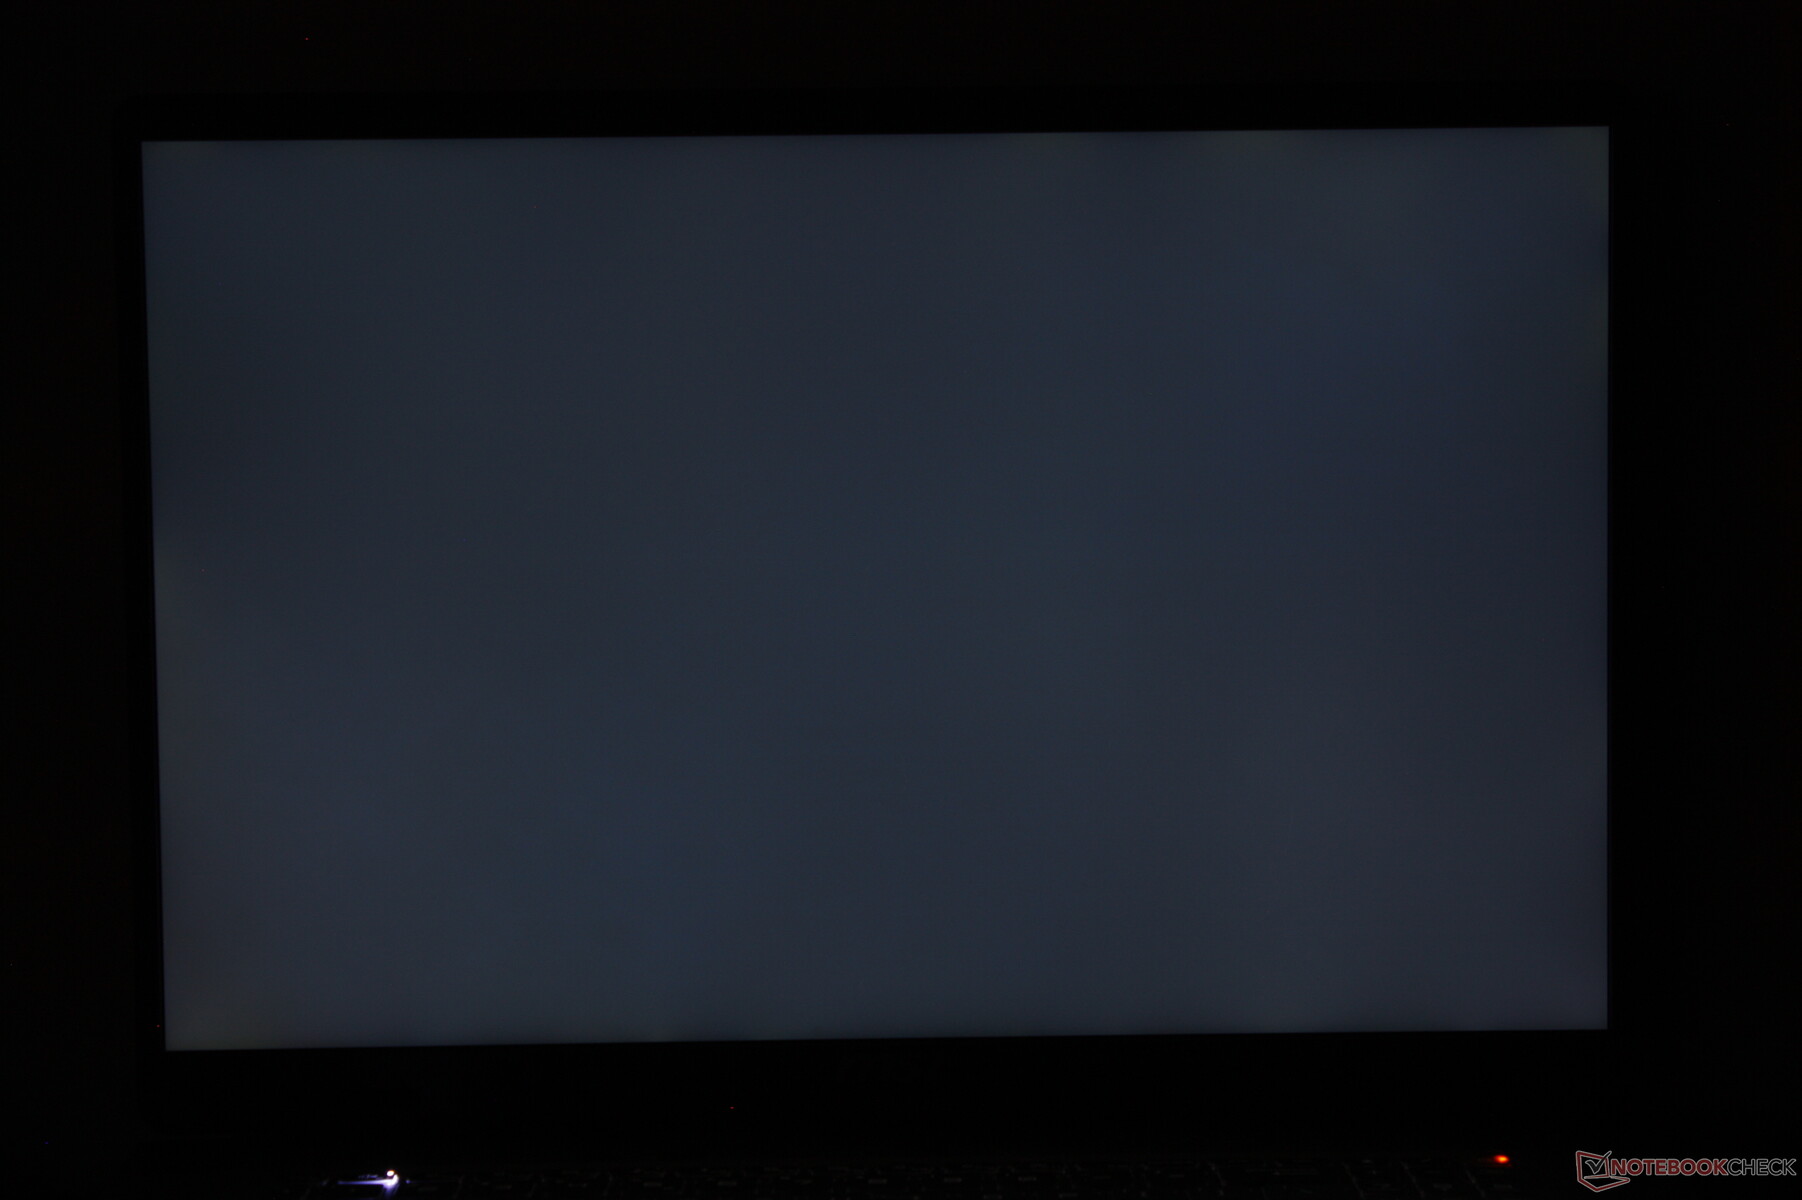
The MSI ships with a similar BOE NE180QDM IPS panel as found on the Asus ROG Strix G18 2025 G814 for full P3 colors and a similar viewing experience between them. Note that while response times are fast and brightness is good at ~500 nits, the monitor lacks support for G-Sync.

| |||||||||||||||||||||||||
Brightness Distribution: 84 %
Center on Battery: 581.4 cd/m²
Contrast: 1264:1 (Black: 0.46 cd/m²)
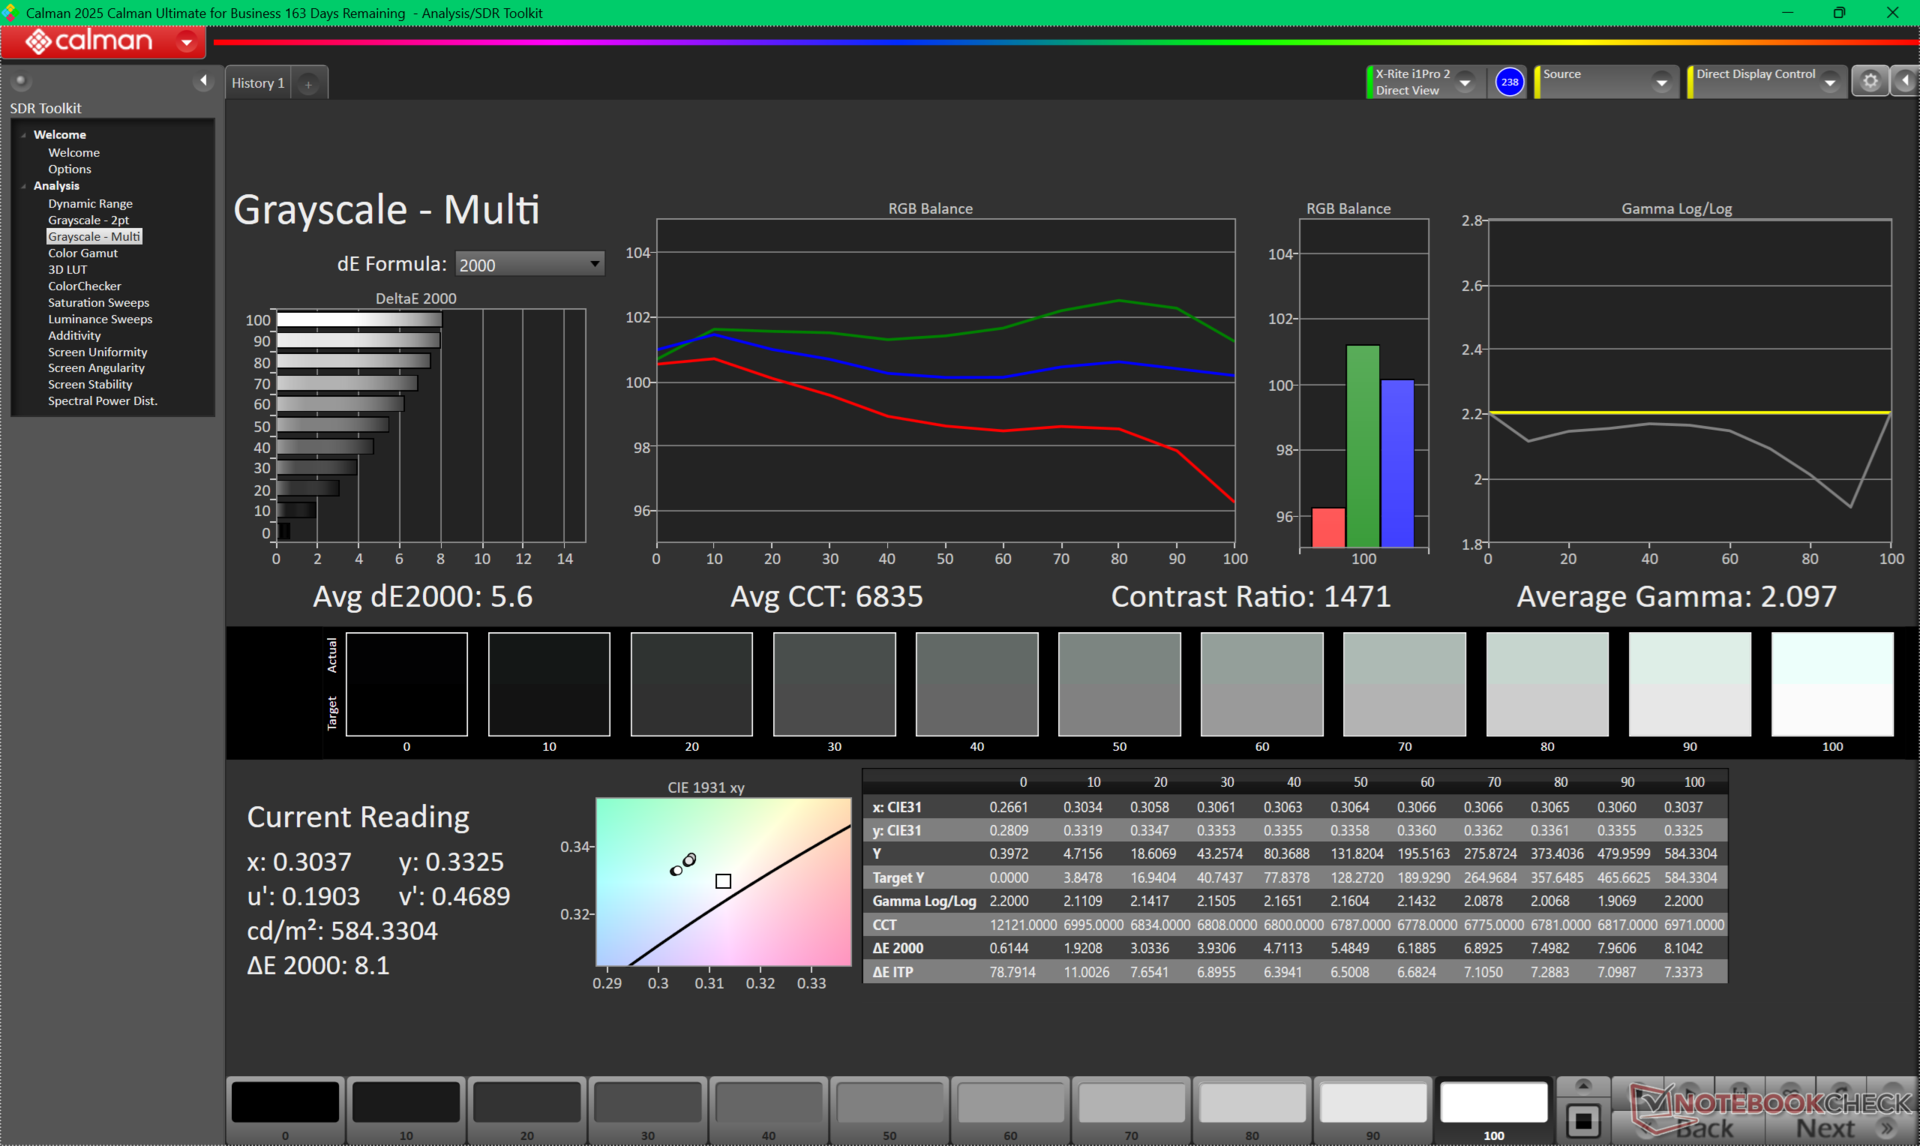
ΔE ColorChecker Calman: 3.89 | ∀{0.5-29.43 Ø4.73}
calibrated: 0.97
ΔE Greyscale Calman: 5.6 | ∀{0.09-98 Ø4.97}
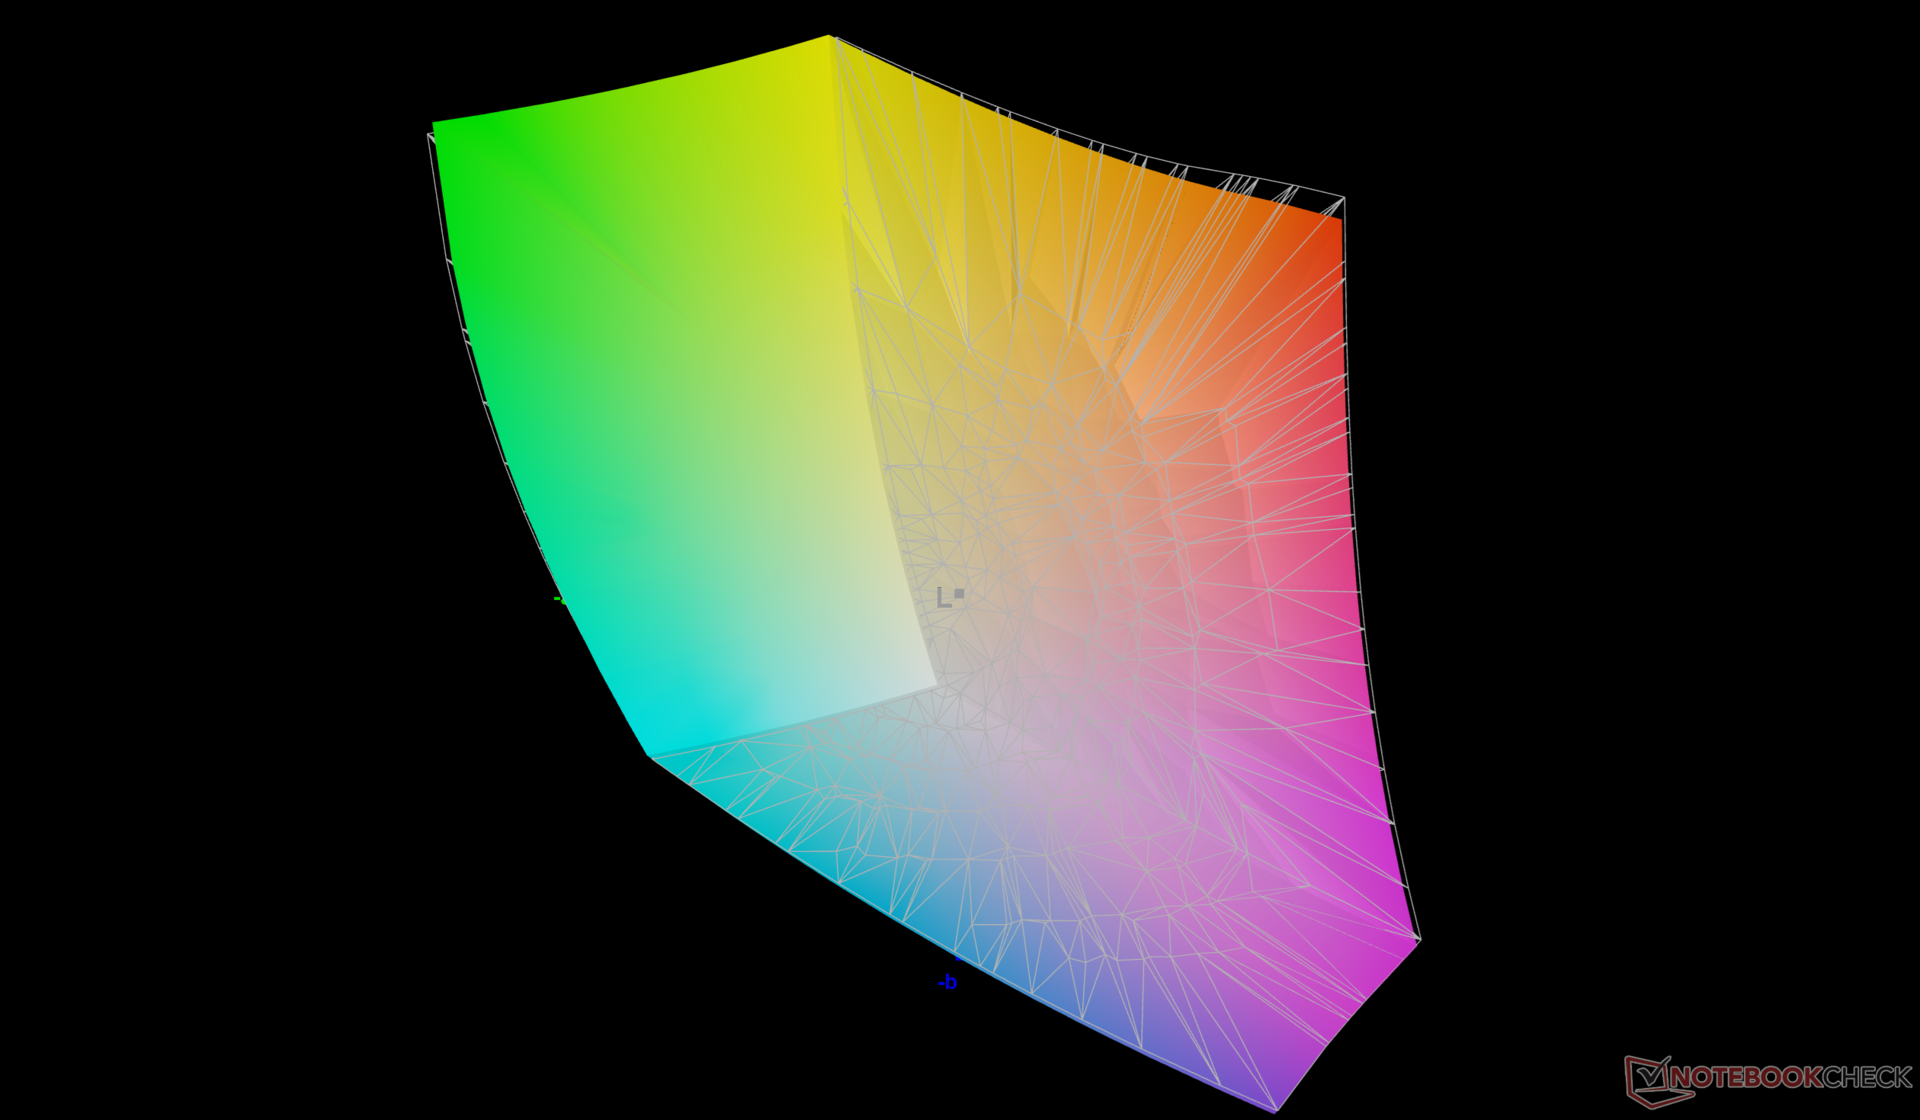
86.1% AdobeRGB 1998 (Argyll 3D)
100% sRGB (Argyll 3D)
98% Display P3 (Argyll 3D)
Gamma: 2.1
CCT: 6835 K
| MSI Crosshair 18 HX AI A2XW BOE NE180QDM-NZ4, IPS, 2560x1600, 18", 240 Hz | Asus ROG Strix G18 2025 G814 NE180QDM-NZC, IPS, 2560x1600, 18", 240 Hz | MSI Vector A18 HX A9W AU Optronics B180QAN01.0, IPS, 2560x1600, 18", 240 Hz | Alienware m18 R1 AMD BOE NE18NZ1, IPS, 1920x1200, 18", 480 Hz | Acer Predator Helios 18 AI B180QAN01.2 (AUO45A8), IPS, 2560x1600, 18", 250 Hz | MSI Crosshair A17 HX D8WGKG B170QAN01.2, IPS, 2560x1600, 17", 240 Hz | |
|---|---|---|---|---|---|---|
| Display | 1% | 0% | 1% | 2% | -1% | |
| Display P3 Coverage (%) | 98 | 99.4 1% | 98.1 0% | 98.5 1% | 99.7 2% | 97.1 -1% |
| sRGB Coverage (%) | 100 | 100 0% | 99.9 0% | 99.7 0% | 100 0% | 99.9 0% |
| AdobeRGB 1998 Coverage (%) | 86.1 | 87.7 2% | 86.3 0% | 88.7 3% | 90.1 5% | 84.9 -1% |
| Response Times | 32% | 15% | 24% | 47% | -69% | |
| Response Time Grey 50% / Grey 80% * (ms) | 4.7 ? | 3.8 ? 19% | 4.3 ? 9% | 2.8 ? 40% | 3.6 ? 23% | 13.3 ? -183% |
| Response Time Black / White * (ms) | 10.3 ? | 5.8 ? 44% | 8.1 ? 21% | 9.6 ? 7% | 3.1 ? 70% | 5.7 ? 45% |
| PWM Frequency (Hz) | 2500 | |||||
| PWM Amplitude * (%) | 100 | |||||
| Screen | 29% | 5% | 26% | 158% | 9% | |
| Brightness middle (cd/m²) | 581.4 | 582 0% | 543 -7% | 319.6 -45% | 730 26% | 471 -19% |
| Brightness (cd/m²) | 534 | 557 4% | 502 -6% | 304 -43% | 719 35% | 468 -12% |
| Brightness Distribution (%) | 84 | 93 11% | 86 2% | 87 4% | 96 14% | 96 14% |
| Black Level * (cd/m²) | 0.46 | 0.4 13% | 0.56 -22% | 0.25 46% | 0.04 91% | 0.4 13% |
| Contrast (:1) | 1264 | 1455 15% | 970 -23% | 1278 1% | 18250 1344% | 1178 -7% |
| Colorchecker dE 2000 * | 3.89 | 1.4 64% | 3.41 12% | 1.22 69% | 3.34 14% | 2.72 30% |
| Colorchecker dE 2000 max. * | 7.94 | 3.4 57% | 6.4 19% | 3.1 61% | 6.56 17% | 5.49 31% |
| Colorchecker dE 2000 calibrated * | 0.97 | 0.7 28% | 0.66 32% | 0.47 52% | 2.44 -152% | 1.12 -15% |
| Greyscale dE 2000 * | 5.6 | 1.8 68% | 3.4 39% | 0.8 86% | 3.86 31% | 3.2 43% |
| Gamma | 2.1 105% | 2.24 98% | 2.3 96% | 2.23 99% | 2.62 84% | 2.227 99% |
| CCT | 6835 95% | 6633 98% | 6070 107% | 6471 100% | 6859 95% | 6925 94% |
| Total Average (Program / Settings) | 21% /
23% | 7% /
5% | 17% /
20% | 69% /
109% | -20% /
-4% |
* ... smaller is better


Display Response Times
| ↔ Response Time Black to White | ||
|---|---|---|
| 10.3 ms ... rise ↗ and fall ↘ combined | ↗ 5.1 ms rise |  |
| ↘ 5.2 ms fall | ||
| The screen shows good response rates in our tests, but may be too slow for competitive gamers. In comparison, all tested devices range from 0.1 (minimum) to 240 (maximum) ms. » 28 % of all devices are better. This means that the measured response time is better than the average of all tested devices (19.9 ms). | ||
| ↔ Response Time 50% Grey to 80% Grey | ||
| 4.7 ms ... rise ↗ and fall ↘ combined | ↗ 1.9 ms rise | 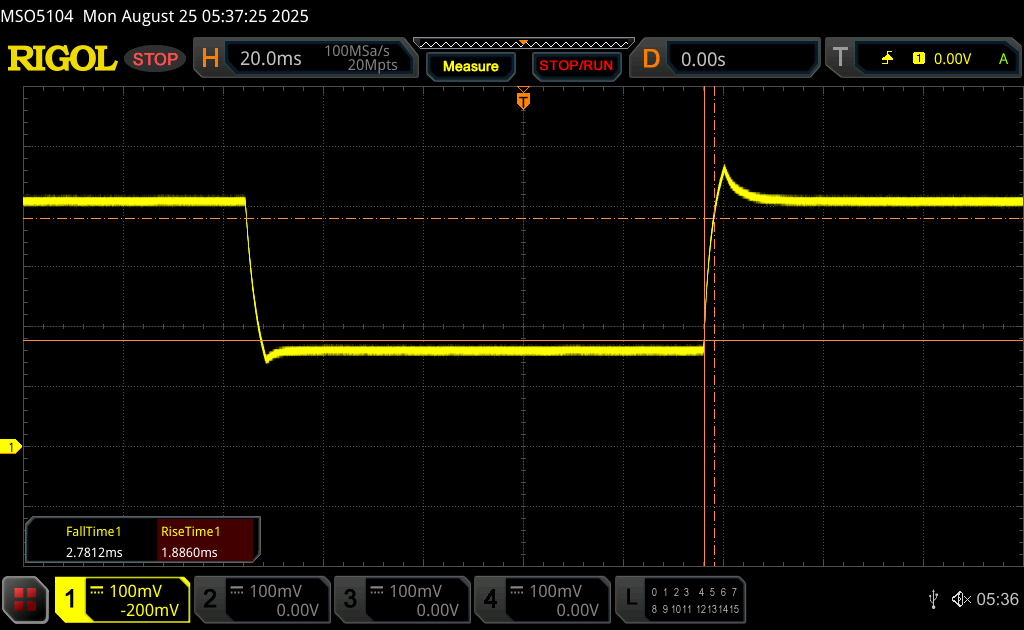 |
| ↘ 2.8 ms fall | ||
| The screen shows very fast response rates in our tests and should be very well suited for fast-paced gaming. In comparison, all tested devices range from 0.165 (minimum) to 636 (maximum) ms. » 16 % of all devices are better. This means that the measured response time is better than the average of all tested devices (31.1 ms). | ||
Screen Flickering / PWM (Pulse-Width Modulation)
| Screen flickering / PWM not detected | 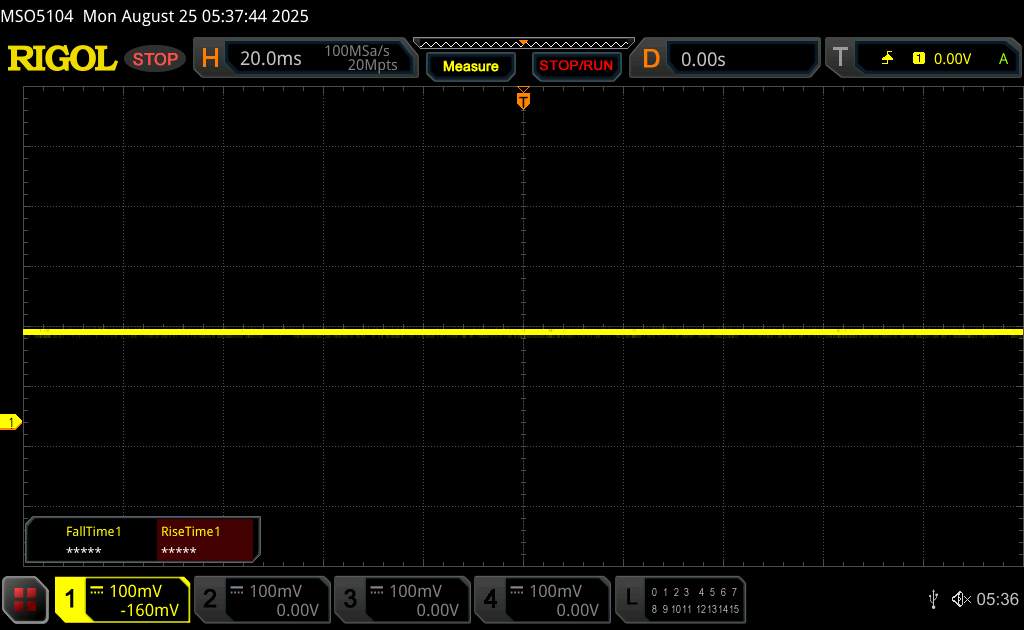 | ||
In comparison: 52 % of all tested devices do not use PWM to dim the display. If PWM was detected, an average of 7798 (minimum: 5 - maximum: 343500) Hz was measured. | |||


Performance

Testing Conditions
We set MSI Center to Performance mode prior to running the benchmarks below.
Processor
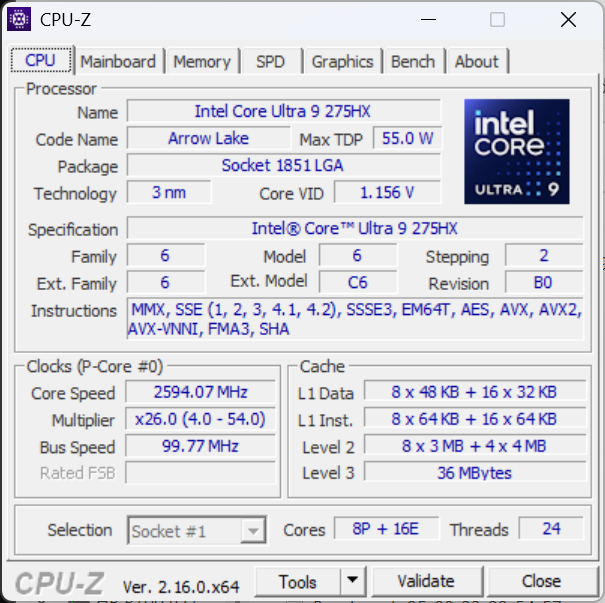
The Core Ultra 9 275HX is one of the fastest processors available on Intel's Arrow Lake-HX platform. it's commonly found on other high-performance 16-inch or 18-inch laptops including the Alienware 18 Area-51. Raw performance is nonetheless comparable to the Ryzen 9 8940HX in the Crosshair A17.
Cinebench R15 Multi Loop
Cinebench R23: Multi Core | Single Core
Cinebench R20: CPU (Multi Core) | CPU (Single Core)
Cinebench R15: CPU Multi 64Bit | CPU Single 64Bit
Blender: v2.79 BMW27 CPU
7-Zip 18.03: 7z b 4 | 7z b 4 -mmt1
Geekbench 6.7: Multi-Core | Single-Core
Geekbench 5.5: Multi-Core | Single-Core
HWBOT x265 Benchmark v2.2: 4k Preset
LibreOffice : 20 Documents To PDF
R Benchmark 2.5: Overall mean
| Geekbench 6.7 / Multi-Core | |
| MSI Raider A18 HX A9WIG-080 | |
| Alienware 18 Area-51 | |
| Asus ROG Strix G18 2025 G814 | |
| Average Intel Core Ultra 9 275HX (16033 - 21668, n=33) | |
| MSI Crosshair 18 HX AI A2XW | |
| Acer Predator Helios 18 AI | |
| Razer Blade 18 2024 RZ09-0509 | |
| MSI Crosshair A17 HX D8WGKG | |
| Alienware m18 R1 AMD | |
| MSI Vector A18 HX A9W | |
| Geekbench 6.7 / Single-Core | |
| Asus ROG Strix G18 2025 G814 | |
| MSI Vector A18 HX A9W | |
| MSI Raider A18 HX A9WIG-080 | |
| Alienware 18 Area-51 | |
| Average Intel Core Ultra 9 275HX (2843 - 3160, n=33) | |
| Acer Predator Helios 18 AI | |
| Alienware m18 R1 AMD | |
| MSI Crosshair 18 HX AI A2XW | |
| Razer Blade 18 2024 RZ09-0509 | |
| MSI Crosshair A17 HX D8WGKG | |
| HWBOT x265 Benchmark v2.2 / 4k Preset | |
| MSI Vector A18 HX A9W | |
| MSI Raider A18 HX A9WIG-080 | |
| Alienware 18 Area-51 | |
| Asus ROG Strix G18 2025 G814 | |
| Average Intel Core Ultra 9 275HX (30.7 - 43.8, n=30) | |
| Alienware m18 R1 AMD | |
| Acer Predator Helios 18 AI | |
| MSI Crosshair A17 HX D8WGKG | |
| MSI Crosshair 18 HX AI A2XW | |
| Razer Blade 18 RTX 4070 | |
| Razer Blade 18 2024 RZ09-0509 | |
| MSI Katana 17 B13VFK | |
* ... smaller is better
AIDA64: FP32 Ray-Trace | FPU Julia | CPU SHA3 | CPU Queen | FPU SinJulia | FPU Mandel | CPU AES | CPU ZLib | FP64 Ray-Trace | CPU PhotoWorxx
| Performance rating | |
| MSI Vector A18 HX A9W | |
| Asus ROG Strix G18 2025 G814 | |
| Alienware m18 R1 AMD | |
| MSI Crosshair A17 HX D8WGKG | |
| Average Intel Core Ultra 9 275HX | |
| MSI Crosshair 18 HX AI A2XW | |
| Acer Predator Helios 18 AI | |
| Razer Blade 18 2024 RZ09-0509 | |
| AIDA64 / FP32 Ray-Trace | |
| MSI Vector A18 HX A9W | |
| Asus ROG Strix G18 2025 G814 | |
| Alienware m18 R1 AMD | |
| MSI Crosshair A17 HX D8WGKG | |
| MSI Crosshair 18 HX AI A2XW | |
| Average Intel Core Ultra 9 275HX (28039 - 39895, n=30) | |
| Acer Predator Helios 18 AI | |
| Razer Blade 18 2024 RZ09-0509 | |
| AIDA64 / FPU Julia | |
| Alienware m18 R1 AMD | |
| MSI Vector A18 HX A9W | |
| Asus ROG Strix G18 2025 G814 | |
| MSI Crosshair A17 HX D8WGKG | |
| MSI Crosshair 18 HX AI A2XW | |
| Average Intel Core Ultra 9 275HX (140254 - 200744, n=30) | |
| Acer Predator Helios 18 AI | |
| Razer Blade 18 2024 RZ09-0509 | |
| AIDA64 / CPU SHA3 | |
| Alienware m18 R1 AMD | |
| MSI Vector A18 HX A9W | |
| Asus ROG Strix G18 2025 G814 | |
| MSI Crosshair A17 HX D8WGKG | |
| Average Intel Core Ultra 9 275HX (6710 - 9817, n=30) | |
| Acer Predator Helios 18 AI | |
| MSI Crosshair 18 HX AI A2XW | |
| Razer Blade 18 2024 RZ09-0509 | |
| AIDA64 / CPU Queen | |
| Alienware m18 R1 AMD | |
| MSI Crosshair A17 HX D8WGKG | |
| Asus ROG Strix G18 2025 G814 | |
| MSI Vector A18 HX A9W | |
| Acer Predator Helios 18 AI | |
| Razer Blade 18 2024 RZ09-0509 | |
| Average Intel Core Ultra 9 275HX (113887 - 140937, n=30) | |
| MSI Crosshair 18 HX AI A2XW | |
| AIDA64 / FPU SinJulia | |
| Alienware m18 R1 AMD | |
| MSI Vector A18 HX A9W | |
| Asus ROG Strix G18 2025 G814 | |
| MSI Crosshair A17 HX D8WGKG | |
| Razer Blade 18 2024 RZ09-0509 | |
| Acer Predator Helios 18 AI | |
| Average Intel Core Ultra 9 275HX (11172 - 14425, n=30) | |
| MSI Crosshair 18 HX AI A2XW | |
| AIDA64 / FPU Mandel | |
| Alienware m18 R1 AMD | |
| MSI Vector A18 HX A9W | |
| MSI Crosshair A17 HX D8WGKG | |
| Asus ROG Strix G18 2025 G814 | |
| MSI Crosshair 18 HX AI A2XW | |
| Average Intel Core Ultra 9 275HX (72596 - 104508, n=30) | |
| Acer Predator Helios 18 AI | |
| Razer Blade 18 2024 RZ09-0509 | |
| AIDA64 / CPU AES | |
| Asus ROG Strix G18 2025 G814 | |
| MSI Crosshair A17 HX D8WGKG | |
| MSI Vector A18 HX A9W | |
| Alienware m18 R1 AMD | |
| Average Intel Core Ultra 9 275HX (105608 - 247074, n=30) | |
| Acer Predator Helios 18 AI | |
| MSI Crosshair 18 HX AI A2XW | |
| Razer Blade 18 2024 RZ09-0509 | |
| AIDA64 / CPU ZLib | |
| MSI Vector A18 HX A9W | |
| Alienware m18 R1 AMD | |
| Asus ROG Strix G18 2025 G814 | |
| MSI Crosshair A17 HX D8WGKG | |
| Average Intel Core Ultra 9 275HX (1582 - 2263, n=30) | |
| Acer Predator Helios 18 AI | |
| MSI Crosshair 18 HX AI A2XW | |
| Razer Blade 18 2024 RZ09-0509 | |
| AIDA64 / FP64 Ray-Trace | |
| MSI Vector A18 HX A9W | |
| Asus ROG Strix G18 2025 G814 | |
| Alienware m18 R1 AMD | |
| MSI Crosshair A17 HX D8WGKG | |
| MSI Crosshair 18 HX AI A2XW | |
| Average Intel Core Ultra 9 275HX (14847 - 21854, n=30) | |
| Acer Predator Helios 18 AI | |
| Razer Blade 18 2024 RZ09-0509 | |
| AIDA64 / CPU PhotoWorxx | |
| Average Intel Core Ultra 9 275HX (37482 - 62916, n=30) | |
| MSI Crosshair 18 HX AI A2XW | |
| Razer Blade 18 2024 RZ09-0509 | |
| Asus ROG Strix G18 2025 G814 | |
| MSI Vector A18 HX A9W | |
| Acer Predator Helios 18 AI | |
| Alienware m18 R1 AMD | |
| MSI Crosshair A17 HX D8WGKG | |
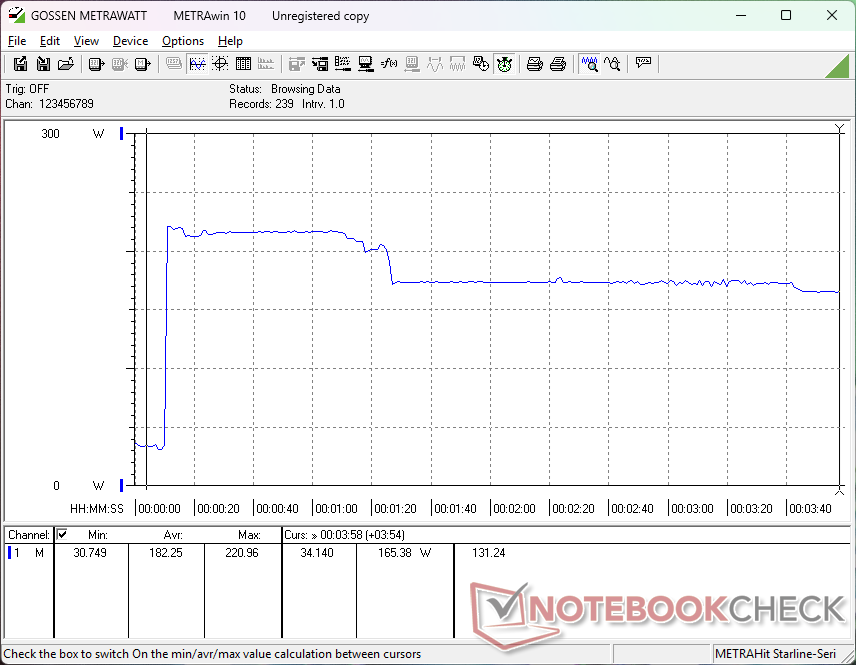
Stress Test
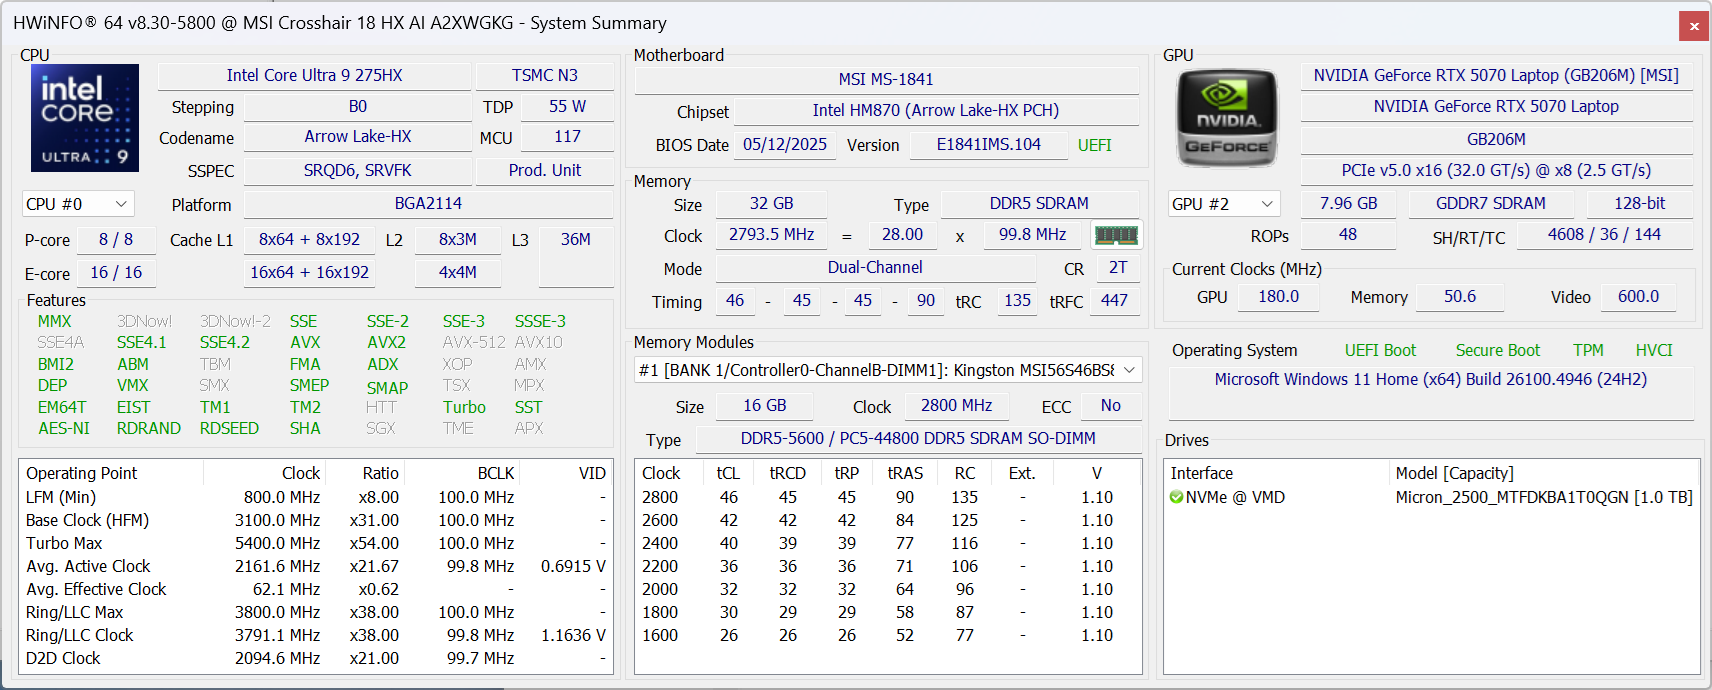
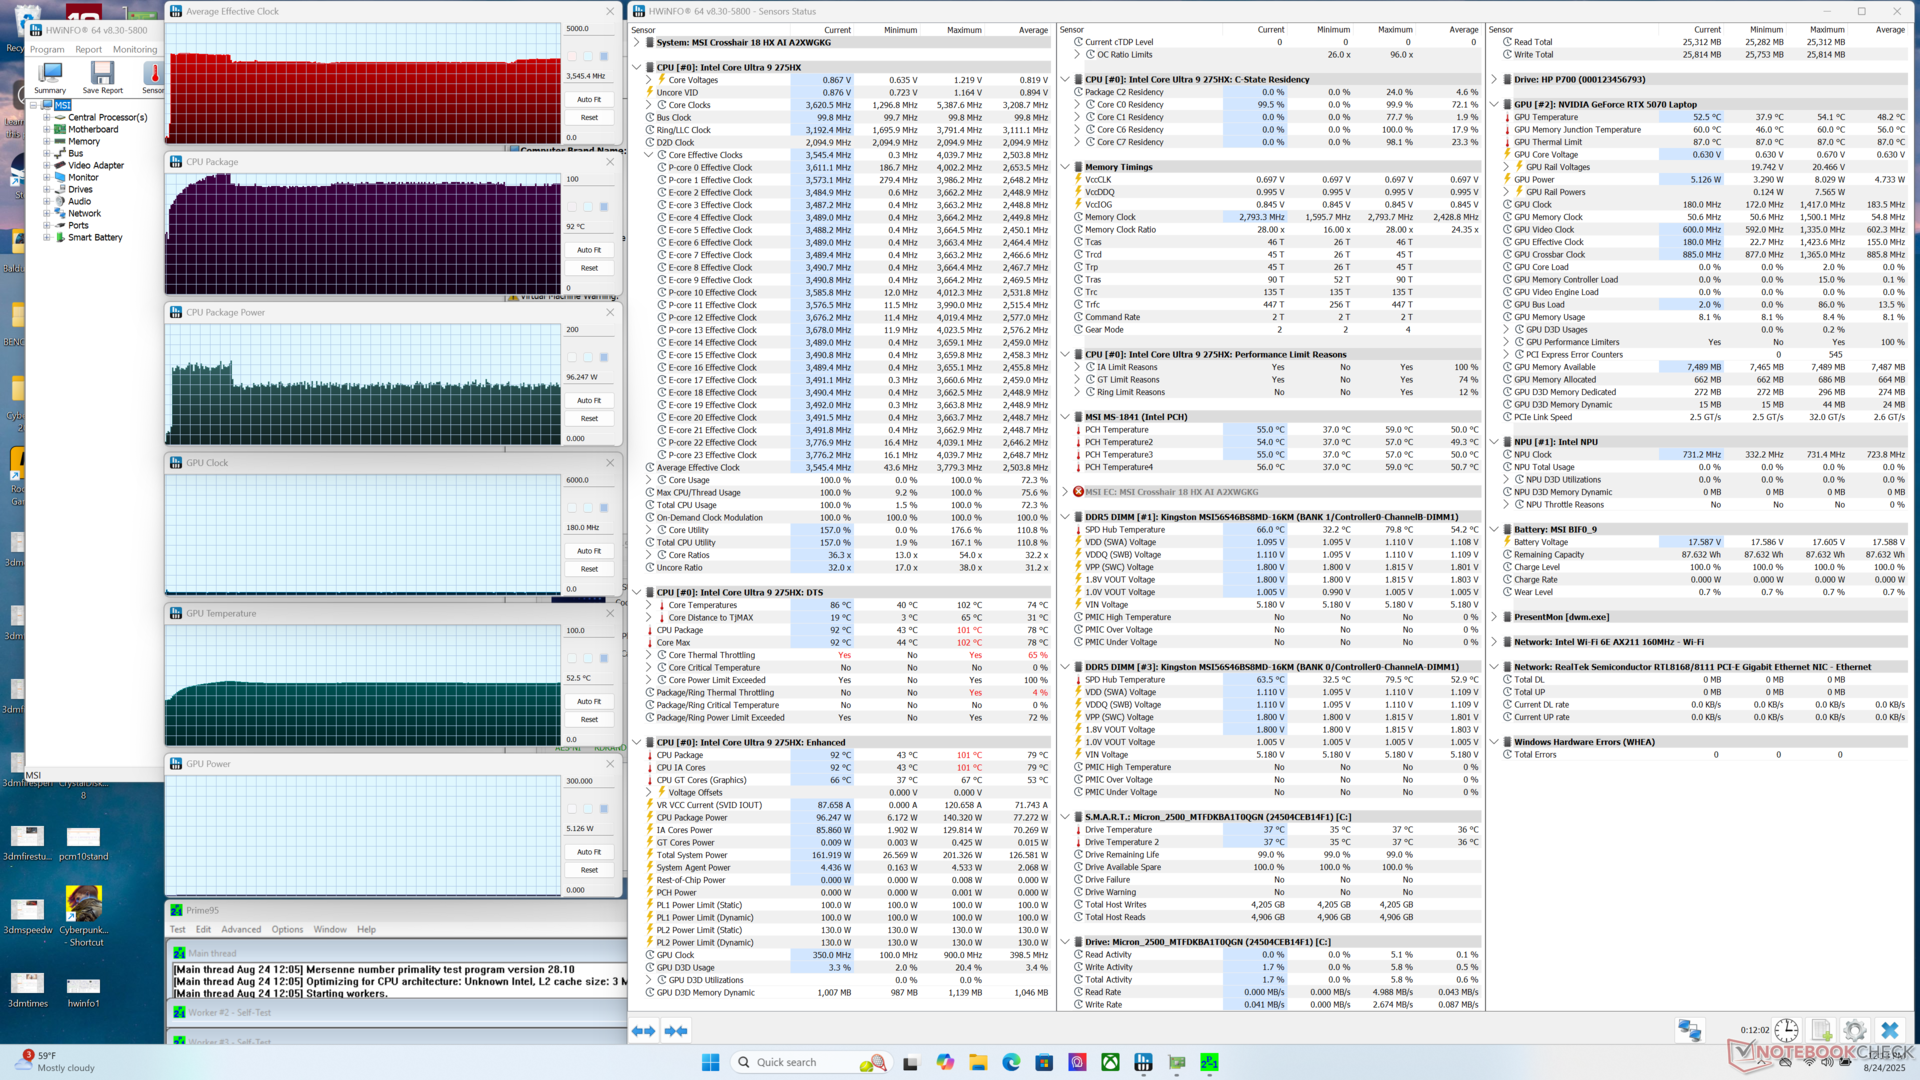
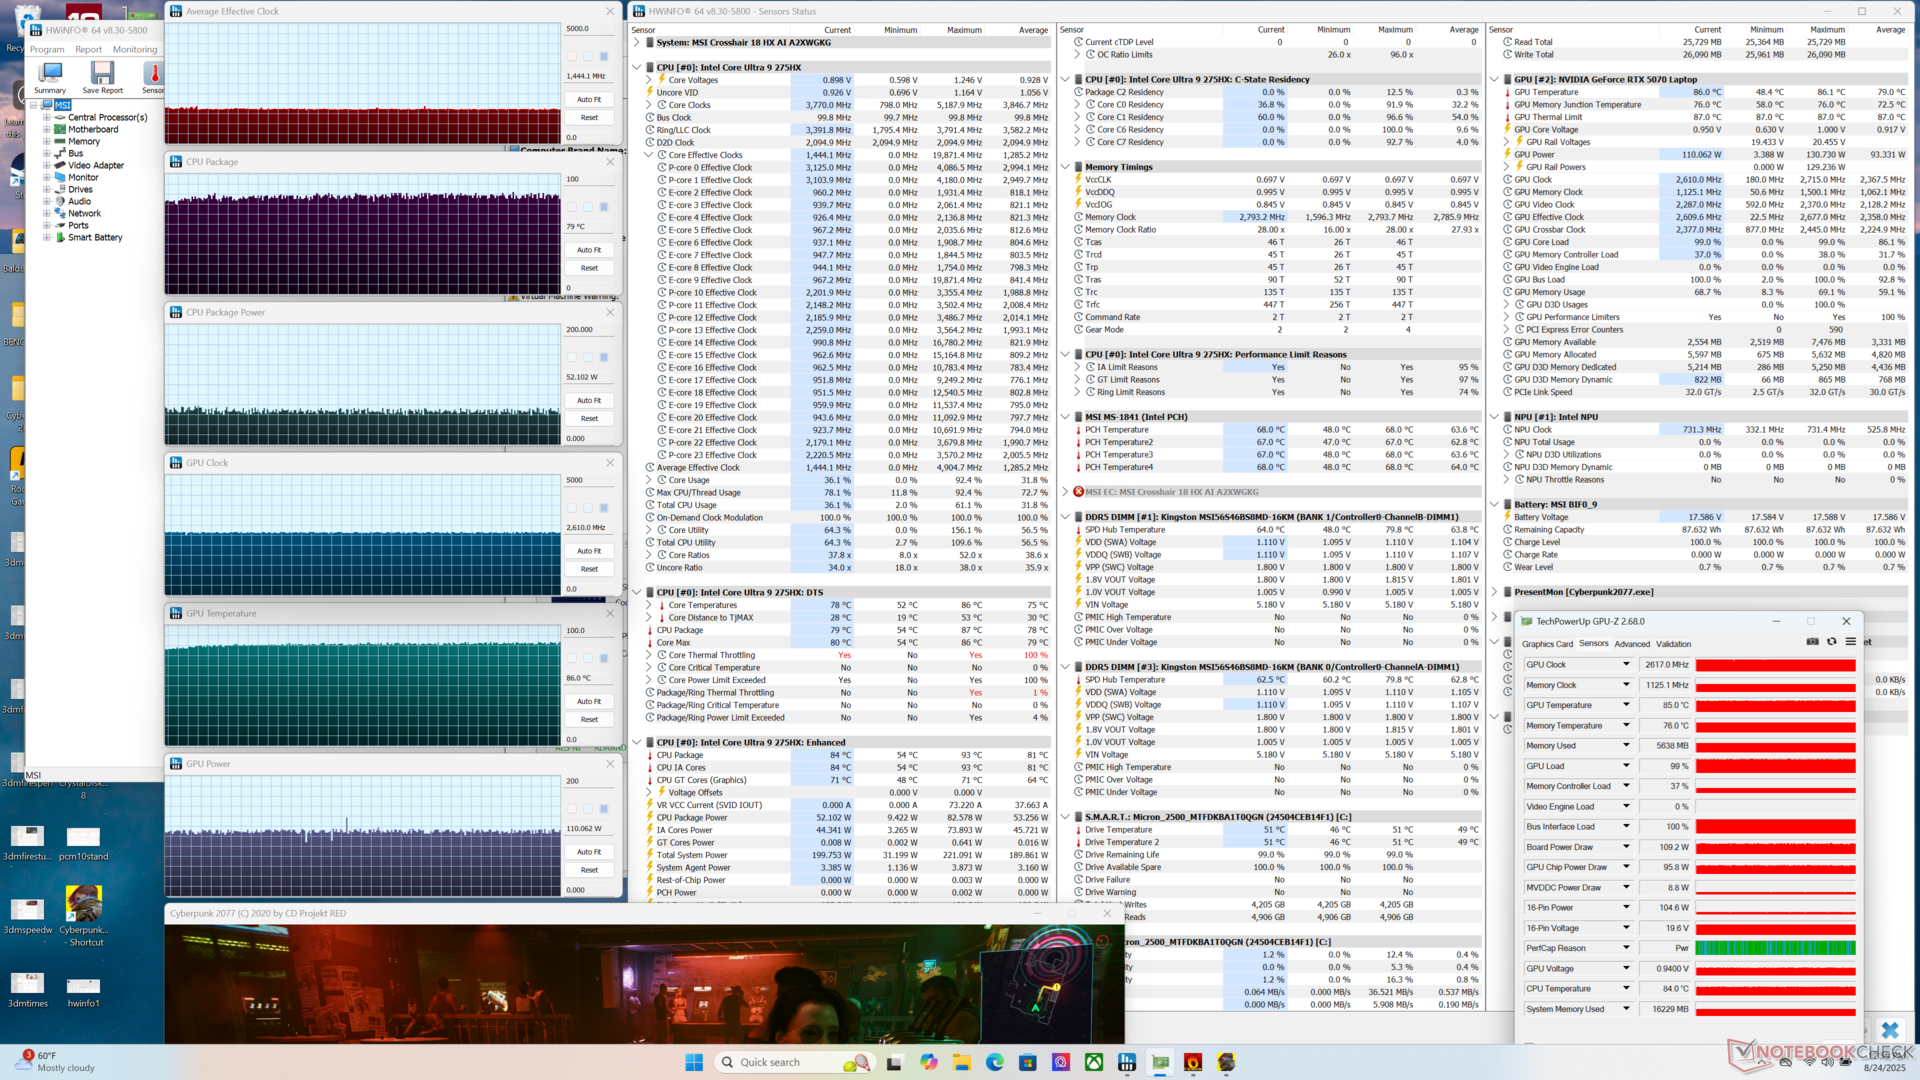
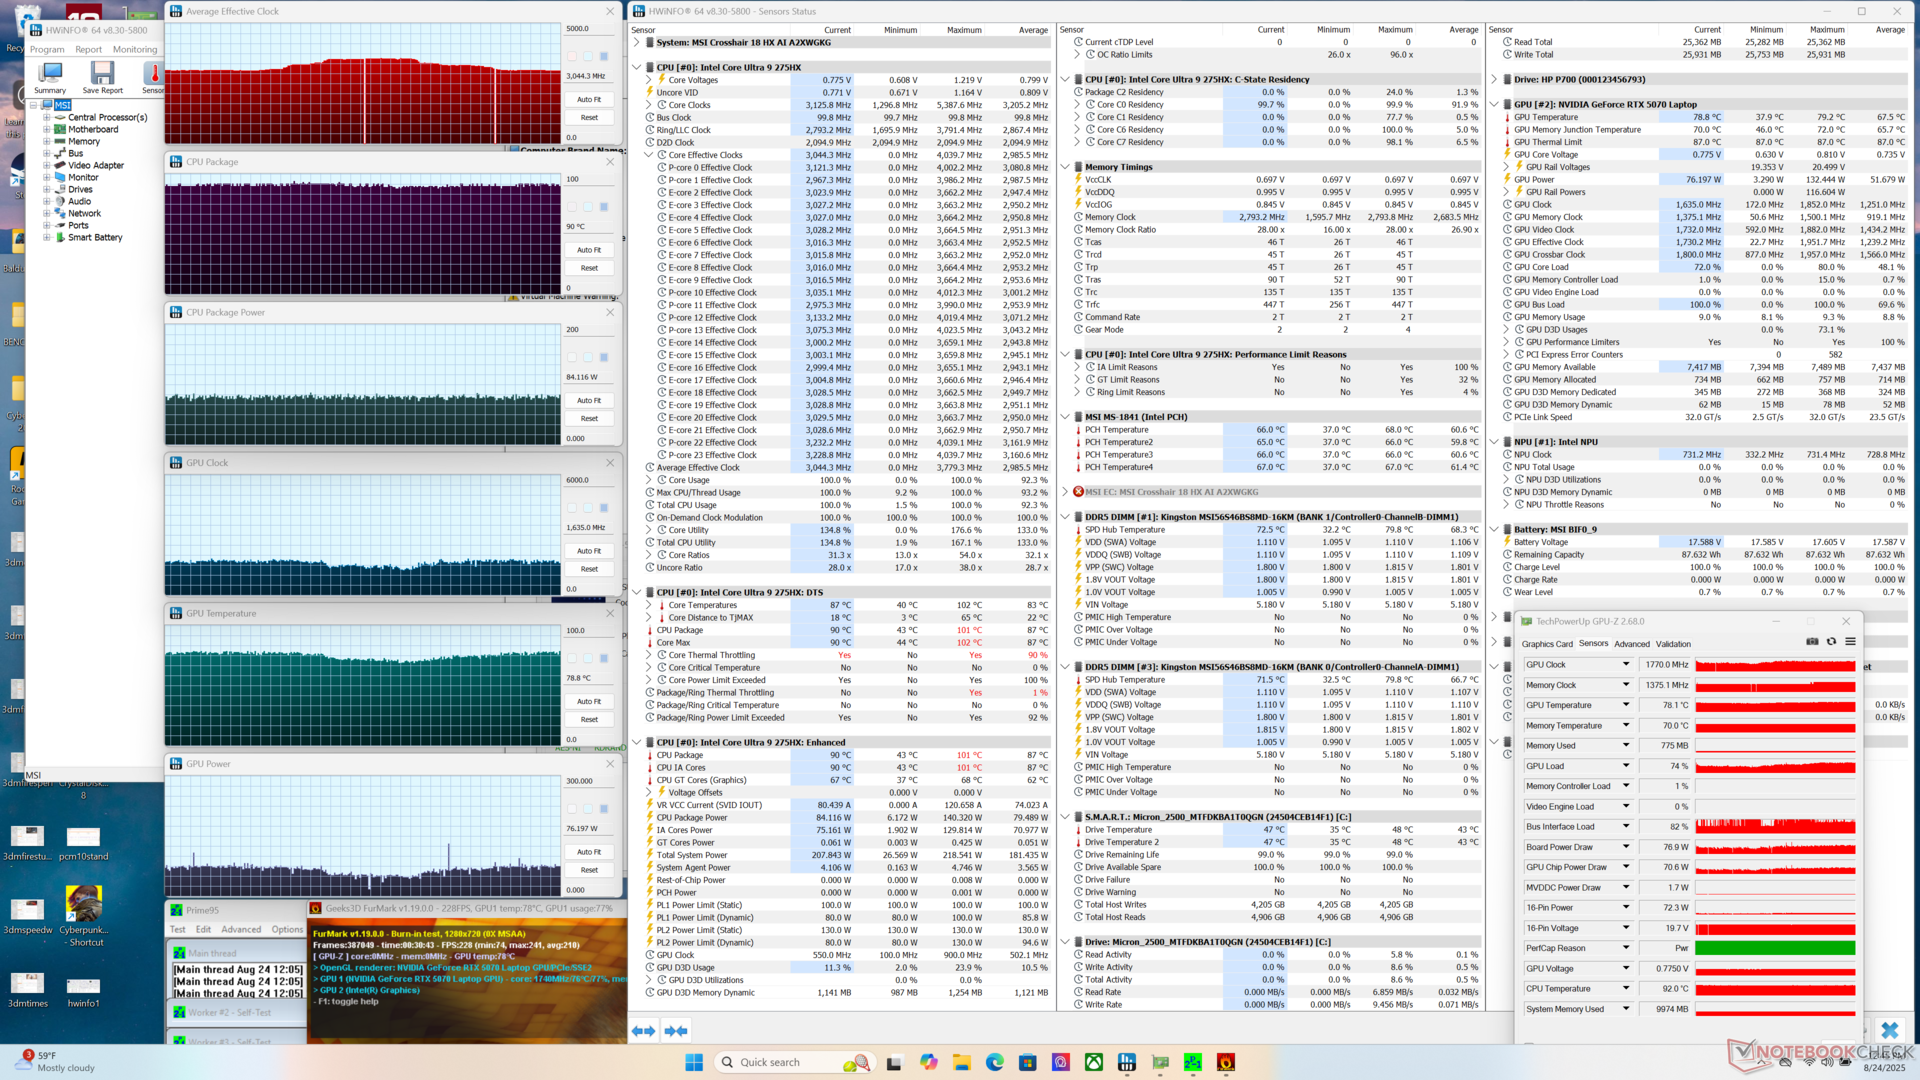
The CPU would boost to 3.7 GHz and 130 W when initiating Prime95 stress before falling and stabilizing at 3.5 GHz, 92 C, and 97 W about 70 seconds later. High Turbo Boost sustainability is therefore good albeit at very warm core temperatures.
GPU board power draw averages around 105 W, 110 W, and 64 W when running Cyberpunk 2077 on Cooler Boost mode, Performance, and Balanced mode, respectively. GPU clock rates and temperature differ between the modes as shown by the table and screenshots below.


| Average CPU Clock (GHz) | GPU Clock (MHz) | Average CPU Temperature (°C) | Average GPU Temperature (°C) | |
| System Idle | -- | -- | 49 | 38 |
| Prime95 Stress | 3.5 | -- | 92 | 53 |
| Prime95 + FurMark Stress | 3.0 | 1635 | 90 | 79 |
| Cyberpunk 2077 Stress (Balanced mode) | 1.2 | 2115 | 71 | 70 |
| Cyberpunk 2077 Stress (Performance mode) | 1.4 | 2617 | 79 | 86 |
| Cyberpunk 2077 Stress (Cooler Boost mode) | 1.5 | 2625 | 76 | 80 |
System Performance

PCMark 10: Score | Essentials | Productivity | Digital Content Creation
CrossMark: Overall | Productivity | Creativity | Responsiveness
WebXPRT 3: Overall
WebXPRT 4: Overall
Mozilla Kraken 1.1: Total
| PCMark 10 / Score | |
| Alienware m18 R1 AMD | |
| MSI Vector A18 HX A9W | |
| Asus ROG Strix G18 2025 G814 | |
| Razer Blade 18 2024 RZ09-0509 | |
| Acer Predator Helios 18 AI | |
| MSI Crosshair A17 HX D8WGKG | |
| MSI Crosshair 18 HX AI A2XW | |
| CrossMark / Overall | |
| Asus ROG Strix G18 2025 G814 | |
| MSI Vector A18 HX A9W | |
| MSI Crosshair 18 HX AI A2XW | |
| Acer Predator Helios 18 AI | |
| Razer Blade 18 2024 RZ09-0509 | |
| MSI Crosshair A17 HX D8WGKG | |
| Alienware m18 R1 AMD | |
| WebXPRT 3 / Overall | |
| Alienware m18 R1 AMD | |
| MSI Vector A18 HX A9W | |
| Razer Blade 18 2024 RZ09-0509 | |
| Asus ROG Strix G18 2025 G814 | |
| MSI Crosshair 18 HX AI A2XW | |
| Acer Predator Helios 18 AI | |
| MSI Crosshair A17 HX D8WGKG | |
| WebXPRT 4 / Overall | |
| MSI Vector A18 HX A9W | |
| MSI Crosshair 18 HX AI A2XW | |
| Alienware m18 R1 AMD | |
| Asus ROG Strix G18 2025 G814 | |
| Acer Predator Helios 18 AI | |
| MSI Crosshair A17 HX D8WGKG | |
* ... smaller is better
| PCMark 10 Score | 8018 points | |
Help | ||
| AIDA64 / Memory Copy | |
| Average Intel Core Ultra 9 275HX (56003 - 94460, n=30) | |
| MSI Crosshair 18 HX AI A2XW | |
| Razer Blade 18 2024 RZ09-0509 | |
| Acer Predator Helios 18 AI | |
| Asus ROG Strix G18 2025 G814 | |
| MSI Vector A18 HX A9W | |
| Alienware m18 R1 AMD | |
| MSI Crosshair A17 HX D8WGKG | |
| AIDA64 / Memory Read | |
| Average Intel Core Ultra 9 275HX (55795 - 97151, n=30) | |
| MSI Crosshair 18 HX AI A2XW | |
| Razer Blade 18 2024 RZ09-0509 | |
| Acer Predator Helios 18 AI | |
| Asus ROG Strix G18 2025 G814 | |
| MSI Vector A18 HX A9W | |
| MSI Crosshair A17 HX D8WGKG | |
| Alienware m18 R1 AMD | |
| AIDA64 / Memory Write | |
| Average Intel Core Ultra 9 275HX (55663 - 116129, n=30) | |
| MSI Crosshair 18 HX AI A2XW | |
| MSI Vector A18 HX A9W | |
| Asus ROG Strix G18 2025 G814 | |
| Razer Blade 18 2024 RZ09-0509 | |
| MSI Crosshair A17 HX D8WGKG | |
| Acer Predator Helios 18 AI | |
| Alienware m18 R1 AMD | |
| AIDA64 / Memory Latency | |
| Acer Predator Helios 18 AI | |
| Average Intel Core Ultra 9 275HX (105.8 - 161.6, n=30) | |
| MSI Crosshair 18 HX AI A2XW | |
| MSI Vector A18 HX A9W | |
| Asus ROG Strix G18 2025 G814 | |
| Alienware m18 R1 AMD | |
| Razer Blade 18 2024 RZ09-0509 | |
| MSI Crosshair A17 HX D8WGKG | |
* ... smaller is better
DPC Latency

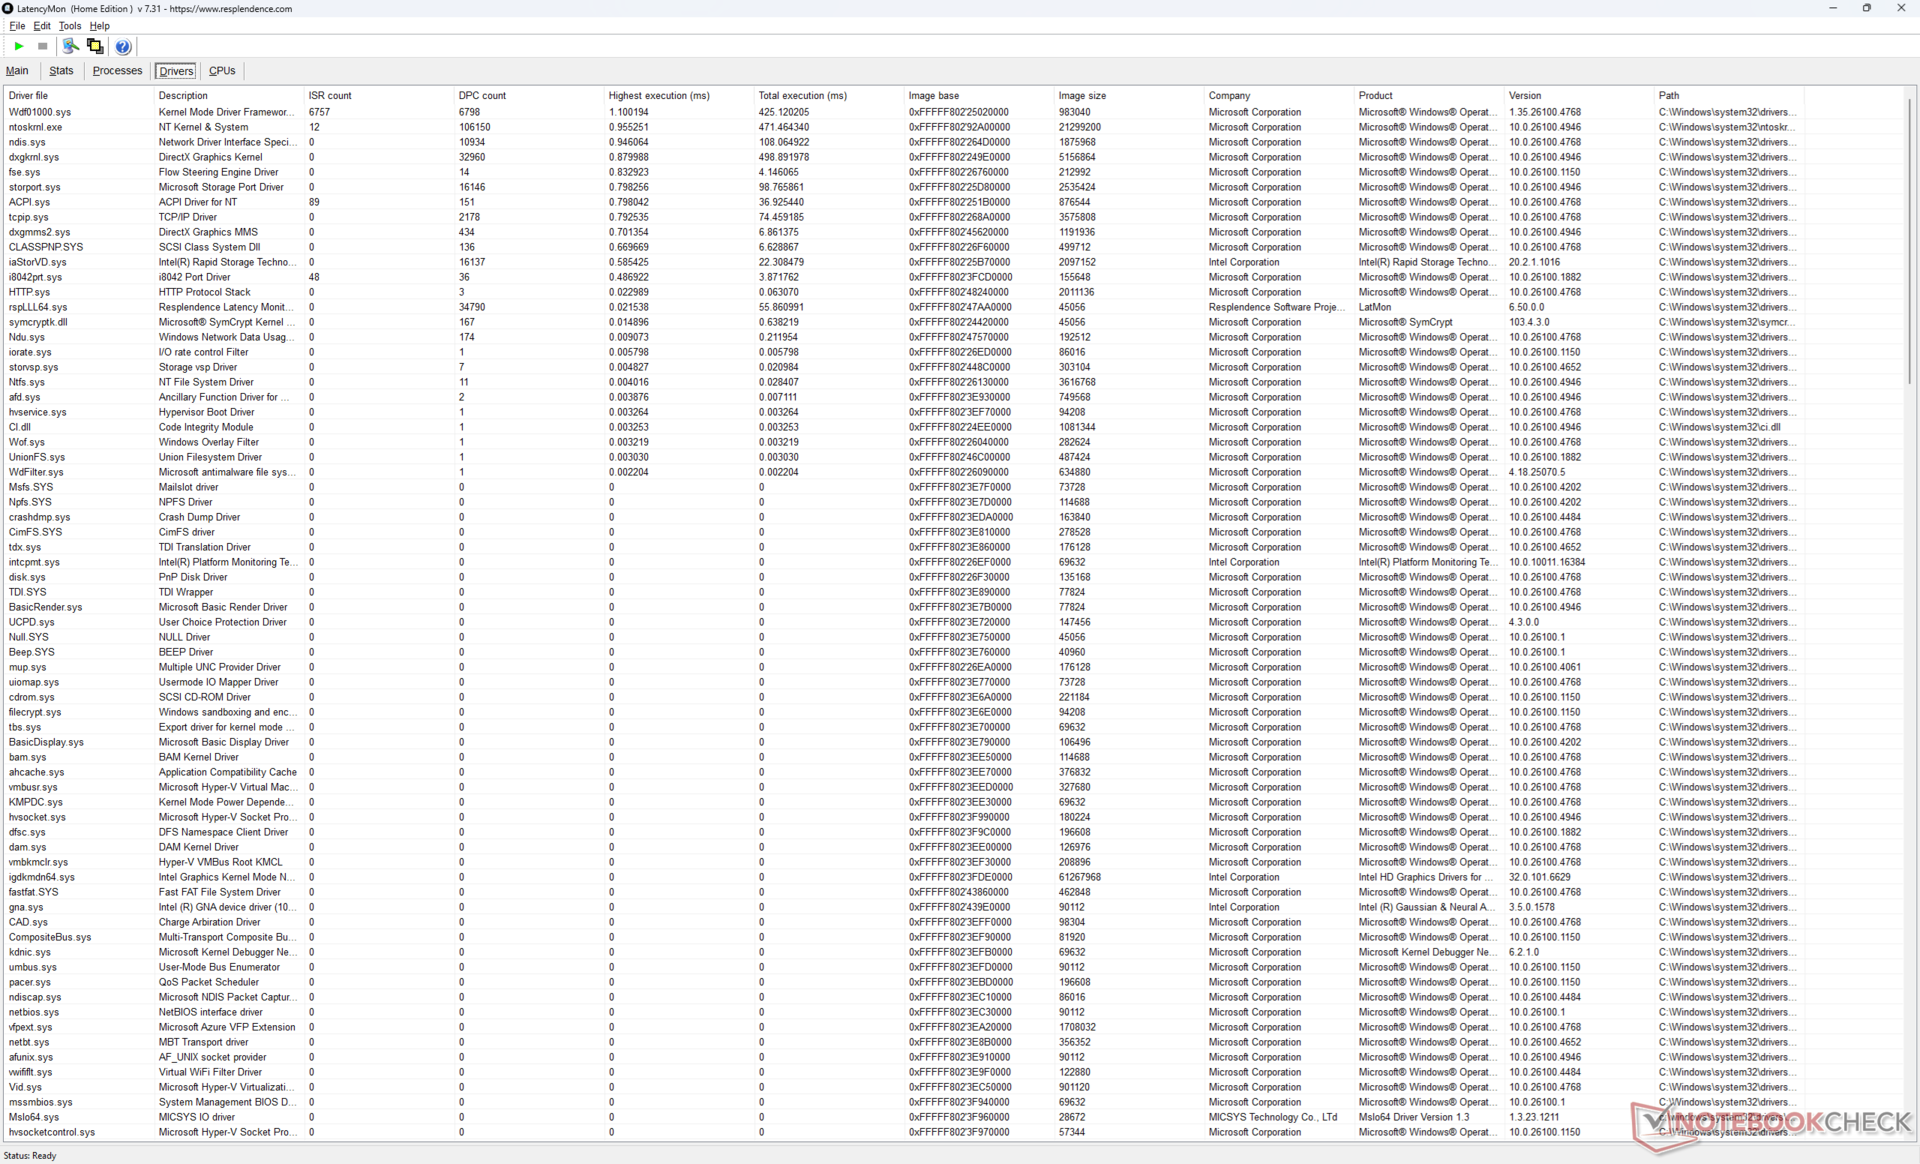
| DPC Latencies / LatencyMon - interrupt to process latency (max), Web, Youtube, Prime95 | |
| Acer Predator Helios 18 AI | |
| Razer Blade 18 2024 RZ09-0509 | |
| Alienware m18 R1 AMD | |
| MSI Crosshair 18 HX AI A2XW | |
| MSI Crosshair A17 HX D8WGKG | |
| Asus ROG Strix G18 2025 G814 | |
| MSI Vector A18 HX A9W | |
* ... smaller is better
Storage Devices

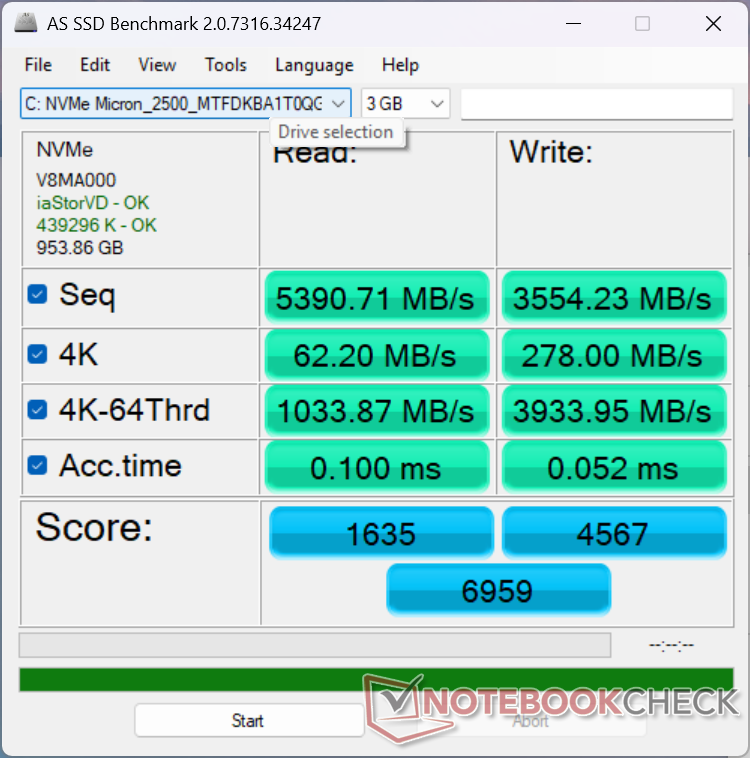


| Drive Performance rating - Percent | |
| Acer Predator Helios 18 AI | |
| Alienware m18 R1 AMD | |
| Asus ROG Strix G18 2025 G814 | |
| MSI Vector A18 HX A9W | |
| MSI Crosshair 18 HX AI A2XW | |
| Razer Blade 18 2024 RZ09-0509 | |
* ... smaller is better
Disk Throttling: DiskSpd Read Loop, Queue Depth 8
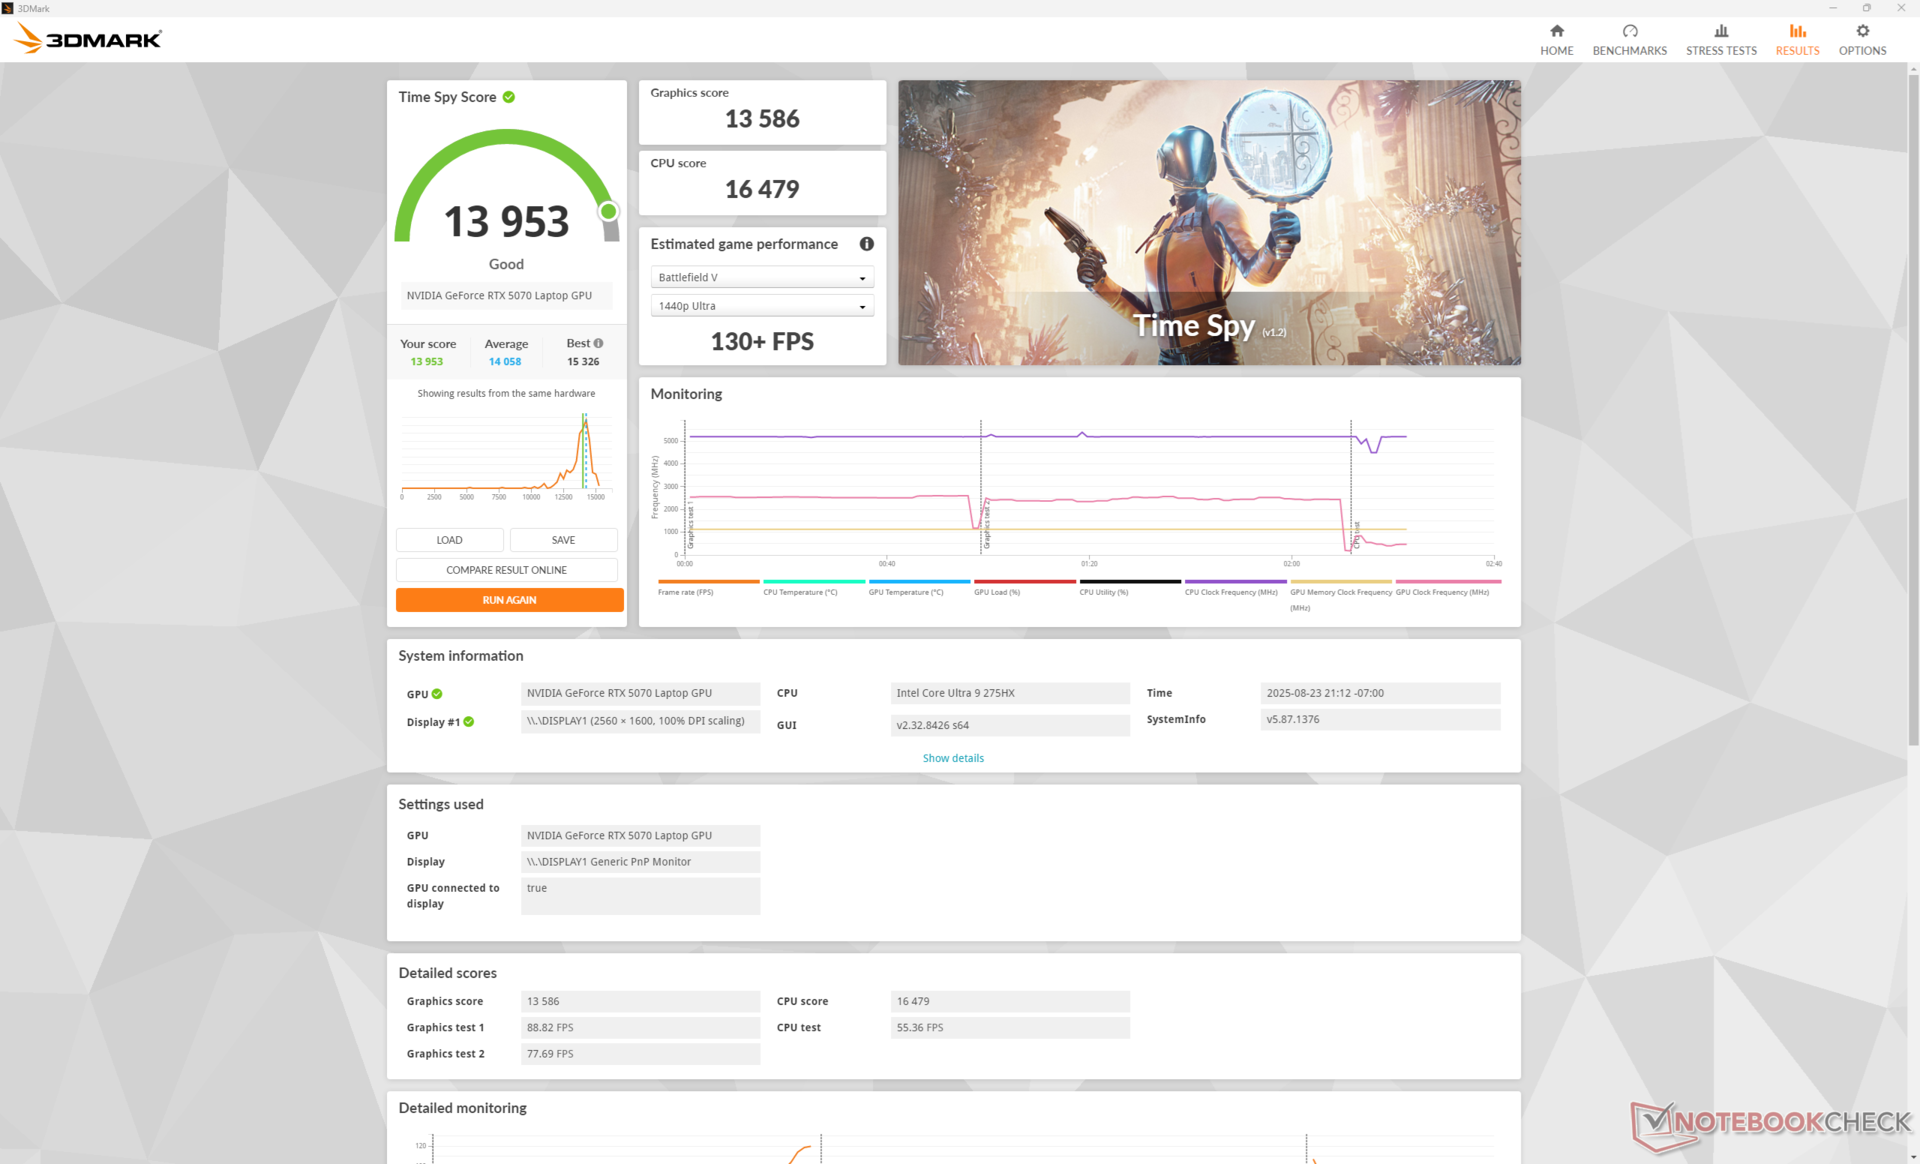
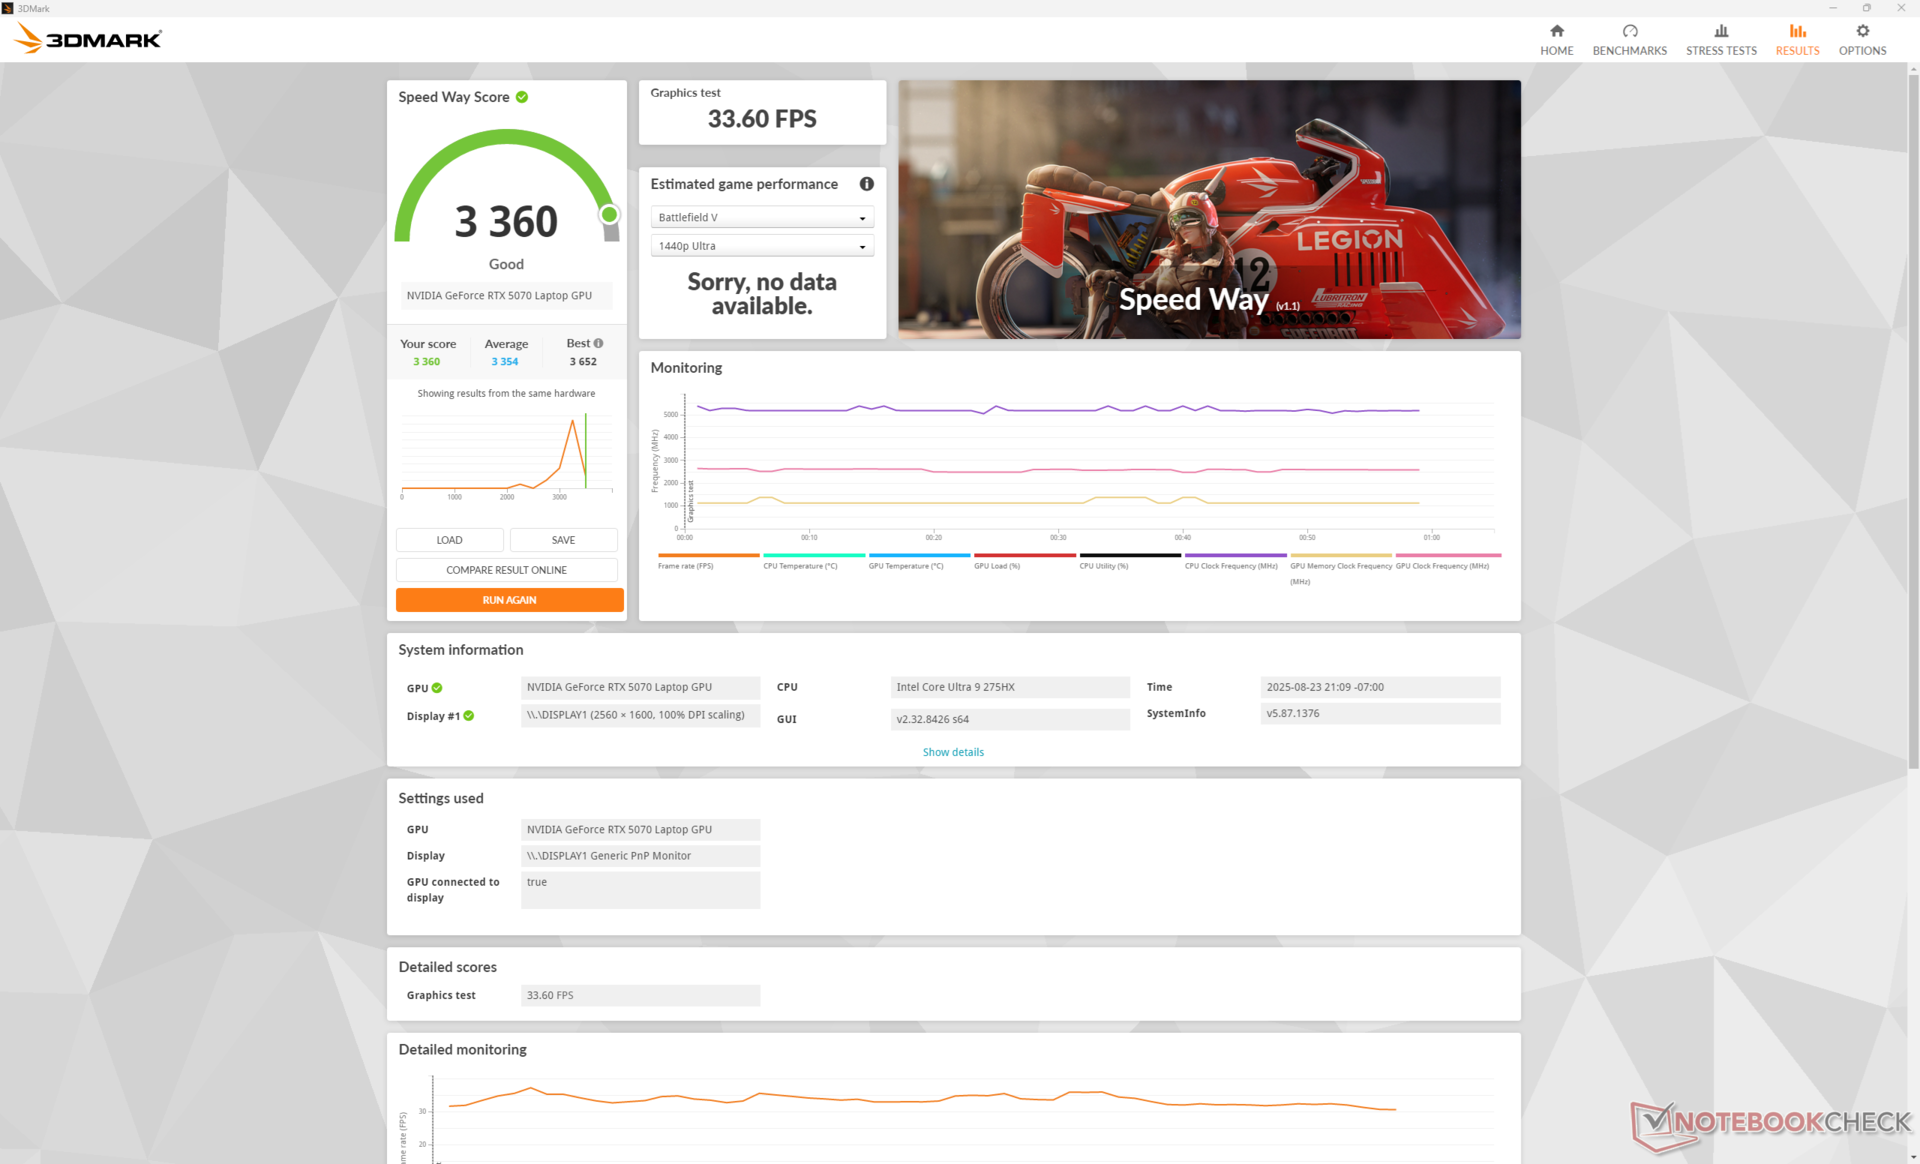
GPU Performance
Running on Cooler Boost mode (i.e., Turbo mode) won't necessarily improve performance over Performance mode as shown by the Fire Strike results table below. On the other hand, dropping down to Balanced mode incurs a performance deficit of about 10 percent.
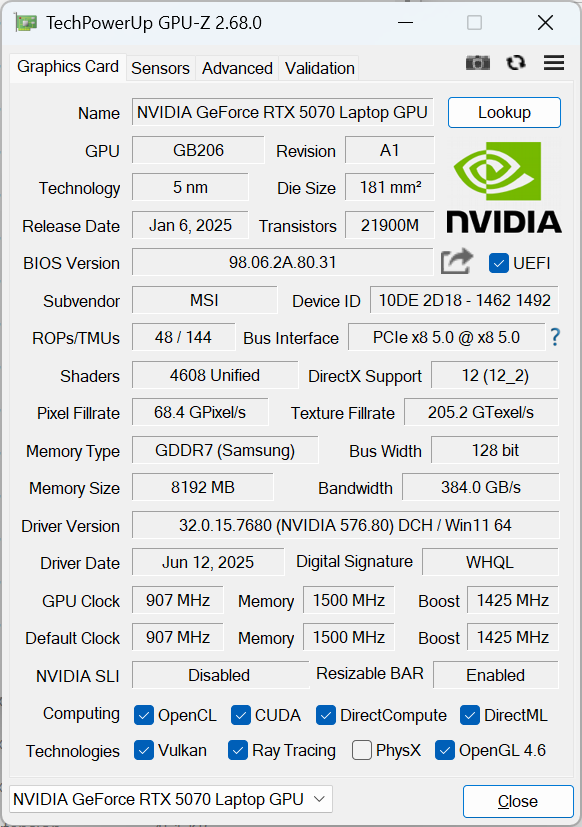
Configuring with the RTX 5060 instead of our RTX 5070 is expected to impact graphics performance by about 20 percent.
| Power Profile | Graphics Score | Physics Score | Combined Score |
| Cooler Boost Mode | 36908 | 41856 | 10151 |
| Performance Mode | 36095 (-2%) | 42319 (+1%) | 10317 (+2%) |
| Balanced Mode | 32198 (-13%) | 37821 (-10%) | 10807 (-7%) |
| Battery Power | 23250 (-37%) | 27045 (-35%) | 6514 (-36%) |


| 3DMark 11 Performance | 37868 points | |
| 3DMark Cloud Gate Standard Score | 68025 points | |
| 3DMark Fire Strike Score | 31470 points | |
| 3DMark Time Spy Score | 13953 points | |
Help | ||
* ... smaller is better
Gaming Performance
The mobile RTX 5070 is a solid GPU for 1080p gaming, but it can begin to struggle at the native QHD+ resolution if playing more demanding titles. Black Myth: Wukong, for example, clocks in at just under 40 FPS at QHD+ maximum settings even with DLSS enabled meaning that medium or medium-high settings are recommended instead to reach over 60 FPS. It's a shame that MSI offers no mobile RTX 5070 Ti options as the Ti version is almost 50 percent faster than the RTX 5070.
| Performance rating - Percent | |
| MSI Vector A18 HX A9W -1! | |
| Acer Predator Helios 18 AI | |
| MSI Crosshair A17 HX D8WGKG -1! | |
| Asus ROG Strix G18 2025 G814 | |
| Alienware m18 R1 AMD | |
| MSI Crosshair 18 HX AI A2XW | |
| Cyberpunk 2077 - 1920x1080 Ultra Preset (FSR off) | |
| Acer Predator Helios 18 AI | |
| MSI Vector A18 HX A9W | |
| Alienware m18 R1 AMD | |
| MSI Crosshair A17 HX D8WGKG | |
| Asus ROG Strix G18 2025 G814 | |
| MSI Crosshair 18 HX AI A2XW | |
| Baldur's Gate 3 - 1920x1080 Ultra Preset AA:T | |
| MSI Vector A18 HX A9W | |
| Acer Predator Helios 18 AI | |
| Alienware m18 R1 AMD | |
| MSI Crosshair 18 HX AI A2XW | |
| MSI Crosshair A17 HX D8WGKG | |
| Asus ROG Strix G18 2025 G814 | |
| GTA V - 1920x1080 Highest AA:4xMSAA + FX AF:16x | |
| MSI Crosshair A17 HX D8WGKG | |
| Asus ROG Strix G18 2025 G814 | |
| Acer Predator Helios 18 AI | |
| MSI Crosshair 18 HX AI A2XW | |
| Alienware m18 R1 AMD | |
| Final Fantasy XV Benchmark - 1920x1080 High Quality | |
| MSI Vector A18 HX A9W | |
| Acer Predator Helios 18 AI | |
| Alienware m18 R1 AMD | |
| MSI Crosshair 18 HX AI A2XW | |
| MSI Crosshair A17 HX D8WGKG | |
| Asus ROG Strix G18 2025 G814 | |
| Strange Brigade - 1920x1080 ultra AA:ultra AF:16 | |
| Acer Predator Helios 18 AI | |
| MSI Vector A18 HX A9W | |
| Alienware m18 R1 AMD | |
| Asus ROG Strix G18 2025 G814 | |
| MSI Crosshair 18 HX AI A2XW | |
| Dota 2 Reborn - 1920x1080 ultra (3/3) best looking | |
| MSI Vector A18 HX A9W | |
| MSI Crosshair A17 HX D8WGKG | |
| Asus ROG Strix G18 2025 G814 | |
| MSI Crosshair 18 HX AI A2XW | |
| Acer Predator Helios 18 AI | |
| Alienware m18 R1 AMD | |
| X-Plane 11.11 - 1920x1080 high (fps_test=3) | |
| Asus ROG Strix G18 2025 G814 | |
| MSI Vector A18 HX A9W | |
| MSI Crosshair A17 HX D8WGKG | |
| Acer Predator Helios 18 AI | |
| MSI Crosshair 18 HX AI A2XW | |
| Alienware m18 R1 AMD | |
| Monster Hunter Wilds | |
| 1920x1080 medium, no upscaling | |
| MSI Raider A18 HX A9WIG-080 | |
| NVIDIA KFA2 GeForce RTX 5070 1-Click OC | |
| MSI Crosshair 18 HX AI A2XW | |
| Average NVIDIA GeForce RTX 5070 Laptop (61.6 - 78.2, n=4) | |
| Alienware 16 Aurora | |
| 1920x1080 ultra, RT: high, no upscaling | |
| Alienware 18 Area-51 | |
| MSI Raider A18 HX A9WIG-080 | |
| NVIDIA KFA2 GeForce RTX 5070 1-Click OC | |
| MSI Vector A18 HX A9W | |
| MSI Crosshair 18 HX AI A2XW | |
| Average NVIDIA GeForce RTX 5070 Laptop (39.1 - 44.5, n=3) | |
| Alienware 16 Aurora | |
| 2560x1440 ultra, RT: high, no upscaling | |
| Alienware 18 Area-51 | |
| MSI Raider A18 HX A9WIG-080 | |
| NVIDIA KFA2 GeForce RTX 5070 1-Click OC | |
| MSI Vector A18 HX A9W | |
| Average NVIDIA GeForce RTX 5070 Laptop (21.1 - 31.7, n=3) | |
| MSI Crosshair 18 HX AI A2XW | |
| Alienware 16 Aurora | |
| 2560x1440 ultra, RT: high, DLSS3 quality | |
| Alienware 18 Area-51 | |
| MSI Vector A18 HX A9W | |
| Average NVIDIA GeForce RTX 5070 Laptop (30.4 - 41.9, n=2) | |
| MSI Crosshair 18 HX AI A2XW | |
Cyberpunk 2077 ultra FPS Chart
| low | med. | high | ultra | QHD DLSS | QHD | |
|---|---|---|---|---|---|---|
| GTA V (2015) | 185.4 | 180.4 | 176.7 | 142.1 | 126.2 | |
| Dota 2 Reborn (2015) | 220 | 189.7 | 181.8 | 165.8 | ||
| Final Fantasy XV Benchmark (2018) | 234 | 193.7 | 145.3 | 104.5 | ||
| X-Plane 11.11 (2018) | 128.6 | 114.7 | 99.8 | |||
| Strange Brigade (2018) | 510 | 339 | 280 | 244 | 168.6 | |
| Baldur's Gate 3 (2023) | 178.7 | 152 | 132.8 | 128.8 | 127.4 | 90.5 |
| Cyberpunk 2077 (2023) | 168.2 | 141.7 | 114.7 | 101.9 | 74.3 | 63.4 |
| F1 24 (2024) | 288 | 275 | 223 | 87.1 | 86.7 | 54.8 |
| Black Myth: Wukong (2024) | 106 | 79 | 62 | 36 | 39 | 26 |
| Monster Hunter Wilds (2025) | 86.5 | 75.9 | 43.2 | 30.4 | 24.3 |
Emissions
System Noise
Fan noise averages 47.7 dB(A), 54.4 dB(A), and 58.6 dB(A) when running Cyberpunk 2077 on Balanced mode, Performance mode, and Cooler Boost mode, respectively.
Noise level
| Idle |
| 27.3 / 27.3 / 27.6 dB(A) |
| Load |
| 30.1 / 58.6 dB(A) |
 | ||
30 dB silent 40 dB(A) audible 50 dB(A) loud |
||
min: | ||
| MSI Crosshair 18 HX AI A2XW GeForce RTX 5070 Laptop, Ultra 9 275HX, Micron 2500 1TB MTFDKBA1T0QGN | Asus ROG Strix G18 2025 G814 GeForce RTX 5070 Laptop, R9 9955HX, Micron 2500 1TB MTFDKBA1T0QGN | MSI Vector A18 HX A9W GeForce RTX 5070 Ti Laptop, R9 9955HX | Alienware m18 R1 AMD Radeon RX 7900M, R9 7945HX, Kioxia XG8 KXG80ZNV1T02 | Acer Predator Helios 18 AI GeForce RTX 5080 Laptop, Ultra 9 275HX, SK hynix PCB01 HFS001TFM9X186N | Razer Blade 18 2024 RZ09-0509 GeForce RTX 4090 Laptop GPU, i9-14900HX | MSI Crosshair A17 HX D8WGKG GeForce RTX 5070 Laptop, R9 8940HX, Samsung PM9C1 MZVL81T0HELB-00BTW | |
|---|---|---|---|---|---|---|---|
| Noise | -1% | -7% | 2% | -1% | -4% | -24% | |
| off / environment * (dB) | 23.1 | 24.6 -6% | 22.5 3% | 22.4 3% | 24 -4% | 23.4 -1% | 24 -4% |
| Idle Minimum * (dB) | 27.3 | 24.6 10% | 26 5% | 23 16% | 24 12% | 23.9 12% | 25 8% |
| Idle Average * (dB) | 27.3 | 30 -10% | 26 5% | 23.4 14% | 24 12% | 28.2 -3% | 30 -10% |
| Idle Maximum * (dB) | 27.6 | 30 -9% | 32 -16% | 33.5 -21% | 31.31 -13% | 29 -5% | 47 -70% |
| Load Average * (dB) | 30.1 | 34.4 -14% | 44.4 -48% | 33.5 -11% | 40.31 -34% | 36.8 -22% | 57 -89% |
| Cyberpunk 2077 ultra * (dB) | 54.4 | 49.7 9% | 49.8 8% | 50.33 7% | 57 -5% | ||
| Load Maximum * (dB) | 58.6 | 49.7 15% | 61.6 -5% | 53.6 9% | 50.33 14% | 61.1 -4% | 58 1% |
| Witcher 3 ultra * (dB) | 53.6 | 54.1 |
* ... smaller is better
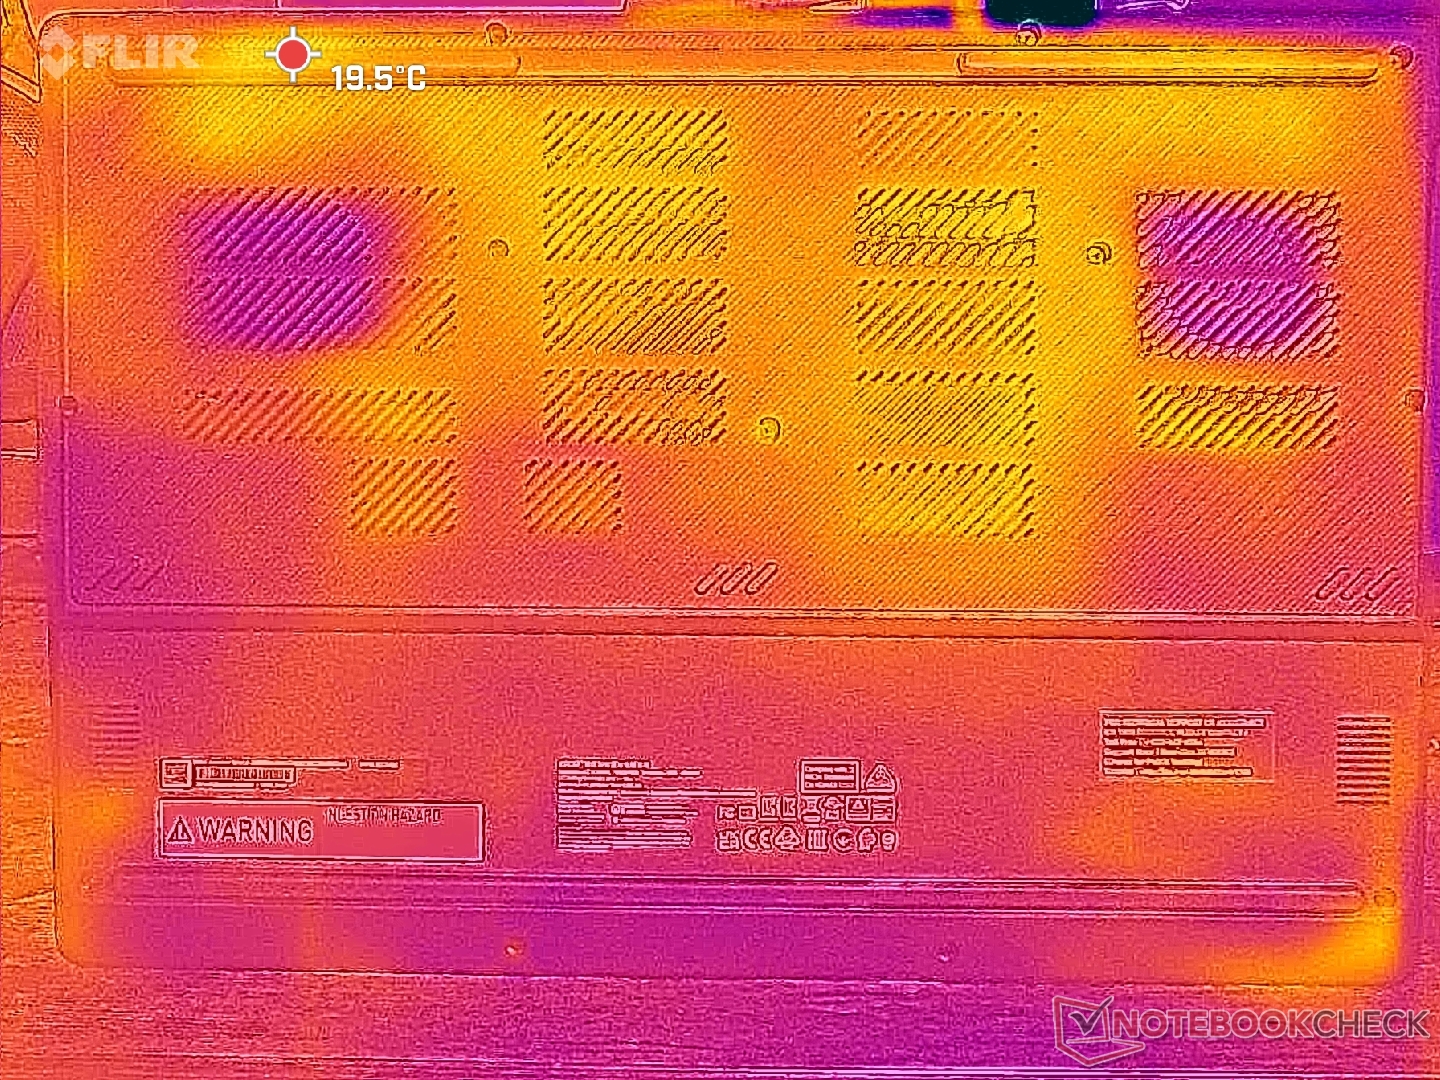
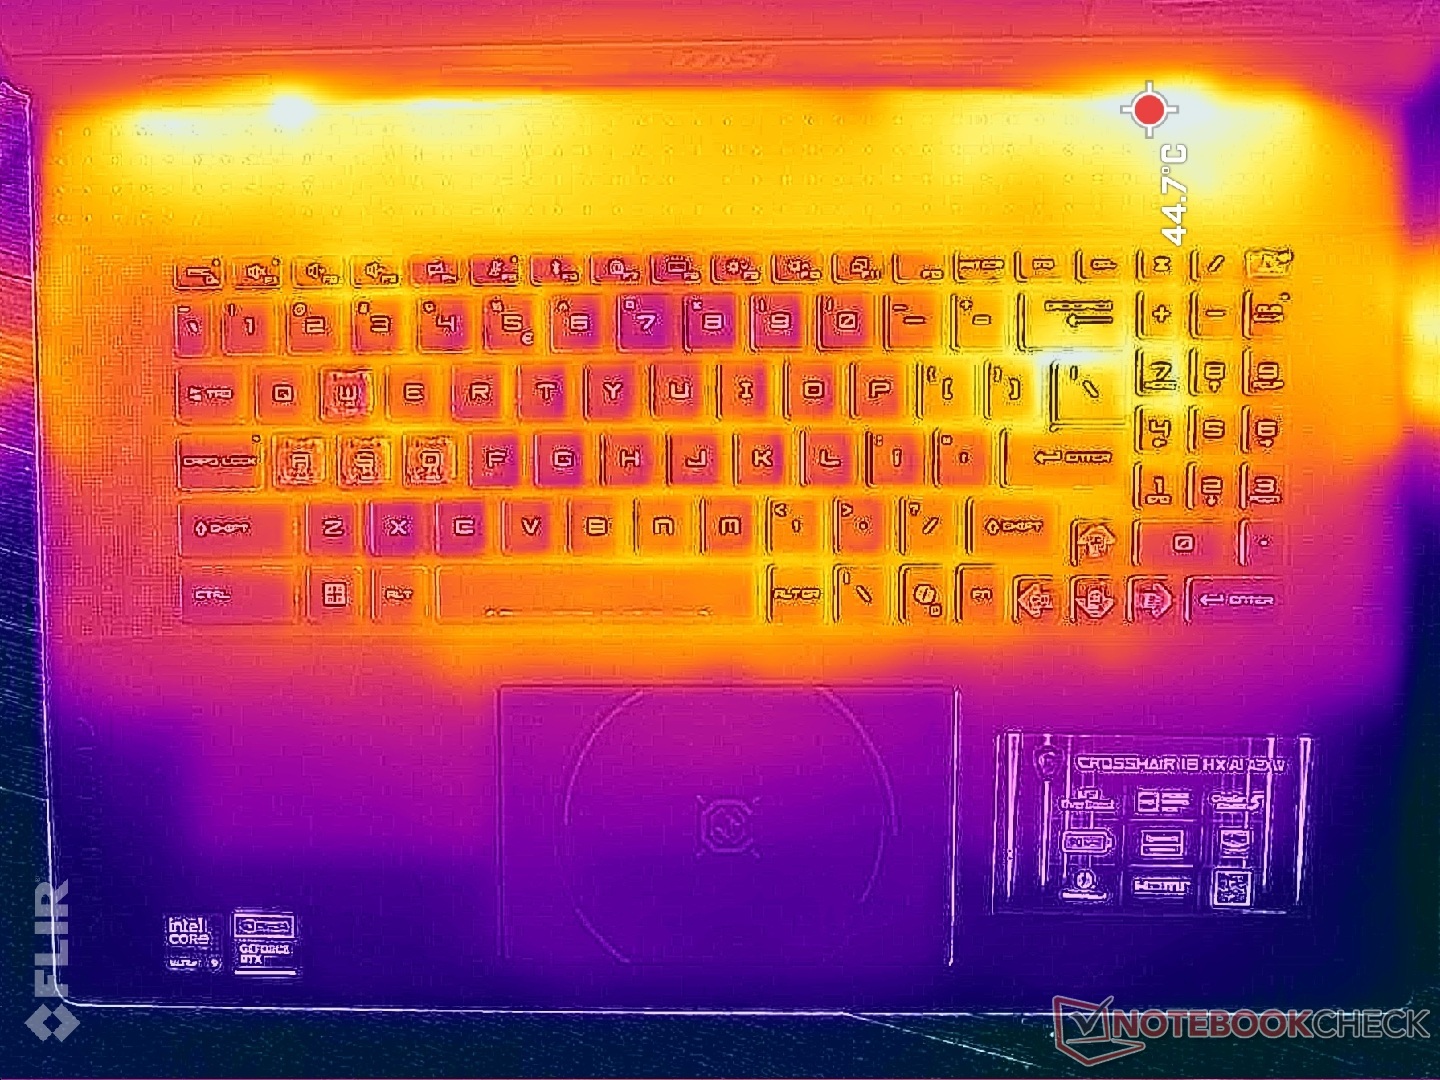
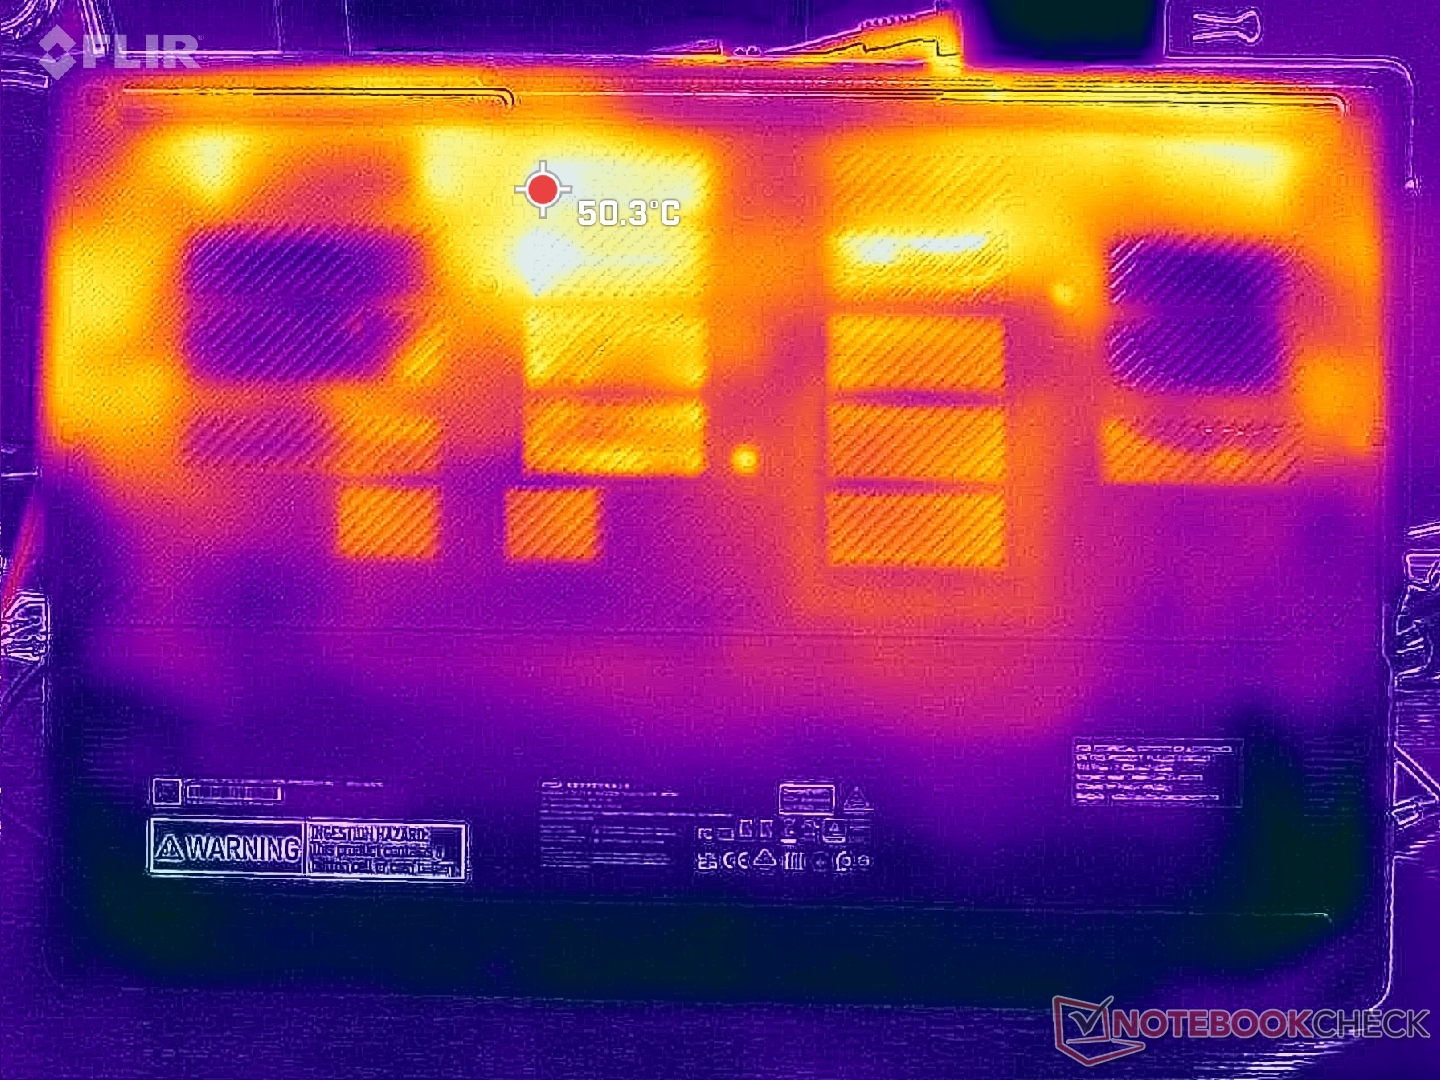
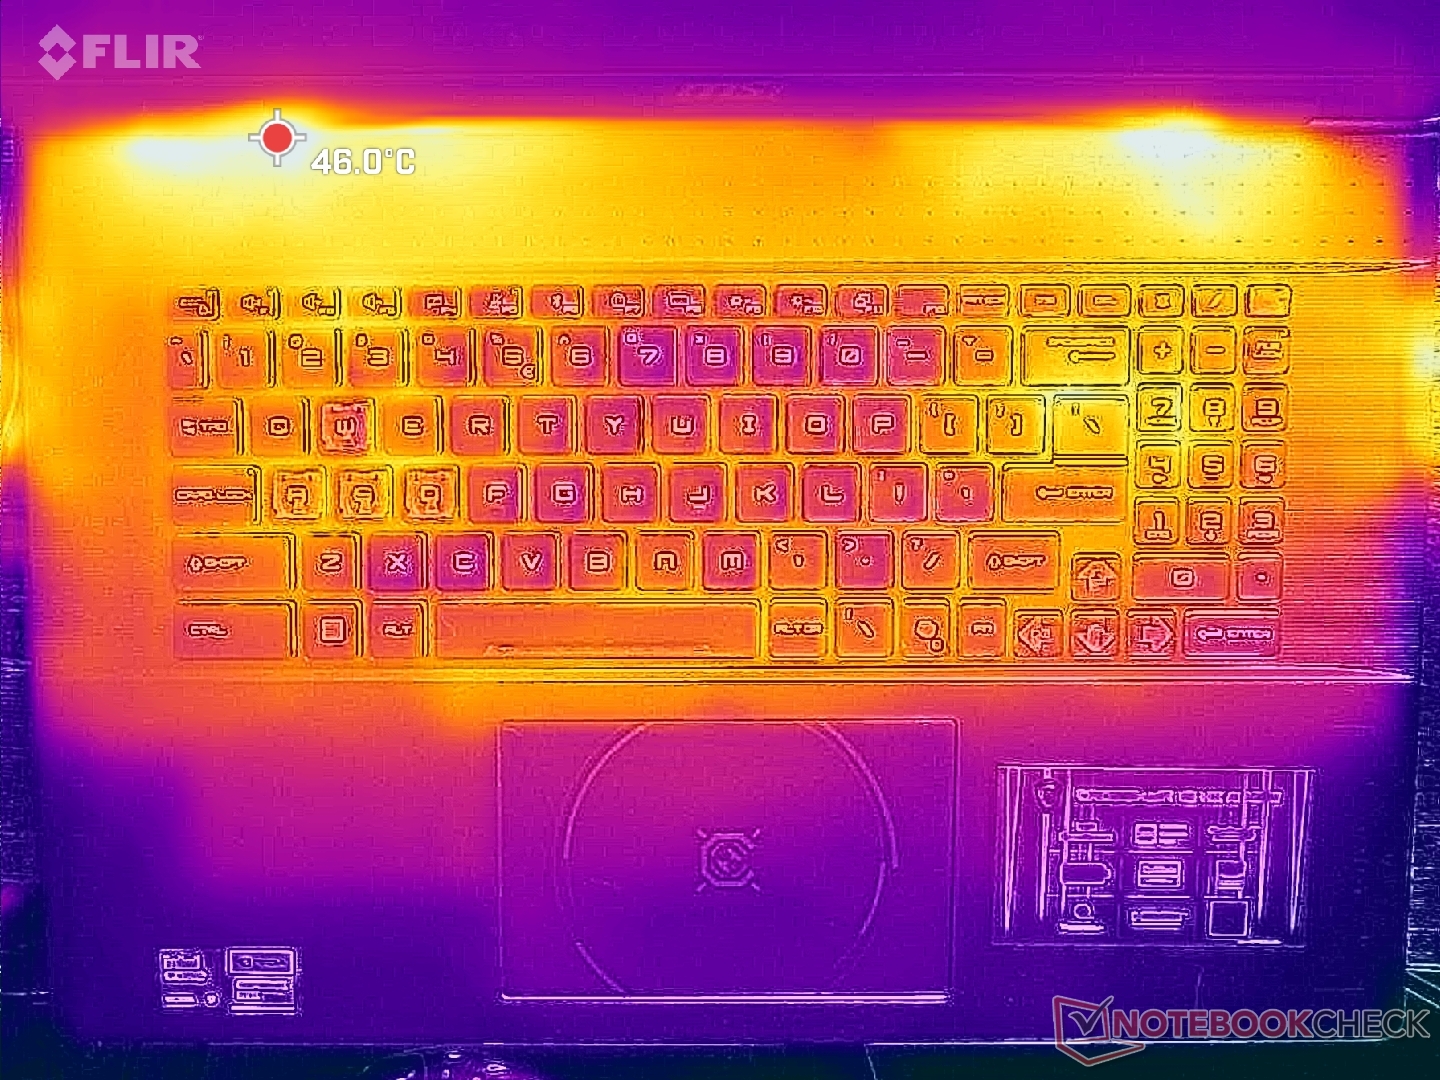
Temperature
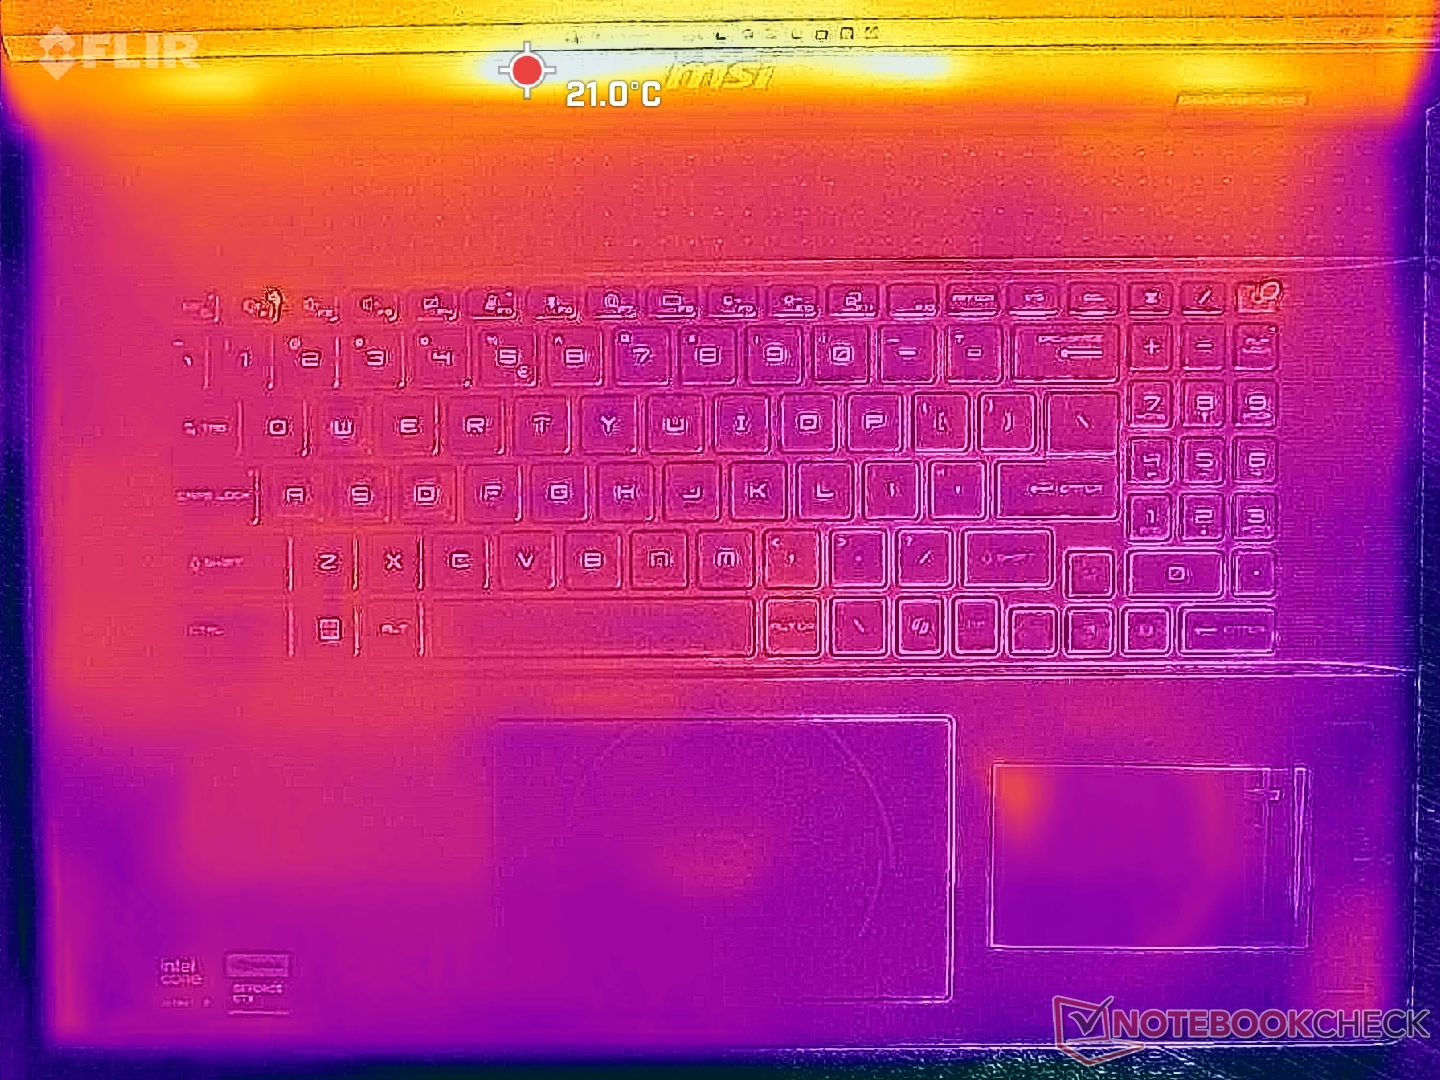
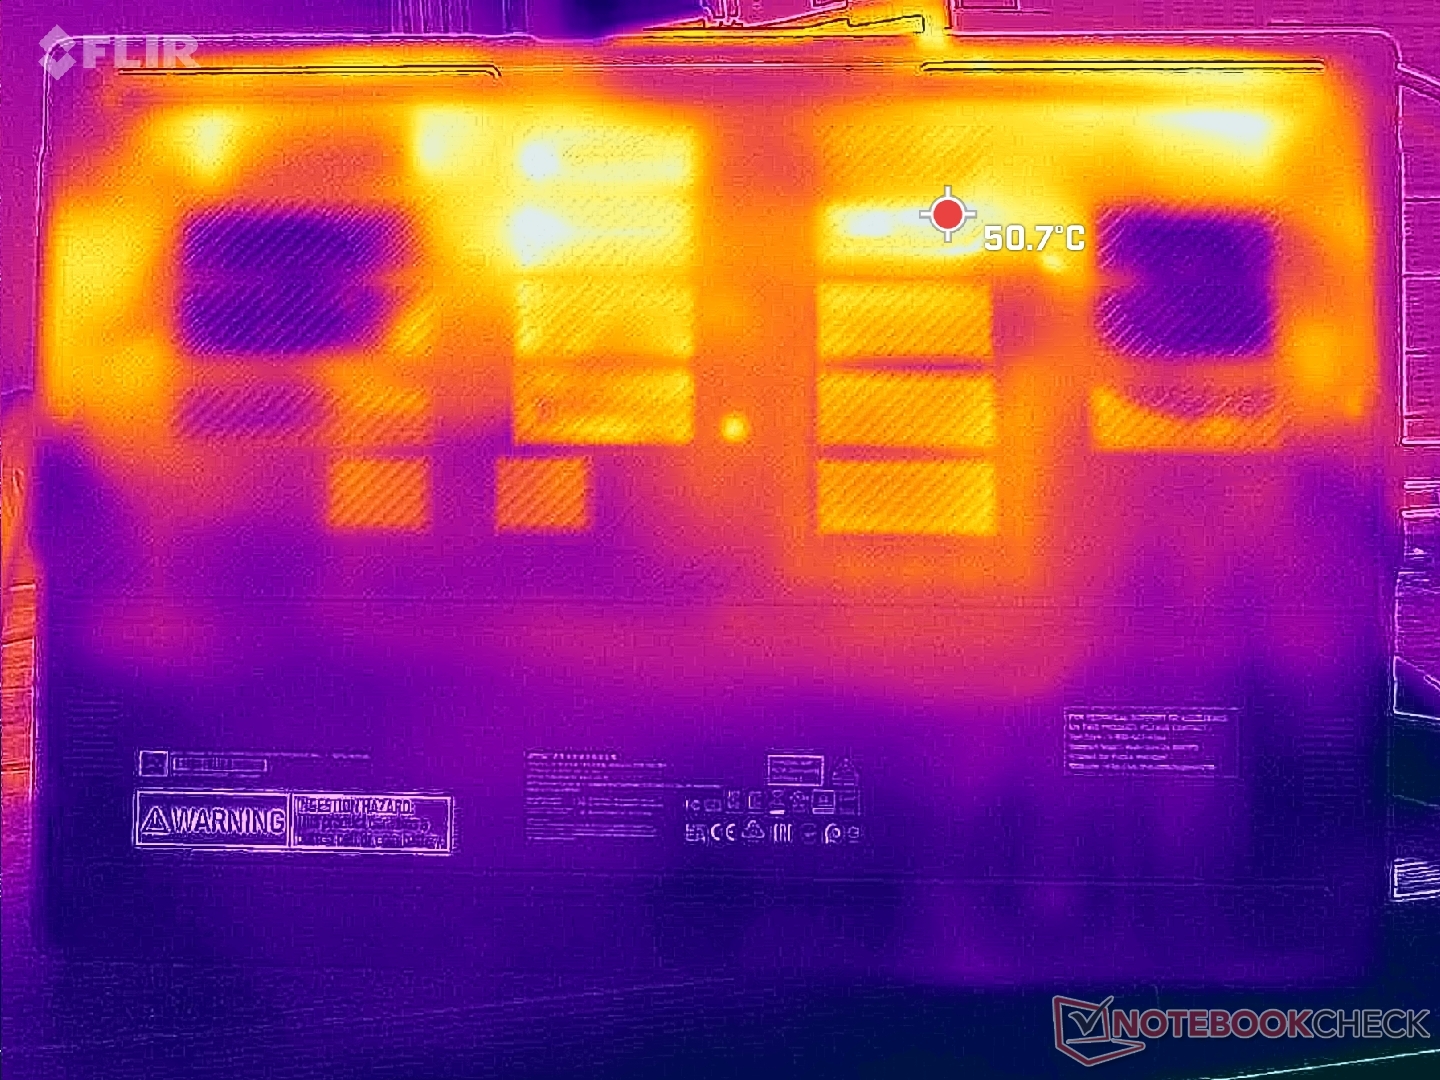
Surface temperatures are never uncomfortably warm on the keyboard or palm rests owing to the large form factor and plentiful ventilation.
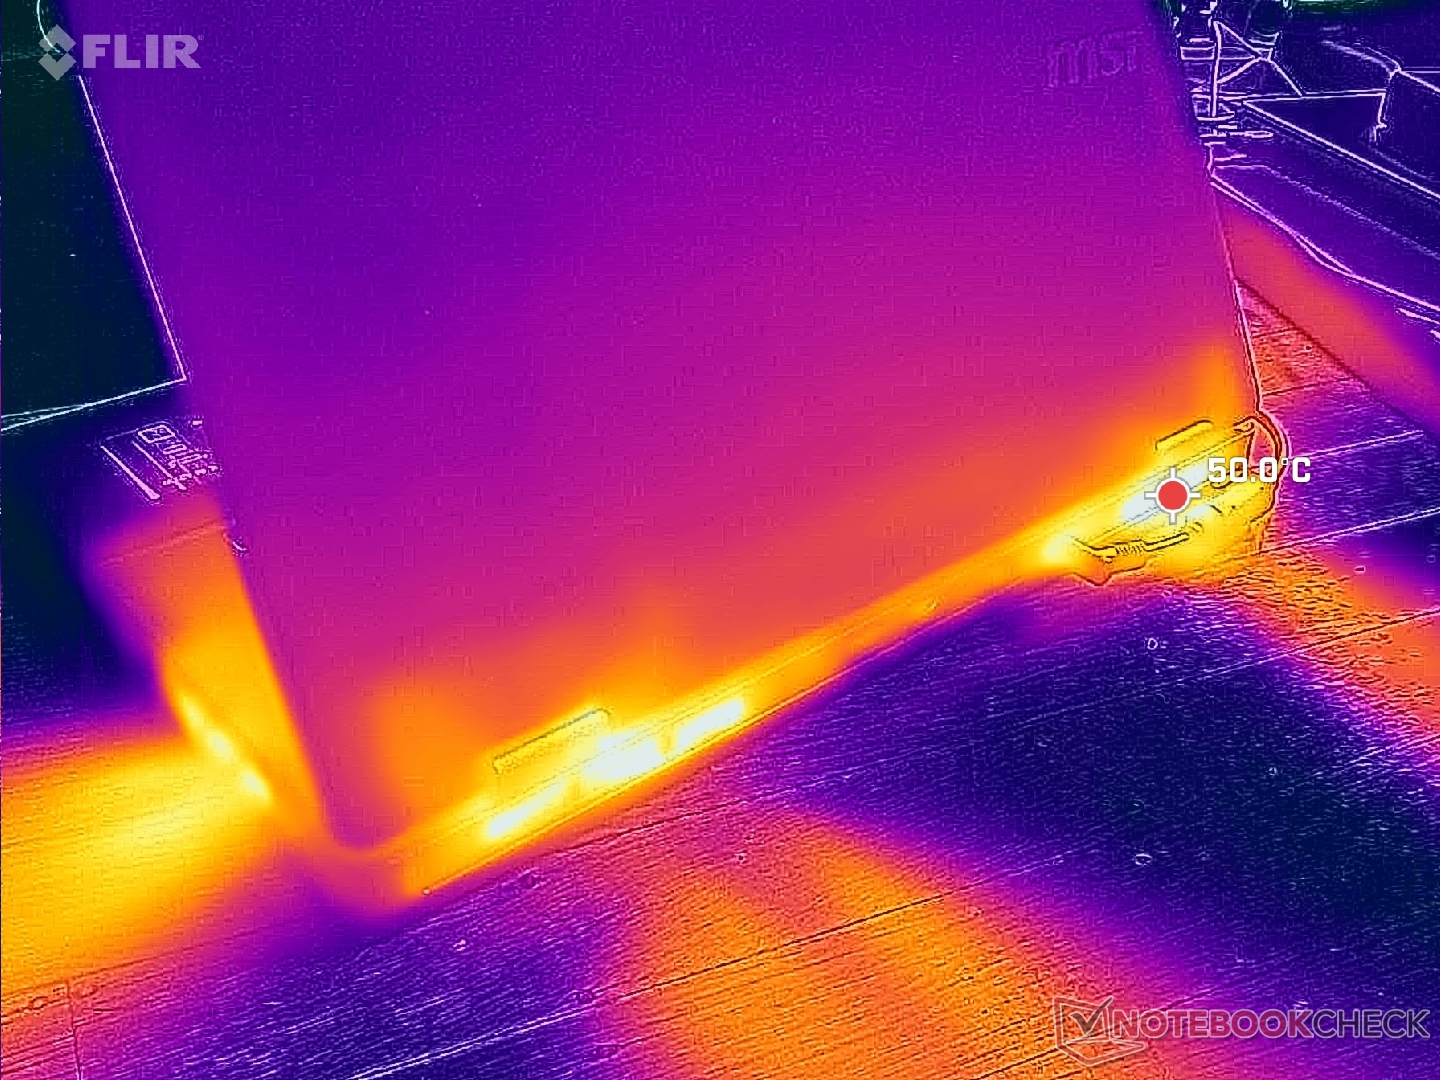
(±) The maximum temperature on the upper side is 40.2 °C / 104 F, compared to the average of 40.4 °C / 105 F, ranging from 21.2 to 68.8 °C for the class Gaming.
(±) The bottom heats up to a maximum of 44 °C / 111 F, compared to the average of 43.2 °C / 110 F
(+) In idle usage, the average temperature for the upper side is 25.1 °C / 77 F, compared to the device average of 33.9 °C / 93 F.
(±) 3: The average temperature for the upper side is 35.7 °C / 96 F, compared to the average of 33.9 °C / 93 F for the class Gaming.
(+) The palmrests and touchpad are cooler than skin temperature with a maximum of 28.6 °C / 83.5 F and are therefore cool to the touch.
(±) The average temperature of the palmrest area of similar devices was 28.8 °C / 83.8 F (+0.2 °C / 0.3 F).
| MSI Crosshair 18 HX AI A2XW Intel Core Ultra 9 275HX, NVIDIA GeForce RTX 5070 Laptop | Asus ROG Strix G18 2025 G814 AMD Ryzen 9 9955HX, NVIDIA GeForce RTX 5070 Laptop | MSI Vector A18 HX A9W AMD Ryzen 9 9955HX, NVIDIA GeForce RTX 5070 Ti Laptop | Alienware m18 R1 AMD AMD Ryzen 9 7945HX, AMD Radeon RX 7900M | Acer Predator Helios 18 AI Intel Core Ultra 9 275HX, NVIDIA GeForce RTX 5080 Laptop | Razer Blade 18 2024 RZ09-0509 Intel Core i9-14900HX, NVIDIA GeForce RTX 4090 Laptop GPU | MSI Crosshair A17 HX D8WGKG AMD Ryzen 9 8940HX, NVIDIA GeForce RTX 5070 Laptop | |
|---|---|---|---|---|---|---|---|
| Heat | -2% | -12% | -6% | -26% | -20% | -32% | |
| Maximum Upper Side * (°C) | 40.2 | 42.8 -6% | 46.6 -16% | 40.2 -0% | 48 -19% | 43.2 -7% | 51 -27% |
| Maximum Bottom * (°C) | 44 | 43.1 2% | 45.6 -4% | 37.4 15% | 59 -34% | 42.6 3% | 49 -11% |
| Idle Upper Side * (°C) | 25.6 | 26.8 -5% | 31.2 -22% | 31.6 -23% | 33 -29% | 36 -41% | 40 -56% |
| Idle Bottom * (°C) | 26.8 | 26.6 1% | 28.6 -7% | 30.6 -14% | 33 -23% | 36.4 -36% | 36 -34% |
* ... smaller is better
Speakers
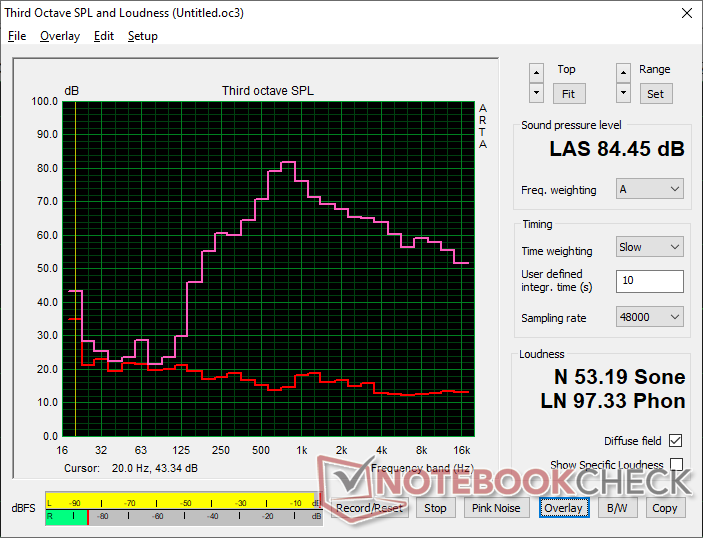
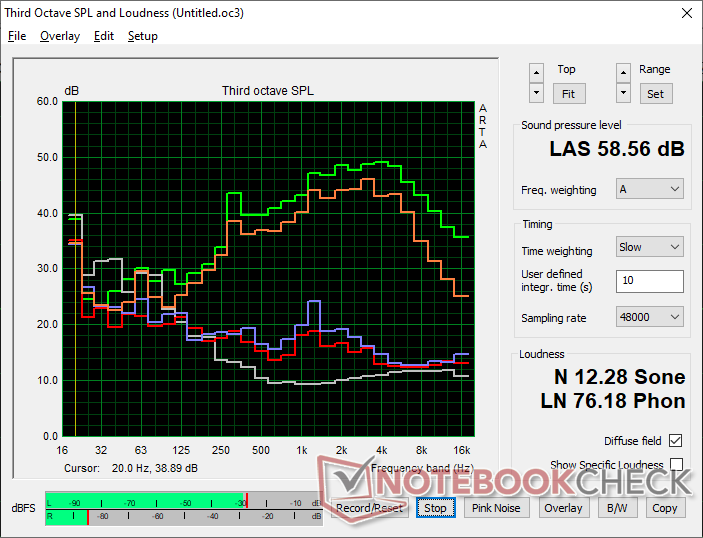
MSI Crosshair 18 HX AI A2XW audio analysis
(+) | speakers can play relatively loud (84.5 dB)
Bass 100 - 315 Hz
(±) | reduced bass - on average 14.8% lower than median
(±) | linearity of bass is average (14.7% delta to prev. frequency)
Mids 400 - 2000 Hz
(±) | higher mids - on average 11.9% higher than median
(±) | linearity of mids is average (10% delta to prev. frequency)
Highs 2 - 16 kHz
(+) | balanced highs - only 3% away from median
(+) | highs are linear (4.9% delta to prev. frequency)
Overall 100 - 16.000 Hz
(±) | linearity of overall sound is average (22.3% difference to median)
Compared to same class
» 80% of all tested devices in this class were better, 6% similar, 14% worse
» The best had a delta of 6%, average was 18%, worst was 132%
Compared to all devices tested
» 65% of all tested devices were better, 6% similar, 29% worse
» The best had a delta of 4%, average was 24%, worst was 134%
Apple MacBook Pro 16 2021 M1 Pro audio analysis
(+) | speakers can play relatively loud (84.7 dB)
Bass 100 - 315 Hz
(+) | good bass - only 3.8% away from median
(+) | bass is linear (5.2% delta to prev. frequency)
Mids 400 - 2000 Hz
(+) | balanced mids - only 1.3% away from median
(+) | mids are linear (2.1% delta to prev. frequency)
Highs 2 - 16 kHz
(+) | balanced highs - only 1.9% away from median
(+) | highs are linear (2.7% delta to prev. frequency)
Overall 100 - 16.000 Hz
(+) | overall sound is linear (4.6% difference to median)
Compared to same class
» 0% of all tested devices in this class were better, 0% similar, 100% worse
» The best had a delta of 5%, average was 17%, worst was 45%
Compared to all devices tested
» 0% of all tested devices were better, 0% similar, 100% worse
» The best had a delta of 4%, average was 24%, worst was 134%
Energy Management
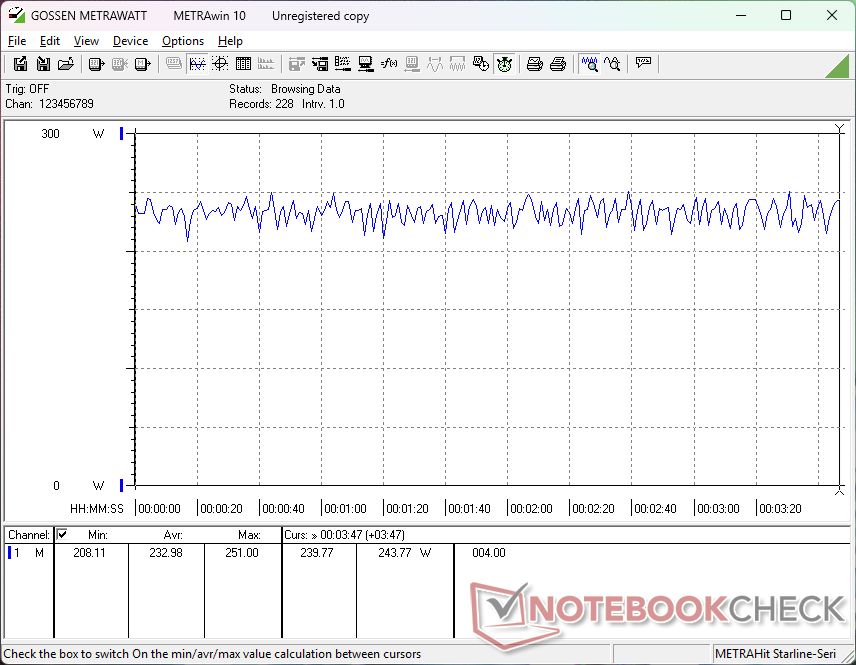
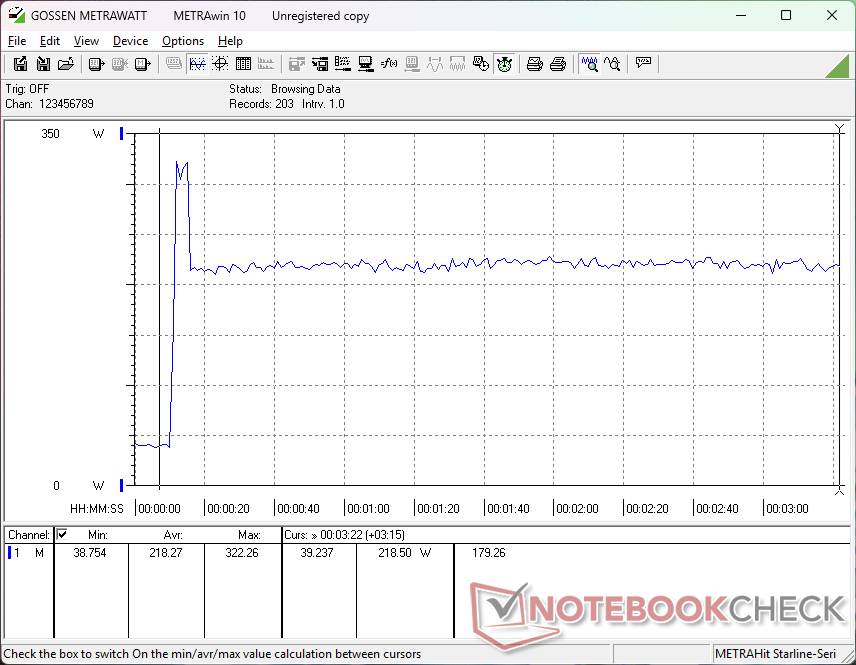
Power Consumption
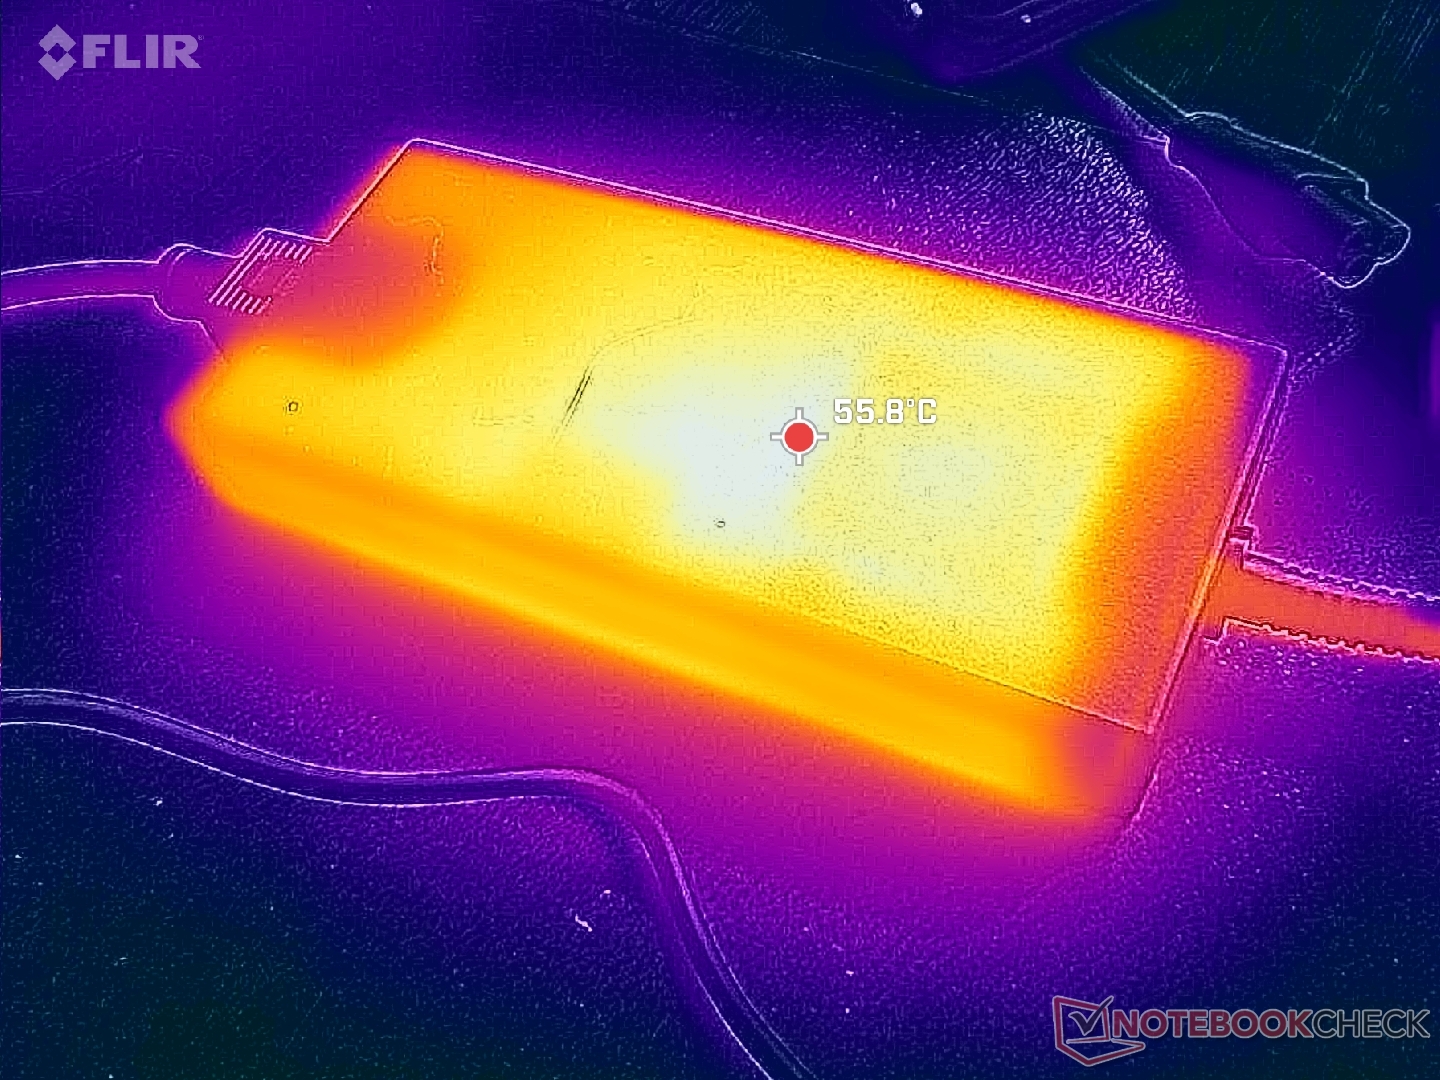
Running games demand an average of 233 W from the medium-sized 240 W AC adapter. In fact, consumption can spike to as high as 323 W when the CPU and GPU are fully stressed as shown by the graph below. This suggests that the laptop could have benefited from a larger 280 W or greater AC adapter especially if charging and gaming simultaneously.

| Off / Standby | |
| Idle | |
| Load |
|
Key:
min: | |
| MSI Crosshair 18 HX AI A2XW Ultra 9 275HX, GeForce RTX 5070 Laptop, Micron 2500 1TB MTFDKBA1T0QGN, IPS, 2560x1600, 18" | Asus ROG Strix G18 2025 G814 R9 9955HX, GeForce RTX 5070 Laptop, Micron 2500 1TB MTFDKBA1T0QGN, IPS, 2560x1600, 18" | MSI Vector A18 HX A9W R9 9955HX, GeForce RTX 5070 Ti Laptop, , IPS, 2560x1600, 18" | Alienware m18 R1 AMD R9 7945HX, Radeon RX 7900M, Kioxia XG8 KXG80ZNV1T02, IPS, 1920x1200, 18" | Acer Predator Helios 18 AI Ultra 9 275HX, GeForce RTX 5080 Laptop, SK hynix PCB01 HFS001TFM9X186N, IPS, 2560x1600, 18" | Razer Blade 18 2024 RZ09-0509 i9-14900HX, GeForce RTX 4090 Laptop GPU, , Mini-LED, 2560x1600, 18" | MSI Crosshair A17 HX D8WGKG R9 8940HX, GeForce RTX 5070 Laptop, Samsung PM9C1 MZVL81T0HELB-00BTW, IPS, 2560x1600, 17" | |
|---|---|---|---|---|---|---|---|
| Power Consumption | -3% | -77% | -156% | -25% | -87% | -64% | |
| Idle Minimum * (Watt) | 8.8 | 13.1 -49% | 20.8 -136% | 30.3 -244% | 17.3 -97% | 25.4 -189% | 32 -264% |
| Idle Average * (Watt) | 14.1 | 20.6 -46% | 52.8 -274% | 55.6 -294% | 23 -63% | 37.7 -167% | 36 -155% |
| Idle Maximum * (Watt) | 35.4 | 21.1 40% | 54.5 -54% | 101.1 -186% | 25.3 29% | 57.9 -64% | 47 -33% |
| Load Average * (Watt) | 106.2 | 123.4 -16% | 146.6 -38% | 160.3 -51% | 123 -16% | 128.4 -21% | 132 -24% |
| Cyberpunk 2077 ultra external monitor * (Watt) | 225 | 179.2 20% | 278 -24% | 243 -8% | 216 4% | ||
| Cyberpunk 2077 ultra * (Watt) | 233 | 215 8% | 285 -22% | 244 -5% | 222 5% | ||
| Load Maximum * (Watt) | 322.3 | 249.7 23% | 297.3 8% | 332.1 -3% | 375 -16% | 297.9 8% | 261 19% |
| Witcher 3 ultra * (Watt) | 216 | 273.1 |
* ... smaller is better
Power Consumption Cyberpunk / Stress Test
Power Consumption external Monitor
Battery Life
WLAN runtime is almost 11 hours when set to iGPU mode to be longer than many other gaming laptops.
| MSI Crosshair 18 HX AI A2XW Ultra 9 275HX, GeForce RTX 5070 Laptop, 90 Wh | Asus ROG Strix G18 2025 G814 R9 9955HX, GeForce RTX 5070 Laptop, 90 Wh | MSI Vector A18 HX A9W R9 9955HX, GeForce RTX 5070 Ti Laptop, 99 Wh | Alienware m18 R1 AMD R9 7945HX, Radeon RX 7900M, 97 Wh | Acer Predator Helios 18 AI Ultra 9 275HX, GeForce RTX 5080 Laptop, 99 Wh | Razer Blade 18 2024 RZ09-0509 i9-14900HX, GeForce RTX 4090 Laptop GPU, 91.7 Wh | MSI Crosshair A17 HX D8WGKG R9 8940HX, GeForce RTX 5070 Laptop, 90 Wh | |
|---|---|---|---|---|---|---|---|
| Battery runtime | -35% | -65% | -87% | -55% | -60% | -60% | |
| WiFi v1.3 (h) | 10.9 | 7.1 -35% | 3.8 -65% | 1.4 -87% | 4.9 -55% | 4.4 -60% | 4.4 -60% |
| Reader / Idle (h) | 7 | 4.5 | 6.6 | ||||
| Load (h) | 0.7 | 1.5 | 1 | ||||
| H.264 (h) | 4.3 |
Notebookcheck Rating
The Crosshair 18 HX offers a big screen with extremely fast CPU performance, but it pares back the GPU and display resolution to improve affordability.
MSI Crosshair 18 HX AI A2XW
- 08/30/2025 v8
Allen Ngo
 Total Sustainability Score:
 Potential Competitors in Comparison
Image | Model / Review | Price | Weight | Height | Display |
|---|---|---|---|---|---|
1. 81.7%  | MSI Crosshair 18 HX AI A2XW Intel Core Ultra 9 275HX ⎘ NVIDIA GeForce RTX 5070 Laptop ⎘ 32 GB Memory, 1024 GB SSD | Amazon: 1. $1,799.99 msi Crosshair 18 HX AI 18" 2... 2. $2,045.99 msi Crosshair 18 HX AI Gamin... 3. $1,899.99 msi Crosshair 18 HX AI 18" 2... List Price: 1700 USD | 3.1 kg | 29.9 mm | 18.00" 2560x1600 168 PPI IPS |
2. 86.4%  | Asus ROG Strix G18 2025 G814 AMD Ryzen 9 9955HX ⎘ NVIDIA GeForce RTX 5070 Laptop ⎘ 32 GB Memory, 1024 GB SSD | Amazon: List Price: 2299€ | 2.9 kg | 30.8 mm | 18.00" 2560x1600 168 PPI IPS |
3. 84.8%  | MSI Vector A18 HX A9W AMD Ryzen 9 9955HX ⎘ NVIDIA GeForce RTX 5070 Ti Laptop ⎘ 32 GB Memory | Amazon: List Price: 3200 USD | 3.5 kg | 32.05 mm | 18.00" 2560x1600 189 PPI IPS |
4. 89.2% v7 (old)  | Alienware m18 R1 AMD AMD Ryzen 9 7945HX ⎘ AMD Radeon RX 7900M ⎘ 32 GB Memory, 1024 GB SSD | Amazon: 1. $2,958.88 Alienware M18 Gaming Laptop ... 2. Alienware m18 AMD Gaming Lap... 3. $2,999.97 Alienware X17 R1, 17.3 inch ... List Price: 2300 USD | 3.9 kg | 26.7 mm | 18.00" 1920x1200 126 PPI IPS |
5. 86.4%  | Acer Predator Helios 18 AI Intel Core Ultra 9 275HX ⎘ NVIDIA GeForce RTX 5080 Laptop ⎘ 31.6 GB Memory, SSD | Amazon: List Price: 3999 Euro | 3.5 kg | 29.55 mm | 18.00" 2560x1600 168 PPI IPS |
6. 90.5% v7 (old)  | Razer Blade 18 2024 RZ09-0509 Intel Core i9-14900HX ⎘ NVIDIA GeForce RTX 4090 Laptop GPU ⎘ 32 GB Memory | Amazon: List Price: 4500 USD | 3.1 kg | 21.9 mm | 18.00" 2560x1600 168 PPI Mini-LED |
7. 79.6%  | MSI Crosshair A17 HX D8WGKG AMD Ryzen 9 8940HX ⎘ NVIDIA GeForce RTX 5070 Laptop ⎘ 32 GB Memory, 1024 GB SSD | Amazon: List Price: 2000 EUR | 2.9 kg | 29.7 mm | 17.00" 2560x1600 178 PPI IPS |
