Verdict
Although just under $1,500 for the review version with a Full HD display, Core i7-14700HX, 16 GB of RAM, 1 TB SSD, and Windows 11 Home is certainly a lot of money, the LOQ 17IRX10 is still one of the more affordable RTX 5070-based laptops.
Accordingly, expectations can't be set quite as high as some competitors, but Lenovo – with one or two criticisms – still manages to do a decent job. It deserves particular credit for the graphics card's good performance. Thanks to the built-in GPU overclocking, the RTX 5070 delivers above-average performance. On the positive side, we also have the two RAM and SSD slots for future upgrades, the relatively good input devices, and dirt-resistant surfaces.
Apart from that, the case could been better. The plastic materials don't feel particularly high-quality and tend to rattle here and there. Lenovo could also improve the display brightness, port distribution, and battery capacity. As with most gaming laptops, the LOQ 17 also gets quite loud during 3D mode (at least in performance mode).
Pros
Cons
Price and availability
The Lenovo LOQ 17IRX10 with a Core i7-14700HX and GeForce RTX 5070 is available for around $1,500.
- $1,309.00Lenovo LOQ Gaming Laptop, Intel i5-13450HX, 16 GB DDR5 RAM, 512 GB PCIe SSD, 17.3" FHD (1920x1080) 165Hz IPS Display, Nvidia G-Force RTX 5050, Backlit Keyboard, W11 Home, Luna Gray
- $1,429.00Lenovo LOQ Gaming Laptop, Intel i5-13450HX, 16 GB DDR5 RAM, 1 TB PCIe SSD, 17.3" FHD (1920x1080) 165Hz IPS Display, Nvidia G-Force RTX 5050, Backlit Keyboard, W11 Home, Luna Gray
- $1,639.00Lenovo LOQ Gaming Laptop, Intel i5-13450HX, 32 GB DDR5 RAM, 1 TB PCIe SSD, 17.3" FHD (1920x1080) 165Hz IPS Display, Nvidia G-Force RTX 5050, Backlit Keyboard, W11 Pro, Luna Gray
The competitors include other current gaming laptops with Nvidia’s Blackwell chip, such as the HP Omen 16 (RTX 5060), the Gigabyte Gaming A16, as well as the MSI Crosshair A17 HX (both RTX 5070) or the Schenker XMG Focus 17 (RTX 5070 Ti), which all appear in the tables as comparison devices.
Specifications
Case
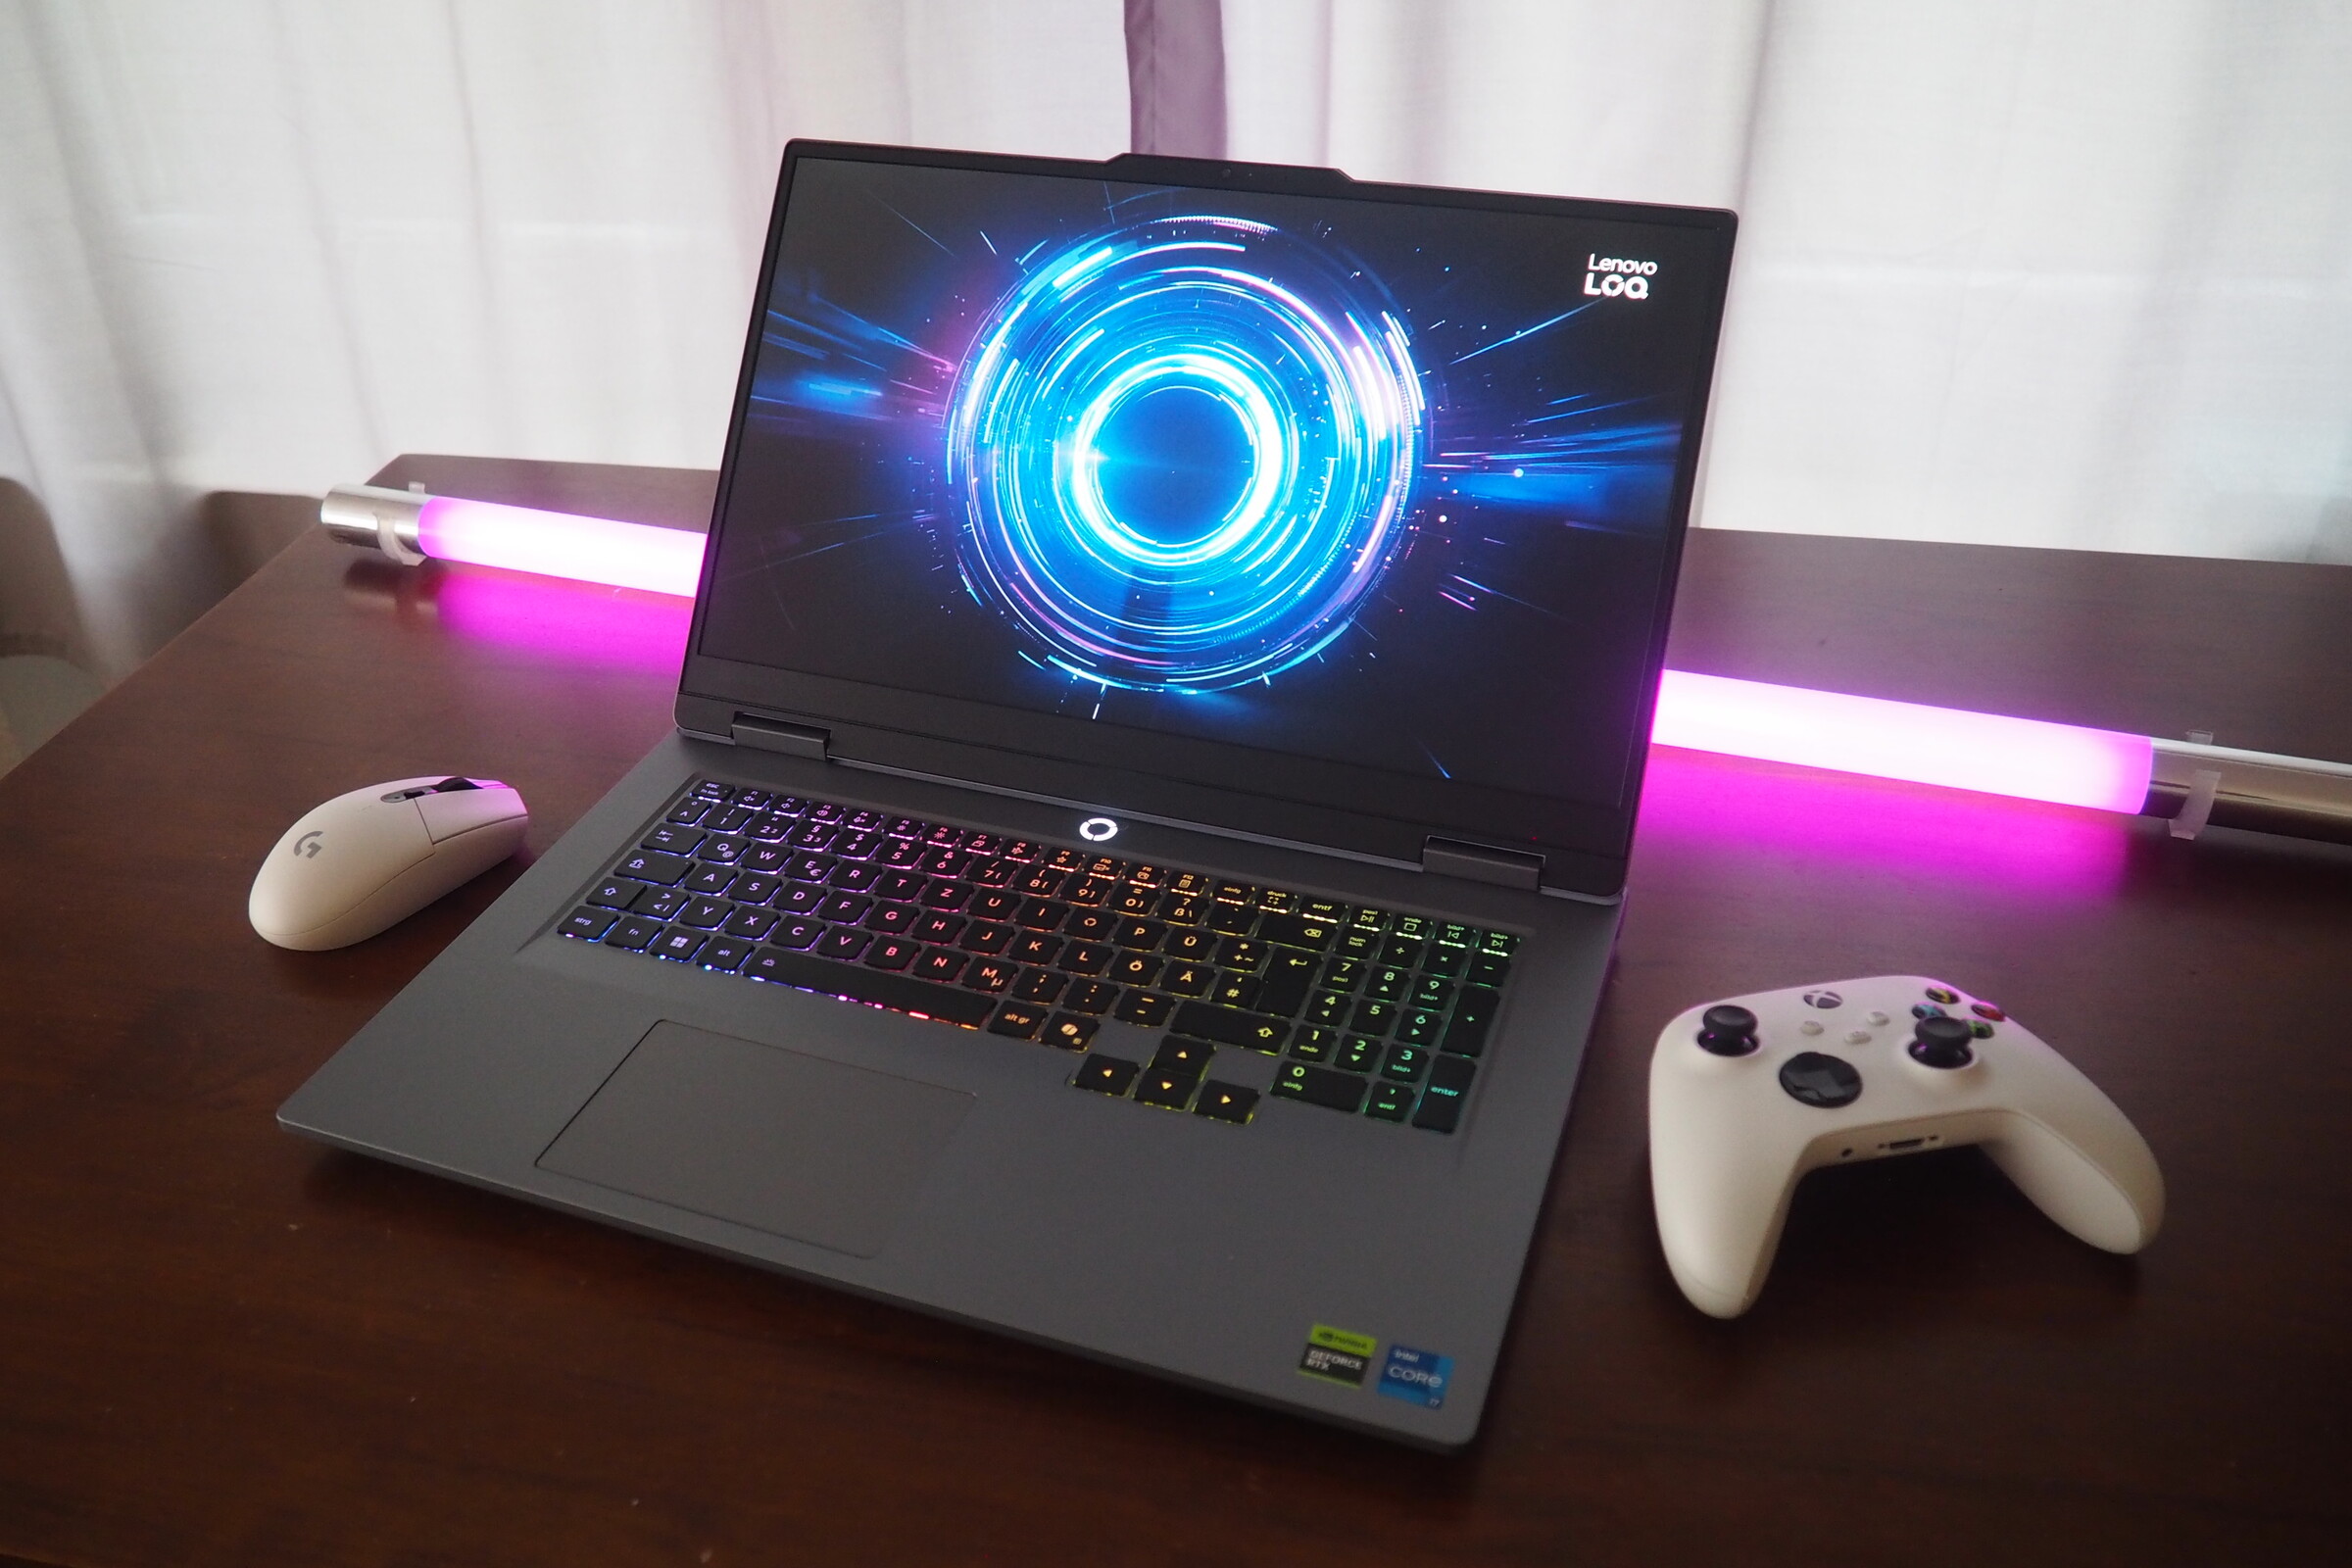
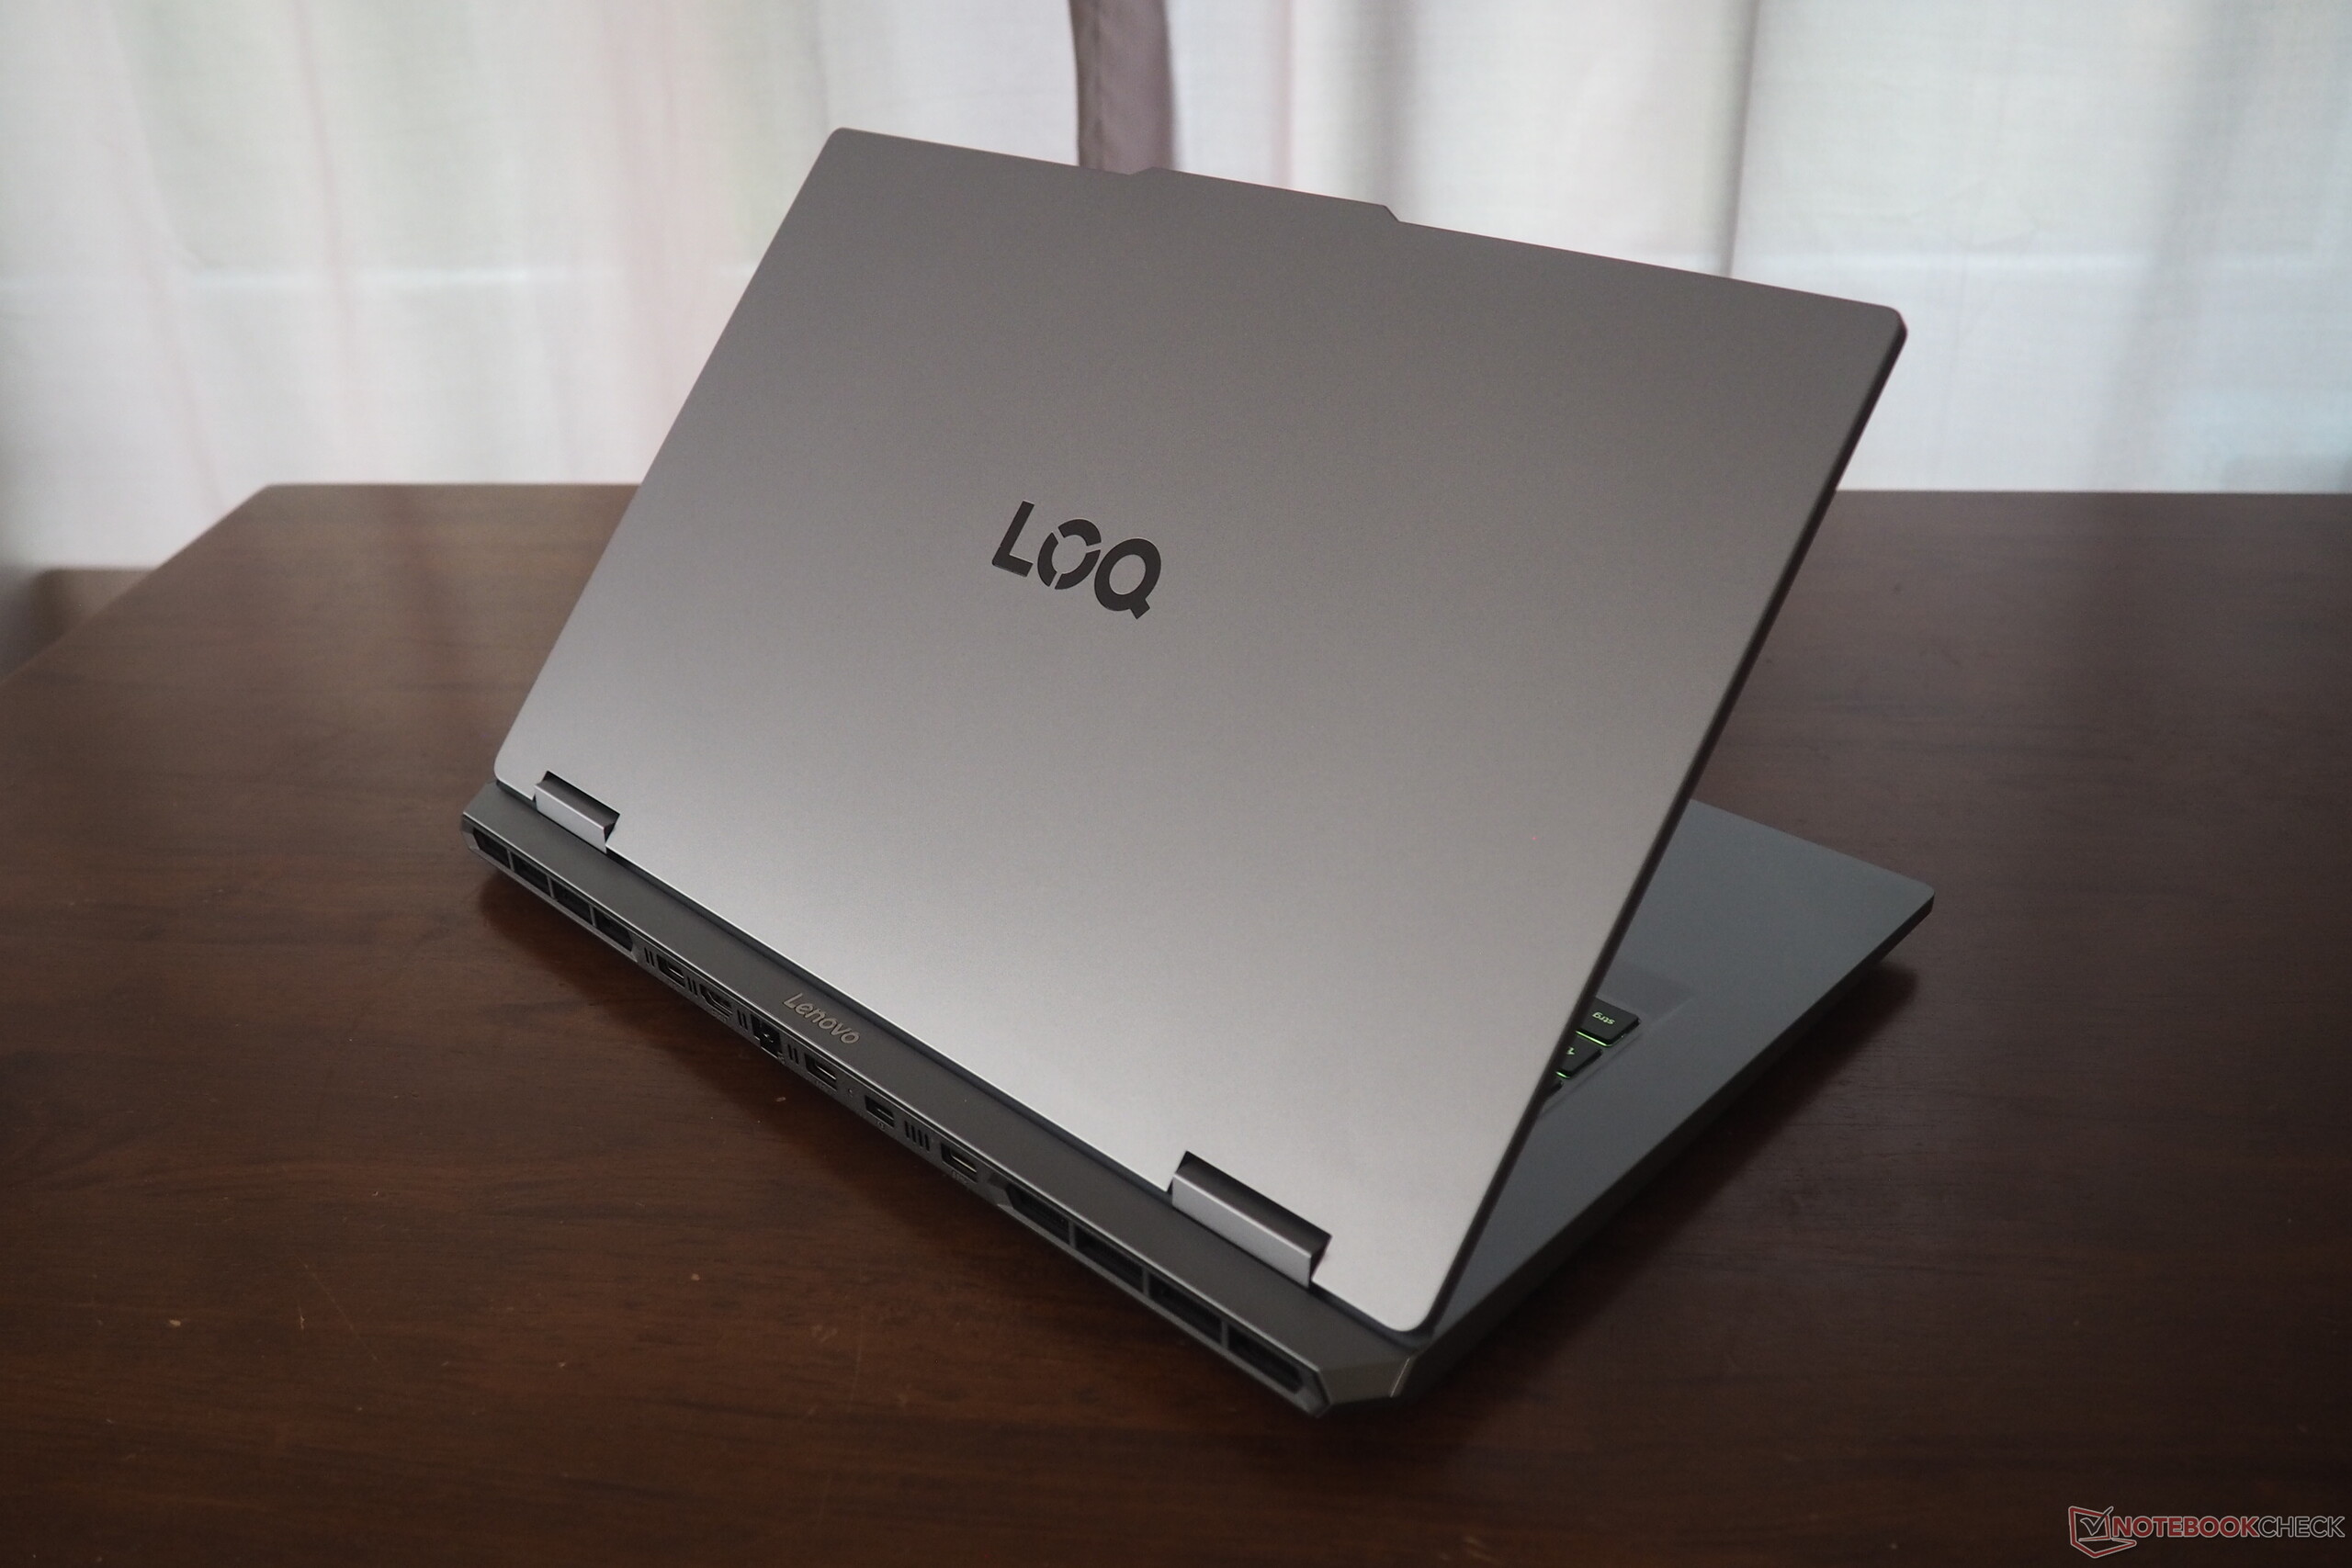
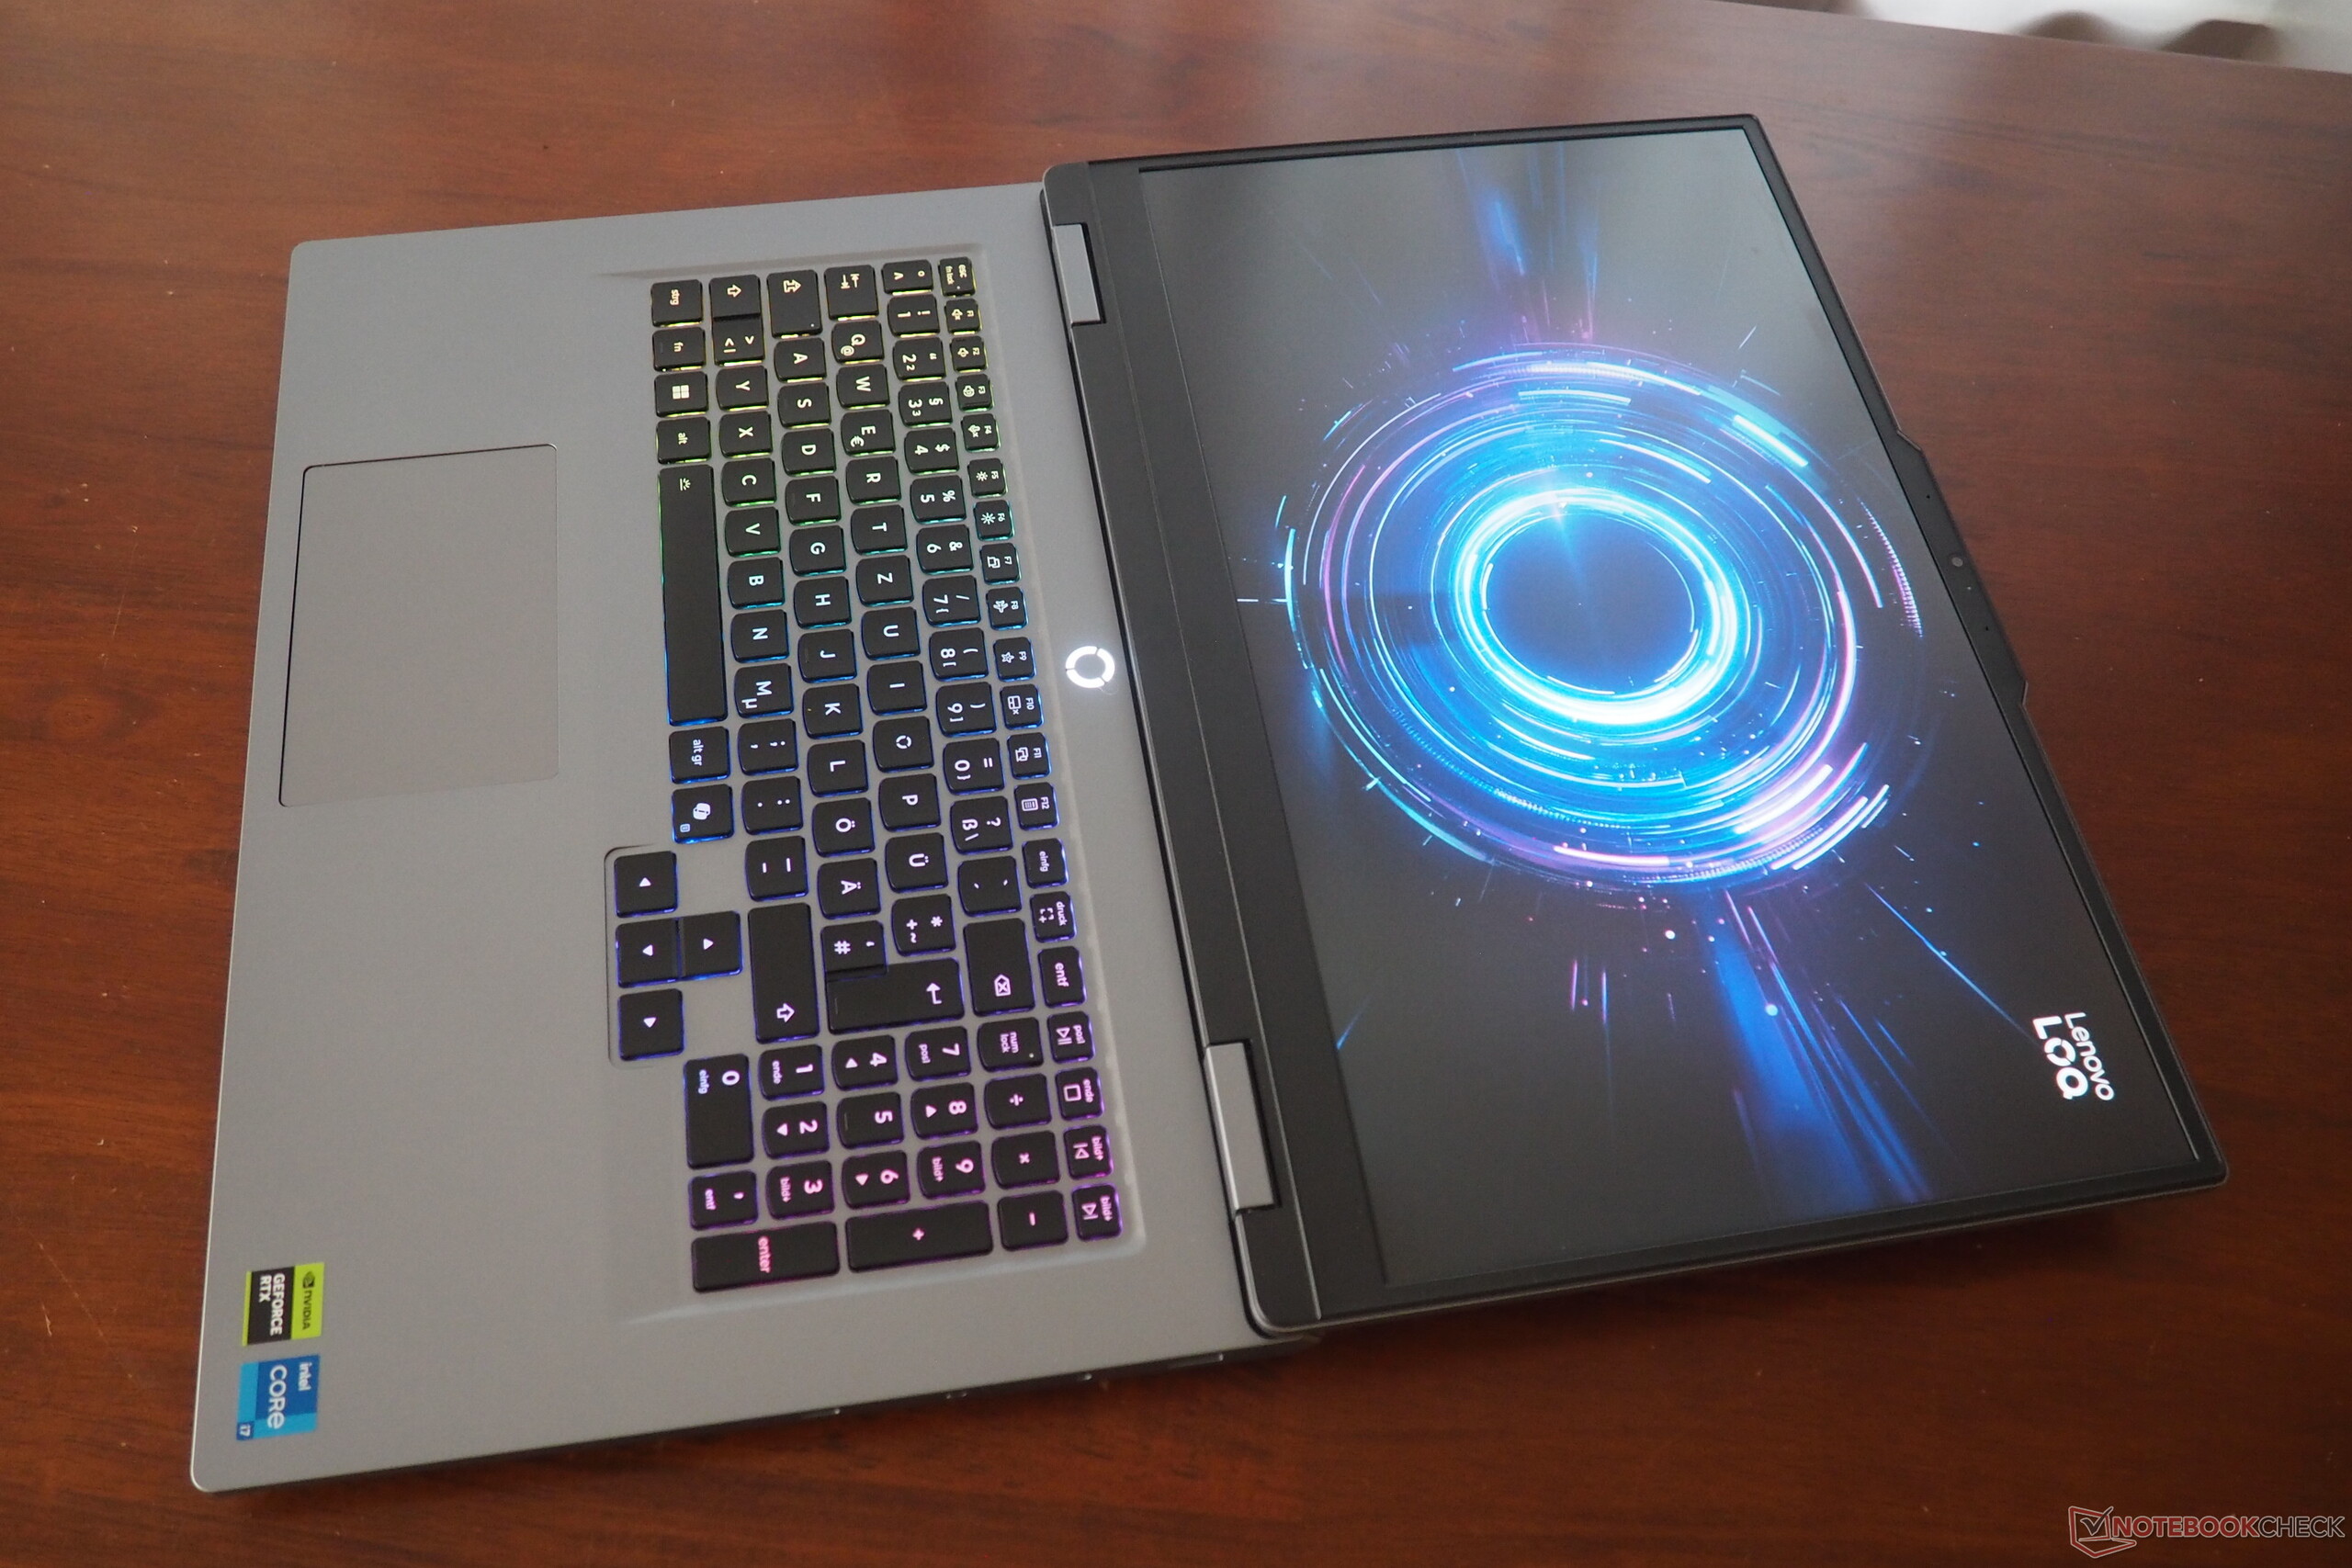
Thanks to the relatively light color (Luna Gray), the chassis makes an inviting impression, and gamers will also appreciate the keyboard's RGB lighting. The build quality and stability leave little room for complaint, and the surfaces generally only give way under forceful pressure. One highlight is the generous 180° display opening angle, which isn't something you see every day of the week.

At 2.9 kg, the LOQ 17 is comparable to its 17-inch counterparts. However, the 16-inch devices tend toward the 2 kg range, which makes them noticeably lighter. In terms of height, the 17-inch model sits comfortably in the middle of the pack (approximately 2.5 cm without the feet).
Features
Ports
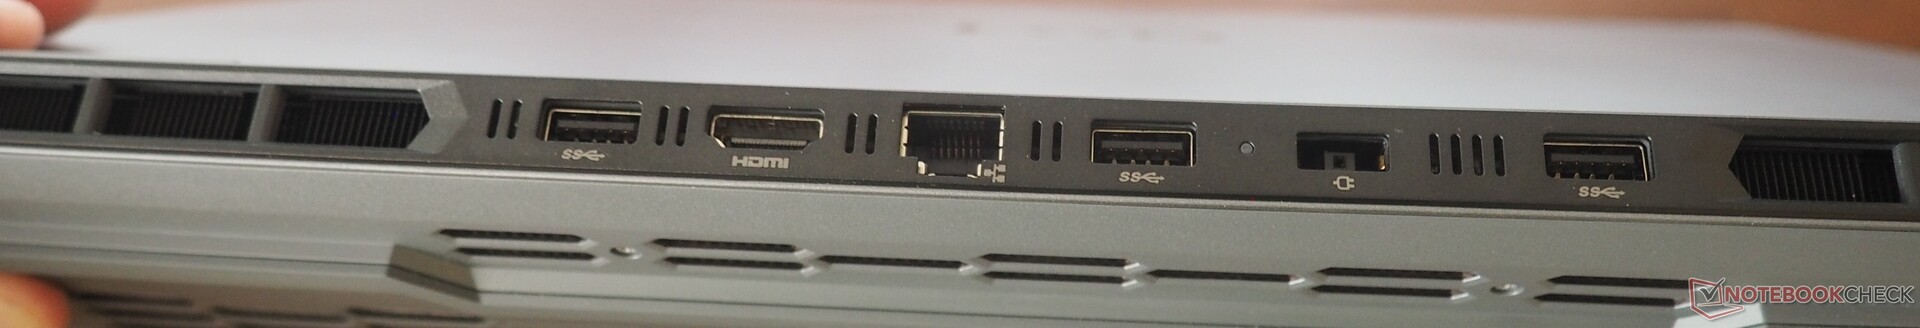
We were somewhat confused by the port layout. While the back panel offers more than enough ports (e.g., three USB-A ports), the left side remains empty. Of the five USB ports, only one is type-C. Furthermore, buyers will have to make do without a card reader.

Communication
A further weakness is the Wi-Fi performance. Despite a fairly modern chip (Wi-Fi 6), the LOQ17 achieved only mediocre results in the range test (especially when transmitting). We also encountered frequent connection drops throughout the entire test, although this may have been a general issue with the review sample.
Webcam
Although the 5 MP webcam does significantly better, you shouldn't expect it to perform miracles. The image sharpness is at least better than that of most competitors.


Accessories
The laptop comes with a few information leaflets and a medium-sized 245-watt power supply.
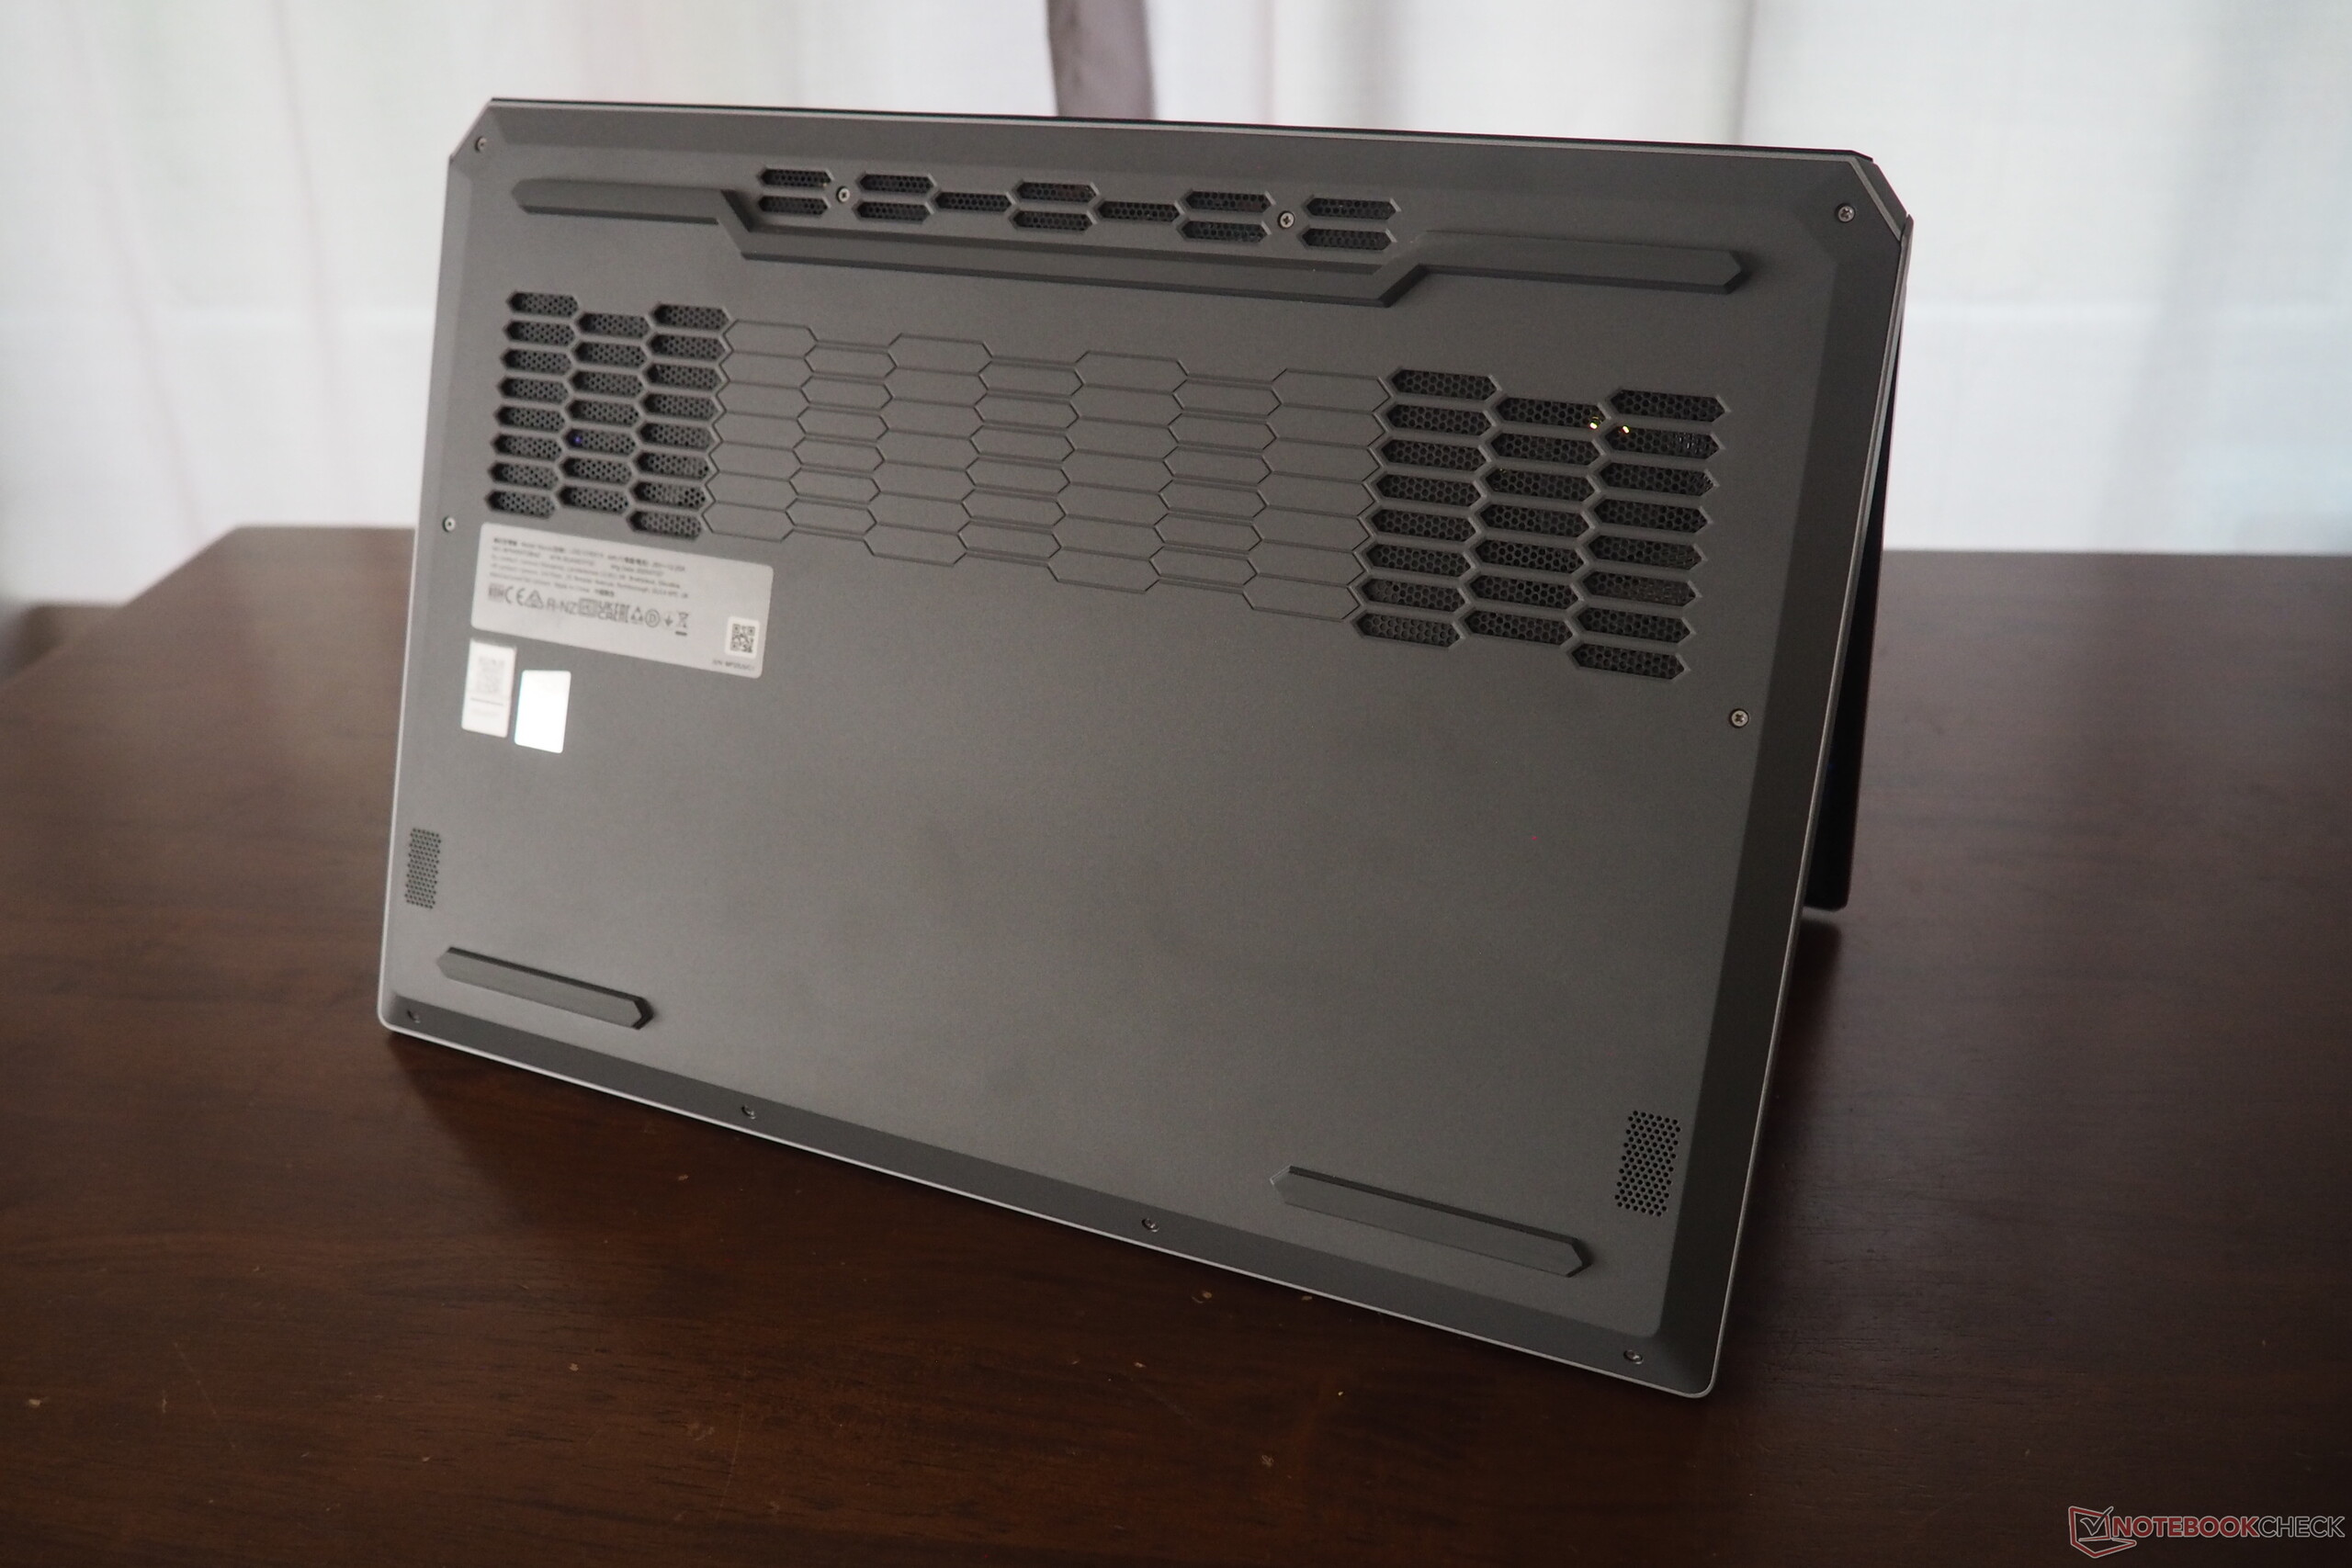
Maintenance
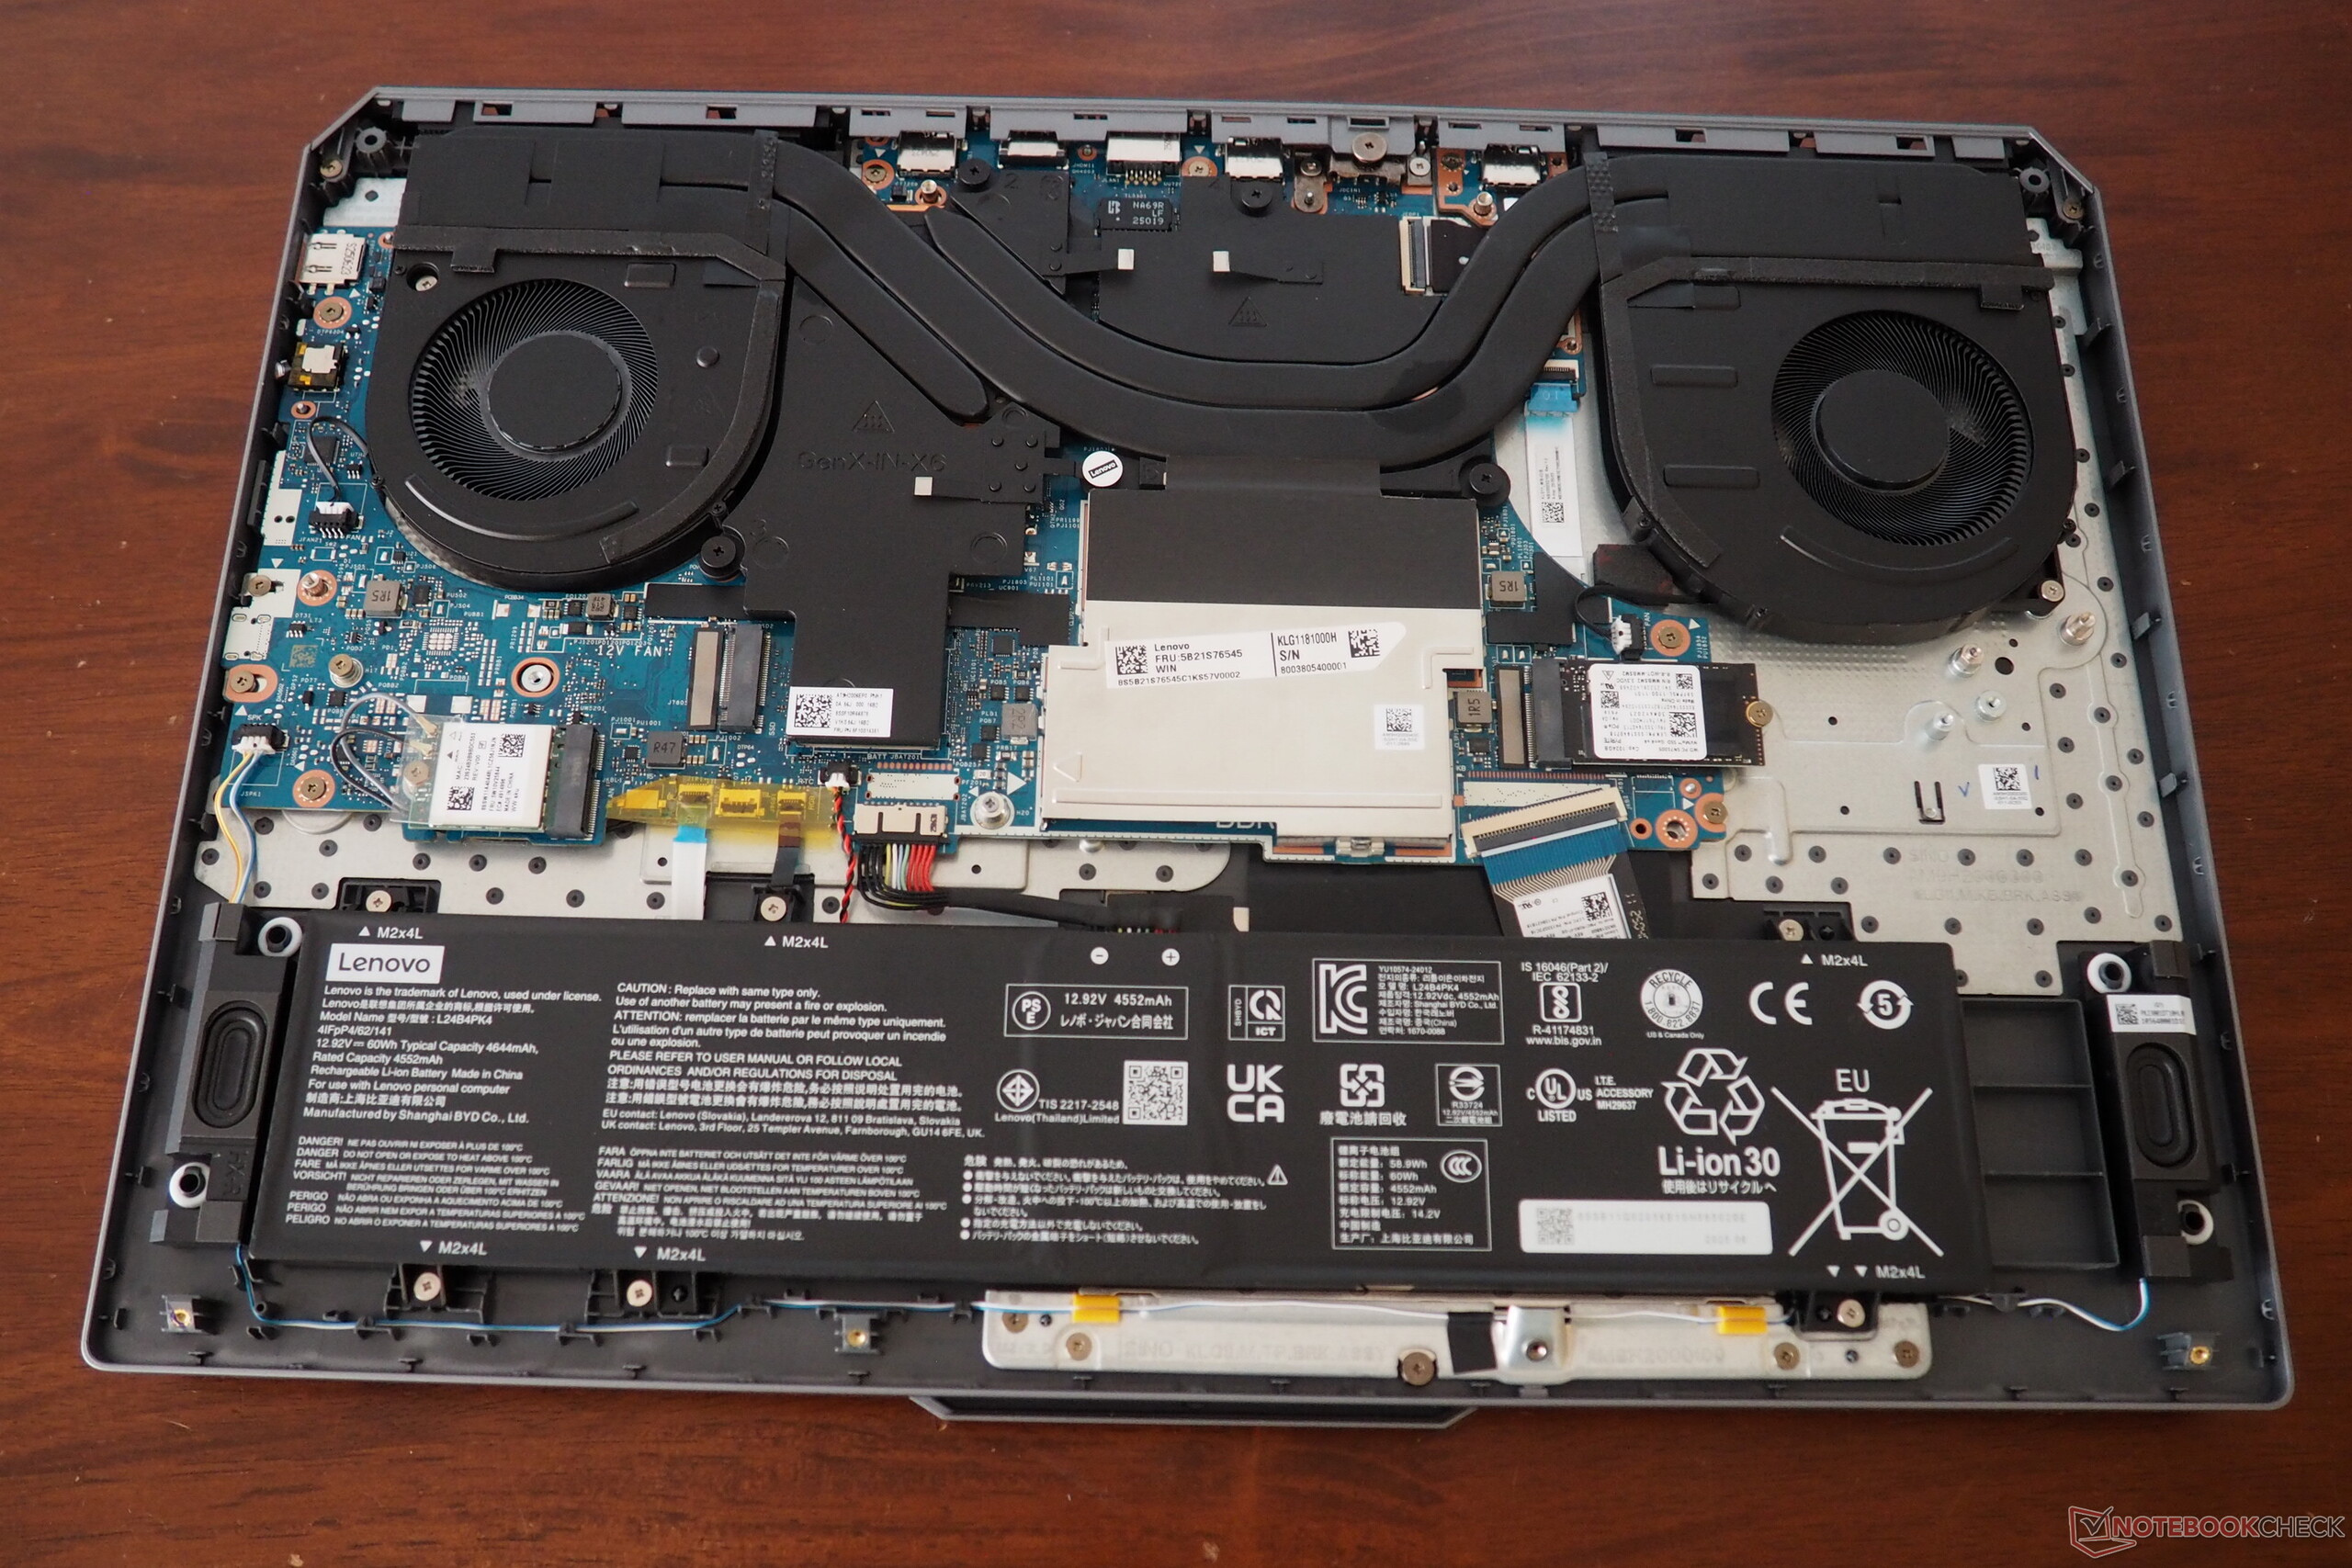
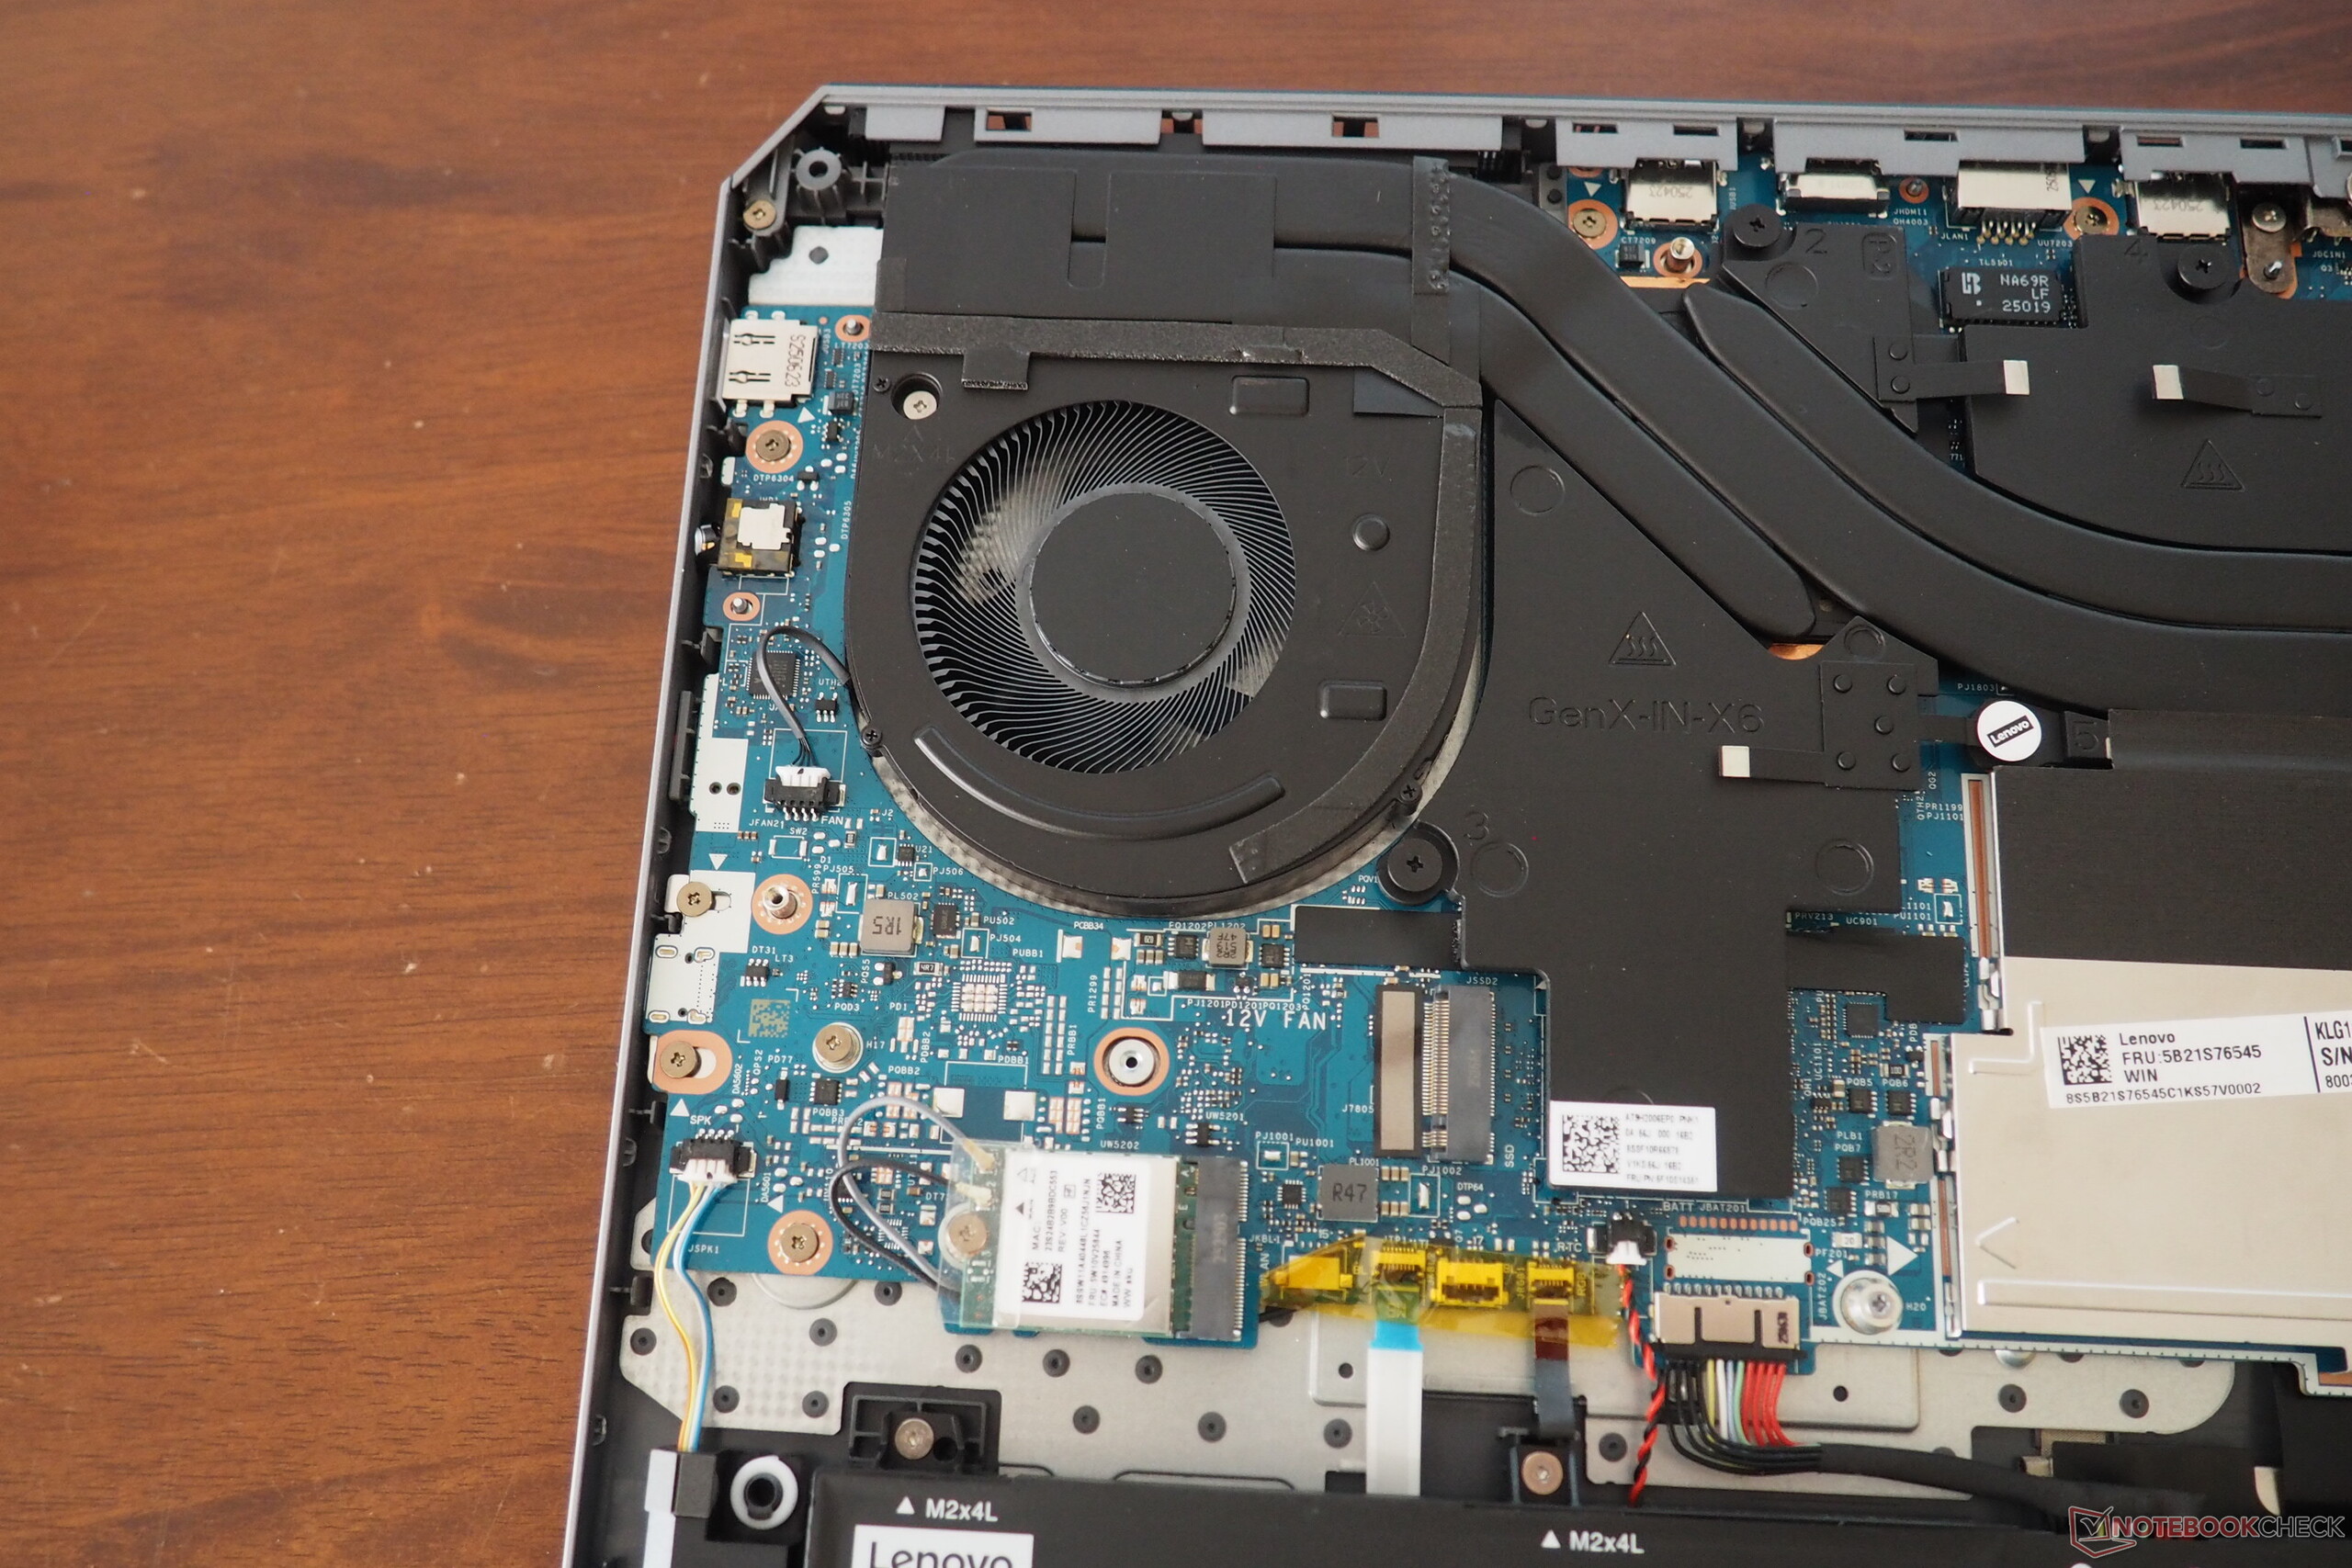
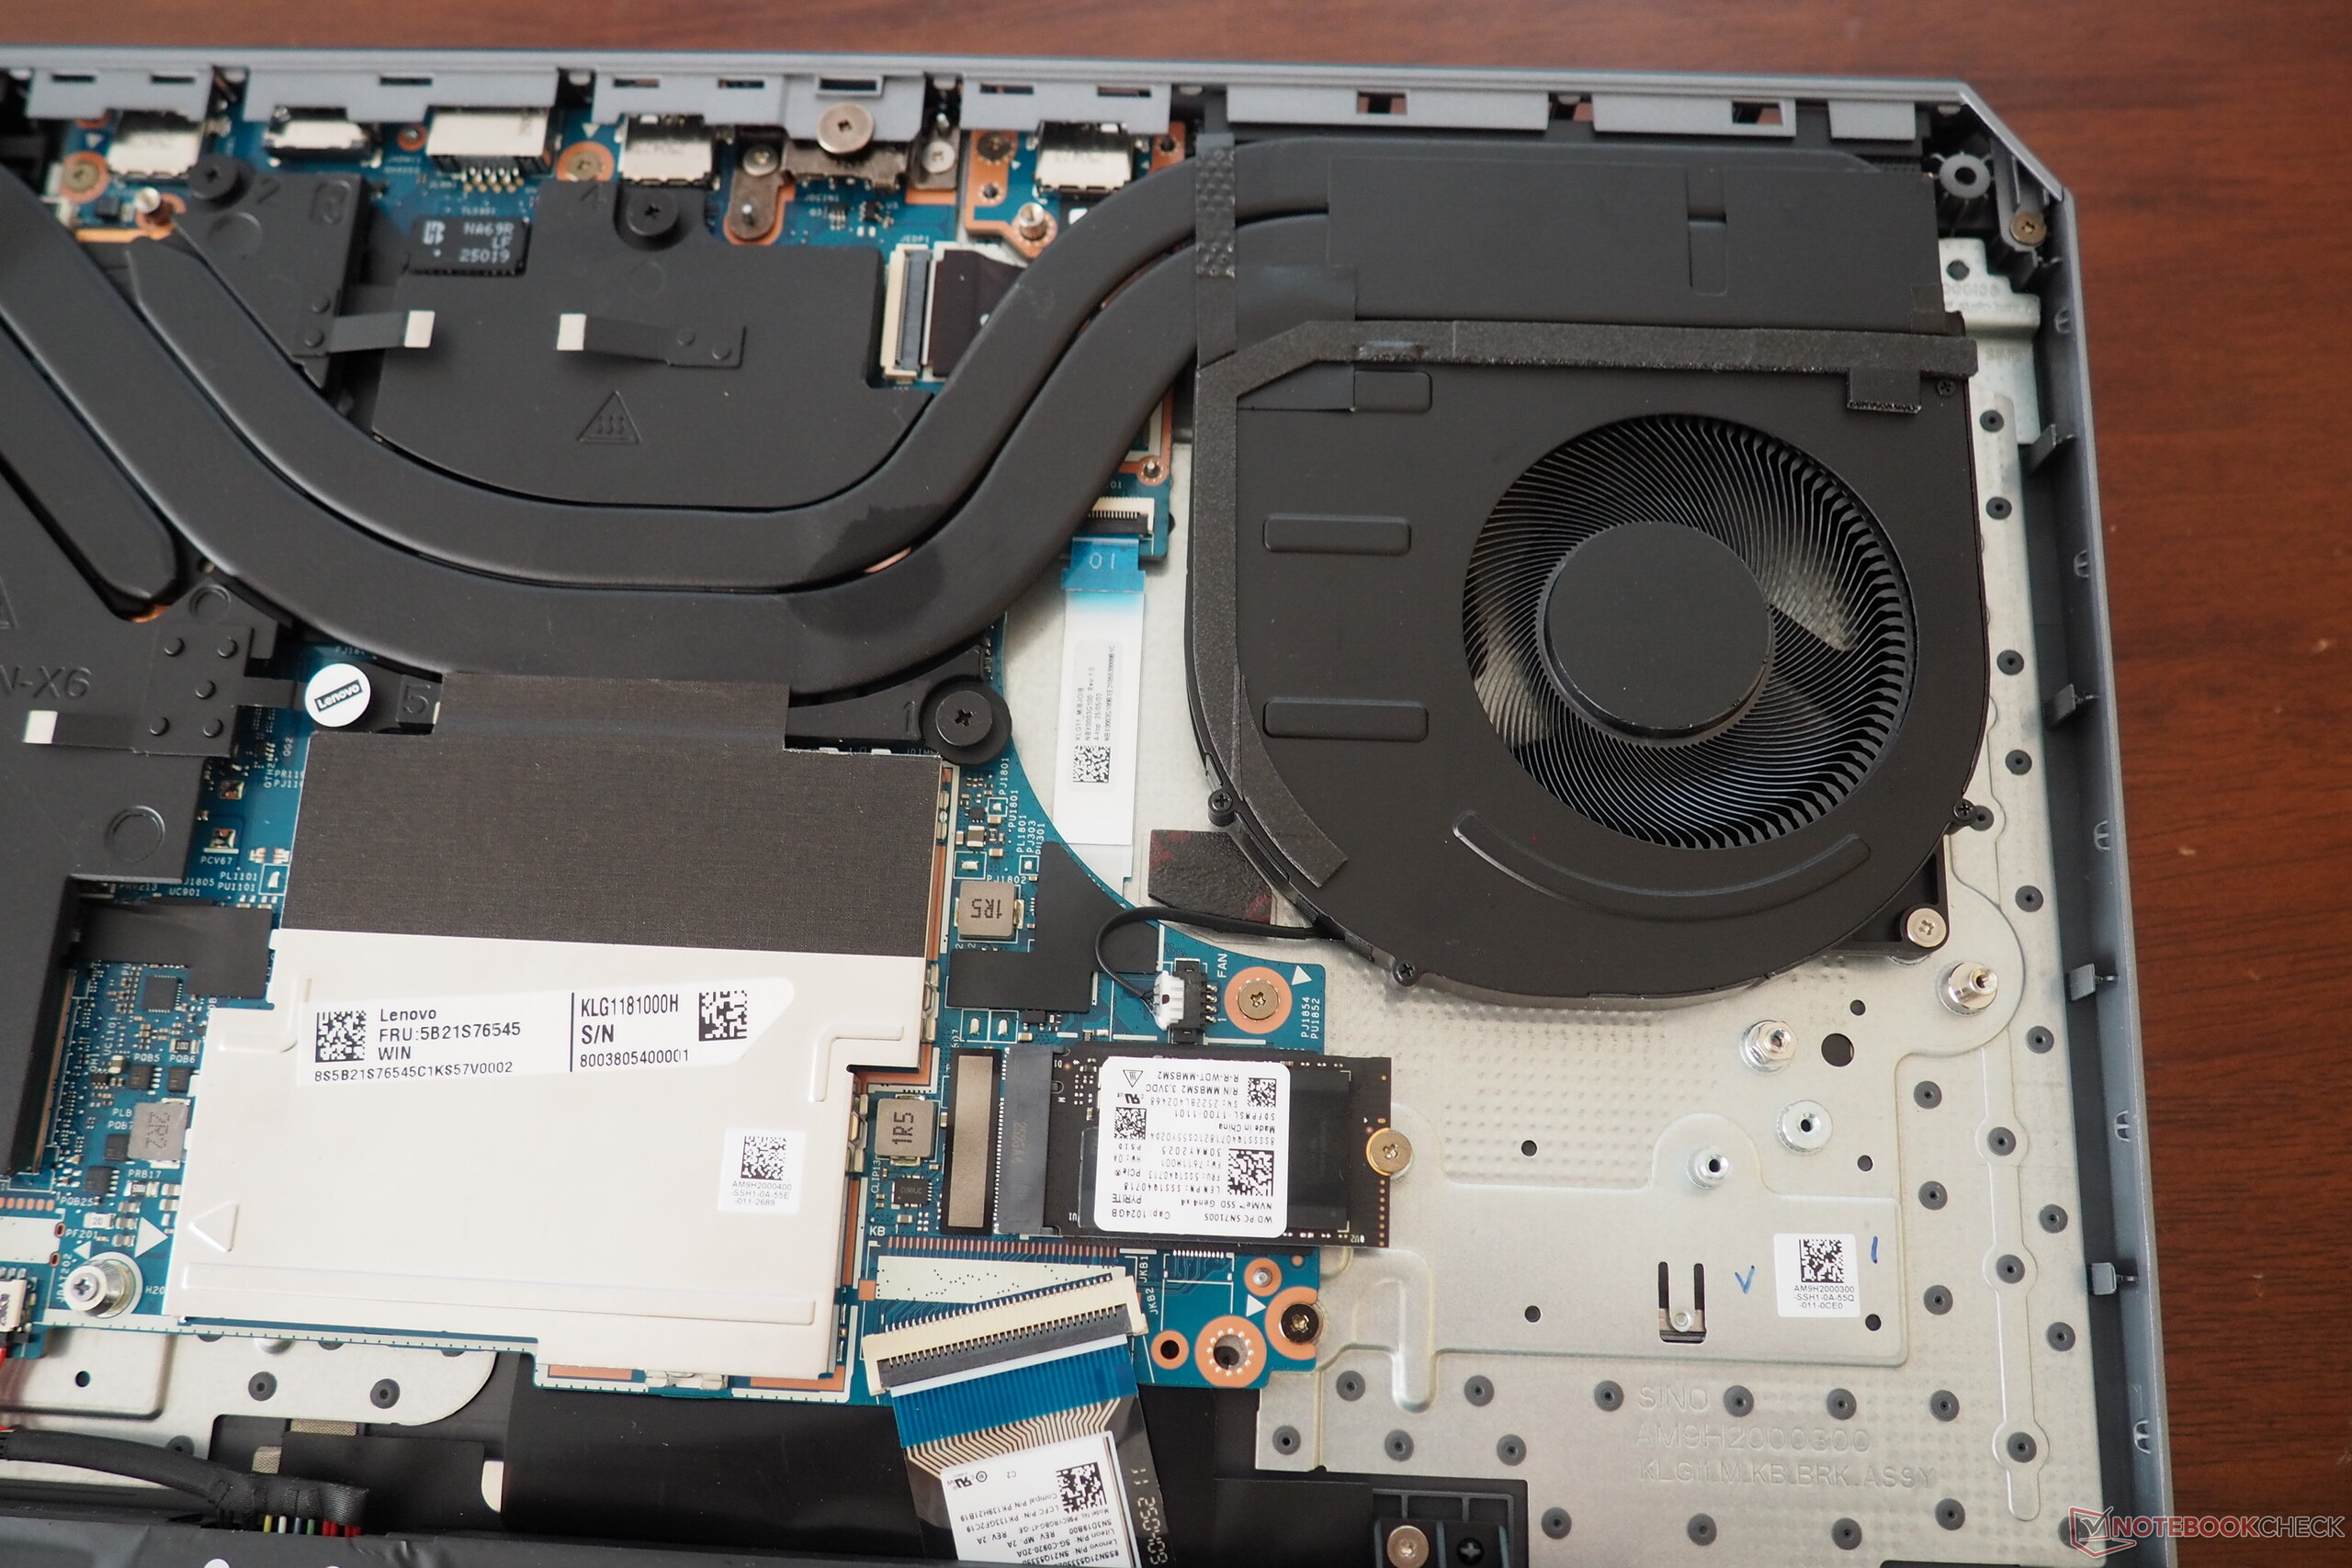
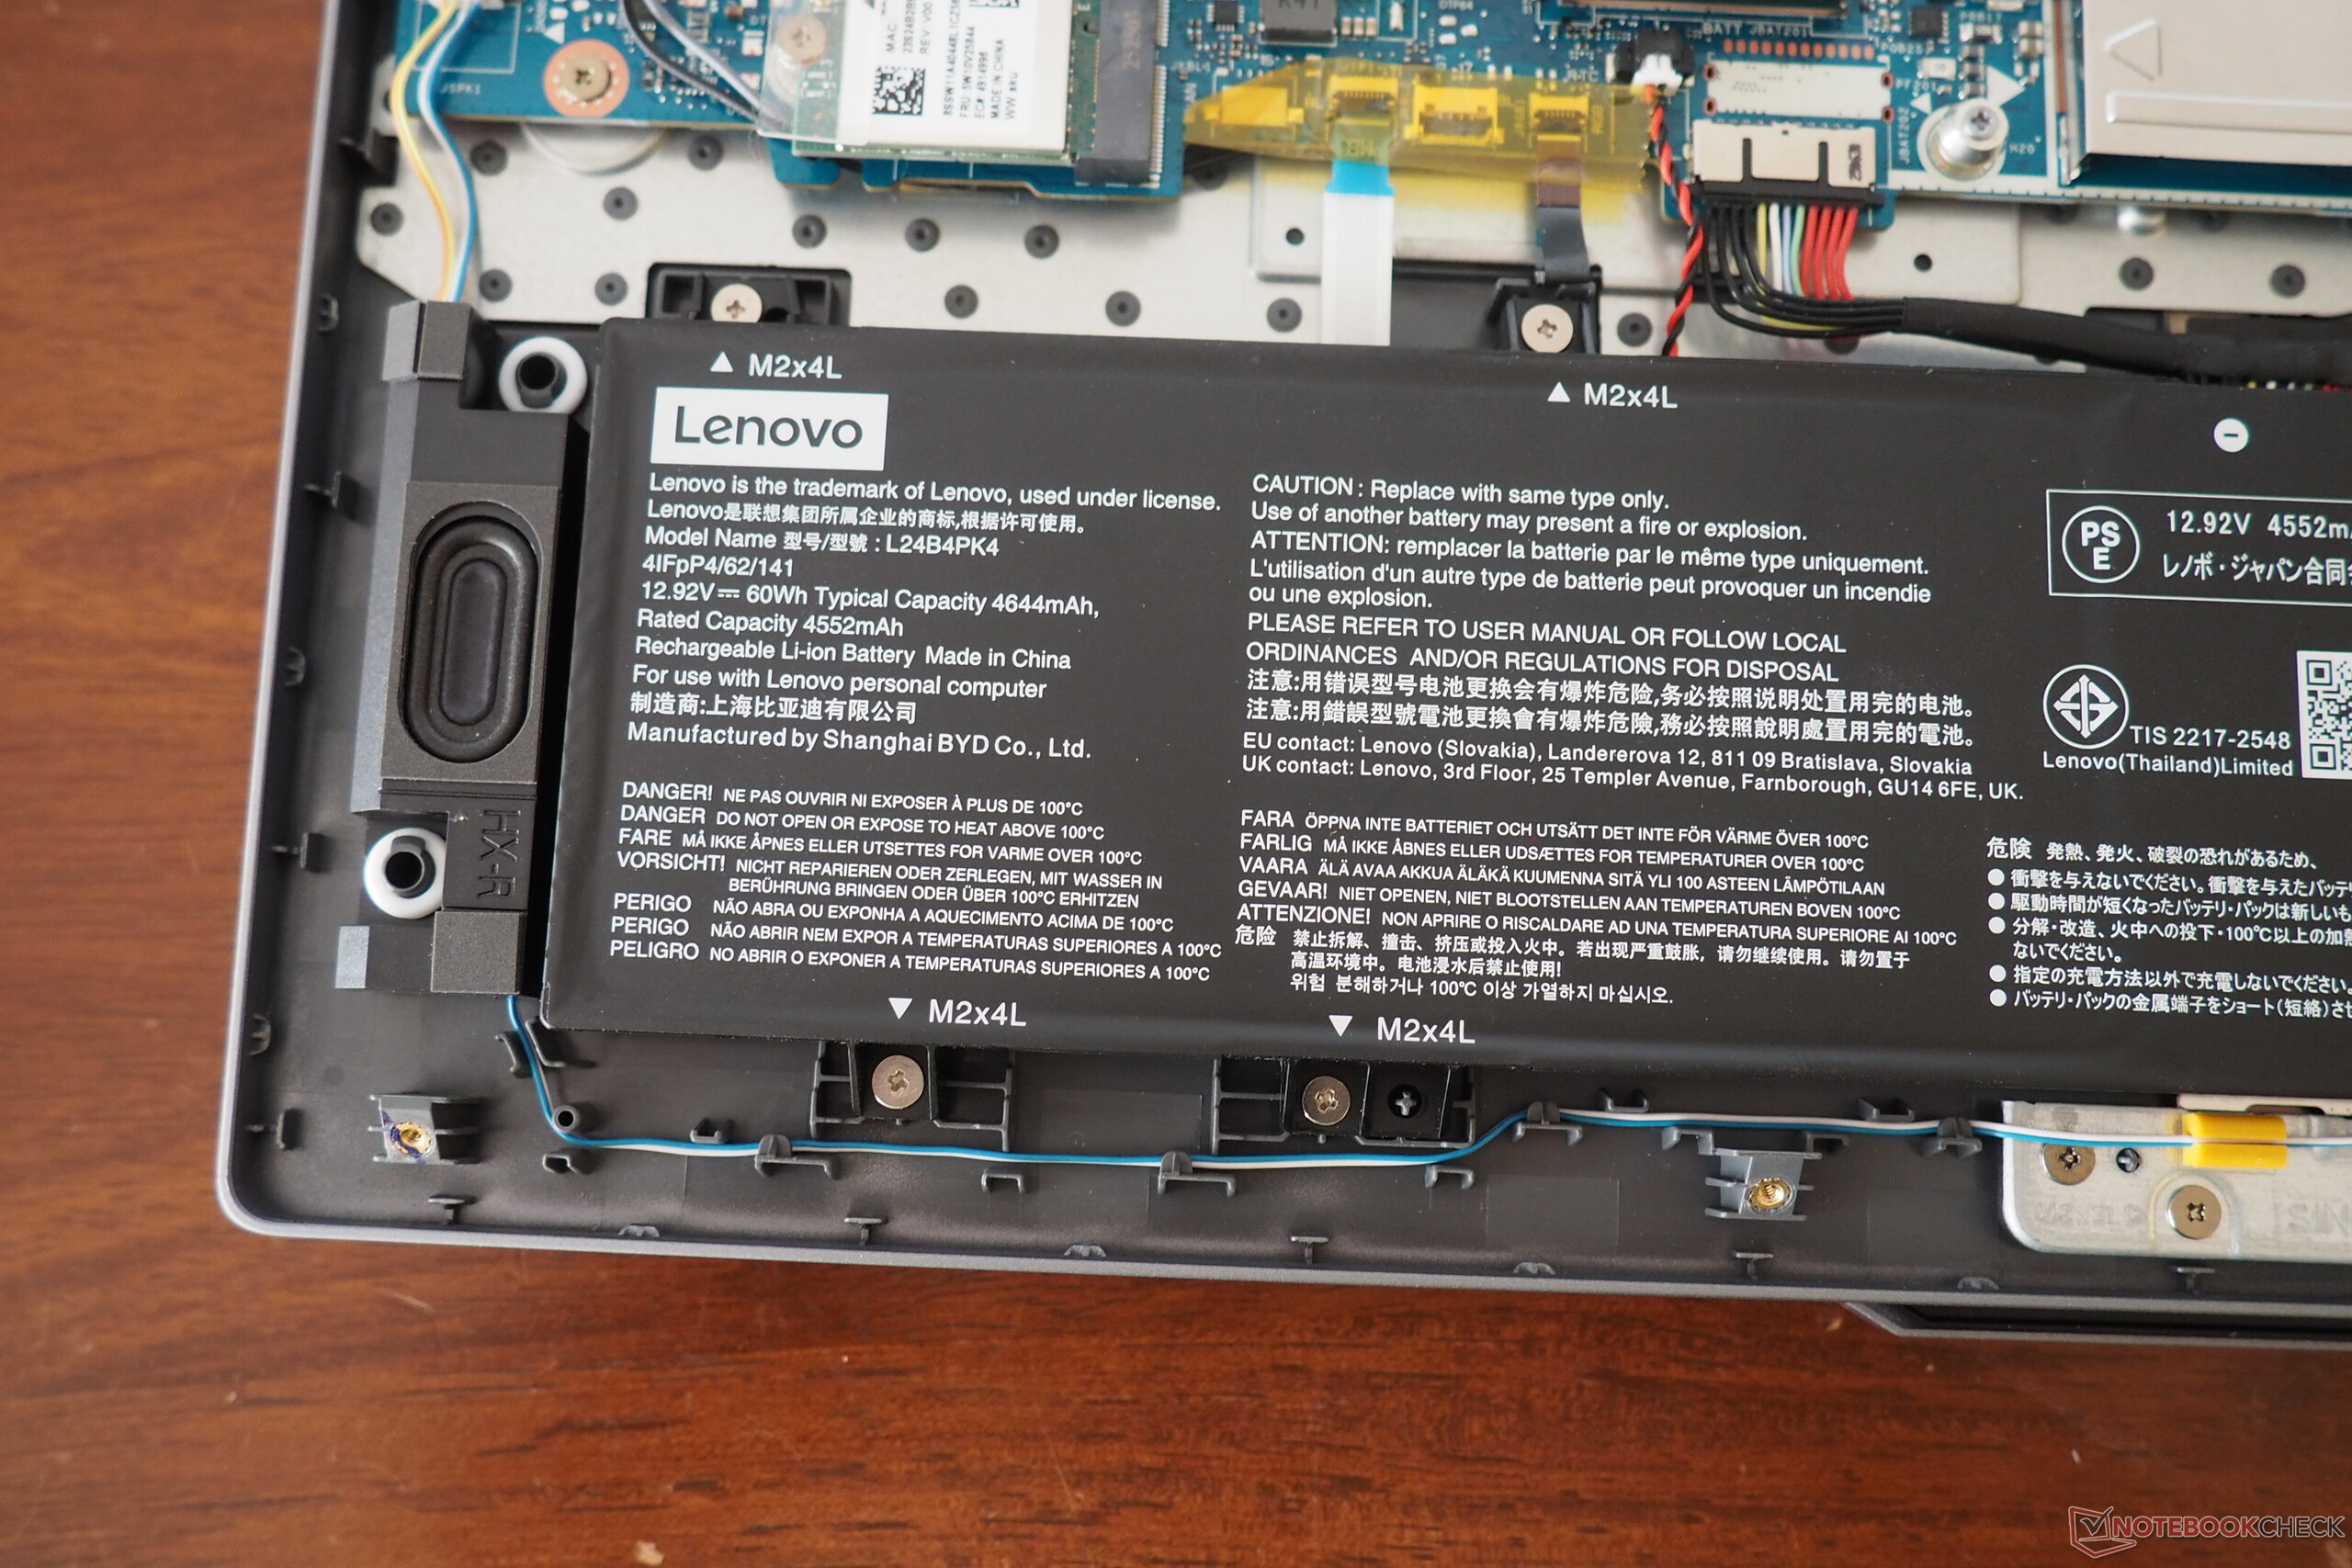
You can only access the internal components by first removing 10 small Phillips screws from the case bottom. Despite the fact that the installed SSD is only an M.2 2242 model, both slots can accommodate regular 2280 SSDs if necessary.
Sustainability
While the in-parallel reviewed Legion 9 18IAX10 is packaged exclusively with cardboard, Lenovo uses a lot of plastic material in its LOQ 17.
Warranty
In Germany, the 17-inch model comes with a two-year warranty.
Input devices
Keyboard
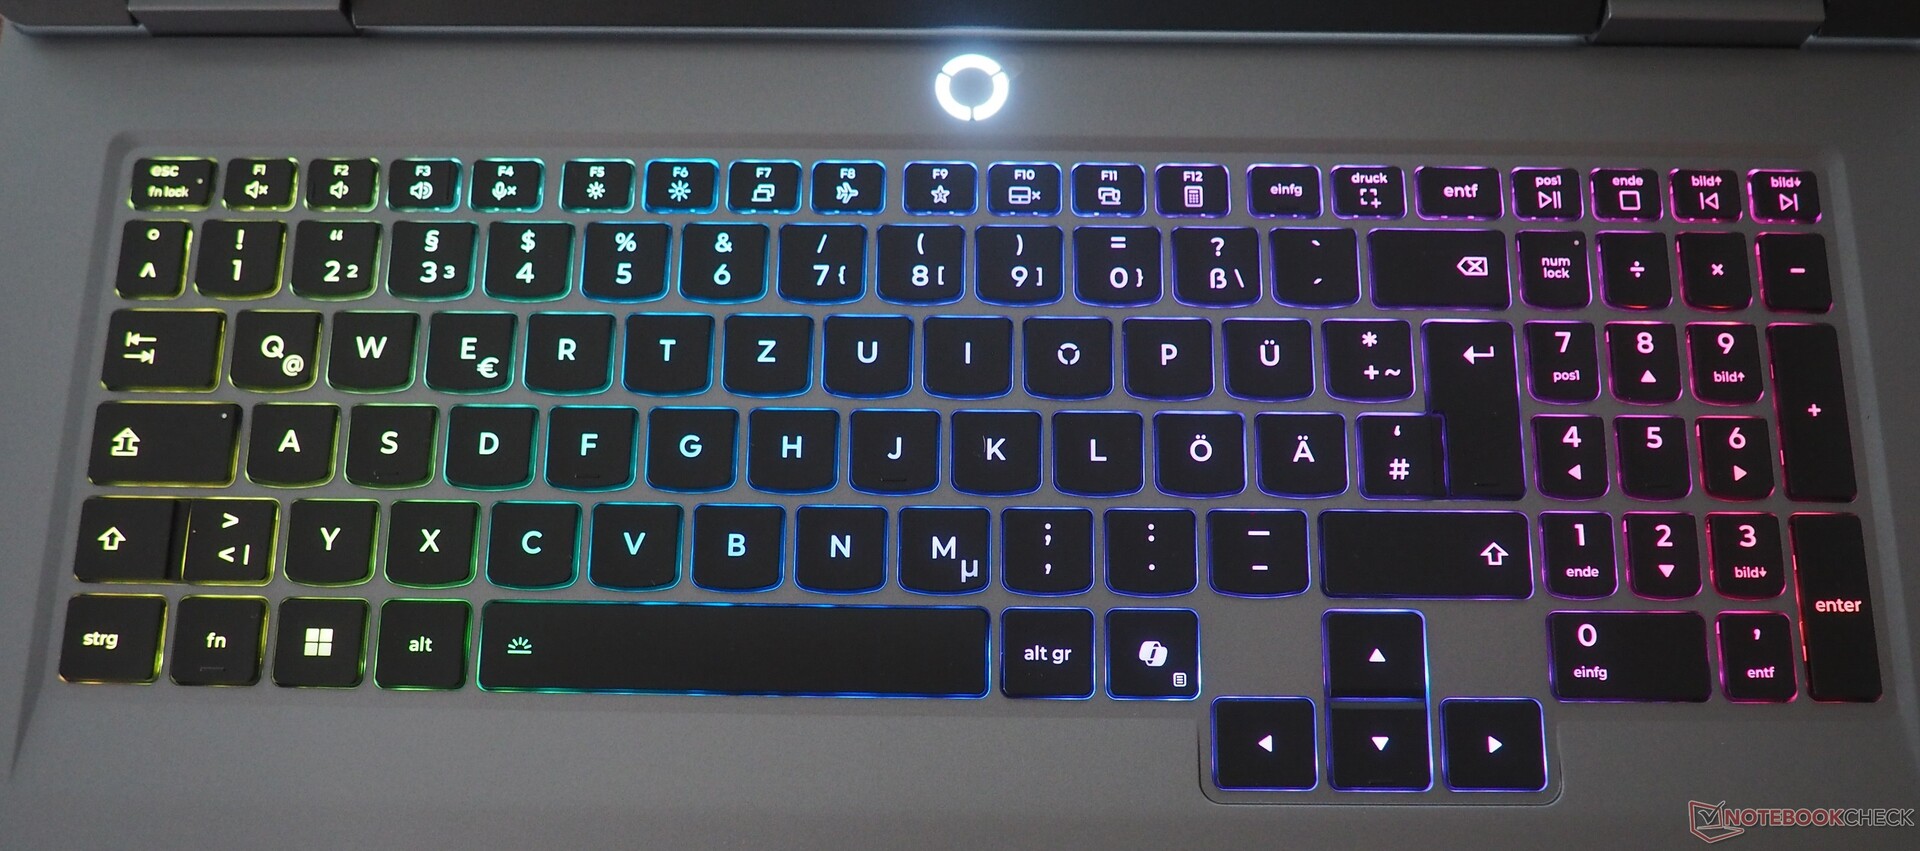
Even though the keyboard doesn't quite match the performance seen in mechanical keyboards, overall, the typing experience is solid. The well-designed layout deserves special praise, and this isn't always a given, especially in the gaming segment. Many competitors could also learn a thing or two from the decently sized arrow keys. This is complemented by a full-sized numeric keypad, whose keys (despite ample space) are somewhat narrower than those situated on the main keyboard. The integrated backlight isn't as intense as other Lenovo gaming keyboards, such as the Legion 9 18, but it can still be adjusted to several levels.
Touchpad
The touchpad is located quite far to the left, and at 12 x 7.5 cm, it's a decent size. Its functionality (gliding characteristics, precision, gestures) is mostly unobtrusive, meaning it's neither bad nor particularly good. In practice, the only thing that bothered us was the somewhat flimsy feel and sound of the click surfaces.
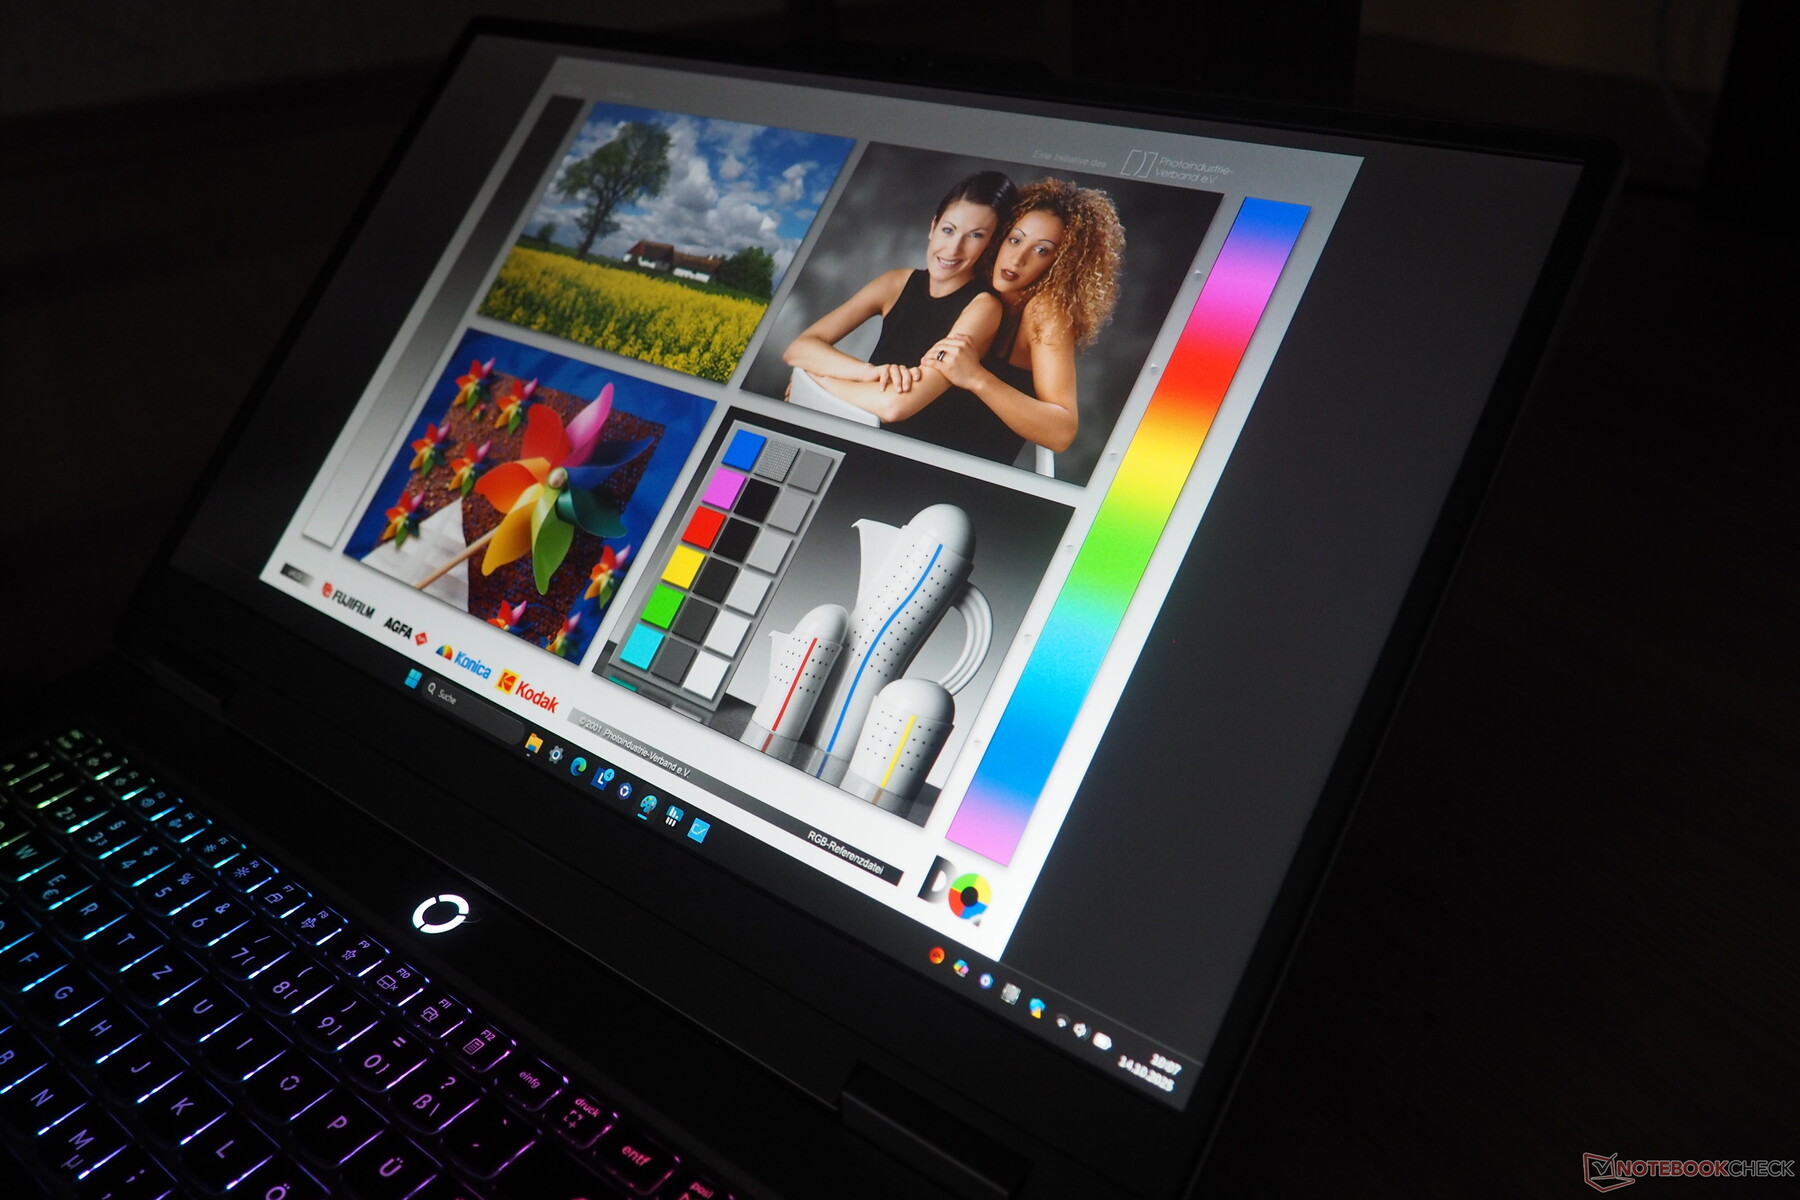
Display
As is normally the case in this price range, the screen is a matte IPS panel, but its 1,920 x 1,080 pixels means it doesn't have a very crisp resolution for a 17-inch device.
| |||||||||||||||||||||||||
Brightness Distribution: 87 %
Center on Battery: 315 cd/m²
Contrast: 1086:1 (Black: 0.29 cd/m²)
ΔE ColorChecker Calman: 2.38 | ∀{0.5-29.43 Ø4.72}
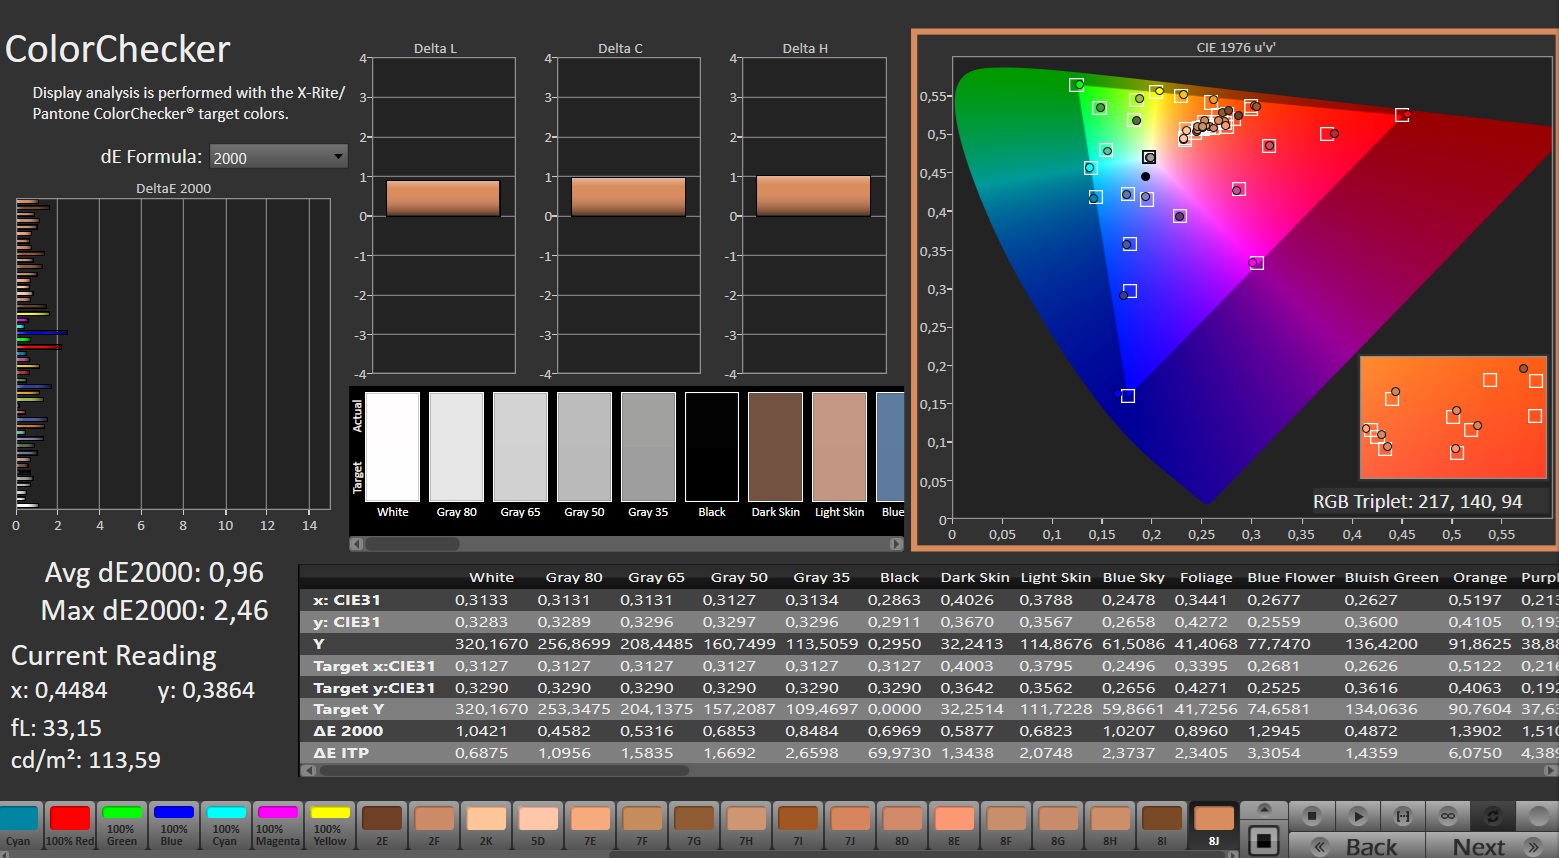
calibrated: 0.96
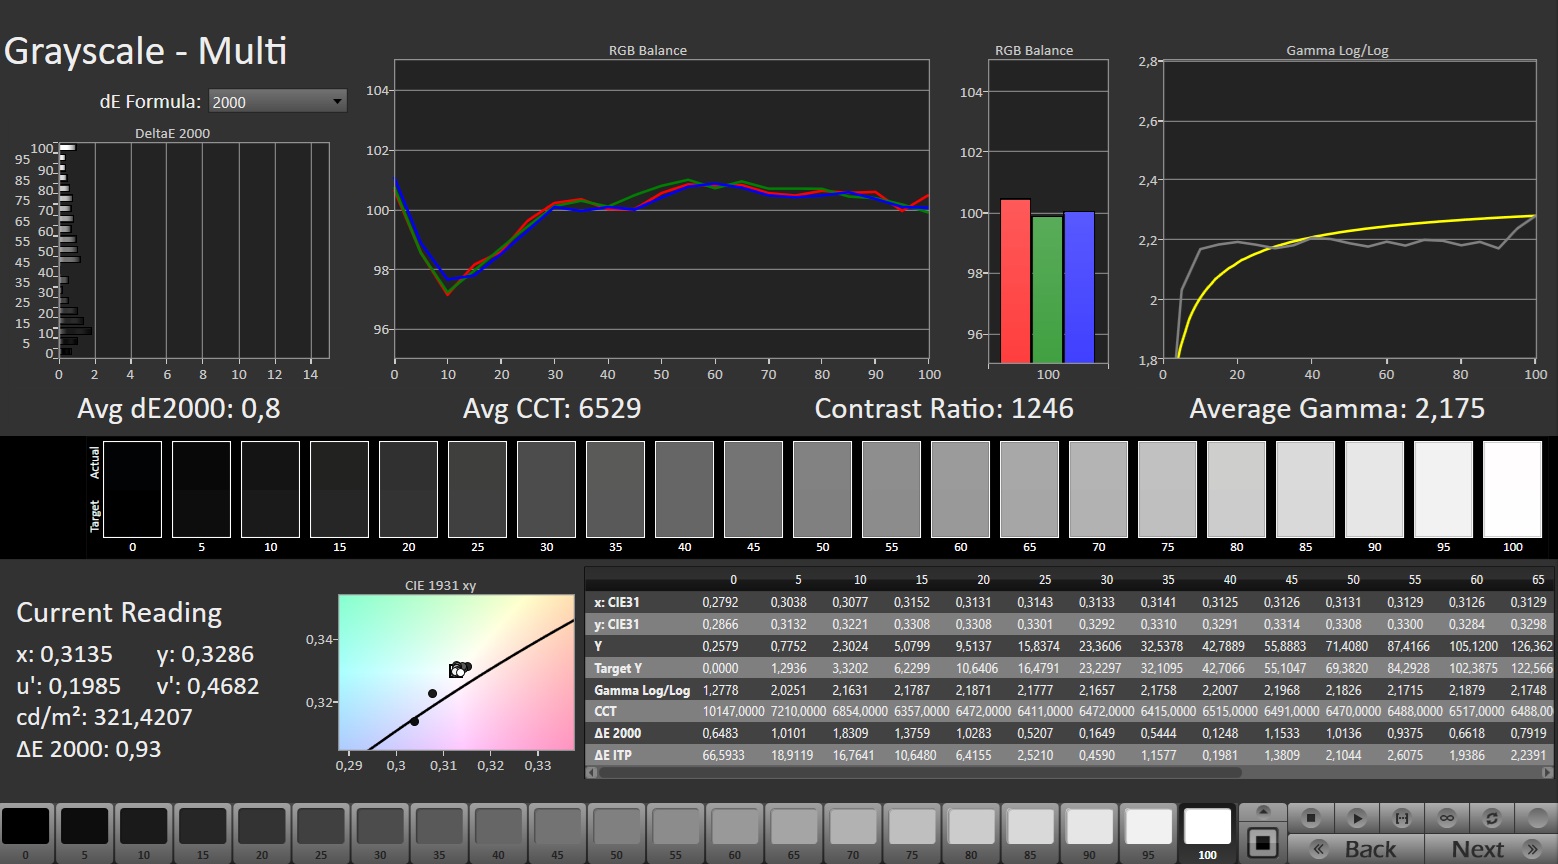
ΔE Greyscale Calman: 2.9 | ∀{0.09-98 Ø4.97}
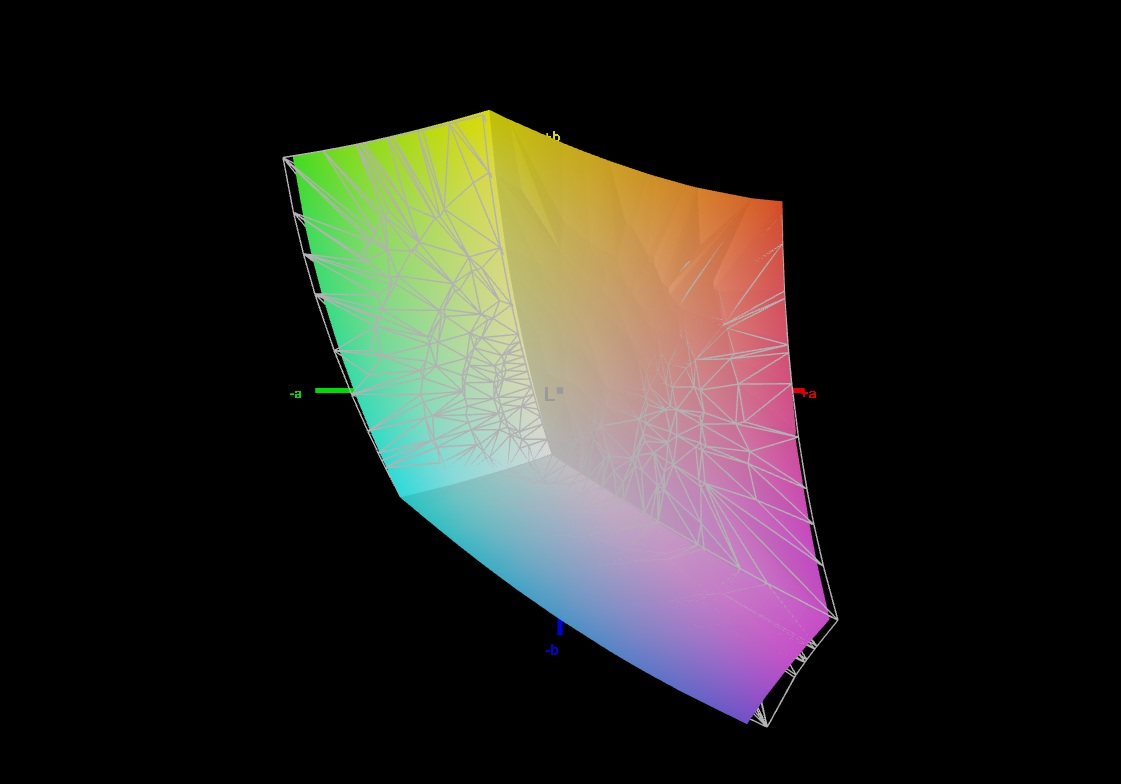
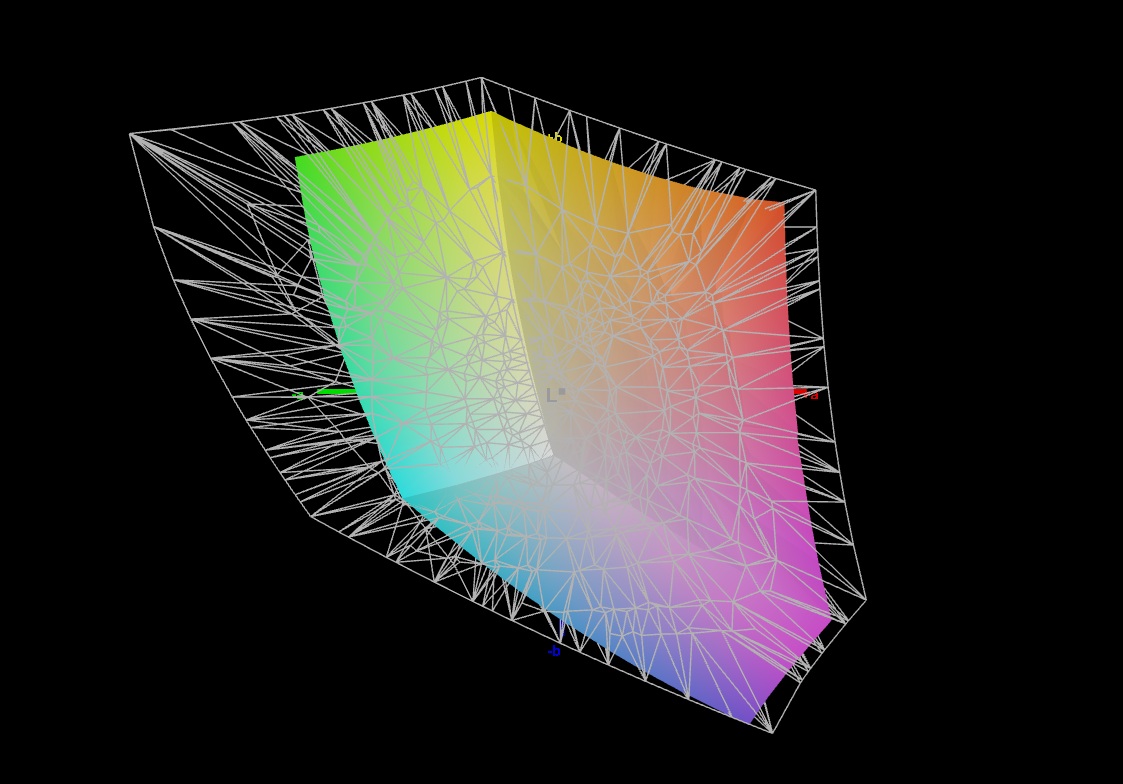
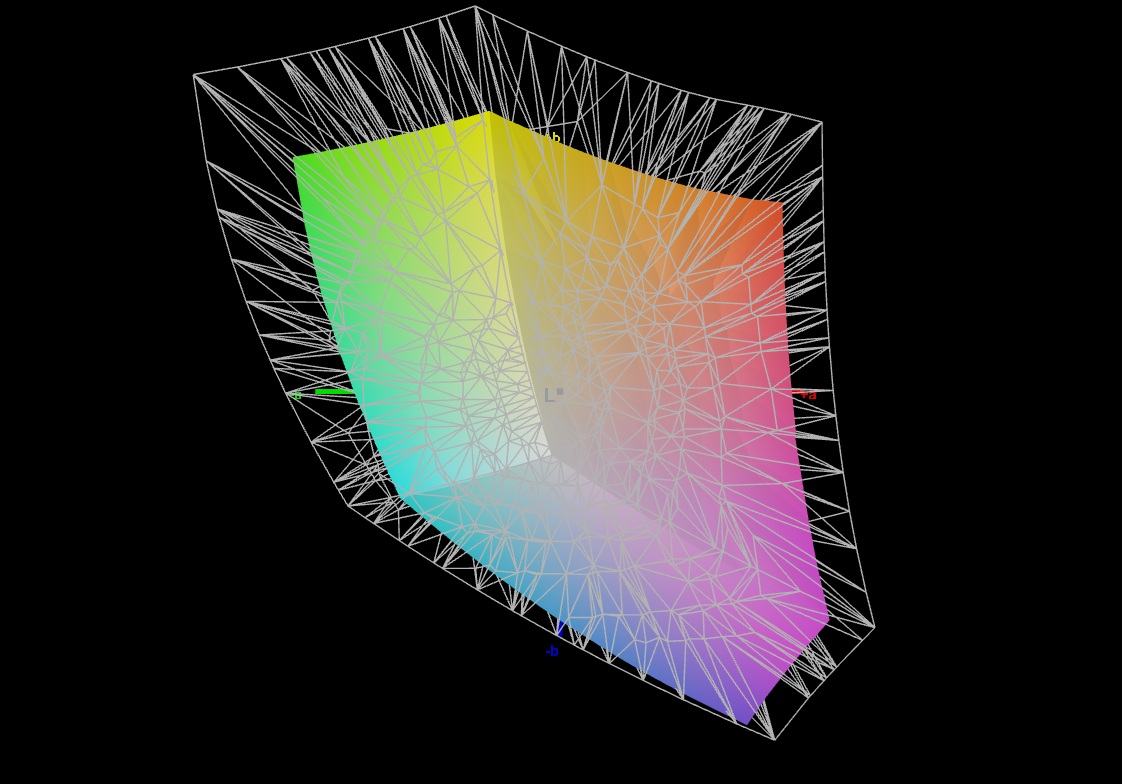
68.4% AdobeRGB 1998 (Argyll 3D)
97.5% sRGB (Argyll 3D)
66.3% Display P3 (Argyll 3D)
Gamma: 2.052
CCT: 6319 K
| Lenovo LOQ 17IRX10 N173HME-G31 (CMN174C), IPS, 1920x1080, 17.3", 165 Hz | HP Omen 16-ap0091ng AUODBB2, IPS, 1920x1200, 16", 144 Hz | Gigabyte Gaming A16 GA6H NE160QDM-NYJ (BOE0C80), IPS, 2560x1600, 16", 165 Hz | MSI Crosshair A17 HX D8WGKG B170QAN01.2, IPS, 2560x1600, 17", 240 Hz | Schenker XMG Focus 17 M25 NE173QHM-NZ1, IPS, 2560x1440, 17.3", 240 Hz | |
|---|---|---|---|---|---|
| Display | -41% | 4% | 24% | 25% | |
| Display P3 Coverage (%) | 66.3 | 40 -40% | 69.4 5% | 97.1 46% | 98.3 48% |
| sRGB Coverage (%) | 97.5 | 58.1 -40% | 99.5 2% | 99.9 2% | 99.9 2% |
| AdobeRGB 1998 Coverage (%) | 68.4 | 38.7 -43% | 71.6 5% | 84.9 24% | 86 26% |
| Response Times | -83% | 21% | 31% | 20% | |
| Response Time Grey 50% / Grey 80% * (ms) | 16 ? | 27.6 ? -73% | 14.3 ? 11% | 13.3 ? 17% | 13.7 ? 14% |
| Response Time Black / White * (ms) | 10.1 ? | 19.4 ? -92% | 7 ? 31% | 5.7 ? 44% | 7.6 ? 25% |
| PWM Frequency (Hz) | |||||
| Screen | -83% | -34% | -0% | -19% | |
| Brightness middle (cd/m²) | 315 | 328 4% | 432 37% | 471 50% | 347 10% |
| Brightness (cd/m²) | 297 | 313 5% | 425 43% | 468 58% | 325 9% |
| Brightness Distribution (%) | 87 | 91 5% | 91 5% | 96 10% | 84 -3% |
| Black Level * (cd/m²) | 0.29 | 0.26 10% | 0.37 -28% | 0.4 -38% | 0.26 10% |
| Contrast (:1) | 1086 | 1262 16% | 1168 8% | 1178 8% | 1335 23% |
| Colorchecker dE 2000 * | 2.38 | 4.73 -99% | 4.76 -100% | 2.72 -14% | 3.3 -39% |
| Colorchecker dE 2000 max. * | 3.66 | 17.47 -377% | 8.59 -135% | 5.49 -50% | 8.4 -130% |
| Colorchecker dE 2000 calibrated * | 0.96 | 4.22 -340% | 1.18 -23% | 1.12 -17% | 0.9 6% |
| Greyscale dE 2000 * | 2.9 | 2.05 29% | 6.2 -114% | 3.2 -10% | 4.5 -55% |
| Gamma | 2.052 107% | 2.63 84% | 2.079 106% | 2.227 99% | 2.05 107% |
| CCT | 6319 103% | 6718 97% | 6690 97% | 6925 94% | 7365 88% |
| Total Average (Program / Settings) | -69% /
-74% | -3% /
-18% | 18% /
9% | 9% /
-4% |
* ... smaller is better
However, as we're about to see in the gaming benchmarks, this pixel count is ideal for the RTX 5070. At just over 1,000:1, the contrast ratio is within the usual range, as is the black level of 0.29 cd/m².
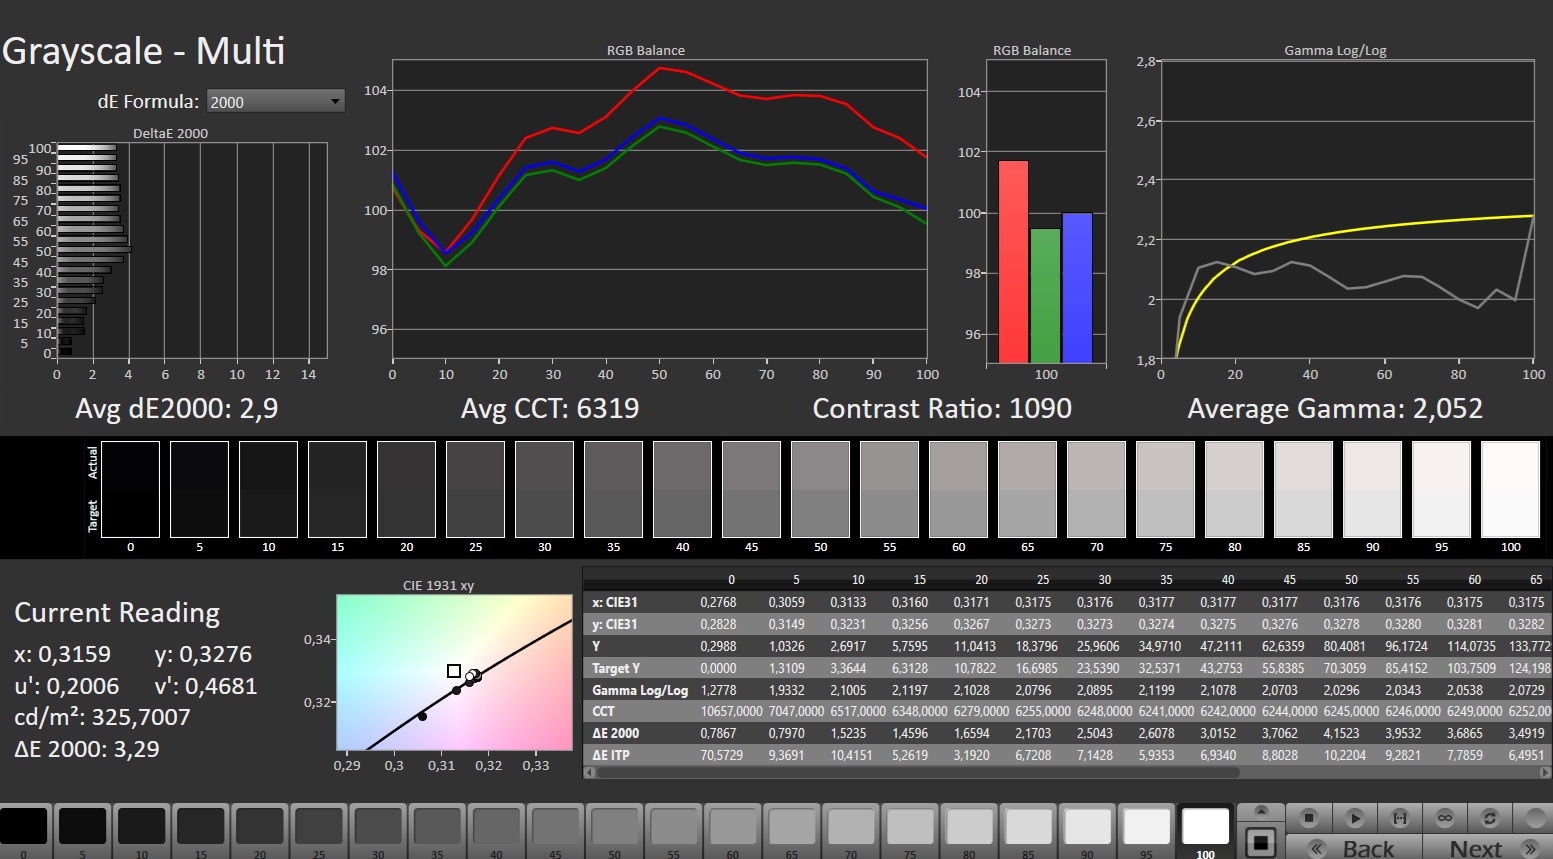
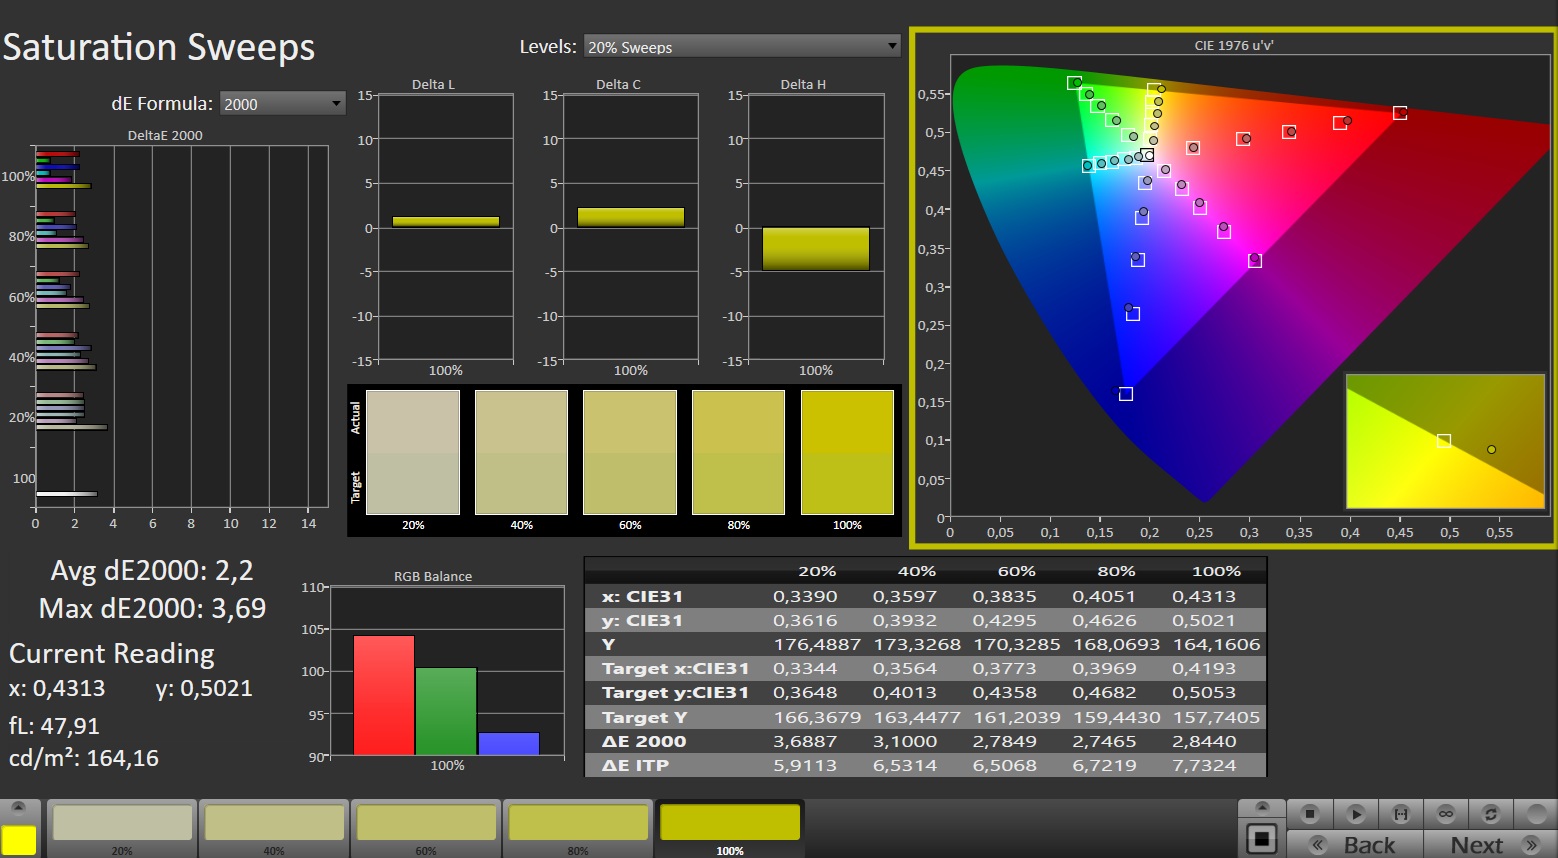
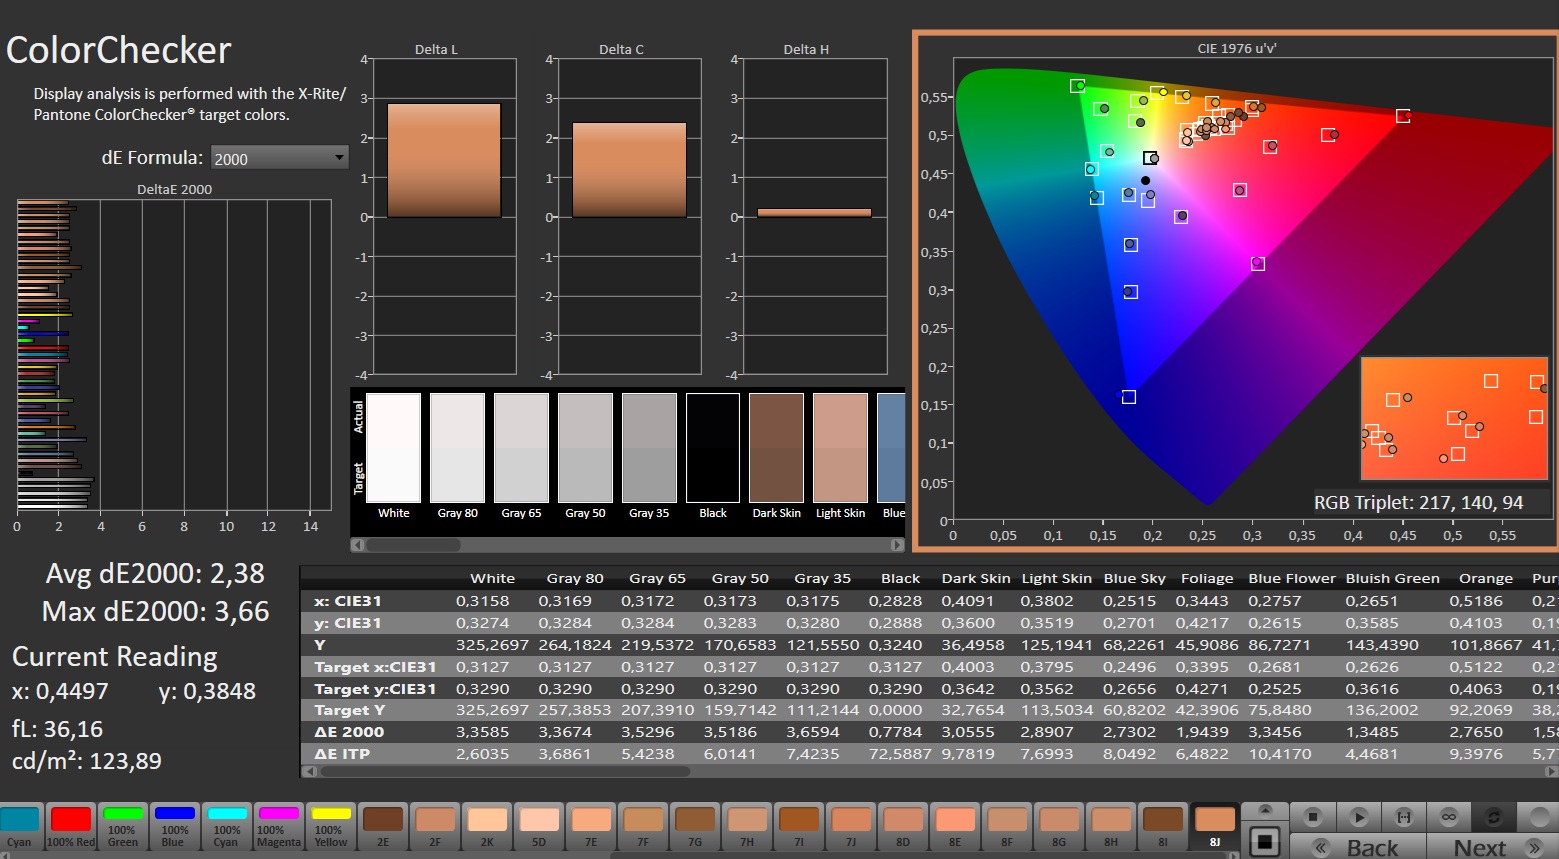
In brighter environments, the brightness leaves something to be desired. At just under 300 cd/m², it places last in the test field, and the color space is similar. With the LOQ 17 covering almost 100% of sRGB, it falls short in AdobeRGB and DCI-P3, which is likely to affect professional users and probably won't bother many gamers.
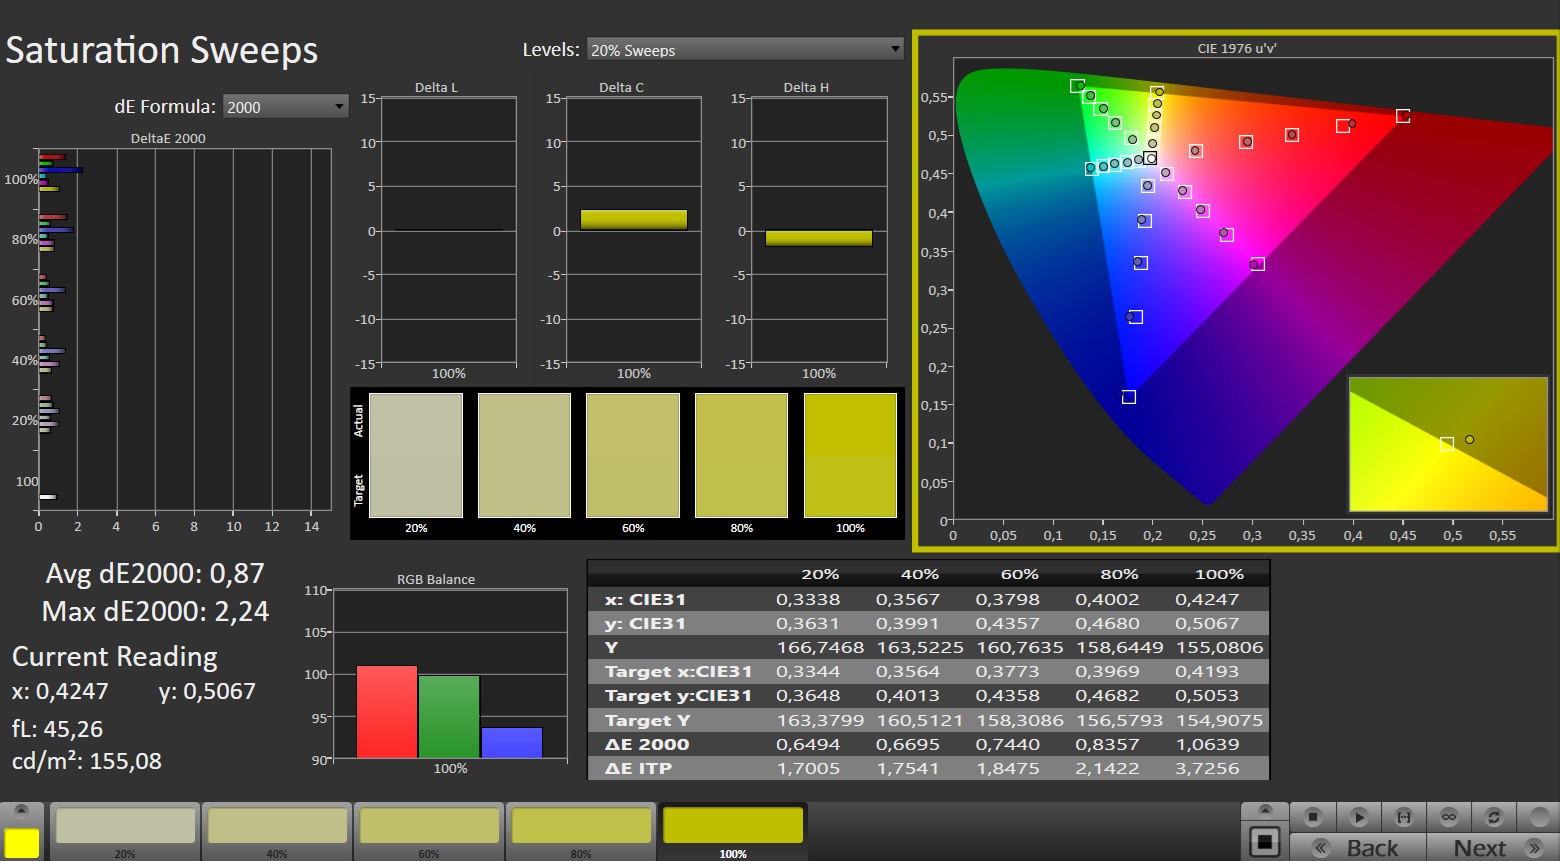
Out of the box, the color accuracy is already on a good level, and the response times are also decent.

Display Response Times
| ↔ Response Time Black to White | ||
|---|---|---|
| 10.1 ms ... rise ↗ and fall ↘ combined | ↗ 5.7 ms rise | 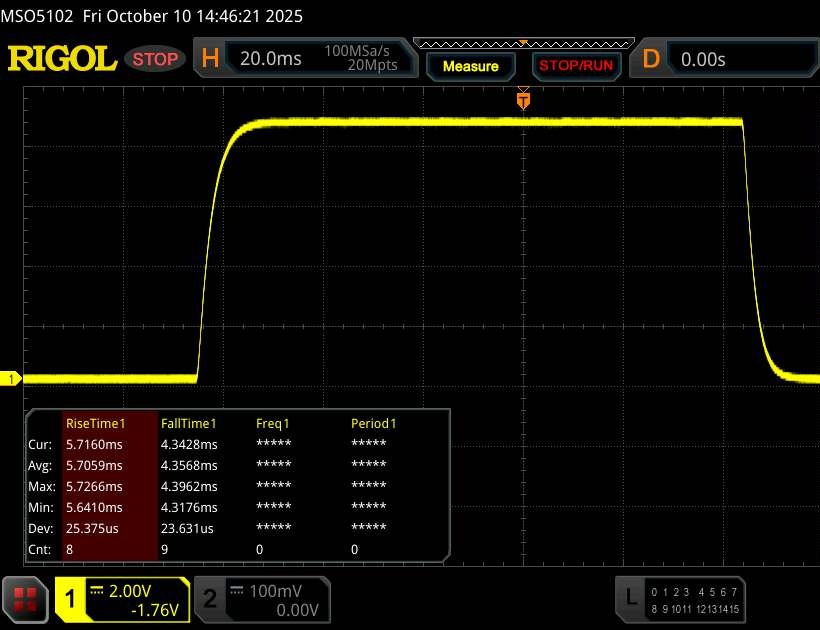 |
| ↘ 4.4 ms fall | ||
| The screen shows good response rates in our tests, but may be too slow for competitive gamers. In comparison, all tested devices range from 0.1 (minimum) to 240 (maximum) ms. » 28 % of all devices are better. This means that the measured response time is better than the average of all tested devices (19.8 ms). | ||
| ↔ Response Time 50% Grey to 80% Grey | ||
| 16 ms ... rise ↗ and fall ↘ combined | ↗ 7.4 ms rise | 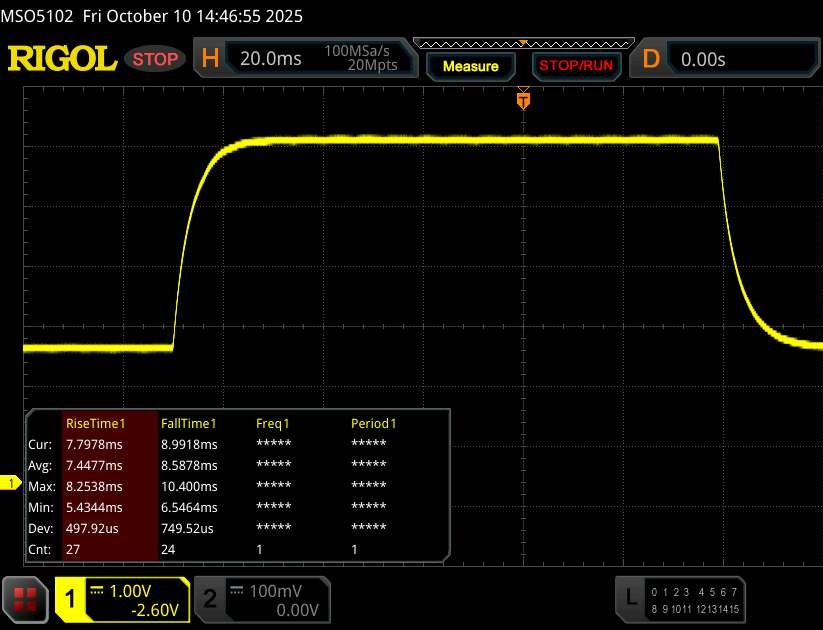 |
| ↘ 8.6 ms fall | ||
| The screen shows good response rates in our tests, but may be too slow for competitive gamers. In comparison, all tested devices range from 0.165 (minimum) to 636 (maximum) ms. » 30 % of all devices are better. This means that the measured response time is better than the average of all tested devices (31 ms). | ||
Screen Flickering / PWM (Pulse-Width Modulation)
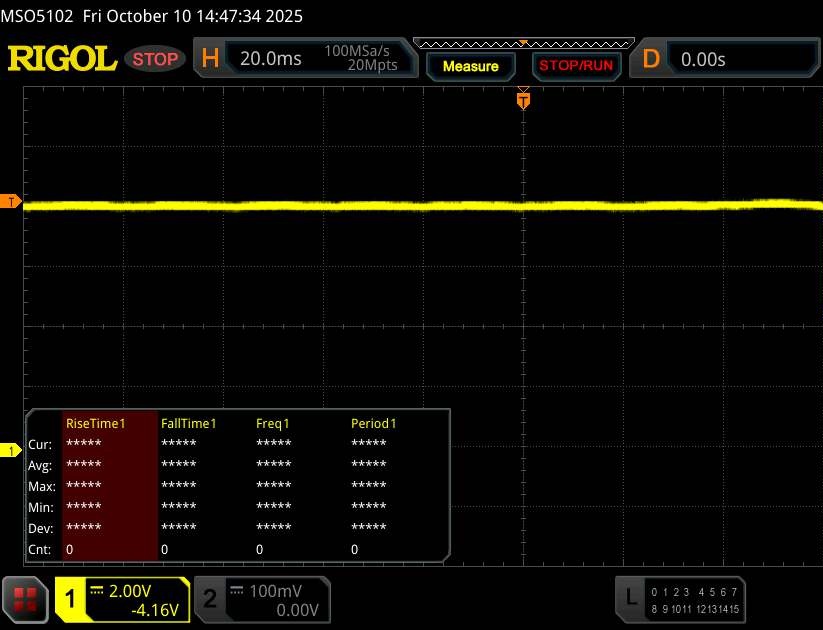
| Screen flickering / PWM not detected | 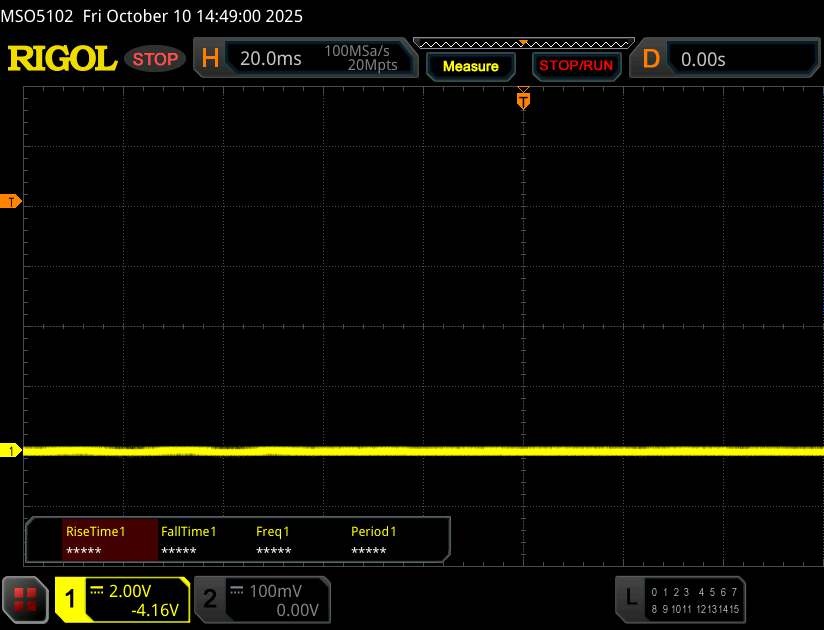 | ||
In comparison: 52 % of all tested devices do not use PWM to dim the display. If PWM was detected, an average of 7750 (minimum: 5 - maximum: 343500) Hz was measured. | |||
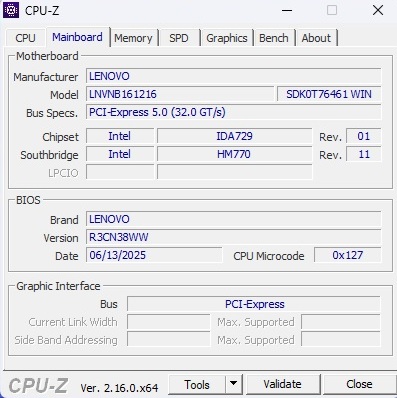
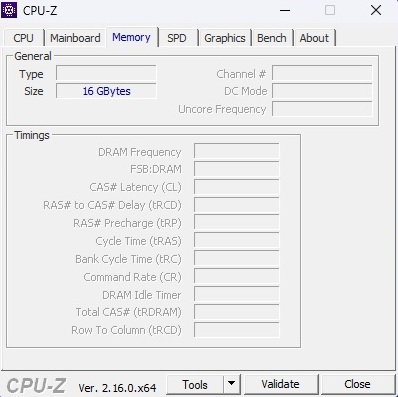
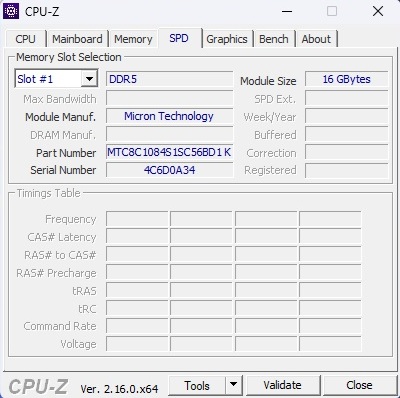
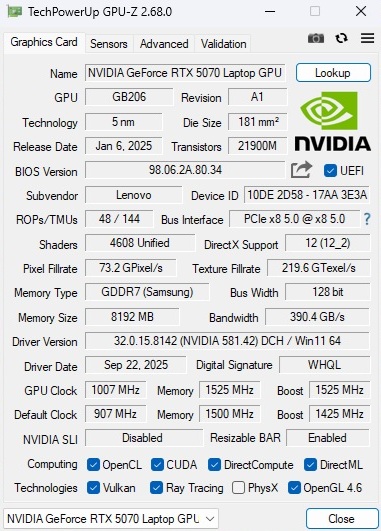
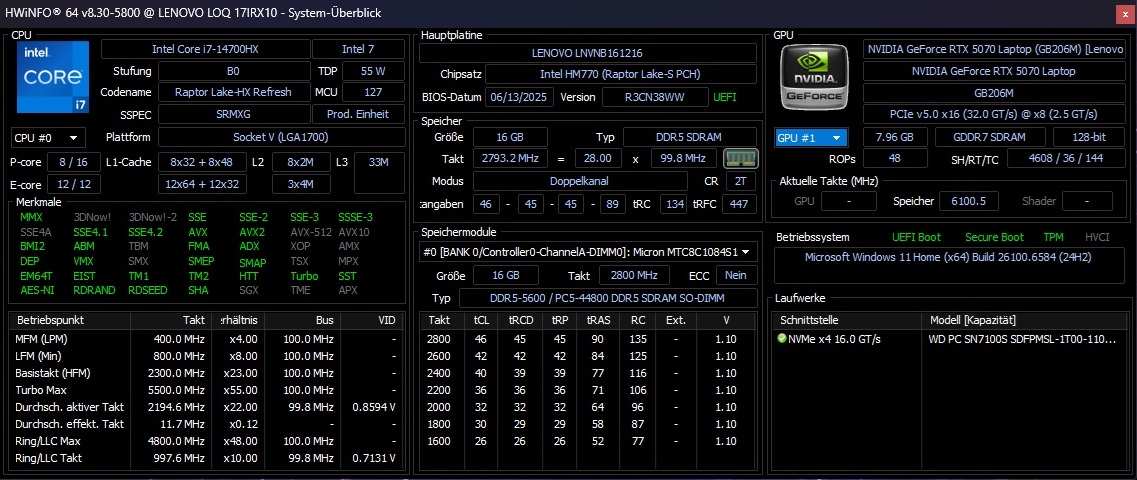
Performance
The performance chapter begins with a series of system screenshots.
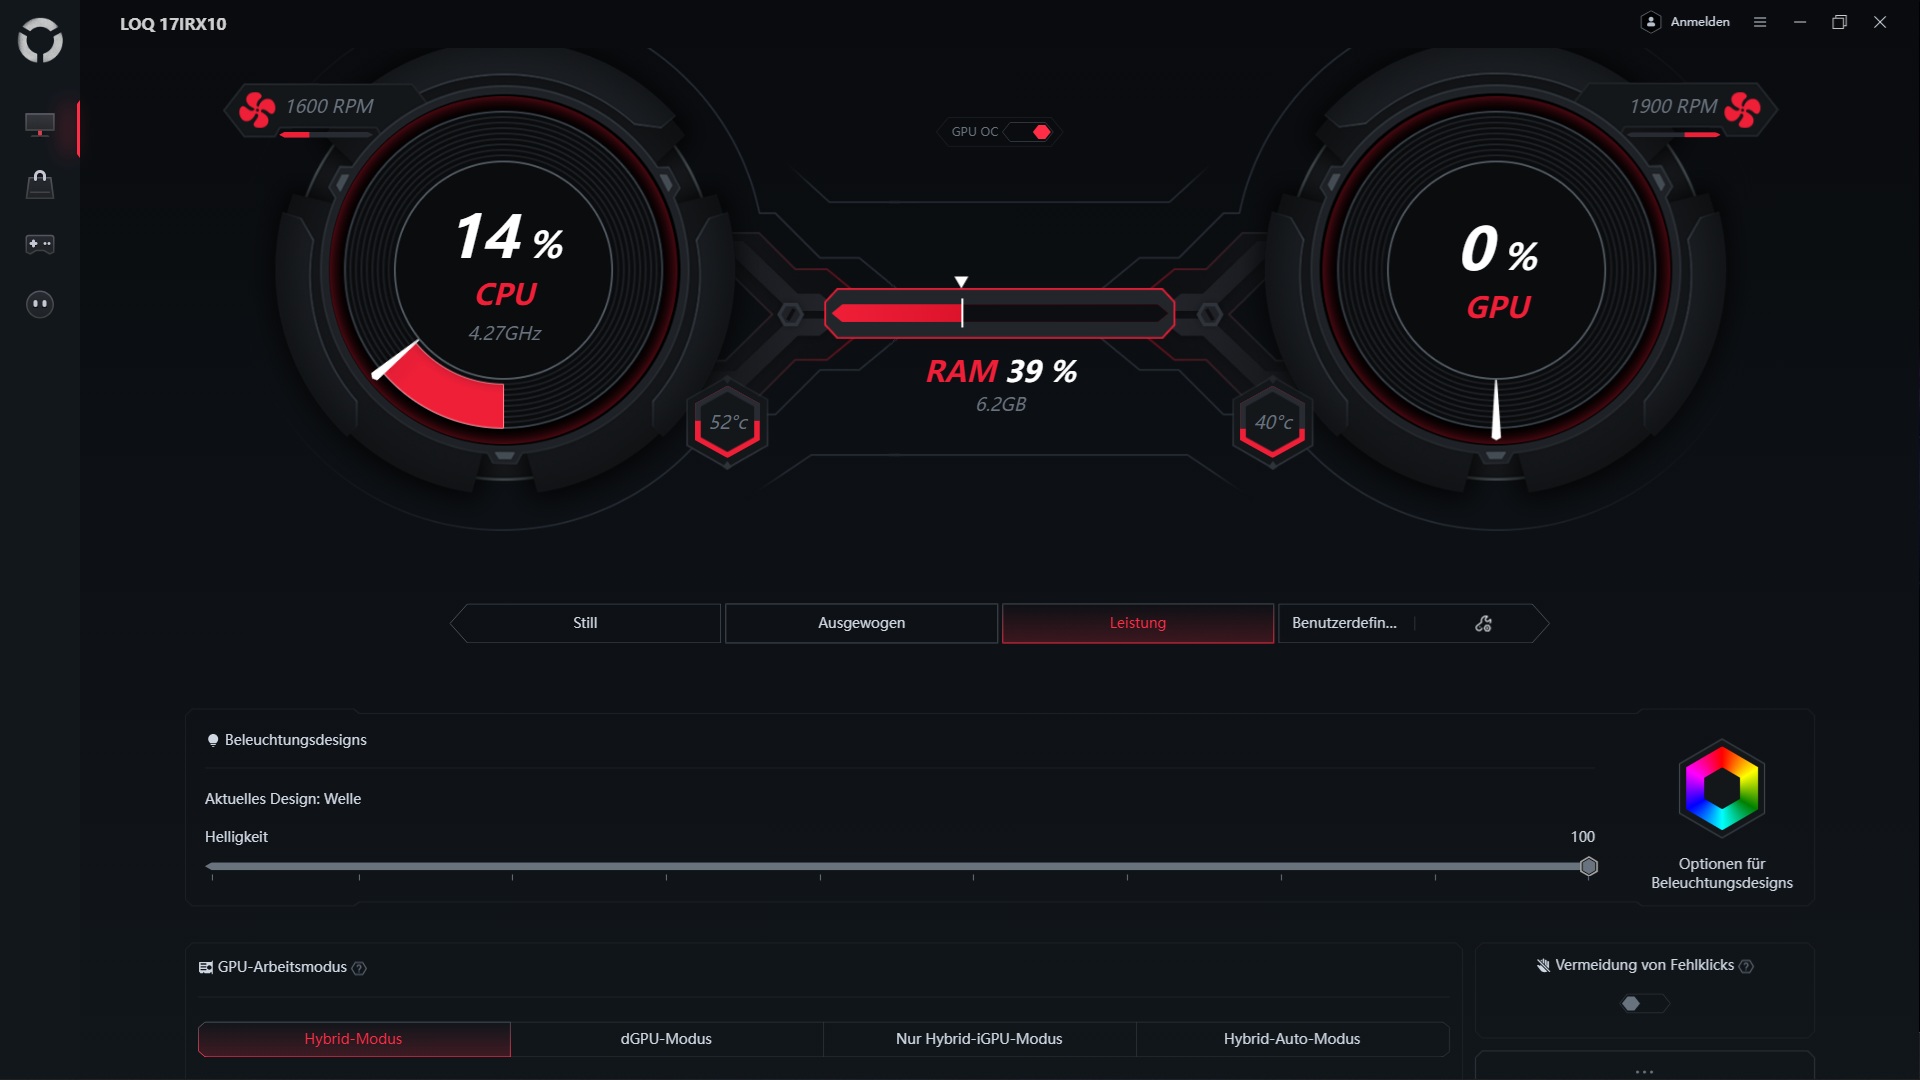
Test conditions
The LOQ 17's operating mode can be changed using a key combination (Fn + Q) or the Legion software. Our measurements (except the battery test) were conducted in performance mode, including GPU overclocking.
| Mode | Silent | Balanced | Performance + GPU OC |
| Cyberpunk 2077 Noise | 42 dB(A) | 49 dB(A) | 55 dB(A) |
| Cyberpunk 2077 Performance (FHD/Ultra) | 55.7fps | 89.7fps | 100fps |
| Cyberpunk 2077 GPU Power Draw | ~45 W | ~75 W | ~100 W |
| Cinebench R15 Multi Score | 2,974 points | 4,054 points | 4,354 points |
| CPU PL1 | 25 W | 70 W | 90 W |
| CPU PL2 | 65 W | 125 W | 162 W |
Processor
If you ignore the not entirely consistent Cinebench loop performance, the Core i7-14700HX cuts a very decent figure. However, compared to the Ryzen 9 8940HX in the MSI Crosshair A17 HX, the LOQ 17 doesn't stand a chance (the latter CPU is on average about 14% faster).
Cinebench R15 Multi Sustained Test
| CPU Performance rating - Percent | |
| MSI Crosshair A17 HX D8WGKG | |
| Schenker XMG Focus 17 M25 | |
| Lenovo LOQ 17IRX10 | |
| Average of class Gaming | |
| HP Omen 16-ap0091ng | |
| Average Intel Core i7-14700HX | |
| Gigabyte Gaming A16 GA6H | |
* ... smaller is better
AIDA64: FP32 Ray-Trace | FPU Julia | CPU SHA3 | CPU Queen | FPU SinJulia | FPU Mandel | CPU AES | CPU ZLib | FP64 Ray-Trace | CPU PhotoWorxx
| Performance rating | |
| MSI Crosshair A17 HX D8WGKG | |
| HP Omen 16-ap0091ng | |
| Schenker XMG Focus 17 M25 | |
| Average of class Gaming | |
| Average Intel Core i7-14700HX | |
| Lenovo LOQ 17IRX10 | |
| Gigabyte Gaming A16 GA6H | |
| AIDA64 / FP32 Ray-Trace | |
| MSI Crosshair A17 HX D8WGKG | |
| HP Omen 16-ap0091ng | |
| Average of class Gaming (10227 - 85542, n=103, last 2 years) | |
| Schenker XMG Focus 17 M25 | |
| Lenovo LOQ 17IRX10 | |
| Average Intel Core i7-14700HX (14147 - 23676, n=9) | |
| Gigabyte Gaming A16 GA6H | |
| AIDA64 / FPU Julia | |
| MSI Crosshair A17 HX D8WGKG | |
| HP Omen 16-ap0091ng | |
| Average of class Gaming (51376 - 238426, n=103, last 2 years) | |
| Schenker XMG Focus 17 M25 | |
| Lenovo LOQ 17IRX10 | |
| Average Intel Core i7-14700HX (71875 - 116556, n=9) | |
| Gigabyte Gaming A16 GA6H | |
| AIDA64 / CPU SHA3 | |
| MSI Crosshair A17 HX D8WGKG | |
| HP Omen 16-ap0091ng | |
| Schenker XMG Focus 17 M25 | |
| Average of class Gaming (2180 - 9817, n=103, last 2 years) | |
| Lenovo LOQ 17IRX10 | |
| Average Intel Core i7-14700HX (3388 - 5567, n=9) | |
| Gigabyte Gaming A16 GA6H | |
| AIDA64 / CPU Queen | |
| MSI Crosshair A17 HX D8WGKG | |
| HP Omen 16-ap0091ng | |
| Lenovo LOQ 17IRX10 | |
| Average Intel Core i7-14700HX (129134 - 152200, n=9) | |
| Schenker XMG Focus 17 M25 | |
| Average of class Gaming (49785 - 173351, n=89, last 2 years) | |
| Gigabyte Gaming A16 GA6H | |
| AIDA64 / FPU SinJulia | |
| MSI Crosshair A17 HX D8WGKG | |
| HP Omen 16-ap0091ng | |
| Schenker XMG Focus 17 M25 | |
| Average of class Gaming (4424 - 33636, n=103, last 2 years) | |
| Lenovo LOQ 17IRX10 | |
| Average Intel Core i7-14700HX (10266 - 14434, n=9) | |
| Gigabyte Gaming A16 GA6H | |
| AIDA64 / FPU Mandel | |
| MSI Crosshair A17 HX D8WGKG | |
| HP Omen 16-ap0091ng | |
| Average of class Gaming (25115 - 128721, n=103, last 2 years) | |
| Schenker XMG Focus 17 M25 | |
| Lenovo LOQ 17IRX10 | |
| Average Intel Core i7-14700HX (35155 - 58380, n=9) | |
| Gigabyte Gaming A16 GA6H | |
| AIDA64 / CPU AES | |
| MSI Crosshair A17 HX D8WGKG | |
| HP Omen 16-ap0091ng | |
| Schenker XMG Focus 17 M25 | |
| Average of class Gaming (39258 - 247074, n=103, last 2 years) | |
| Lenovo LOQ 17IRX10 | |
| Average Intel Core i7-14700HX (68616 - 113157, n=9) | |
| Gigabyte Gaming A16 GA6H | |
| AIDA64 / CPU ZLib | |
| MSI Crosshair A17 HX D8WGKG | |
| Schenker XMG Focus 17 M25 | |
| HP Omen 16-ap0091ng | |
| Average of class Gaming (574 - 2531, n=103, last 2 years) | |
| Lenovo LOQ 17IRX10 | |
| Average Intel Core i7-14700HX (1003 - 1682, n=9) | |
| Gigabyte Gaming A16 GA6H | |
| AIDA64 / FP64 Ray-Trace | |
| MSI Crosshair A17 HX D8WGKG | |
| HP Omen 16-ap0091ng | |
| Average of class Gaming (5509 - 45446, n=103, last 2 years) | |
| Schenker XMG Focus 17 M25 | |
| Lenovo LOQ 17IRX10 | |
| Average Intel Core i7-14700HX (7585 - 12928, n=9) | |
| Gigabyte Gaming A16 GA6H | |
| AIDA64 / CPU PhotoWorxx | |
| Schenker XMG Focus 17 M25 | |
| Average of class Gaming (12271 - 89891, n=103, last 2 years) | |
| Average Intel Core i7-14700HX (24276 - 49671, n=9) | |
| MSI Crosshair A17 HX D8WGKG | |
| Lenovo LOQ 17IRX10 | |
| Gigabyte Gaming A16 GA6H | |
| HP Omen 16-ap0091ng | |
System performance
The system performance on offer meets expectations, and the 17-inch model once again lands in the upper mid-range among the comparison devices.
PCMark 10: Essentials
CrossMark: Overall | Productivity | Creativity | Responsiveness
WebXPRT 3: Overall
WebXPRT 4: Overall
Mozilla Kraken 1.1: Total
| Performance rating | |
| Schenker XMG Focus 17 M25 | |
| Lenovo LOQ 17IRX10 | |
| Average Intel Core i7-14700HX, NVIDIA GeForce RTX 5070 Laptop | |
| Average of class Gaming | |
| HP Omen 16-ap0091ng | |
| MSI Crosshair A17 HX D8WGKG | |
| Gigabyte Gaming A16 GA6H | |
| PCMark 10 / Essentials | |
| MSI Crosshair A17 HX D8WGKG | |
| Schenker XMG Focus 17 M25 | |
| Lenovo LOQ 17IRX10 | |
| Average Intel Core i7-14700HX, NVIDIA GeForce RTX 5070 Laptop (n=1) | |
| HP Omen 16-ap0091ng | |
| Average of class Gaming (8810 - 11935, n=96, last 2 years) | |
| Gigabyte Gaming A16 GA6H | |
| CrossMark / Overall | |
| Schenker XMG Focus 17 M25 | |
| Lenovo LOQ 17IRX10 | |
| Average Intel Core i7-14700HX, NVIDIA GeForce RTX 5070 Laptop (n=1) | |
| Average of class Gaming (1366 - 2409, n=93, last 2 years) | |
| MSI Crosshair A17 HX D8WGKG | |
| HP Omen 16-ap0091ng | |
| Gigabyte Gaming A16 GA6H | |
| CrossMark / Productivity | |
| Schenker XMG Focus 17 M25 | |
| Lenovo LOQ 17IRX10 | |
| Average Intel Core i7-14700HX, NVIDIA GeForce RTX 5070 Laptop (n=1) | |
| Average of class Gaming (1386 - 2254, n=93, last 2 years) | |
| MSI Crosshair A17 HX D8WGKG | |
| HP Omen 16-ap0091ng | |
| Gigabyte Gaming A16 GA6H | |
| CrossMark / Creativity | |
| Schenker XMG Focus 17 M25 | |
| Average of class Gaming (1343 - 2729, n=93, last 2 years) | |
| Lenovo LOQ 17IRX10 | |
| Average Intel Core i7-14700HX, NVIDIA GeForce RTX 5070 Laptop (n=1) | |
| MSI Crosshair A17 HX D8WGKG | |
| HP Omen 16-ap0091ng | |
| Gigabyte Gaming A16 GA6H | |
| CrossMark / Responsiveness | |
| Schenker XMG Focus 17 M25 | |
| Gigabyte Gaming A16 GA6H | |
| Lenovo LOQ 17IRX10 | |
| Average Intel Core i7-14700HX, NVIDIA GeForce RTX 5070 Laptop (n=1) | |
| MSI Crosshair A17 HX D8WGKG | |
| Average of class Gaming (1226 - 2334, n=93, last 2 years) | |
| HP Omen 16-ap0091ng | |
| WebXPRT 3 / Overall | |
| HP Omen 16-ap0091ng | |
| Average of class Gaming (220 - 532, n=97, last 2 years) | |
| Schenker XMG Focus 17 M25 | |
| Lenovo LOQ 17IRX10 | |
| Average Intel Core i7-14700HX, NVIDIA GeForce RTX 5070 Laptop (n=1) | |
| MSI Crosshair A17 HX D8WGKG | |
| Gigabyte Gaming A16 GA6H | |
| WebXPRT 4 / Overall | |
| Schenker XMG Focus 17 M25 | |
| Lenovo LOQ 17IRX10 | |
| Average Intel Core i7-14700HX, NVIDIA GeForce RTX 5070 Laptop (n=1) | |
| Average of class Gaming (165 - 354, n=97, last 2 years) | |
| Gigabyte Gaming A16 GA6H | |
| HP Omen 16-ap0091ng | |
| MSI Crosshair A17 HX D8WGKG | |
| Mozilla Kraken 1.1 / Total | |
| Gigabyte Gaming A16 GA6H | |
| HP Omen 16-ap0091ng | |
| MSI Crosshair A17 HX D8WGKG | |
| Schenker XMG Focus 17 M25 | |
| Average of class Gaming (391 - 590, n=99, last 2 years) | |
| Lenovo LOQ 17IRX10 | |
| Average Intel Core i7-14700HX, NVIDIA GeForce RTX 5070 Laptop (n=1) | |
* ... smaller is better
| AIDA64 / Memory Copy | |
| Schenker XMG Focus 17 M25 | |
| Average of class Gaming (21750 - 129946, n=103, last 2 years) | |
| Average Intel Core i7-14700HX (41617 - 78742, n=9) | |
| MSI Crosshair A17 HX D8WGKG | |
| Lenovo LOQ 17IRX10 | |
| Gigabyte Gaming A16 GA6H | |
| HP Omen 16-ap0091ng | |
| AIDA64 / Memory Read | |
| Schenker XMG Focus 17 M25 | |
| Average Intel Core i7-14700HX (46627 - 86175, n=9) | |
| Average of class Gaming (22956 - 118858, n=103, last 2 years) | |
| MSI Crosshair A17 HX D8WGKG | |
| Lenovo LOQ 17IRX10 | |
| HP Omen 16-ap0091ng | |
| Gigabyte Gaming A16 GA6H | |
| AIDA64 / Memory Write | |
| Average of class Gaming (22297 - 135096, n=103, last 2 years) | |
| Schenker XMG Focus 17 M25 | |
| Average Intel Core i7-14700HX (39155 - 76976, n=9) | |
| MSI Crosshair A17 HX D8WGKG | |
| Lenovo LOQ 17IRX10 | |
| HP Omen 16-ap0091ng | |
| Gigabyte Gaming A16 GA6H | |
| AIDA64 / Memory Latency | |
| Average of class Gaming (75.3 - 259, n=103, last 2 years) | |
| Gigabyte Gaming A16 GA6H | |
| Average Intel Core i7-14700HX (82.7 - 96.4, n=9) | |
| Lenovo LOQ 17IRX10 | |
| MSI Crosshair A17 HX D8WGKG | |
| HP Omen 16-ap0091ng | |
| Schenker XMG Focus 17 M25 | |
* ... smaller is better
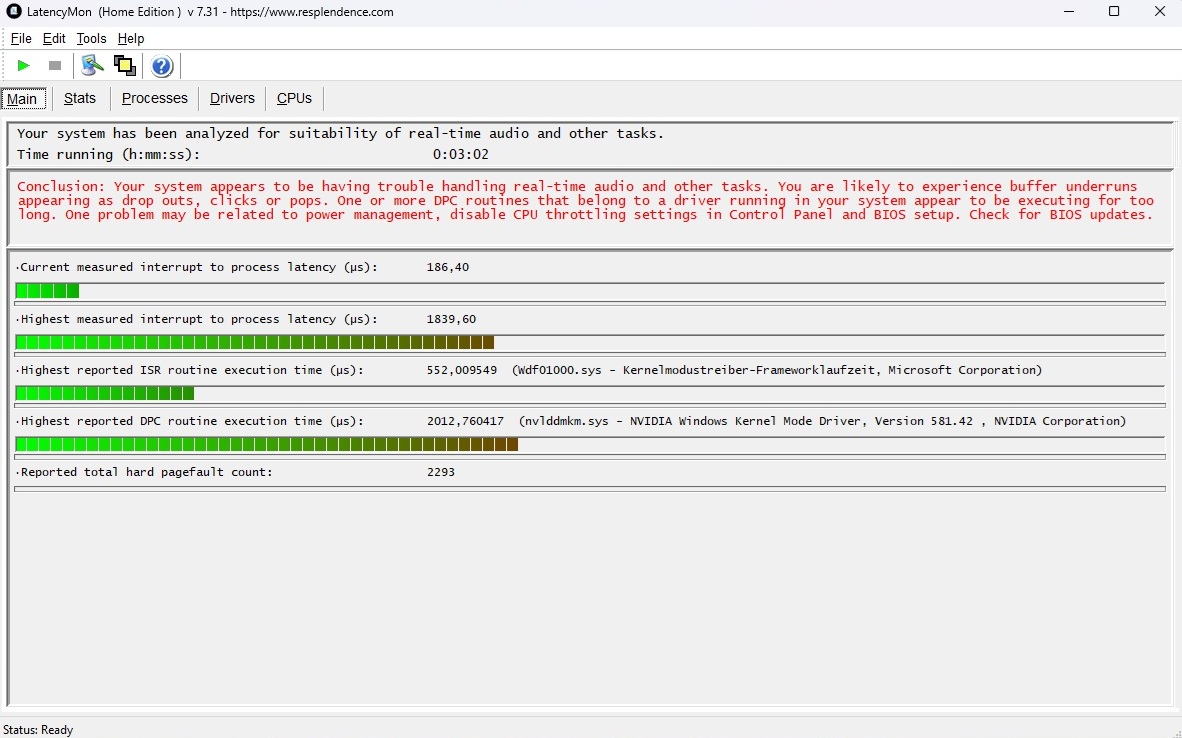
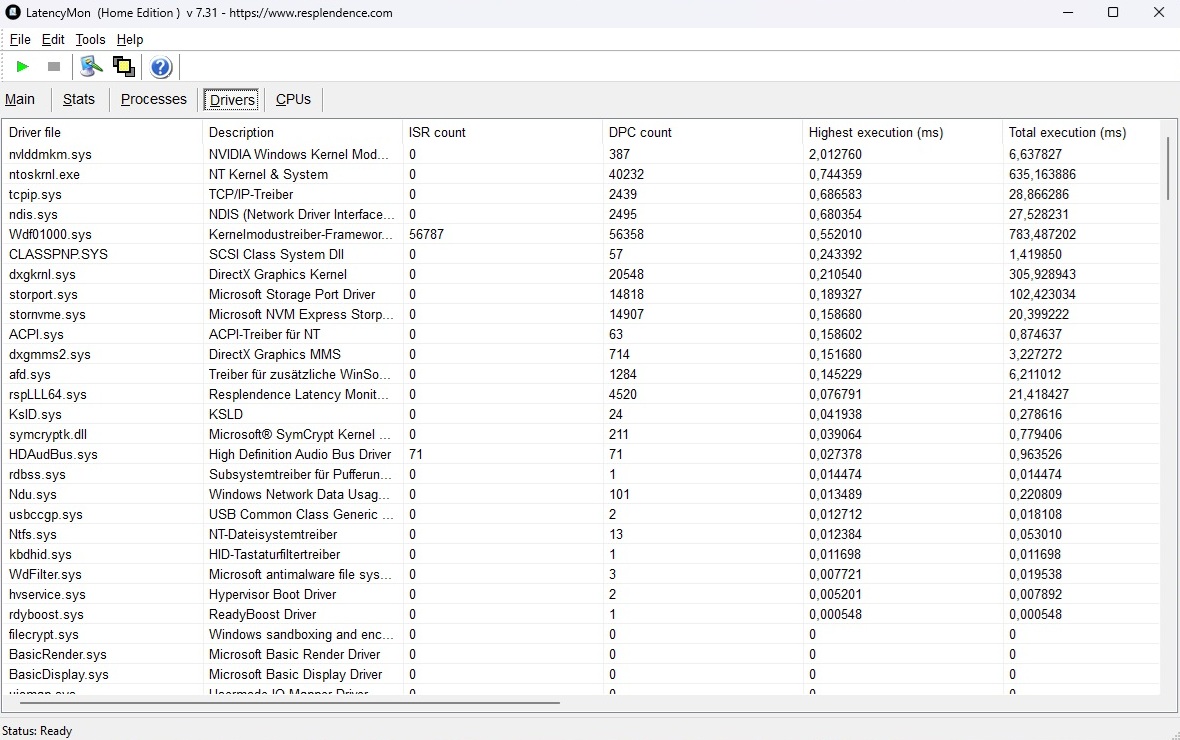
DPC latenices
As is often the case, latency proves to be less than perfect. The LatencyMon tool indicates potential problems in certain application scenarios.
| DPC Latencies / LatencyMon - interrupt to process latency (max), Web, Youtube, Prime95 | |
| Gigabyte Gaming A16 GA6H | |
| Lenovo LOQ 17IRX10 | |
| Schenker XMG Focus 17 M25 | |
| HP Omen 16-ap0091ng | |
| MSI Crosshair A17 HX D8WGKG | |
* ... smaller is better
Mass storage
The review configuration features a Western Digital 1 TB SSD, which delivers acceptable performance from an NVMe perspective, but in the loop test, speed drops and fluctuations occurred after a while (see table).

* ... smaller is better
Sustained Performance Read: DiskSpd Read Loop, Queue Depth 8
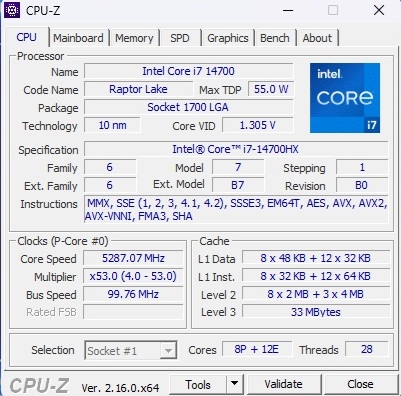
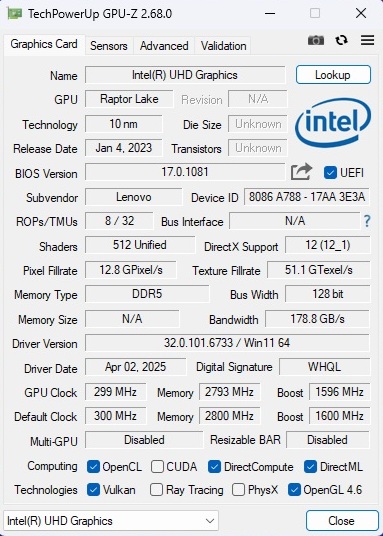
GPU performance
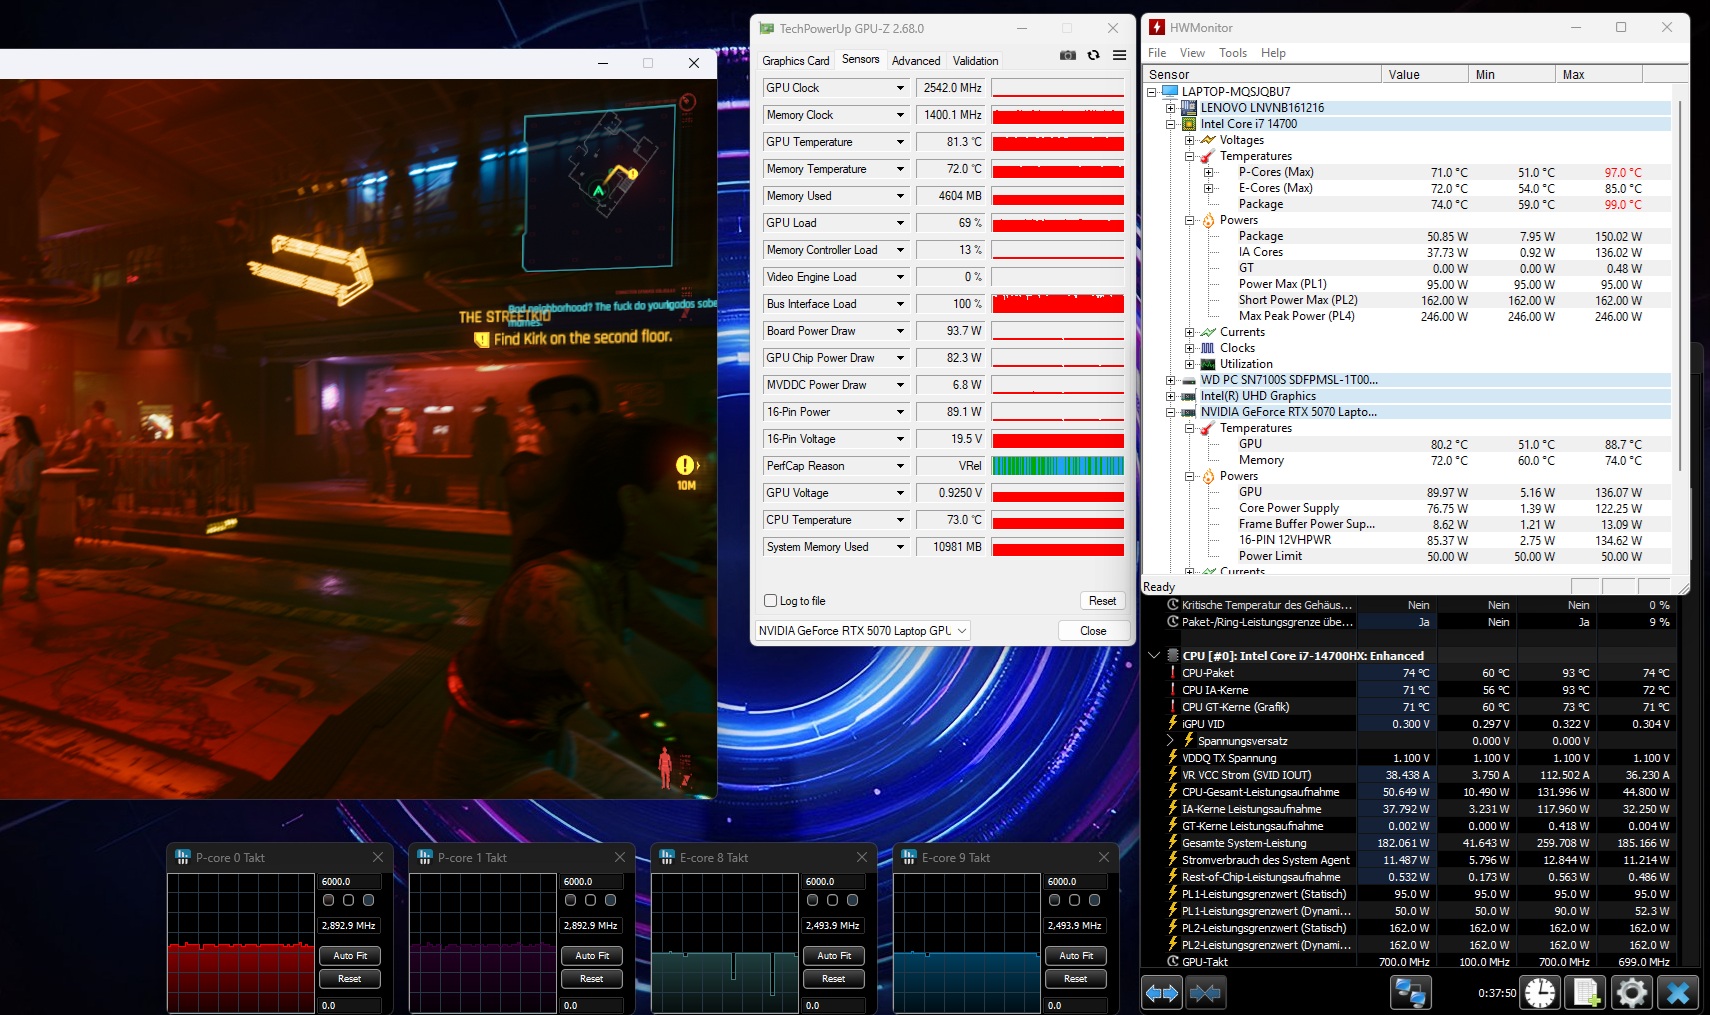
As previously mentioned, the GPU benefits from Lenovo's overclocking. According to the GPU-Z tool, the RTX 5070's clock speed is increased by approximately 10% when overclocking is enabled, which helps the LOQ 17 achieve above-average results in synthetic benchmarks and gaming tests. In 3DMark, the 17-inch laptop even manages to take the lead among RTX 5070 laptops, although the RTX 5070 Ti still enjoys a 20% advantage.
| 3DMark Performance rating - Percent | |
| Schenker XMG Focus 17 M25 -1! | |
| Average of class Gaming | |
| Lenovo LOQ 17IRX10 | |
| MSI Crosshair A17 HX D8WGKG | |
| Average NVIDIA GeForce RTX 5070 Laptop | |
| Gigabyte Gaming A16 GA6H | |
| HP Omen 16-ap0091ng -1! | |
| 3DMark 11 Performance | 37532 points | |
| 3DMark Cloud Gate Standard Score | 65067 points | |
| 3DMark Fire Strike Score | 32559 points | |
| 3DMark Time Spy Score | 13683 points | |
Help | ||
* ... smaller is better
Gaming performance
As a direct result of its specifications (number of shaders, VRAM configuration, etc.), the RTX 5070 is only intended for QHD panels. When using the native Full HD resolution of 1,920 x 1,080 pixels, most current games run smoothly even at maximum details. Exceptions are only extremely poorly optimized titles such as Borderlands 4. Anyone aiming to get even higher frame rates can use upscaling and other Nvidia Blackwell architecture features. DLSS Quality in Hellblade 2, for example, means 72fps instead of 54 (FHD/High). Including quadruple frame generation even resulted in a whopping 191fps, although the subjective image quality is sometimes not quite as thrilling as the pure frame rate numbers suggest due to the lower frame times.
| Final Fantasy XV Benchmark - 1920x1080 High Quality | |
| Schenker XMG Focus 17 M25 | |
| Average of class Gaming (41 - 215, n=94, last 2 years) | |
| MSI Crosshair A17 HX D8WGKG | |
| Lenovo LOQ 17IRX10 | |
| Average NVIDIA GeForce RTX 5070 Laptop (96 - 150.7, n=26) | |
| HP Omen 16-ap0091ng | |
| Gigabyte Gaming A16 GA6H | |
| Strange Brigade - 1920x1080 ultra AA:ultra AF:16 | |
| Schenker XMG Focus 17 M25 | |
| Average of class Gaming (76.3 - 456, n=86, last 2 years) | |
| Lenovo LOQ 17IRX10 | |
| Average NVIDIA GeForce RTX 5070 Laptop (203 - 261, n=24) | |
| HP Omen 16-ap0091ng | |
| Gigabyte Gaming A16 GA6H | |
| Dota 2 Reborn - 1920x1080 ultra (3/3) best looking | |
| MSI Crosshair A17 HX D8WGKG | |
| Lenovo LOQ 17IRX10 | |
| Schenker XMG Focus 17 M25 | |
| HP Omen 16-ap0091ng | |
| Average of class Gaming (84.8 - 248, n=106, last 2 years) | |
| Gigabyte Gaming A16 GA6H | |
| Average NVIDIA GeForce RTX 5070 Laptop (122.1 - 184.2, n=28) | |
| low | med. | high | ultra | QHD DLSS | QHD | 4K DLSS | 4K | |
|---|---|---|---|---|---|---|---|---|
| GTA V (2015) | 181.8 | 176.2 | 135.4 | |||||
| Dota 2 Reborn (2015) | 192.4 | 183.4 | 167.2 | |||||
| Final Fantasy XV Benchmark (2018) | 172.8 | 137.7 | ||||||
| X-Plane 11.11 (2018) | 135 | 113.8 | ||||||
| Strange Brigade (2018) | 332 | 277 | 254 | |||||
| Baldur's Gate 3 (2023) | 134.3 | 112.9 | 108 | |||||
| Cyberpunk 2077 (2023) | 112.6 | 108 | 100 | |||||
| Horizon Forbidden West (2024) | 98.5 | 82.1 | 81 | |||||
| Ghost of Tsushima (2024) | 97.4 | 91 | 75.8 | |||||
| Senua's Saga Hellblade 2 (2024) | 70 | 53.5 | ||||||
| Star Wars Outlaws (2024) | 58.6 | 53.5 | 47.5 | |||||
| Space Marine 2 (2024) | 73.1 | 70.5 | 68.1 | |||||
| Until Dawn (2024) | 100.7 | 75.9 | 59 | |||||
| Stalker 2 (2024) | 68.3 | 59.3 | 50.4 | |||||
| Borderlands 4 (2025) | 52.3 | 42.5 | 27.4 | |||||
| Battlefield 6 (2025) | 141 | 130.3 | 111.2 | 77.8 | 64.7 | 51.2 | 18 | 13.2 |
| Stalker 2 - 1920x1080 Epic Preset | |
| Average of class Gaming (28.8 - 147.6, n=18, last 2 years) | |
| Lenovo LOQ 17IRX10 | |
| Average NVIDIA GeForce RTX 5070 Laptop (45.7 - 50.4, n=3) | |
| MSI Katana 17 HX B14WGK | |
| Until Dawn - 1920x1080 Ultra Preset | |
| Average of class Gaming (36.4 - 104, n=16, last 2 years) | |
| Lenovo LOQ 17IRX10 | |
| Average NVIDIA GeForce RTX 5070 Laptop (48.8 - 61.8, n=3) | |
| MSI Katana 17 HX B14WGK | |
| Space Marine 2 - 1920x1080 Ultra Preset AA:T | |
| Average of class Gaming (52.8 - 108, n=14, last 2 years) | |
| Average NVIDIA GeForce RTX 5070 Laptop (58.9 - 97.3, n=3) | |
| Lenovo LOQ 17IRX10 | |
| MSI Katana 17 HX B14WGK | |
| Star Wars Outlaws - 1920x1080 cinem. ultra | |
| MSI Katana 17 HX B14WGK | |
| Average of class Gaming (29.1 - 71.6, n=15, last 2 years) | |
| Average NVIDIA GeForce RTX 5070 Laptop (47.5 - 50.3, n=3) | |
| Lenovo LOQ 17IRX10 | |
| Senua's Saga Hellblade 2 - 1920x1080 High Preset | |
| Lenovo LOQ 17IRX10 | |
| Average of class Gaming (33.9 - 86.1, n=12, last 2 years) | |
| Average NVIDIA GeForce RTX 5070 Laptop (46.3 - 53.5, n=3) | |
| MSI Katana 17 HX B14WGK | |
| Ghost of Tsushima - 1920x1080 Very High Preset AA:T | |
| Lenovo LOQ 17IRX10 | |
| Average of class Gaming (28.5 - 108.1, n=14, last 2 years) | |
| Average NVIDIA GeForce RTX 5070 Laptop (64.9 - 75.8, n=3) | |
| MSI Katana 17 HX B14WGK | |
| Horizon Forbidden West - 1920x1080 Very High Preset AA:T | |
| Lenovo LOQ 17IRX10 | |
| Average of class Gaming (14.7 - 140.3, n=12, last 2 years) | |
| Average NVIDIA GeForce RTX 5070 Laptop (73.2 - 81, n=3) | |
| MSI Katana 17 HX B14WGK | |
In the long-term test with Cyberpunk 2077, there were no abnormalities, and the frame rate was quite stable.
Cyberpunk 2077 Ultra FPS Diagram
Emissions
Noise emissions
Noise levels are roughly in line with the competition. The 55 dB(A) measured in Cyberpunk 2077 is reminiscent of the Gigabyte Gaming A16, MSI Crosshair A17 HX, and XMG Focus 17, whereas the Omen 16 is somewhat quieter under load. In idle mode, the fans are generally comfortable, averaging a modest 26 dB(A).
Noise level
| Idle |
| 25 / 26 / 32 dB(A) |
| Load |
| 56 / 56 dB(A) |
 | ||
30 dB silent 40 dB(A) audible 50 dB(A) loud |
||
min: | ||
| Lenovo LOQ 17IRX10 i7-14700HX, GeForce RTX 5070 Laptop | HP Omen 16-ap0091ng R9 8940HX, GeForce RTX 5060 Laptop | Gigabyte Gaming A16 GA6H i7-13620H, GeForce RTX 5070 Laptop | MSI Crosshair A17 HX D8WGKG R9 8940HX, GeForce RTX 5070 Laptop | Schenker XMG Focus 17 M25 i9-13900HX, GeForce RTX 5070 Ti Laptop | |
|---|---|---|---|---|---|
| Noise | 9% | 3% | -10% | 3% | |
| off / environment * (dB) | 24 | 23 4% | 24 -0% | 24 -0% | 24.8 -3% |
| Idle Minimum * (dB) | 25 | 23 8% | 25 -0% | 25 -0% | 24.8 1% |
| Idle Average * (dB) | 26 | 23 12% | 26 -0% | 30 -15% | 24.8 5% |
| Idle Maximum * (dB) | 32 | 27.64 14% | 27 16% | 47 -47% | 27.7 13% |
| Load Average * (dB) | 56 | 49.5 12% | 54 4% | 57 -2% | 51 9% |
| Cyberpunk 2077 ultra * (dB) | 55 | 49.5 10% | 54 2% | 57 -4% | 56.2 -2% |
| Load Maximum * (dB) | 56 | 52.73 6% | 55 2% | 58 -4% | 56.2 -0% |
* ... smaller is better
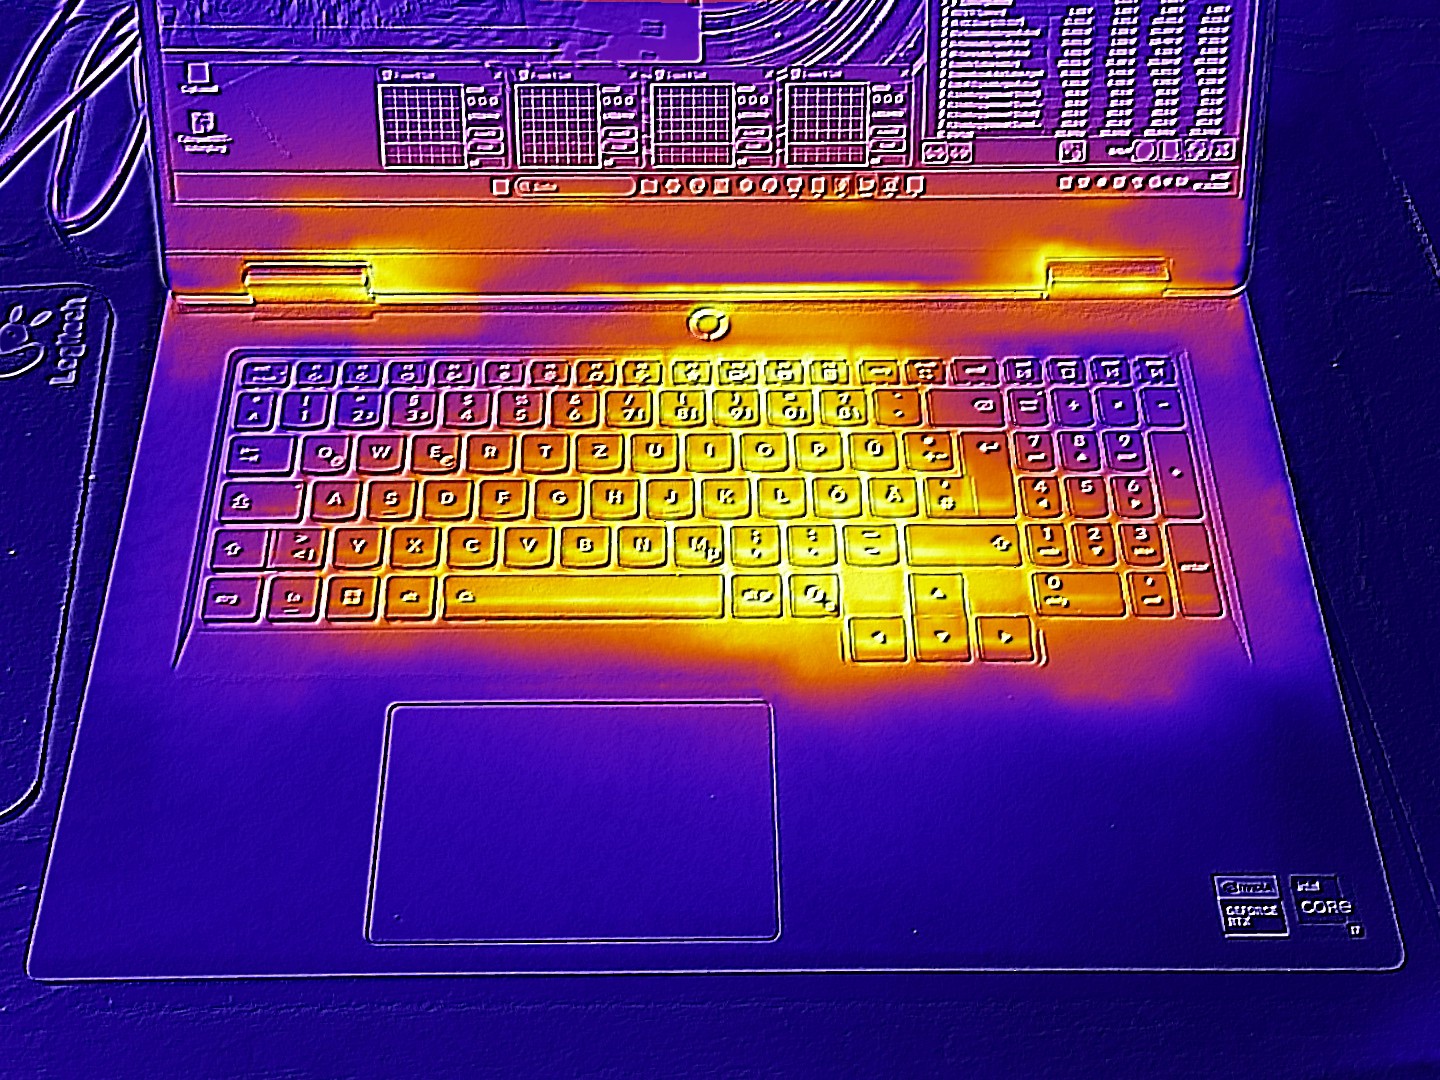
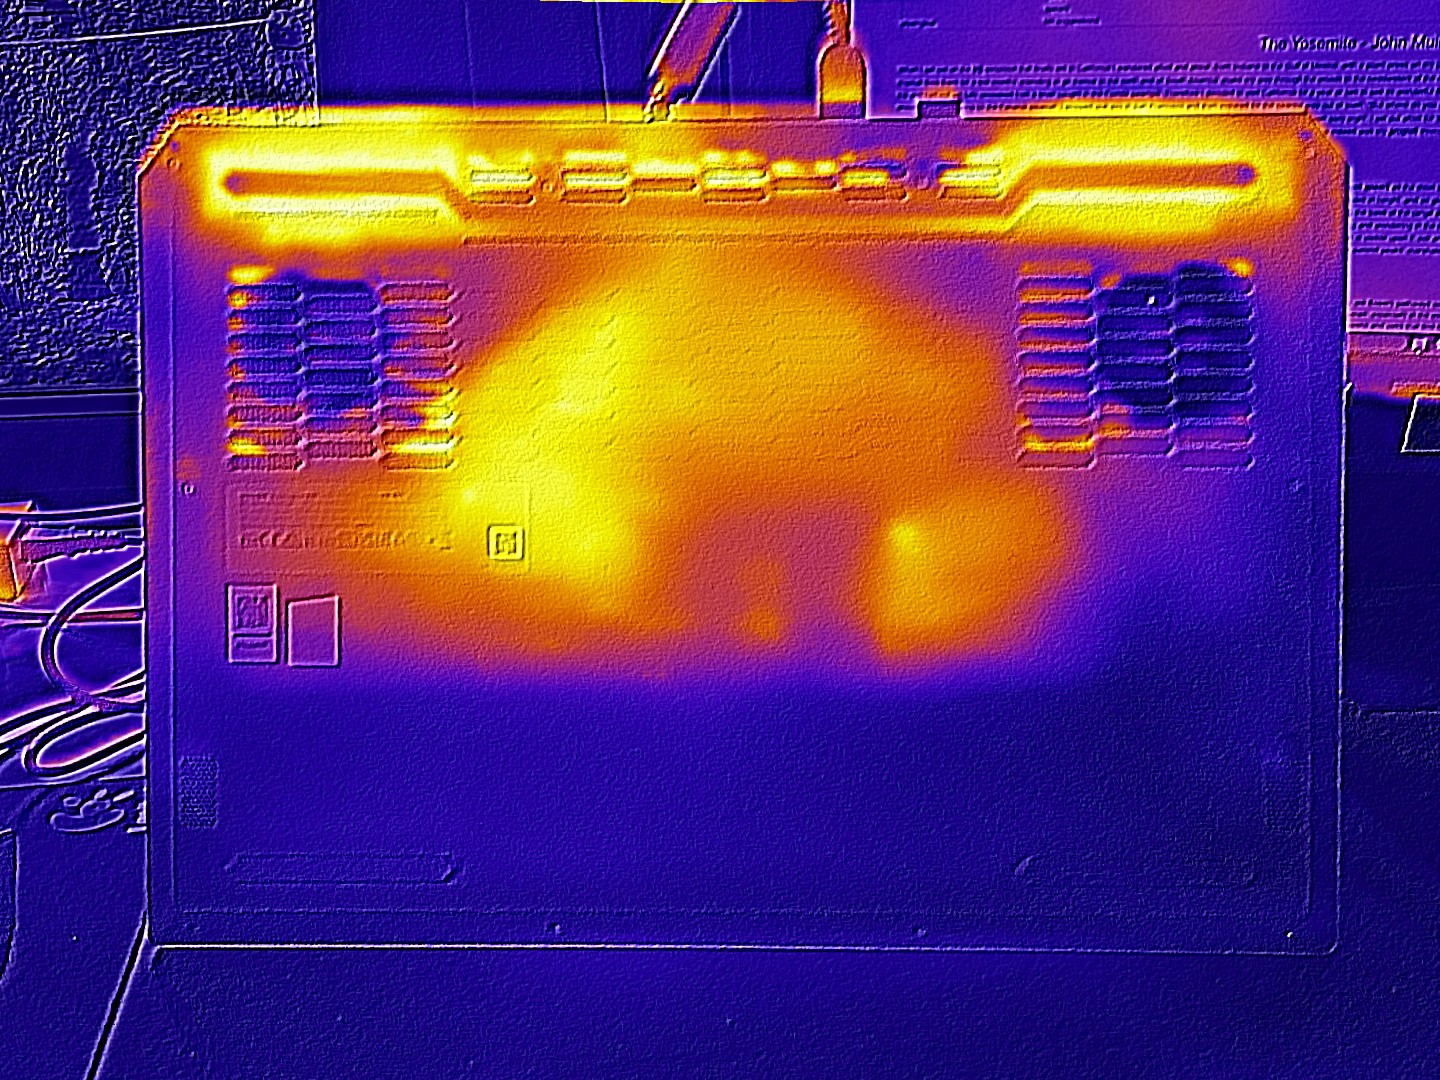
Temperature
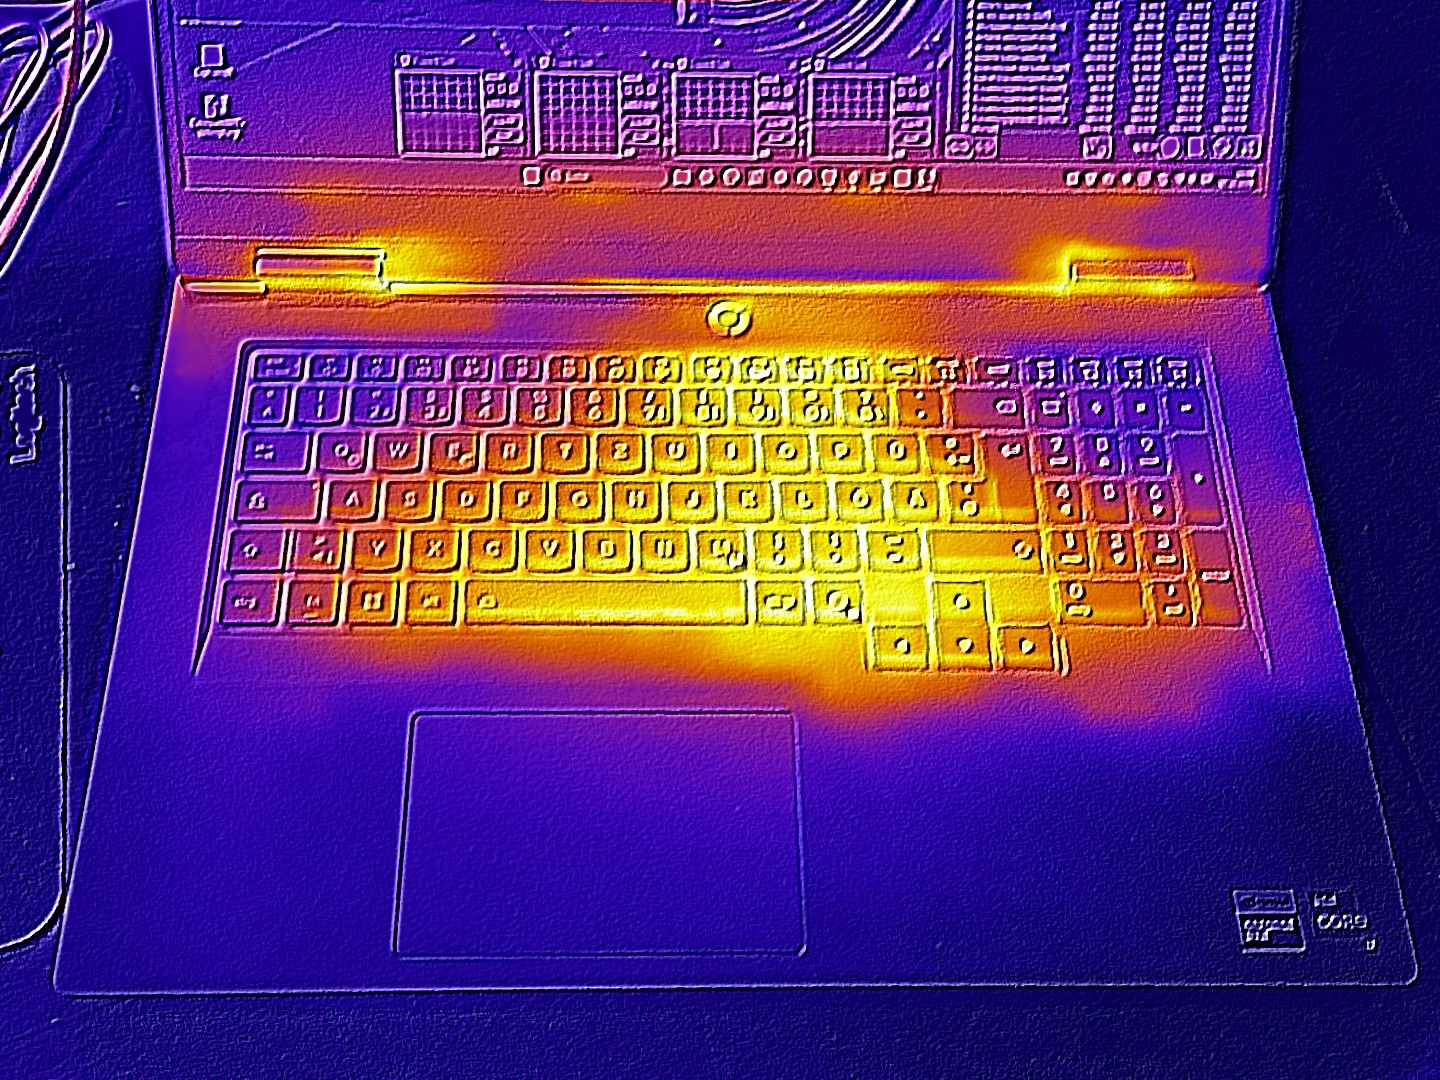
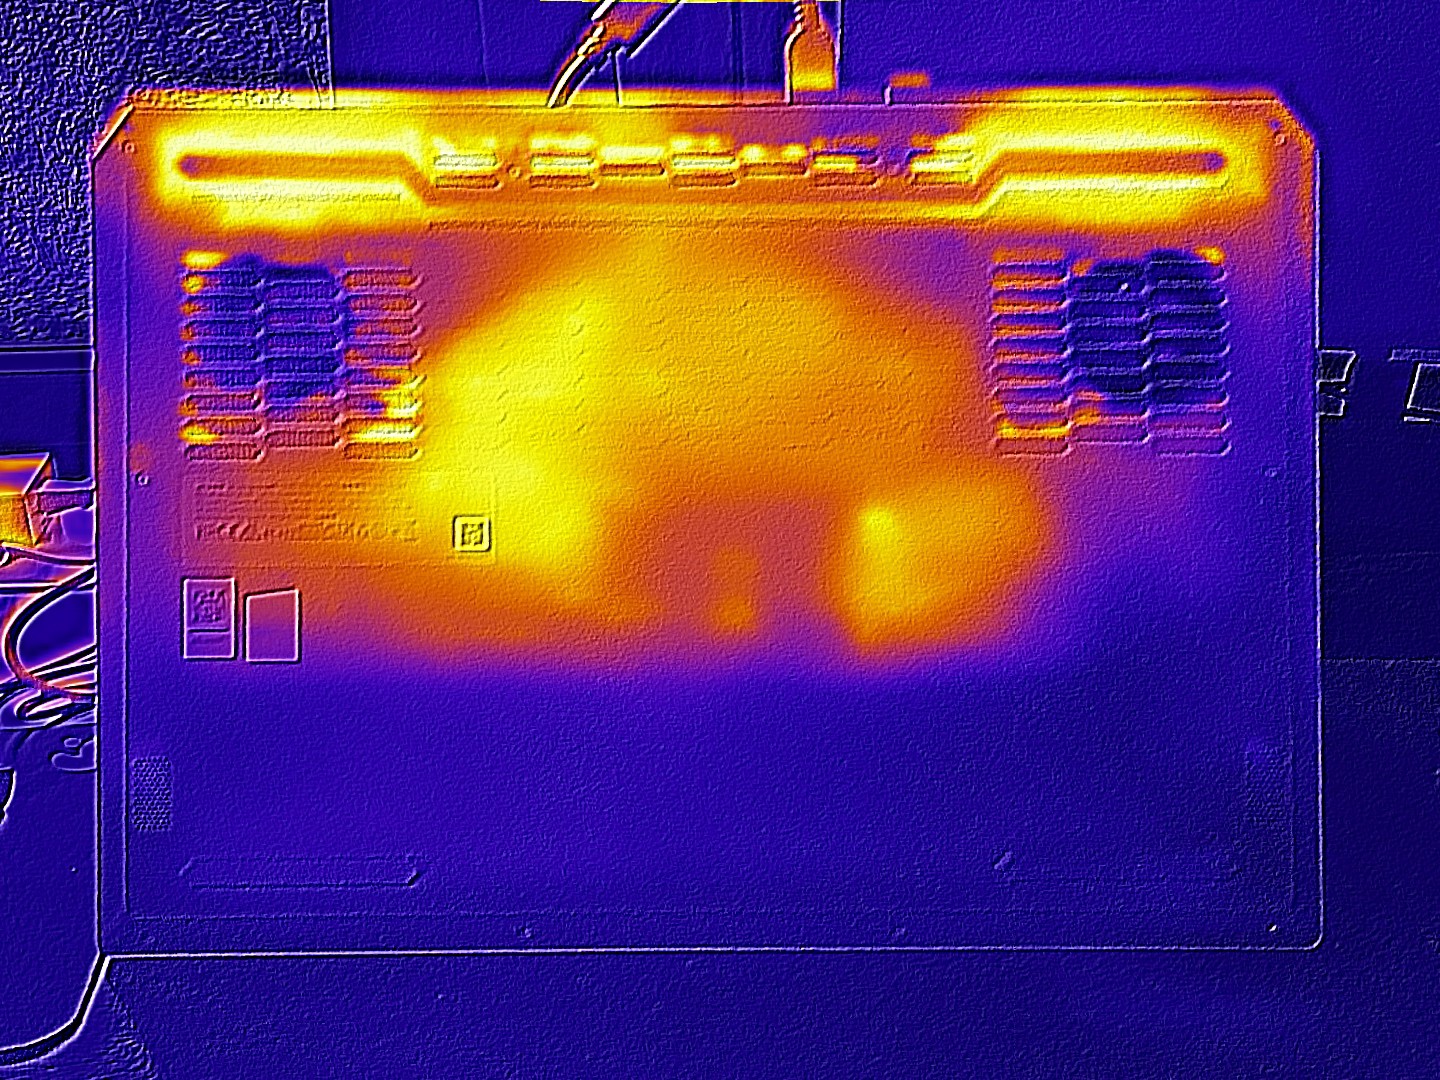
The idle temperatures are also unspectacular, with the case remaining below 30°C most of the time. In 3D mode, the chassis heats up to a maximum of 45°C (top) and 49°C (bottom), which is still within acceptable limits.
(±) The maximum temperature on the upper side is 45 °C / 113 F, compared to the average of 40.4 °C / 105 F, ranging from 21.2 to 68.8 °C for the class Gaming.
(-) The bottom heats up to a maximum of 49 °C / 120 F, compared to the average of 43.2 °C / 110 F
(+) In idle usage, the average temperature for the upper side is 27.2 °C / 81 F, compared to the device average of 33.9 °C / 93 F.
(±) 3: The average temperature for the upper side is 37.4 °C / 99 F, compared to the average of 33.9 °C / 93 F for the class Gaming.
(+) The palmrests and touchpad are cooler than skin temperature with a maximum of 30 °C / 86 F and are therefore cool to the touch.
(±) The average temperature of the palmrest area of similar devices was 28.8 °C / 83.8 F (-1.2 °C / -2.2 F).
| Lenovo LOQ 17IRX10 i7-14700HX, GeForce RTX 5070 Laptop | HP Omen 16-ap0091ng R9 8940HX, GeForce RTX 5060 Laptop | Gigabyte Gaming A16 GA6H i7-13620H, GeForce RTX 5070 Laptop | MSI Crosshair A17 HX D8WGKG R9 8940HX, GeForce RTX 5070 Laptop | Schenker XMG Focus 17 M25 i9-13900HX, GeForce RTX 5070 Ti Laptop | |
|---|---|---|---|---|---|
| Heat | 12% | -8% | -14% | 6% | |
| Maximum Upper Side * (°C) | 45 | 36 20% | 50 -11% | 51 -13% | 41.2 8% |
| Maximum Bottom * (°C) | 49 | 37 24% | 49 -0% | 49 -0% | 48.8 -0% |
| Idle Upper Side * (°C) | 32 | 30 6% | 35 -9% | 40 -25% | 27.6 14% |
| Idle Bottom * (°C) | 31 | 32 -3% | 34 -10% | 36 -16% | 30.1 3% |
* ... smaller is better
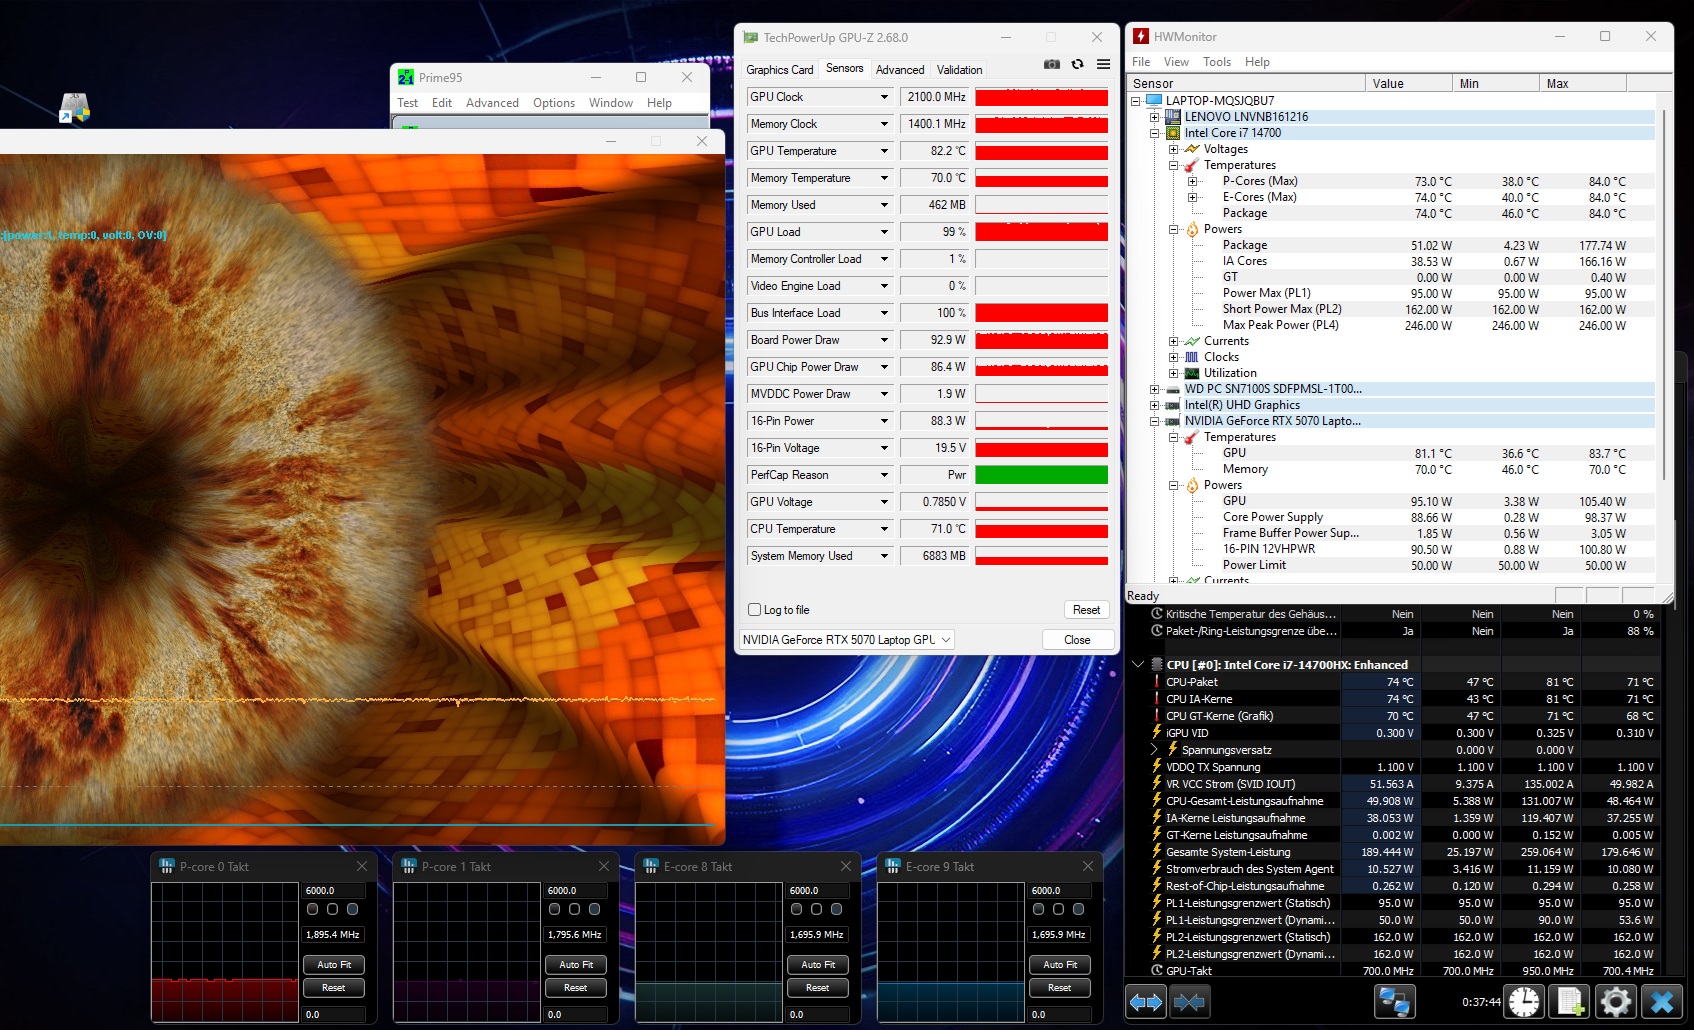
Stress test
In the stress test using the Furmark and Prime95 tools, the processor heated up to around 74 °C – a moderate value, while the graphics card heated up to around 82 °C.
Speakers
As you can see from our audio analysis, the speakers are sometimes significantly weaker than those installed in the Gigabyte Gaming A16. The sound quality is only sufficient for mid-range performance.
Lenovo LOQ 17IRX10 audio analysis
(±) | speaker loudness is average but good (77 dB)
Bass 100 - 315 Hz
(-) | nearly no bass - on average 17.6% lower than median
(±) | linearity of bass is average (8.7% delta to prev. frequency)
Mids 400 - 2000 Hz
(±) | higher mids - on average 5.3% higher than median
(±) | linearity of mids is average (7.4% delta to prev. frequency)
Highs 2 - 16 kHz
(+) | balanced highs - only 2.4% away from median
(+) | highs are linear (5.3% delta to prev. frequency)
Overall 100 - 16.000 Hz
(±) | linearity of overall sound is average (17.4% difference to median)
Compared to same class
» 48% of all tested devices in this class were better, 12% similar, 40% worse
» The best had a delta of 6%, average was 18%, worst was 132%
Compared to all devices tested
» 33% of all tested devices were better, 8% similar, 58% worse
» The best had a delta of 4%, average was 23%, worst was 134%
Gigabyte Gaming A16 GA6H audio analysis
(±) | speaker loudness is average but good (81 dB)
Bass 100 - 315 Hz
(±) | reduced bass - on average 13.3% lower than median
(±) | linearity of bass is average (12.1% delta to prev. frequency)
Mids 400 - 2000 Hz
(+) | balanced mids - only 4.9% away from median
(+) | mids are linear (5.2% delta to prev. frequency)
Highs 2 - 16 kHz
(+) | balanced highs - only 2.2% away from median
(+) | highs are linear (6.4% delta to prev. frequency)
Overall 100 - 16.000 Hz
(+) | overall sound is linear (13.3% difference to median)
Compared to same class
» 19% of all tested devices in this class were better, 5% similar, 76% worse
» The best had a delta of 6%, average was 18%, worst was 132%
Compared to all devices tested
» 14% of all tested devices were better, 3% similar, 83% worse
» The best had a delta of 4%, average was 23%, worst was 134%
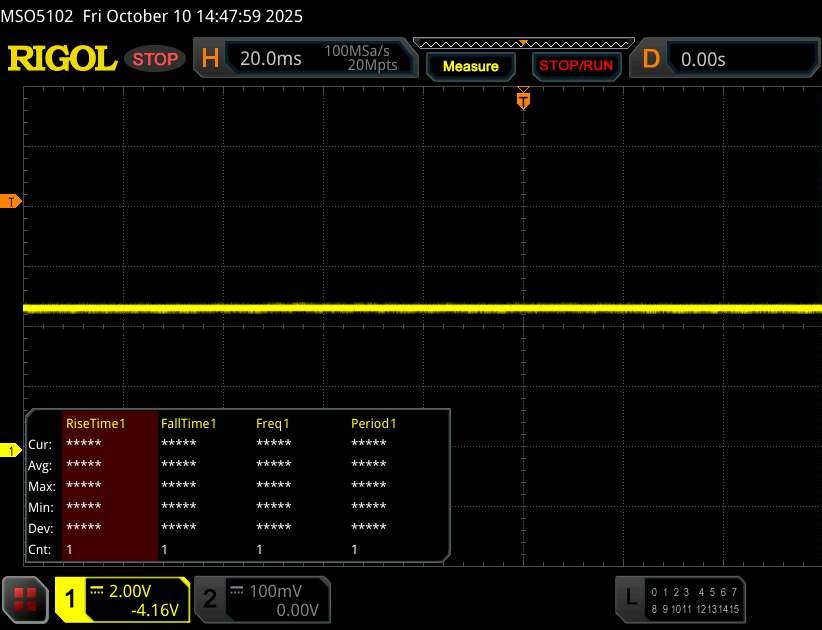
Energy management
Power consumption
Despite the CPU's high PL1/PL2 level and GPU overclocking, power consumption remained consistent. Although we measured 14 to 28 watts in idle mode, it ranged between 158 watts (average 3DMark 06) and 232 watts (maximum stress test) under load.
| Off / Standby | |
| Idle | |
| Load |
|
Key:
min: | |
| Lenovo LOQ 17IRX10 i7-14700HX, GeForce RTX 5070 Laptop | HP Omen 16-ap0091ng R9 8940HX, GeForce RTX 5060 Laptop | Gigabyte Gaming A16 GA6H i7-13620H, GeForce RTX 5070 Laptop | MSI Crosshair A17 HX D8WGKG R9 8940HX, GeForce RTX 5070 Laptop | Schenker XMG Focus 17 M25 i9-13900HX, GeForce RTX 5070 Ti Laptop | Average of class Gaming | |
|---|---|---|---|---|---|---|
| Power Consumption | 25% | 34% | -45% | -0% | 7% | |
| Idle Minimum * (Watt) | 14.4 | 7.8 46% | 9 37% | 32 -122% | 12 17% | 13 ? 10% |
| Idle Average * (Watt) | 17.2 | 8.8 49% | 11 36% | 36 -109% | 17.5 -2% | 18.7 ? -9% |
| Idle Maximum * (Watt) | 28 | 21.5 23% | 23 18% | 47 -68% | 18.1 35% | 24.3 ? 13% |
| Load Average * (Watt) | 158 | 119 25% | 91 42% | 132 16% | 121.1 23% | 110.2 ? 30% |
| Cyberpunk 2077 ultra external monitor * (Watt) | 199.3 | 164.5 17% | 130 35% | 216 -8% | 244 -22% | |
| Cyberpunk 2077 ultra * (Watt) | 203 | 192 5% | 132.5 35% | 222 -9% | 255 -26% | |
| Load Maximum * (Watt) | 232 | 208 10% | 155 33% | 261 -13% | 292.1 -26% | 258 ? -11% |
* ... smaller is better
Power consumption Cyberpunk / stress test
Power consumption with an external monitor
Battery life
At 60 Wh, the LOQ 17's battery isn't particularly powerful - especially considering the competition (70 to 90 Wh). Accordingly, it's unsurprising that the 17-inch device came in last in the Wi-Fi test. Around 3 hours is pretty meager for a device with graphics switching capabilities.
| Lenovo LOQ 17IRX10 i7-14700HX, GeForce RTX 5070 Laptop, 60 Wh | HP Omen 16-ap0091ng R9 8940HX, GeForce RTX 5060 Laptop, 70 Wh | Gigabyte Gaming A16 GA6H i7-13620H, GeForce RTX 5070 Laptop, 76 Wh | MSI Crosshair A17 HX D8WGKG R9 8940HX, GeForce RTX 5070 Laptop, 90 Wh | Schenker XMG Focus 17 M25 i9-13900HX, GeForce RTX 5070 Ti Laptop, 73 Wh | Average of class Gaming | |
|---|---|---|---|---|---|---|
| Battery runtime | 61% | 148% | 42% | 87% | 131% | |
| WiFi v1.3 (h) | 3.1 | 5 61% | 7.7 148% | 4.4 42% | 5.8 87% | 7.15 ? 131% |
| H.264 (h) | 5.1 | 8.64 ? | ||||
| Load (h) | 1.3 | 1.502 ? |
Notebookcheck overall rating
Apart from the GPU performance, which benefits from the OC option, Lenovo's LOQ 17 delivers neither top nor peak performance in any category. However, being one of the more affordable gaming laptops with an RTX 5070 makes it a solid choice.
Lenovo LOQ 17IRX10
- 10/10/2025 v8
Florian Glaser
 Total Sustainability Score:
 Possible alternatives compared
Image | Model / Review | Price | Weight | Height | Display |
|---|---|---|---|---|---|
1. 79.8%  | Lenovo LOQ 17IRX10 Intel Core i7-14700HX ⎘ NVIDIA GeForce RTX 5070 Laptop ⎘ 16 GB Memory, 1024 GB SSD | Amazon: List Price: 1500 EUR | 2.9 kg | 25 mm | 17.30" 1920x1080 127 PPI IPS |
2. 86.6%  | Lenovo Legion 7 16IAX10 Intel Core Ultra 7 255HX ⎘ NVIDIA GeForce RTX 5060 Laptop ⎘ 32 GB Memory, 1024 GB SSD | Amazon: List Price: 1650 USD | 2 kg | 17.9 mm | 16.00" 2560x1600 189 PPI OLED |
3. 79.6%  | MSI Crosshair A17 HX D8WGKG AMD Ryzen 9 8940HX ⎘ NVIDIA GeForce RTX 5070 Laptop ⎘ 32 GB Memory, 1024 GB SSD | Amazon: List Price: 2000 EUR | 2.9 kg | 29.7 mm | 17.00" 2560x1600 178 PPI IPS |
4. 86.2%  | Schenker XMG Core 16 M25 AMD Ryzen AI 9 HX 370 ⎘ NVIDIA GeForce RTX 5070 Laptop ⎘ 64 GB Memory, 2048 GB SSD | Amazon: List Price: 2100€ | 2.1 kg | 23 mm | 16.00" 2560x1600 189 PPI IPS |
5. 82.5%  | Schenker XMG Focus 17 M25 Intel Core i9-13900HX ⎘ NVIDIA GeForce RTX 5070 Ti Laptop ⎘ 32 GB Memory, 500 GB NVMe | Amazon: List Price: 1990€ | 2.8 kg | 28.5 mm | 17.30" 2560x1440 170 PPI IPS |
Transparency
The selection of devices to be reviewed is made by our editorial team. The test sample was provided to the author as a loan by the manufacturer or retailer for the purpose of this review. The lender had no influence on this review, nor did the manufacturer receive a copy of this review before publication. There was no obligation to publish this review. As an independent media company, Notebookcheck is not subjected to the authority of manufacturers, retailers or publishers.
This is how Notebookcheck is testing
Every year, Notebookcheck independently reviews hundreds of laptops and smartphones using standardized procedures to ensure that all results are comparable. We have continuously developed our test methods for around 20 years and set industry standards in the process. In our test labs, high-quality measuring equipment is utilized by experienced technicians and editors. These tests involve a multi-stage validation process. Our complex rating system is based on hundreds of well-founded measurements and benchmarks, which maintains objectivity. Further information on our test methods can be found here.

