Verdict - The XMG Focus 17 offers a high performance with some compromises
With the new Focus 17 M25, XMG is clearly aiming to offer the highest possible performance at the lowest possible price. To achieve this, the new GeForce RTX 5070 Ti laptop GPU (12 GB of VRAM) in the fastest 140-watt variant is combined with the older Core i9-13900HX. However, its performance is still sufficient, especially in gaming. This makes playing games at native QHD resolution possible without any issues. When calling on full power, the fans do get very loud, but that's no different to the competition. Nevertheless, the cooling unit remains very quiet in everyday use, and the extensive energy profiles allow you to configure a quiet system without a negative impact on performance.
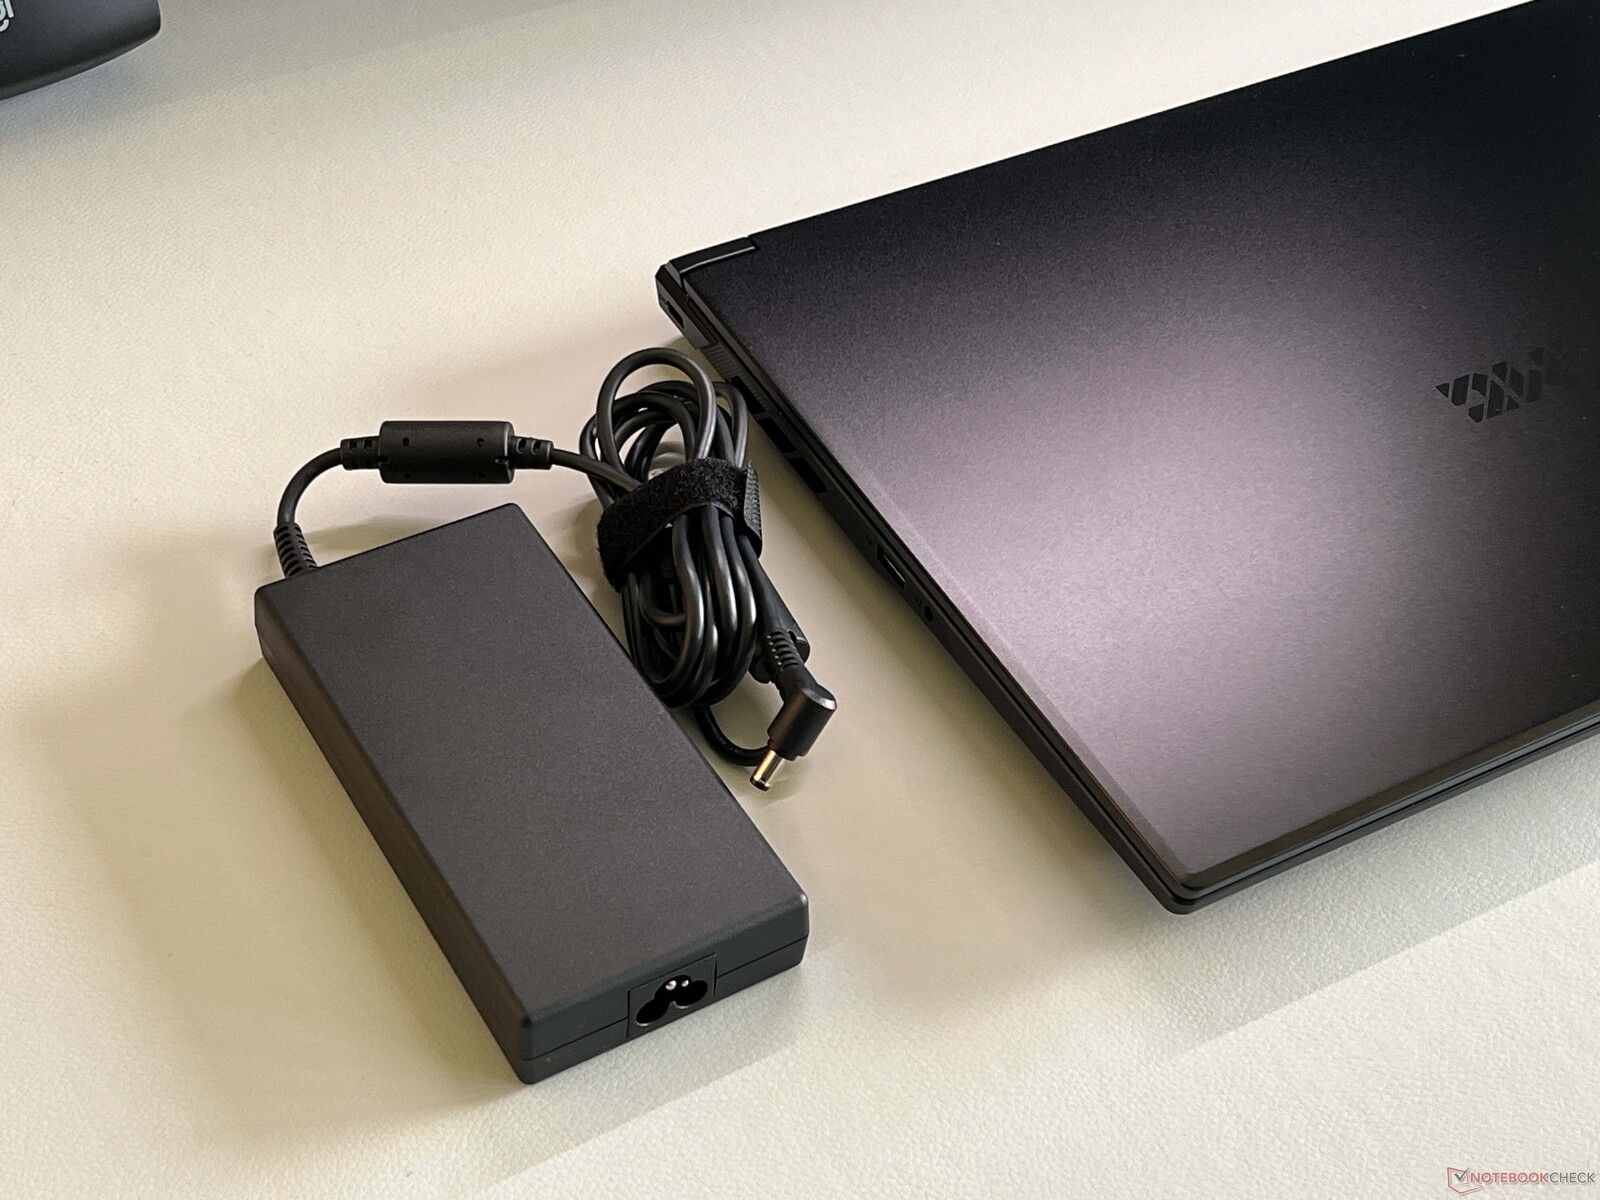
The matte 240 Hz IPS display is also well-suited for gaming. Unfortunately, it's still a 16:9 screen that struggles to match the brightness of its competitors. Additional compromises include the lack of Thunderbolt/USB 4.0 and Advanced Optimus, but these are manageable. The speakers are also quite weak, and the 230-watt power supply is borderline undersized.
All in all, you get a fast gaming machine at an excellent price, and with 12 GB of VRAM, the GPU is also more future-proof than, for example, the standard RTX 5070 laptop GPU.
Pros
Cons
Price and availability
The new XMG Focus 17 M25 can be ordered from Bestware starting at $1,849 - around $2,100 at the exchange rate at the time of review.
With the new Focus 17 M25, XMG is offering a 17-inch gaming laptop that aims to deliver maximum performance at a low price. The starting price for the Core i9-13900HX, 16 GB of RAM, a 1 TB SSD, and the new GeForce RTX 5070 Ti laptop GPU (140-watt) is €1,849 ($2,100), with our 32 GB of RAM, Wi-Fi 7, and Windows 11 Home review configuration coming in at €1,990 ($2,300).
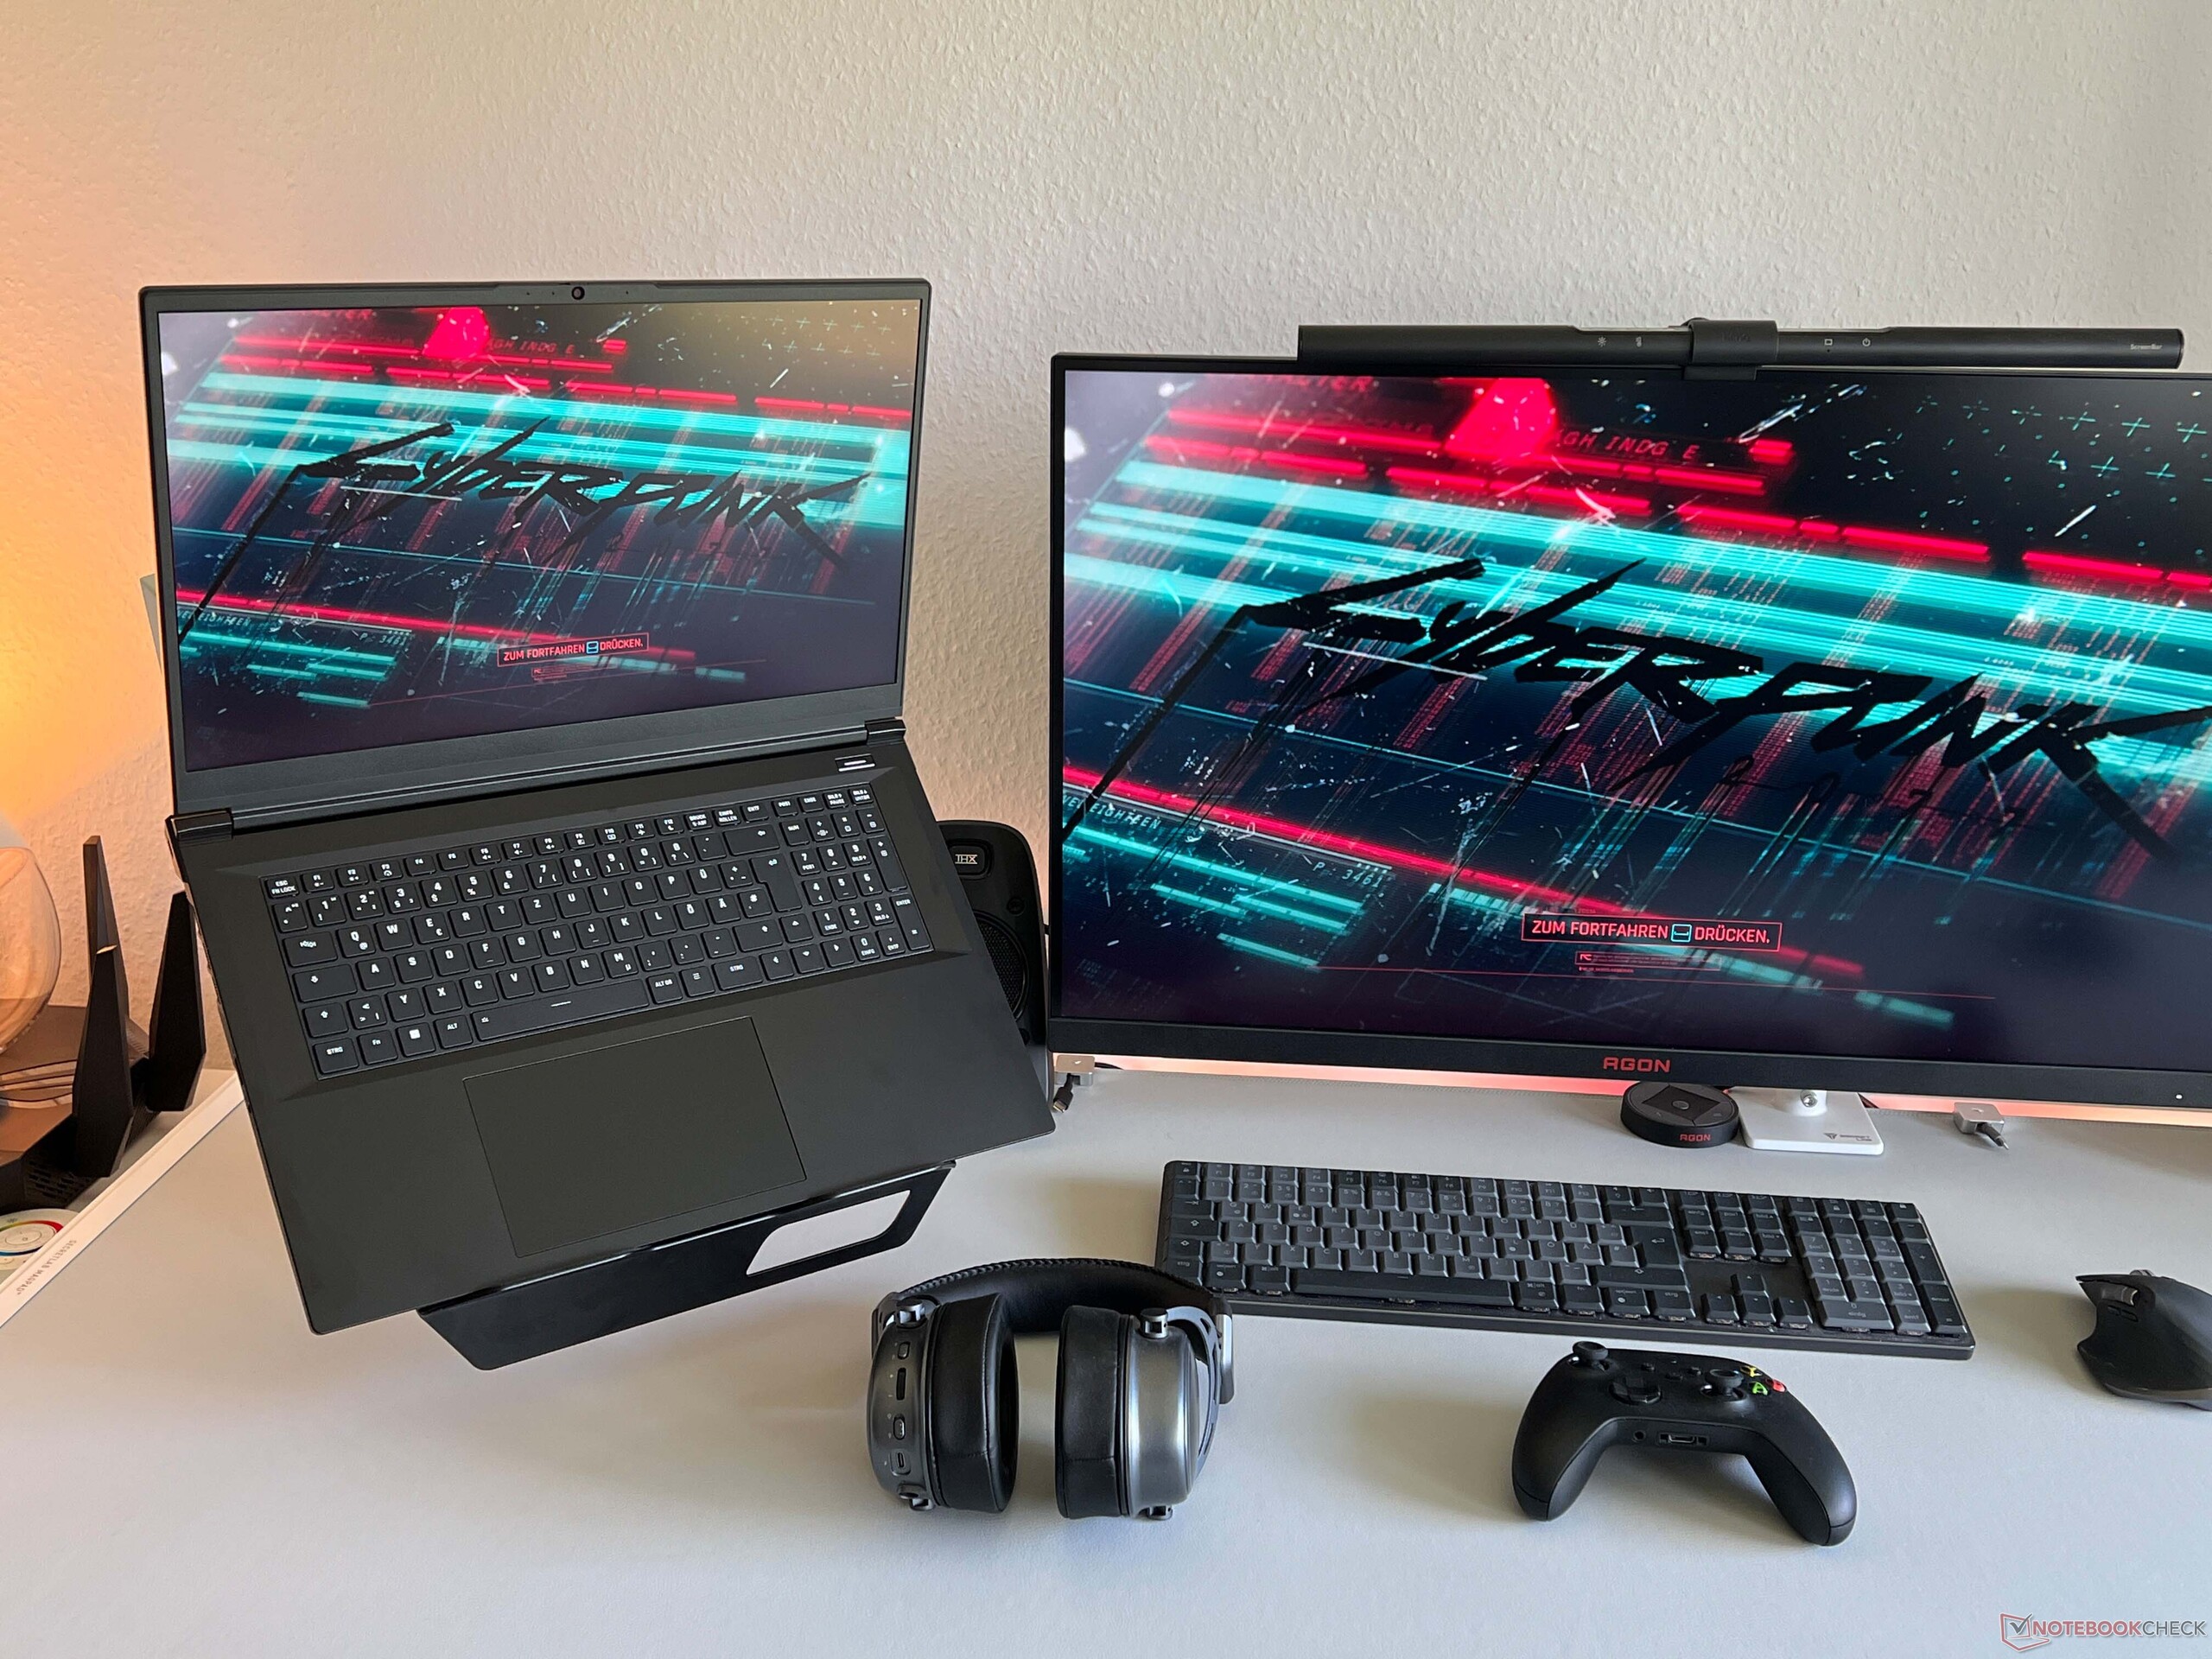
There are hardly any real 17-inch competitors, because the MSI Vector 17 HX with the RTX 5070 Ti is currently available for around €3,100 ($3,600). There are several comparable devices in the 16-inch segment, but this is also an area where the Focus 17 enjoys a price advantage.
Specifications
Case & features
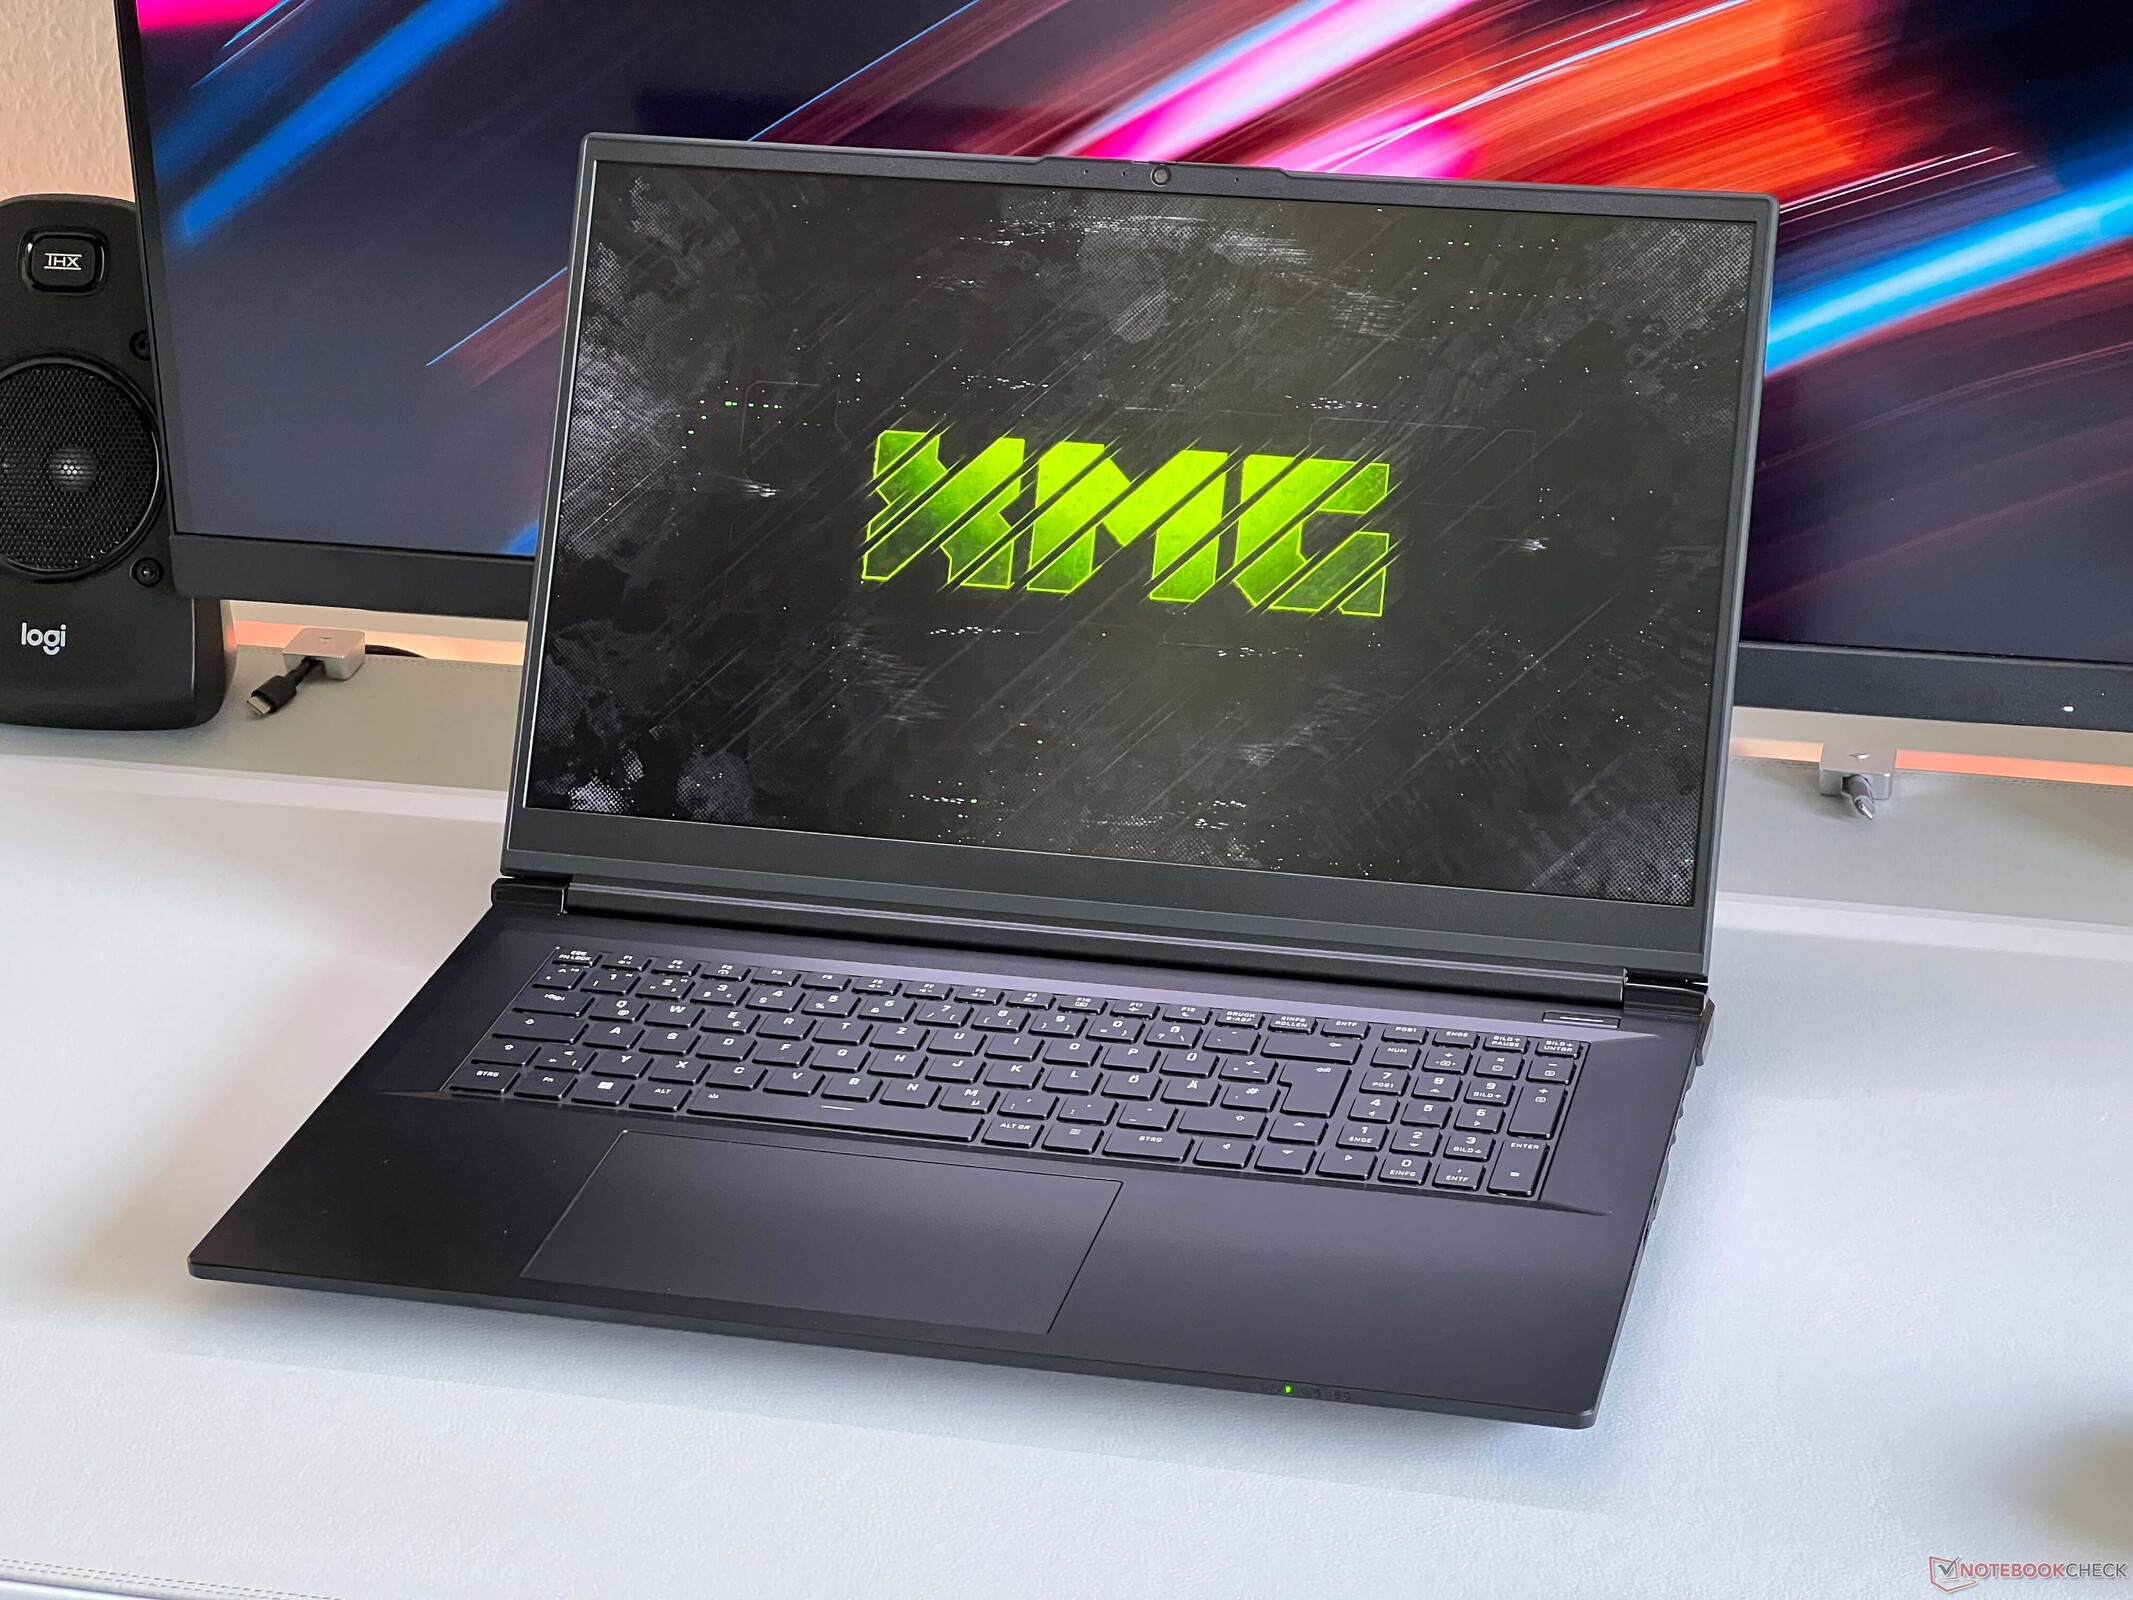
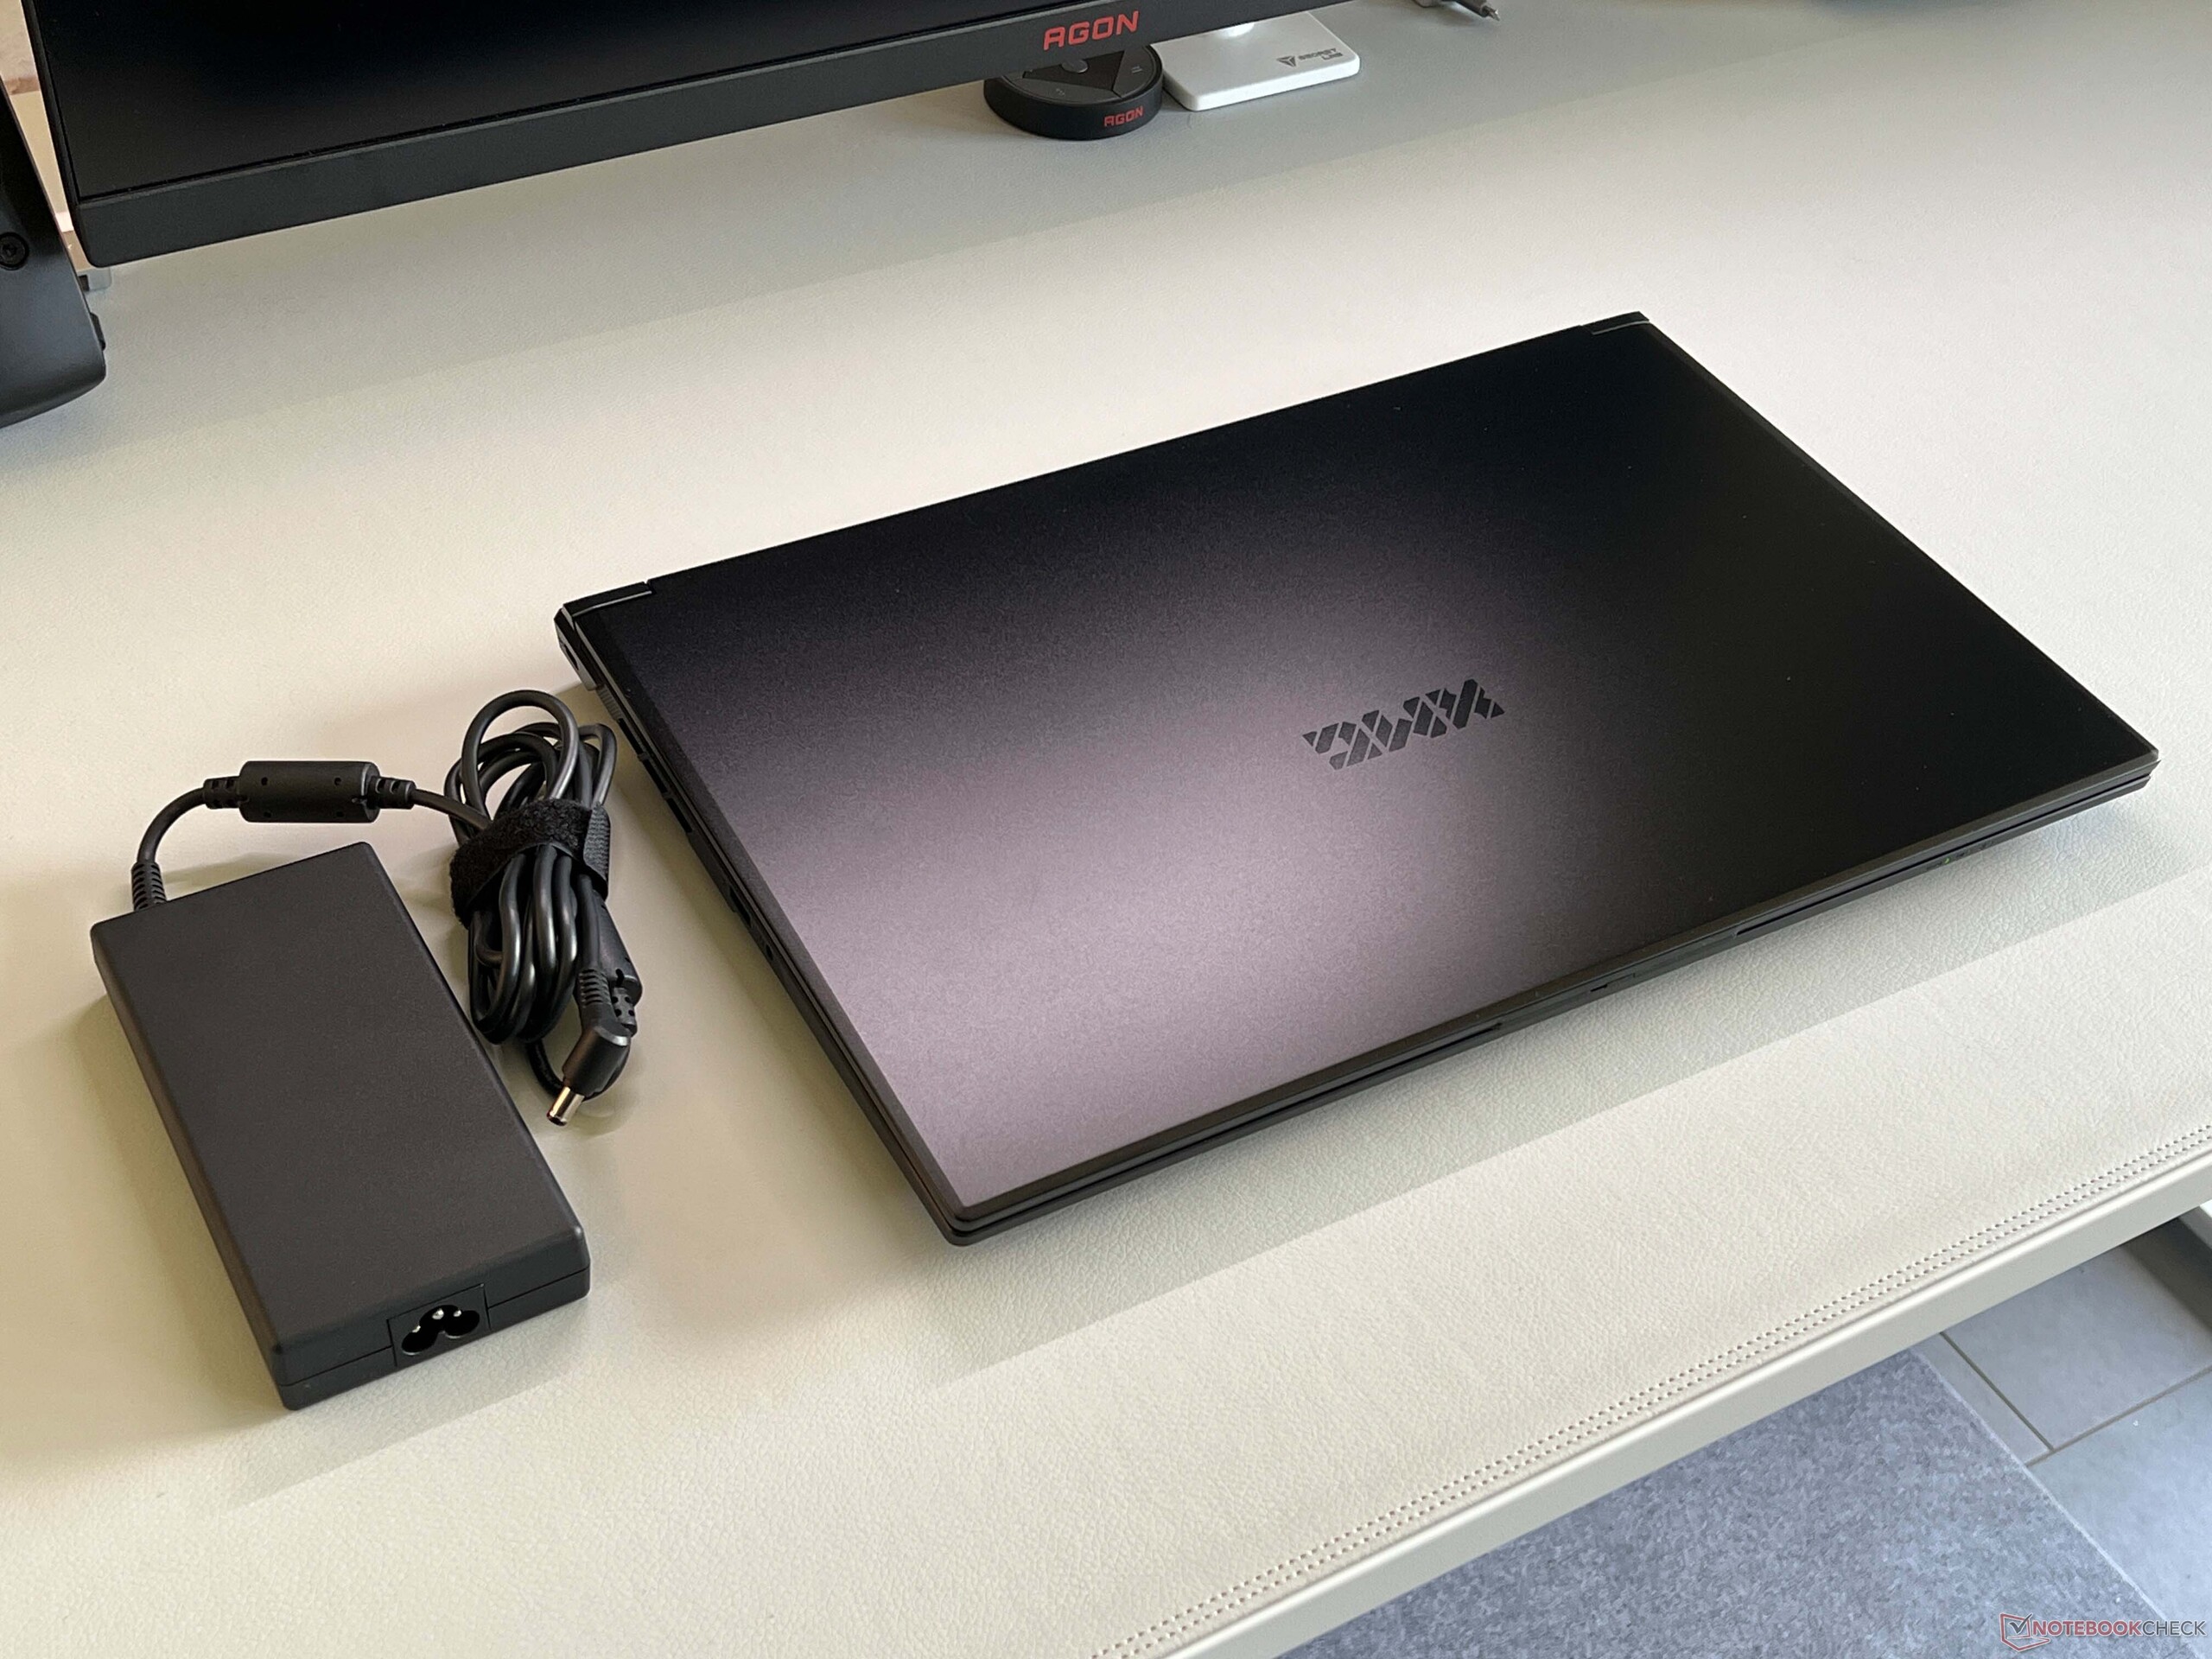
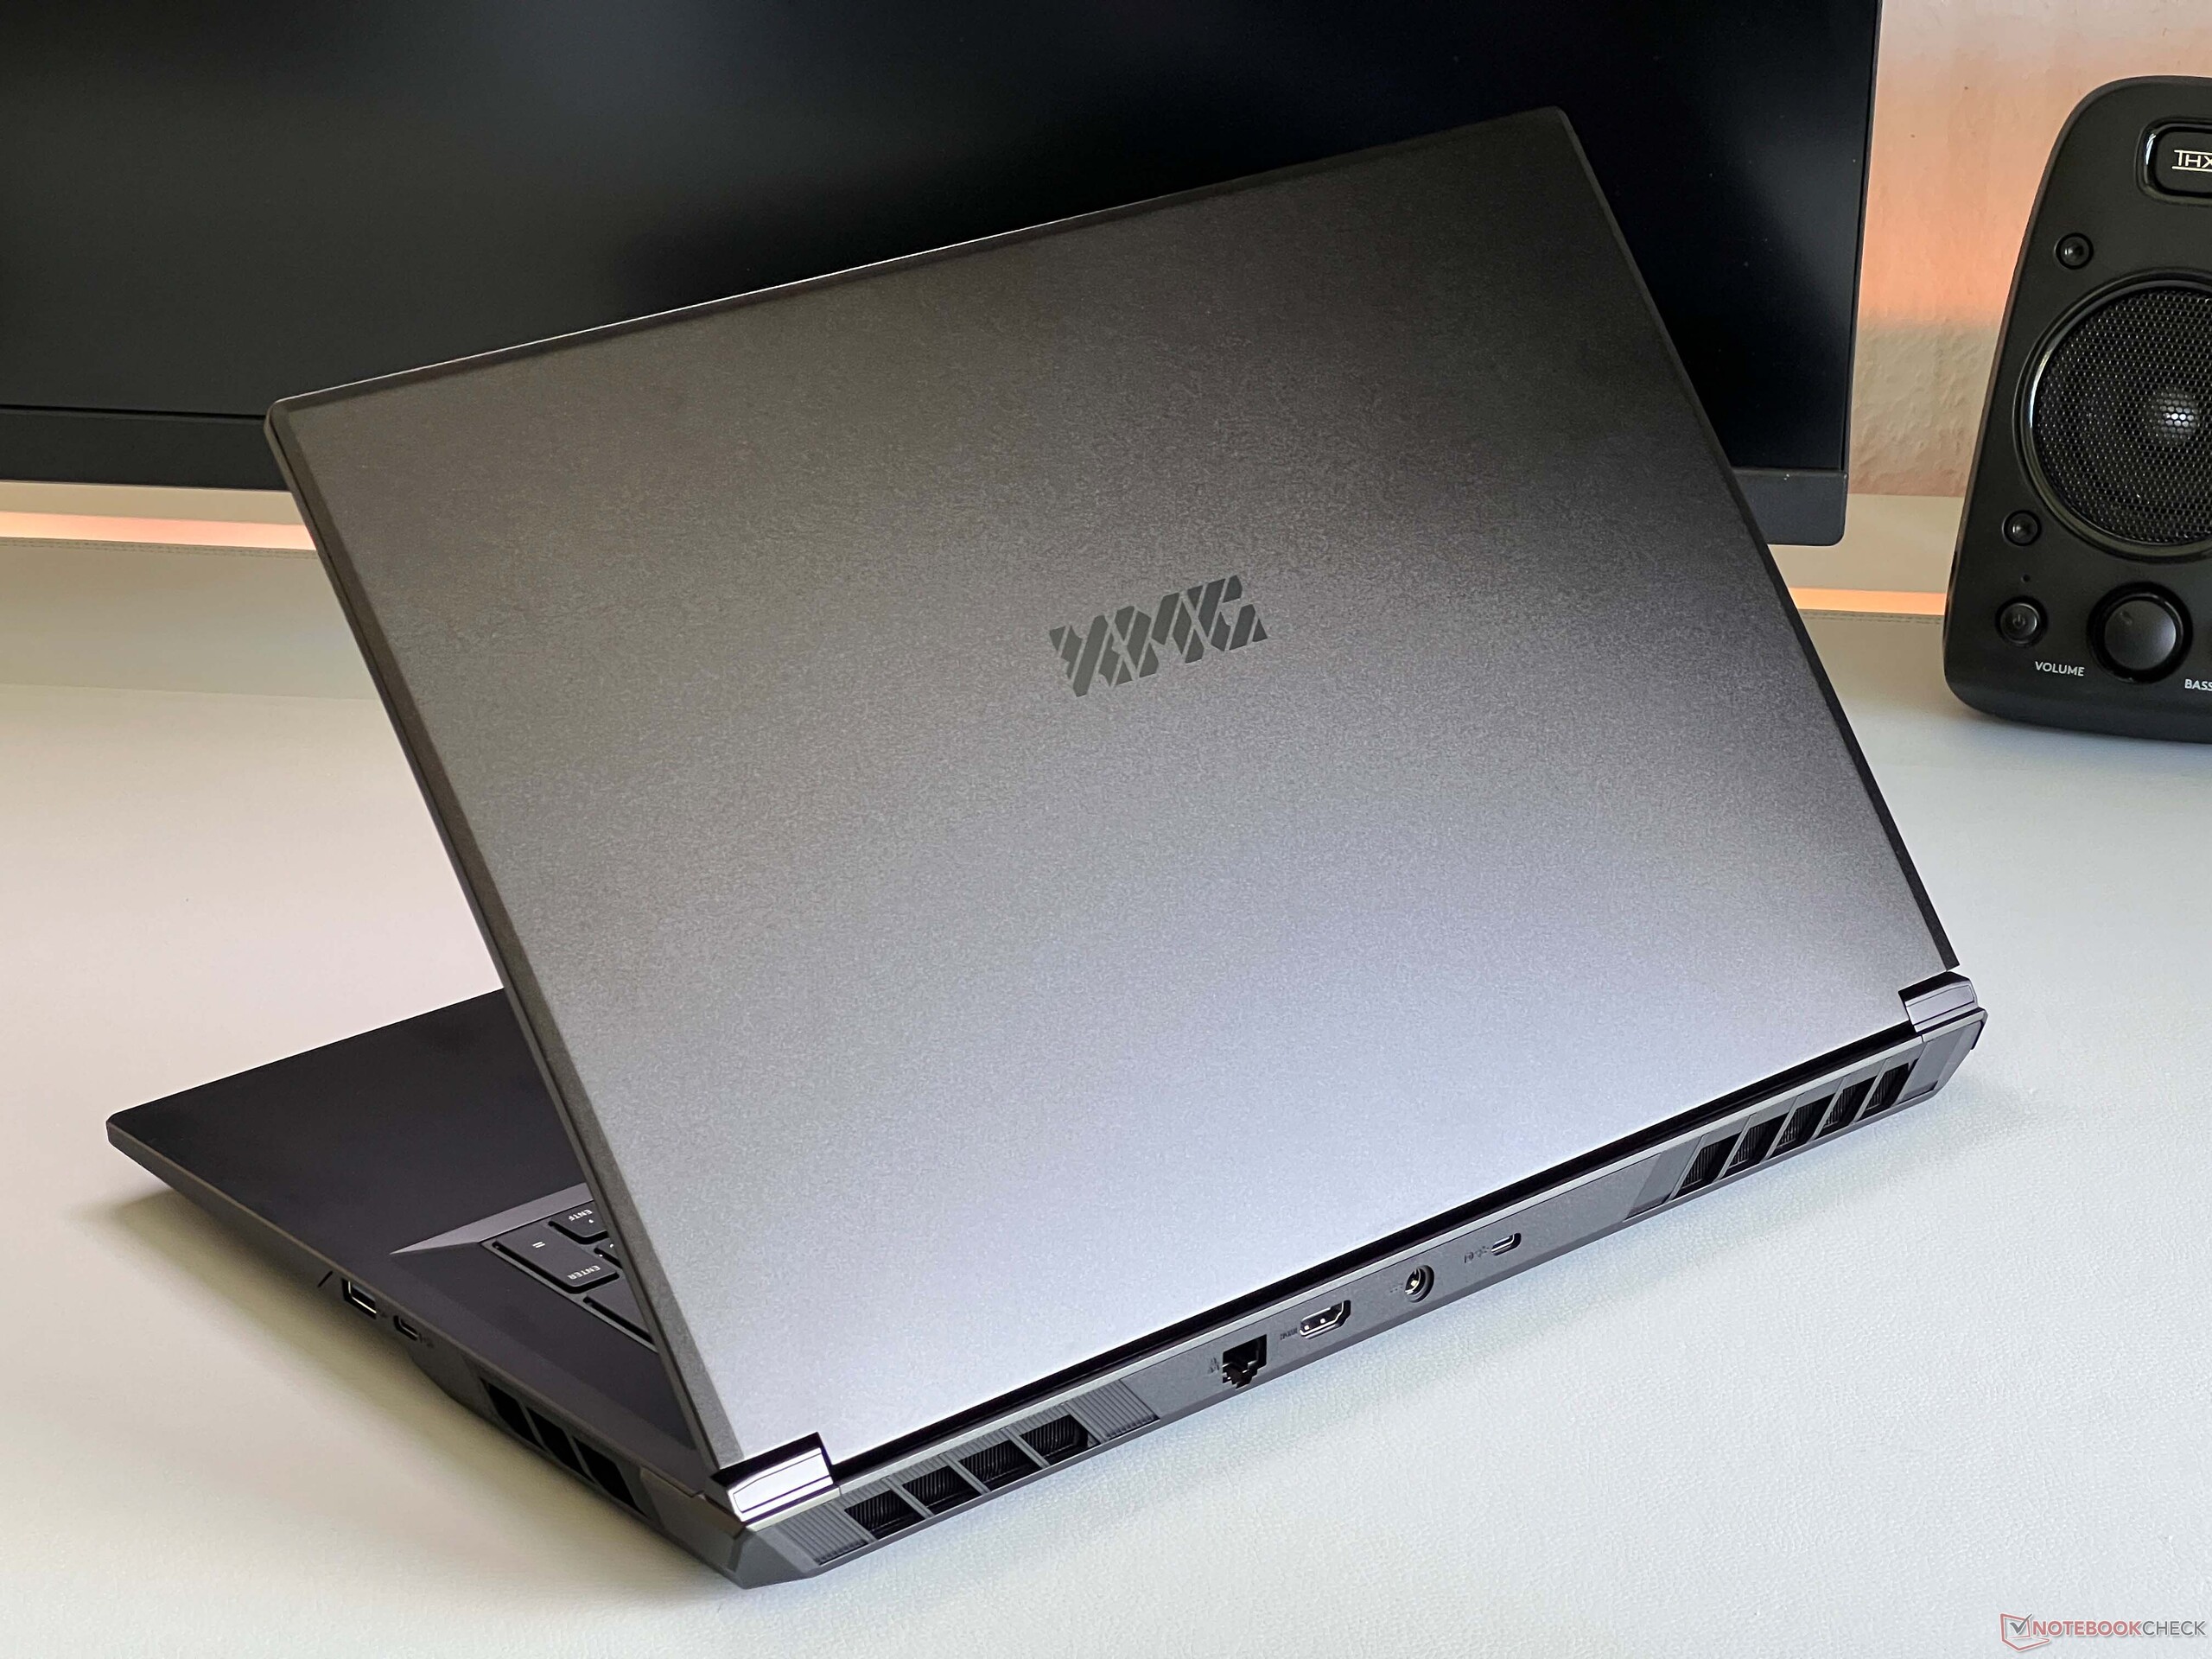
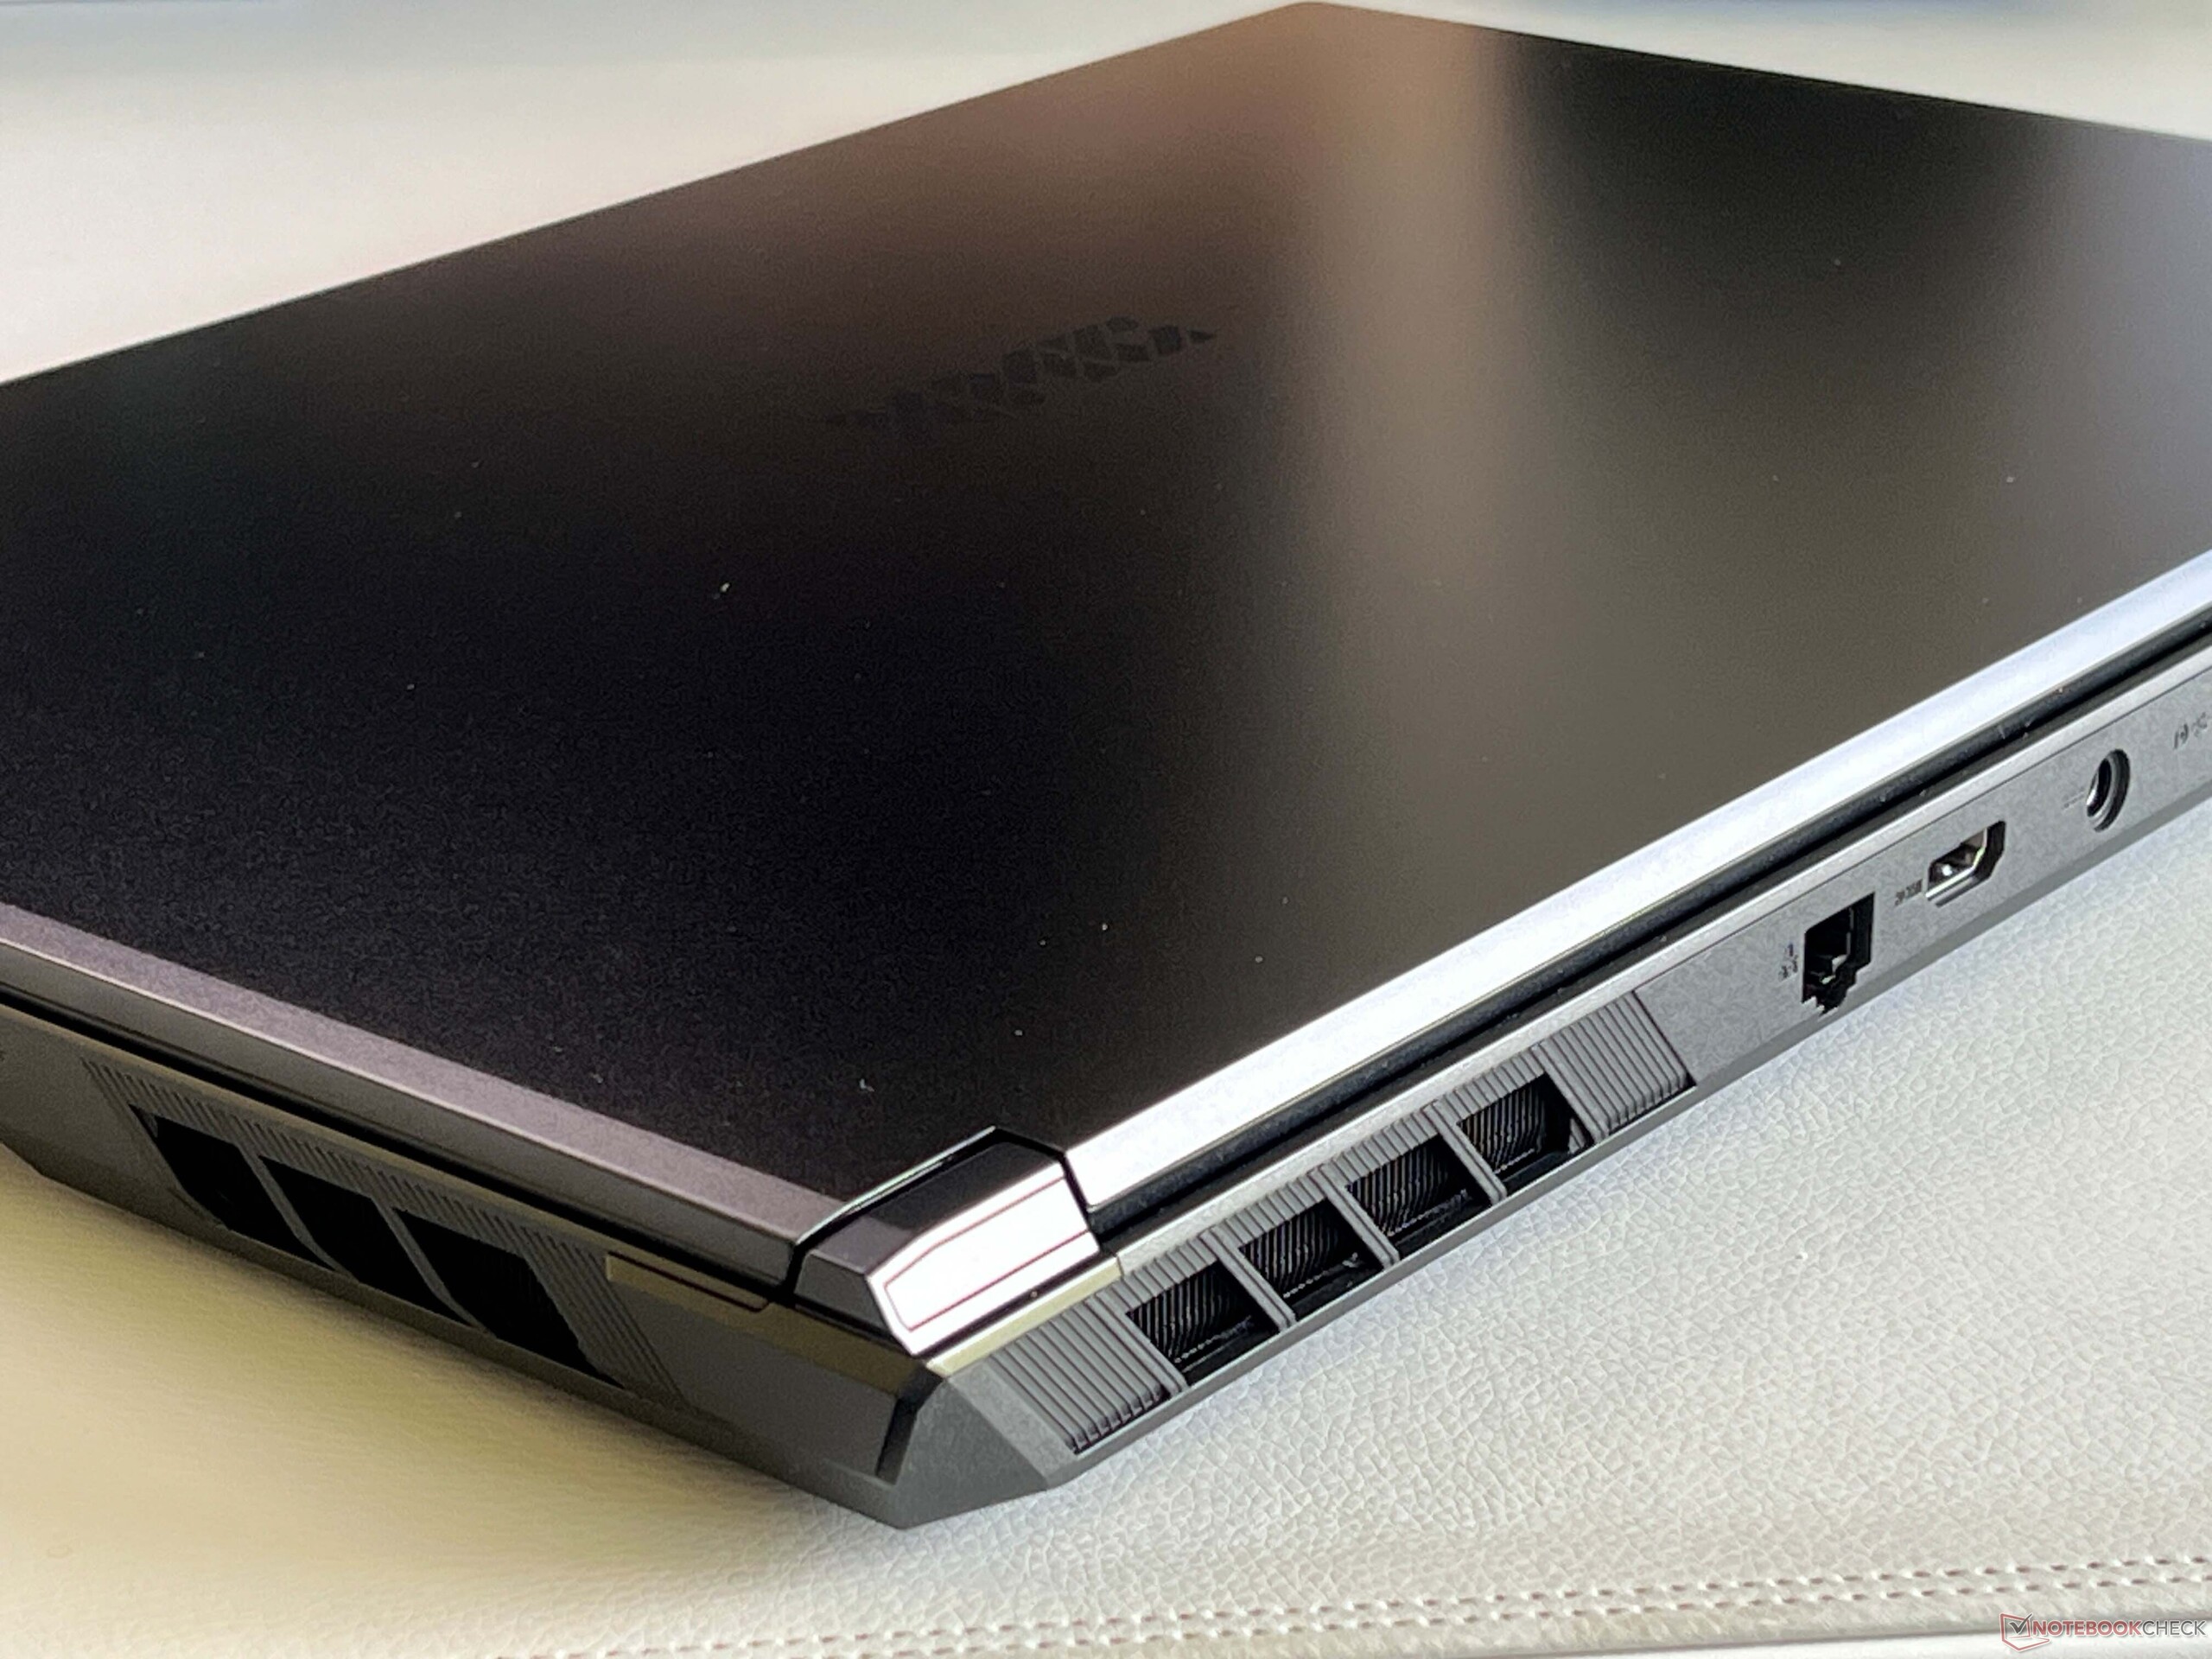
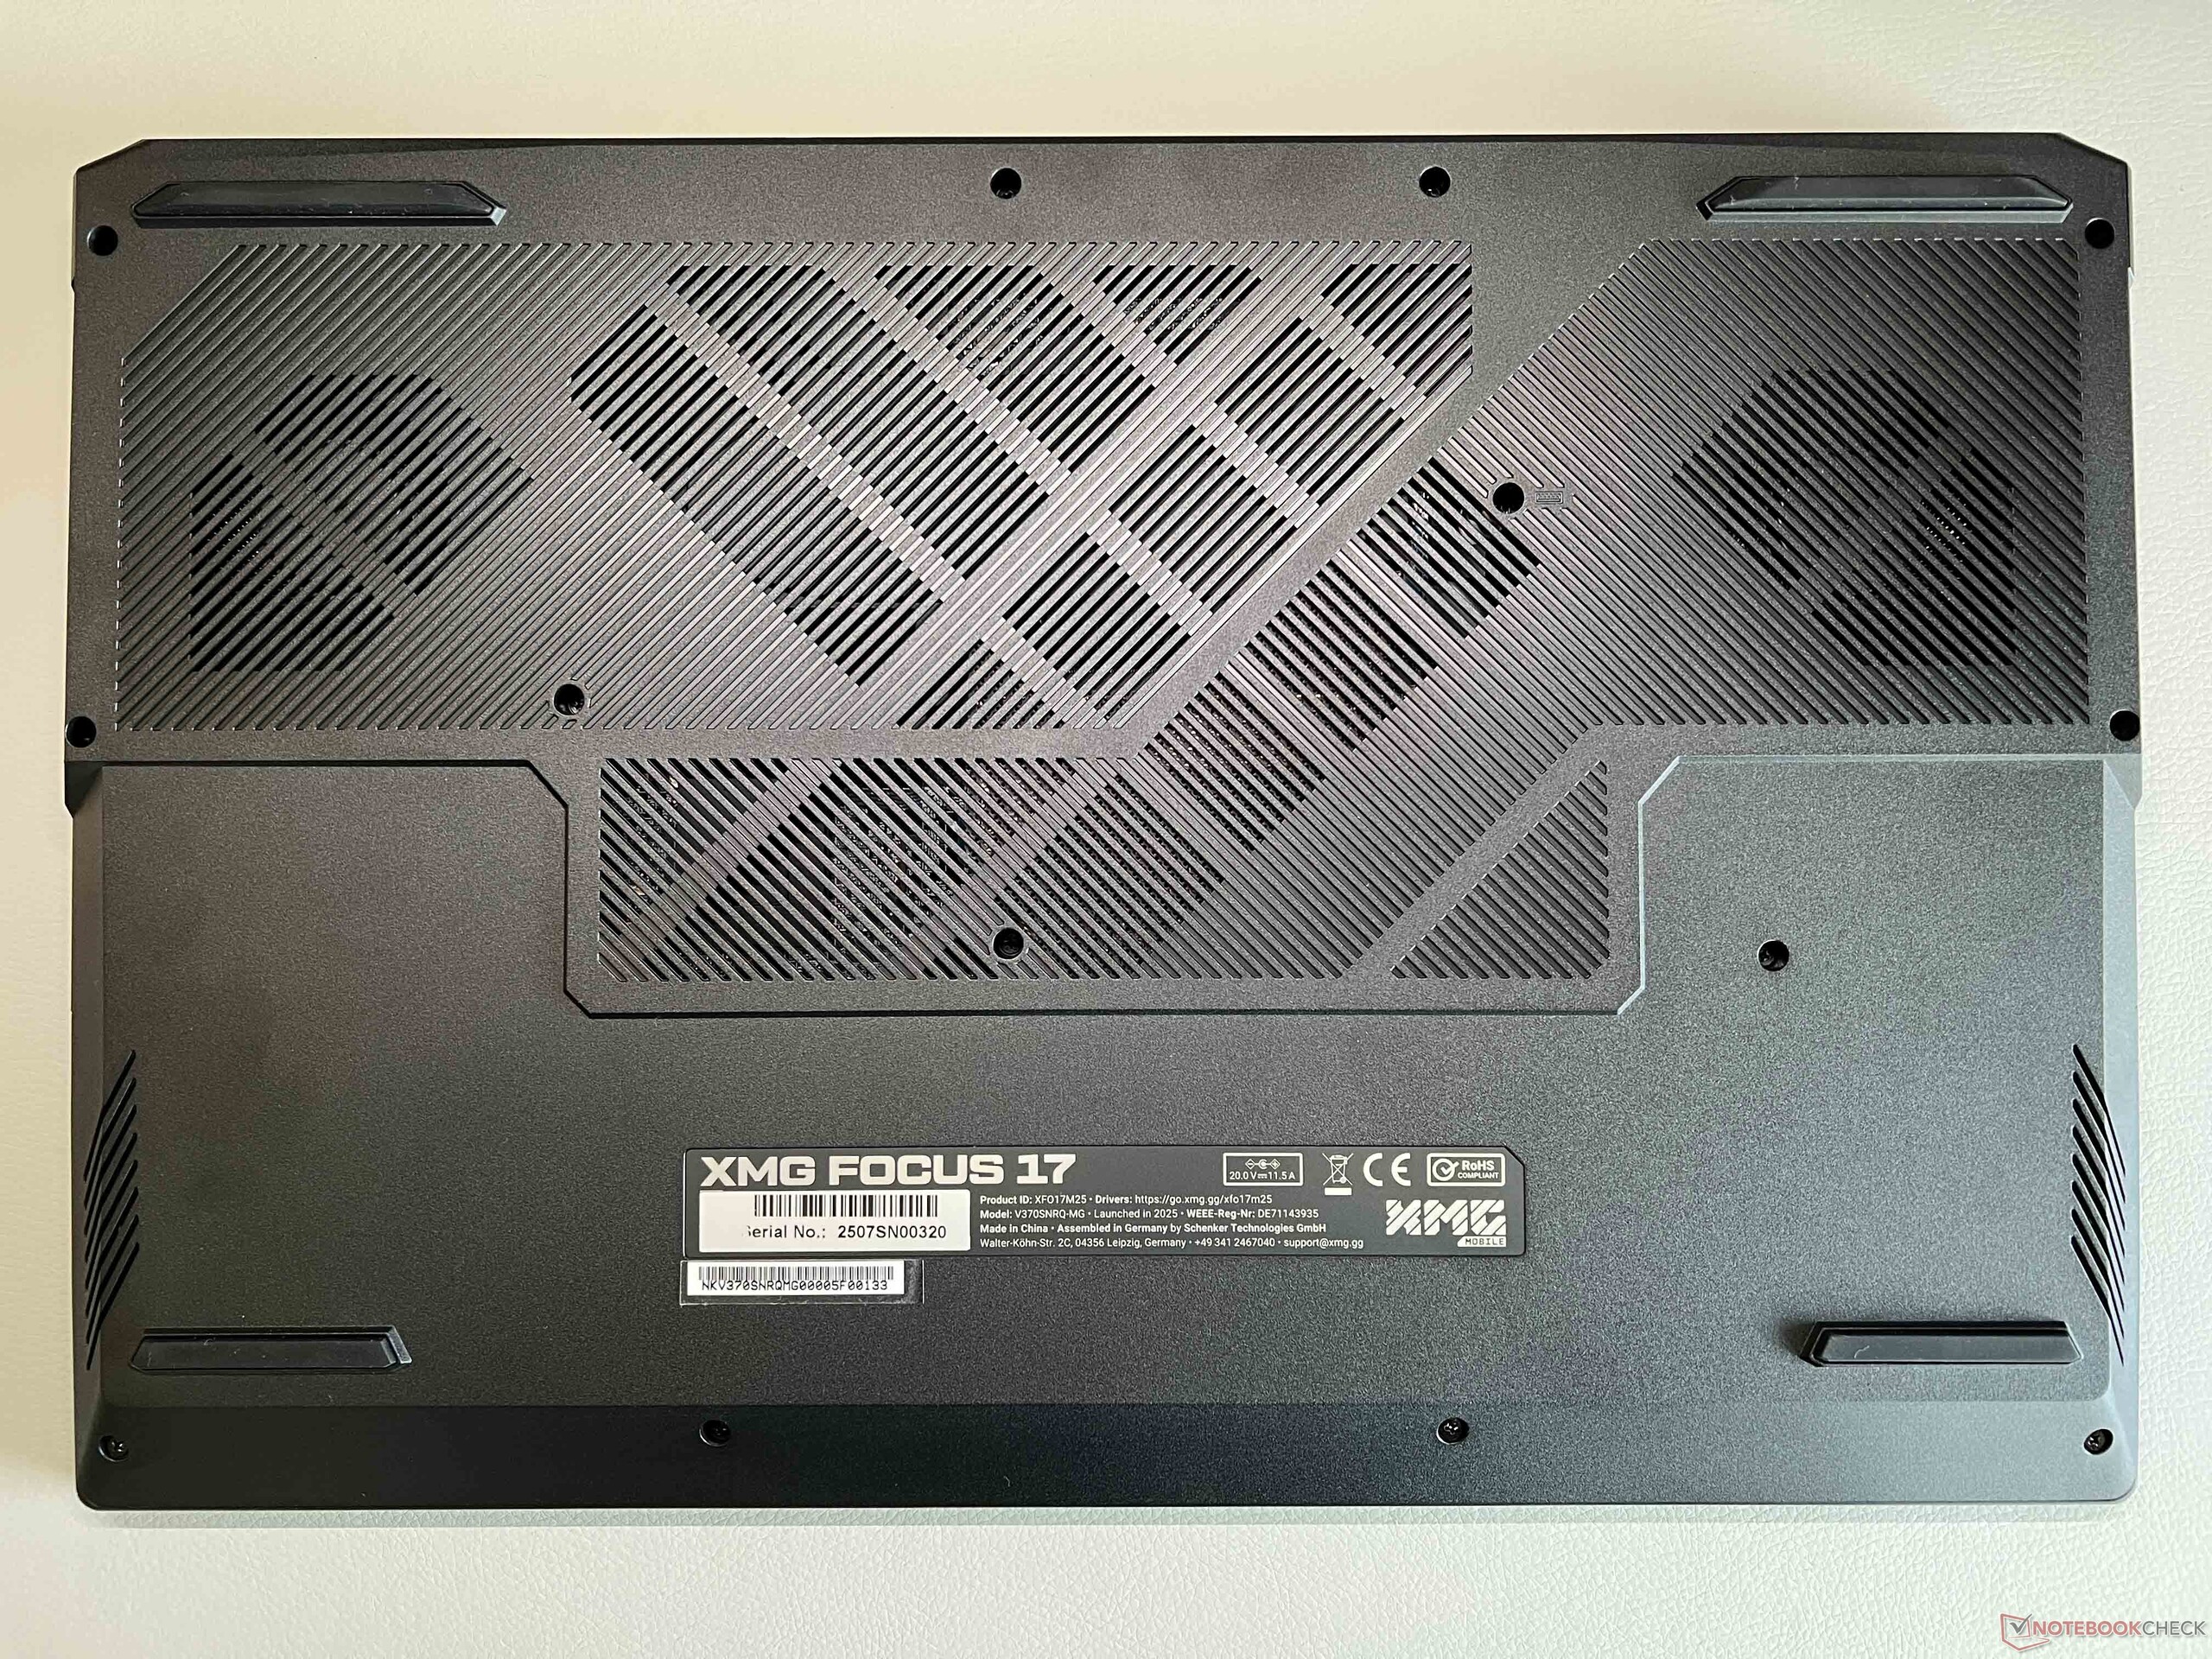
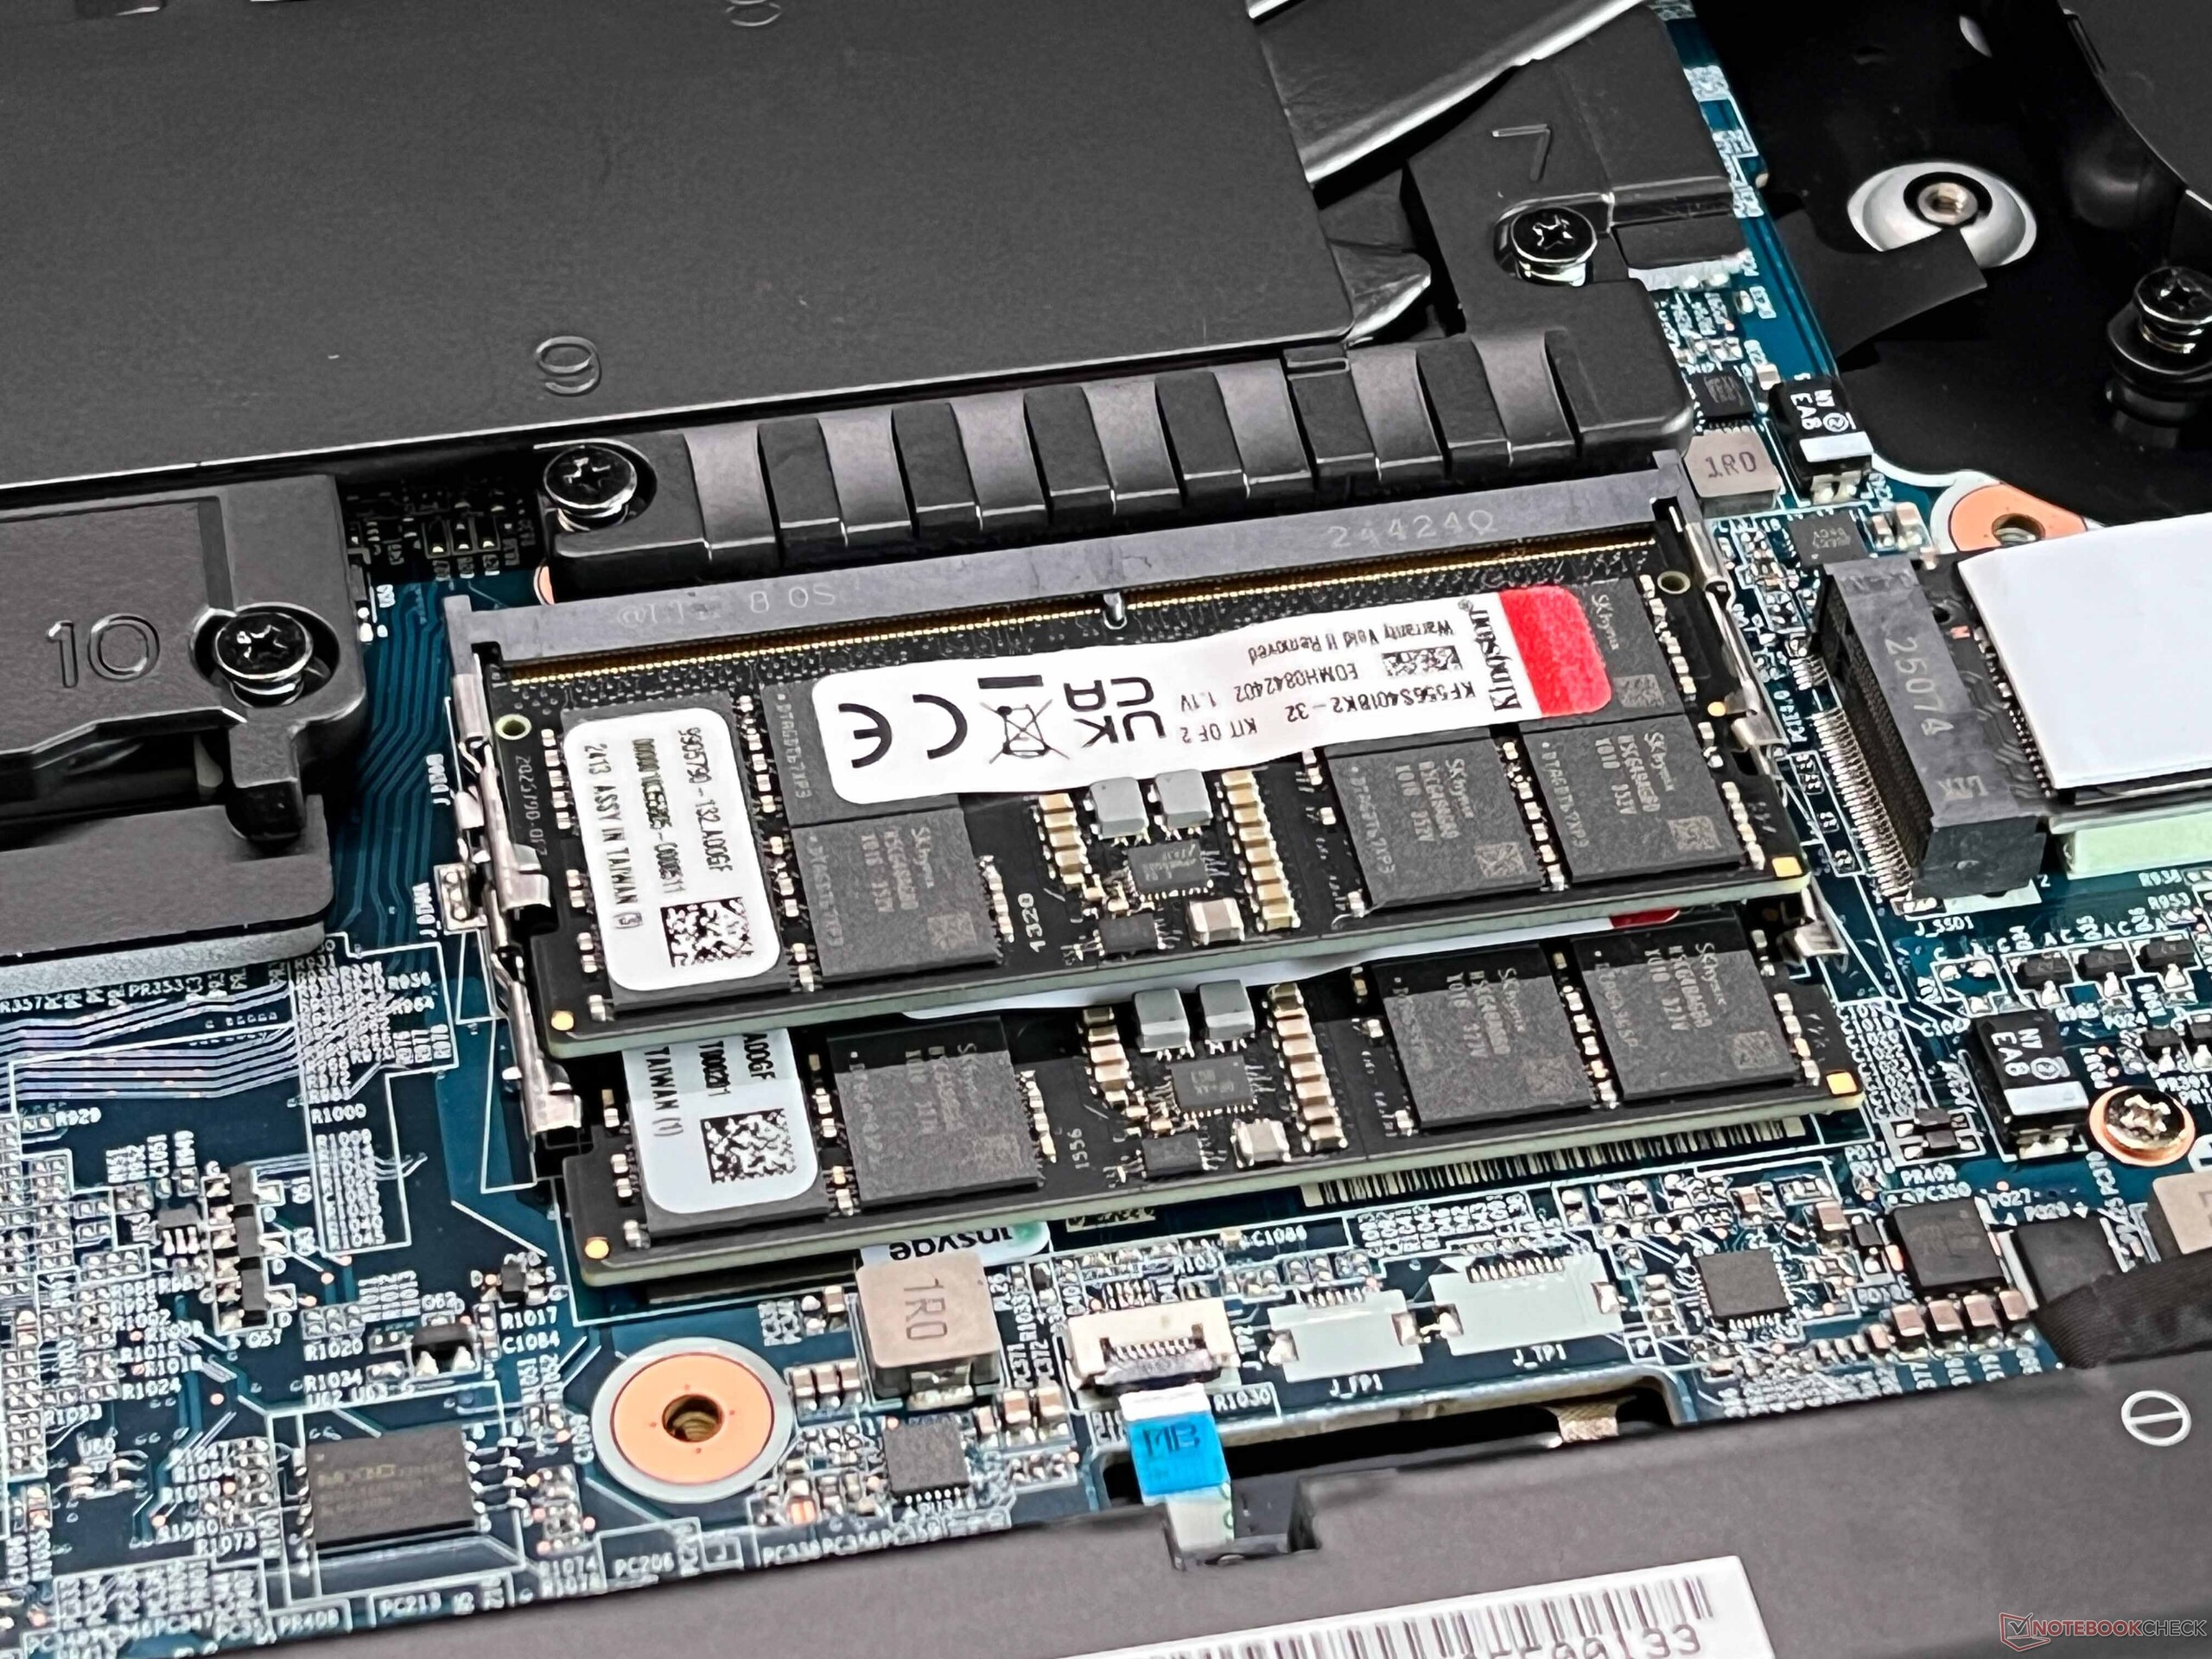
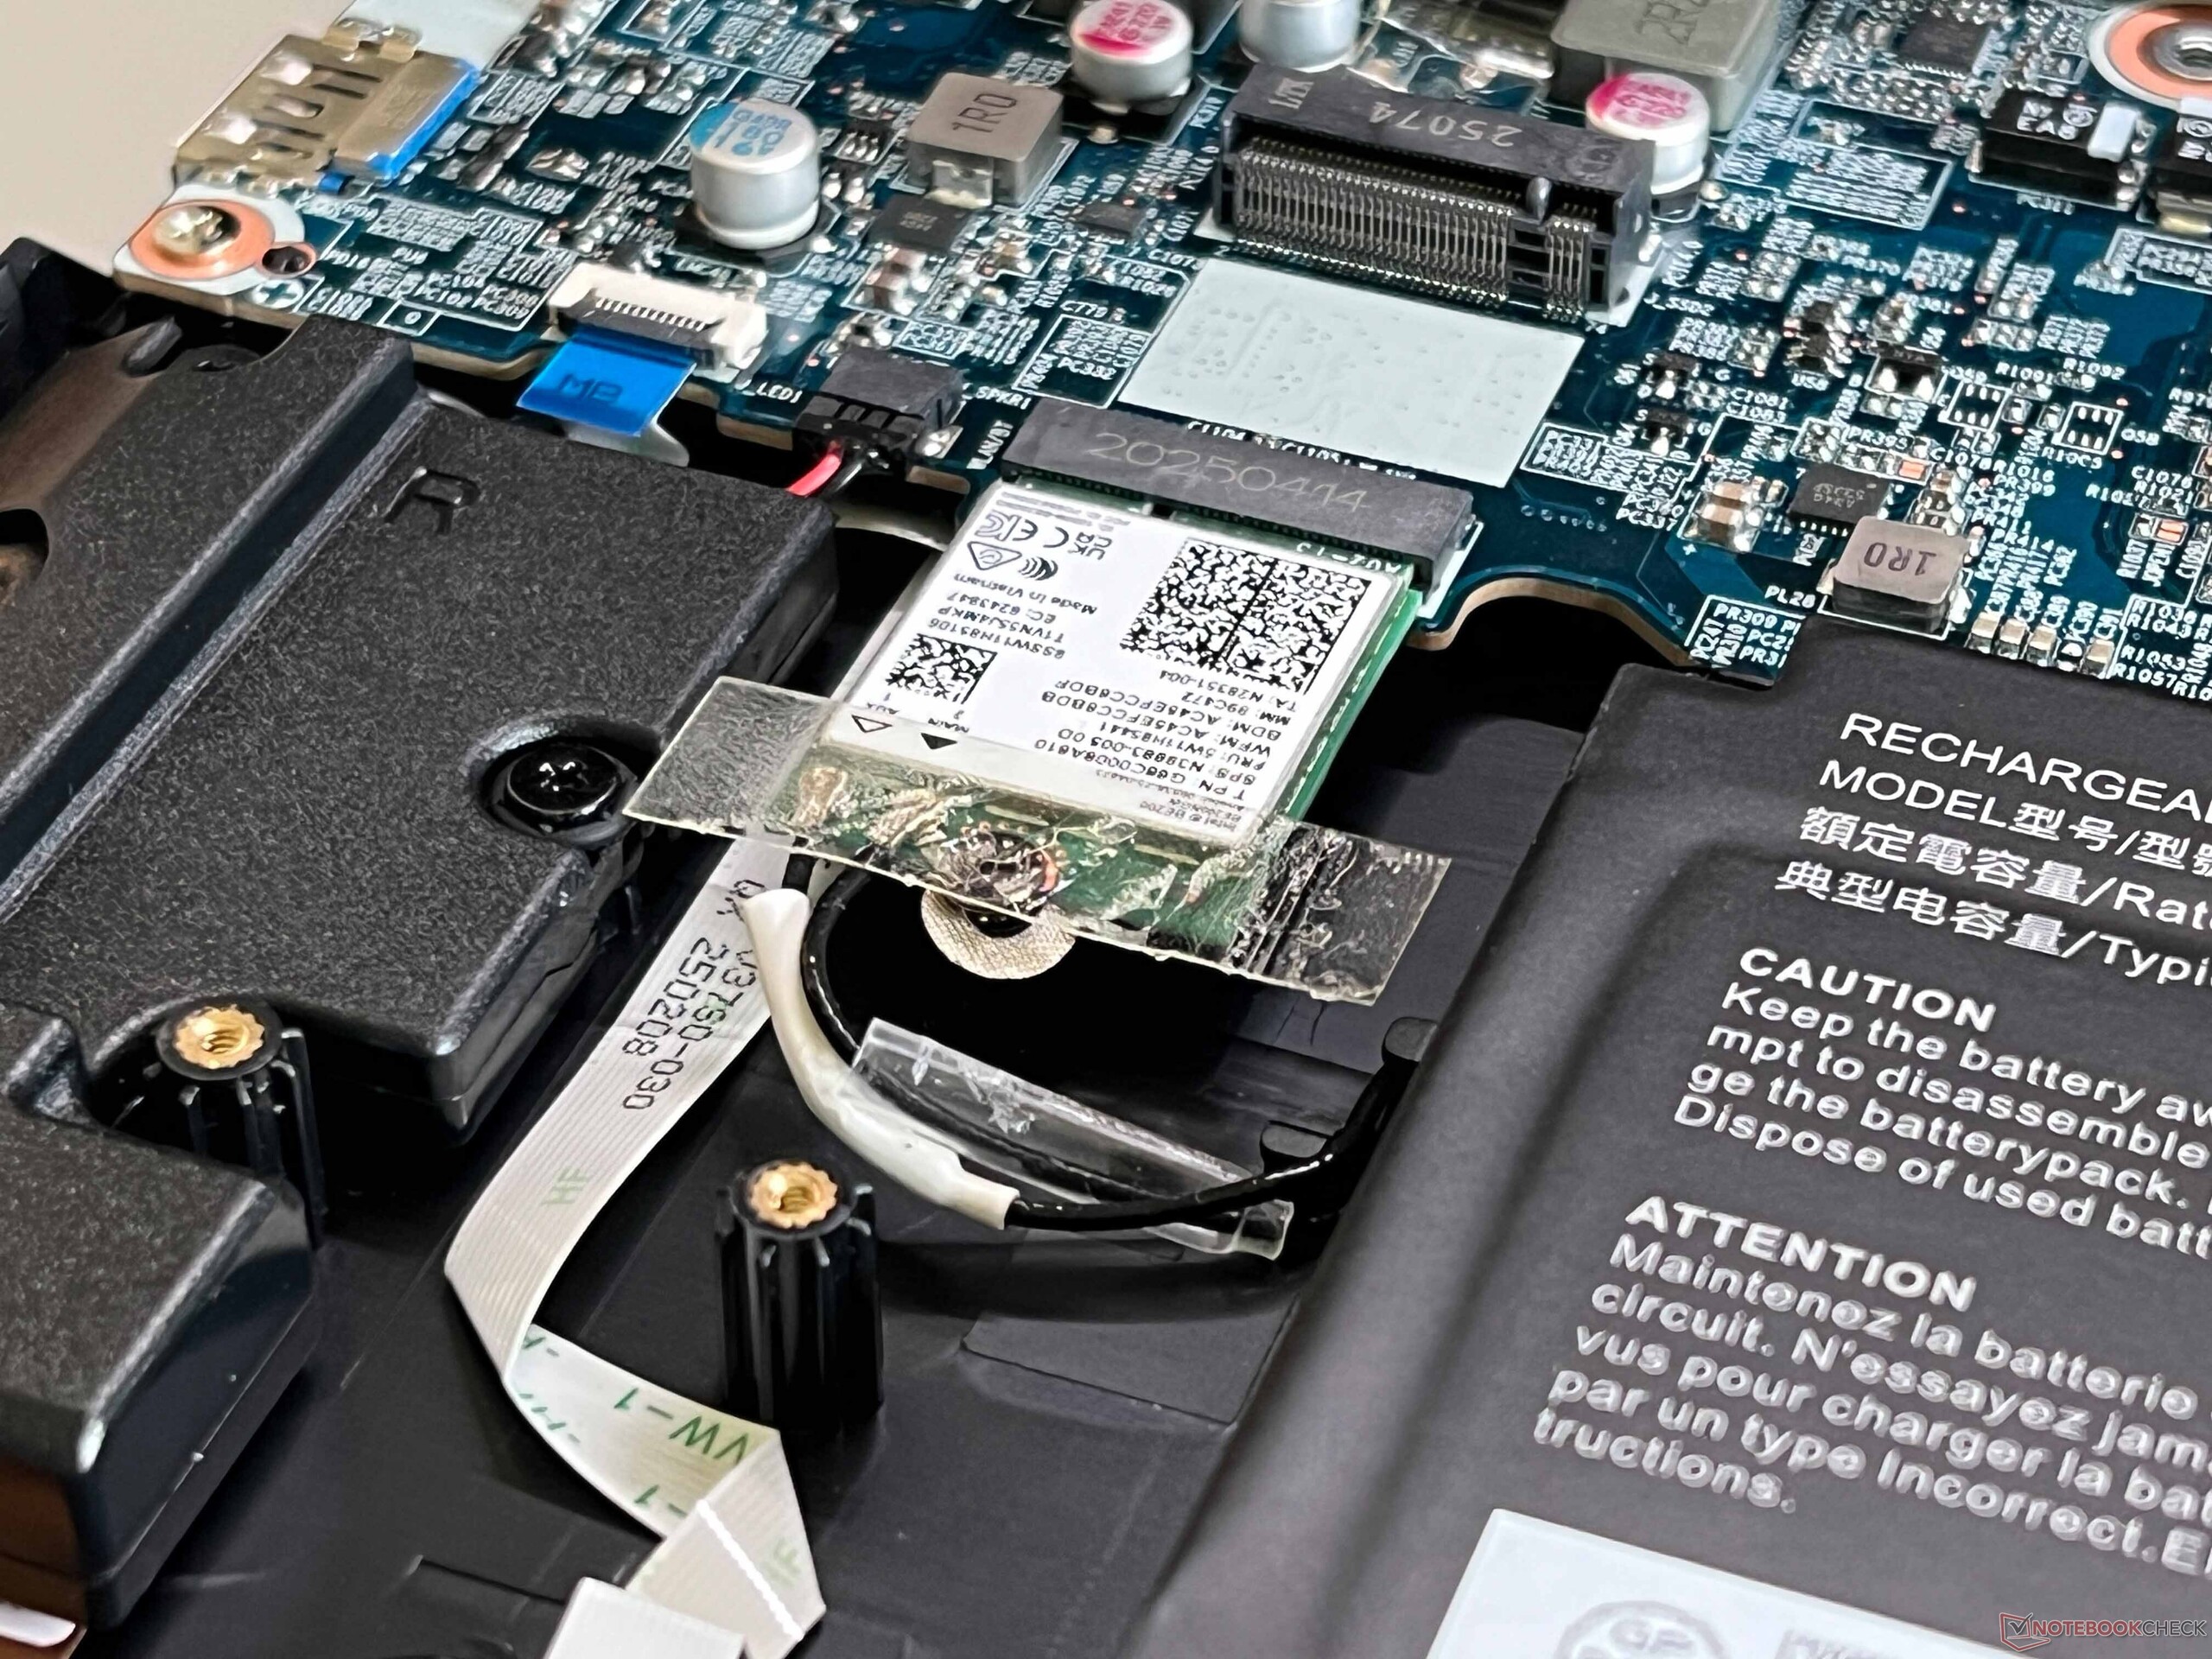
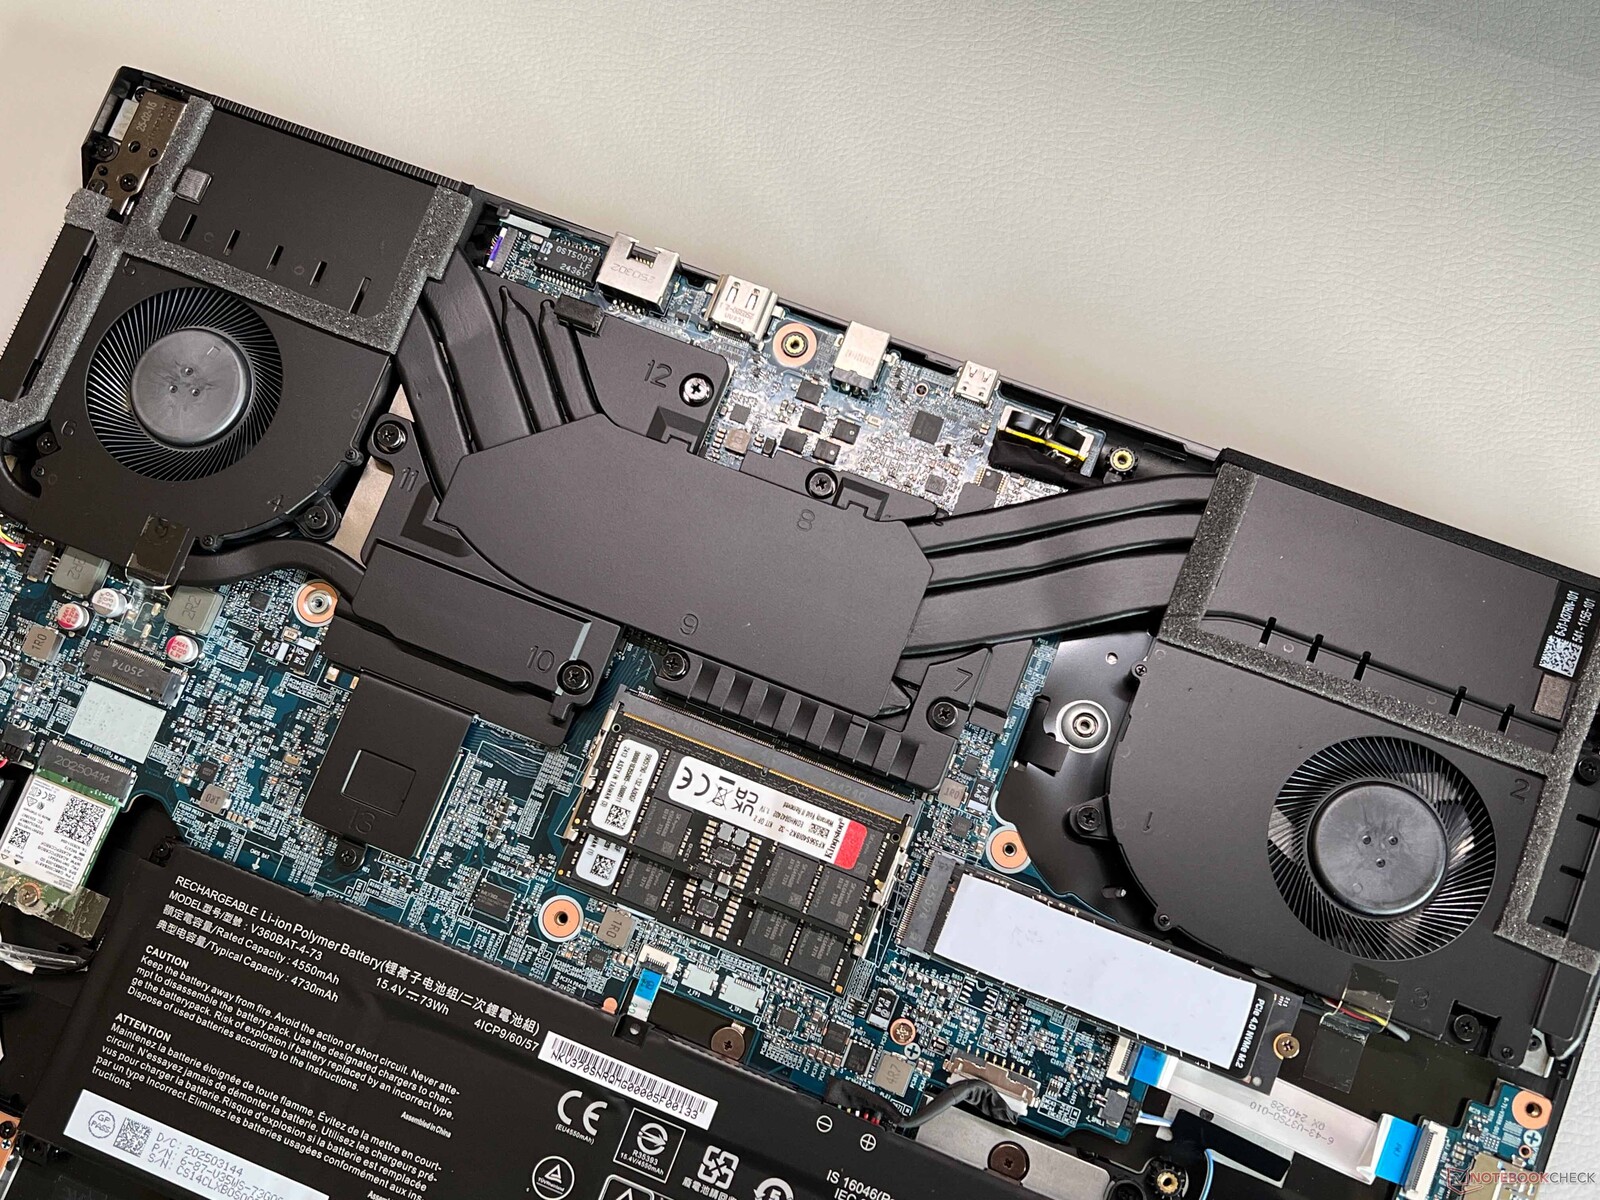
With its black surfaces, the case design is very straightforward, and there are no lighting elements apart from the keyboard. The lid is made of aluminum, but the rest of the case is made of plastic, and the surfaces are generally very susceptible to dirt. Neither the build quality nor the stability presents any major issues, although the base unit does make slight creaking noises when pressure is applied. The display's maximum opening angle is 130 degrees, but the hinges wobble slightly. Maintenance options are generally very good, since there are two slots each for RAM and SSDs, the Wi-Fi module and battery can be replaced if necessary, and the fans are also easy to clean.
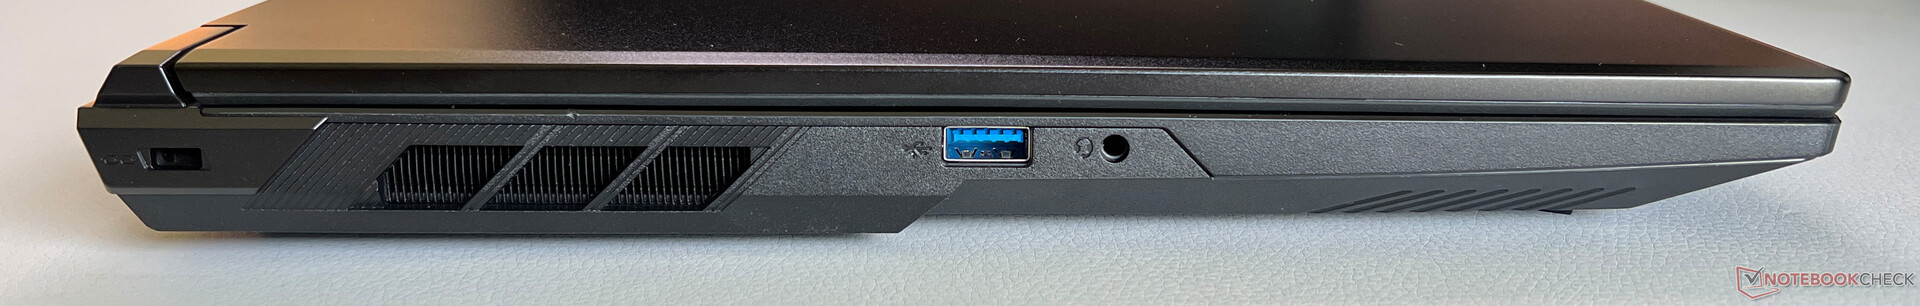
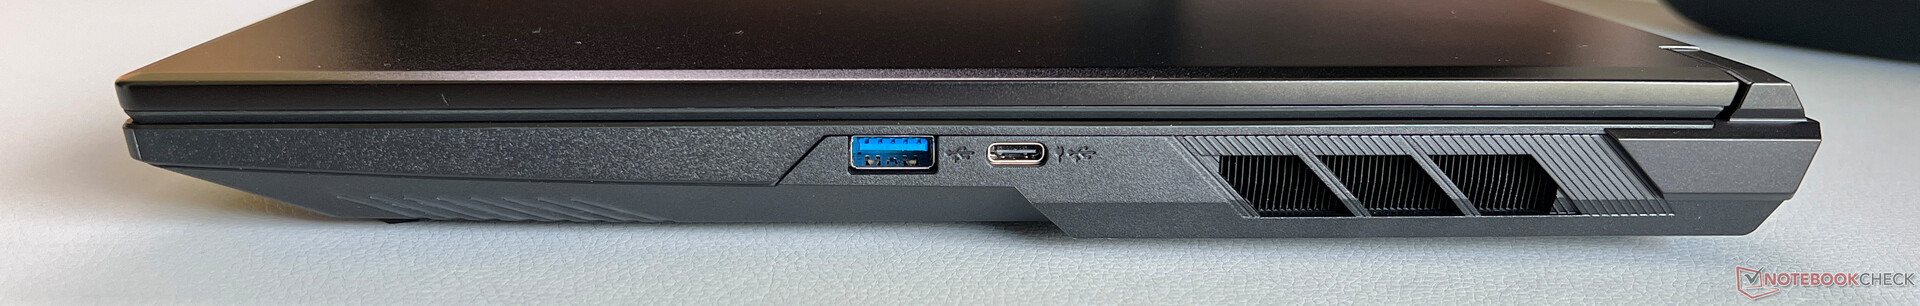
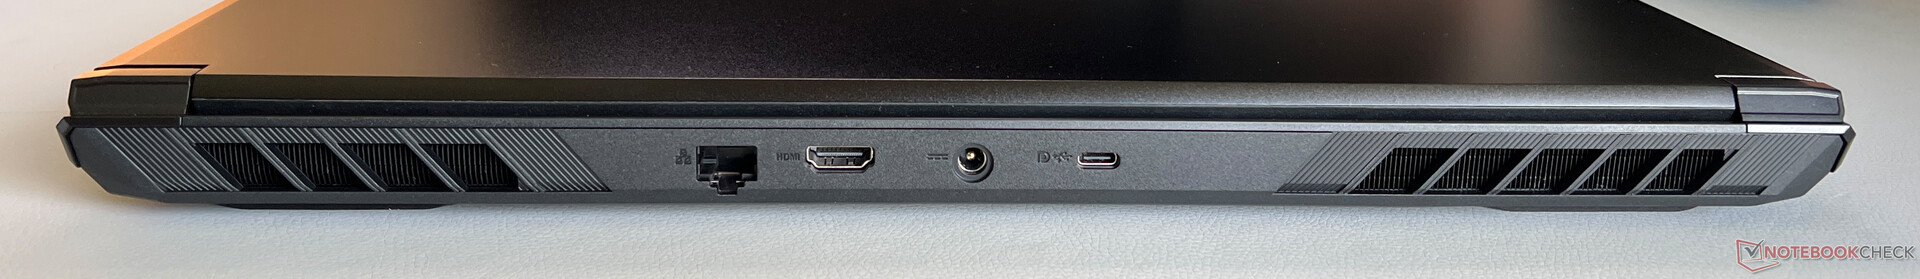
Thunderbolt is absent, but there are sufficient USB ports as well as an Intel Wi-Fi 7 module, which impresses with good, stable transfer rates. The 1080p webcam (including a mechanical shutter) only takes average pictures, and there is no IR module.


| Networking | |
| Schenker XMG Focus 17 M25 | |
| iperf3 transmit AXE11000 | |
| iperf3 receive AXE11000 | |
| MSI Vector 17 HX AI A2XWIG | |
| iperf3 transmit AXE11000 | |
| iperf3 receive AXE11000 | |
| iperf3 transmit AXE11000 6GHz | |
| iperf3 receive AXE11000 6GHz | |
| Lenovo Legion 5 Pro 16IAX10H | |
| iperf3 transmit AXE11000 | |
| iperf3 receive AXE11000 | |
| MSI Vector 16 HX AI A2XWHG | |
| iperf3 transmit AXE11000 | |
| iperf3 receive AXE11000 | |
| Schenker XMG Pro 16 (E25) | |
| iperf3 transmit AXE11000 | |
| iperf3 receive AXE11000 | |


Sustainability
The manufacturer has issued no statements regarding sustainability. The packaging is fully recyclable.
Input devices
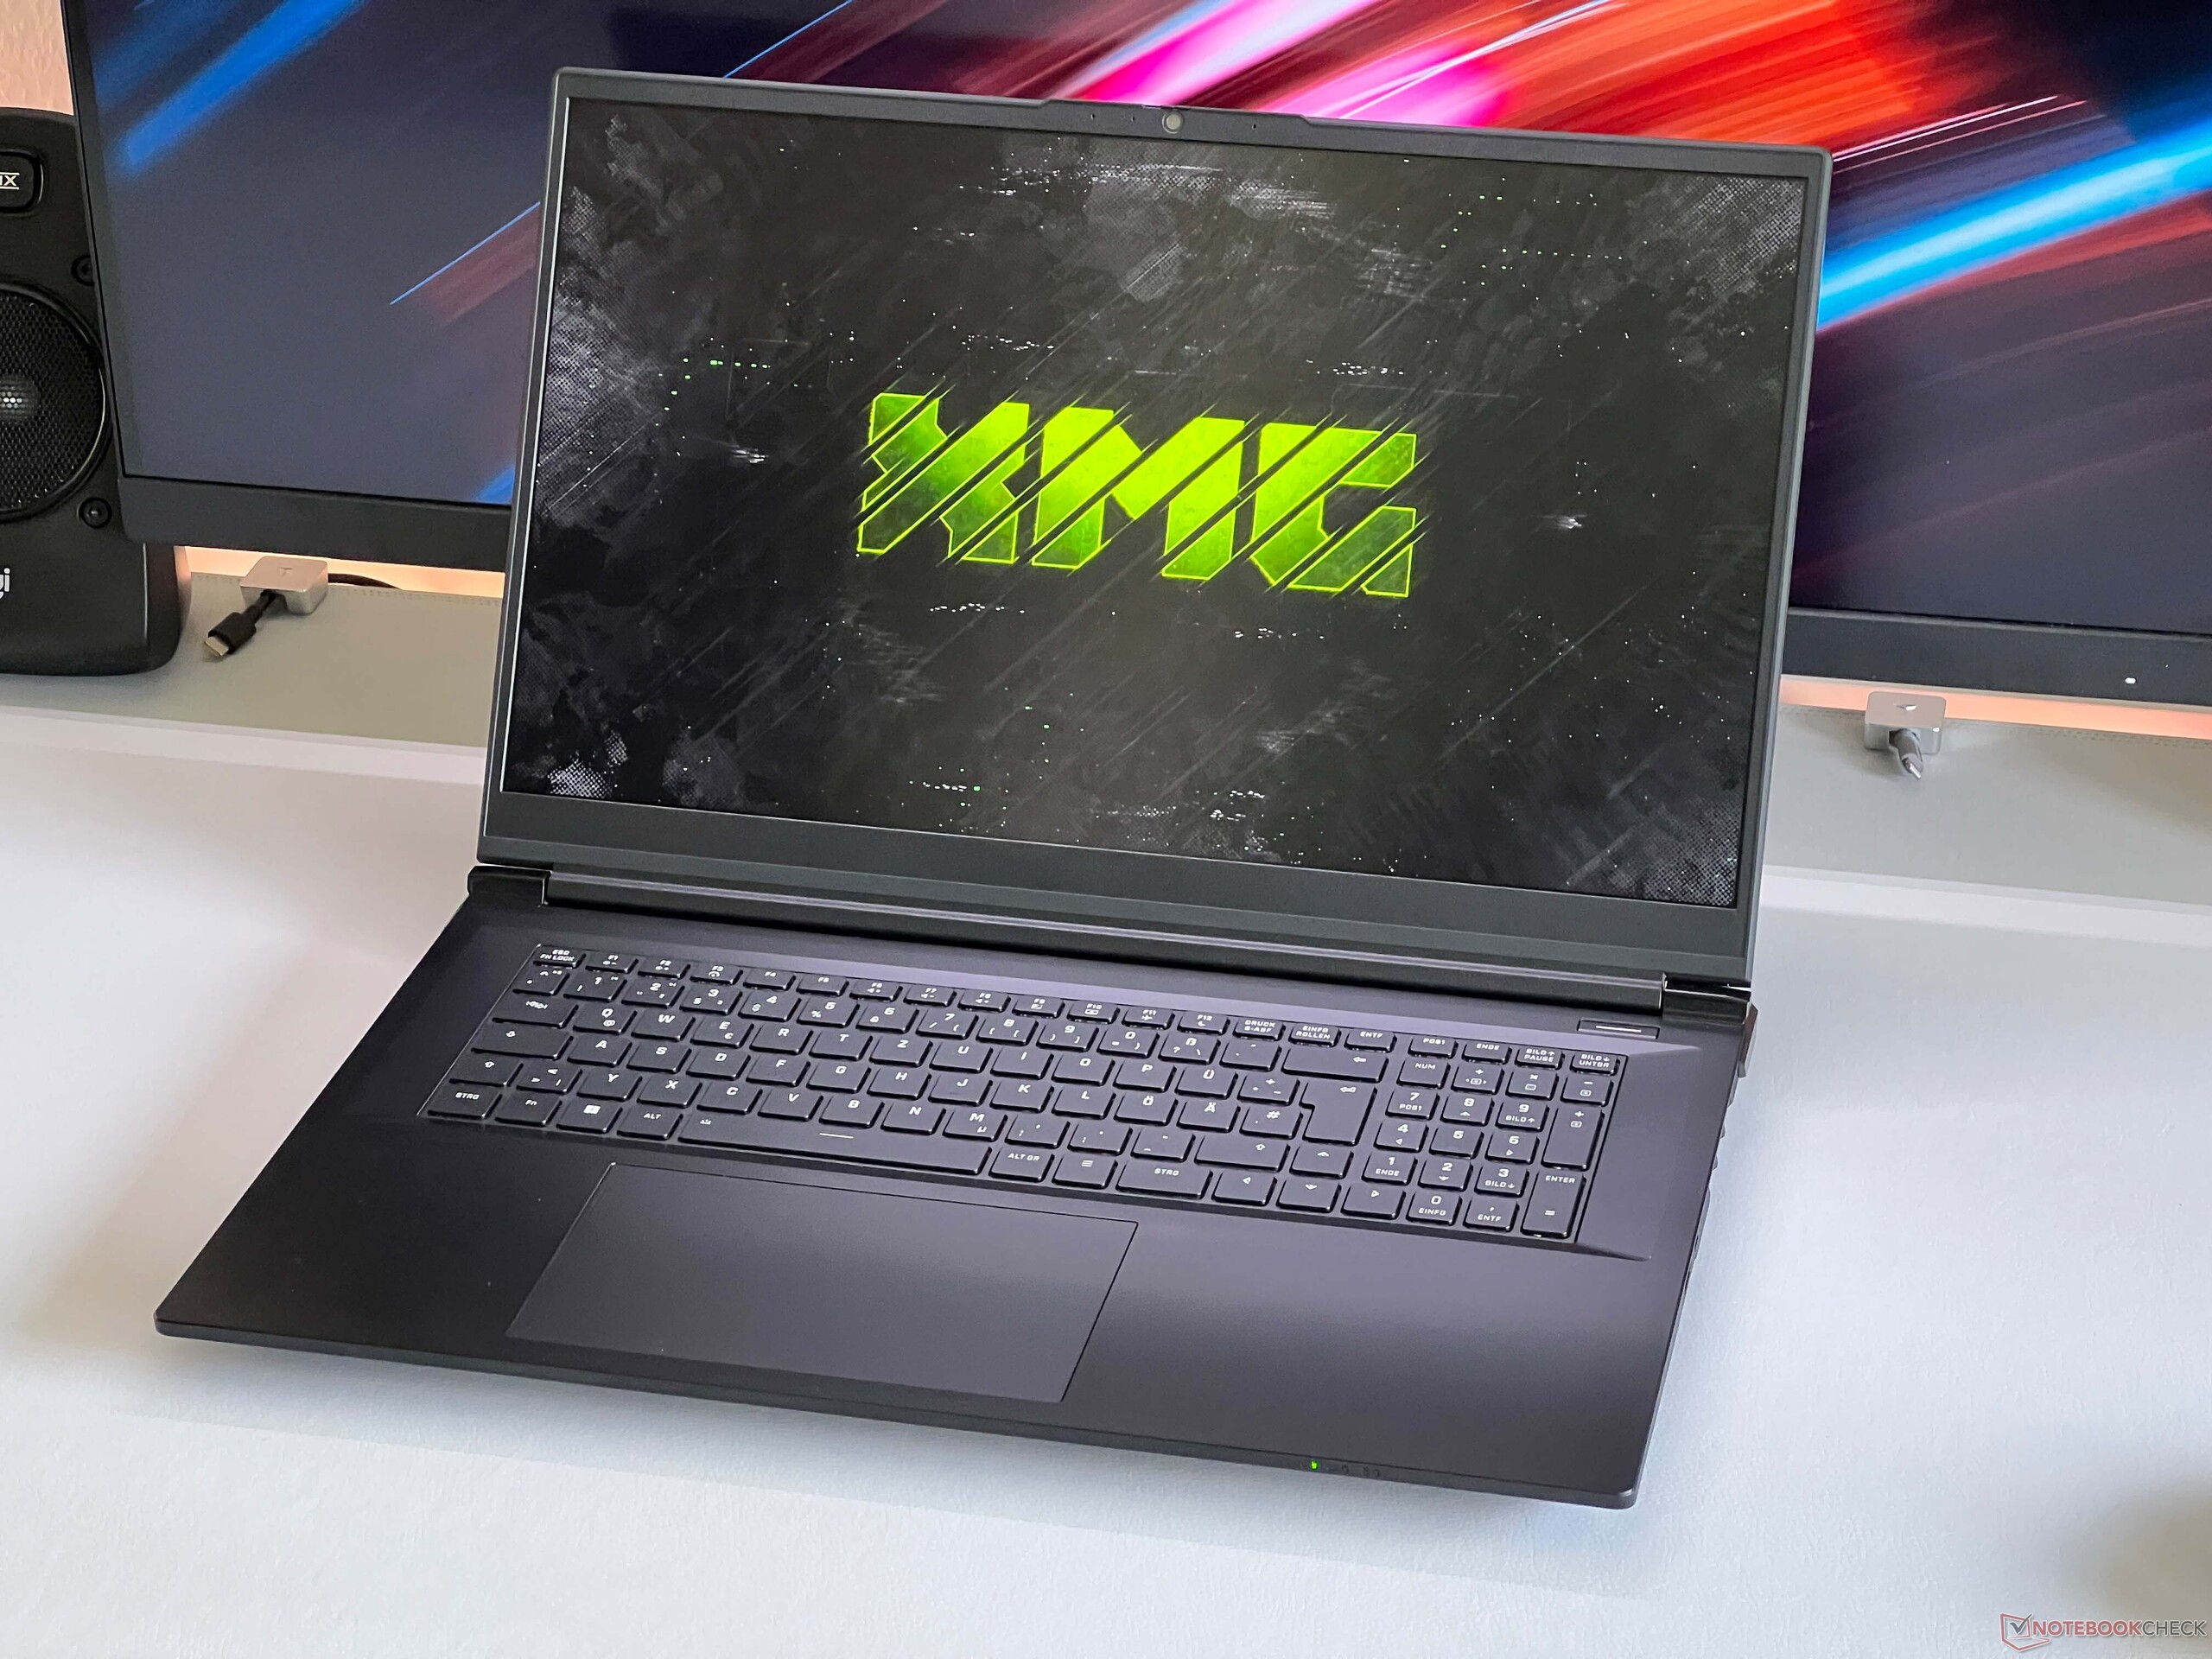
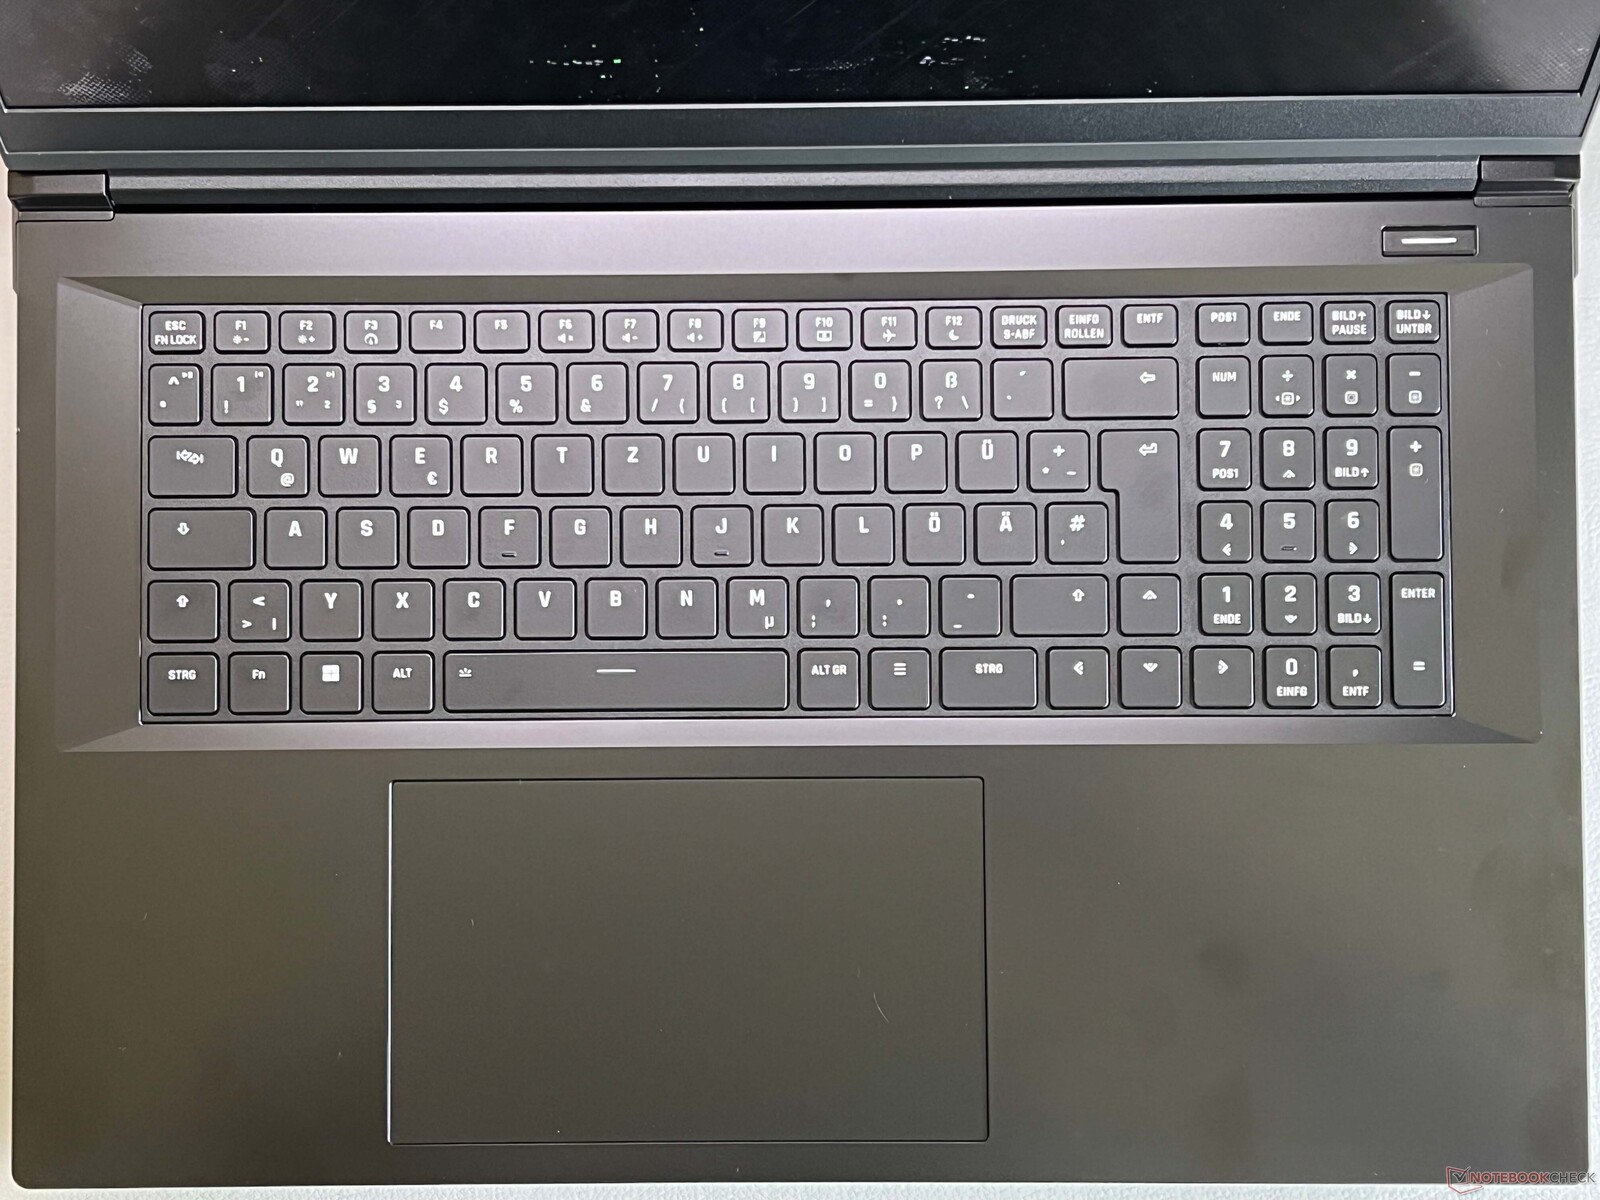
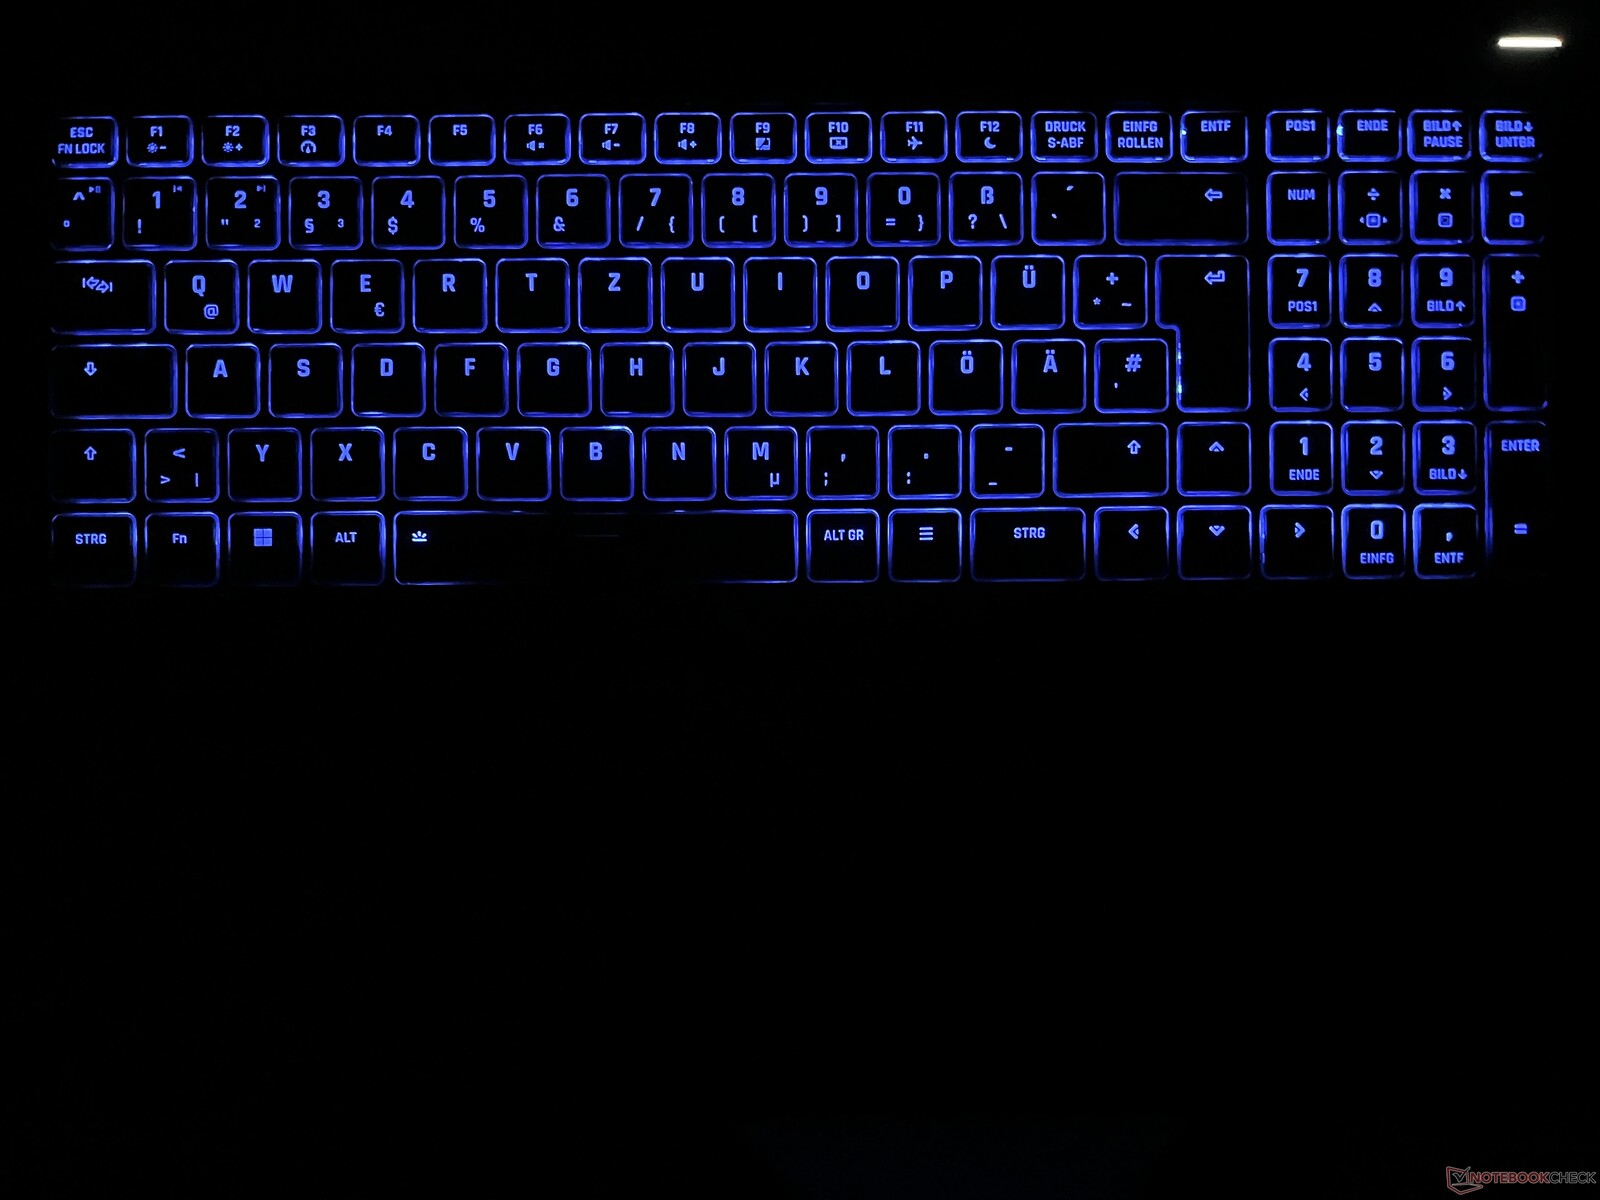
XMG has fitted a keyboard with a dedicated number pad and single-zone RGB lighting. Typing is comfortable, with sufficient key travel and precise feedback. Furthermore, the keys aren't too loud. The large clickpad is relatively smooth to the touch. It's sufficiently large (15 x 9 cm) and very well-padded (no rattling). Only the mechanical clicks in the lower area are very loud.
Display - A 240 Hz IPS

The Focus uses a 17.3-inch IPS panel with a 16:9 aspect ratio and QHD resolution of 2,560 x 1,440 pixels. The matte panel's image quality is good, with bright areas appearing only minimally grainy, although this is hardly noticeable in everyday use. Colors are vibrant, and motion is smooth thanks to the 240 Hz refresh rate. Response times are also fast, and there's no PWM flickering.
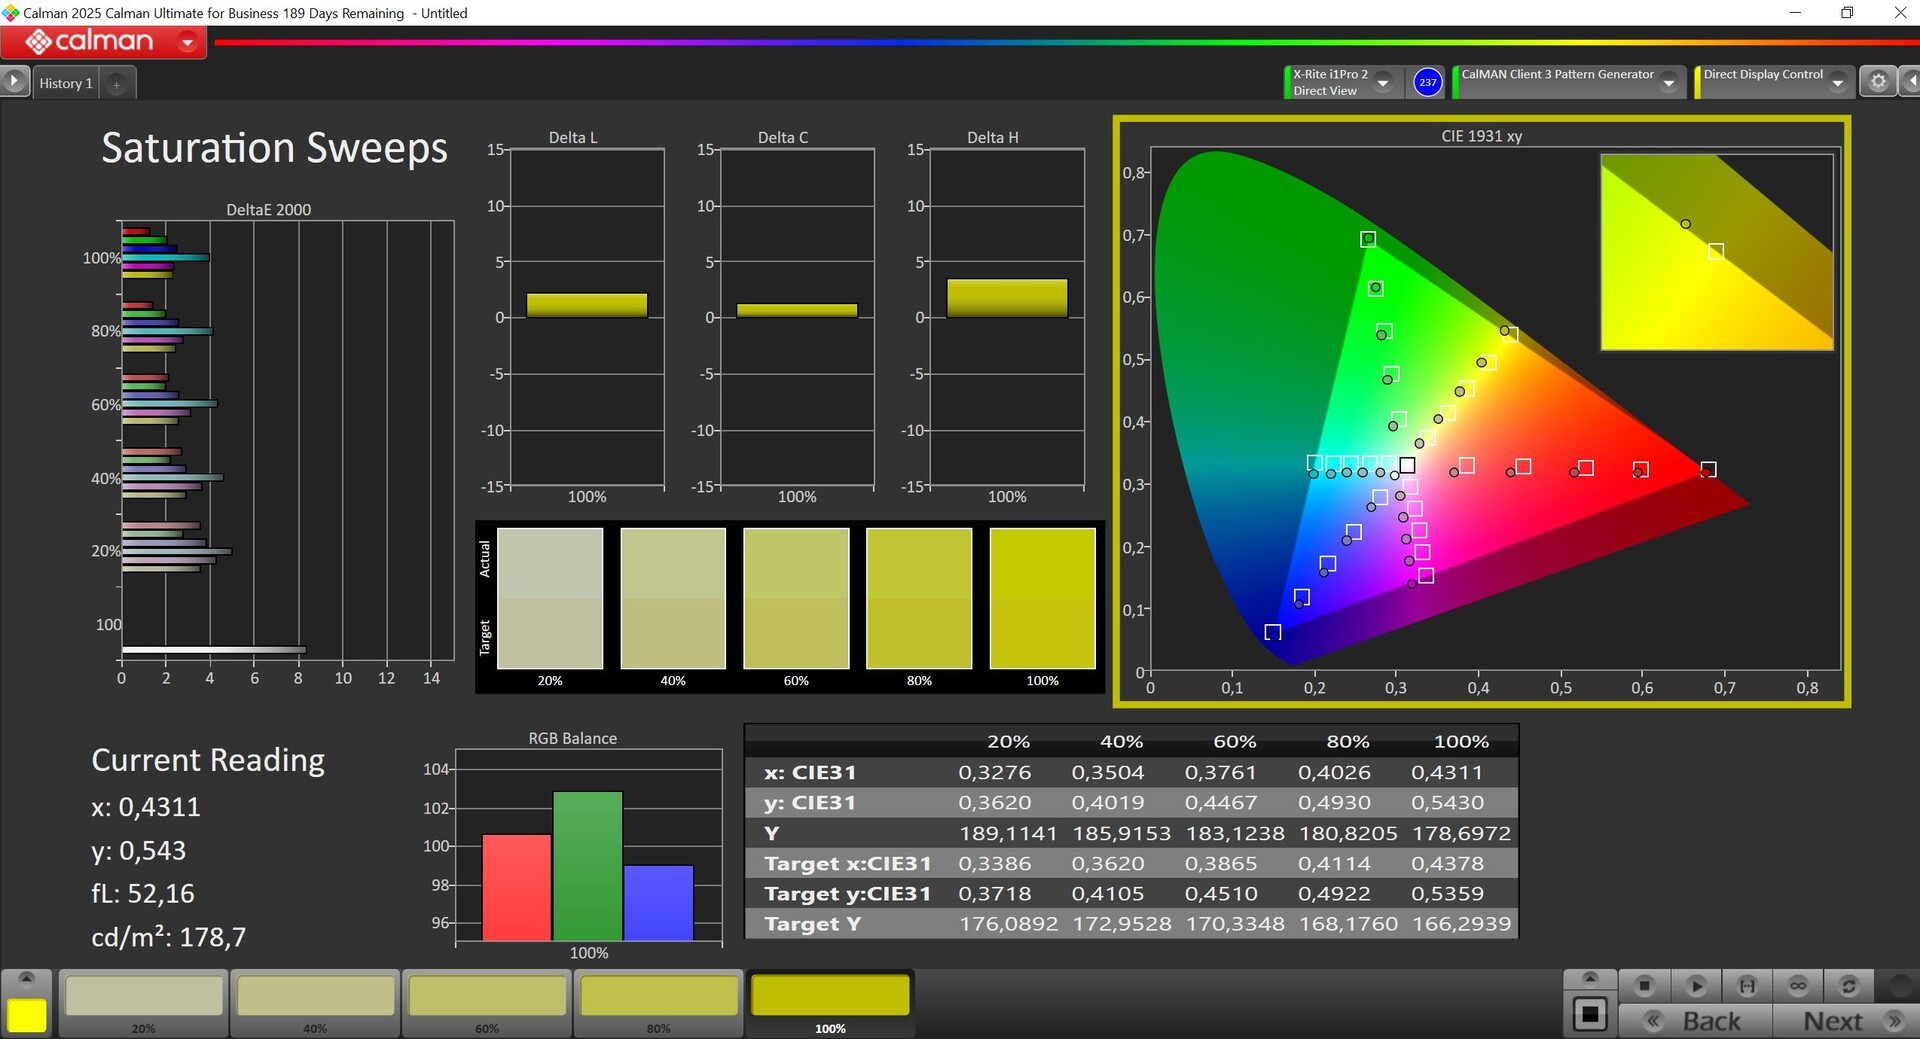
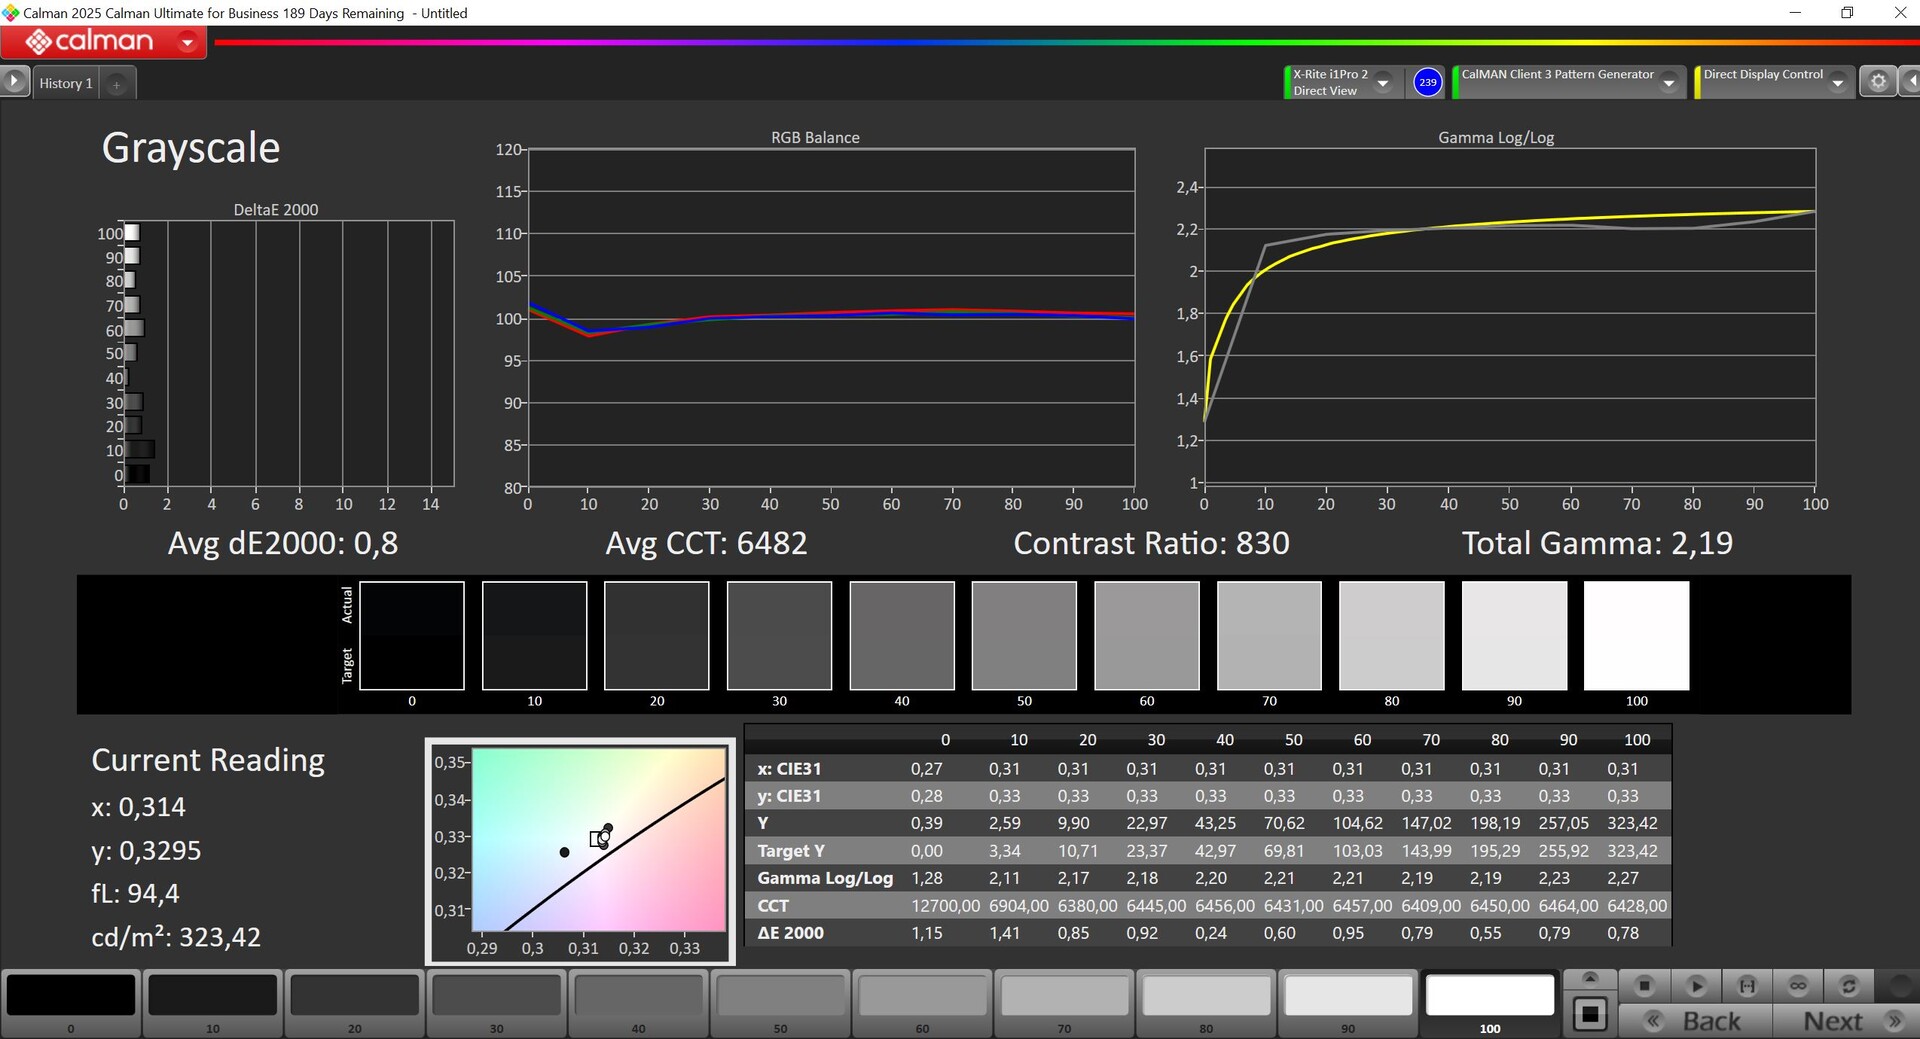
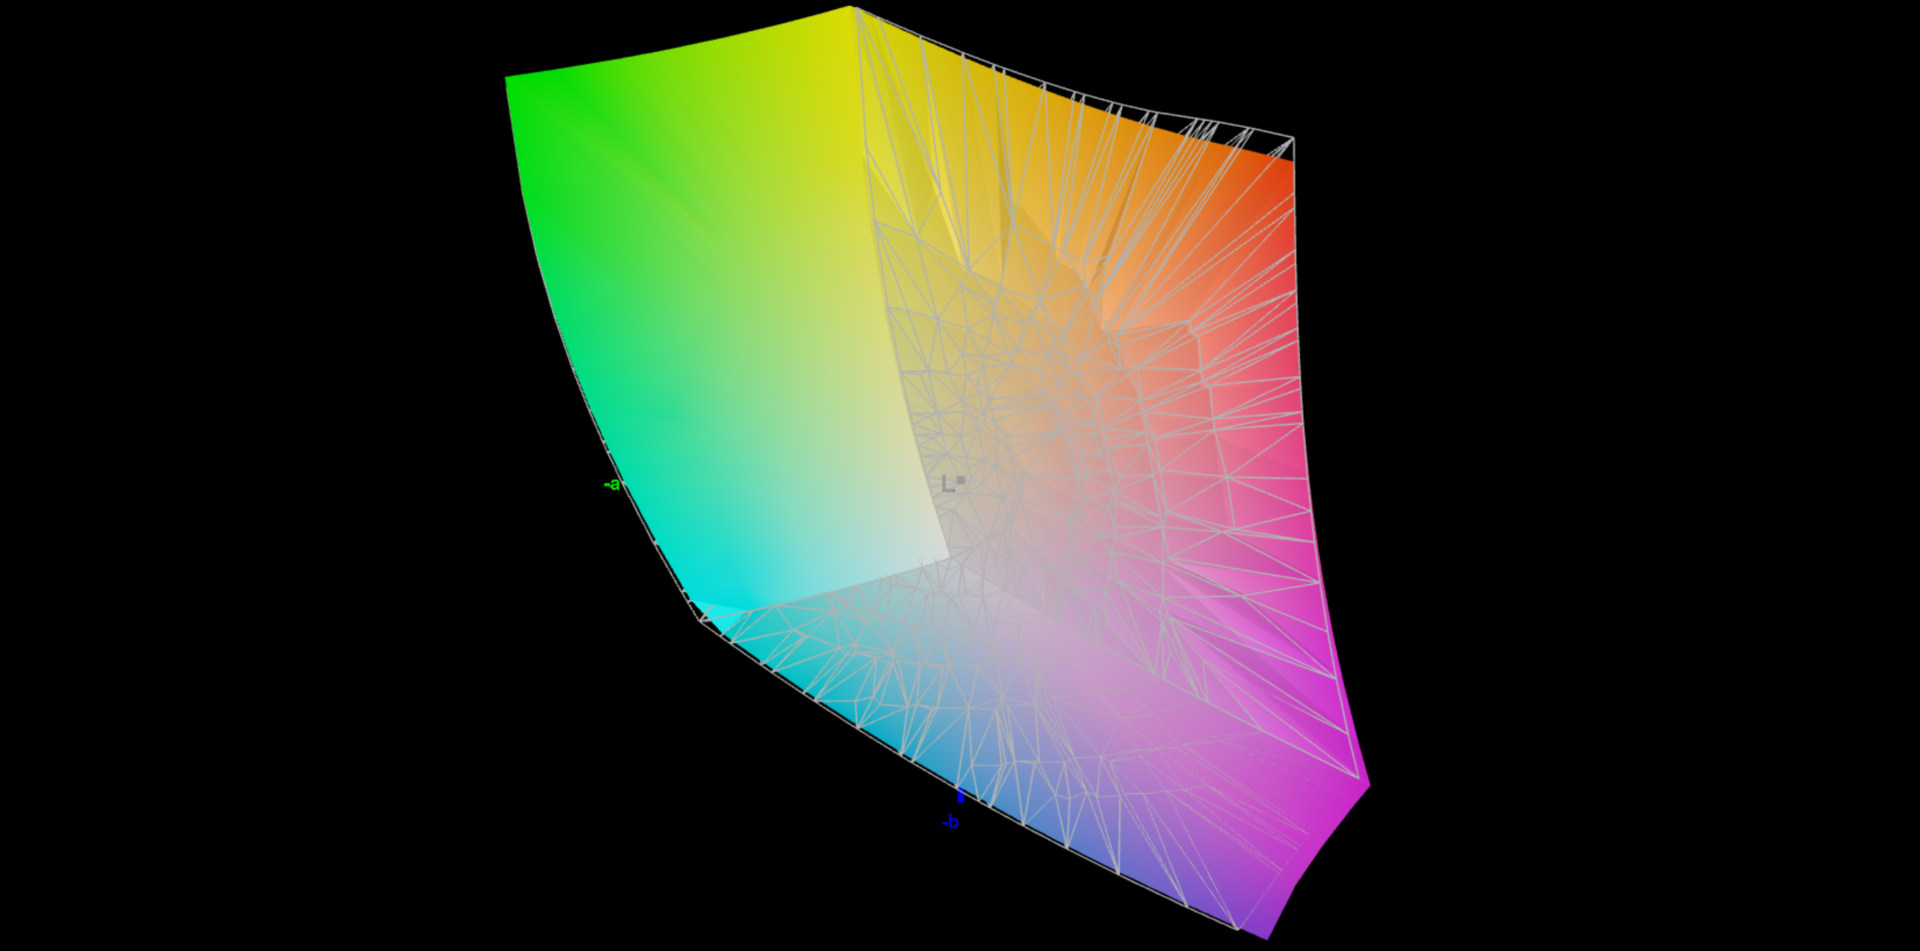
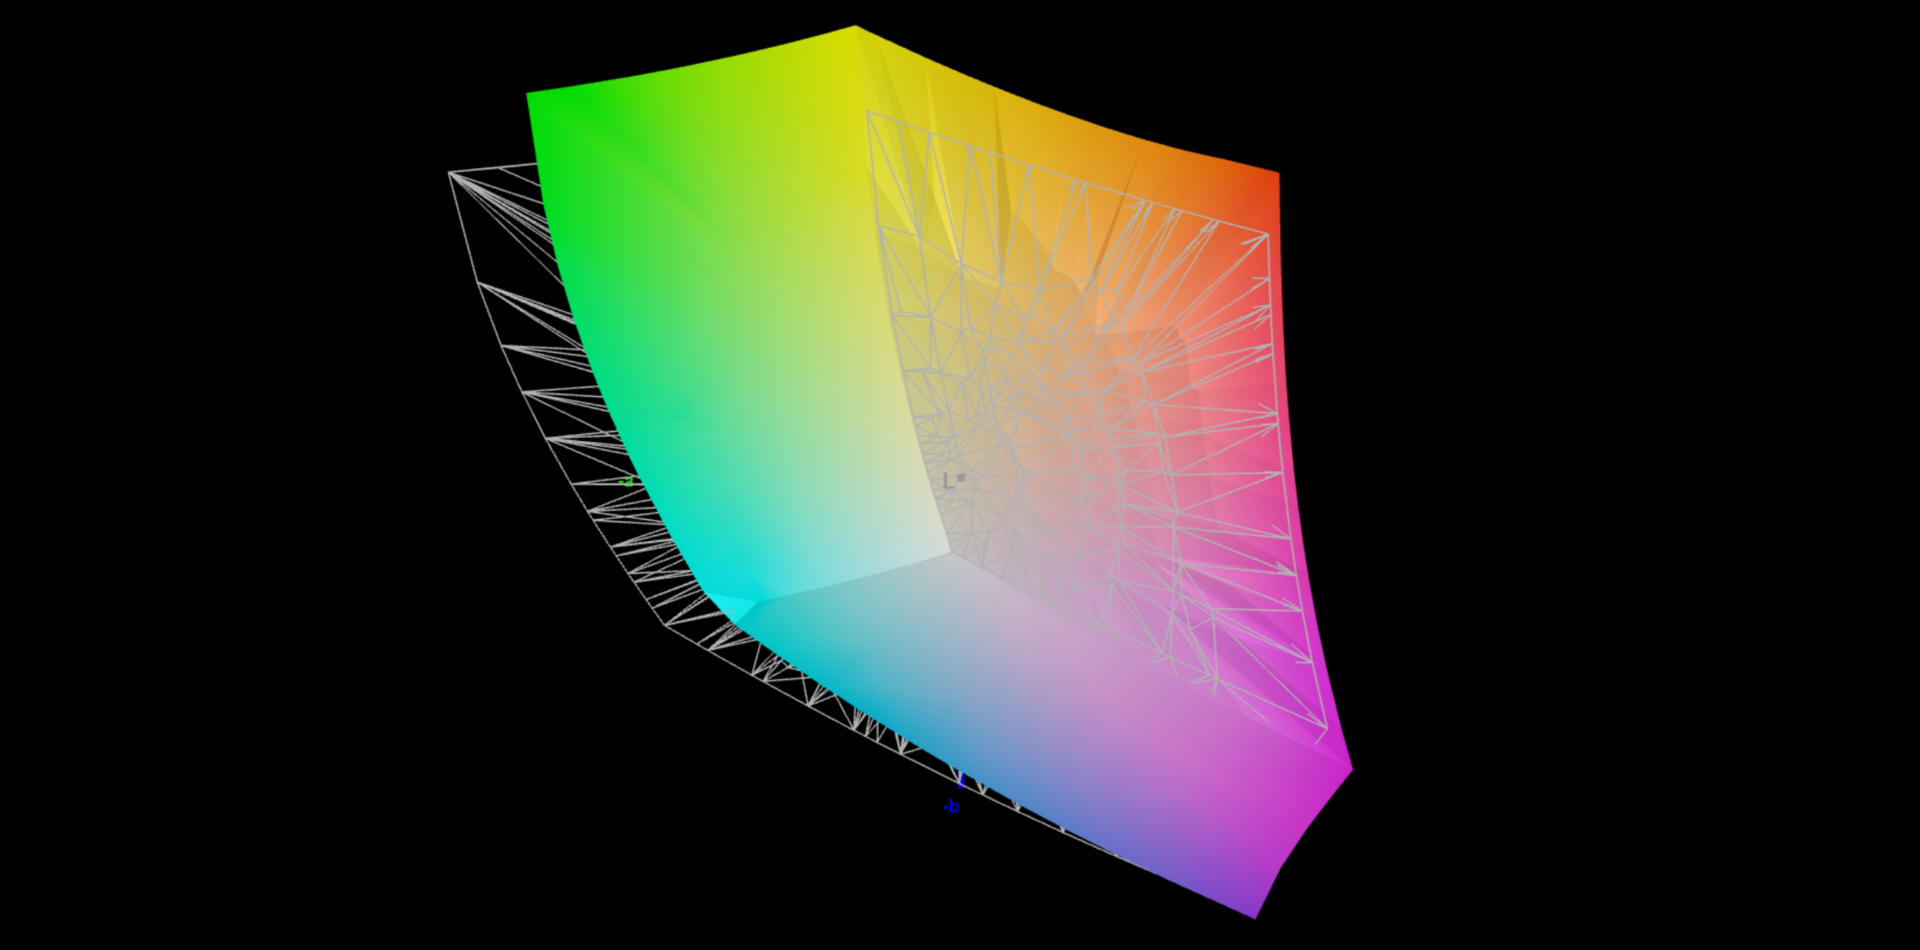
XMG has specified a brightness of 300 cd/m², which our test model manages to exceed with a maximum of 347 cd/m² (average 325 cd/m²). The contrast ratio is good at a maximum of 1,335:1, but our analysis with the professional CalMAN software highlights a distinct blue tint in the factory settings, combined with a color temperature that is too cool. On top of this, there are also significant color deviations. With our calibration (the profile is available for free download in the box on the right), we were able to significantly improve the displayed images. Both the P3 and sRGB color spaces are fully covered, but there's no sRGB profile. Overall, the panel is well-suited for gaming, but the competition is superior, especially in terms of brightness.
| |||||||||||||||||||||||||
Brightness Distribution: 84 %
Center on Battery: 347 cd/m²
Contrast: 1335:1 (Black: 0.26 cd/m²)
ΔE ColorChecker Calman: 3.3 | ∀{0.5-29.43 Ø4.73}
calibrated: 0.9
ΔE Greyscale Calman: 4.5 | ∀{0.09-98 Ø4.97}
86% AdobeRGB 1998 (Argyll 3D)
99.9% sRGB (Argyll 3D)
98.3% Display P3 (Argyll 3D)
Gamma: 2.05
CCT: 7365 K
| Schenker XMG Focus 17 M25 NE173QHM-NZ1, IPS, 2560x1440, 17.3", 240 Hz | MSI Vector 17 HX AI A2XWIG B170QAN01.2 (AUO84A6), IPS, 2560x1600, 17", 240 Hz | Lenovo Legion 5 Pro 16IAX10H ATNA60HS01-0 (Samsung SDC420A), OLED, 2560x1600, 16", 165 Hz | MSI Vector 16 HX AI A2XWHG B160QAN02.3 (AUO7DB2), IPS, 2560x1600, 16", 240 Hz | Schenker XMG Pro 16 (E25) NE160QDM-NZL, IPS, 2560x1600, 16", 300 Hz | |
|---|---|---|---|---|---|
| Display | 1% | 4% | -1% | -12% | |
| Display P3 Coverage (%) | 98.3 | 99.6 1% | 99.9 2% | 96.6 -2% | 74.7 -24% |
| sRGB Coverage (%) | 99.9 | 100 0% | 100 0% | 99.8 0% | 99.8 0% |
| AdobeRGB 1998 Coverage (%) | 86 | 87.4 2% | 94.1 9% | 84.4 -2% | 75.4 -12% |
| Response Times | 56% | 84% | 45% | 26% | |
| Response Time Grey 50% / Grey 80% * (ms) | 13.7 ? | 3.6 ? 74% | 2 ? 85% | 4.3 ? 69% | 10.5 ? 23% |
| Response Time Black / White * (ms) | 7.6 ? | 4.8 ? 37% | 1.4 ? 82% | 6 ? 21% | 5.4 ? 29% |
| PWM Frequency (Hz) | 1300 | ||||
| PWM Amplitude * (%) | 16.7 | ||||
| Screen | 4% | 12% | -2% | 19% | |
| Brightness middle (cd/m²) | 347 | 488 41% | 518 49% | 473 36% | 538 55% |
| Brightness (cd/m²) | 325 | 473 46% | 522 61% | 426 31% | 508 56% |
| Brightness Distribution (%) | 84 | 91 8% | 97 15% | 85 1% | 88 5% |
| Black Level * (cd/m²) | 0.26 | 0.74 -185% | 0.42 -62% | 0.47 -81% | |
| Contrast (:1) | 1335 | 659 -51% | 1126 -16% | 1145 -14% | |
| Colorchecker dE 2000 * | 3.3 | 1.67 49% | 2.49 25% | 3.47 -5% | 1.9 42% |
| Colorchecker dE 2000 max. * | 8.4 | 3.43 59% | 5.25 37% | 7.24 14% | 4 52% |
| Colorchecker dE 2000 calibrated * | 0.9 | 0.8 11% | 2.15 -139% | 1.36 -51% | |
| Greyscale dE 2000 * | 4.5 | 2.08 54% | 3.02 33% | 3.1 31% | 2.7 40% |
| Gamma | 2.05 107% | 2.55 86% | 2.37 93% | 2.486 88% | 2.24 98% |
| CCT | 7365 88% | 6240 104% | 6426 101% | 6832 95% | 7027 93% |
| Total Average (Program / Settings) | 20% /
10% | 33% /
22% | 14% /
5% | 11% /
13% |
* ... smaller is better


Display Response Times
| ↔ Response Time Black to White | ||
|---|---|---|
| 7.6 ms ... rise ↗ and fall ↘ combined | ↗ 3.1 ms rise | 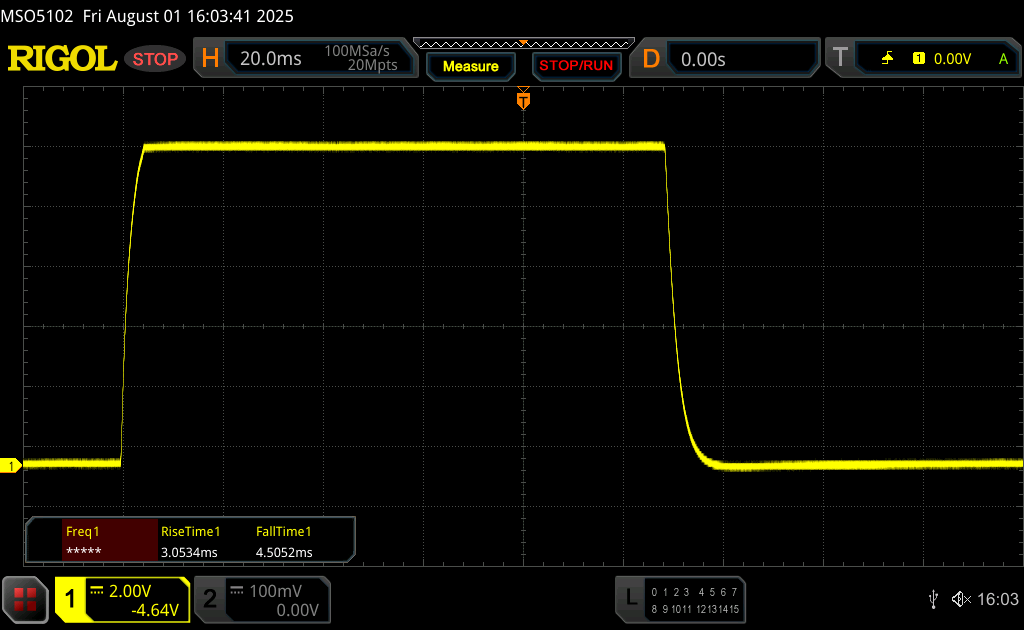 |
| ↘ 4.5 ms fall | ||
| The screen shows very fast response rates in our tests and should be very well suited for fast-paced gaming. In comparison, all tested devices range from 0.1 (minimum) to 240 (maximum) ms. » 22 % of all devices are better. This means that the measured response time is better than the average of all tested devices (19.9 ms). | ||
| ↔ Response Time 50% Grey to 80% Grey | ||
| 13.7 ms ... rise ↗ and fall ↘ combined | ↗ 6.5 ms rise |  |
| ↘ 7.2 ms fall | ||
| The screen shows good response rates in our tests, but may be too slow for competitive gamers. In comparison, all tested devices range from 0.165 (minimum) to 636 (maximum) ms. » 27 % of all devices are better. This means that the measured response time is better than the average of all tested devices (31.1 ms). | ||
Screen Flickering / PWM (Pulse-Width Modulation)
| Screen flickering / PWM not detected |  | ||
In comparison: 52 % of all tested devices do not use PWM to dim the display. If PWM was detected, an average of 7798 (minimum: 5 - maximum: 343500) Hz was measured. | |||


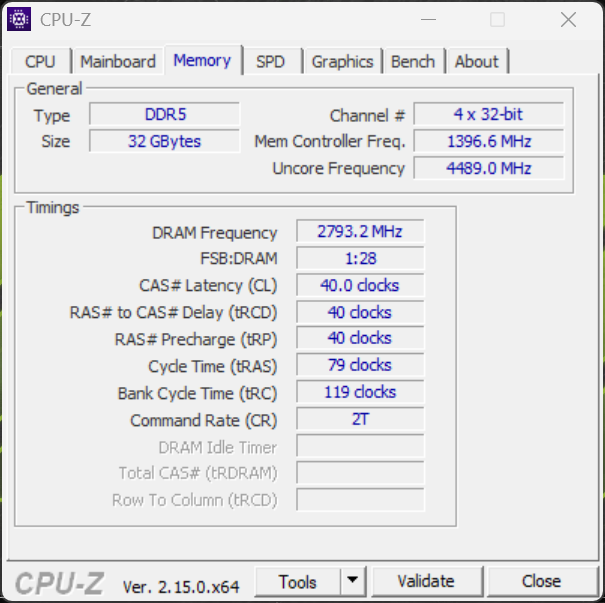
Performance - A 5070 Ti laptop GPU with up to 96 GB of RAM
Test conditions
Various power profiles are available in the Control Center, each offering sub-profiles. Maximum gaming performance is only available in Performance/Turbo mode. Although maximum GPU performance is generally available in Performance/Auto mode, performance differs when gaming with simultaneous CPU load (maximum TGP then 100 watts).
| Energy profile | CPU TDP | CB24 Multi | GPU TGP | Time Spy Graphics | CP2077 QHD Ultra | max. fan volume |
|---|---|---|---|---|---|---|
| Silent | 30/28 watts | 591 points | 100 watts | 14,202 points | 61.2fps | 37 dB(A) |
| Entertainment | 115/45 watts | 1,013 points | 100 watts | 14,463 points | 68.1fps | 46.6 dB(A) |
| Performance (Auto) | 150/120 watts | 1,624 points | 140/100 watts | 14,833 points | 69.8fps | 51.9 dB(A) |
| Performance (Turbo) | 150/135 watts | 1,675 points | 140 watts | 17,211 points | 81fps | 56.2 dB(A) |
| Battery | 30 watts | 619 points | 35 watts | 3,423 points | 17.9fps | 33.6 dB(A) |
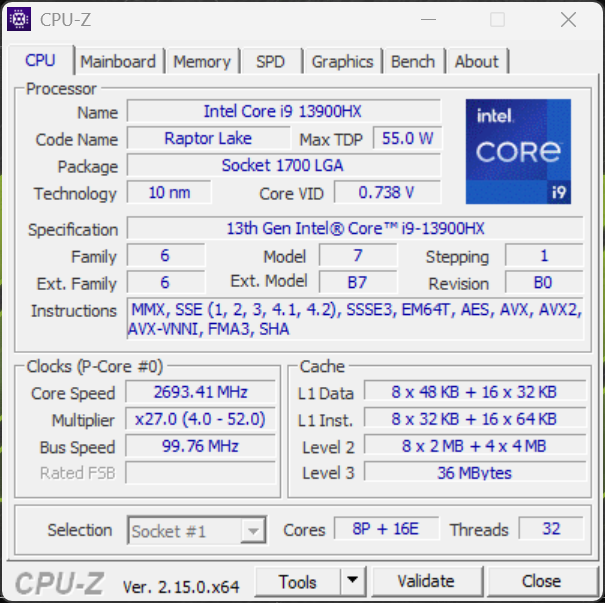
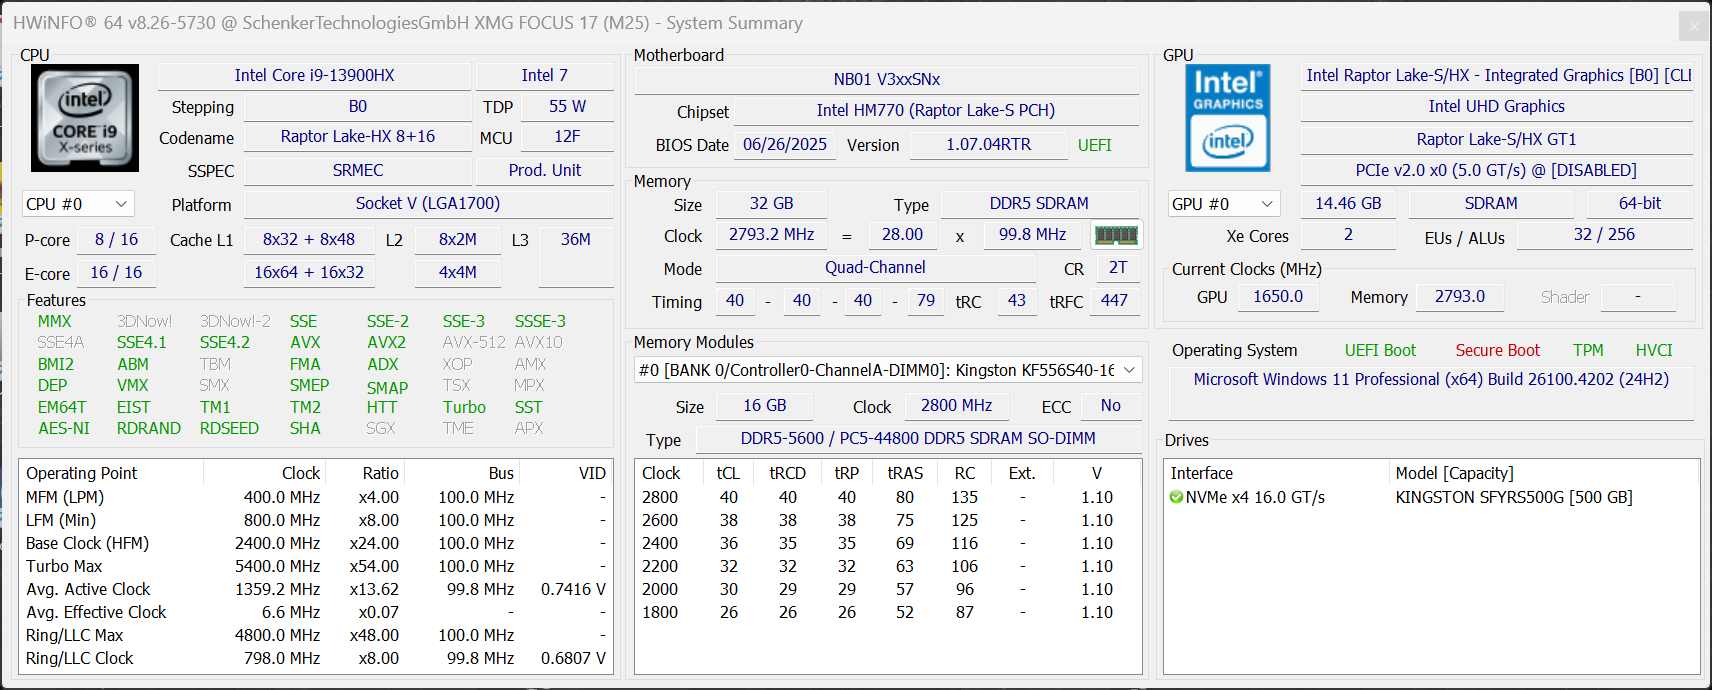
Processor - Core i9-13900HX
As standard, the Focus 17 M25 is fitted with the old Core i9-13900HX. However, the Core i9-14900HX is also optionally available. The CPU performance continues to be good, but, as expected, the Raptor Lake falls short of the Core Ultra 9 275HX. However, the more expensive Vector 17 with the 275HX is only minimally faster due to the lower power limits.
Cinebench R15 Multi Sustained Test
Cinebench 2024: CPU Multi Core | CPU Single Core
Cinebench R23: Multi Core | Single Core
Cinebench R20: CPU (Multi Core) | CPU (Single Core)
Cinebench R15: CPU Multi 64Bit | CPU Single 64Bit
Blender: v2.79 BMW27 CPU
7-Zip 18.03: 7z b 4 | 7z b 4 -mmt1
Geekbench 6.7: Multi-Core | Single-Core
Geekbench 5.5: Multi-Core | Single-Core
HWBOT x265 Benchmark v2.2: 4k Preset
LibreOffice : 20 Documents To PDF
R Benchmark 2.5: Overall mean
| CPU Performance rating | |
| Schenker XMG Pro 16 (E25) | |
| Lenovo Legion 5 Pro 16IAX10H -2! | |
| MSI Vector 17 HX AI A2XWIG -2! | |
| Schenker XMG Focus 17 M25 | |
| Average Intel Core i9-13900HX | |
| MSI Vector 16 HX AI A2XWHG | |
| Average of class Gaming | |
| Cinebench 2024 / CPU Multi Core | |
| Schenker XMG Pro 16 (E25) | |
| Schenker XMG Focus 17 M25 | |
| Average Intel Core i9-13900HX (n=1) | |
| MSI Vector 16 HX AI A2XWHG | |
| Average of class Gaming (486 - 2298, n=92, last 2 years) | |
| Cinebench 2024 / CPU Single Core | |
| Schenker XMG Pro 16 (E25) | |
| MSI Vector 16 HX AI A2XWHG | |
| Schenker XMG Focus 17 M25 | |
| Average Intel Core i9-13900HX (n=1) | |
| Average of class Gaming (95 - 138.2, n=92, last 2 years) | |
| Cinebench R23 / Multi Core | |
| Lenovo Legion 5 Pro 16IAX10H | |
| Schenker XMG Pro 16 (E25) | |
| MSI Vector 17 HX AI A2XWIG | |
| Schenker XMG Focus 17 M25 | |
| Average Intel Core i9-13900HX (24270 - 32623, n=23) | |
| MSI Vector 16 HX AI A2XWHG | |
| Average of class Gaming (10488 - 40970, n=113, last 2 years) | |
| Cinebench R23 / Single Core | |
| Lenovo Legion 5 Pro 16IAX10H | |
| Schenker XMG Pro 16 (E25) | |
| MSI Vector 17 HX AI A2XWIG | |
| MSI Vector 16 HX AI A2XWHG | |
| Schenker XMG Focus 17 M25 | |
| Average Intel Core i9-13900HX (1867 - 2105, n=20) | |
| Average of class Gaming (1166 - 2356, n=113, last 2 years) | |
| Cinebench R20 / CPU (Multi Core) | |
| Lenovo Legion 5 Pro 16IAX10H | |
| Schenker XMG Pro 16 (E25) | |
| MSI Vector 17 HX AI A2XWIG | |
| Schenker XMG Focus 17 M25 | |
| Average Intel Core i9-13900HX (9152 - 12541, n=21) | |
| MSI Vector 16 HX AI A2XWHG | |
| Average of class Gaming (4029 - 16108, n=112, last 2 years) | |
| Cinebench R20 / CPU (Single Core) | |
| Lenovo Legion 5 Pro 16IAX10H | |
| Schenker XMG Pro 16 (E25) | |
| MSI Vector 17 HX AI A2XWIG | |
| MSI Vector 16 HX AI A2XWHG | |
| Schenker XMG Focus 17 M25 | |
| Average Intel Core i9-13900HX (722 - 810, n=21) | |
| Average of class Gaming (442 - 895, n=112, last 2 years) | |
| Cinebench R15 / CPU Multi 64Bit | |
| Lenovo Legion 5 Pro 16IAX10H | |
| Schenker XMG Pro 16 (E25) | |
| MSI Vector 17 HX AI A2XWIG | |
| Average Intel Core i9-13900HX (3913 - 4970, n=22) | |
| Schenker XMG Focus 17 M25 | |
| MSI Vector 16 HX AI A2XWHG | |
| Average of class Gaming (1578 - 6271, n=113, last 2 years) | |
| Cinebench R15 / CPU Single 64Bit | |
| MSI Vector 17 HX AI A2XWIG | |
| MSI Vector 17 HX AI A2XWIG | |
| Schenker XMG Pro 16 (E25) | |
| Lenovo Legion 5 Pro 16IAX10H | |
| MSI Vector 16 HX AI A2XWHG | |
| Schenker XMG Focus 17 M25 | |
| Average of class Gaming (188.8 - 343, n=112, last 2 years) | |
| Average Intel Core i9-13900HX (247 - 304, n=22) | |
| Blender / v2.79 BMW27 CPU | |
| Average of class Gaming (80 - 330, n=110, last 2 years) | |
| MSI Vector 16 HX AI A2XWHG | |
| Average Intel Core i9-13900HX (101 - 153, n=22) | |
| MSI Vector 17 HX AI A2XWIG | |
| Schenker XMG Focus 17 M25 | |
| Lenovo Legion 5 Pro 16IAX10H | |
| Schenker XMG Pro 16 (E25) | |
| 7-Zip 18.03 / 7z b 4 | |
| Schenker XMG Focus 17 M25 | |
| Schenker XMG Pro 16 (E25) | |
| Lenovo Legion 5 Pro 16IAX10H | |
| Average Intel Core i9-13900HX (90675 - 127283, n=21) | |
| MSI Vector 17 HX AI A2XWIG | |
| Average of class Gaming (33491 - 148086, n=111, last 2 years) | |
| MSI Vector 16 HX AI A2XWHG | |
| 7-Zip 18.03 / 7z b 4 -mmt1 | |
| Schenker XMG Focus 17 M25 | |
| Schenker XMG Pro 16 (E25) | |
| Average Intel Core i9-13900HX (6340 - 7177, n=21) | |
| Lenovo Legion 5 Pro 16IAX10H | |
| MSI Vector 17 HX AI A2XWIG | |
| MSI Vector 16 HX AI A2XWHG | |
| Average of class Gaming (4199 - 7436, n=111, last 2 years) | |
| Geekbench 6.7 / Multi-Core | |
| Schenker XMG Pro 16 (E25) | |
| Lenovo Legion 5 Pro 16IAX10H | |
| MSI Vector 17 HX AI A2XWIG | |
| MSI Vector 16 HX AI A2XWHG | |
| Schenker XMG Focus 17 M25 | |
| Average Intel Core i9-13900HX (15031 - 18014, n=3) | |
| Average of class Gaming (6625 - 22104, n=112, last 2 years) | |
| Geekbench 6.7 / Single-Core | |
| Schenker XMG Pro 16 (E25) | |
| MSI Vector 17 HX AI A2XWIG | |
| Lenovo Legion 5 Pro 16IAX10H | |
| MSI Vector 16 HX AI A2XWHG | |
| Schenker XMG Focus 17 M25 | |
| Average of class Gaming (1490 - 3259, n=112, last 2 years) | |
| Average Intel Core i9-13900HX (2548 - 2892, n=3) | |
| Geekbench 5.5 / Multi-Core | |
| Schenker XMG Pro 16 (E25) | |
| Lenovo Legion 5 Pro 16IAX10H | |
| MSI Vector 17 HX AI A2XWIG | |
| Schenker XMG Focus 17 M25 | |
| Average Intel Core i9-13900HX (17614 - 21075, n=22) | |
| MSI Vector 16 HX AI A2XWHG | |
| Average of class Gaming (6460 - 27010, n=111, last 2 years) | |
| Geekbench 5.5 / Single-Core | |
| Schenker XMG Pro 16 (E25) | |
| Lenovo Legion 5 Pro 16IAX10H | |
| MSI Vector 17 HX AI A2XWIG | |
| MSI Vector 16 HX AI A2XWHG | |
| Schenker XMG Focus 17 M25 | |
| Average of class Gaming (986 - 2474, n=111, last 2 years) | |
| Average Intel Core i9-13900HX (1345 - 2093, n=22) | |
| HWBOT x265 Benchmark v2.2 / 4k Preset | |
| Schenker XMG Pro 16 (E25) | |
| Lenovo Legion 5 Pro 16IAX10H | |
| MSI Vector 17 HX AI A2XWIG | |
| MSI Vector 16 HX AI A2XWHG | |
| Schenker XMG Focus 17 M25 | |
| Average Intel Core i9-13900HX (23.5 - 34.4, n=22) | |
| Average of class Gaming (11.5 - 44.3, n=111, last 2 years) | |
| LibreOffice / 20 Documents To PDF | |
| Average of class Gaming (19 - 88.8, n=111, last 2 years) | |
| Schenker XMG Pro 16 (E25) | |
| Schenker XMG Focus 17 M25 | |
| Average Intel Core i9-13900HX (32.8 - 51.1, n=21) | |
| MSI Vector 16 HX AI A2XWHG | |
| MSI Vector 17 HX AI A2XWIG | |
| Lenovo Legion 5 Pro 16IAX10H | |
| R Benchmark 2.5 / Overall mean | |
| Average of class Gaming (0.3439 - 0.759, n=112, last 2 years) | |
| MSI Vector 16 HX AI A2XWHG | |
| MSI Vector 17 HX AI A2XWIG | |
| Lenovo Legion 5 Pro 16IAX10H | |
| Schenker XMG Pro 16 (E25) | |
| Schenker XMG Focus 17 M25 | |
| Average Intel Core i9-13900HX (0.375 - 0.4564, n=22) | |
* ... smaller is better
AIDA64: FP32 Ray-Trace | FPU Julia | CPU SHA3 | CPU Queen | FPU SinJulia | FPU Mandel | CPU AES | CPU ZLib | FP64 Ray-Trace | CPU PhotoWorxx
| Performance rating | |
| Lenovo Legion 5 Pro 16IAX10H | |
| Schenker XMG Pro 16 (E25) | |
| Schenker XMG Focus 17 M25 | |
| MSI Vector 17 HX AI A2XWIG | |
| Average Intel Core i9-13900HX | |
| Average of class Gaming | |
| MSI Vector 16 HX AI A2XWHG | |
| AIDA64 / FP32 Ray-Trace | |
| Lenovo Legion 5 Pro 16IAX10H | |
| Schenker XMG Pro 16 (E25) | |
| Average of class Gaming (10227 - 85542, n=110, last 2 years) | |
| MSI Vector 17 HX AI A2XWIG | |
| MSI Vector 16 HX AI A2XWHG | |
| Schenker XMG Focus 17 M25 | |
| Average Intel Core i9-13900HX (17589 - 27615, n=22) | |
| AIDA64 / FPU Julia | |
| Lenovo Legion 5 Pro 16IAX10H | |
| Schenker XMG Pro 16 (E25) | |
| MSI Vector 17 HX AI A2XWIG | |
| MSI Vector 16 HX AI A2XWHG | |
| Average of class Gaming (51376 - 238426, n=110, last 2 years) | |
| Schenker XMG Focus 17 M25 | |
| Average Intel Core i9-13900HX (88686 - 137015, n=22) | |
| AIDA64 / CPU SHA3 | |
| Schenker XMG Pro 16 (E25) | |
| Lenovo Legion 5 Pro 16IAX10H | |
| MSI Vector 17 HX AI A2XWIG | |
| Schenker XMG Focus 17 M25 | |
| MSI Vector 16 HX AI A2XWHG | |
| Average of class Gaming (2180 - 9817, n=110, last 2 years) | |
| Average Intel Core i9-13900HX (4362 - 7029, n=22) | |
| AIDA64 / CPU Queen | |
| Lenovo Legion 5 Pro 16IAX10H | |
| Schenker XMG Focus 17 M25 | |
| Average Intel Core i9-13900HX (125644 - 141385, n=22) | |
| Schenker XMG Pro 16 (E25) | |
| MSI Vector 17 HX AI A2XWIG | |
| Average of class Gaming (49785 - 173351, n=101, last 2 years) | |
| MSI Vector 16 HX AI A2XWHG | |
| AIDA64 / FPU SinJulia | |
| Schenker XMG Focus 17 M25 | |
| Average Intel Core i9-13900HX (12334 - 17179, n=22) | |
| Average of class Gaming (4424 - 33636, n=110, last 2 years) | |
| Schenker XMG Pro 16 (E25) | |
| Lenovo Legion 5 Pro 16IAX10H | |
| MSI Vector 17 HX AI A2XWIG | |
| MSI Vector 16 HX AI A2XWHG | |
| AIDA64 / FPU Mandel | |
| Schenker XMG Pro 16 (E25) | |
| Lenovo Legion 5 Pro 16IAX10H | |
| MSI Vector 17 HX AI A2XWIG | |
| MSI Vector 16 HX AI A2XWHG | |
| Average of class Gaming (25115 - 128721, n=110, last 2 years) | |
| Schenker XMG Focus 17 M25 | |
| Average Intel Core i9-13900HX (43850 - 69202, n=22) | |
| AIDA64 / CPU AES | |
| Average Intel Core i9-13900HX (89413 - 237881, n=22) | |
| Lenovo Legion 5 Pro 16IAX10H | |
| Schenker XMG Pro 16 (E25) | |
| Schenker XMG Focus 17 M25 | |
| MSI Vector 17 HX AI A2XWIG | |
| Average of class Gaming (39258 - 247074, n=110, last 2 years) | |
| MSI Vector 16 HX AI A2XWHG | |
| AIDA64 / CPU ZLib | |
| Lenovo Legion 5 Pro 16IAX10H | |
| Schenker XMG Pro 16 (E25) | |
| Schenker XMG Focus 17 M25 | |
| Average Intel Core i9-13900HX (1284 - 1958, n=22) | |
| MSI Vector 17 HX AI A2XWIG | |
| Average of class Gaming (574 - 2531, n=110, last 2 years) | |
| MSI Vector 16 HX AI A2XWHG | |
| AIDA64 / FP64 Ray-Trace | |
| Lenovo Legion 5 Pro 16IAX10H | |
| Schenker XMG Pro 16 (E25) | |
| Average of class Gaming (5509 - 45446, n=110, last 2 years) | |
| MSI Vector 16 HX AI A2XWHG | |
| MSI Vector 17 HX AI A2XWIG | |
| Schenker XMG Focus 17 M25 | |
| Average Intel Core i9-13900HX (9481 - 15279, n=22) | |
| AIDA64 / CPU PhotoWorxx | |
| Schenker XMG Pro 16 (E25) | |
| Lenovo Legion 5 Pro 16IAX10H | |
| MSI Vector 17 HX AI A2XWIG | |
| Schenker XMG Focus 17 M25 | |
| Average Intel Core i9-13900HX (42994 - 51994, n=22) | |
| Average of class Gaming (12271 - 89891, n=110, last 2 years) | |
| MSI Vector 16 HX AI A2XWHG | |
System performance
The Focus 17 is a very fast companion in everyday situations, and its benchmark results are also good. We didn't encounter any issues with system stability during testing.
PCMark 10: Score | Essentials | Productivity | Digital Content Creation
CrossMark: Overall | Productivity | Creativity | Responsiveness
WebXPRT 3: Overall
WebXPRT 4: Overall
Mozilla Kraken 1.1: Total
| Performance rating | |
| Lenovo Legion 5 Pro 16IAX10H | |
| Schenker XMG Pro 16 (E25) | |
| MSI Vector 17 HX AI A2XWIG | |
| Schenker XMG Focus 17 M25 | |
| Average Intel Core i9-13900HX, NVIDIA GeForce RTX 5070 Ti Laptop | |
| Average of class Gaming | |
| MSI Vector 16 HX AI A2XWHG | |
| PCMark 10 / Score | |
| Schenker XMG Pro 16 (E25) | |
| MSI Vector 17 HX AI A2XWIG | |
| Average of class Gaming (5828 - 11574, n=96, last 2 years) | |
| Lenovo Legion 5 Pro 16IAX10H | |
| MSI Vector 16 HX AI A2XWHG | |
| Schenker XMG Focus 17 M25 | |
| Average Intel Core i9-13900HX, NVIDIA GeForce RTX 5070 Ti Laptop (n=1) | |
| PCMark 10 / Essentials | |
| Schenker XMG Pro 16 (E25) | |
| Schenker XMG Focus 17 M25 | |
| Average Intel Core i9-13900HX, NVIDIA GeForce RTX 5070 Ti Laptop (n=1) | |
| MSI Vector 17 HX AI A2XWIG | |
| Lenovo Legion 5 Pro 16IAX10H | |
| MSI Vector 16 HX AI A2XWHG | |
| Average of class Gaming (8810 - 12600, n=100, last 2 years) | |
| PCMark 10 / Productivity | |
| Average of class Gaming (6845 - 18766, n=98, last 2 years) | |
| Lenovo Legion 5 Pro 16IAX10H | |
| Schenker XMG Pro 16 (E25) | |
| MSI Vector 16 HX AI A2XWHG | |
| MSI Vector 17 HX AI A2XWIG | |
| Schenker XMG Focus 17 M25 | |
| Average Intel Core i9-13900HX, NVIDIA GeForce RTX 5070 Ti Laptop (n=1) | |
| PCMark 10 / Digital Content Creation | |
| MSI Vector 17 HX AI A2XWIG | |
| Schenker XMG Pro 16 (E25) | |
| Lenovo Legion 5 Pro 16IAX10H | |
| Average of class Gaming (7602 - 19657, n=98, last 2 years) | |
| Schenker XMG Focus 17 M25 | |
| Average Intel Core i9-13900HX, NVIDIA GeForce RTX 5070 Ti Laptop (n=1) | |
| MSI Vector 16 HX AI A2XWHG | |
| CrossMark / Overall | |
| Schenker XMG Focus 17 M25 | |
| Average Intel Core i9-13900HX, NVIDIA GeForce RTX 5070 Ti Laptop (n=1) | |
| MSI Vector 17 HX AI A2XWIG | |
| Schenker XMG Pro 16 (E25) | |
| Lenovo Legion 5 Pro 16IAX10H | |
| Average of class Gaming (1366 - 2409, n=98, last 2 years) | |
| MSI Vector 16 HX AI A2XWHG | |
| CrossMark / Productivity | |
| MSI Vector 17 HX AI A2XWIG | |
| Lenovo Legion 5 Pro 16IAX10H | |
| Schenker XMG Focus 17 M25 | |
| Average Intel Core i9-13900HX, NVIDIA GeForce RTX 5070 Ti Laptop (n=1) | |
| Schenker XMG Pro 16 (E25) | |
| Average of class Gaming (1386 - 2254, n=98, last 2 years) | |
| MSI Vector 16 HX AI A2XWHG | |
| CrossMark / Creativity | |
| Schenker XMG Pro 16 (E25) | |
| Schenker XMG Focus 17 M25 | |
| Average Intel Core i9-13900HX, NVIDIA GeForce RTX 5070 Ti Laptop (n=1) | |
| Lenovo Legion 5 Pro 16IAX10H | |
| MSI Vector 17 HX AI A2XWIG | |
| MSI Vector 16 HX AI A2XWHG | |
| Average of class Gaming (1343 - 2729, n=98, last 2 years) | |
| CrossMark / Responsiveness | |
| Schenker XMG Focus 17 M25 | |
| Average Intel Core i9-13900HX, NVIDIA GeForce RTX 5070 Ti Laptop (n=1) | |
| MSI Vector 17 HX AI A2XWIG | |
| Lenovo Legion 5 Pro 16IAX10H | |
| Schenker XMG Pro 16 (E25) | |
| Average of class Gaming (1226 - 2334, n=98, last 2 years) | |
| MSI Vector 16 HX AI A2XWHG | |
| WebXPRT 3 / Overall | |
| Lenovo Legion 5 Pro 16IAX10H | |
| Schenker XMG Pro 16 (E25) | |
| MSI Vector 17 HX AI A2XWIG | |
| MSI Vector 16 HX AI A2XWHG | |
| Average of class Gaming (242 - 532, n=101, last 2 years) | |
| Average Intel Core i9-13900HX, NVIDIA GeForce RTX 5070 Ti Laptop (n=1) | |
| Schenker XMG Focus 17 M25 | |
| WebXPRT 4 / Overall | |
| Schenker XMG Pro 16 (E25) | |
| MSI Vector 17 HX AI A2XWIG | |
| Lenovo Legion 5 Pro 16IAX10H | |
| MSI Vector 16 HX AI A2XWHG | |
| Schenker XMG Focus 17 M25 | |
| Average Intel Core i9-13900HX, NVIDIA GeForce RTX 5070 Ti Laptop (n=1) | |
| Average of class Gaming (176.4 - 354, n=101, last 2 years) | |
| Mozilla Kraken 1.1 / Total | |
| Schenker XMG Focus 17 M25 | |
| Average Intel Core i9-13900HX, NVIDIA GeForce RTX 5070 Ti Laptop (n=1) | |
| Average of class Gaming (391 - 590, n=106, last 2 years) | |
| MSI Vector 16 HX AI A2XWHG | |
| MSI Vector 17 HX AI A2XWIG | |
| Lenovo Legion 5 Pro 16IAX10H | |
| Schenker XMG Pro 16 (E25) | |
* ... smaller is better
| PCMark 10 Score | 7560 points | |
Help | ||
| AIDA64 / Memory Copy | |
| Schenker XMG Pro 16 (E25) | |
| Schenker XMG Focus 17 M25 | |
| Lenovo Legion 5 Pro 16IAX10H | |
| MSI Vector 17 HX AI A2XWIG | |
| Average Intel Core i9-13900HX (67716 - 79193, n=22) | |
| Average of class Gaming (21750 - 129946, n=110, last 2 years) | |
| MSI Vector 16 HX AI A2XWHG | |
| AIDA64 / Memory Read | |
| Schenker XMG Pro 16 (E25) | |
| Schenker XMG Focus 17 M25 | |
| Lenovo Legion 5 Pro 16IAX10H | |
| MSI Vector 17 HX AI A2XWIG | |
| Average Intel Core i9-13900HX (73998 - 88462, n=22) | |
| MSI Vector 16 HX AI A2XWHG | |
| Average of class Gaming (22956 - 118858, n=110, last 2 years) | |
| AIDA64 / Memory Write | |
| Schenker XMG Pro 16 (E25) | |
| Lenovo Legion 5 Pro 16IAX10H | |
| MSI Vector 17 HX AI A2XWIG | |
| Average of class Gaming (22297 - 135096, n=110, last 2 years) | |
| Schenker XMG Focus 17 M25 | |
| Average Intel Core i9-13900HX (65472 - 77045, n=22) | |
| MSI Vector 16 HX AI A2XWHG | |
| AIDA64 / Memory Latency | |
| MSI Vector 17 HX AI A2XWIG | |
| Lenovo Legion 5 Pro 16IAX10H | |
| MSI Vector 16 HX AI A2XWHG | |
| Average of class Gaming (75.3 - 259, n=110, last 2 years) | |
| Schenker XMG Pro 16 (E25) | |
| Average Intel Core i9-13900HX (75.3 - 91.1, n=22) | |
| Schenker XMG Focus 17 M25 | |
* ... smaller is better
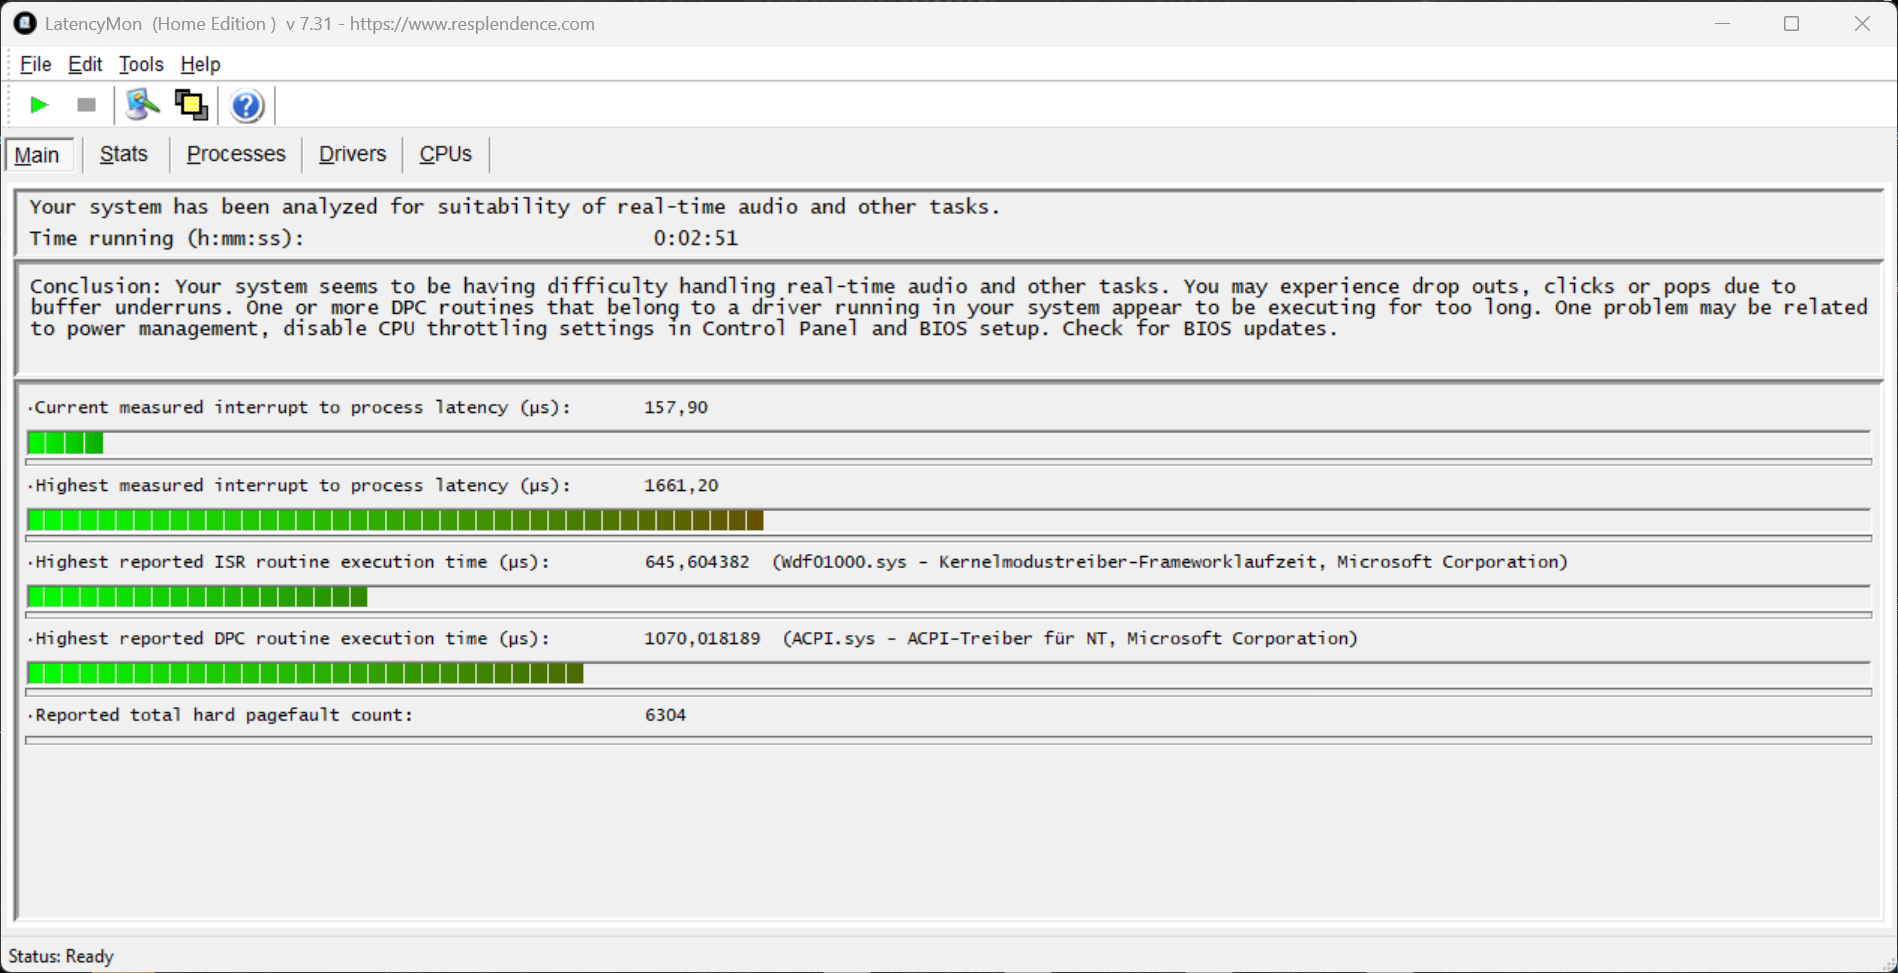
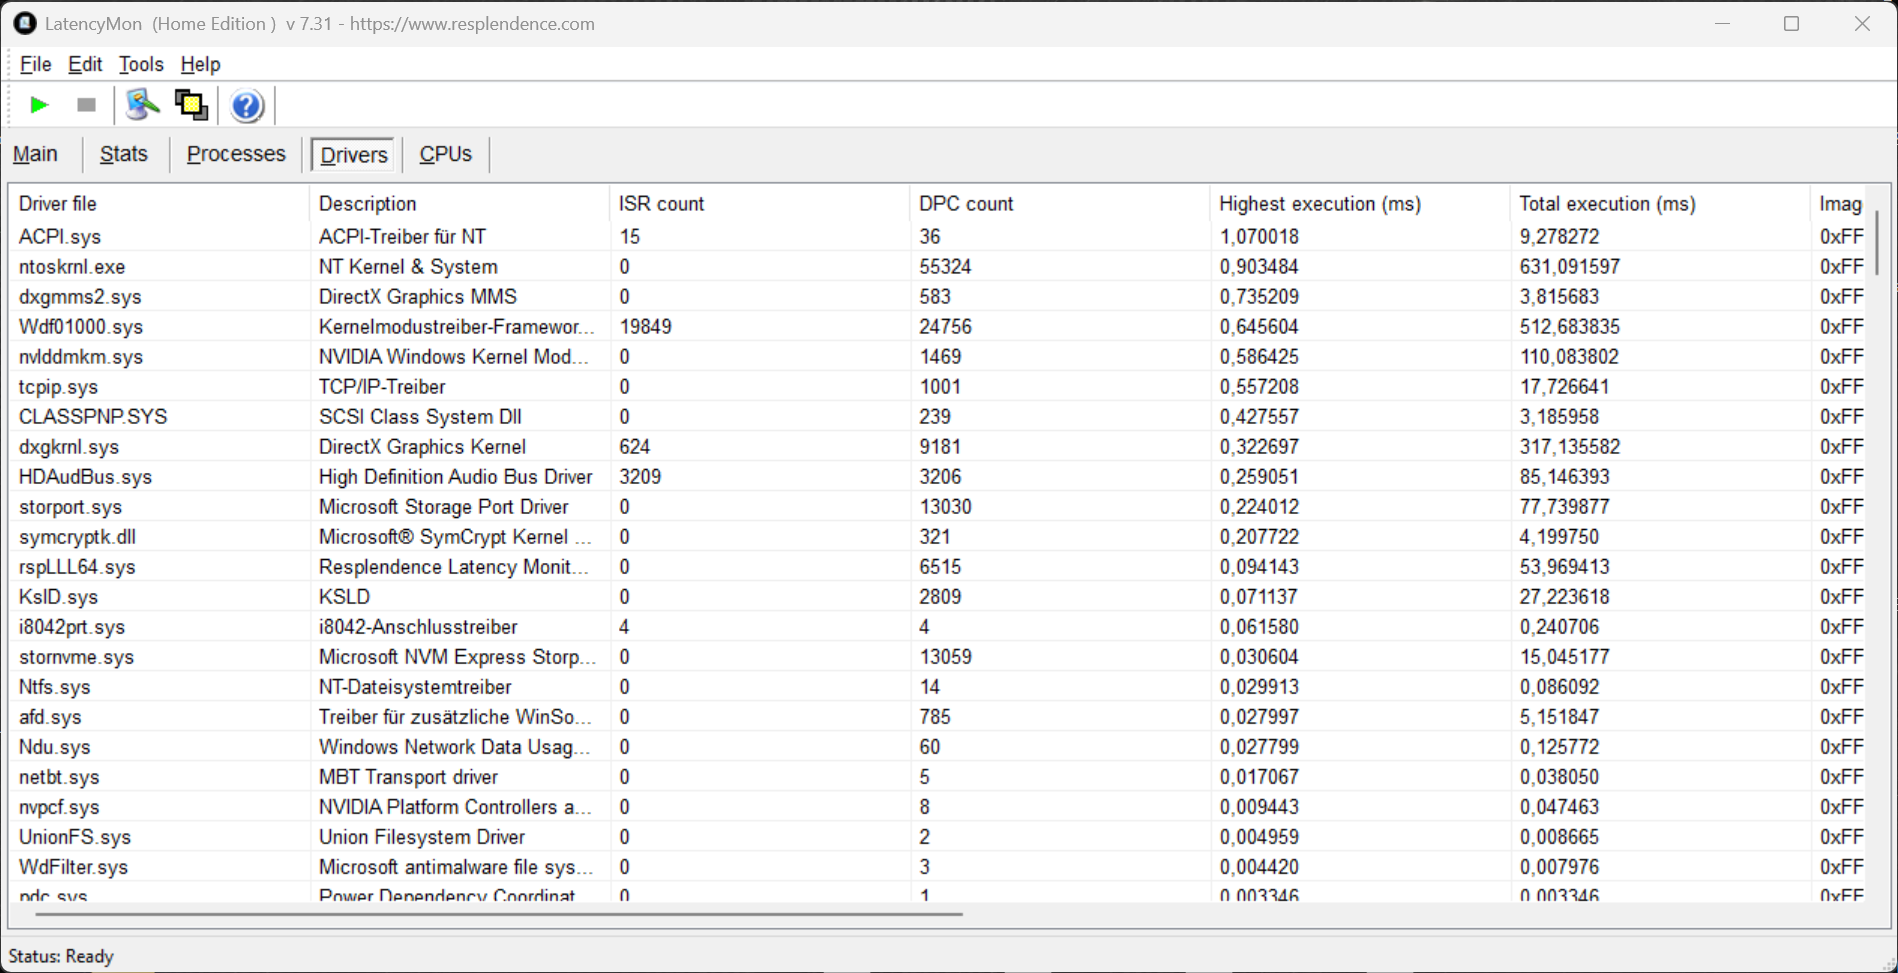
DPC latencies
In our standardized latency test (web browsing, 4K YouTube playback, CPU load), the review device (with the current BIOS version) showed slight limitations when using real-time audio applications.
| DPC Latencies / LatencyMon - interrupt to process latency (max), Web, Youtube, Prime95 | |
| MSI Vector 16 HX AI A2XWHG | |
| Schenker XMG Pro 16 (E25) | |
| Schenker XMG Focus 17 M25 | |
| MSI Vector 17 HX AI A2XWIG | |
| Lenovo Legion 5 Pro 16IAX10H | |
* ... smaller is better
Mass storage
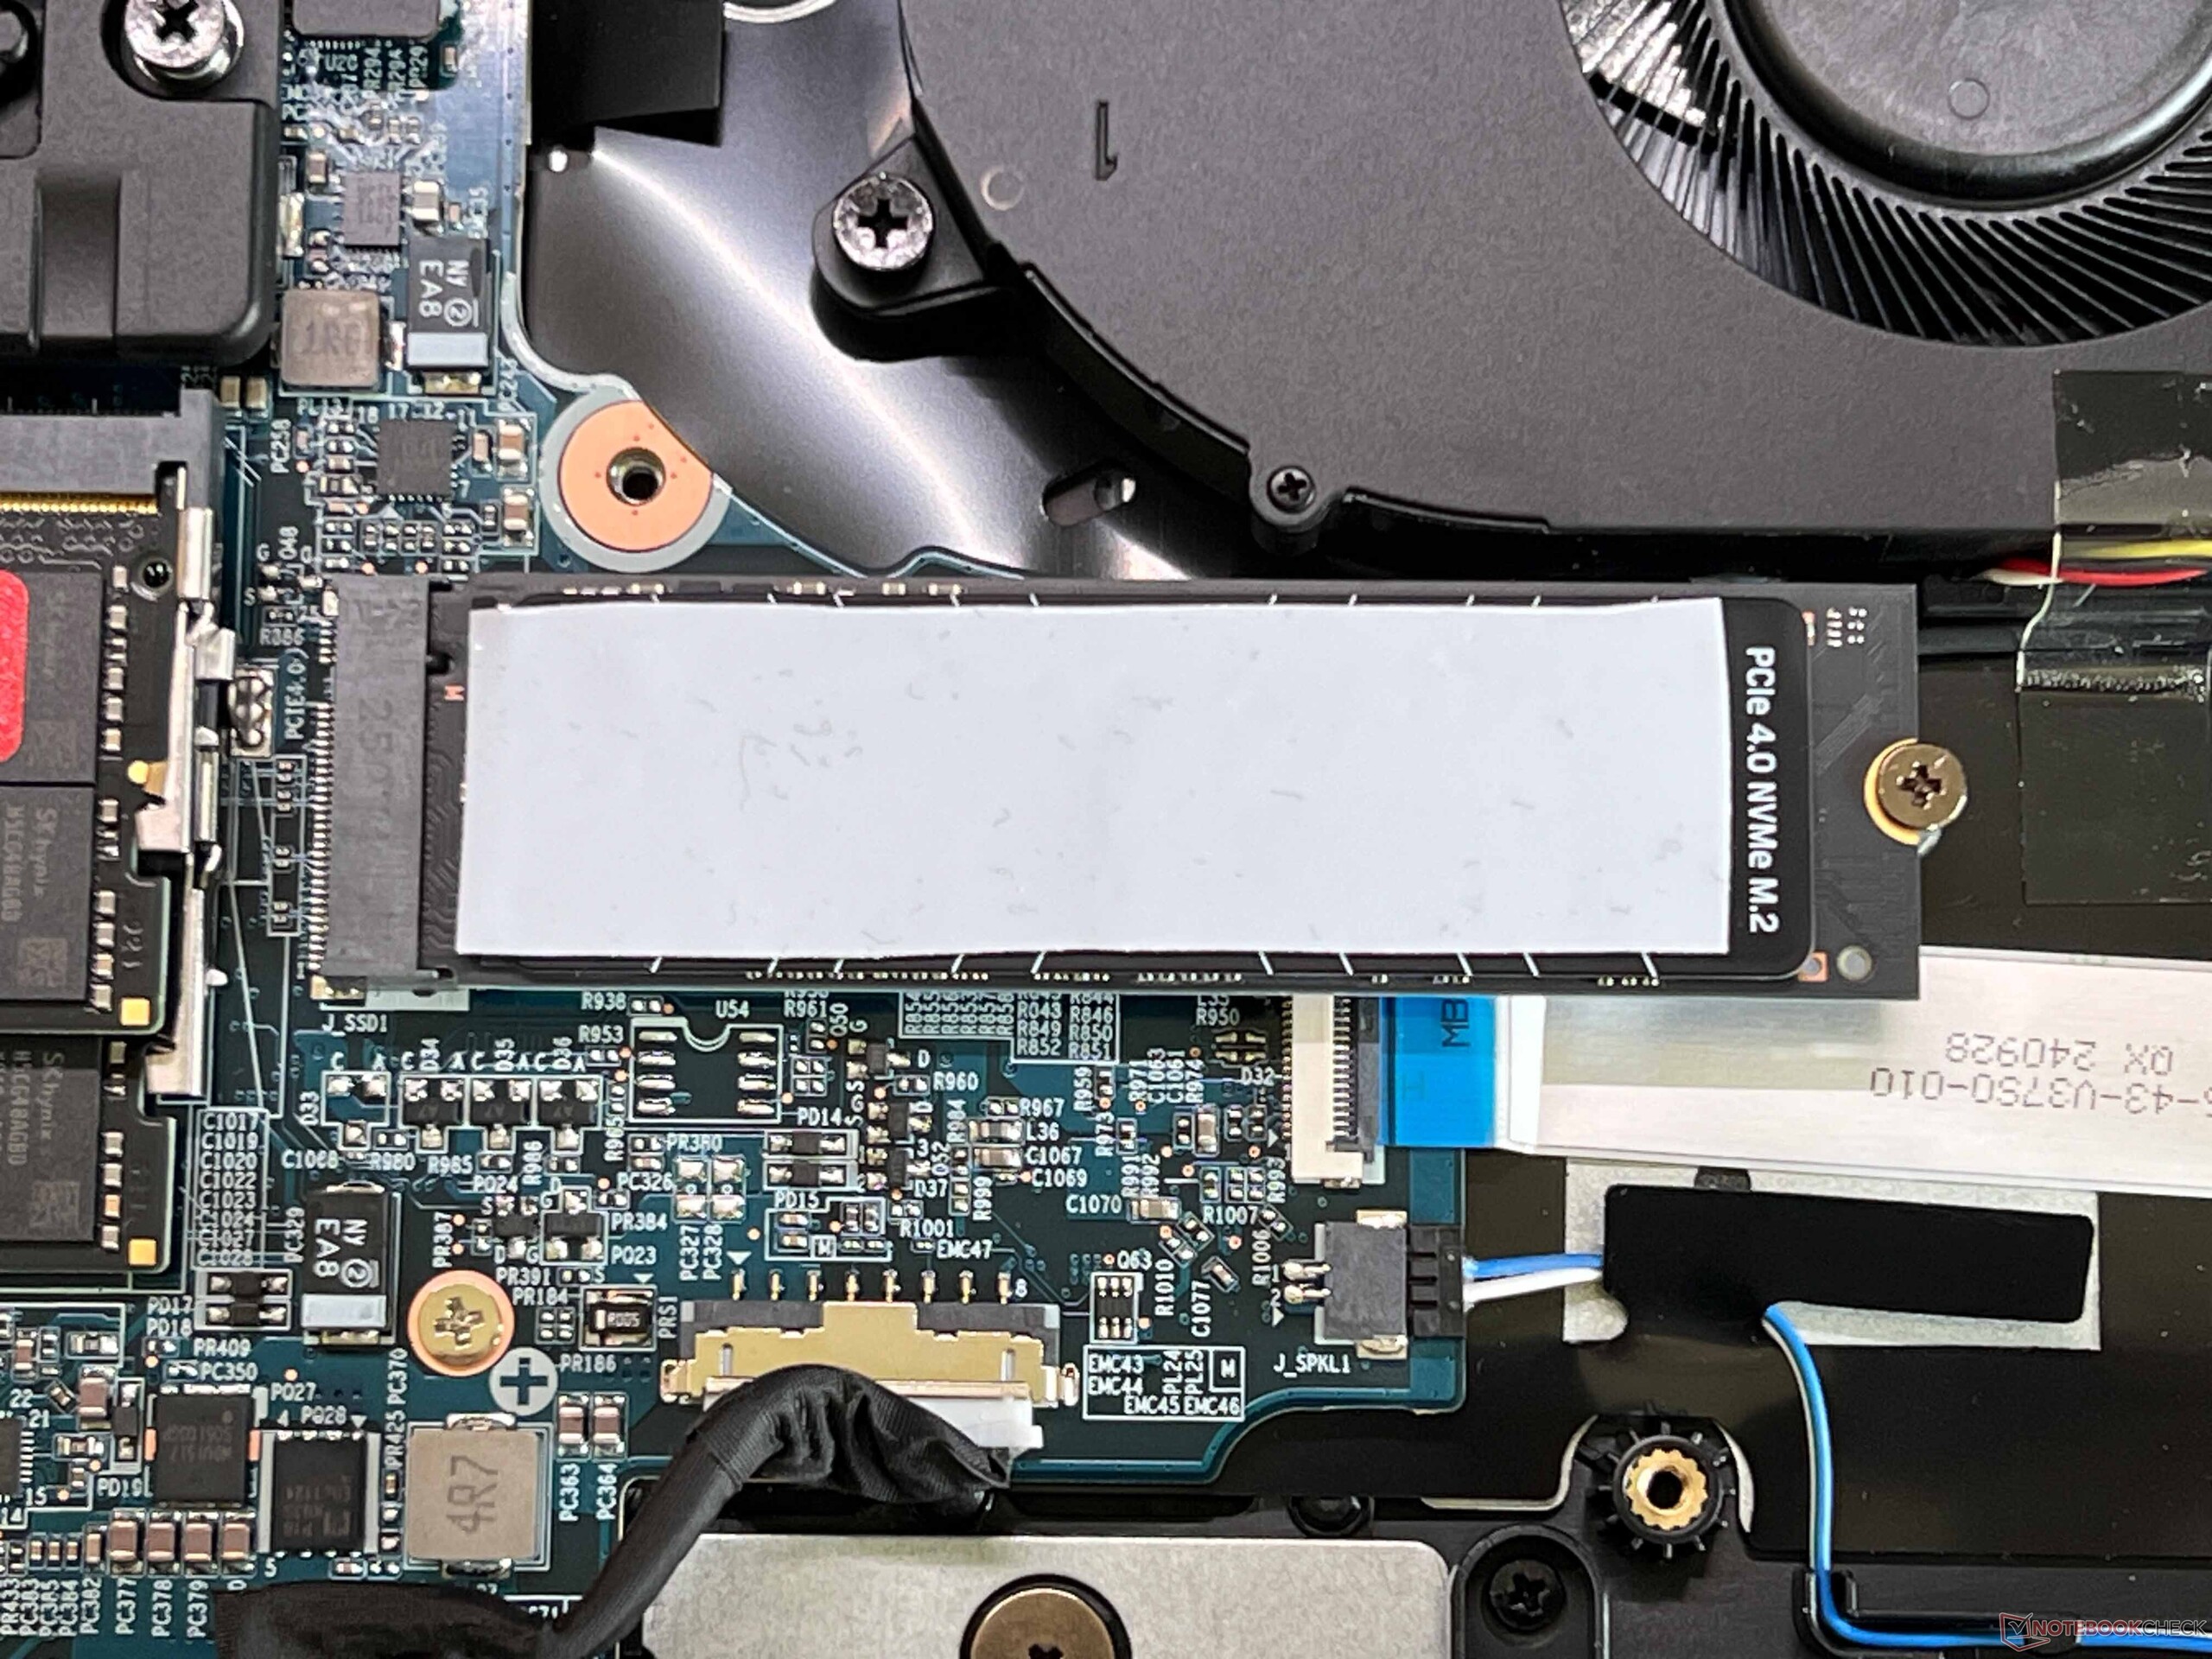
The Focus offers two slots for M.2 2280 SSDs (PCIe 4.0), and our review unit is equipped with a 500 GB Kingston drive (399 GB free). Transfer speeds are very good and remain stable even under extended load.

* ... smaller is better
Sustained Performance Read: DiskSpd Read Loop, Queue Depth 8
GPU performance
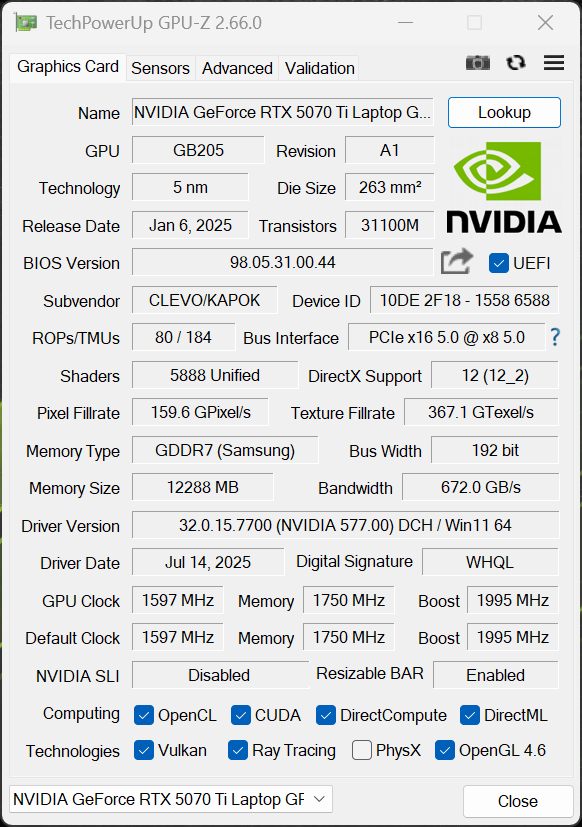
Das Focus 17 is exclusively equipped with the new GeForce RTX 5070 Ti laptop GPU (TGP 140 watts, 12 GB of VRAM). Graphics switching is handled via Optimus technology, and a multi-threaded switch is integrated. Graphics performance in synthetic benchmarks was excellent. Furthermore, GPU performance remained stable under sustained load.
Gaming performance is also very good, with all titles running smoothly at QHD resolution. However, performance was not entirely stable, as CPU performance dropped slightly after a few minutes. There will be slight differences depending on the title. In our test with Cyberpunk 2077, for example, performance dropped by approximately 5% after about 5 minutes.
| 3DMark 11 Performance | 43731 points | |
| 3DMark Fire Strike Score | 33824 points | |
| 3DMark Time Spy Score | 17276 points | |
| 3DMark Steel Nomad Score | 3932 points | |
| 3DMark Steel Nomad Light Score | 17797 points | |
| 3DMark Steel Nomad Light Unlimited Score | 18318 points | |
Help | ||
| Blender / v3.3 Classroom OPTIX/RTX | |
| Average of class Gaming (9 - 32, n=112, last 2 years) | |
| MSI Vector 16 HX AI A2XWHG | |
| Average NVIDIA GeForce RTX 5070 Ti Laptop (13 - 19, n=14) | |
| Lenovo Legion 5 Pro 16IAX10H | |
| Schenker XMG Pro 16 (E25) | |
| MSI Vector 17 HX AI A2XWIG | |
| Schenker XMG Focus 17 M25 | |
| Blender / v3.3 Classroom CUDA | |
| Average of class Gaming (15 - 228, n=112, last 2 years) | |
| Schenker XMG Focus 17 M25 | |
| Average NVIDIA GeForce RTX 5070 Ti Laptop (24 - 33, n=14) | |
| Schenker XMG Pro 16 (E25) | |
| MSI Vector 16 HX AI A2XWHG | |
| Lenovo Legion 5 Pro 16IAX10H | |
| MSI Vector 17 HX AI A2XWIG | |
| Blender / v3.3 Classroom CPU | |
| Average of class Gaming (122 - 565, n=108, last 2 years) | |
| MSI Vector 16 HX AI A2XWHG | |
| Average NVIDIA GeForce RTX 5070 Ti Laptop (122 - 361, n=14) | |
| Schenker XMG Focus 17 M25 | |
| MSI Vector 17 HX AI A2XWIG | |
| Lenovo Legion 5 Pro 16IAX10H | |
| Schenker XMG Pro 16 (E25) | |
* ... smaller is better
| Performance rating - Percent | |
| MSI Vector 17 HX AI A2XWIG | |
| Lenovo Legion 5 Pro 16IAX10H | |
| Schenker XMG Focus 17 M25 | |
| MSI Vector 16 HX AI A2XWHG -1! | |
| Schenker XMG Pro 16 (E25) | |
| Average of class Gaming | |
| Cyberpunk 2077 - 1920x1080 Ultra Preset (FSR off) | |
| MSI Vector 17 HX AI A2XWIG | |
| Lenovo Legion 5 Pro 16IAX10H | |
| Schenker XMG Pro 16 (E25) | |
| MSI Vector 16 HX AI A2XWHG | |
| Schenker XMG Focus 17 M25 | |
| Average of class Gaming (17.7 - 169.9, n=121, last 2 years) | |
| Baldur's Gate 3 - 1920x1080 Ultra Preset AA:T | |
| MSI Vector 17 HX AI A2XWIG | |
| Schenker XMG Pro 16 (E25) | |
| Schenker XMG Focus 17 M25 | |
| MSI Vector 16 HX AI A2XWHG | |
| Lenovo Legion 5 Pro 16IAX10H | |
| Average of class Gaming (59.4 - 246, n=107, last 2 years) | |
| GTA V - 1920x1080 Highest AA:4xMSAA + FX AF:16x | |
| Schenker XMG Pro 16 (E25) | |
| MSI Vector 17 HX AI A2XWIG | |
| Schenker XMG Focus 17 M25 | |
| Lenovo Legion 5 Pro 16IAX10H | |
| MSI Vector 16 HX AI A2XWHG | |
| Average of class Gaming (48.3 - 186.9, n=103, last 2 years) | |
| Final Fantasy XV Benchmark - 1920x1080 High Quality | |
| MSI Vector 17 HX AI A2XWIG | |
| Lenovo Legion 5 Pro 16IAX10H | |
| MSI Vector 16 HX AI A2XWHG | |
| Schenker XMG Focus 17 M25 | |
| Schenker XMG Pro 16 (E25) | |
| Average of class Gaming (41 - 215, n=104, last 2 years) | |
| Strange Brigade - 1920x1080 ultra AA:ultra AF:16 | |
| MSI Vector 17 HX AI A2XWIG | |
| Lenovo Legion 5 Pro 16IAX10H | |
| Schenker XMG Focus 17 M25 | |
| Average of class Gaming (76.3 - 456, n=94, last 2 years) | |
| Schenker XMG Pro 16 (E25) | |
| Dota 2 Reborn - 1920x1080 ultra (3/3) best looking | |
| Schenker XMG Pro 16 (E25) | |
| Lenovo Legion 5 Pro 16IAX10H | |
| MSI Vector 17 HX AI A2XWIG | |
| Schenker XMG Focus 17 M25 | |
| MSI Vector 16 HX AI A2XWHG | |
| Average of class Gaming (84.8 - 248, n=113, last 2 years) | |
| X-Plane 11.11 - 1920x1080 high (fps_test=3) | |
| Schenker XMG Focus 17 M25 | |
| Schenker XMG Pro 16 (E25) | |
| Lenovo Legion 5 Pro 16IAX10H | |
| MSI Vector 17 HX AI A2XWIG | |
| MSI Vector 16 HX AI A2XWHG | |
| Average of class Gaming (52.1 - 143.5, n=116, last 2 years) | |
| F1 24 - 2560x1440 Ultra High Preset AA:T AF:16x | |
| Schenker XMG Pro 16 (E25) | |
| Average of class Gaming (29.8 - 106.9, n=60, last 2 years) | |
| Schenker XMG Focus 17 M25 | |
| Average NVIDIA GeForce RTX 5070 Ti Laptop (53.2 - 72.1, n=10) | |
| F1 25 - 2560x1440 Ultra Max Preset AA:T AF:16x | |
| Average NVIDIA GeForce RTX 5070 Ti Laptop (18 - 26, n=7) | |
| Average of class Gaming (5 - 37.5, n=24, last 2 years) | |
| Lenovo Legion 5 Pro 16IAX10H | |
| Assassin's Creed Shadows - 2560x1440 Ultra High | |
| Schenker XMG Focus 17 M25 | |
| Average of class Gaming (22 - 64, n=48, last 2 years) | |
| Lenovo Legion 5 Pro 16IAX10H | |
| Average NVIDIA GeForce RTX 5070 Ti Laptop (40 - 48, n=9) | |
Cyberpunk 2077 ultra FPS diagram
| low | med. | high | ultra | QHD DLSS | QHD | |
|---|---|---|---|---|---|---|
| GTA V (2015) | 152.9 | 139.1 | ||||
| Dota 2 Reborn (2015) | 223 | 192.9 | 178.8 | 165.4 | ||
| Final Fantasy XV Benchmark (2018) | 223 | 197.6 | 156.8 | 129.5 | ||
| X-Plane 11.11 (2018) | 165 | 142.2 | 124.6 | |||
| Strange Brigade (2018) | 438 | 362 | 328 | 303 | 229 | |
| Baldur's Gate 3 (2023) | 202.6 | 172.8 | 154.2 | 153.9 | 108.6 | |
| Cyberpunk 2077 (2023) | 149.4 | 139.8 | 126.4 | 115.7 | 93.9 | 81 |
| F1 24 (2024) | 247 | 236 | 232 | 98.7 | 98.4 | 66.4 |
| Assassin's Creed Shadows (2025) | 90 | 84 | 72 | 55 | 47 |
Emissions & energy
Noise emissions
In everyday use, the two fans generally remain very quiet, even using the fast power profile, and the fan speed also reduces very quickly after the load phase ends. At 56.2 dB(A), things get very loud when gaming in the fastest mode, and headphones are recommended. Silent mode, on the other hand, is very quiet at a maximum of 37 dB(A), and gaming performance is still acceptable. No other electronic noises were detected on the review unit.
Noise level
| Idle |
| 24.8 / 24.8 / 27.7 dB(A) |
| Load |
| 51 / 56.2 dB(A) |
 | ||
30 dB silent 40 dB(A) audible 50 dB(A) loud |
||
min: | ||
| Schenker XMG Focus 17 M25 GeForce RTX 5070 Ti Laptop, i9-13900HX, Kingston Fury Renegade SFYRS500G | MSI Vector 17 HX AI A2XWIG GeForce RTX 5080 Laptop, Ultra 9 275HX, Western Digital PC SN5000S SDEPNSJ-2T00-1032 | Lenovo Legion 5 Pro 16IAX10H GeForce RTX 5070 Ti Laptop, Ultra 9 275HX, Western Digital PC SN8000S SDEPNRK-1T00 | MSI Vector 16 HX AI A2XWHG GeForce RTX 5070 Ti Laptop, Ultra 7 255HX, Micron 2400 MTFDKBA512QFM | Schenker XMG Pro 16 (E25) GeForce RTX 5070 Ti Laptop, Ultra 9 275HX, Samsung 9100 Pro 1 TB | |
|---|---|---|---|---|---|
| Noise | -0% | -2% | -10% | 5% | |
| off / environment * (dB) | 24.8 | 24 3% | 24 3% | 25 -1% | 23.3 6% |
| Idle Minimum * (dB) | 24.8 | 24 3% | 24 3% | 33 -33% | 25 -1% |
| Idle Average * (dB) | 24.8 | 30.82 -24% | 24 3% | 34 -37% | 25 -1% |
| Idle Maximum * (dB) | 27.7 | 31.31 -13% | 30.9 -12% | 38 -37% | 25 10% |
| Load Average * (dB) | 51 | 31.12 39% | 55.9 -10% | 46 10% | 45.5 11% |
| Cyberpunk 2077 ultra * (dB) | 56.2 | 59.24 -5% | 56.72 -1% | 47 16% | 53.3 5% |
| Load Maximum * (dB) | 56.2 | 59.24 -5% | 56.72 -1% | 49 13% | 53.3 5% |
* ... smaller is better
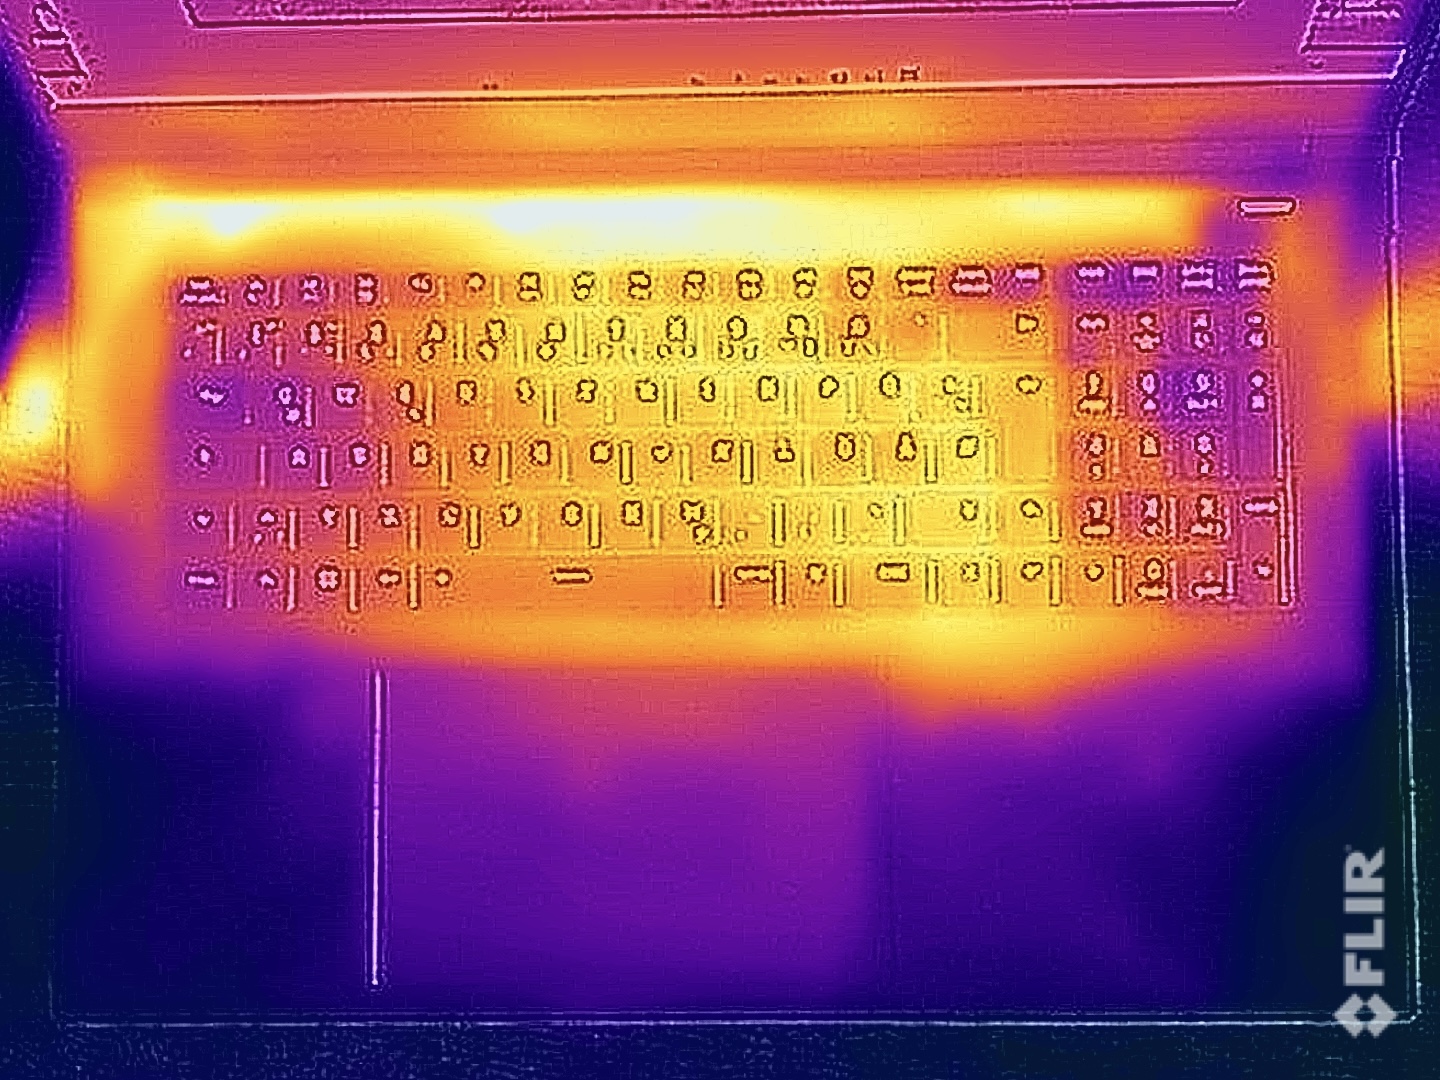
Temperature
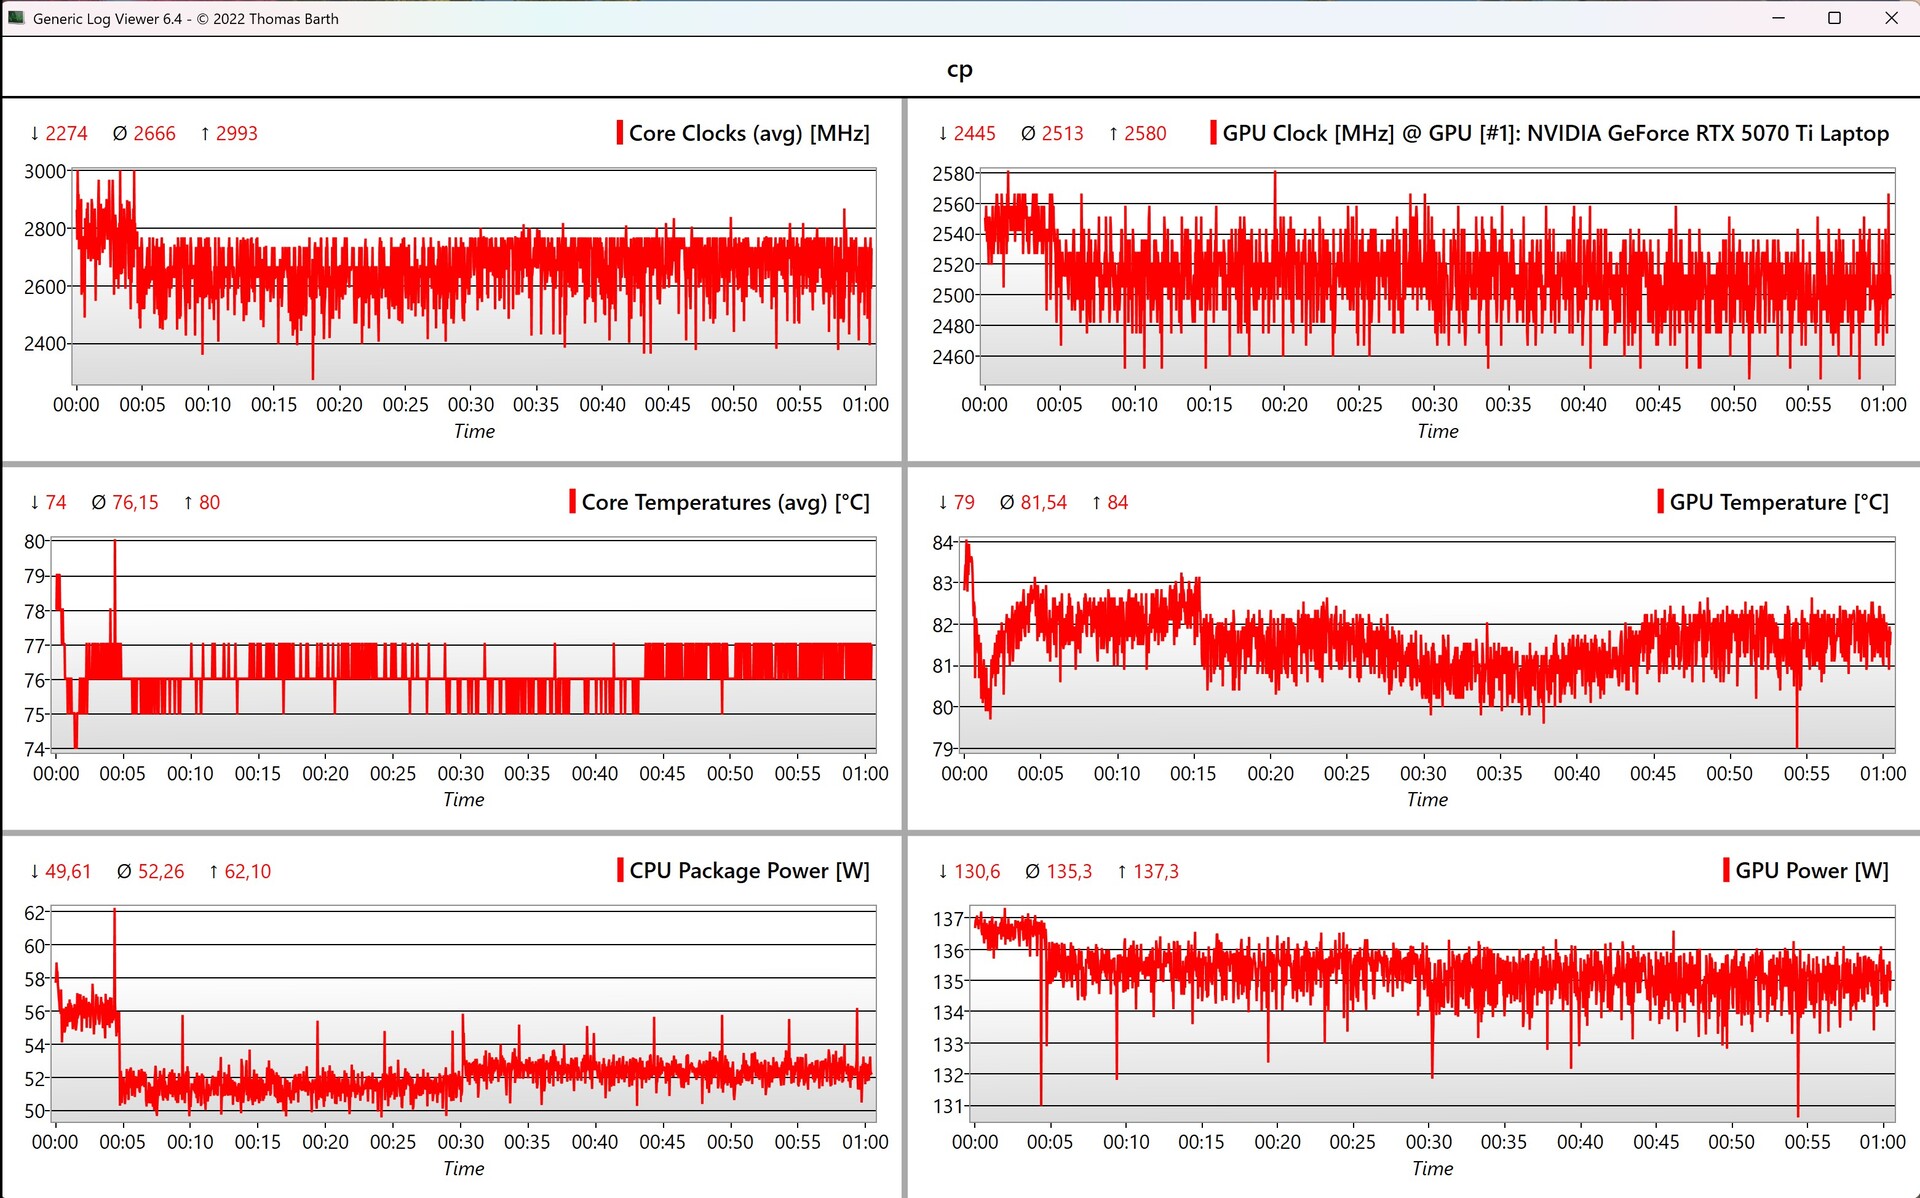
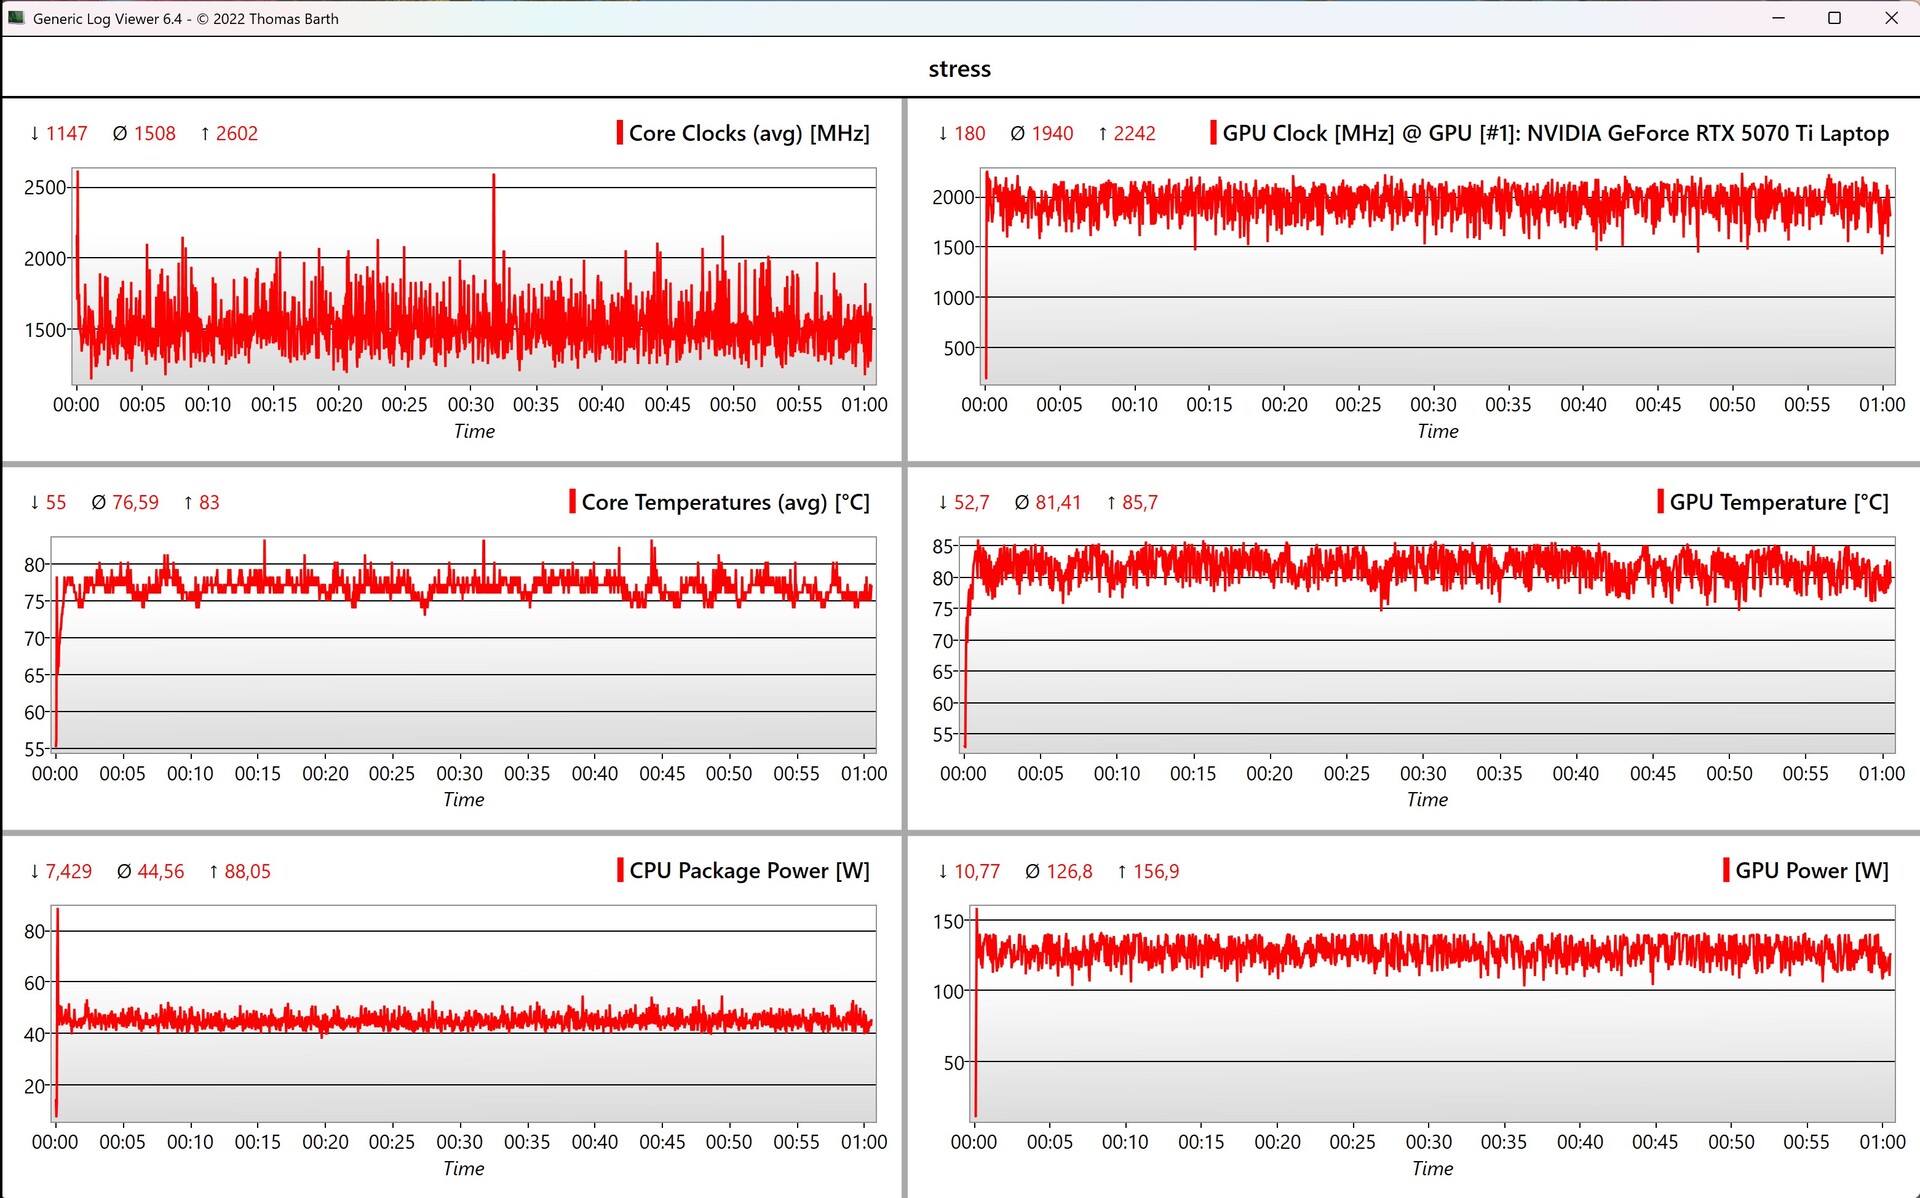
The surface temperatures remain unproblematic, and particularly the keyboard doesn't get too hot even while gaming. While the bottom panel reaches a maximum of 48°C, given its size, you probably won't place the Focus 17 on your lap anyway. In the stress test, the GPU operated at around 130 watts (81°C) and the CPU at 45 watts (77°C).
(±) The maximum temperature on the upper side is 41.2 °C / 106 F, compared to the average of 40.4 °C / 105 F, ranging from 21.2 to 68.8 °C for the class Gaming.
(-) The bottom heats up to a maximum of 48.8 °C / 120 F, compared to the average of 43.2 °C / 110 F
(+) In idle usage, the average temperature for the upper side is 26.6 °C / 80 F, compared to the device average of 33.9 °C / 93 F.
(±) 3: The average temperature for the upper side is 35.6 °C / 96 F, compared to the average of 33.9 °C / 93 F for the class Gaming.
(+) The palmrests and touchpad are cooler than skin temperature with a maximum of 28 °C / 82.4 F and are therefore cool to the touch.
(±) The average temperature of the palmrest area of similar devices was 28.8 °C / 83.8 F (+0.8 °C / 1.4 F).

| Schenker XMG Focus 17 M25 Intel Core i9-13900HX, NVIDIA GeForce RTX 5070 Ti Laptop | MSI Vector 17 HX AI A2XWIG Intel Core Ultra 9 275HX, NVIDIA GeForce RTX 5080 Laptop | Lenovo Legion 5 Pro 16IAX10H Intel Core Ultra 9 275HX, NVIDIA GeForce RTX 5070 Ti Laptop | MSI Vector 16 HX AI A2XWHG Intel Core Ultra 7 255HX, NVIDIA GeForce RTX 5070 Ti Laptop | Schenker XMG Pro 16 (E25) Intel Core Ultra 9 275HX, NVIDIA GeForce RTX 5070 Ti Laptop | |
|---|---|---|---|---|---|
| Heat | -24% | -24% | -13% | -194% | |
| Maximum Upper Side * (°C) | 41.2 | 53 -29% | 48 -17% | 53 -29% | 43.2 -5% |
| Maximum Bottom * (°C) | 48.8 | 54 -11% | 50 -2% | 52 -7% | 46 6% |
| Idle Upper Side * (°C) | 27.6 | 39 -41% | 38 -38% | 33 -20% | 27.7 -0% |
| Idle Bottom * (°C) | 30.1 | 34 -13% | 42 -40% | 29 4% | 264 -777% |
* ... smaller is better
Speakers
The two stereo speakers don't impress, with the sound appearing very thin and a low maximum volume.
Schenker XMG Focus 17 M25 audio analysis
(±) | speaker loudness is average but good (78.5 dB)
Bass 100 - 315 Hz
(-) | nearly no bass - on average 21.9% lower than median
(±) | linearity of bass is average (13.4% delta to prev. frequency)
Mids 400 - 2000 Hz
(+) | balanced mids - only 2.8% away from median
(±) | linearity of mids is average (7.3% delta to prev. frequency)
Highs 2 - 16 kHz
(+) | balanced highs - only 3.9% away from median
(+) | highs are linear (5.8% delta to prev. frequency)
Overall 100 - 16.000 Hz
(±) | linearity of overall sound is average (18.8% difference to median)
Compared to same class
» 62% of all tested devices in this class were better, 8% similar, 30% worse
» The best had a delta of 6%, average was 18%, worst was 132%
Compared to all devices tested
» 43% of all tested devices were better, 8% similar, 49% worse
» The best had a delta of 4%, average was 24%, worst was 134%
MSI Vector 17 HX AI A2XWIG audio analysis
(±) | speaker loudness is average but good (80.39 dB)
Bass 100 - 315 Hz
(±) | reduced bass - on average 10.4% lower than median
(±) | linearity of bass is average (7.4% delta to prev. frequency)
Mids 400 - 2000 Hz
(±) | higher mids - on average 6.2% higher than median
(+) | mids are linear (4.7% delta to prev. frequency)
Highs 2 - 16 kHz
(+) | balanced highs - only 4.3% away from median
(±) | linearity of highs is average (8.7% delta to prev. frequency)
Overall 100 - 16.000 Hz
(±) | linearity of overall sound is average (15.6% difference to median)
Compared to same class
» 36% of all tested devices in this class were better, 6% similar, 58% worse
» The best had a delta of 6%, average was 18%, worst was 132%
Compared to all devices tested
» 23% of all tested devices were better, 5% similar, 72% worse
» The best had a delta of 4%, average was 24%, worst was 134%
Lenovo Legion 5 Pro 16IAX10H audio analysis
(±) | speaker loudness is average but good (78.2 dB)
Bass 100 - 315 Hz
(-) | nearly no bass - on average 21.1% lower than median
(±) | linearity of bass is average (8% delta to prev. frequency)
Mids 400 - 2000 Hz
(±) | higher mids - on average 6.3% higher than median
(+) | mids are linear (6.5% delta to prev. frequency)
Highs 2 - 16 kHz
(+) | balanced highs - only 1.6% away from median
(+) | highs are linear (4.9% delta to prev. frequency)
Overall 100 - 16.000 Hz
(±) | linearity of overall sound is average (18.3% difference to median)
Compared to same class
» 58% of all tested devices in this class were better, 9% similar, 33% worse
» The best had a delta of 6%, average was 18%, worst was 132%
Compared to all devices tested
» 40% of all tested devices were better, 8% similar, 52% worse
» The best had a delta of 4%, average was 24%, worst was 134%
MSI Vector 16 HX AI A2XWHG audio analysis
(+) | speakers can play relatively loud (86 dB)
Bass 100 - 315 Hz
(±) | reduced bass - on average 12.3% lower than median
(±) | linearity of bass is average (8.5% delta to prev. frequency)
Mids 400 - 2000 Hz
(±) | higher mids - on average 9.9% higher than median
(+) | mids are linear (6.8% delta to prev. frequency)
Highs 2 - 16 kHz
(+) | balanced highs - only 1.8% away from median
(+) | highs are linear (2.9% delta to prev. frequency)
Overall 100 - 16.000 Hz
(±) | linearity of overall sound is average (15.8% difference to median)
Compared to same class
» 37% of all tested devices in this class were better, 7% similar, 56% worse
» The best had a delta of 6%, average was 18%, worst was 132%
Compared to all devices tested
» 24% of all tested devices were better, 5% similar, 71% worse
» The best had a delta of 4%, average was 24%, worst was 134%
Schenker XMG Pro 16 (E25) audio analysis
(±) | speaker loudness is average but good (79.2 dB)
Bass 100 - 315 Hz
(±) | reduced bass - on average 14.2% lower than median
(±) | linearity of bass is average (10.6% delta to prev. frequency)
Mids 400 - 2000 Hz
(±) | higher mids - on average 8.2% higher than median
(±) | linearity of mids is average (9.9% delta to prev. frequency)
Highs 2 - 16 kHz
(+) | balanced highs - only 3.8% away from median
(+) | highs are linear (5.9% delta to prev. frequency)
Overall 100 - 16.000 Hz
(±) | linearity of overall sound is average (18.5% difference to median)
Compared to same class
» 60% of all tested devices in this class were better, 8% similar, 32% worse
» The best had a delta of 6%, average was 18%, worst was 132%
Compared to all devices tested
» 41% of all tested devices were better, 8% similar, 51% worse
» The best had a delta of 4%, average was 24%, worst was 134%
Power consumption
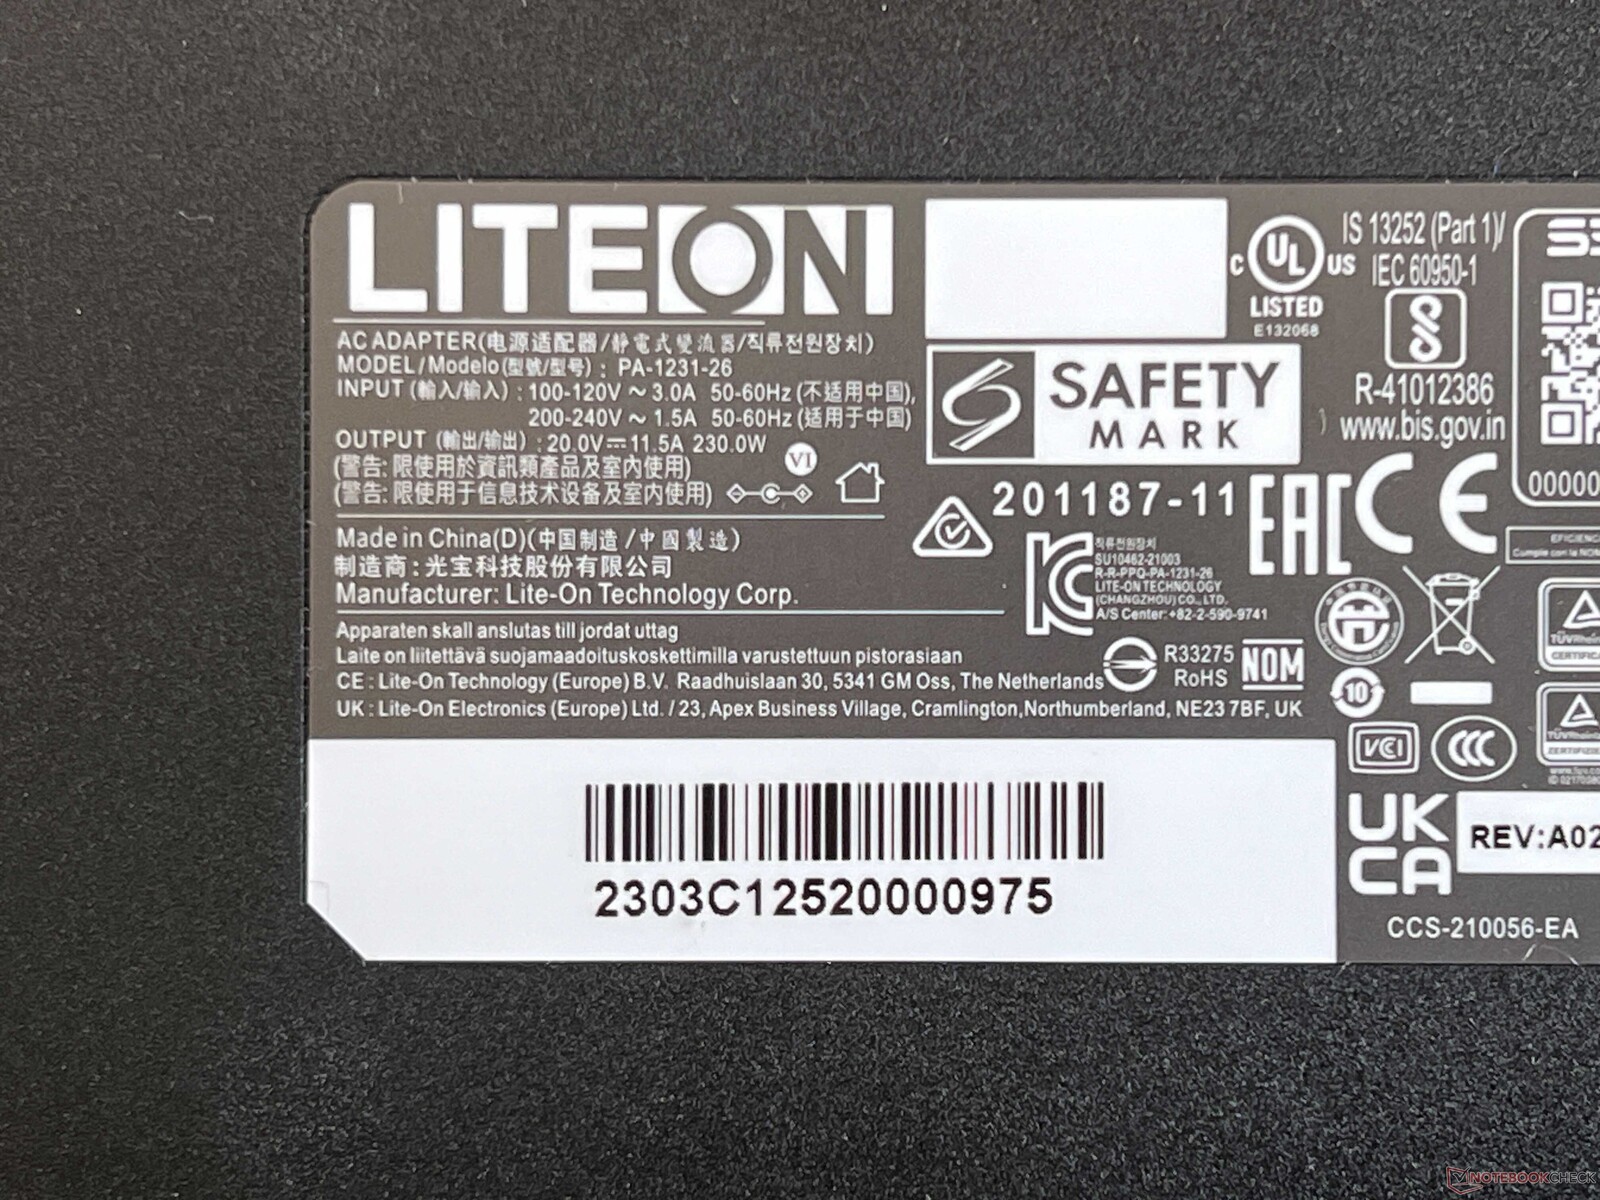
Running idle, the Focus remained quite economical at a maximum of 18 watts. However, under full load, we measured up to 290 watts, which then settled at around 245 watts. When gaming, it even reached up to 255 watts. This is somewhat problematic, as the package only includes a 230-watt power supply. Although the battery doesn't drain under load, a 280-watt power supply would still have been a better choice.
| Off / Standby | |
| Idle | |
| Load |
|
Key:
min: | |
| Schenker XMG Focus 17 M25 GeForce RTX 5070 Ti Laptop, i9-13900HX, Kingston Fury Renegade SFYRS500G | MSI Vector 17 HX AI A2XWIG GeForce RTX 5080 Laptop, Ultra 9 275HX, Western Digital PC SN5000S SDEPNSJ-2T00-1032 | Lenovo Legion 5 Pro 16IAX10H GeForce RTX 5070 Ti Laptop, Ultra 9 275HX, Western Digital PC SN8000S SDEPNRK-1T00 | MSI Vector 16 HX AI A2XWHG GeForce RTX 5070 Ti Laptop, Ultra 7 255HX, Micron 2400 MTFDKBA512QFM | Schenker XMG Pro 16 (E25) GeForce RTX 5070 Ti Laptop, Ultra 9 275HX, Samsung 9100 Pro 1 TB | |
|---|---|---|---|---|---|
| Power Consumption | -0% | -9% | -1% | 2% | |
| Idle Minimum * (Watt) | 12 | 10 17% | 14 -17% | 7.1 41% | 11.7 2% |
| Idle Average * (Watt) | 17.5 | 15.4 12% | 14.3 18% | 15.9 9% | 16.6 5% |
| Idle Maximum * (Watt) | 18.1 | 18.7 -3% | 20.1 -11% | 29.5 -63% | 17.1 6% |
| Load Average * (Watt) | 121.1 | 89.7 26% | 177 -46% | 124 -2% | 122.4 -1% |
| Cyberpunk 2077 ultra * (Watt) | 255 | 308 -21% | 255 -0% | 222 13% | 245 4% |
| Cyberpunk 2077 ultra external monitor * (Watt) | 244 | 300 -23% | 255 -5% | 217 11% | 241 1% |
| Load Maximum * (Watt) | 292.1 | 321 -10% | 294 -1% | 336 -15% | 291.5 -0% |
* ... smaller is better
Power consumption Cyberpunk / stress test
Power consumption with an external monitor
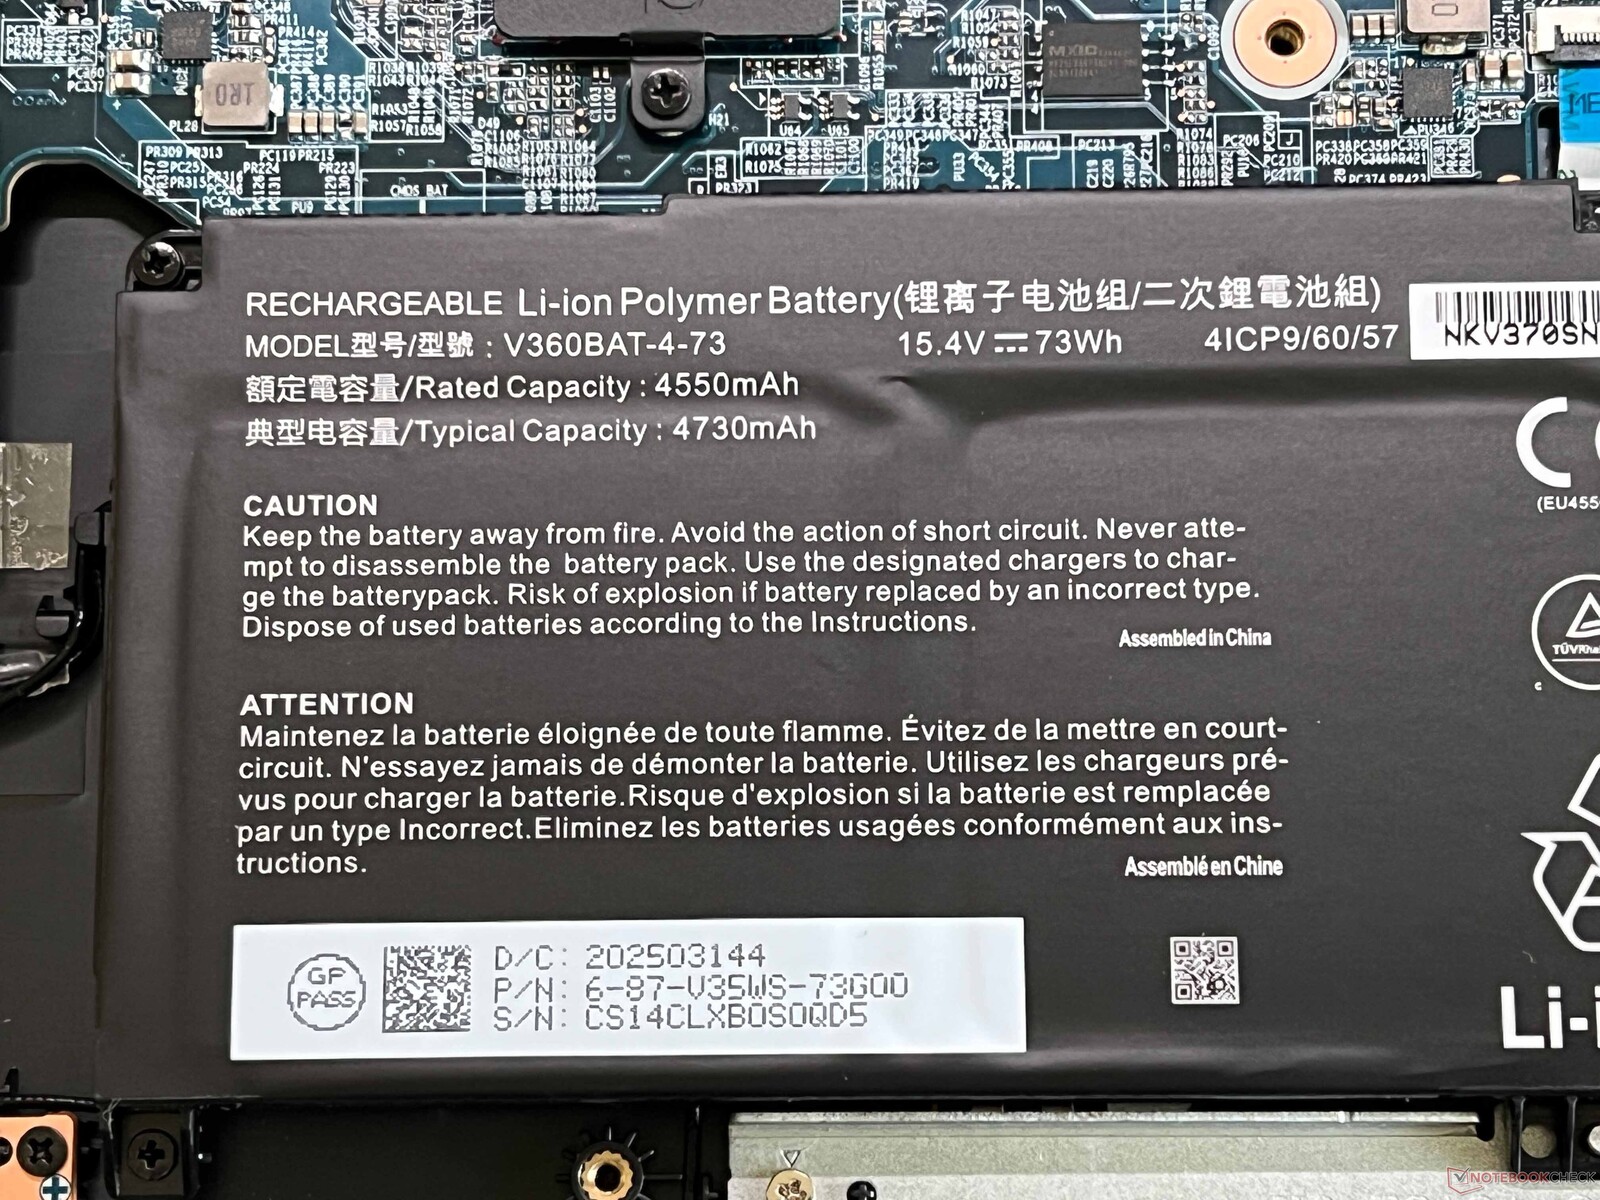
Battery life
Battery life with the 73 Wh battery can only be described as average. In our Wi-Fi test at 150 cd/m² (35% of the maximum brightness), we measured just under 6 hours, and at full brightness, we measured 4.5 hours.
Notebookcheck overall rating
Schenker XMG Focus 17 M25
- 08/04/2025 v8
Andreas Osthoff
 Total Sustainability Score:
 Possible alternatives compared
Image | Model / Review | Price | Weight | Height | Display |
|---|---|---|---|---|---|
1. 82.5%  | Schenker XMG Focus 17 M25 Intel Core i9-13900HX ⎘ NVIDIA GeForce RTX 5070 Ti Laptop ⎘ 32 GB Memory, 500 GB NVMe | Amazon: List Price: 1990€ | 2.8 kg | 28.5 mm | 17.30" 2560x1440 170 PPI IPS |
2. 84.3%  | MSI Vector 17 HX AI A2XWIG Intel Core Ultra 9 275HX ⎘ NVIDIA GeForce RTX 5080 Laptop ⎘ 32 GB Memory, 2048 GB SSD | Amazon: List Price: 3499 Euro | 3 kg | 28.8 mm | 17.00" 2560x1600 178 PPI IPS |
3. 84.5%  | Lenovo Legion 5 Pro 16IAX10H Intel Core Ultra 9 275HX ⎘ NVIDIA GeForce RTX 5070 Ti Laptop ⎘ 32 GB Memory, 1024 GB SSD | Amazon: 1. $1,649.99 Lenovo Legion Pro 5 AI Gamin... 2. $99.99 Lenovo Slim 245W AC Adapter ... 3. $2,801.75 Lenovo Legion Pro 7 16IAX10H... List Price: 2500 Euro | 2.4 kg | 25.95 mm | 16.00" 2560x1600 189 PPI OLED |
4. 84%  | MSI Vector 16 HX AI A2XWHG Intel Core Ultra 7 255HX ⎘ NVIDIA GeForce RTX 5070 Ti Laptop ⎘ 16 GB Memory, 512 GB SSD | Amazon: List Price: 2000 EUR | 2.6 kg | 28.6 mm | 16.00" 2560x1600 189 PPI IPS |
5. 87.4%  | Schenker XMG Pro 16 (E25) Intel Core Ultra 9 275HX ⎘ NVIDIA GeForce RTX 5070 Ti Laptop ⎘ 32 GB Memory, 1024 GB SSD | Amazon: 1. $22.79 Very Best of Michael Schenke... List Price: 2480€ | 2.5 kg | 26.5 mm | 16.00" 2560x1600 189 PPI IPS |
Transparency
The selection of devices to be reviewed is made by our editorial team. The test sample was provided to the author as a loan by the manufacturer or retailer for the purpose of this review. The lender had no influence on this review, nor did the manufacturer receive a copy of this review before publication. There was no obligation to publish this review. As an independent media company, Notebookcheck is not subjected to the authority of manufacturers, retailers or publishers.
This is how Notebookcheck is testing
Every year, Notebookcheck independently reviews hundreds of laptops and smartphones using standardized procedures to ensure that all results are comparable. We have continuously developed our test methods for around 20 years and set industry standards in the process. In our test labs, high-quality measuring equipment is utilized by experienced technicians and editors. These tests involve a multi-stage validation process. Our complex rating system is based on hundreds of well-founded measurements and benchmarks, which maintains objectivity. Further information on our test methods can be found here.

