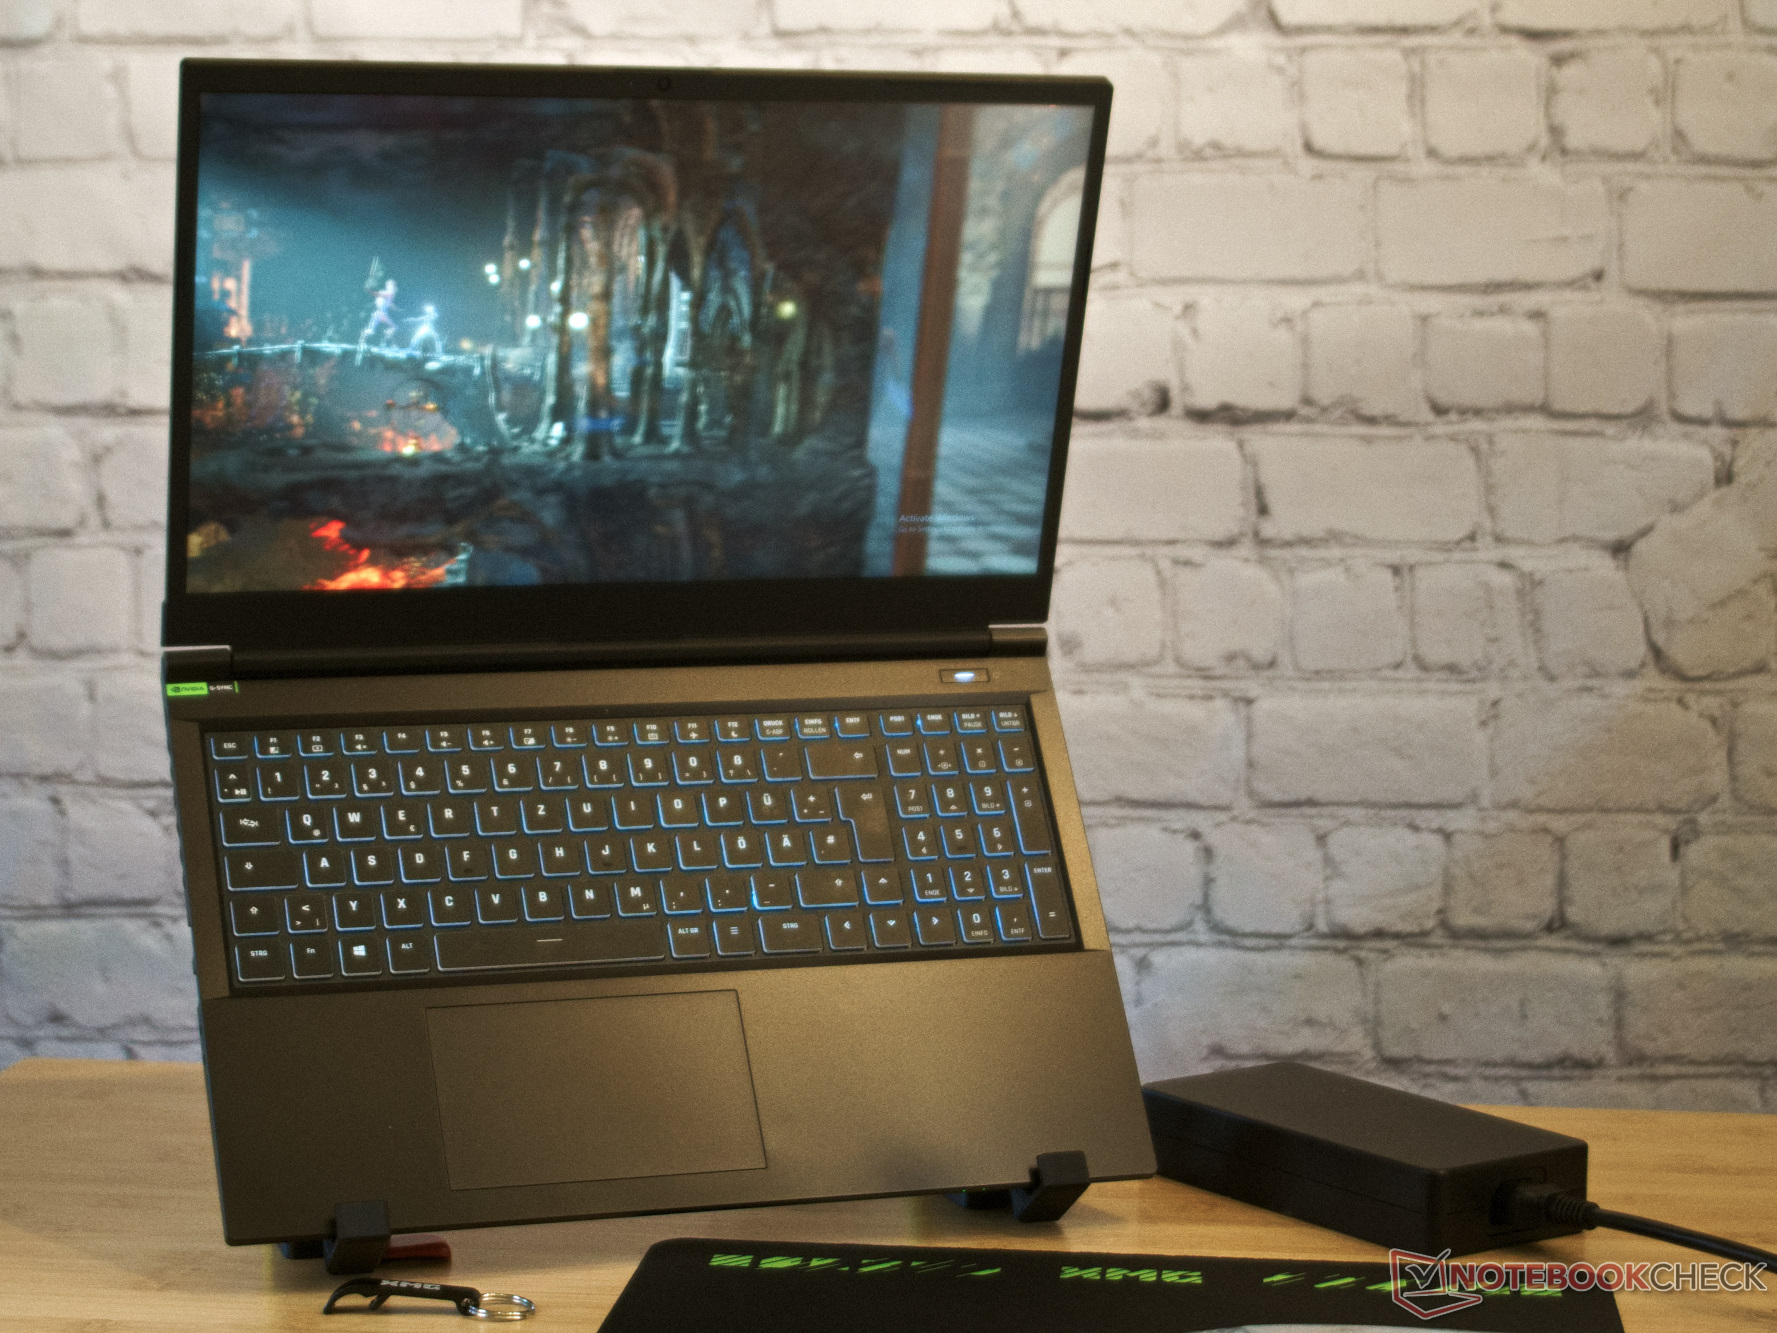
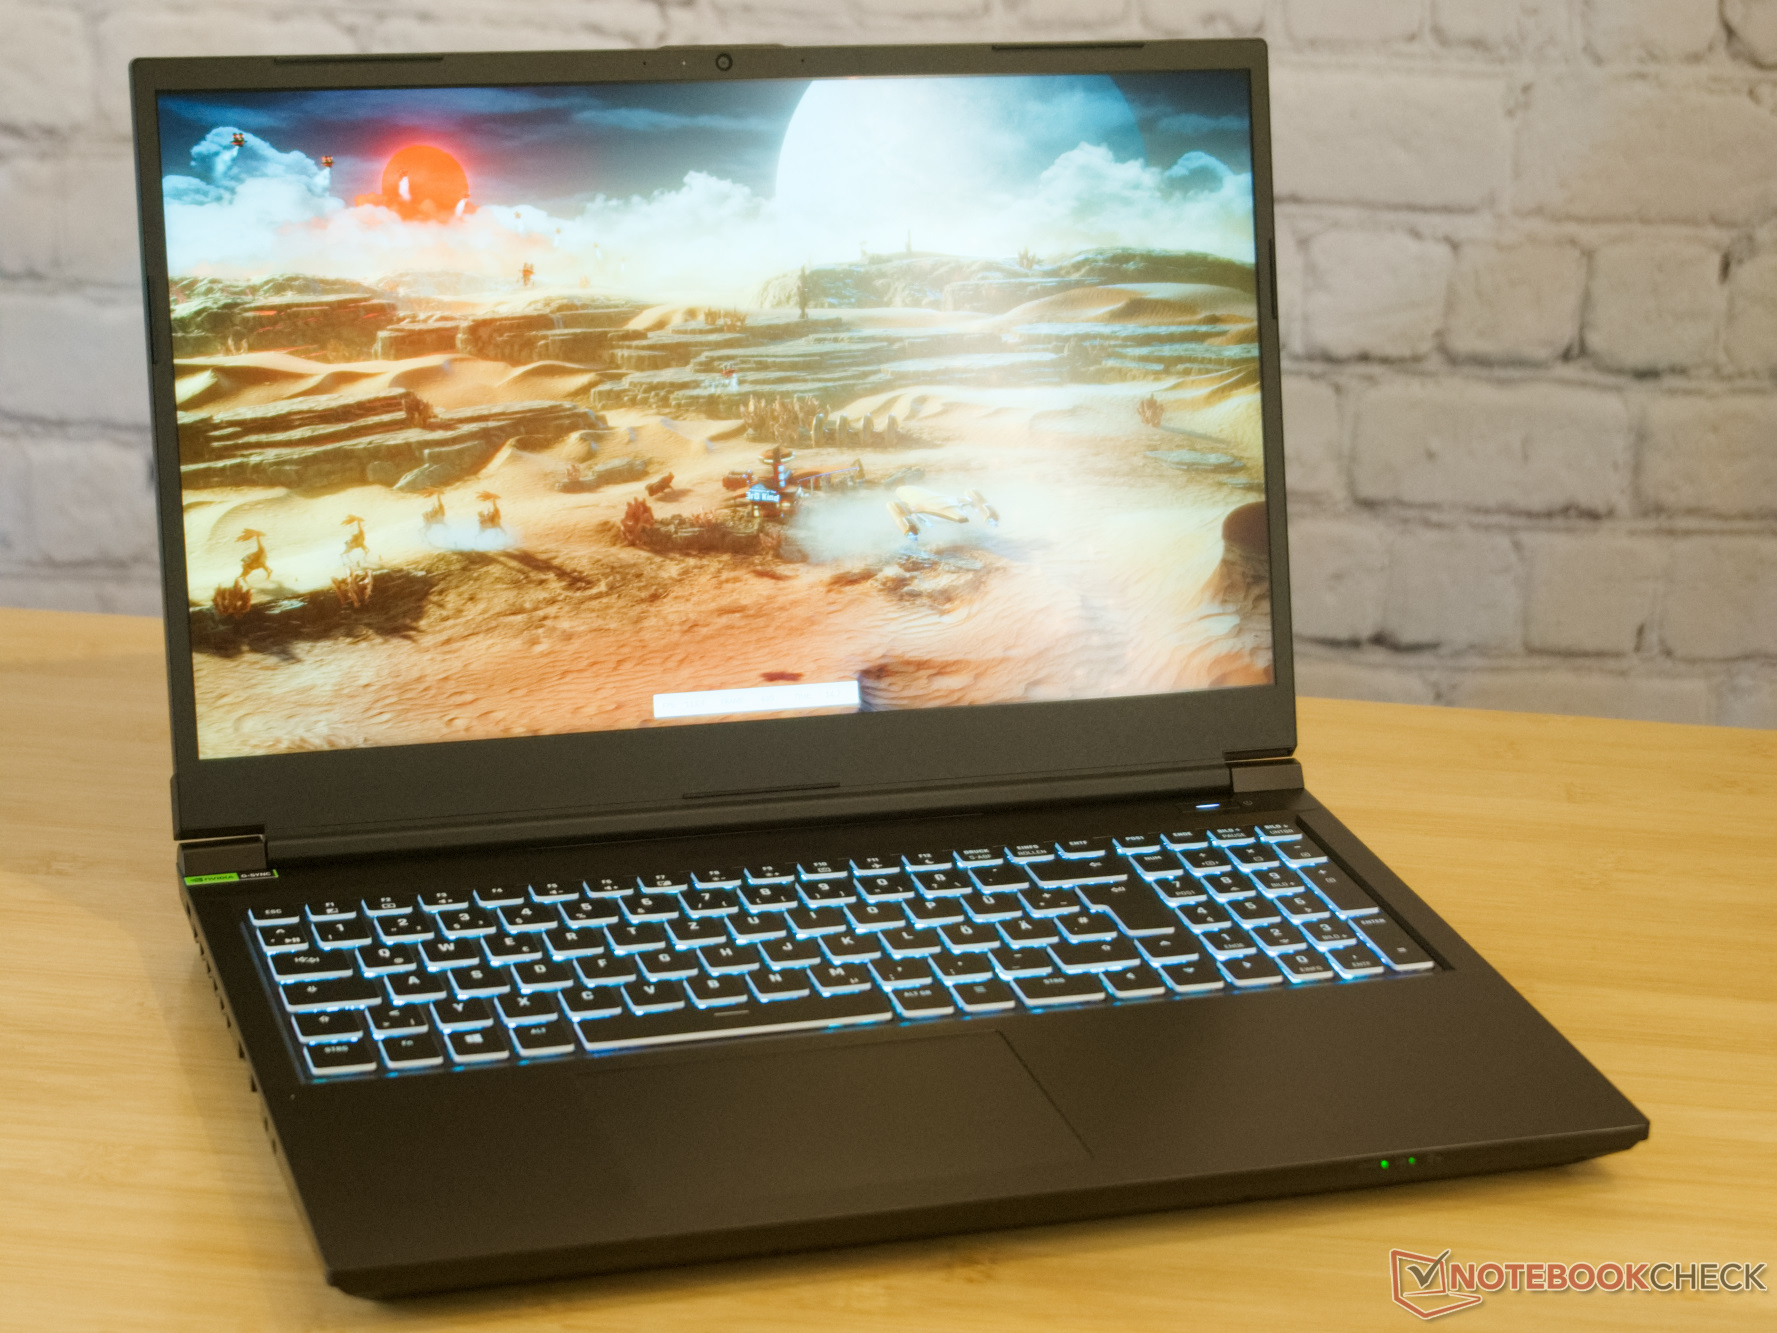
Schenker XMG Focus 15 (E23) budget gaming laptop review: A lot of performance at a lesser price than the Pro 15

We first tested the XMG Focus 15 back at the end of 2021. The Focus 15 was a laptop that pushed the then brand new RTX 3050 Ti Laptop GPU to its limits. Despite its cooling, the XMG Focus 15 showed only above-average performance under high temperatures.
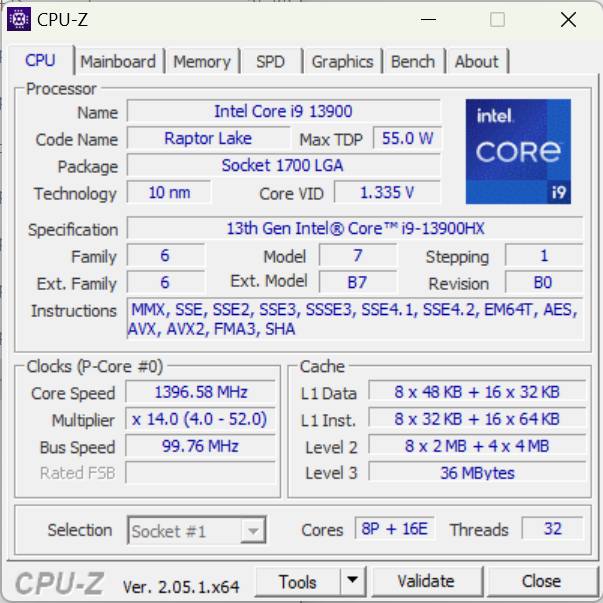
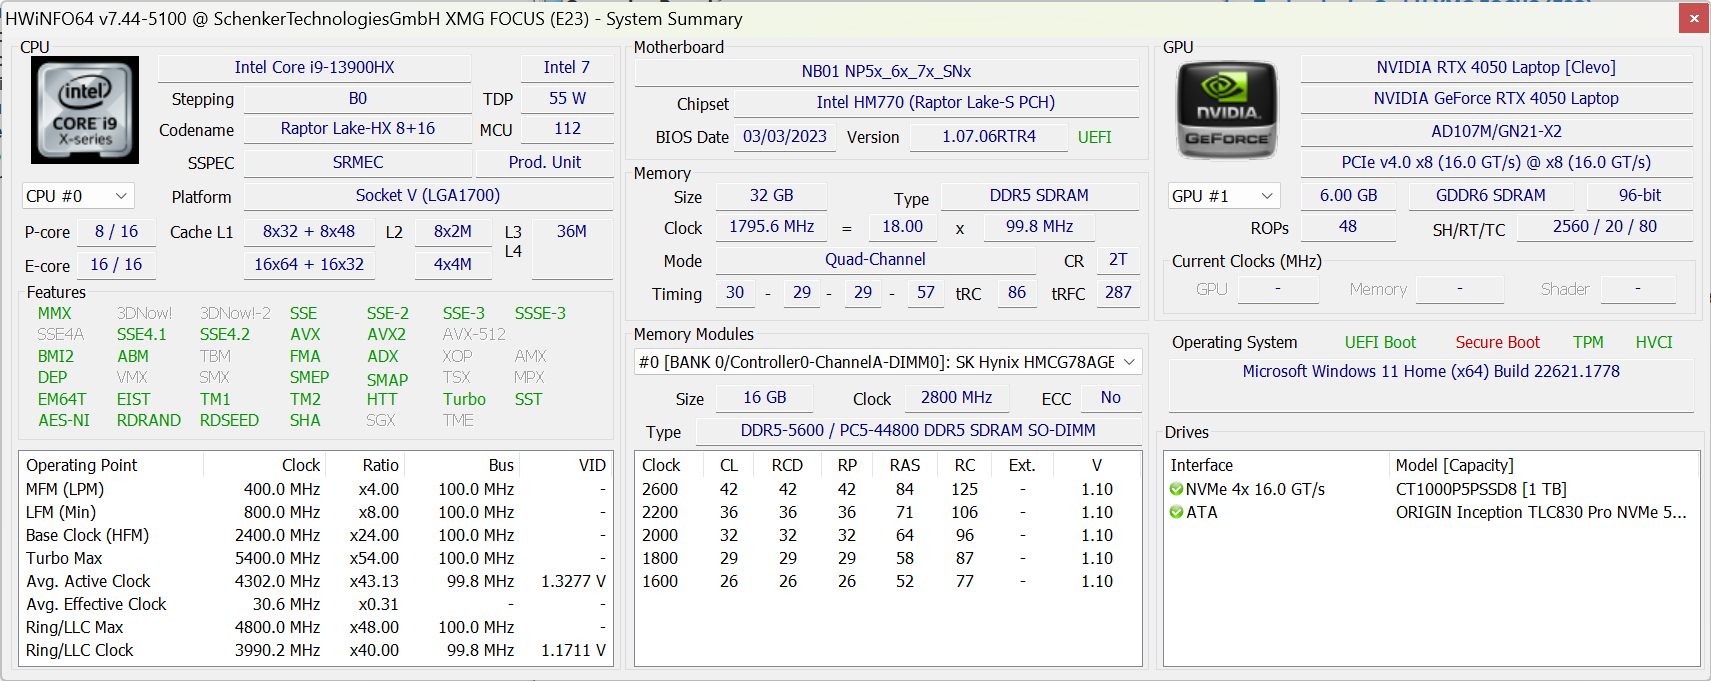
Schenker once again relies on a barebone from Clevo for the current Focus 15, and this time it is the NP50SNC chassis. Similar to the recently tested XMG Pro 15, we find an Intel Core i9-13900HX installed in the new Focus 15.
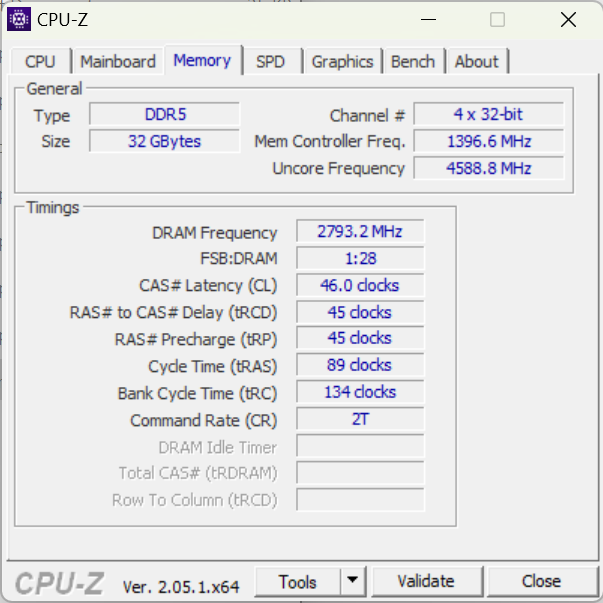
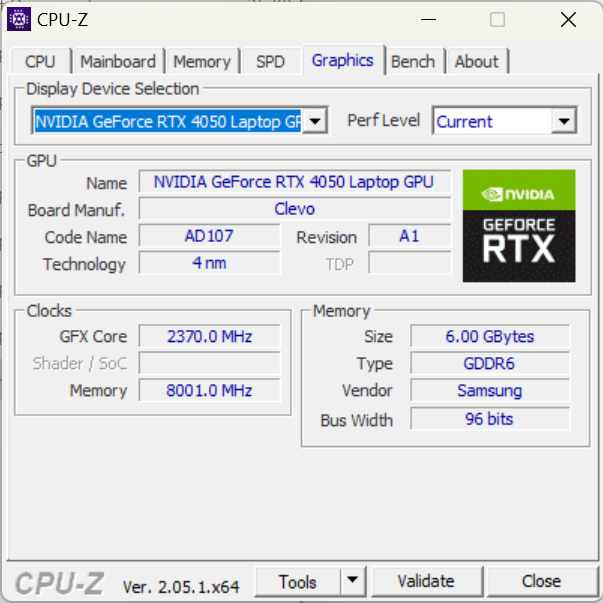
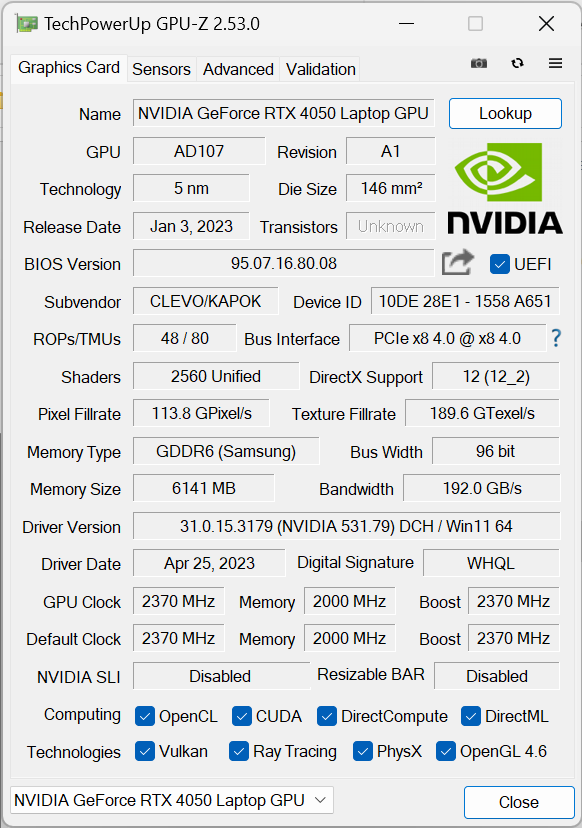
The high-end processor in the Focus 15 is complemented by an entry-level GPU, the Nvidia GeForce RTX 4050 Laptop GPU, 32 GB of working memory, and a 1 TB Crucial NVMe SSD.
As usual, Schenker offers a wide range of configuration options. Buyers can also configure the Focus 15 with an RTX 4060 Laptop GPU or an RTX 4070 Laptop GPU together with additional RAM options.
Due to the entry-level graphics of our review sample, we classify the XMG Pro 15 as an entry-level gaming laptop. However, entry-level gaming laptops usually do not have such a high-performance processor and not more than 16 GB of working memory, so we also look for corresponding comparison devices among high-end multimedia laptops.
Among them are devices like the MSI Katana 15 or the Asus TUF A15 as gaming laptops and the Samsung Galaxy Book3 Ultra 16 or the Acer Swift X SFX14-71G as multimedia laptops. The XMG Pro 15 also gets a place in this comparison — Schenker's more expensive laptop differs from its cheaper cousin only in a few aspects.
Possible competitors in comparison
Rating | Date | Model | Weight | Height | Size | Resolution | Price |
|---|---|---|---|---|---|---|---|
| 85.1 % v7 (old) | 07 / 2023 | Schenker XMG Focus 15 (E23) i9-13900HX, GeForce RTX 4050 Laptop GPU | 2.4 kg | 26.9 mm | 15.60" | 2569x1440 | |
| 86.2 % v7 (old) | 07 / 2023 | Schenker XMG Pro 15 (E23) i9-13900HX, GeForce RTX 4060 Laptop GPU | 2.4 kg | 24.9 mm | 15.60" | 2560x1440 | |
| 86.3 % v7 (old) | 06 / 2023 | Asus TUF A15 FA507 R7 7735HS, GeForce RTX 4050 Laptop GPU | 2.2 kg | 24.9 mm | 15.60" | 1920x1080 | |
| 82.9 % v7 (old) | 03 / 2023 | MSI Katana 15 B12VEK i7-12650H, GeForce RTX 4050 Laptop GPU | 2.3 kg | 24.9 mm | 15.60" | 1920x1080 | |
| 86.3 % v7 (old) | 07 / 2023 | Acer Swift X SFX14-71G i7-13700H, GeForce RTX 4050 Laptop GPU | 1.5 kg | 17.9 mm | 14.50" | 2880x1800 | |
| 89.4 % v7 (old) | 04 / 2023 | Samsung Galaxy Book3 Ultra 16 i7-13700H, GeForce RTX 4050 Laptop GPU | 1.8 kg | 16.5 mm | 16.00" | 2880x1800 | |
| 89.4 % v7 (old) | 05 / 2023 | Gigabyte Aero 14 OLED BMF i7-13700H, GeForce RTX 4050 Laptop GPU | 1.4 kg | 17 mm | 14.00" | 2880x1800 |
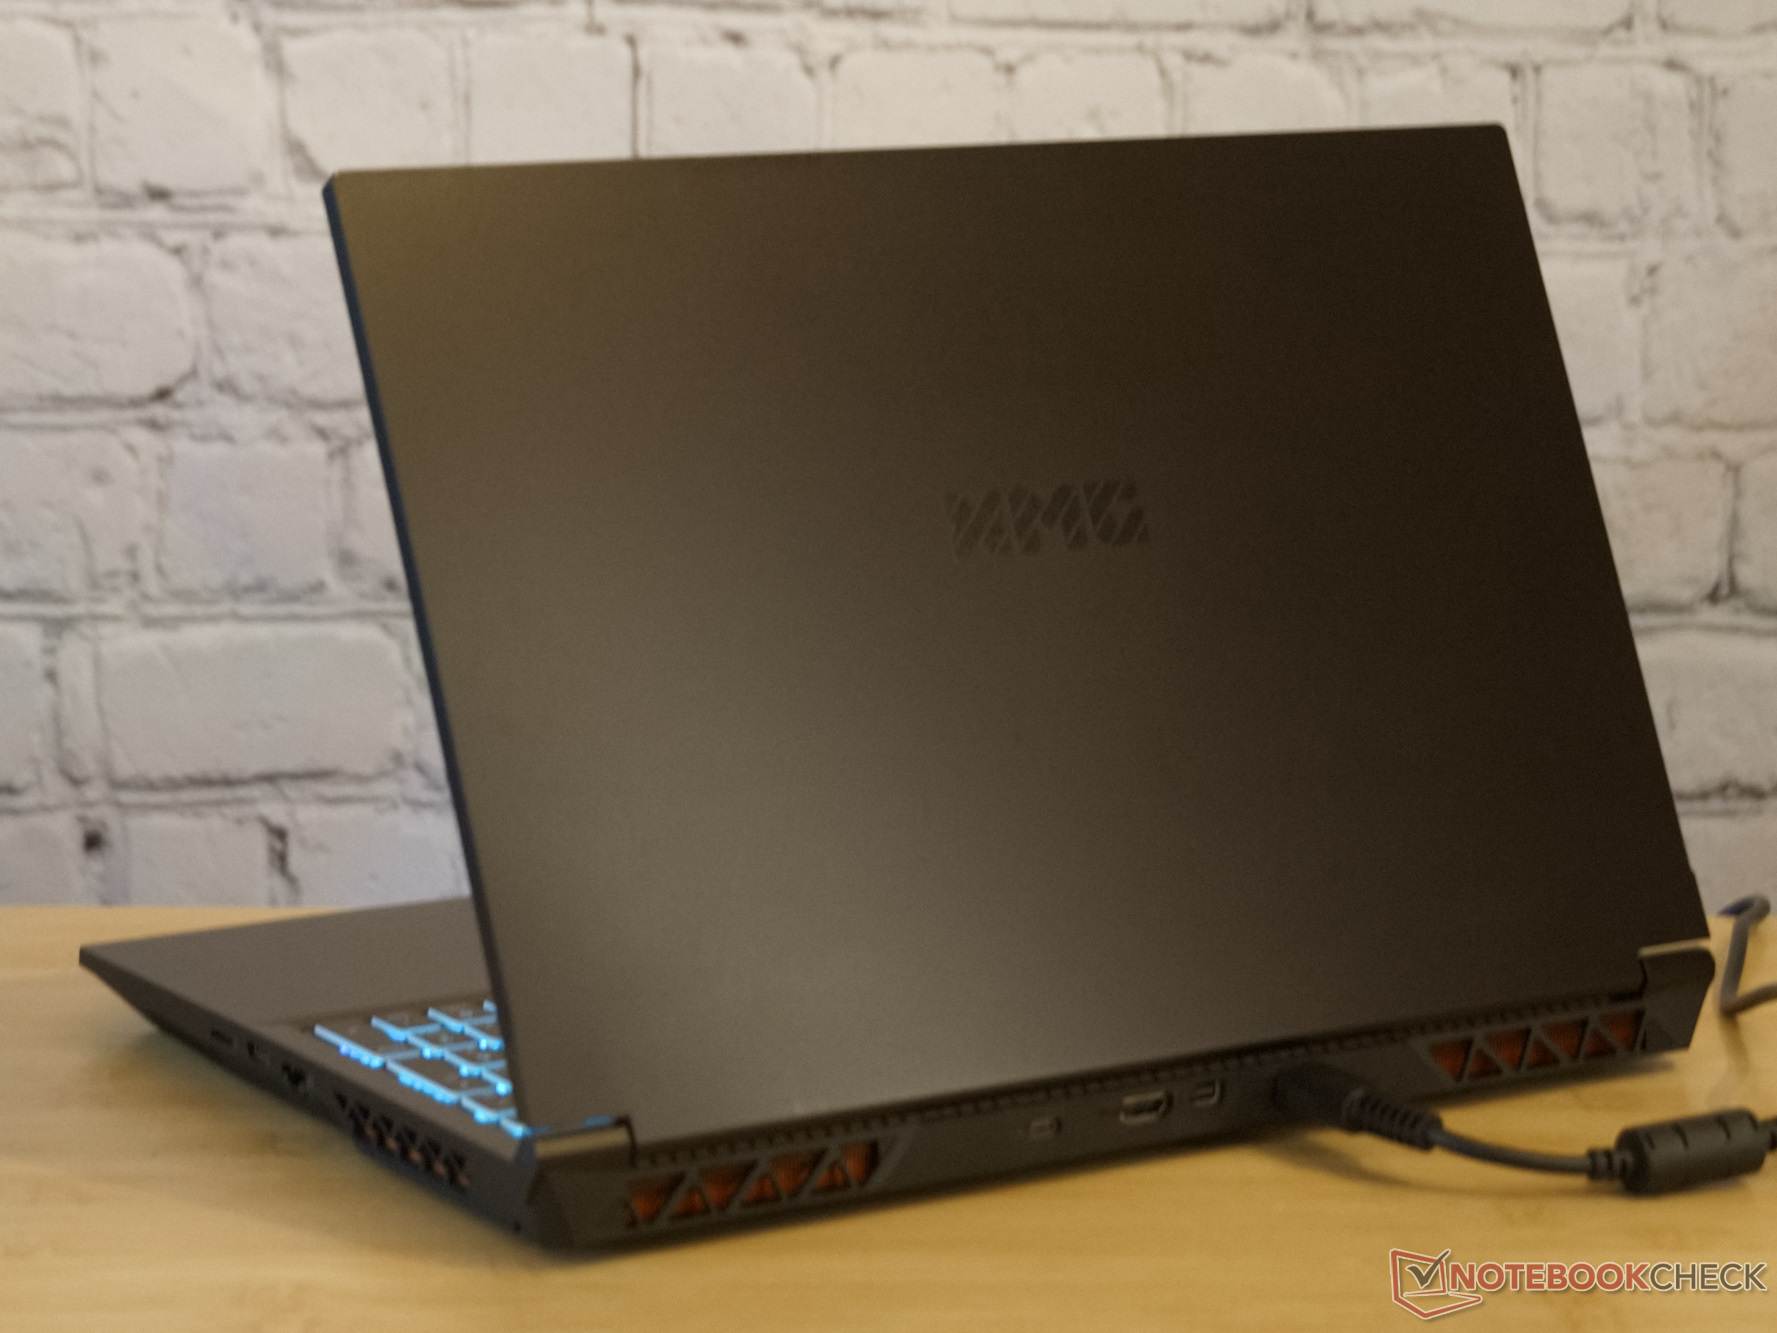
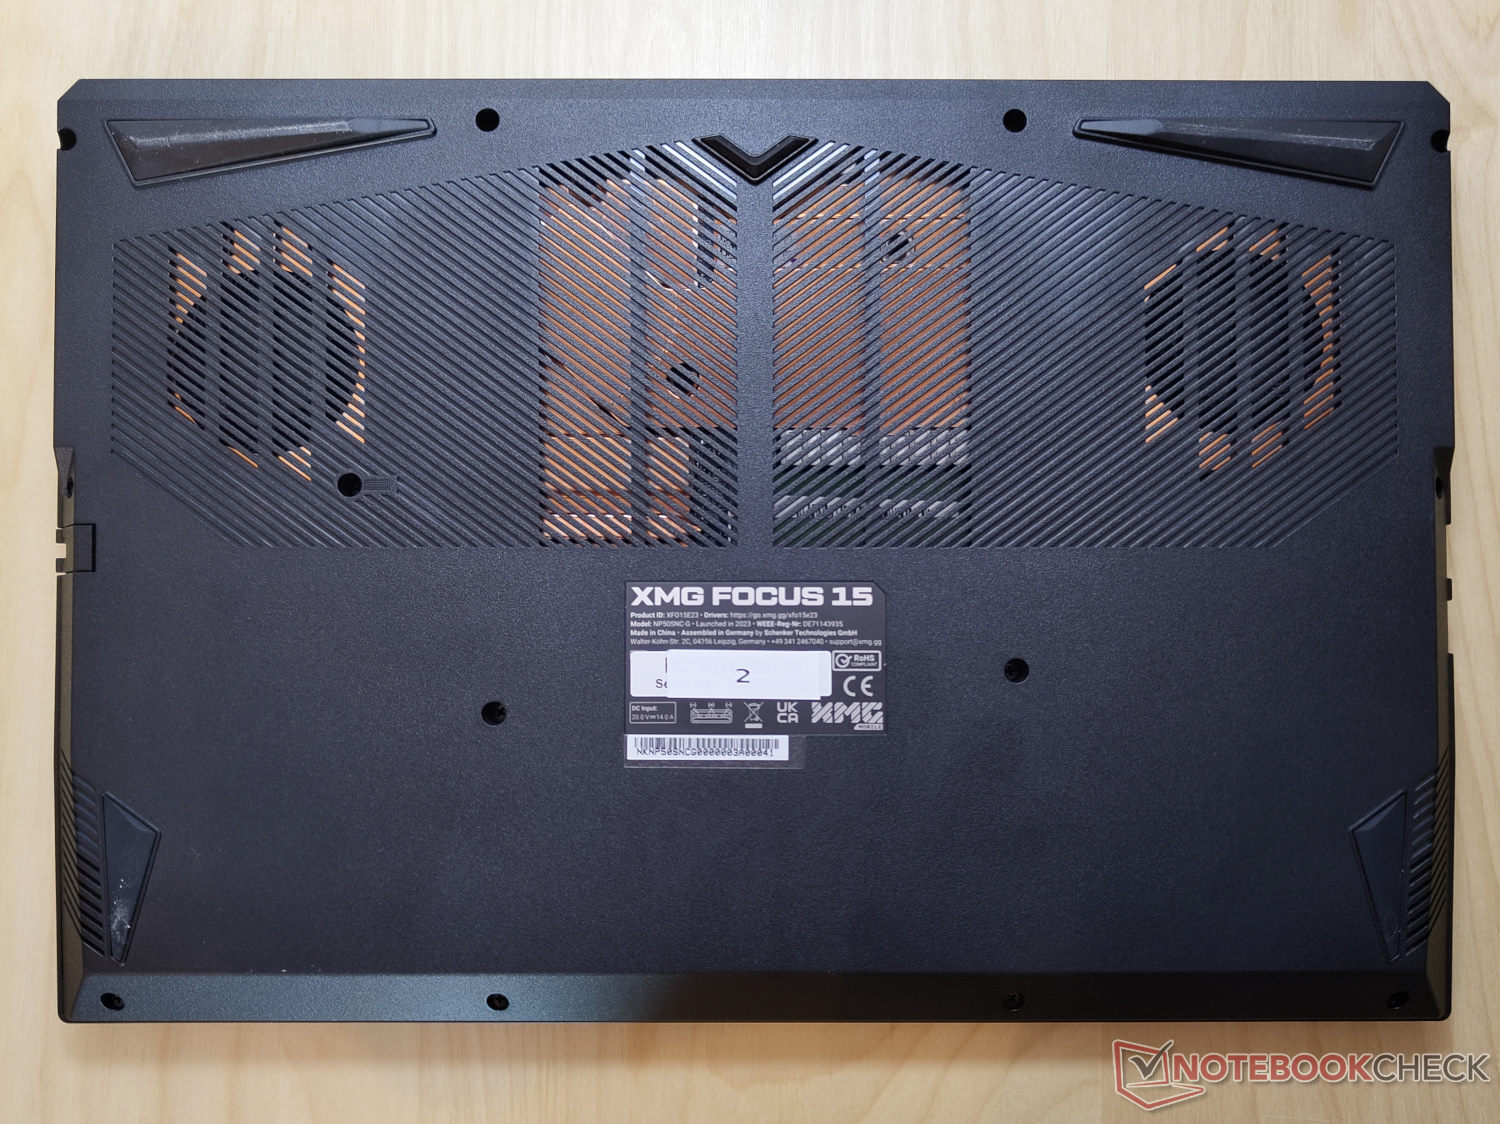
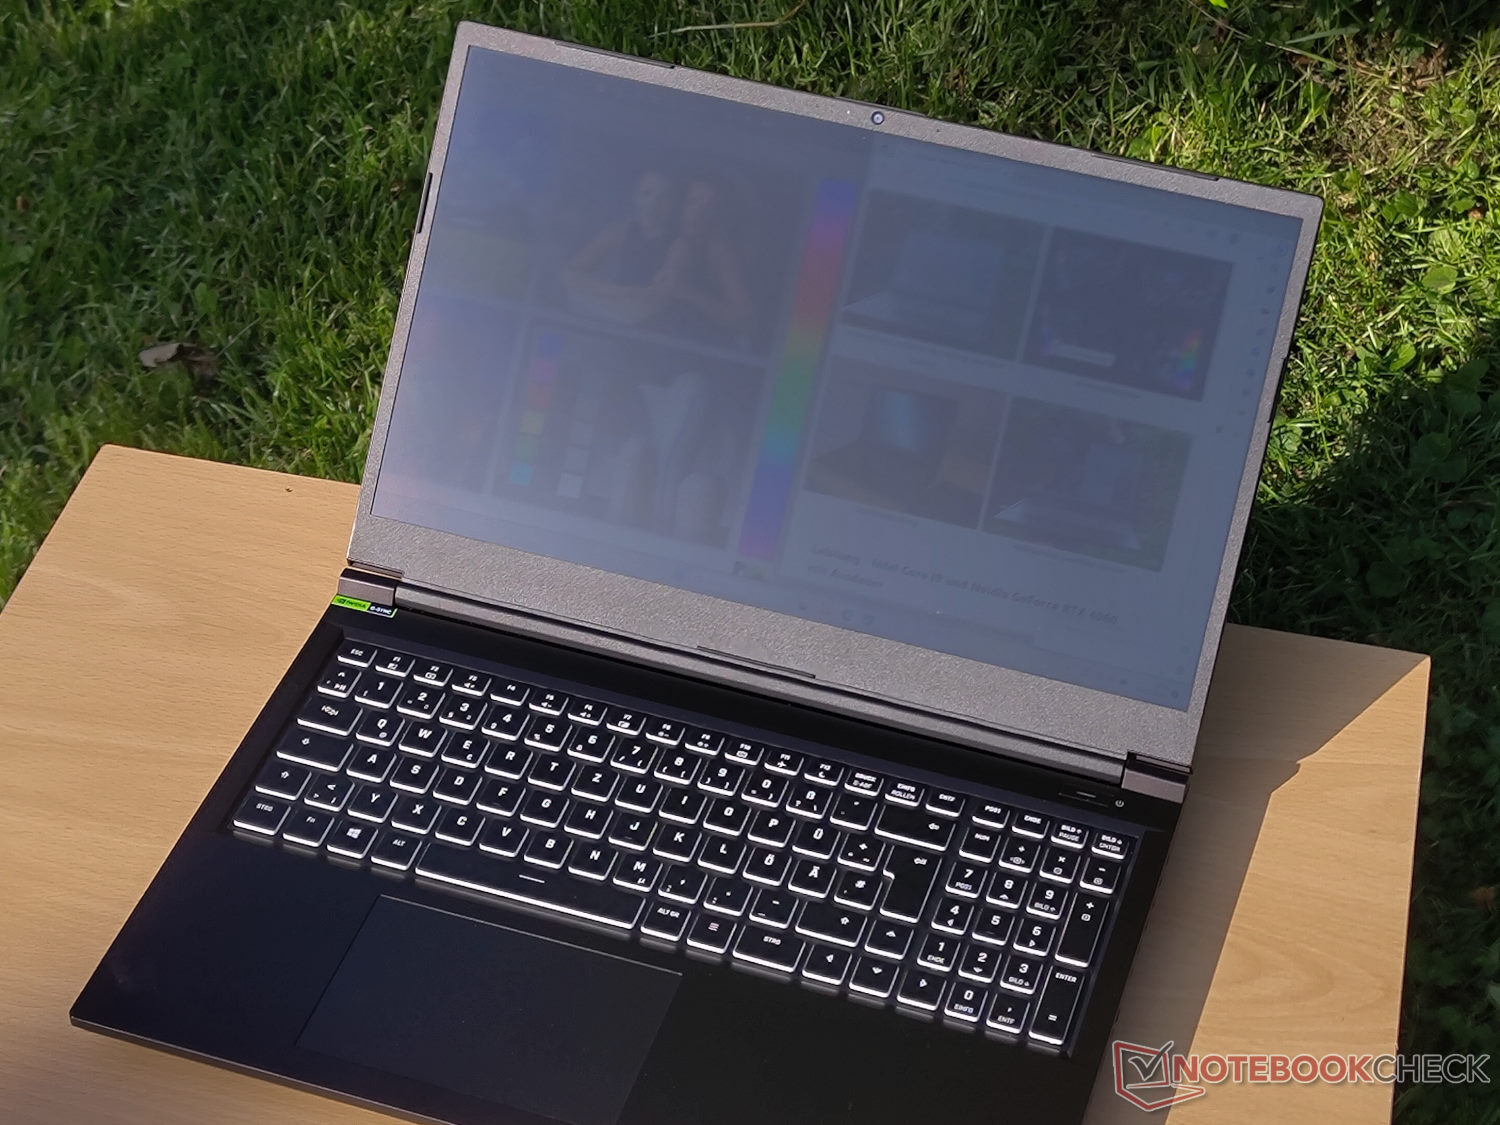
Chassis: Robust plastic
The laptop's casing is completely made of robust plastic. Metal is only visible from the outside behind the grills in the form of the heat sink. Clevo and Schenker have kept the design rather simple. Branding is only found in the form of the black XMG logo on a black background.
Even though the case is primarily made of plastic, we do not find any weaknesses in terms of quality. The laptop appears resistant in all aspects, doesn't creak when twisting, and shows very narrow and even gaps. The display lid can be opened to about 140° with one hand and holds its position throughout.
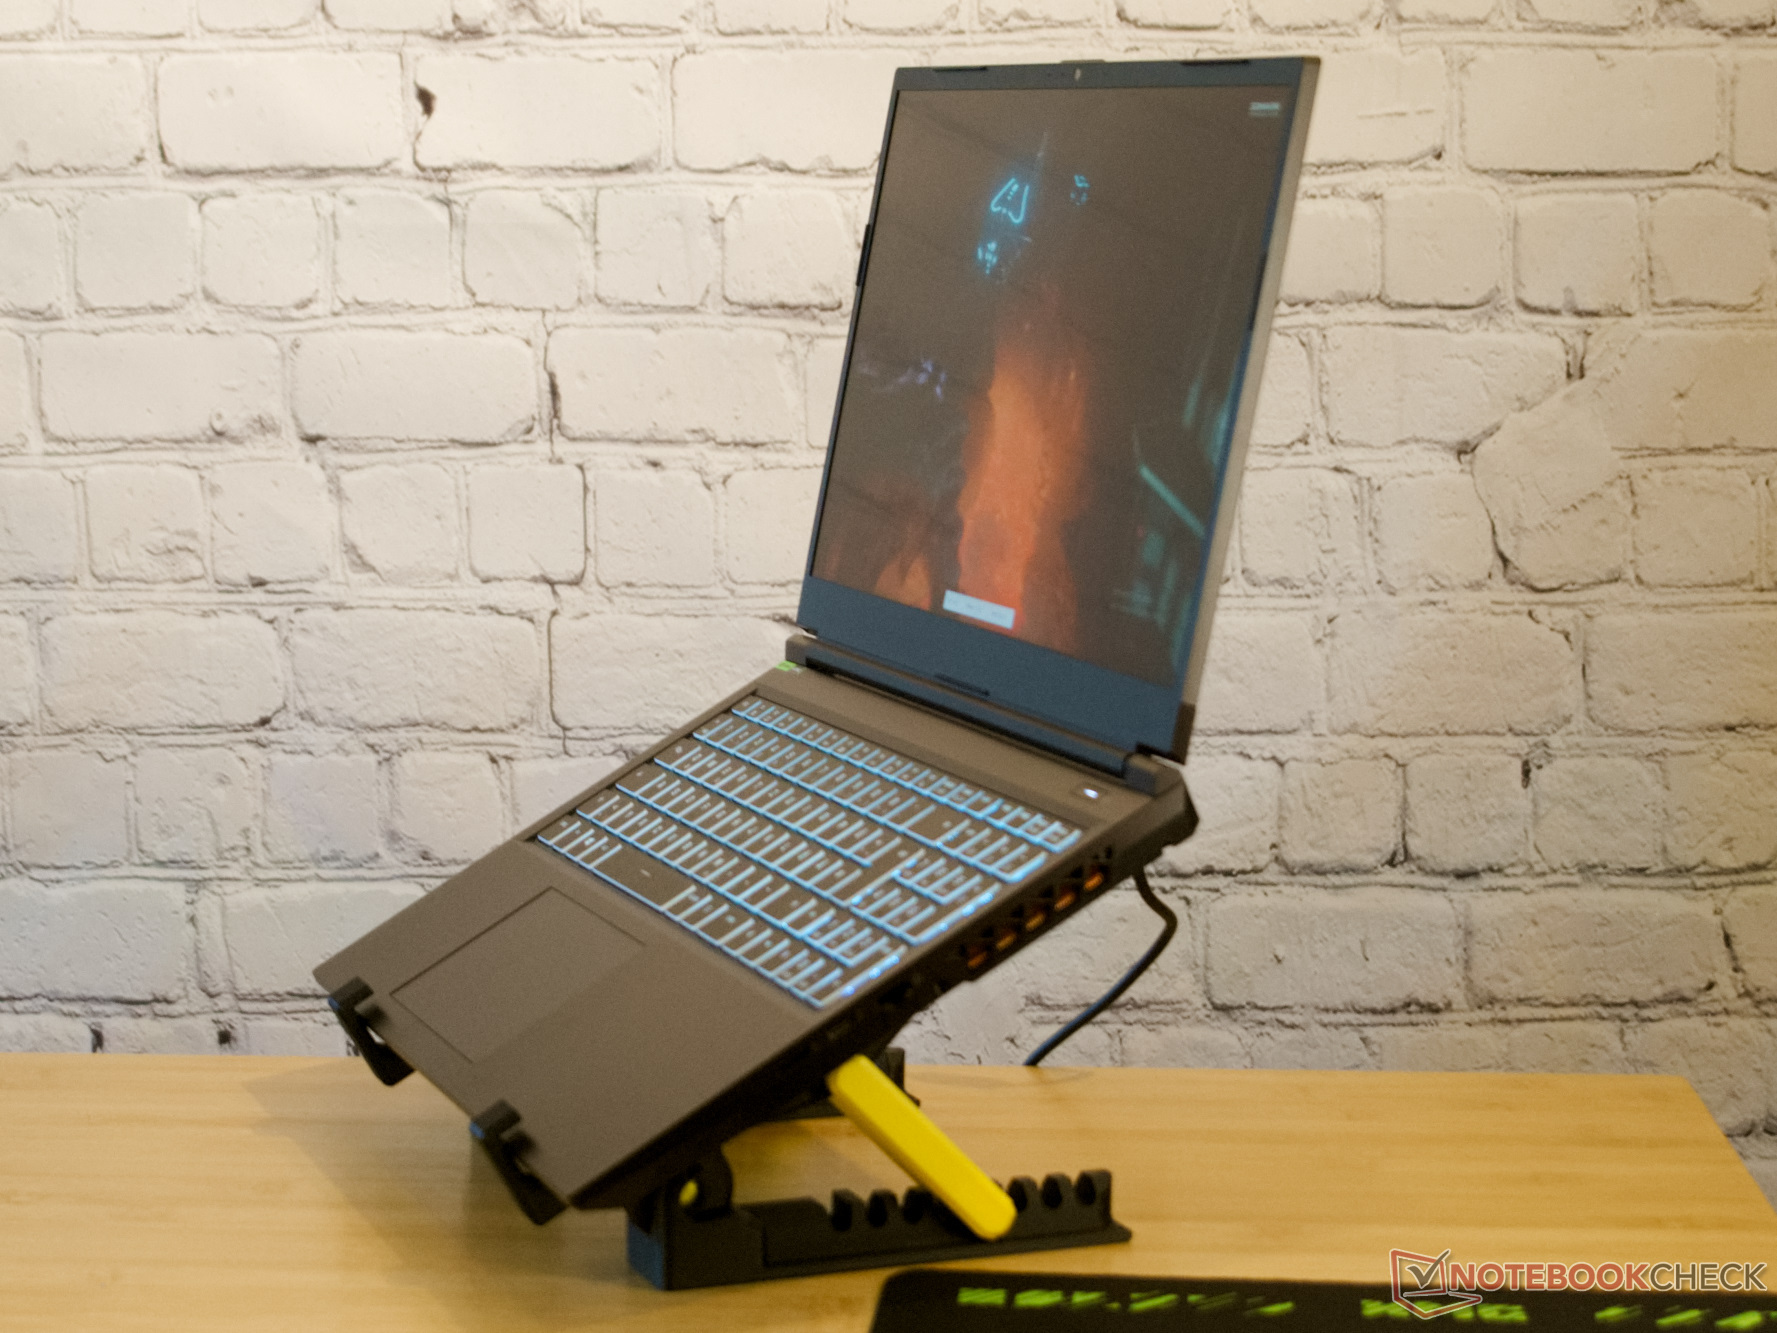
Neither the weight nor the thickness is atypical for a 15.6-inch gaming laptop in 16:10 format. However, a comparison with other multimedia laptops shows that those with similar hardware could also be a bit slimmer.
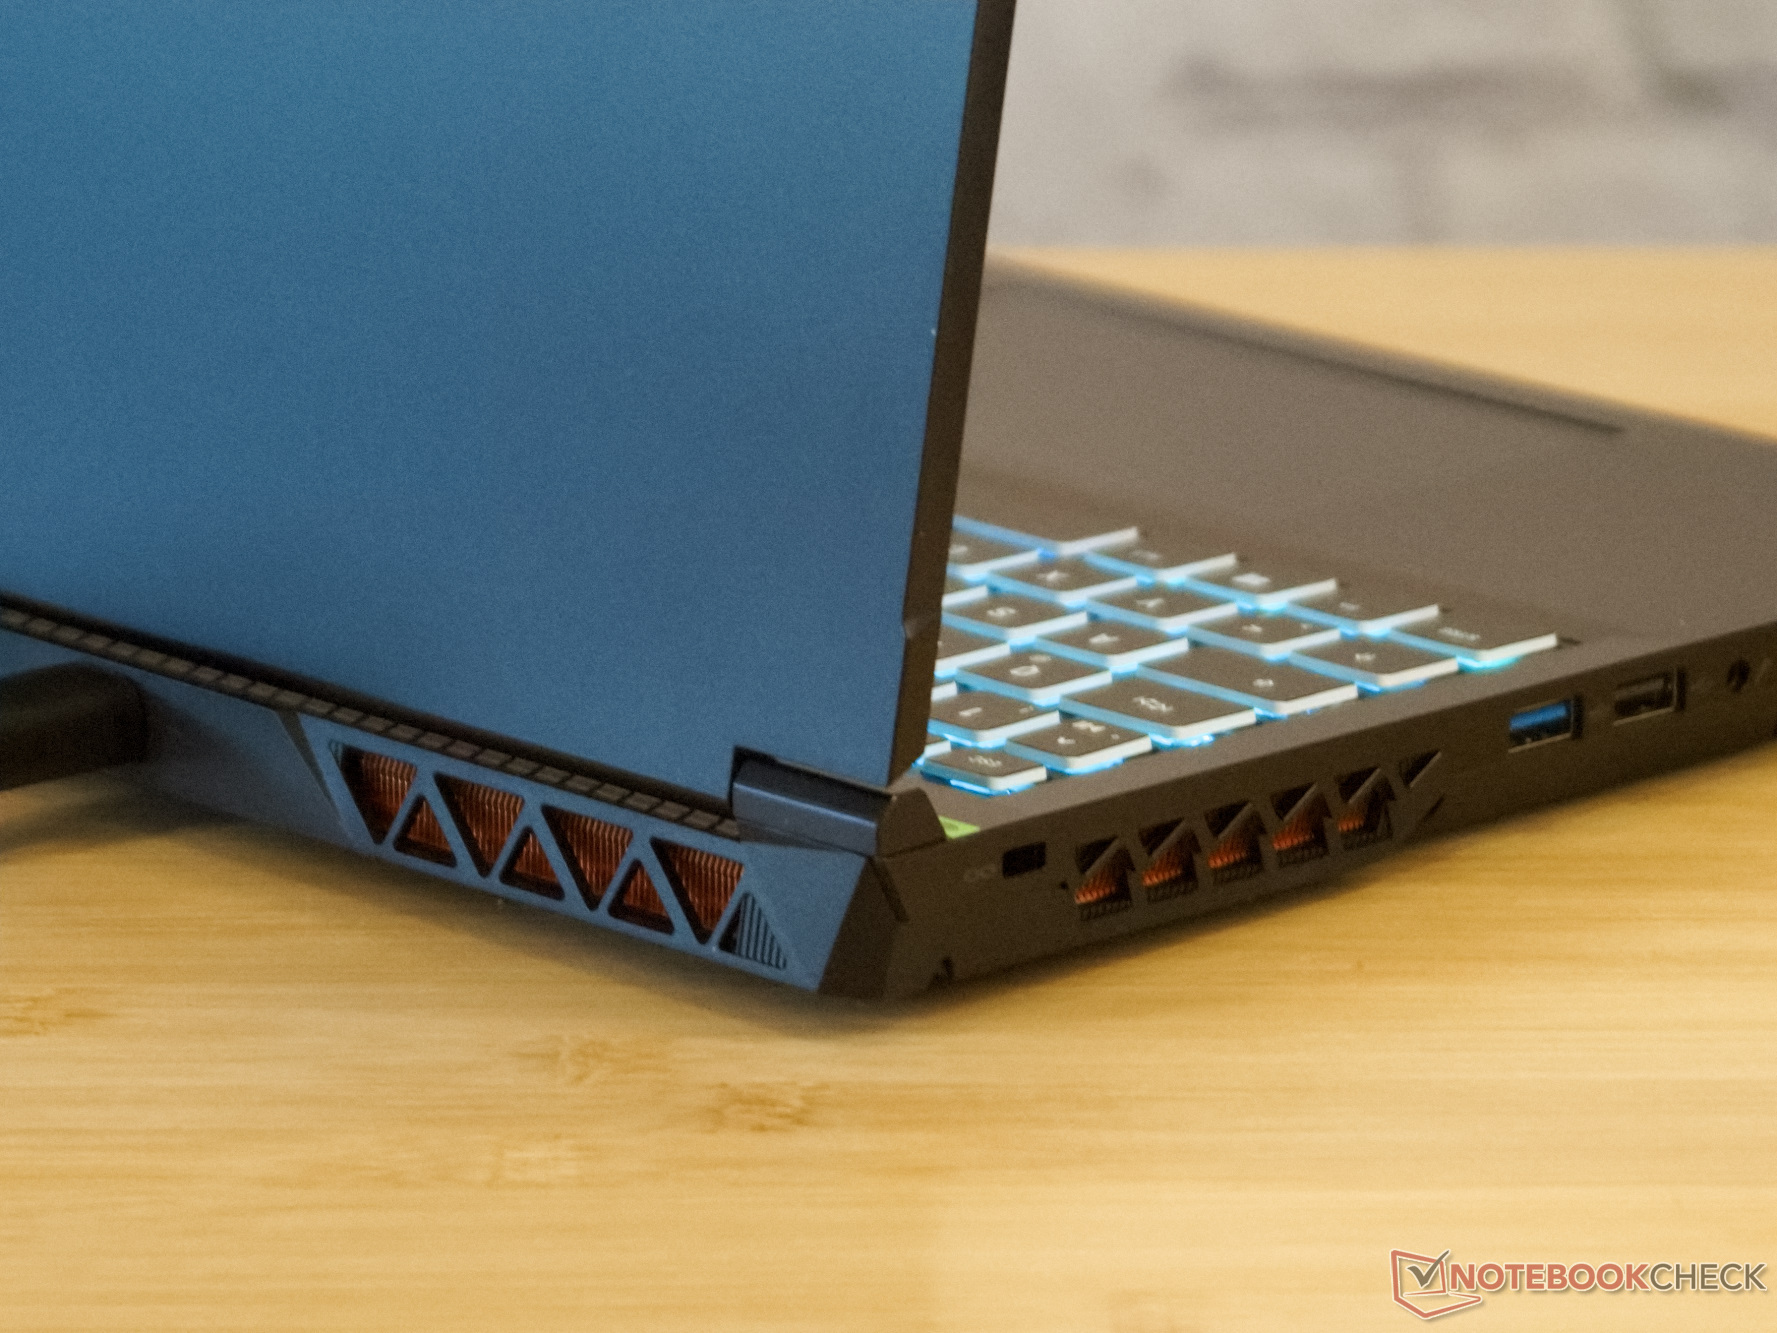
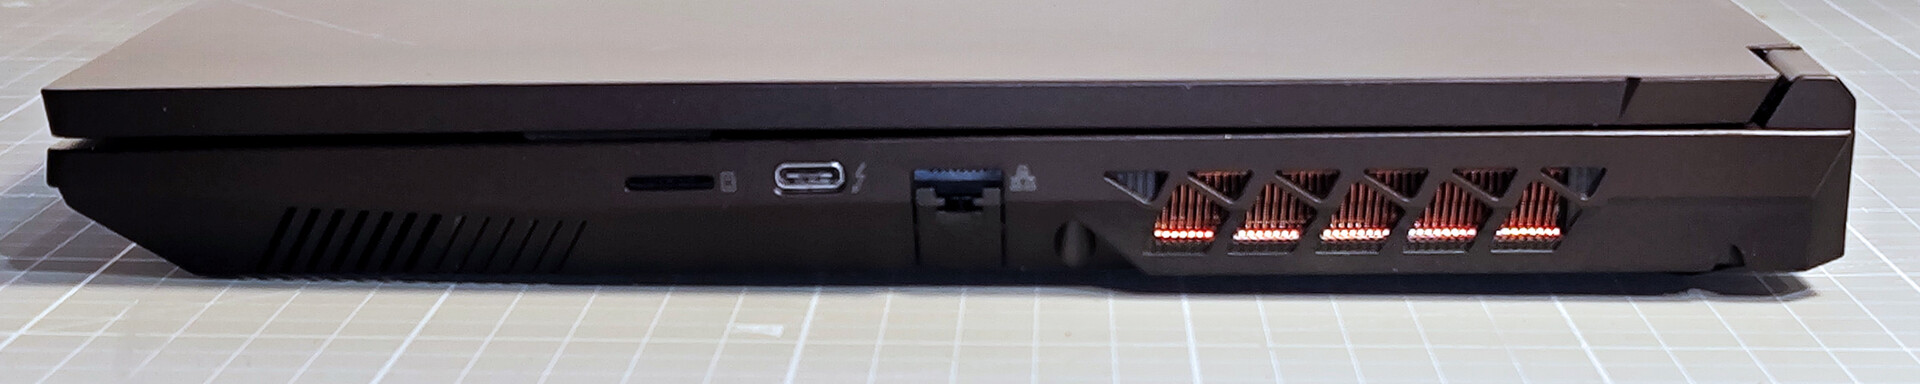
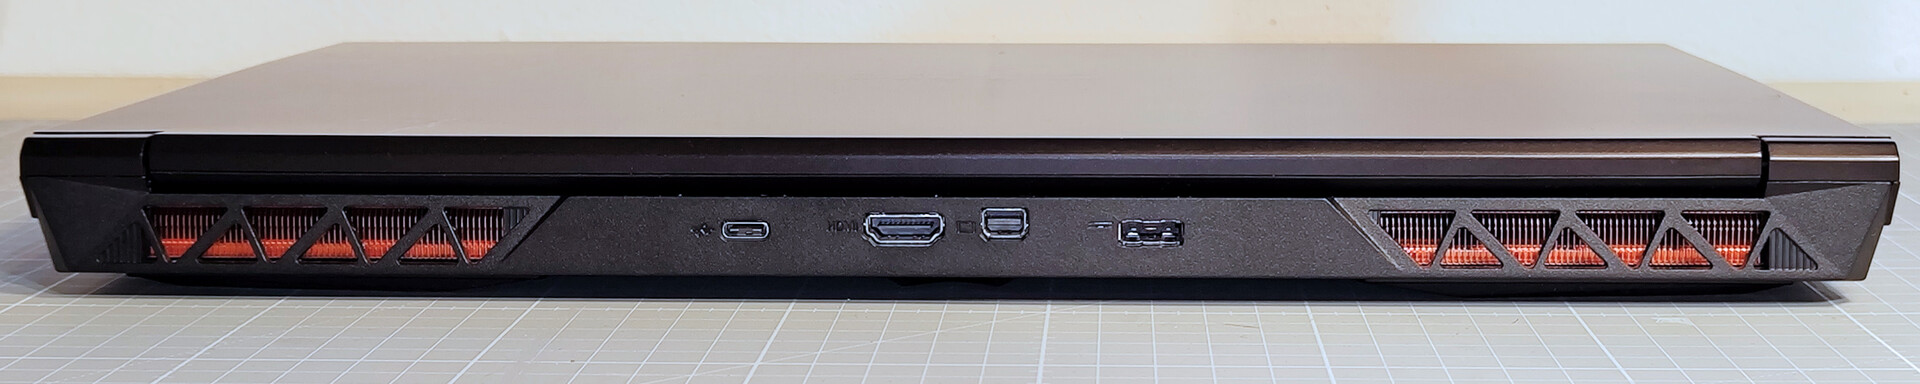
Equipment: USB ports on three sides
The connectivity aspects of the XMG Focus 15 have hardly changed since our last review. The only new addition is another USB-C port, but the SD card reader has been reduced to the microSD format.
Both the USB Type-C ports do not offer power delivery. Thus, you will probably always have to take the power adapter with you, which weighs nearly one kg.
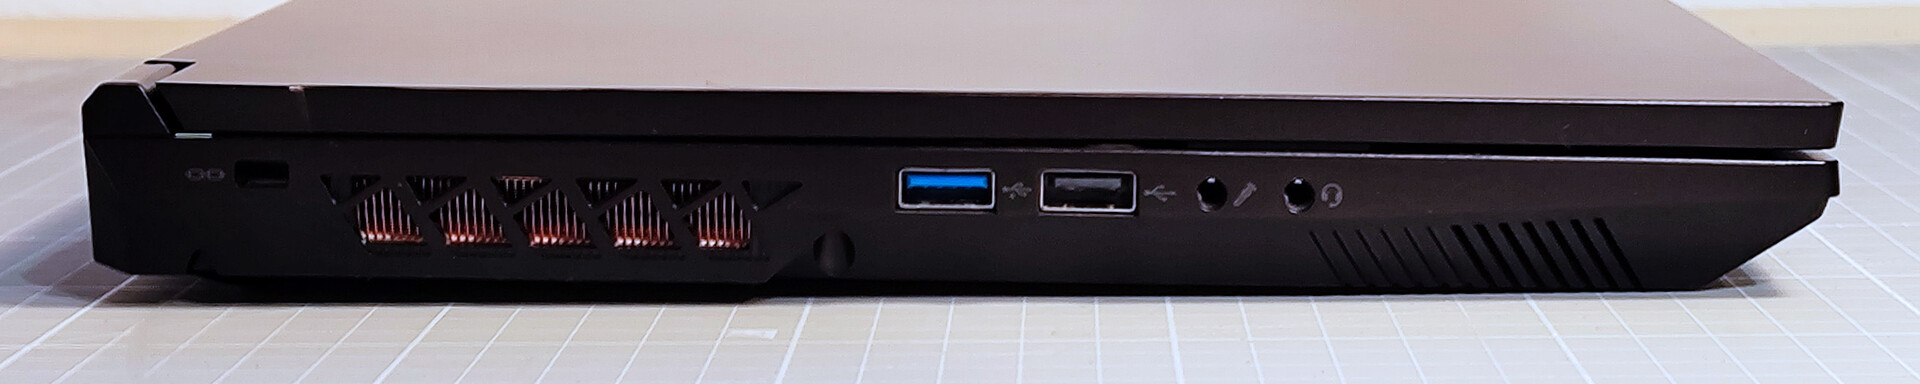
SD card reader

SD card transfer rates are good using the AV PRO microSD 128 GB V60 with our test device or the Pro 15, though not outstanding.
The other two gaming laptops in our comparison come without a card reader.
| SD Card Reader - maximum AS SSD Seq Read Test (1GB) | |
| Gigabyte Aero 14 OLED BMF | |
| Average of class Gaming (25.5 - 261, n=51, last 2 years) | |
| Schenker XMG Focus 15 (E23) | |
| Acer Swift X SFX14-71G (Angelbird AV Pro V60) | |
| Samsung Galaxy Book3 Ultra 16 (AV PRO microSD 128 GB V60) | |
Communication
The Intel AX211 Wi-Fi module in the Focus 15 provides high transmission speeds in the Wi-Fi 6E network with our reference Asus ROG Rapture AXE-GT11000 router.
On the other hand, transmission speeds in the 5 GHz Wi-Fi 6 network seem below average with the same test setup.
Webcam
The Full HD webcam of the new Focus 15 only focuses perfectly on the center of the image. Therefore, the center is sharp and rich in contrast, while the edges look a bit washed out.
The camera's high color deviations are annoying, and skin tones in particular are poorly reproduced.

 GeForce RTX 4050 Laptop GPU, i9-13900HX, Crucial P5 Plus 1TB CT1000P5PSSD8")
 GeForce RTX 4050 Laptop GPU, i9-13900HX, Crucial P5 Plus 1TB CT1000P5PSSD8")
Security
There are no biometric authentication options for the Focus 15. A Kensington security slot provides physical theft protection.
TPM 2.0 and SecureBoot can protect against unauthorized data access.
Accessories
In the box, we find an extensive accessories package in addition to the power supply and documentation. You get a large mouse pad with the XMG logo and a matching bottle opener along with c an installation CD and USB stick containing Windows with matching programs and drivers.
Maintenance
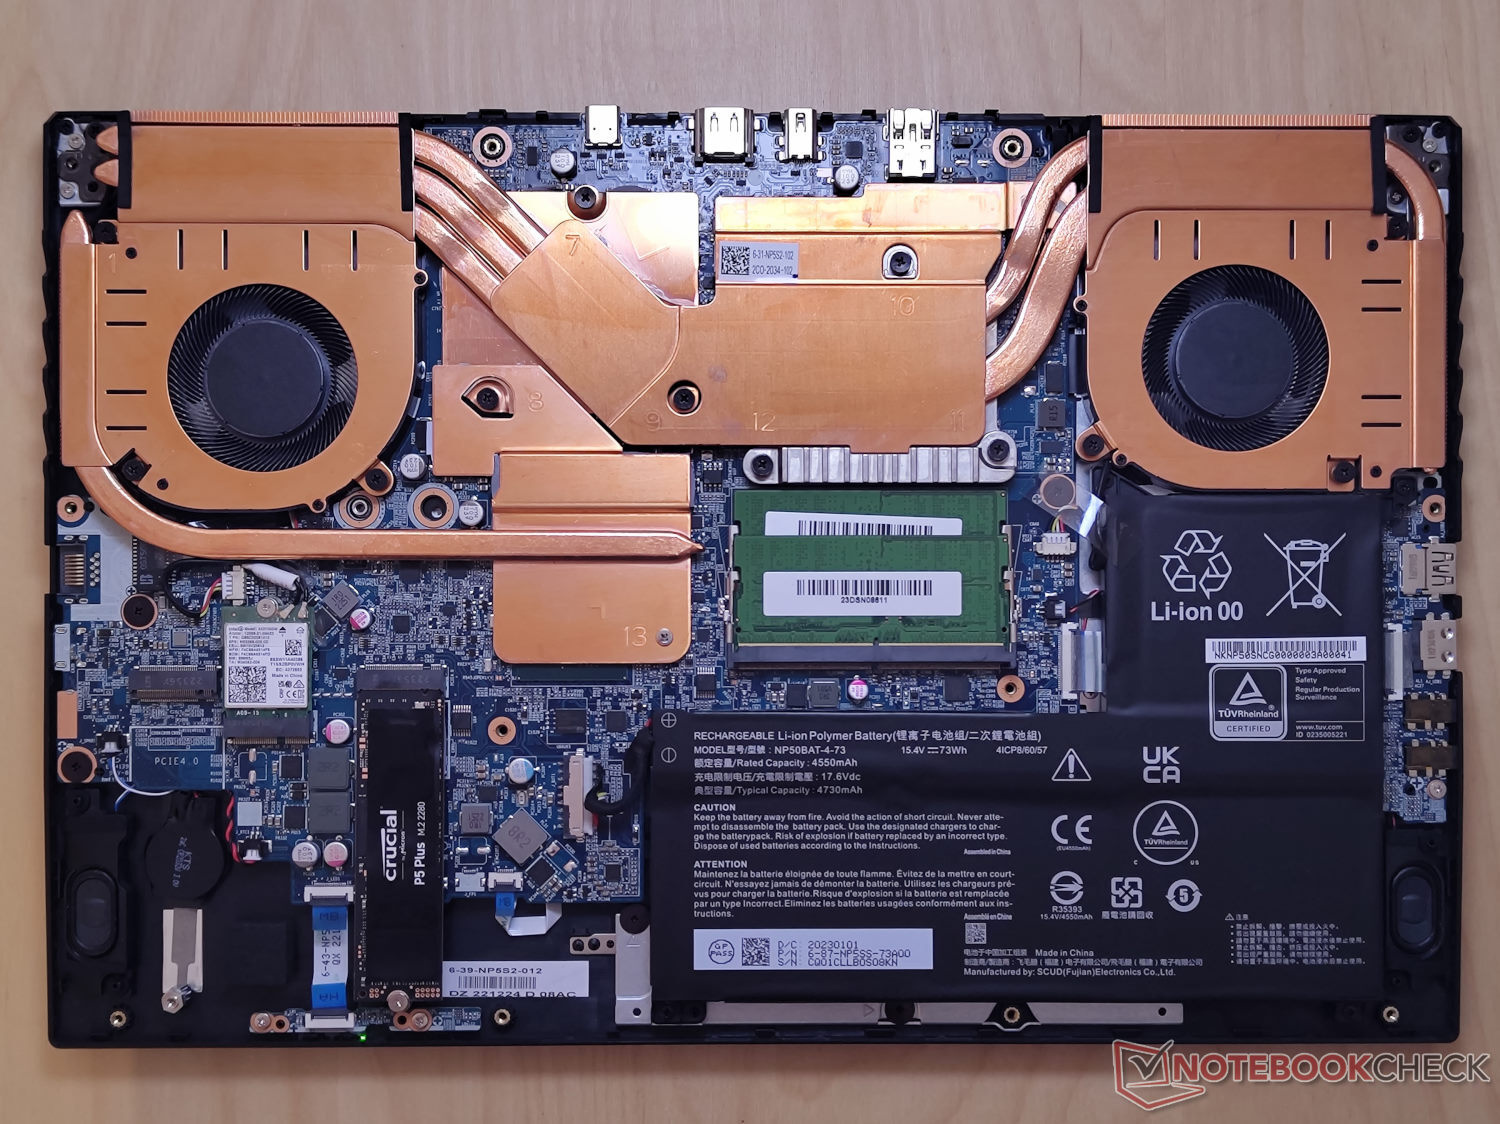
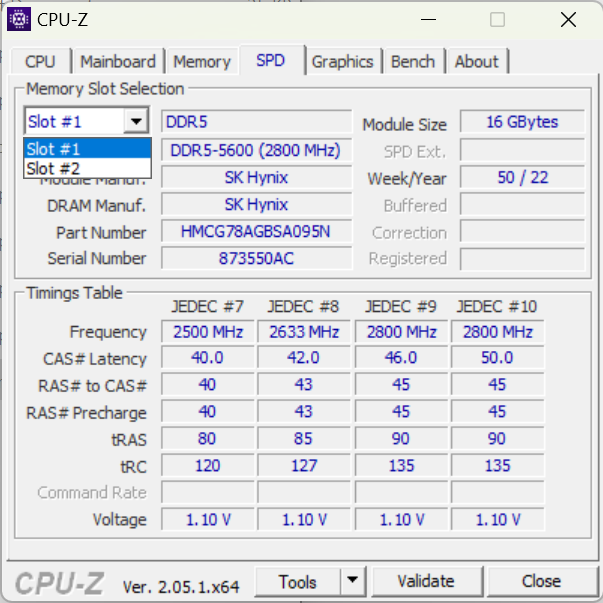
The SSD, working memory, and WLAN module of the XMG Focus 15 are replaceable. A free M.2 PCIe 4.0 slot is available in our test device.
The laptop's entire base plate is secured with 11 PH0 screws and can be removed quite easily to access the corresponding components. After loosening the screws, the lid can be lifted off without any problems.
Warranty
Schenker grants a free basic warranty of 24 months for the laptop. Further warranty options can be added via Bestware during checkout.
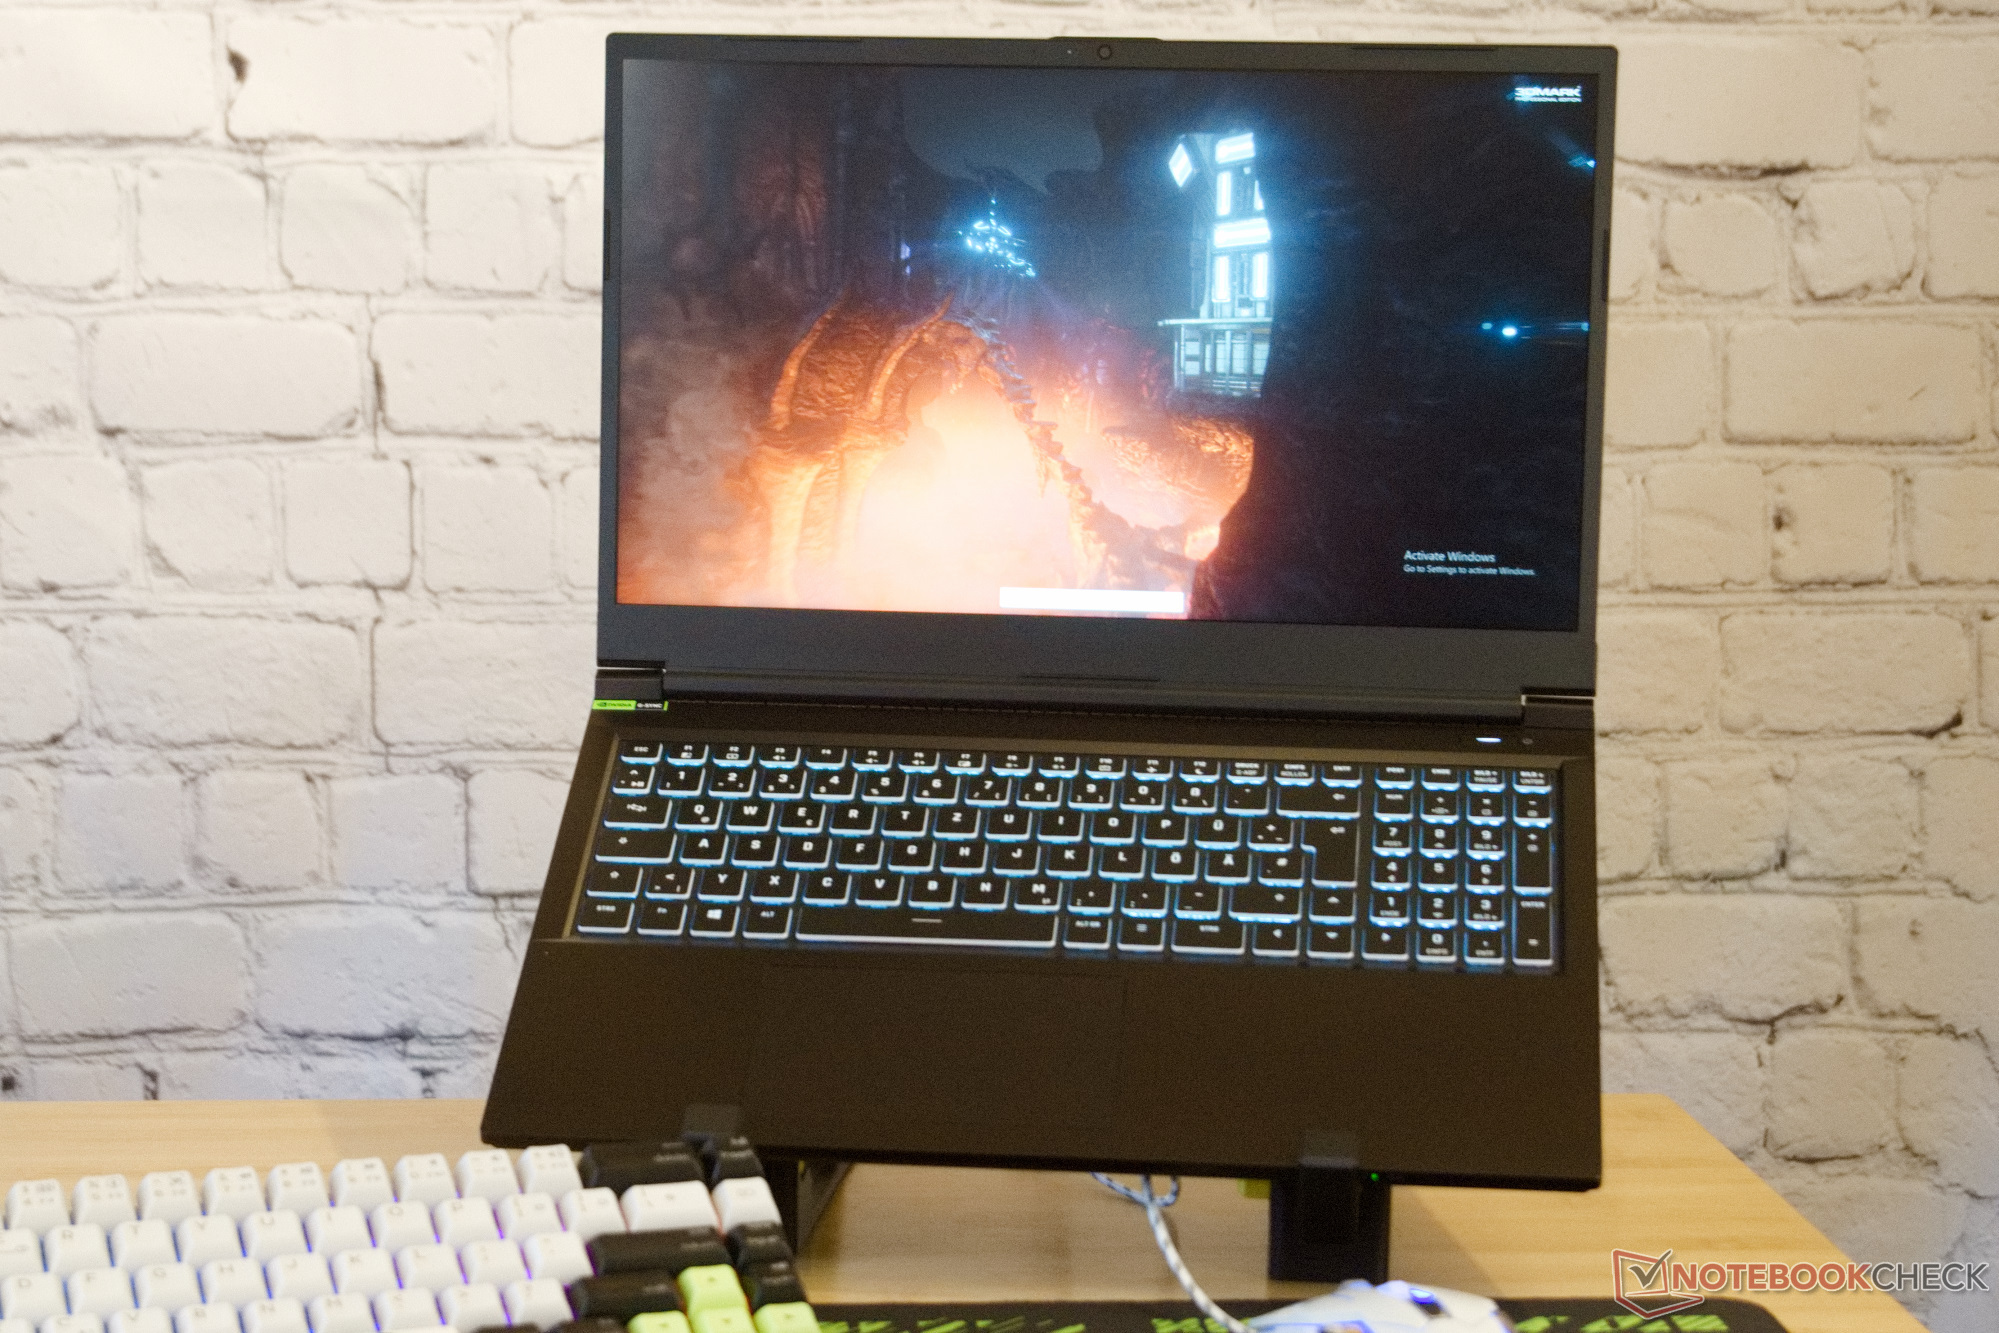
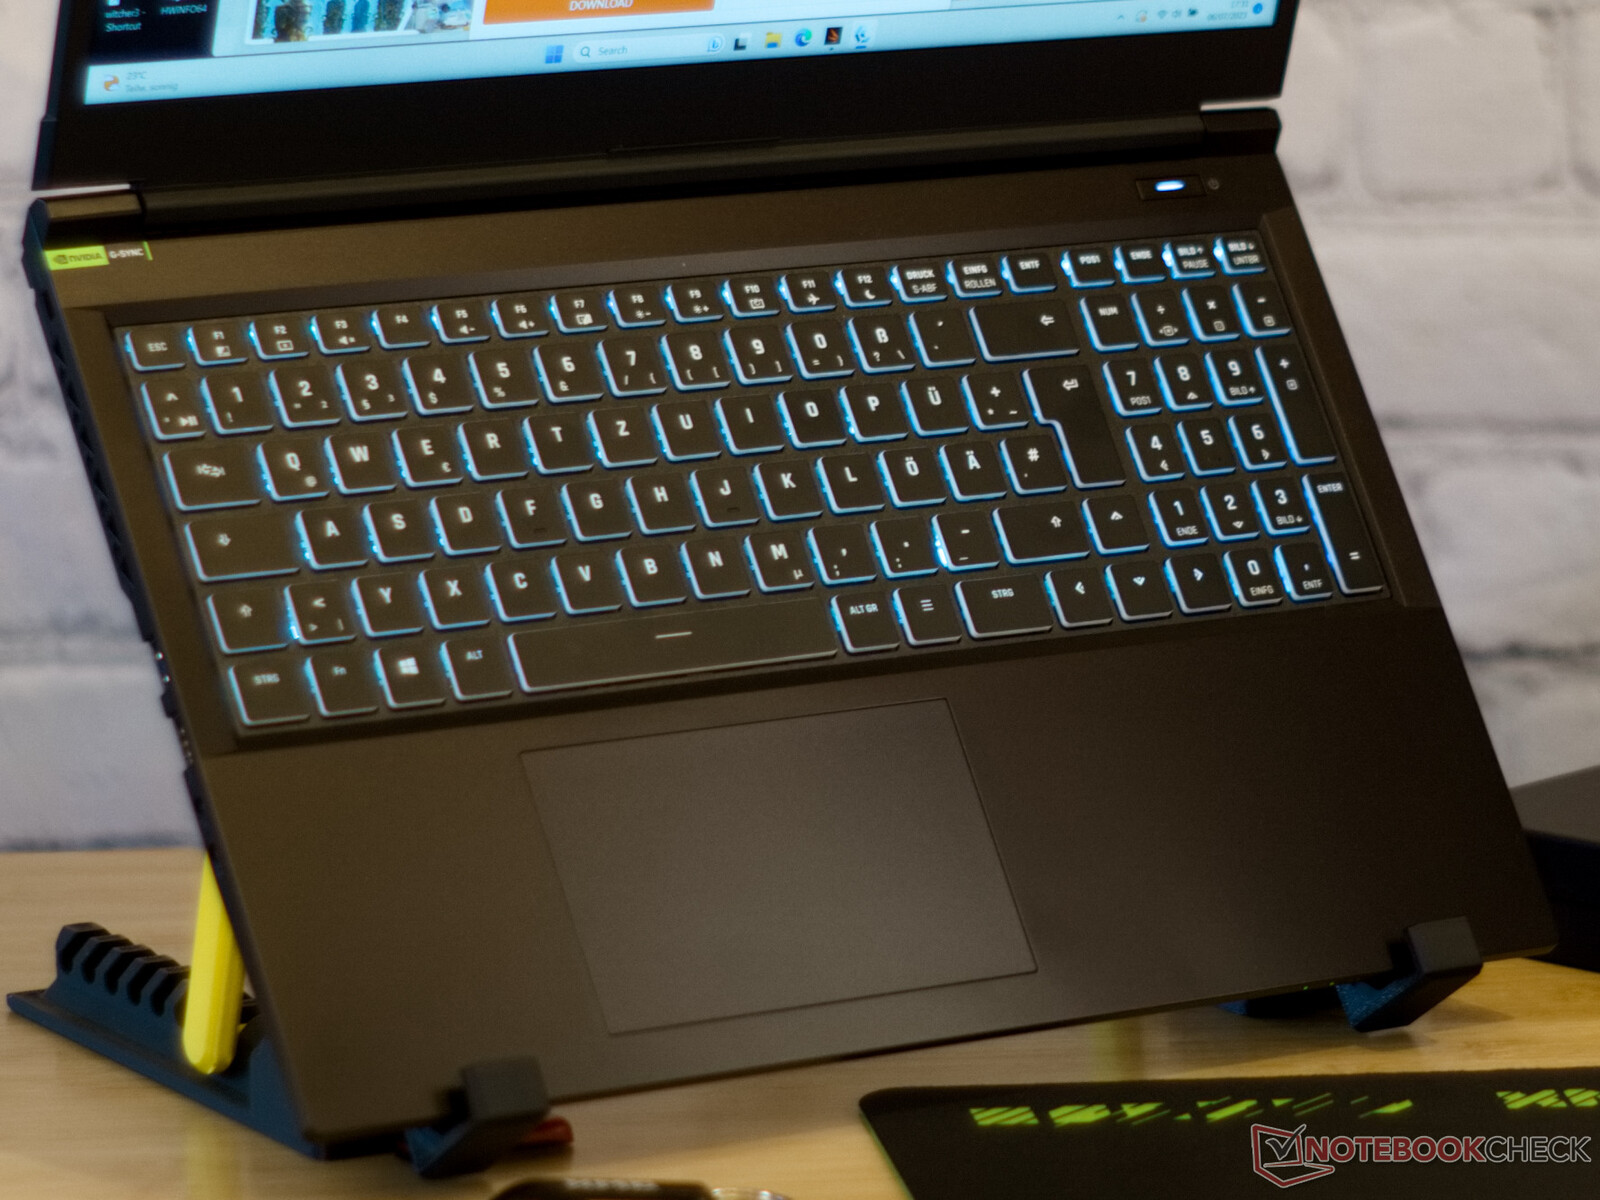
Input devices: RGB keyboard
Keyboard
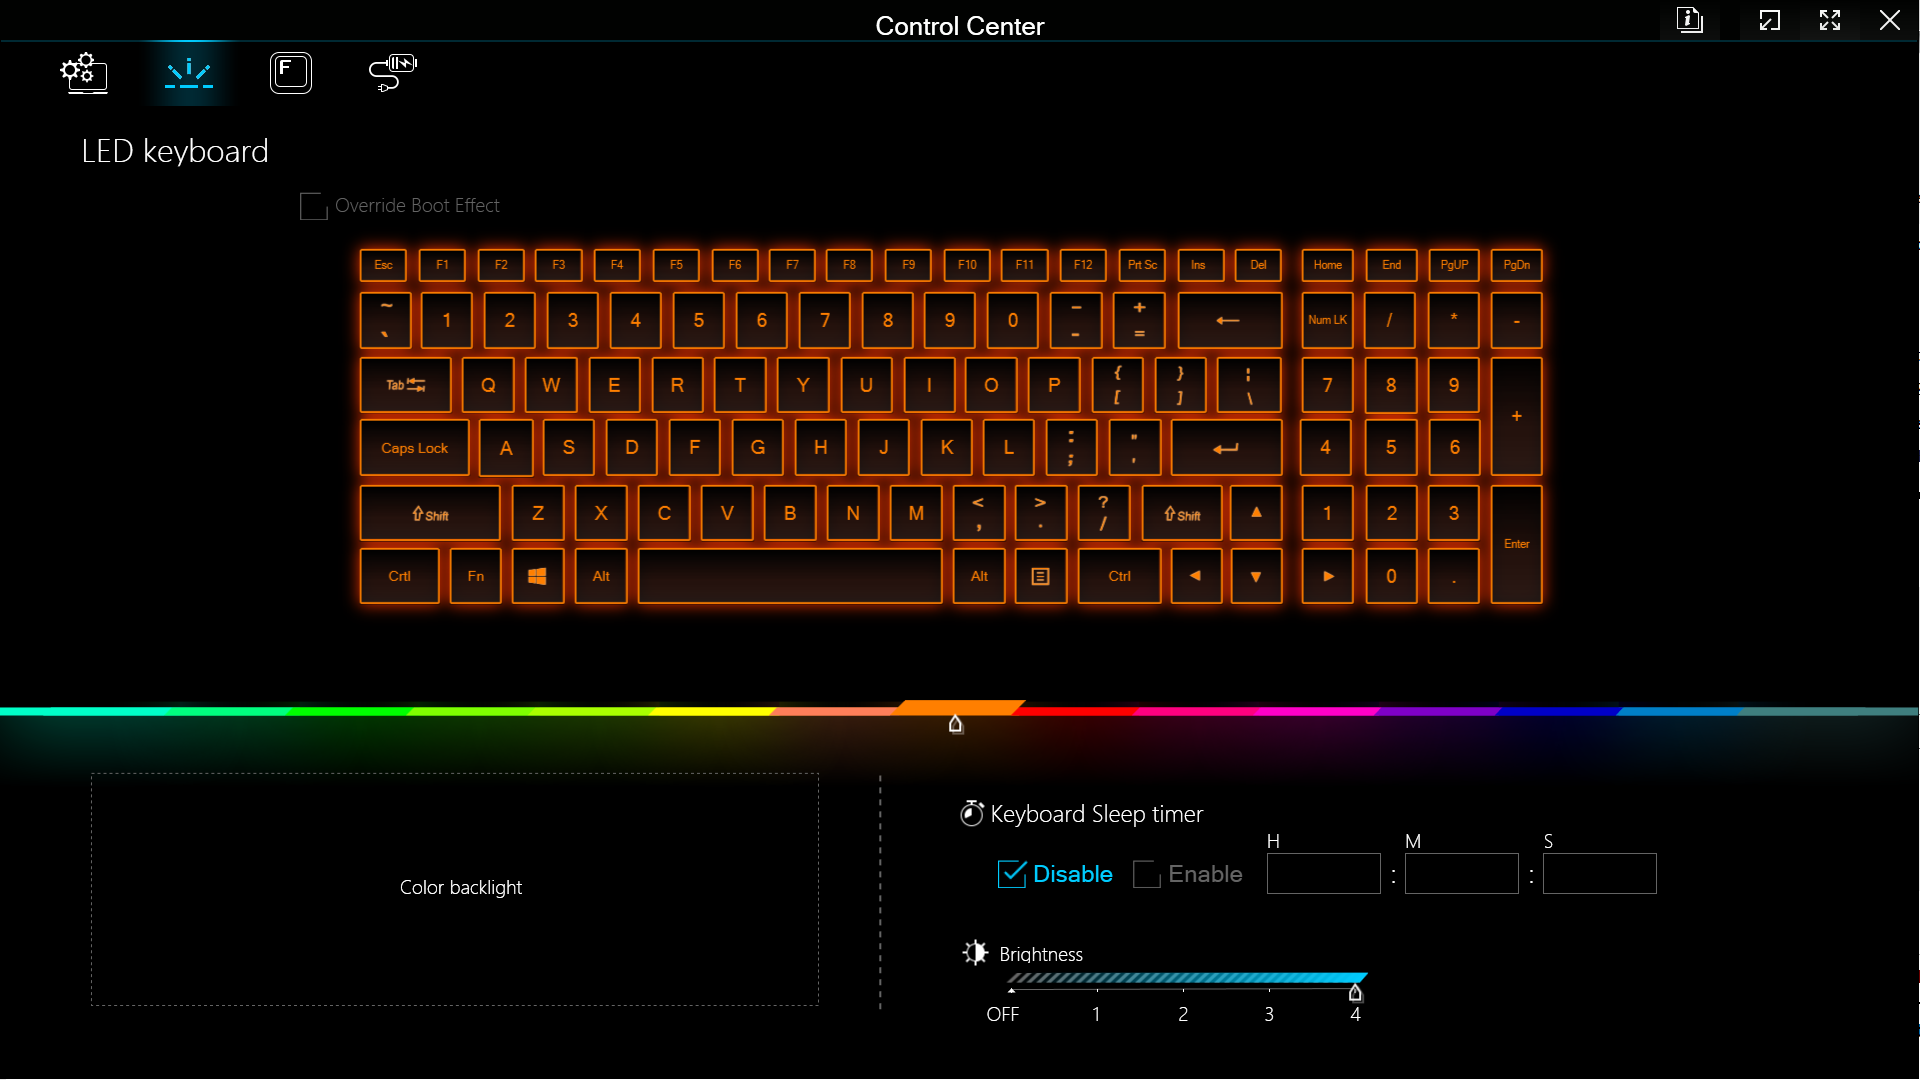
Typing on the laptop's black keyboard deck with white-lettered keys is good thanks to strong haptic feedback and a 1.5 mm key travel. Schenker laser-etches every imaginable language layout into the black surface on request. The RGB lighting lets the keyboard shine in the desired color.
Touchpad
At about 7 cm × 12 cm, the touchpad on the Focus 15 is smaller than on most gaming laptops. However, it is large enough to comfortably navigate across the entire screen with multiple fingers on it and perform all possible multi-touch gestures.
The touchpad's position and size also provide enough room to avoid erroneous inputs from the heel of the hand. The smooth surface and comfortable clicks make mouse input fluid.
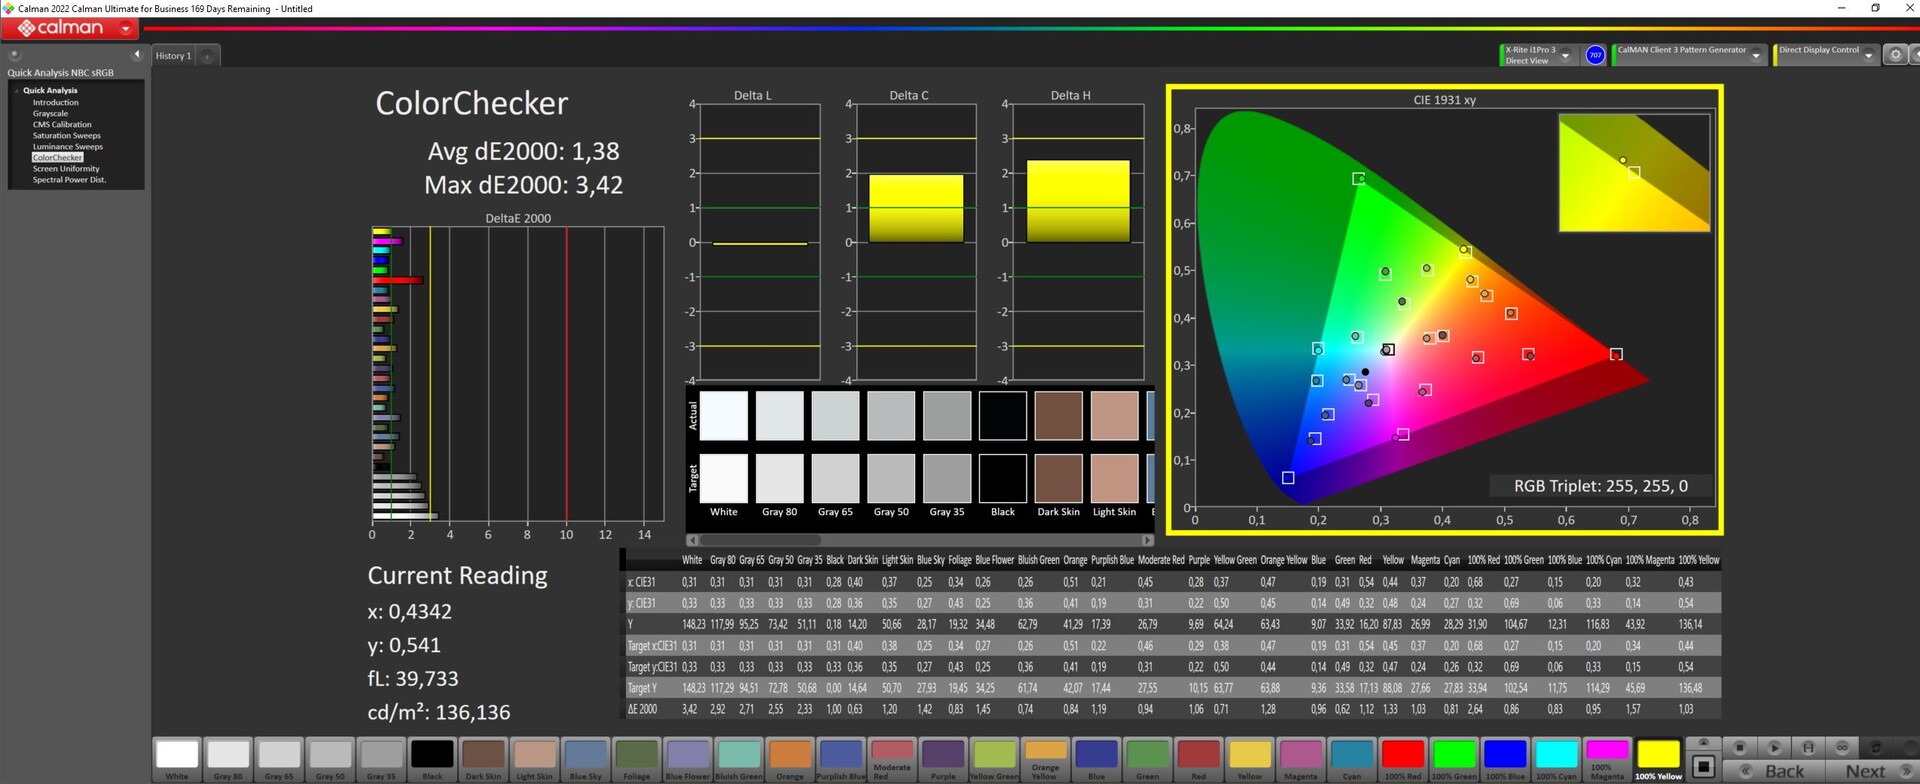
Display: QHD at 240 Hz
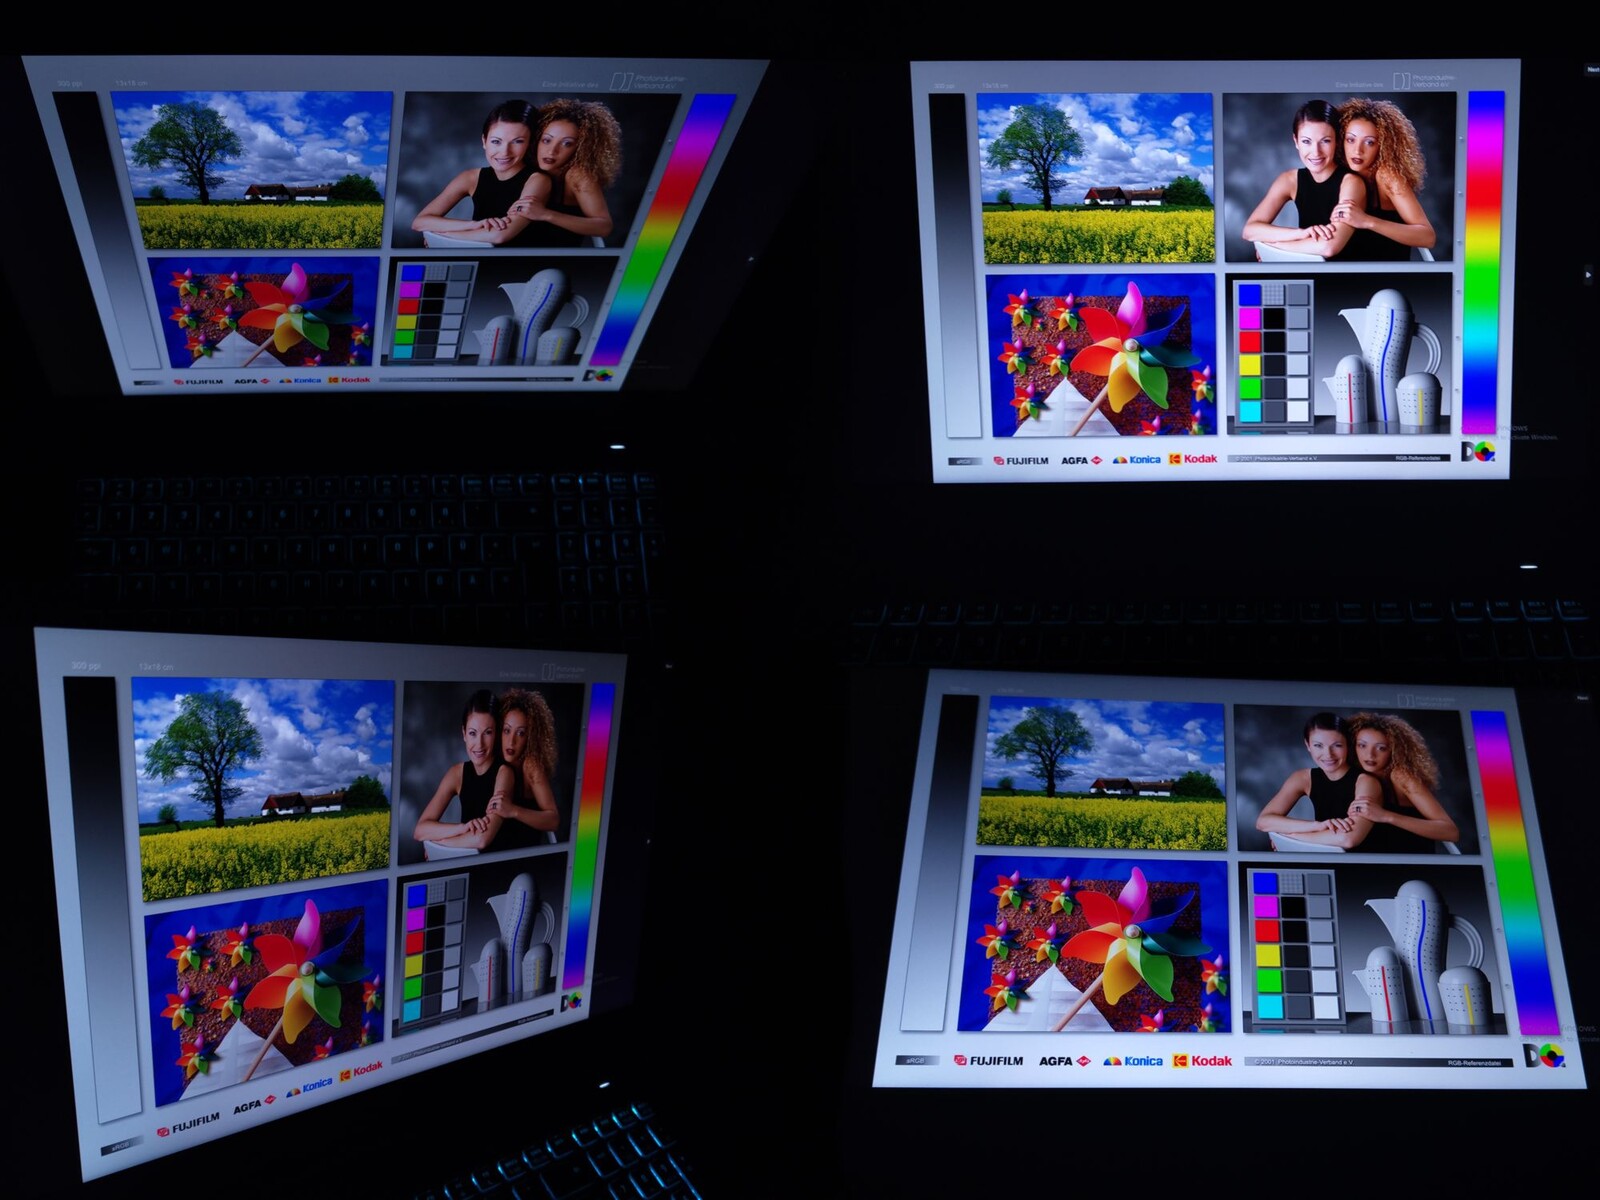
The Focus 15 uses the same high-quality IPS panel as the XMG Pro 15. However, it is slightly darker than in the Pro 15 with an average brightness of 302 cd/m² in our review sample. The screen has a refresh rate of 240 Hz and sports a 2,560 × 1,440 resolution.
The matte display's black value and contrast are acceptable, and the illumination is also good. Backlight bleeding is hardly visible on the screen.
Besides the QHD display, Schenker also offers a full HD display option for the XMG Focus 15. This has a refresh rate of 165 Hz and only represents 95% of the sRGB color space according to Schenker. However, both display options support G-Sync.
Those who buy the laptop as a pure gaming device and want to use it with the RTX 4050 should consider choosing the full HD display, which is about €80 cheaper. Most games only support the sRGB color space anyway and can fully utilize the display's capabilities in combination with the RTX 4050.
QHD or 4K gaming is only possible to a limited extent with the entry-level Nvidia graphics.
| |||||||||||||||||||||||||
Brightness Distribution: 85 %
Center on Battery: 302 cd/m²
Contrast: 839:1 (Black: 0.36 cd/m²)
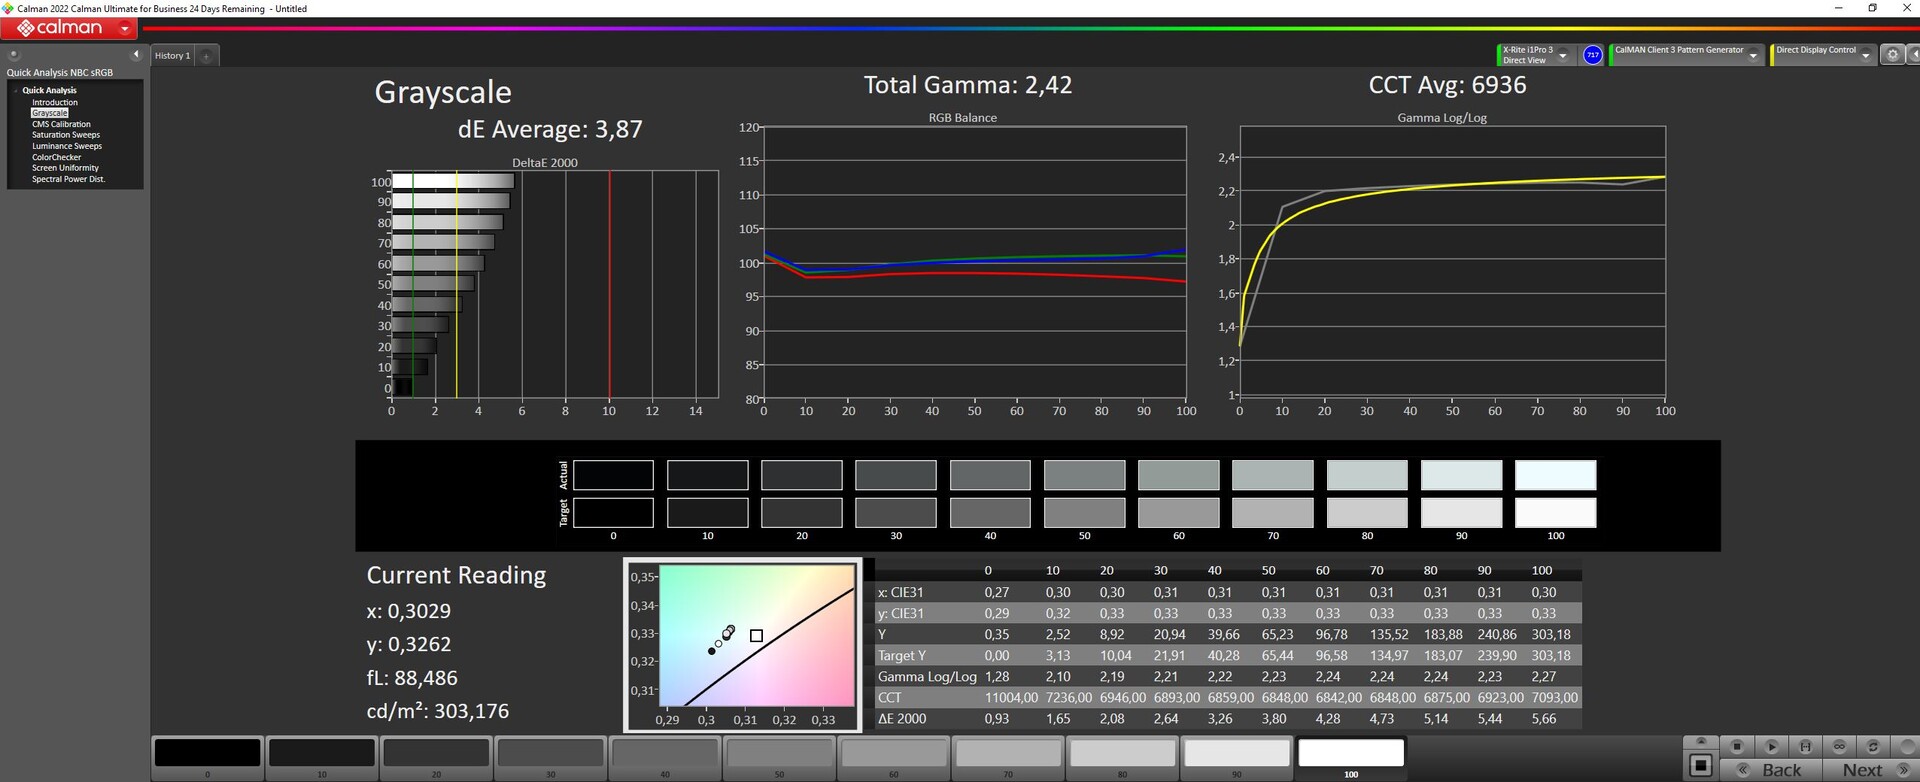
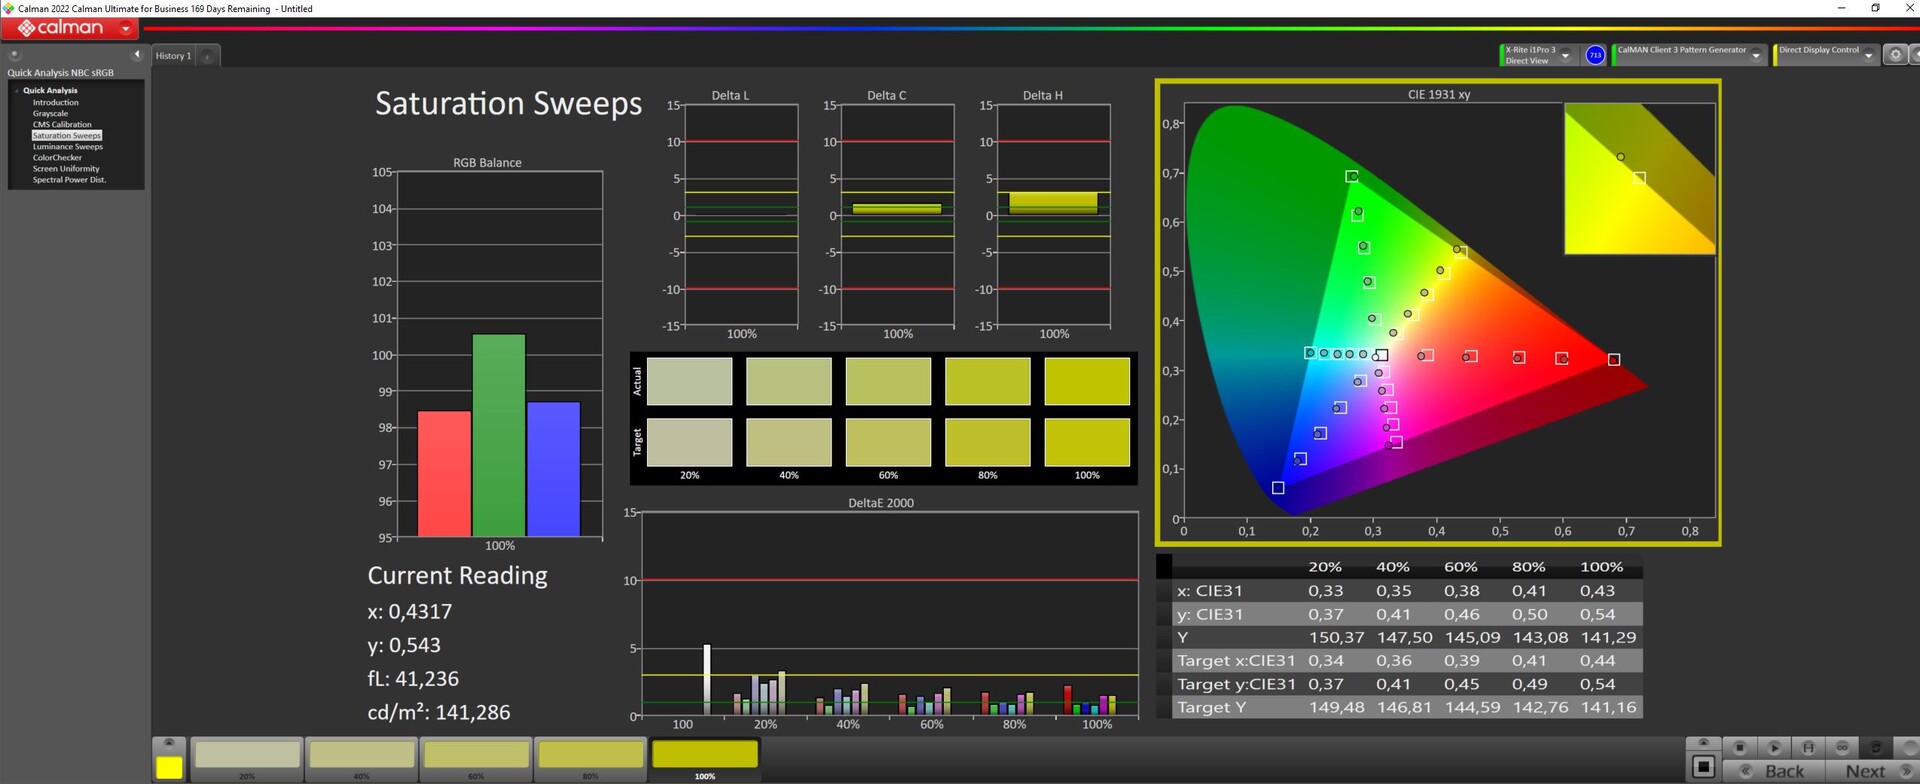
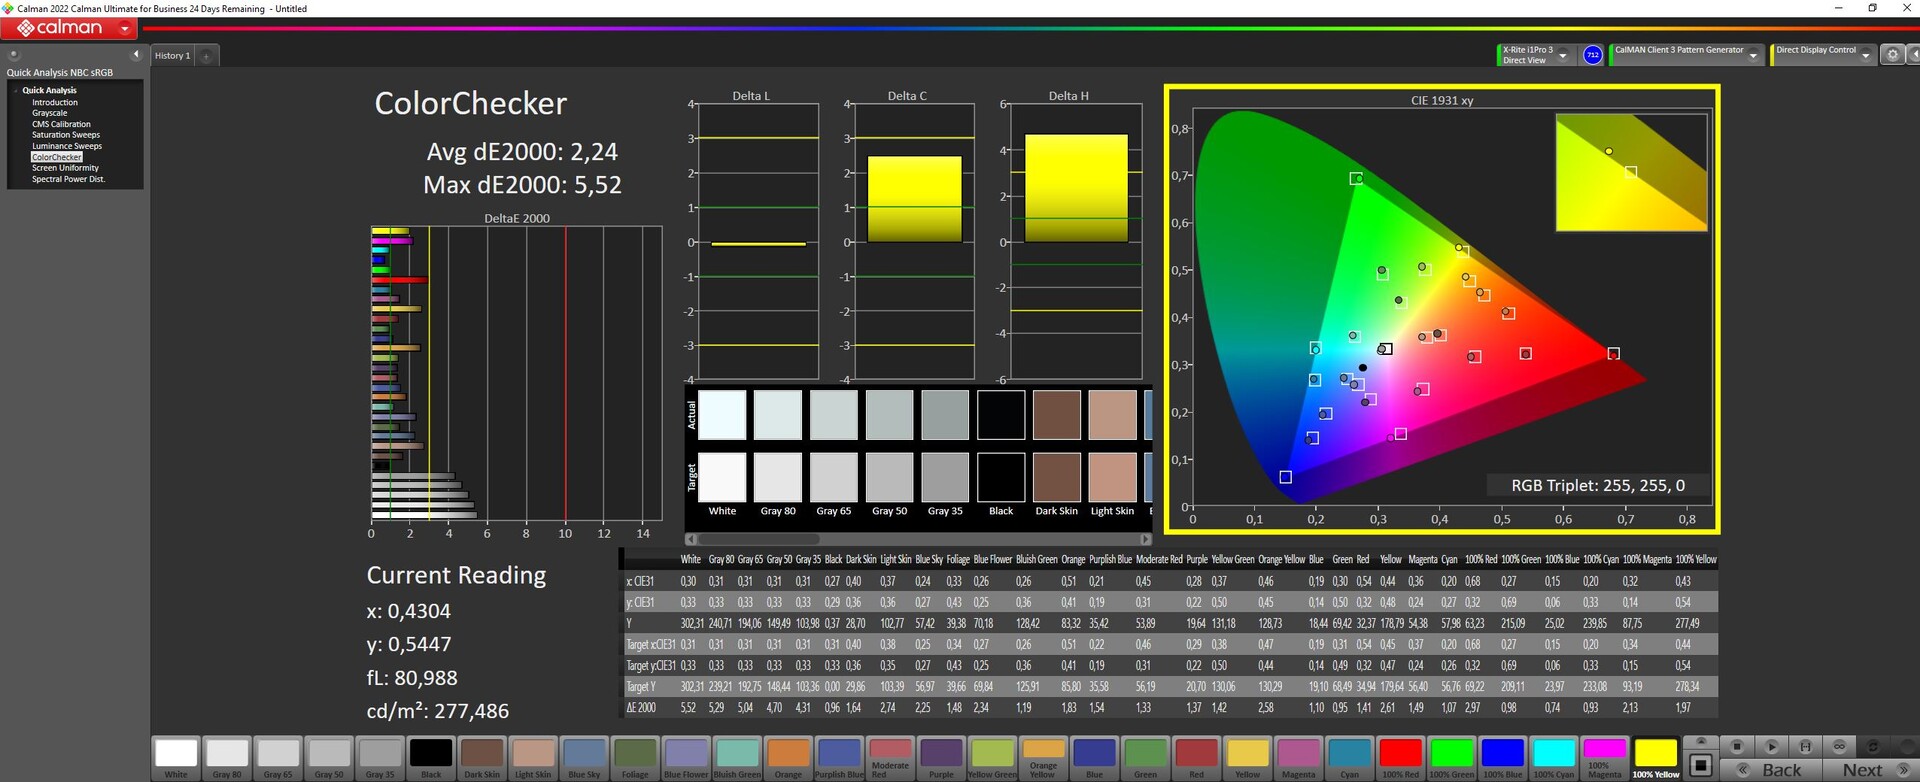
ΔE ColorChecker Calman: 2.24 | ∀{0.5-29.43 Ø4.72}
ΔE Greyscale Calman: 3.87 | ∀{0.09-98 Ø4.97}
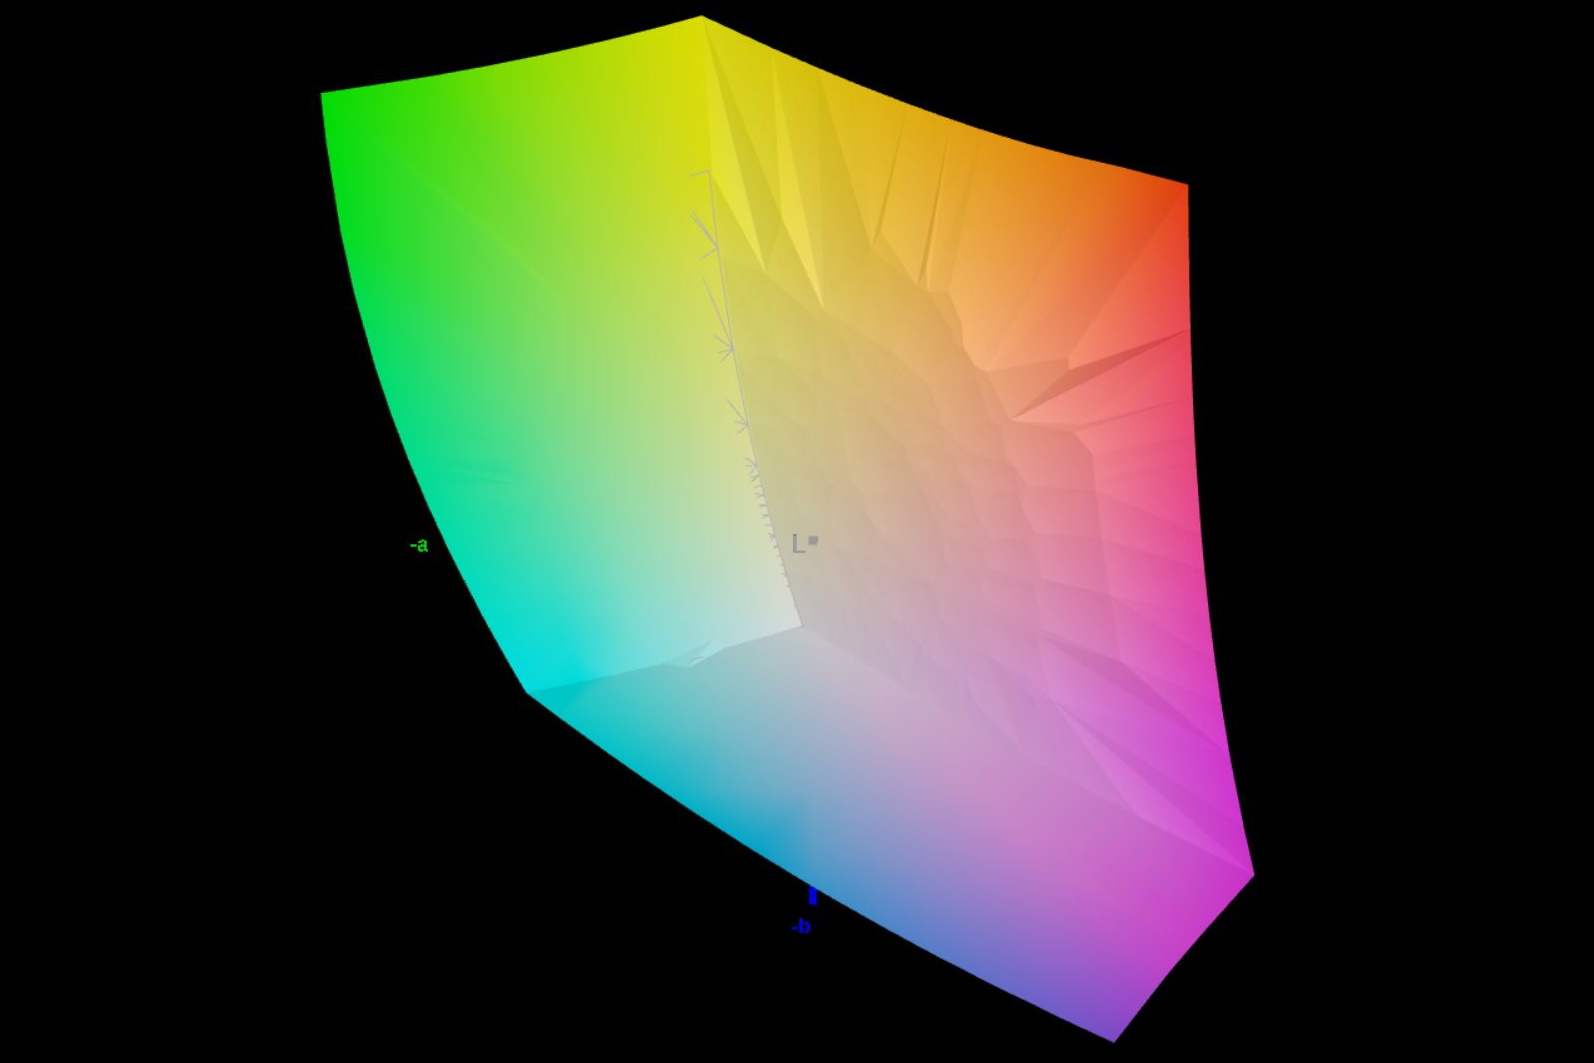
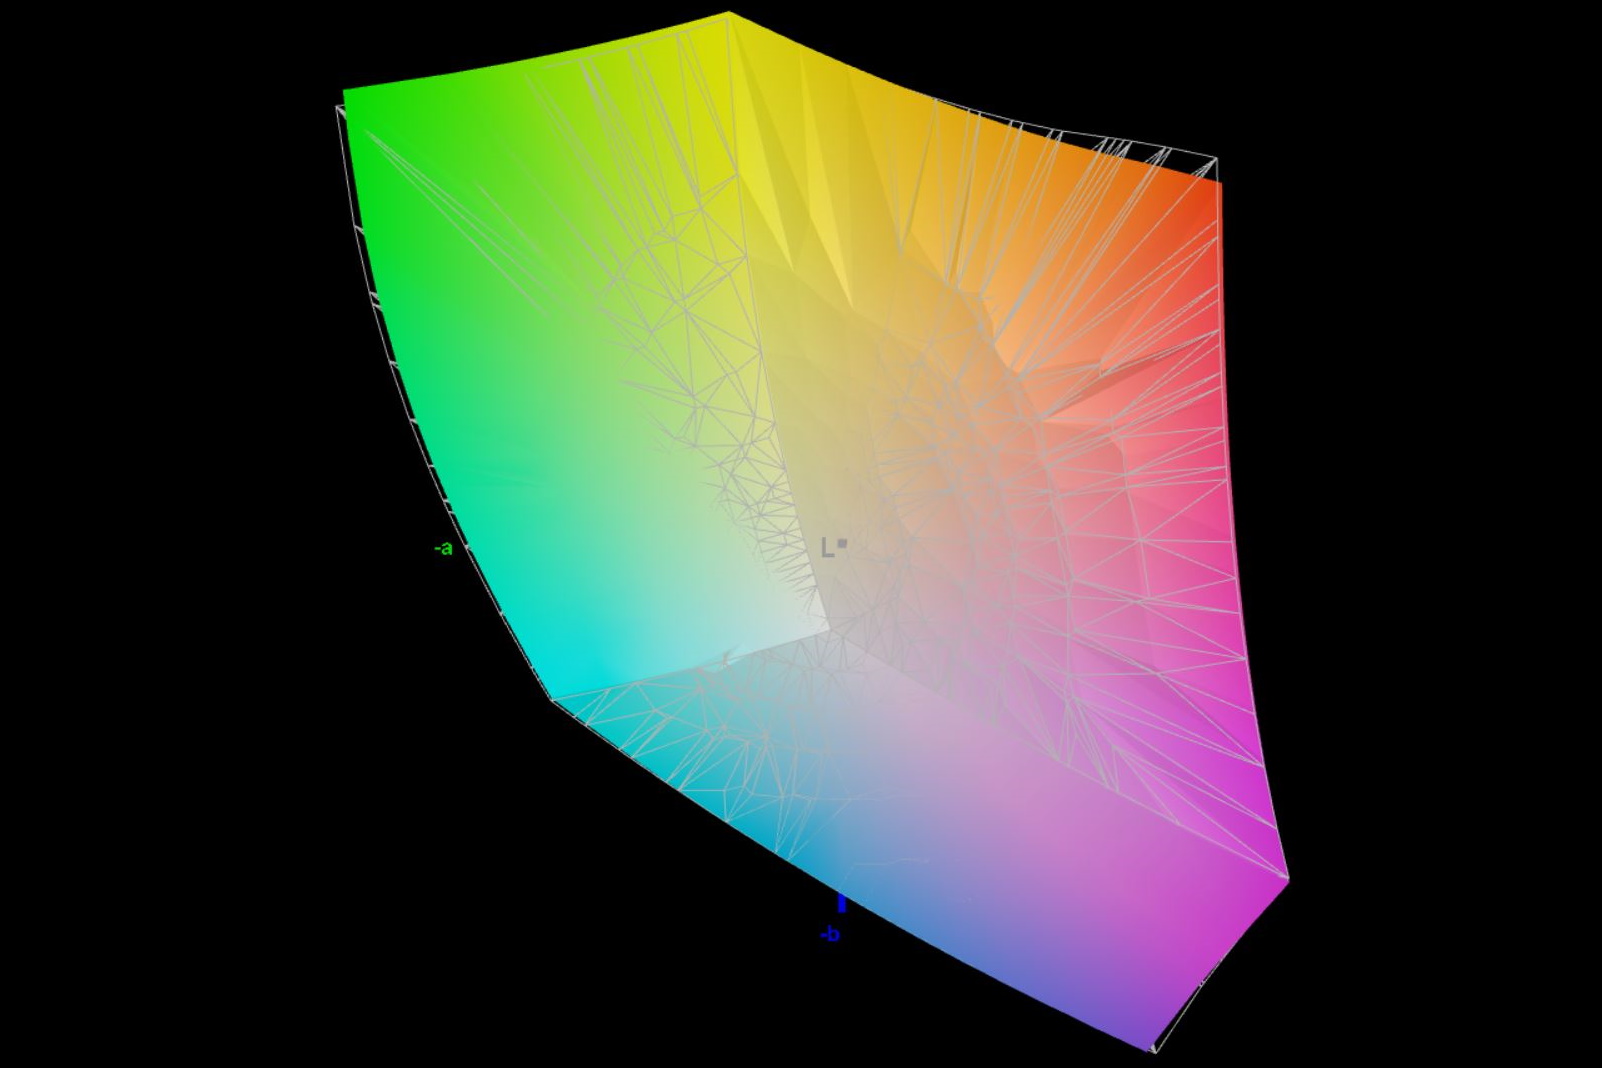
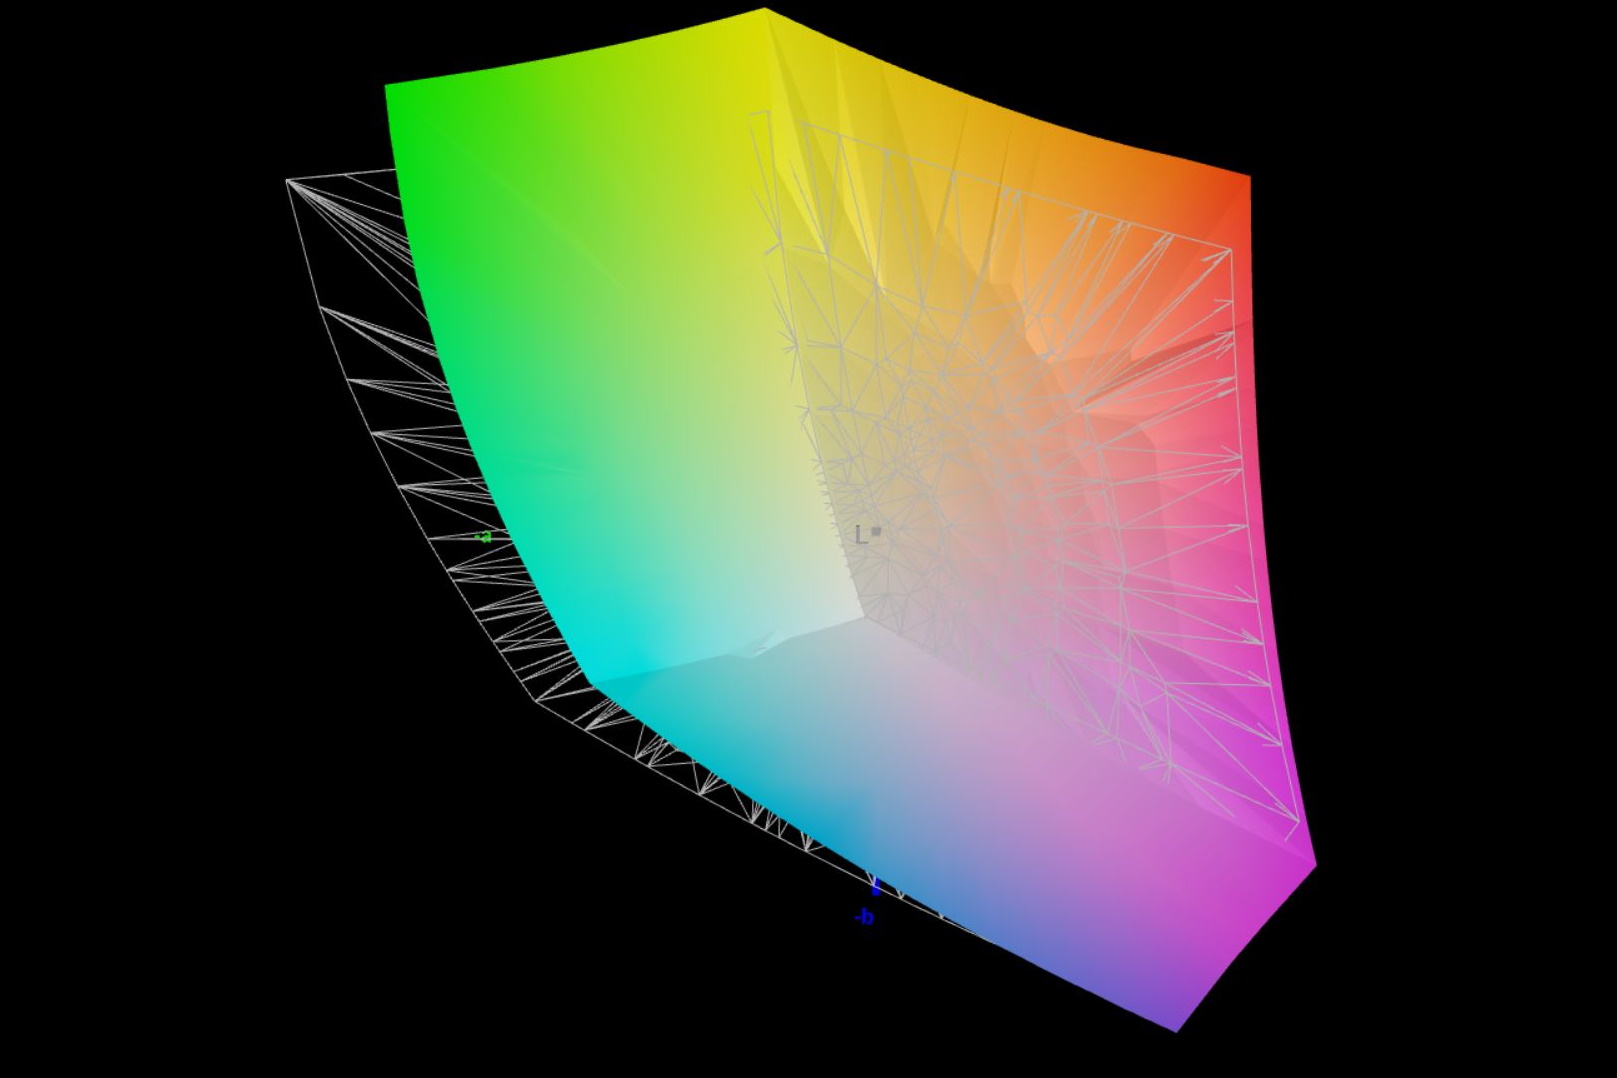
86.3% AdobeRGB 1998 (Argyll 3D)
99.9% sRGB (Argyll 3D)
98.6% Display P3 (Argyll 3D)
Gamma: 2.42
CCT: 6936 K
| Schenker XMG Focus 15 (E23) BOE0AD1, IPS, 2569x1440, 15.6" | Schenker XMG Pro 15 (E23) BOE0AD1, IPS, 2560x1440, 15.6" | Asus TUF A15 FA507 N156HMA-GA1, IPS, 1920x1080, 15.6" | MSI Katana 15 B12VEK AUOAF90 (B156HAN08.4), IPS, 1920x1080, 15.6" | Acer Swift X SFX14-71G ATNA45AF03-0, OLED, 2880x1800, 14.5" | Samsung Galaxy Book3 Ultra 16 Samsung ATNA60CL03-0, AMOLED, 2880x1800, 16" | Gigabyte Aero 14 OLED BMF Samsung SDC4192 (ATNA40YK14-0), OLED, 2880x1800, 14" | |
|---|---|---|---|---|---|---|---|
| Display | -1% | -20% | -53% | 4% | 4% | 1% | |
| Display P3 Coverage (%) | 98.6 | 97.8 -1% | 64.9 -34% | 38.1 -61% | 99.9 1% | 99.9 1% | 99.8 1% |
| sRGB Coverage (%) | 99.9 | 99.9 0% | 96.5 -3% | 56.8 -43% | 99.9 0% | 100 0% | 100 0% |
| AdobeRGB 1998 Coverage (%) | 86.3 | 85.4 -1% | 66.6 -23% | 39.3 -54% | 96.2 11% | 96.3 12% | 88.7 3% |
| Response Times | 14% | -87% | -140% | 96% | 96% | 82% | |
| Response Time Grey 50% / Grey 80% * (ms) | 15.6 ? | 14 ? 10% | 30.4 ? -95% | 38.8 ? -149% | 0.4 ? 97% | 0.49 ? 97% | 2.4 ? 85% |
| Response Time Black / White * (ms) | 11.6 ? | 9.6 ? 17% | 20.8 ? -79% | 26.8 ? -131% | 0.6 ? 95% | 0.65 ? 94% | 2.4 ? 79% |
| PWM Frequency (Hz) | 240 ? | 240 ? | 300 | ||||
| Screen | 10% | 30% | -38% | 30% | 215% | 103% | |
| Brightness middle (cd/m²) | 302 | 322 7% | 288 -5% | 261 -14% | 388 28% | 400 32% | 423 40% |
| Brightness (cd/m²) | 278 | 301 8% | 271 -3% | 258 -7% | 390 40% | 399 44% | 427 54% |
| Brightness Distribution (%) | 85 | 85 0% | 91 7% | 92 8% | 98 15% | 93 9% | 98 15% |
| Black Level * (cd/m²) | 0.36 | 0.36 -0% | 0.17 53% | 0.19 47% | 0.03 92% | 0.1 72% | |
| Contrast (:1) | 839 | 894 7% | 1694 102% | 1374 64% | 13333 1489% | 4230 404% | |
| Colorchecker dE 2000 * | 2.24 | 1.98 12% | 1.9 15% | 5.57 -149% | 2.2 2% | 2.3 -3% | 0.55 75% |
| Colorchecker dE 2000 max. * | 5.52 | 5.24 5% | 3.3 40% | 20.6 -273% | 3.9 29% | 4.15 25% | 1.15 79% |
| Greyscale dE 2000 * | 3.87 | 2.44 37% | 2.7 30% | 3.19 18% | 1.4 64% | 2.7 30% | 0.69 82% |
| Gamma | 2.42 91% | 2.42 91% | 2.32 95% | 2.45 90% | 2.22 99% | 2.266 97% | 2.42 91% |
| CCT | 6936 94% | 6984 93% | 6535 99% | 6146 106% | 6380 102% | 7047 92% | 6479 100% |
| Colorchecker dE 2000 calibrated * | 1.98 | 0.9 | 4.63 | 1.9 | 1.66 | 1.15 | |
| Total Average (Program / Settings) | 8% /
8% | -26% /
0% | -77% /
-57% | 43% /
35% | 105% /
148% | 62% /
76% |
* ... smaller is better
For videographers and content creators, the near-complete Display P3 color space coverage in the XMG Focus 15 should be a plus. The AdobeRGB color space is more important for photo editing and printing, and the Focus 15 manages to only reproduce 88% of this.
The screen in our test device has a good color reproduction with an average color deviation of ΔΕ 2.24 ex-works. The values improve further upon calibration.
We found that the color reproduction could also be improved when the illumination is set at 150 nits.

Display Response Times
| ↔ Response Time Black to White | ||
|---|---|---|
| 11.6 ms ... rise ↗ and fall ↘ combined | ↗ 5.8 ms rise | 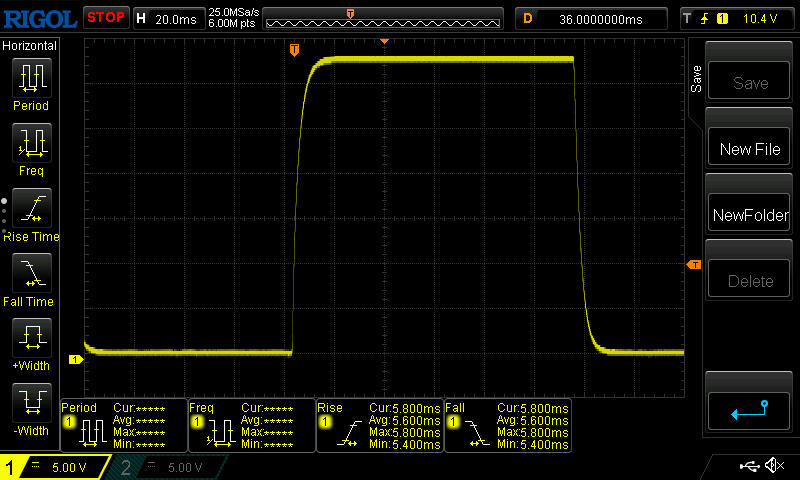 |
| ↘ 5.8 ms fall | ||
| The screen shows good response rates in our tests, but may be too slow for competitive gamers. In comparison, all tested devices range from 0.1 (minimum) to 240 (maximum) ms. » 31 % of all devices are better. This means that the measured response time is better than the average of all tested devices (19.9 ms). | ||
| ↔ Response Time 50% Grey to 80% Grey | ||
| 15.6 ms ... rise ↗ and fall ↘ combined | ↗ 7.4 ms rise | 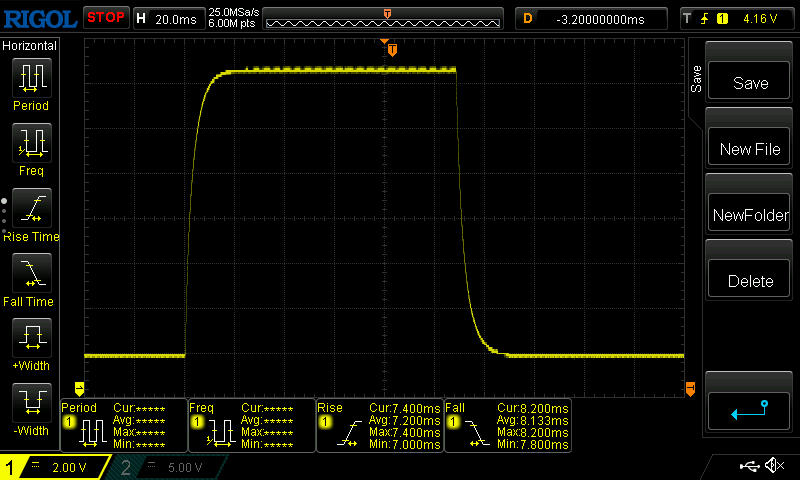 |
| ↘ 8.2 ms fall | ||
| The screen shows good response rates in our tests, but may be too slow for competitive gamers. In comparison, all tested devices range from 0.165 (minimum) to 636 (maximum) ms. » 30 % of all devices are better. This means that the measured response time is better than the average of all tested devices (31.1 ms). | ||
Screen Flickering / PWM (Pulse-Width Modulation)
| Screen flickering / PWM not detected | 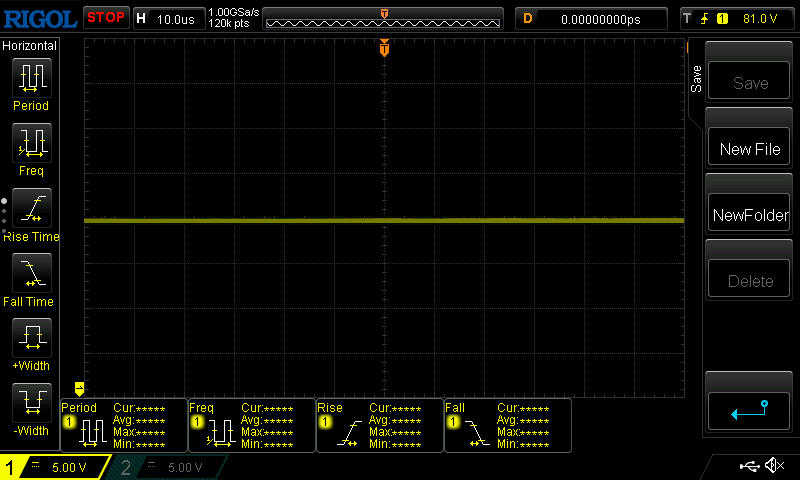 | ||
In comparison: 52 % of all tested devices do not use PWM to dim the display. If PWM was detected, an average of 7784 (minimum: 5 - maximum: 343500) Hz was measured. | |||
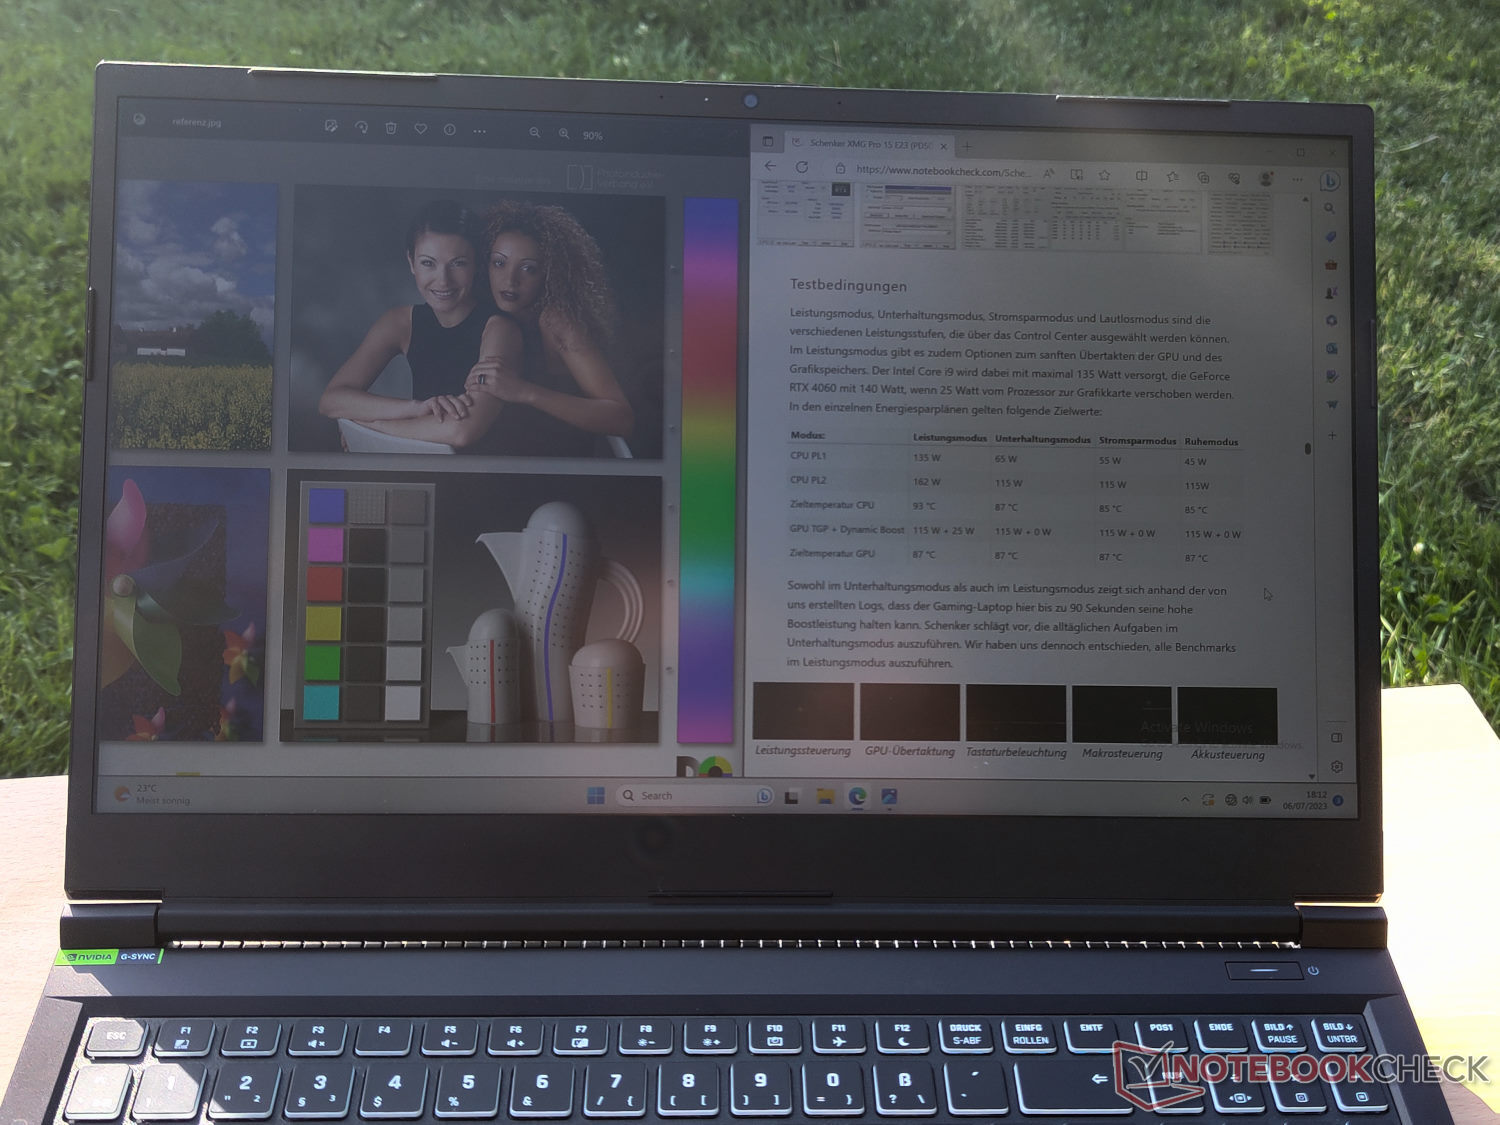
With its matte surface, the reasonably bright display is also usable outdoors as long as the location and angle to the sun are taken care of. Fortunately, a favorable position can usually be found since the screen's viewing angles are quite stable.
Performance: Core i9 with extreme performance
Schenker offers a wide range of configuration options for the XMG Focus 15. The processor in all of them is the Intel Core i9-13900HX. This is supported by an Nvidia chip with GeForce RTX 4050, RTX 4060 or RTX 4070 options available in the configuration process at Bestware along with several memory options.
Our test device is equipped with the Nvidia GeForce RTX 4050 Laptop GPU and 32 GB of working memory. With the lowest graphics chip of the Ada Lovelace generation, the laptop is capable of playing many current games smoothly, although you will probably have to limit the quality settings if you want to utilize the display's full QHD resolution.
Test conditions
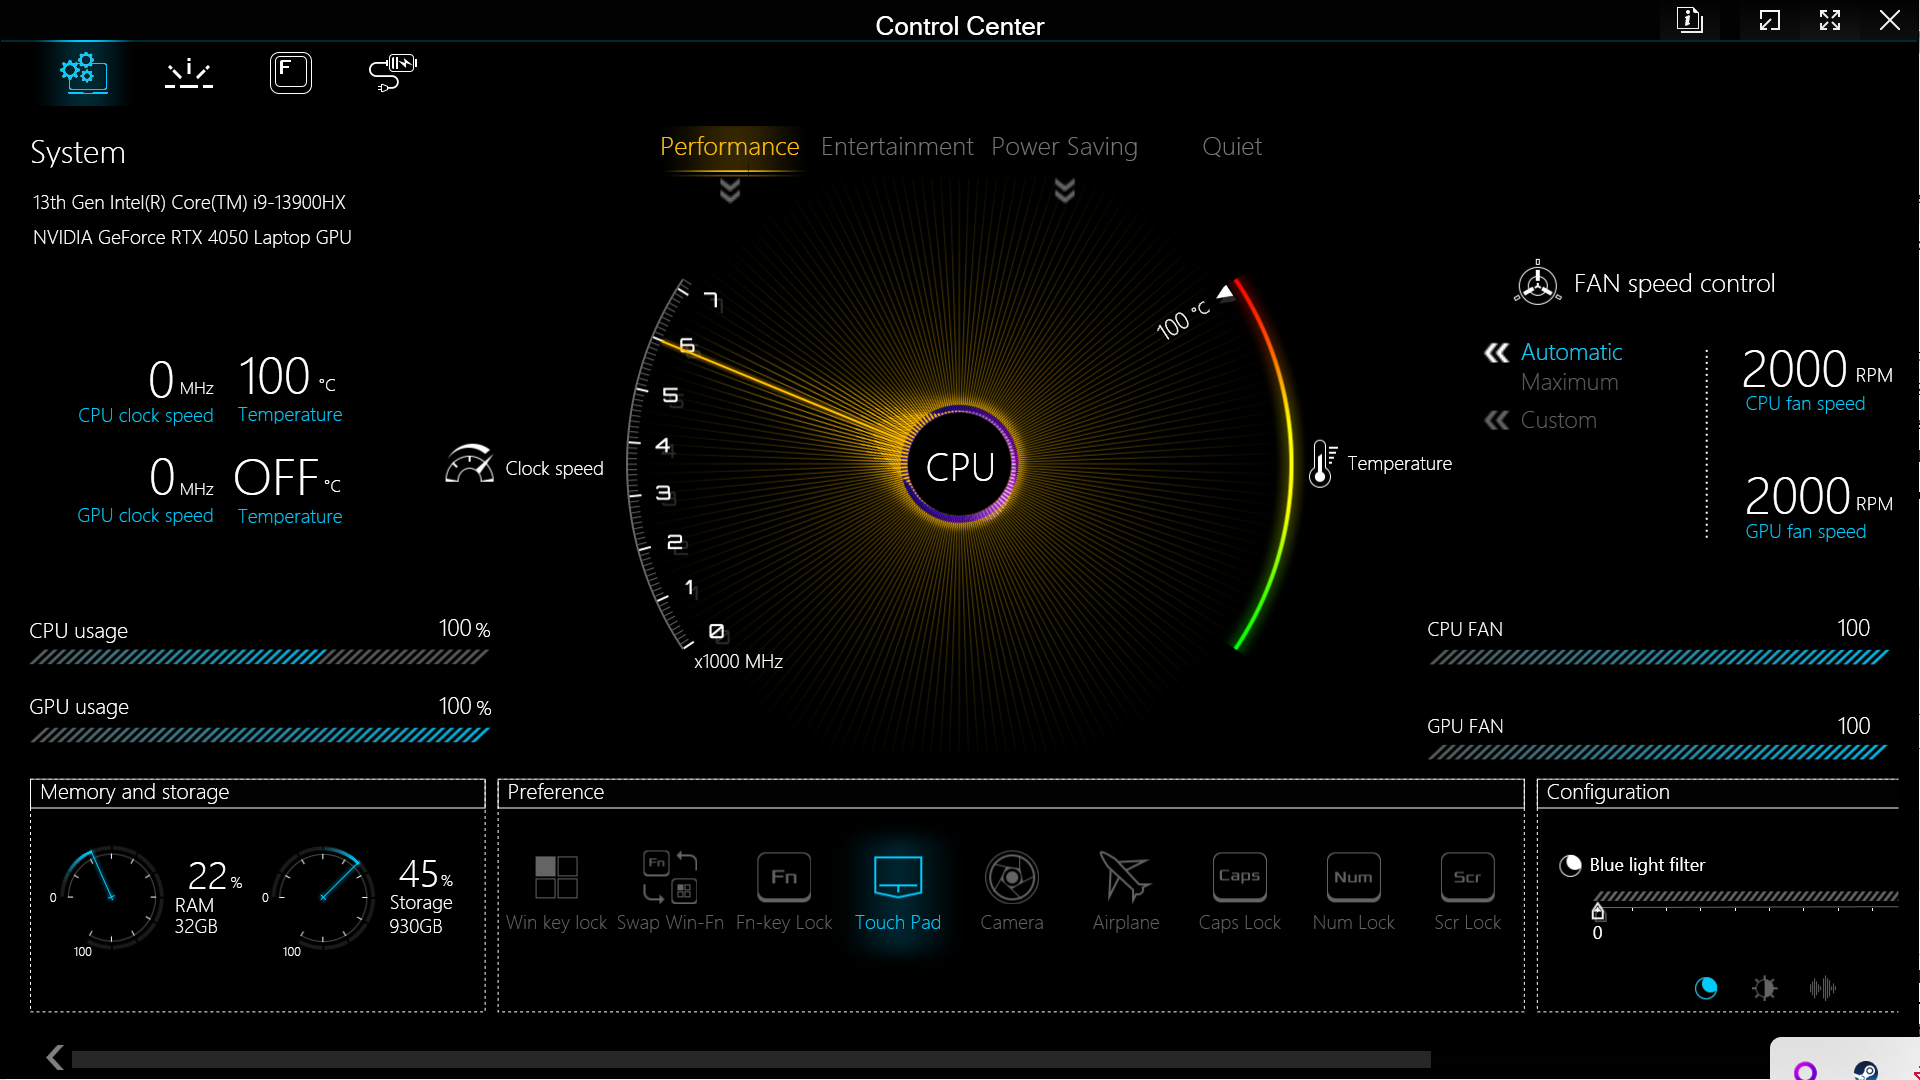
Four different performance plans can be accessed via Schenker's Control Center. While the Power-saving mode and Sleep mode noticeably limit the performance of the test device, the benchmarks of the Performance and Entertainment modes are often quite close to each other when a lot of performance is demanded from the laptop over longer periods.
That being said, the processor's boost phase lasts considerably longer in the Performance mode. With almost 1.5 minutes in boost, the processor easily gets through benchmarks like Cinebench R23 or Blender tests. The power limits in individual modes are as follows:
| Mode: | Power mode | Entertainment mode | Power saving mode |
|---|---|---|---|
| CPU PL1 | 135 W | 55 W | 15 W |
| CPU PL2 | 162 W | 130 W | 30 W |
| Target temperature CPU | 93 °C | 87 °C | 85 °C |
| GPU TGP + Dynamic Boost | 115 W + 25 W | 115 W + 0 W | 115 W + 0 W |
| Target temperature GPU | 87 °C | 87 °C | 87 °C |
The laptop can achieve the high target rates of the Performance mode in our tests. These correspond exactly to the values that Schenker also achieved with the XMG Pro 15. Thus, the performance of the two processors in Focus and Pro are nearly identical.
In order to draw a better comparison between the two devices, we ultimately decided to run all benchmarks in Performance mode in the XMG Focus 15 as well.
Processor
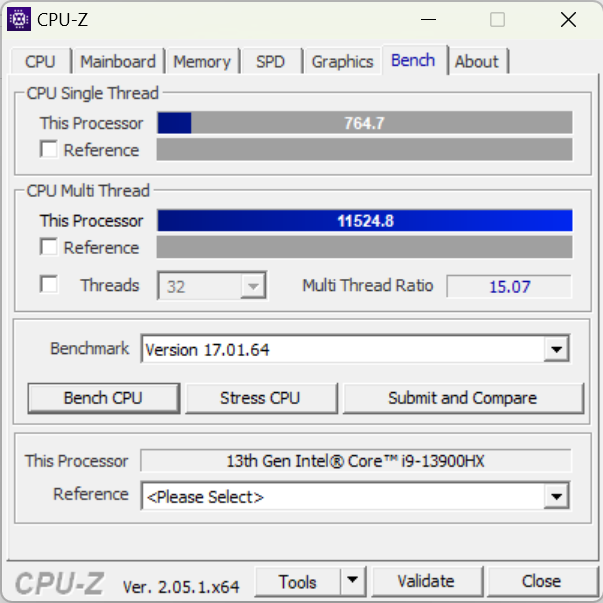
With the Intel Core i9-13900HX, one of the highest-end laptop processors from the Raptor Lake-HX generation is installed in the XMG Focus 15. Here the processor is even slightly faster than the one in the Pro 15.
The difference is more perceptible in the area of the smooth running of modern processors. With 8 P-cores and 16 E-cores, the processor has 32 threads that provide extreme multitasking. The Focus 15 and the Pro 15 are at the top of the comparison devices.
Cinebench R15 Multi Loop Test
Cinebench R23: Multi Core | Single Core
Cinebench R20: CPU (Multi Core) | CPU (Single Core)
Cinebench R15: CPU Multi 64Bit | CPU Single 64Bit
Blender: v2.79 BMW27 CPU
7-Zip 18.03: 7z b 4 | 7z b 4 -mmt1
Geekbench 5.5: Multi-Core | Single-Core
HWBOT x265 Benchmark v2.2: 4k Preset
LibreOffice : 20 Documents To PDF
R Benchmark 2.5: Overall mean
| CPU Performance rating | |
| Average Intel Core i9-13900HX | |
| Average of class Gaming | |
| Schenker XMG Focus 15 (E23) | |
| Schenker XMG Pro 15 (E23) | |
| Gigabyte Aero 14 OLED BMF | |
| Acer Swift X SFX14-71G | |
| Samsung Galaxy Book3 Ultra 16 | |
| MSI Katana 15 B12VEK | |
| Asus TUF A15 FA507 | |
| Cinebench R23 / Multi Core | |
| Average Intel Core i9-13900HX (24270 - 32623, n=23) | |
| Average of class Gaming (10488 - 40970, n=110, last 2 years) | |
| Schenker XMG Pro 15 (E23) | |
| Schenker XMG Focus 15 (E23) | |
| Acer Swift X SFX14-71G | |
| MSI Katana 15 B12VEK | |
| Samsung Galaxy Book3 Ultra 16 | |
| Gigabyte Aero 14 OLED BMF | |
| Asus TUF A15 FA507 | |
| Cinebench R23 / Single Core | |
| Average Intel Core i9-13900HX (1867 - 2105, n=20) | |
| Average of class Gaming (1166 - 2356, n=110, last 2 years) | |
| Schenker XMG Focus 15 (E23) | |
| Acer Swift X SFX14-71G | |
| Schenker XMG Pro 15 (E23) | |
| Gigabyte Aero 14 OLED BMF | |
| Samsung Galaxy Book3 Ultra 16 | |
| MSI Katana 15 B12VEK | |
| Asus TUF A15 FA507 | |
| Cinebench R20 / CPU (Multi Core) | |
| Average Intel Core i9-13900HX (9152 - 12541, n=21) | |
| Average of class Gaming (4029 - 16108, n=109, last 2 years) | |
| Schenker XMG Pro 15 (E23) | |
| Schenker XMG Focus 15 (E23) | |
| Acer Swift X SFX14-71G | |
| MSI Katana 15 B12VEK | |
| Samsung Galaxy Book3 Ultra 16 | |
| Gigabyte Aero 14 OLED BMF | |
| Asus TUF A15 FA507 | |
| Cinebench R20 / CPU (Single Core) | |
| Average Intel Core i9-13900HX (722 - 810, n=21) | |
| Average of class Gaming (442 - 895, n=109, last 2 years) | |
| Schenker XMG Focus 15 (E23) | |
| Acer Swift X SFX14-71G | |
| Schenker XMG Pro 15 (E23) | |
| Gigabyte Aero 14 OLED BMF | |
| Samsung Galaxy Book3 Ultra 16 | |
| MSI Katana 15 B12VEK | |
| Asus TUF A15 FA507 | |
| Cinebench R15 / CPU Multi 64Bit | |
| Average Intel Core i9-13900HX (3913 - 4970, n=22) | |
| Schenker XMG Focus 15 (E23) | |
| Average of class Gaming (1578 - 6271, n=109, last 2 years) | |
| Schenker XMG Pro 15 (E23) | |
| Samsung Galaxy Book3 Ultra 16 | |
| Gigabyte Aero 14 OLED BMF | |
| Acer Swift X SFX14-71G | |
| Asus TUF A15 FA507 | |
| MSI Katana 15 B12VEK | |
| Cinebench R15 / CPU Single 64Bit | |
| Average of class Gaming (188.8 - 343, n=109, last 2 years) | |
| Average Intel Core i9-13900HX (247 - 304, n=22) | |
| Acer Swift X SFX14-71G | |
| Schenker XMG Focus 15 (E23) | |
| Gigabyte Aero 14 OLED BMF | |
| Asus TUF A15 FA507 | |
| MSI Katana 15 B12VEK | |
| Schenker XMG Pro 15 (E23) | |
| Samsung Galaxy Book3 Ultra 16 | |
| Blender / v2.79 BMW27 CPU | |
| Acer Swift X SFX14-71G | |
| MSI Katana 15 B12VEK | |
| Gigabyte Aero 14 OLED BMF | |
| Asus TUF A15 FA507 | |
| Samsung Galaxy Book3 Ultra 16 | |
| Average of class Gaming (80 - 330, n=107, last 2 years) | |
| Schenker XMG Pro 15 (E23) | |
| Schenker XMG Focus 15 (E23) | |
| Average Intel Core i9-13900HX (101 - 153, n=22) | |
| 7-Zip 18.03 / 7z b 4 | |
| Average Intel Core i9-13900HX (90675 - 127283, n=21) | |
| Schenker XMG Focus 15 (E23) | |
| Schenker XMG Pro 15 (E23) | |
| Average of class Gaming (33491 - 148086, n=108, last 2 years) | |
| Samsung Galaxy Book3 Ultra 16 | |
| Asus TUF A15 FA507 | |
| MSI Katana 15 B12VEK | |
| Gigabyte Aero 14 OLED BMF | |
| Acer Swift X SFX14-71G | |
| 7-Zip 18.03 / 7z b 4 -mmt1 | |
| Average Intel Core i9-13900HX (6340 - 7177, n=21) | |
| Average of class Gaming (4199 - 7436, n=108, last 2 years) | |
| Schenker XMG Focus 15 (E23) | |
| Schenker XMG Pro 15 (E23) | |
| Acer Swift X SFX14-71G | |
| Gigabyte Aero 14 OLED BMF | |
| Asus TUF A15 FA507 | |
| MSI Katana 15 B12VEK | |
| Samsung Galaxy Book3 Ultra 16 | |
| Geekbench 5.5 / Multi-Core | |
| Average Intel Core i9-13900HX (17614 - 21075, n=22) | |
| Schenker XMG Focus 15 (E23) | |
| Schenker XMG Pro 15 (E23) | |
| Average of class Gaming (6460 - 27010, n=108, last 2 years) | |
| Acer Swift X SFX14-71G | |
| Samsung Galaxy Book3 Ultra 16 | |
| MSI Katana 15 B12VEK | |
| Gigabyte Aero 14 OLED BMF | |
| Asus TUF A15 FA507 | |
| Geekbench 5.5 / Single-Core | |
| Average of class Gaming (986 - 2474, n=108, last 2 years) | |
| Average Intel Core i9-13900HX (1345 - 2093, n=22) | |
| Gigabyte Aero 14 OLED BMF | |
| Acer Swift X SFX14-71G | |
| Schenker XMG Pro 15 (E23) | |
| Samsung Galaxy Book3 Ultra 16 | |
| MSI Katana 15 B12VEK | |
| Asus TUF A15 FA507 | |
| Schenker XMG Focus 15 (E23) | |
| HWBOT x265 Benchmark v2.2 / 4k Preset | |
| Average Intel Core i9-13900HX (23.5 - 34.4, n=22) | |
| Average of class Gaming (11.5 - 44.3, n=108, last 2 years) | |
| Schenker XMG Focus 15 (E23) | |
| Schenker XMG Pro 15 (E23) | |
| MSI Katana 15 B12VEK | |
| Asus TUF A15 FA507 | |
| Samsung Galaxy Book3 Ultra 16 | |
| Gigabyte Aero 14 OLED BMF | |
| Acer Swift X SFX14-71G | |
| LibreOffice / 20 Documents To PDF | |
| Schenker XMG Pro 15 (E23) | |
| Asus TUF A15 FA507 | |
| Samsung Galaxy Book3 Ultra 16 | |
| Average of class Gaming (19 - 88.8, n=108, last 2 years) | |
| MSI Katana 15 B12VEK | |
| Average Intel Core i9-13900HX (32.8 - 51.1, n=21) | |
| Gigabyte Aero 14 OLED BMF | |
| Acer Swift X SFX14-71G | |
| Schenker XMG Focus 15 (E23) | |
| R Benchmark 2.5 / Overall mean | |
| Asus TUF A15 FA507 | |
| MSI Katana 15 B12VEK | |
| Samsung Galaxy Book3 Ultra 16 | |
| Schenker XMG Pro 15 (E23) | |
| Gigabyte Aero 14 OLED BMF | |
| Acer Swift X SFX14-71G | |
| Schenker XMG Focus 15 (E23) | |
| Average of class Gaming (0.3439 - 0.759, n=109, last 2 years) | |
| Average Intel Core i9-13900HX (0.375 - 0.4564, n=22) | |
* ... smaller is better
AIDA64: FP32 Ray-Trace | FPU Julia | CPU SHA3 | CPU Queen | FPU SinJulia | FPU Mandel | CPU AES | CPU ZLib | FP64 Ray-Trace | CPU PhotoWorxx
| Performance rating | |
| Average of class Gaming | |
| Average Intel Core i9-13900HX | |
| Schenker XMG Focus 15 (E23) | |
| Schenker XMG Pro 15 (E23) | |
| Asus TUF A15 FA507 | |
| Gigabyte Aero 14 OLED BMF | |
| Samsung Galaxy Book3 Ultra 16 | |
| MSI Katana 15 B12VEK | |
| Acer Swift X SFX14-71G | |
| AIDA64 / FP32 Ray-Trace | |
| Average of class Gaming (10227 - 85542, n=107, last 2 years) | |
| Average Intel Core i9-13900HX (17589 - 27615, n=22) | |
| Schenker XMG Focus 15 (E23) | |
| Schenker XMG Pro 15 (E23) | |
| Asus TUF A15 FA507 | |
| MSI Katana 15 B12VEK | |
| Samsung Galaxy Book3 Ultra 16 | |
| Gigabyte Aero 14 OLED BMF | |
| Acer Swift X SFX14-71G | |
| AIDA64 / FPU Julia | |
| Average of class Gaming (51376 - 238426, n=107, last 2 years) | |
| Average Intel Core i9-13900HX (88686 - 137015, n=22) | |
| Schenker XMG Focus 15 (E23) | |
| Asus TUF A15 FA507 | |
| Schenker XMG Pro 15 (E23) | |
| MSI Katana 15 B12VEK | |
| Samsung Galaxy Book3 Ultra 16 | |
| Gigabyte Aero 14 OLED BMF | |
| Acer Swift X SFX14-71G | |
| AIDA64 / CPU SHA3 | |
| Average of class Gaming (2180 - 9817, n=107, last 2 years) | |
| Average Intel Core i9-13900HX (4362 - 7029, n=22) | |
| Schenker XMG Focus 15 (E23) | |
| Schenker XMG Pro 15 (E23) | |
| Asus TUF A15 FA507 | |
| Samsung Galaxy Book3 Ultra 16 | |
| MSI Katana 15 B12VEK | |
| Gigabyte Aero 14 OLED BMF | |
| Acer Swift X SFX14-71G | |
| AIDA64 / CPU Queen | |
| Schenker XMG Focus 15 (E23) | |
| Average Intel Core i9-13900HX (125644 - 141385, n=22) | |
| Schenker XMG Pro 15 (E23) | |
| Average of class Gaming (49785 - 173351, n=98, last 2 years) | |
| Gigabyte Aero 14 OLED BMF | |
| Acer Swift X SFX14-71G | |
| Asus TUF A15 FA507 | |
| Samsung Galaxy Book3 Ultra 16 | |
| MSI Katana 15 B12VEK | |
| AIDA64 / FPU SinJulia | |
| Average Intel Core i9-13900HX (12334 - 17179, n=22) | |
| Average of class Gaming (4424 - 33636, n=107, last 2 years) | |
| Schenker XMG Focus 15 (E23) | |
| Asus TUF A15 FA507 | |
| Schenker XMG Pro 15 (E23) | |
| Samsung Galaxy Book3 Ultra 16 | |
| Gigabyte Aero 14 OLED BMF | |
| MSI Katana 15 B12VEK | |
| Acer Swift X SFX14-71G | |
| AIDA64 / FPU Mandel | |
| Average of class Gaming (25115 - 128721, n=107, last 2 years) | |
| Average Intel Core i9-13900HX (43850 - 69202, n=22) | |
| Asus TUF A15 FA507 | |
| Schenker XMG Focus 15 (E23) | |
| Schenker XMG Pro 15 (E23) | |
| MSI Katana 15 B12VEK | |
| Samsung Galaxy Book3 Ultra 16 | |
| Gigabyte Aero 14 OLED BMF | |
| Acer Swift X SFX14-71G | |
| AIDA64 / CPU AES | |
| Average Intel Core i9-13900HX (89413 - 237881, n=22) | |
| Gigabyte Aero 14 OLED BMF | |
| Average of class Gaming (39258 - 247074, n=107, last 2 years) | |
| Schenker XMG Focus 15 (E23) | |
| Schenker XMG Pro 15 (E23) | |
| Acer Swift X SFX14-71G | |
| Samsung Galaxy Book3 Ultra 16 | |
| MSI Katana 15 B12VEK | |
| Asus TUF A15 FA507 | |
| AIDA64 / CPU ZLib | |
| Average Intel Core i9-13900HX (1284 - 1958, n=22) | |
| Schenker XMG Focus 15 (E23) | |
| Average of class Gaming (574 - 2531, n=107, last 2 years) | |
| Schenker XMG Pro 15 (E23) | |
| Samsung Galaxy Book3 Ultra 16 | |
| MSI Katana 15 B12VEK | |
| Gigabyte Aero 14 OLED BMF | |
| Acer Swift X SFX14-71G | |
| Asus TUF A15 FA507 | |
| AIDA64 / FP64 Ray-Trace | |
| Average of class Gaming (5509 - 45446, n=107, last 2 years) | |
| Average Intel Core i9-13900HX (9481 - 15279, n=22) | |
| Schenker XMG Focus 15 (E23) | |
| Schenker XMG Pro 15 (E23) | |
| Asus TUF A15 FA507 | |
| MSI Katana 15 B12VEK | |
| Samsung Galaxy Book3 Ultra 16 | |
| Gigabyte Aero 14 OLED BMF | |
| Acer Swift X SFX14-71G | |
| AIDA64 / CPU PhotoWorxx | |
| Gigabyte Aero 14 OLED BMF | |
| Schenker XMG Focus 15 (E23) | |
| Schenker XMG Pro 15 (E23) | |
| Average Intel Core i9-13900HX (42994 - 51994, n=22) | |
| Samsung Galaxy Book3 Ultra 16 | |
| Average of class Gaming (12271 - 89891, n=107, last 2 years) | |
| Acer Swift X SFX14-71G | |
| MSI Katana 15 B12VEK | |
| Asus TUF A15 FA507 | |
System performance
With Nvidia's entry-level GPU, the GeForce RTX 4050, the Focus can't score quite as many points in the PCMark 10 benchmark as the Pro 15. Still, the Focus 15 manages to keep up with the other comparison devices.
The slightly faster processor of the Focus 15 is again noticeable in the CrossMark benchmark. The review sample score slightly higher points than the Pro 15. CrossMark considers the graphics card's performance much less than PCMark.
CrossMark: Overall | Productivity | Creativity | Responsiveness
| PCMark 10 / Score | |
| Average of class Gaming (5828 - 11574, n=94, last 2 years) | |
| Schenker XMG Pro 15 (E23) | |
| Gigabyte Aero 14 OLED BMF | |
| Acer Swift X SFX14-71G | |
| Asus TUF A15 FA507 | |
| Schenker XMG Focus 15 (E23) | |
| Average Intel Core i9-13900HX, NVIDIA GeForce RTX 4050 Laptop GPU (n=1) | |
| MSI Katana 15 B12VEK | |
| Samsung Galaxy Book3 Ultra 16 | |
| PCMark 10 / Essentials | |
| Gigabyte Aero 14 OLED BMF | |
| Schenker XMG Pro 15 (E23) | |
| Acer Swift X SFX14-71G | |
| Average of class Gaming (8810 - 12600, n=98, last 2 years) | |
| Asus TUF A15 FA507 | |
| Samsung Galaxy Book3 Ultra 16 | |
| MSI Katana 15 B12VEK | |
| Schenker XMG Focus 15 (E23) | |
| Average Intel Core i9-13900HX, NVIDIA GeForce RTX 4050 Laptop GPU (n=1) | |
| PCMark 10 / Productivity | |
| Average of class Gaming (6845 - 18766, n=96, last 2 years) | |
| Schenker XMG Pro 15 (E23) | |
| MSI Katana 15 B12VEK | |
| Schenker XMG Focus 15 (E23) | |
| Average Intel Core i9-13900HX, NVIDIA GeForce RTX 4050 Laptop GPU (n=1) | |
| Acer Swift X SFX14-71G | |
| Gigabyte Aero 14 OLED BMF | |
| Asus TUF A15 FA507 | |
| Samsung Galaxy Book3 Ultra 16 | |
| PCMark 10 / Digital Content Creation | |
| Average of class Gaming (7602 - 19657, n=96, last 2 years) | |
| Asus TUF A15 FA507 | |
| Acer Swift X SFX14-71G | |
| Gigabyte Aero 14 OLED BMF | |
| Schenker XMG Pro 15 (E23) | |
| Schenker XMG Focus 15 (E23) | |
| Average Intel Core i9-13900HX, NVIDIA GeForce RTX 4050 Laptop GPU (n=1) | |
| Samsung Galaxy Book3 Ultra 16 | |
| MSI Katana 15 B12VEK | |
| CrossMark / Overall | |
| Schenker XMG Focus 15 (E23) | |
| Average Intel Core i9-13900HX, NVIDIA GeForce RTX 4050 Laptop GPU (n=1) | |
| Average of class Gaming (1366 - 2409, n=96, last 2 years) | |
| Schenker XMG Pro 15 (E23) | |
| Acer Swift X SFX14-71G | |
| Gigabyte Aero 14 OLED BMF | |
| MSI Katana 15 B12VEK | |
| Samsung Galaxy Book3 Ultra 16 | |
| Asus TUF A15 FA507 | |
| CrossMark / Productivity | |
| Schenker XMG Focus 15 (E23) | |
| Average Intel Core i9-13900HX, NVIDIA GeForce RTX 4050 Laptop GPU (n=1) | |
| Acer Swift X SFX14-71G | |
| Average of class Gaming (1386 - 2254, n=96, last 2 years) | |
| Schenker XMG Pro 15 (E23) | |
| Gigabyte Aero 14 OLED BMF | |
| MSI Katana 15 B12VEK | |
| Asus TUF A15 FA507 | |
| Samsung Galaxy Book3 Ultra 16 | |
| CrossMark / Creativity | |
| Schenker XMG Focus 15 (E23) | |
| Average Intel Core i9-13900HX, NVIDIA GeForce RTX 4050 Laptop GPU (n=1) | |
| Average of class Gaming (1343 - 2729, n=96, last 2 years) | |
| Schenker XMG Pro 15 (E23) | |
| Acer Swift X SFX14-71G | |
| Gigabyte Aero 14 OLED BMF | |
| MSI Katana 15 B12VEK | |
| Asus TUF A15 FA507 | |
| Samsung Galaxy Book3 Ultra 16 | |
| CrossMark / Responsiveness | |
| Acer Swift X SFX14-71G | |
| Schenker XMG Focus 15 (E23) | |
| Average Intel Core i9-13900HX, NVIDIA GeForce RTX 4050 Laptop GPU (n=1) | |
| Schenker XMG Pro 15 (E23) | |
| Gigabyte Aero 14 OLED BMF | |
| Average of class Gaming (1226 - 2334, n=96, last 2 years) | |
| MSI Katana 15 B12VEK | |
| Samsung Galaxy Book3 Ultra 16 | |
| Asus TUF A15 FA507 | |
| PCMark 10 Score | 6926 points | |
Help | ||
| AIDA64 / Memory Copy | |
| Gigabyte Aero 14 OLED BMF | |
| Schenker XMG Focus 15 (E23) | |
| Schenker XMG Pro 15 (E23) | |
| Average Intel Core i9-13900HX (67716 - 79193, n=22) | |
| Average of class Gaming (21750 - 129946, n=107, last 2 years) | |
| Samsung Galaxy Book3 Ultra 16 | |
| Acer Swift X SFX14-71G | |
| MSI Katana 15 B12VEK | |
| Asus TUF A15 FA507 | |
| AIDA64 / Memory Read | |
| Schenker XMG Focus 15 (E23) | |
| Schenker XMG Pro 15 (E23) | |
| Average Intel Core i9-13900HX (73998 - 88462, n=22) | |
| Gigabyte Aero 14 OLED BMF | |
| Average of class Gaming (22956 - 118858, n=107, last 2 years) | |
| Samsung Galaxy Book3 Ultra 16 | |
| MSI Katana 15 B12VEK | |
| Acer Swift X SFX14-71G | |
| Asus TUF A15 FA507 | |
| AIDA64 / Memory Write | |
| Gigabyte Aero 14 OLED BMF | |
| Samsung Galaxy Book3 Ultra 16 | |
| Average of class Gaming (22297 - 135096, n=107, last 2 years) | |
| Schenker XMG Focus 15 (E23) | |
| Schenker XMG Pro 15 (E23) | |
| Average Intel Core i9-13900HX (65472 - 77045, n=22) | |
| Acer Swift X SFX14-71G | |
| MSI Katana 15 B12VEK | |
| Asus TUF A15 FA507 | |
| AIDA64 / Memory Latency | |
| Average of class Gaming (75.3 - 259, n=107, last 2 years) | |
| Acer Swift X SFX14-71G | |
| Samsung Galaxy Book3 Ultra 16 | |
| MSI Katana 15 B12VEK | |
| Gigabyte Aero 14 OLED BMF | |
| Average Intel Core i9-13900HX (75.3 - 91.1, n=22) | |
| Schenker XMG Focus 15 (E23) | |
| Schenker XMG Pro 15 (E23) | |
| Asus TUF A15 FA507 | |
* ... smaller is better
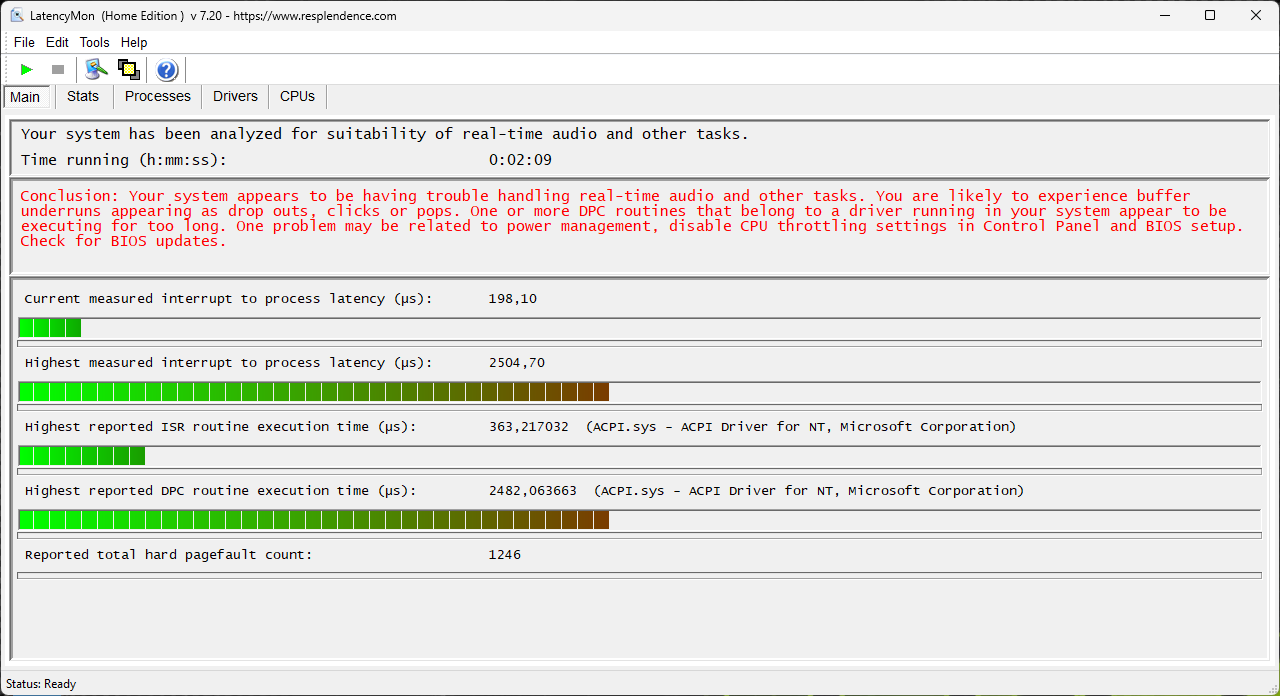
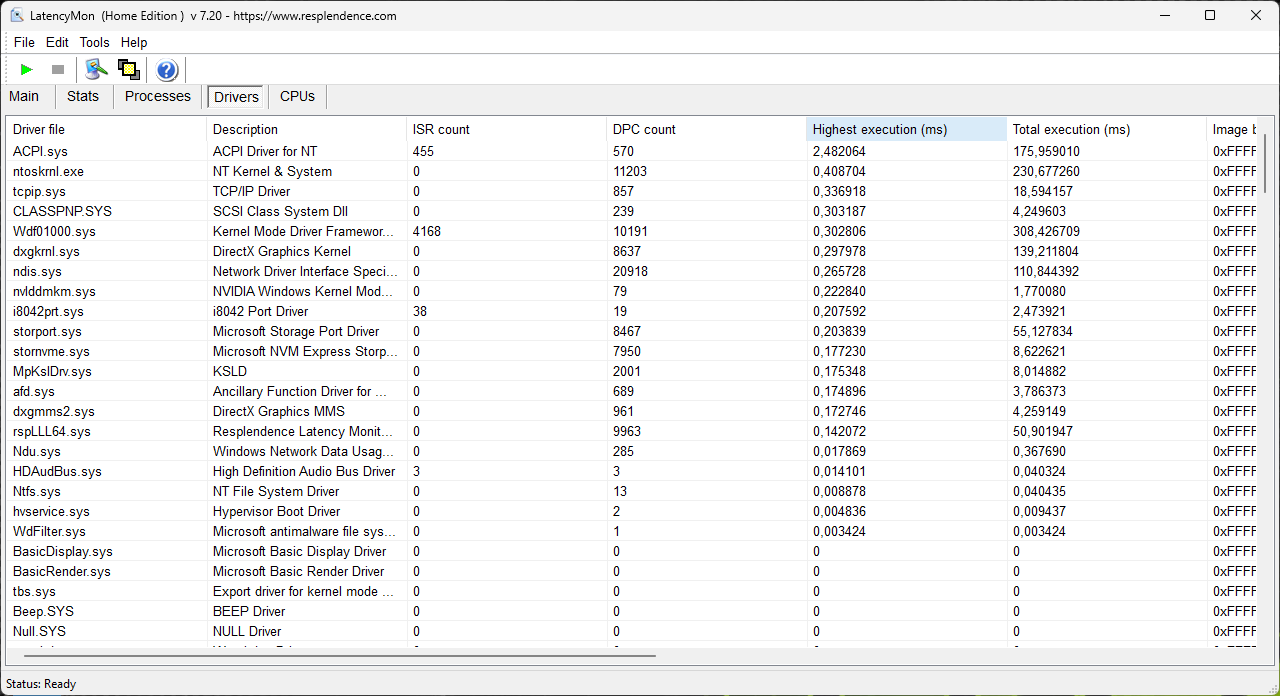
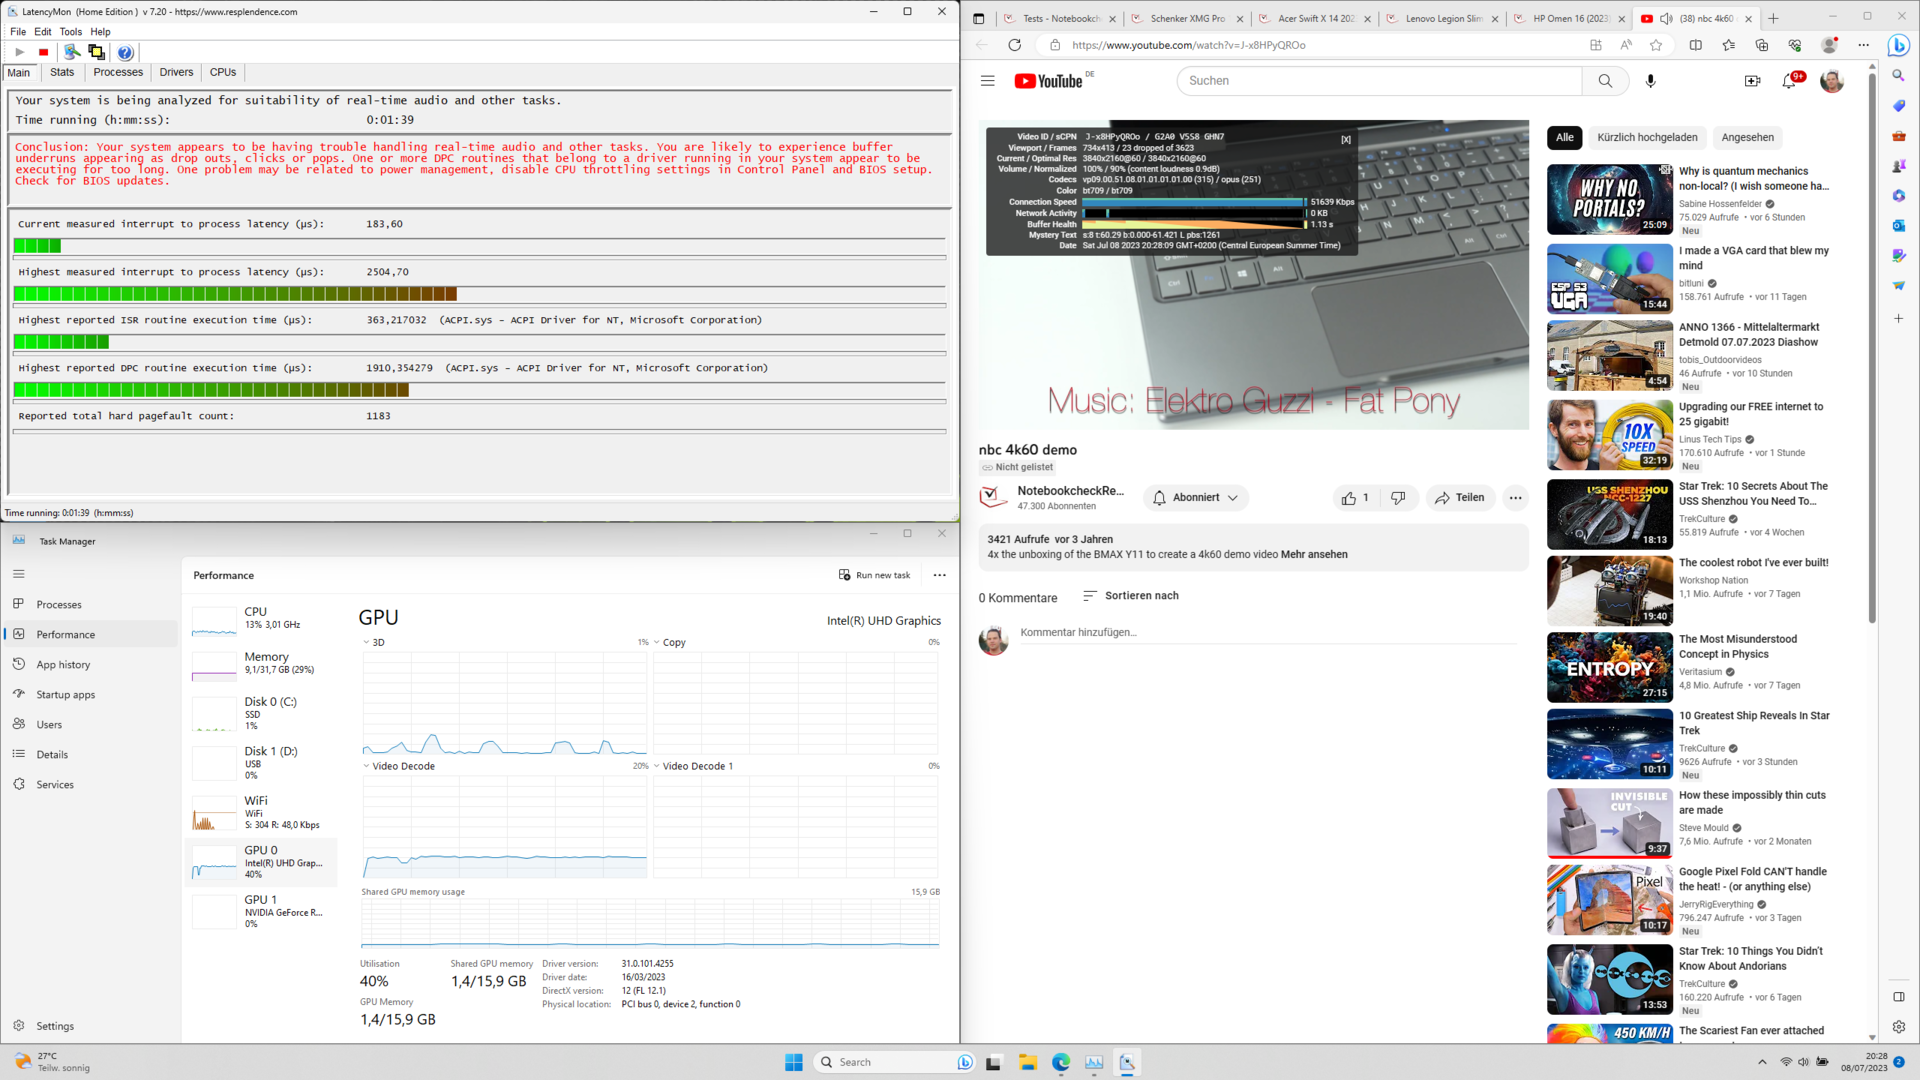
DPC Latency
Our latency test with various browser tabs, YouTube playback, and Prime95 shows that the gaming laptop unfortunately has quite high DPC latencies.
The ACPI driver, which establishes the connection between BIOS/UEFI and Windows, is conspicuous here. A UEFI update did not improve this.
| DPC Latencies / LatencyMon - interrupt to process latency (max), Web, Youtube, Prime95 | |
| MSI Katana 15 B12VEK | |
| Acer Swift X SFX14-71G | |
| Samsung Galaxy Book3 Ultra 16 | |
| Schenker XMG Focus 15 (E23) | |
| Gigabyte Aero 14 OLED BMF | |
| Schenker XMG Pro 15 (E23) | |
* ... smaller is better
Mass storage
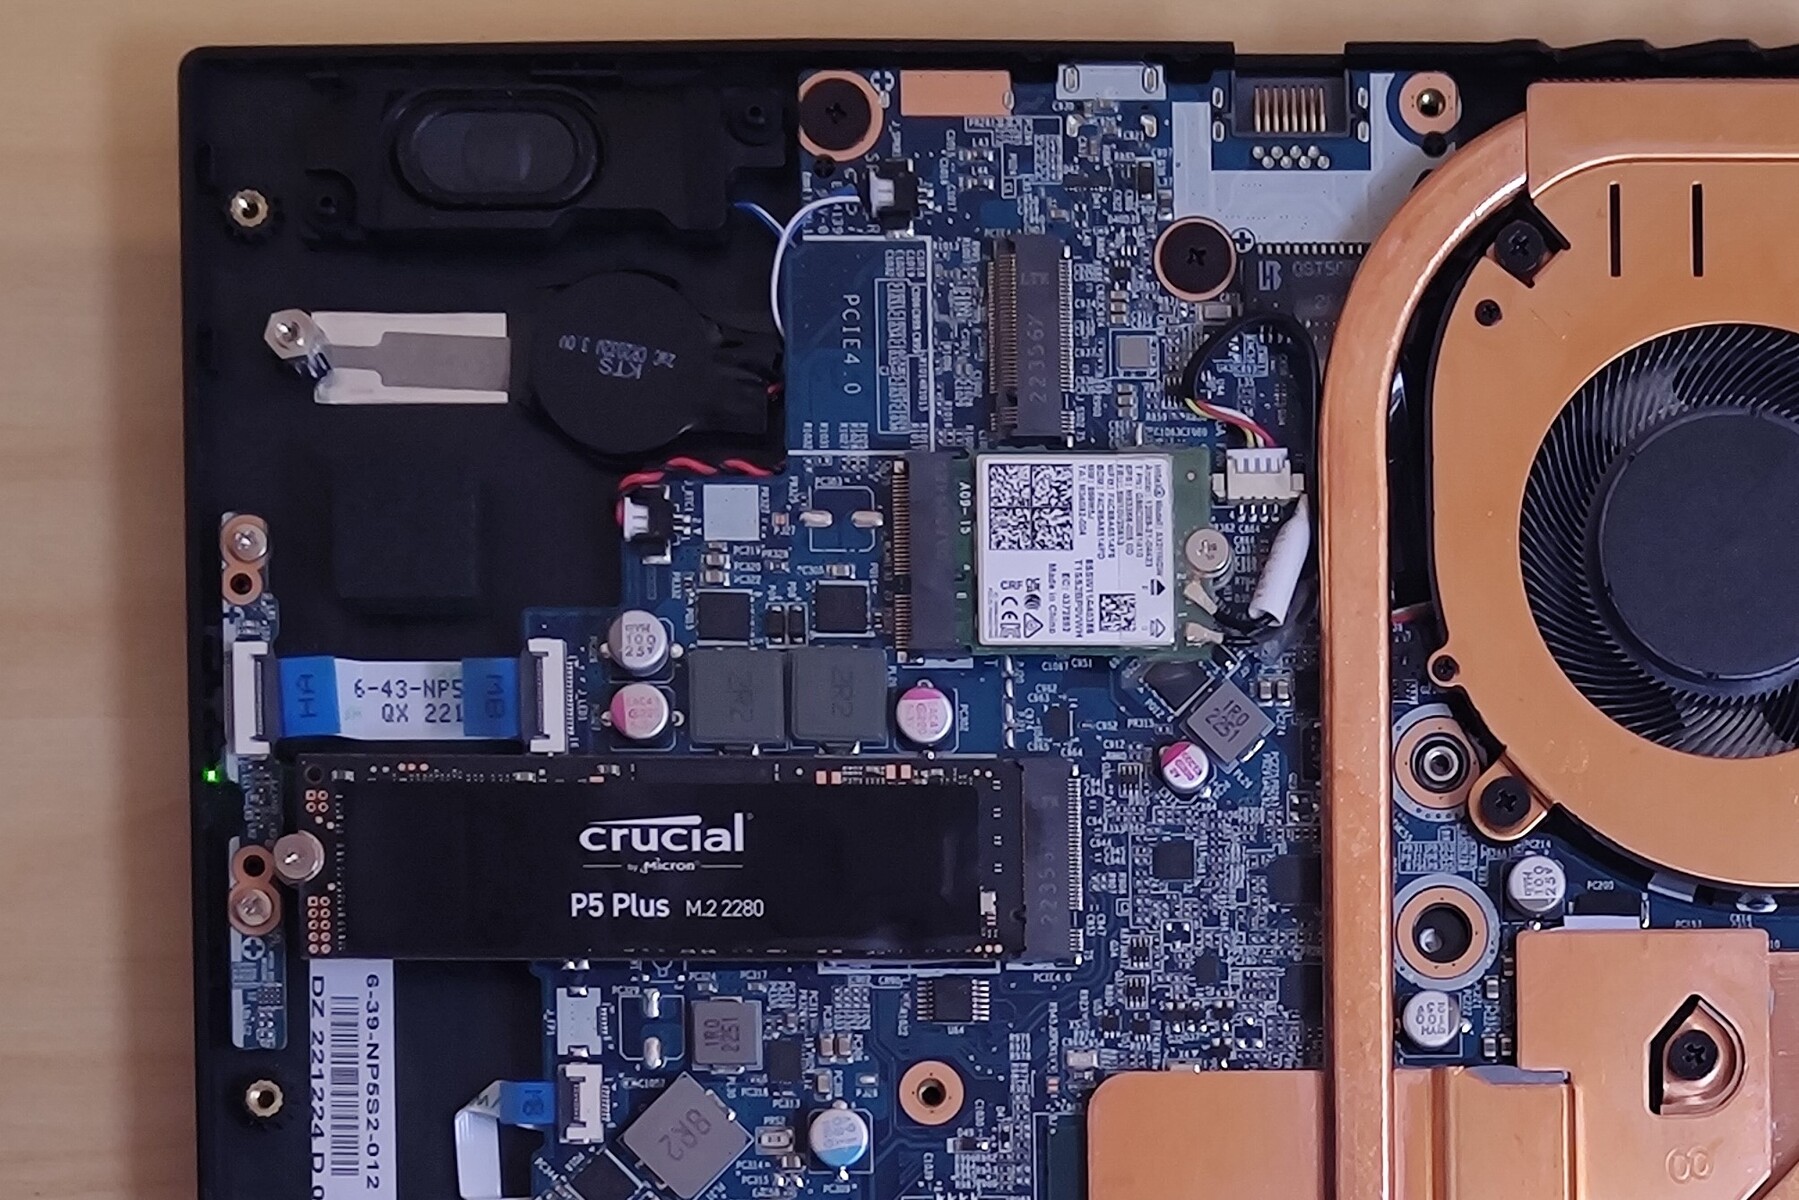
The Crucial P5 Plus in the test device offers good transfer speeds. However, it apparently overheats during longer loads.
In our long-term test of the write speed, the NVMe SSD clearly loses performance after some time.

* ... smaller is better
Disk throttling: DiskSpd Read Loop, Queue Depth 8
Graphics card
In our Focus 15 sample, the graphics chip's performance is about 15 to 20% lower that of the RTX 4060 in the Pro 15. A look at the Aorus 15X ASF also shows where the performance of the Focus 15 in combination with an RTX 4070 could lie. Since all three laptops have equivalent TGP values, the performances should be comparable here when the laptops are equipped with the same graphics chip.
The Nvidia RTX 4050 GPU is rated at up to a 140 W TGP. This value is at the top of the TGP configurations recommended by Nvidia. However, this does not give the graphics card any advantage over the other gaming laptops in every benchmark.
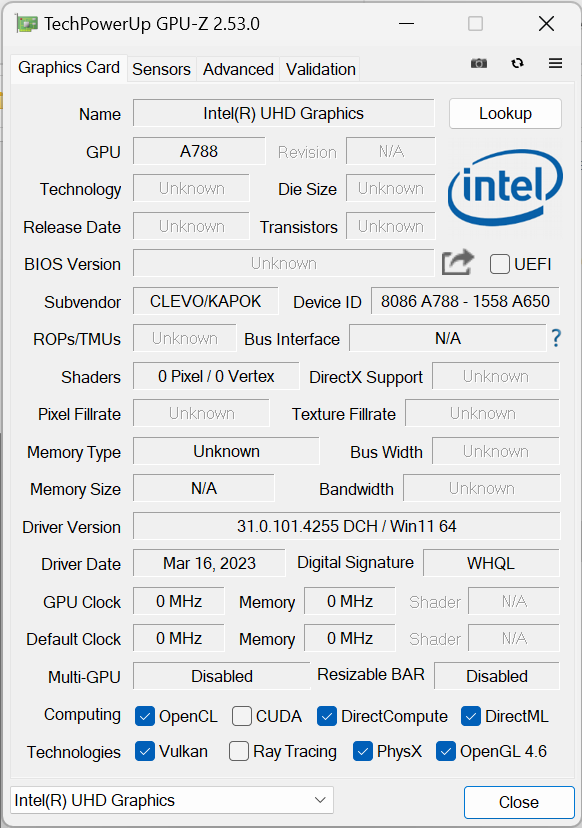
The graphics chip can be directly selected in the Focus 15 via Optimus and MUX switches — the Core i9's iGPU is also available. That being said, the Intel UHD Graphics 770 with 32 EUs in the 13900HX is one of the weaker graphics options Intel offers in current processors. Thus, it can only perform basic tasks.
| 3DMark 11 Performance | 27613 points | |
| 3DMark Ice Storm Standard Score | 134251 points | |
| 3DMark Cloud Gate Standard Score | 52615 points | |
| 3DMark Fire Strike Score | 20964 points | |
| 3DMark Time Spy Score | 9236 points | |
Help | ||
| Geekbench 6.7 - GPU OpenCL | |
| Average of class Gaming (67235 - 253130, n=106, last 2 years) | |
| Schenker XMG Focus 15 (E23) | |
| Average NVIDIA GeForce RTX 4050 Laptop GPU (60815 - 86892, n=21) | |
* ... smaller is better
Gaming performance
As indicated earlier, the graphics can be handled either by the Intel chip or the Nvidia GeForce RTX 4050. We actually wanted to use the dual-GPU mode with automatic switching for all benchmarks. However, the automatic selection did not work well in all cases. Therefore, our gaming benchmarks were run in dGPU-only mode.
Among the comparison devices with the RTX 4050, the Focus 15 shows the best gaming performance. With the exception of The Witcher 3, the RTX 4050 produces slightly higher fps than usual here. The results of Dota 2 Reborn and X-Plane 11 might seem conspicuous. The Focus 15 achieves more fps in both games than the Pro 15 with the stronger RTX 4060.
However, both games are now limited more by the CPU performance than the GPU performance. This becomes especially clear when you compare the performance of the Galaxy Book3 Ultra 16 with the Acer Swift Go. Both devices use the Intel Core i7-13700H with similar TDP values and can show similar fps in Dota 2 Reborn.
| The Witcher 3 - 1920x1080 Ultra Graphics & Postprocessing (HBAO+) | |
| Average of class Gaming (95 - 240, n=8, last 2 years) | |
| Schenker XMG Pro 15 (E23) | |
| MSI Katana 15 B12VEK | |
| Asus TUF A15 FA507 | |
| Gigabyte Aero 14 OLED BMF | |
| Gigabyte Aero 14 OLED BMF | |
| Schenker XMG Focus 15 (E23) | |
| Samsung Galaxy Book3 Ultra 16 | |
| Acer Swift X SFX14-71G | |
| Acer Swift Go SFG16-71 | |
| Final Fantasy XV Benchmark - 1920x1080 High Quality | |
| Average of class Gaming (41 - 215, n=101, last 2 years) | |
| Schenker XMG Focus 15 (E23) | |
| MSI Katana 15 B12VEK | |
| Asus TUF A15 FA507 | |
| Acer Swift X SFX14-71G | |
| Gigabyte Aero 14 OLED BMF | |
| Samsung Galaxy Book3 Ultra 16 | |
| Acer Swift Go SFG16-71 | |
| low | med. | high | ultra | QHD | 4K | |
|---|---|---|---|---|---|---|
| GTA V (2015) | 185.6 | 175.8 | 93.7 | |||
| The Witcher 3 (2015) | 64 | |||||
| Dota 2 Reborn (2015) | 193.2 | 181.6 | 175.8 | 160.7 | 106.6 | |
| Final Fantasy XV Benchmark (2018) | 114.1 | 85 | 58.5 | |||
| X-Plane 11.11 (2018) | 165.2 | 144.9 | 117 | 108.6 | ||
| Far Cry 5 (2018) | 141 | 131 | 123 | 86 | ||
| Strange Brigade (2018) | 417 | 218 | 175.4 | 151.2 | ||
| F1 22 (2022) | 244 | 234 | 174.7 | 55.7 | ||
| F1 23 (2023) | 259 | 235 | 164.5 | 45.3 | 36.9 |
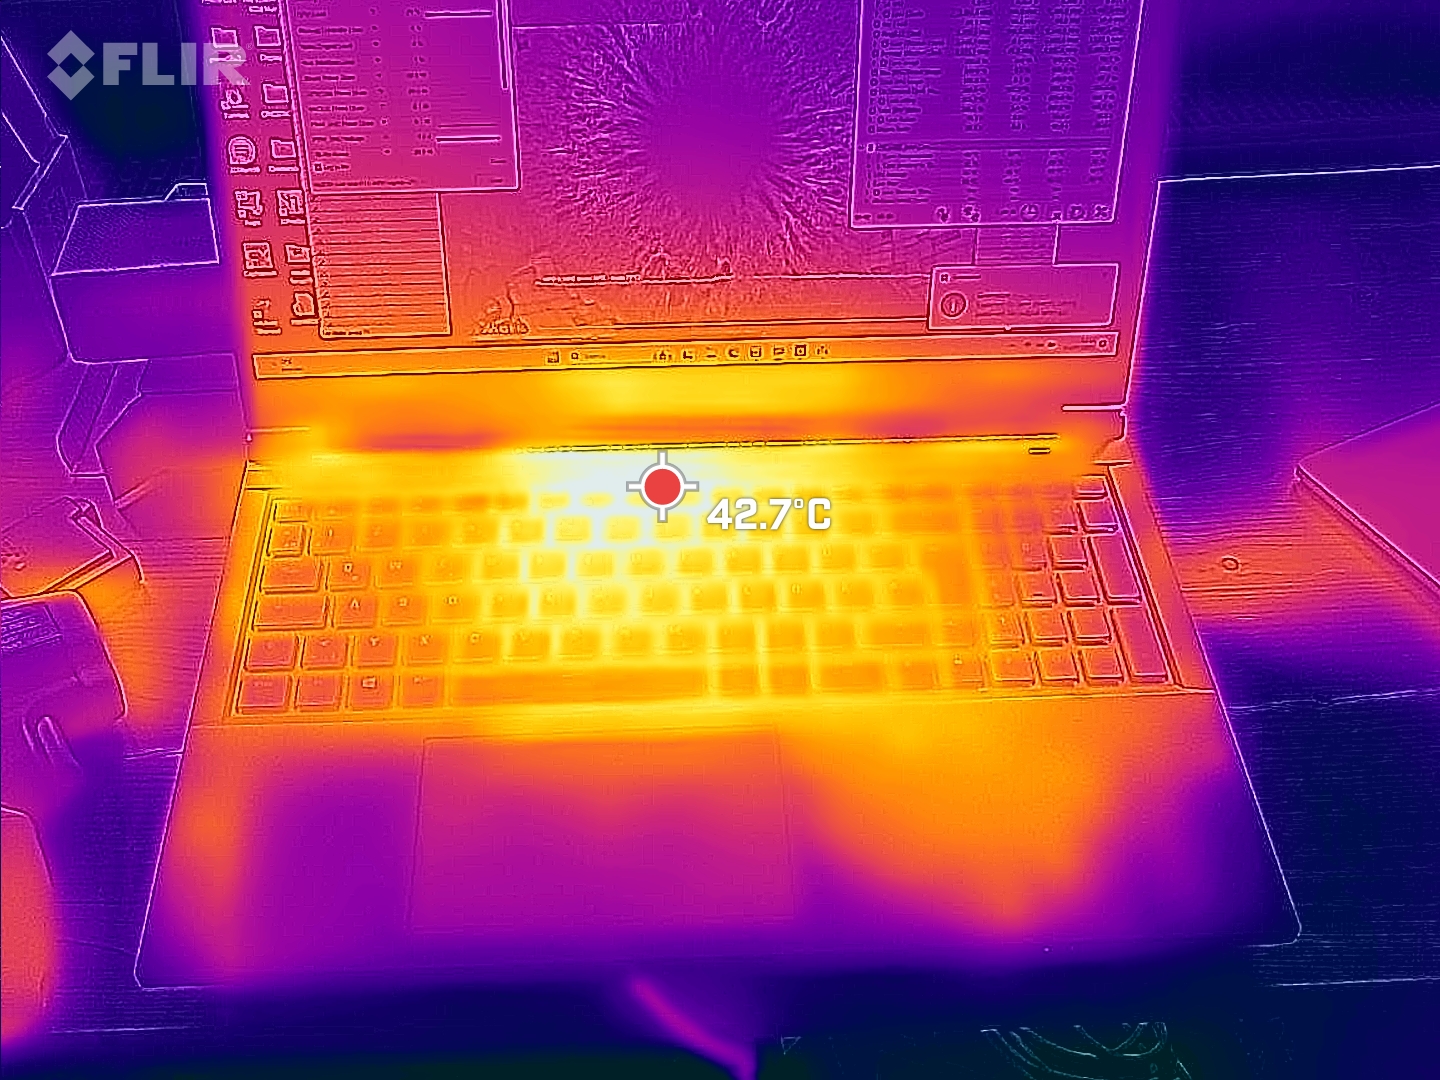
Emissions: Warm right palm rest
Noise emissions
The Focus 15 has fan noise levels typical of gaming laptops. With up to 55 dB(A) measured at a distance of 15 cm, the test device sometimes gets unpleasantly loud in the Performance mode.
Entertainment mode shows noise emissions around the 50 dB(A) mark. You can also run the notebook almost silently with the Sleep mode at the expense of losing significant computing power.
Noise level
| Idle |
| 24 / 25.14 / 35.14 dB(A) |
| Load |
| 55.93 / 56.34 dB(A) |
 | ||
30 dB silent 40 dB(A) audible 50 dB(A) loud |
||
min: | ||
| Schenker XMG Focus 15 (E23) GeForce RTX 4050 Laptop GPU, i9-13900HX, Crucial P5 Plus 1TB CT1000P5PSSD8 | Schenker XMG Pro 15 (E23) GeForce RTX 4060 Laptop GPU, i9-13900HX, Crucial P5 Plus 1TB CT1000P5PSSD8 | Asus TUF A15 FA507 GeForce RTX 4050 Laptop GPU, R7 7735HS, Micron 2400 MTFDKBA512QFM | MSI Katana 15 B12VEK GeForce RTX 4050 Laptop GPU, i7-12650H, Micron 2400 MTFDKBA1T0QFM | Acer Swift X SFX14-71G GeForce RTX 4050 Laptop GPU, i7-13700H, Samsung PM9A1 MZVL21T0HCLR | Samsung Galaxy Book3 Ultra 16 GeForce RTX 4050 Laptop GPU, i7-13700H, Samsung PM9A1 MZVL2512HCJQ | Gigabyte Aero 14 OLED BMF GeForce RTX 4050 Laptop GPU, i7-13700H, Gigabyte AG470S1TB-SI B10 | |
|---|---|---|---|---|---|---|---|
| Noise | 7% | 20% | 13% | 1% | 12% | 6% | |
| off / environment * (dB) | 24 | 24 -0% | 23.3 3% | 24 -0% | 24.8 -3% | 25 -4% | 24 -0% |
| Idle Minimum * (dB) | 24 | 24 -0% | 23.3 3% | 24 -0% | 28.2 -18% | 26 -8% | 24 -0% |
| Idle Average * (dB) | 25.14 | 24 5% | 23.3 7% | 24 5% | 31.8 -26% | 27 -7% | 24 5% |
| Idle Maximum * (dB) | 35.14 | 24 32% | 23.3 34% | 24 32% | 31.8 10% | 28 20% | 35.71 -2% |
| Load Average * (dB) | 55.93 | 53.65 4% | 29.6 47% | 37.71 33% | 38.2 32% | 40 28% | |
| Witcher 3 ultra * (dB) | 54.62 | 53.53 2% | 43 21% | 45.75 16% | 50 8% | 39 29% | 40.22 26% |
| Load Maximum * (dB) | 56.34 | 53.65 5% | 43 24% | 54.55 3% | 52.2 7% | 41 27% | 51.93 8% |
* ... smaller is better
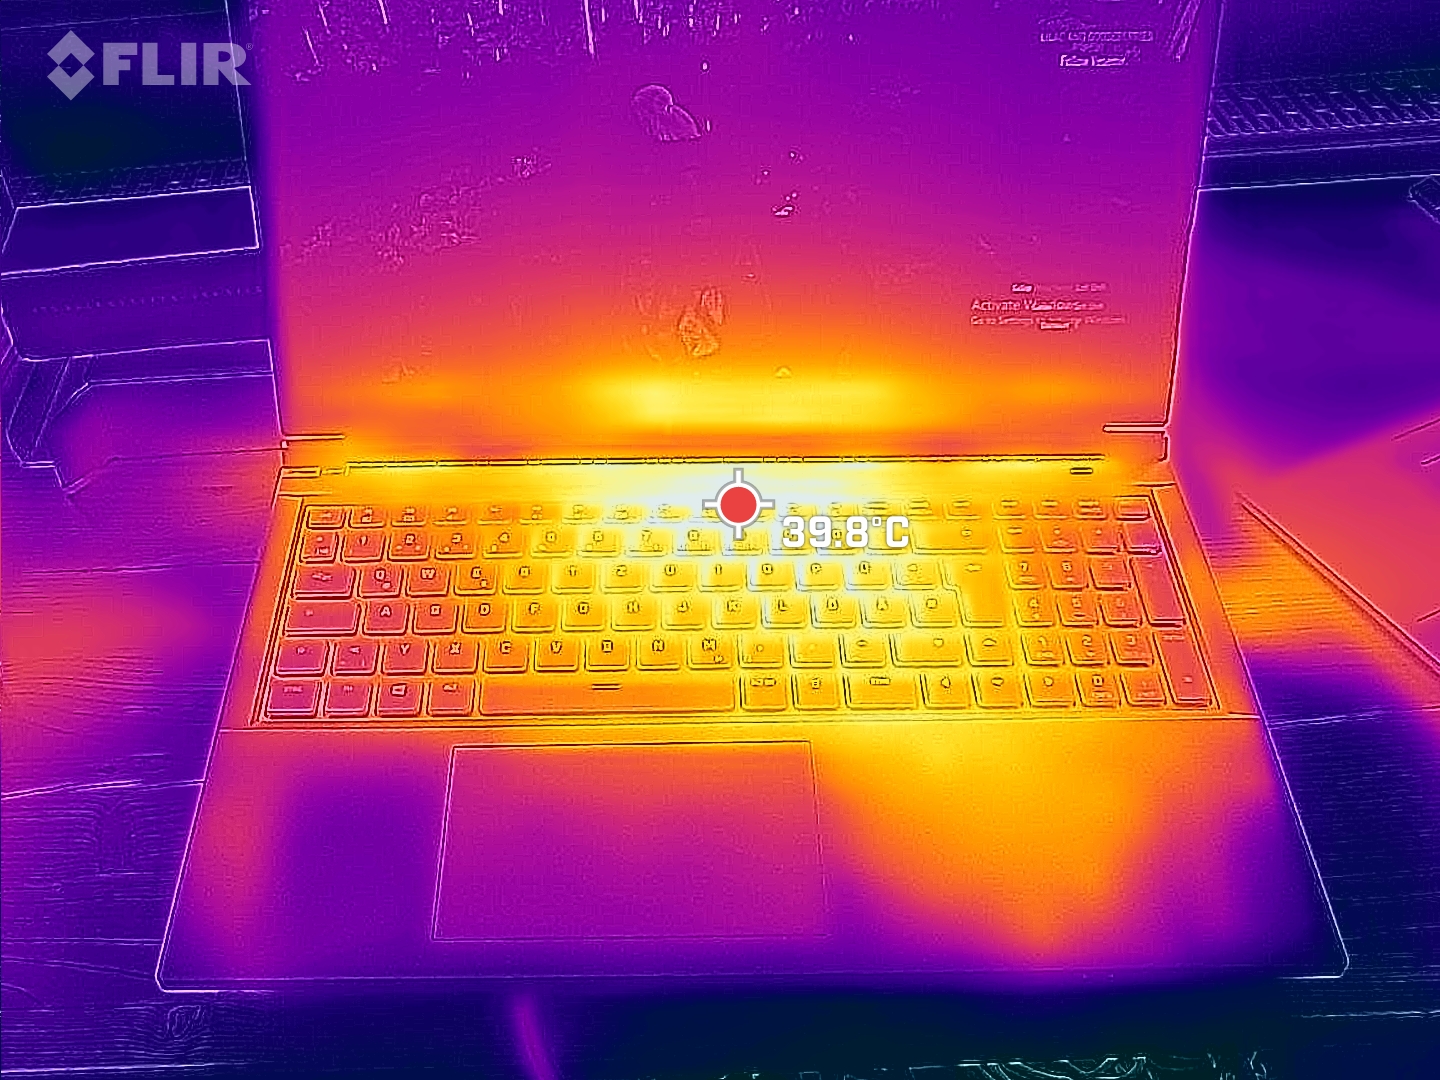
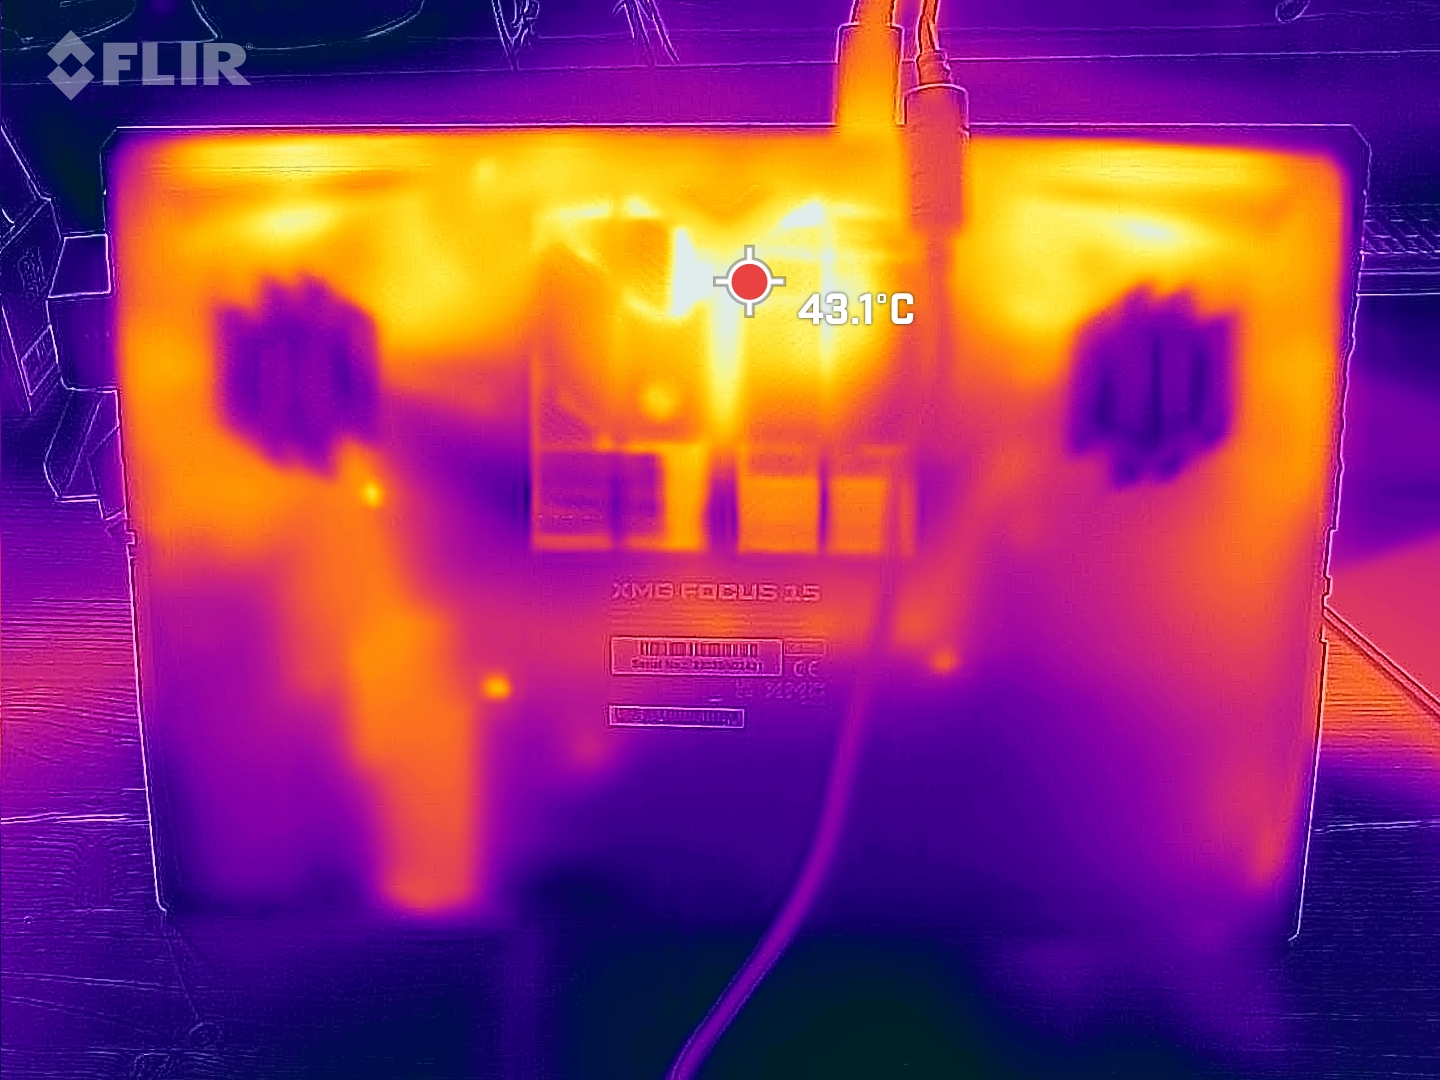
Temperature
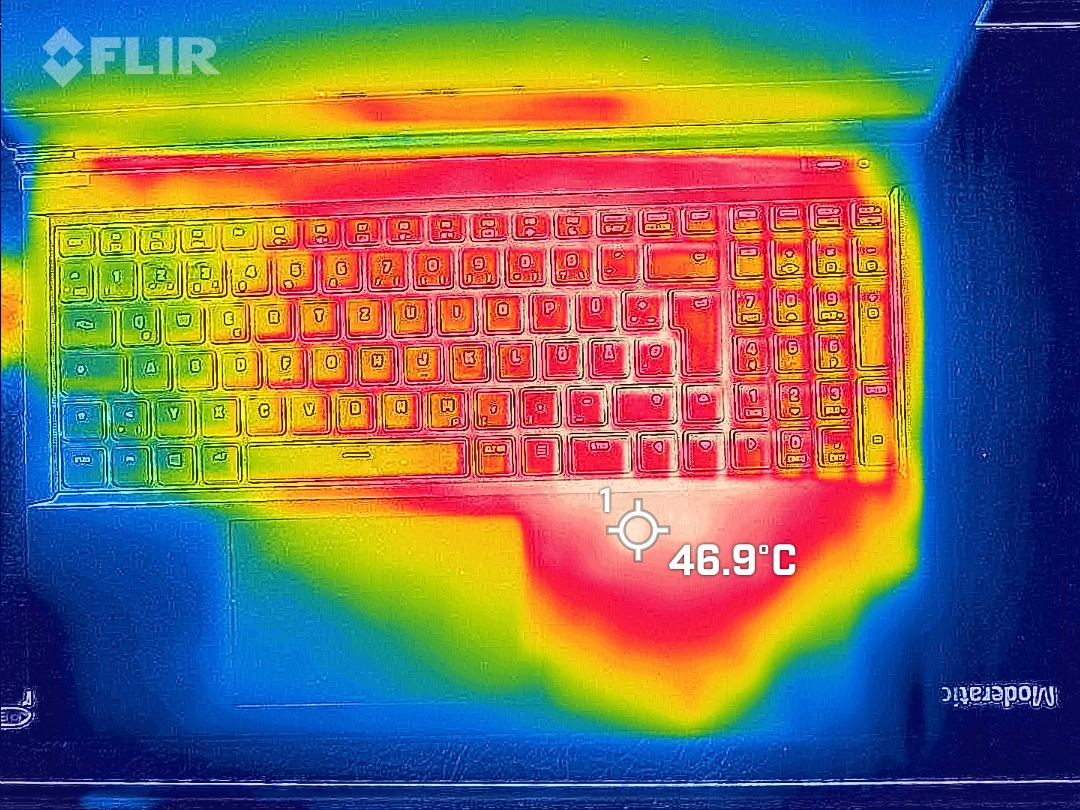
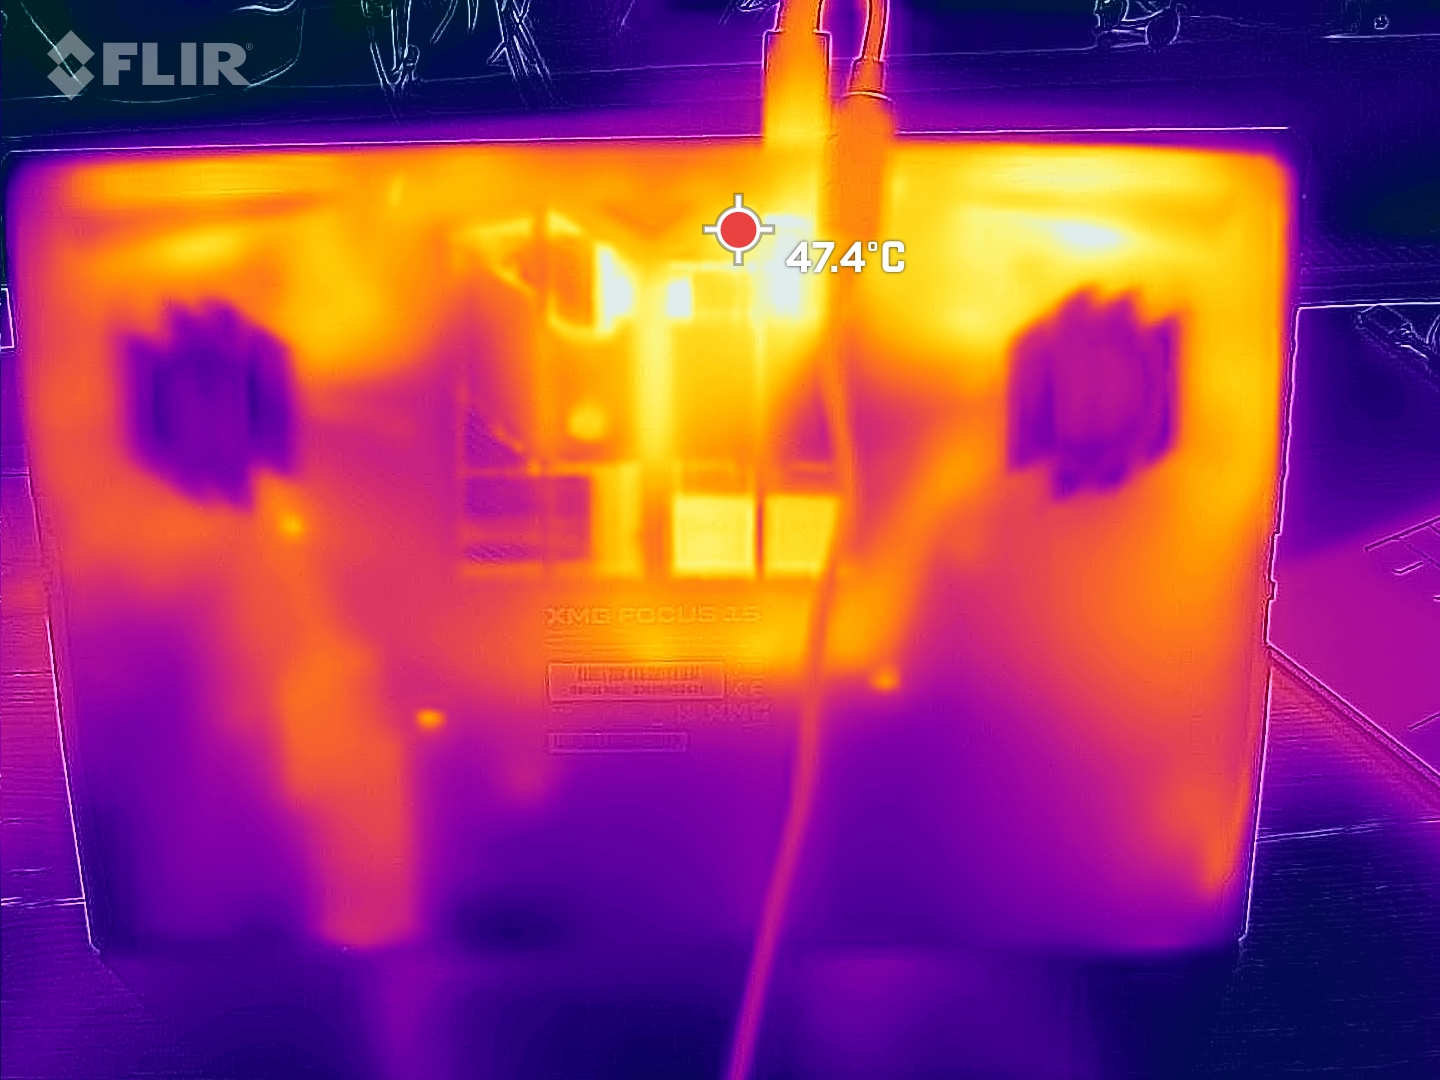
The surface temperatures of this gaming laptop are not cool at all. We measured hotspots of 51 °C, but these are fortunately far away from the usual touch points.
However, the laptop also gets very warm on the right palm rest during use. Since you usually use an external mouse for gaming, this is probably not a big deal for right-handers. The left palm rest and the W, A, S, D keys stay cool.
Even the longer load of the installed NVMe SSD seems to be enough to increase the temperature of the palm rest significantly. It reached almost 46 °C when we installed our test games.
(-) The maximum temperature on the upper side is 51 °C / 124 F, compared to the average of 40.4 °C / 105 F, ranging from 21.2 to 68.8 °C for the class Gaming.
(-) The bottom heats up to a maximum of 53 °C / 127 F, compared to the average of 43.2 °C / 110 F
(+) In idle usage, the average temperature for the upper side is 25.8 °C / 78 F, compared to the device average of 33.9 °C / 93 F.
(±) Playing The Witcher 3, the average temperature for the upper side is 36.2 °C / 97 F, compared to the device average of 33.9 °C / 93 F.
(±) The palmrests and touchpad can get very hot to the touch with a maximum of 36 °C / 96.8 F.
(-) The average temperature of the palmrest area of similar devices was 28.8 °C / 83.8 F (-7.2 °C / -13 F).
| Schenker XMG Focus 15 (E23) Intel Core i9-13900HX, NVIDIA GeForce RTX 4050 Laptop GPU | Schenker XMG Pro 15 (E23) Intel Core i9-13900HX, NVIDIA GeForce RTX 4060 Laptop GPU | Asus TUF A15 FA507 AMD Ryzen 7 7735HS, NVIDIA GeForce RTX 4050 Laptop GPU | MSI Katana 15 B12VEK Intel Core i7-12650H, NVIDIA GeForce RTX 4050 Laptop GPU | Acer Swift X SFX14-71G Intel Core i7-13700H, NVIDIA GeForce RTX 4050 Laptop GPU | Samsung Galaxy Book3 Ultra 16 Intel Core i7-13700H, NVIDIA GeForce RTX 4050 Laptop GPU | Gigabyte Aero 14 OLED BMF Intel Core i7-13700H, NVIDIA GeForce RTX 4050 Laptop GPU | |
|---|---|---|---|---|---|---|---|
| Heat | -3% | 9% | -8% | 9% | 18% | 10% | |
| Maximum Upper Side * (°C) | 51 | 50 2% | 48.9 4% | 47 8% | 46.4 9% | 41 20% | 42 18% |
| Maximum Bottom * (°C) | 53 | 50 6% | 44.6 16% | 48 9% | 49 8% | 44 17% | 52 2% |
| Idle Upper Side * (°C) | 29 | 33 -14% | 27.1 7% | 35 -21% | 26.5 9% | 23 21% | 26 10% |
| Idle Bottom * (°C) | 30 | 32 -7% | 27.5 8% | 38 -27% | 26.6 11% | 26 13% | 27 10% |
* ... smaller is better
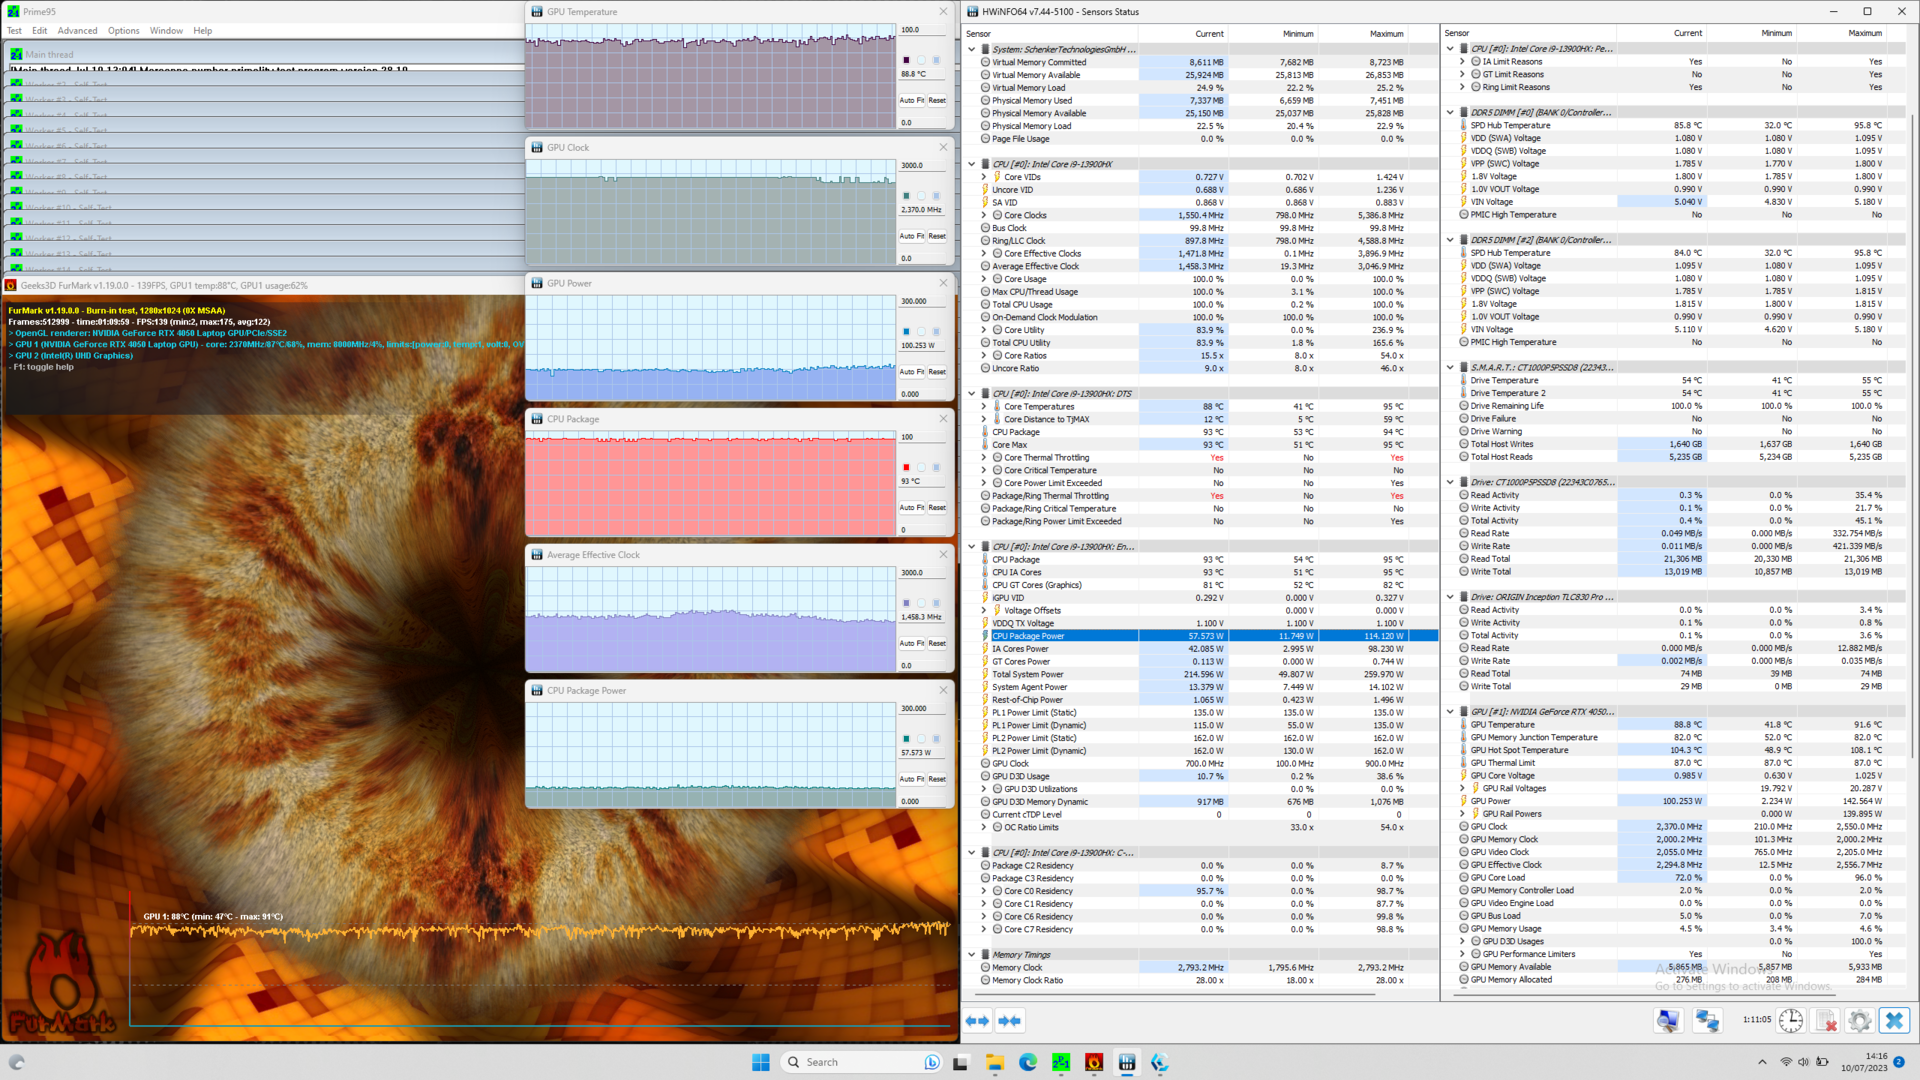
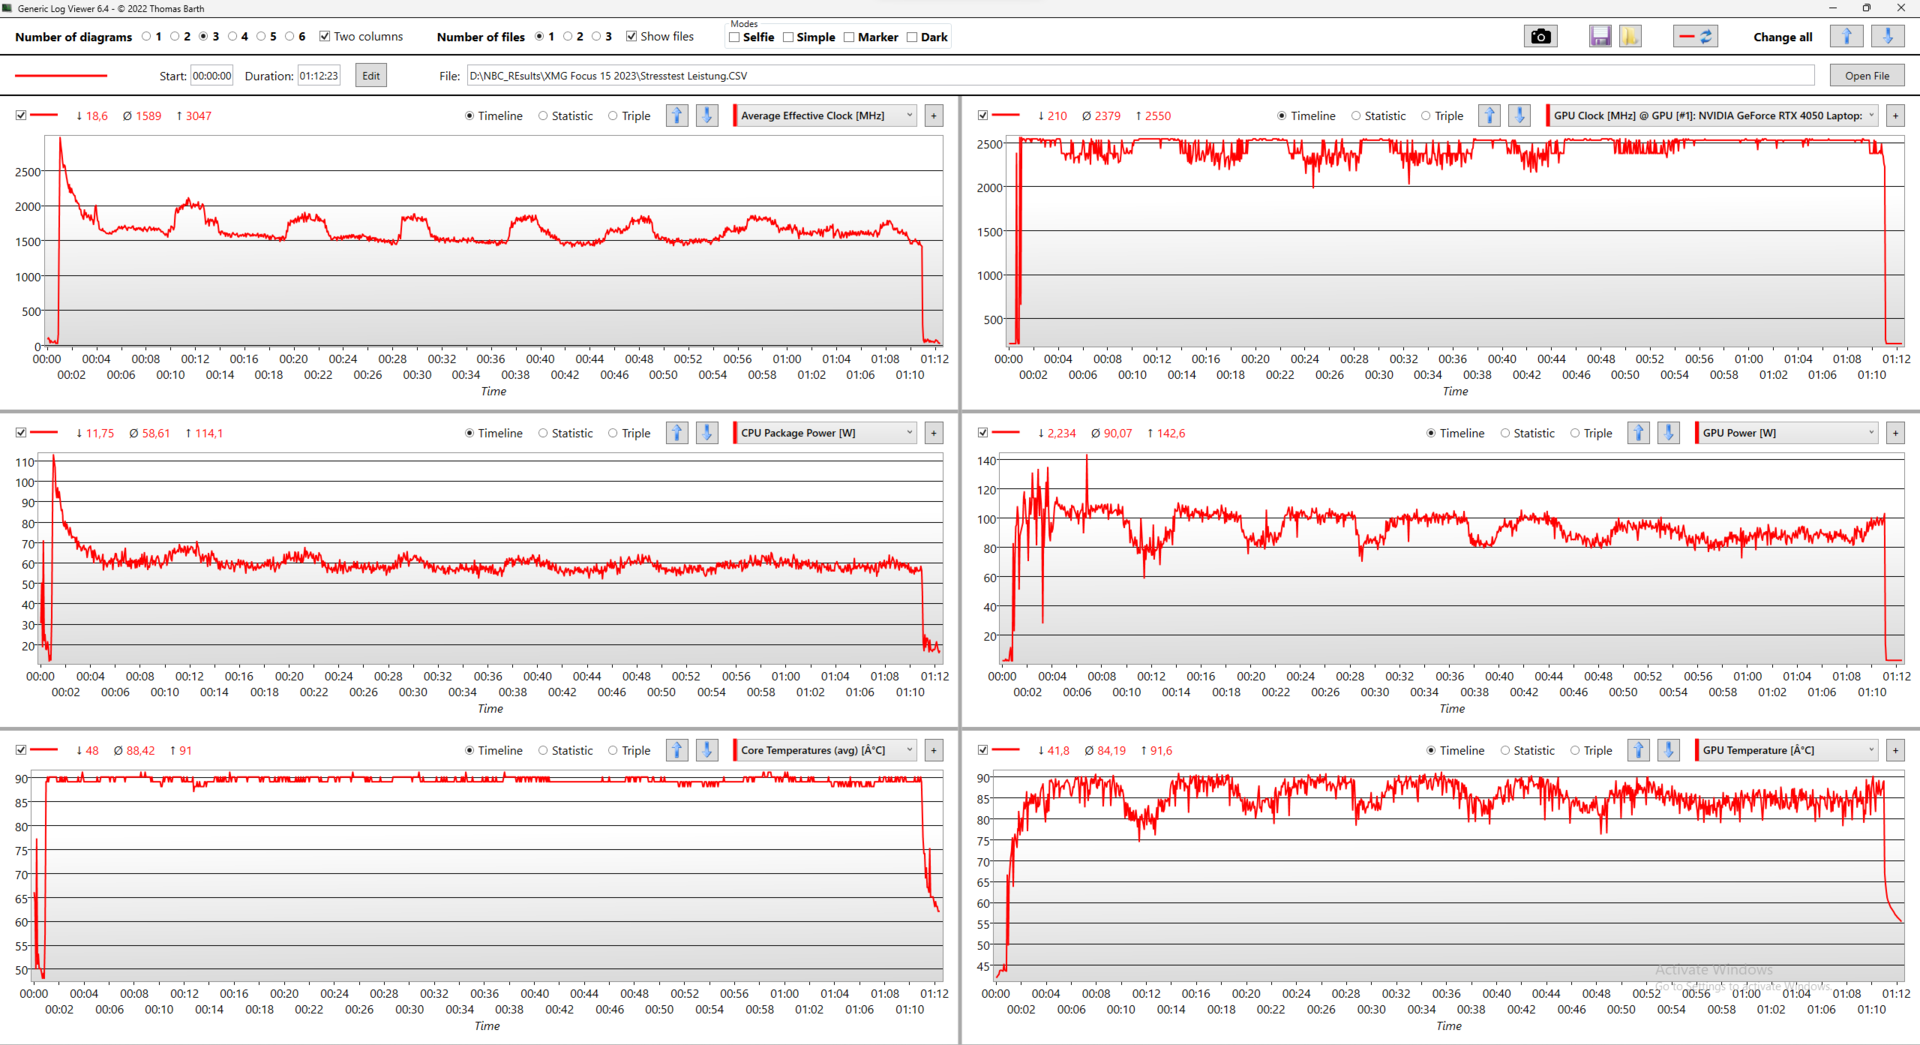
Stress test
The XMG Focus 15 survives the stress test with Prime95 and Furmark at high temperatures with constant performance. We could not determine a drop in the CPU or GPU clock after the boost phase.
In return, the Core i9's temperatures are relatively high at around 90 °C. However, looking at the logs from the stress test, we have to note that the values stated by Schenker are not maintained in the long run.
After about 10 minutes in the stress test, the CPU performance settles around 60 W and the GPU power consumption at 100 W. In the meantime, the 15 W Dynamic Boost is switched between the processor and the graphics chip every now and then.
Loudspeaker
The speakers in the Focus 15 present the mids and trebles relatively well but can hardly serve any bass. Thus, the Focus 15 sounds a bit better than the Pro 15.
If the onboard speakers seem inadequate, you can always use external devices connected via Bluetooth or the 3.5 mm jack.
Schenker XMG Focus 15 (E23) audio analysis
(±) | speaker loudness is average but good (77.39 dB)
Bass 100 - 315 Hz
(-) | nearly no bass - on average 29% lower than median
(±) | linearity of bass is average (9.5% delta to prev. frequency)
Mids 400 - 2000 Hz
(±) | higher mids - on average 5.2% higher than median
(±) | linearity of mids is average (7.2% delta to prev. frequency)
Highs 2 - 16 kHz
(±) | higher highs - on average 5.4% higher than median
(+) | highs are linear (3.4% delta to prev. frequency)
Overall 100 - 16.000 Hz
(±) | linearity of overall sound is average (24.9% difference to median)
Compared to same class
» 89% of all tested devices in this class were better, 3% similar, 7% worse
» The best had a delta of 6%, average was 18%, worst was 132%
Compared to all devices tested
» 76% of all tested devices were better, 5% similar, 19% worse
» The best had a delta of 4%, average was 24%, worst was 134%
Schenker XMG Pro 15 (E23) audio analysis
(±) | speaker loudness is average but good (72.52 dB)
Bass 100 - 315 Hz
(±) | reduced bass - on average 12.9% lower than median
(±) | linearity of bass is average (7.2% delta to prev. frequency)
Mids 400 - 2000 Hz
(±) | higher mids - on average 6.2% higher than median
(±) | linearity of mids is average (7.8% delta to prev. frequency)
Highs 2 - 16 kHz
(+) | balanced highs - only 2.5% away from median
(+) | highs are linear (4.6% delta to prev. frequency)
Overall 100 - 16.000 Hz
(±) | linearity of overall sound is average (18% difference to median)
Compared to same class
» 55% of all tested devices in this class were better, 9% similar, 36% worse
» The best had a delta of 6%, average was 18%, worst was 132%
Compared to all devices tested
» 38% of all tested devices were better, 8% similar, 54% worse
» The best had a delta of 4%, average was 24%, worst was 134%
Power management: Energy-hungry gaming laptop
Energy consumption
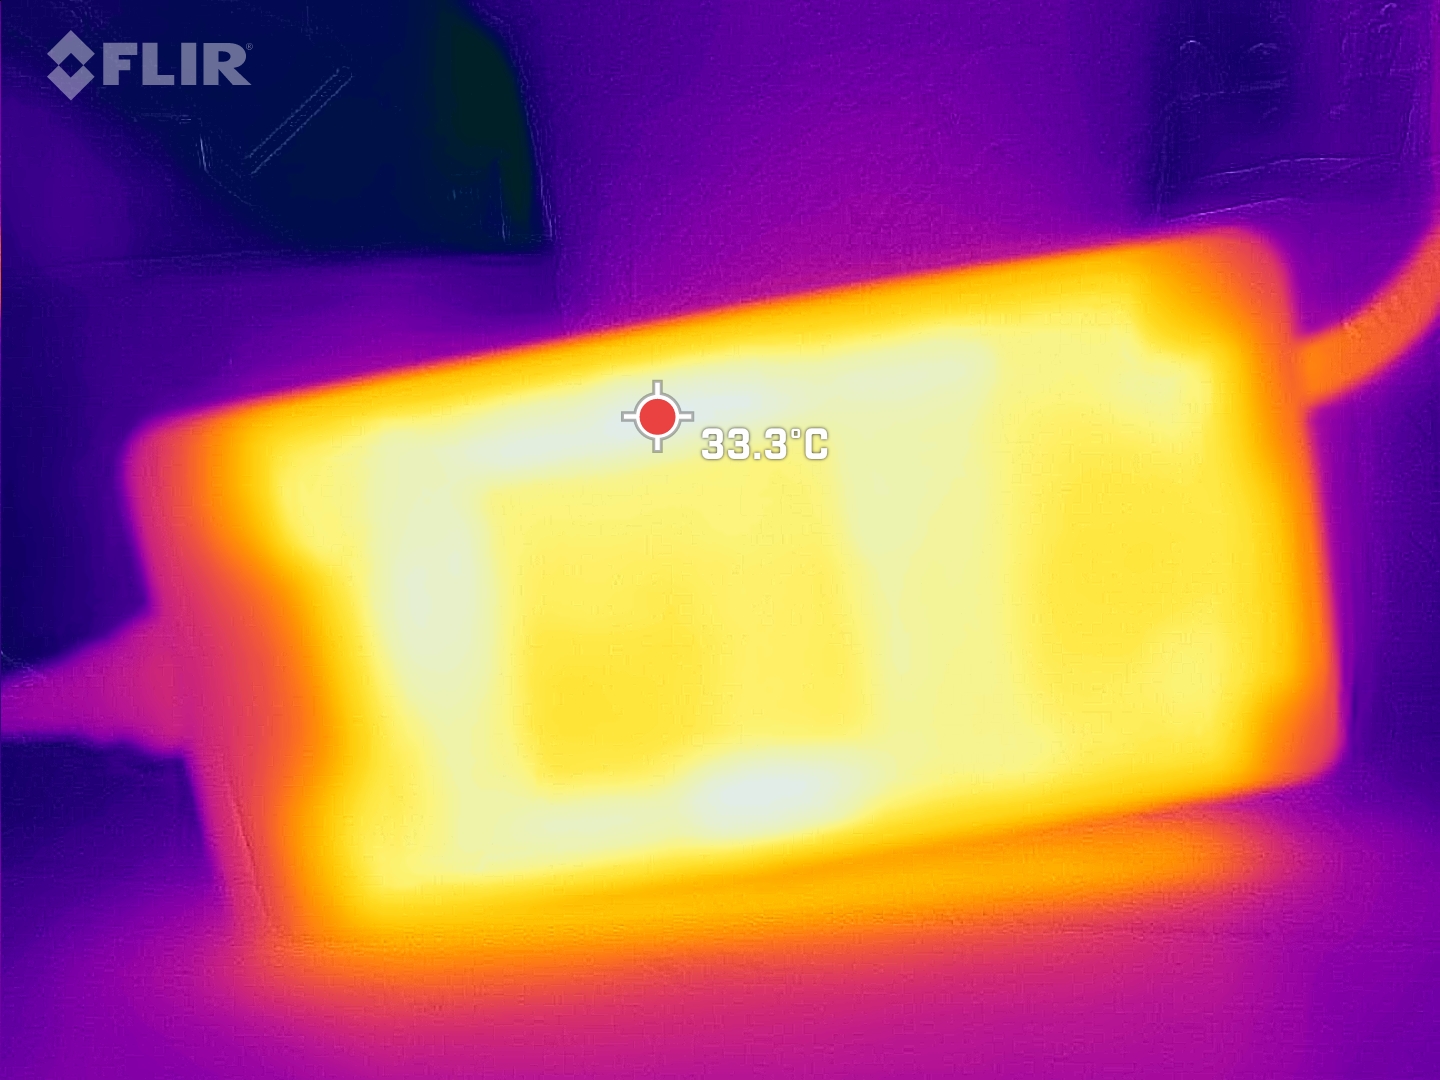
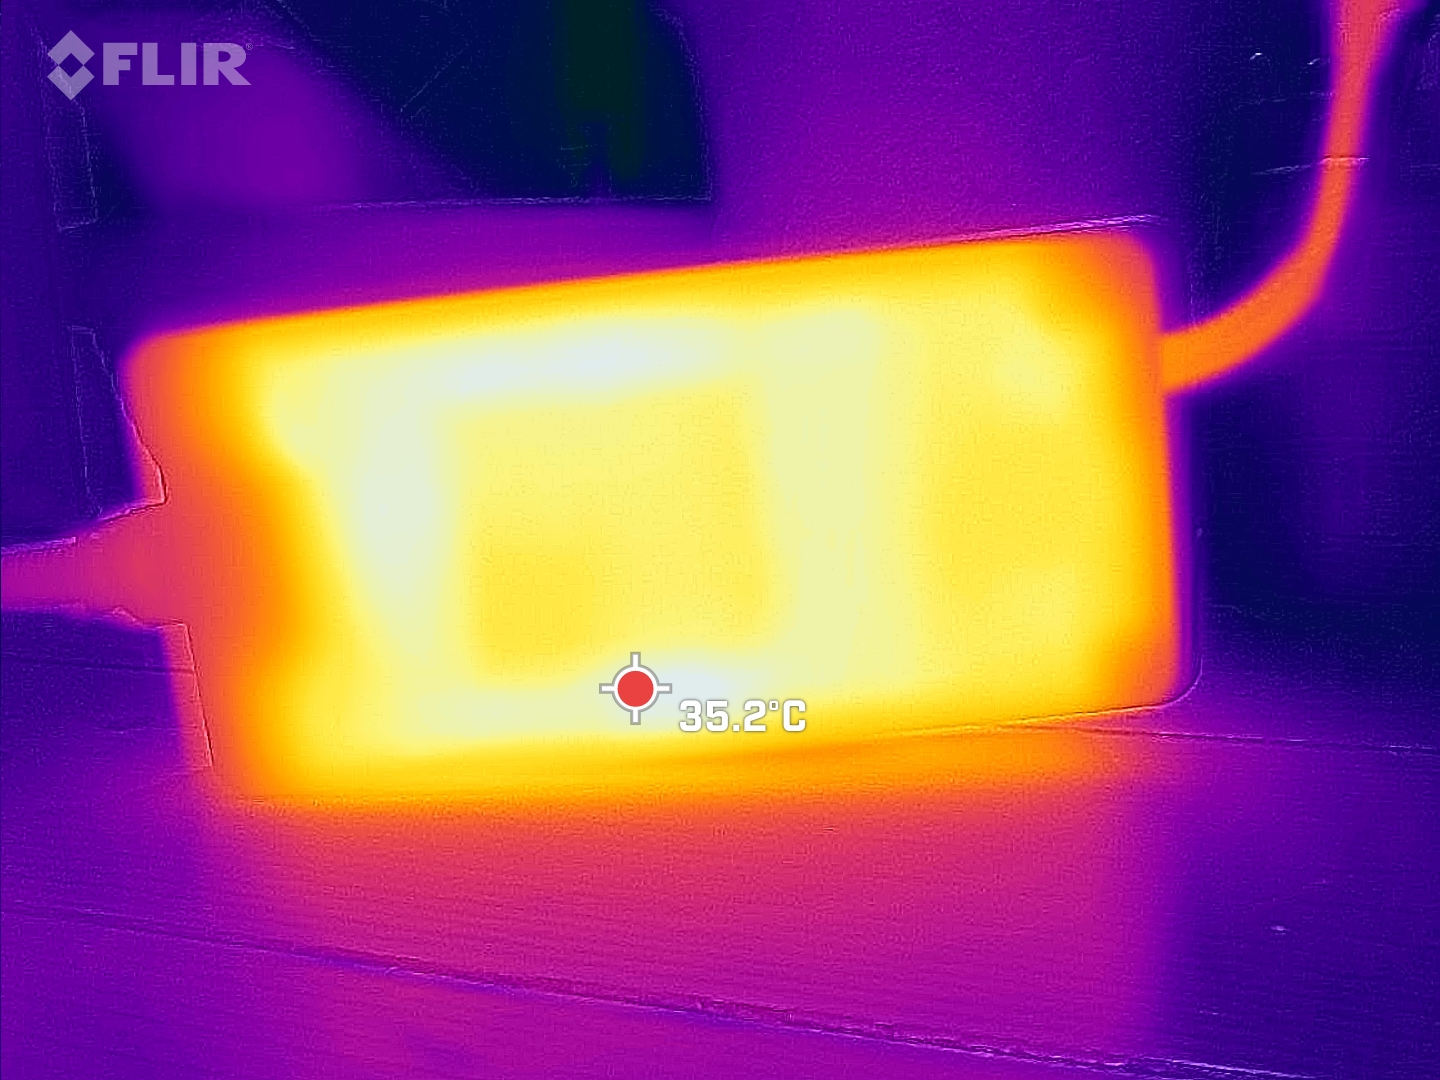
The Schenker XMG Focus 15 comes with a class-standard hunger for energy. Included is a large power supply that can deliver up to 280 W.
Interestingly, the peak load consumption is higher in the Focus 15 than in the Pro 15, so the power supply's output is also fully utilized.
When running on an external monitor, the laptop is even stable above 280 W in the stress test. With the internal monitor, the energy consumption dropped a bit within a short time.
| Off / Standby | |
| Idle | |
| Load |
|
Key:
min: | |
| Schenker XMG Focus 15 (E23) i9-13900HX, GeForce RTX 4050 Laptop GPU, Crucial P5 Plus 1TB CT1000P5PSSD8, IPS, 2569x1440, 15.6" | Schenker XMG Pro 15 (E23) i9-13900HX, GeForce RTX 4060 Laptop GPU, Crucial P5 Plus 1TB CT1000P5PSSD8, IPS, 2560x1440, 15.6" | Asus TUF A15 FA507 R7 7735HS, GeForce RTX 4050 Laptop GPU, Micron 2400 MTFDKBA512QFM, IPS, 1920x1080, 15.6" | MSI Katana 15 B12VEK i7-12650H, GeForce RTX 4050 Laptop GPU, Micron 2400 MTFDKBA1T0QFM, IPS, 1920x1080, 15.6" | Acer Swift X SFX14-71G i7-13700H, GeForce RTX 4050 Laptop GPU, Samsung PM9A1 MZVL21T0HCLR, OLED, 2880x1800, 14.5" | Samsung Galaxy Book3 Ultra 16 i7-13700H, GeForce RTX 4050 Laptop GPU, Samsung PM9A1 MZVL2512HCJQ, AMOLED, 2880x1800, 16" | Gigabyte Aero 14 OLED BMF i7-13700H, GeForce RTX 4050 Laptop GPU, Gigabyte AG470S1TB-SI B10, OLED, 2880x1800, 14" | Average NVIDIA GeForce RTX 4050 Laptop GPU | Average of class Gaming | |
|---|---|---|---|---|---|---|---|---|---|
| Power Consumption | -39% | 40% | 41% | 47% | 64% | 54% | 23% | 2% | |
| Idle Minimum * (Watt) | 11.4 | 21.6 -89% | 8 30% | 8.5 25% | 8.4 26% | 3 74% | 7.4 35% | 9.95 ? 13% | 13.2 ? -16% |
| Idle Average * (Watt) | 16.7 | 29 -74% | 12.1 28% | 10.2 39% | 11.5 31% | 5 70% | 8.3 50% | 15.8 ? 5% | 18.9 ? -13% |
| Idle Maximum * (Watt) | 25.8 | 42.7 -66% | 12.5 52% | 11.3 56% | 11.9 54% | 11 57% | 8.7 66% | 20.1 ? 22% | 24.3 ? 6% |
| Load Average * (Watt) | 139 | 190 -37% | 74.9 46% | 84 40% | 84.9 39% | 72 48% | 76 45% | 88 ? 37% | 108.3 ? 22% |
| Witcher 3 ultra * (Watt) | 265 | 189 29% | 136.6 48% | 128 52% | 83.6 68% | 69.7 74% | 70 74% | ||
| Load Maximum * (Watt) | 280 | 269 4% | 185 34% | 189 32% | 104.2 63% | 108 61% | 132 53% | 176.3 ? 37% | 254 ? 9% |
* ... smaller is better
Power consumption: The Witcher 3 / Stress test
Power consumption: External Monitor
Battery life

We determined almost six hours of run time in the practical Wi-Fi web surfing test. Thus, the test device is only two minutes below the average gaming laptop.
Meanwhile, gamers can manage significantly longer runtimes in battery mode. However, the 73 Wh capacity of the battery is drained pretty quickly.
| Schenker XMG Focus 15 (E23) i9-13900HX, GeForce RTX 4050 Laptop GPU, 73 Wh | Schenker XMG Pro 15 (E23) i9-13900HX, GeForce RTX 4060 Laptop GPU, 80 Wh | Asus TUF A15 FA507 R7 7735HS, GeForce RTX 4050 Laptop GPU, 90 Wh | MSI Katana 15 B12VEK i7-12650H, GeForce RTX 4050 Laptop GPU, 53.5 Wh | Acer Swift X SFX14-71G i7-13700H, GeForce RTX 4050 Laptop GPU, 76 Wh | Samsung Galaxy Book3 Ultra 16 i7-13700H, GeForce RTX 4050 Laptop GPU, 76 Wh | Gigabyte Aero 14 OLED BMF i7-13700H, GeForce RTX 4050 Laptop GPU, 63 Wh | Average of class Gaming | |
|---|---|---|---|---|---|---|---|---|
| Battery runtime | 22% | 38% | -6% | -8% | 51% | 22% | 16% | |
| WiFi v1.3 (h) | 5.9 | 5.7 -3% | 11.7 98% | 4.3 -27% | 7.7 31% | 9.6 63% | 7.6 29% | 7.04 ? 19% |
| Load (h) | 1.3 | 1.9 46% | 1 -23% | 1.5 15% | 0.7 -46% | 1.8 38% | 1.5 15% | 1.47 ? 13% |
| H.264 (h) | 12.5 | 4.4 | 9.5 | 13.4 | 8.26 ? | |||
| Reader / Idle (h) | 18.2 | 11.3 | 8.71 ? |
Pros
Cons
Verdict: XMG captures the essence of gaming
If you want a 15.6-inch laptop with a current Nvidia GPU from Schenker or XMG, you have the choice of the XMG Apex 15 Max and Focus as well as the Schenker Key and Media. The XMG Pro 15 and the XMG Focus 15 are very close to each other in the test.
The Focus 15 focuses on the basics. The gaming laptop mainly convinces with high-performance computing hardware. The Intel Core i9-13900HX and Nvidia GeForce RTX 4050 work on a very high-performance level. While this results in high scores in the benchmarks, it also contributes to high surface temperatures, louder fans, and shorter battery runtimes compared to many of its contemporaries, like the Asus TUF A15.
Whether the chassis has to come with a lot of metal like the Pro 15 or whether it can be made of plastic is a matter of taste. From the outside, the Pro 15 and Focus 15 look very similar. However, the review sample offers less connectivity and lacks a USB Type-C port with Power Delivery.
The XMG Focus 15 meets the basic requirements of a gaming laptop. Thanks to the many configuration options, it can be adapted to the user's needs.
As with the Pro 15, only a few negative points can be found in the Focus 15. This is because all the drawbacks that the laptop shows are typical for its price and performance class.
Compared with other cheaper gaming laptops like the Asus TUF A15 or the MSI Katana 15, the extremely powerful Core i9-13900HX and the good QHD screen of the XMG Focus stand out positively.
Price and availability
The XMG Focus 15 can be freely configured at Bestware. Two display options, three GPU choices, and several memory combinations are available. In the absolute basic configuration, with only 8 GB of working memory and without SSD or Windows, the entry-level price is around €1,440 Euros (~US$1,618).
For a configuration with a Full HD display, 16 GB of working memory, and a 1 TB Samsung SSD, Bestware charges around €1,560. Our test configuration costs about €300 more. If you plan on going all out and select the most expensive components, expect to spend more than €3,500 for this laptop.
Schenker XMG Focus 15 (E23)
- 07/10/2023 v7 (old)
Marc Herter
Transparency
The selection of devices to be reviewed is made by our editorial team. The test sample was provided to the author as a loan by the manufacturer or retailer for the purpose of this review. The lender had no influence on this review, nor did the manufacturer receive a copy of this review before publication. There was no obligation to publish this review. As an independent media company, Notebookcheck is not subjected to the authority of manufacturers, retailers or publishers.
This is how Notebookcheck is testing
Every year, Notebookcheck independently reviews hundreds of laptops and smartphones using standardized procedures to ensure that all results are comparable. We have continuously developed our test methods for around 20 years and set industry standards in the process. In our test labs, high-quality measuring equipment is utilized by experienced technicians and editors. These tests involve a multi-stage validation process. Our complex rating system is based on hundreds of well-founded measurements and benchmarks, which maintains objectivity. Further information on our test methods can be found here.
Price comparison

