XMG Apex 15 Max (Clevo NH57VR) review: Gaming laptop with a desktop CPU

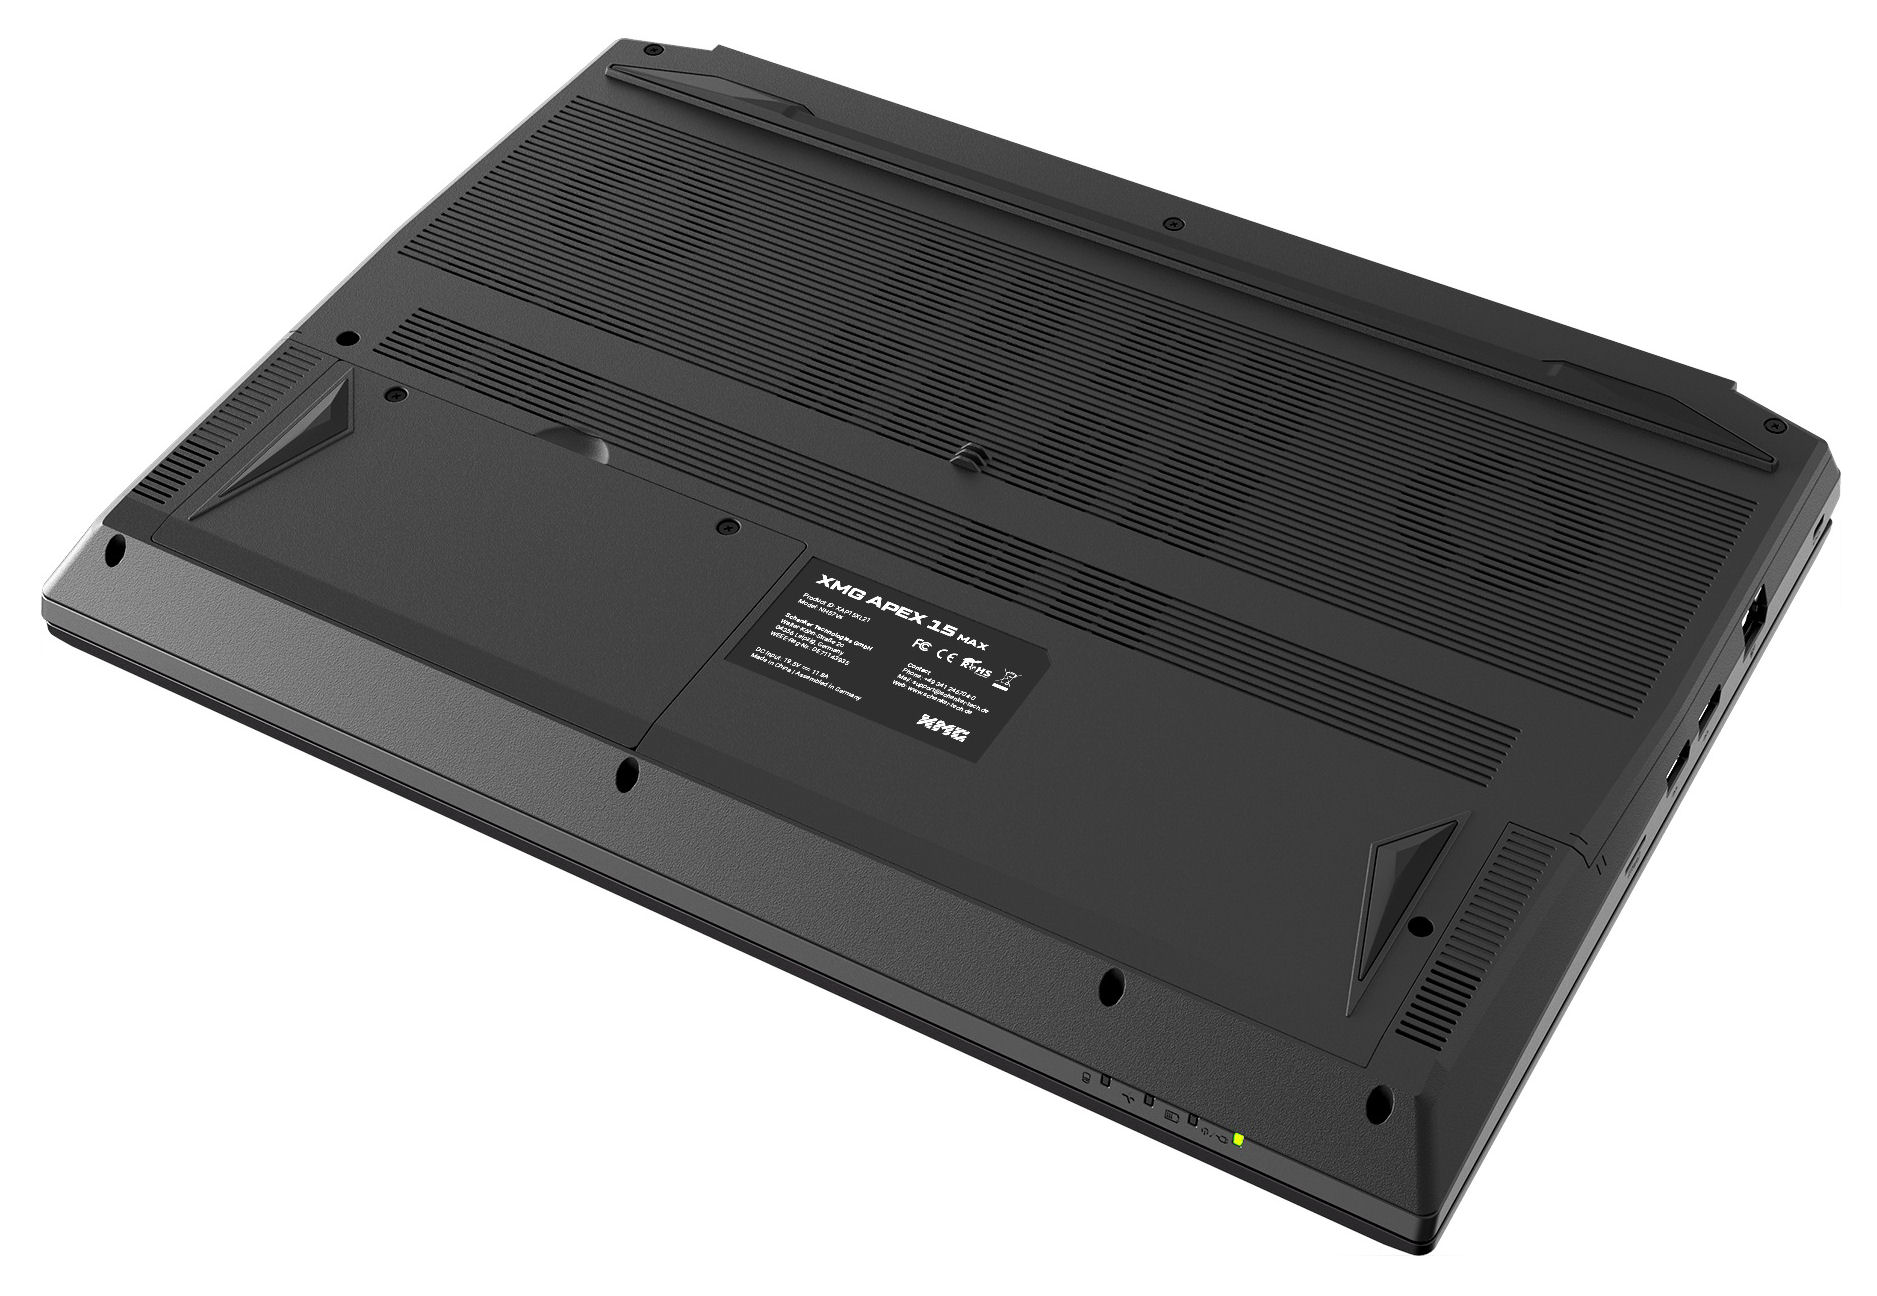
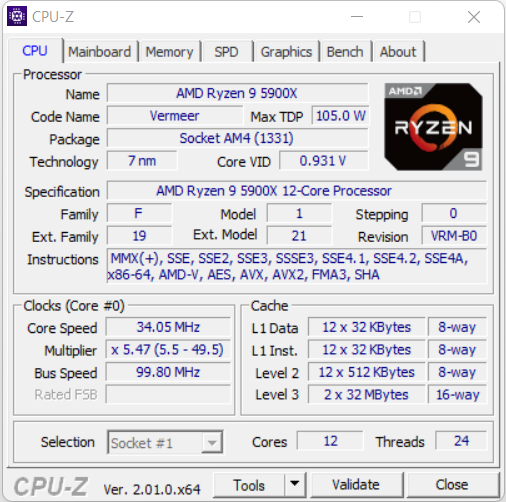
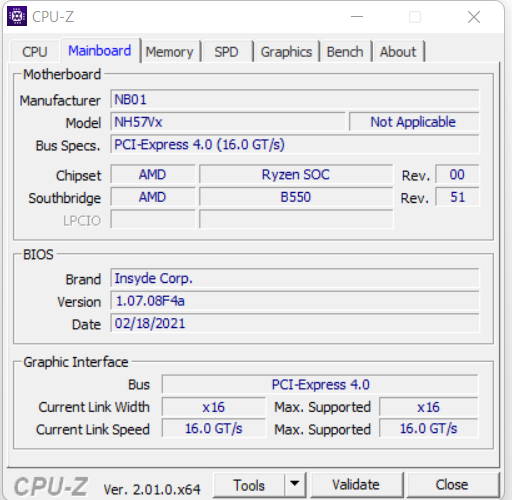
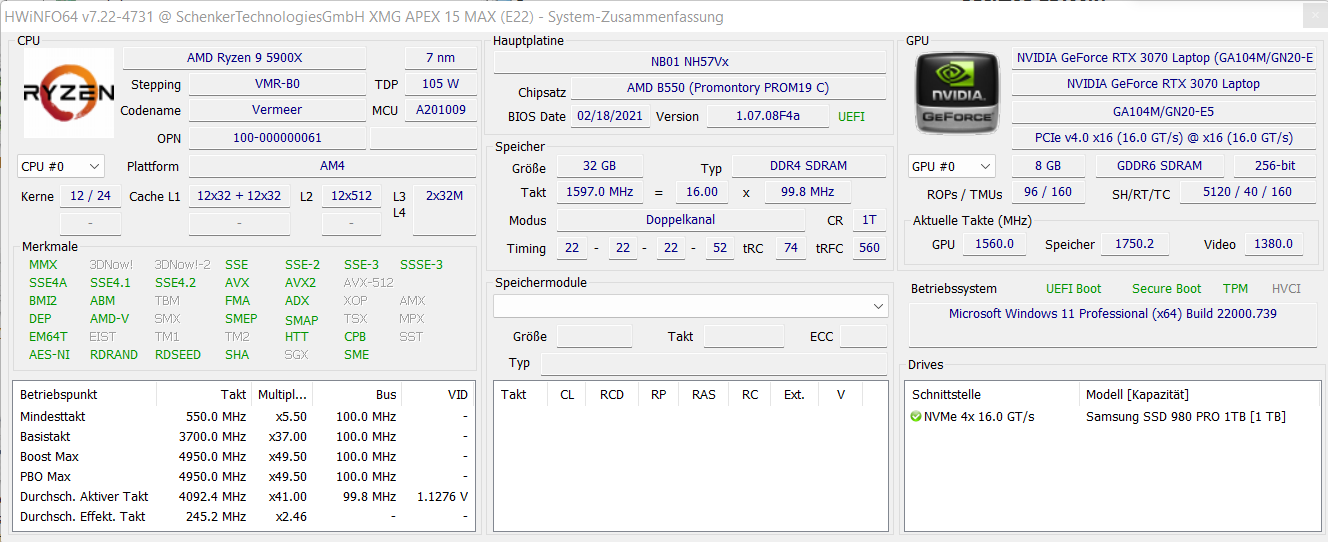
While the Schenker XMG Apex 15 Max is advertised primarily as a gaming laptop, it also targets the workstation and DTR area. Inside the Clevo Barebone (NH57VR) used here are a replaceable Ryzen 9-5900X Desktop CPU and a GeForce RTX 3070 Laptop GPU.
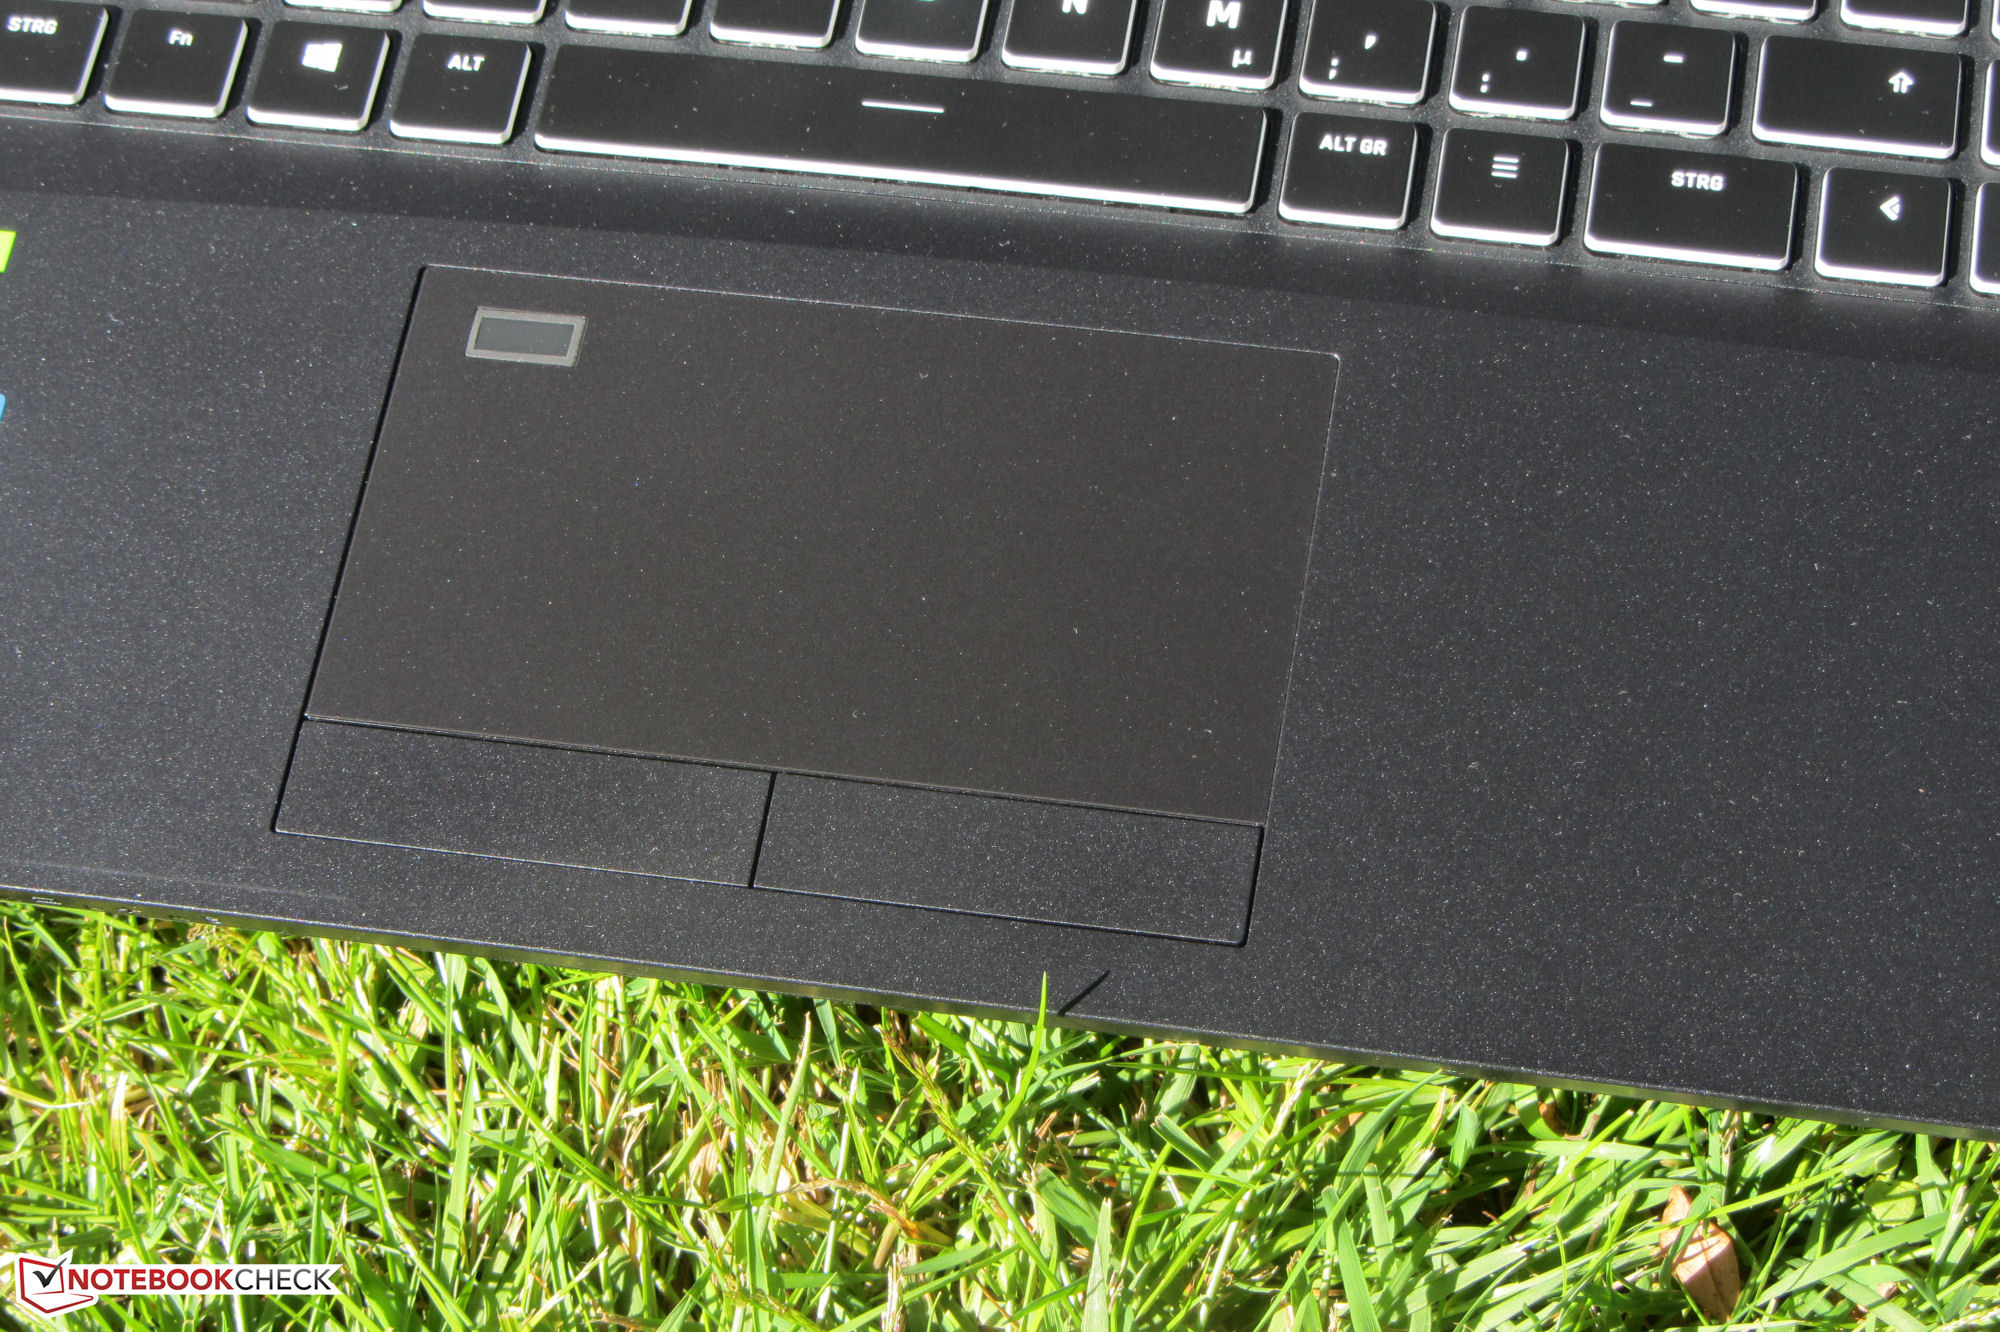
This is the identically constructed successor of the Schenker XMG Apex 15 (2020). We therefore won't discuss the case, equipment, input devices, and speakers here again. You can find the corresponding information in the review of the old Apex 15.
Possible Competitors in Comparison
Rating | Date | Model | Weight | Height | Size | Resolution | Price |
|---|---|---|---|---|---|---|---|
| 83.4 % v7 (old) | 06 / 2022 | Schenker XMG Apex 15 Max R9 5900X, GeForce RTX 3070 Laptop GPU | 2.6 kg | 32.5 mm | 15.60" | 1920x1080 | |
| 83 % v7 (old) | 01 / 2022 | Eurocom Nightsky ARX315 R9 5900X, GeForce RTX 3070 Laptop GPU | 2.6 kg | 32.5 mm | 15.60" | 1920x1080 | |
| 86.9 % v7 (old) | 03 / 2022 | MSI Vector GP66 12UGS i9-12900H, GeForce RTX 3070 Ti Laptop GPU | 2.3 kg | 23.4 mm | 15.60" | 1920x1080 | |
| 85.5 % v7 (old) | 05 / 2022 | HP Omen 16-b1090ng i7-12700H, GeForce RTX 3070 Ti Laptop GPU | 2.3 kg | 23 mm | 16.10" | 2560x1440 | |
| 84.1 % v7 (old) | 01 / 2022 | Gigabyte A5 X1 R9 5900HX, GeForce RTX 3070 Laptop GPU | 2.2 kg | 25.3 mm | 15.60" | 1920x1080 |

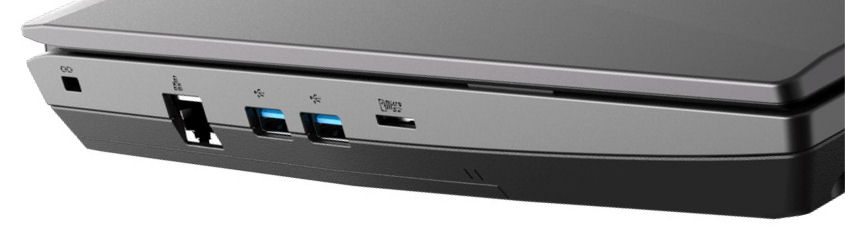
| SD Card Reader | |
| average JPG Copy Test (av. of 3 runs) | |
| Average of class Gaming (20.9 - 210, n=55, last 2 years) | |
| Schenker XMG Apex 15 Max (AV PRO microSD 128 GB V60) | |
| Eurocom Nightsky ARX315 (AV Pro V60) | |
| HP Omen 16-b1090ng (AV PRO microSD 128 GB V60) | |
| maximum AS SSD Seq Read Test (1GB) | |
| Average of class Gaming (25.5 - 261, n=52, last 2 years) | |
| Schenker XMG Apex 15 Max (AV PRO microSD 128 GB V60) | |
| Eurocom Nightsky ARX315 (AV Pro V60) | |


Display - 240-Hz IPS
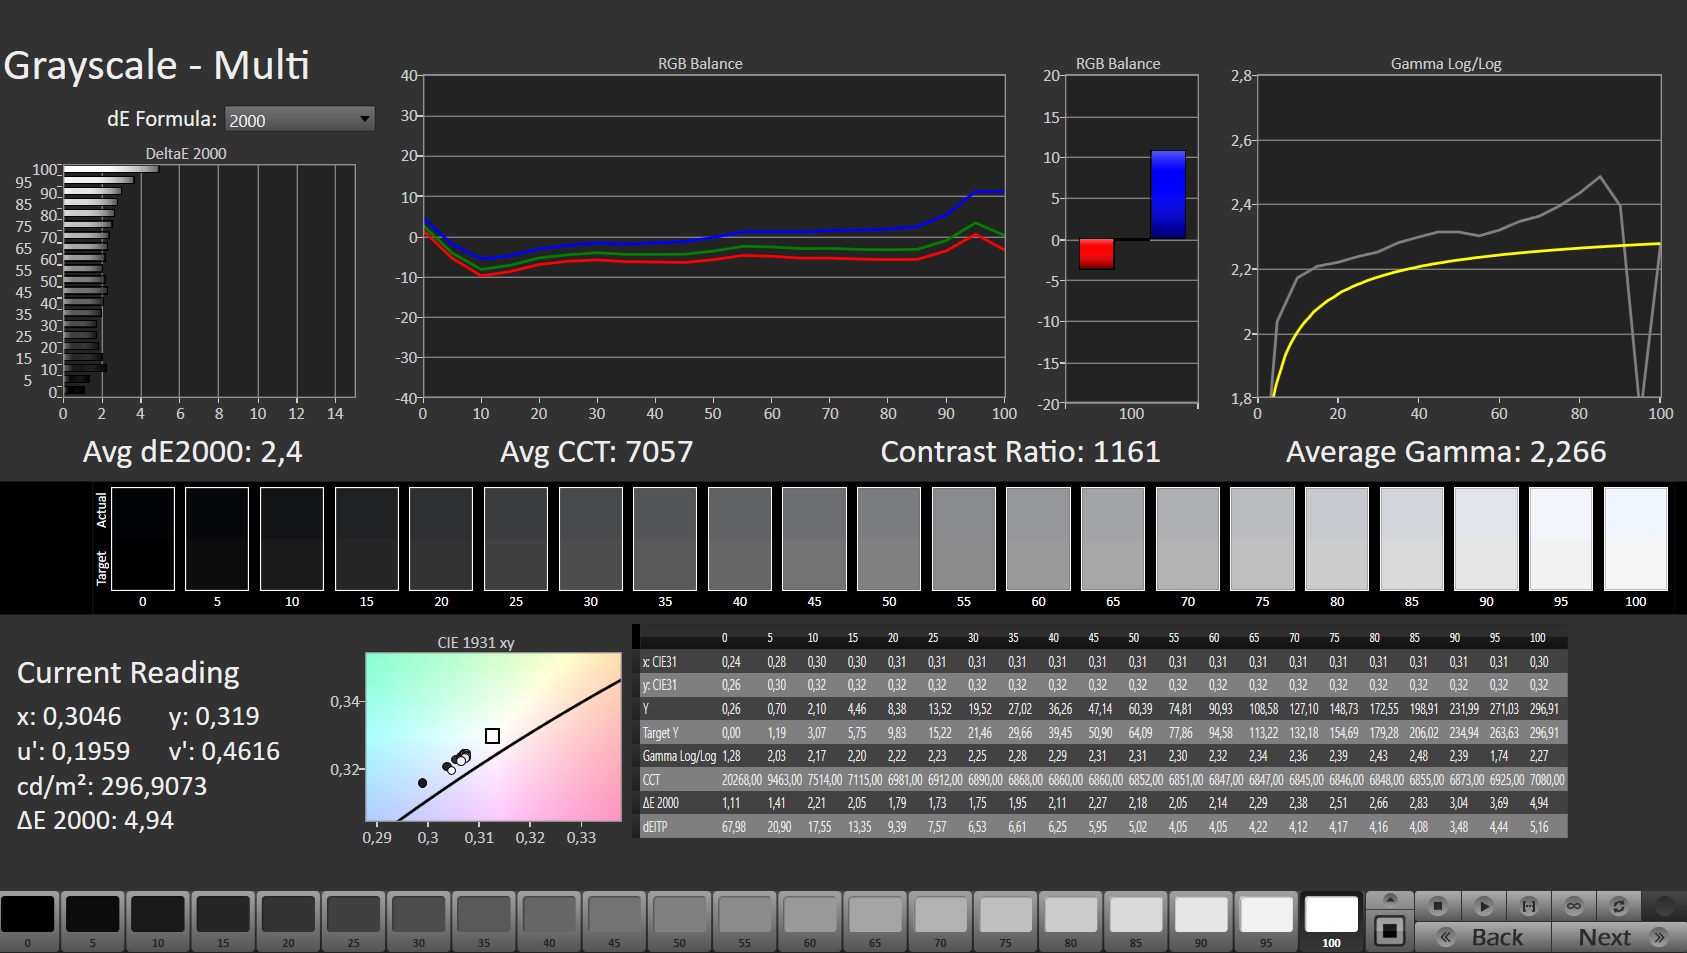
While the contrast (1096:1) of the matte 15.6-inch display (1920 x 1080 pixels) meets the requirements (> 1000:1), the brightness (264.2 cd/m²) turns out too low. We consider values above 300 cd/m² good. The 240-Hz panel offers short response times.
The measurement tools register a high-frequency flickering (23,545 Hz) at brightness levels of 35% and lower. This means that sensitive users should be spared any headaches or eye problems.

| |||||||||||||||||||||||||
Brightness Distribution: 86 %
Center on Battery: 285 cd/m²
Contrast: 1096:1 (Black: 0.26 cd/m²)
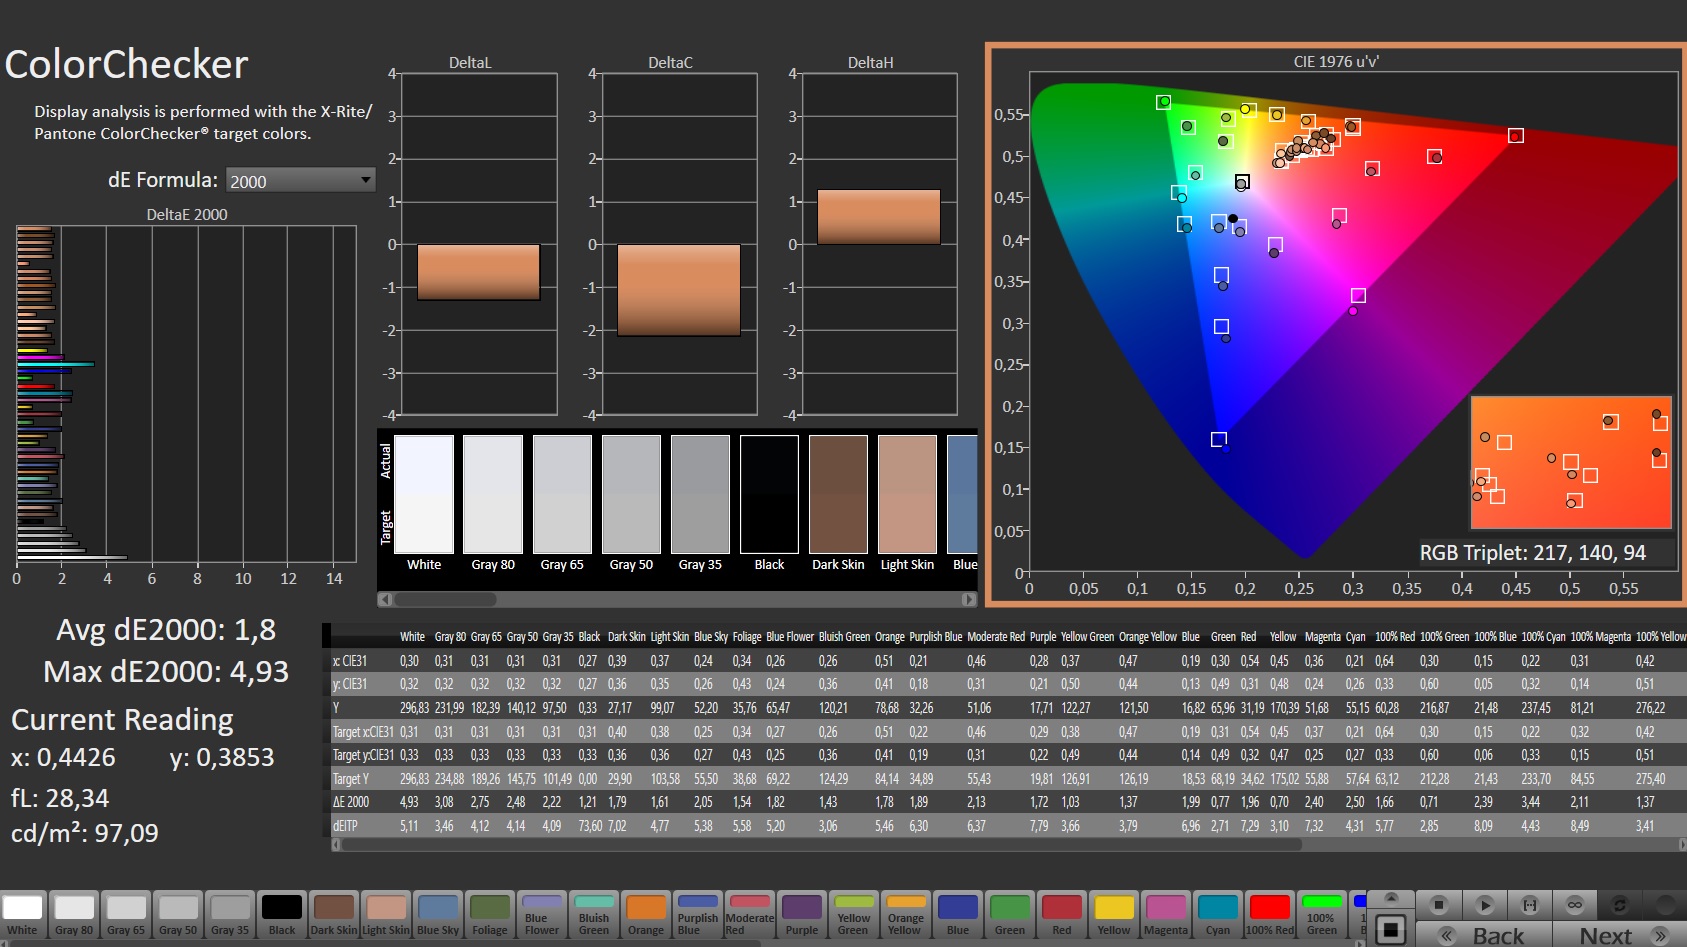
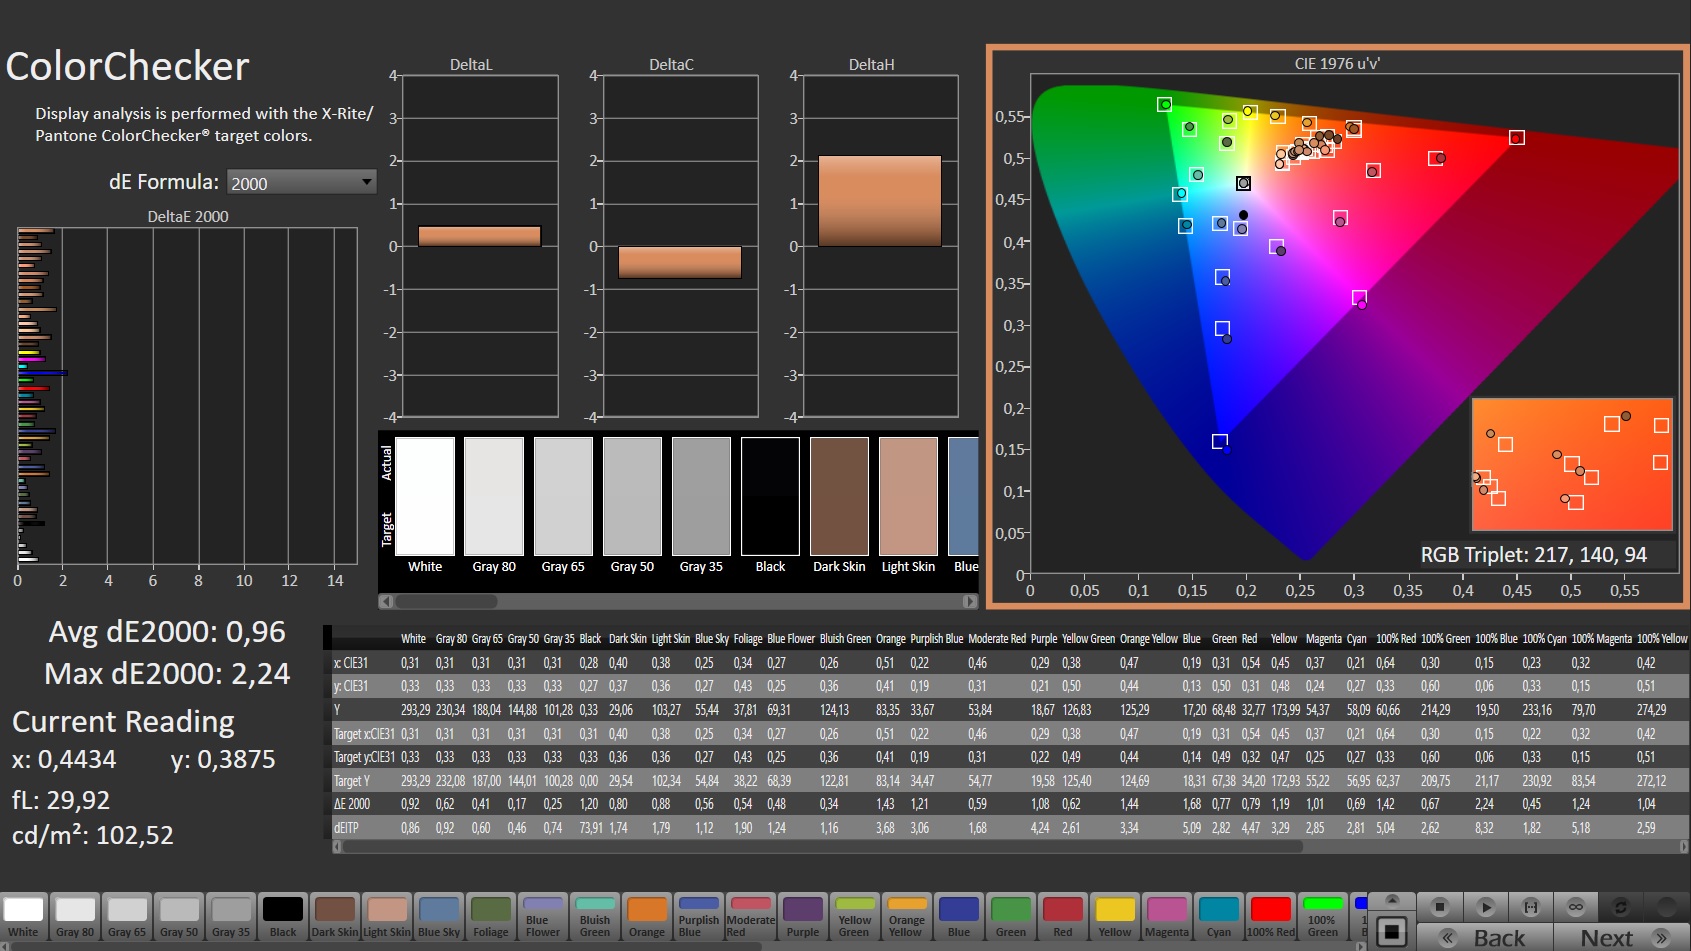
ΔE ColorChecker Calman: 1.8 | ∀{0.5-29.43 Ø4.73}
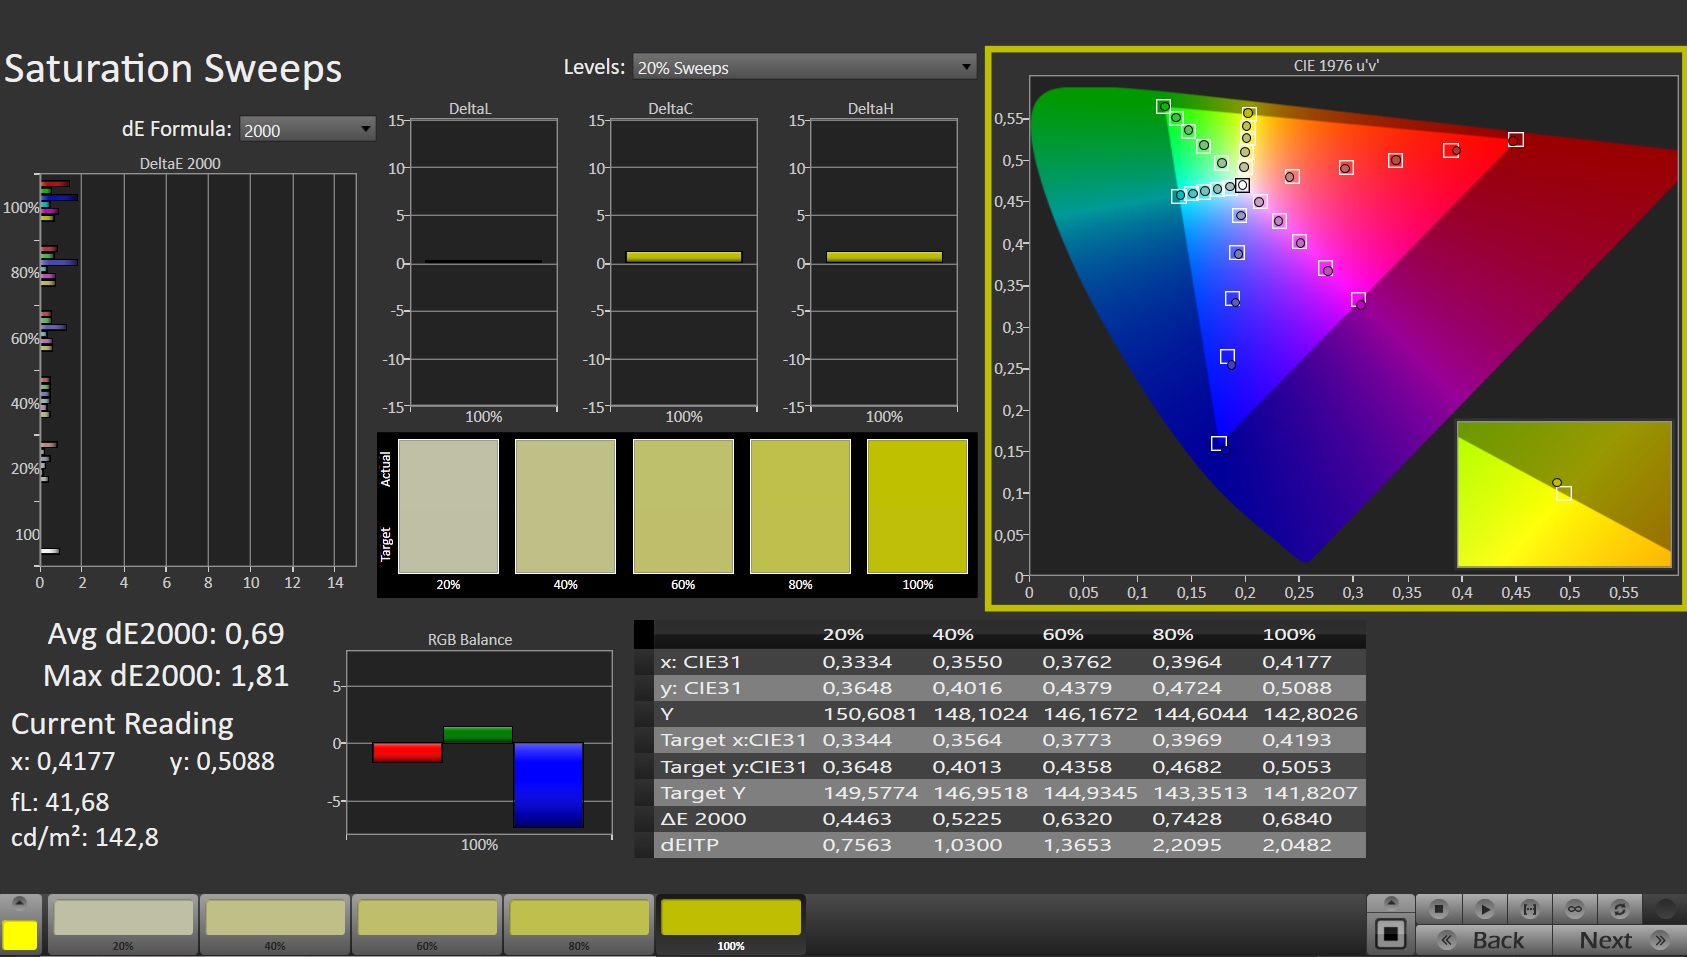
calibrated: 0.96
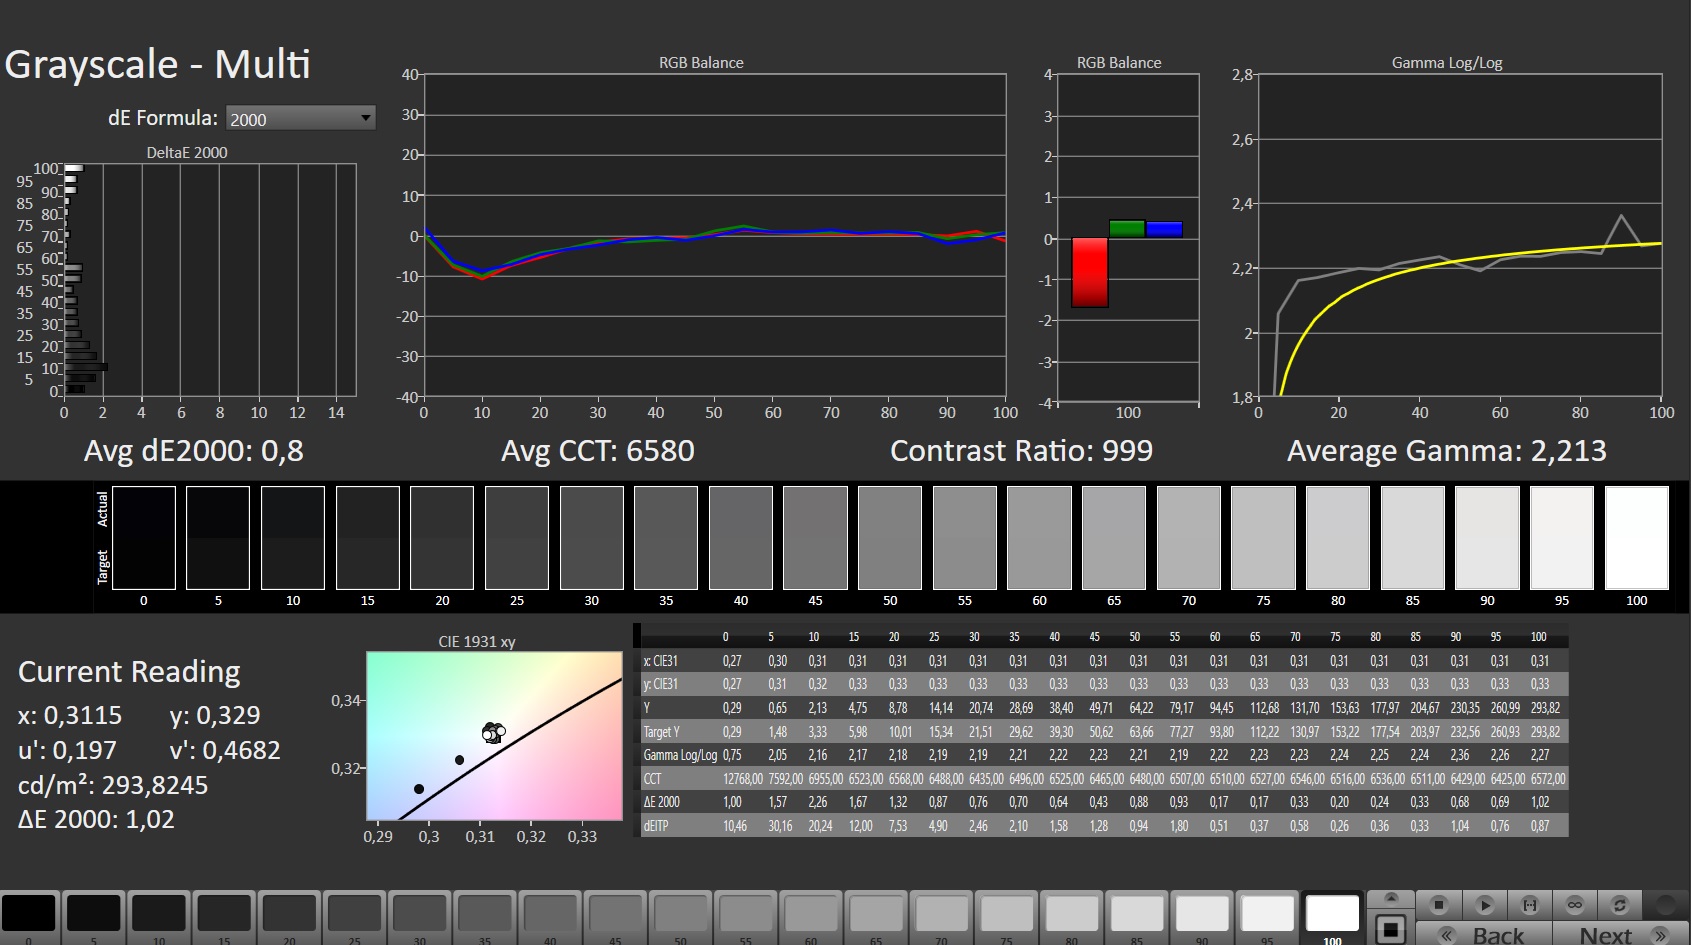
ΔE Greyscale Calman: 2.4 | ∀{0.09-98 Ø4.97}
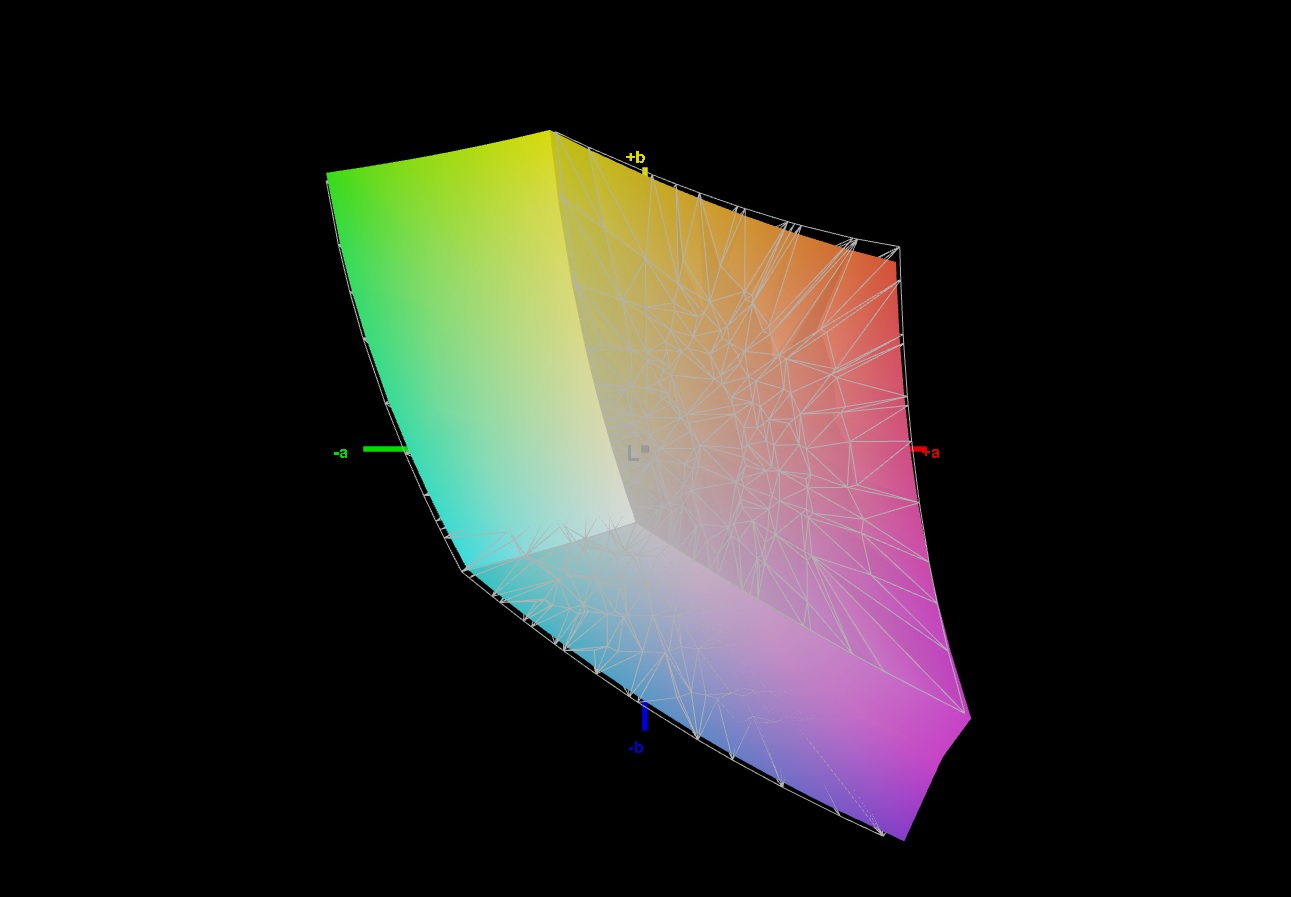
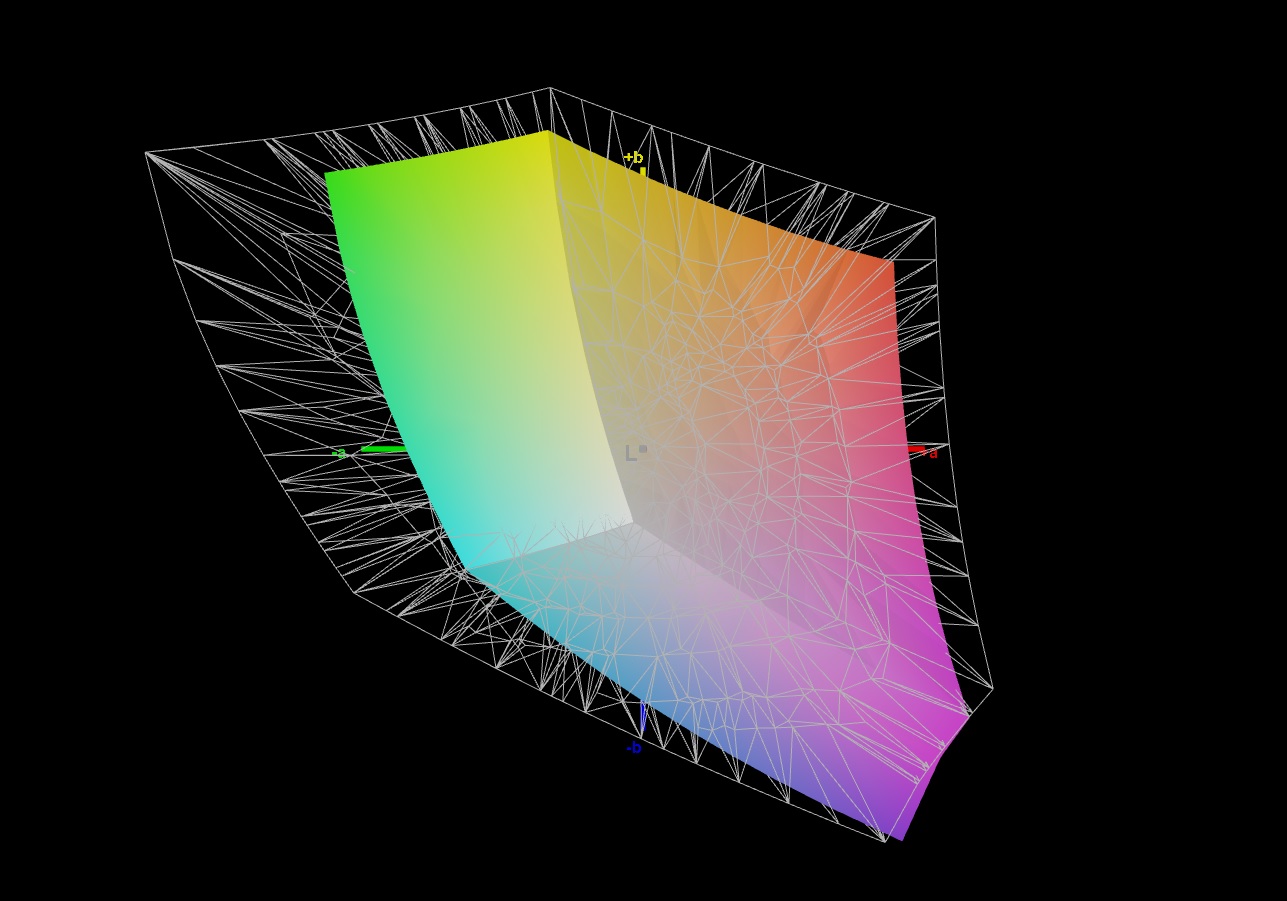
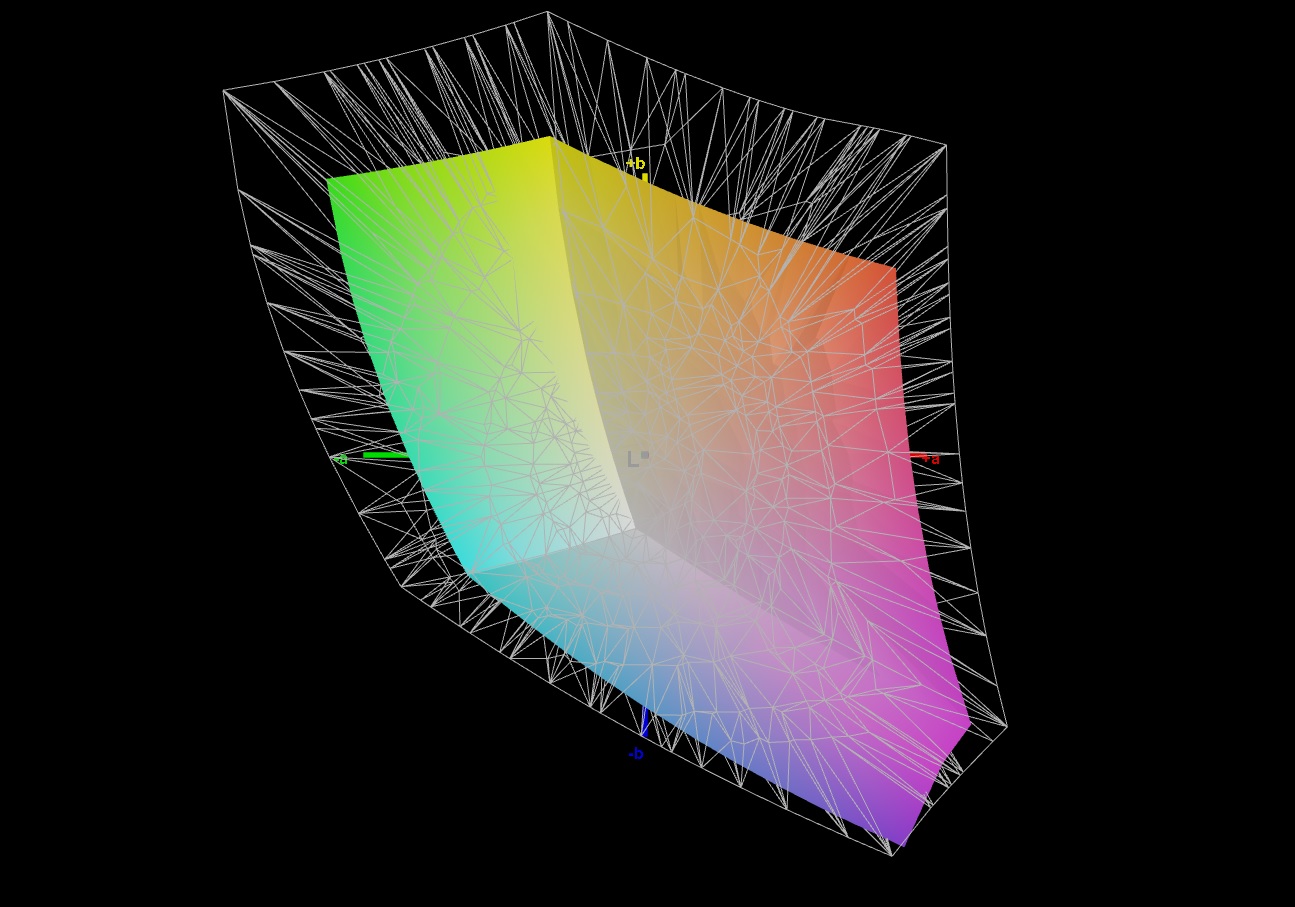
66.8% AdobeRGB 1998 (Argyll 3D)
97% sRGB (Argyll 3D)
65.4% Display P3 (Argyll 3D)
Gamma: 2.266
CCT: 7057 K
| Schenker XMG Apex 15 Max Sharp LQ156M1JW03, IPS, 1920x1080, 15.6" | Eurocom Nightsky ARX315 Sharp LQ156M1JW03, IPS, 1920x1080, 15.6" | MSI Vector GP66 12UGS BOE NE156FHM-NZ3, IPS, 1920x1080, 15.6" | HP Omen 16-b1090ng BOE09E5, IPS, 2560x1440, 16.1" | Schenker XMG Apex 15 NH57AF1 AU Optronics B156HAN (AUO80ED), IPS, 1920x1080, 15.6" | Gigabyte A5 X1 AU Optronics B156HAN12.0, IPS, 1920x1080, 15.6" | |
|---|---|---|---|---|---|---|
| Display | 6% | 6% | 7% | -1% | 5% | |
| Display P3 Coverage (%) | 65.4 | 67.9 4% | 70.1 7% | 71 9% | 67.3 3% | 69.6 6% |
| sRGB Coverage (%) | 97 | 99.7 3% | 99.5 3% | 97.9 1% | 91.3 -6% | 98.6 2% |
| AdobeRGB 1998 Coverage (%) | 66.8 | 73.7 10% | 72.1 8% | 73.3 10% | 66.8 0% | 70.8 6% |
| Response Times | -50% | 11% | -36% | -63% | 6% | |
| Response Time Grey 50% / Grey 80% * (ms) | 9.3 ? | 15.2 ? -63% | 5.8 ? 38% | 14.5 ? -56% | 17.6 ? -89% | 4.8 ? 48% |
| Response Time Black / White * (ms) | 8.2 ? | 11.2 ? -37% | 9.6 ? -17% | 9.4 ? -15% | 11.2 ? -37% | 11.2 ? -37% |
| PWM Frequency (Hz) | 23545 ? | 23150 ? | ||||
| Screen | -18% | -13% | -47% | -32% | -22% | |
| Brightness middle (cd/m²) | 285 | 312.8 10% | 353.1 24% | 335 18% | 317 11% | 335 18% |
| Brightness (cd/m²) | 264 | 294 11% | 325 23% | 319 21% | 316 20% | 325 23% |
| Brightness Distribution (%) | 86 | 90 5% | 85 -1% | 90 5% | 84 -2% | 90 5% |
| Black Level * (cd/m²) | 0.26 | 0.28 -8% | 0.38 -46% | 0.28 -8% | 0.28 -8% | 0.4 -54% |
| Contrast (:1) | 1096 | 1117 2% | 929 -15% | 1196 9% | 1132 3% | 838 -24% |
| Colorchecker dE 2000 * | 1.8 | 2.96 -64% | 2.24 -24% | 4.38 -143% | 3.52 -96% | 2.63 -46% |
| Colorchecker dE 2000 max. * | 4.93 | 6.23 -26% | 5 -1% | 9.48 -92% | 6.93 -41% | 7.71 -56% |
| Colorchecker dE 2000 calibrated * | 0.96 | 1.02 -6% | 1.33 -39% | 2.49 -159% | 0.97 -1% | |
| Greyscale dE 2000 * | 2.4 | 4.2 -75% | 4 -67% | 7 -192% | 2.81 -17% | 4 -67% |
| Gamma | 2.266 97% | 2.32 95% | 2.24 98% | 2.103 105% | 2.54 87% | 2.129 103% |
| CCT | 7057 92% | 7145 91% | 6864 95% | 6244 104% | 6877 95% | 7434 87% |
| Color Space (Percent of AdobeRGB 1998) (%) | 67 | |||||
| Color Space (Percent of sRGB) (%) | 91 | |||||
| Total Average (Program / Settings) | -21% /
-18% | 1% /
-5% | -25% /
-34% | -32% /
-30% | -4% /
-13% |
* ... smaller is better
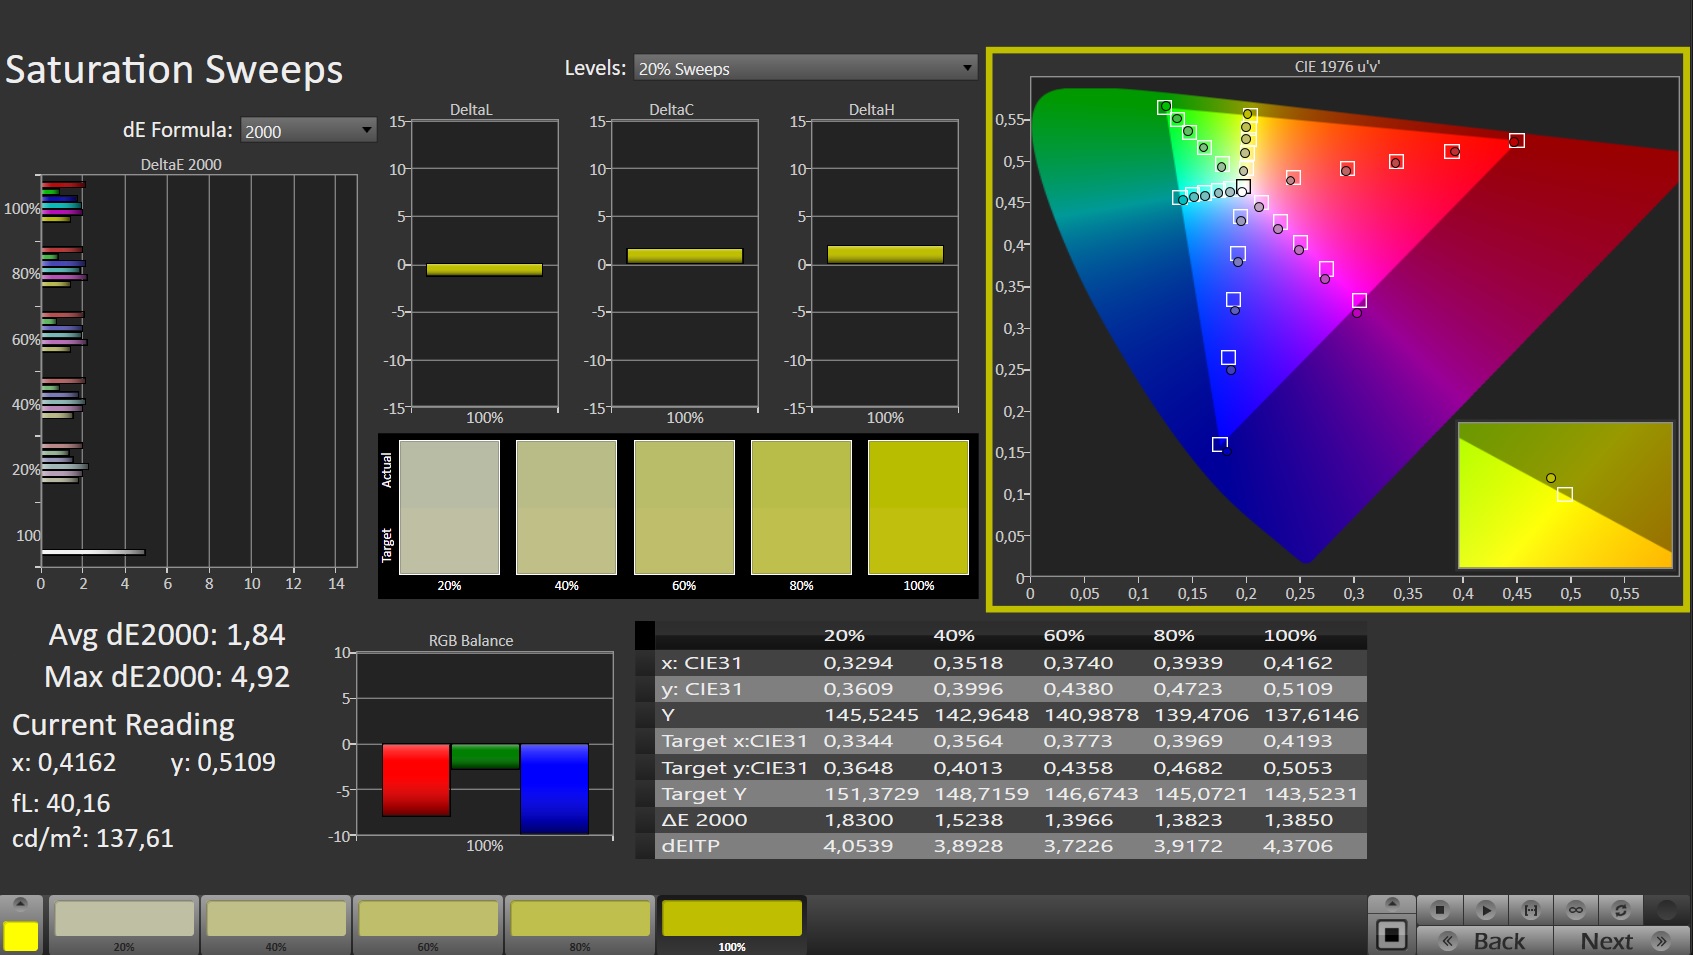
The display shows a good color reproduction already in the state of delivery, and the color deviations remain within the target range. However, a calibration still brings some improvements. The display is unable to cover the AdobeRGB (67%) and DCI-P3 (65%) color spaces, but at least 97% of the sRGB color space are displayed.
Display Response Times
| ↔ Response Time Black to White | ||
|---|---|---|
| 8.2 ms ... rise ↗ and fall ↘ combined | ↗ 4.3 ms rise | 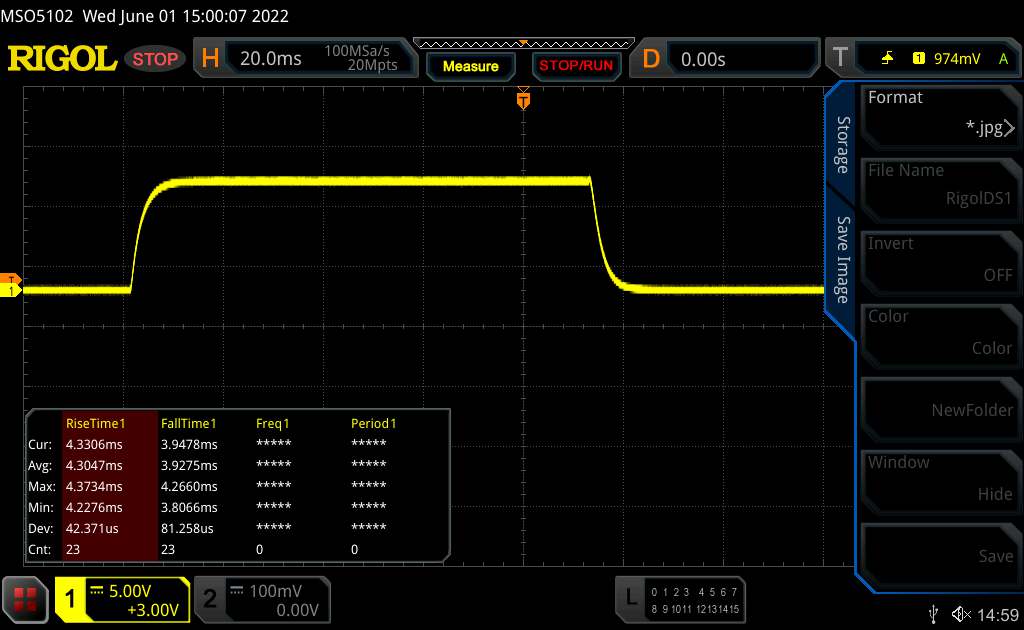 |
| ↘ 3.9 ms fall | ||
| The screen shows fast response rates in our tests and should be suited for gaming. In comparison, all tested devices range from 0.1 (minimum) to 240 (maximum) ms. » 23 % of all devices are better. This means that the measured response time is better than the average of all tested devices (19.9 ms). | ||
| ↔ Response Time 50% Grey to 80% Grey | ||
| 9.3 ms ... rise ↗ and fall ↘ combined | ↗ 4.5 ms rise | 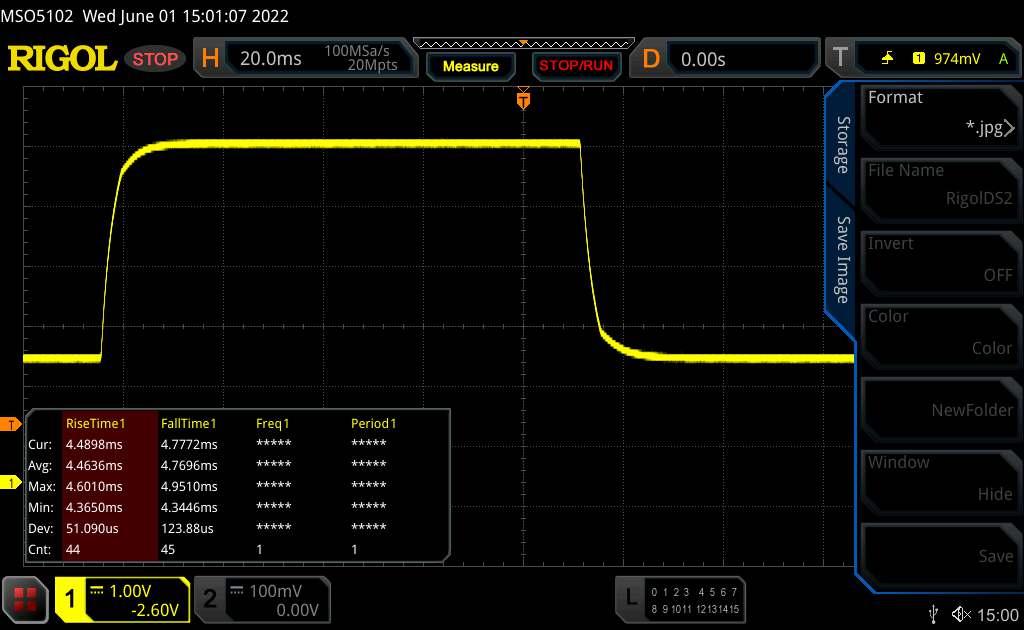 |
| ↘ 4.8 ms fall | ||
| The screen shows fast response rates in our tests and should be suited for gaming. In comparison, all tested devices range from 0.165 (minimum) to 636 (maximum) ms. » 23 % of all devices are better. This means that the measured response time is better than the average of all tested devices (31.1 ms). | ||
Screen Flickering / PWM (Pulse-Width Modulation)
| Screen flickering / PWM detected | 23545 Hz | ≤ 35 % brightness setting | 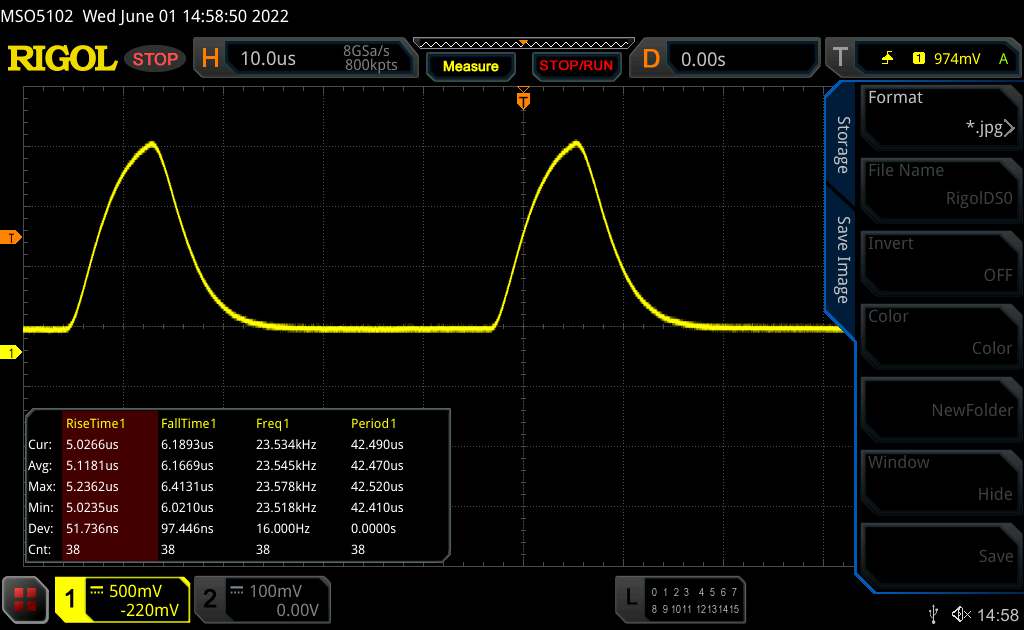 |
The display backlight flickers at 23545 Hz (worst case, e.g., utilizing PWM) Flickering detected at a brightness setting of 35 % and below. There should be no flickering or PWM above this brightness setting. The frequency of 23545 Hz is quite high, so most users sensitive to PWM should not notice any flickering. In comparison: 52 % of all tested devices do not use PWM to dim the display. If PWM was detected, an average of 7798 (minimum: 5 - maximum: 343500) Hz was measured. | |||
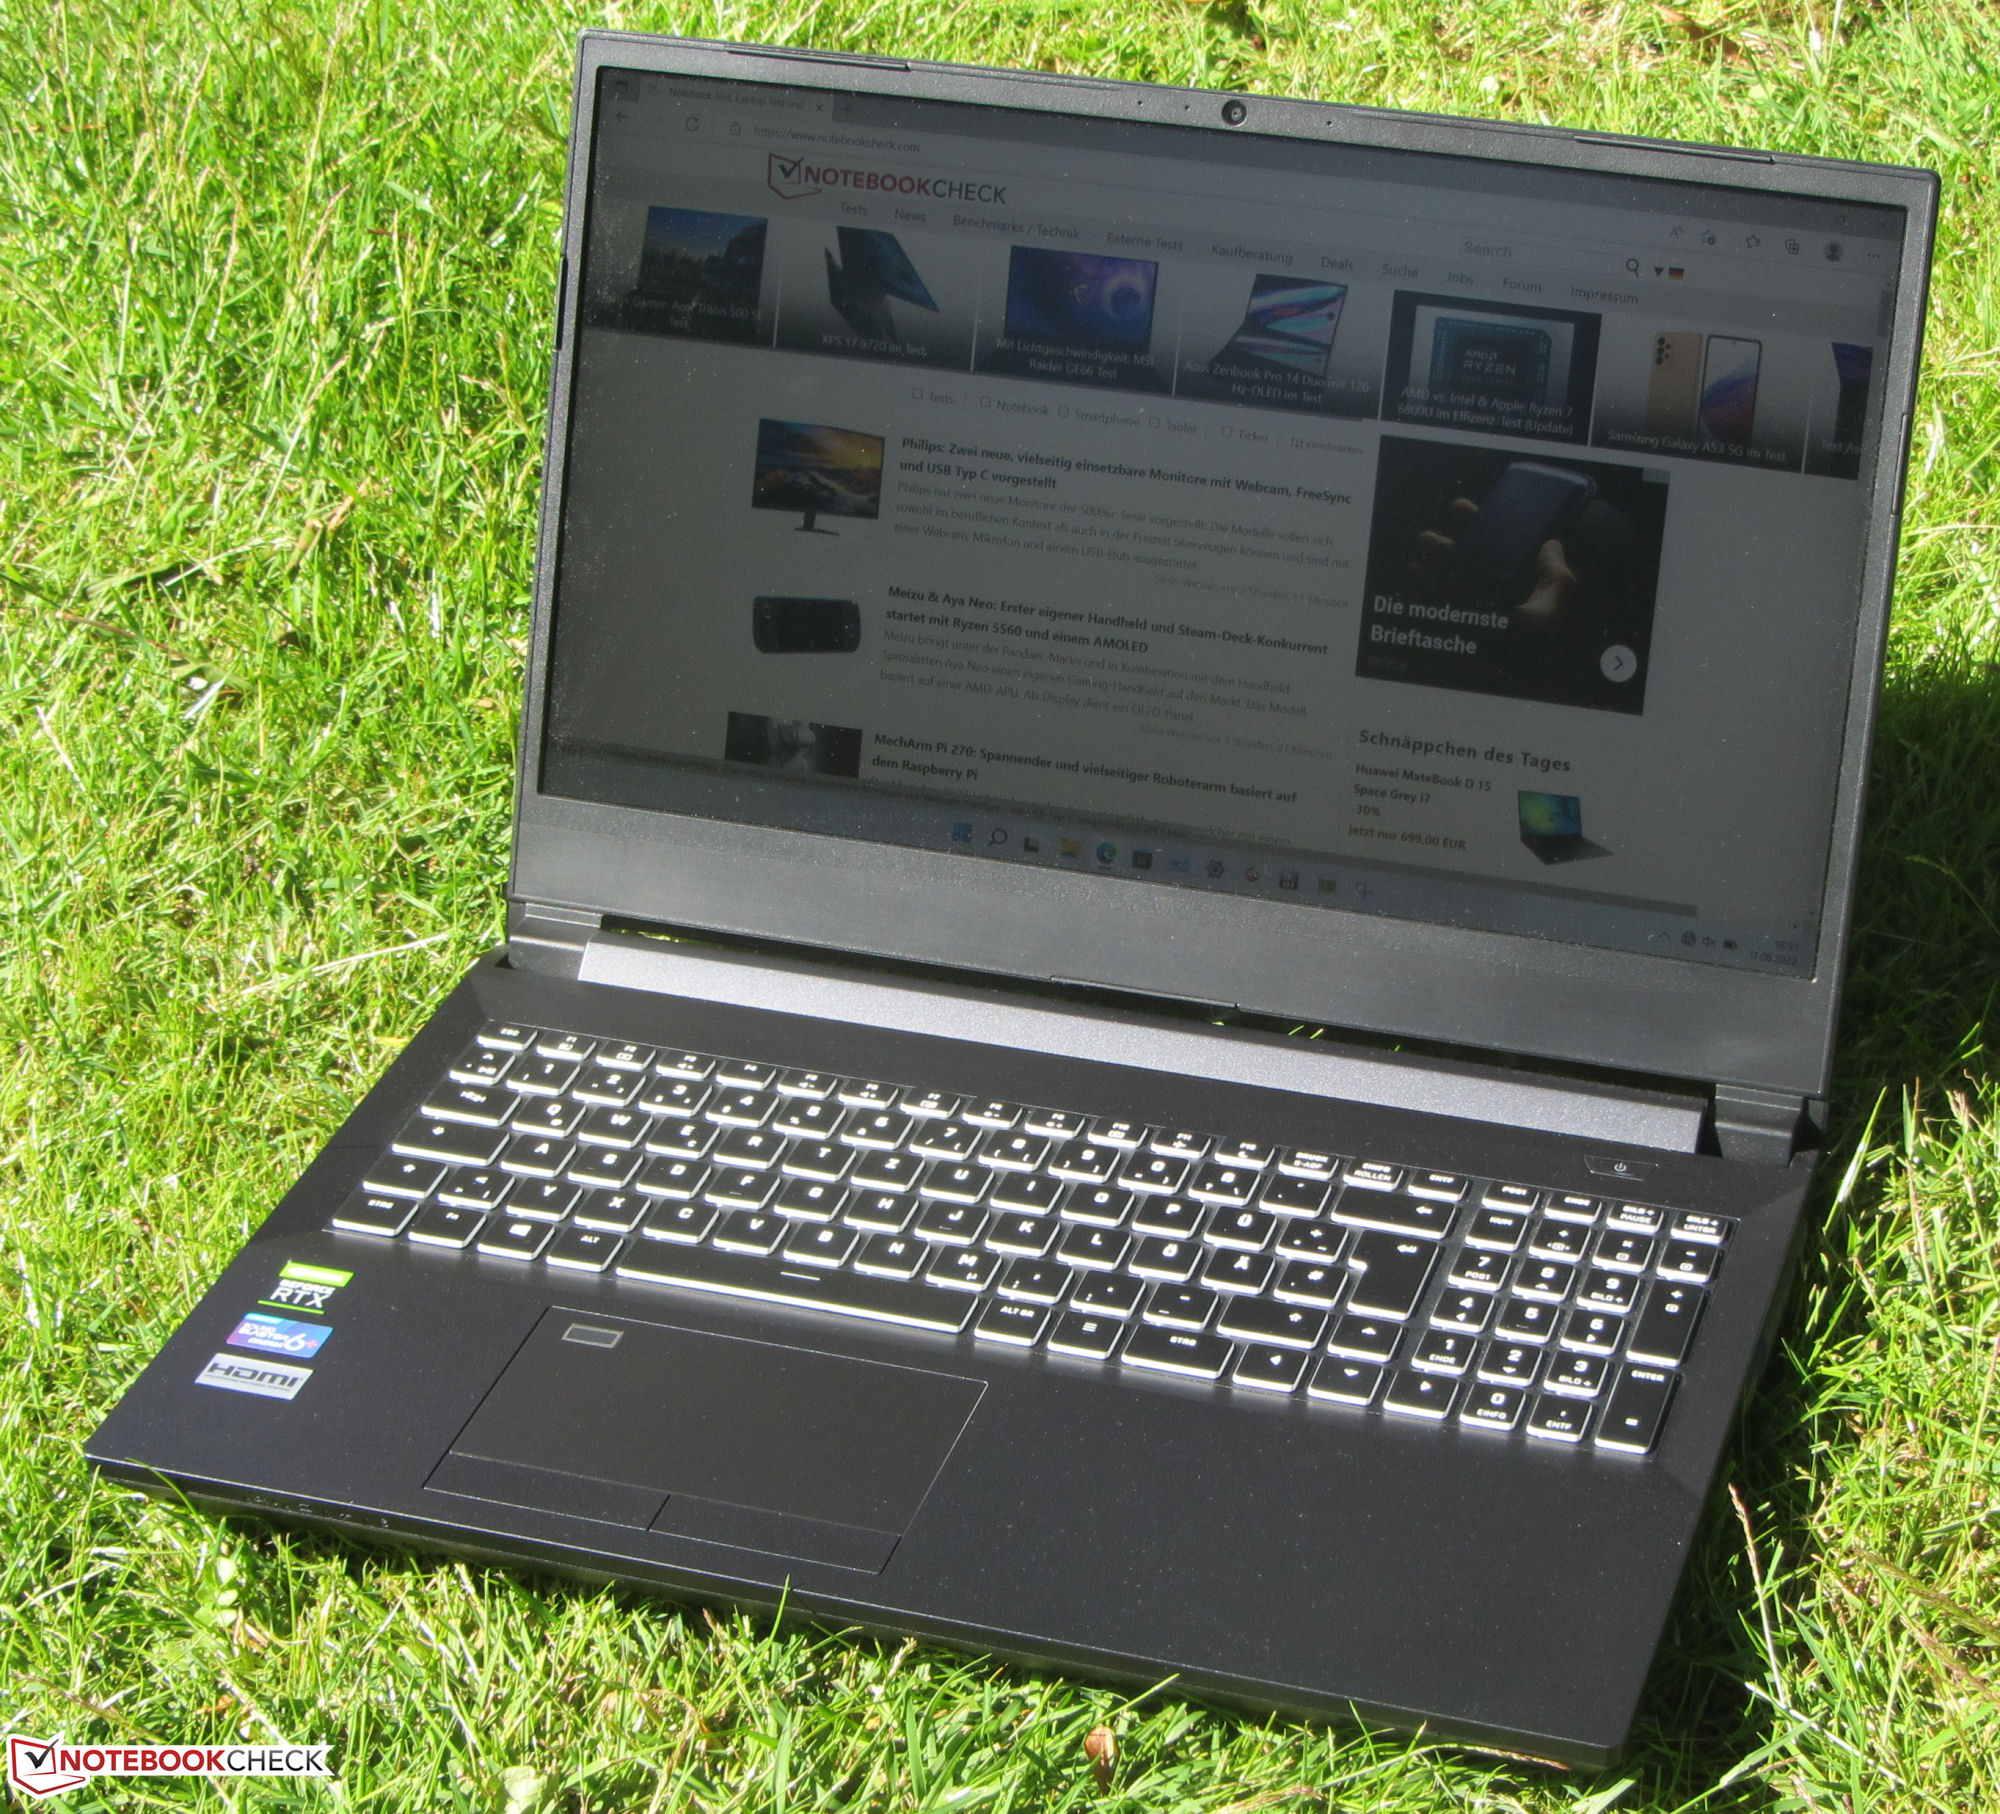
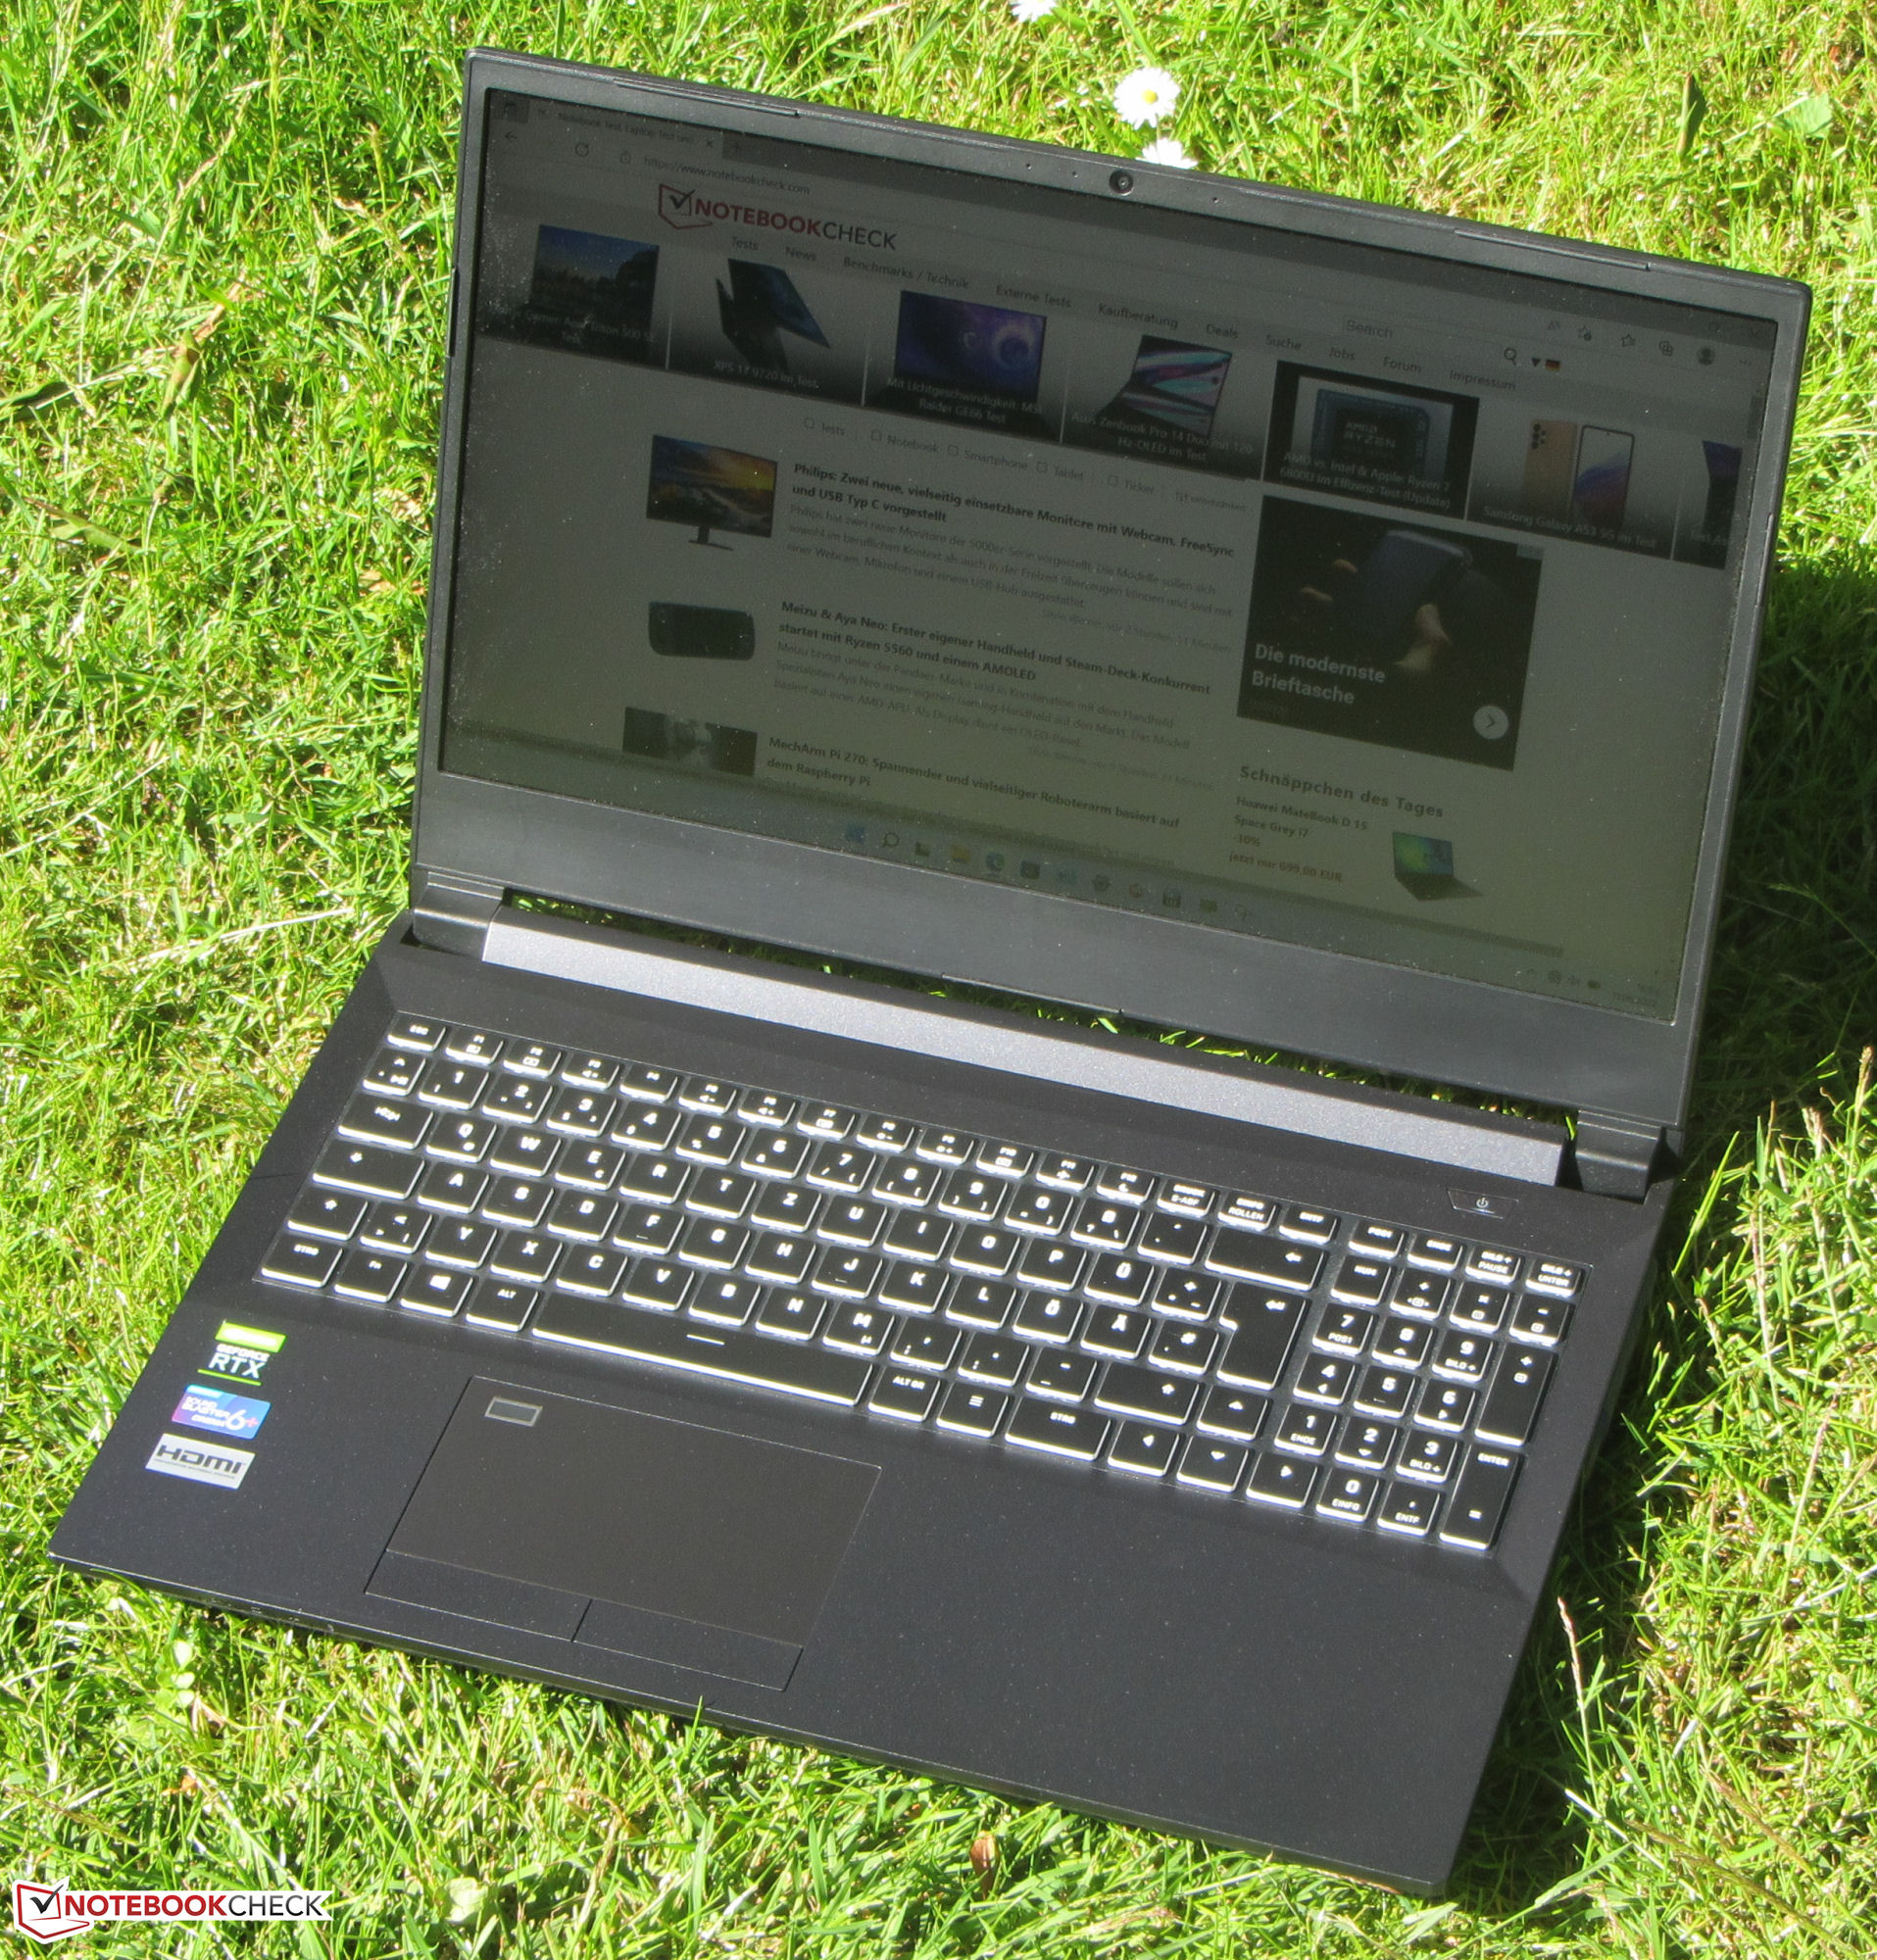
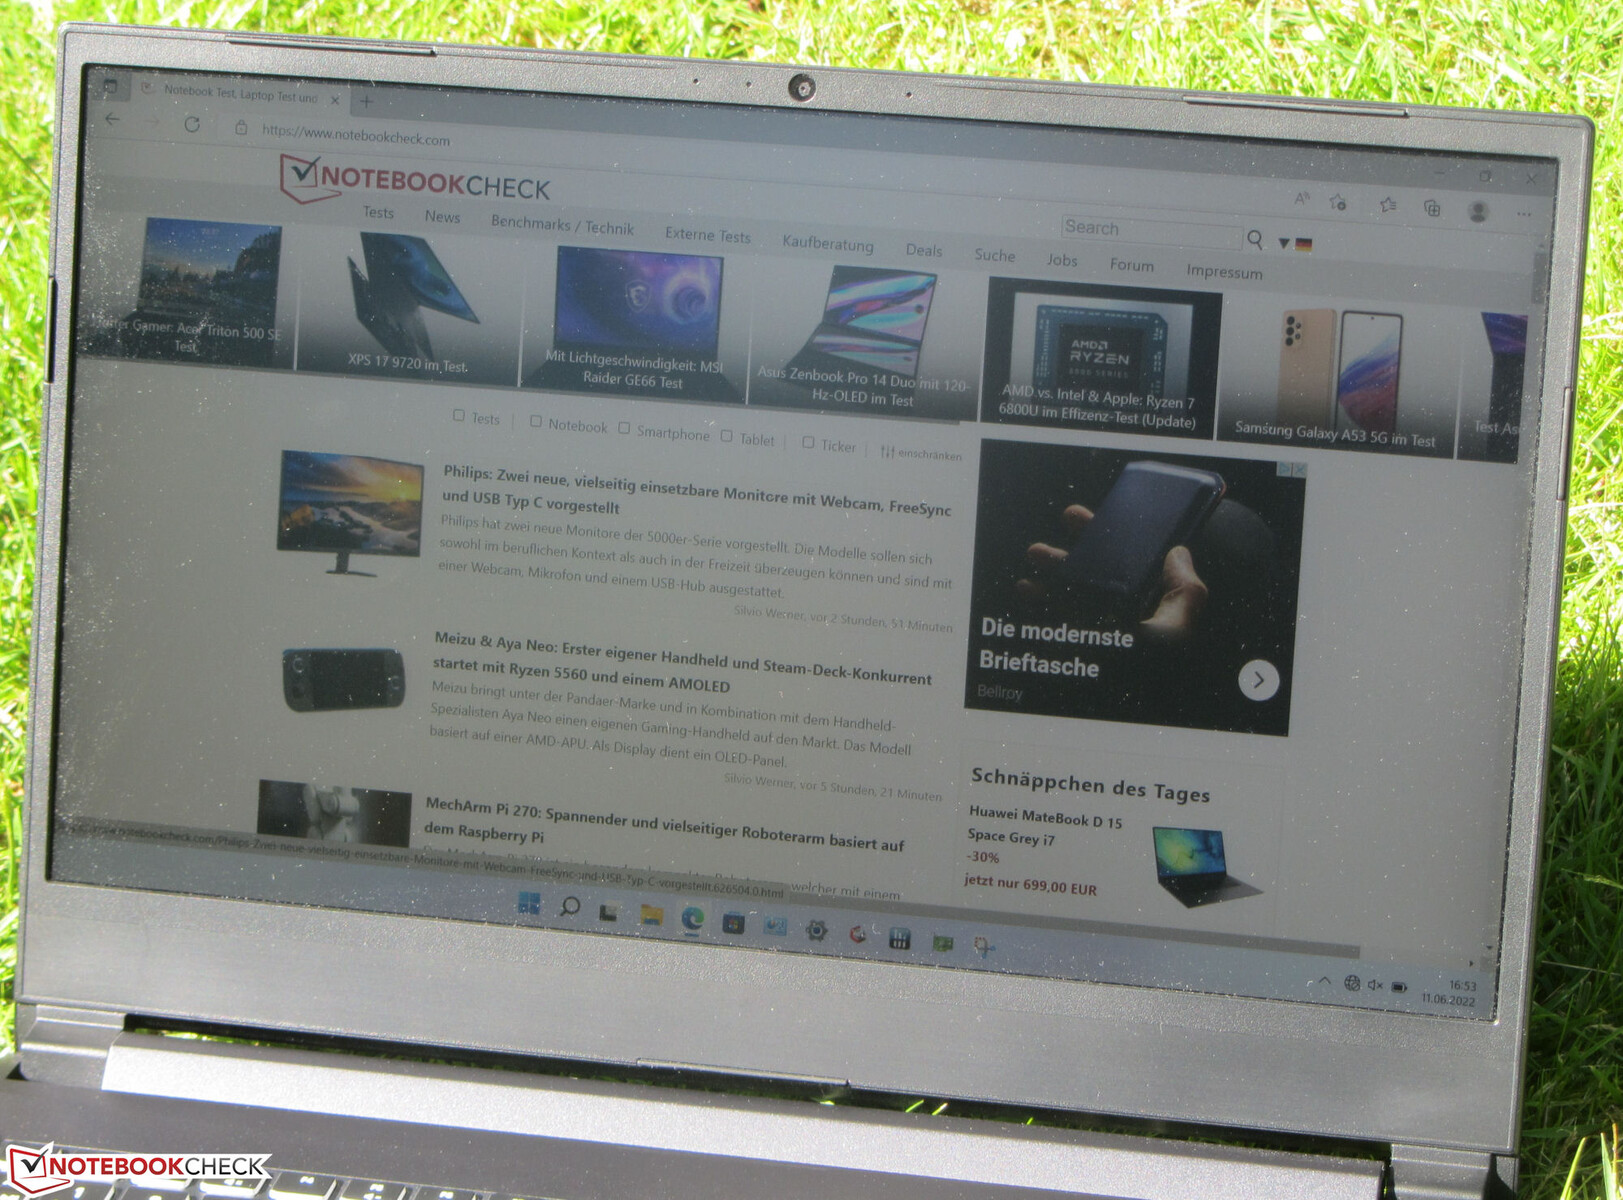
The IPS panel offers stable viewing angles and can be read from any angle. Outdoors, the display contents can be read if the sun isn't too bright.

Performance - The desktop CPU of the XMG Apex doesn't develop its full potential
The powerful 15.6-inch laptop strikes a good figure in application scenarios that require a lot of computing power, be it gaming, video processing, or rendering. The laptop can be configured very individually in the Schenker Online shop (bestware.com).
Test Conditions
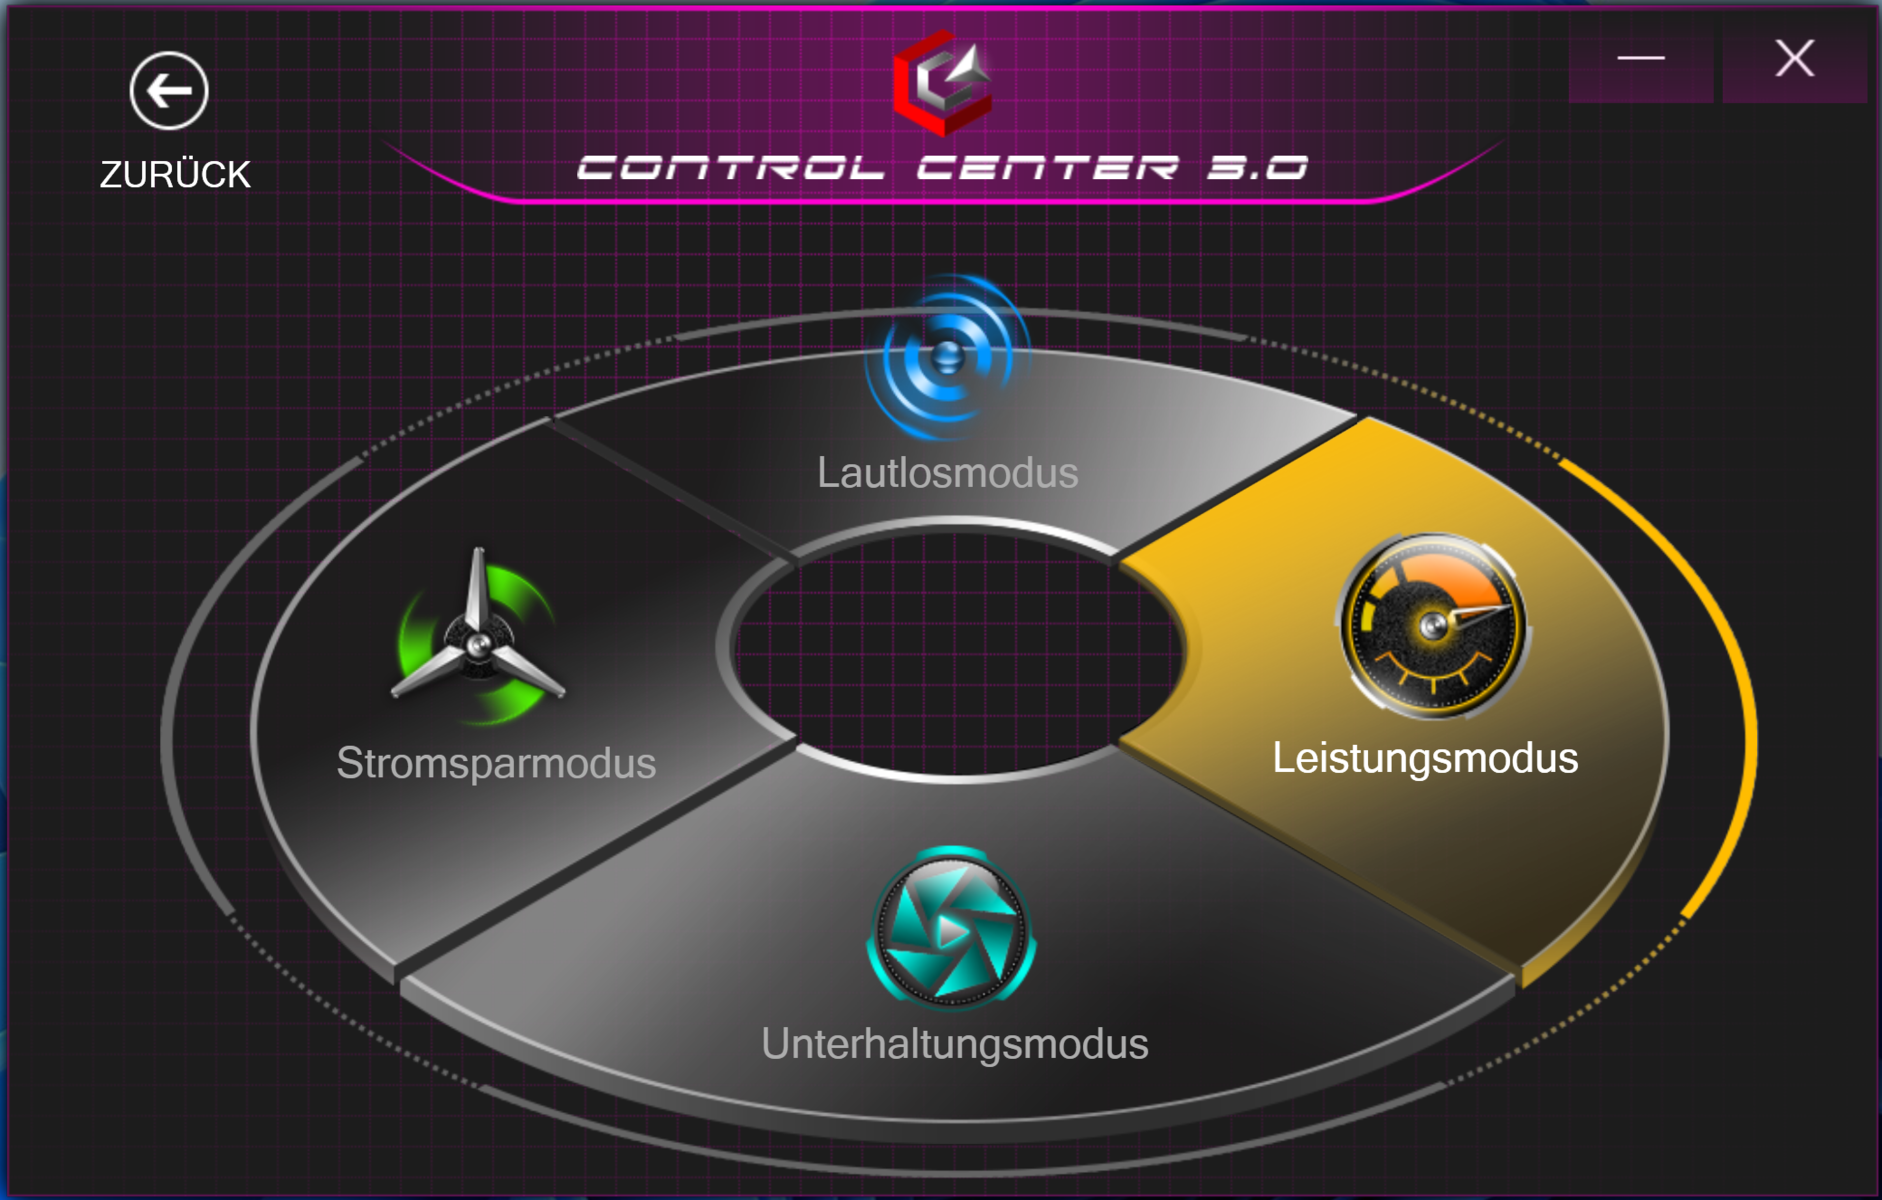
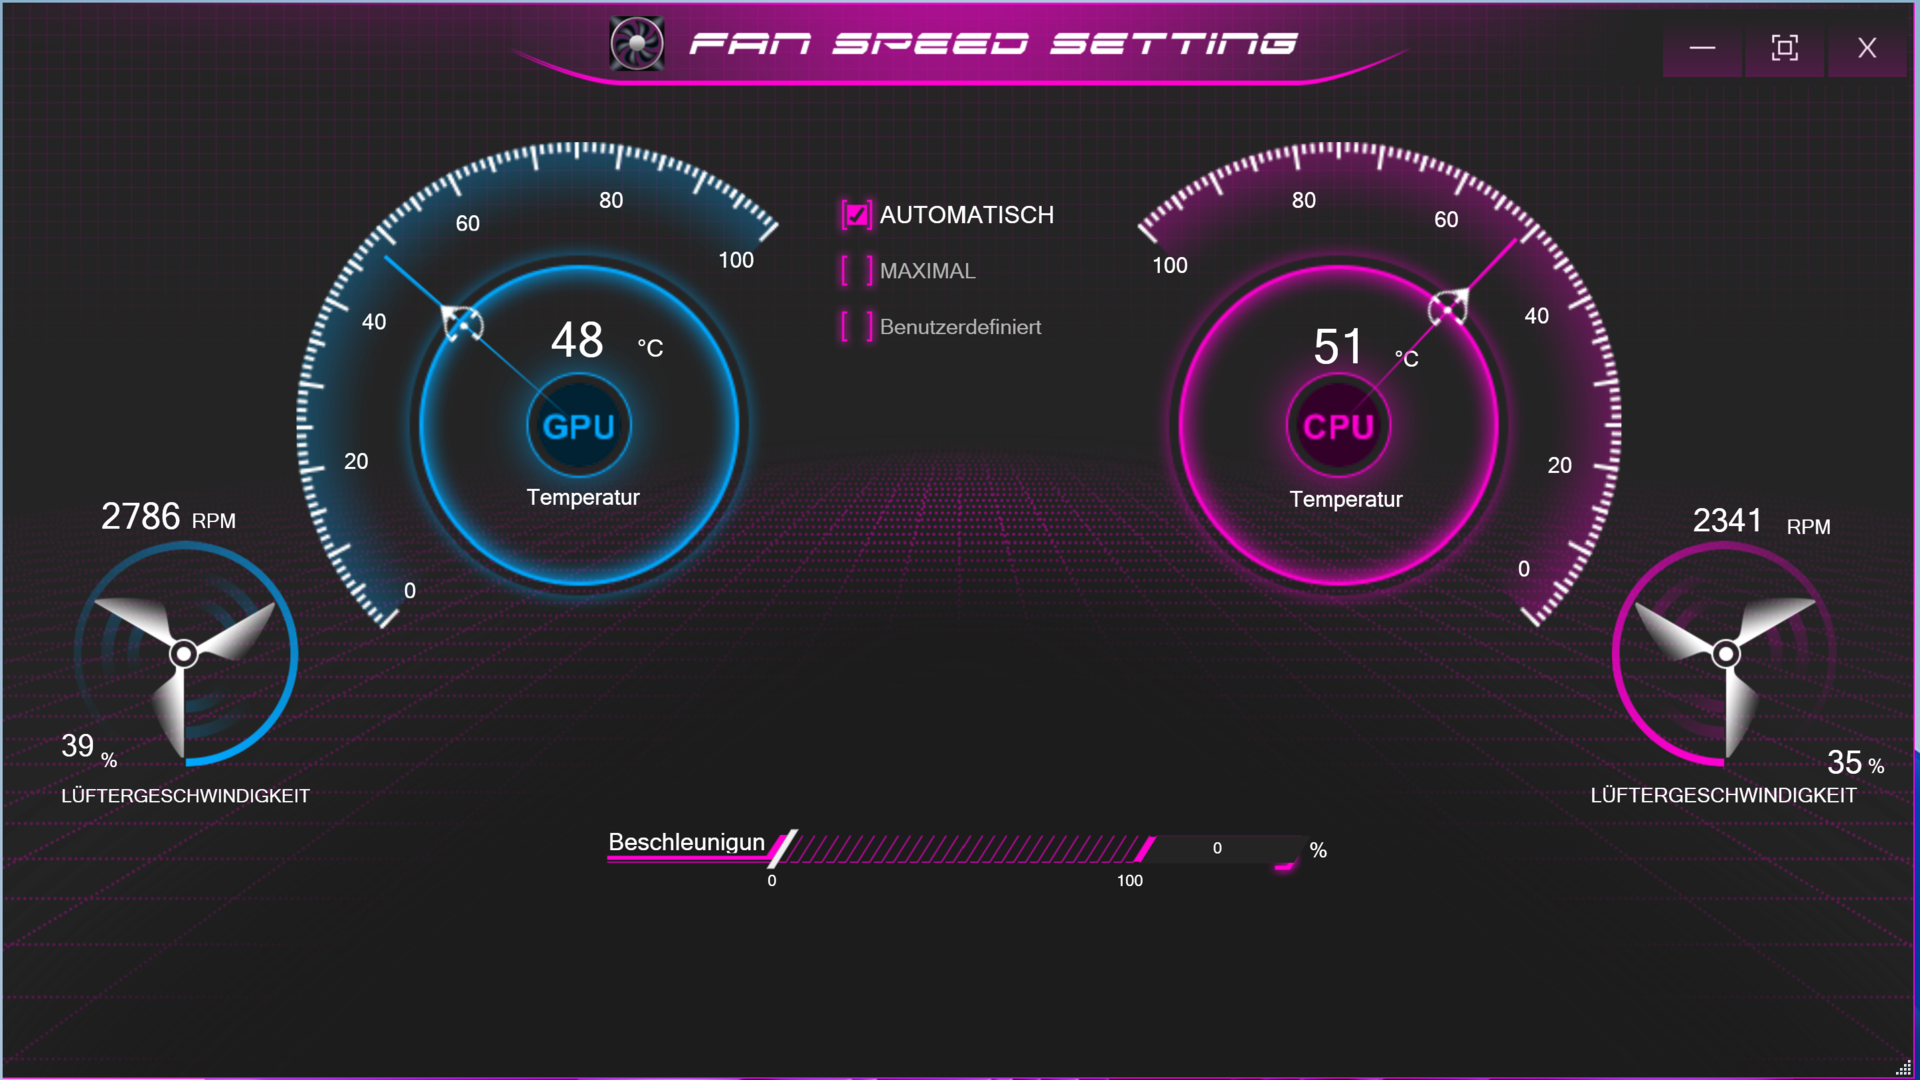
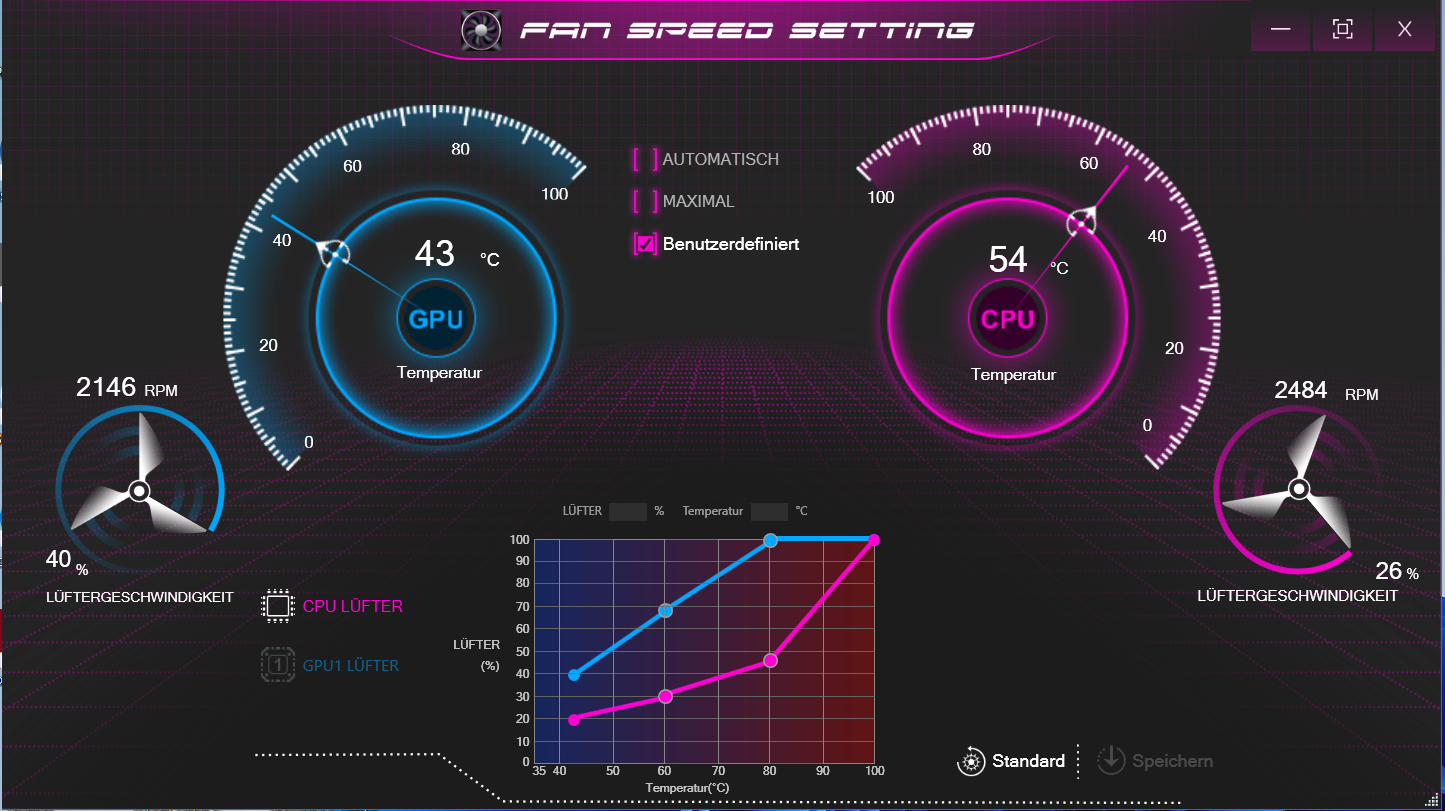
Among other options, the preinstalled Control Center also allows you to select a performance profile (Performance mode, Entertainment mode, Power Saving mode, Silent mode). The benchmarks and battery tests were performed using the Entertainment mode including automatic fan control.

BIOS
According to Schenker, the BIOS of the Apex 15 Max represents an inhouse development. In this way, the company wants to guarantee the stable operation of the offered Ryzen 9 CPUs at all times. We can also confirm this at least for our test unit.
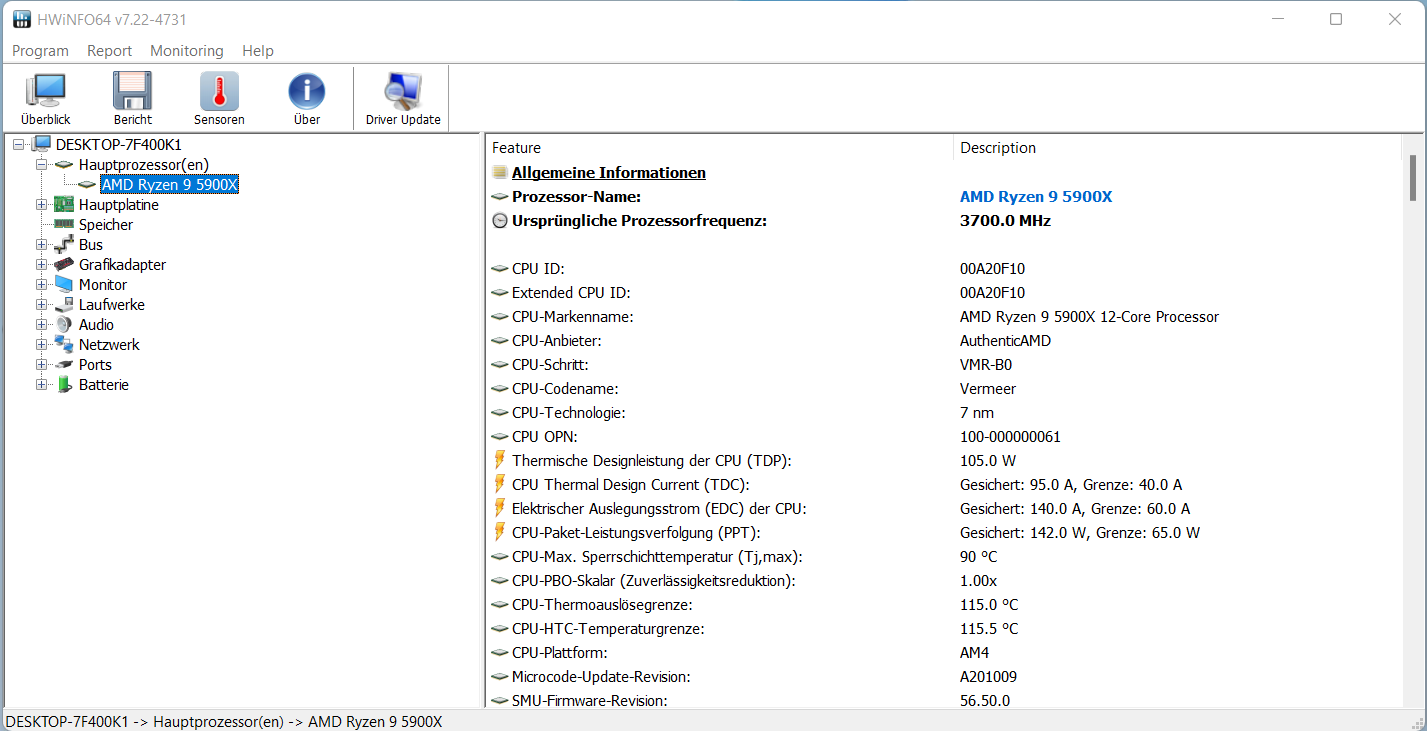
Processor
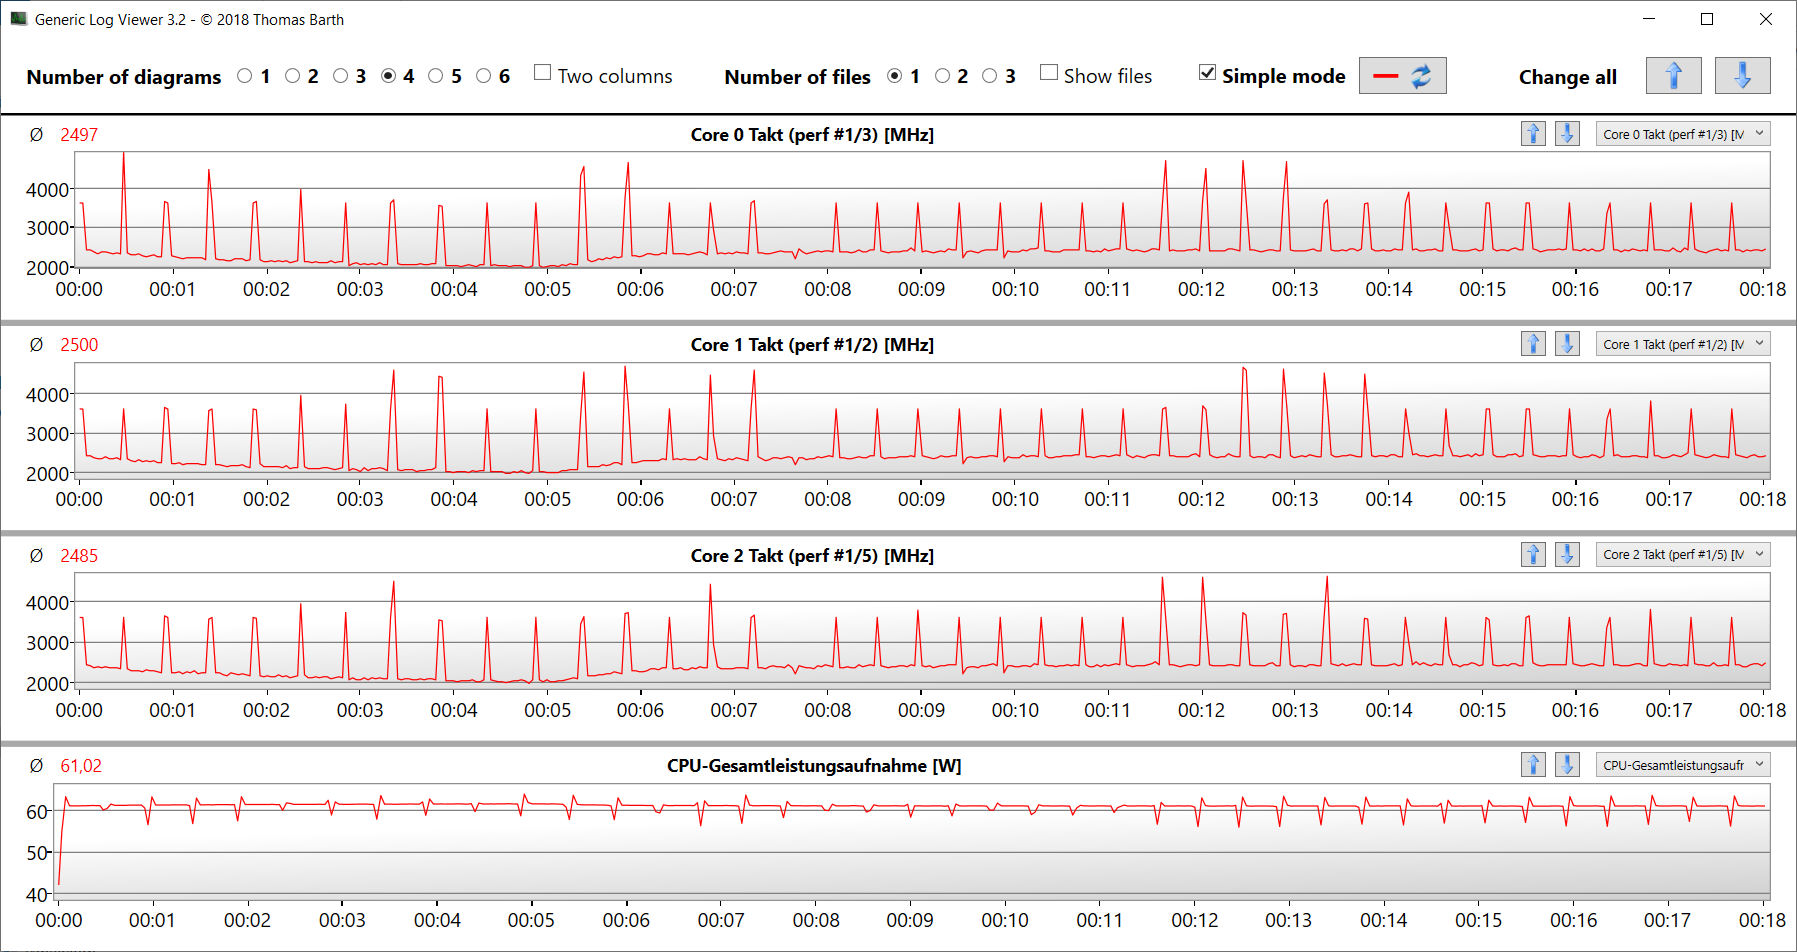
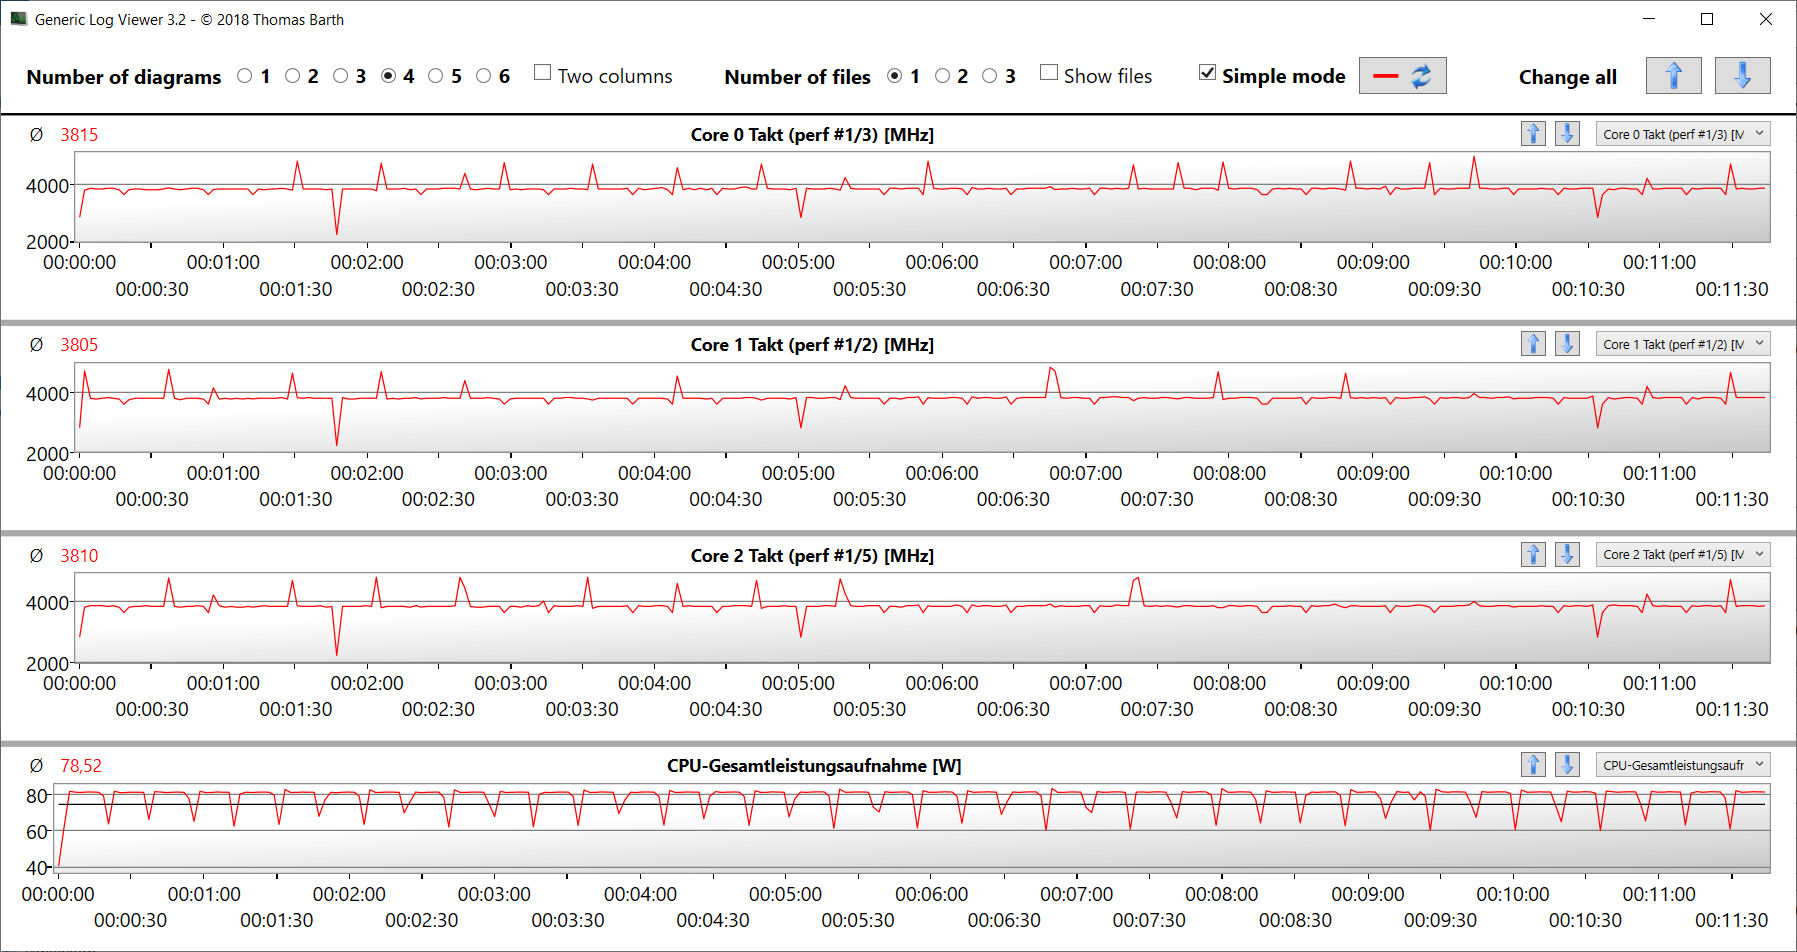
The replaceable Ryzen 9 5900X twelve-core processor (Vermeer) runs with a basic clock speed of 3.7 GHz. Via Turbo, this can be increased up to 4.5 GHz (twelve cores) and 4.8 GHz (single core). Simultaneous multithreading (with two Threads per core) is supported. The clock speeds during the Cinebench R15 benchmarks vary significantly, depending on the selected power profile. In all cases, the CPU is able to run constantly at a stable clock speed, which is shown by our CB15 loop test.
| Entertainment Mode | Performance Mode | Performance Mode Max. Fan | Silent Mode | Power Saving Mode | |
|---|---|---|---|---|---|
| Single Thread | 3.6 to 4.7 GHz | 3.4 to 4.8 GHz | 3.6 to 4.8 GHz | 600 MHz to 3.6 GHz | 550 to 650 MHz |
| Multi-Thread | 2.3 GHz | 3.8 GHz | 3.8 to 3.9 GHz | 550 MHz | 550 MHz |
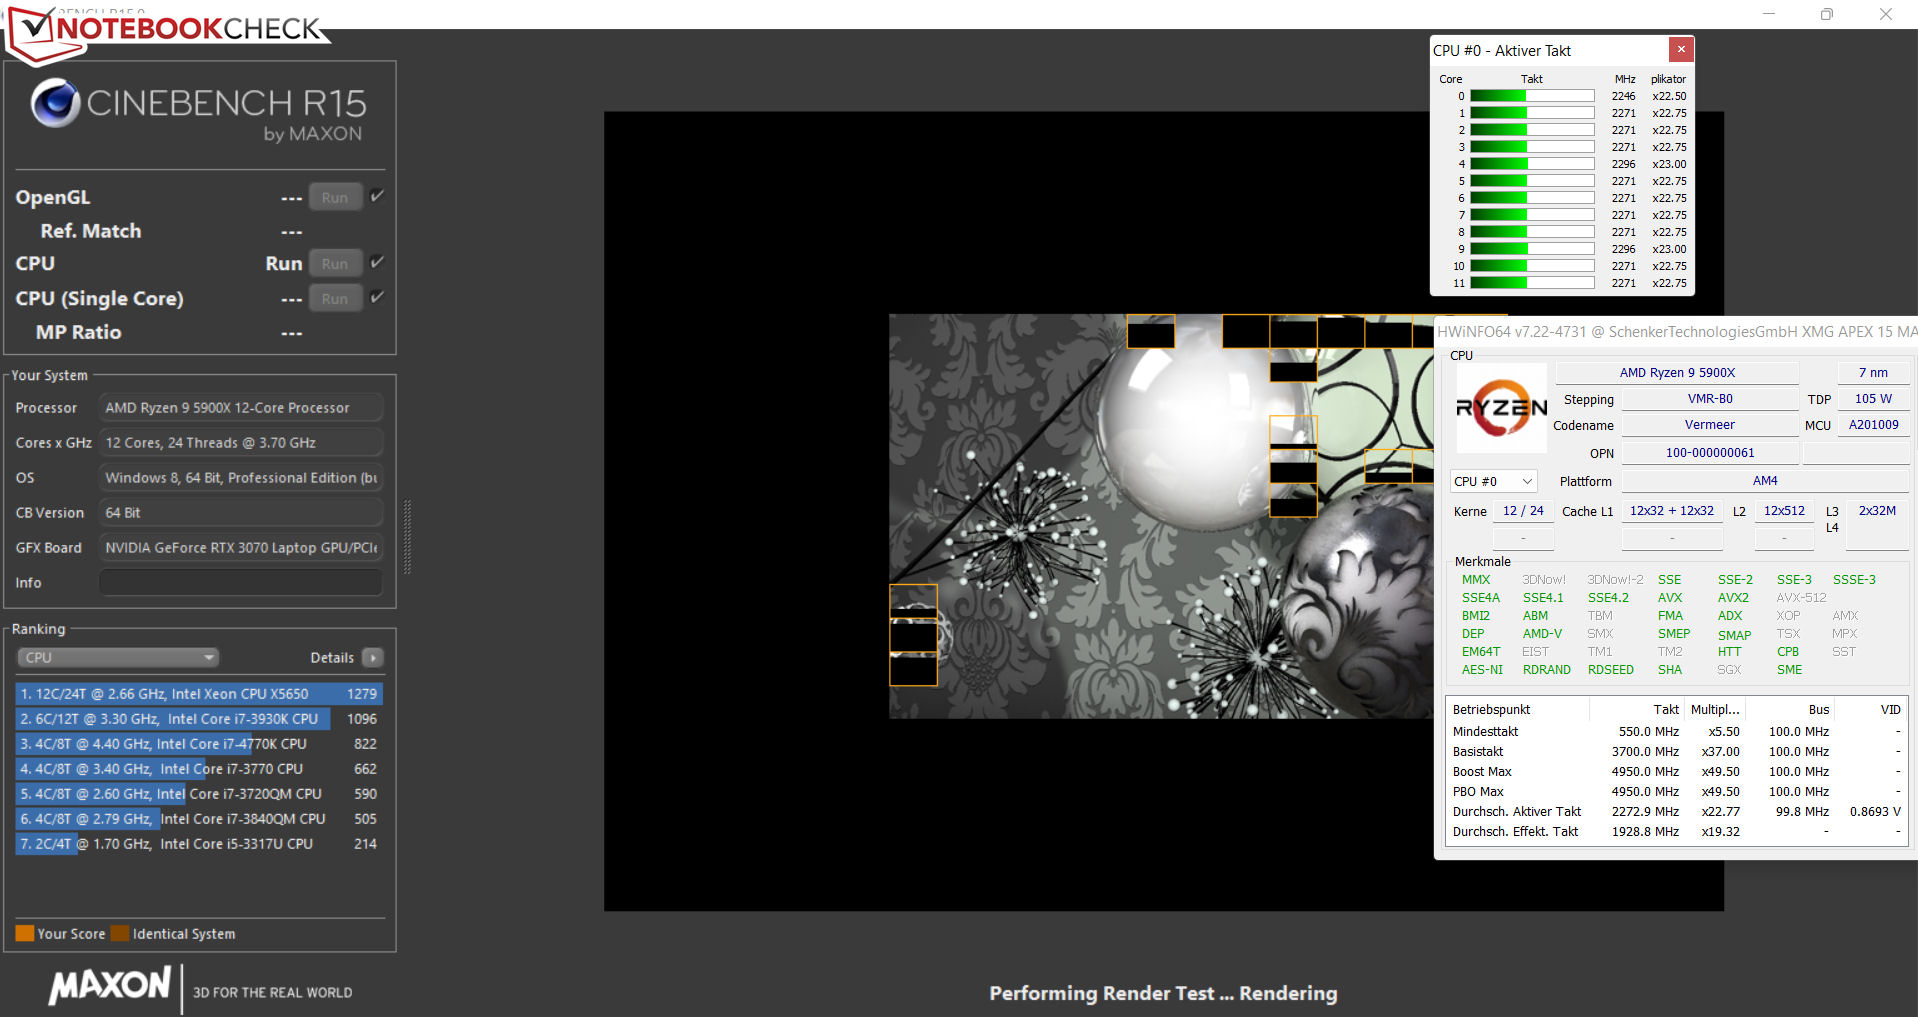
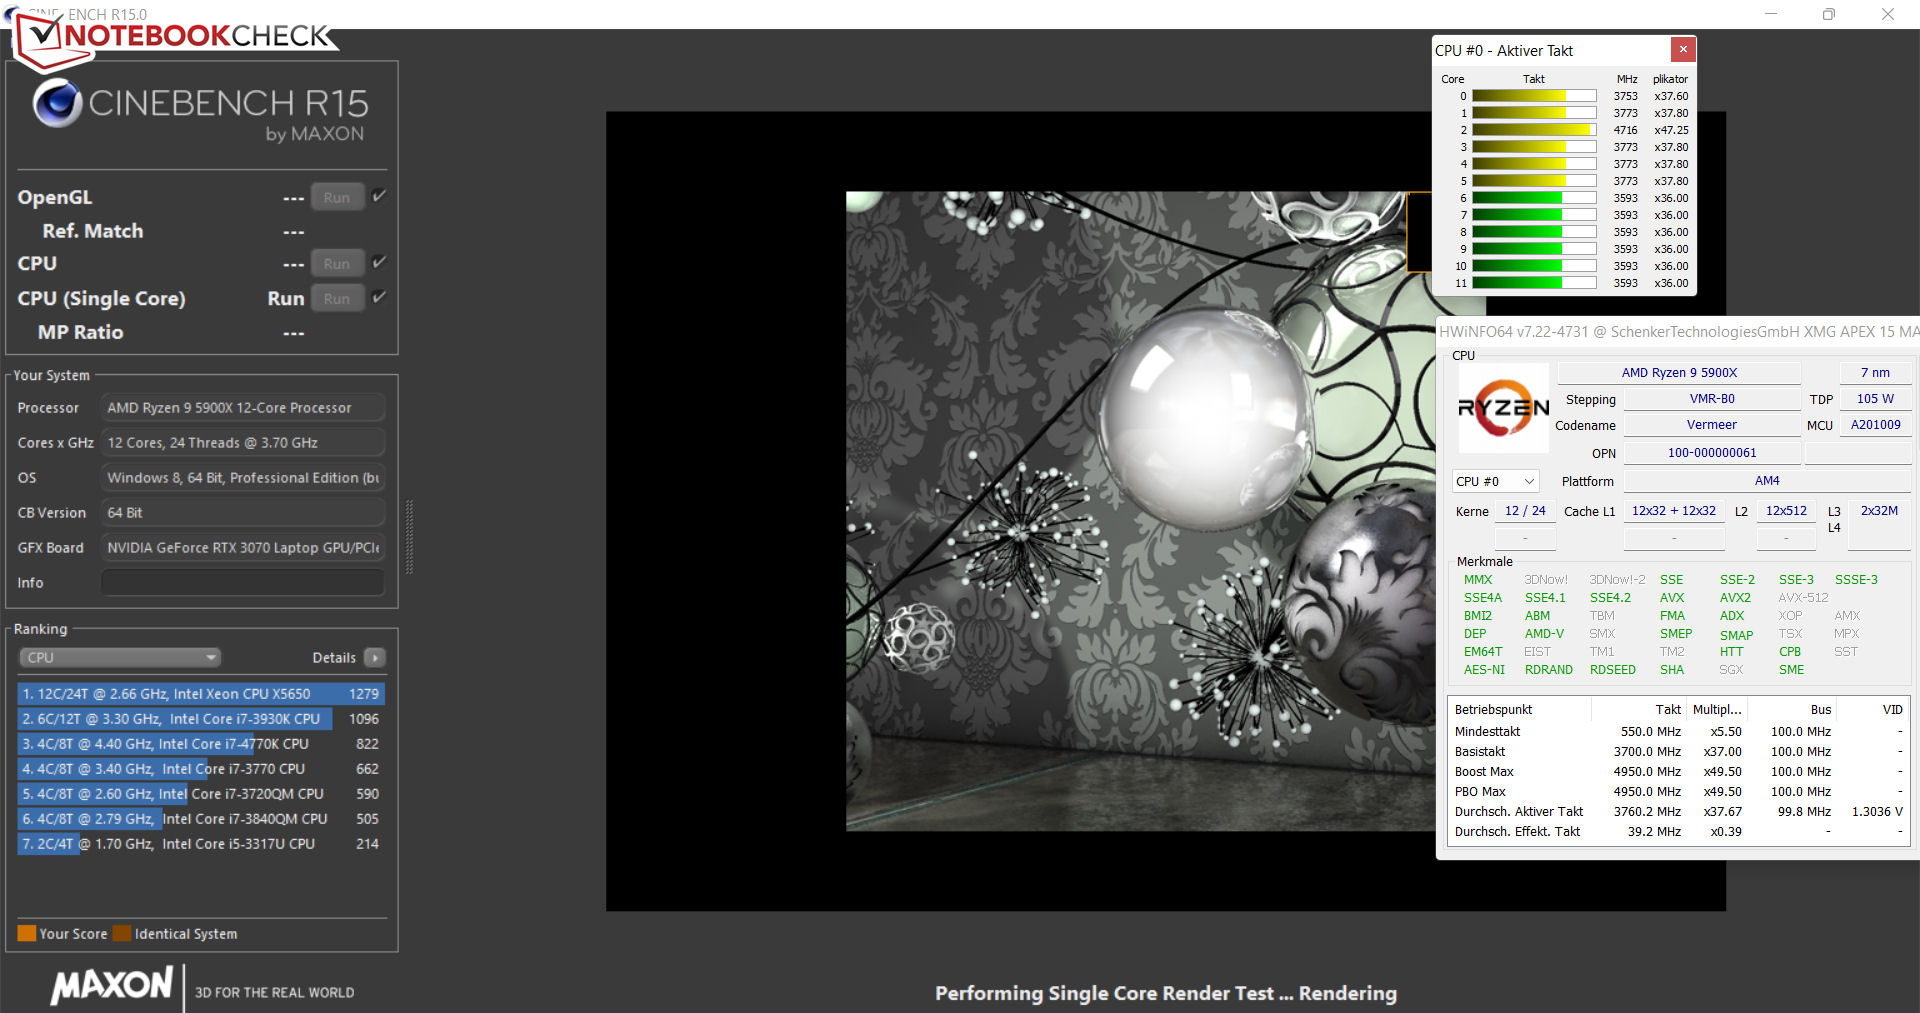
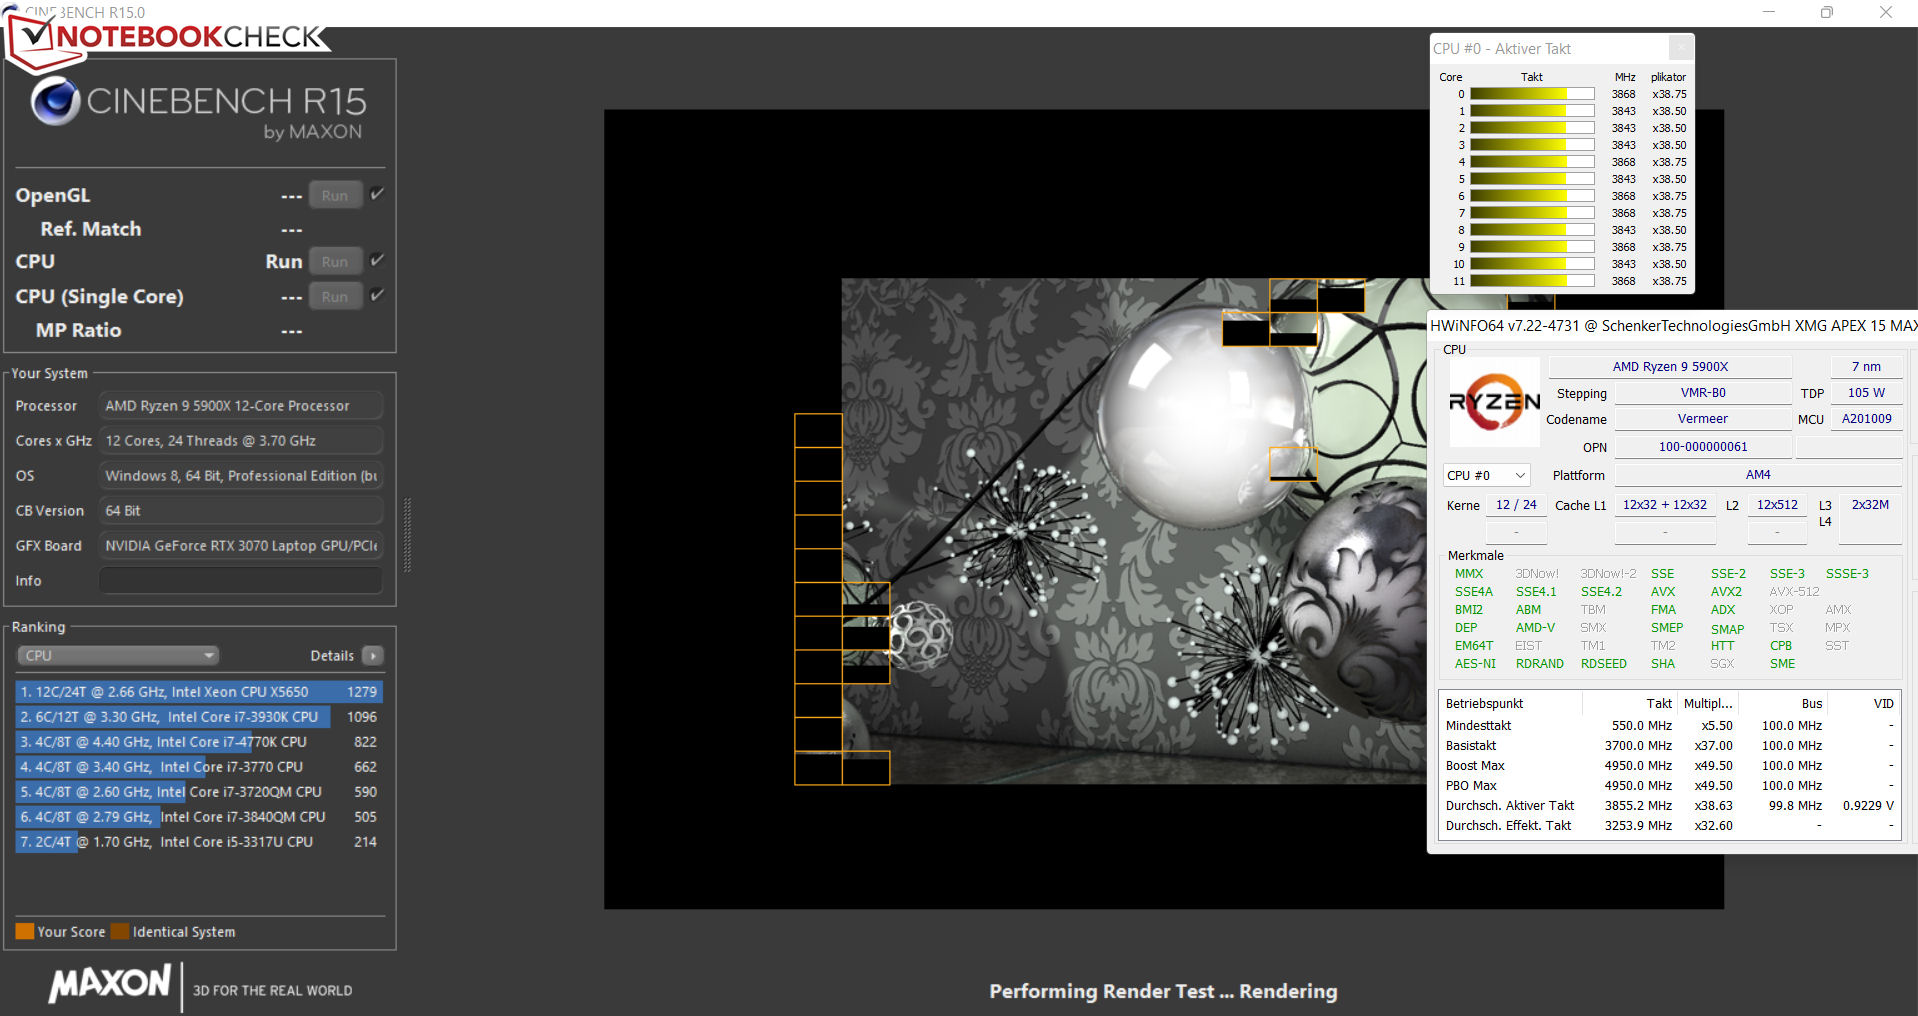
In multi-thread operation, the 5900X CPU remains significantly below its full potential: it only briefly reaches the Turbo speed, if the Performance profile is activated. In single thread operation, the distance between desktop and laptop turns out smaller (see comparison chart). The cooling options of a laptop could simply be insufficient in general to run the desktop CPU at full power.
It is curious that using the same performance settings (Performance mode, max. fan), the Apex performs much better in multi-thread operation than the identically constructed Eurocom Nightsky ARX315, which is also equipped with a Ryzen 9 5900X CPU. Perhaps the optimized, inhouse Schenker BIOS teases more performance from the CPU.
Cinebench R15 Multi Constant Load Test

| CPU Performance rating - Percent | |
| Average of class Gaming | |
| AMD Ryzen 9 5900X | |
| MSI Vector GP66 12UGS | |
| HP Omen 16-b1090ng | |
| Schenker XMG Apex 15 Max | |
| Schenker XMG Apex 15 Max | |
| Eurocom Nightsky ARX315 | |
| Schenker XMG Apex 15 NH57AF1 -2! | |
| Average AMD Ryzen 9 5900X | |
| Gigabyte A5 X1 | |
| Schenker XMG Apex 15 Max | |
| Schenker XMG Apex 15 Max | |
| Schenker XMG Apex 15 Max | |
| Cinebench R23 | |
| Multi Core | |
| Average of class Gaming (10488 - 40970, n=113, last 2 years) | |
| AMD Ryzen 9 5900X | |
| MSI Vector GP66 12UGS | |
| Schenker XMG Apex 15 Max (Leistungsmodus, max. Fan) | |
| Schenker XMG Apex 15 Max (Leistungsmodus) | |
| HP Omen 16-b1090ng | |
| Gigabyte A5 X1 | |
| Eurocom Nightsky ARX315 | |
| Average AMD Ryzen 9 5900X (2435 - 20634, n=7) | |
| Schenker XMG Apex 15 Max | |
| Schenker XMG Apex 15 Max (Stromsparmodus) | |
| Schenker XMG Apex 15 Max (Lautlosmodus) | |
| Single Core | |
| Average of class Gaming (1166 - 2356, n=113, last 2 years) | |
| MSI Vector GP66 12UGS | |
| HP Omen 16-b1090ng | |
| AMD Ryzen 9 5900X | |
| Eurocom Nightsky ARX315 | |
| Schenker XMG Apex 15 Max (Leistungsmodus) | |
| Schenker XMG Apex 15 Max (Leistungsmodus, max. Fan) | |
| Gigabyte A5 X1 | |
| Schenker XMG Apex 15 Max | |
| Average AMD Ryzen 9 5900X (527 - 1568, n=7) | |
| Schenker XMG Apex 15 Max (Lautlosmodus) | |
| Schenker XMG Apex 15 Max (Stromsparmodus) | |
| Cinebench R20 | |
| CPU (Multi Core) | |
| Average of class Gaming (4029 - 16108, n=112, last 2 years) | |
| AMD Ryzen 9 5900X | |
| MSI Vector GP66 12UGS | |
| Schenker XMG Apex 15 Max (Leistungsmodus, max. Fan) | |
| Schenker XMG Apex 15 NH57AF1 | |
| Schenker XMG Apex 15 Max (Leistungsmodus) | |
| HP Omen 16-b1090ng | |
| Gigabyte A5 X1 | |
| Eurocom Nightsky ARX315 | |
| Average AMD Ryzen 9 5900X (930 - 8629, n=7) | |
| Schenker XMG Apex 15 Max | |
| Schenker XMG Apex 15 Max (Stromsparmodus) | |
| Schenker XMG Apex 15 Max (Lautlosmodus) | |
| CPU (Single Core) | |
| Average of class Gaming (442 - 895, n=112, last 2 years) | |
| MSI Vector GP66 12UGS | |
| HP Omen 16-b1090ng | |
| AMD Ryzen 9 5900X | |
| Schenker XMG Apex 15 Max (Leistungsmodus) | |
| Eurocom Nightsky ARX315 | |
| Schenker XMG Apex 15 Max (Leistungsmodus, max. Fan) | |
| Gigabyte A5 X1 | |
| Schenker XMG Apex 15 Max | |
| Average AMD Ryzen 9 5900X (169 - 639, n=7) | |
| Schenker XMG Apex 15 NH57AF1 | |
| Schenker XMG Apex 15 Max (Lautlosmodus) | |
| Schenker XMG Apex 15 Max (Stromsparmodus) | |
| Cinebench R15 | |
| CPU Multi 64Bit | |
| Average of class Gaming (1578 - 6271, n=113, last 2 years) | |
| AMD Ryzen 9 5900X | |
| HP Omen 16-b1090ng | |
| Schenker XMG Apex 15 NH57AF1 | |
| Schenker XMG Apex 15 Max (Leistungsmodus, max. Fan) | |
| Schenker XMG Apex 15 Max (Leistungsmodus) | |
| MSI Vector GP66 12UGS | |
| Eurocom Nightsky ARX315 | |
| Gigabyte A5 X1 | |
| Average AMD Ryzen 9 5900X (400 - 3717, n=7) | |
| Schenker XMG Apex 15 Max (Unterhaltungsmodus) | |
| Schenker XMG Apex 15 Max (Lautlosmodus) | |
| Schenker XMG Apex 15 Max (Stromsparmodus) | |
| CPU Single 64Bit | |
| Average of class Gaming (188.8 - 343, n=112, last 2 years) | |
| MSI Vector GP66 12UGS | |
| AMD Ryzen 9 5900X | |
| HP Omen 16-b1090ng | |
| Schenker XMG Apex 15 Max (Leistungsmodus, max. Fan) | |
| Eurocom Nightsky ARX315 | |
| Schenker XMG Apex 15 Max (Leistungsmodus) | |
| Schenker XMG Apex 15 Max | |
| Gigabyte A5 X1 | |
| Average AMD Ryzen 9 5900X (79.2 - 271, n=7) | |
| Schenker XMG Apex 15 NH57AF1 | |
| Schenker XMG Apex 15 Max (Lautlosmodus) | |
| Schenker XMG Apex 15 Max (Stromsparmodus) | |
| Blender - v2.79 BMW27 CPU | |
| Schenker XMG Apex 15 Max (Stromsparmodus) | |
| Schenker XMG Apex 15 Max (Lautlosmodus) | |
| Schenker XMG Apex 15 Max | |
| Average AMD Ryzen 9 5900X (138 - 1259, n=25) | |
| Gigabyte A5 X1 | |
| Eurocom Nightsky ARX315 | |
| MSI Vector GP66 12UGS | |
| Schenker XMG Apex 15 Max (Leistungsmodus) | |
| Schenker XMG Apex 15 Max (Leistungsmodus, max. Fan) | |
| HP Omen 16-b1090ng | |
| Schenker XMG Apex 15 NH57AF1 | |
| Average of class Gaming (80 - 330, n=110, last 2 years) | |
| AMD Ryzen 9 5900X | |
| 7-Zip 18.03 | |
| 7z b 4 | |
| AMD Ryzen 9 5900X | |
| Average of class Gaming (33491 - 148086, n=111, last 2 years) | |
| Schenker XMG Apex 15 Max (Leistungsmodus, max. Fan) | |
| Schenker XMG Apex 15 Max (Leistungsmodus) | |
| Average AMD Ryzen 9 5900X (11386 - 103095, n=25) | |
| Eurocom Nightsky ARX315 | |
| Schenker XMG Apex 15 NH57AF1 | |
| HP Omen 16-b1090ng | |
| MSI Vector GP66 12UGS | |
| Schenker XMG Apex 15 Max | |
| Gigabyte A5 X1 | |
| Schenker XMG Apex 15 Max (Lautlosmodus) | |
| Schenker XMG Apex 15 Max (Stromsparmodus) | |
| 7z b 4 -mmt1 | |
| AMD Ryzen 9 5900X | |
| Schenker XMG Apex 15 Max (Leistungsmodus, max. Fan) | |
| Eurocom Nightsky ARX315 | |
| Average of class Gaming (4199 - 7436, n=111, last 2 years) | |
| Schenker XMG Apex 15 Max | |
| Schenker XMG Apex 15 Max (Leistungsmodus) | |
| Average AMD Ryzen 9 5900X (2685 - 6930, n=25) | |
| MSI Vector GP66 12UGS | |
| HP Omen 16-b1090ng | |
| Gigabyte A5 X1 | |
| Schenker XMG Apex 15 Max (Lautlosmodus) | |
| Schenker XMG Apex 15 NH57AF1 | |
| Schenker XMG Apex 15 Max (Stromsparmodus) | |
| Geekbench 5.5 | |
| Multi-Core | |
| Average of class Gaming (6460 - 27010, n=111, last 2 years) | |
| HP Omen 16-b1090ng | |
| AMD Ryzen 9 5900X | |
| MSI Vector GP66 12UGS | |
| Schenker XMG Apex 15 Max (Leistungsmodus, max. Fan) | |
| Schenker XMG Apex 15 Max (Leistungsmodus) | |
| Average AMD Ryzen 9 5900X (1946 - 15119, n=27) | |
| Schenker XMG Apex 15 NH57AF1 | |
| Eurocom Nightsky ARX315 | |
| Schenker XMG Apex 15 Max | |
| Gigabyte A5 X1 | |
| Schenker XMG Apex 15 Max (Lautlosmodus) | |
| Schenker XMG Apex 15 Max (Stromsparmodus) | |
| Single-Core | |
| Average of class Gaming (986 - 2474, n=111, last 2 years) | |
| MSI Vector GP66 12UGS | |
| HP Omen 16-b1090ng | |
| AMD Ryzen 9 5900X | |
| Schenker XMG Apex 15 Max (Leistungsmodus) | |
| Schenker XMG Apex 15 Max (Leistungsmodus, max. Fan) | |
| Eurocom Nightsky ARX315 | |
| Schenker XMG Apex 15 Max | |
| Gigabyte A5 X1 | |
| Average AMD Ryzen 9 5900X (158 - 1737, n=27) | |
| Schenker XMG Apex 15 NH57AF1 | |
| Schenker XMG Apex 15 Max (Lautlosmodus) | |
| Schenker XMG Apex 15 Max (Stromsparmodus) | |
| HWBOT x265 Benchmark v2.2 - 4k Preset | |
| Average of class Gaming (11.5 - 44.3, n=111, last 2 years) | |
| AMD Ryzen 9 5900X | |
| Average AMD Ryzen 9 5900X (3 - 27.4, n=24) | |
| Schenker XMG Apex 15 Max (Leistungsmodus, max. Fan) | |
| Schenker XMG Apex 15 Max (Leistungsmodus) | |
| HP Omen 16-b1090ng | |
| MSI Vector GP66 12UGS | |
| Schenker XMG Apex 15 NH57AF1 | |
| Eurocom Nightsky ARX315 | |
| Gigabyte A5 X1 | |
| Schenker XMG Apex 15 Max | |
| Schenker XMG Apex 15 Max (Lautlosmodus) | |
| Schenker XMG Apex 15 Max (Stromsparmodus) | |
| LibreOffice - 20 Documents To PDF | |
| Schenker XMG Apex 15 Max (Stromsparmodus) | |
| Schenker XMG Apex 15 Max (Lautlosmodus) | |
| Gigabyte A5 X1 | |
| Average AMD Ryzen 9 5900X (47.4 - 332, n=25) | |
| Schenker XMG Apex 15 NH57AF1 | |
| Schenker XMG Apex 15 Max | |
| Average of class Gaming (19 - 88.8, n=111, last 2 years) | |
| Schenker XMG Apex 15 Max (Leistungsmodus) | |
| AMD Ryzen 9 5900X | |
| Schenker XMG Apex 15 Max (Leistungsmodus, max. Fan) | |
| Eurocom Nightsky ARX315 | |
| HP Omen 16-b1090ng | |
| MSI Vector GP66 12UGS | |
| R Benchmark 2.5 - Overall mean | |
| Schenker XMG Apex 15 Max (Stromsparmodus) | |
| Schenker XMG Apex 15 Max (Lautlosmodus) | |
| Average AMD Ryzen 9 5900X (0.4457 - 4.47, n=25) | |
| Schenker XMG Apex 15 NH57AF1 | |
| Schenker XMG Apex 15 Max | |
| Gigabyte A5 X1 | |
| Eurocom Nightsky ARX315 | |
| Schenker XMG Apex 15 Max (Leistungsmodus, max. Fan) | |
| Schenker XMG Apex 15 Max (Leistungsmodus) | |
| AMD Ryzen 9 5900X | |
| HP Omen 16-b1090ng | |
| Average of class Gaming (0.3439 - 0.759, n=112, last 2 years) | |
| MSI Vector GP66 12UGS | |
* ... smaller is better
AIDA64: FP32 Ray-Trace | FPU Julia | CPU SHA3 | CPU Queen | FPU SinJulia | FPU Mandel | CPU AES | CPU ZLib | FP64 Ray-Trace | CPU PhotoWorxx
| Performance rating | |
| Average of class Gaming | |
| AMD Ryzen 9 5900X | |
| Schenker XMG Apex 15 Max | |
| Schenker XMG Apex 15 Max | |
| Average AMD Ryzen 9 5900X | |
| Schenker XMG Apex 15 NH57AF1 | |
| Eurocom Nightsky ARX315 | |
| Gigabyte A5 X1 | |
| Schenker XMG Apex 15 Max | |
| MSI Vector GP66 12UGS | |
| HP Omen 16-b1090ng | |
| Schenker XMG Apex 15 Max | |
| Schenker XMG Apex 15 Max | |
| AIDA64 / FP32 Ray-Trace | |
| Average of class Gaming (10227 - 85542, n=110, last 2 years) | |
| AMD Ryzen 9 5900X (v6.25.5400) | |
| Average AMD Ryzen 9 5900X (3069 - 24659, n=15) | |
| Schenker XMG Apex 15 Max (v6.50.5800, Leistungsmodus, max. Fan) | |
| Schenker XMG Apex 15 NH57AF1 | |
| Schenker XMG Apex 15 Max (v6.50.5800, Leistungsmodus) | |
| Gigabyte A5 X1 (v6.50.5800) | |
| Eurocom Nightsky ARX315 (v6.50.5800) | |
| Schenker XMG Apex 15 Max (v6.50.5800) | |
| MSI Vector GP66 12UGS (v6.50.5800) | |
| HP Omen 16-b1090ng (v6.50.5800) | |
| Schenker XMG Apex 15 Max (v6.50.5800, Lautlosmodus) | |
| Schenker XMG Apex 15 Max (v6.50.5800, Stromsparmodus) | |
| AIDA64 / FPU Julia | |
| Average of class Gaming (51376 - 238426, n=110, last 2 years) | |
| Schenker XMG Apex 15 Max (v6.50.5800, Leistungsmodus, max. Fan) | |
| AMD Ryzen 9 5900X (v6.25.5400) | |
| Schenker XMG Apex 15 Max (v6.50.5800, Leistungsmodus) | |
| Average AMD Ryzen 9 5900X (18567 - 155529, n=15) | |
| Schenker XMG Apex 15 NH57AF1 | |
| Gigabyte A5 X1 (v6.50.5800) | |
| Eurocom Nightsky ARX315 (v6.50.5800) | |
| Schenker XMG Apex 15 Max (v6.50.5800) | |
| MSI Vector GP66 12UGS (v6.50.5800) | |
| HP Omen 16-b1090ng (v6.50.5800) | |
| Schenker XMG Apex 15 Max (v6.50.5800, Stromsparmodus) | |
| Schenker XMG Apex 15 Max (v6.50.5800, Lautlosmodus) | |
| AIDA64 / CPU SHA3 | |
| Average of class Gaming (2180 - 9817, n=110, last 2 years) | |
| Schenker XMG Apex 15 Max (v6.50.5800, Leistungsmodus, max. Fan) | |
| Schenker XMG Apex 15 Max (v6.50.5800, Leistungsmodus) | |
| Average AMD Ryzen 9 5900X (629 - 5329, n=15) | |
| AMD Ryzen 9 5900X (v6.25.5400) | |
| Gigabyte A5 X1 (v6.50.5800) | |
| Schenker XMG Apex 15 NH57AF1 | |
| Eurocom Nightsky ARX315 (v6.50.5800) | |
| MSI Vector GP66 12UGS (v6.50.5800) | |
| HP Omen 16-b1090ng (v6.50.5800) | |
| Schenker XMG Apex 15 Max | |
| Schenker XMG Apex 15 Max (v6.50.5800, Lautlosmodus) | |
| Schenker XMG Apex 15 Max (v6.50.5800, Stromsparmodus) | |
| AIDA64 / CPU Queen | |
| AMD Ryzen 9 5900X (v6.25.5400) | |
| Schenker XMG Apex 15 NH57AF1 | |
| Schenker XMG Apex 15 Max (v6.50.5800, Leistungsmodus, max. Fan) | |
| Eurocom Nightsky ARX315 (v6.50.5800) | |
| Average of class Gaming (49785 - 173351, n=101, last 2 years) | |
| Average AMD Ryzen 9 5900X (15371 - 138889, n=15) | |
| Schenker XMG Apex 15 Max (v6.50.5800, Leistungsmodus) | |
| MSI Vector GP66 12UGS (v6.50.5800) | |
| Gigabyte A5 X1 (v6.50.5800) | |
| HP Omen 16-b1090ng (v6.50.5800) | |
| Schenker XMG Apex 15 Max (v6.50.5800) | |
| Schenker XMG Apex 15 Max (v6.50.5800, Lautlosmodus) | |
| Schenker XMG Apex 15 Max (v6.50.5800, Stromsparmodus) | |
| AIDA64 / FPU SinJulia | |
| Schenker XMG Apex 15 NH57AF1 | |
| AMD Ryzen 9 5900X (v6.25.5400) | |
| Eurocom Nightsky ARX315 (v6.50.5800) | |
| Schenker XMG Apex 15 Max (v6.50.5800, Leistungsmodus, max. Fan) | |
| Schenker XMG Apex 15 Max (v6.50.5800, Leistungsmodus) | |
| Average AMD Ryzen 9 5900X (2137 - 19465, n=15) | |
| Schenker XMG Apex 15 Max (v6.50.5800) | |
| Average of class Gaming (4424 - 33636, n=110, last 2 years) | |
| Gigabyte A5 X1 (v6.50.5800) | |
| MSI Vector GP66 12UGS (v6.50.5800) | |
| HP Omen 16-b1090ng (v6.50.5800) | |
| Schenker XMG Apex 15 Max (v6.50.5800, Stromsparmodus) | |
| Schenker XMG Apex 15 Max (v6.50.5800, Lautlosmodus) | |
| AIDA64 / FPU Mandel | |
| Average of class Gaming (25115 - 128721, n=110, last 2 years) | |
| Schenker XMG Apex 15 Max (v6.50.5800, Leistungsmodus, max. Fan) | |
| AMD Ryzen 9 5900X (v6.25.5400) | |
| Schenker XMG Apex 15 Max (v6.50.5800, Leistungsmodus) | |
| Average AMD Ryzen 9 5900X (10291 - 85469, n=15) | |
| Gigabyte A5 X1 (v6.50.5800) | |
| Schenker XMG Apex 15 NH57AF1 | |
| Eurocom Nightsky ARX315 (v6.50.5800) | |
| Schenker XMG Apex 15 Max | |
| MSI Vector GP66 12UGS (v6.50.5800) | |
| HP Omen 16-b1090ng (v6.50.5800) | |
| Schenker XMG Apex 15 Max (v6.50.5800, Lautlosmodus) | |
| Schenker XMG Apex 15 Max (v6.50.5800, Stromsparmodus) | |
| AIDA64 / CPU AES | |
| Schenker XMG Apex 15 Max (v6.50.5800, Leistungsmodus, max. Fan) | |
| Schenker XMG Apex 15 Max (v6.50.5800, Leistungsmodus) | |
| Average AMD Ryzen 9 5900X (24327 - 212390, n=15) | |
| Eurocom Nightsky ARX315 (v6.50.5800) | |
| Gigabyte A5 X1 (v6.50.5800) | |
| AMD Ryzen 9 5900X (v6.25.5400) | |
| Schenker XMG Apex 15 Max (v6.50.5800) | |
| Average of class Gaming (39258 - 247074, n=110, last 2 years) | |
| Schenker XMG Apex 15 NH57AF1 | |
| MSI Vector GP66 12UGS (v6.50.5800) | |
| HP Omen 16-b1090ng (v6.50.5800) | |
| Schenker XMG Apex 15 Max (v6.50.5800, Stromsparmodus) | |
| Schenker XMG Apex 15 Max (v6.50.5800, Lautlosmodus) | |
| AIDA64 / CPU ZLib | |
| Average of class Gaming (574 - 2531, n=110, last 2 years) | |
| AMD Ryzen 9 5900X (v6.25.5400) | |
| Schenker XMG Apex 15 NH57AF1 | |
| MSI Vector GP66 12UGS (v6.50.5800) | |
| Average AMD Ryzen 9 5900X (150.9 - 1345, n=15) | |
| Schenker XMG Apex 15 Max (v6.50.5800, Leistungsmodus, max. Fan) | |
| Schenker XMG Apex 15 Max (v6.50.5800, Leistungsmodus) | |
| HP Omen 16-b1090ng (v6.50.5800) | |
| Eurocom Nightsky ARX315 (v6.50.5800) | |
| Gigabyte A5 X1 (v6.50.5800) | |
| Schenker XMG Apex 15 Max (v6.50.5800) | |
| Schenker XMG Apex 15 Max (v6.50.5800, Stromsparmodus) | |
| Schenker XMG Apex 15 Max (v6.50.5800, Lautlosmodus) | |
| AIDA64 / FP64 Ray-Trace | |
| Average of class Gaming (5509 - 45446, n=110, last 2 years) | |
| AMD Ryzen 9 5900X (v6.25.5400) | |
| Average AMD Ryzen 9 5900X (1518 - 13196, n=15) | |
| Schenker XMG Apex 15 Max (v6.50.5800, Leistungsmodus, max. Fan) | |
| Schenker XMG Apex 15 NH57AF1 | |
| Schenker XMG Apex 15 Max (v6.50.5800, Leistungsmodus) | |
| Gigabyte A5 X1 (v6.50.5800) | |
| Eurocom Nightsky ARX315 (v6.50.5800) | |
| Schenker XMG Apex 15 Max (v6.50.5800) | |
| MSI Vector GP66 12UGS (v6.50.5800) | |
| HP Omen 16-b1090ng (v6.50.5800) | |
| Schenker XMG Apex 15 Max (v6.50.5800, Stromsparmodus) | |
| Schenker XMG Apex 15 Max (v6.50.5800, Lautlosmodus) | |
| AIDA64 / CPU PhotoWorxx | |
| Average of class Gaming (12271 - 89891, n=110, last 2 years) | |
| HP Omen 16-b1090ng (v6.50.5800) | |
| Schenker XMG Apex 15 Max (v6.50.5800, Leistungsmodus) | |
| Schenker XMG Apex 15 Max (v6.50.5800, Leistungsmodus, max. Fan) | |
| Schenker XMG Apex 15 Max (v6.50.5800) | |
| MSI Vector GP66 12UGS (v6.50.5800) | |
| Average AMD Ryzen 9 5900X (11451 - 32849, n=15) | |
| Eurocom Nightsky ARX315 (v6.50.5800) | |
| Schenker XMG Apex 15 NH57AF1 | |
| AMD Ryzen 9 5900X (v6.25.5400) | |
| Gigabyte A5 X1 (v6.50.5800) | |
| Schenker XMG Apex 15 Max (v6.50.5800, Stromsparmodus) | |
| Schenker XMG Apex 15 Max (v6.50.5800, Lautlosmodus) | |
System Performance
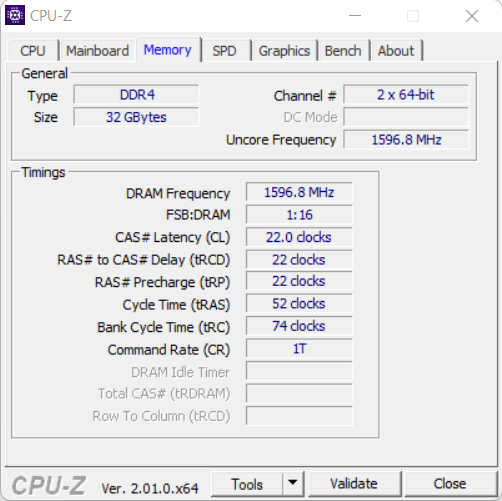
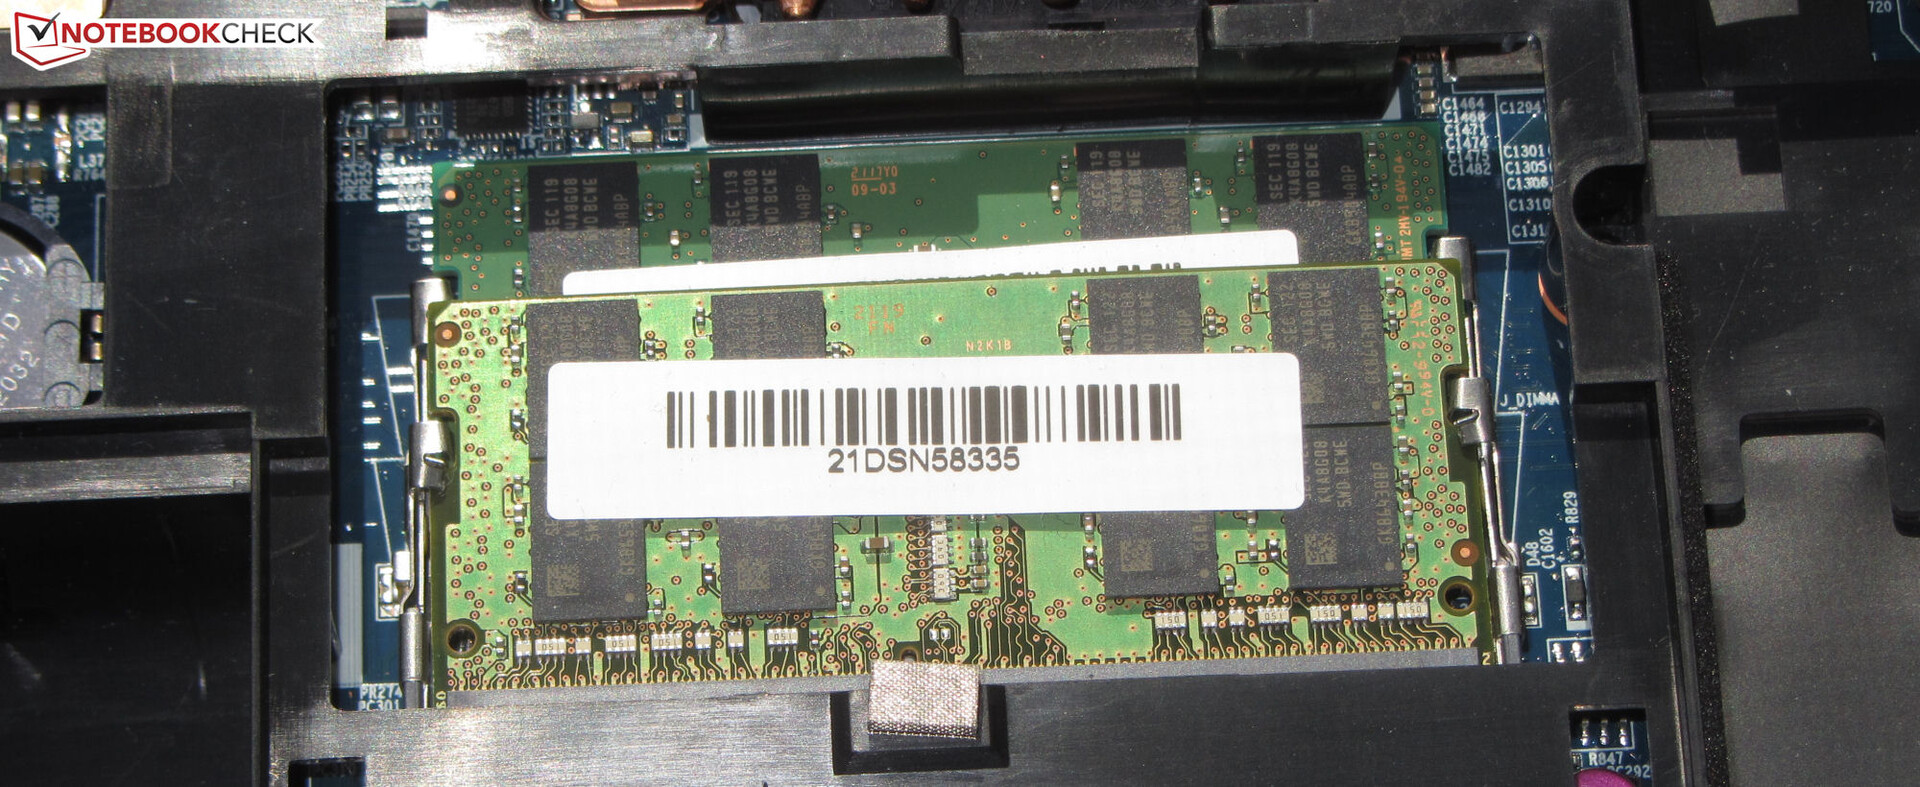
The laptop is able to master application scenarios that demand a lot of performance without any trouble, which is also confirmed by the very good PC-Mark results. The transfer rates of the built-in working memory range at a normal level for DDR4 3200 storage.
As long as the Performance or Entertainment mode are selected, the system runs quickly and smoothly. If you use the other two profiles, the system tends to suffer from a certain sluggishness, since the computing performance is throttled significantly.
CrossMark: Overall | Productivity | Creativity | Responsiveness
| PCMark 10 / Score | |
| Average of class Gaming (5828 - 11574, n=96, last 2 years) | |
| MSI Vector GP66 12UGS | |
| Schenker XMG Apex 15 Max (Leistungsmodus) | |
| Average AMD Ryzen 9 5900X, NVIDIA GeForce RTX 3070 Laptop GPU (7087 - 7688, n=3) | |
| HP Omen 16-b1090ng | |
| Eurocom Nightsky ARX315 | |
| Schenker XMG Apex 15 Max | |
| Schenker XMG Apex 15 NH57AF1 | |
| Gigabyte A5 X1 | |
| PCMark 10 / Essentials | |
| MSI Vector GP66 12UGS | |
| Average of class Gaming (8810 - 12600, n=100, last 2 years) | |
| Eurocom Nightsky ARX315 | |
| Schenker XMG Apex 15 NH57AF1 | |
| Average AMD Ryzen 9 5900X, NVIDIA GeForce RTX 3070 Laptop GPU (10286 - 10613, n=3) | |
| Schenker XMG Apex 15 Max (Leistungsmodus) | |
| Schenker XMG Apex 15 Max | |
| HP Omen 16-b1090ng | |
| Gigabyte A5 X1 | |
| PCMark 10 / Productivity | |
| Average of class Gaming (6845 - 18766, n=98, last 2 years) | |
| MSI Vector GP66 12UGS | |
| Schenker XMG Apex 15 Max (Leistungsmodus) | |
| HP Omen 16-b1090ng | |
| Average AMD Ryzen 9 5900X, NVIDIA GeForce RTX 3070 Laptop GPU (9042 - 9959, n=3) | |
| Eurocom Nightsky ARX315 | |
| Gigabyte A5 X1 | |
| Schenker XMG Apex 15 Max | |
| Schenker XMG Apex 15 NH57AF1 | |
| PCMark 10 / Digital Content Creation | |
| Average of class Gaming (7602 - 19657, n=98, last 2 years) | |
| MSI Vector GP66 12UGS | |
| Schenker XMG Apex 15 Max (Leistungsmodus) | |
| Average AMD Ryzen 9 5900X, NVIDIA GeForce RTX 3070 Laptop GPU (10387 - 11892, n=3) | |
| HP Omen 16-b1090ng | |
| Eurocom Nightsky ARX315 | |
| Schenker XMG Apex 15 Max | |
| Schenker XMG Apex 15 NH57AF1 | |
| Gigabyte A5 X1 | |
| CrossMark / Overall | |
| Average of class Gaming (1366 - 2409, n=98, last 2 years) | |
| Schenker XMG Apex 15 Max | |
| Average AMD Ryzen 9 5900X, NVIDIA GeForce RTX 3070 Laptop GPU (n=1) | |
| CrossMark / Productivity | |
| Average of class Gaming (1386 - 2254, n=98, last 2 years) | |
| Schenker XMG Apex 15 Max | |
| Average AMD Ryzen 9 5900X, NVIDIA GeForce RTX 3070 Laptop GPU (n=1) | |
| CrossMark / Creativity | |
| Average of class Gaming (1343 - 2729, n=98, last 2 years) | |
| Schenker XMG Apex 15 Max | |
| Average AMD Ryzen 9 5900X, NVIDIA GeForce RTX 3070 Laptop GPU (n=1) | |
| CrossMark / Responsiveness | |
| Average of class Gaming (1226 - 2334, n=98, last 2 years) | |
| Schenker XMG Apex 15 Max | |
| Average AMD Ryzen 9 5900X, NVIDIA GeForce RTX 3070 Laptop GPU (n=1) | |
| PCMark 8 Home Score Accelerated v2 | 5278 points | |
| PCMark 8 Creative Score Accelerated v2 | 6049 points | |
| PCMark 8 Work Score Accelerated v2 | 6196 points | |
| PCMark 10 Score | 7087 points | |
Help | ||
| AIDA64 / Memory Copy | |
| Average of class Gaming (21750 - 129946, n=110, last 2 years) | |
| HP Omen 16-b1090ng | |
| Average AMD Ryzen 9 5900X (31315 - 72008, n=15) | |
| Schenker XMG Apex 15 NH57AF1 | |
| Schenker XMG Apex 15 Max | |
| MSI Vector GP66 12UGS | |
| Gigabyte A5 X1 | |
| Eurocom Nightsky ARX315 | |
| AIDA64 / Memory Read | |
| Average of class Gaming (22956 - 118858, n=110, last 2 years) | |
| HP Omen 16-b1090ng | |
| Average AMD Ryzen 9 5900X (32972 - 70692, n=15) | |
| MSI Vector GP66 12UGS | |
| Schenker XMG Apex 15 Max | |
| Schenker XMG Apex 15 NH57AF1 | |
| Gigabyte A5 X1 | |
| Eurocom Nightsky ARX315 | |
| AIDA64 / Memory Write | |
| Average of class Gaming (22297 - 135096, n=110, last 2 years) | |
| HP Omen 16-b1090ng | |
| Average AMD Ryzen 9 5900X (21619 - 57070, n=15) | |
| Schenker XMG Apex 15 Max | |
| MSI Vector GP66 12UGS | |
| Schenker XMG Apex 15 NH57AF1 | |
| Eurocom Nightsky ARX315 | |
| Gigabyte A5 X1 | |
| AIDA64 / Memory Latency | |
| Average of class Gaming (75.3 - 259, n=110, last 2 years) | |
| MSI Vector GP66 12UGS | |
| HP Omen 16-b1090ng | |
| Schenker XMG Apex 15 NH57AF1 | |
| Gigabyte A5 X1 | |
| Average AMD Ryzen 9 5900X (58.4 - 107.6, n=15) | |
| Schenker XMG Apex 15 Max | |
| Eurocom Nightsky ARX315 | |
* ... smaller is better
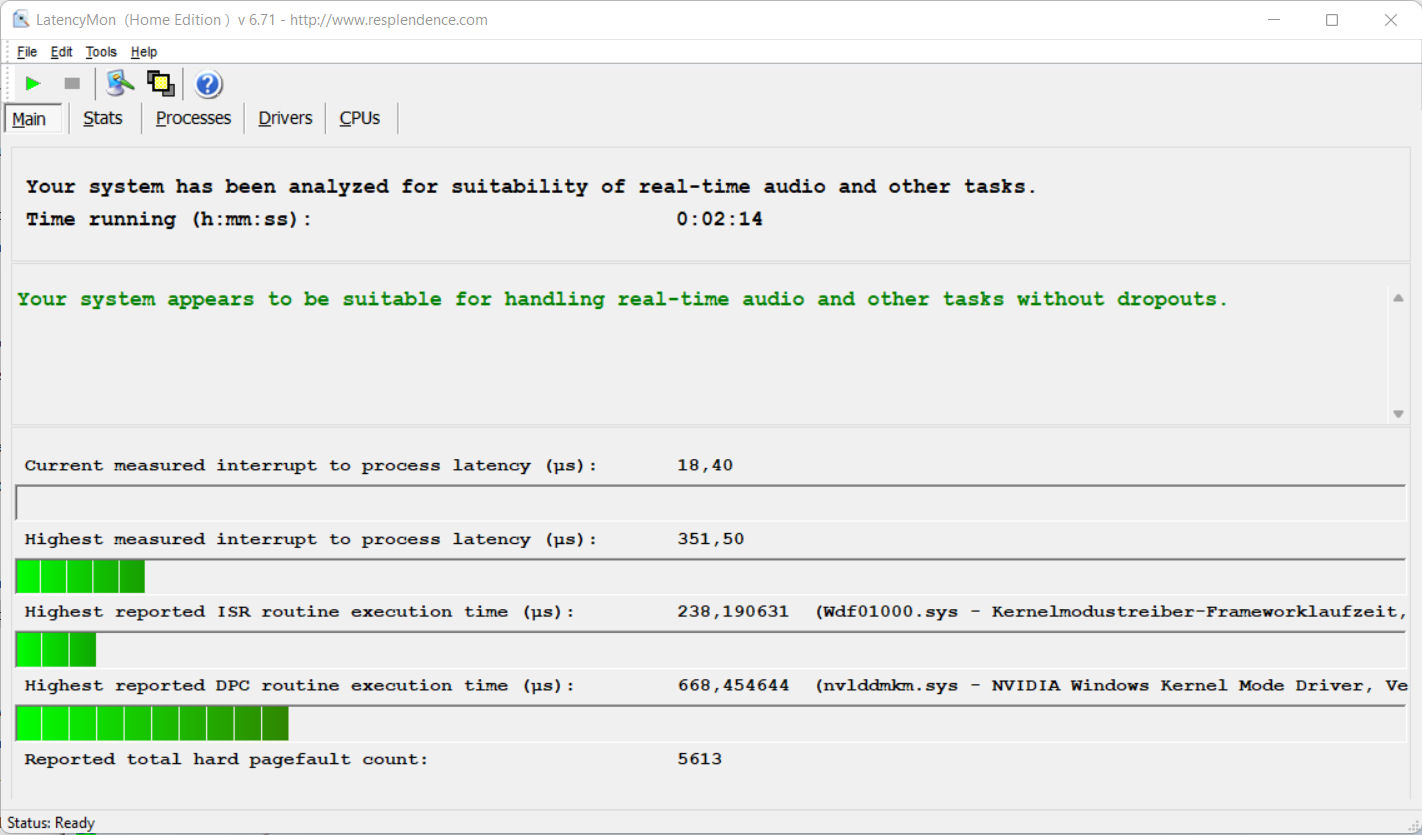
DPC Latencies
The standardized Latency Monitor test (web surfing, 4k video reproduction, Prime95 high load) does not reveal anything conspicuous in the DPC latencies. The system appears to be suitable for real-time video and audio processing. Future software updates might lead to improvements or even make things worse.
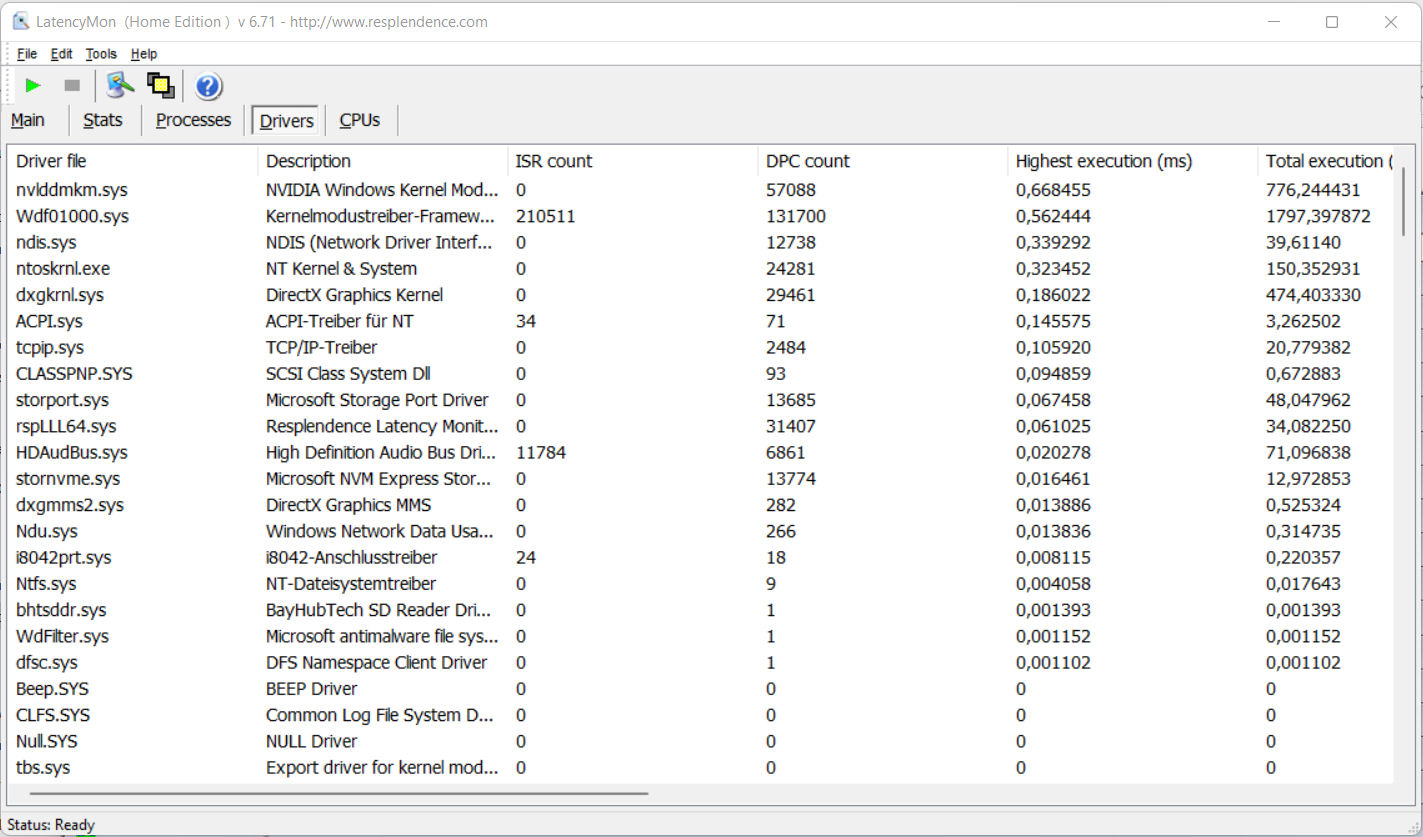
| DPC Latencies / LatencyMon - interrupt to process latency (max), Web, Youtube, Prime95 | |
| MSI Vector GP66 12UGS | |
| Schenker XMG Apex 15 NH57AF1 | |
| HP Omen 16-b1090ng | |
| Gigabyte A5 X1 | |
| Eurocom Nightsky ARX315 | |
| Schenker XMG Apex 15 Max | |
* ... smaller is better
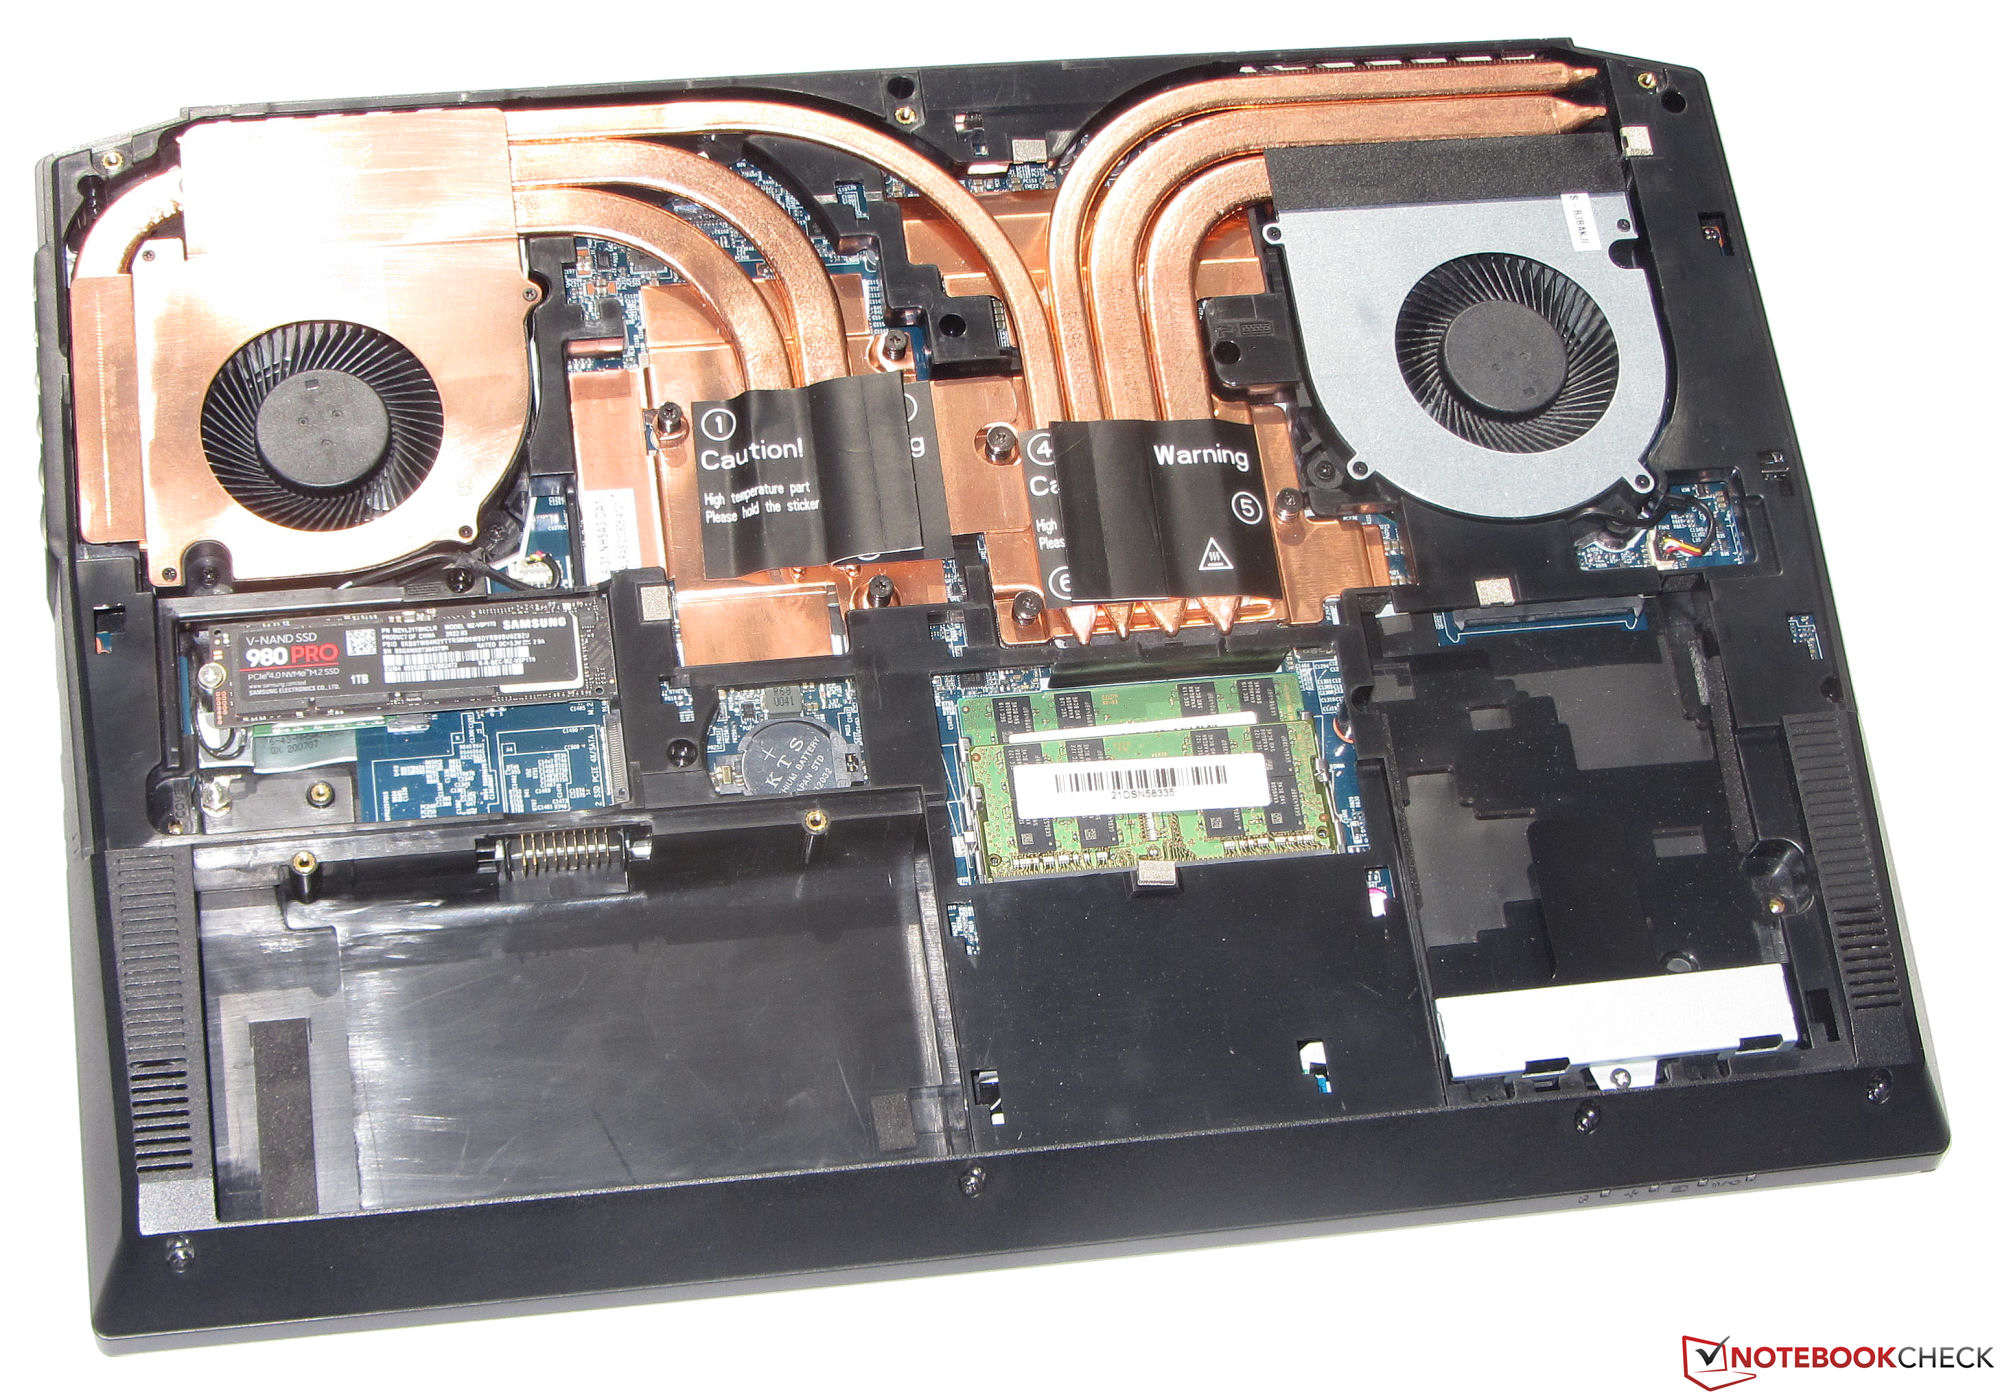
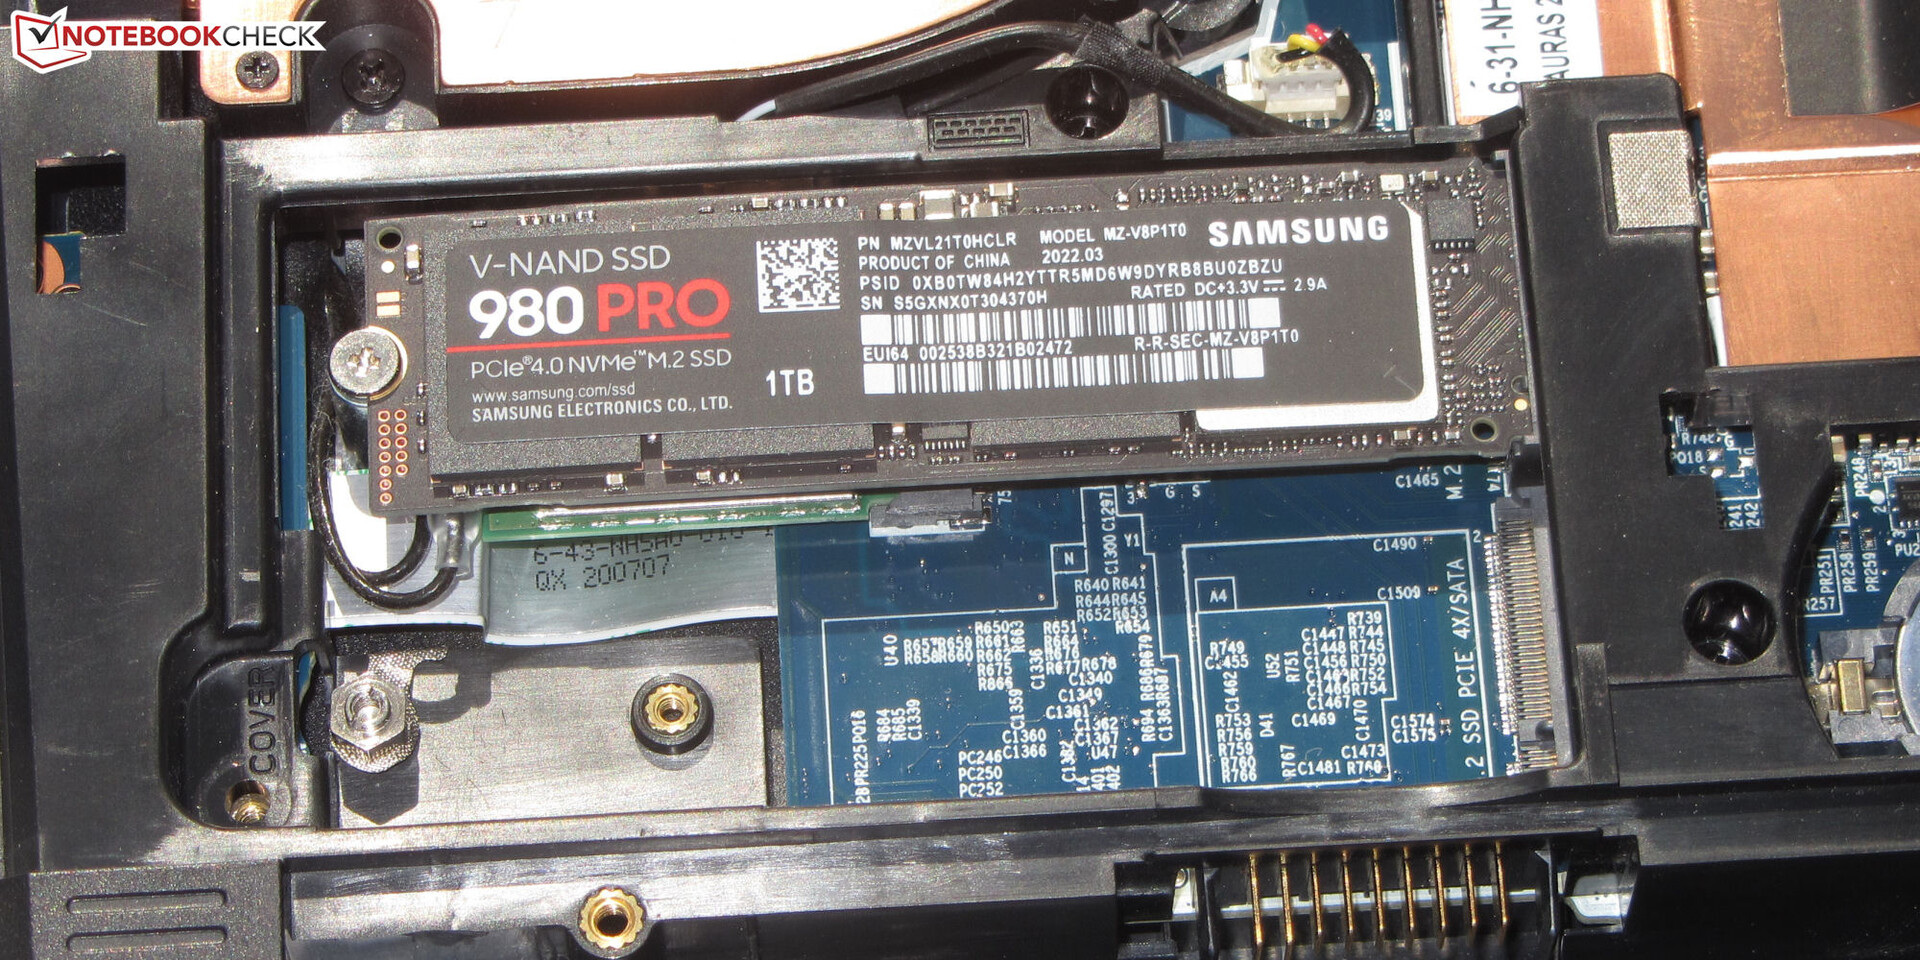
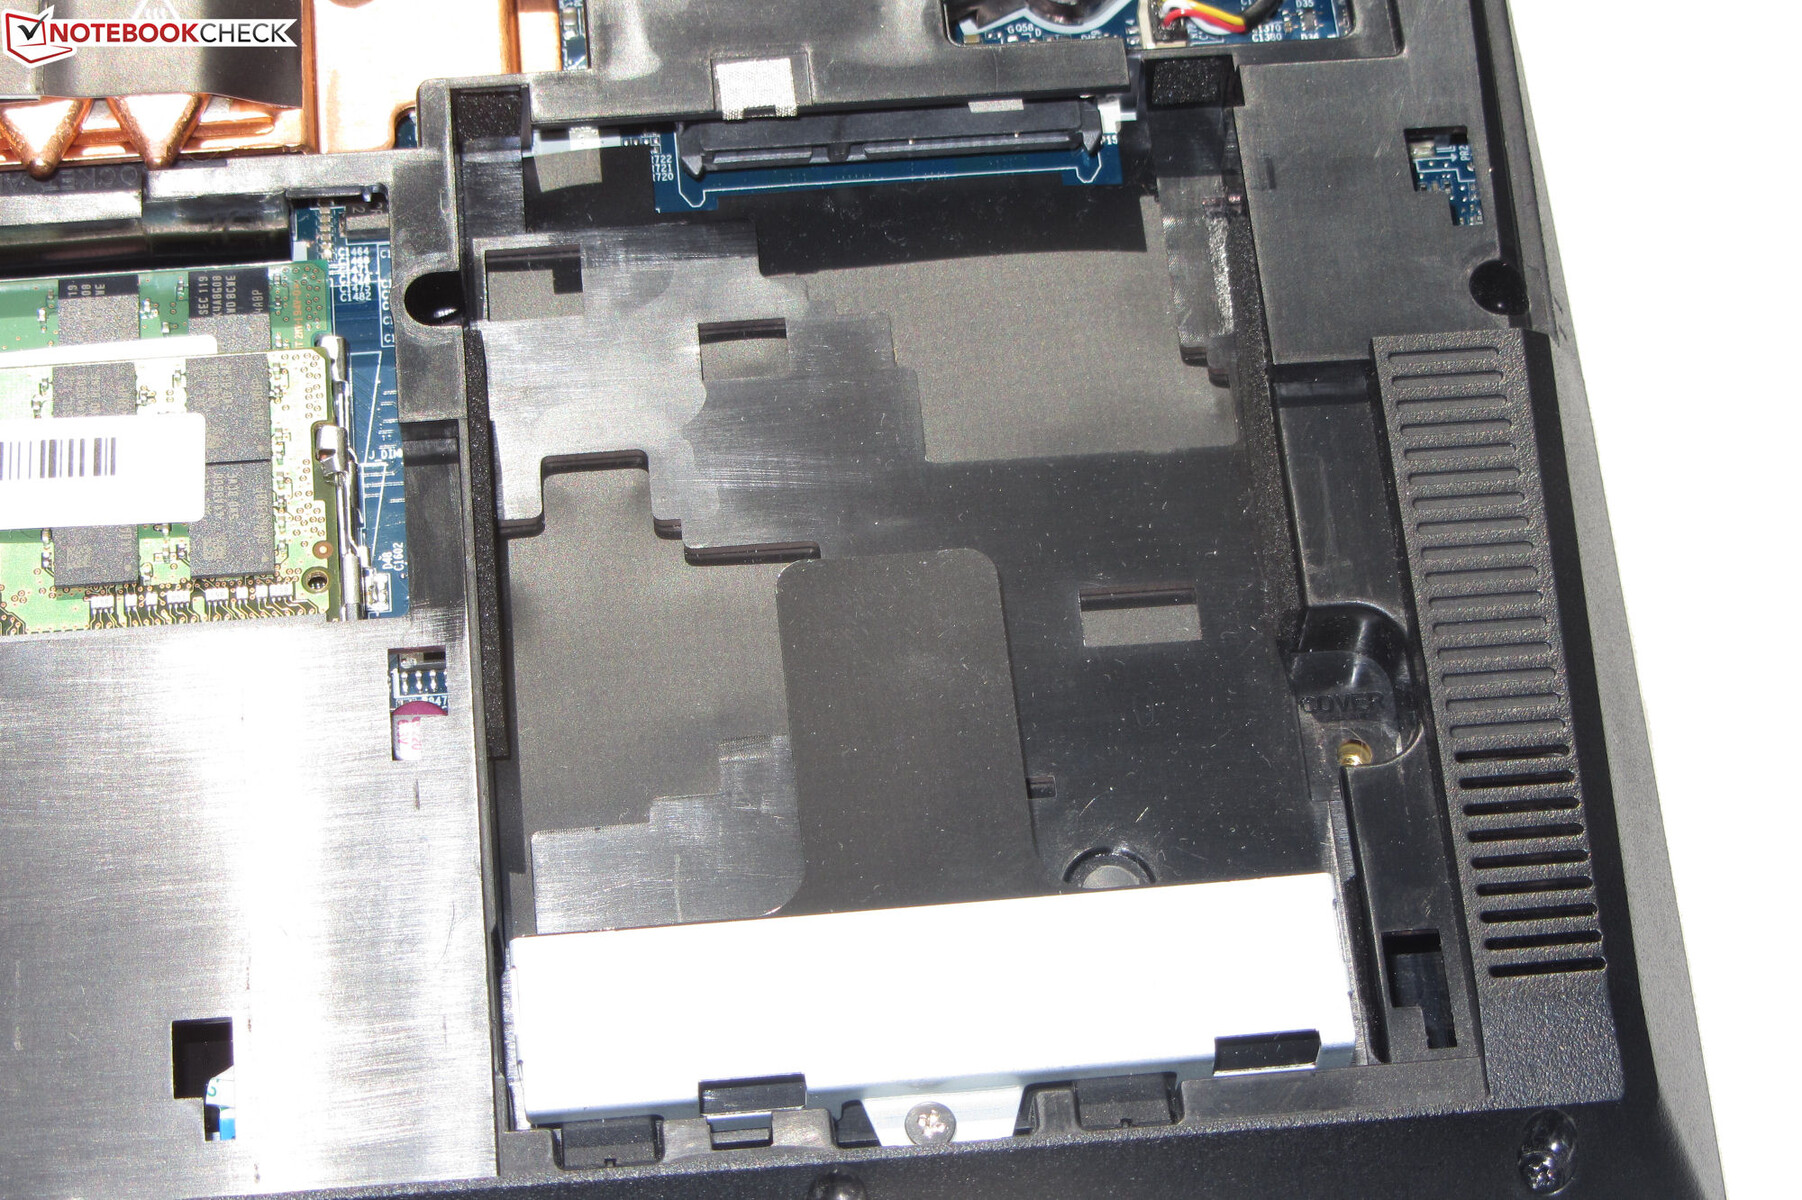
Storage Solution
A 1-TB SSD (PCIe 4, M.2-2280) from Samsung, which delivers excellent transfer rates, is used as the system drive. The laptop also offers additional space for a second SSD (PCIe 3) and a 2.5-inch storage medium.

* ... smaller is better
Constant Performance Reading: DiskSpd Read Loop, Queue Depth 8
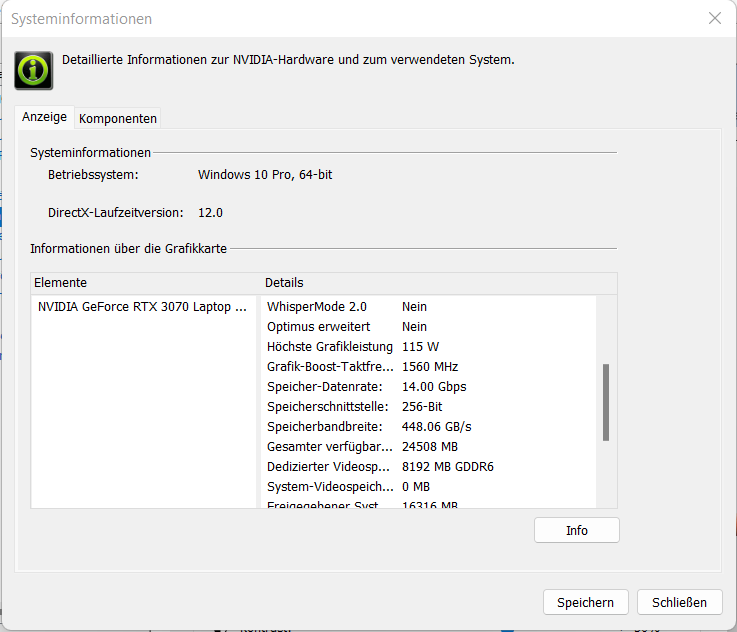
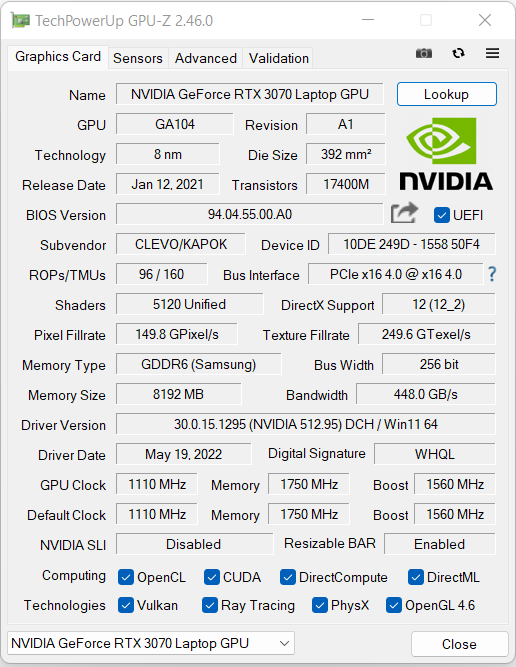
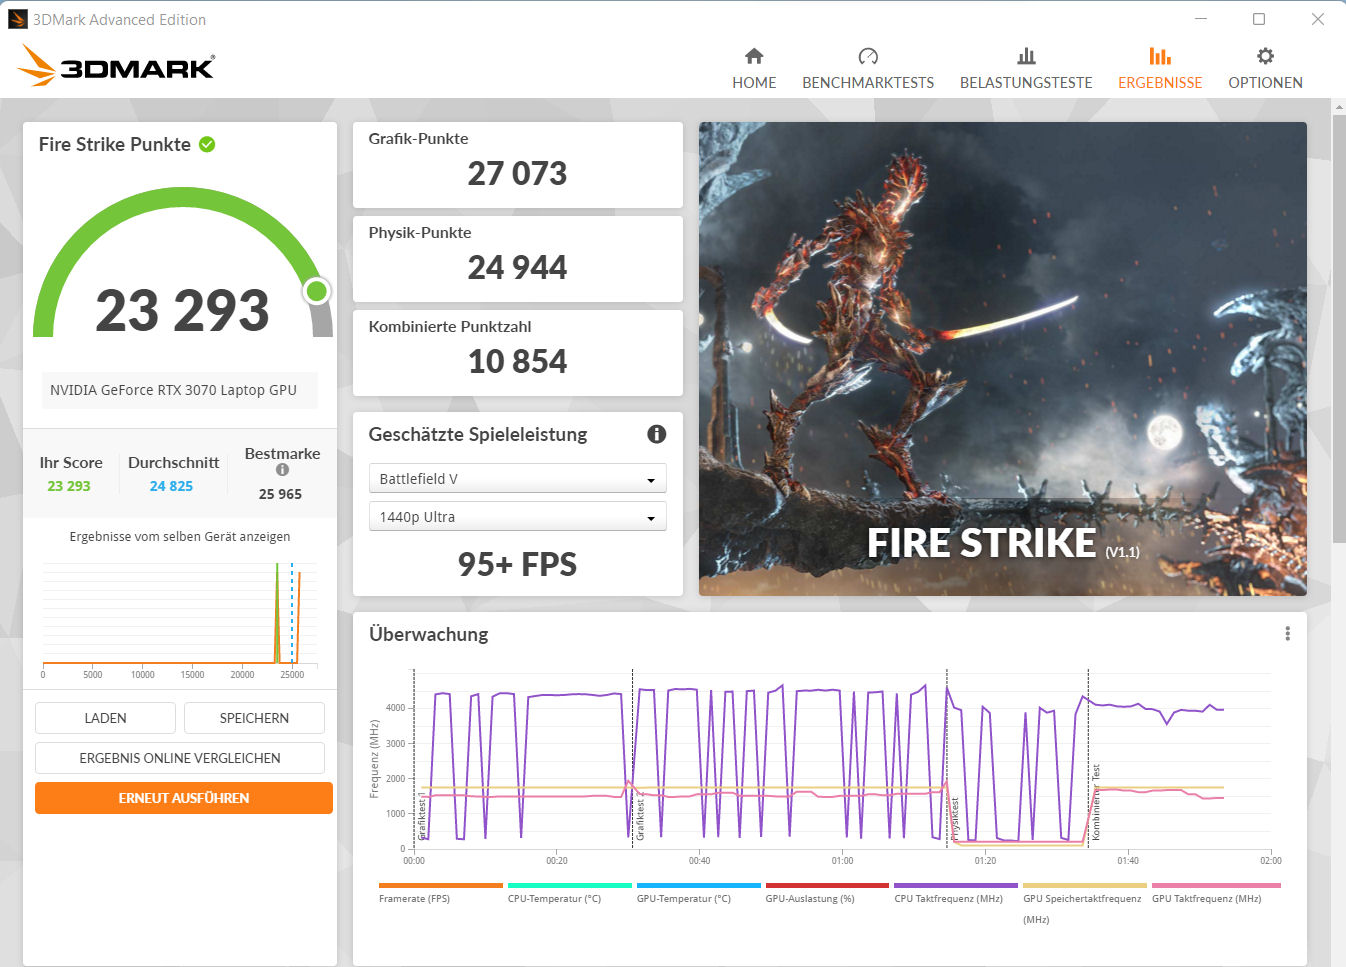
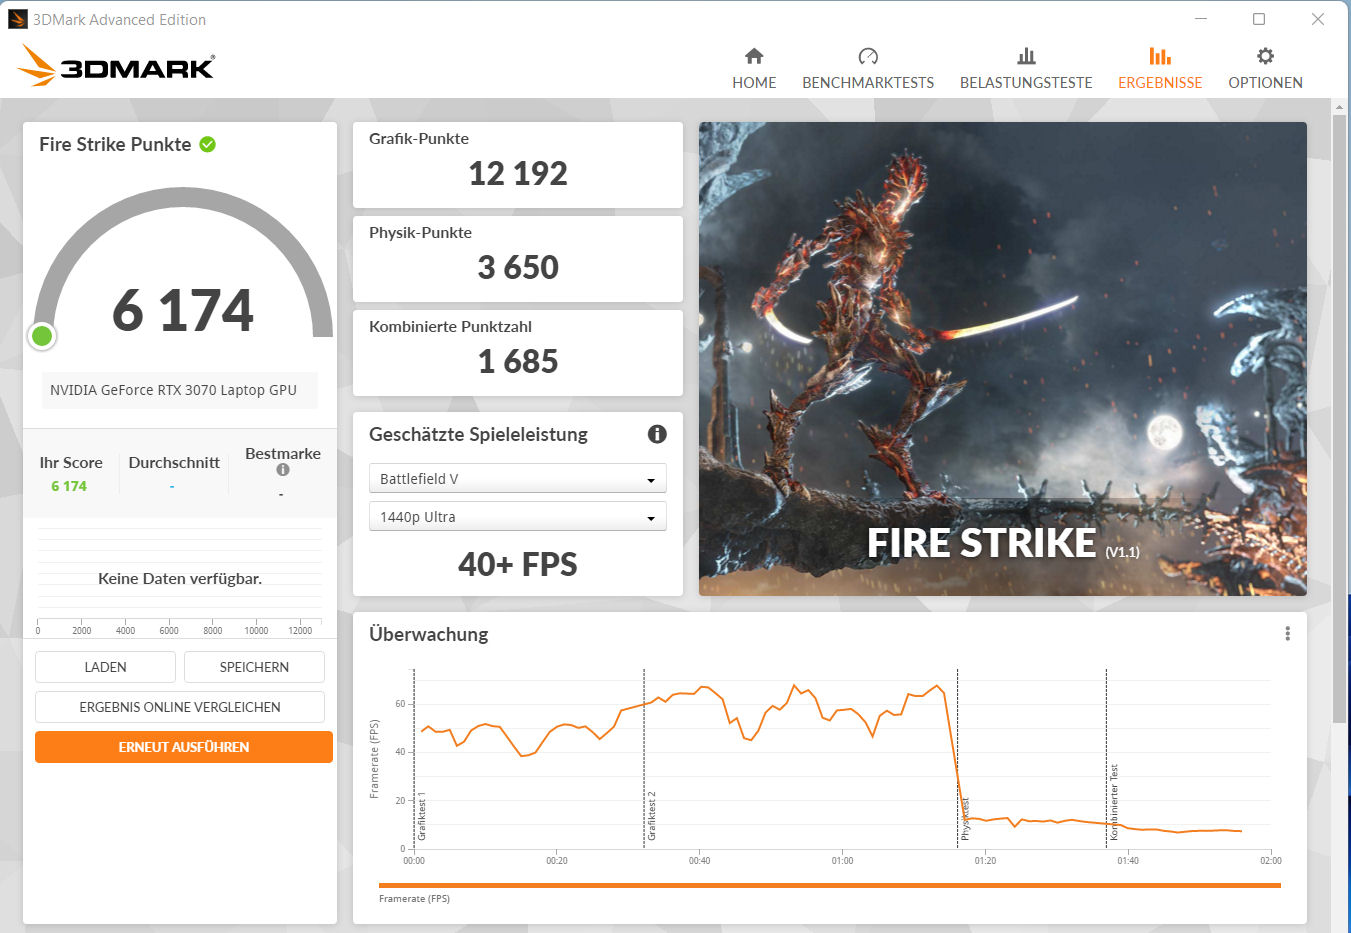
Graphics Card
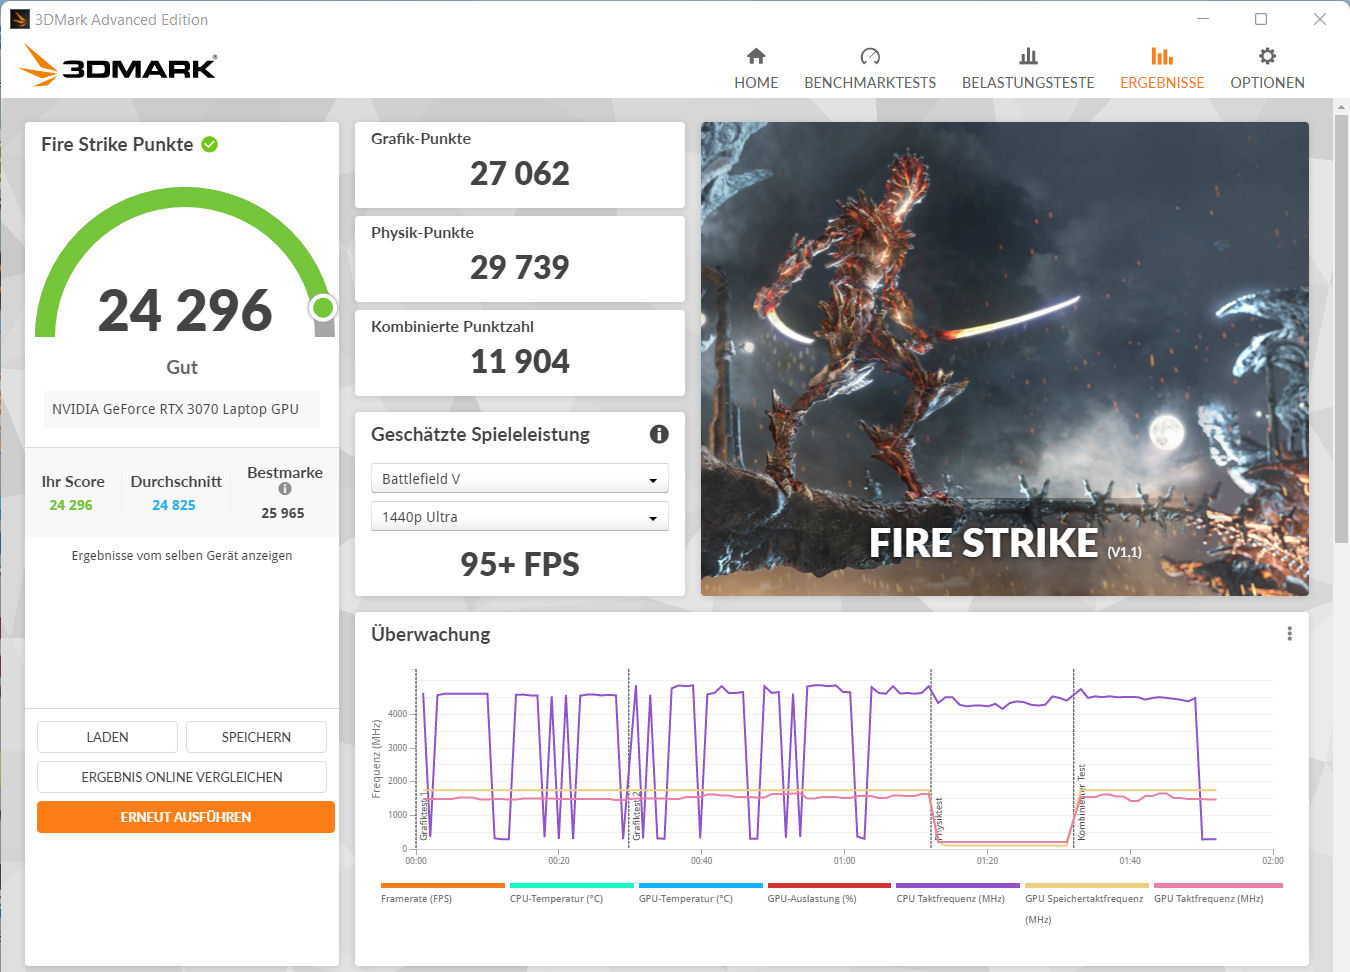
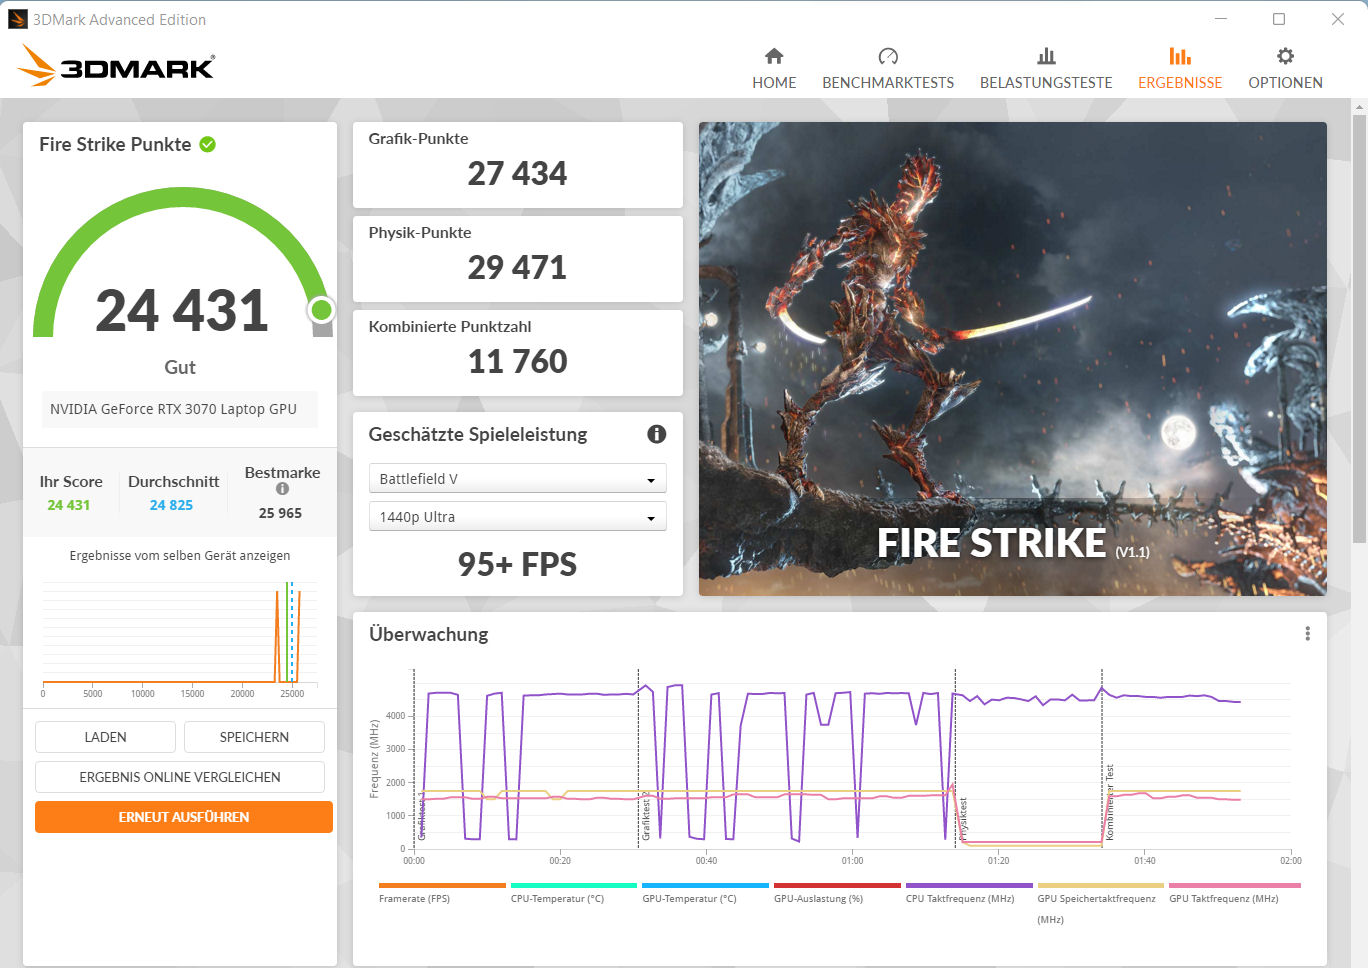
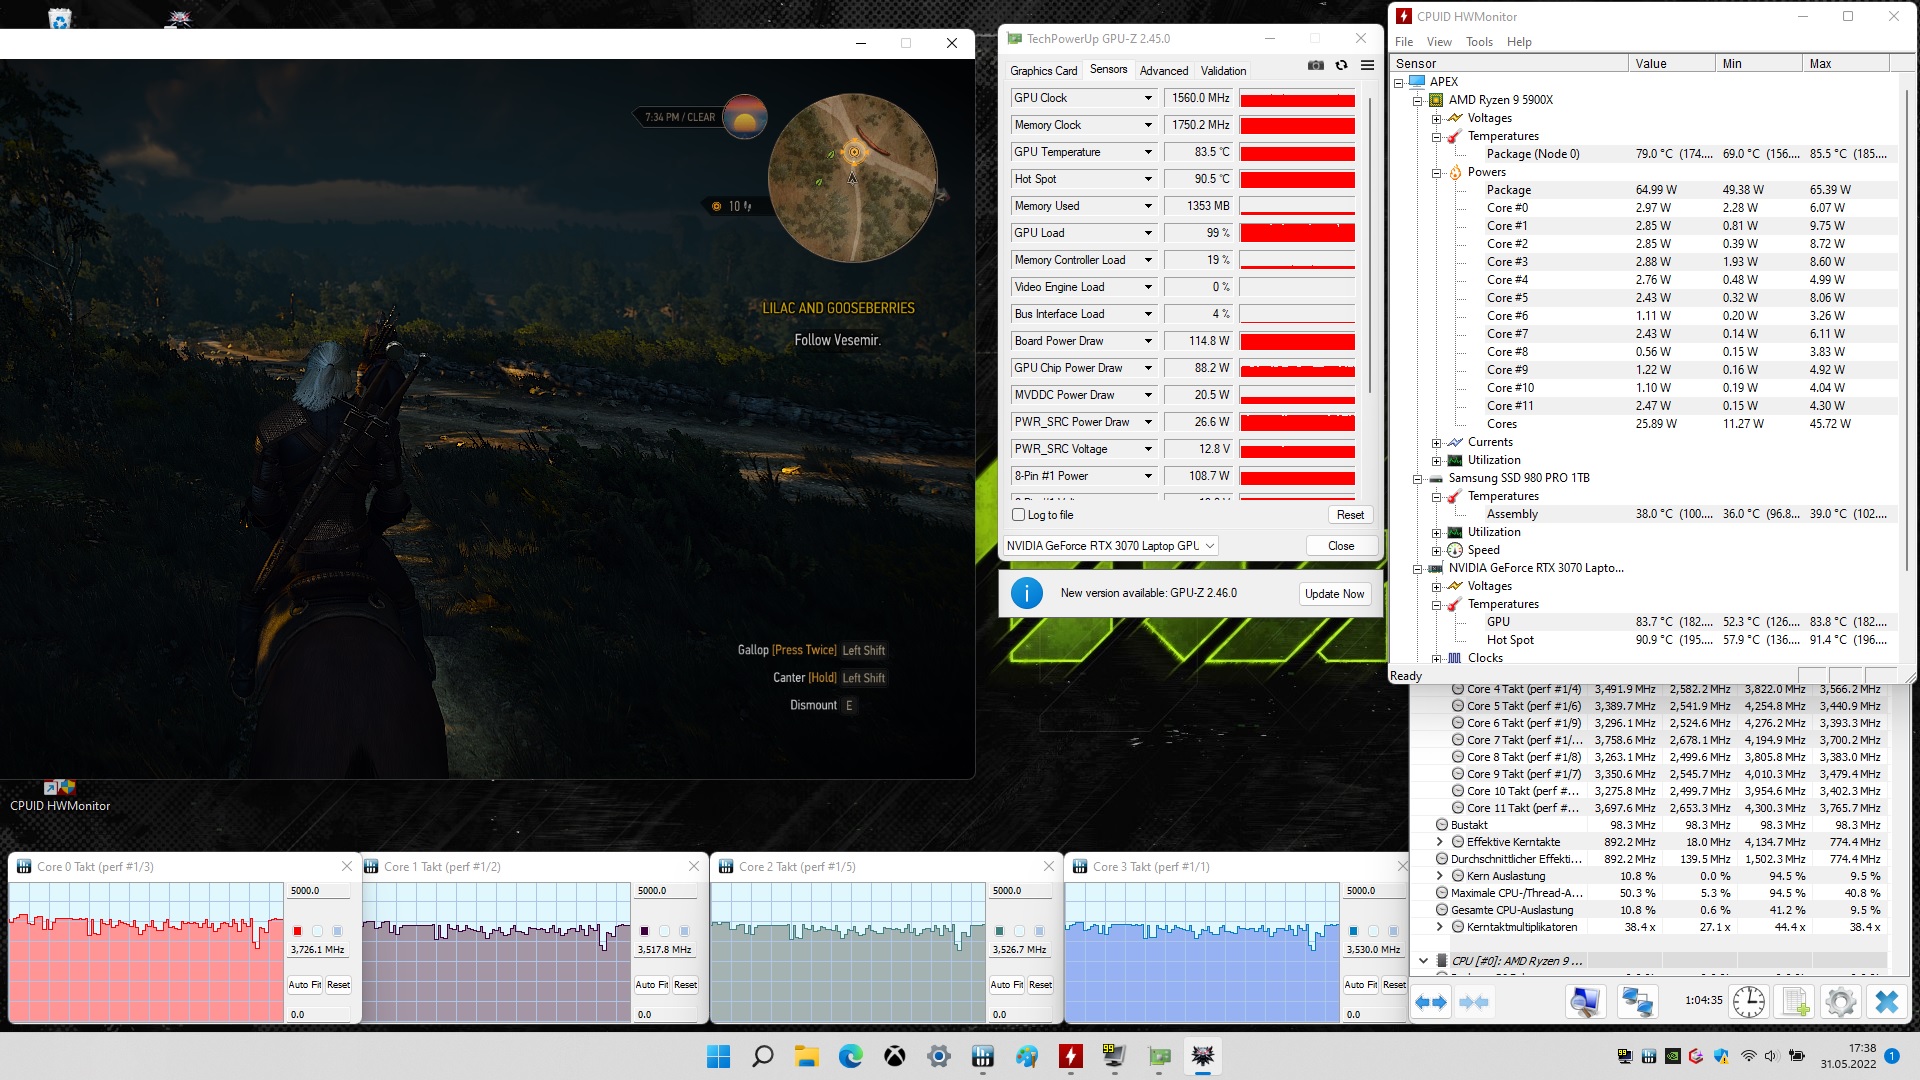
The actual performance of the RTX 3000 GPU depends on several factors: the cooling, storage equipment, and the maximum TGP that the laptop manufacturer chooses within the limits defined by Nvidia. Schenker selects a maximum TGP of 115 watts for the built-in GeForce RTX 3070 Laptop GPU. The GPU is able to use fast GDDR6 graphics storage (8,192 MB).
The benchmark results range above the average that we determined for the RTX 3070 until now. The TGP is fully used, which is shown by our The Witcher 3 test. There is no integrated GPU onboard, and the RTX 3070 runs permanently.
| 3DMark Performance rating - Percent | |
| Schenker XMG Apex 15 Max | |
| Schenker XMG Apex 15 Max | |
| Average of class Gaming | |
| Average NVIDIA GeForce RTX 3070 Laptop GPU | |
| MSI Vector GP66 12UGS -15! | |
| Gigabyte A5 X1 -16! | |
| Schenker XMG Apex 15 Max -15! | |
| Eurocom Nightsky ARX315 -15! | |
| HP Omen 16-b1090ng -15! | |
| Schenker XMG Apex 15 NH57AF1 -15! | |
| Schenker XMG Apex 15 Max -15! | |
| Schenker XMG Apex 15 Max -18! | |
| 3DMark 11 - 1280x720 Performance GPU | |
| Average of class Gaming (21841 - 80022, n=109, last 2 years) | |
| MSI Vector GP66 12UGS | |
| Eurocom Nightsky ARX315 | |
| Gigabyte A5 X1 | |
| Schenker XMG Apex 15 Max (Leistungsmodus, max. Fan) | |
| Schenker XMG Apex 15 Max (Leistungsmodus) | |
| Schenker XMG Apex 15 Max | |
| HP Omen 16-b1090ng | |
| Average NVIDIA GeForce RTX 3070 Laptop GPU (12535 - 38275, n=54) | |
| Schenker XMG Apex 15 NH57AF1 | |
| Schenker XMG Apex 15 Max (Lautlosmodus) | |
| Schenker XMG Apex 15 Max (Stromsparmodus) | |
| 3DMark 11 Performance | 27648 points | |
| 3DMark Cloud Gate Standard Score | 56629 points | |
| 3DMark Fire Strike Score | 23293 points | |
| 3DMark Time Spy Score | 9891 points | |
Help | ||
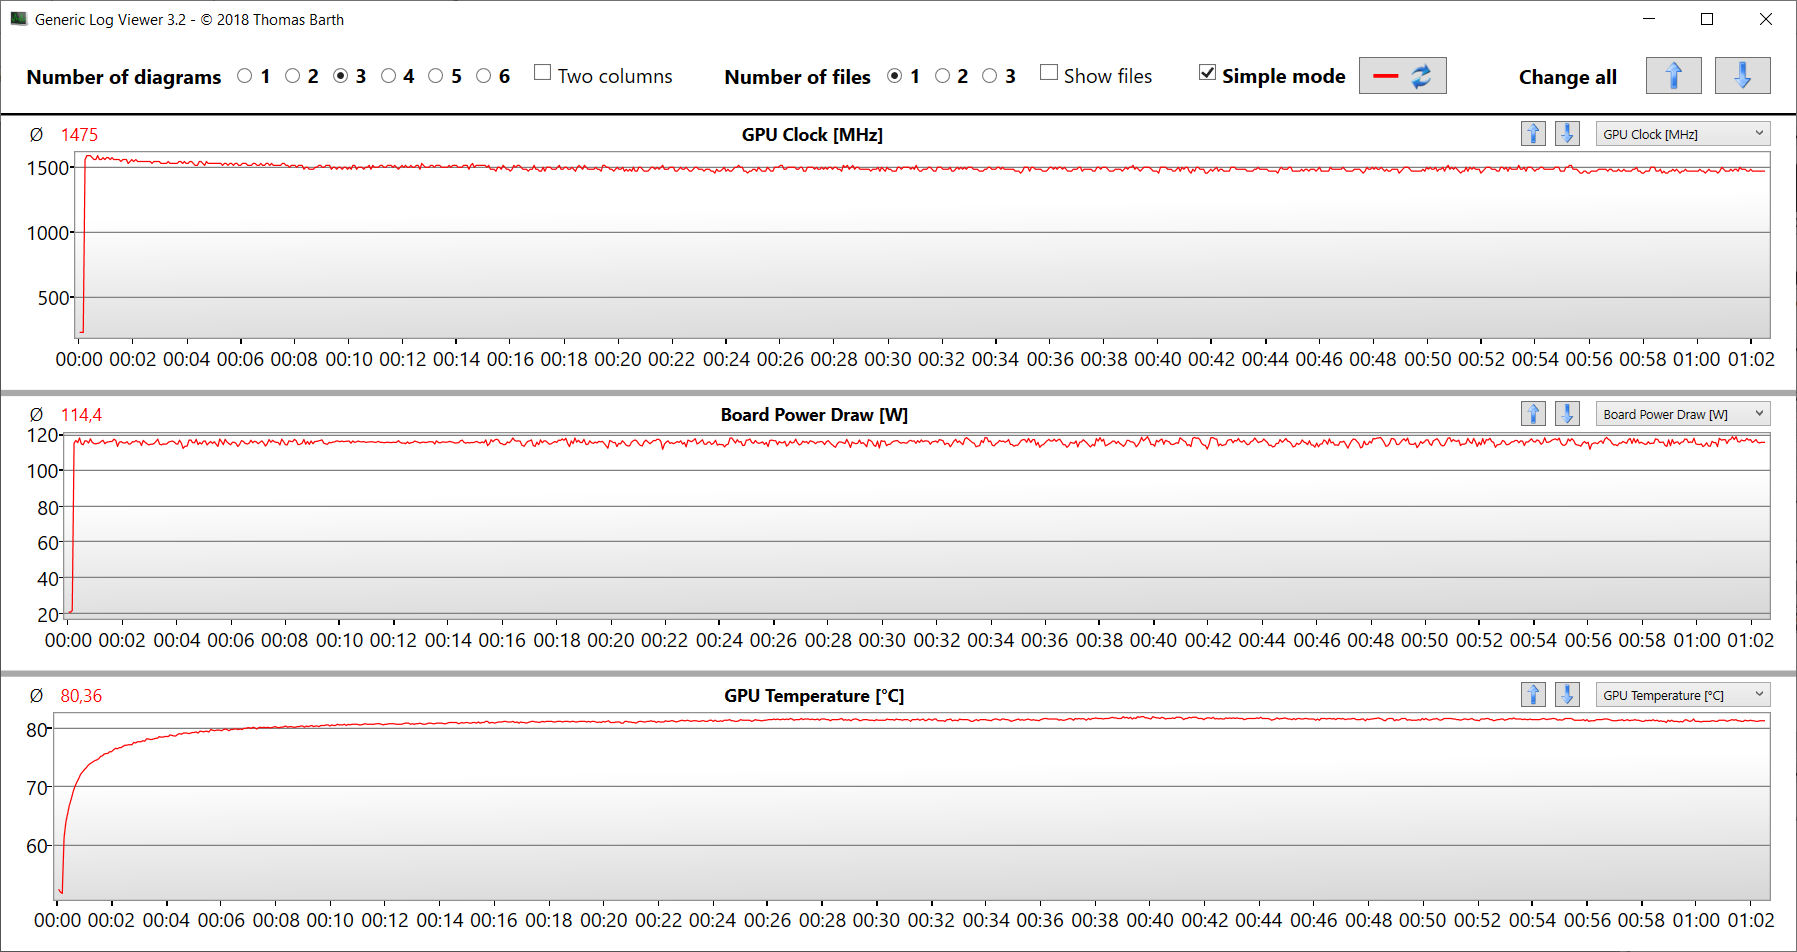
Gaming Performance
The hardware used is able to bring all the current games smoothly to the screen at FHD resolution and maximum settings. Higher resolutions with a connection of the corresponding external monitor might require some reduced quality settings. The frame rates are above the average that we determined for the RTX 3070 and also remain constant for a longer time period, which is shown by our The Witcher 3 test (FHD, max. settings, 60 min. duration). The Performance profile results in a small increase of the frame rates in CPU-heavy games.
| The Witcher 3 - 1920x1080 Ultra Graphics & Postprocessing (HBAO+) | |
| Average of class Gaming (95 - 240, n=8, last 2 years) | |
| MSI Vector GP66 12UGS | |
| Schenker XMG Apex 15 Max (Leistungsmodus, max. Fan) | |
| Schenker XMG Apex 15 Max | |
| Schenker XMG Apex 15 Max (Leistungsmodus) | |
| Gigabyte A5 X1 | |
| HP Omen 16-b1090ng | |
| Eurocom Nightsky ARX315 | |
| Average NVIDIA GeForce RTX 3070 Laptop GPU (34.9 - 109, n=52) | |
| Schenker XMG Apex 15 NH57AF1 | |
| Schenker XMG Apex 15 Max (Lautlosmodus) | |
| Schenker XMG Apex 15 Max (Stromsparmodus) | |
| Dota 2 Reborn - 1920x1080 ultra (3/3) best looking | |
| Schenker XMG Apex 15 Max (Leistungsmodus) | |
| Eurocom Nightsky ARX315 | |
| MSI Vector GP66 12UGS | |
| Schenker XMG Apex 15 Max (Leistungsmodus, max. Fan) | |
| Average of class Gaming (84.8 - 248, n=113, last 2 years) | |
| Schenker XMG Apex 15 Max | |
| HP Omen 16-b1090ng | |
| Schenker XMG Apex 15 NH57AF1 | |
| Gigabyte A5 X1 | |
| Average NVIDIA GeForce RTX 3070 Laptop GPU (26.9 - 163.9, n=58) | |
| Schenker XMG Apex 15 Max (Lautlosmodus) | |
| Schenker XMG Apex 15 Max (Stromsparmodus) | |
| X-Plane 11.11 - 1920x1080 high (fps_test=3) | |
| Schenker XMG Apex 15 Max (Leistungsmodus) | |
| Schenker XMG Apex 15 Max (Leistungsmodus, max. Fan) | |
| HP Omen 16-b1090ng | |
| MSI Vector GP66 12UGS | |
| Schenker XMG Apex 15 Max | |
| Eurocom Nightsky ARX315 | |
| Average of class Gaming (52.1 - 143.5, n=116, last 2 years) | |
| Schenker XMG Apex 15 NH57AF1 | |
| Average NVIDIA GeForce RTX 3070 Laptop GPU (12.4 - 118.8, n=61) | |
| Gigabyte A5 X1 | |
| Schenker XMG Apex 15 Max (Lautlosmodus) | |
| Schenker XMG Apex 15 Max (Stromsparmodus) | |
| Final Fantasy XV Benchmark - 1920x1080 High Quality | |
| Average of class Gaming (41 - 215, n=104, last 2 years) | |
| MSI Vector GP66 12UGS (1.3) | |
| Eurocom Nightsky ARX315 (1.3) | |
| Schenker XMG Apex 15 Max (1.3, Leistungsmodus, max. Fan) | |
| Schenker XMG Apex 15 Max (1.3) | |
| Schenker XMG Apex 15 Max (1.3, Leistungsmodus) | |
| HP Omen 16-b1090ng | |
| Gigabyte A5 X1 (1.3) | |
| Average NVIDIA GeForce RTX 3070 Laptop GPU (27.9 - 107, n=49) | |
| Schenker XMG Apex 15 Max (1.3, Lautlosmodus) | |
| Schenker XMG Apex 15 Max (1.3, Stromsparmodus) | |
| GTA V - 1920x1080 Highest AA:4xMSAA + FX AF:16x | |
| Average of class Gaming (48.3 - 186.9, n=103, last 2 years) | |
| Schenker XMG Apex 15 Max (Leistungsmodus) | |
| Schenker XMG Apex 15 Max (Leistungsmodus, max. Fan) | |
| Schenker XMG Apex 15 Max | |
| MSI Vector GP66 12UGS | |
| Eurocom Nightsky ARX315 | |
| HP Omen 16-b1090ng | |
| Gigabyte A5 X1 | |
| Average NVIDIA GeForce RTX 3070 Laptop GPU (21.7 - 125.8, n=50) | |
| Schenker XMG Apex 15 NH57AF1 | |
| Schenker XMG Apex 15 Max (Lautlosmodus) | |
| Schenker XMG Apex 15 Max (Stromsparmodus) | |
| Strange Brigade - 1920x1080 ultra AA:ultra AF:16 | |
| Average of class Gaming (76.3 - 456, n=94, last 2 years) | |
| MSI Vector GP66 12UGS (1.47.22.14 D3D12) | |
| Eurocom Nightsky ARX315 (1.47.22.14 D3D12) | |
| Schenker XMG Apex 15 Max (1.47.22.14 D3D12, Leistungsmodus, max. Fan) | |
| Schenker XMG Apex 15 Max (1.47.22.14 D3D12) | |
| Schenker XMG Apex 15 Max (1.47.22.14 D3D12, Leistungsmodus) | |
| Gigabyte A5 X1 (1.47.22.14 D3D12) | |
| Average NVIDIA GeForce RTX 3070 Laptop GPU (36.2 - 194, n=46) | |
| HP Omen 16-b1090ng (1.47.22.14 D3D12) | |
| Schenker XMG Apex 15 Max (1.47.22.14 D3D12, Lautlosmodus) | |
| Schenker XMG Apex 15 Max (1.47.22.14 D3D12, Stromsparmodus) | |
| F1 2021 - 1920x1080 Ultra High Preset + Raytracing AA:T AF:16x | |
| Schenker XMG Apex 15 Max (874931) | |
| Schenker XMG Apex 15 Max (874931, Leistungsmodus) | |
| Schenker XMG Apex 15 Max (874931, Leistungsmodus, max. Fan) | |
| Gigabyte A5 X1 (831795) | |
| Average NVIDIA GeForce RTX 3070 Laptop GPU (33.1 - 123.1, n=23) | |
| Schenker XMG Apex 15 Max (874931, Lautlosmodus) | |
| Schenker XMG Apex 15 Max (874931, Stromsparmodus) | |
| Far Cry 5 - 1920x1080 Ultra Preset AA:T | |
| Schenker XMG Apex 15 Max (Leistungsmodus) | |
| MSI Vector GP66 12UGS | |
| Schenker XMG Apex 15 Max | |
| Eurocom Nightsky ARX315 | |
| Average of class Gaming (70 - 151, n=10, last 2 years) | |
| Average NVIDIA GeForce RTX 3070 Laptop GPU (89 - 140, n=36) | |
| Gigabyte A5 X1 | |
The Witcher 3 FPS Chart
| low | med. | high | ultra | |
|---|---|---|---|---|
| GTA V (2015) | 186.4 | 183.4 | 181.4 | 123.6 |
| The Witcher 3 (2015) | 468 | 339 | 189.4 | 101.7 |
| Dota 2 Reborn (2015) | 196.2 | 173.3 | 165.1 | 150.9 |
| Final Fantasy XV Benchmark (2018) | 207 | 138.4 | 103.1 | |
| X-Plane 11.11 (2018) | 142.2 | 131.7 | 110.7 | |
| Far Cry 5 (2018) | 176 | 143 | 137 | 128 |
| Strange Brigade (2018) | 474 | 270 | 217 | 188.3 |
| F1 2021 (2021) | 460 | 324 | 256 | 122.8 |
| Forza Horizon 5 (2021) | 235 | 155 | 142 | 86 |
| Rainbow Six Extraction (2022) | 266 | 206 | 201 | 155 |
| Dying Light 2 (2022) | 111.6 | 88.8 | 75.3 | |
| GRID Legends (2022) | 197.6 | 169.2 | 153 | 124.2 |
| Ghostwire Tokyo (2022) | 164.5 | 162.5 | 160.4 | 159.3 |
| Tiny Tina's Wonderlands (2022) | 210.5 | 170.2 | 115.9 | 90.1 |
| The Quarry (2022) | 155.9 | 114.3 | 95.9 | 75.2 |
Emissions - The Schenker laptop makes a lot of noise
Noise Emissions
In everyday operation with Office and Internet, the two fans are subdued to a large extent, but they can always be heard. They are never turned off. Under load, they become very loud with maximum noise levels of up to 52 dB(A) in our The Witcher 3 test) and 56 dB (A) in the stress test. For a lower noise level during operation, you can select the Silent mode. Even though the laptop then runs quieter, it is not silent, and the computing performance is reduced significantly.
Noise level
| Idle |
| 30 / 33 / 34 dB(A) |
| Load |
| 52 / 56 dB(A) |
 | ||
30 dB silent 40 dB(A) audible 50 dB(A) loud |
||
min: | ||
| Schenker XMG Apex 15 Max R9 5900X, GeForce RTX 3070 Laptop GPU | Eurocom Nightsky ARX315 R9 5900X, GeForce RTX 3070 Laptop GPU | MSI Vector GP66 12UGS i9-12900H, GeForce RTX 3070 Ti Laptop GPU | HP Omen 16-b1090ng i7-12700H, GeForce RTX 3070 Ti Laptop GPU | Schenker XMG Apex 15 NH57AF1 R9 3900, GeForce RTX 2070 Mobile | Gigabyte A5 X1 R9 5900HX, GeForce RTX 3070 Laptop GPU | |
|---|---|---|---|---|---|---|
| Noise | -0% | 14% | 2% | -14% | 1% | |
| off / environment * (dB) | 26 | 25.3 3% | 22.9 12% | 26 -0% | 30 -15% | 25 4% |
| Idle Minimum * (dB) | 30 | 25.9 14% | 23.4 22% | 30 -0% | 35 -17% | 27 10% |
| Idle Average * (dB) | 33 | 27.9 15% | 23.4 29% | 31 6% | 36 -9% | 29 12% |
| Idle Maximum * (dB) | 34 | 40.8 -20% | 27.4 19% | 33 3% | 39 -15% | 32 6% |
| Load Average * (dB) | 52 | 55.2 -6% | 36 31% | 49 6% | 59 -13% | 57 -10% |
| Witcher 3 ultra * (dB) | 52 | 52.4 -1% | 58.2 -12% | 53 -2% | 62 -19% | 56 -8% |
| Load Maximum * (dB) | 56 | 60.3 -8% | 58 -4% | 57 -2% | 63 -13% | 58 -4% |
* ... smaller is better
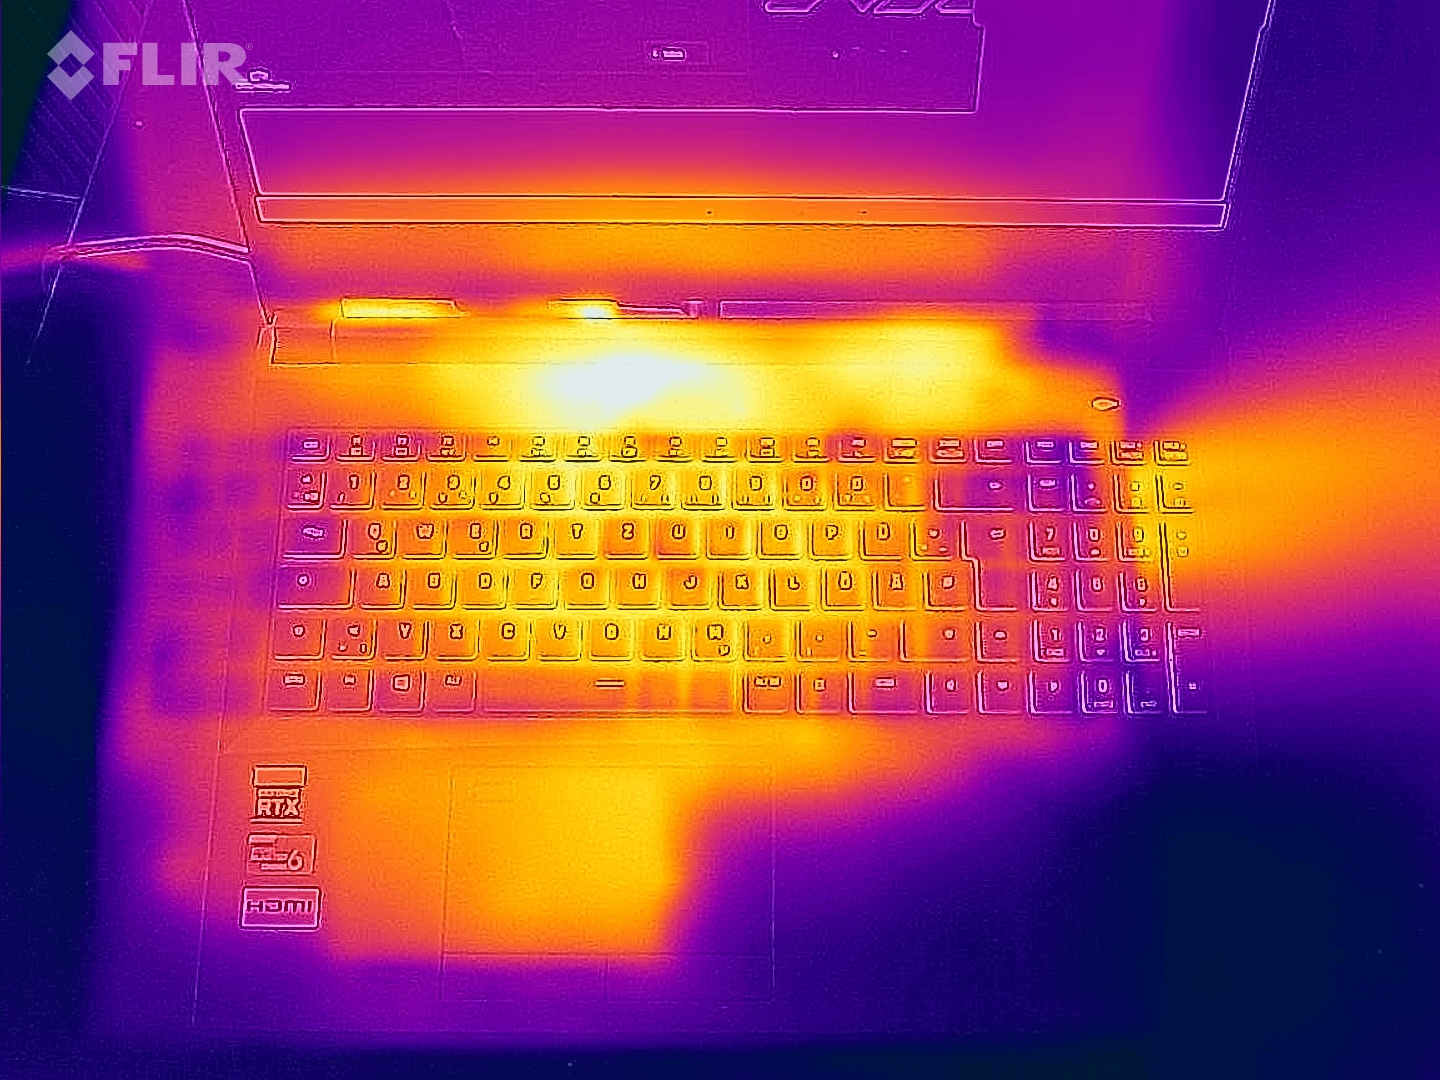
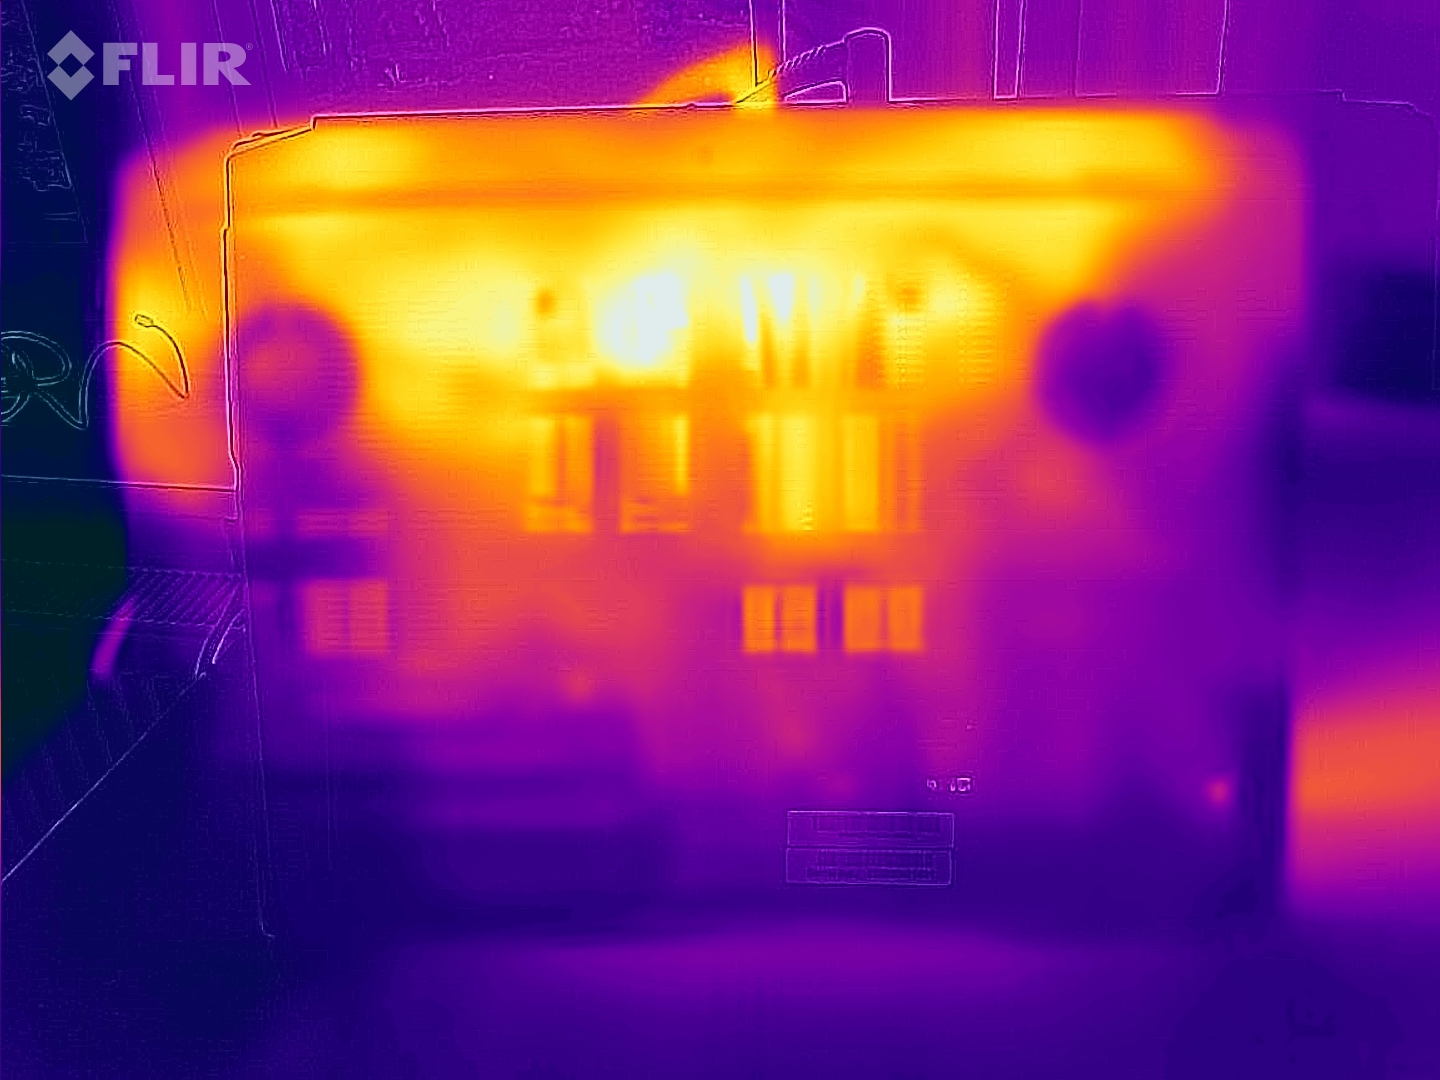
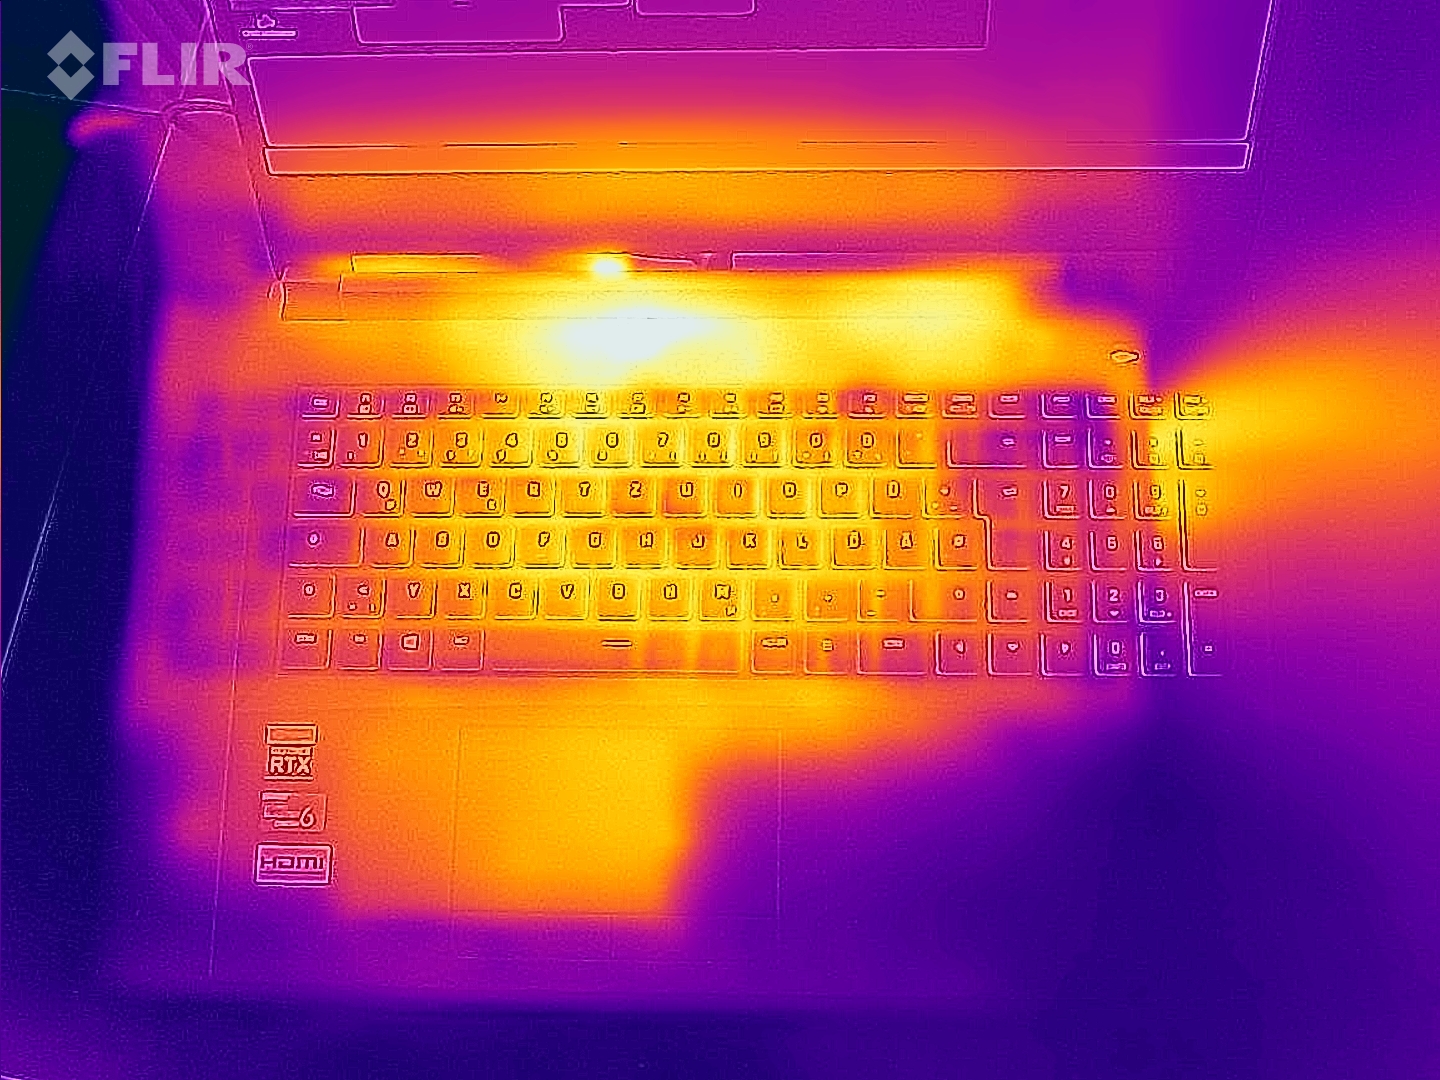
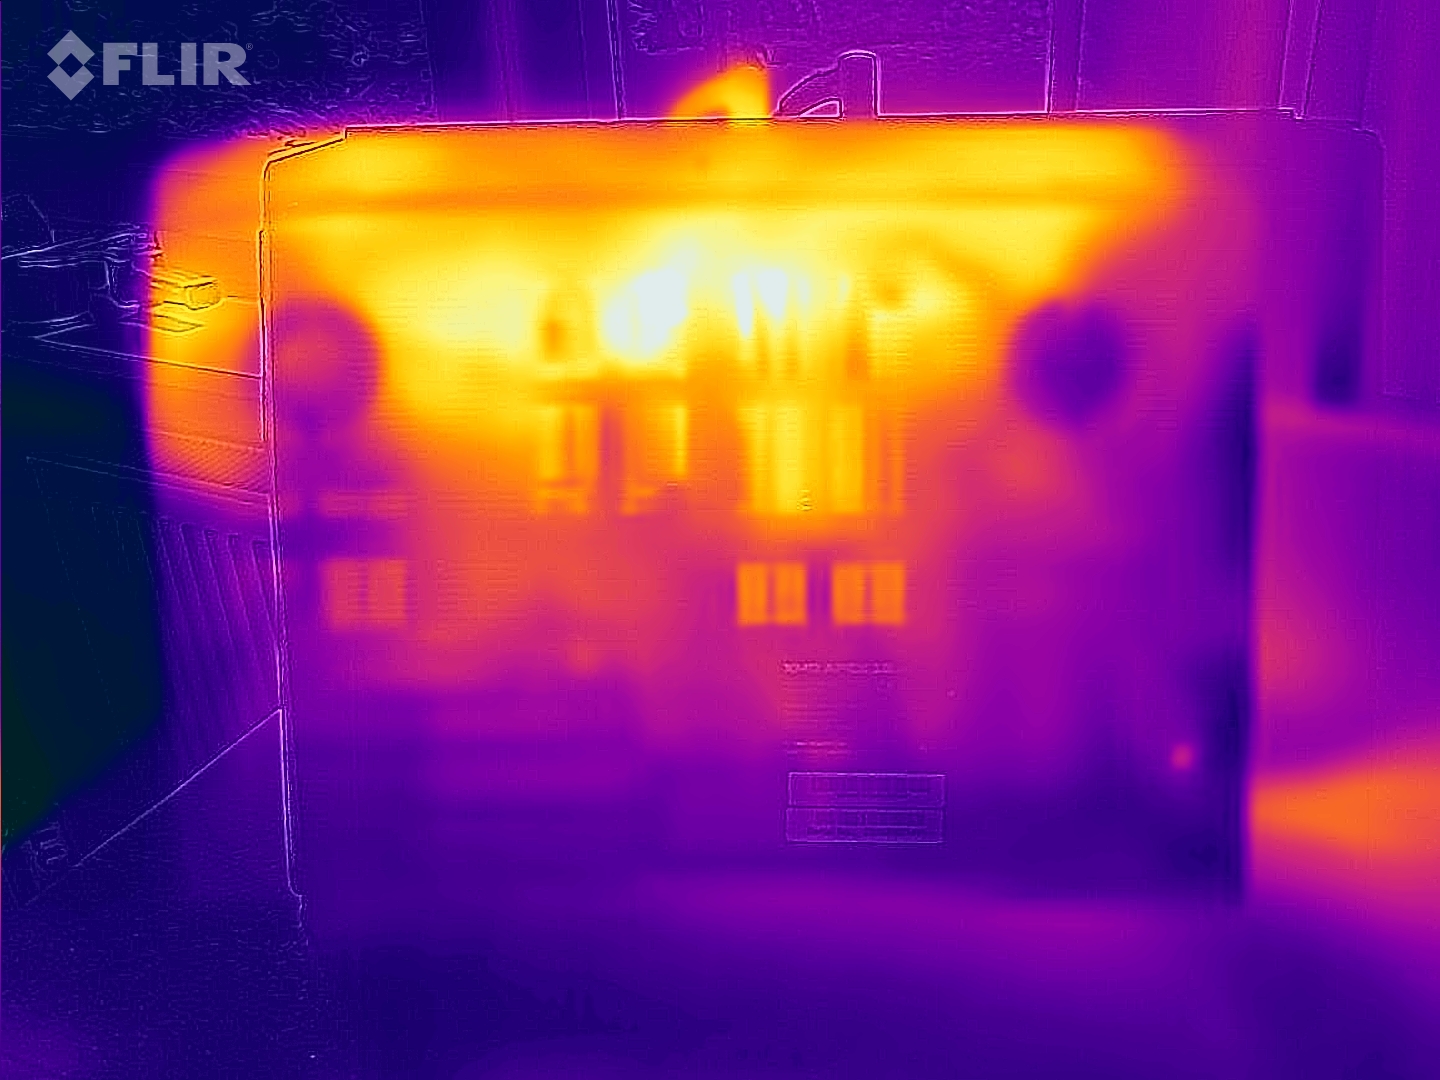
Temperatures
The laptop warms up noticeably across the whole load spectrum, but this is not extreme. This is the benefit of the strongly revving fans. The CPU temperatures give no reason for concern.
(-) The maximum temperature on the upper side is 49 °C / 120 F, compared to the average of 40.4 °C / 105 F, ranging from 21.2 to 68.8 °C for the class Gaming.
(-) The bottom heats up to a maximum of 54 °C / 129 F, compared to the average of 43.2 °C / 110 F
(±) In idle usage, the average temperature for the upper side is 35.1 °C / 95 F, compared to the device average of 33.9 °C / 93 F.
(-) Playing The Witcher 3, the average temperature for the upper side is 39.8 °C / 104 F, compared to the device average of 33.9 °C / 93 F.
(±) The palmrests and touchpad can get very hot to the touch with a maximum of 39 °C / 102.2 F.
(-) The average temperature of the palmrest area of similar devices was 28.8 °C / 83.8 F (-10.2 °C / -18.4 F).
| Schenker XMG Apex 15 Max R9 5900X, GeForce RTX 3070 Laptop GPU | Eurocom Nightsky ARX315 R9 5900X, GeForce RTX 3070 Laptop GPU | MSI Vector GP66 12UGS i9-12900H, GeForce RTX 3070 Ti Laptop GPU | HP Omen 16-b1090ng i7-12700H, GeForce RTX 3070 Ti Laptop GPU | Schenker XMG Apex 15 NH57AF1 R9 3900, GeForce RTX 2070 Mobile | Gigabyte A5 X1 R9 5900HX, GeForce RTX 3070 Laptop GPU | |
|---|---|---|---|---|---|---|
| Heat | 13% | 16% | 19% | 11% | 18% | |
| Maximum Upper Side * (°C) | 49 | 36.2 26% | 40.2 18% | 41 16% | 44 10% | 47 4% |
| Maximum Bottom * (°C) | 54 | 49.6 8% | 43.8 19% | 62 -15% | 48 11% | 51 6% |
| Idle Upper Side * (°C) | 38 | 32.6 14% | 34.8 8% | 25 34% | 33 13% | 27 29% |
| Idle Bottom * (°C) | 45 | 43.2 4% | 37 18% | 26 42% | 41 9% | 30 33% |
* ... smaller is better
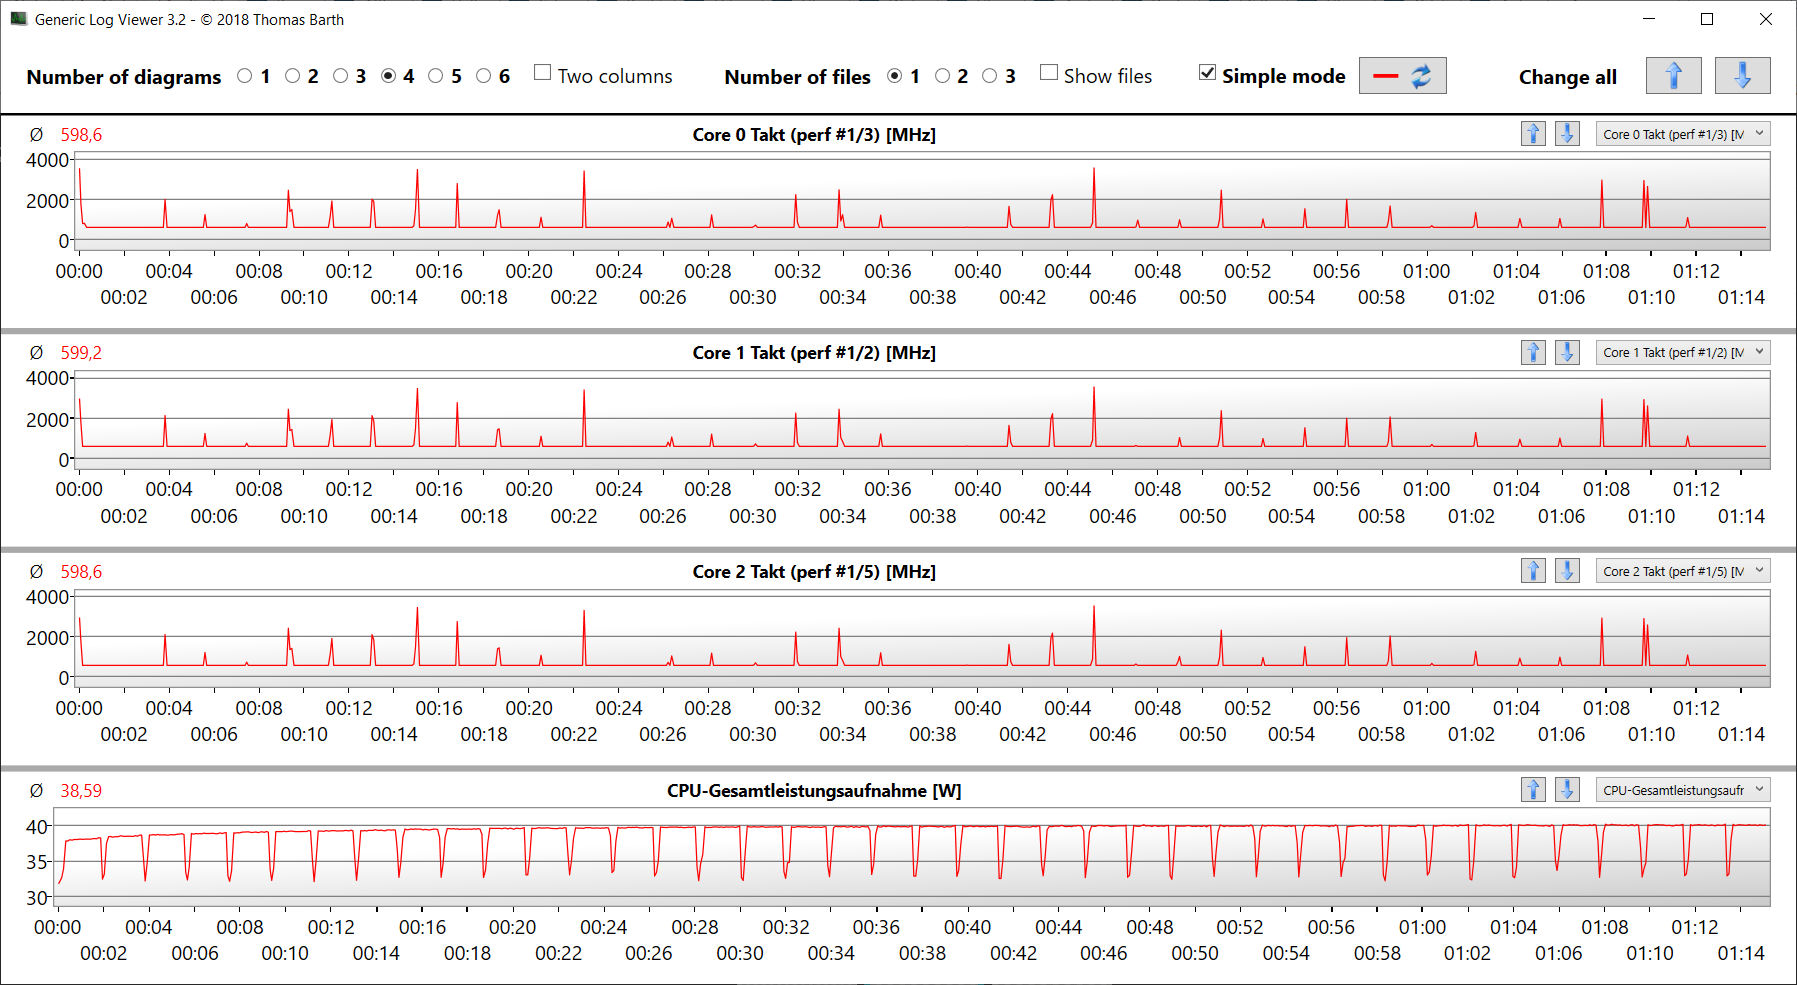
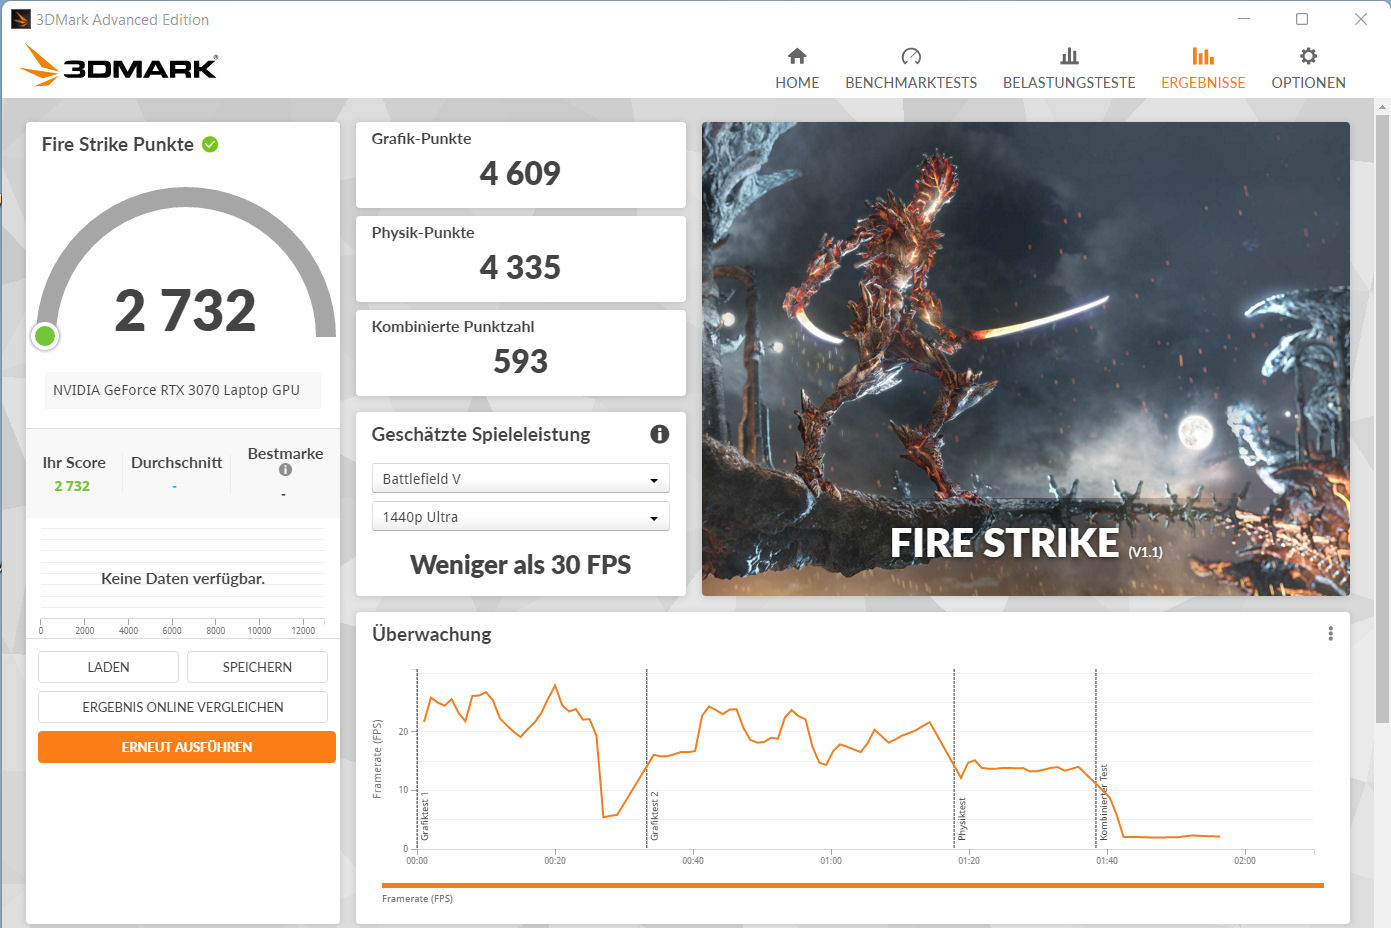
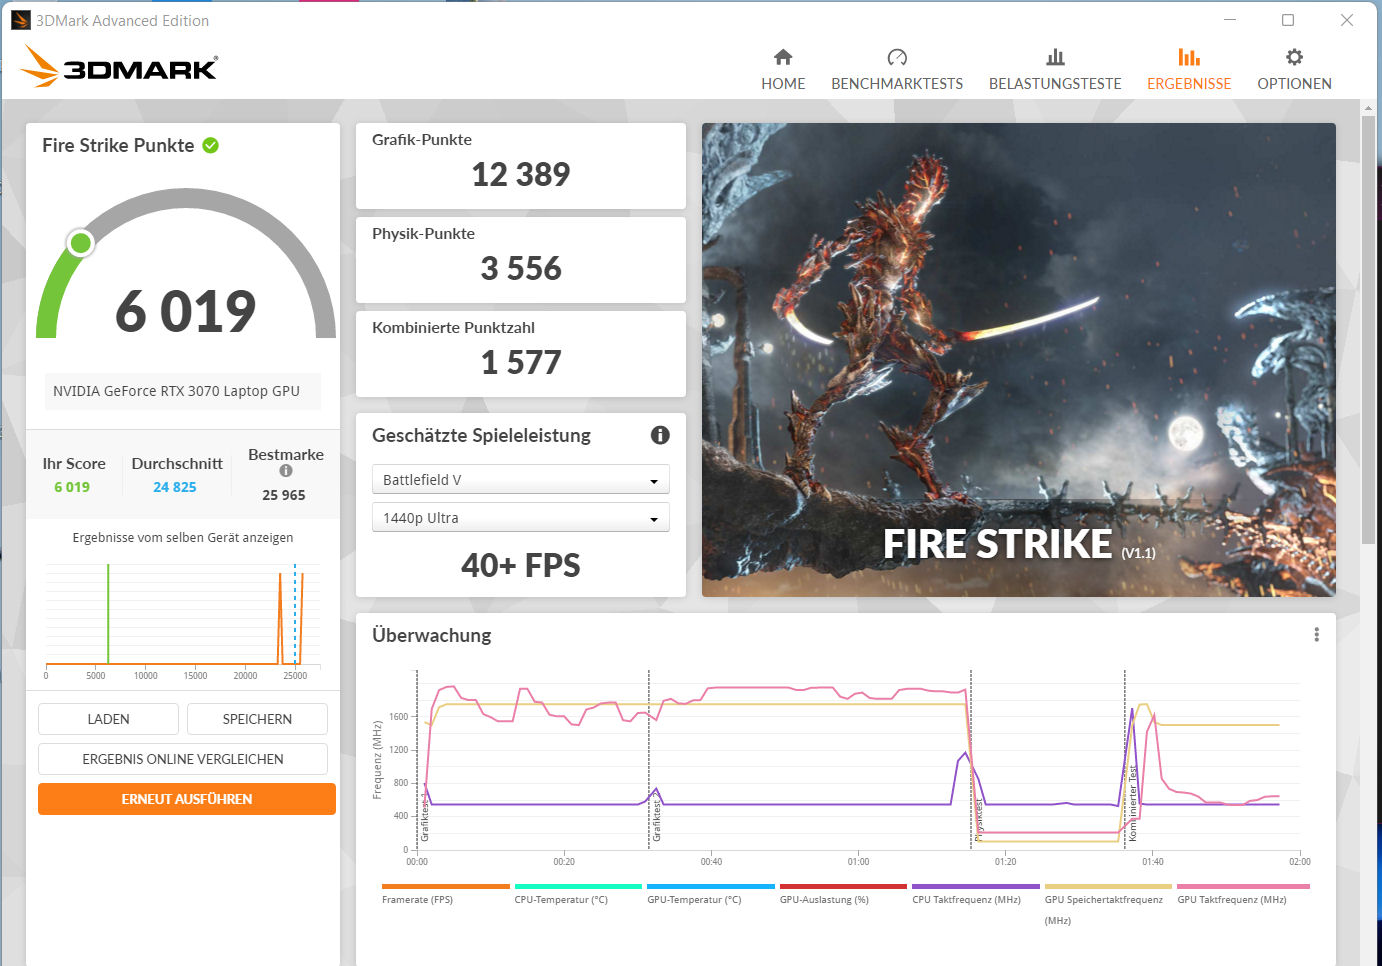
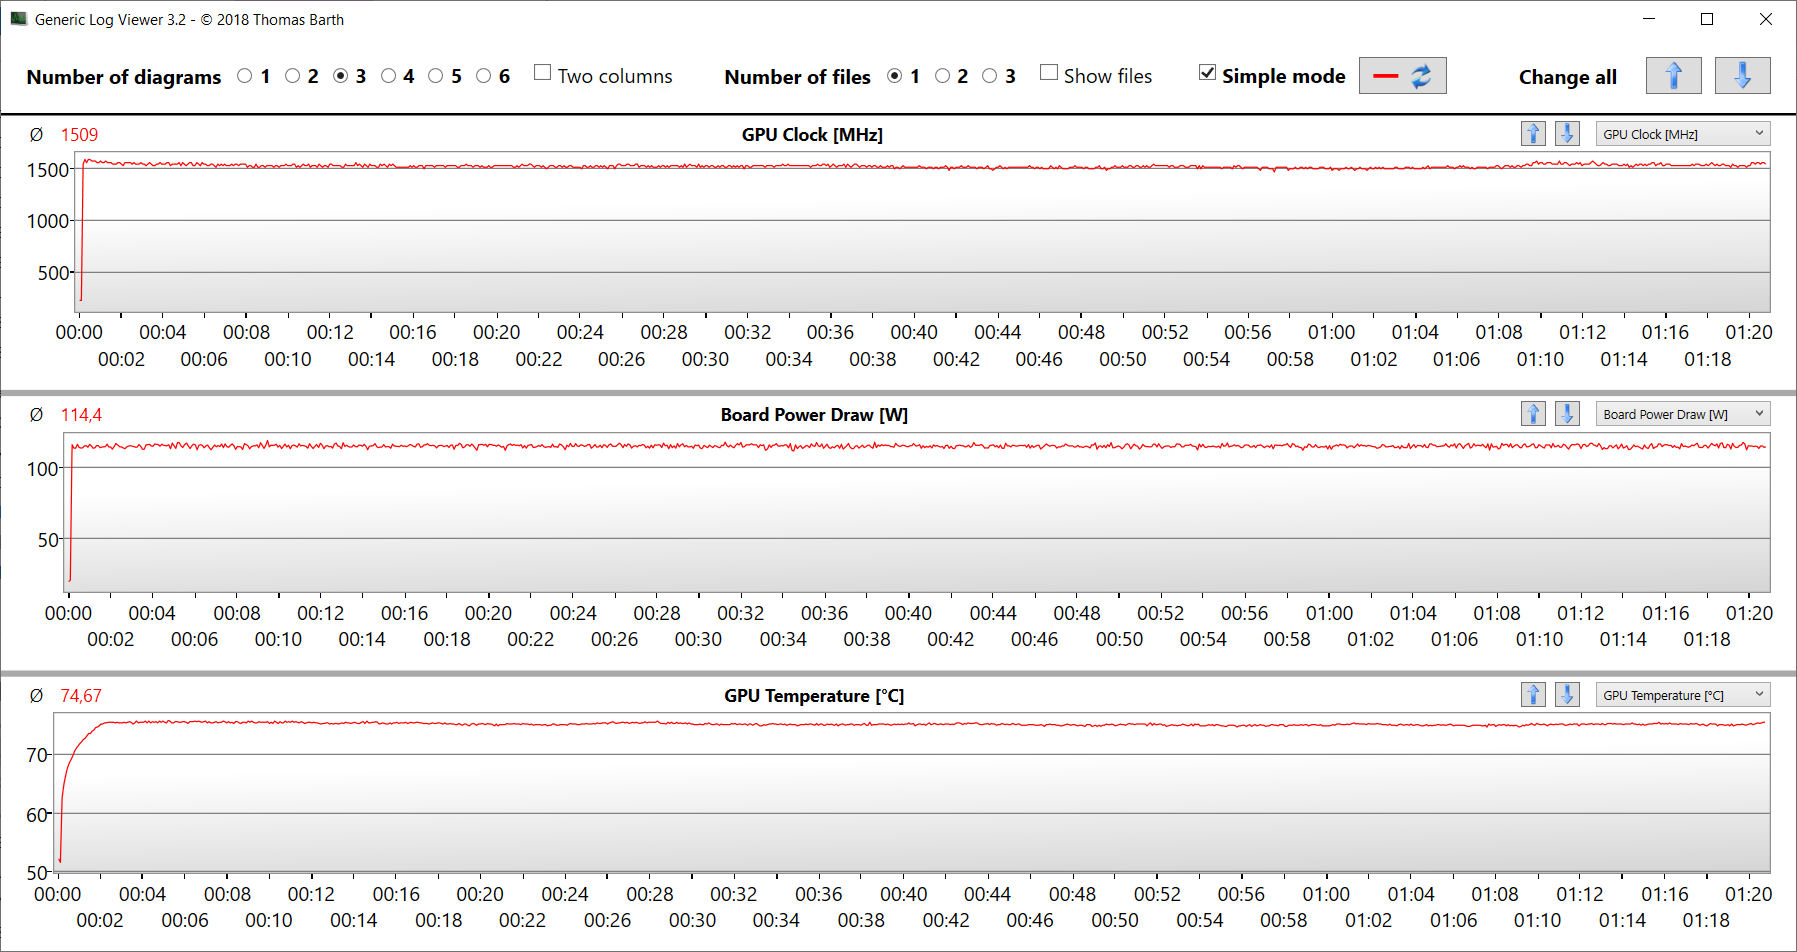
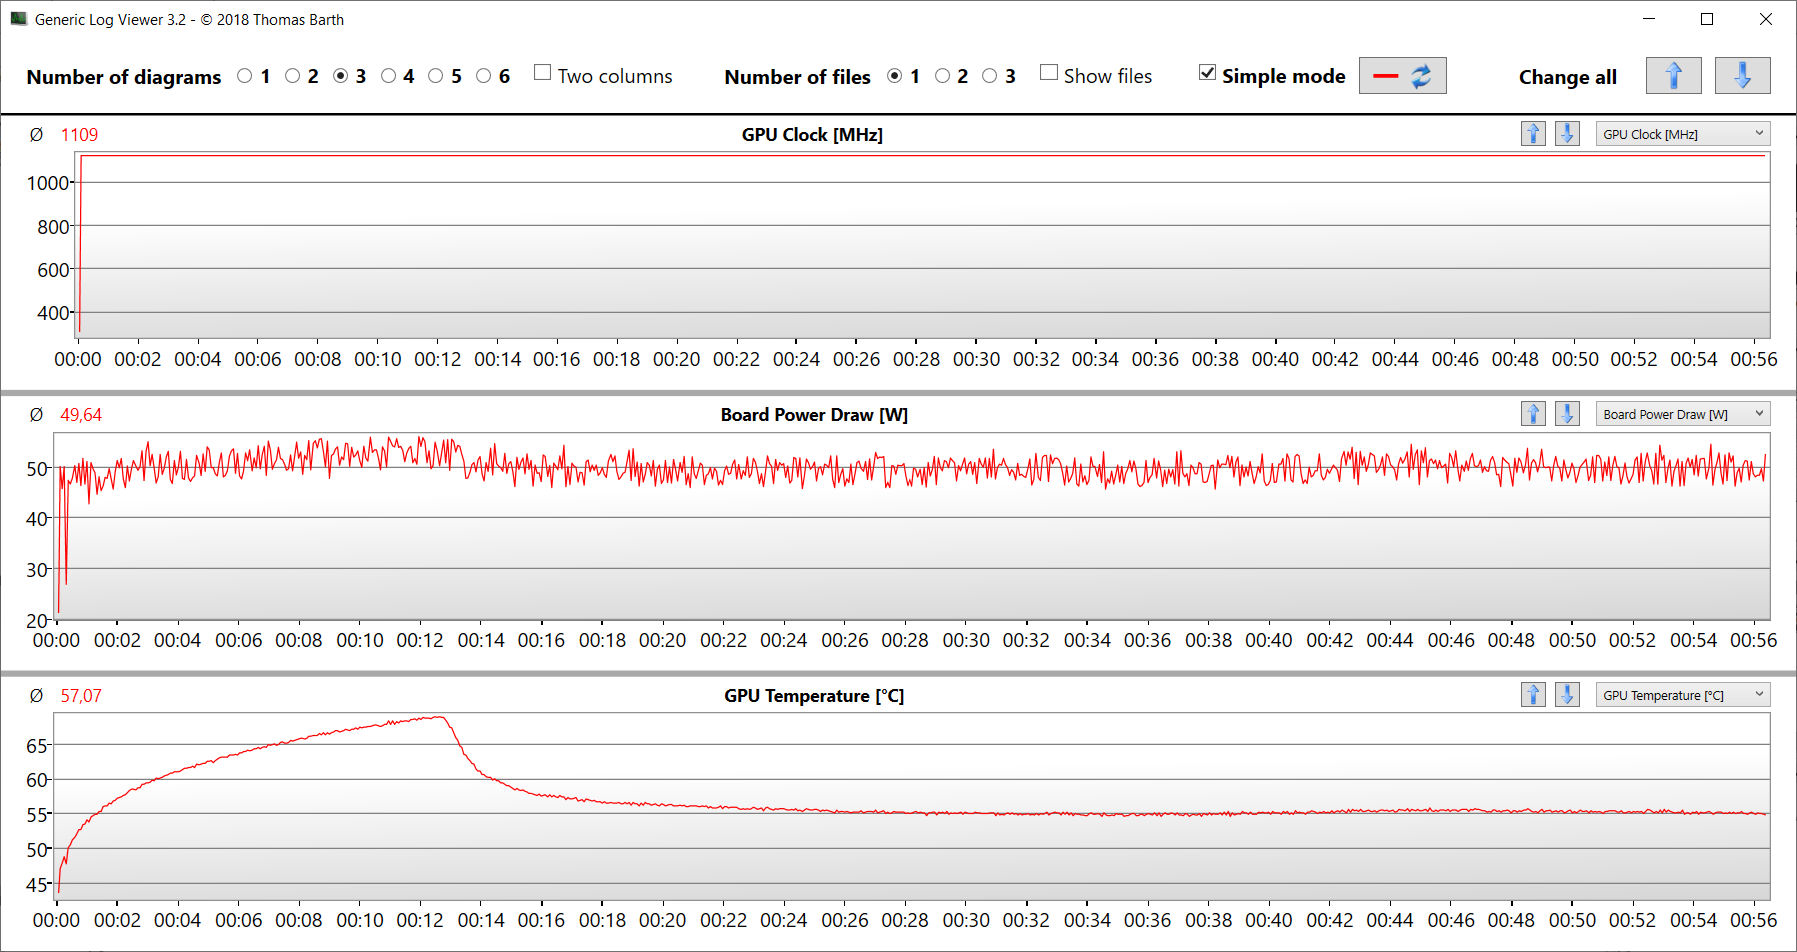
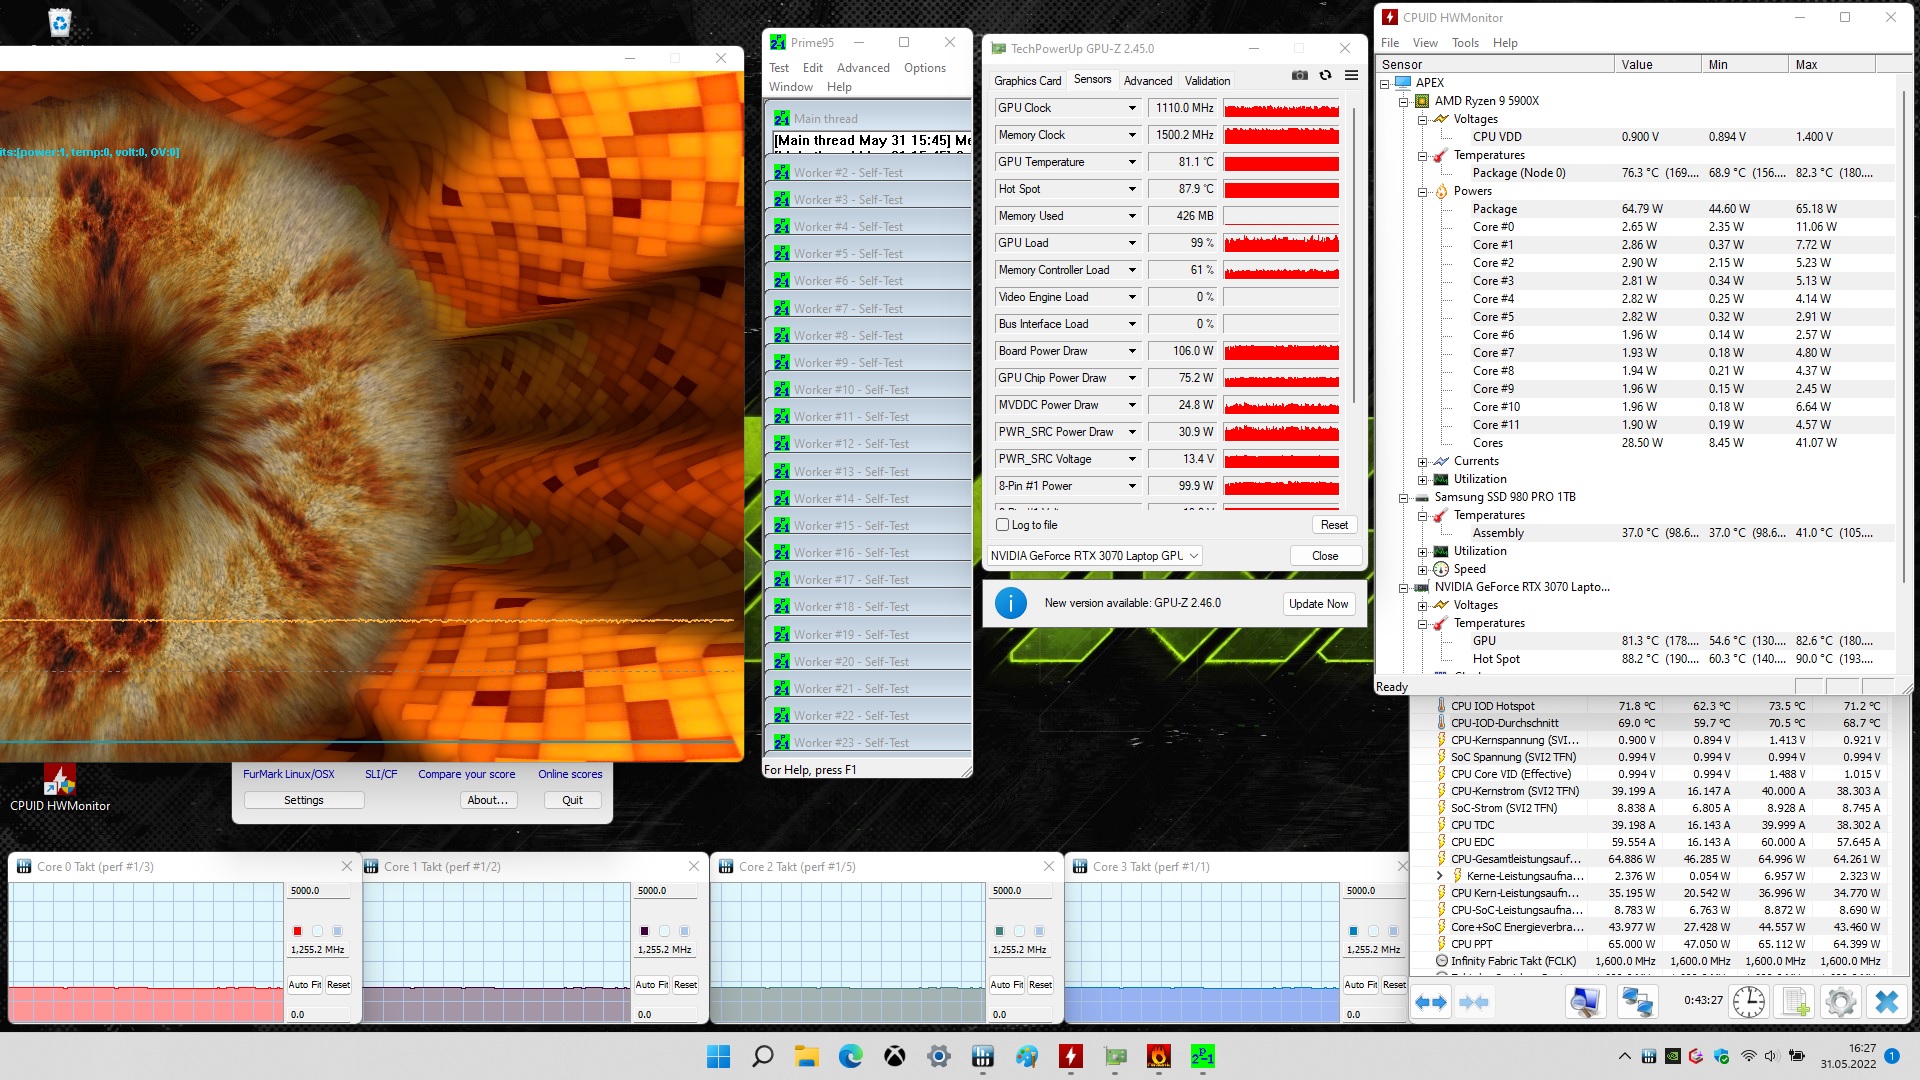
Stress Test
The CPU runs through our stress test with Prime95 and Furmark running for at least one hour at between 1. 2 and 1.3 GHz, and the graphics core has speeds between 1100 and 1200 MHz. The stress test represents an extreme scenario, and we use this test to evaluate whether the system remains stable under full load.
Speakers
The stereo speakers produce an acceptable sound, but there is hardly any bass.
Schenker XMG Apex 15 Max audio analysis
(±) | speaker loudness is average but good (79 dB)
Bass 100 - 315 Hz
(-) | nearly no bass - on average 29.1% lower than median
(±) | linearity of bass is average (12.3% delta to prev. frequency)
Mids 400 - 2000 Hz
(+) | balanced mids - only 3% away from median
(+) | mids are linear (5.1% delta to prev. frequency)
Highs 2 - 16 kHz
(+) | balanced highs - only 2.8% away from median
(+) | highs are linear (6.6% delta to prev. frequency)
Overall 100 - 16.000 Hz
(±) | linearity of overall sound is average (20.1% difference to median)
Compared to same class
» 71% of all tested devices in this class were better, 6% similar, 23% worse
» The best had a delta of 6%, average was 18%, worst was 132%
Compared to all devices tested
» 52% of all tested devices were better, 8% similar, 40% worse
» The best had a delta of 4%, average was 24%, worst was 134%
MSI Vector GP66 12UGS audio analysis
(+) | speakers can play relatively loud (86.4 dB)
Bass 100 - 315 Hz
(-) | nearly no bass - on average 19.2% lower than median
(±) | linearity of bass is average (9.1% delta to prev. frequency)
Mids 400 - 2000 Hz
(±) | higher mids - on average 6.5% higher than median
(+) | mids are linear (5.8% delta to prev. frequency)
Highs 2 - 16 kHz
(+) | balanced highs - only 3.7% away from median
(+) | highs are linear (6.5% delta to prev. frequency)
Overall 100 - 16.000 Hz
(±) | linearity of overall sound is average (18.1% difference to median)
Compared to same class
» 57% of all tested devices in this class were better, 8% similar, 35% worse
» The best had a delta of 6%, average was 18%, worst was 132%
Compared to all devices tested
» 38% of all tested devices were better, 8% similar, 54% worse
» The best had a delta of 4%, average was 24%, worst was 134%
Power Management - The Apex Max is very power-hungry
Power Consumption
The power consumption during idle operation turns out very high with values of up to 76 watts. During the stress test and The Witcher 3 test, the consumption increases up to 233 watts or an average of 230 watts. During both tests, the power consumption remains constant. The power supply is rated at 230 watts.
| Off / Standby | |
| Idle | |
| Load |
|
Key:
min: | |
| Schenker XMG Apex 15 Max R9 5900X, GeForce RTX 3070 Laptop GPU | Eurocom Nightsky ARX315 R9 5900X, GeForce RTX 3070 Laptop GPU | MSI Vector GP66 12UGS i9-12900H, GeForce RTX 3070 Ti Laptop GPU | HP Omen 16-b1090ng i7-12700H, GeForce RTX 3070 Ti Laptop GPU | Schenker XMG Apex 15 NH57AF1 R9 3900, GeForce RTX 2070 Mobile | Gigabyte A5 X1 R9 5900HX, GeForce RTX 3070 Laptop GPU | Average of class Gaming | |
|---|---|---|---|---|---|---|---|
| Power Consumption | -0% | 31% | 49% | 5% | 42% | 46% | |
| Idle Minimum * (Watt) | 64 | 55 14% | 17.5 73% | 4 94% | 55 14% | 10 84% | 13.3 ? 79% |
| Idle Average * (Watt) | 67 | 68.2 -2% | 20.1 70% | 10 85% | 59 12% | 12 82% | 19 ? 72% |
| Idle Maximum * (Watt) | 76 | 72.5 5% | 47.3 38% | 19 75% | 63 17% | 16 79% | 24.5 ? 68% |
| Load Average * (Watt) | 138 | 149.2 -8% | 107.3 22% | 114 17% | 141 -2% | 124 10% | 108.1 ? 22% |
| Witcher 3 ultra * (Watt) | 230 | 233 -1% | 225 2% | 183.2 20% | 238 -3% | 204 11% | |
| Load Maximum * (Watt) | 233 | 255.8 -10% | 277.7 -19% | 221 5% | 259 -11% | 272 -17% | 254 ? -9% |
* ... smaller is better
Power Consumption The Witcher 3 / Stress Test
Power Consumption With External Monitor
Battery Life
The high power consumption of the laptop leads to a meager battery life. In the WLAN test loading websites via a script and the video test playing the short film Big Buck Bunny (H.264 coding, FHD) in a loop, the 15.6-inch laptop lasts for 0:57 h and 0:56 h respectively. The Power Saving profile brings only an minor improvement of the WLAN runtime to 1:14 h. The battery serves more as an emergency backup here.
| Schenker XMG Apex 15 Max R9 5900X, GeForce RTX 3070 Laptop GPU, 62 Wh | Eurocom Nightsky ARX315 R9 5900X, GeForce RTX 3070 Laptop GPU, 62 Wh | MSI Vector GP66 12UGS i9-12900H, GeForce RTX 3070 Ti Laptop GPU, 65 Wh | HP Omen 16-b1090ng i7-12700H, GeForce RTX 3070 Ti Laptop GPU, 83 Wh | Schenker XMG Apex 15 NH57AF1 R9 3900, GeForce RTX 2070 Mobile, 62 Wh | Gigabyte A5 X1 R9 5900HX, GeForce RTX 3070 Laptop GPU, 48.96 Wh | Average of class Gaming | |
|---|---|---|---|---|---|---|---|
| Battery runtime | 0% | 395% | 502% | -6% | 556% | 569% | |
| Reader / Idle (h) | 1 | 7.9 690% | 10.1 910% | 1.2 20% | 10.1 910% | 8.71 ? 771% | |
| H.264 (h) | 0.9 | 7.3 711% | 8.26 ? 818% | ||||
| WiFi v1.3 (h) | 1 | 1 0% | 5.7 470% | 5.6 460% | 1 0% | 6.4 540% | 7.01 ? 601% |
| Load (h) | 0.8 | 1 25% | 1.9 137% | 0.5 -37% | 1.3 63% | 1.47 ? 84% |
Pros
Cons
Verdict - A gaming laptop for a limited user group
The Schenker XMG Apex 15 Max has to be seen as a hybrid of a gaming laptop, DTR laptop, and workstation. The laptop is designed to be able to produce a constant high performance - and the Apex doesn't disappoint in this regard. The laptop can handle FHD gaming at maximum settings without any trouble.
The Schenker XMG Apex 15 Max delivers a lot of computing performance but is also very power-hungry.
On the other hand, while the GeForce RTX 3070 Laptop GPU runs constantly at maximum speed, the permanent Ryzen 9 5900X Desktop CPU (socketed, replaceable) only reaches its Turbo speed briefly in multi-thread operation. The cooling options reach their limits here.
The laptop warms up noticeably but doesn't get excessively hot. The noise development is at the usual level for the class - that is to say, it becomes very loud. This is accompanied by a lousy battery life and a huge hunger for power during idle operation. Particularly the latter is hard to explain these days.
There aren't too many laptops with a replaceable desktop CPU and without an integrated GPU in our database. Among the "regular" gaming laptops, the MSI Vector GP66 12UGS would be an alternative. While it can offer even slightly more performance than the Apex at times, it is also able to bring a significantly longer battery life at the same time.
Price and Availability
The Schenker XMG Apex 15 Max (early 2022) can be configured individually in the Schenker online shop. The equipment configuration that was provided to us is available for almost 2300 Euros (~$2433), and entry models are available starting from about 1400 Euros (~$1481).
Schenker XMG Apex 15 Max
- 06/22/2022 v7 (old)
Sascha Mölck
Price comparison

