Running an AMD Ryzen 9 5900X on a laptop: Eurocom Nightsky ARX15 review
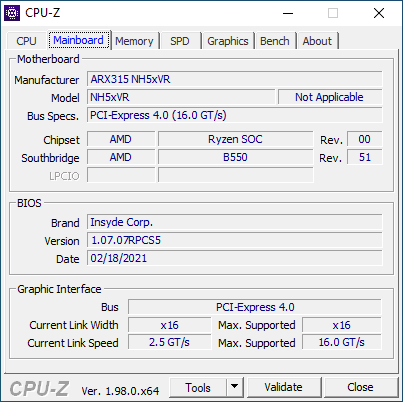
Not to be confused with the Nightsky RX15, the Nightsky ARX15 utilizes desktop AMD CPUs and a different chassis than its Intel counterpart. Its paper specifications alone should make the ARX15 one of the fastest 15.6-inch laptops you can buy in terms of raw CPU performance. The configuration we have in review retails for around $3400 USD with much lower or higher prices available depending on storage.
Additional information on the Nightsky ARX15 can be found on its official page here. The chassis is based off of the Clevo NH57AF1 and so users will find many similarities between the Eurocom Nightsky ARX15 and the Schenker XMG Apex 15.
More Eurocom reviews:
Potential Competitors in Comparison
Rating | Date | Model | Weight | Height | Size | Resolution | Price |
|---|---|---|---|---|---|---|---|
| 83 % v7 (old) | 01 / 2022 | Eurocom Nightsky ARX315 R9 5900X, GeForce RTX 3070 Laptop GPU | 2.6 kg | 32.5 mm | 15.60" | 1920x1080 | |
| 84.1 % v7 (old) | 01 / 2022 | Gigabyte A5 X1 R9 5900HX, GeForce RTX 3070 Laptop GPU | 2.2 kg | 25.3 mm | 15.60" | 1920x1080 | |
| 81.4 % v7 (old) | 12 / 2021 | Medion Erazer Deputy P25 R7 5800H, GeForce RTX 3060 Laptop GPU | 2.3 kg | 26 mm | 15.60" | 1920x1080 | |
| 82.9 % v7 (old) | 10 / 2021 | MSI Delta 15 A5EFK R9 5900HX, Radeon RX 6700M | 2 kg | 19 mm | 15.60" | 1920x1080 | |
| 84.4 % v7 (old) | 11 / 2021 | Schenker XMG Apex 15 NH57E PS R7 5800H, GeForce RTX 3060 Laptop GPU | 2.1 kg | 29 mm | 15.60" | 1920x1080 | |
| 84.6 % v7 (old) | 07 / 2020 | MSI GE66 Raider 10SFS i9-10980HK, GeForce RTX 2070 Super Mobile | 2.4 kg | 23 mm | 15.60" | 1920x1080 |
Case
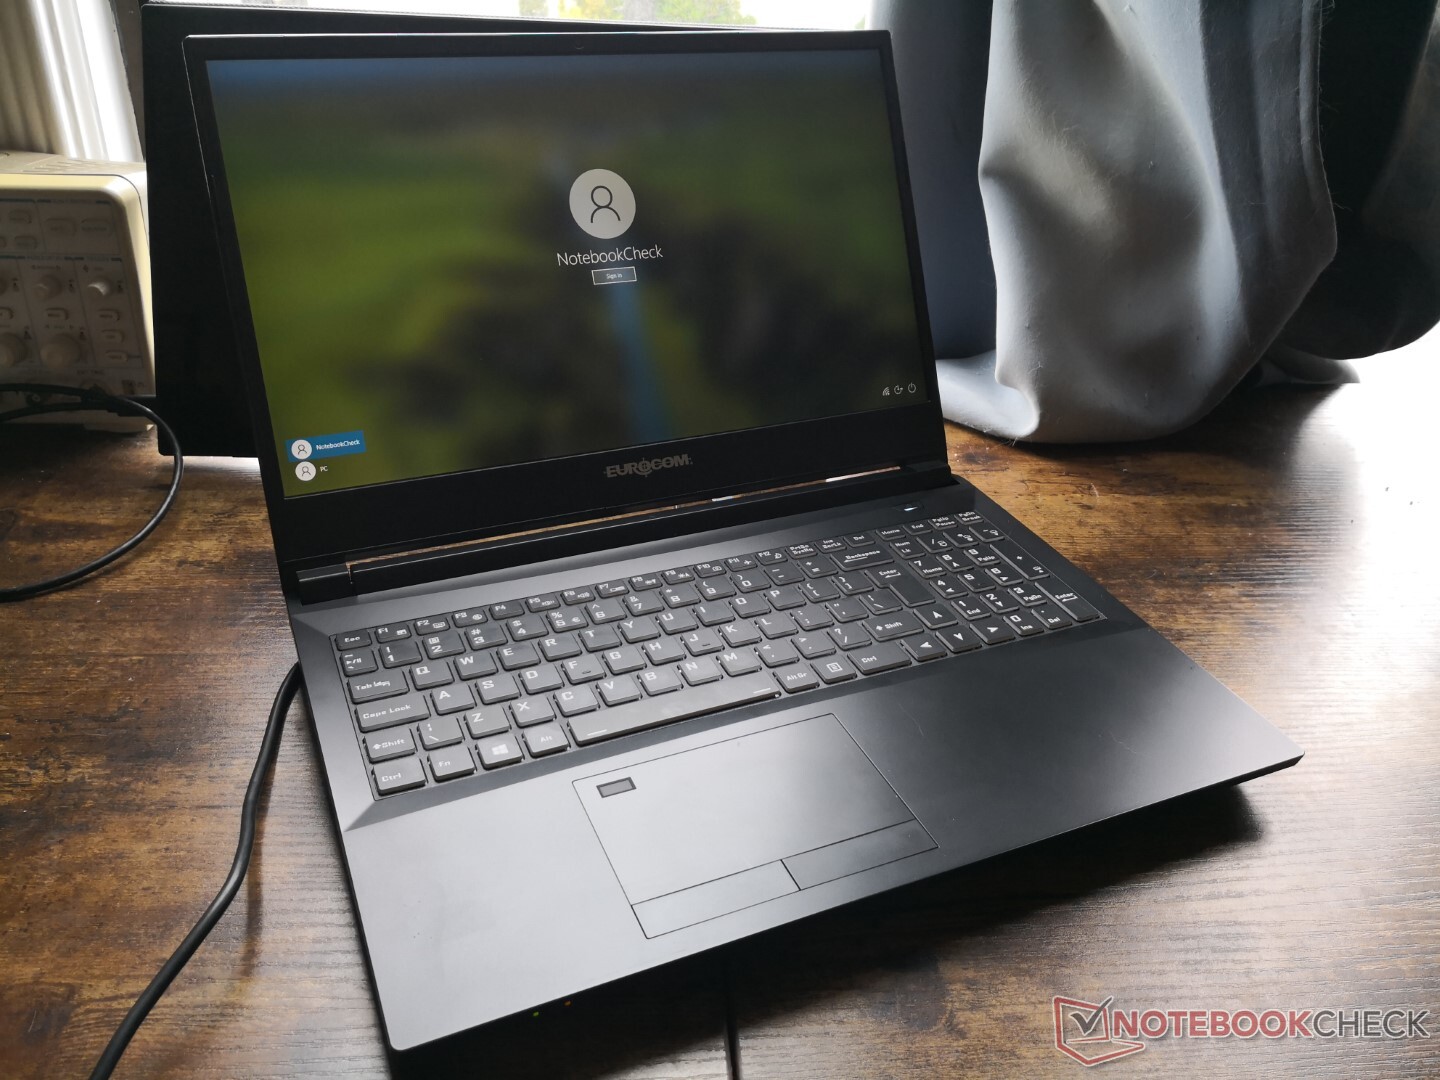
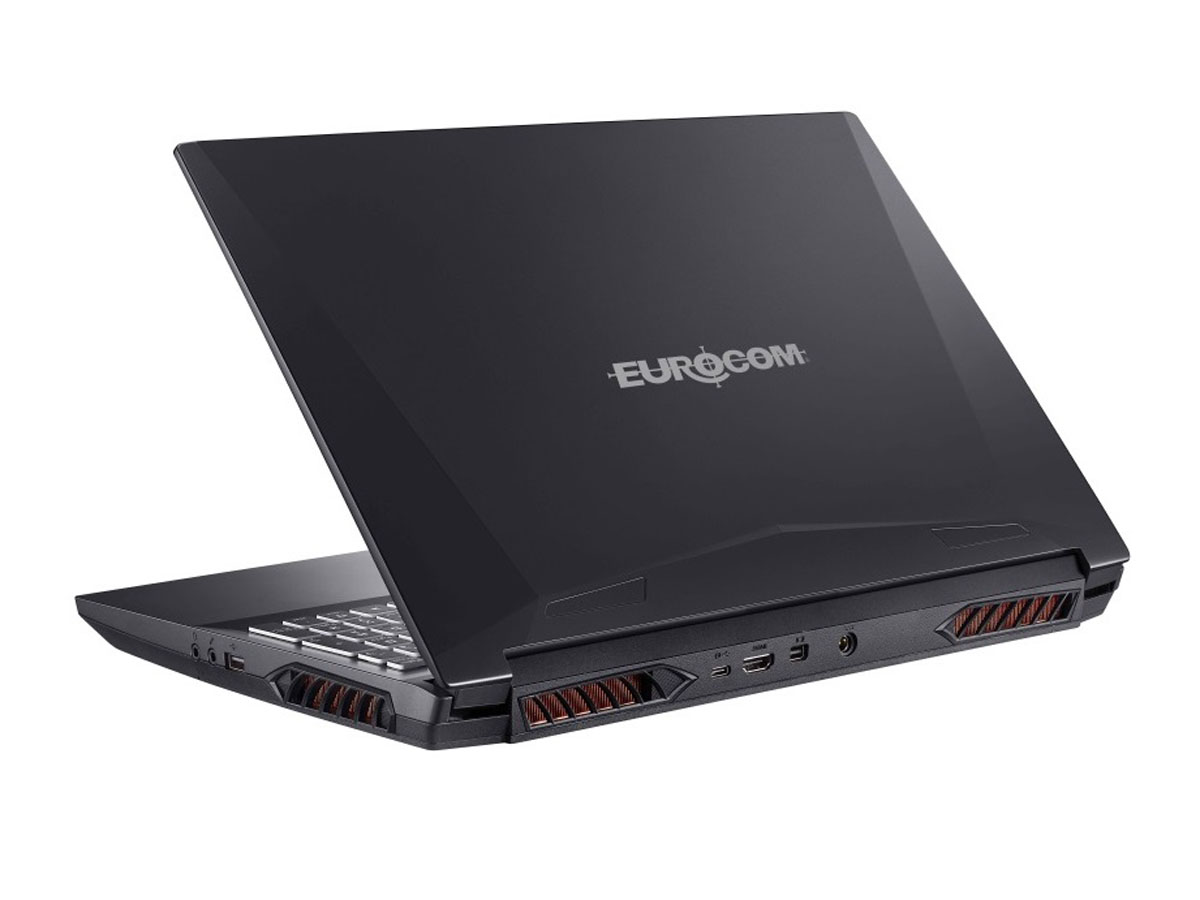
The chassis remains larger and heavier relative to other 15.6-inch gaming laptops with more traditional mobile H-series CPUs like the MSI GE66 or Asus ROG Strix G15. Our chassis impressions on the Schenker Apex 15 apply here for the Nightsky ARX15.
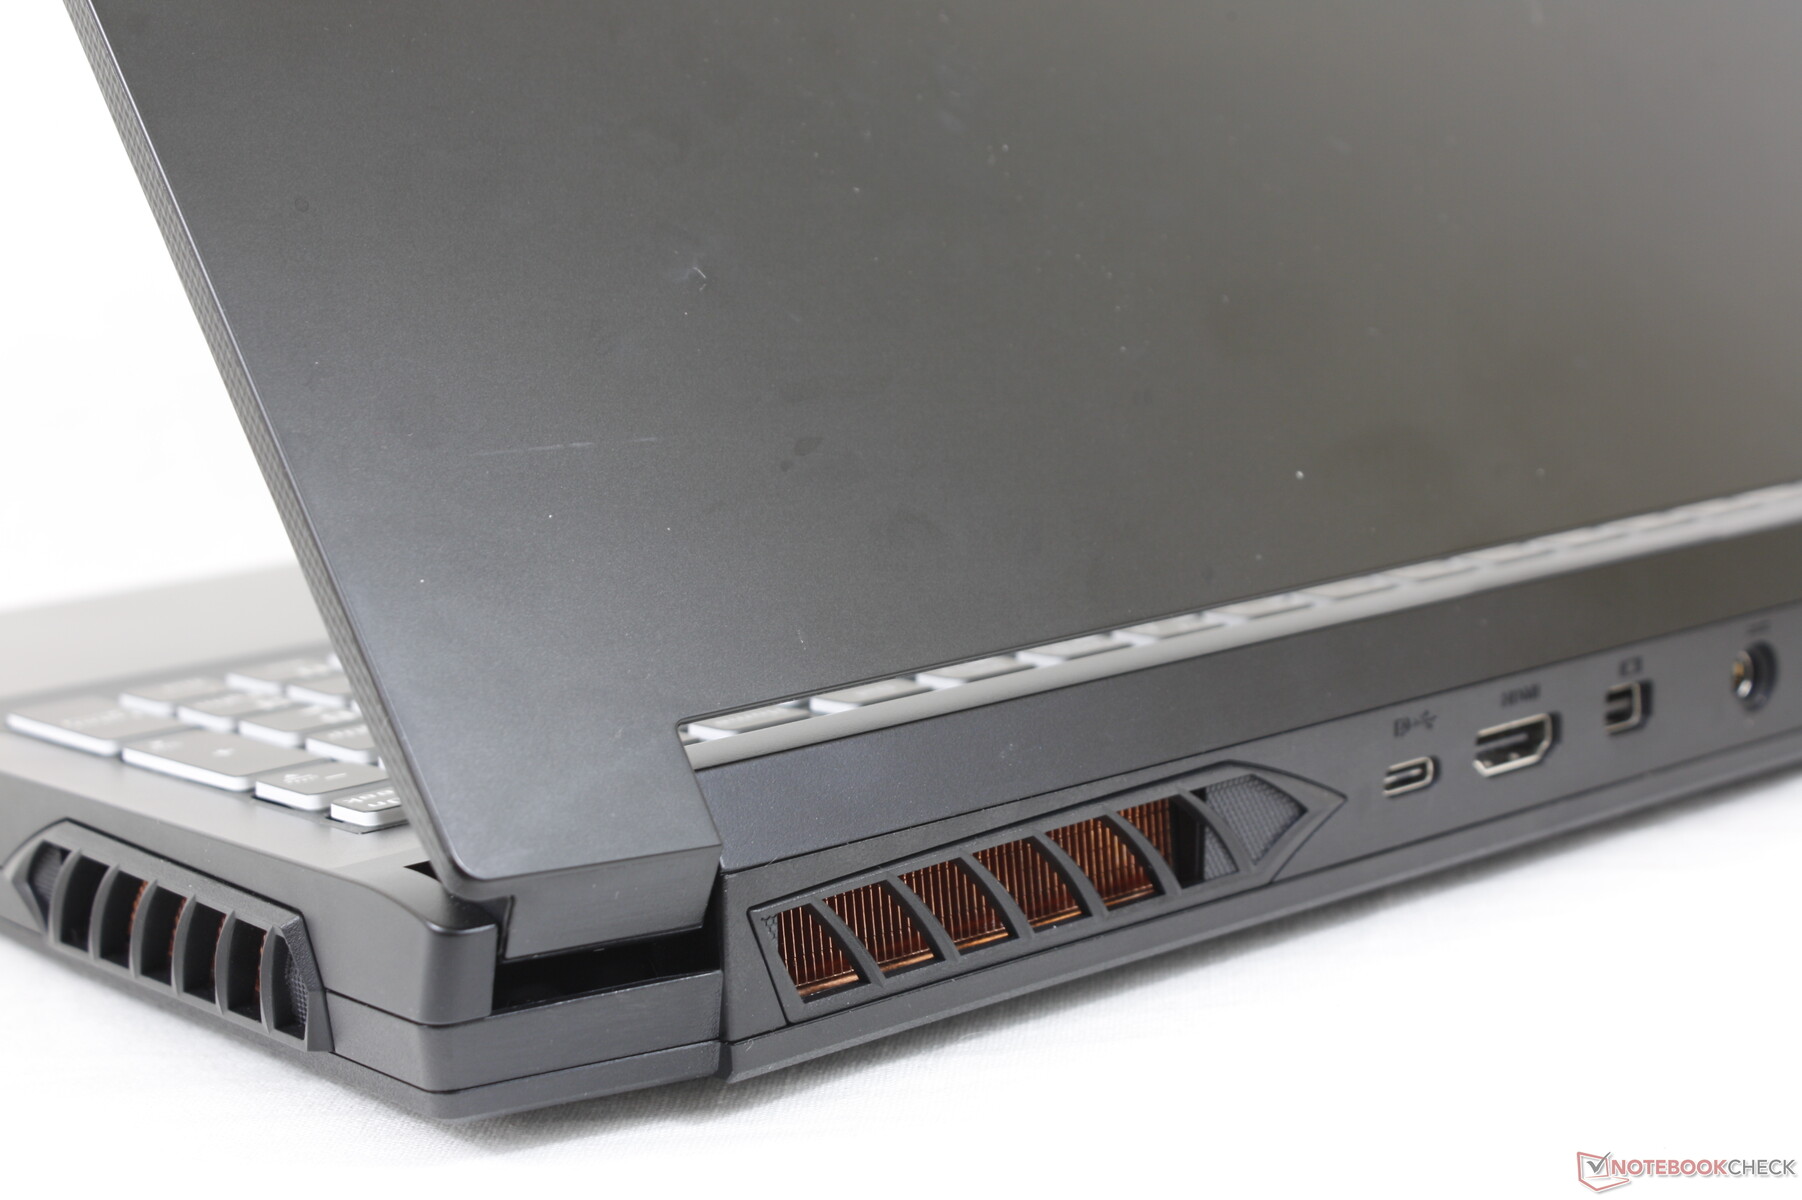
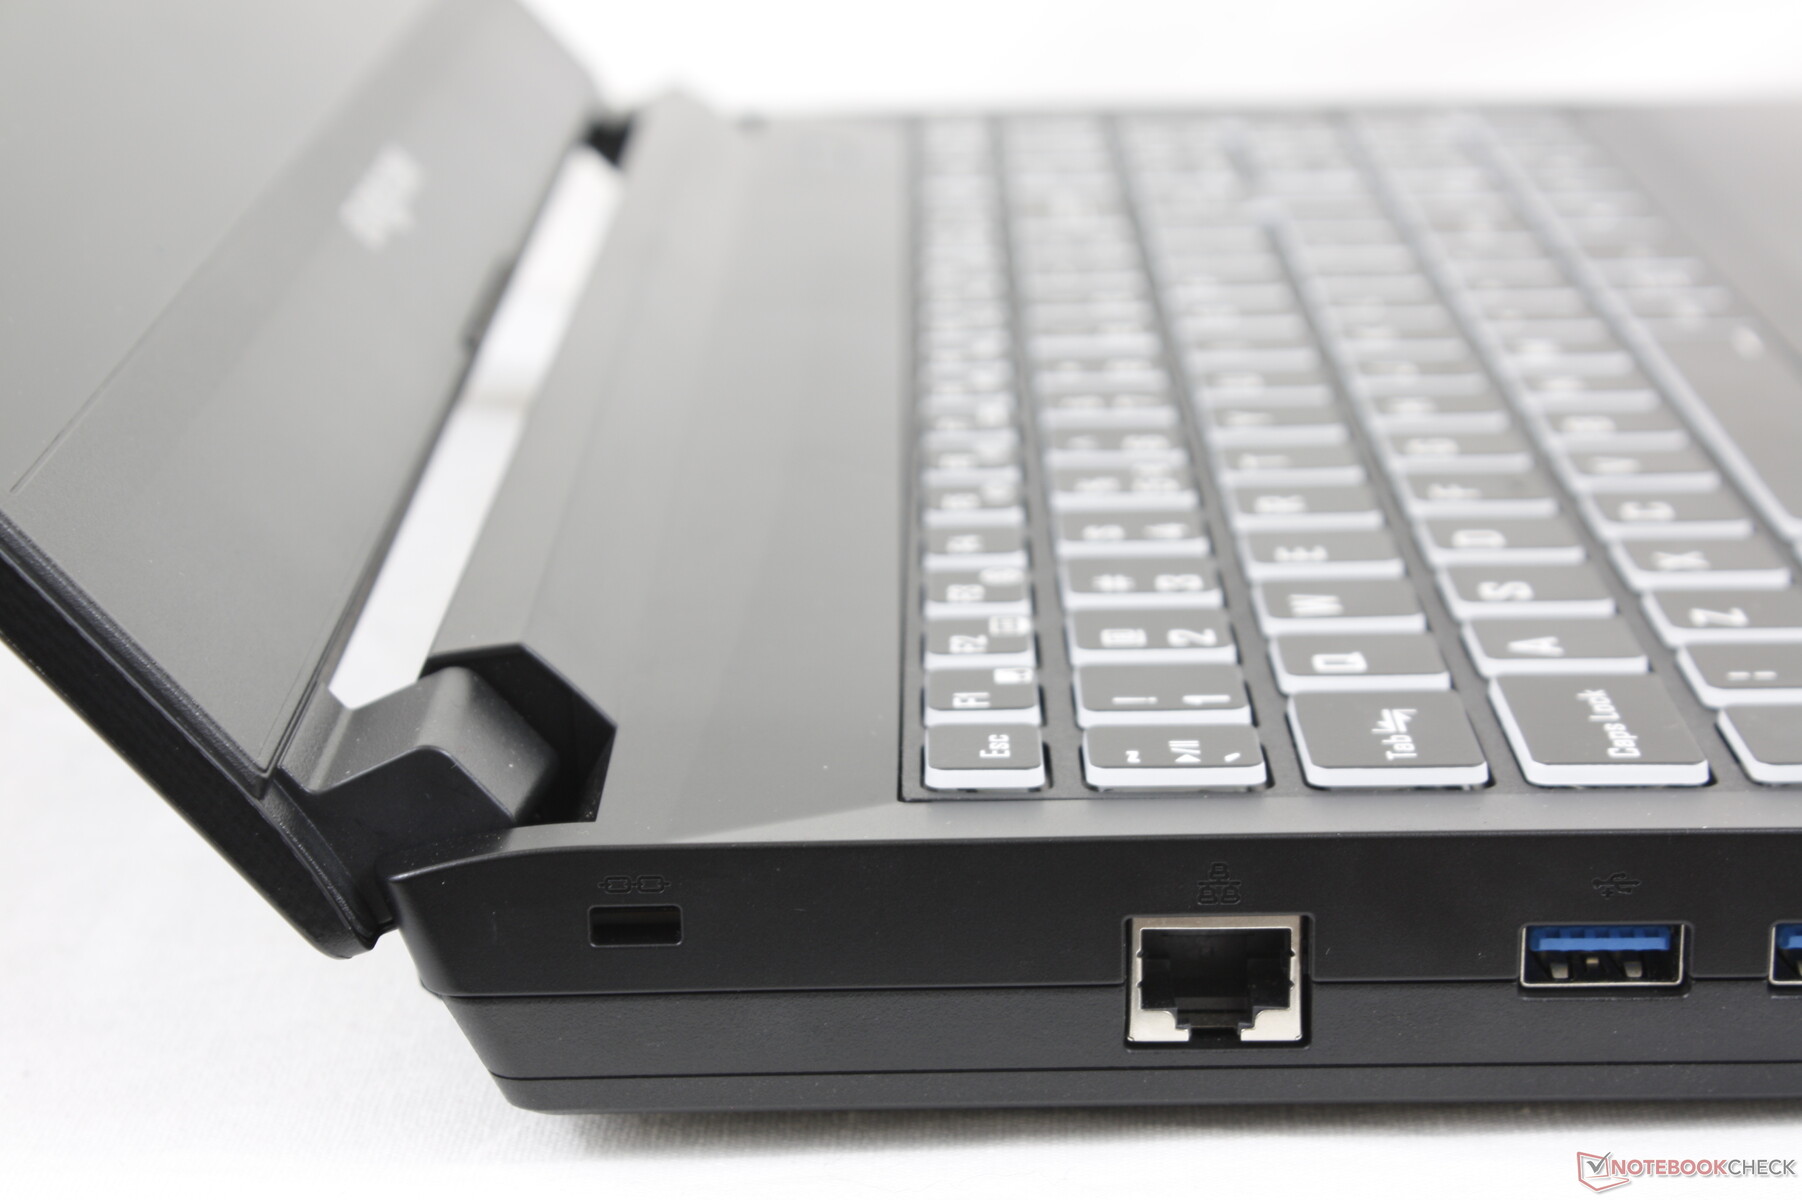
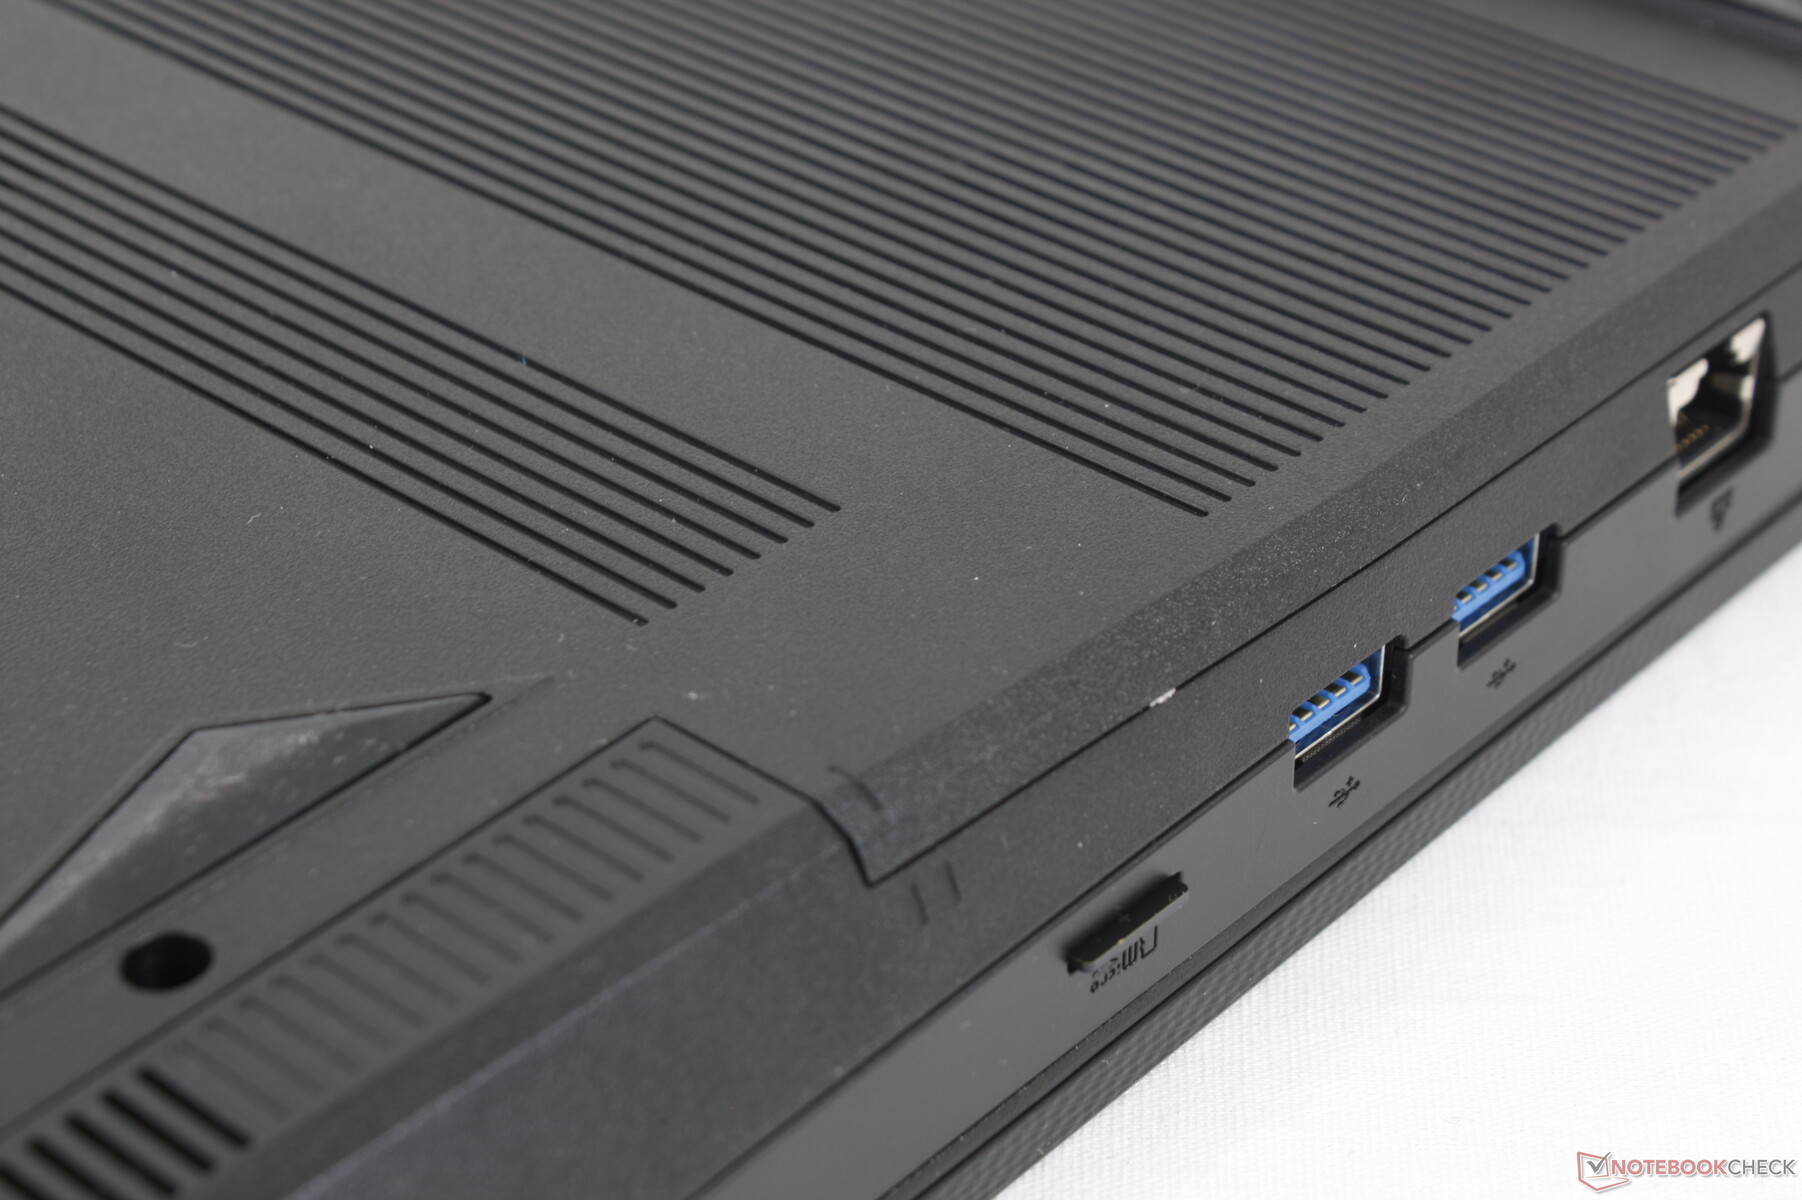
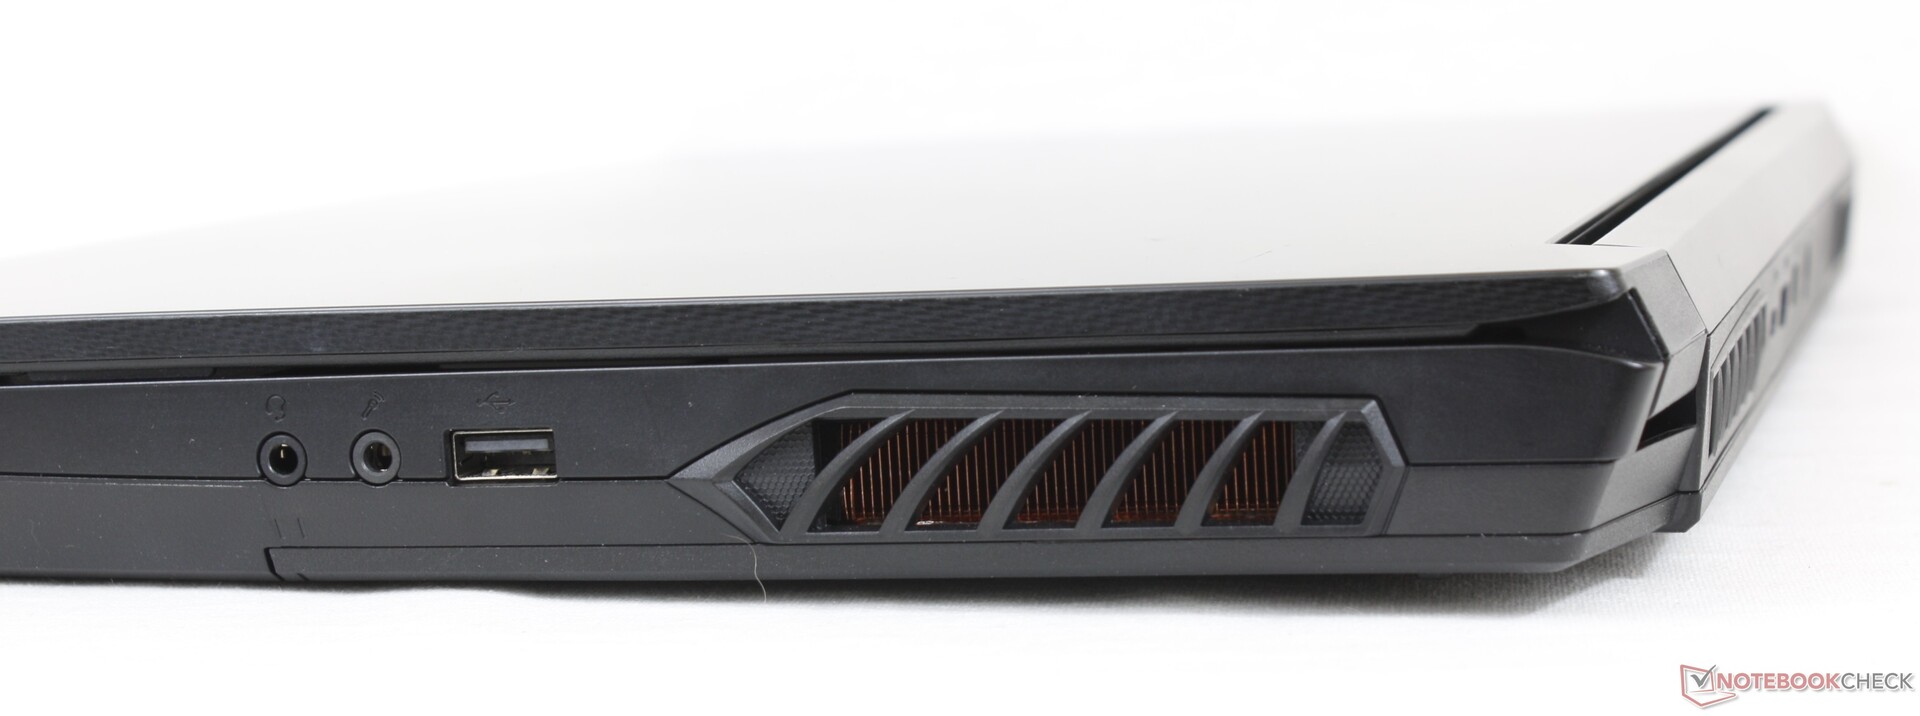
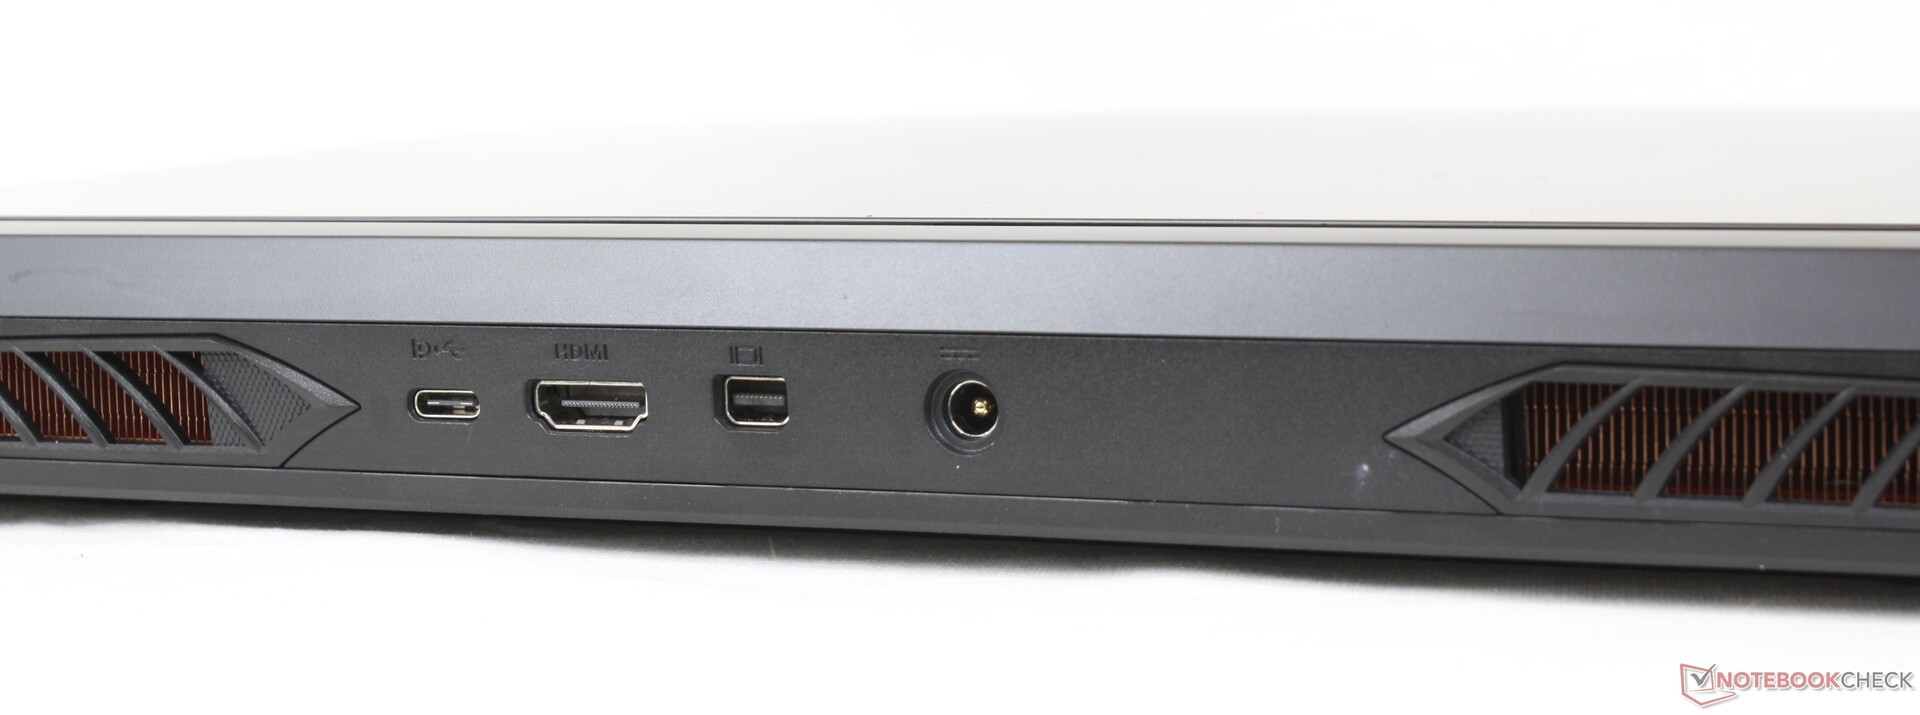
Connectivity
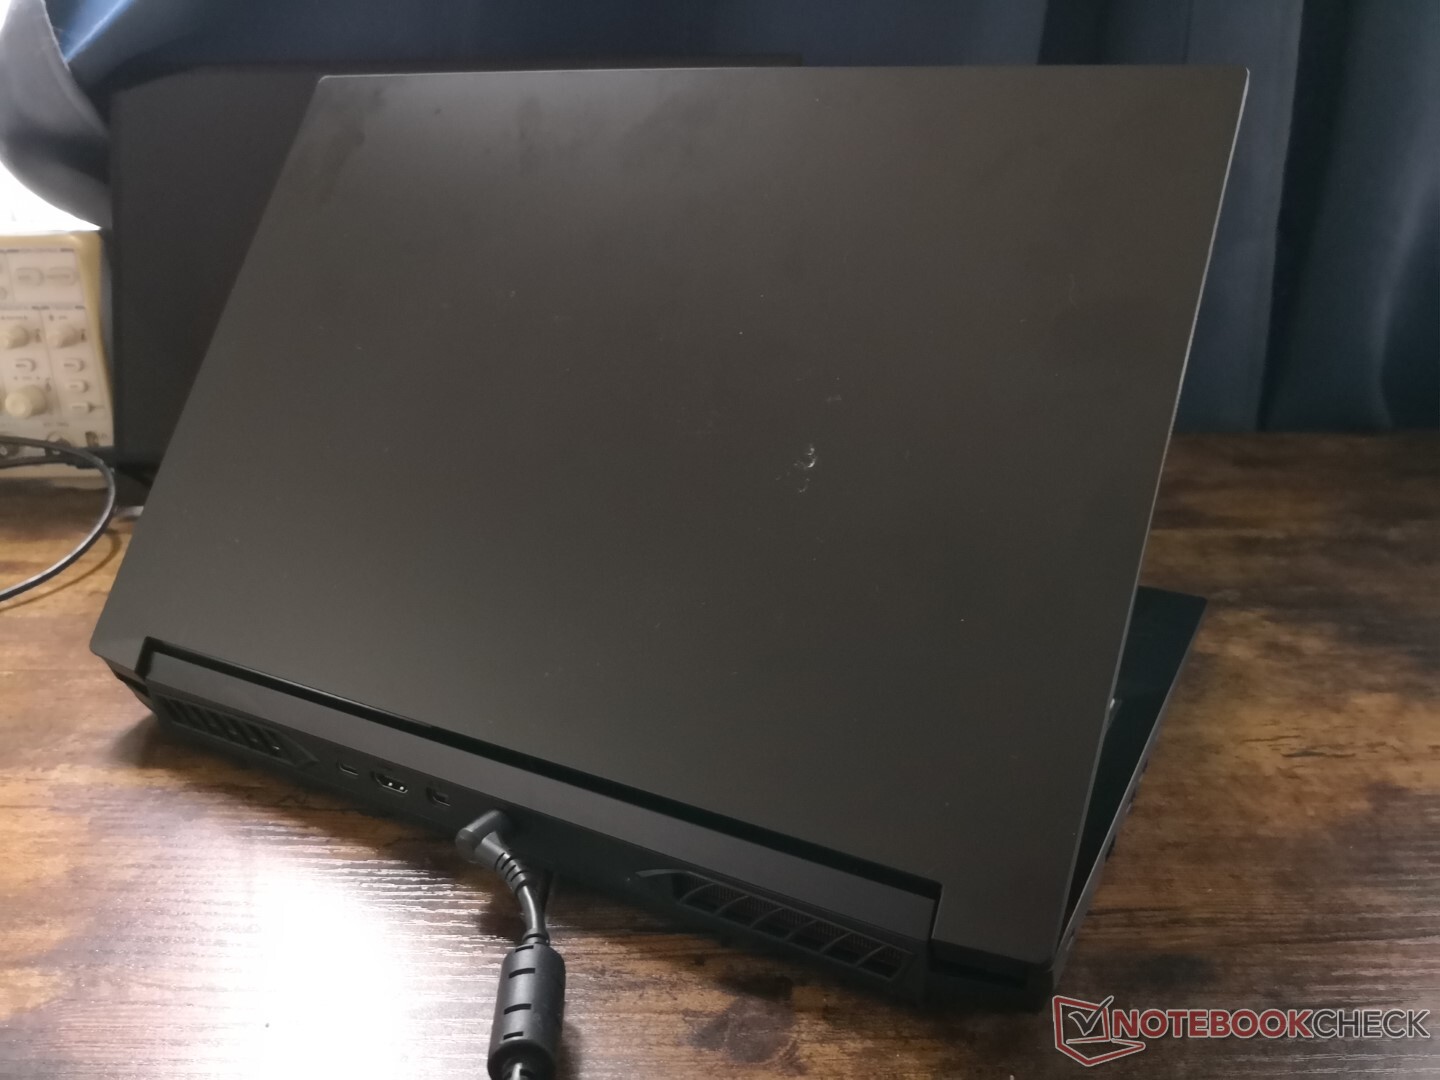
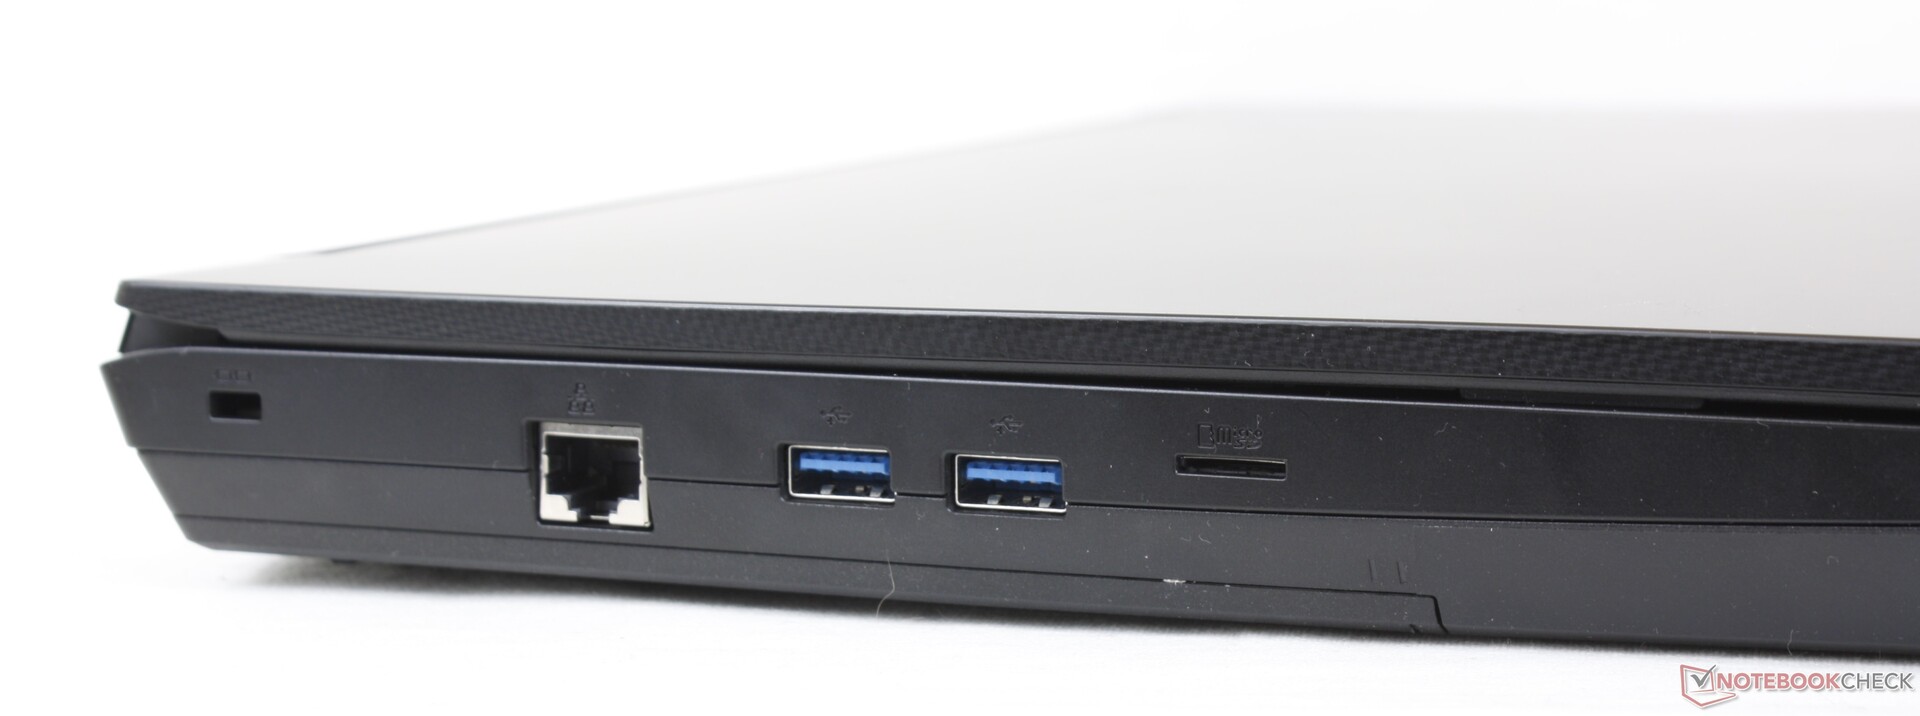
There are fewer port options here when compared to the RX15. There is only one USB-C port instead of two, for example, and it doesn't support Thunderbolt or Power Delivery. In contrast, most MSI, Asus, and Alienware laptops have the option to recharge via USB-C.
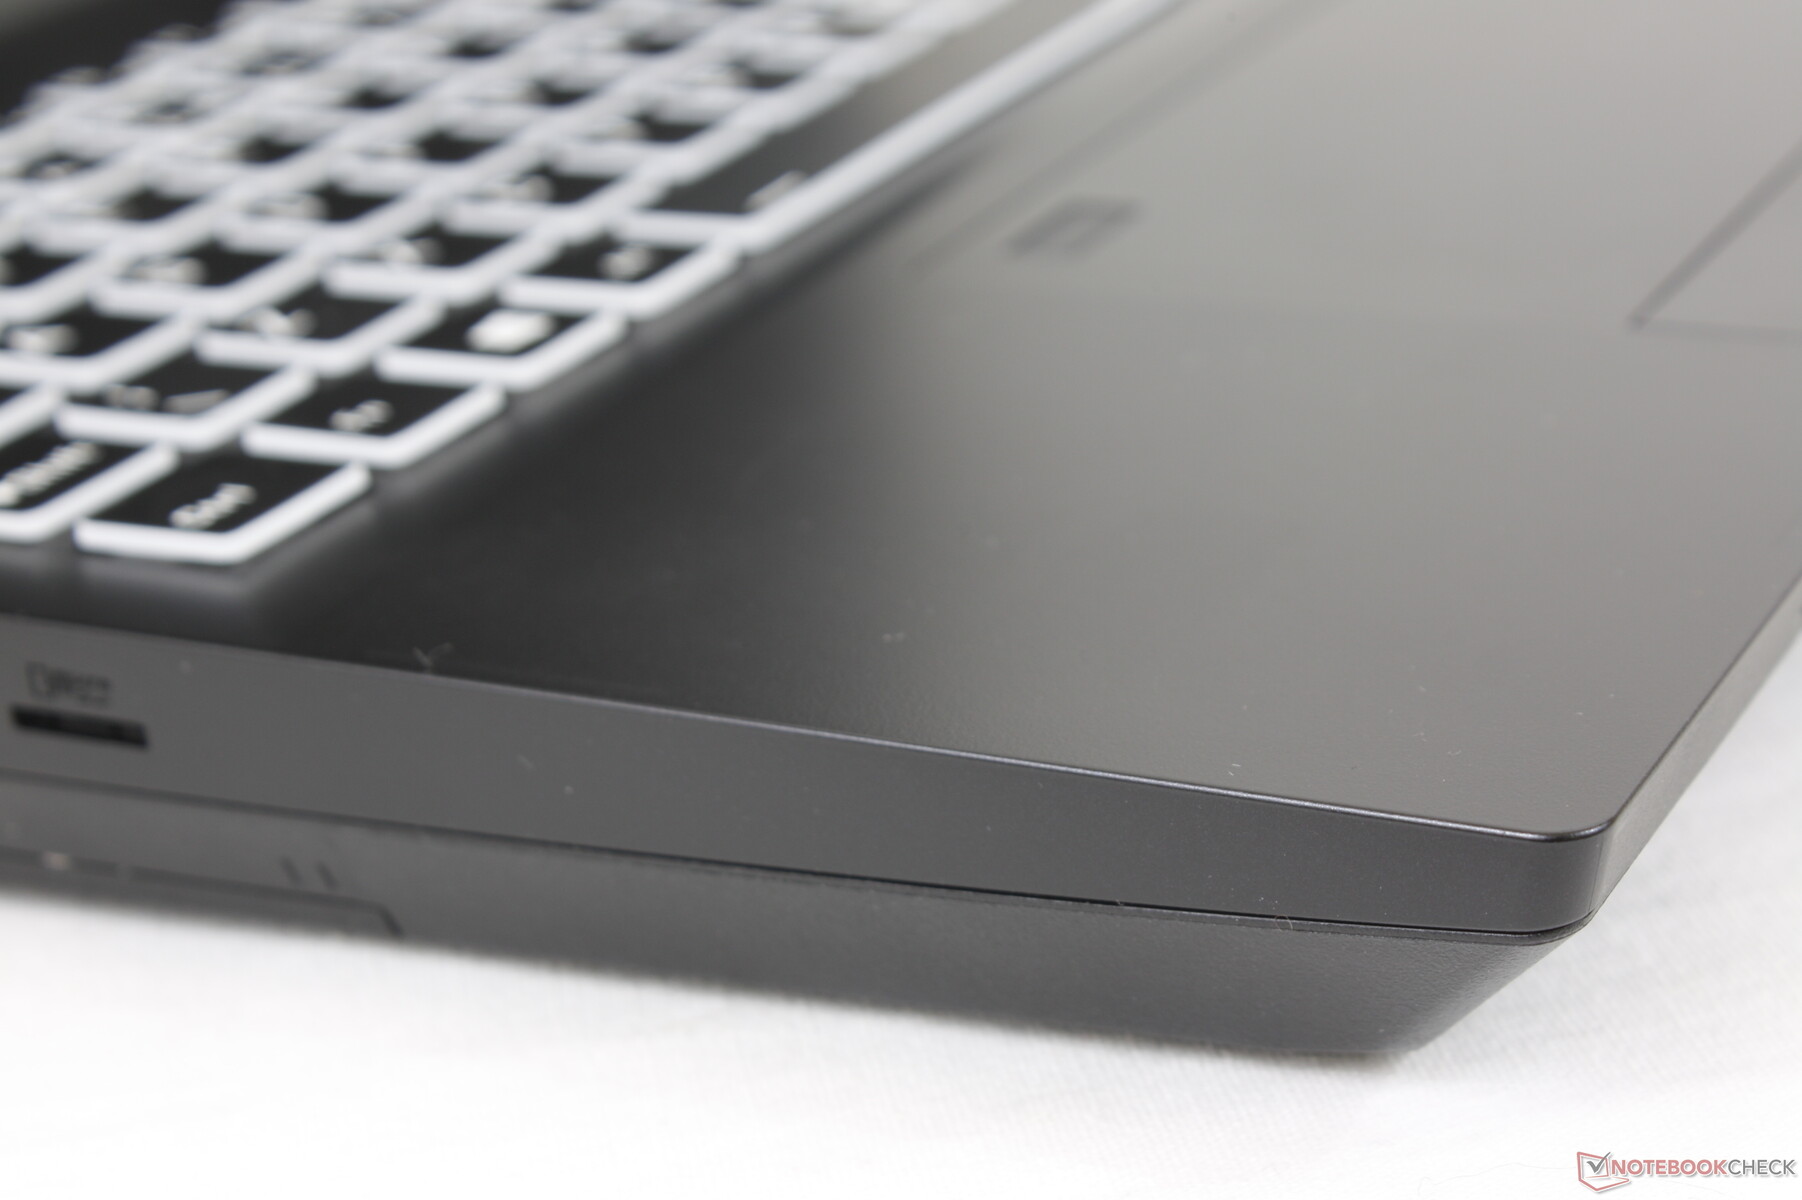
SD Card Reader
Transfer rates from the integrated MicroSD reader are decent but still disappointing relative to the price of the system. Moving 1 GB of pictures from our UHS-II test card to desktop takes about 15 seconds compared to less than half that on the MSI GE66 Raider 10SFS.
| SD Card Reader | |
| average JPG Copy Test (av. of 3 runs) | |
| MSI GE66 Raider 10SFS (Toshiba Exceria Pro SDXC 64 GB UHS-II) | |
| Eurocom Nightsky ARX315 (AV Pro V60) | |
| maximum AS SSD Seq Read Test (1GB) | |
| MSI GE66 Raider 10SFS (Toshiba Exceria Pro SDXC 64 GB UHS-II) | |
| Eurocom Nightsky ARX315 (AV Pro V60) | |
Communication
Webcam
The system comes equipped with a 720p webcam whereas the Eurocom Sky X4C comes with a higher resolution 1080p webcam. There is no privacy shutter or IR camera. Instead, there is an Fn key to disable the camera electronically.


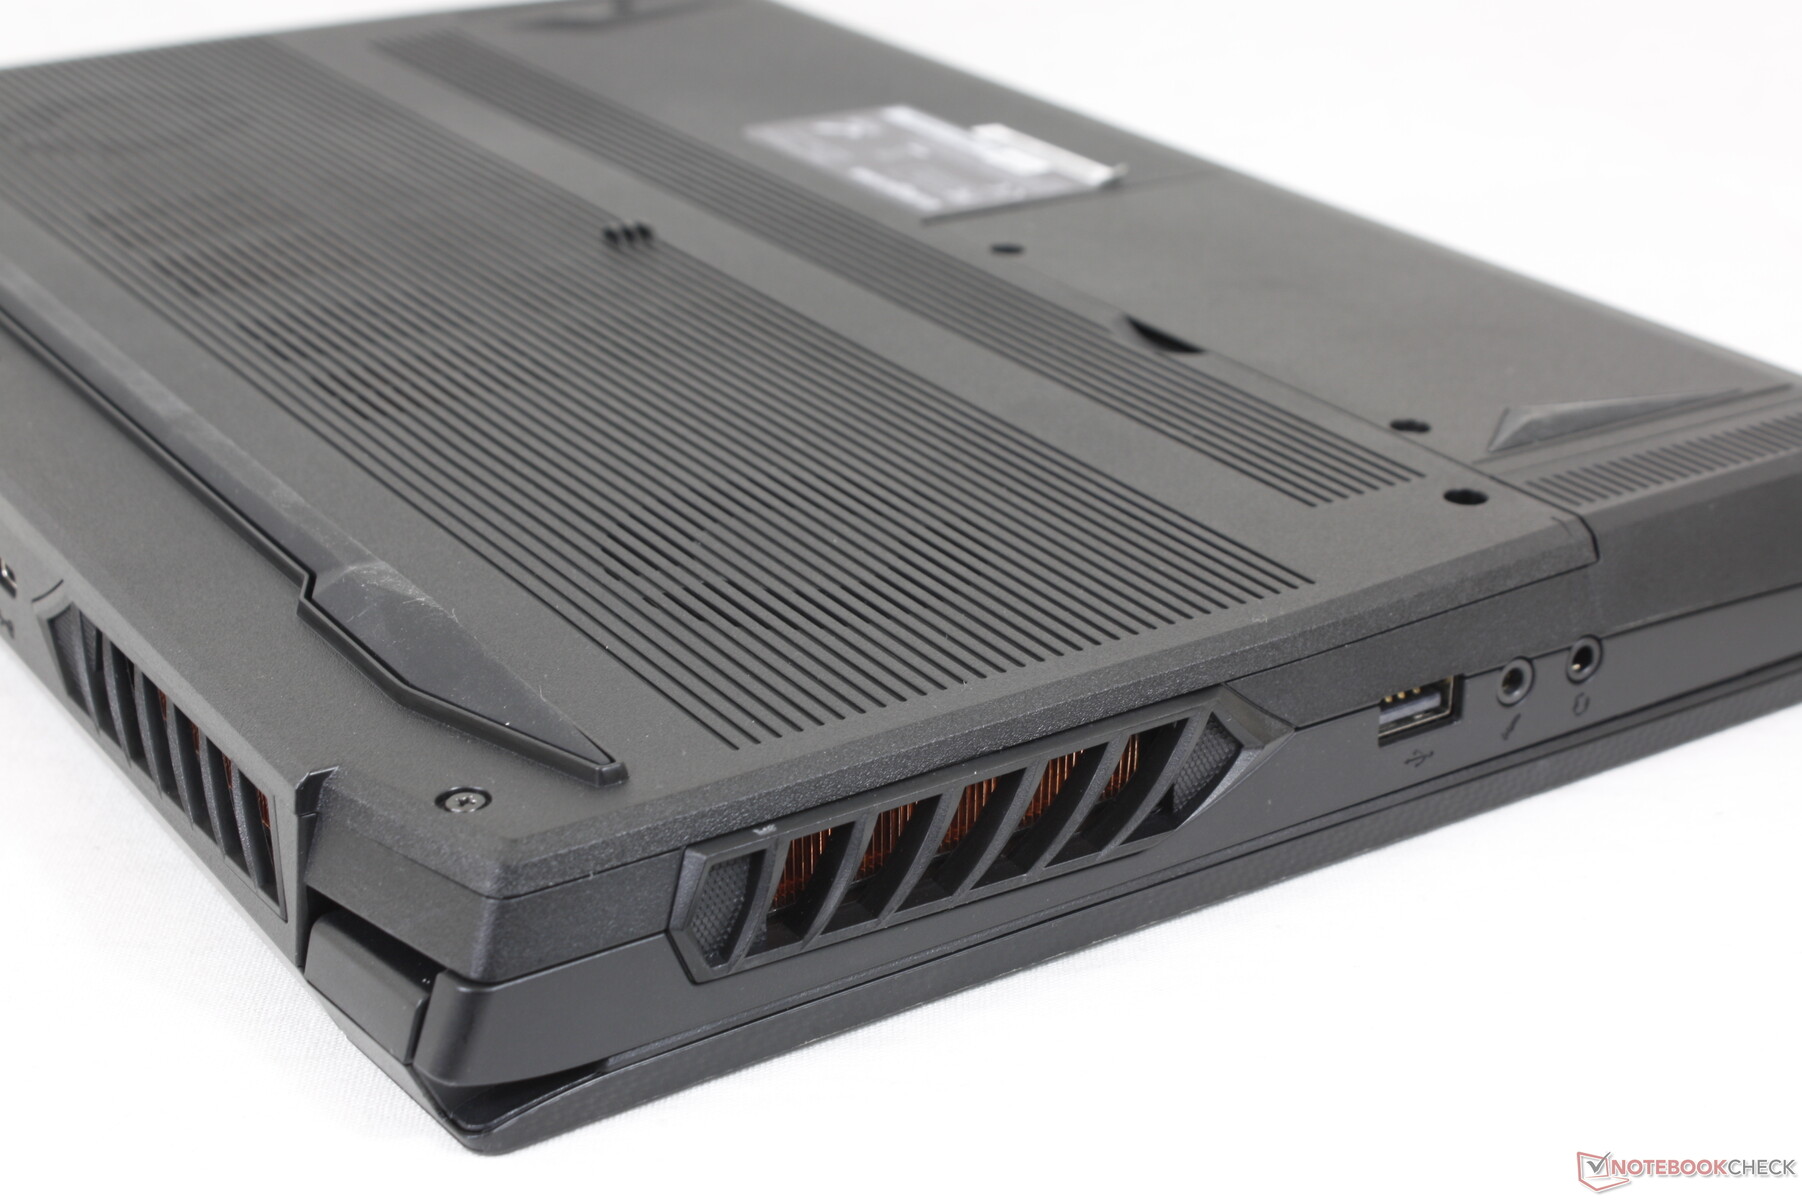
Maintenance
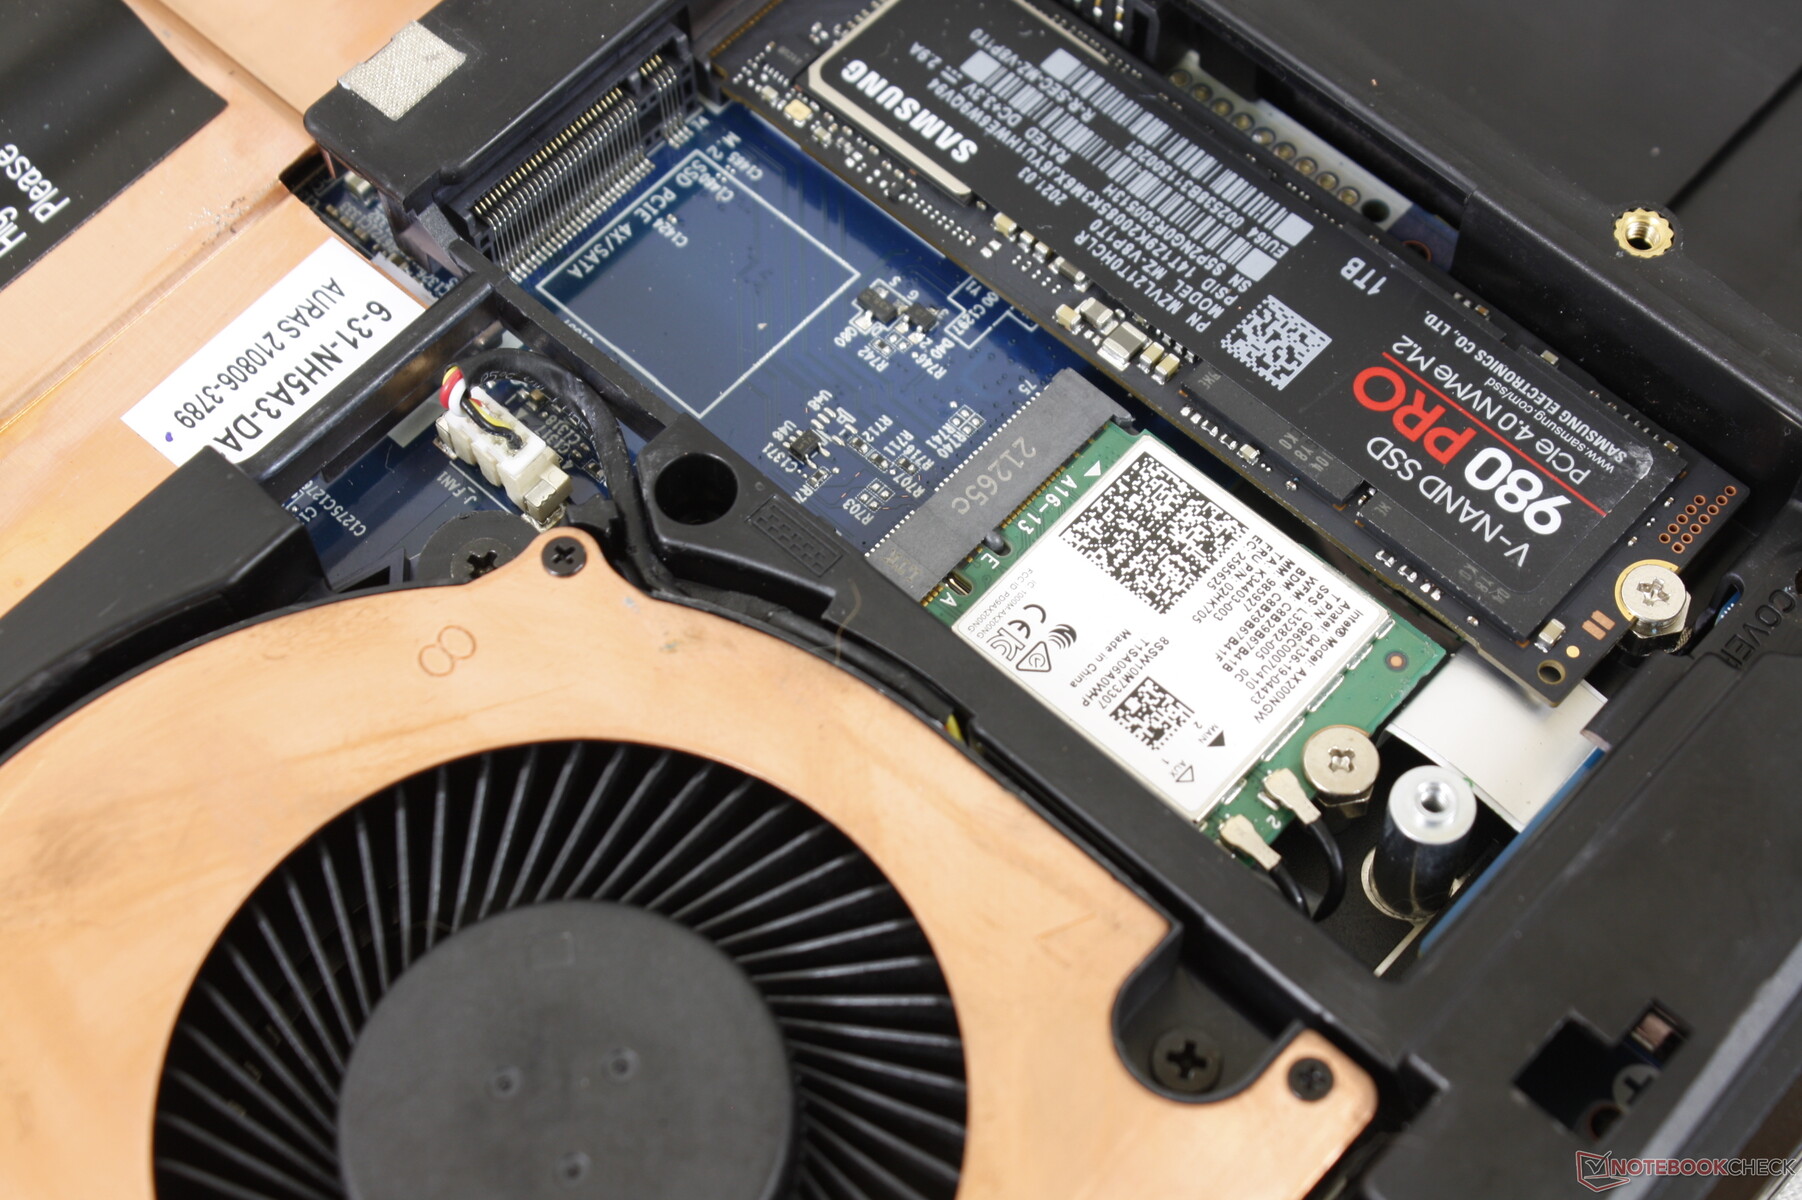
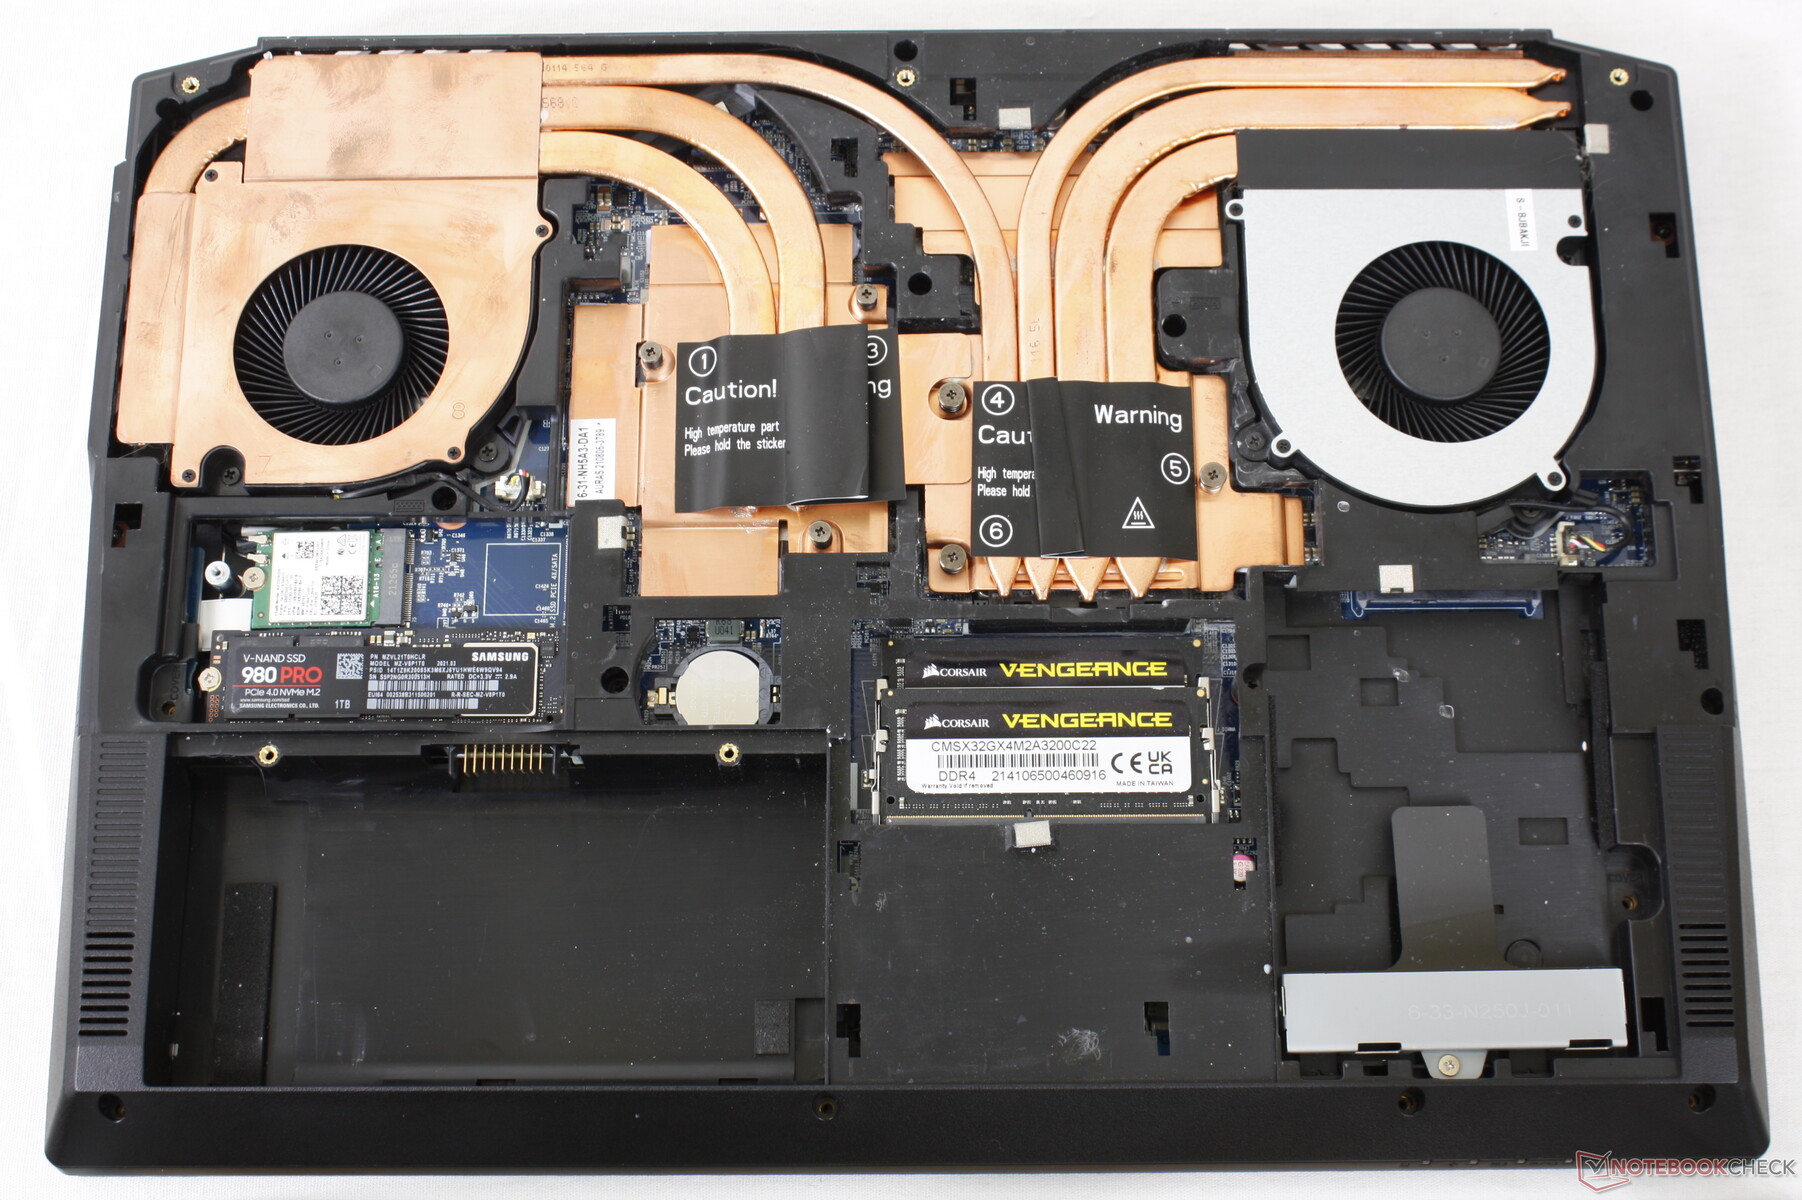
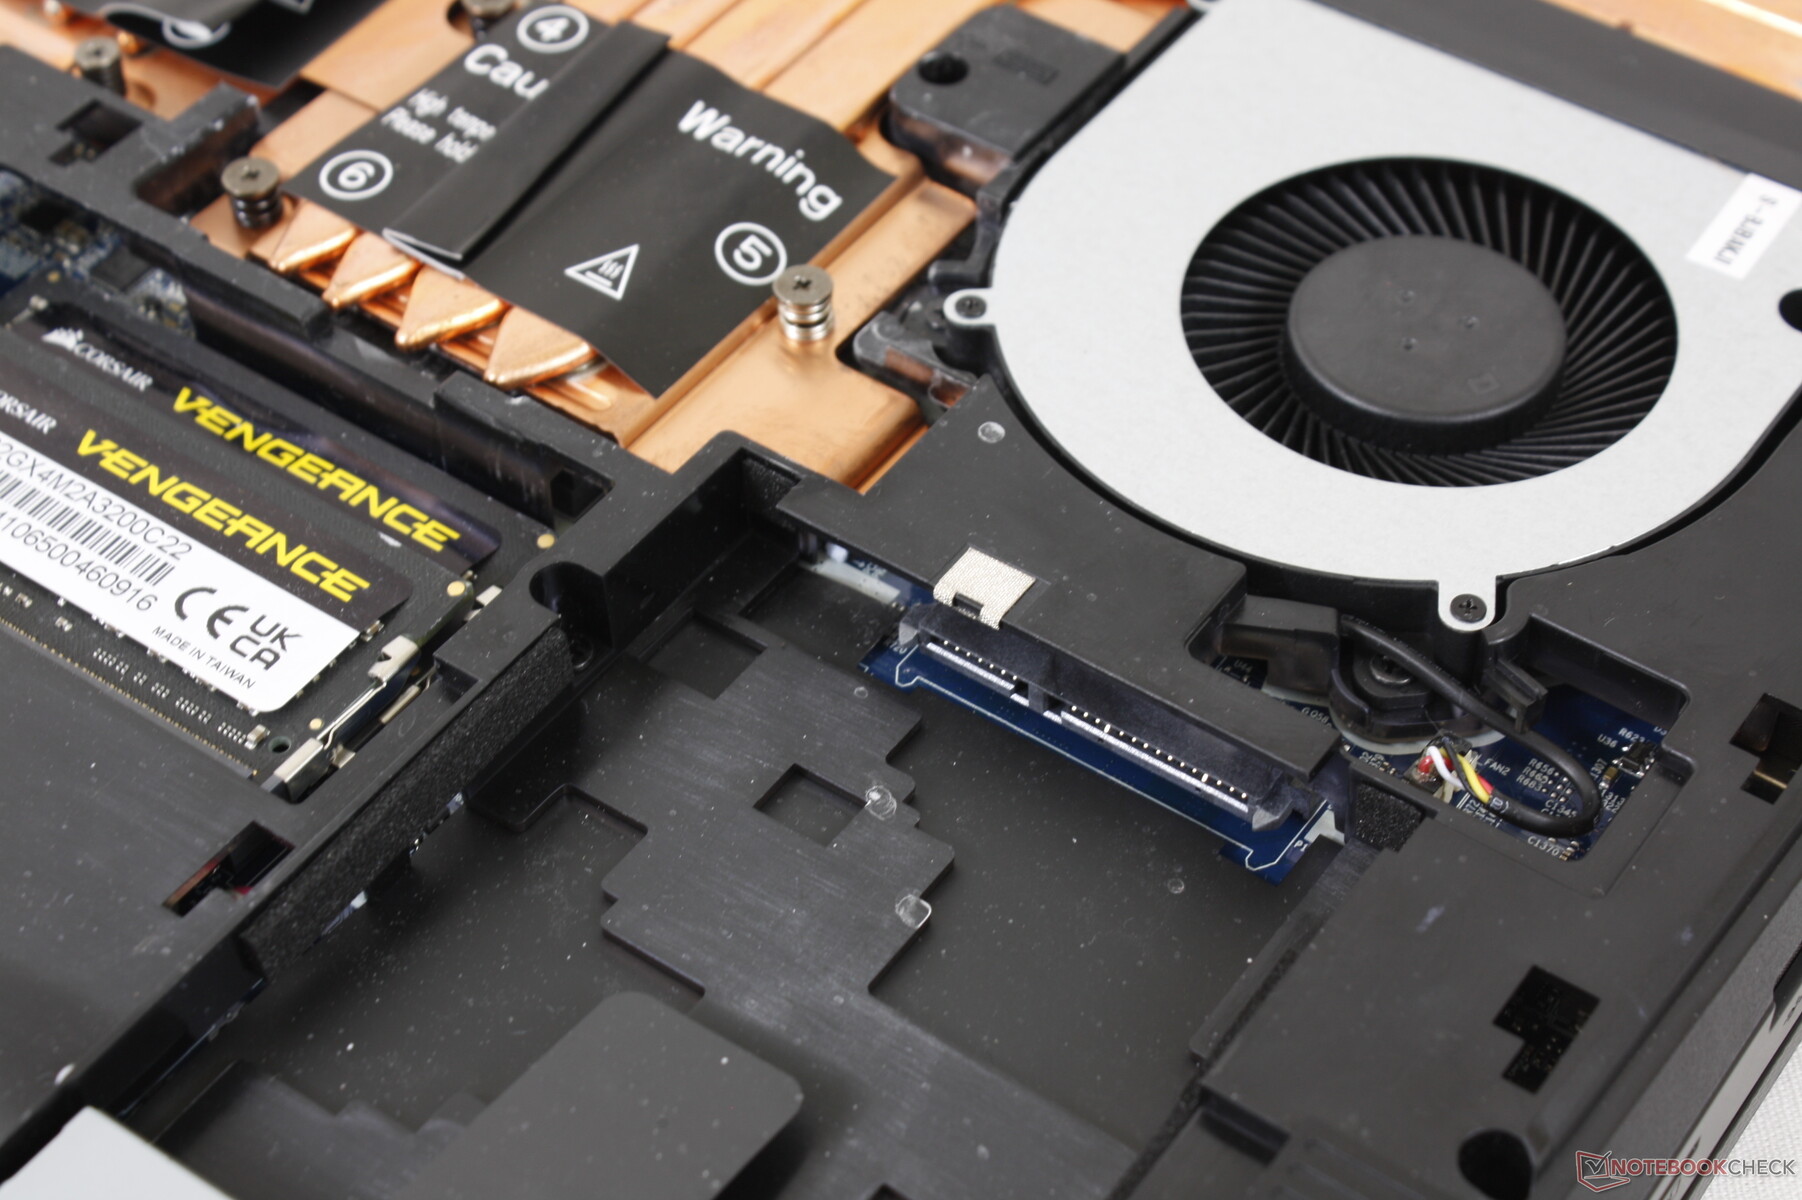
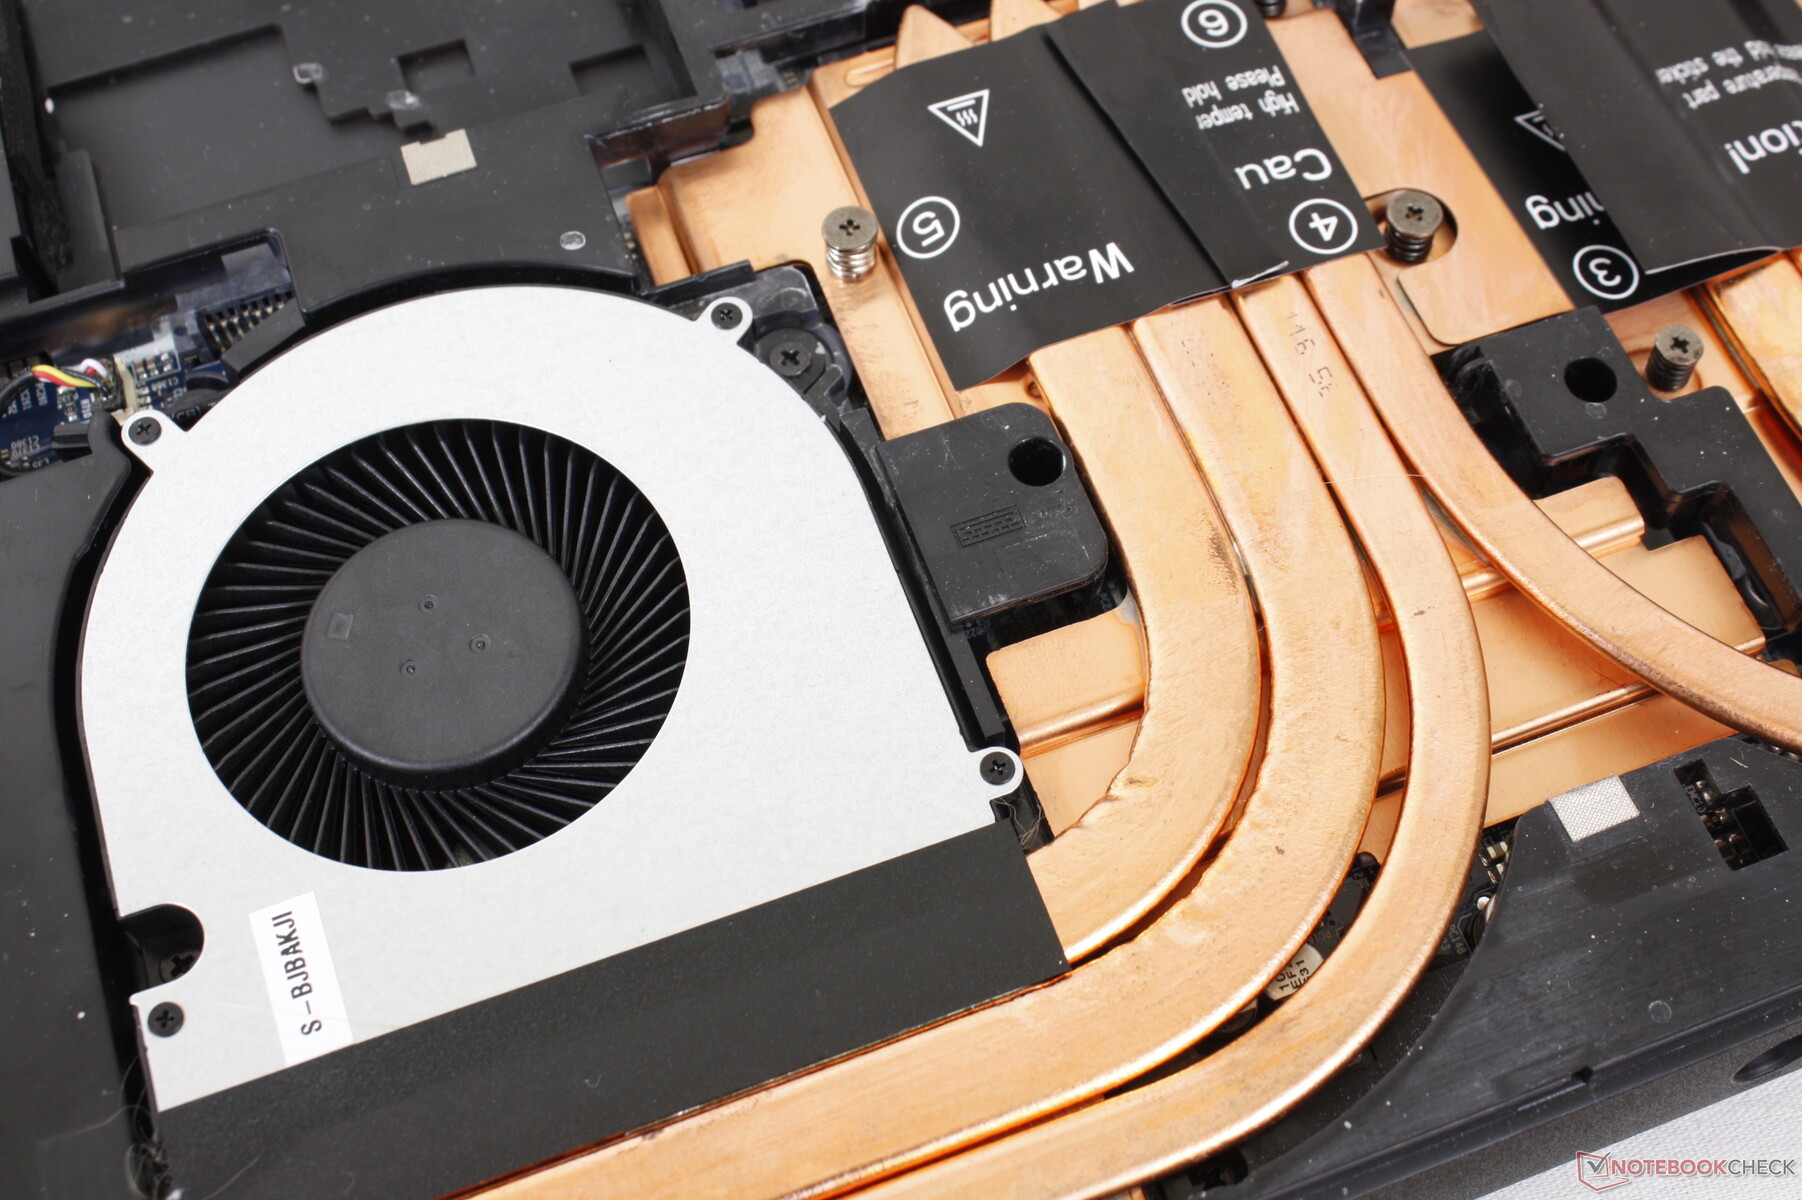
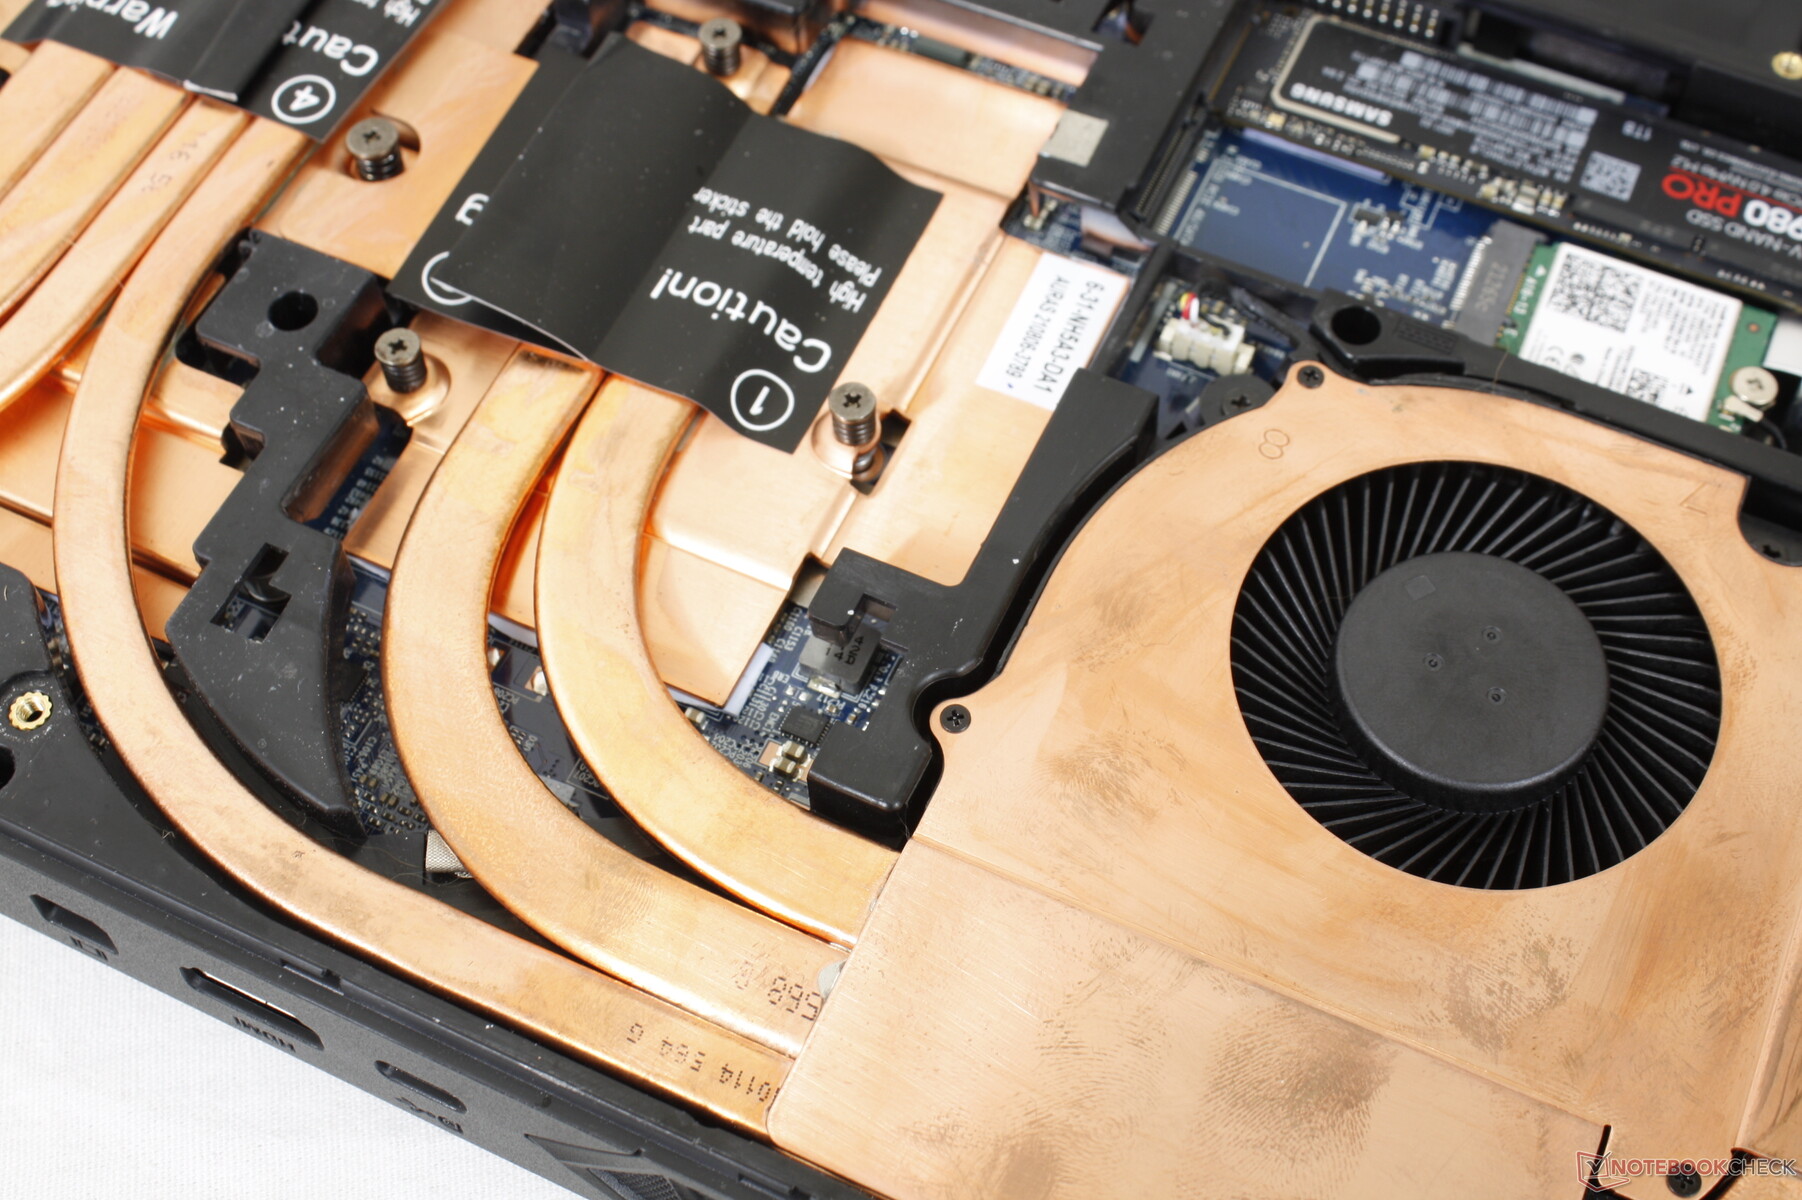
The bottom panel pops off easily after removing the five Philips screws. Users have direct access to all common components including the two DDR4 SODIMM slots and three storage bays.
Accessories and Warranty
The retail box includes a manual, drivers disk, Windows 10 USB drive, additional screws, SSD thermal pad, and two 0.6g thermal paste syringes. The standard one-year limited warranty applies with the option to extend up to 3 years.
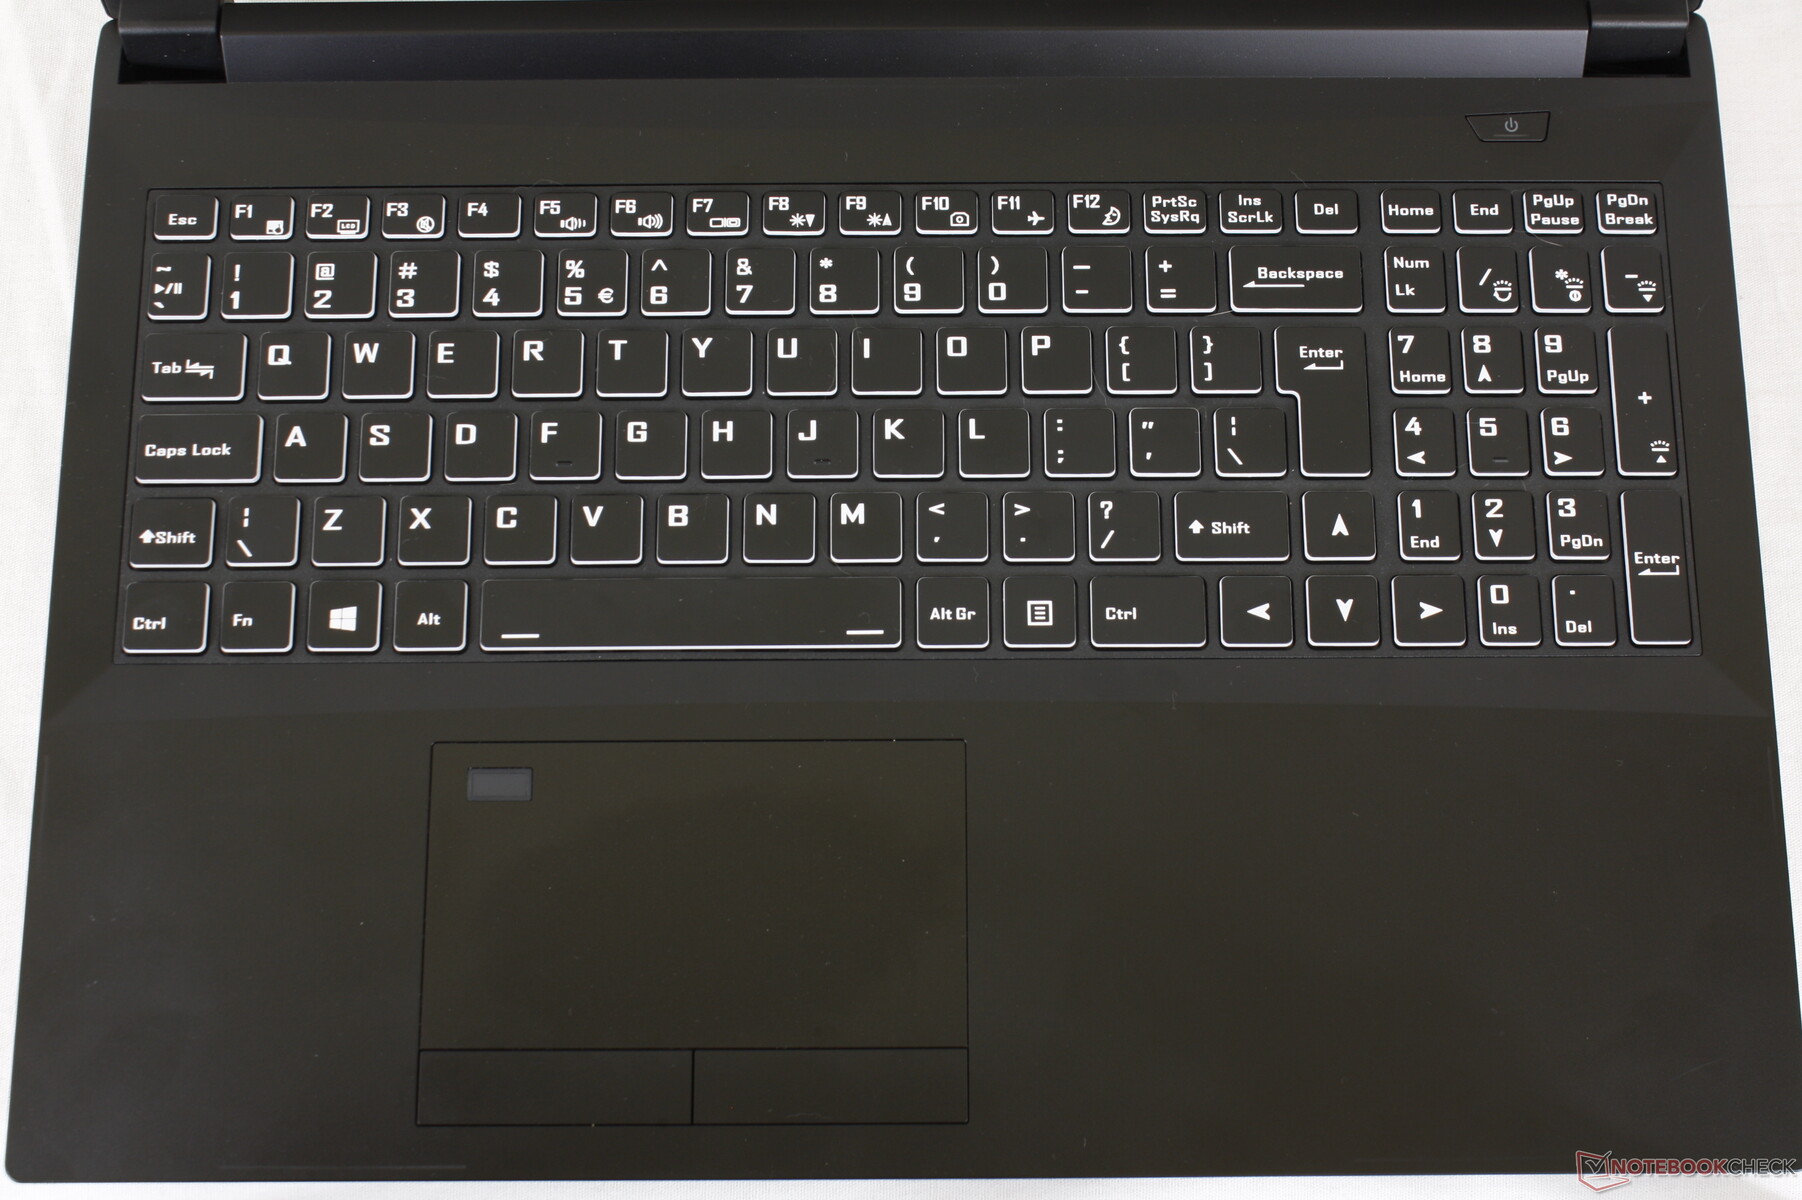
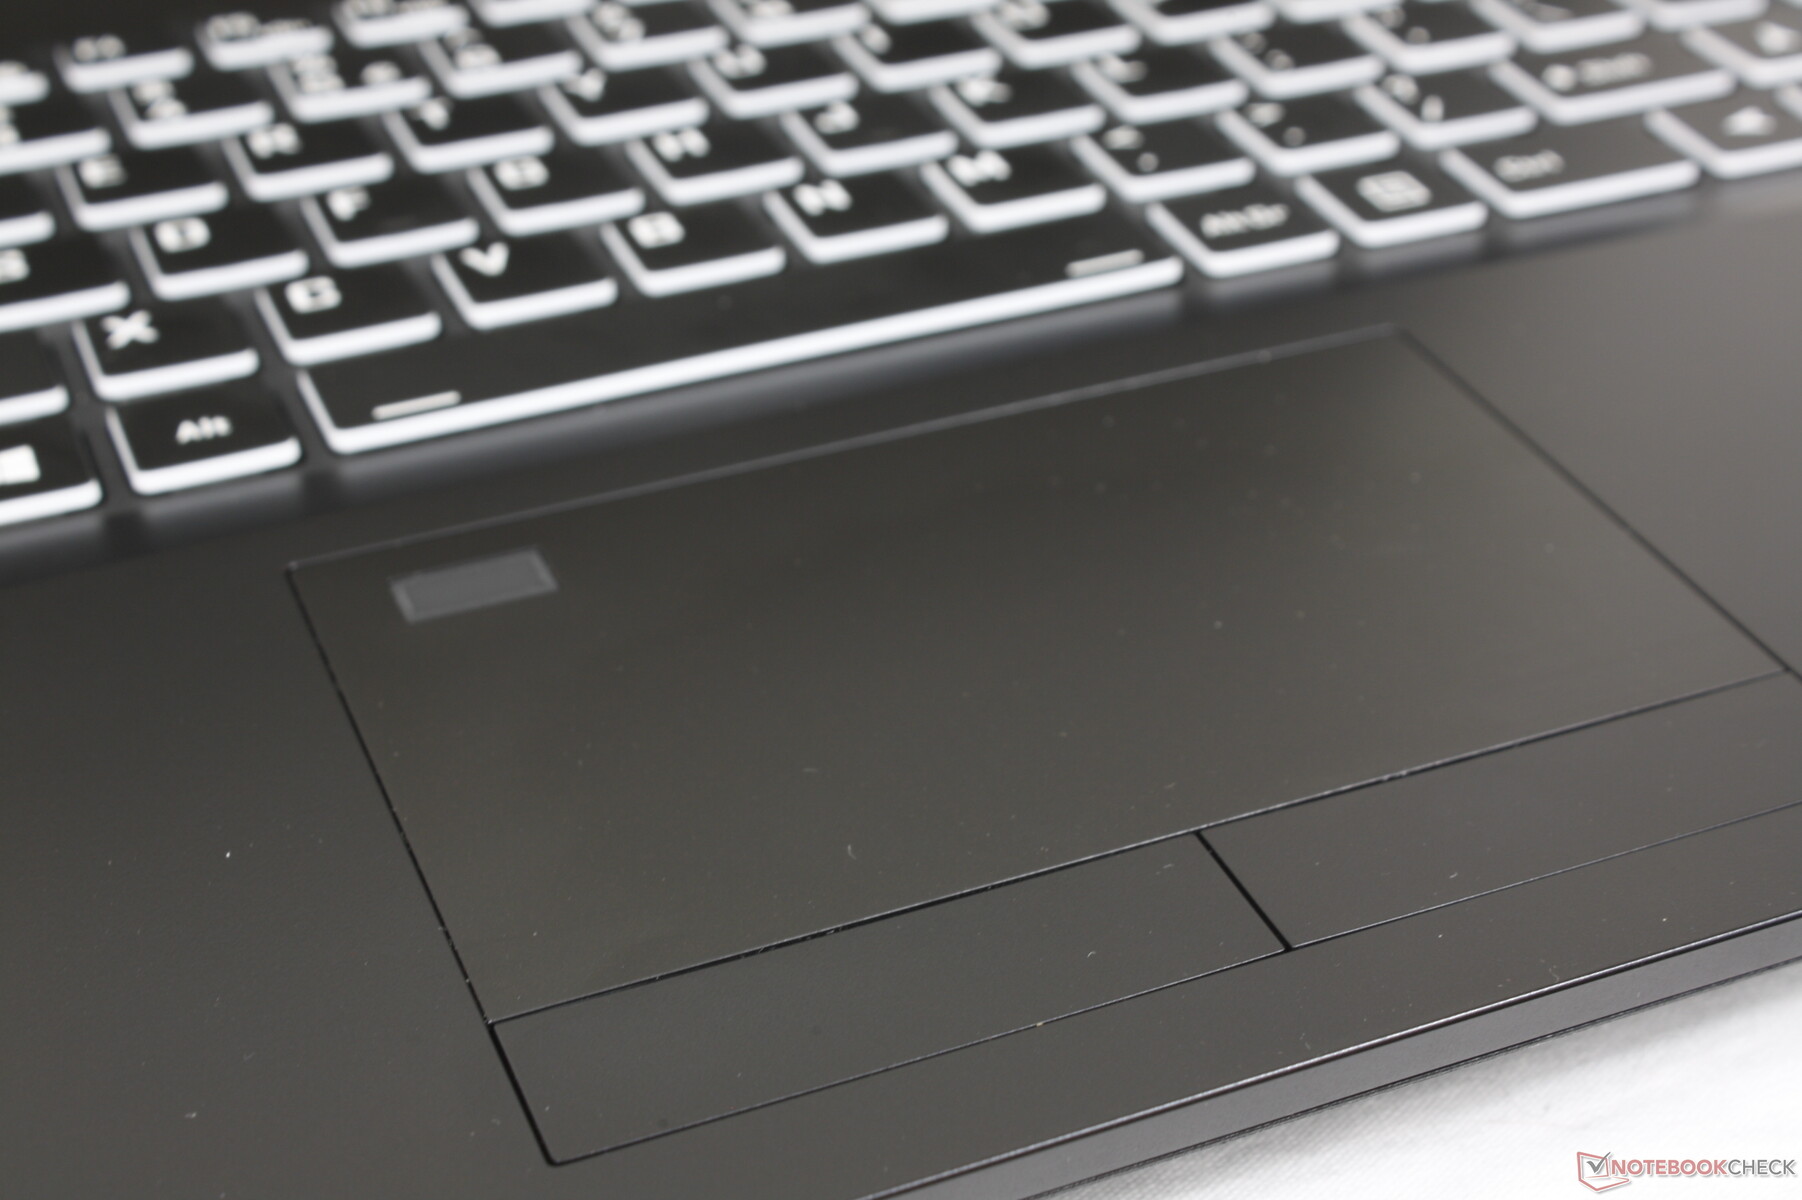
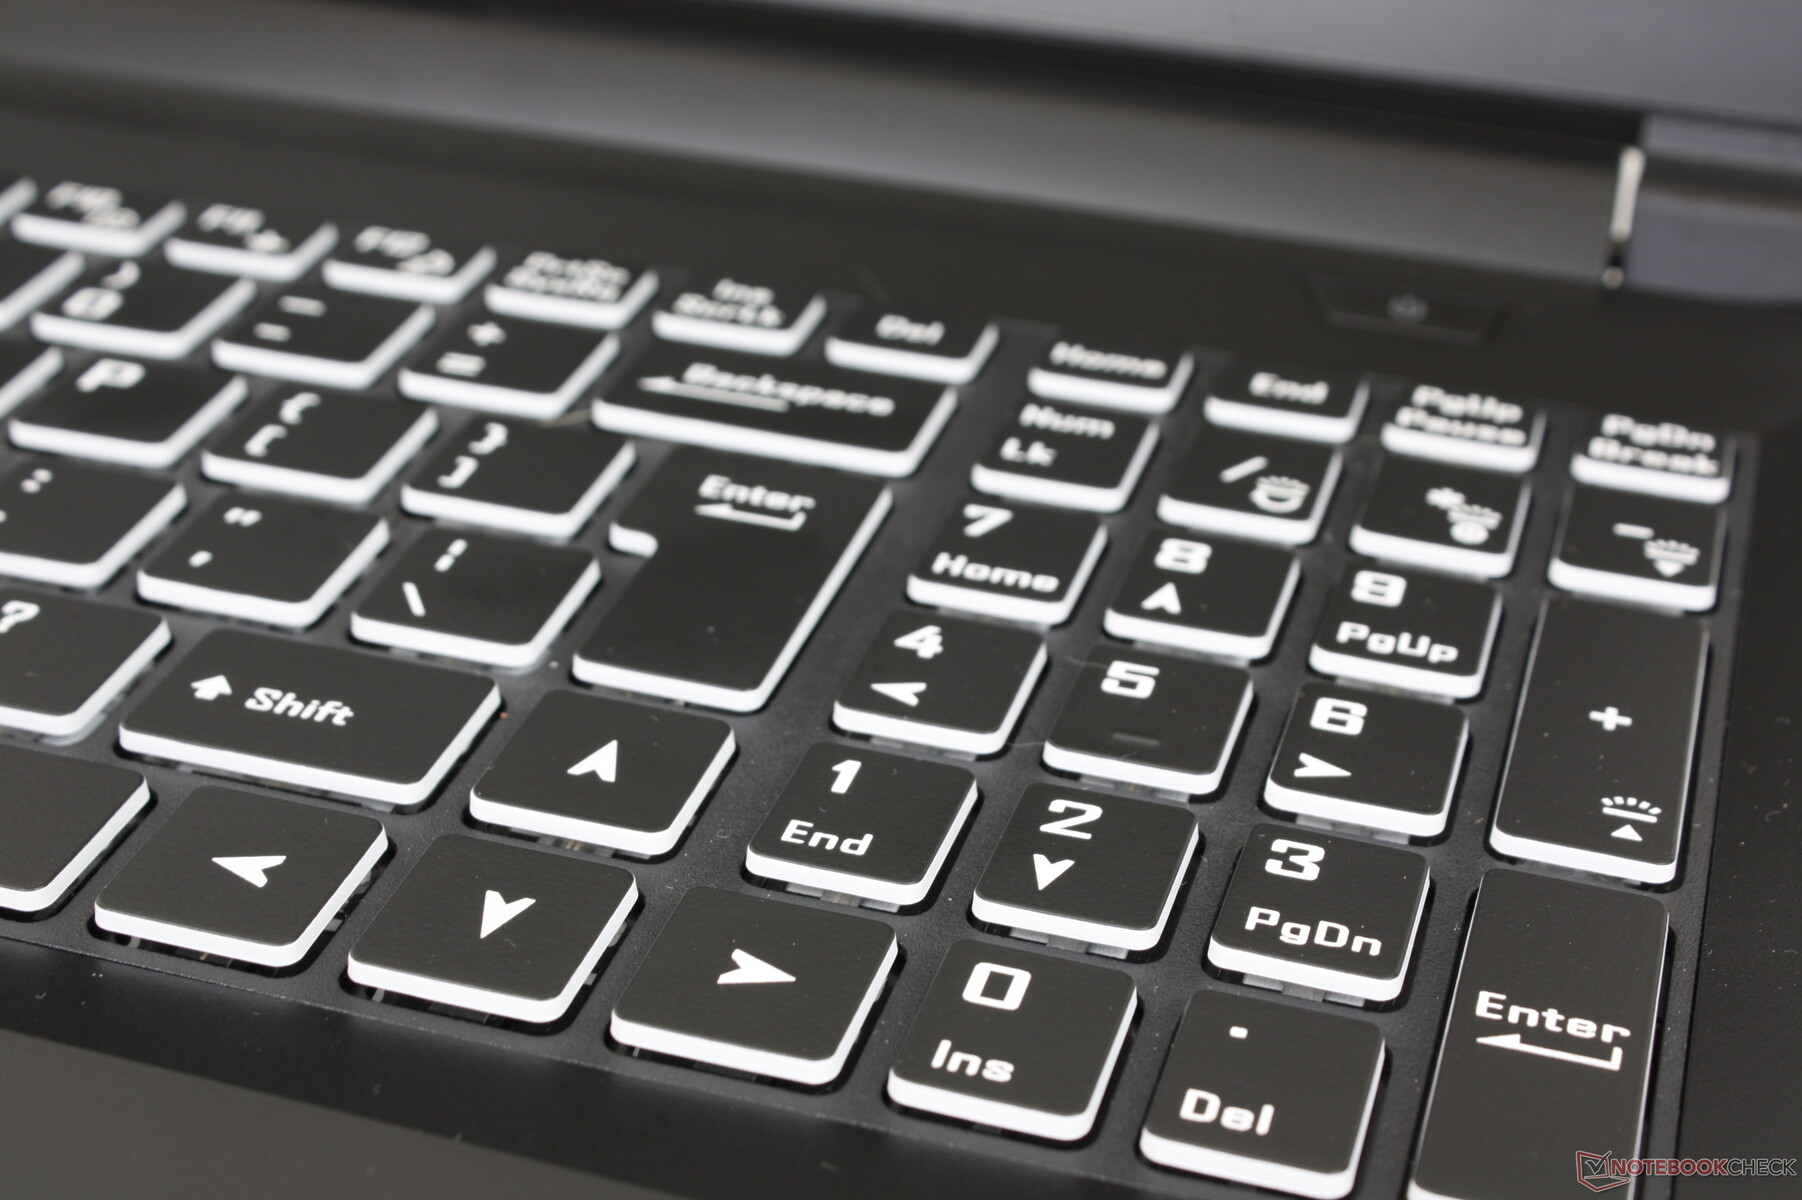
Input Devices

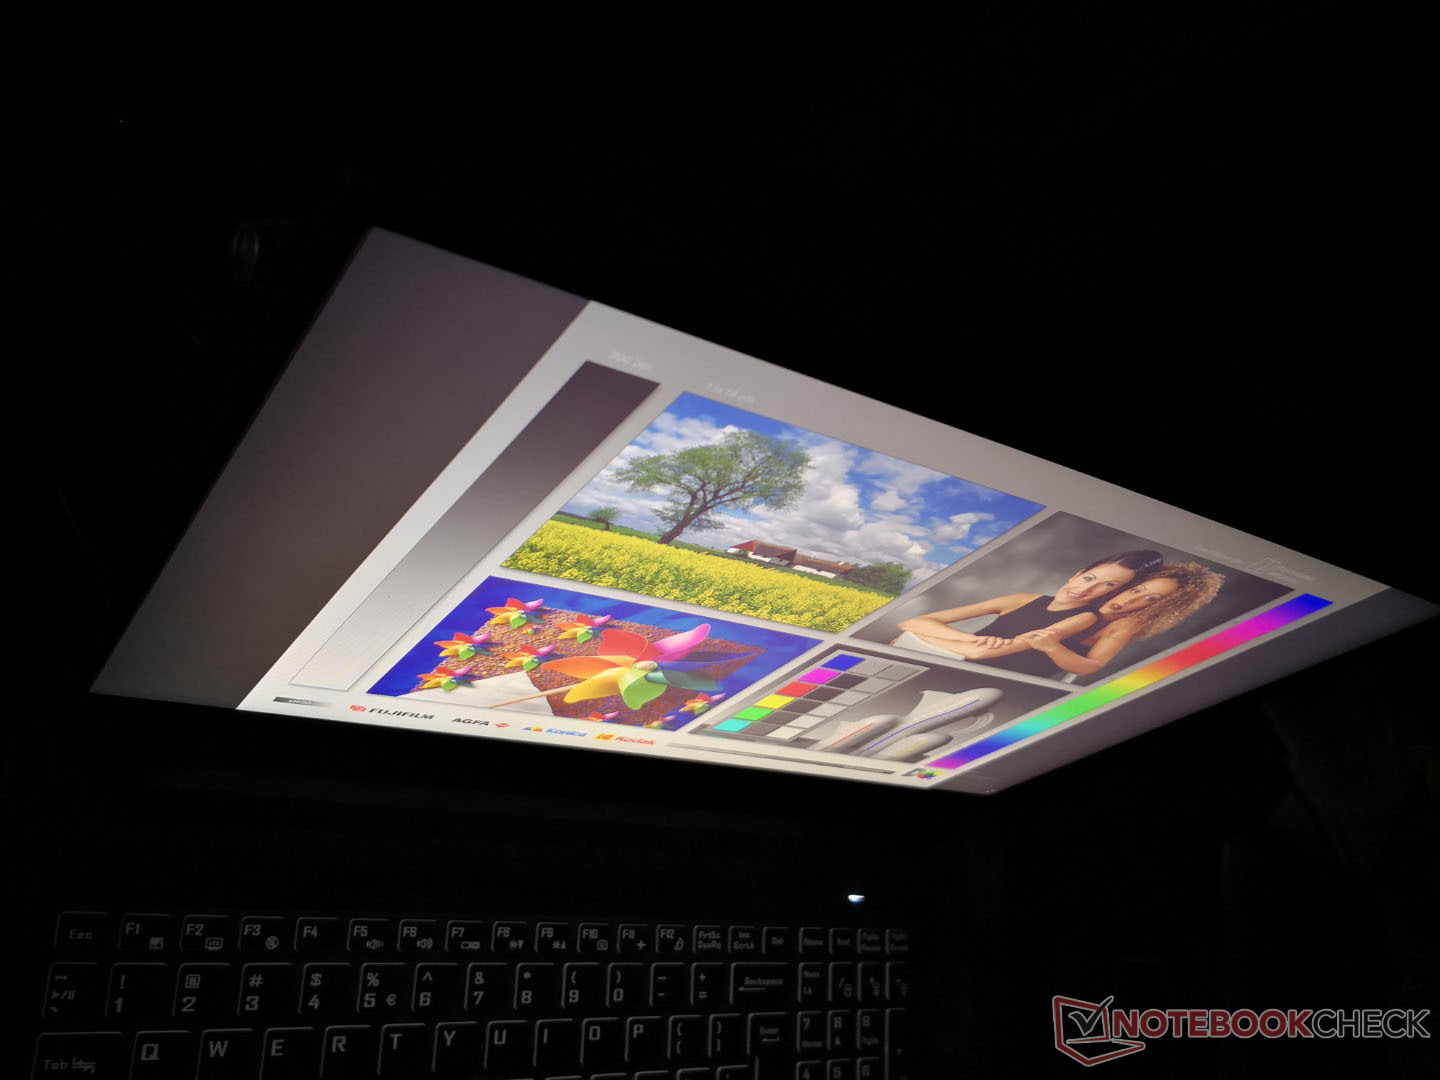
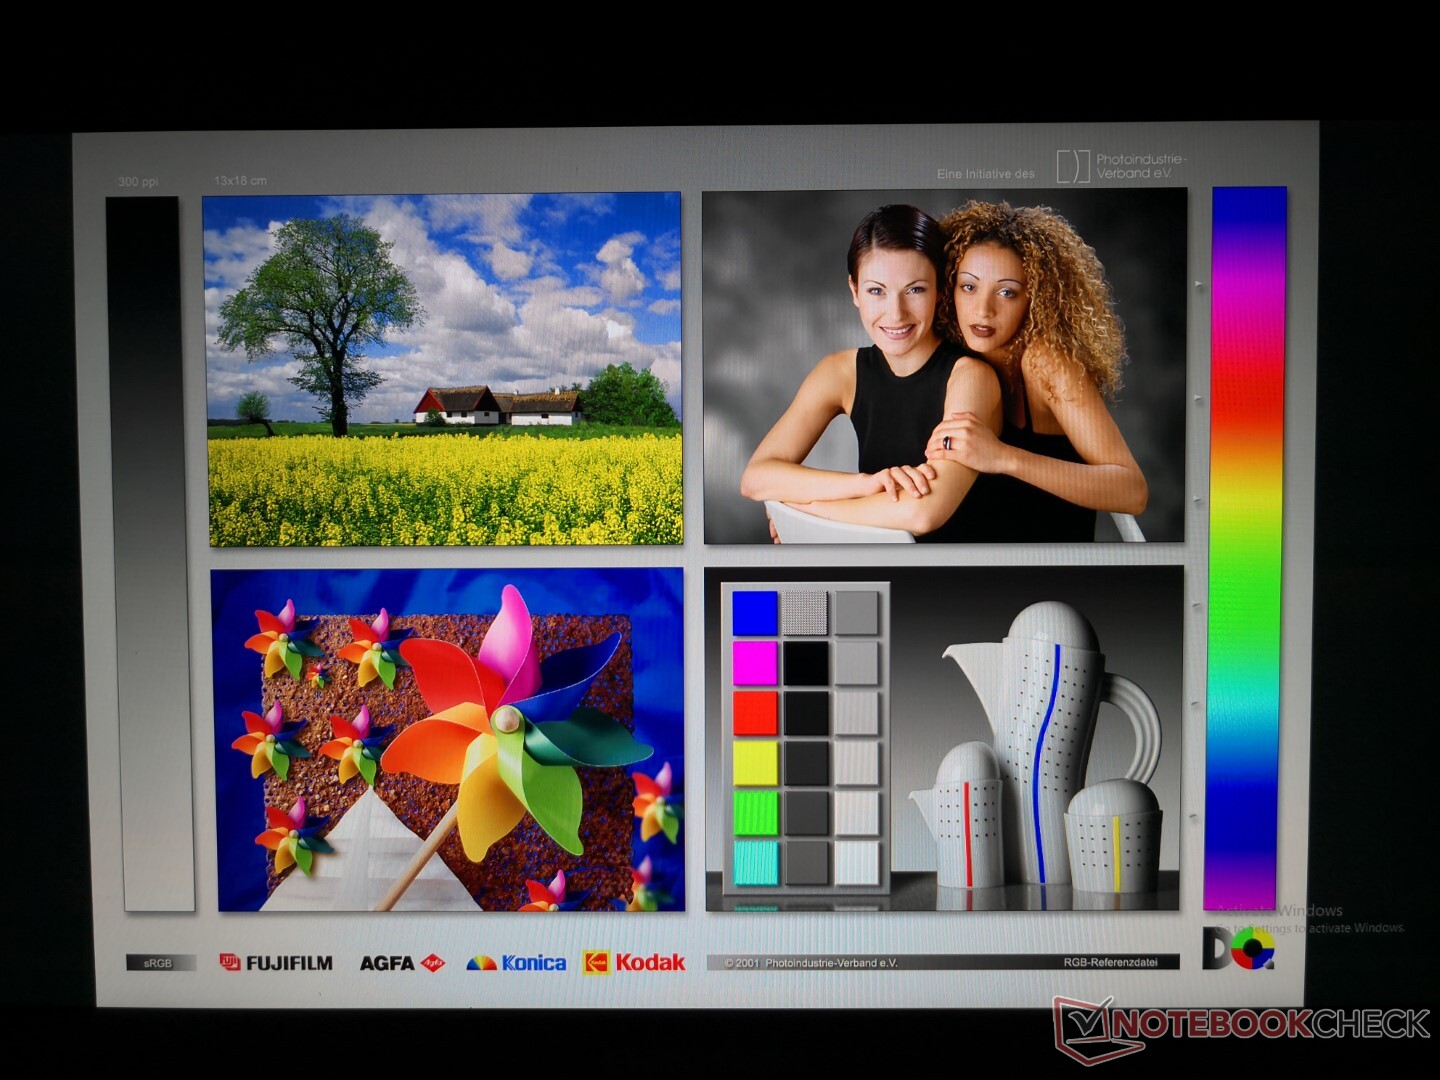
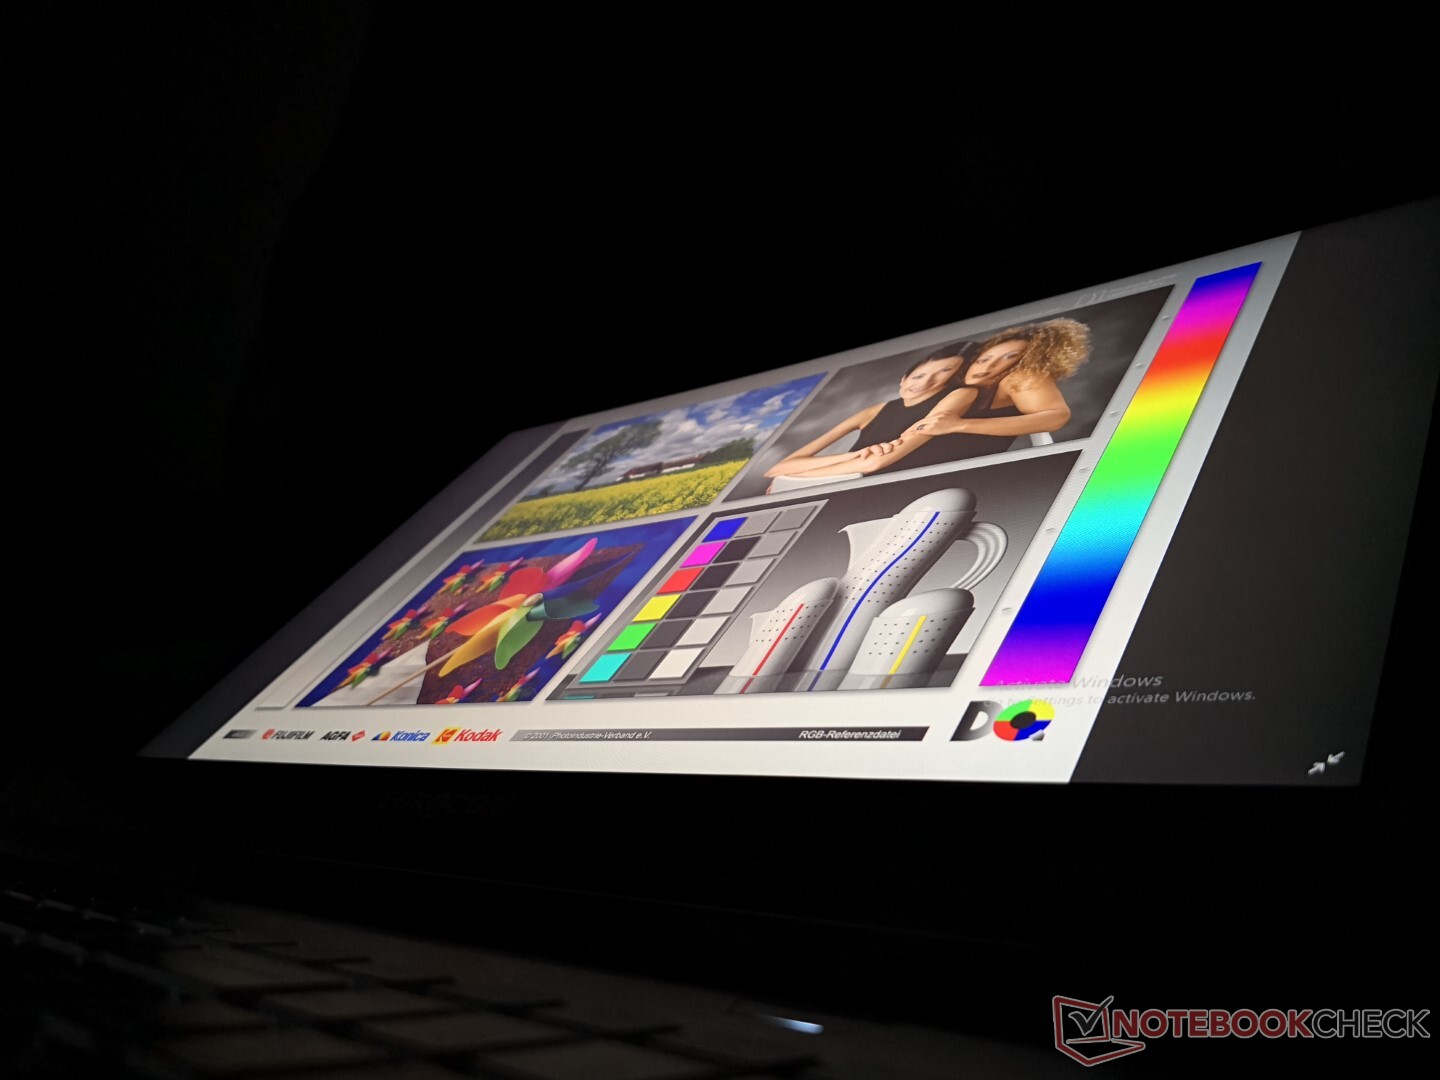
Display
The Nightsky ARX15 uses a very similar Sharp LQ156M1JW03 IPS panel as the ones found on the MSI GE66 or Delta 15. Thus, the viewing experience is almost identical between these three models with their 240 Hz native refresh rates, ~1000:1 contrast ratios, full sRGB coverage, fast response times, and even similar pulse-width modulation frequencies. It's a high-end panel with excellent attributes even if its colors and contrast can't quite reach the same levels as OLED panels.

| |||||||||||||||||||||||||
Brightness Distribution: 90 %
Center on Battery: 312.8 cd/m²
Contrast: 1117:1 (Black: 0.28 cd/m²)
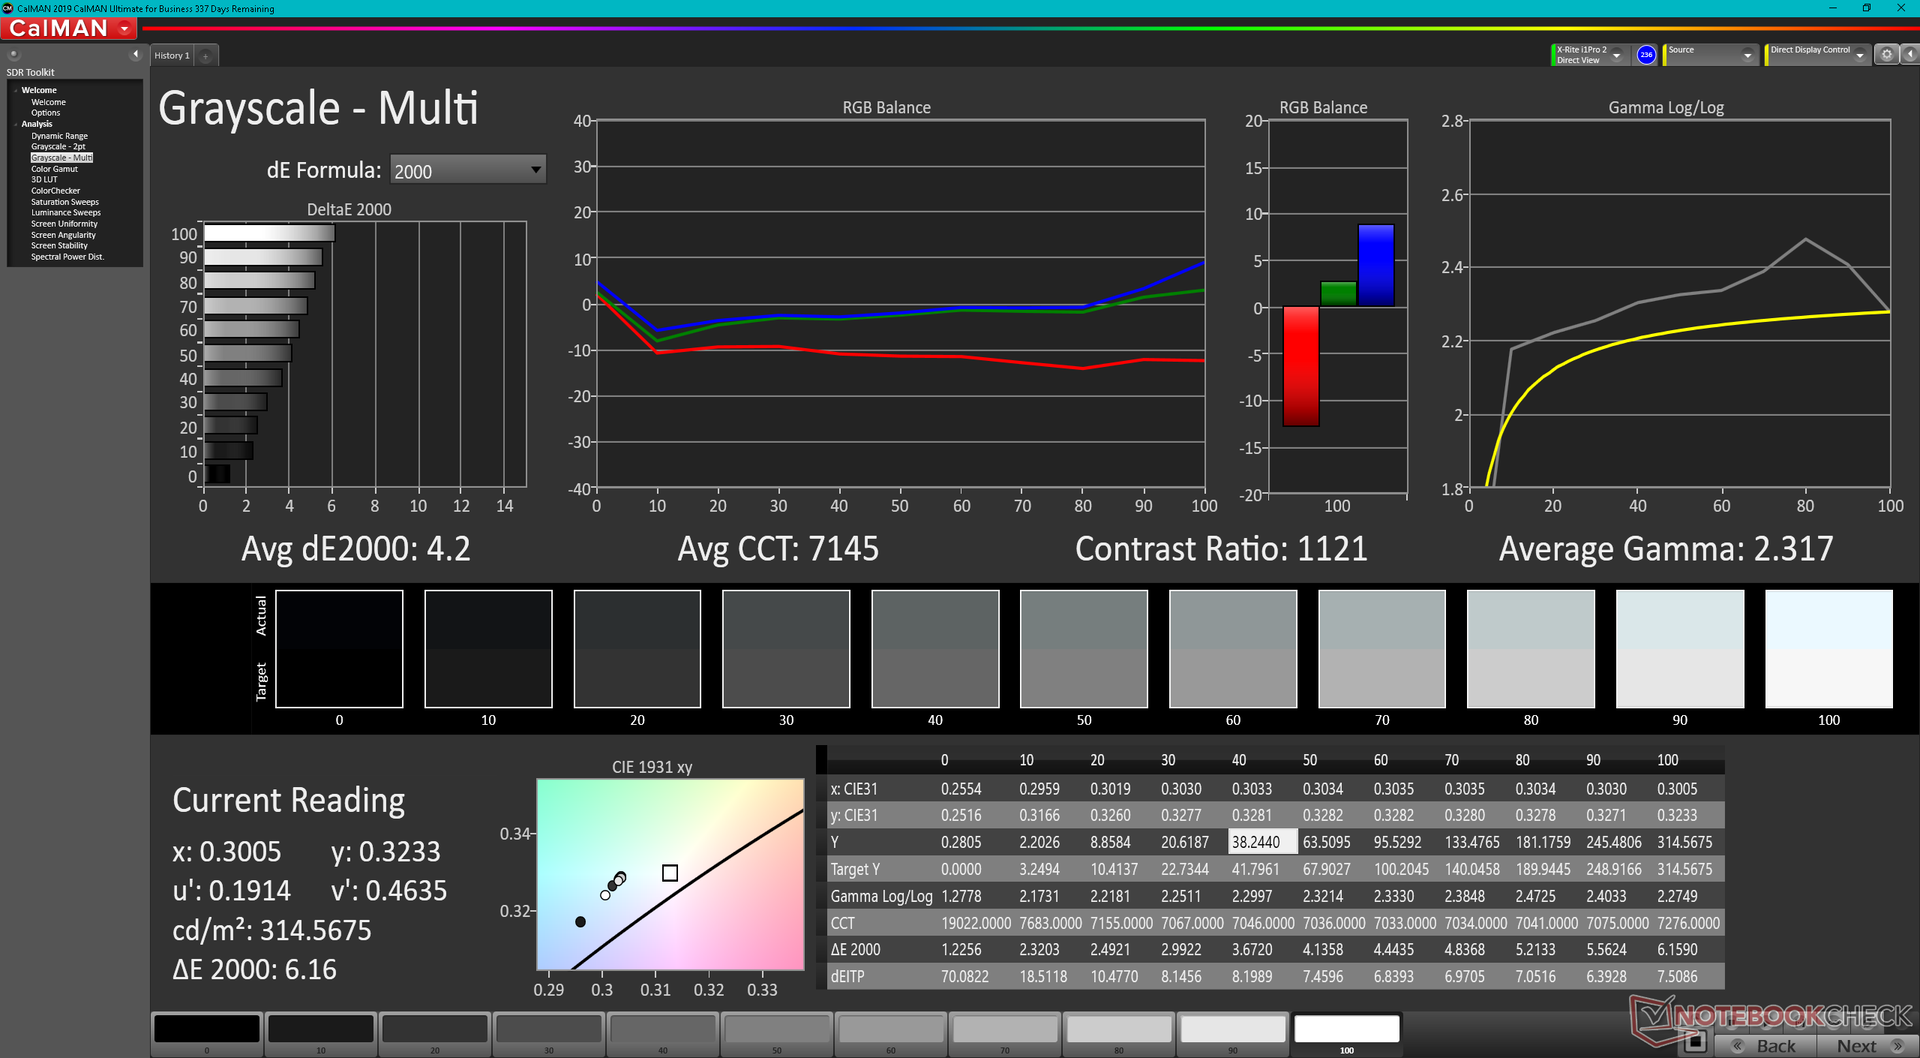
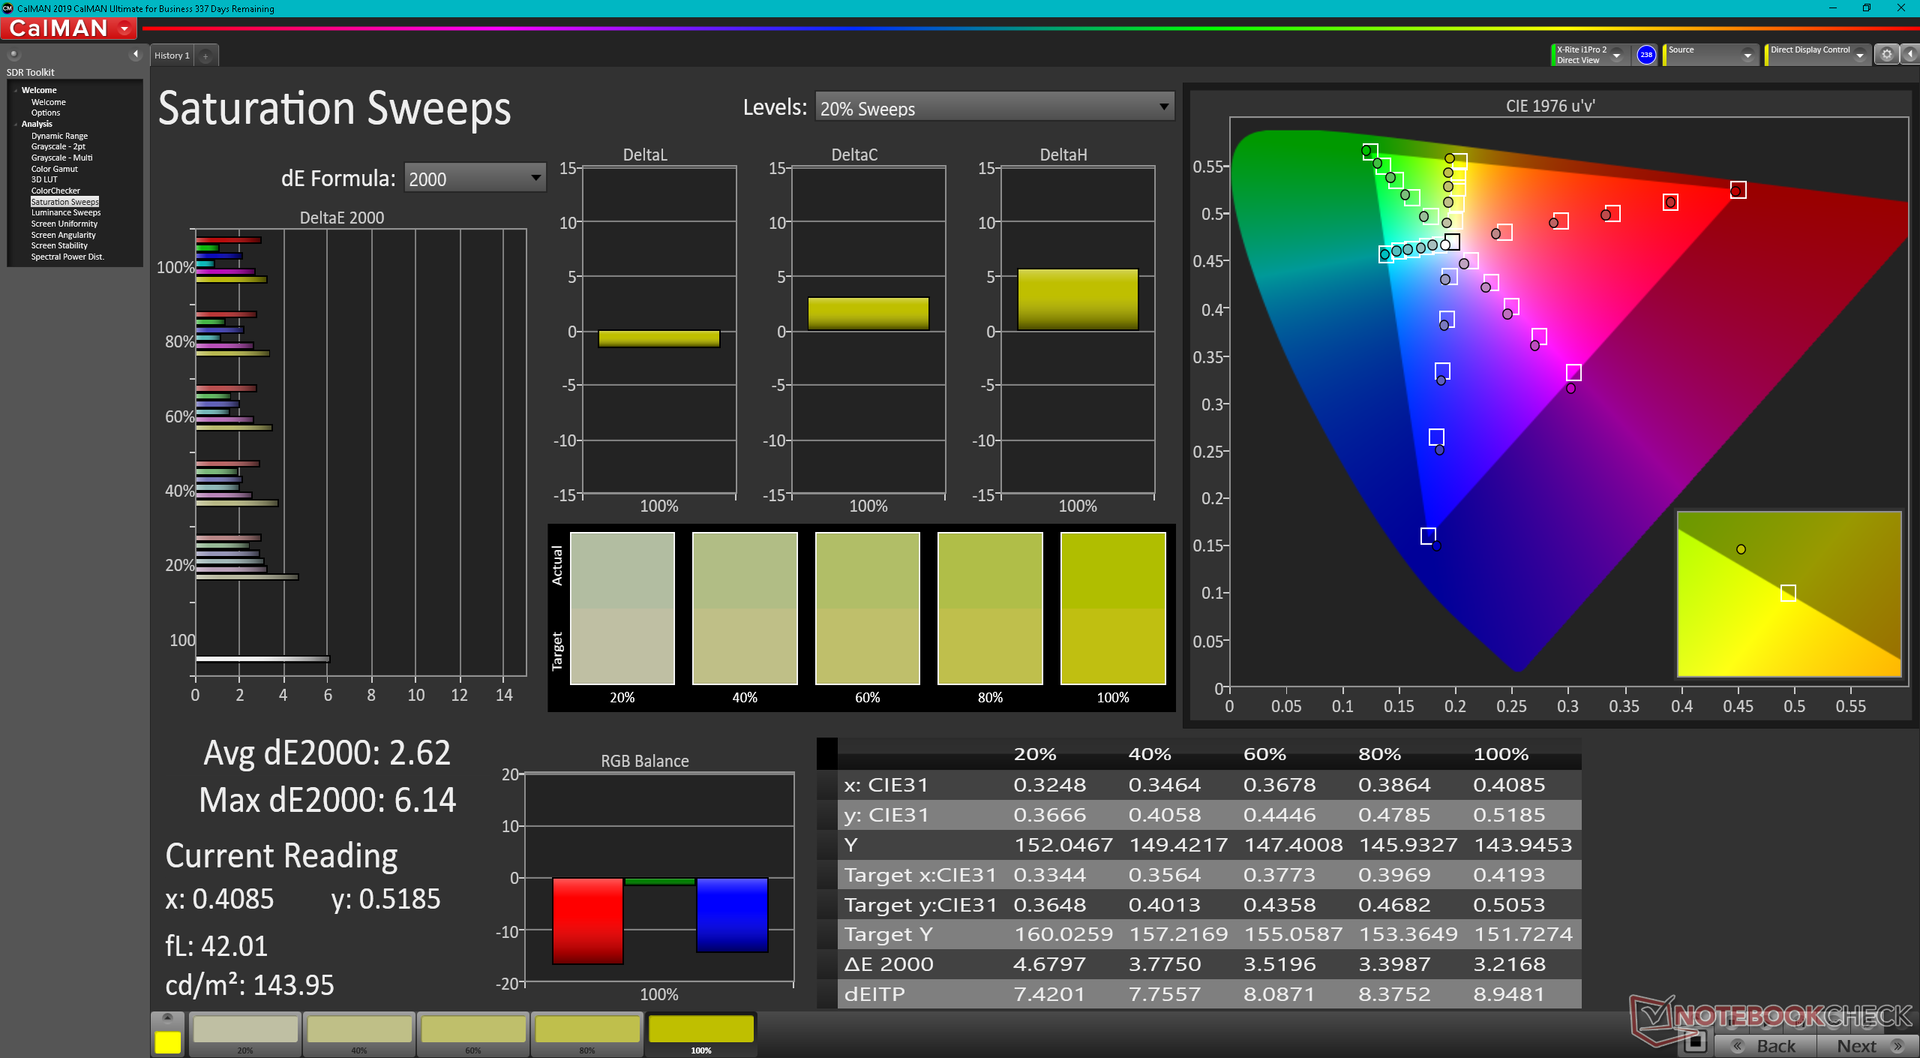
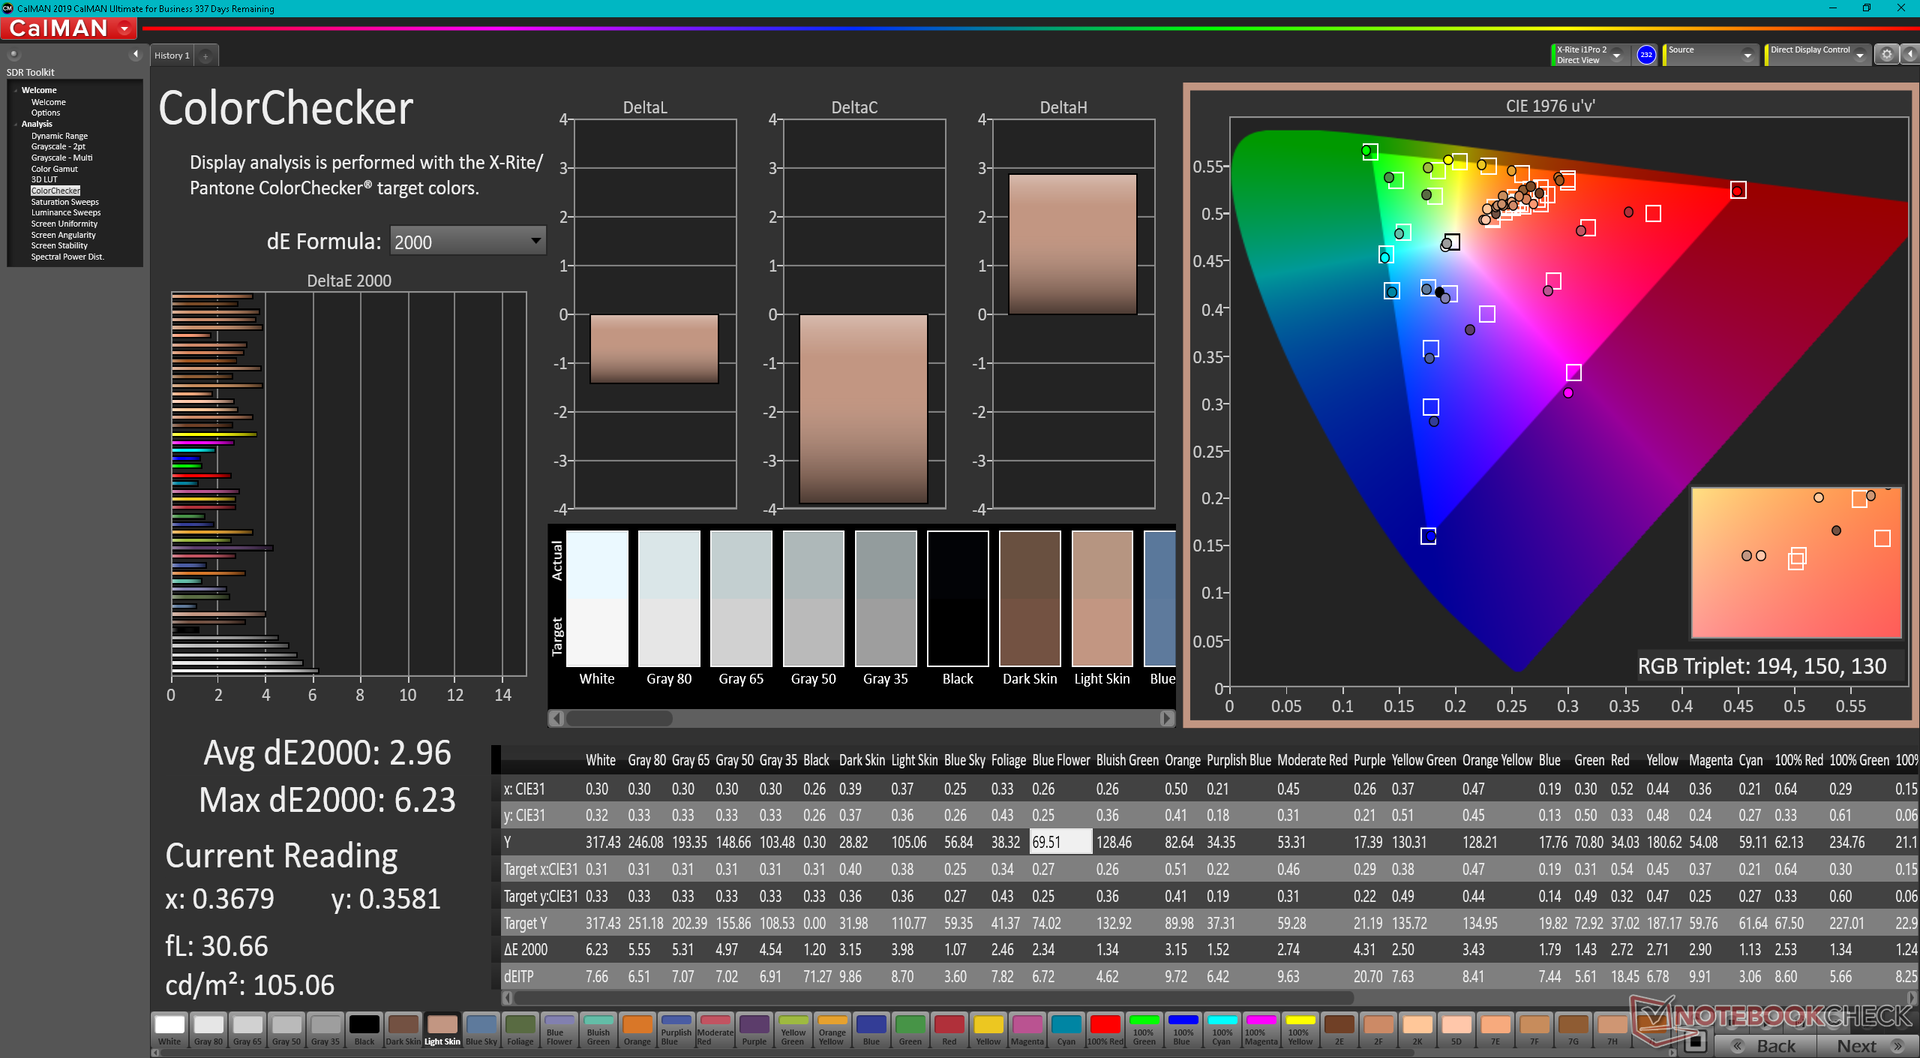
ΔE ColorChecker Calman: 2.96 | ∀{0.5-29.43 Ø4.73}
ΔE Greyscale Calman: 4.2 | ∀{0.09-98 Ø4.97}
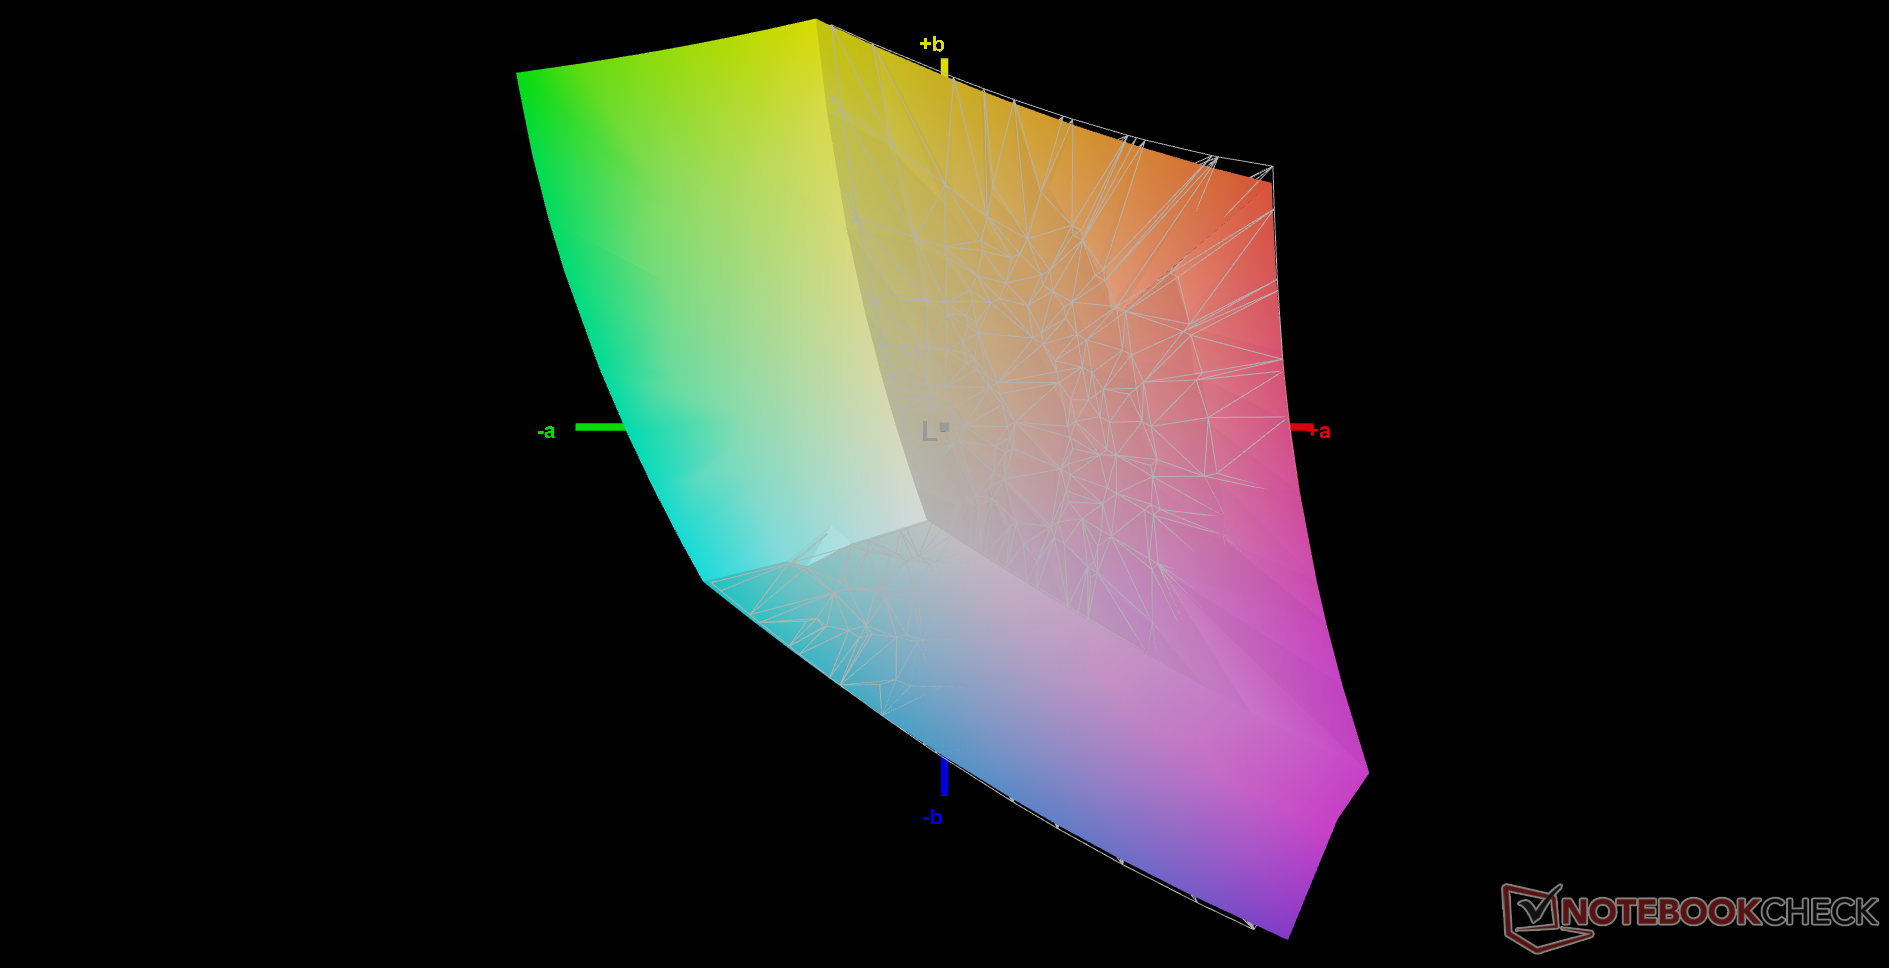
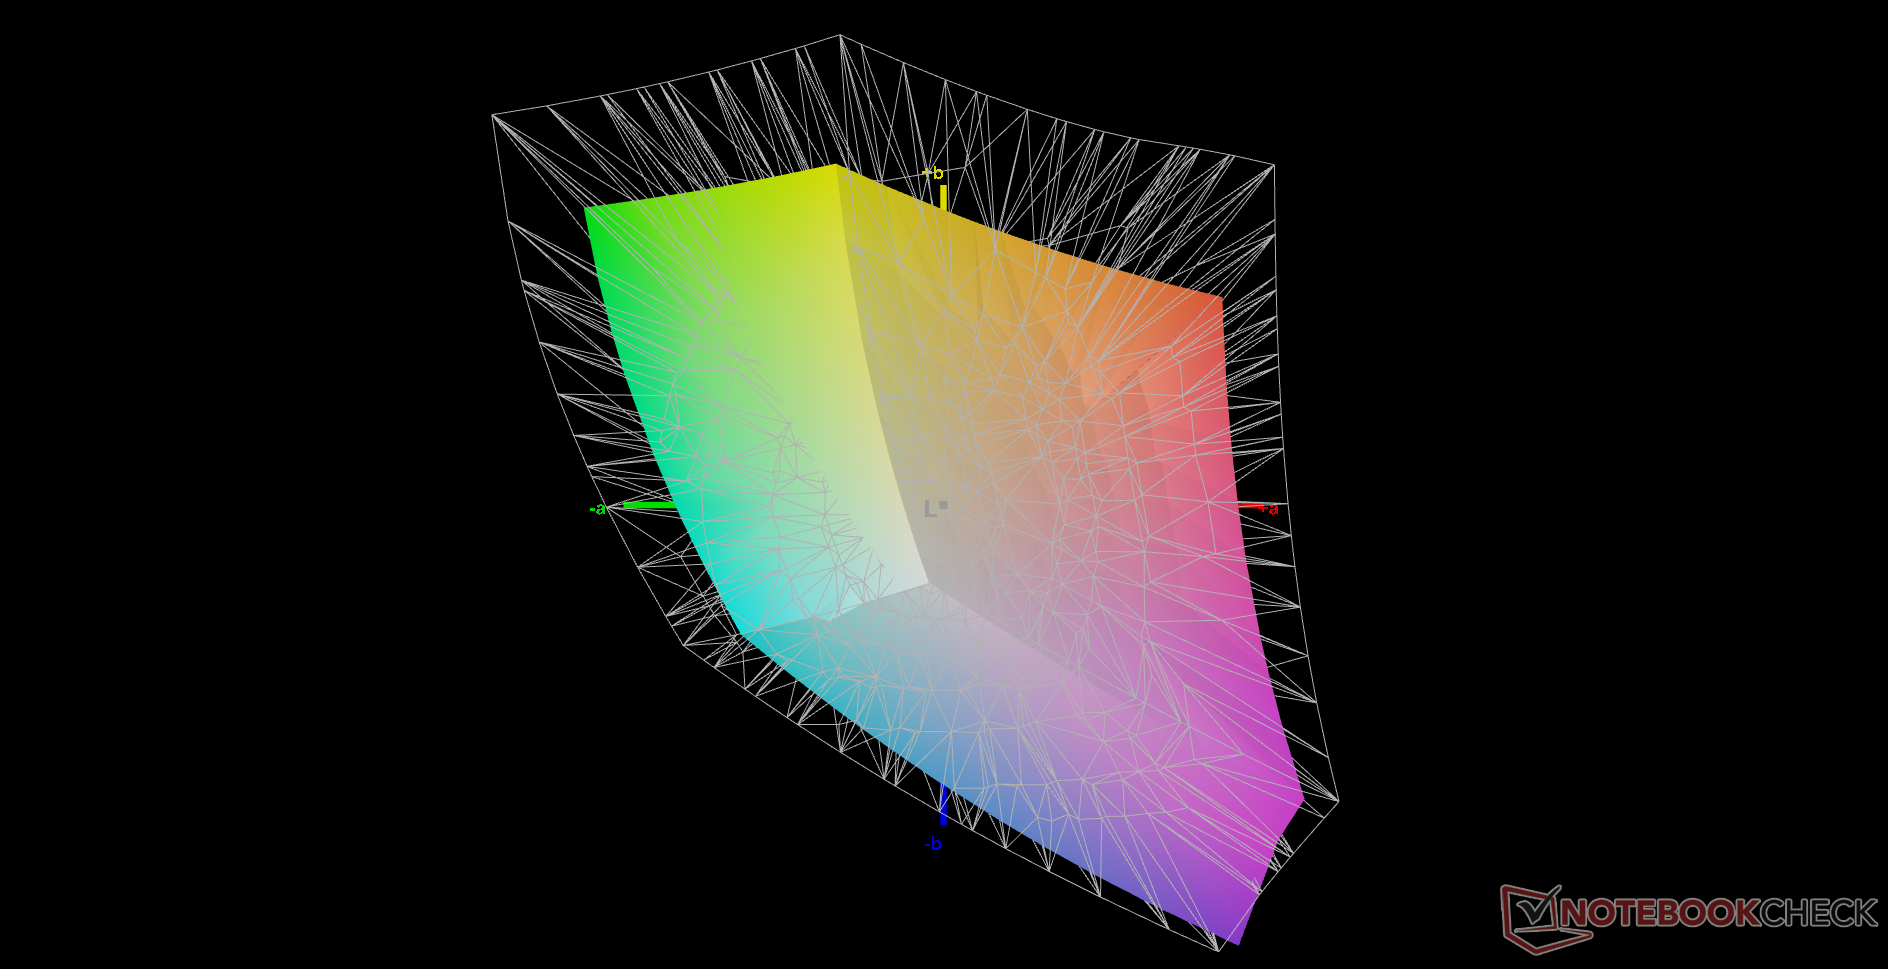
73.7% AdobeRGB 1998 (Argyll 3D)
99.7% sRGB (Argyll 3D)
67.9% Display P3 (Argyll 3D)
Gamma: 2.32
CCT: 7145 K
| Eurocom Nightsky ARX315 Sharp LQ156M1JW03, IPS, 1920x1080, 15.6" | Gigabyte A5 X1 AU Optronics B156HAN12.0, IPS, 1920x1080, 15.6" | Medion Erazer Deputy P25 Panda LM156LF-2F03, IPS, 1920x1080, 15.6" | MSI Delta 15 A5EFK LQ156M1JW03 (SHP155D), IPS-Level, 1920x1080, 15.6" | Schenker XMG Apex 15 NH57E PS LG Philips LGD0625 (LP156WFG-SPB3), IPS, 1920x1080, 15.6" | MSI GE66 Raider 10SFS Sharp LQ156M1JW03 (SHP14C5), IPS-Level, 1920x1080, 15.6" | |
|---|---|---|---|---|---|---|
| Display | -1% | -42% | -4% | -7% | -2% | |
| Display P3 Coverage (%) | 67.9 | 69.6 3% | 39.7 -42% | 66.5 -2% | 64.5 -5% | 68 0% |
| sRGB Coverage (%) | 99.7 | 98.6 -1% | 59.7 -40% | 97.8 -2% | 95.9 -4% | 99 -1% |
| AdobeRGB 1998 Coverage (%) | 73.7 | 70.8 -4% | 41.1 -44% | 67.6 -8% | 65.8 -11% | 69.8 -5% |
| Response Times | 34% | -169% | 12% | -2% | -1% | |
| Response Time Grey 50% / Grey 80% * (ms) | 15.2 ? | 4.8 ? 68% | 40.4 ? -166% | 12.8 ? 16% | 15 1% | 16.4 ? -8% |
| Response Time Black / White * (ms) | 11.2 ? | 11.2 ? -0% | 30.4 ? -171% | 10.4 ? 7% | 11.6 -4% | 10.4 ? 7% |
| PWM Frequency (Hz) | 23150 ? | 23580 ? | 23580 ? | |||
| Screen | -7% | -25% | -12% | -7% | 21% | |
| Brightness middle (cd/m²) | 312.8 | 335 7% | 283 -10% | 291 -7% | 393 26% | 291 -7% |
| Brightness (cd/m²) | 294 | 325 11% | 266 -10% | 266 -10% | 353 20% | 278 -5% |
| Brightness Distribution (%) | 90 | 90 0% | 85 -6% | 88 -2% | 83 -8% | 91 1% |
| Black Level * (cd/m²) | 0.28 | 0.4 -43% | 0.2 29% | 0.36 -29% | 0.47 -68% | 0.25 11% |
| Contrast (:1) | 1117 | 838 -25% | 1415 27% | 808 -28% | 836 -25% | 1164 4% |
| Colorchecker dE 2000 * | 2.96 | 2.63 11% | 5.32 -80% | 2.98 -1% | 2.84 4% | 1.19 60% |
| Colorchecker dE 2000 max. * | 6.23 | 7.71 -24% | 17.68 -184% | 7.59 -22% | 7.15 -15% | 3.04 51% |
| Greyscale dE 2000 * | 4.2 | 4 5% | 2.9 31% | 4.2 -0% | 3.73 11% | 1.9 55% |
| Gamma | 2.32 95% | 2.129 103% | 2.062 107% | 2.293 96% | 2.53 87% | 2.216 99% |
| CCT | 7145 91% | 7434 87% | 7167 91% | 7624 85% | 7312 89% | 7018 93% |
| Colorchecker dE 2000 calibrated * | 0.97 | 3.94 | 0.91 | 0.67 | ||
| Color Space (Percent of AdobeRGB 1998) (%) | 70 | |||||
| Color Space (Percent of sRGB) (%) | 92 | |||||
| Total Average (Program / Settings) | 9% /
1% | -79% /
-51% | -1% /
-7% | -5% /
-6% | 6% /
13% |
* ... smaller is better
Color temperature is cooler than expected which impacts color accuracy and overall Delta E values. Eurocom will personally calibrate the display for an additional charge. We recommend calibrating the display in order to better exploit the full sRGB coverage of the panel.
Display Response Times
| ↔ Response Time Black to White | ||
|---|---|---|
| 11.2 ms ... rise ↗ and fall ↘ combined | ↗ 6 ms rise | 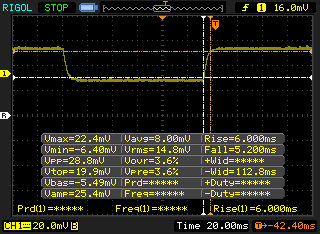 |
| ↘ 5.2 ms fall | ||
| The screen shows good response rates in our tests, but may be too slow for competitive gamers. In comparison, all tested devices range from 0.1 (minimum) to 240 (maximum) ms. » 30 % of all devices are better. This means that the measured response time is better than the average of all tested devices (19.9 ms). | ||
| ↔ Response Time 50% Grey to 80% Grey | ||
| 15.2 ms ... rise ↗ and fall ↘ combined | ↗ 7.6 ms rise | 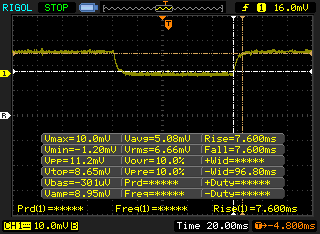 |
| ↘ 7.6 ms fall | ||
| The screen shows good response rates in our tests, but may be too slow for competitive gamers. In comparison, all tested devices range from 0.165 (minimum) to 636 (maximum) ms. » 29 % of all devices are better. This means that the measured response time is better than the average of all tested devices (31.1 ms). | ||
Screen Flickering / PWM (Pulse-Width Modulation)
| Screen flickering / PWM detected | 23150 Hz | ≤ 34 % brightness setting | 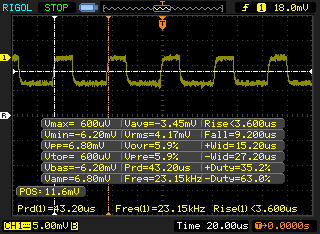 |
The display backlight flickers at 23150 Hz (worst case, e.g., utilizing PWM) Flickering detected at a brightness setting of 34 % and below. There should be no flickering or PWM above this brightness setting. The frequency of 23150 Hz is quite high, so most users sensitive to PWM should not notice any flickering. In comparison: 52 % of all tested devices do not use PWM to dim the display. If PWM was detected, an average of 7798 (minimum: 5 - maximum: 343500) Hz was measured. | |||
Performance
Testing Conditions
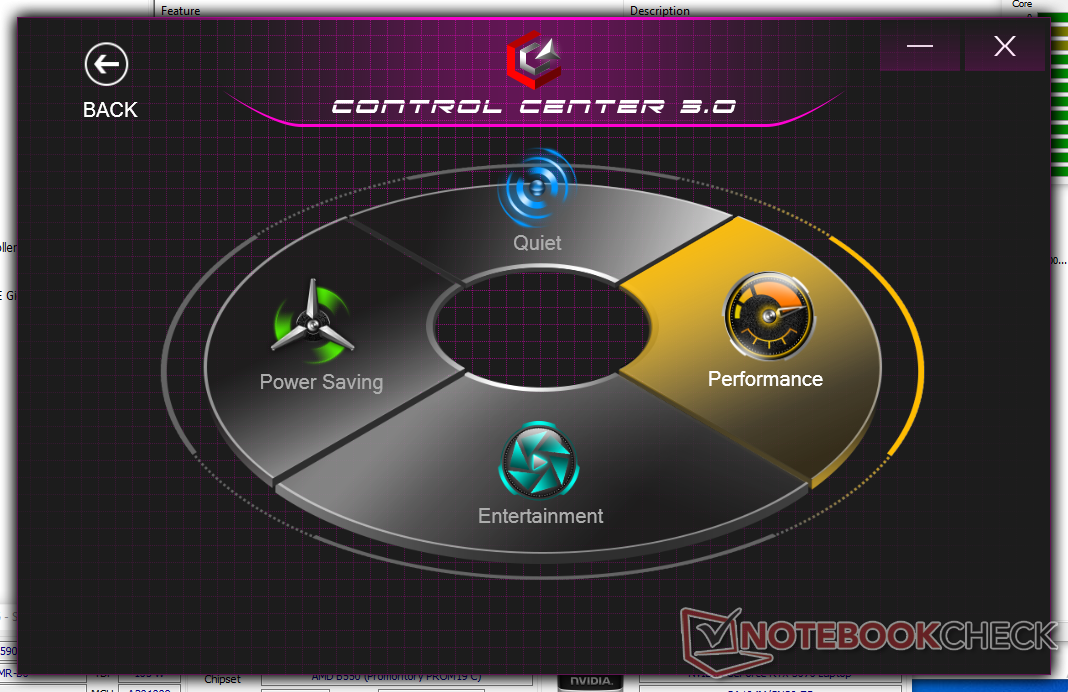
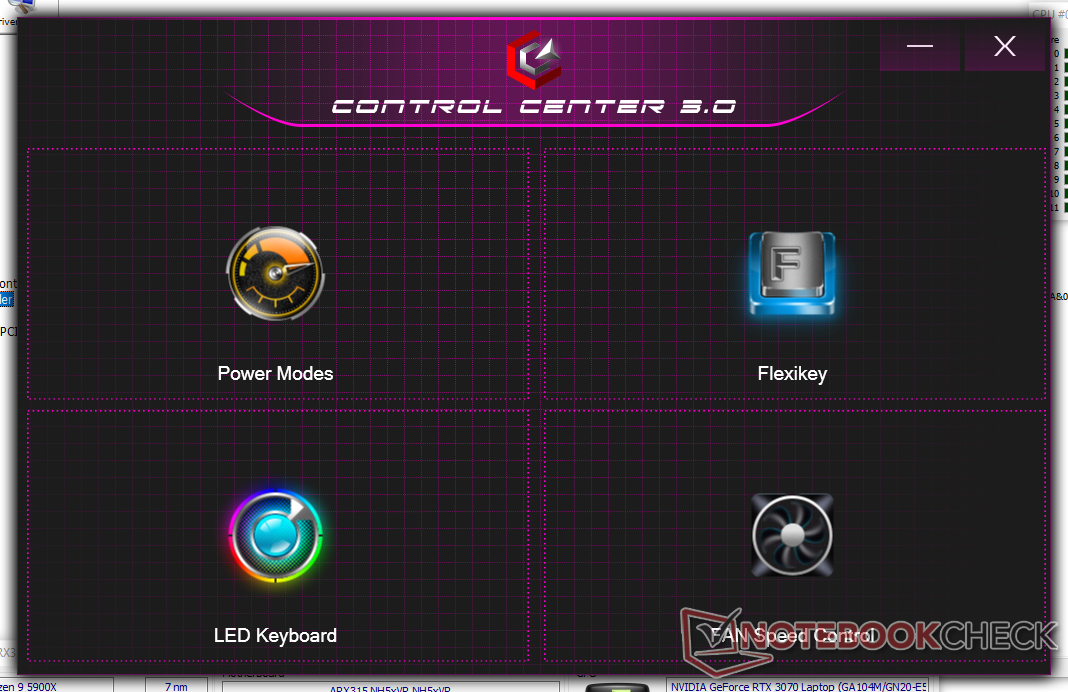
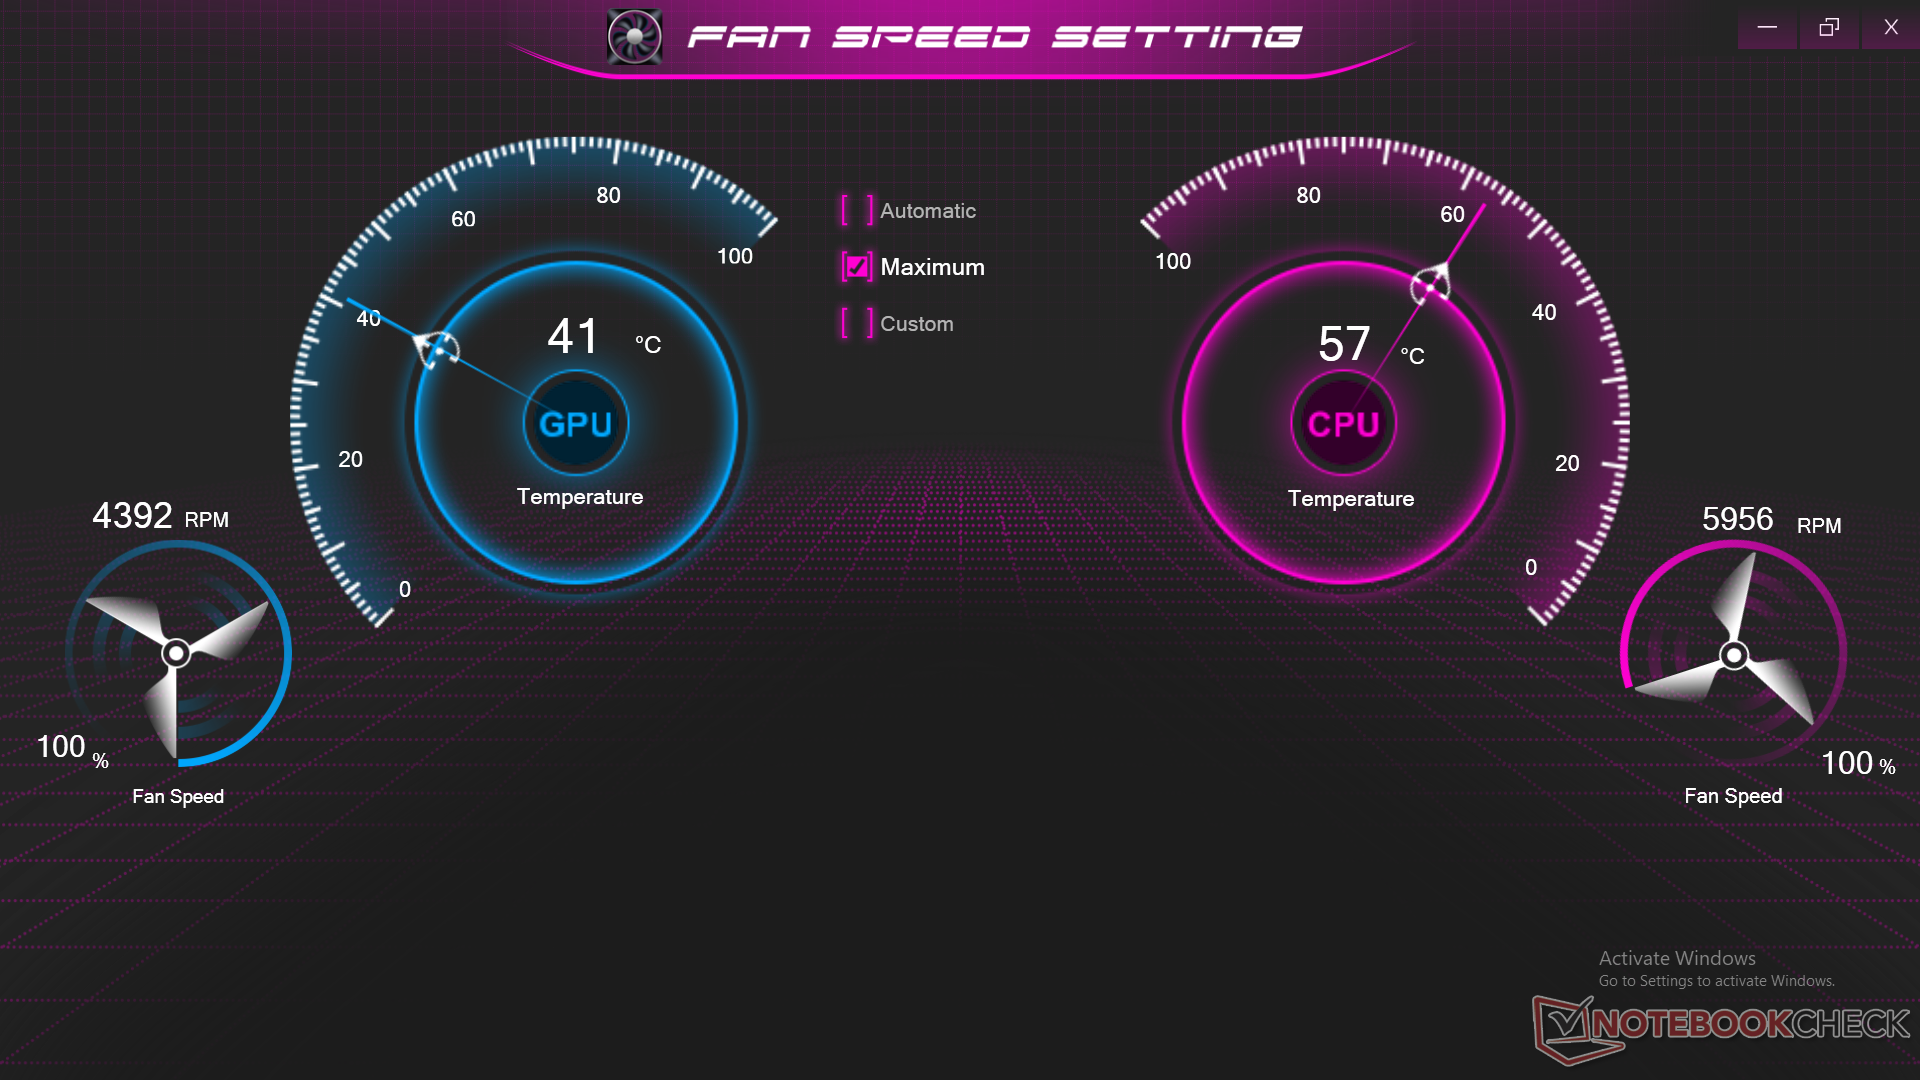
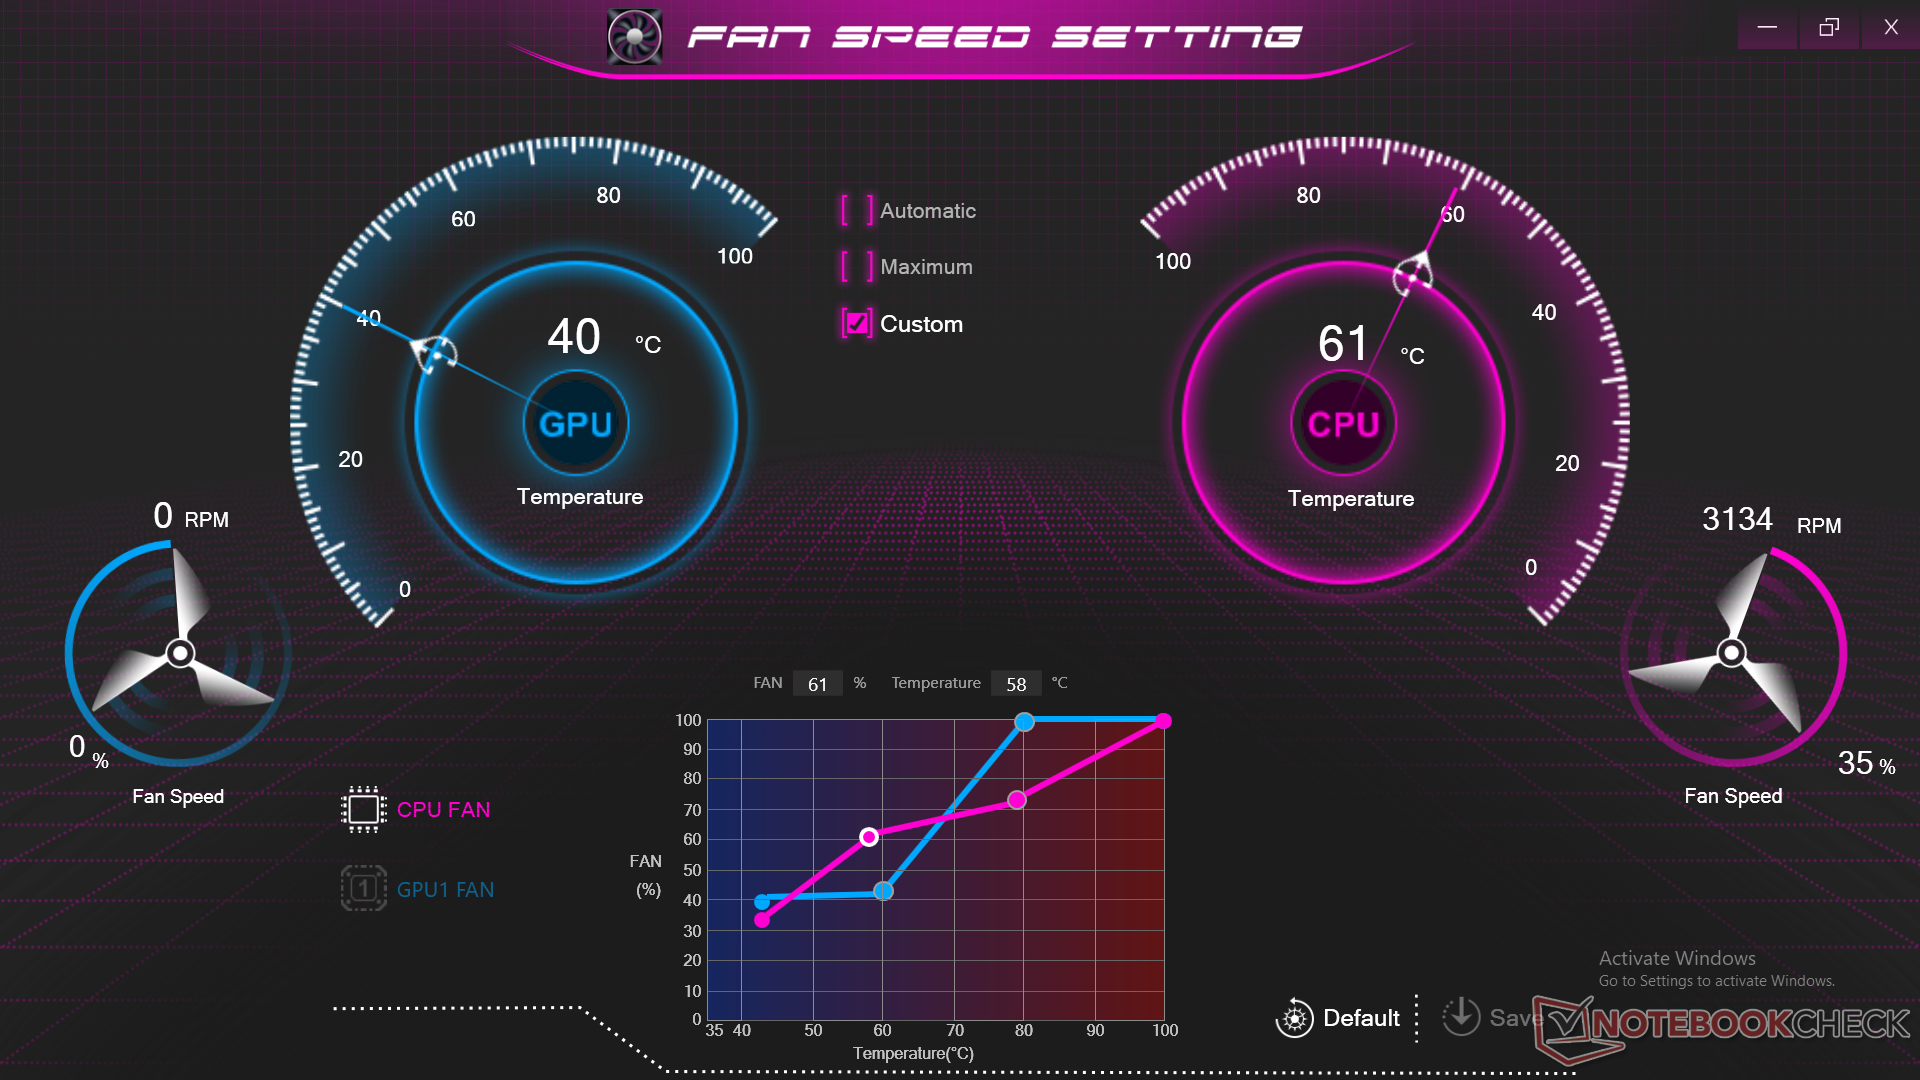
Our unit was set to both High Performance mode via Windows and Performance mode with Maximum fan mode active via Control Center 3.0 for the highest possible scores on stock OEM settings. We recommend users become familiar with the Control Center software as many auxiliary features can be toggled here.
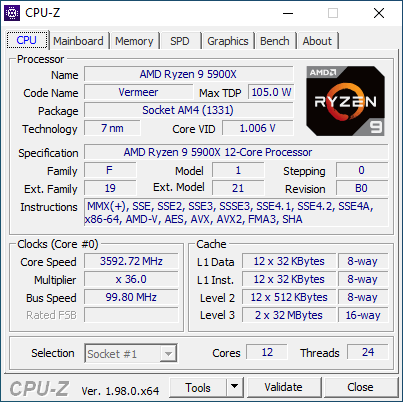
Processor
Multi-thread performance is disappointing when compared to our desktop Ryzen 9 5900X reference. Our Eurocom Ryzen 9 5900X is consistently slower by about 30 to 40 percent to be more in line with the mobile Ryzen 9 5900HX.
Cinebench R15 Multi Loop
Cinebench R23: Multi Core | Single Core
Cinebench R20: CPU (Multi Core) | CPU (Single Core)
Cinebench R15: CPU Multi 64Bit | CPU Single 64Bit
Blender: v2.79 BMW27 CPU
7-Zip 18.03: 7z b 4 | 7z b 4 -mmt1
Geekbench 5.5: Multi-Core | Single-Core
HWBOT x265 Benchmark v2.2: 4k Preset
LibreOffice : 20 Documents To PDF
R Benchmark 2.5: Overall mean
* ... smaller is better
AIDA64: FP32 Ray-Trace | FPU Julia | CPU SHA3 | CPU Queen | FPU SinJulia | FPU Mandel | CPU AES | CPU ZLib | FP64 Ray-Trace | CPU PhotoWorxx
| Performance rating | |
| Average AMD Ryzen 9 5900X | |
| Eurocom Nightsky ARX315 | |
| Gigabyte A5 X1 | |
| MSI Delta 15 A5EFK | |
| Schenker XMG Apex 15 NH57E PS | |
| Medion Erazer Deputy P25 | |
| MSI GE66 Raider 10SFS | |
| AIDA64 / FP32 Ray-Trace | |
| Average AMD Ryzen 9 5900X (3069 - 24659, n=15) | |
| Gigabyte A5 X1 | |
| MSI Delta 15 A5EFK | |
| Medion Erazer Deputy P25 | |
| Schenker XMG Apex 15 NH57E PS | |
| Eurocom Nightsky ARX315 | |
| MSI GE66 Raider 10SFS | |
| AIDA64 / FPU Julia | |
| Average AMD Ryzen 9 5900X (18567 - 155529, n=15) | |
| Gigabyte A5 X1 | |
| Medion Erazer Deputy P25 | |
| MSI Delta 15 A5EFK | |
| Schenker XMG Apex 15 NH57E PS | |
| Eurocom Nightsky ARX315 | |
| MSI GE66 Raider 10SFS | |
| AIDA64 / CPU SHA3 | |
| Average AMD Ryzen 9 5900X (629 - 5329, n=15) | |
| Gigabyte A5 X1 | |
| MSI Delta 15 A5EFK | |
| Schenker XMG Apex 15 NH57E PS | |
| Medion Erazer Deputy P25 | |
| Eurocom Nightsky ARX315 | |
| MSI GE66 Raider 10SFS | |
| AIDA64 / CPU Queen | |
| Eurocom Nightsky ARX315 | |
| Average AMD Ryzen 9 5900X (15371 - 138889, n=15) | |
| MSI Delta 15 A5EFK | |
| Gigabyte A5 X1 | |
| Schenker XMG Apex 15 NH57E PS | |
| Medion Erazer Deputy P25 | |
| MSI GE66 Raider 10SFS | |
| AIDA64 / FPU SinJulia | |
| Eurocom Nightsky ARX315 | |
| Average AMD Ryzen 9 5900X (2137 - 19465, n=15) | |
| Gigabyte A5 X1 | |
| MSI Delta 15 A5EFK | |
| Schenker XMG Apex 15 NH57E PS | |
| Medion Erazer Deputy P25 | |
| MSI GE66 Raider 10SFS | |
| AIDA64 / FPU Mandel | |
| Average AMD Ryzen 9 5900X (10291 - 85469, n=15) | |
| Gigabyte A5 X1 | |
| MSI Delta 15 A5EFK | |
| Medion Erazer Deputy P25 | |
| Schenker XMG Apex 15 NH57E PS | |
| Eurocom Nightsky ARX315 | |
| MSI GE66 Raider 10SFS | |
| AIDA64 / CPU AES | |
| Average AMD Ryzen 9 5900X (24327 - 212390, n=15) | |
| Eurocom Nightsky ARX315 | |
| Gigabyte A5 X1 | |
| MSI Delta 15 A5EFK | |
| Schenker XMG Apex 15 NH57E PS | |
| Medion Erazer Deputy P25 | |
| MSI GE66 Raider 10SFS | |
| AIDA64 / CPU ZLib | |
| Average AMD Ryzen 9 5900X (150.9 - 1345, n=15) | |
| Eurocom Nightsky ARX315 | |
| Gigabyte A5 X1 | |
| MSI Delta 15 A5EFK | |
| Schenker XMG Apex 15 NH57E PS | |
| Medion Erazer Deputy P25 | |
| MSI GE66 Raider 10SFS | |
| AIDA64 / FP64 Ray-Trace | |
| Average AMD Ryzen 9 5900X (1518 - 13196, n=15) | |
| Gigabyte A5 X1 | |
| MSI Delta 15 A5EFK | |
| Medion Erazer Deputy P25 | |
| Schenker XMG Apex 15 NH57E PS | |
| MSI GE66 Raider 10SFS | |
| Eurocom Nightsky ARX315 | |
| AIDA64 / CPU PhotoWorxx | |
| Average AMD Ryzen 9 5900X (11451 - 32849, n=15) | |
| MSI GE66 Raider 10SFS | |
| Eurocom Nightsky ARX315 | |
| MSI Delta 15 A5EFK | |
| Schenker XMG Apex 15 NH57E PS | |
| Gigabyte A5 X1 | |
| Medion Erazer Deputy P25 | |
System Performance
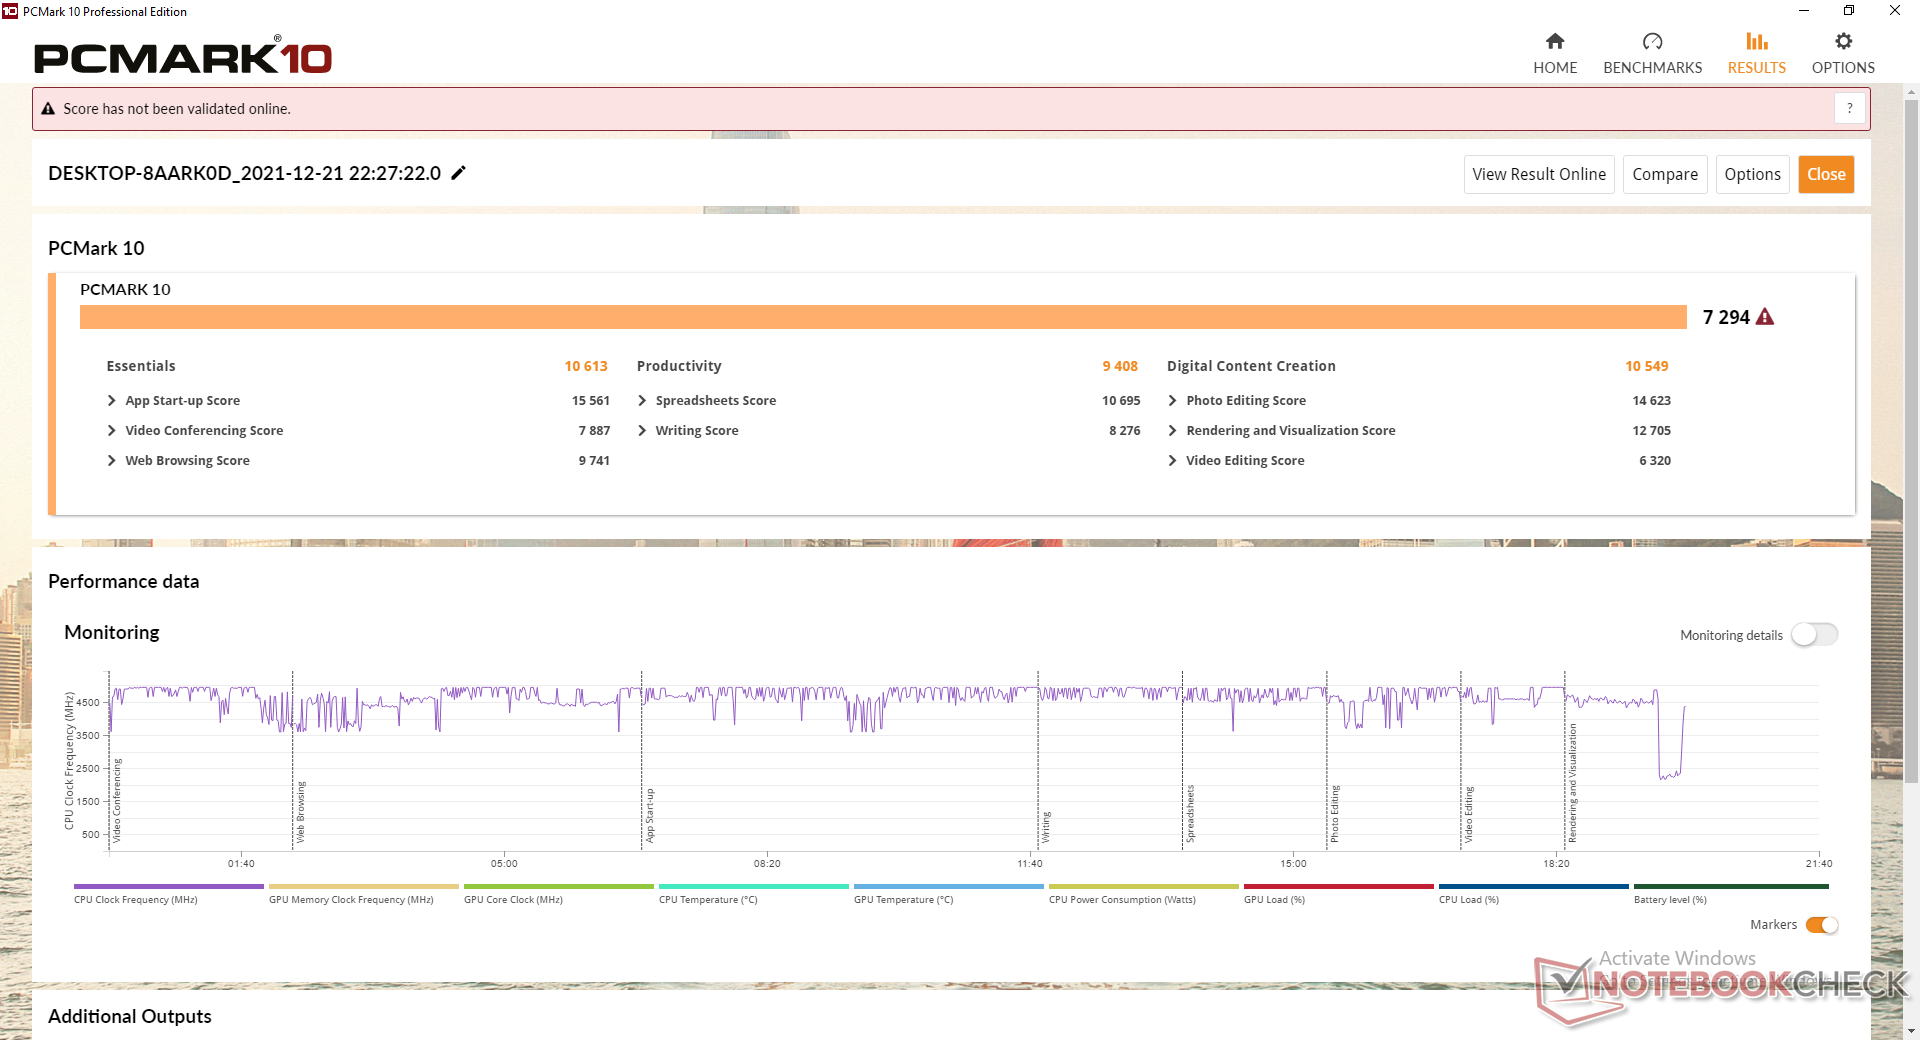
PCMark 10 scores are excellent and comparable to the MSI Delta 15. However, we do not recommend setting Control Center to Power Saving mode or Quiet mode as system performance will slow to a crawl. Simple browsing or OS navigation will become very laggy with constant mouse cursor jumps and frame skips. Users should instead remain on Entertainment mode or Performance mode for a smoother experience.
Furthermore, the system takes an unusually long time to wake from sleep. Typical laptops or Ultrabooks would take less than a couple of seconds whereas our Eurocom would always take upwards of 10 seconds.
| PCMark 10 / Score | |
| MSI Delta 15 A5EFK | |
| Eurocom Nightsky ARX315 | |
| Gigabyte A5 X1 | |
| Schenker XMG Apex 15 NH57E PS | |
| Medion Erazer Deputy P25 | |
| MSI GE66 Raider 10SFS | |
| PCMark 10 / Essentials | |
| Eurocom Nightsky ARX315 | |
| MSI Delta 15 A5EFK | |
| Gigabyte A5 X1 | |
| Schenker XMG Apex 15 NH57E PS | |
| Medion Erazer Deputy P25 | |
| MSI GE66 Raider 10SFS | |
| PCMark 10 / Productivity | |
| MSI Delta 15 A5EFK | |
| Eurocom Nightsky ARX315 | |
| Gigabyte A5 X1 | |
| Medion Erazer Deputy P25 | |
| Schenker XMG Apex 15 NH57E PS | |
| MSI GE66 Raider 10SFS | |
| PCMark 10 / Digital Content Creation | |
| MSI Delta 15 A5EFK | |
| Eurocom Nightsky ARX315 | |
| Gigabyte A5 X1 | |
| Schenker XMG Apex 15 NH57E PS | |
| Medion Erazer Deputy P25 | |
| MSI GE66 Raider 10SFS | |
| PCMark 10 Score | 7294 points | |
Help | ||
| AIDA64 / Memory Copy | |
| Average AMD Ryzen 9 5900X (31315 - 72008, n=15) | |
| Schenker XMG Apex 15 NH57E PS | |
| MSI Delta 15 A5EFK | |
| Gigabyte A5 X1 | |
| Eurocom Nightsky ARX315 | |
| MSI GE66 Raider 10SFS | |
| Medion Erazer Deputy P25 | |
| AIDA64 / Memory Read | |
| Average AMD Ryzen 9 5900X (32972 - 70692, n=15) | |
| Schenker XMG Apex 15 NH57E PS | |
| Gigabyte A5 X1 | |
| MSI Delta 15 A5EFK | |
| Eurocom Nightsky ARX315 | |
| MSI GE66 Raider 10SFS | |
| Medion Erazer Deputy P25 | |
| AIDA64 / Memory Write | |
| Average AMD Ryzen 9 5900X (21619 - 57070, n=15) | |
| MSI GE66 Raider 10SFS | |
| Eurocom Nightsky ARX315 | |
| Schenker XMG Apex 15 NH57E PS | |
| MSI Delta 15 A5EFK | |
| Gigabyte A5 X1 | |
| Medion Erazer Deputy P25 | |
| AIDA64 / Memory Latency | |
| Medion Erazer Deputy P25 | |
| Schenker XMG Apex 15 NH57E PS | |
| MSI Delta 15 A5EFK | |
| Gigabyte A5 X1 | |
| Average AMD Ryzen 9 5900X (58.4 - 107.6, n=15) | |
| Eurocom Nightsky ARX315 | |
| MSI GE66 Raider 10SFS | |
* ... smaller is better
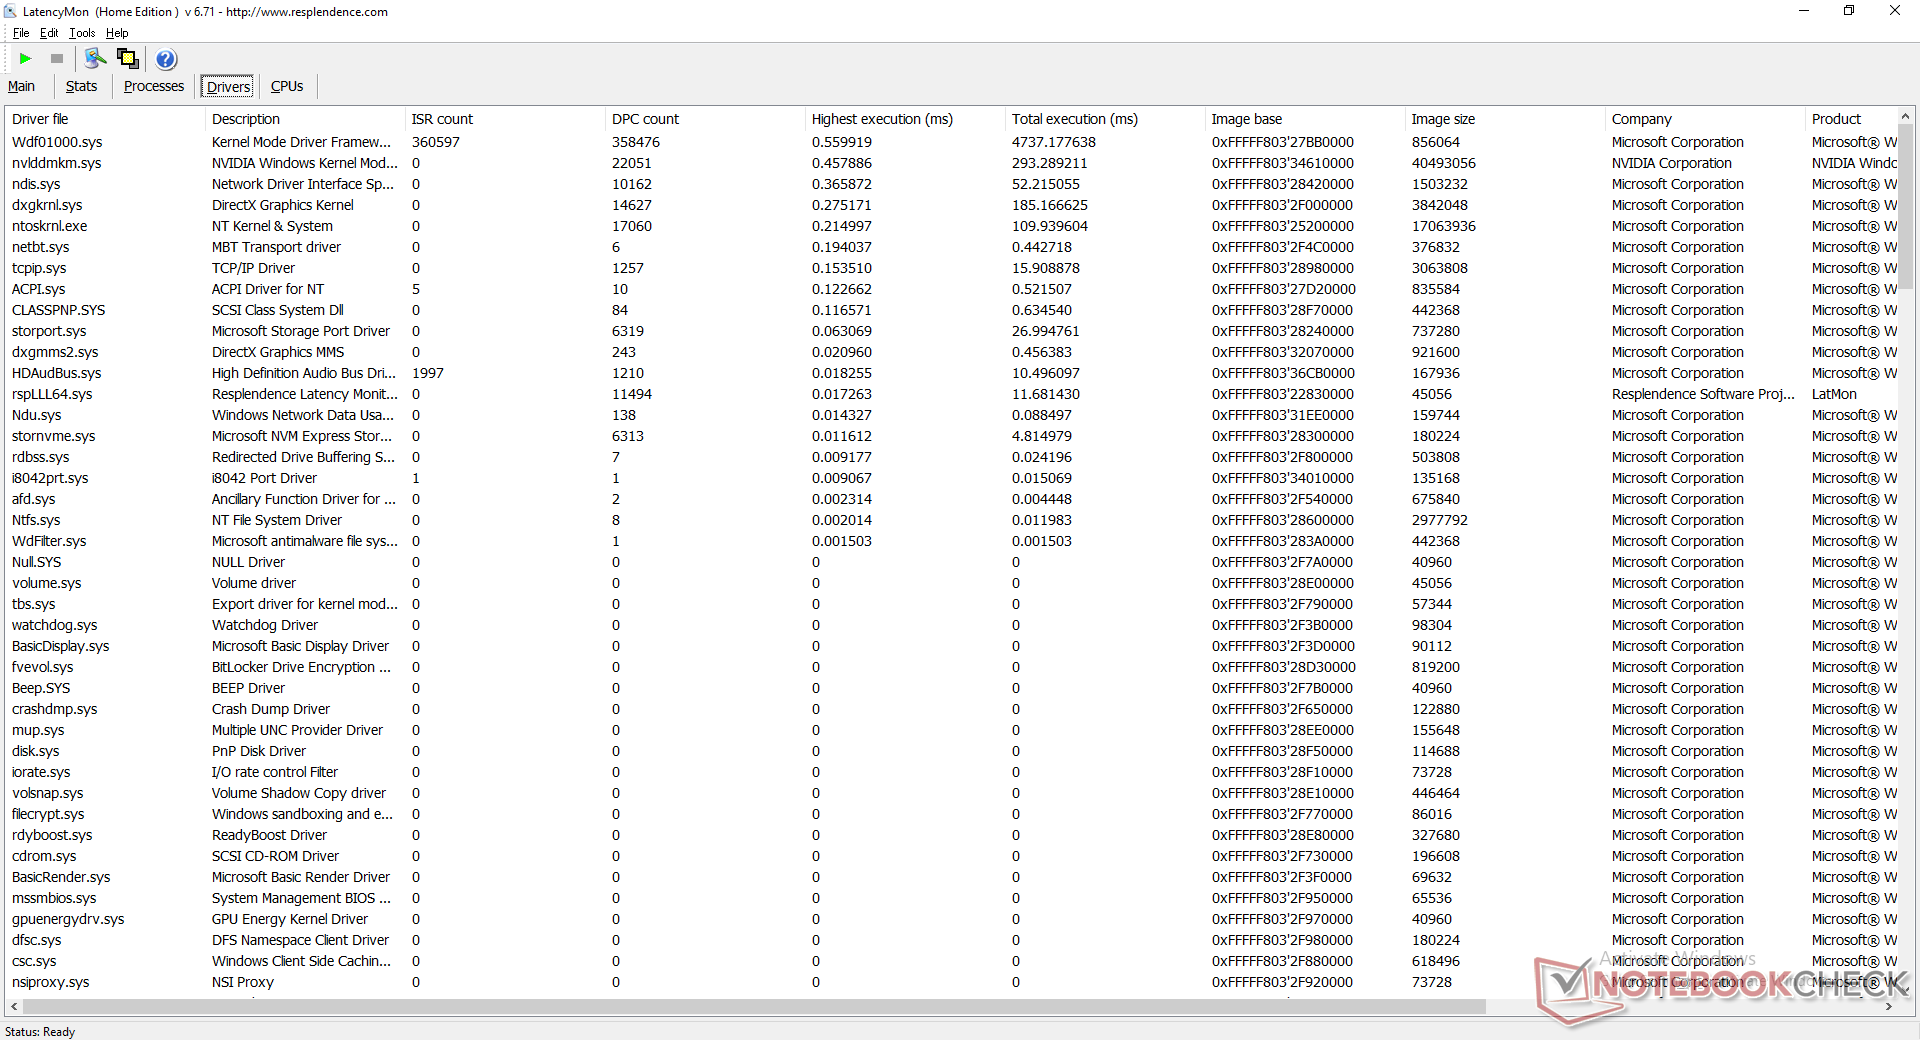
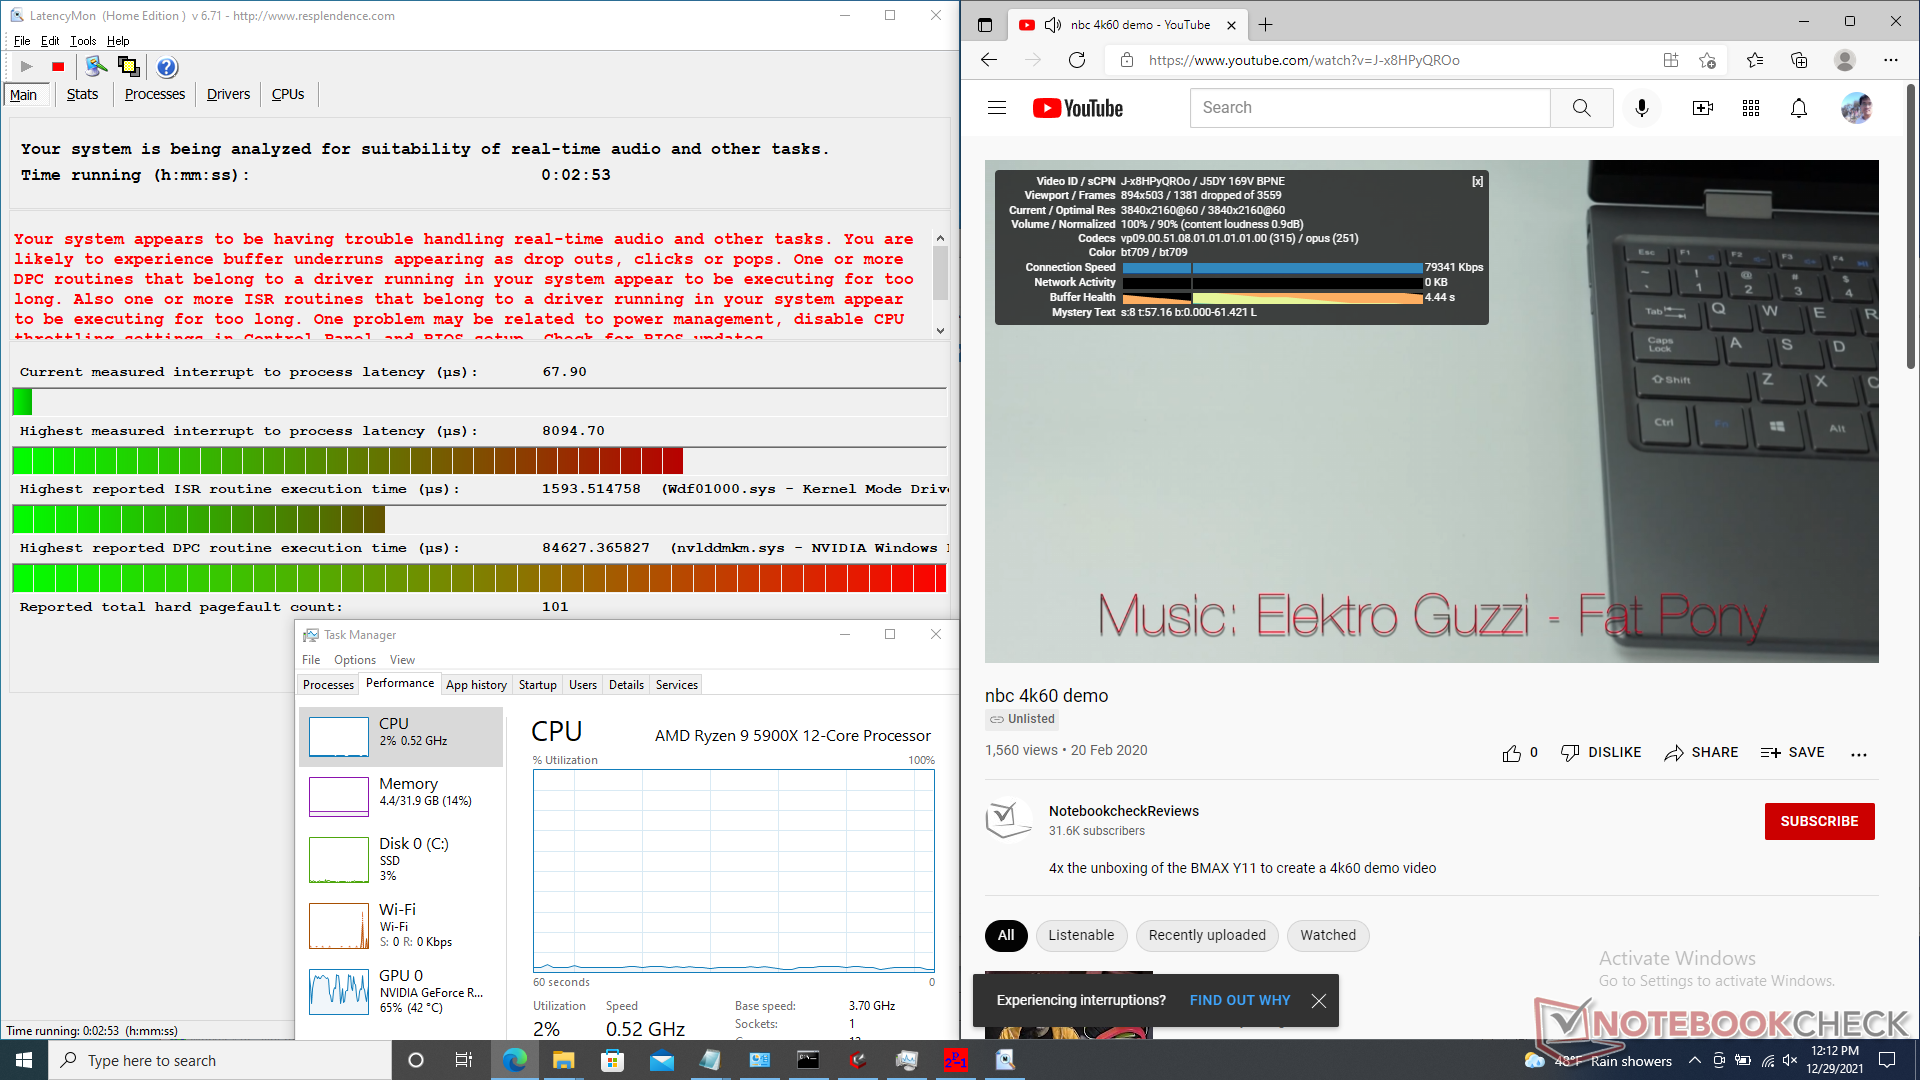
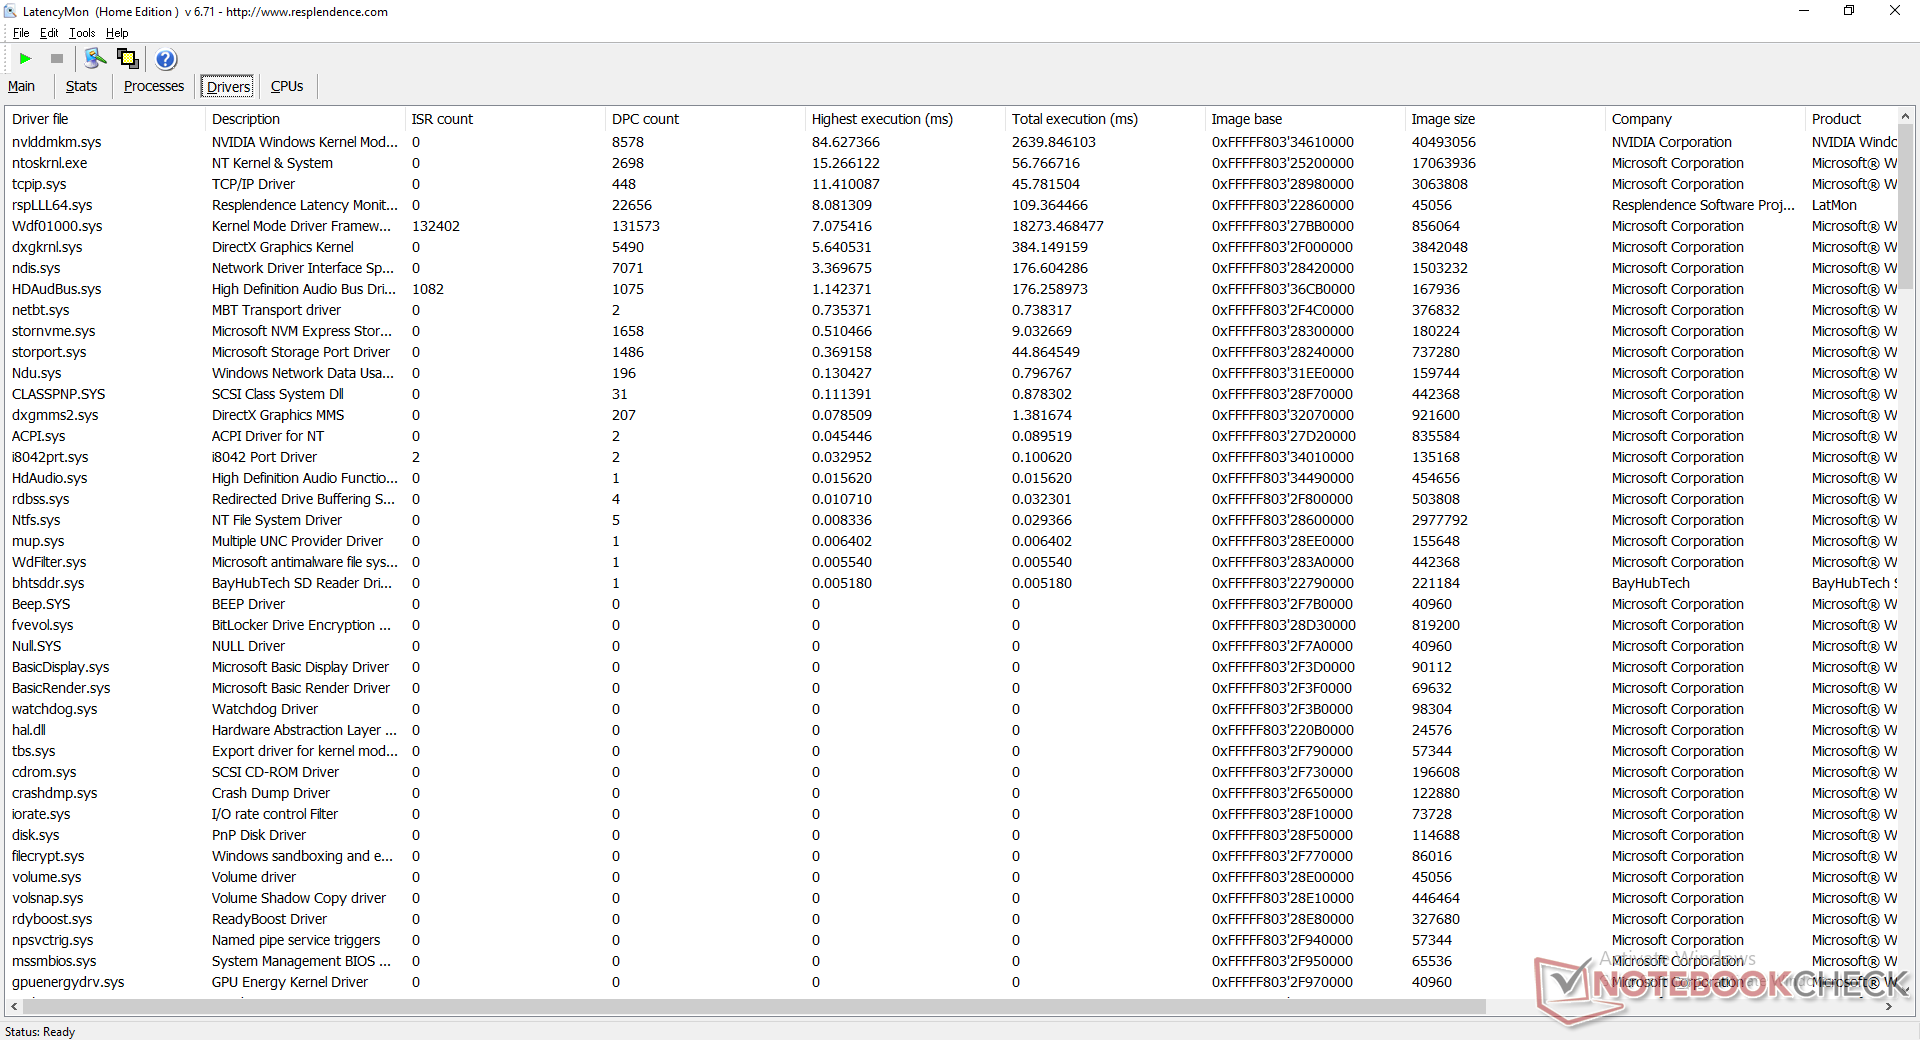
DPC Latency
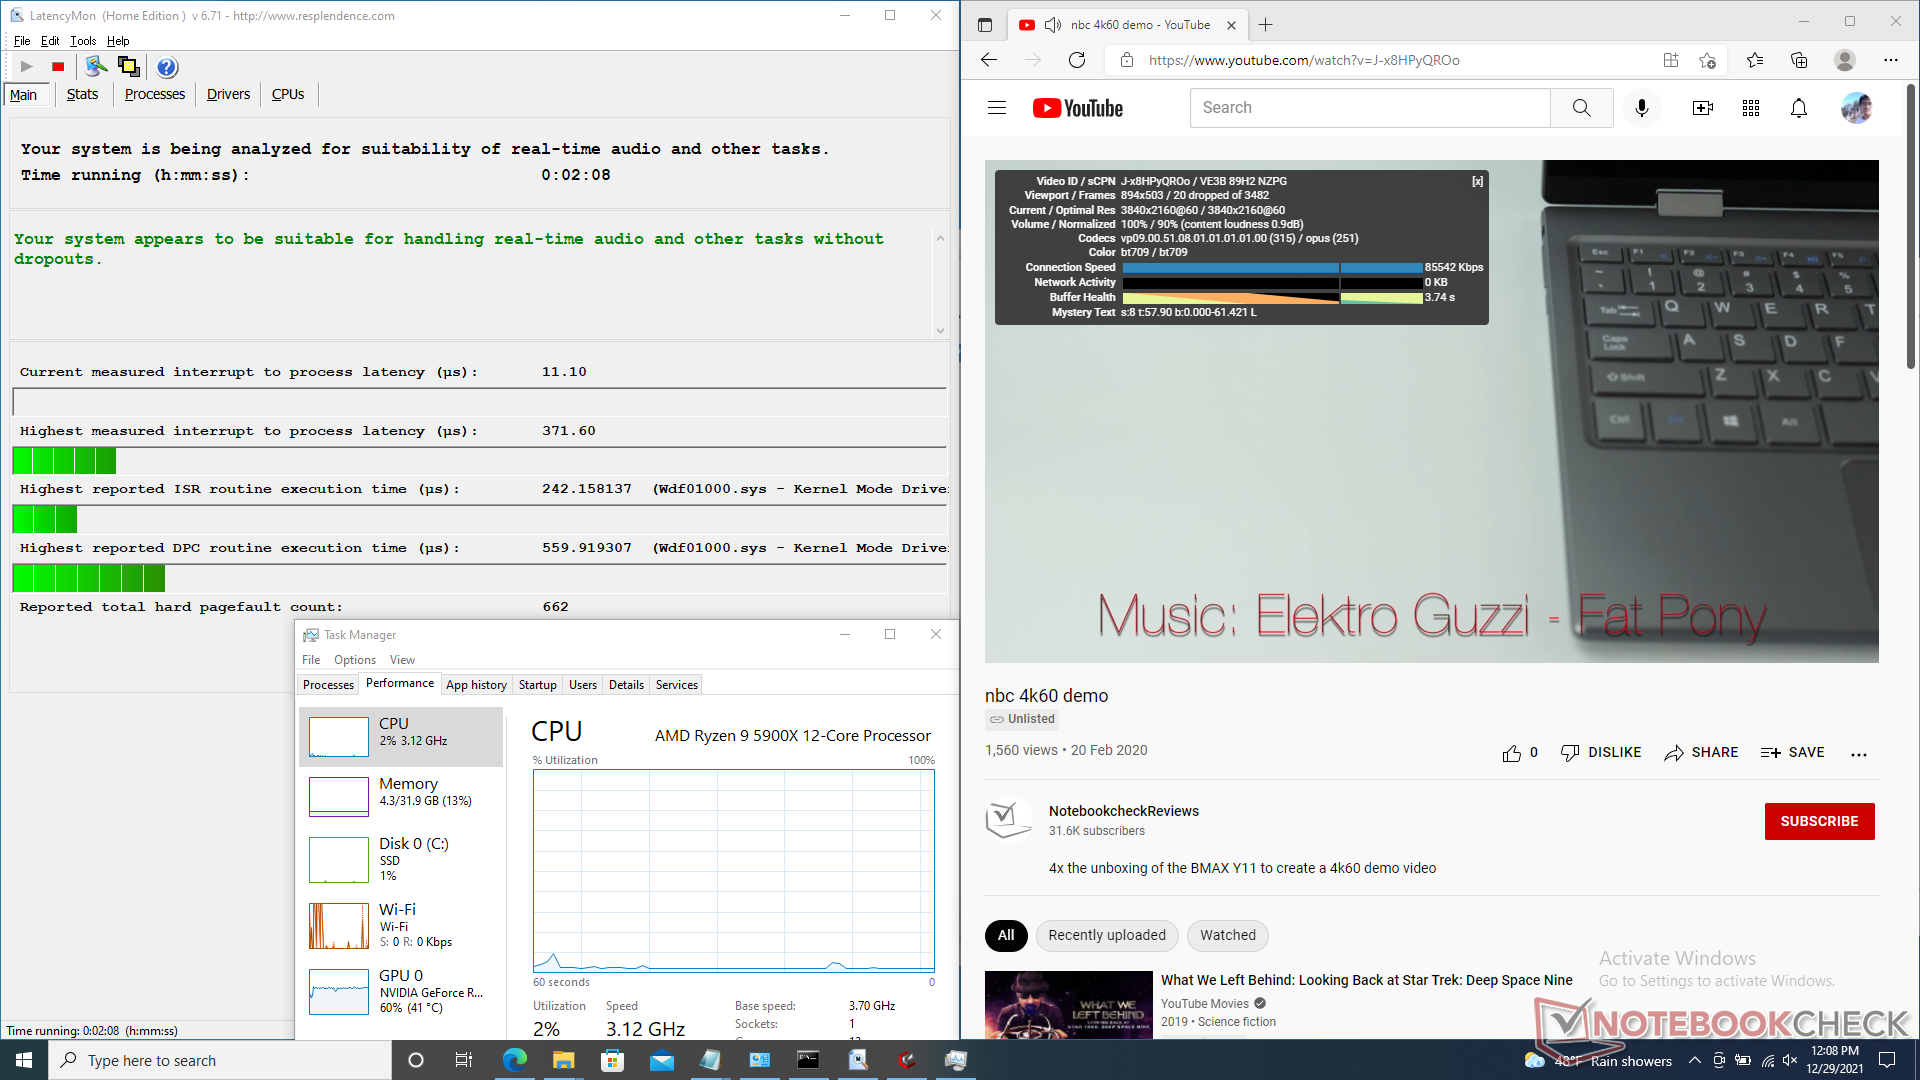
There are no latency issues when running on Entertainment mode or Performance mode. Unfortunately, the story flips if running on Power Saving mode or Quiet mode. Our minute-long 4K60 test video would have over 1500 dropped frames when on Power Saving or Quiet mode compared to just 20 dropped frames if on Entertainment or Performance mode.
| DPC Latencies / LatencyMon - interrupt to process latency (max), Web, Youtube, Prime95 | |
| MSI Delta 15 A5EFK | |
| Medion Erazer Deputy P25 | |
| Schenker XMG Apex 15 NH57E PS | |
| MSI GE66 Raider 10SFS | |
| Gigabyte A5 X1 | |
| Eurocom Nightsky ARX315 | |
* ... smaller is better
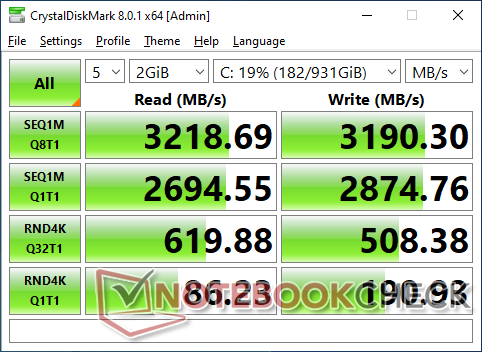
Storage Devices
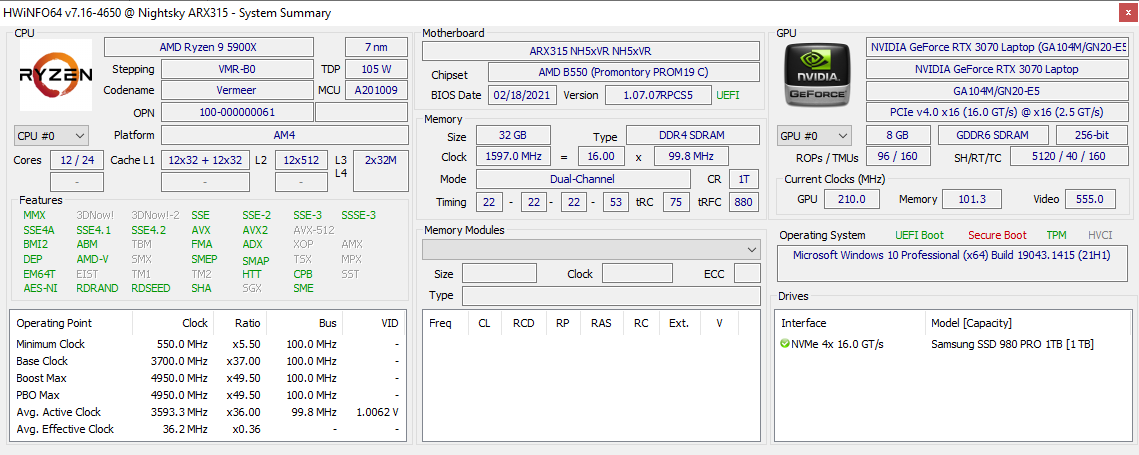
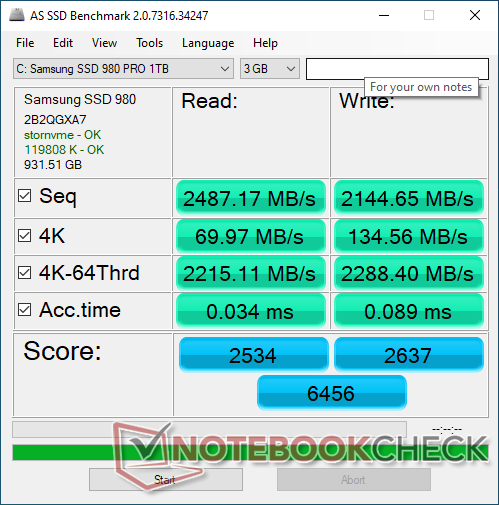
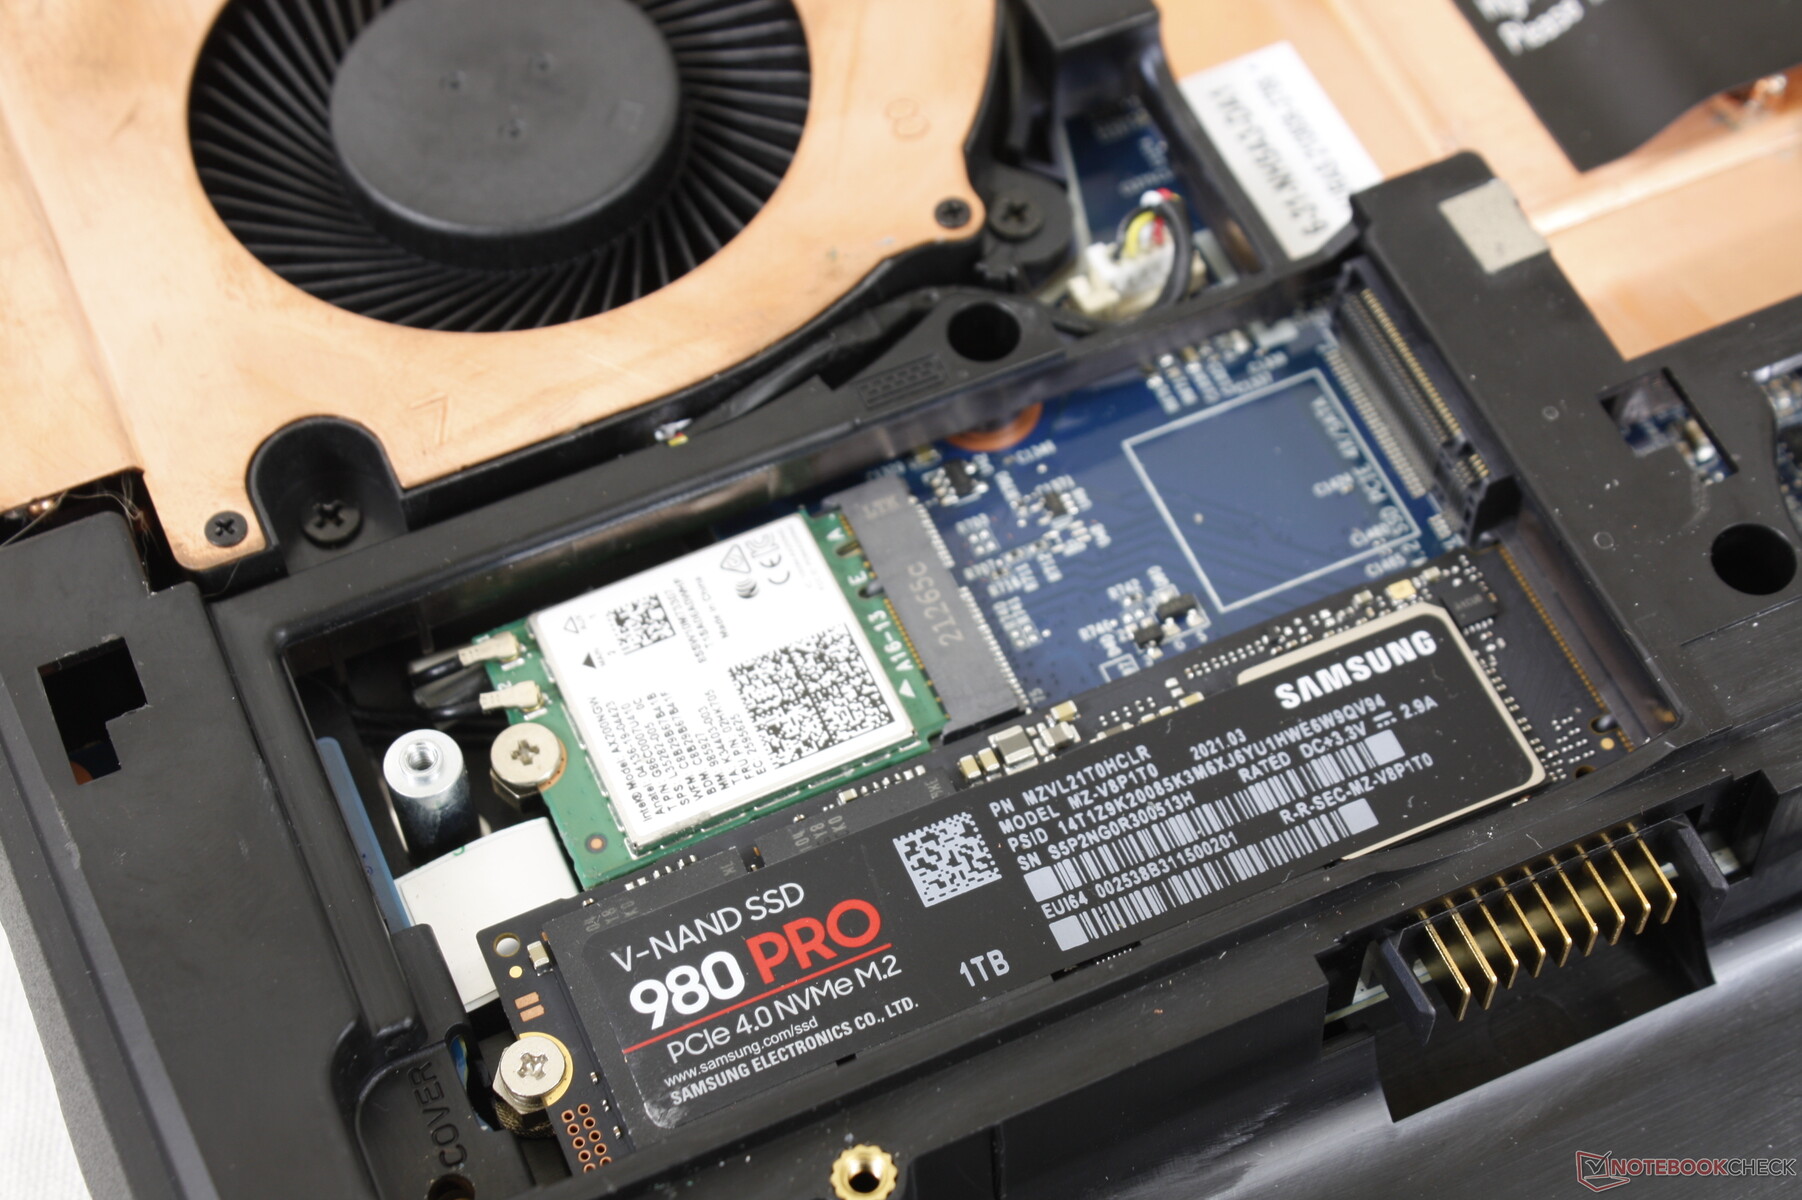
Eurocom offers a wide selection of NVMe SSDs ranging from just 250 GB up to 8 TB. Our unit has been configured with the Samsung SSD 980 Pro which is a PCIe4 x4 NVMe SSD capable of transfer rates of up to 7000 MB/s. Unfortunately, the M.2 slots on the Nightsky ARX15 are PCIe3 x4 only and so transfer rates will be much slower at up to around 3200 MB/s. You may want to save yourself some cash and only configure with less expensive PCIe3 drives since the motherboard cannot fully exploit the performance benefits of pricier PCIe4 drives.

* ... smaller is better
Disk Throttling: DiskSpd Read Loop, Queue Depth 8
GPU Performance
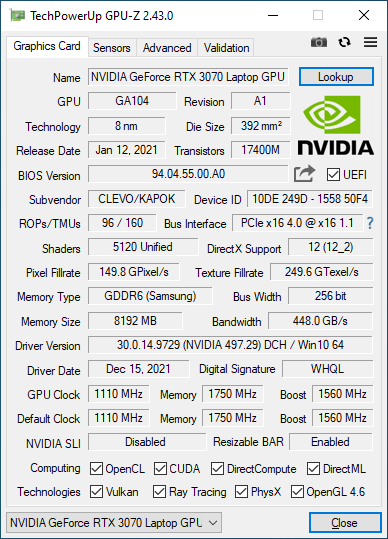
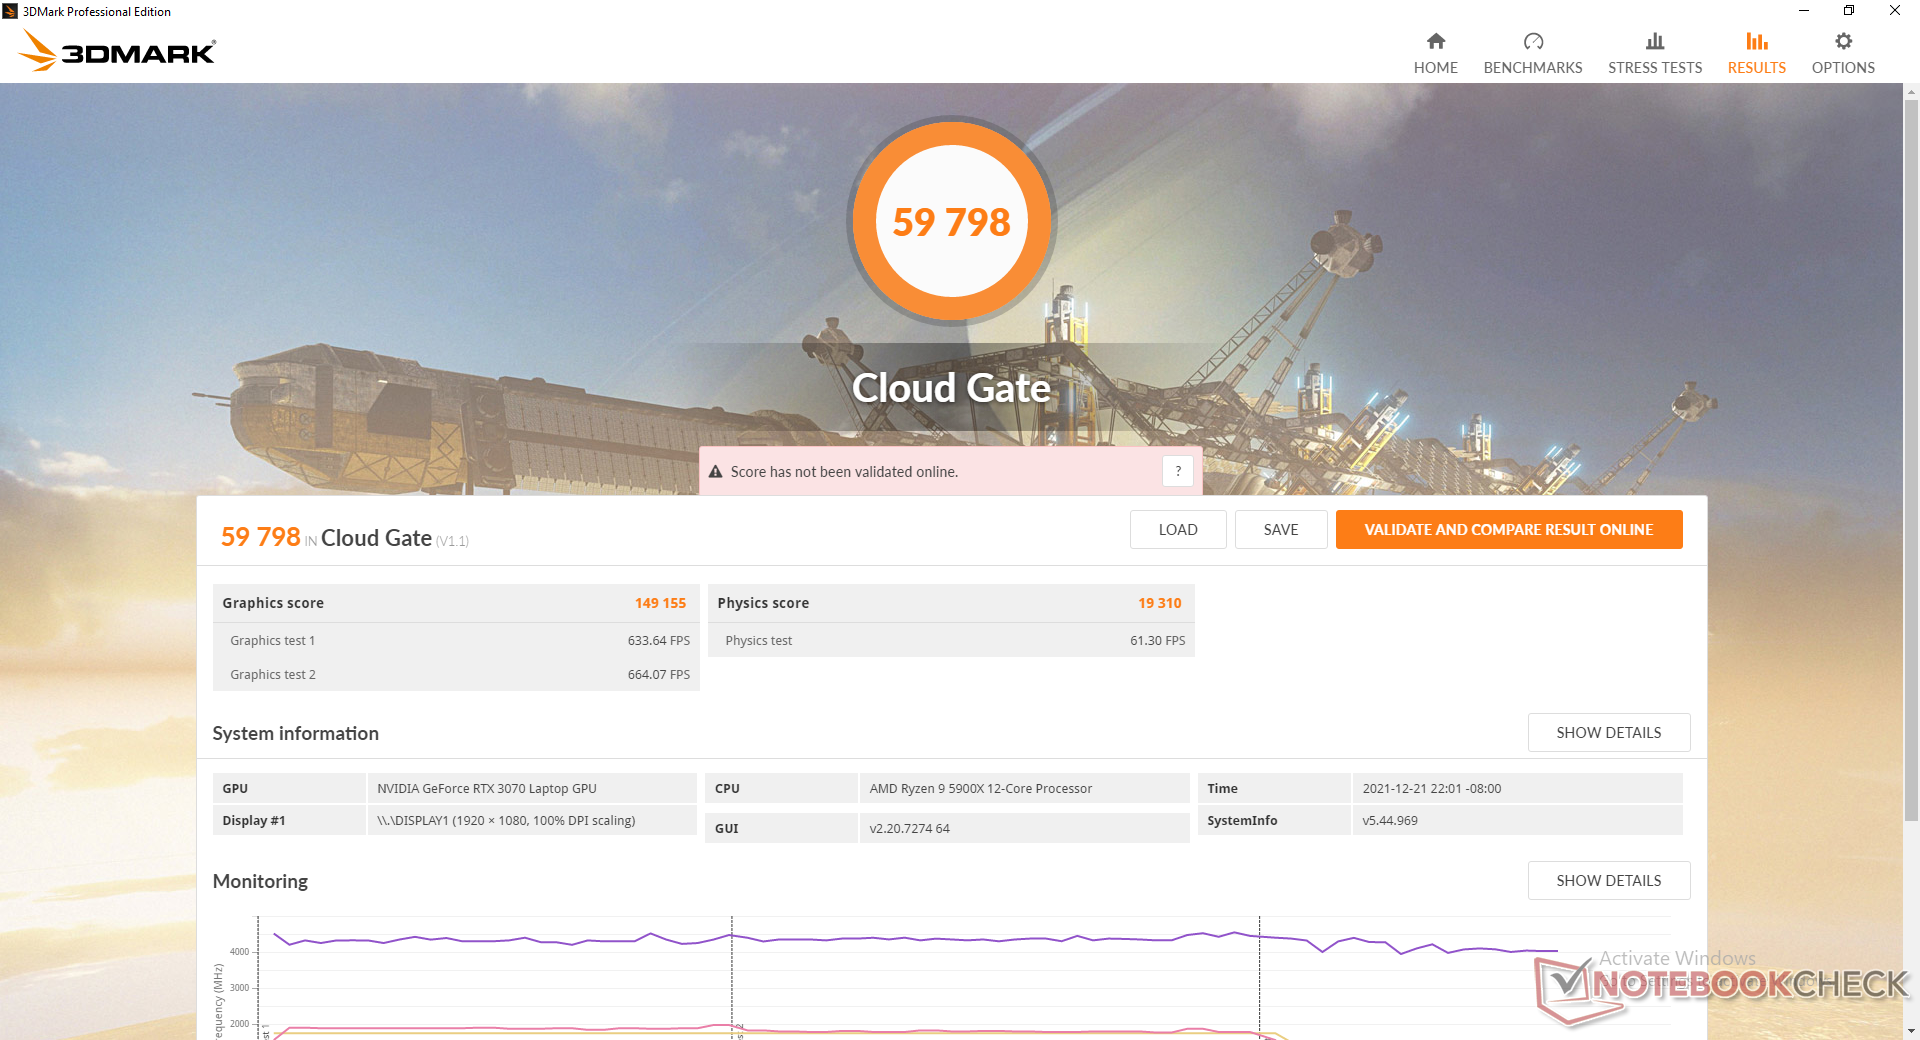
The 115 W TGP mobile GeForce RTX 3070 is performing where we expect it to be relative to other laptops with the same GPU. There appears to be no GPU performance benefits if running with Maximum Fan mode on.
G-Sync is not supported on the main display and there is no Advanced Optimus, either.
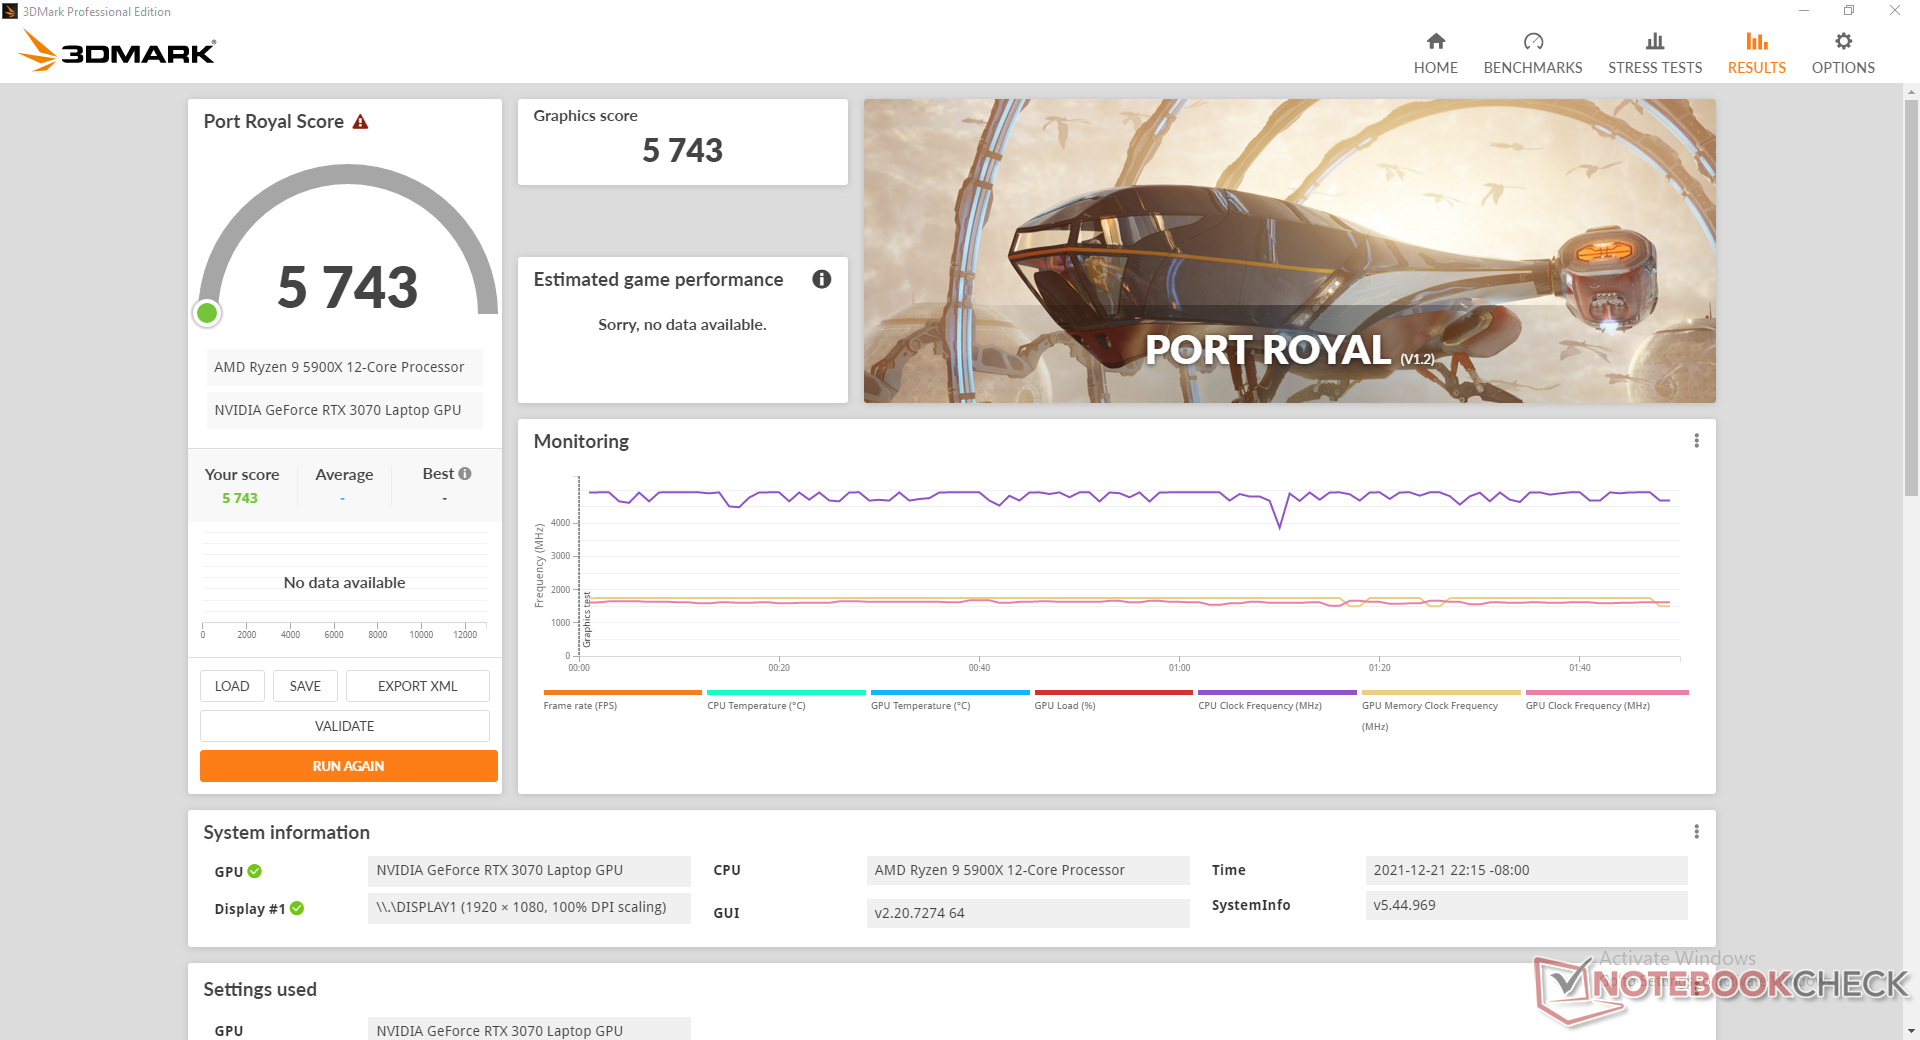
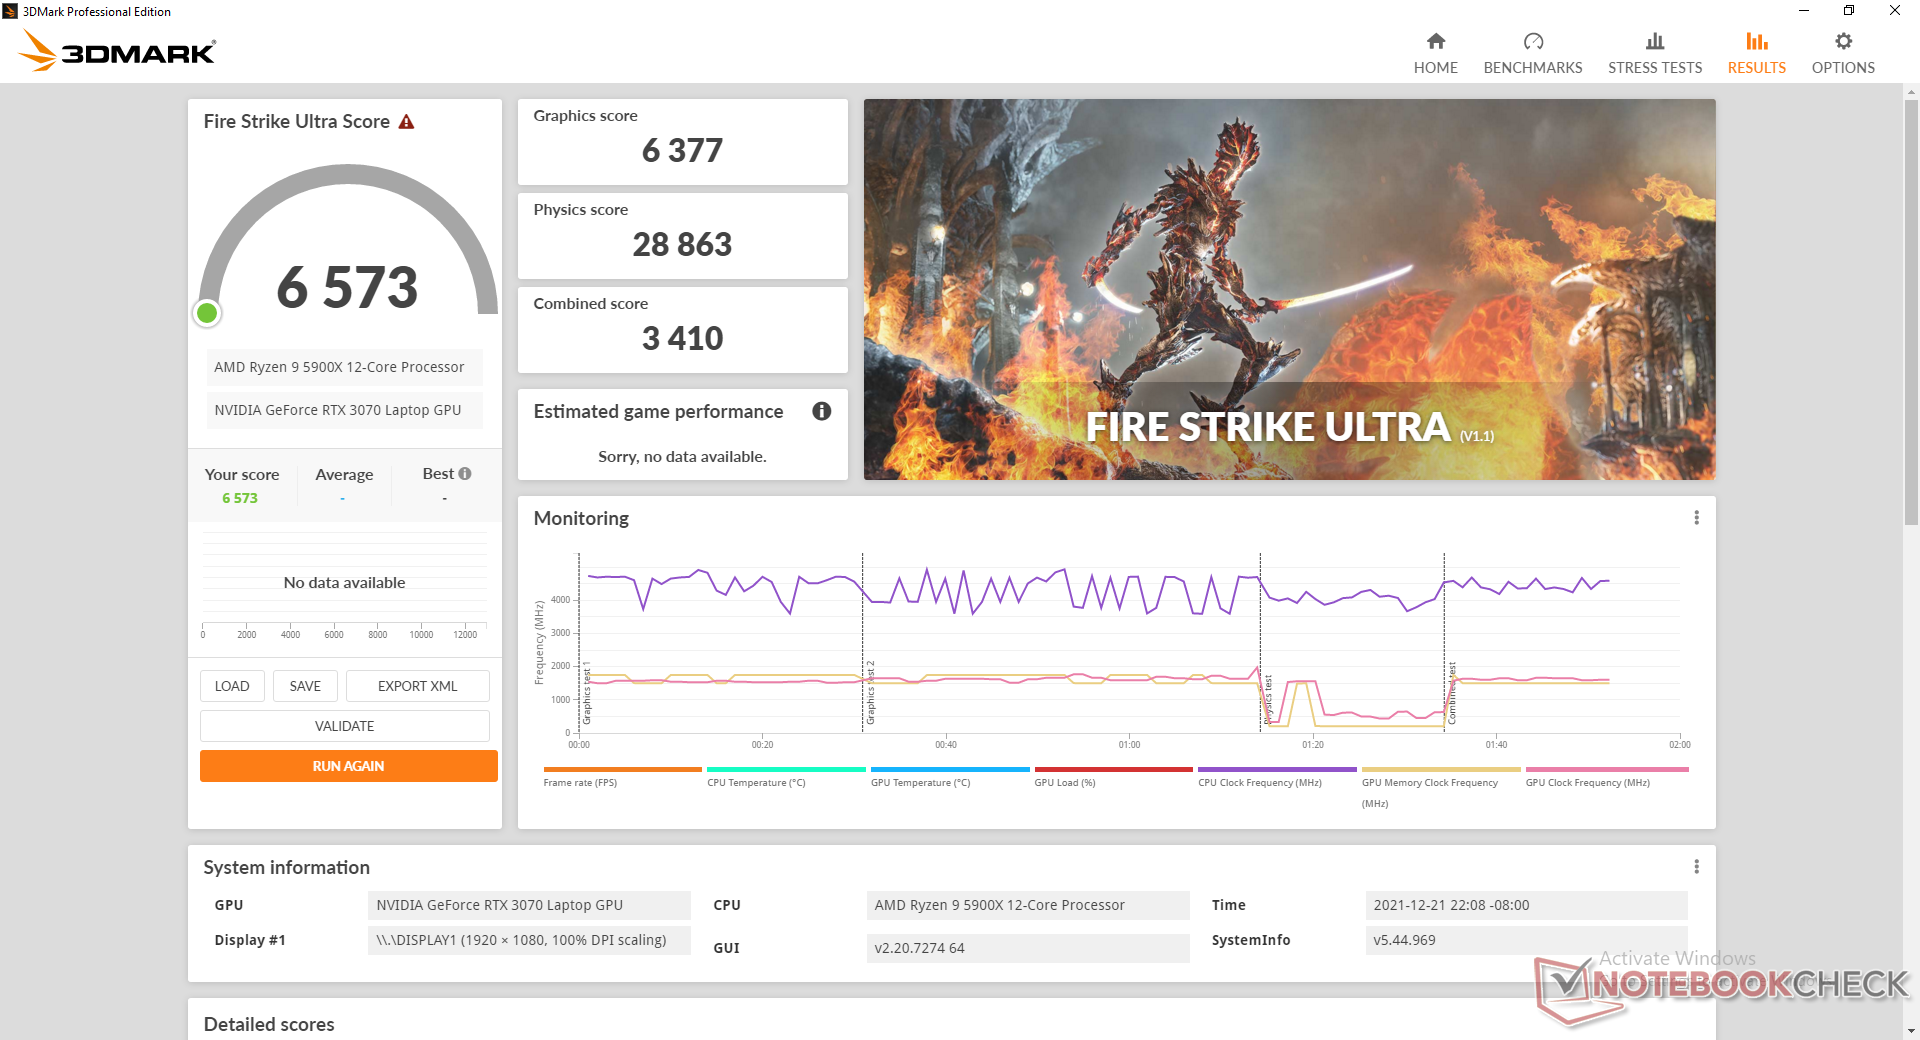
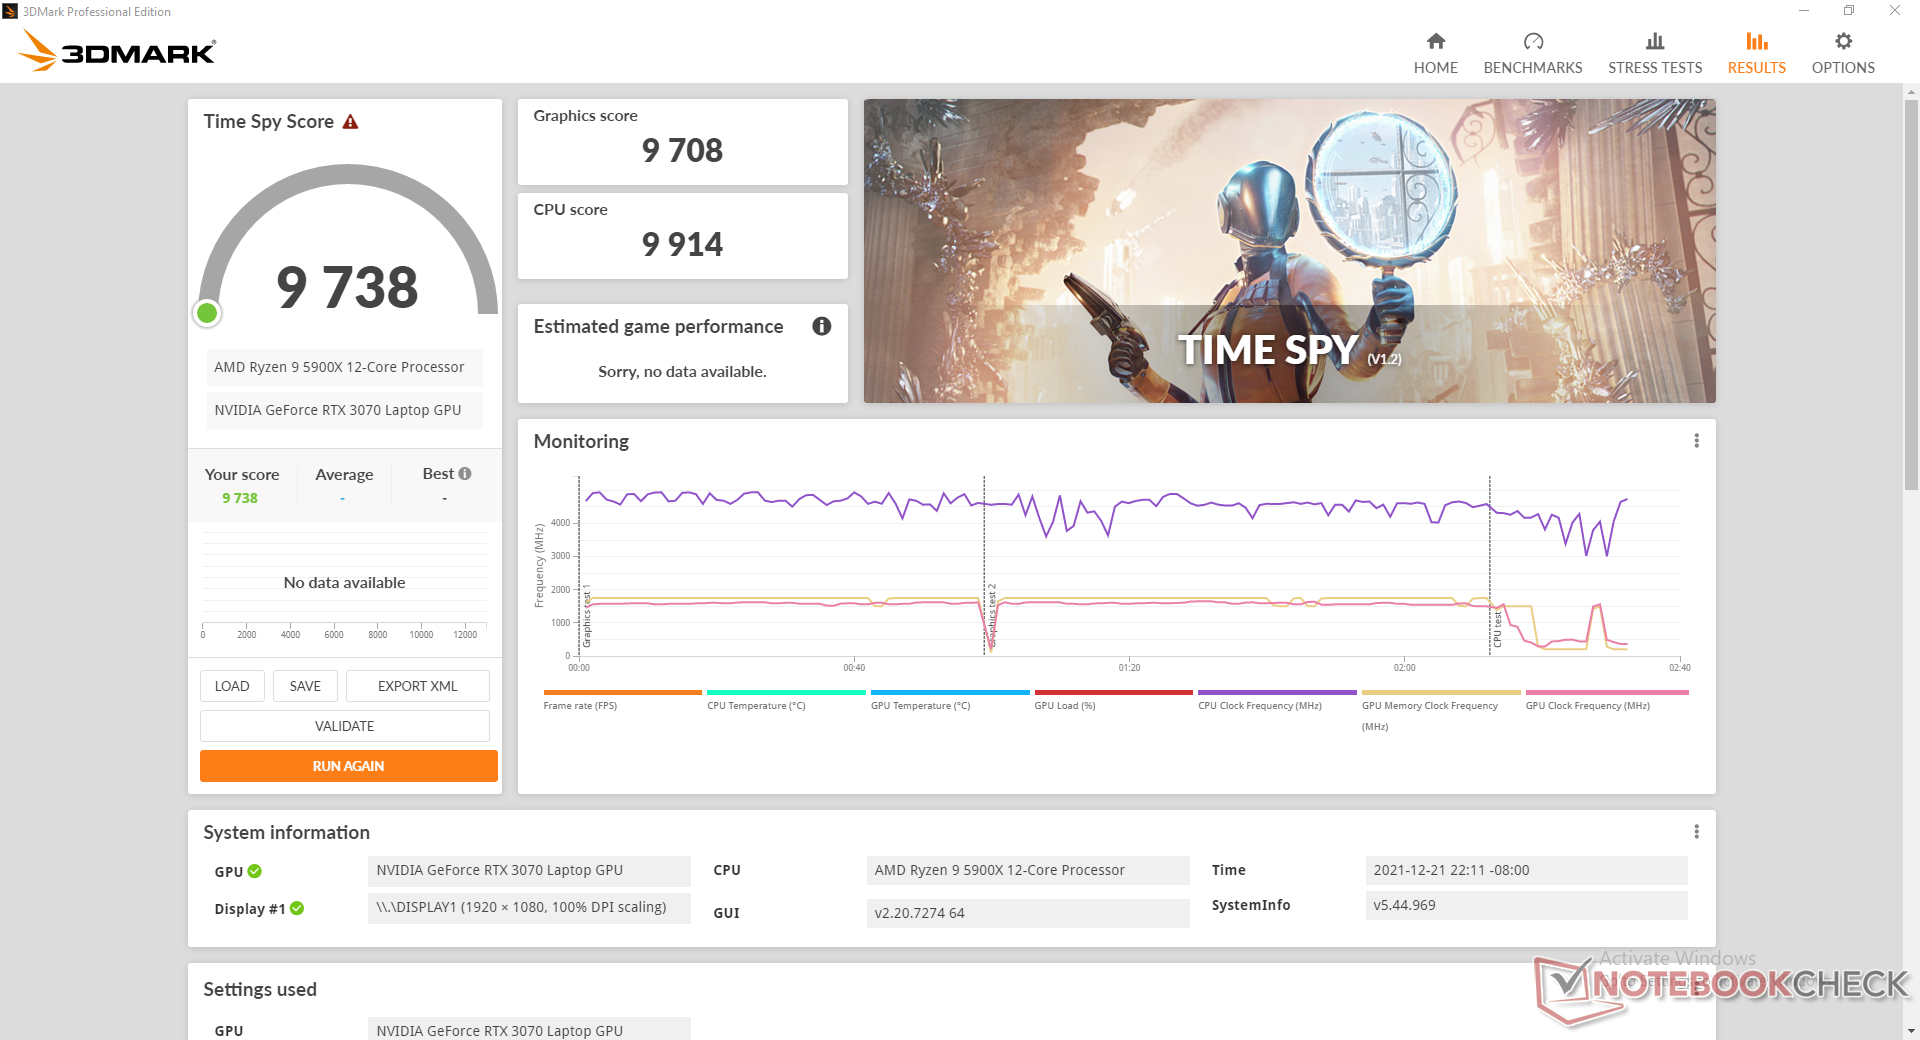
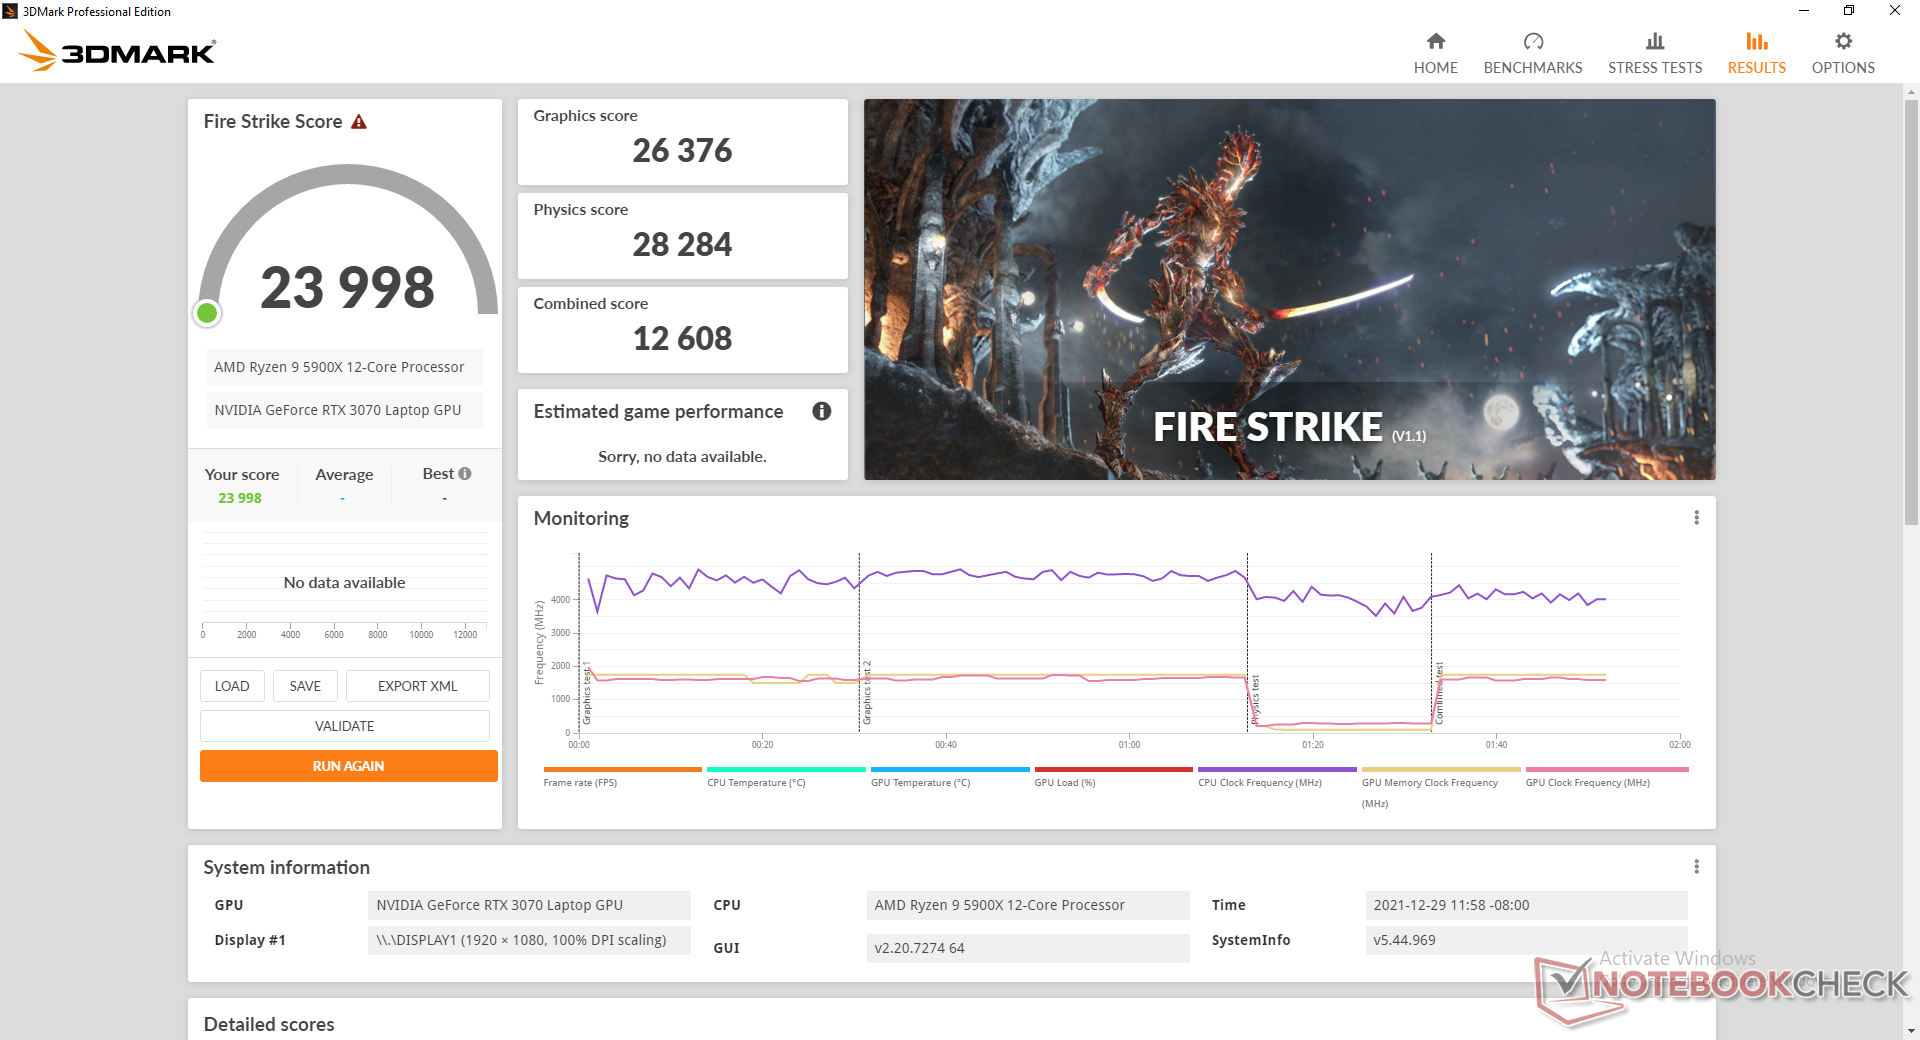
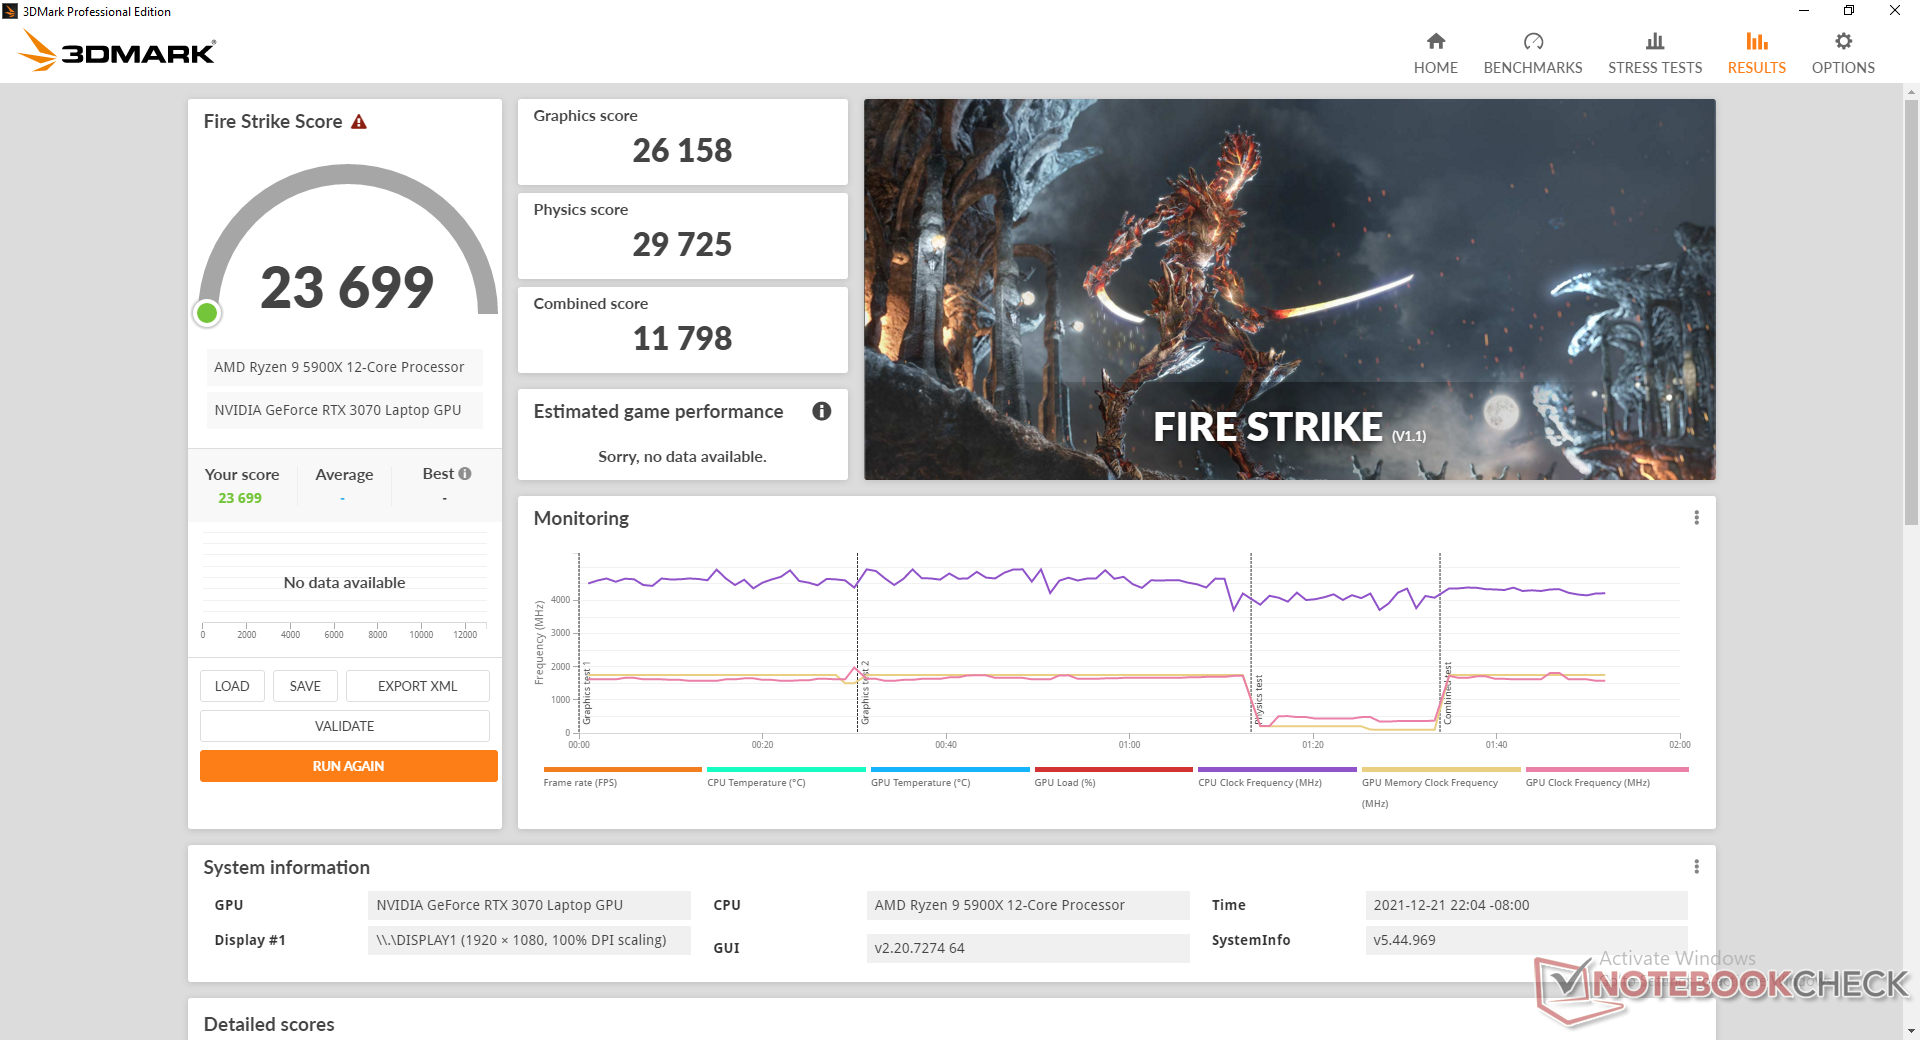
| 3DMark 11 Performance | 29688 points | |
| 3DMark Cloud Gate Standard Score | 59798 points | |
| 3DMark Fire Strike Score | 23699 points | |
| 3DMark Time Spy Score | 9738 points | |
Help | ||
| Final Fantasy XV Benchmark | |
| 1280x720 Lite Quality | |
| Eurocom Nightsky ARX315 | |
| Gigabyte A5 X1 | |
| Average NVIDIA GeForce RTX 3070 Laptop GPU (137 - 207, n=30) | |
| MSI GeForce RTX 3080 Gaming X Trio | |
| 1920x1080 Standard Quality | |
| Eurocom Nightsky ARX315 | |
| MSI GeForce RTX 3080 Gaming X Trio | |
| Gigabyte A5 X1 | |
| Average NVIDIA GeForce RTX 3070 Laptop GPU (67 - 144, n=32) | |
| 1920x1080 High Quality | |
| MSI GeForce RTX 3080 Gaming X Trio | |
| Eurocom Nightsky ARX315 | |
| Gigabyte A5 X1 | |
| Average NVIDIA GeForce RTX 3070 Laptop GPU (27.9 - 107, n=49) | |
| Strange Brigade | |
| 1280x720 lowest AF:1 | |
| Eurocom Nightsky ARX315 | |
| MSI GeForce RTX 3080 Gaming X Trio | |
| Average NVIDIA GeForce RTX 3070 Laptop GPU (106.8 - 522, n=34) | |
| Gigabyte A5 X1 | |
| 1920x1080 medium AA:medium AF:4 | |
| MSI GeForce RTX 3080 Gaming X Trio | |
| Eurocom Nightsky ARX315 | |
| Average NVIDIA GeForce RTX 3070 Laptop GPU (44.1 - 279, n=35) | |
| Gigabyte A5 X1 | |
| 1920x1080 high AA:high AF:8 | |
| MSI GeForce RTX 3080 Gaming X Trio | |
| Eurocom Nightsky ARX315 | |
| Average NVIDIA GeForce RTX 3070 Laptop GPU (39.6 - 225, n=35) | |
| Gigabyte A5 X1 | |
| 1920x1080 ultra AA:ultra AF:16 | |
| MSI GeForce RTX 3080 Gaming X Trio | |
| Eurocom Nightsky ARX315 | |
| Gigabyte A5 X1 | |
| Average NVIDIA GeForce RTX 3070 Laptop GPU (36.2 - 194, n=46) | |
Witcher 3 FPS Chart
| low | med. | high | ultra | |
|---|---|---|---|---|
| GTA V (2015) | 185 | 182 | 175 | 114 |
| The Witcher 3 (2015) | 505 | 327.3 | 199 | 96.6 |
| Dota 2 Reborn (2015) | 211 | 180 | 178 | 158 |
| Final Fantasy XV Benchmark (2018) | 207 | 144 | 107 | |
| X-Plane 11.11 (2018) | 146 | 131 | 105 | |
| Far Cry 5 (2018) | 165 | 140 | 135 | 126 |
| Strange Brigade (2018) | 519 | 275 | 221 | 192 |
Emissions
System Noise
Fan noise is dependent on the four Control Center power profile settings: Power Saving, Quiet, Entertainment, or Performance. The system runs very quietly (~27.9 dB(A)) on the first two settings, but overall performance would suffer so dramatically that the system can feel like molasses. Meanwhile, fan noise will often spike to as high as 40.8 dB(A) even if running undemanding loads on Performance mode. We recommend running on Entertainment mode as it offers the better balance between system performance and the constantly pulsing fans.
Gaming will induce a fan noise between 52 and 56 dB(A) to be not unlike most other high-performance 15.6-inch gaming laptops. Fan noise can reach over 60 dB(A) when Maximum Fan mode is active.
Noise level
| Idle |
| 25.9 / 27.9 / 40.8 dB(A) |
| Load |
| 55.2 / 60.3 dB(A) |
 | ||
30 dB silent 40 dB(A) audible 50 dB(A) loud |
||
min: | ||
| Eurocom Nightsky ARX315 GeForce RTX 3070 Laptop GPU, R9 5900X, Samsung SSD 980 Pro 1TB MZ-V8P1T0BW | Gigabyte A5 X1 GeForce RTX 3070 Laptop GPU, R9 5900HX, ADATA XPG SX8200 Pro (ASX8200PNP-512GT) | Medion Erazer Deputy P25 GeForce RTX 3060 Laptop GPU, R7 5800H, Phison E12S-512GB-Phison-SSD-BICS4 | MSI Delta 15 A5EFK Radeon RX 6700M, R9 5900HX, Micron 2210 MTFDHBA1T0QFD | Schenker XMG Apex 15 NH57E PS GeForce RTX 3060 Laptop GPU, R7 5800H, Samsung SSD 980 500GB (MZ-V8V500BW) | MSI GE66 Raider 10SFS GeForce RTX 2070 Super Mobile, i9-10980HK, WDC PC SN730 SDBPNTY-1T00 | |
|---|---|---|---|---|---|---|
| Noise | 1% | 2% | 5% | 15% | -8% | |
| off / environment * (dB) | 25.3 | 25 1% | 25 1% | 25 1% | 23 9% | 30 -19% |
| Idle Minimum * (dB) | 25.9 | 27 -4% | 27 -4% | 25 3% | 23 11% | 30 -16% |
| Idle Average * (dB) | 27.9 | 29 -4% | 29 -4% | 30 -8% | 23 18% | 35 -25% |
| Idle Maximum * (dB) | 40.8 | 32 22% | 31 24% | 40 2% | 26.4 35% | 44 -8% |
| Load Average * (dB) | 55.2 | 57 -3% | 57 -3% | 47 15% | 34.25 38% | 53 4% |
| Witcher 3 ultra * (dB) | 52.4 | 56 -7% | 56 -7% | 48 8% | 58.4 -11% | 53 -1% |
| Load Maximum * (dB) | 60.3 | 58 4% | 58 4% | 51 15% | 58.42 3% | 55 9% |
* ... smaller is better
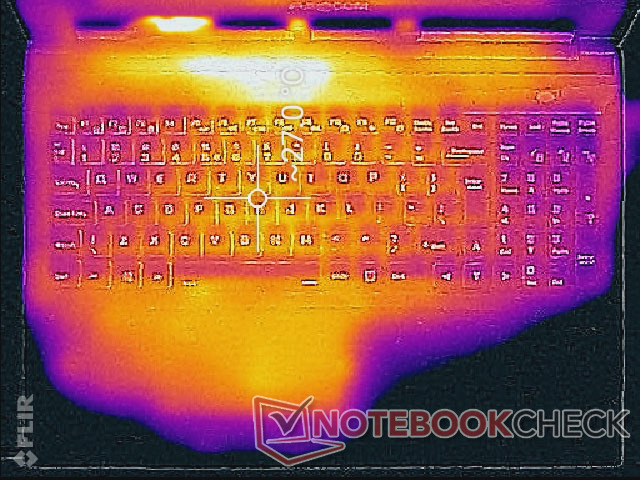
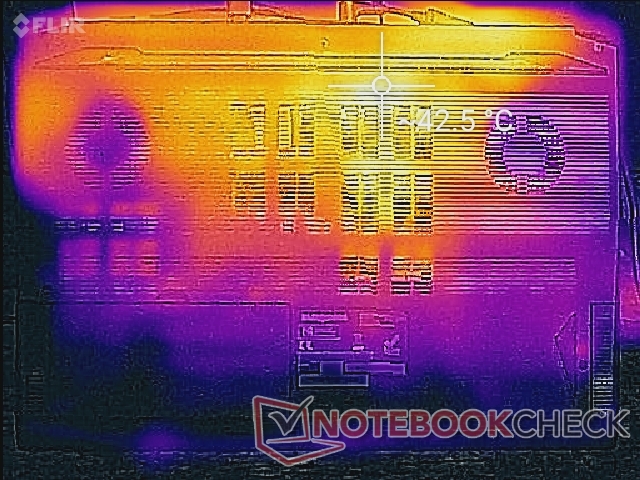
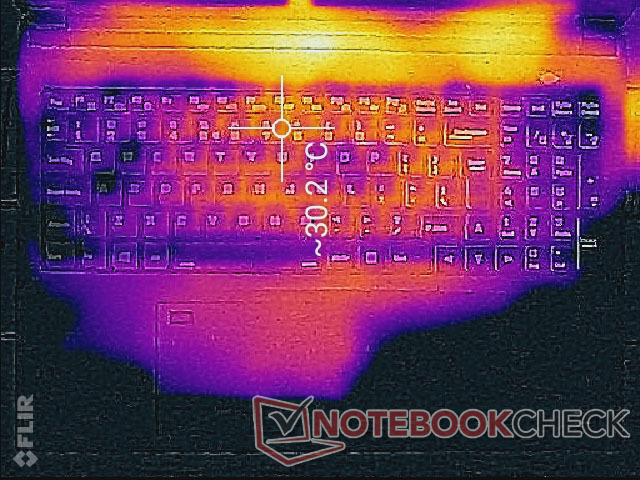
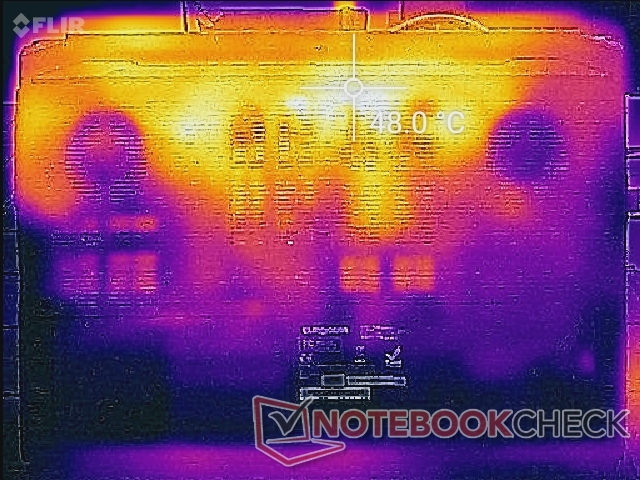
Temperature
Surface temperatures are warm even when idling on Power Saving mode or Quiet mode since fan noise is being pushed to much quieter limits. Hot spots can be as warm as 27 C and 43 C on the top and bottom, respectively. The keyboard keys are therefore always warm but thankfully never uncomfortably when running high loads as the loud fans do a good job at keeping surface temperatures in check.
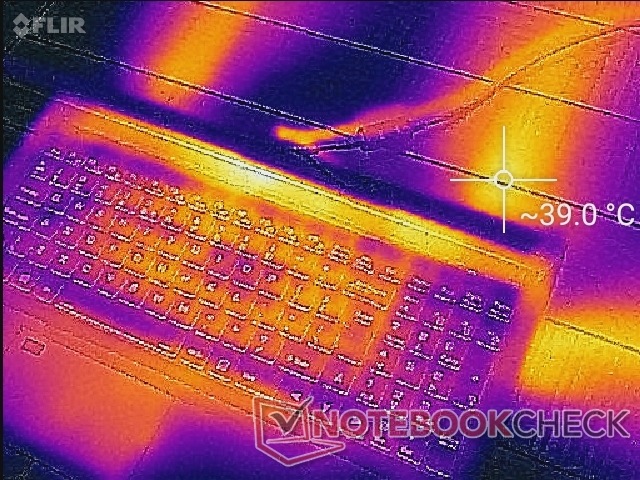
(+) The maximum temperature on the upper side is 36.2 °C / 97 F, compared to the average of 40.4 °C / 105 F, ranging from 21.2 to 68.8 °C for the class Gaming.
(-) The bottom heats up to a maximum of 49.6 °C / 121 F, compared to the average of 43.2 °C / 110 F
(+) In idle usage, the average temperature for the upper side is 27 °C / 81 F, compared to the device average of 33.9 °C / 93 F.
(+) The palmrests and touchpad are cooler than skin temperature with a maximum of 30 °C / 86 F and are therefore cool to the touch.
(±) The average temperature of the palmrest area of similar devices was 28.8 °C / 83.8 F (-1.2 °C / -2.2 F).
| Eurocom Nightsky ARX315 AMD Ryzen 9 5900X, NVIDIA GeForce RTX 3070 Laptop GPU | Gigabyte A5 X1 AMD Ryzen 9 5900HX, NVIDIA GeForce RTX 3070 Laptop GPU | Medion Erazer Deputy P25 AMD Ryzen 7 5800H, NVIDIA GeForce RTX 3060 Laptop GPU | MSI Delta 15 A5EFK AMD Ryzen 9 5900HX, AMD Radeon RX 6700M | Schenker XMG Apex 15 NH57E PS AMD Ryzen 7 5800H, NVIDIA GeForce RTX 3060 Laptop GPU | MSI GE66 Raider 10SFS Intel Core i9-10980HK, NVIDIA GeForce RTX 2070 Super Mobile | |
|---|---|---|---|---|---|---|
| Heat | 4% | 17% | -3% | 13% | -3% | |
| Maximum Upper Side * (°C) | 36.2 | 47 -30% | 37 -2% | 50 -38% | 36 1% | 49 -35% |
| Maximum Bottom * (°C) | 49.6 | 51 -3% | 40 19% | 55 -11% | 38 23% | 52 -5% |
| Idle Upper Side * (°C) | 32.6 | 27 17% | 27 17% | 31 5% | 31 5% | 30 8% |
| Idle Bottom * (°C) | 43.2 | 30 31% | 29 33% | 30 31% | 33 24% | 34 21% |
* ... smaller is better
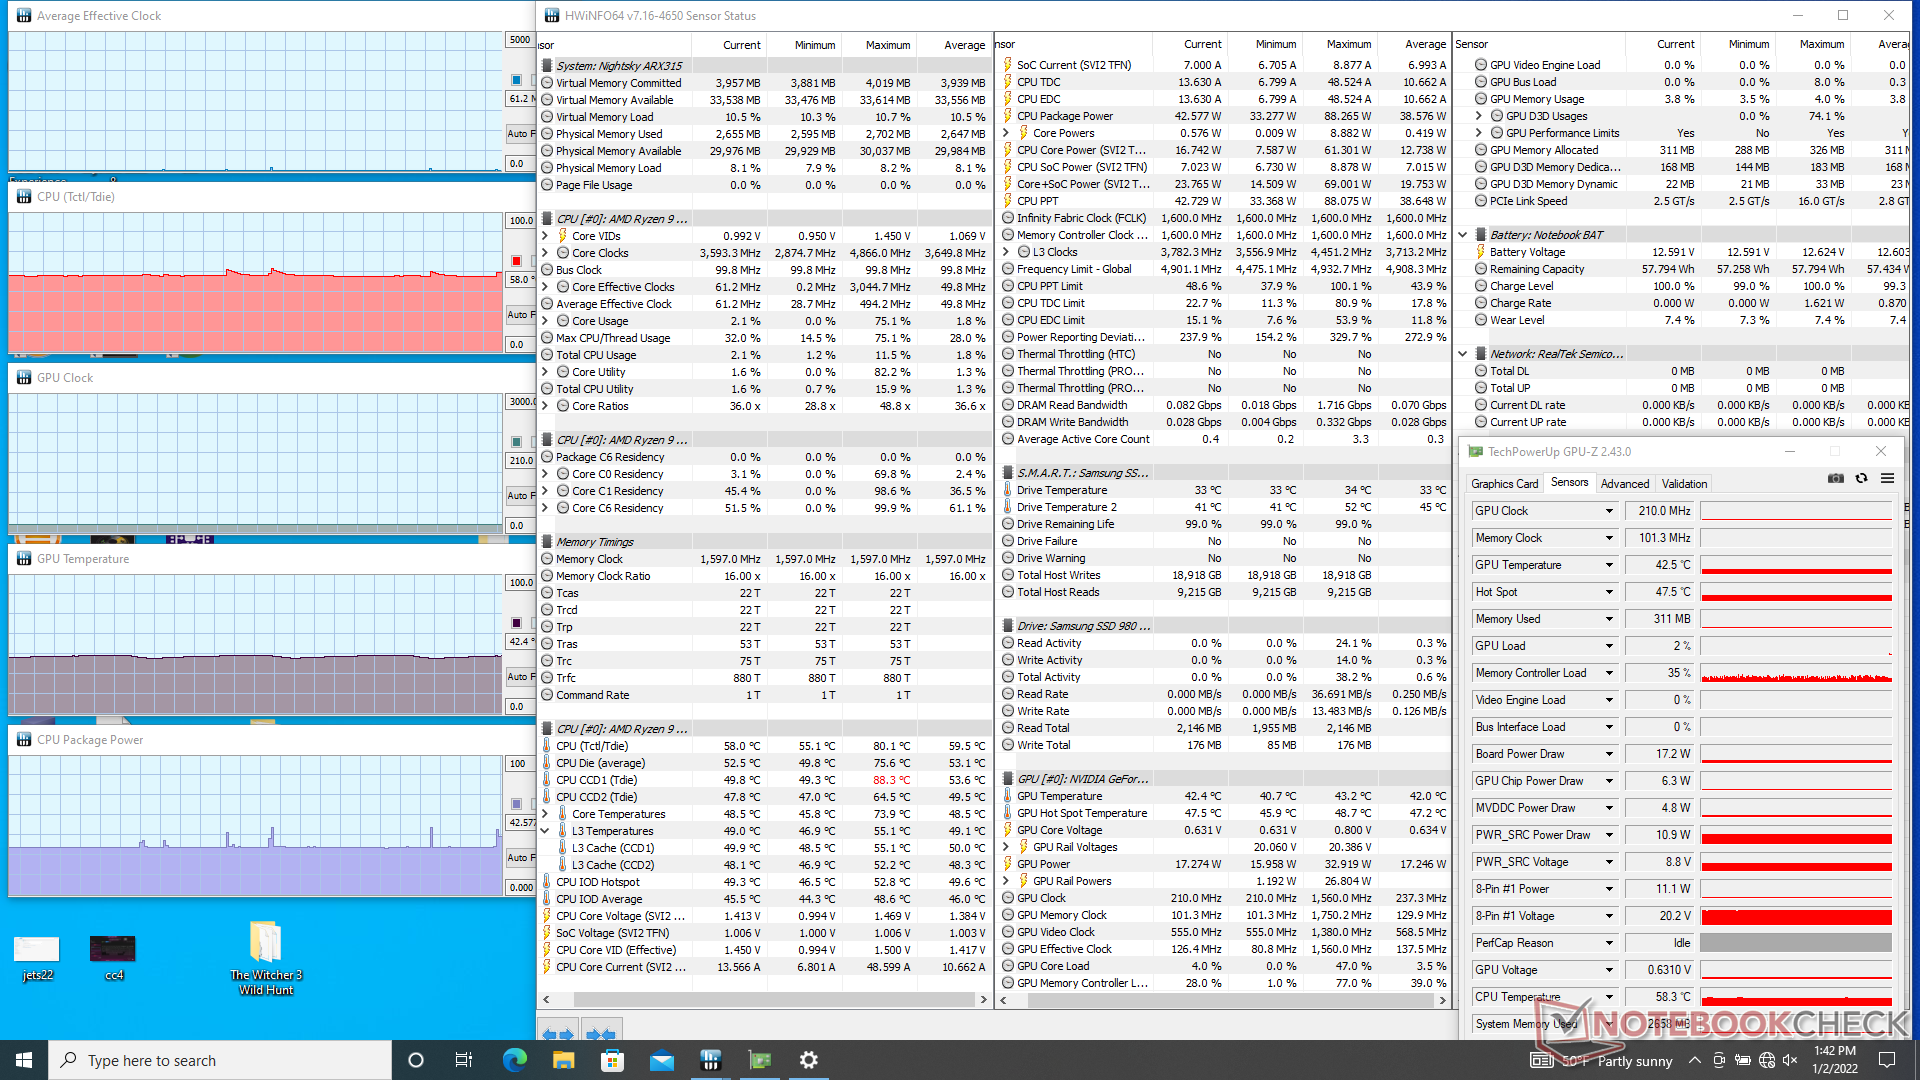
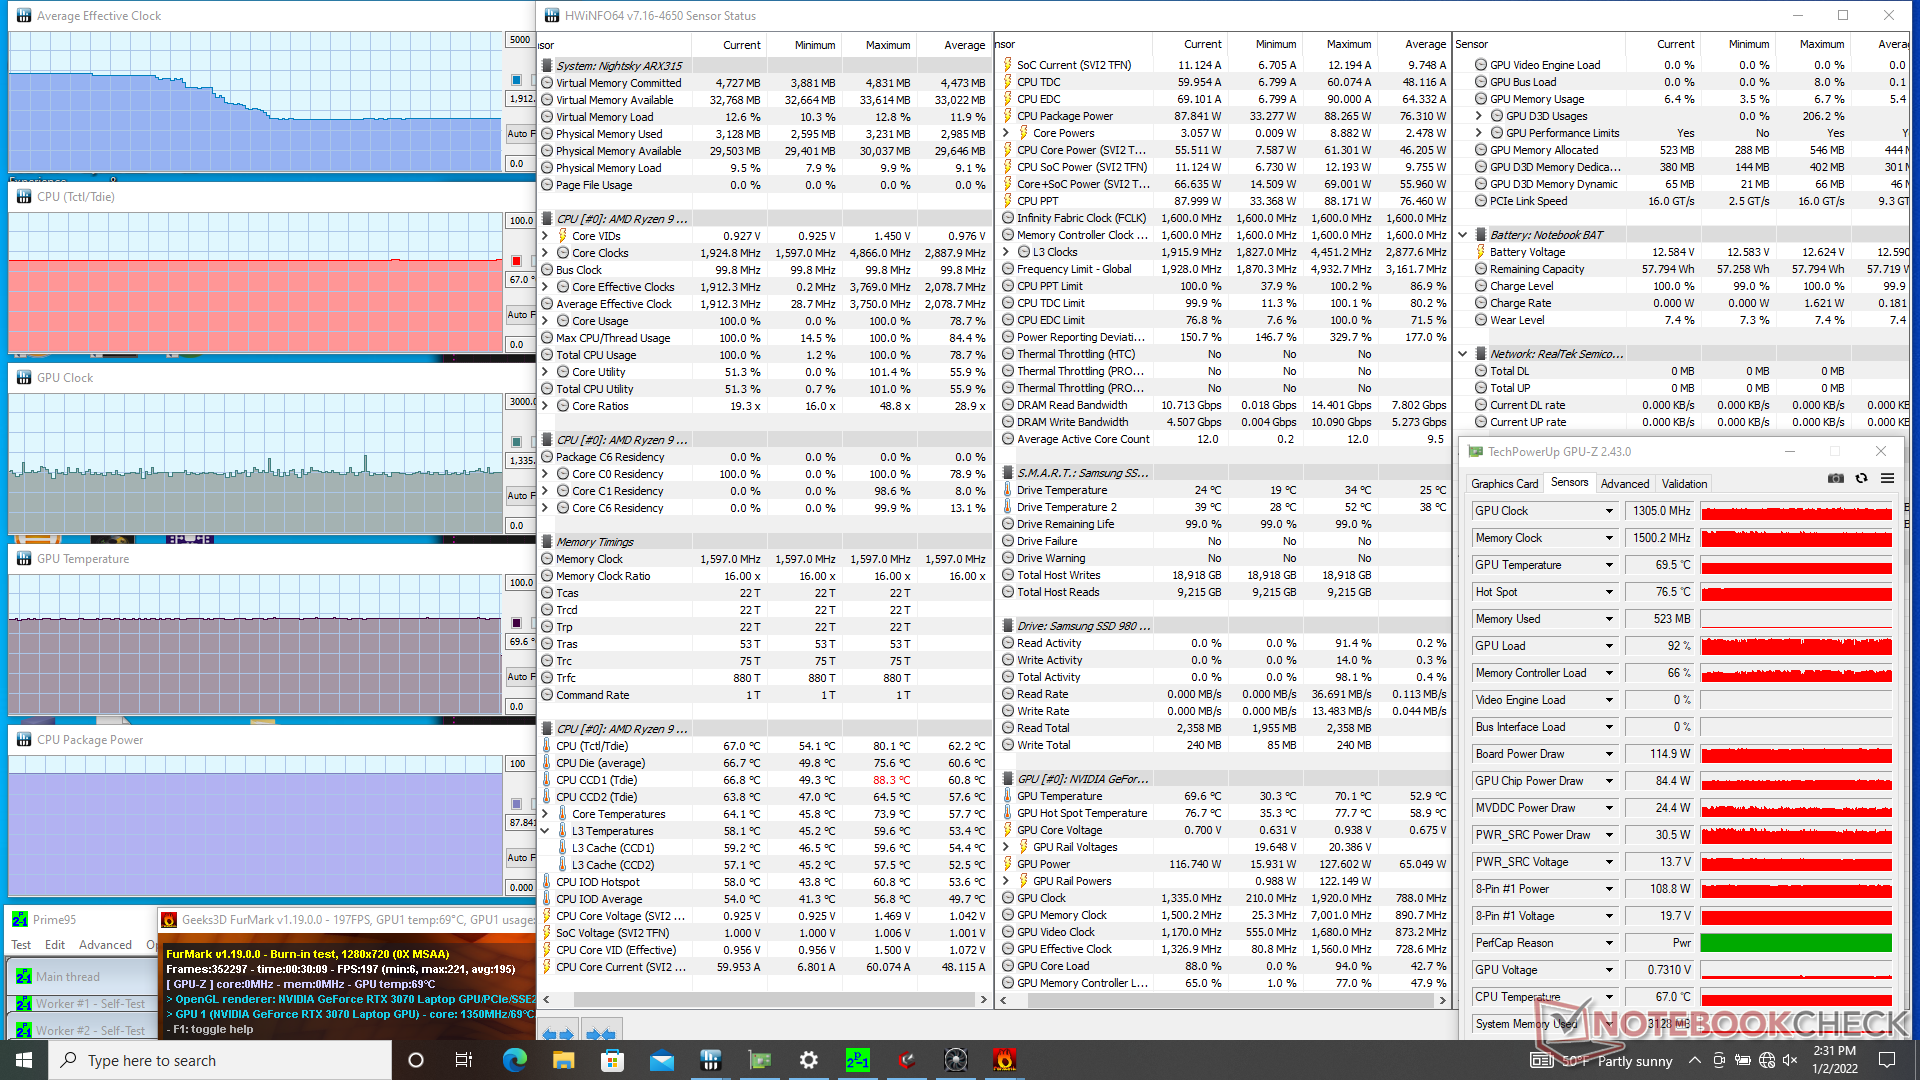
Stress Test
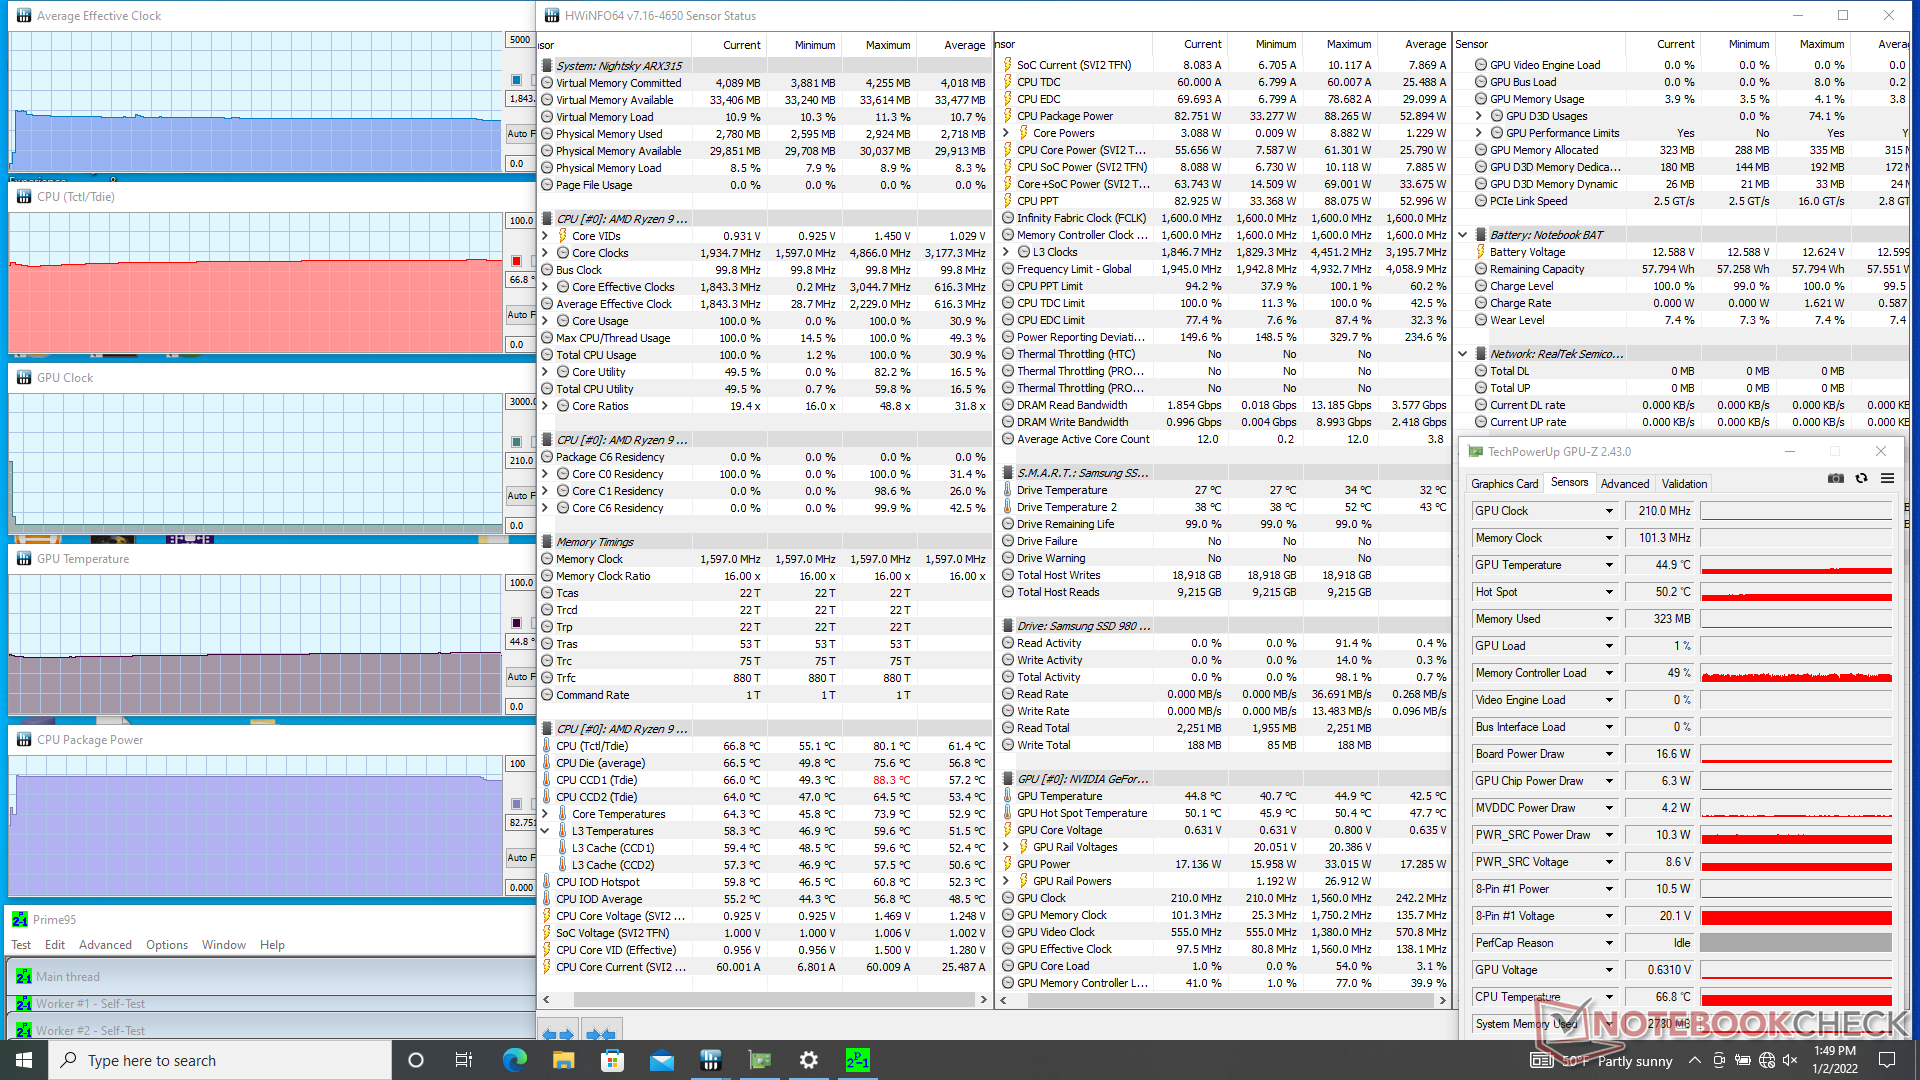
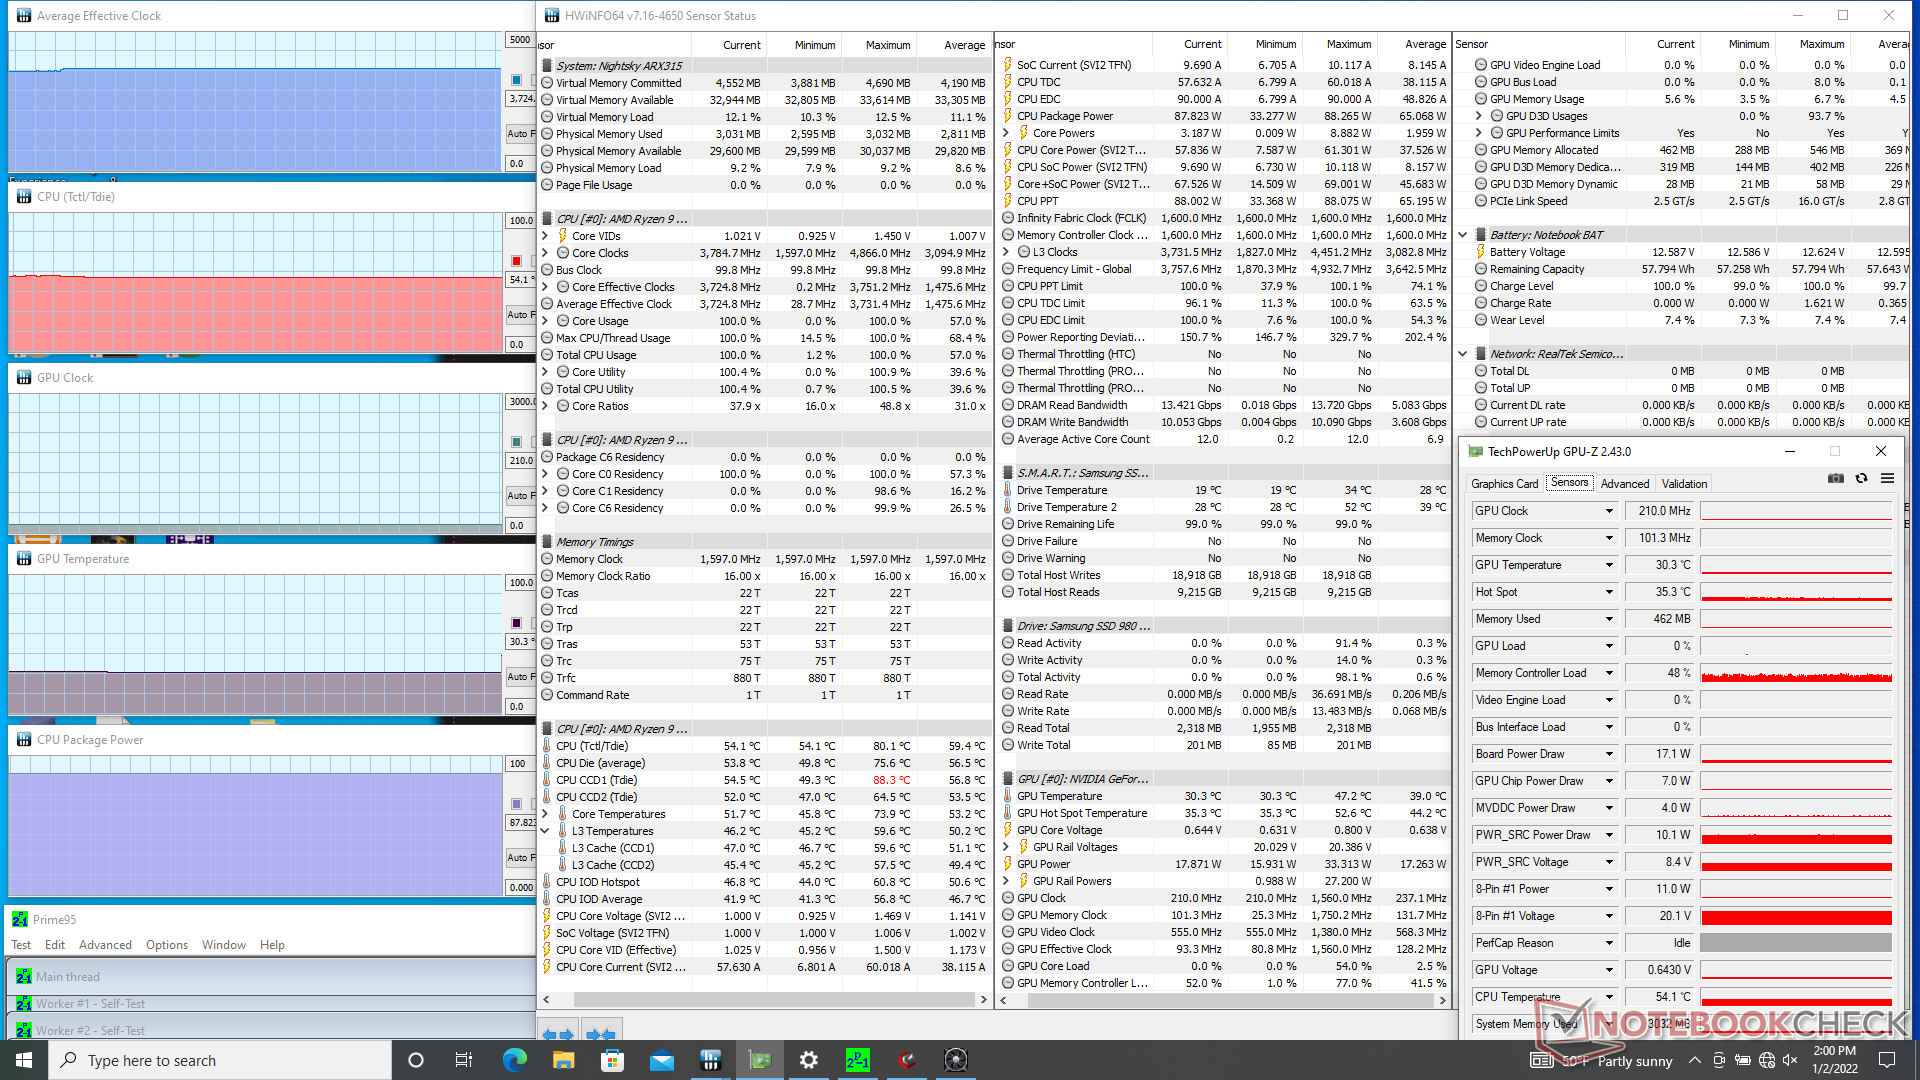
When running Prime95 with Maximum Fan mode off, the CPU would stabilize at around 1.9 GHz and at a core temperature of 67 C. Enabling Maximum Fan mode would cause clock rates to stabilize at 3.8 GHz and with a lower core temperature of 54 C. In comparison, our Ryzen 9 5900X desktop reference would instead stabilize at a much higher 4.5 GHz clock rate when subjected to the same Prime95 conditions which would explain the slower-than-expected CPU benchmark results of our Eurocom mentioned above. Fortunately, there is enough of a temperature headroom for end-user overclocking if desired albeit at the cost of very loud fan noise. CPU package power would stabilize in the 82 W to 88 W range when on stock settings.
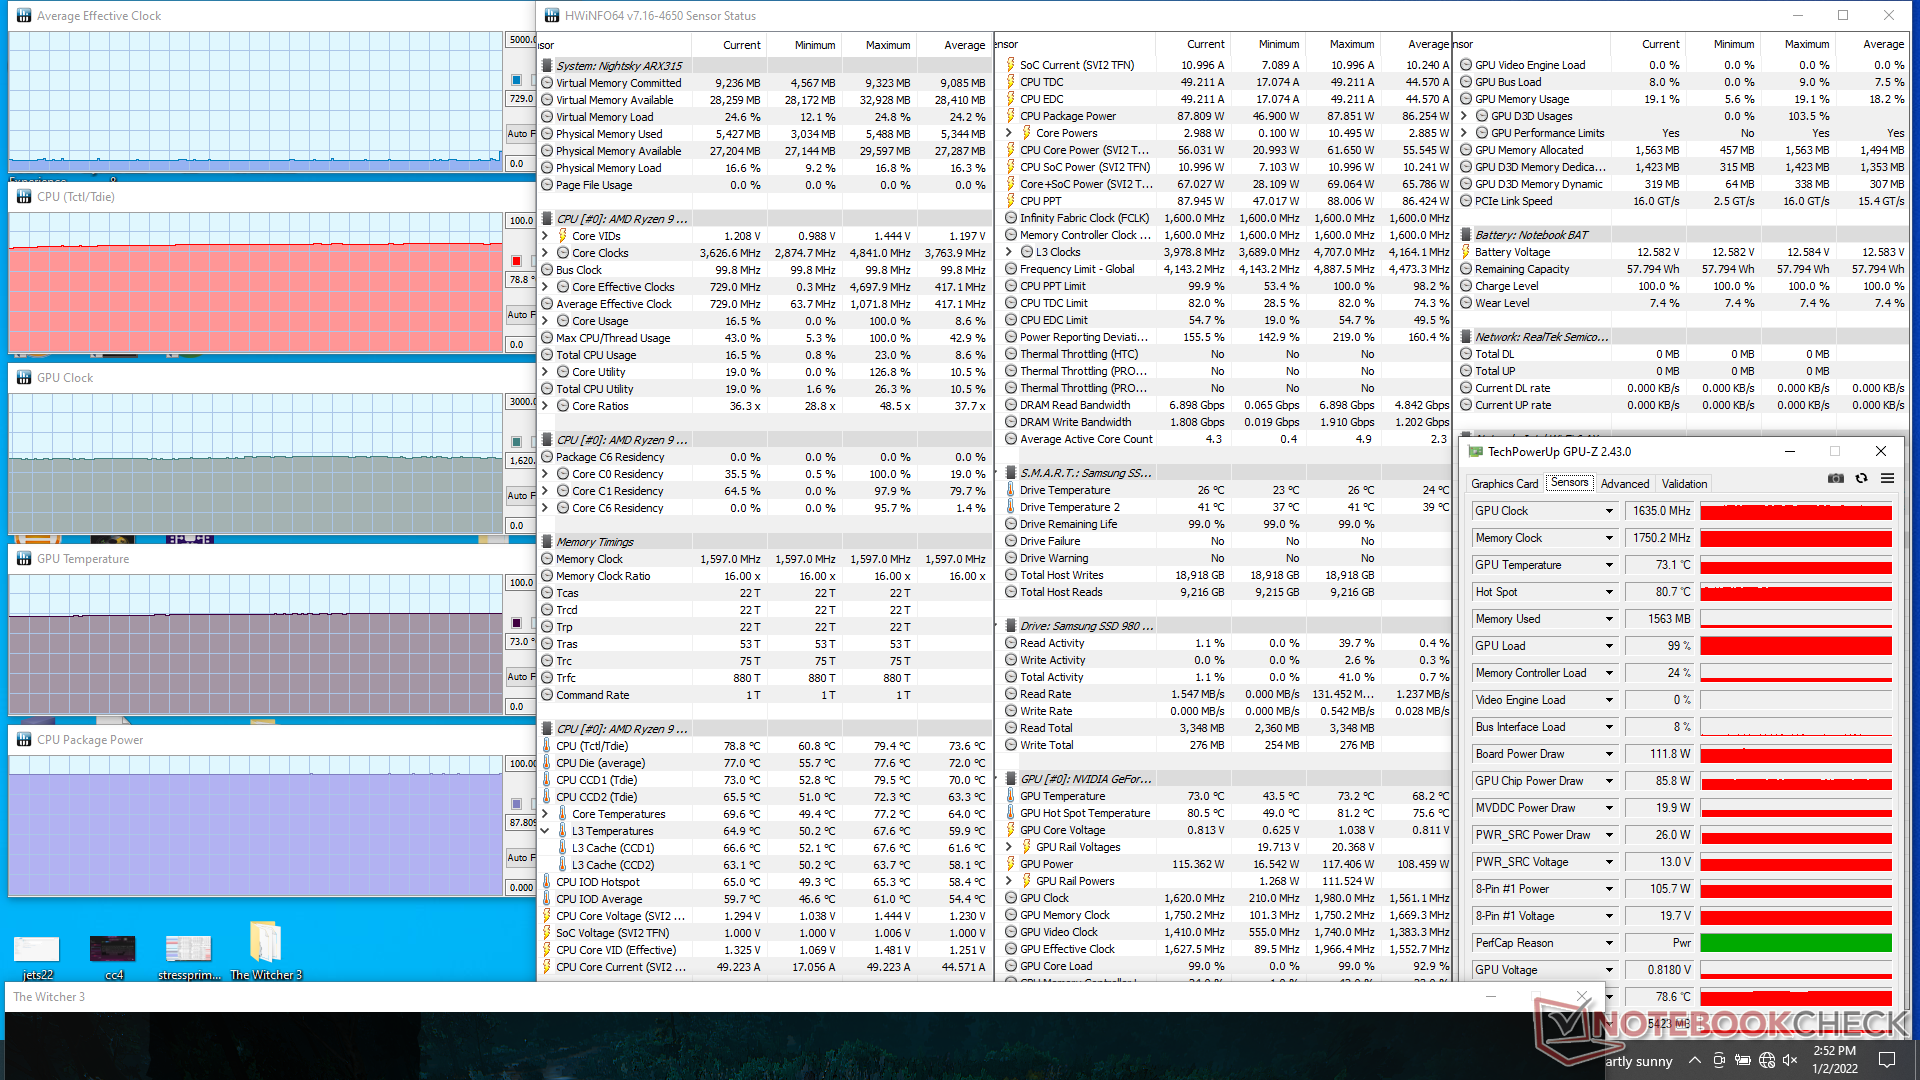
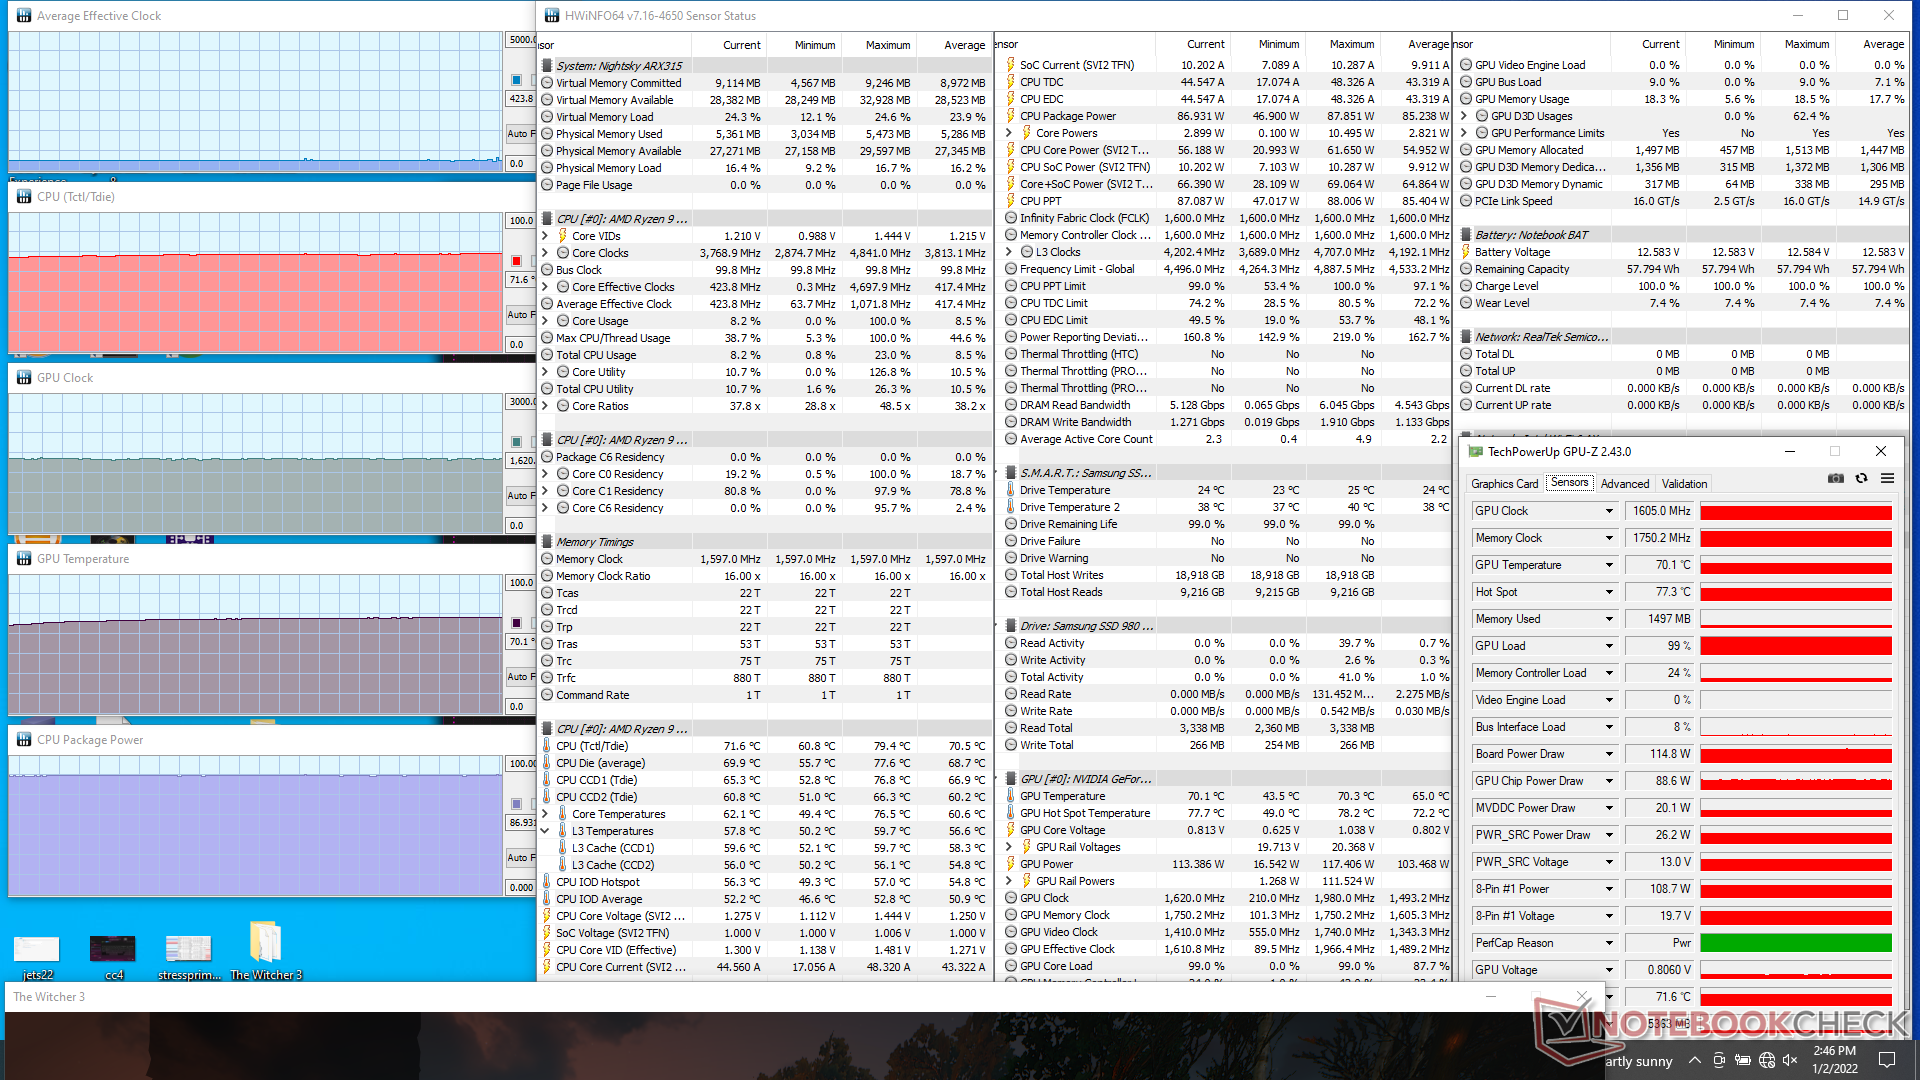
Running Witcher 3 on Maximum Fan mode would result in a stable GPU clock rate and temperature of 1605 MHz and 70 C, respectively, compared to 1365 MHz and 74 C on the Asus TUF Dash F15 equipped with the same GeForce RTX 3070 GPU.
Running on battery power will limit performance. A 3DMark 11 test on batteries would return Physics and Graphics scores of 3398 and 7357 points, respectively, compared to 19082 and 36118 points when on mains.
| CPU Clock (GHz) | GPU Clock (MHz) | Average CPU Temperature (°C) | Average GPU Temperature (°C) | |
| System Idle (Maximum Fan mode off) | -- | -- | 58 | 42 |
| Prime95 Stress (Maximum Fan mode off) | 1.8 | -- | 67 | 45 |
| Prime95 Stress (Maximum Fan mode on) | 3.8 | -- | 54 | 30 |
| Prime95 + FurMark Stress (Maximum Fan mode on) | 1.9 - 3.6 | 1305 | 67 | 70 |
| Witcher 3 Stress (Maximum Fan mode off) | 0.8 | 1635 | 79 | 73 |
| Witcher 3 Stress (Maximum Fan mode on) | 0.4 | 1605 | 72 | 70 |
Speakers
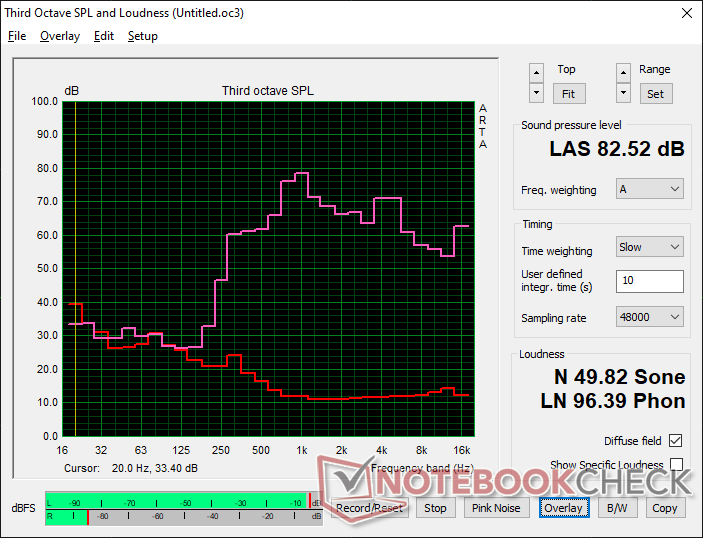
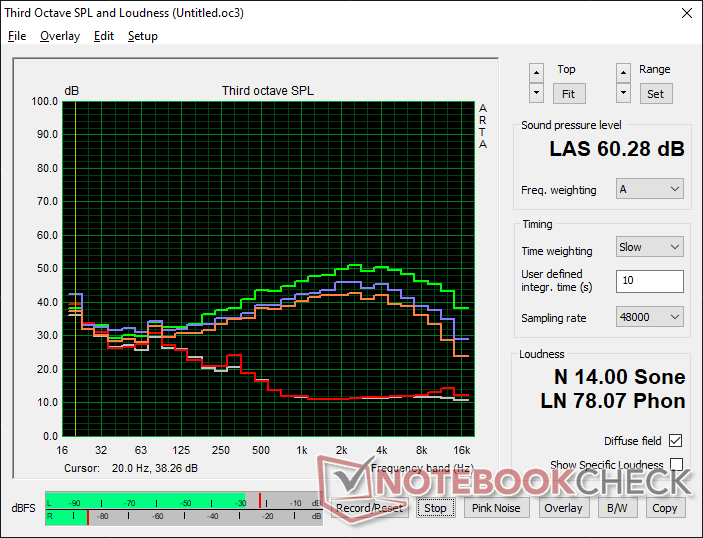
Eurocom Nightsky ARX315 audio analysis
(+) | speakers can play relatively loud (82.5 dB)
Bass 100 - 315 Hz
(-) | nearly no bass - on average 25.1% lower than median
(±) | linearity of bass is average (12.8% delta to prev. frequency)
Mids 400 - 2000 Hz
(±) | higher mids - on average 7.1% higher than median
(±) | linearity of mids is average (7.7% delta to prev. frequency)
Highs 2 - 16 kHz
(±) | higher highs - on average 5.2% higher than median
(±) | linearity of highs is average (7.7% delta to prev. frequency)
Overall 100 - 16.000 Hz
(±) | linearity of overall sound is average (23.2% difference to median)
Compared to same class
» 84% of all tested devices in this class were better, 4% similar, 11% worse
» The best had a delta of 6%, average was 18%, worst was 132%
Compared to all devices tested
» 69% of all tested devices were better, 5% similar, 25% worse
» The best had a delta of 4%, average was 24%, worst was 134%
Apple MacBook 12 (Early 2016) 1.1 GHz audio analysis
(+) | speakers can play relatively loud (83.6 dB)
Bass 100 - 315 Hz
(±) | reduced bass - on average 11.3% lower than median
(±) | linearity of bass is average (14.2% delta to prev. frequency)
Mids 400 - 2000 Hz
(+) | balanced mids - only 2.4% away from median
(+) | mids are linear (5.5% delta to prev. frequency)
Highs 2 - 16 kHz
(+) | balanced highs - only 2% away from median
(+) | highs are linear (4.5% delta to prev. frequency)
Overall 100 - 16.000 Hz
(+) | overall sound is linear (10.2% difference to median)
Compared to same class
» 7% of all tested devices in this class were better, 2% similar, 91% worse
» The best had a delta of 5%, average was 18%, worst was 53%
Compared to all devices tested
» 5% of all tested devices were better, 1% similar, 94% worse
» The best had a delta of 4%, average was 24%, worst was 134%
Energy Management
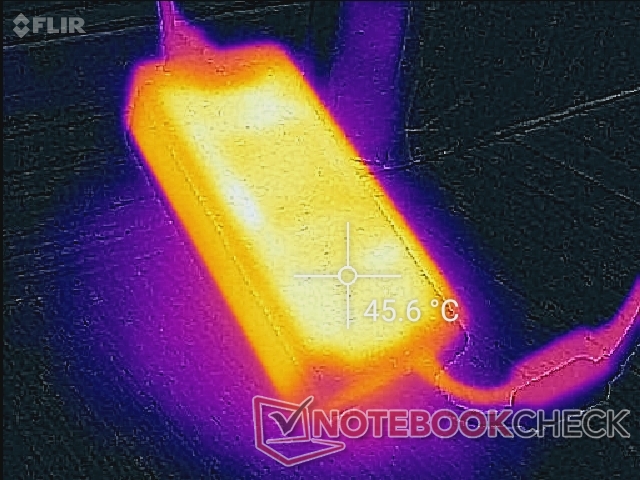
Power Consumption
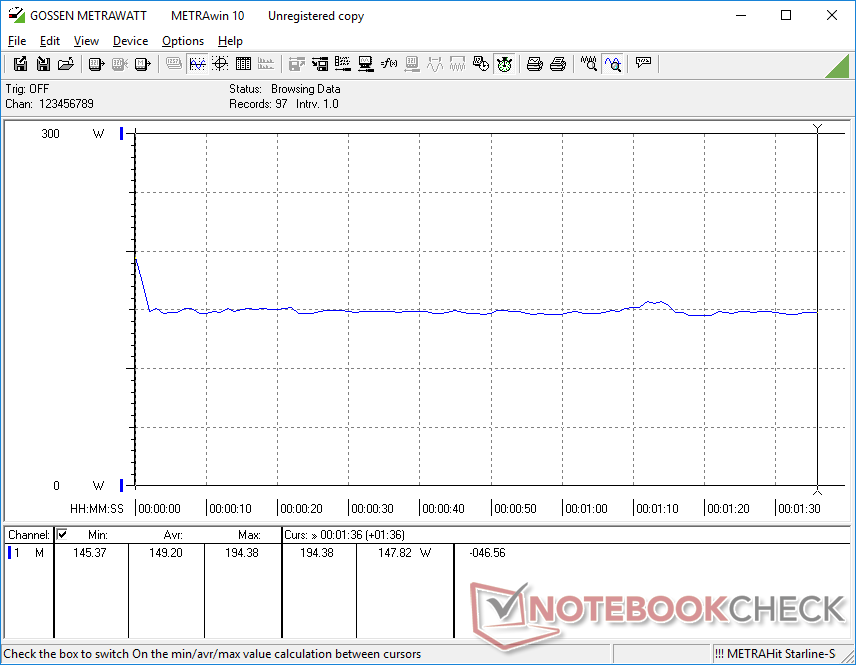
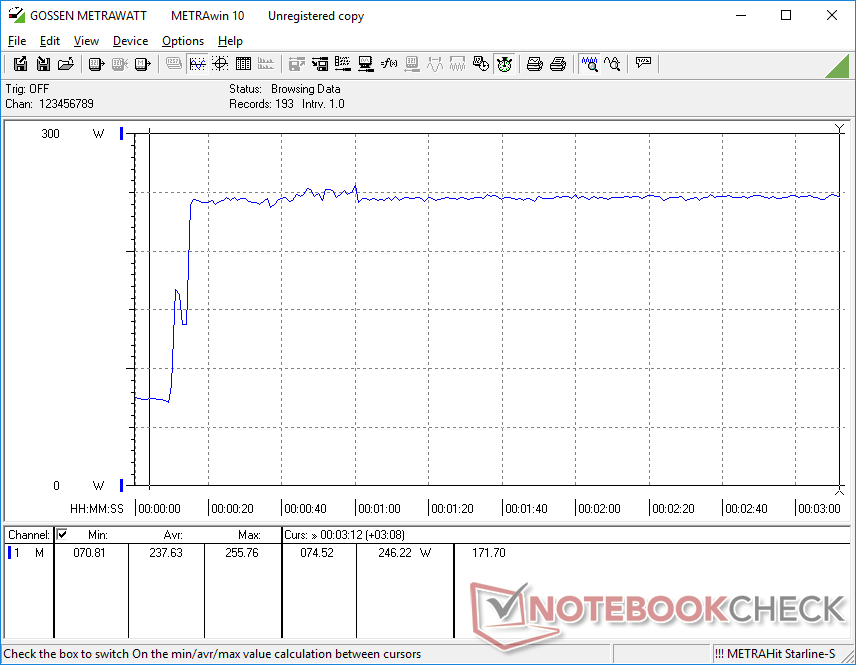
Power consumption is very high no matter the activity which may explain the poor battery life in the next section. Simply idling on desktop would consume between 55 W and 73 W compared to 12 W and 35 W on the older Intel-powered Nightsky RX15. The wide delta doesn't shrink when running higher loads like games. The Gigabyte A5 X1, which uses the same RTX 3070 GPU but the mobile Ryzen 9 5900HX CPU instead, would demand around 25 to 30 W less than our Eurocom when under heavier loads.
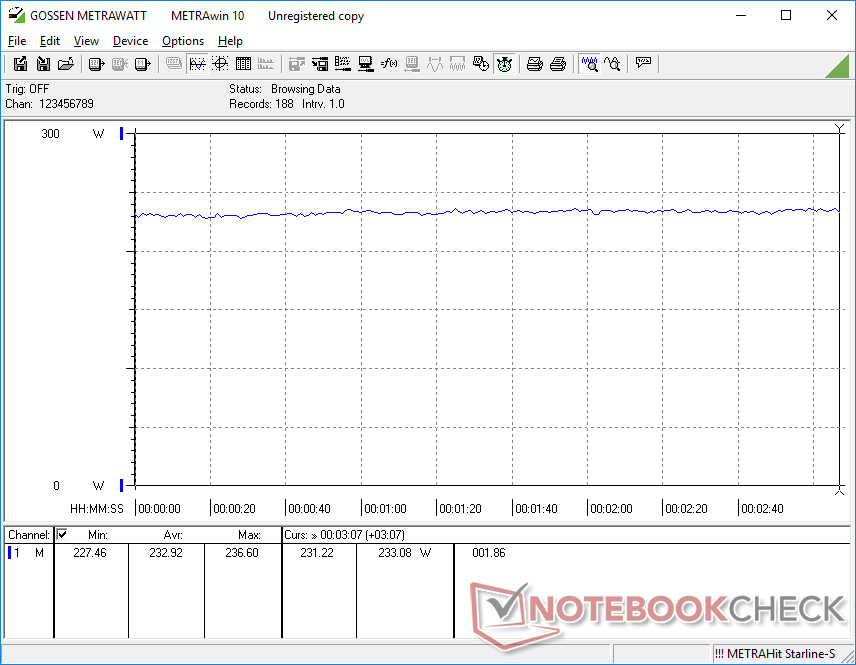
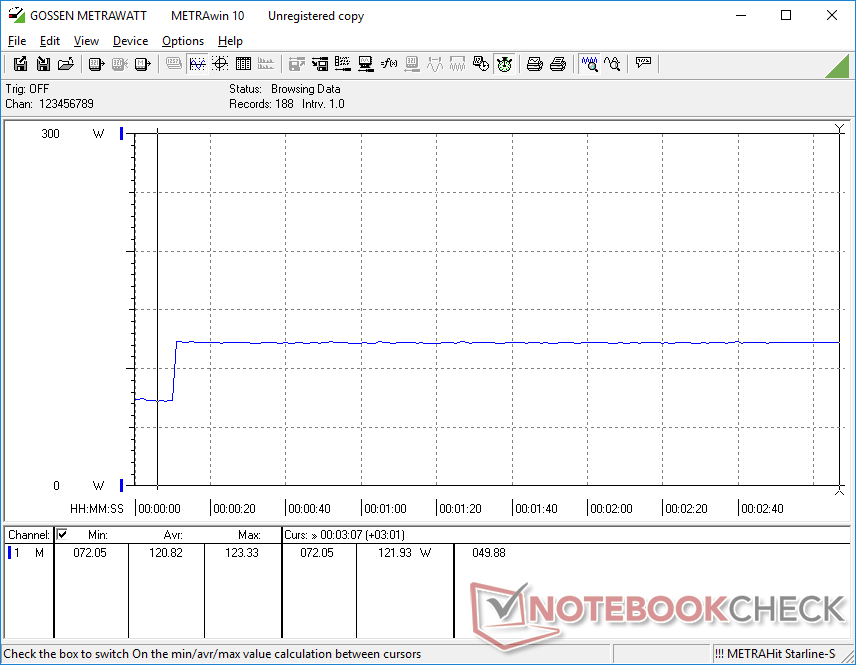
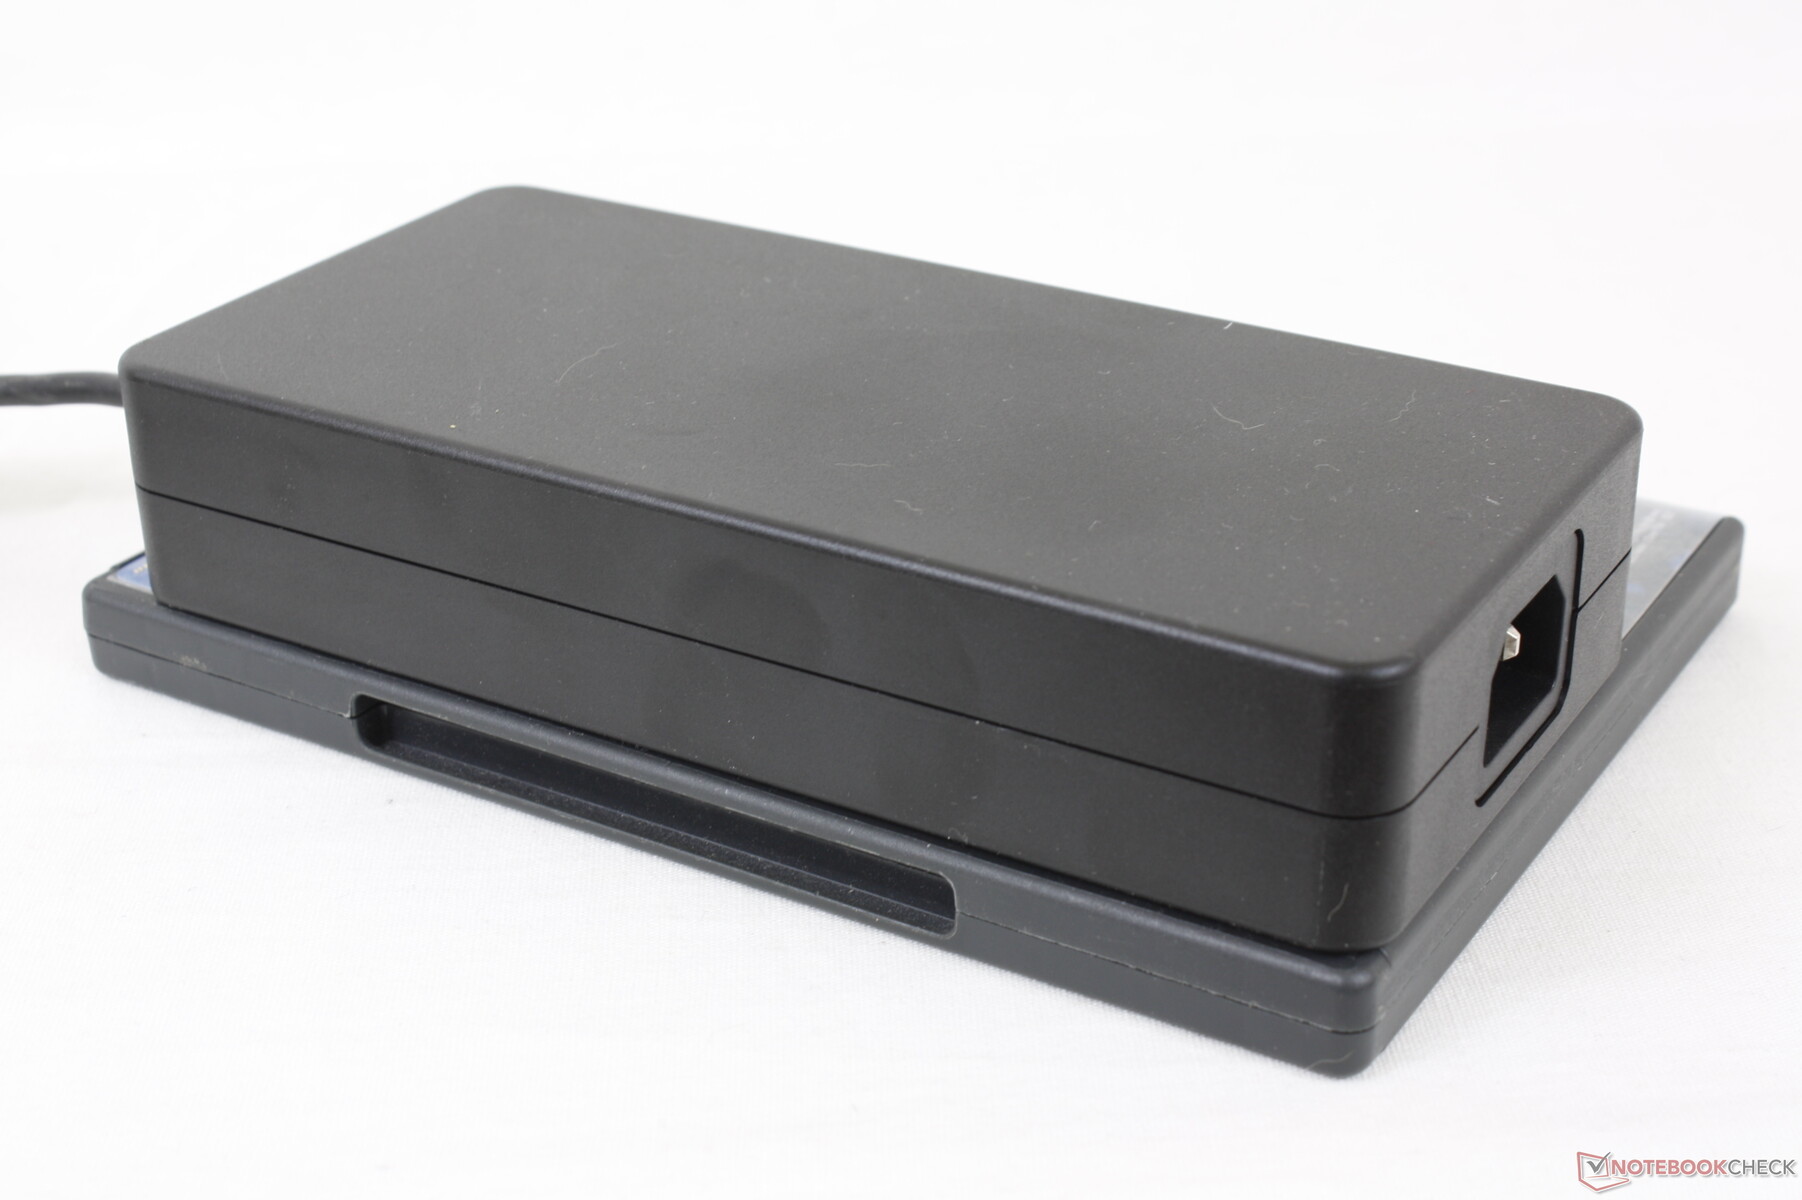
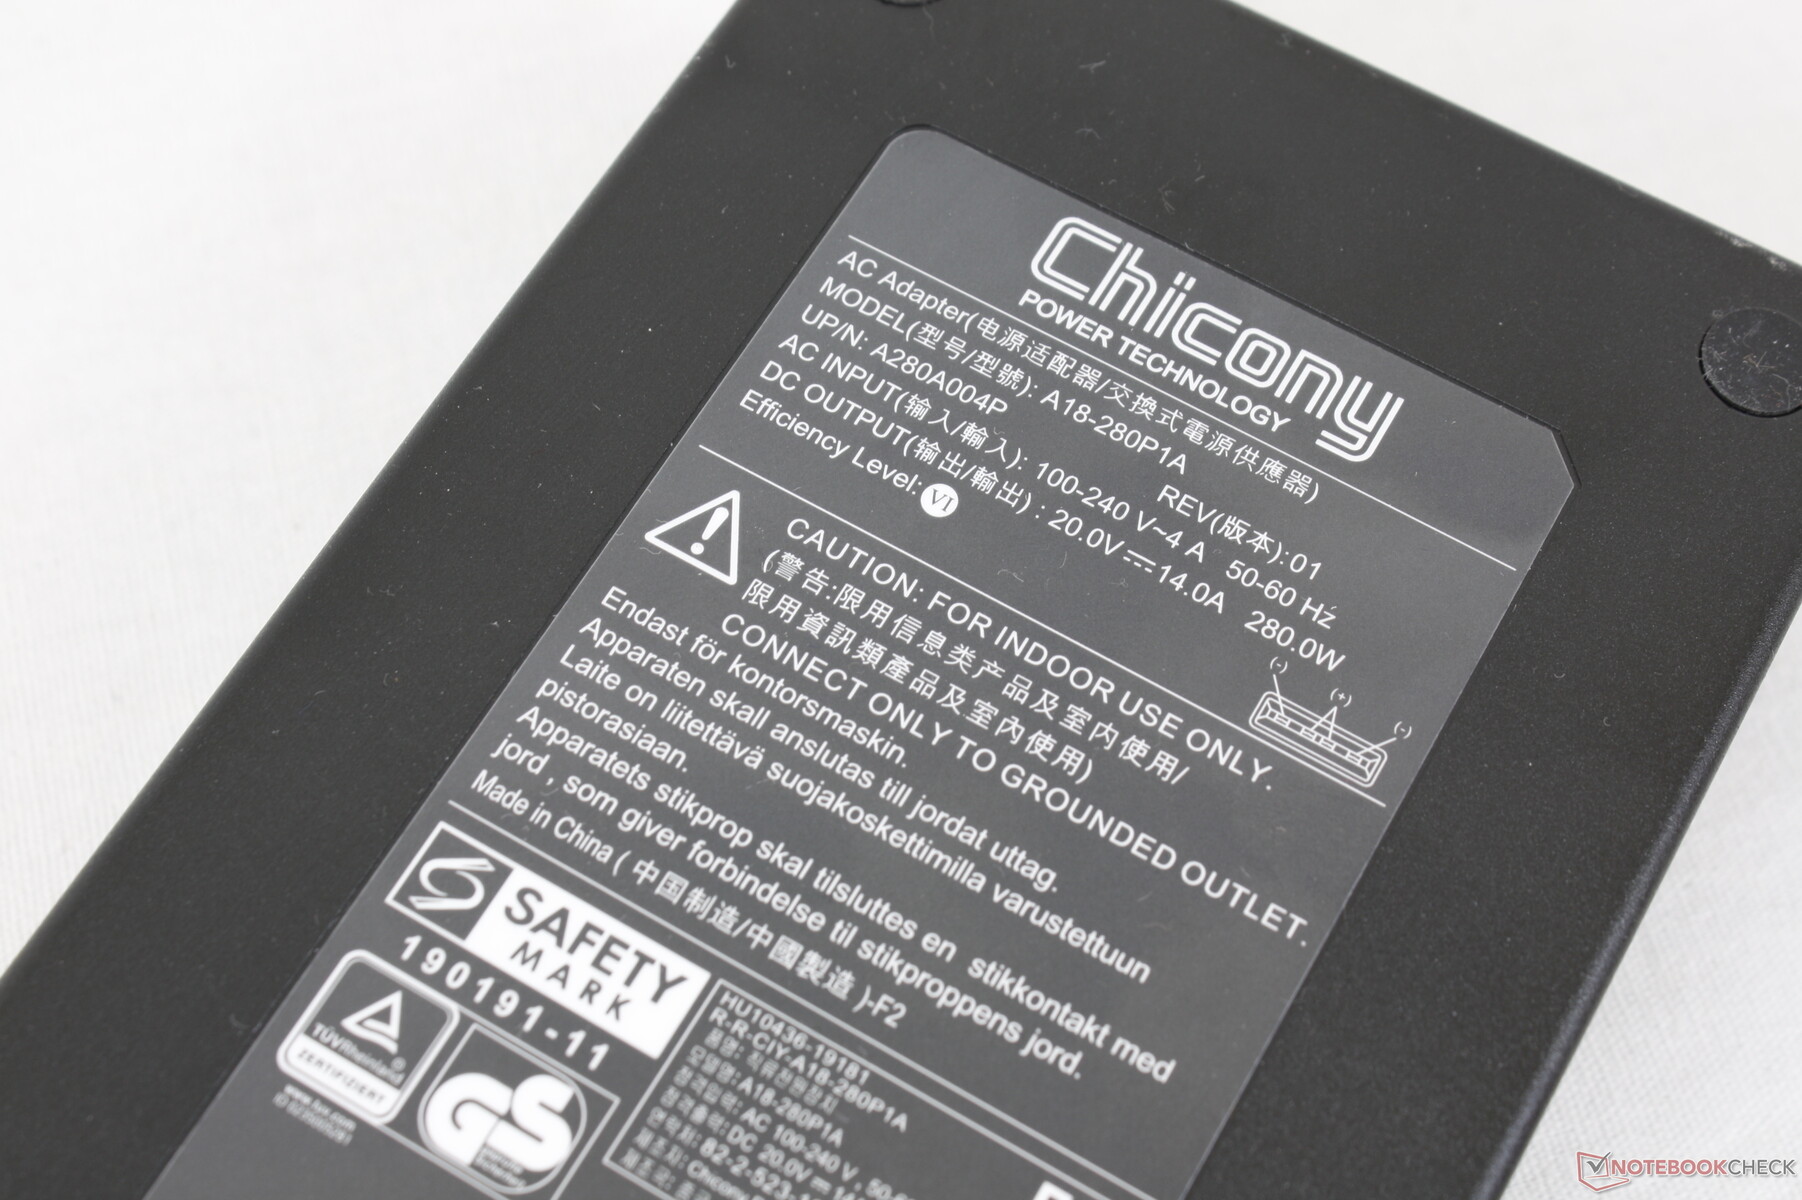
We're able to record a maximum draw of 256 W from the large (~18 x 8.5 x 3.5 cm) 280 W AC adapter when running Prime95 and FurMark simultaneously.
| Off / Standby | |
| Idle | |
| Load |
|
Key:
min: | |
| Eurocom Nightsky ARX315 R9 5900X, GeForce RTX 3070 Laptop GPU, Samsung SSD 980 Pro 1TB MZ-V8P1T0BW, IPS, 1920x1080, 15.6" | Gigabyte A5 X1 R9 5900HX, GeForce RTX 3070 Laptop GPU, ADATA XPG SX8200 Pro (ASX8200PNP-512GT), IPS, 1920x1080, 15.6" | Medion Erazer Deputy P25 R7 5800H, GeForce RTX 3060 Laptop GPU, Phison E12S-512GB-Phison-SSD-BICS4, IPS, 1920x1080, 15.6" | MSI Delta 15 A5EFK R9 5900HX, Radeon RX 6700M, Micron 2210 MTFDHBA1T0QFD, IPS-Level, 1920x1080, 15.6" | Schenker XMG Apex 15 NH57E PS R7 5800H, GeForce RTX 3060 Laptop GPU, Samsung SSD 980 500GB (MZ-V8V500BW), IPS, 1920x1080, 15.6" | MSI GE66 Raider 10SFS i9-10980HK, GeForce RTX 2070 Super Mobile, WDC PC SN730 SDBPNTY-1T00, IPS-Level, 1920x1080, 15.6" | |
|---|---|---|---|---|---|---|
| Power Consumption | 44% | 52% | 48% | 52% | 45% | |
| Idle Minimum * (Watt) | 55 | 10 82% | 8 85% | 10 82% | 10.5 81% | 6 89% |
| Idle Average * (Watt) | 68.2 | 12 82% | 11 84% | 18 74% | 15 78% | 14 79% |
| Idle Maximum * (Watt) | 72.5 | 16 78% | 16 78% | 25 66% | 17 77% | 25 66% |
| Load Average * (Watt) | 149.2 | 124 17% | 109 27% | 101 32% | 109 27% | 108 28% |
| Witcher 3 ultra * (Watt) | 233 | 204 12% | 183 21% | 187 20% | 186 20% | 195 16% |
| Load Maximum * (Watt) | 255.8 | 272 -6% | 211 18% | 217 15% | 186 27% | 280 -9% |
* ... smaller is better
Power Consumption Witcher 3 / Stresstest
Power Consumption external Monitor
Battery Life
Runtimes on the balanced profile (or Quiet) setting are so poor that it takes much longer to charge the battery from empty to full than it takes to discharge the battery when simply web browsing (120 minutes vs 61 minutes). The battery is easy removable unlike on most other laptops, but capacity is rather small at 62 Wh when compared to other large 15.6-inch laptops like the MSI GE66.
| Eurocom Nightsky ARX315 R9 5900X, GeForce RTX 3070 Laptop GPU, 62 Wh | Gigabyte A5 X1 R9 5900HX, GeForce RTX 3070 Laptop GPU, 48.96 Wh | Medion Erazer Deputy P25 R7 5800H, GeForce RTX 3060 Laptop GPU, 49 Wh | MSI Delta 15 A5EFK R9 5900HX, Radeon RX 6700M, 82 Wh | Schenker XMG Apex 15 NH57E PS R7 5800H, GeForce RTX 3060 Laptop GPU, 49 Wh | MSI GE66 Raider 10SFS i9-10980HK, GeForce RTX 2070 Super Mobile, 99.99 Wh | |
|---|---|---|---|---|---|---|
| Battery runtime | 540% | 570% | 690% | 550% | 510% | |
| WiFi v1.3 (h) | 1 | 6.4 540% | 6.7 570% | 7.9 690% | 6.5 550% | 6.1 510% |
| Reader / Idle (h) | 10.1 | 10.5 | 11.1 | 7.6 | ||
| H.264 (h) | 7.3 | 4.6 | ||||
| Load (h) | 1.3 | 1.1 | 1.6 | 1.4 | 1.8 |
Pros
Cons
Verdict
There are a couple of issues that need to be addressed: the very slow wake times and the horrendously laggy performance when set to Power Saving mode or Quiet mode. These two features are significantly slower here on the Nightsky ARX15 when compared to a standard Ultrabook that's a fraction of the cost.
It's not recommended to run this system on stock settings for those who wish to exploit the Ryzen 9 5900X to its maximum potential. CPU performance will underperform when compared to a proper desktop with the same Ryzen 9 5900X meaning users must overclock our mobile Ryzen 9 5900X to bring it up to par. Our tests show that there is indeed some headroom available, but the resulting fan noise will be very loud and potentially bothersome. Nonetheless, Eurocom continues to be one of the very few companies to offer laptops with desktop CPUs as many larger makers like MSI and Alienware have been focusing less on such "super performance" laptops.
Price and Availability
Users can configure the Nightsky ARX15 directly from the manufacturer here.
Eurocom Nightsky ARX315
- 01/06/2022 v7 (old)
Allen Ngo
Price comparison
