Eurocom Sky X4C Core i9-9900KS Laptop Review: Unlocked Desktop Processor in a Mobile Form Factor
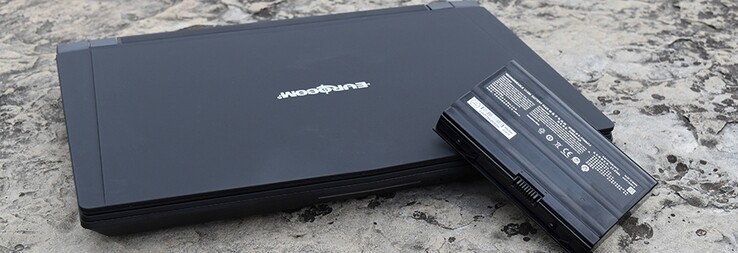
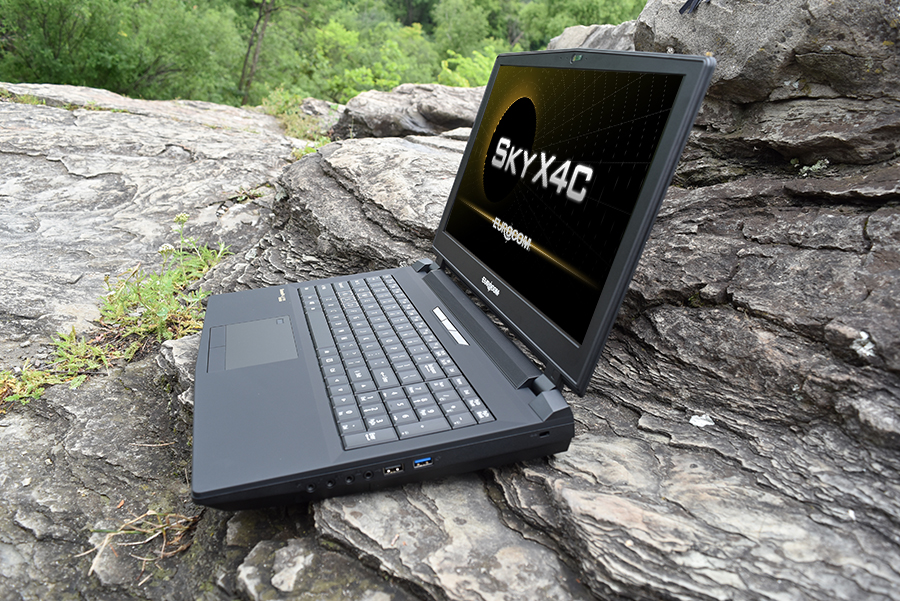
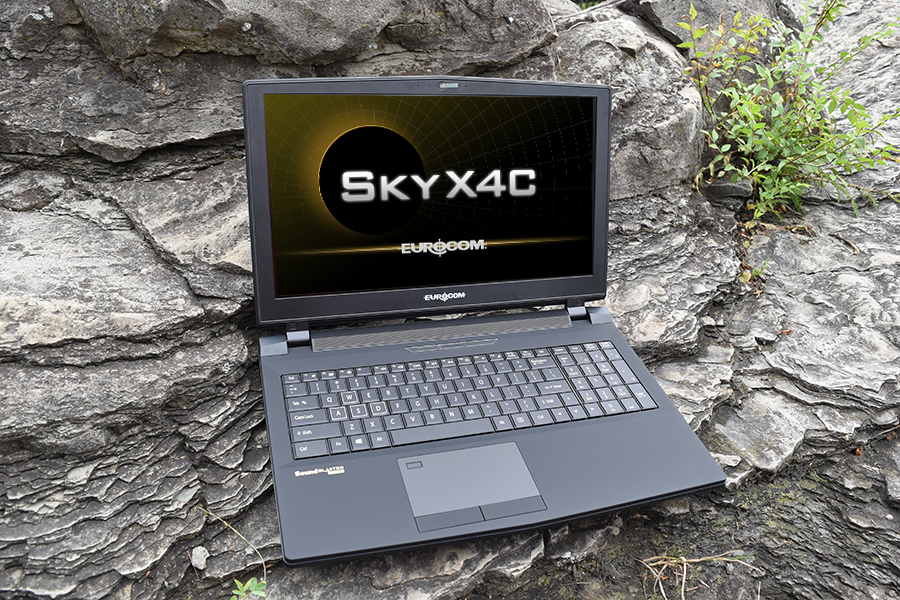
The Eurocom Sky X4C is a high-performance laptop with easy serviceability aimed at enthusiasts. Unlike most other laptops, it carries upgradeable LGA 1151 desktop CPUs and MXM GPUs for added versatility.
We had checked out the Sky X4C almost two years ago with the Coffee Lake Core i7-8700K CPU and Pascal GeForce GTX 1080 GPU. Our unit today comes equipped with the faster and newer Coffee Lake Core i9-9900KS and Turing GeForce RTX 2080. We recommend checking out our existing review on the Sky X4C as all our comments on the chassis and its features still apply.
More Eurocom reviews:
Rating | Date | Model | Weight | Height | Size | Resolution | Price |
|---|---|---|---|---|---|---|---|
| 84.6 % v7 (old) | 11 / 2019 | Eurocom Sky X4C i9-9900KS i9-9900KS, GeForce RTX 2080 Mobile | 3.6 kg | 38 mm | 15.60" | 1920x1080 | |
| 87.3 % v6 (old) | 07 / 2018 | MSI GT63 Titan 8RG-046 i7-8750H, GeForce GTX 1080 Mobile | 2.9 kg | 40 mm | 15.60" | 1920x1080 | |
| 86.1 % v7 (old) | 05 / 2019 | MSI GE75 9SG i9-9880H, GeForce RTX 2080 Mobile | 2.7 kg | 27.5 mm | 17.30" | 1920x1080 | |
| 88.3 % v6 (old) | 03 / 2019 | Eurocom Sky X7C i9-9900K i9-9900K, GeForce RTX 2080 Mobile | 4.3 kg | 41 mm | 17.30" | 1920x1080 | |
| 85.8 % v7 (old) | 03 / 2019 | Alienware Area-51m i9-9900K RTX 2080 i9-9900K, GeForce RTX 2080 Mobile | 3.9 kg | 42 mm | 17.30" | 1920x1080 |
Case
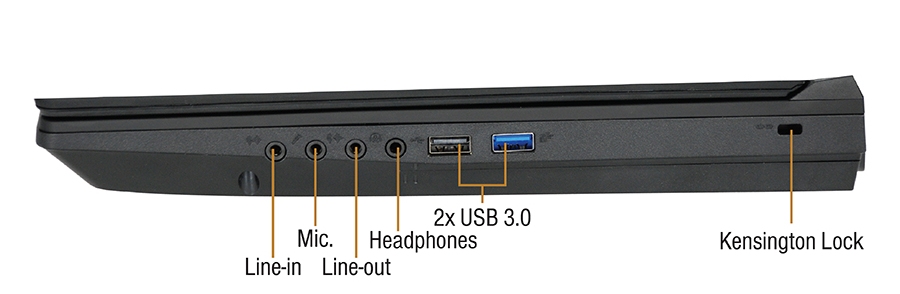
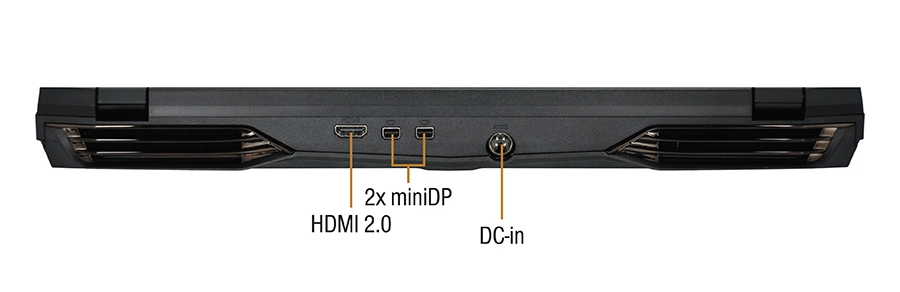
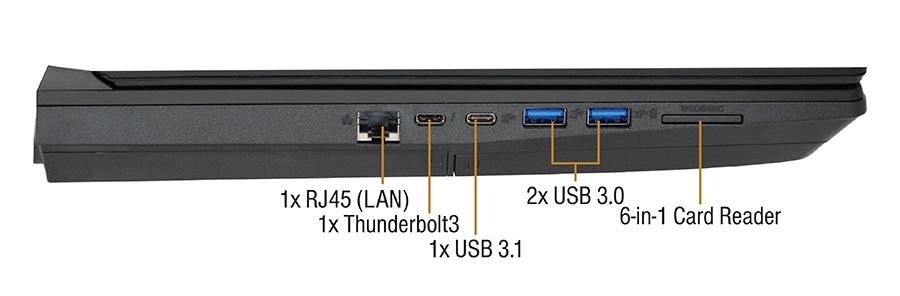
Connectivity
SD Card Reader
| SD Card Reader | |
| average JPG Copy Test (av. of 3 runs) | |
| Eurocom Sky X4C i9-9900KS (Toshiba Exceria Pro SDXC 64 GB UHS-II) | |
| Razer Blade Pro 17 4K UHD 120 Hz (Toshiba Exceria Pro SDXC 64 GB UHS-II) | |
| MSI GE63VR 7RF Raider (Toshiba Exceria Pro SDXC 64 GB UHS-II) | |
| MSI Prestige 15 A10SC (Toshiba Exceria Pro M501 UHS-II) | |
| MSI GT63 Titan 8RG-046 (Toshiba Exceria Pro SDXC 64 GB UHS-II) | |
| maximum AS SSD Seq Read Test (1GB) | |
| Eurocom Sky X4C i9-9900KS (Toshiba Exceria Pro SDXC 64 GB UHS-II) | |
| MSI GE63VR 7RF Raider (Toshiba Exceria Pro SDXC 64 GB UHS-II) | |
| Razer Blade Pro 17 4K UHD 120 Hz (Toshiba Exceria Pro SDXC 64 GB UHS-II) | |
| MSI Prestige 15 A10SC (Toshiba Exceria Pro M501 UHS-II) | |
| MSI GT63 Titan 8RG-046 (Toshiba Exceria Pro SDXC 64 GB UHS-II) | |
Communication
The Killer Wi-Fi 6 AX1650x module is essentially a rebranded Intel AX200/201 and so performance is similar between them. Instead, the AX1650x benefits from Killer-specific features and controls.
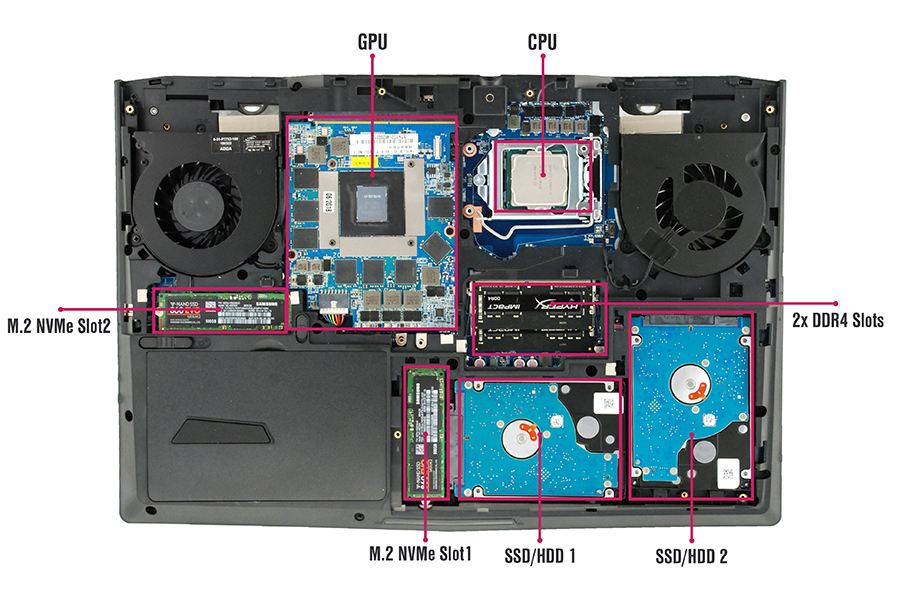
Maintenance
Accessories and Warranty
The usual manuals, HDD/SSD screws, and Drivers CD are included with optional adapters, docks, and inverters. A one-year limited warranty applies with extensions of up to three years.
Display
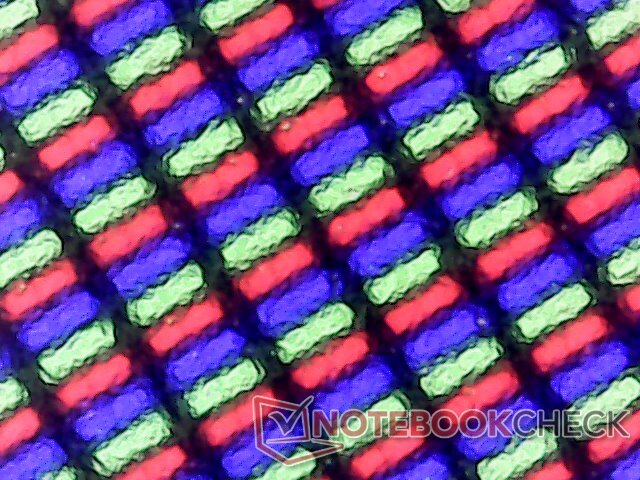
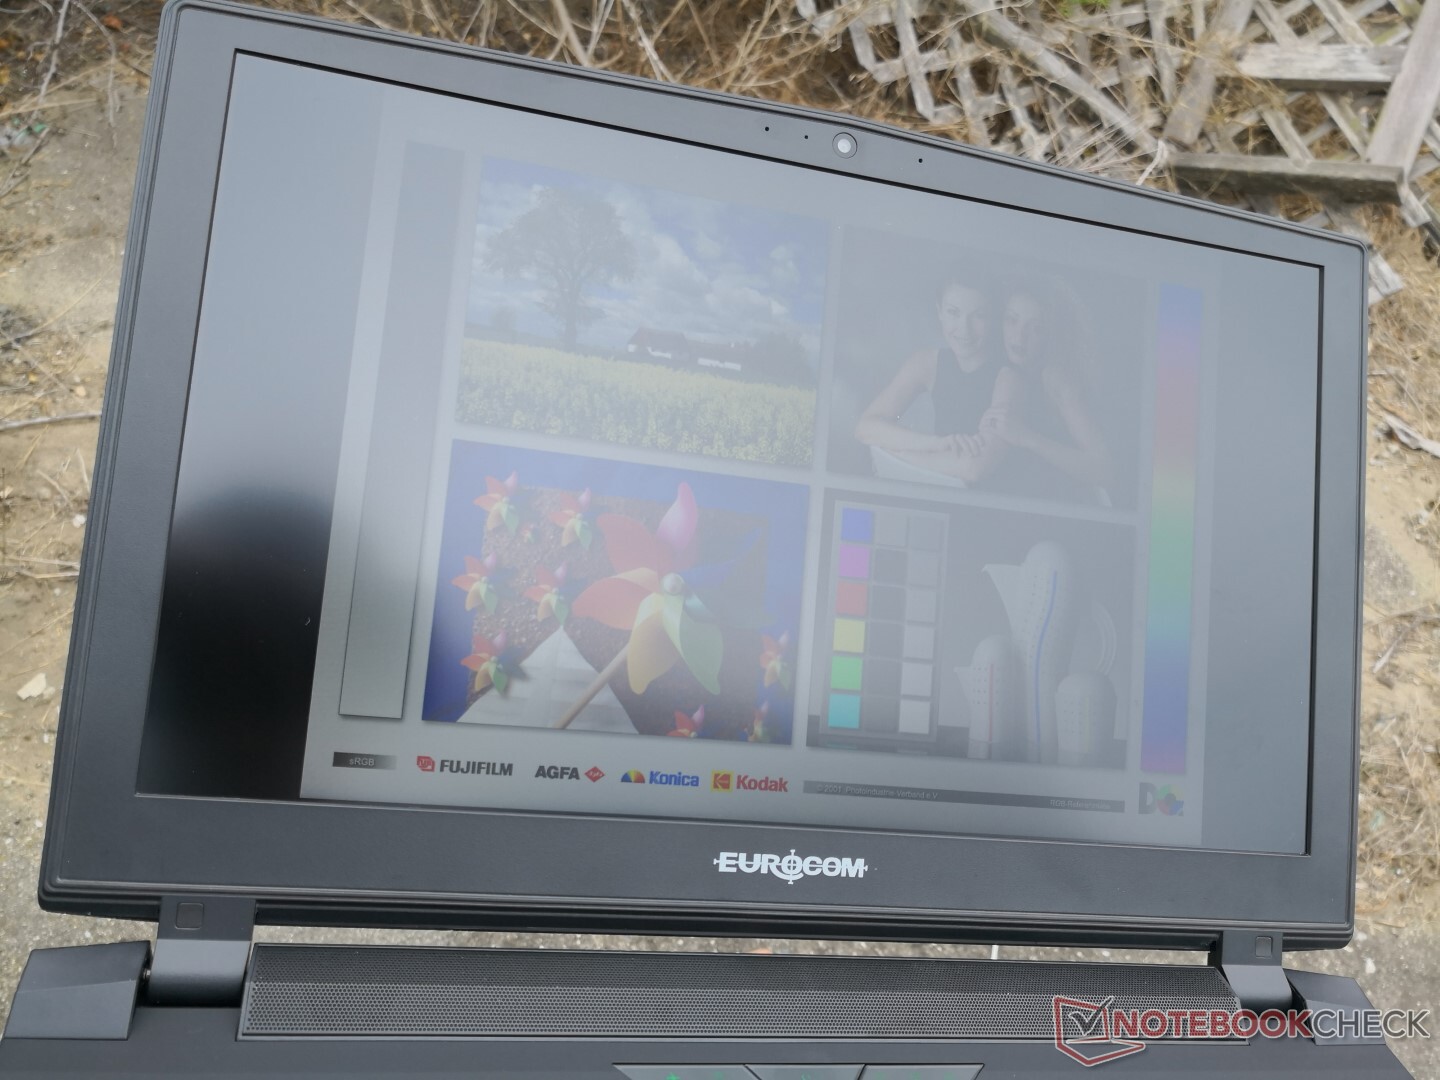
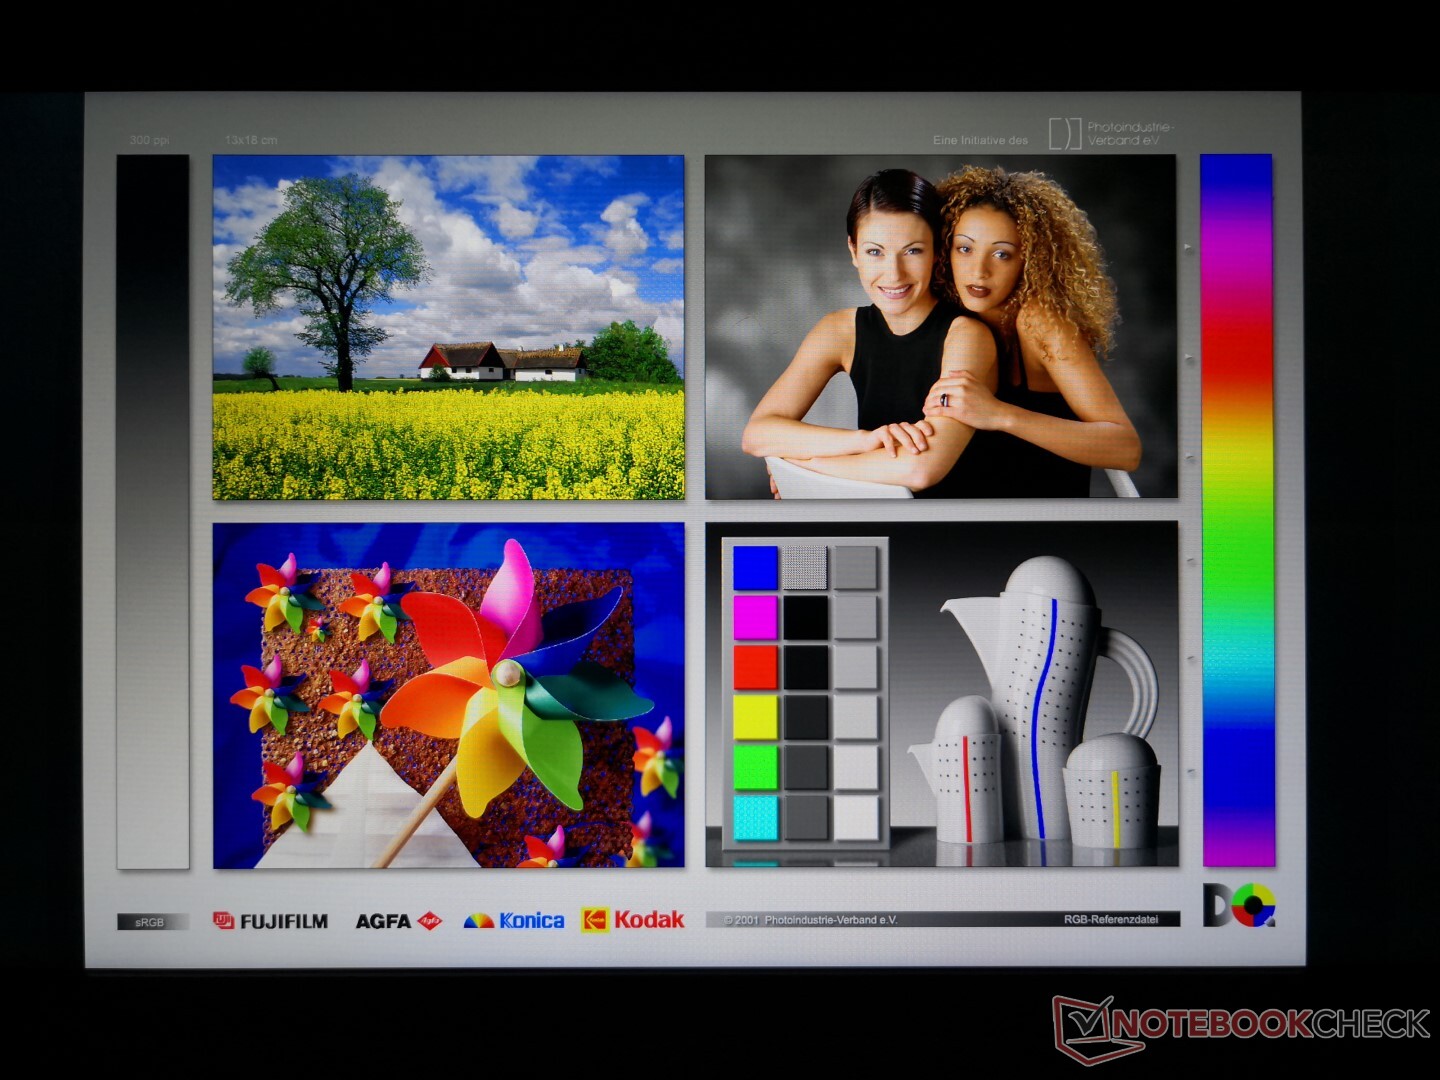
Unlike the glossy 4K UHD 60 Hz panel on our 2018 SKy X4C, our latest unit comes with a matte FHD 144 Hz panel. The AU Optronics B156HAN07.0 panel here can also be found on both the Schenker XMG Ultra 15 and Gigabyte Aorus X5 v8 meaning that these three laptops share similar display qualities including the fast response times, good contrast ratio, and decent color coverage. When compared to the 4K UHD option, the FHD option exhibits less ghosting.
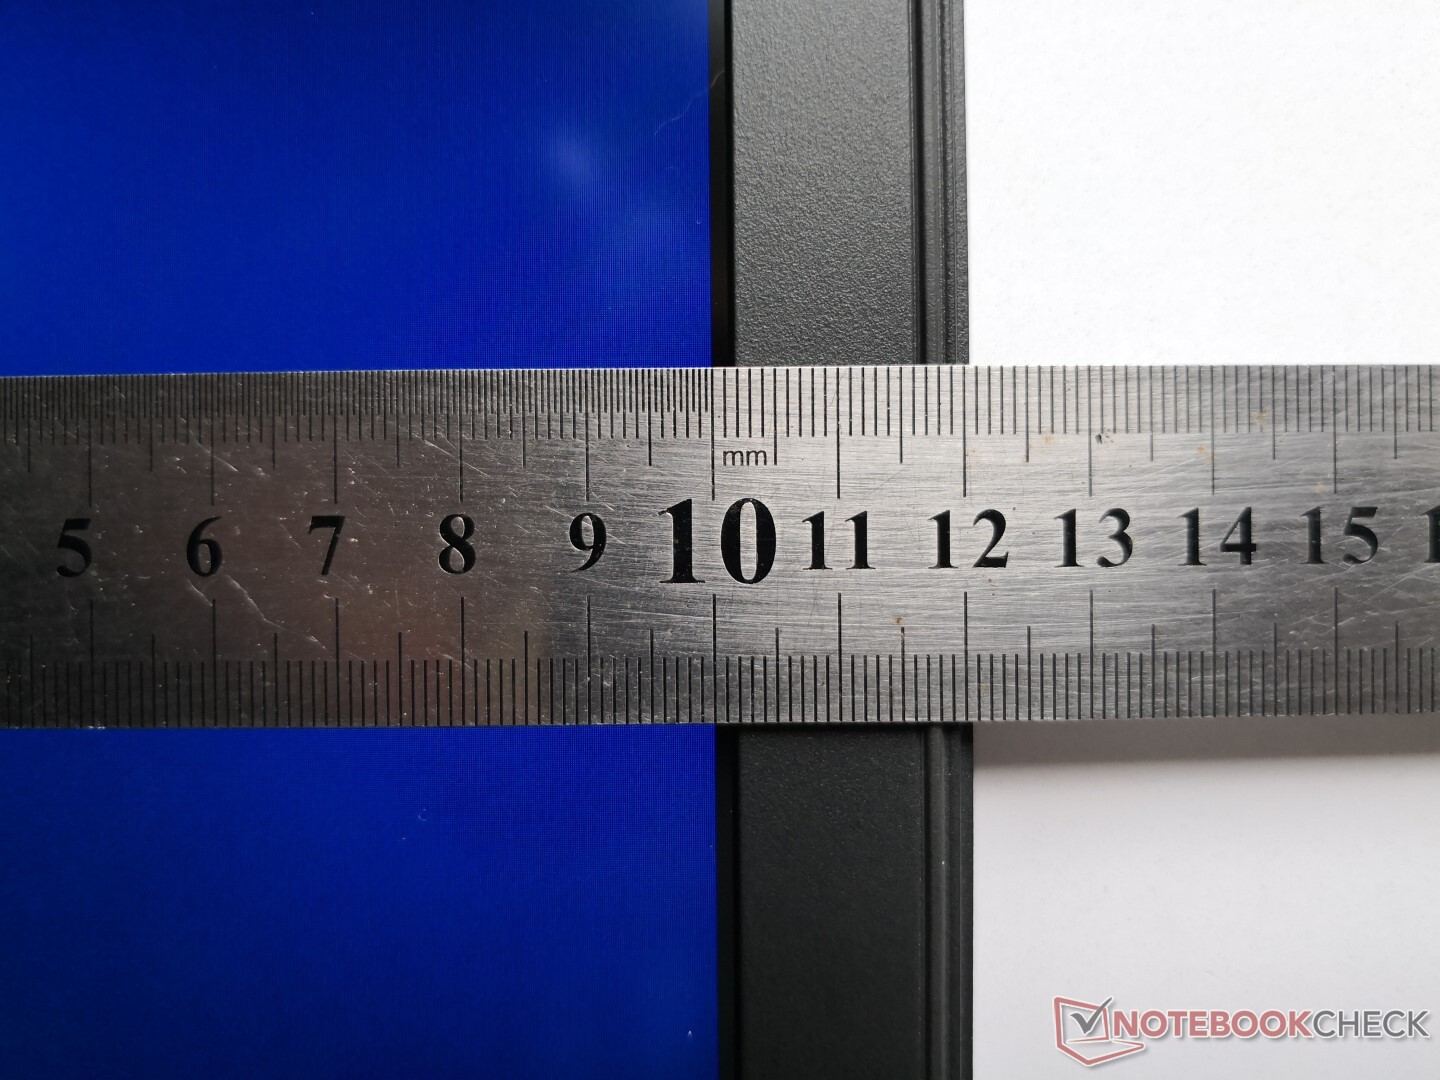
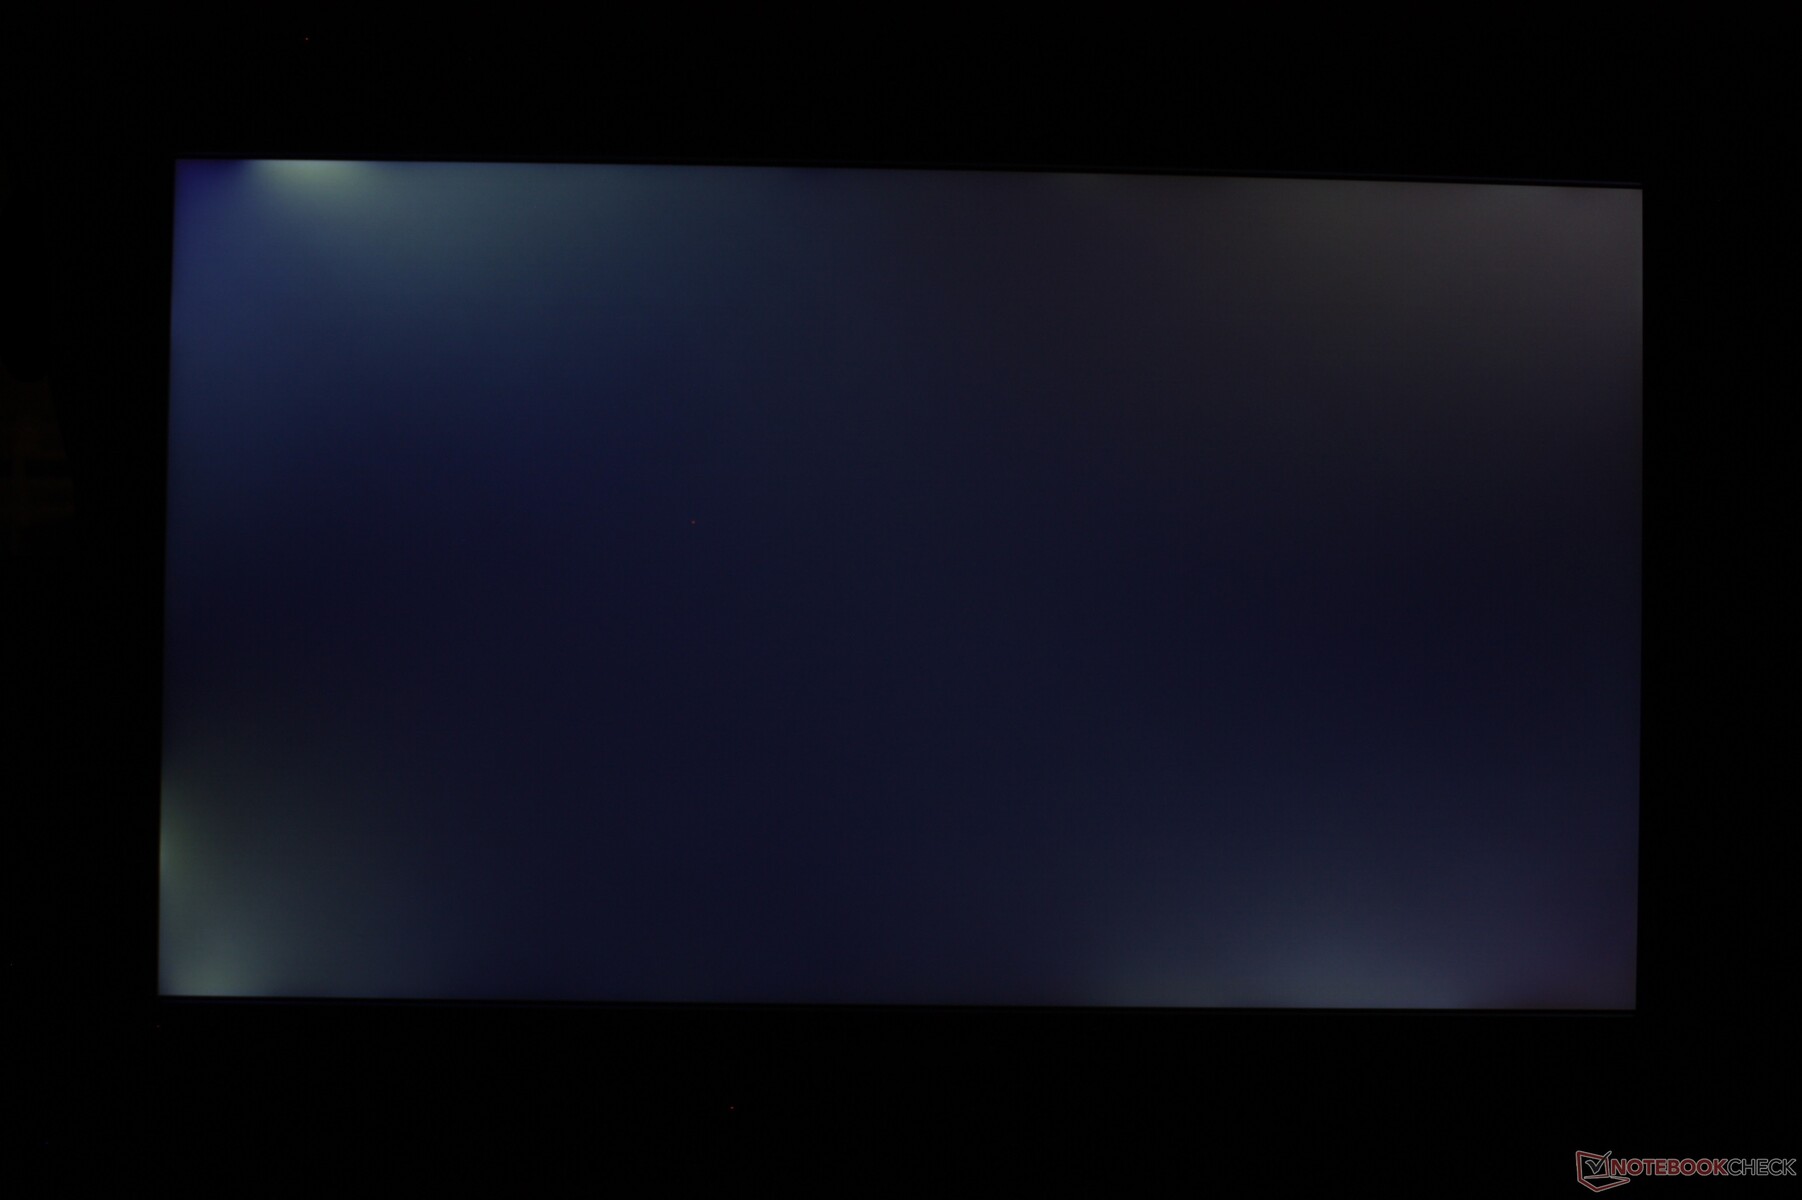
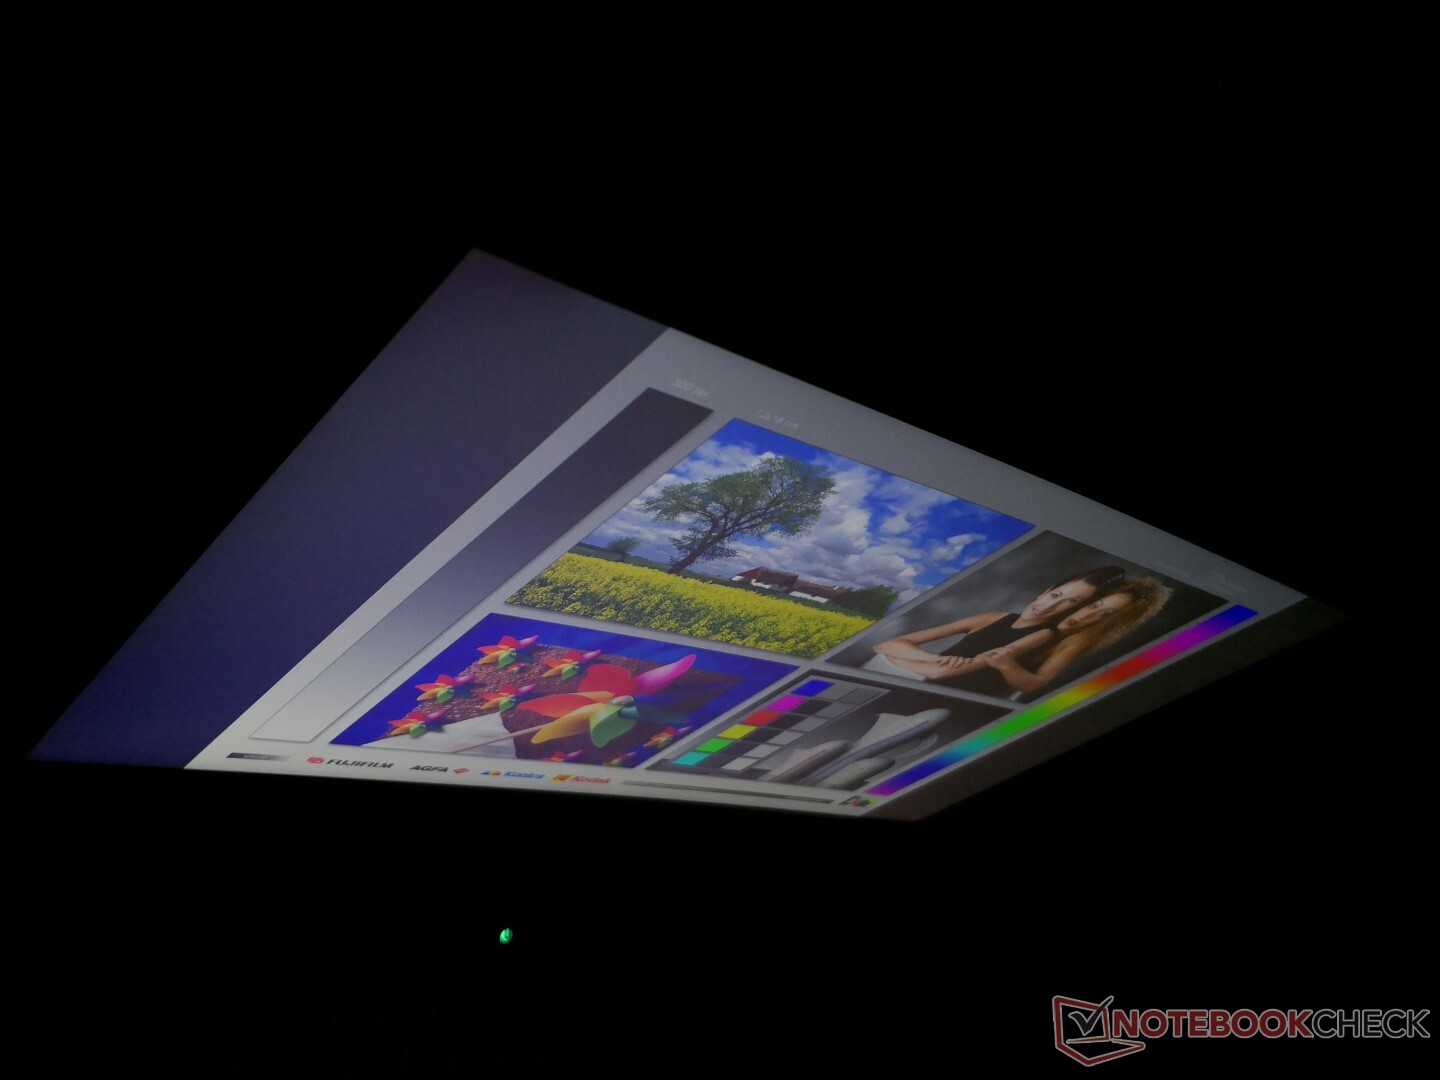
Heavy uneven backlight bleeding is present on our test unit as shown by the picture below. We recommend checking for this immediately as the light bleed can be distracting during video playback or other darkened applications.
| |||||||||||||||||||||||||
Brightness Distribution: 82 %
Center on Battery: 258.8 cd/m²
Contrast: 924:1 (Black: 0.28 cd/m²)
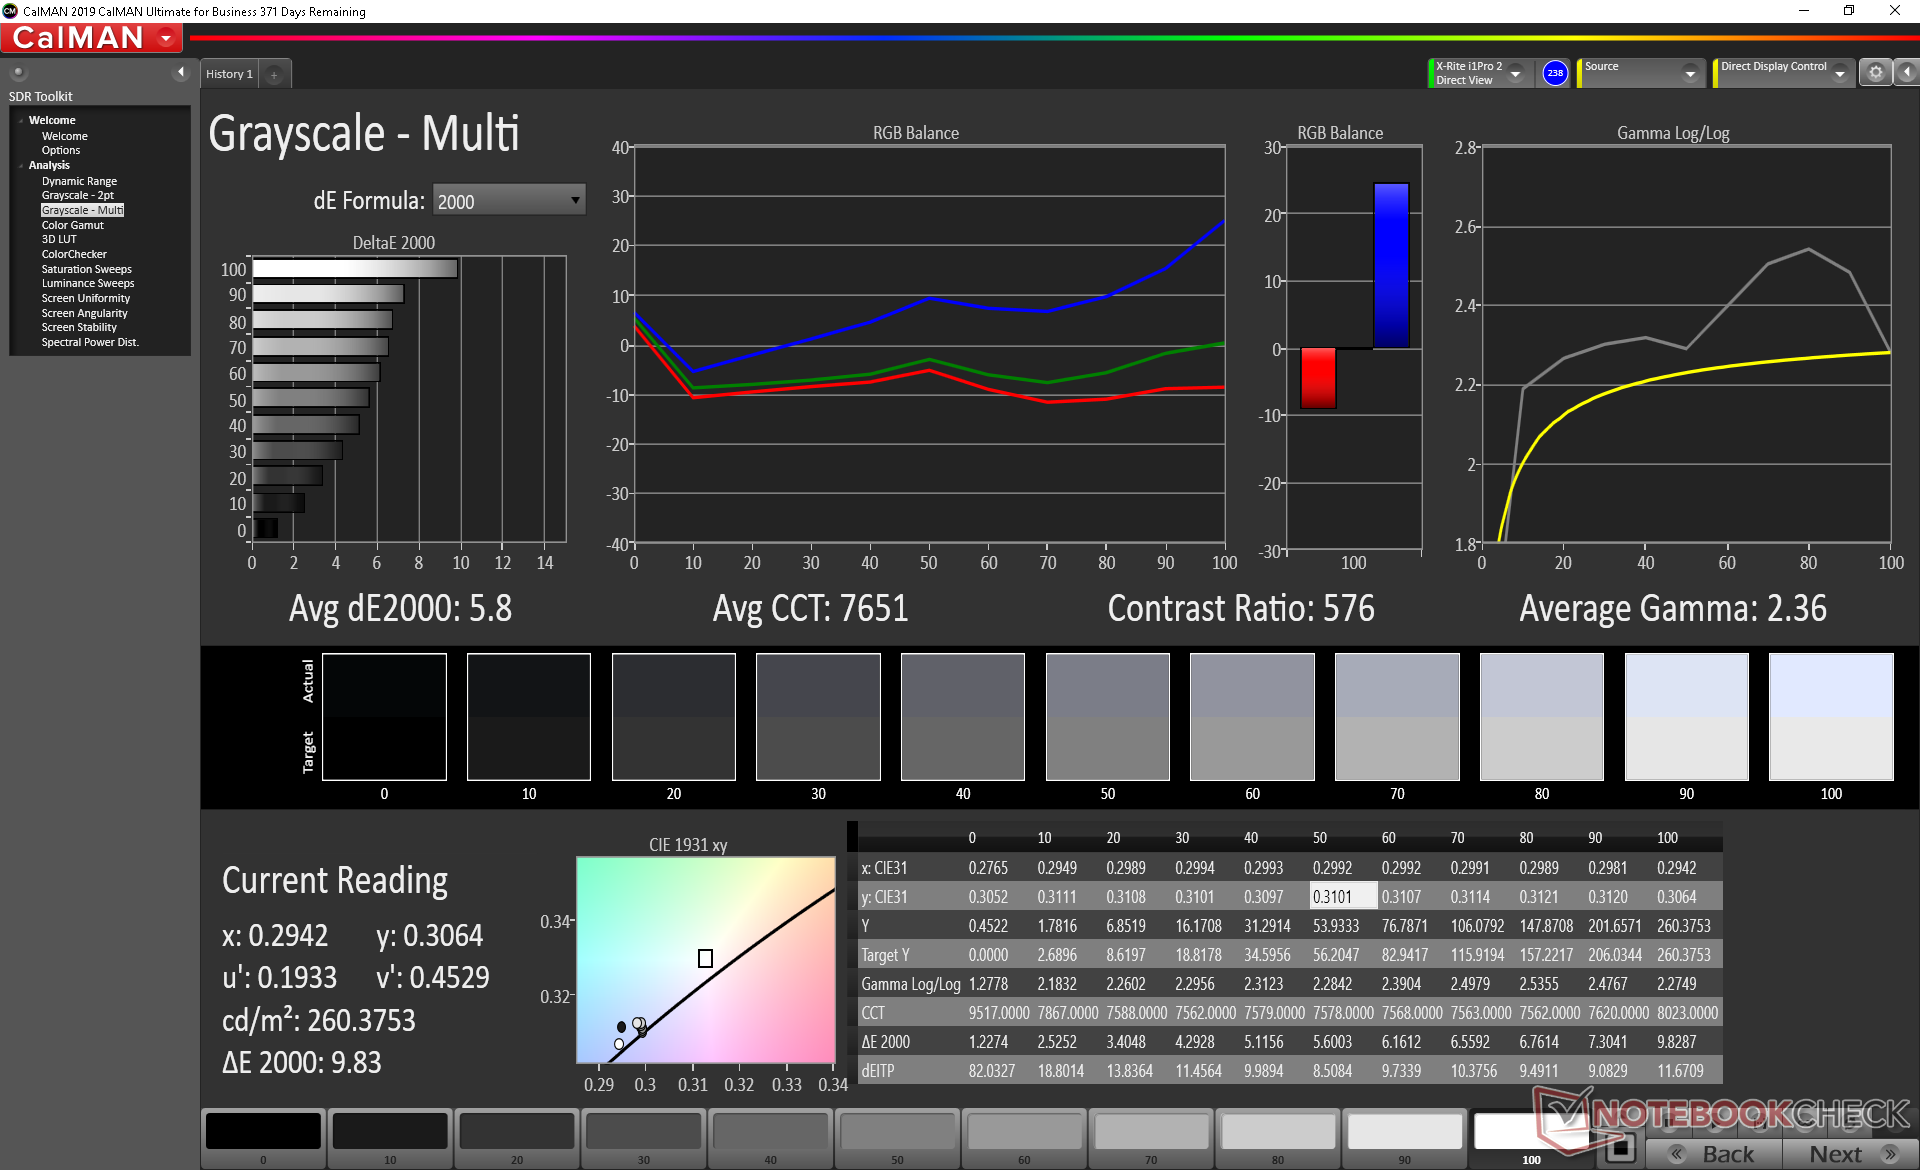
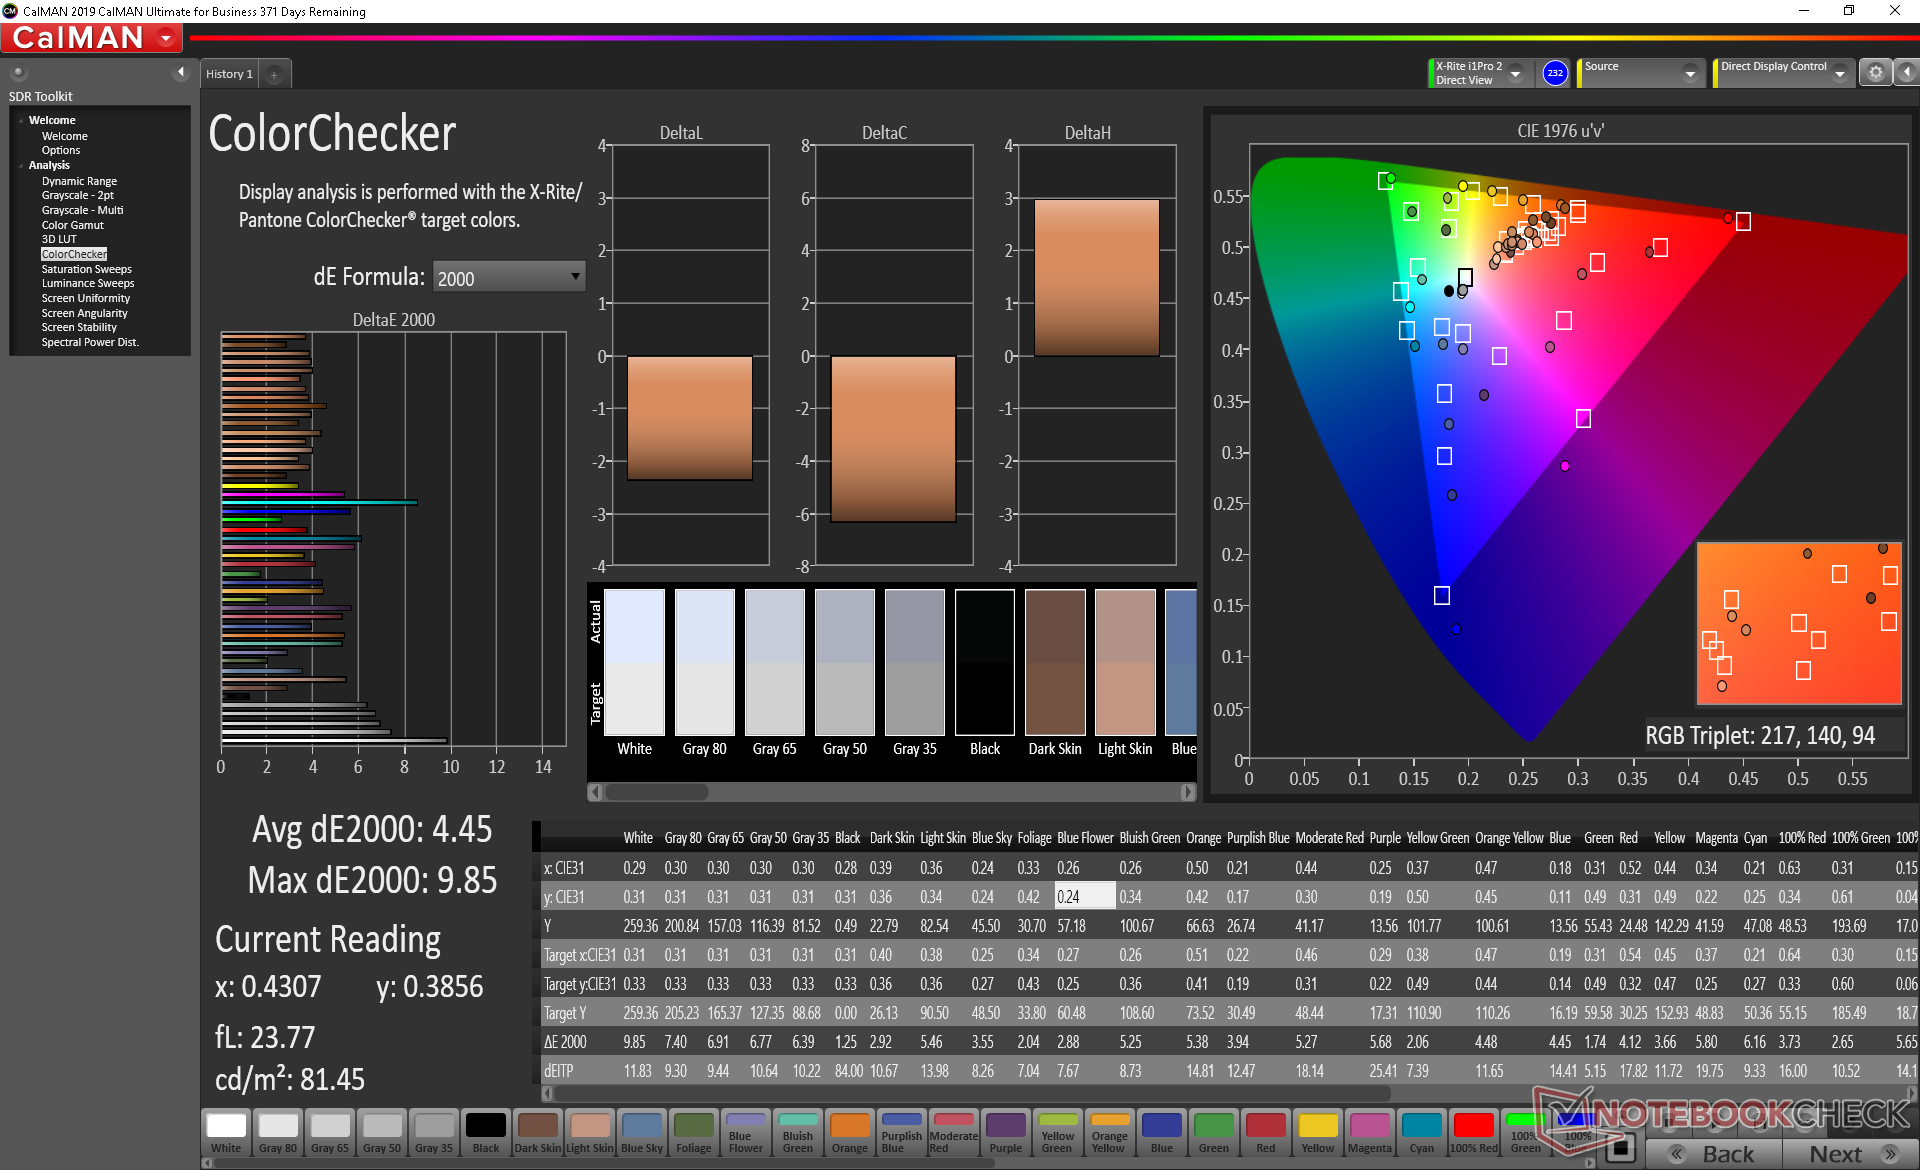
ΔE ColorChecker Calman: 4.45 | ∀{0.5-29.43 Ø4.73}
calibrated: 3
ΔE Greyscale Calman: 5.8 | ∀{0.09-98 Ø4.97}
90.5% sRGB (Argyll 1.6.3 3D)
58.8% AdobeRGB 1998 (Argyll 1.6.3 3D)
64.7% AdobeRGB 1998 (Argyll 3D)
90.9% sRGB (Argyll 3D)
63.6% Display P3 (Argyll 3D)
Gamma: 2.36
CCT: 7651 K
| Eurocom Sky X4C i9-9900KS AU Optronics B156HAN07.0, IPS, 15.6", 1920x1080 | MSI GE63VR 7RF Raider Chi Mei N156HHE-GA1 (CMN15F4), TN LED, 15.6", 1920x1080 | Asus Strix Scar III G531GW-AZ062T Sharp LQ156M1JW09 (SHP14D3), IPS, 15.6", 1920x1080 | Lenovo Legion Y740-15ICHg BOE NV156FHM-N4J, IPS, 15.6", 1920x1080 | MSI GT63 Titan 8RG-046 N156HHE-GA1, TN, 15.6", 1920x1080 | Eurocom Sky X4C ID: SHP142A, Name: LQ156D1JX01B, IPS, 15.6", 3840x2160 | |
|---|---|---|---|---|---|---|
| Display | 29% | 5% | 4% | 29% | 4% | |
| Display P3 Coverage (%) | 63.6 | 91.3 44% | 66.2 4% | 67.7 6% | 91.3 44% | 65.1 2% |
| sRGB Coverage (%) | 90.9 | 100 10% | 97.1 7% | 91.6 1% | 99.9 10% | 96.5 6% |
| AdobeRGB 1998 Coverage (%) | 64.7 | 86.7 34% | 67.6 4% | 67.1 4% | 85.7 32% | 67.2 4% |
| Response Times | 38% | 14% | -3% | 48% | -154% | |
| Response Time Grey 50% / Grey 80% * (ms) | 16.8 ? | 9.6 ? 43% | 15 ? 11% | 19 ? -13% | 8.4 ? 50% | 33.6 ? -100% |
| Response Time Black / White * (ms) | 10.8 ? | 7.2 ? 33% | 9 ? 17% | 10 ? 7% | 5.8 ? 46% | 33.2 ? -207% |
| PWM Frequency (Hz) | 26000 ? | 250 ? | 25510 ? | 1000 ? | ||
| Screen | 22% | 7% | 44% | 18% | 11% | |
| Brightness middle (cd/m²) | 258.8 | 285 10% | 309 19% | 477 84% | 307.1 19% | 324.7 25% |
| Brightness (cd/m²) | 258 | 273 6% | 284 10% | 431 67% | 276 7% | 318 23% |
| Brightness Distribution (%) | 82 | 84 2% | 88 7% | 84 2% | 80 -2% | 81 -1% |
| Black Level * (cd/m²) | 0.28 | 0.23 18% | 0.42 -50% | 0.175 38% | 0.37 -32% | 0.26 7% |
| Contrast (:1) | 924 | 1239 34% | 736 -20% | 2726 195% | 830 -10% | 1249 35% |
| Colorchecker dE 2000 * | 4.45 | 3.52 21% | 3.99 10% | 4.17 6% | 2.53 43% | 4.67 -5% |
| Colorchecker dE 2000 max. * | 9.85 | 5.18 47% | 8.3 16% | 6.97 29% | 4.66 53% | 8.16 17% |
| Colorchecker dE 2000 calibrated * | 3 | 1.12 63% | 2.51 16% | 2.82 6% | ||
| Greyscale dE 2000 * | 5.8 | 3.41 41% | 5.43 6% | 3.49 40% | 1.7 71% | 5.9 -2% |
| Gamma | 2.36 93% | 2.05 107% | 2.57 86% | 2.5 88% | 2.194 100% | 2.14 103% |
| CCT | 7651 85% | 7077 92% | 7767 84% | 7076 92% | 6893 94% | 7176 91% |
| Color Space (Percent of AdobeRGB 1998) (%) | 58.8 | 77 31% | 63 7% | 60 2% | 76 29% | 61.1 4% |
| Color Space (Percent of sRGB) (%) | 90.5 | 100 10% | 97 7% | 91 1% | 100 10% | 96.1 6% |
| Total Average (Program / Settings) | 30% /
26% | 9% /
7% | 15% /
30% | 32% /
24% | -46% /
-12% |
* ... smaller is better
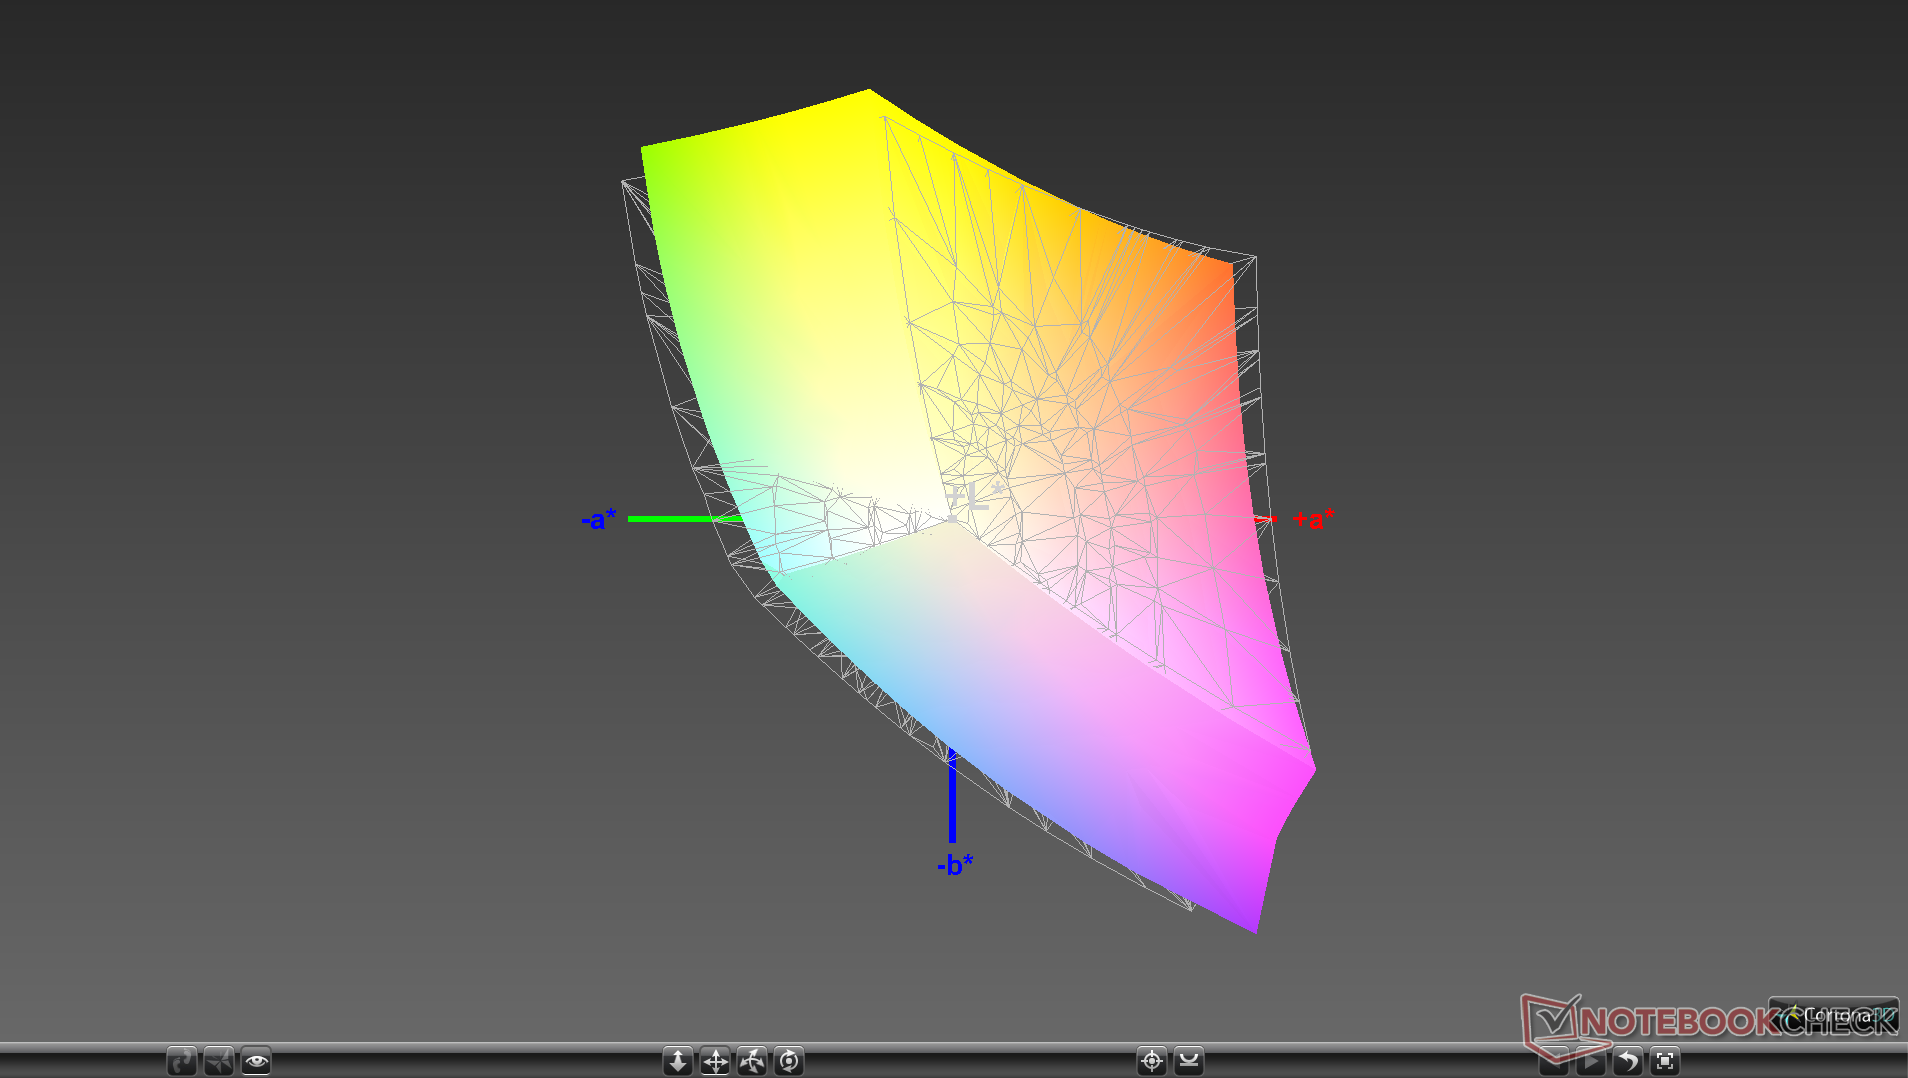
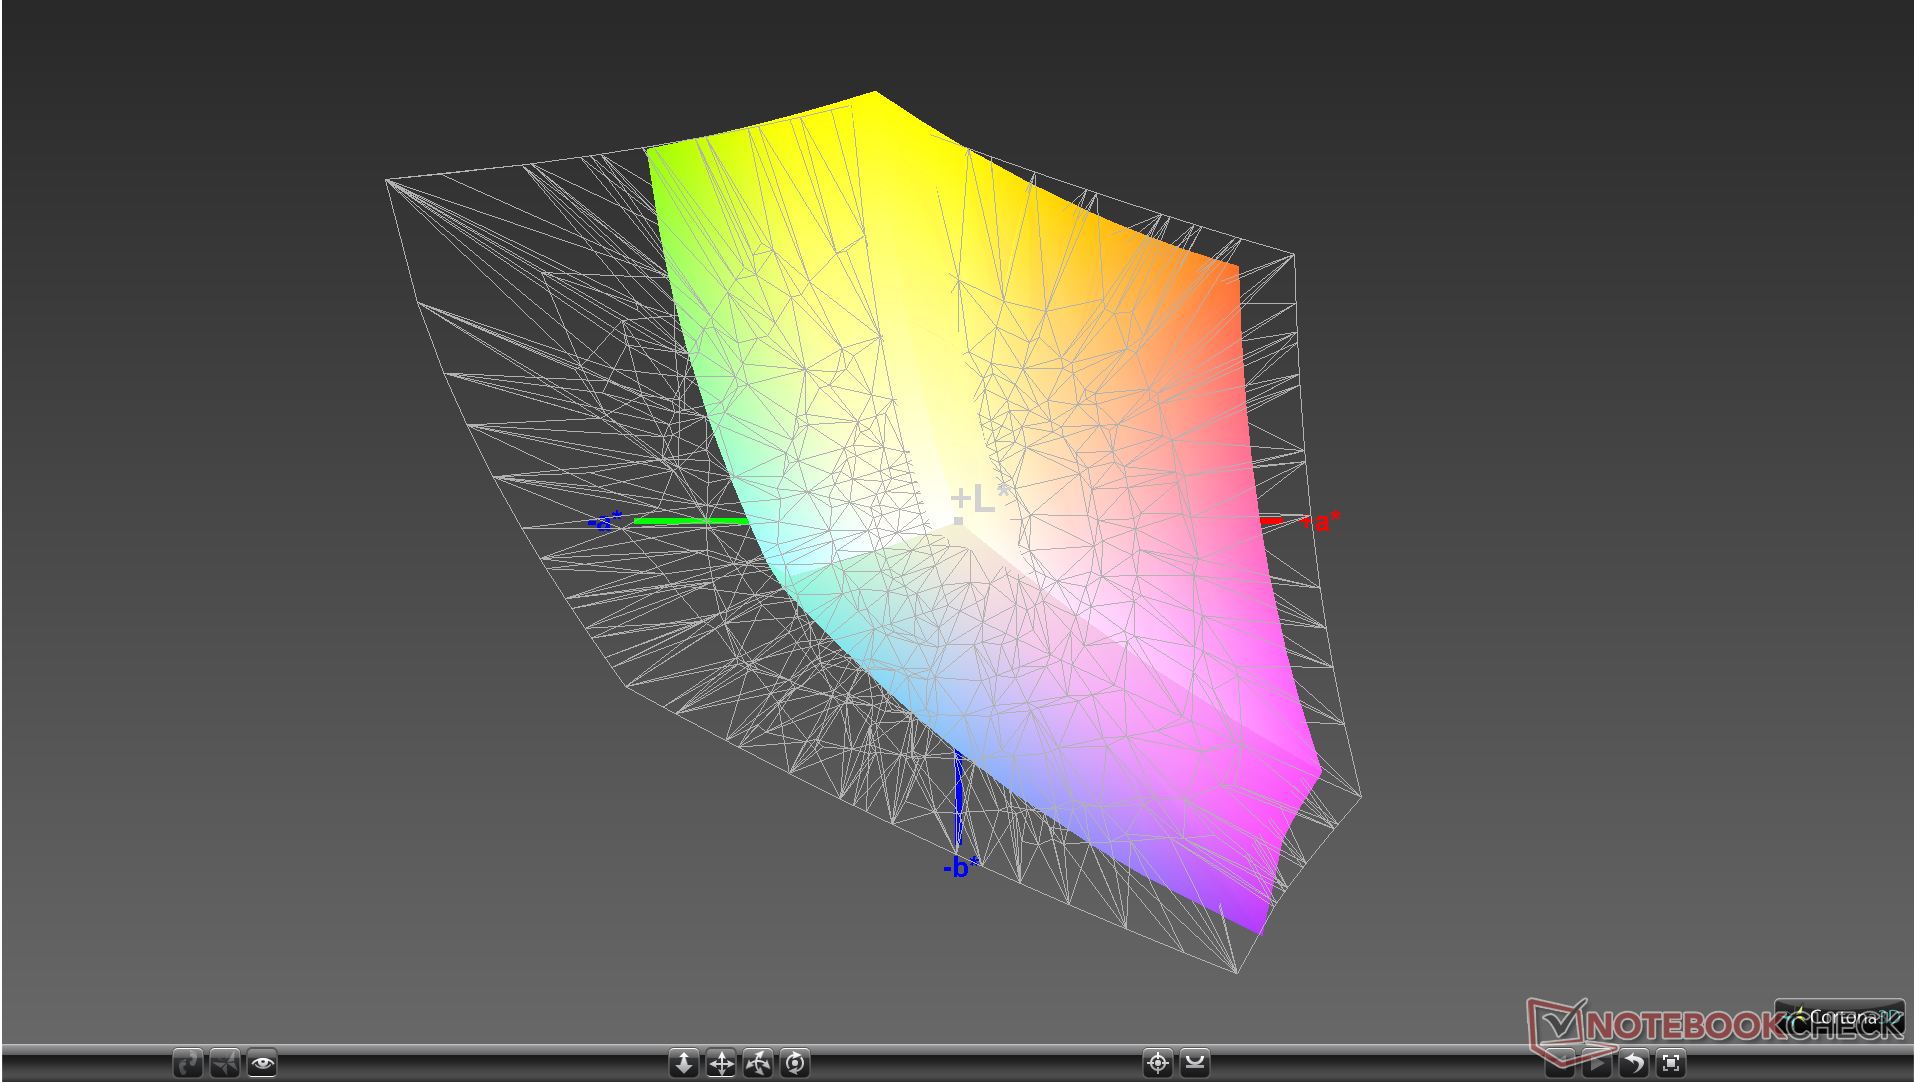
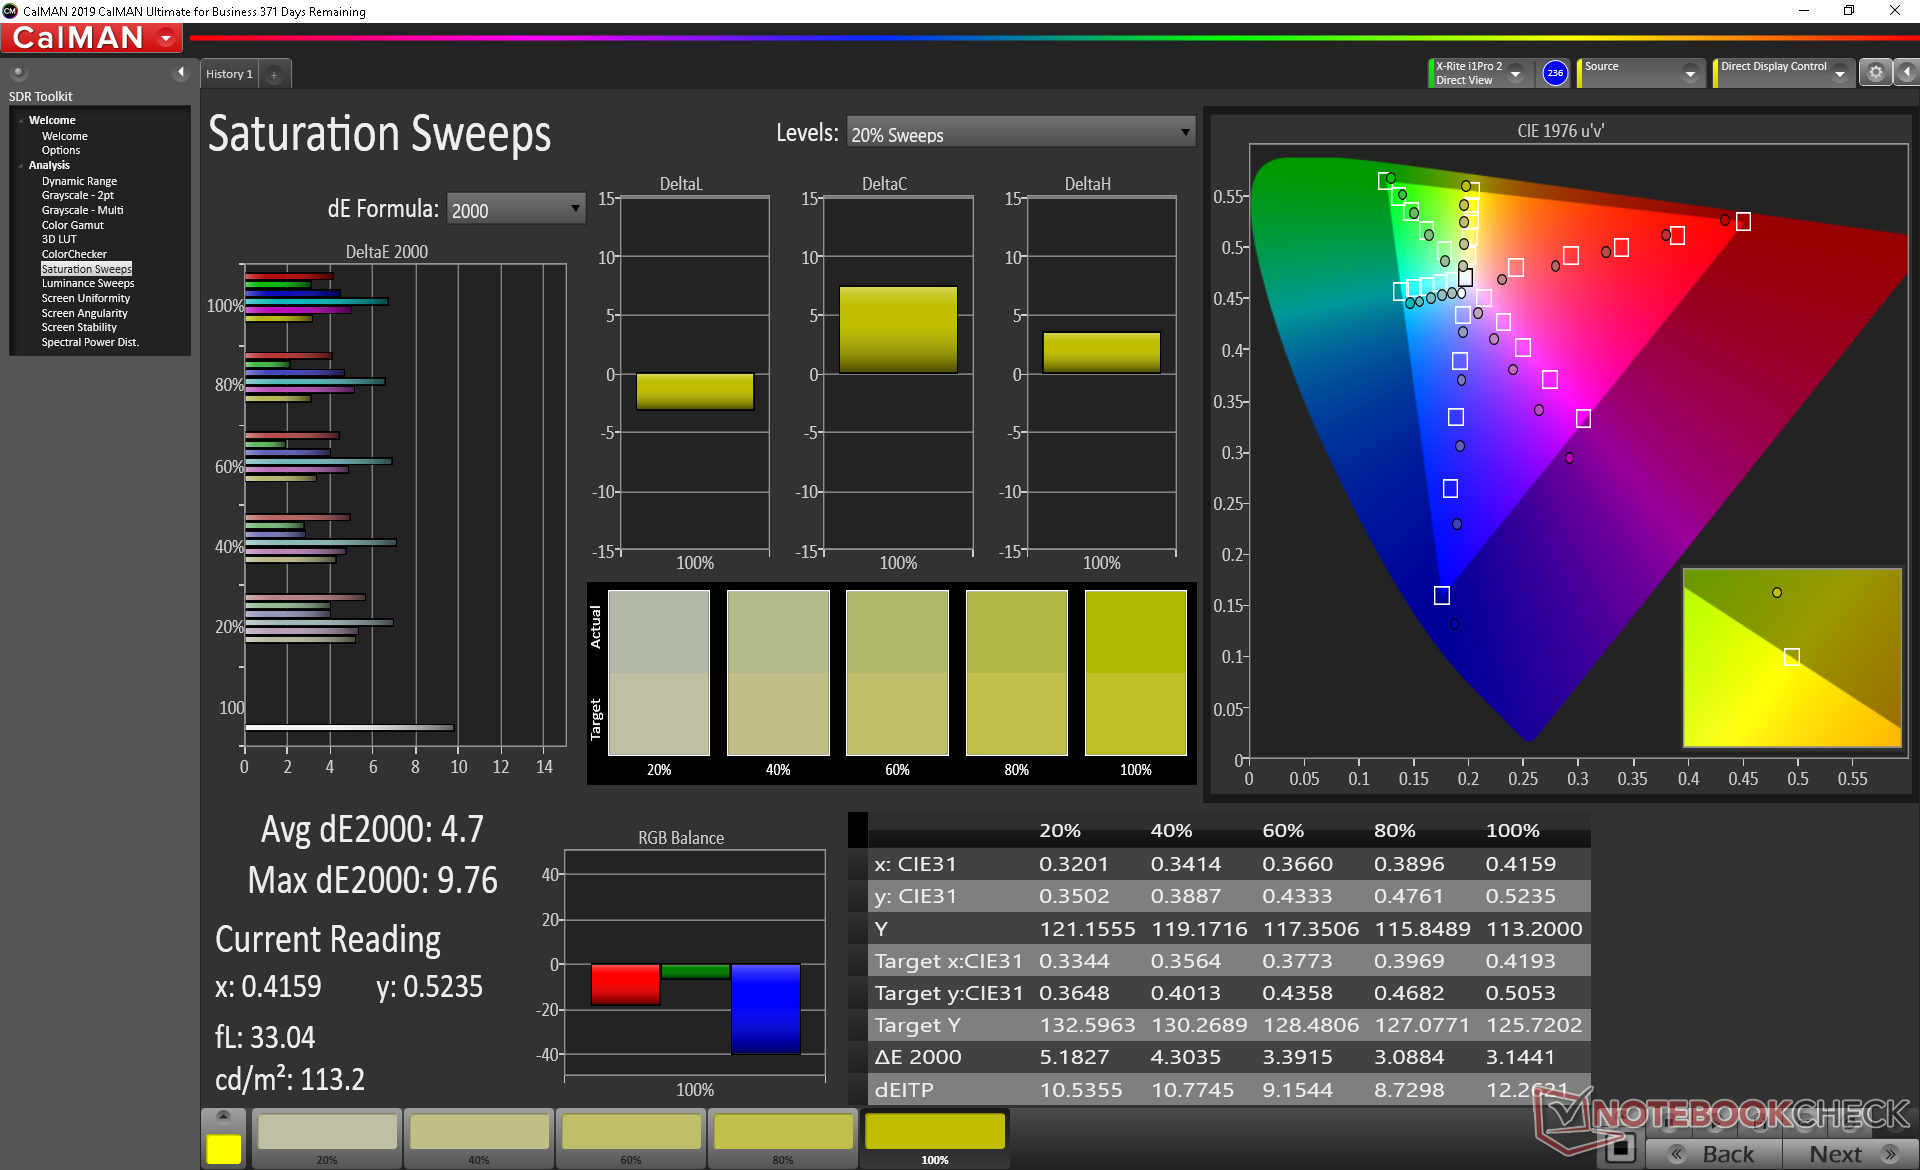
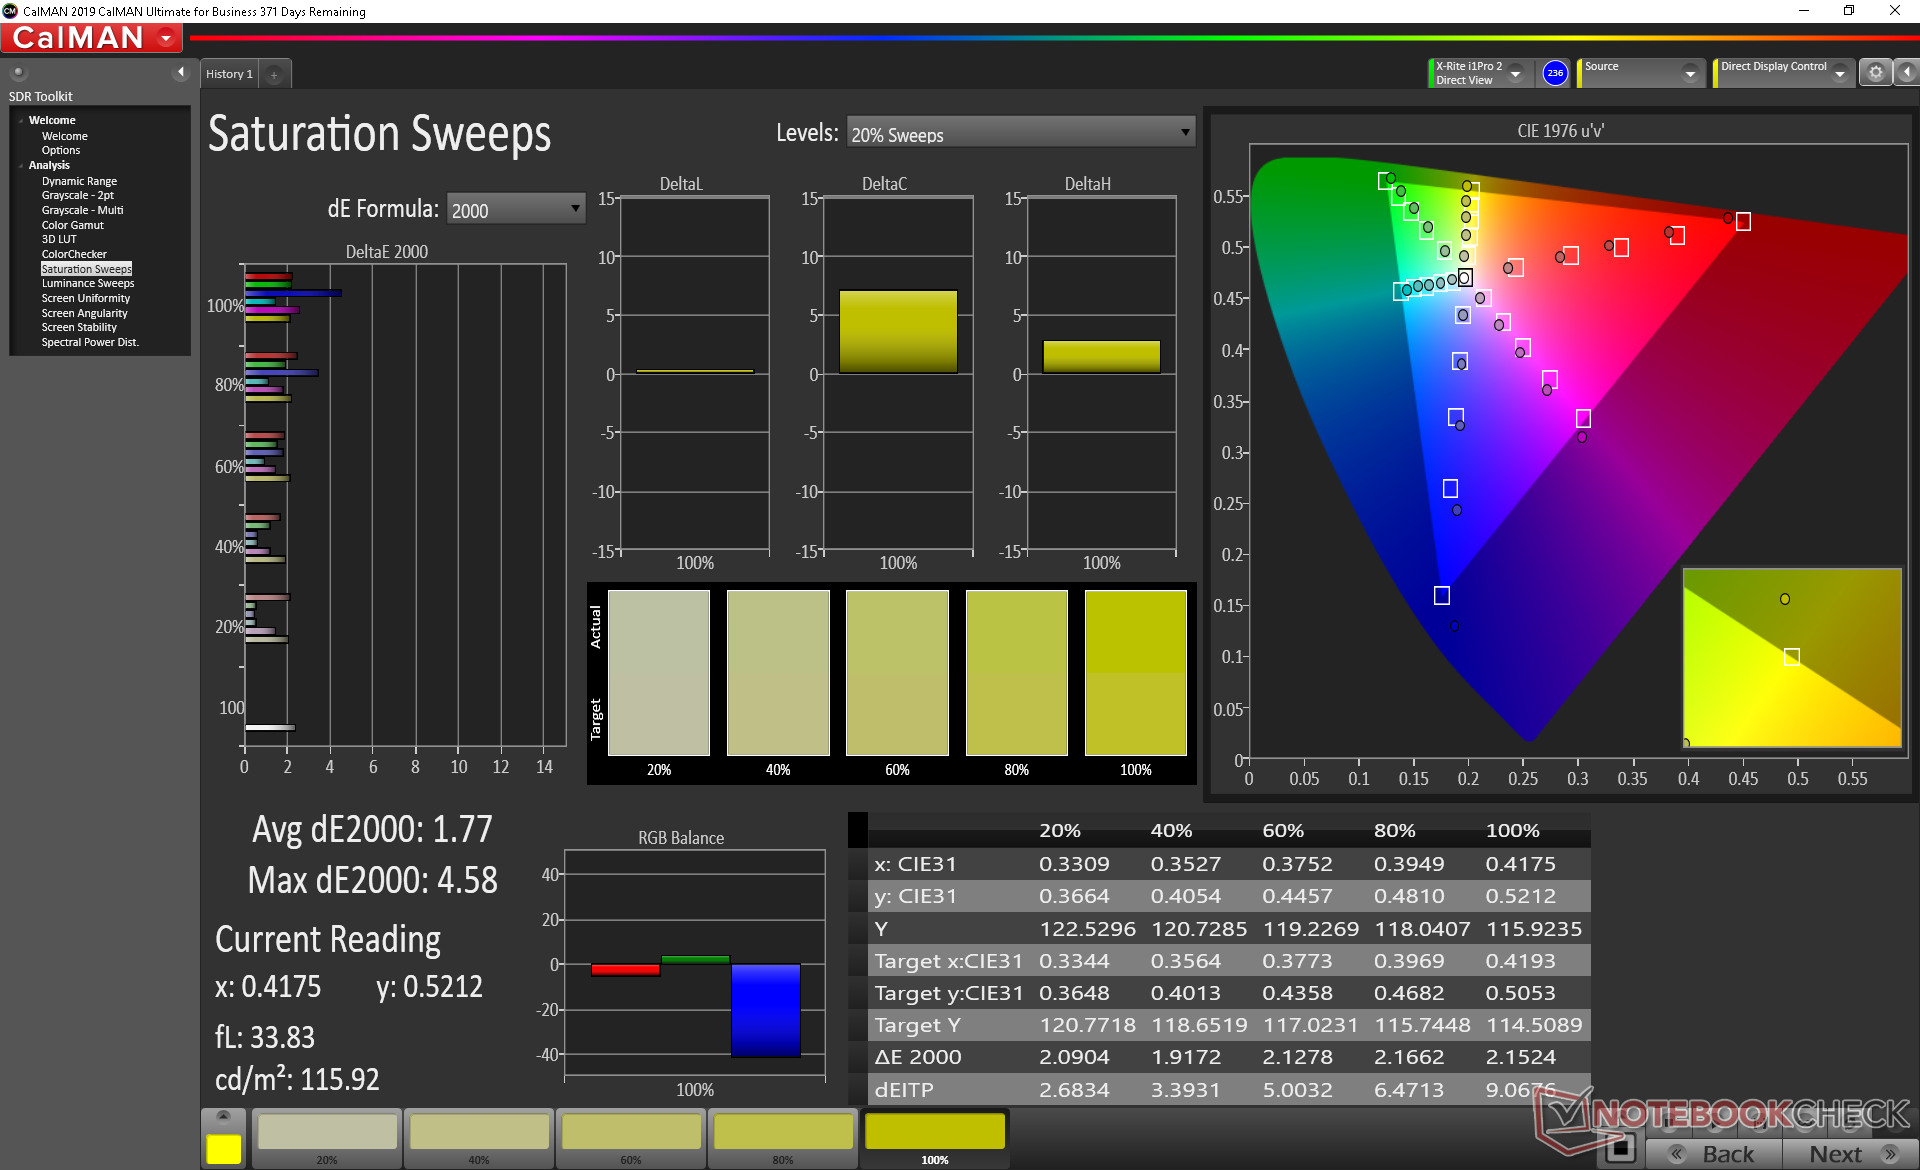
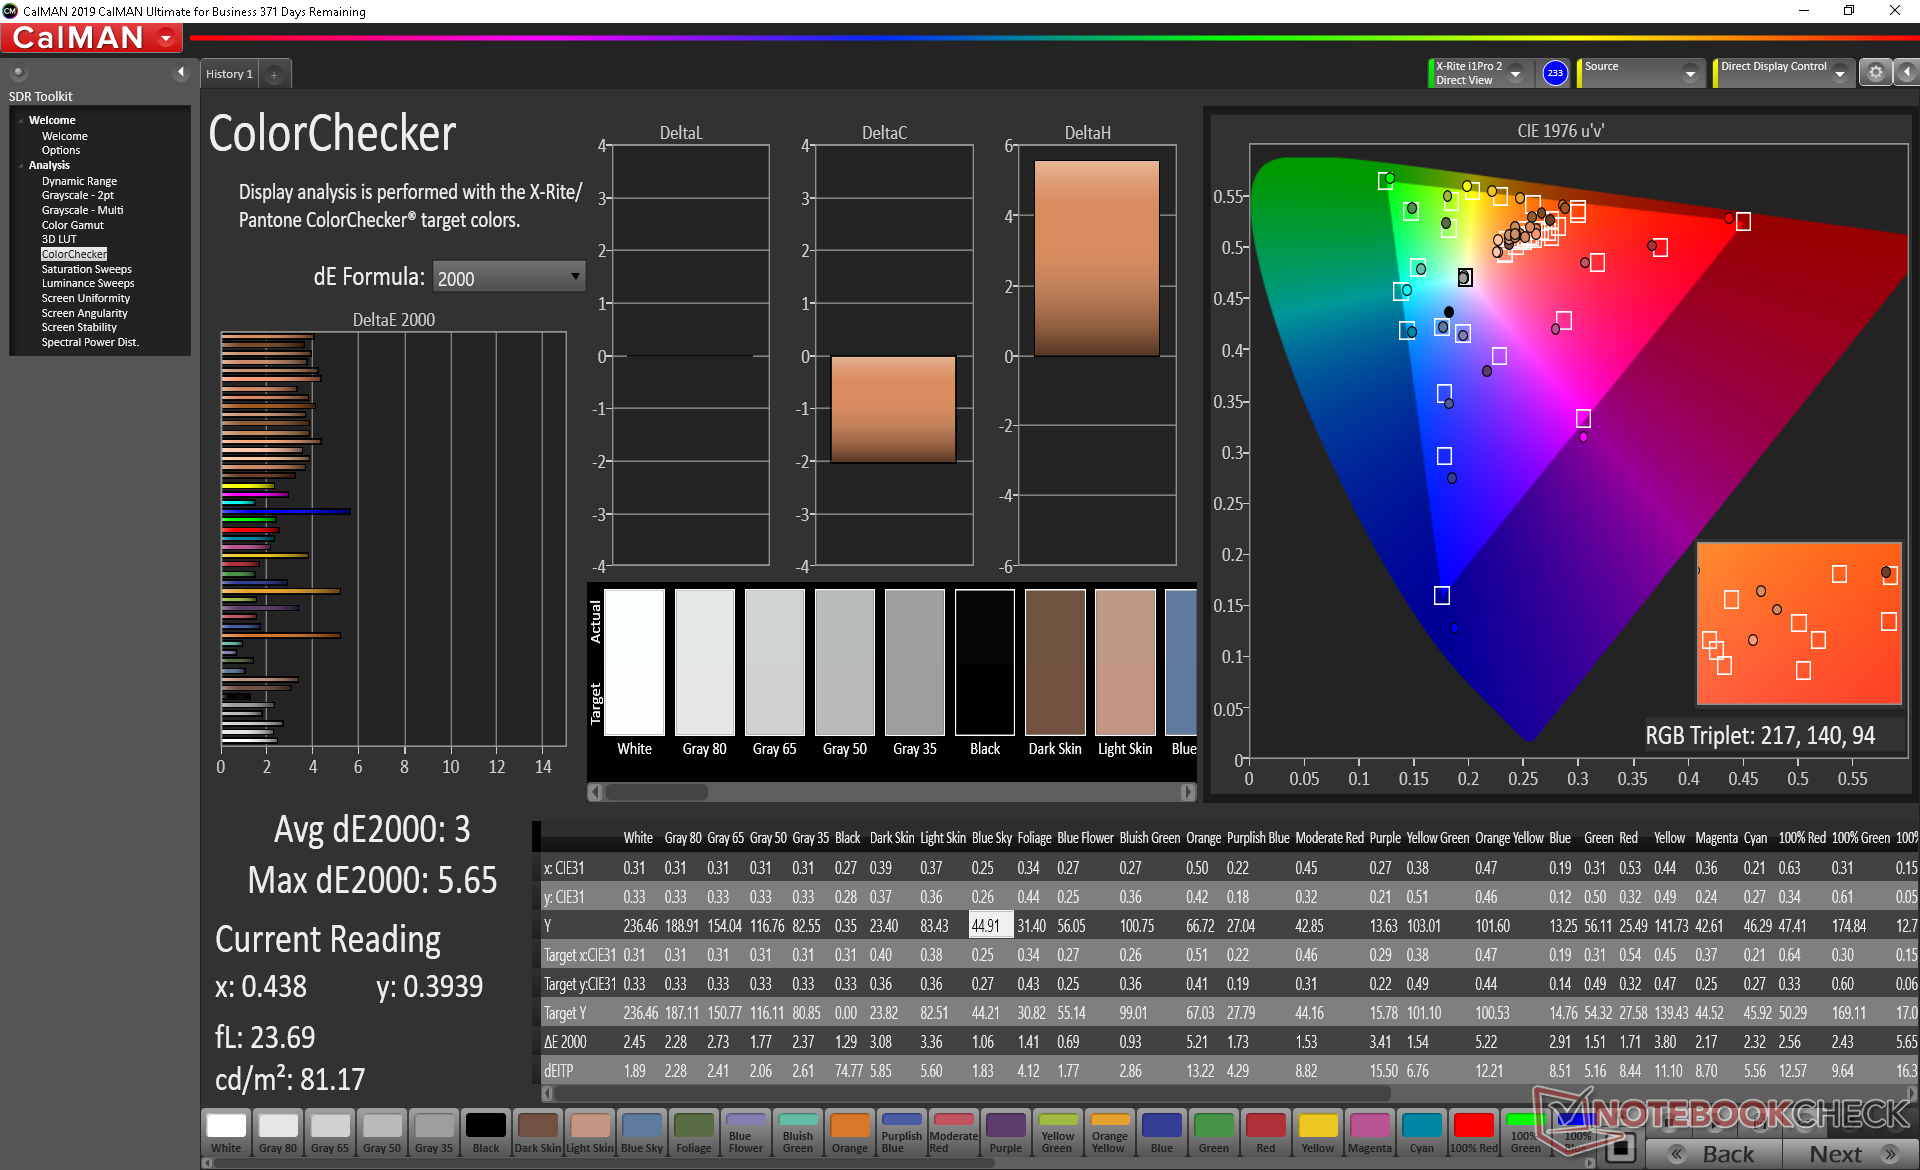
Color space covers approximately 59 percent and 91 percent of the AdobeRGB and sRGB standards, respectively, to be similar to all other 15.6-inch 144 Hz panels currently in the market. The only other high refresh rate panel that can offer a significantly wider gamut at the moment is the 120 Hz panel on the latest Razer Blade Pro 17.
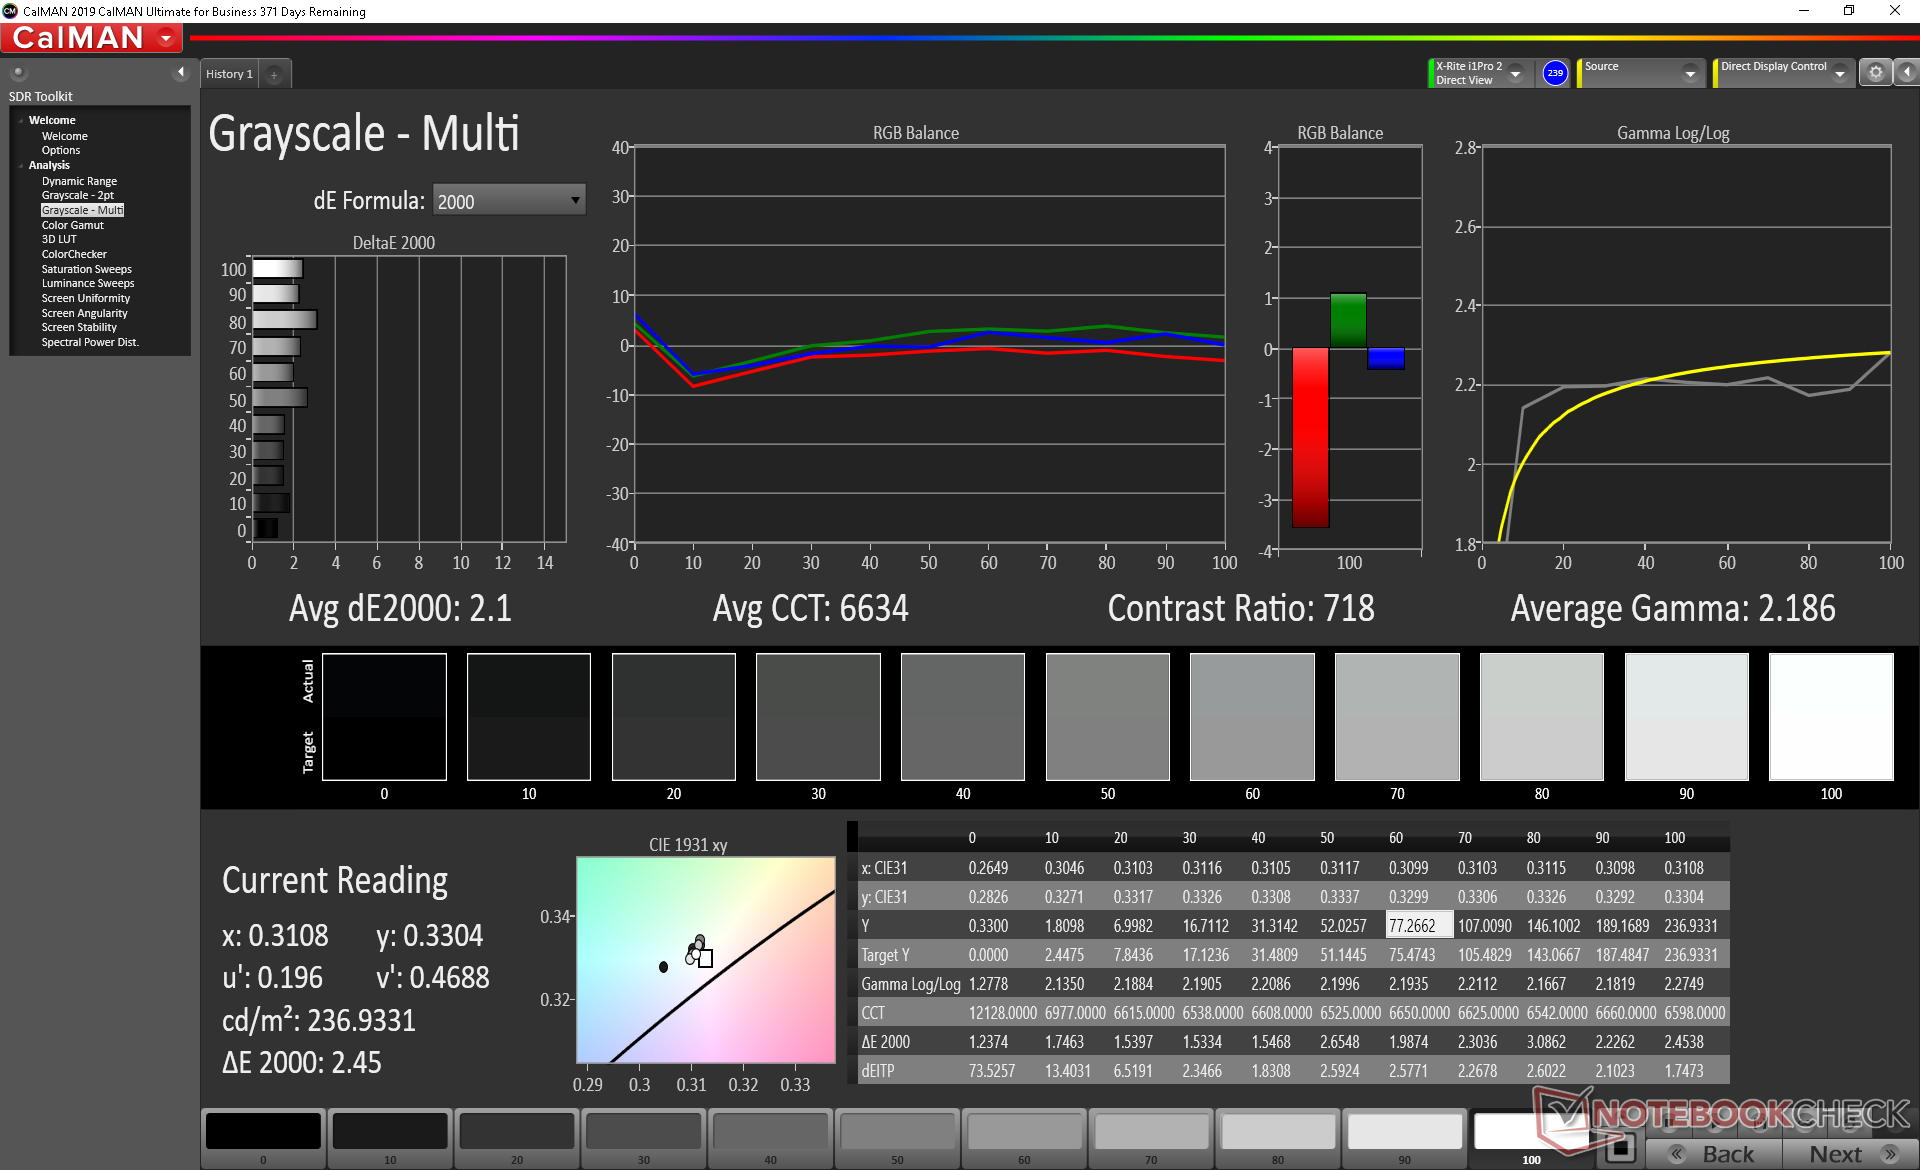
The panel is not well-calibrated out of the box and color temperature is far too cool. Average grayscale and color deltaE values sit at 5.8 and 4.7 compared to 2.1 and 1.77, respectively, after calibrating the panel ourselves. Eurocom will pre-calibrate the laptop before shipping at an additional cost.
Display Response Times
| ↔ Response Time Black to White | ||
|---|---|---|
| 10.8 ms ... rise ↗ and fall ↘ combined | ↗ 5.2 ms rise | 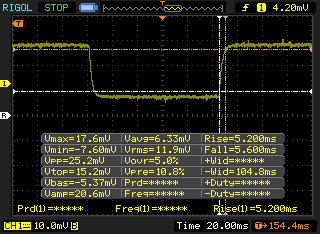 |
| ↘ 5.6 ms fall | ||
| The screen shows good response rates in our tests, but may be too slow for competitive gamers. In comparison, all tested devices range from 0.1 (minimum) to 240 (maximum) ms. » 29 % of all devices are better. This means that the measured response time is better than the average of all tested devices (19.9 ms). | ||
| ↔ Response Time 50% Grey to 80% Grey | ||
| 16.8 ms ... rise ↗ and fall ↘ combined | ↗ 9.2 ms rise | 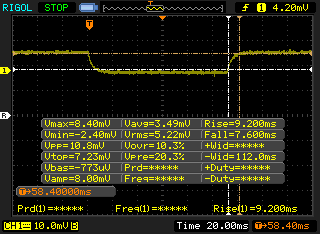 |
| ↘ 7.6 ms fall | ||
| The screen shows good response rates in our tests, but may be too slow for competitive gamers. In comparison, all tested devices range from 0.165 (minimum) to 636 (maximum) ms. » 31 % of all devices are better. This means that the measured response time is better than the average of all tested devices (31.1 ms). | ||
Screen Flickering / PWM (Pulse-Width Modulation)
| Screen flickering / PWM not detected | 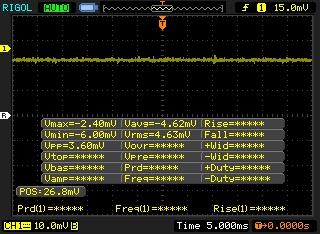 | ||
In comparison: 52 % of all tested devices do not use PWM to dim the display. If PWM was detected, an average of 7794 (minimum: 5 - maximum: 343500) Hz was measured. | |||
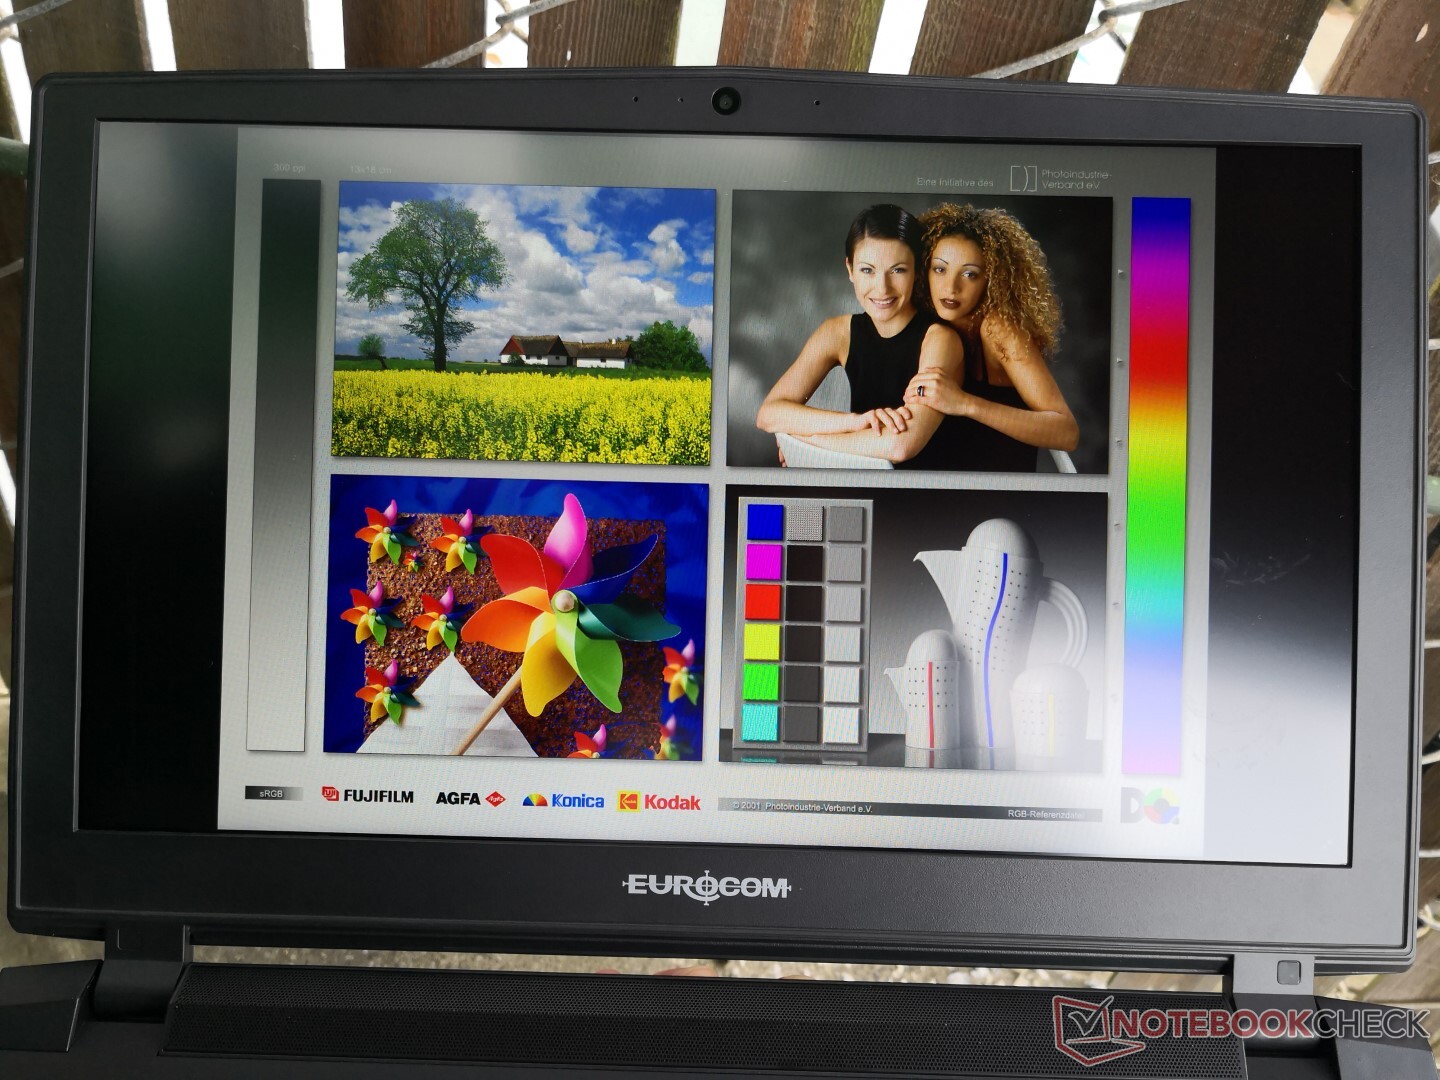
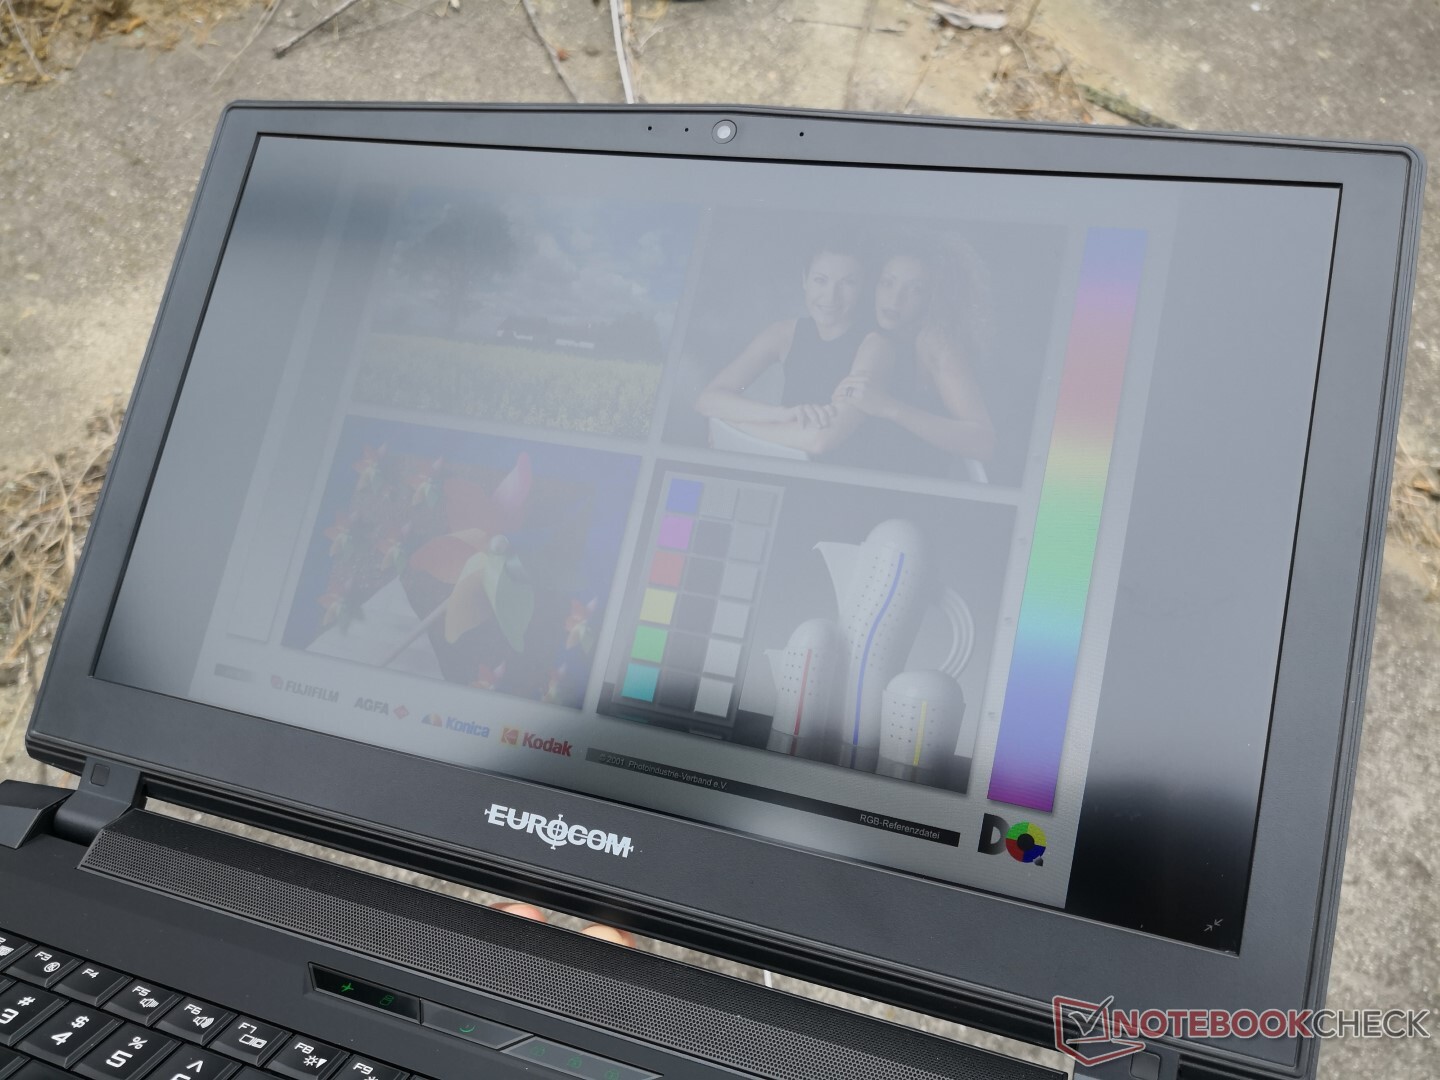
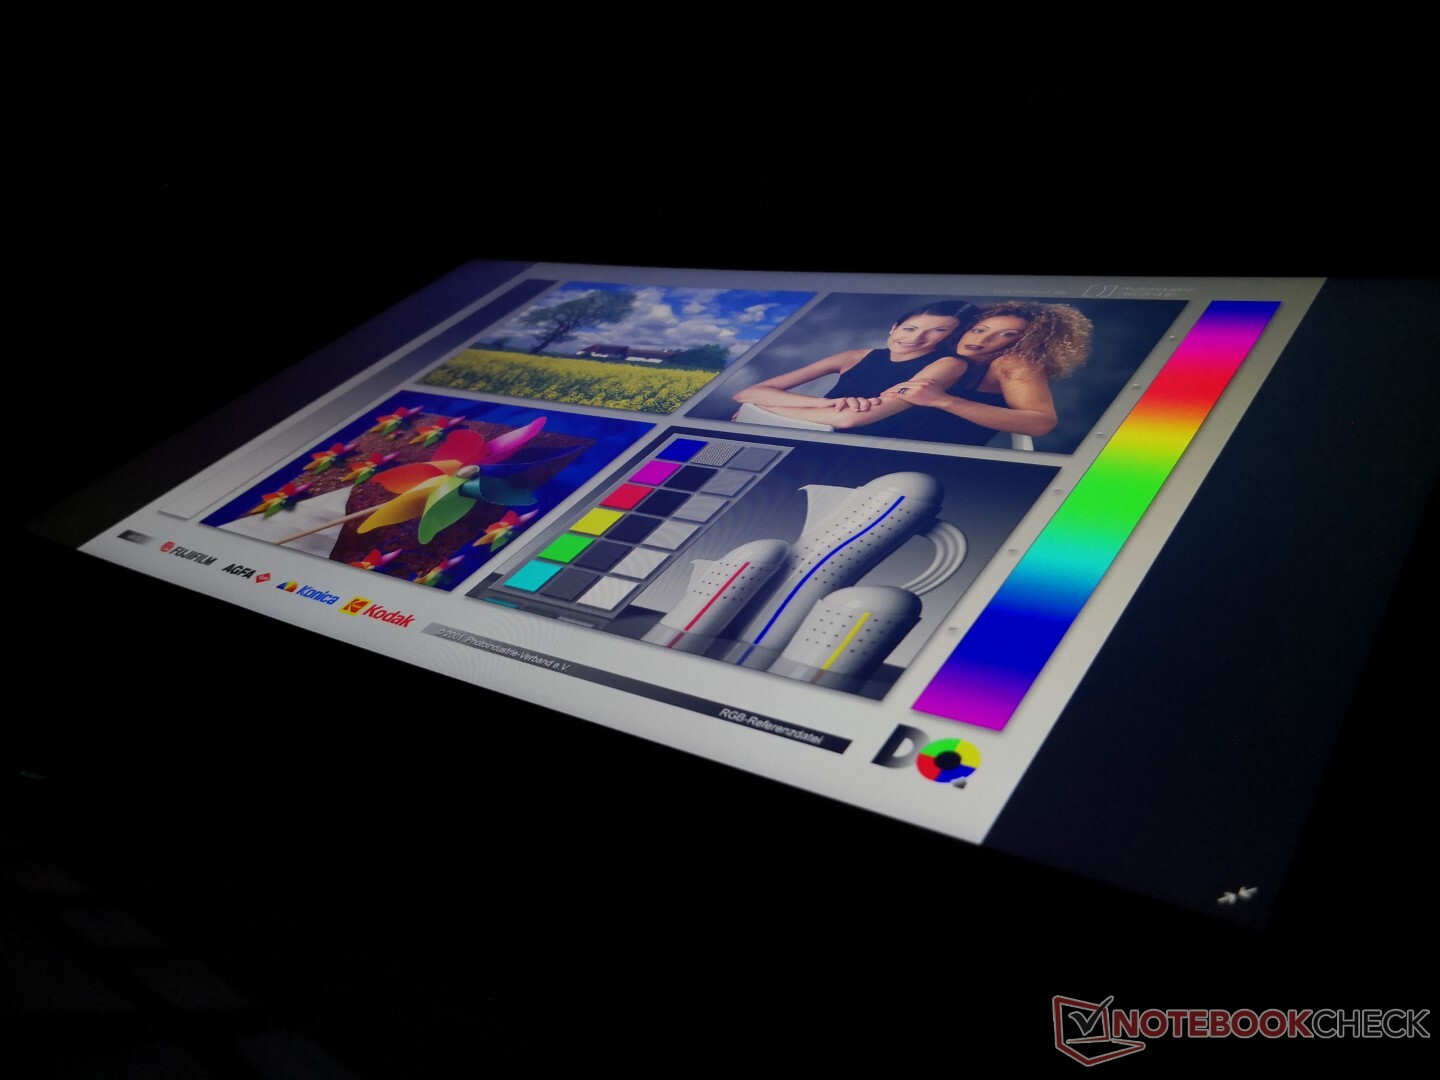
Outdoor visibility is worse than the 4K UHD option since this FHD panel is dimmer. Viewing angles are still excellent except if viewing from abnormally wide angles where contrast and colors begin to degrade.
Performance
The Core i9-9900KS (S for Special Edition) is essentially identical to the Core i9-9900K with a couple of differences as described by their respective product pages here. From a pure performance point-of-view, the Special Edition SKU has a higher base clock rate of 4 GHz compared to 3.6 GHz on i9-9900K. In practice, however, the two CPUs perform nearly identically on laptops due to having similar Turbo Boost clock rate potential.
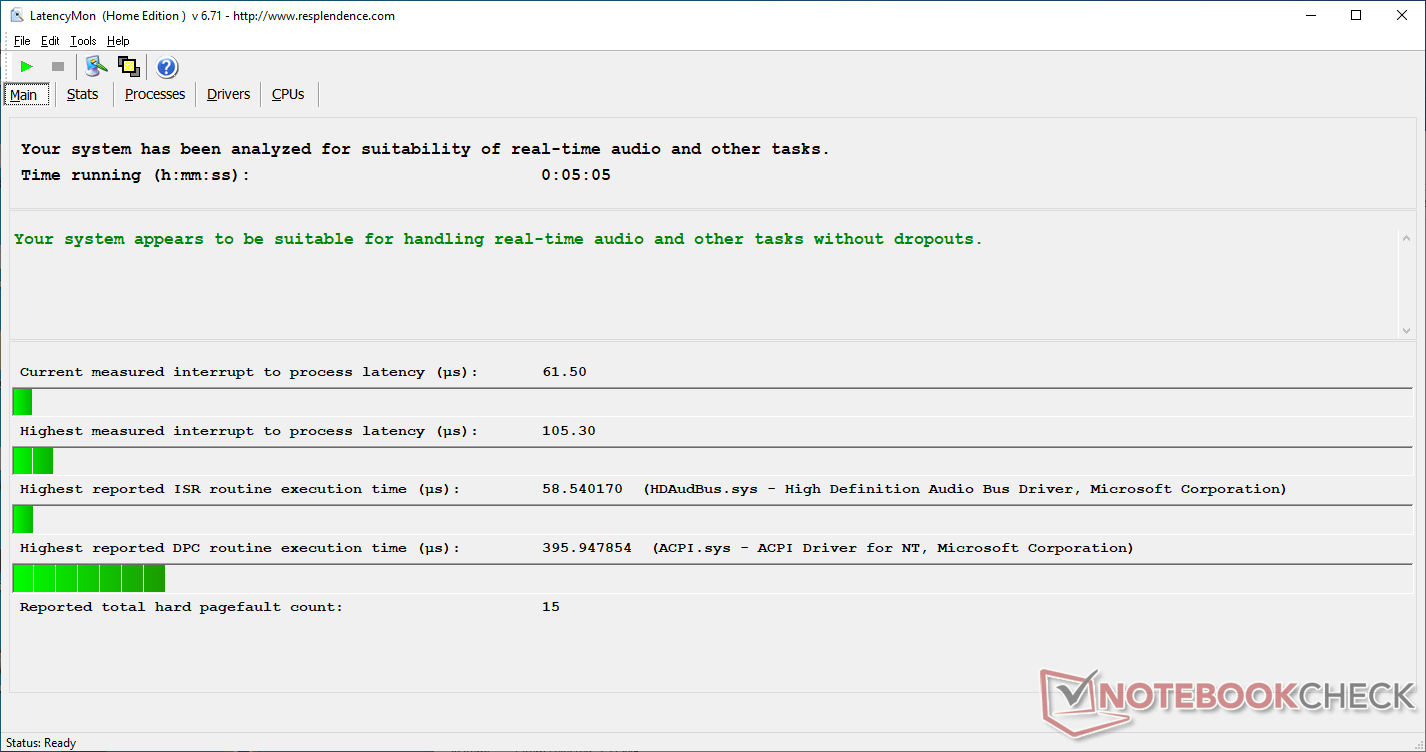
LatencyMon shows no DPC latency issues when the wireless is enabled or disabled. G-Sync is supported since there is no Optimus.
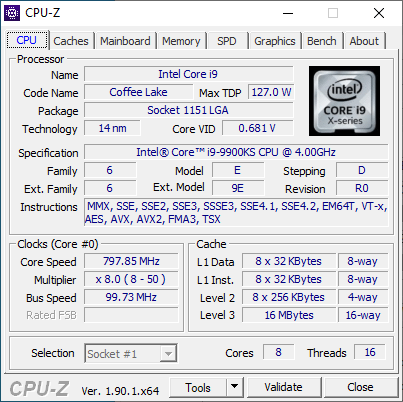
Processor
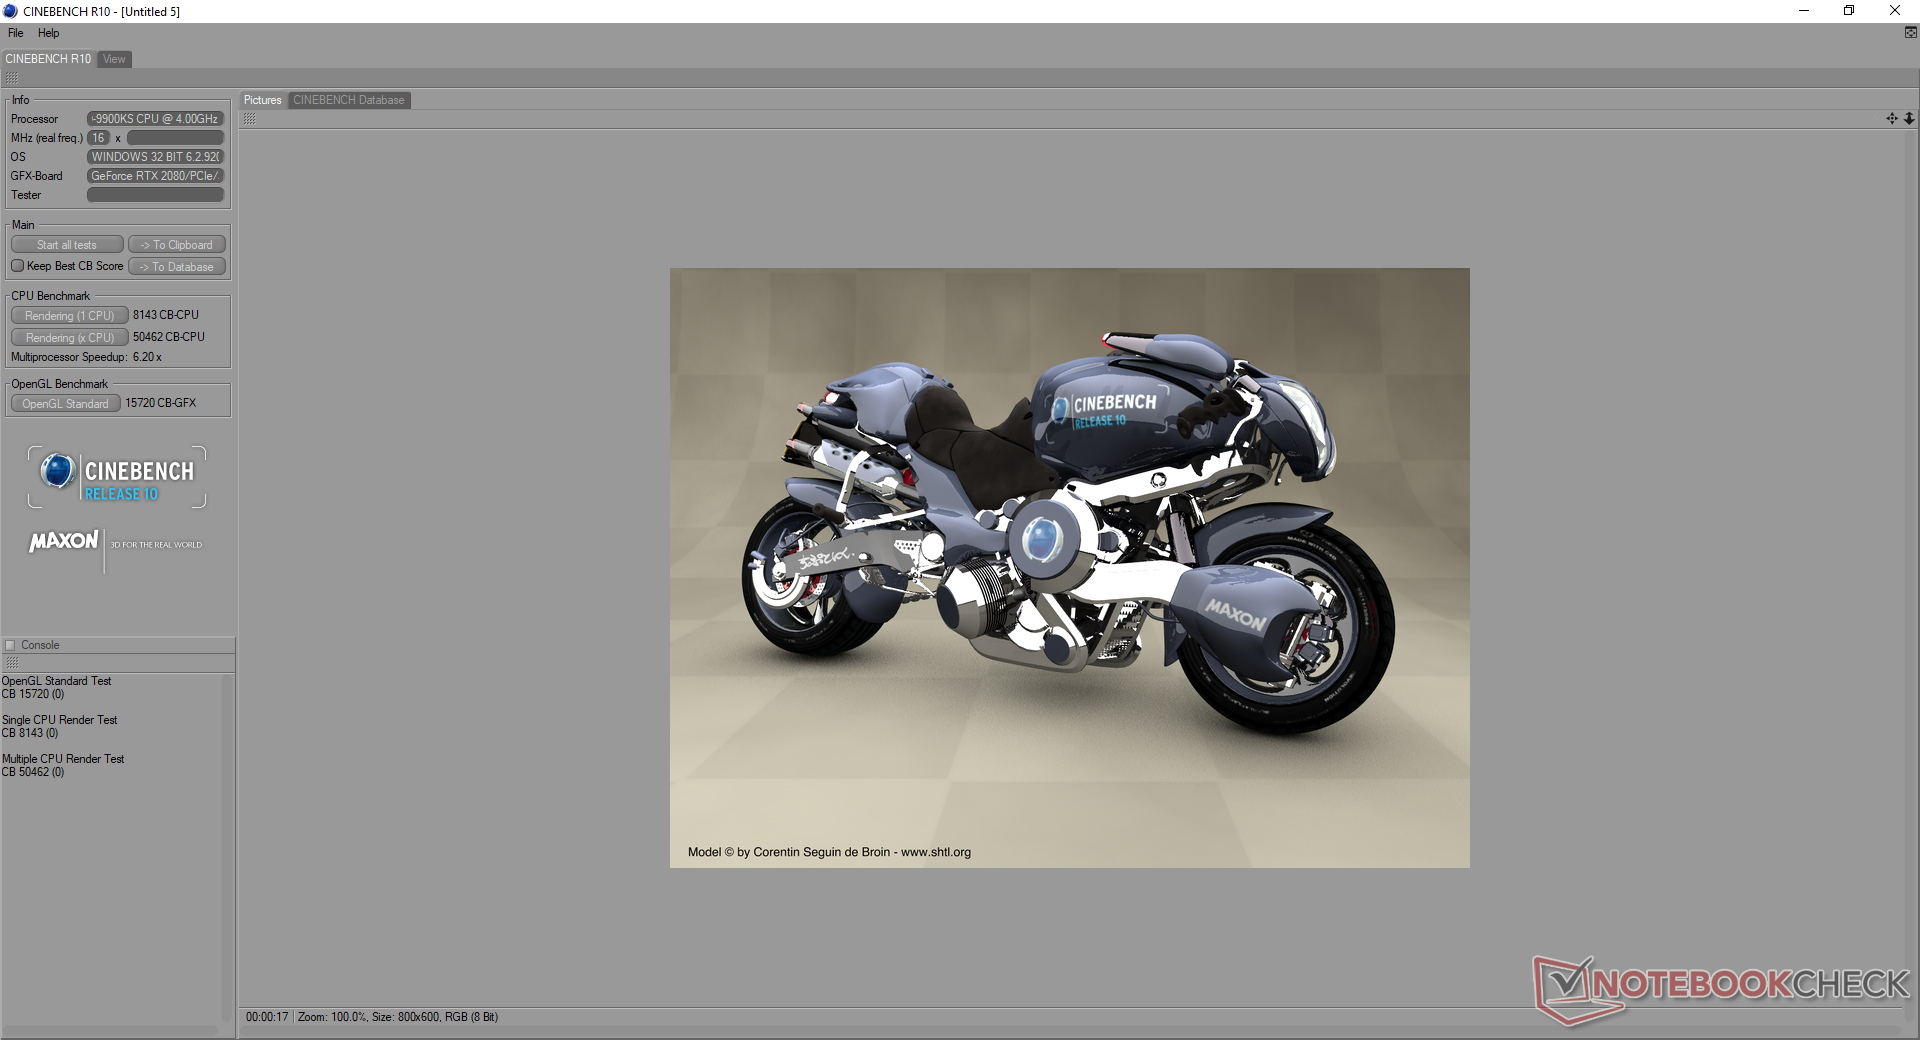
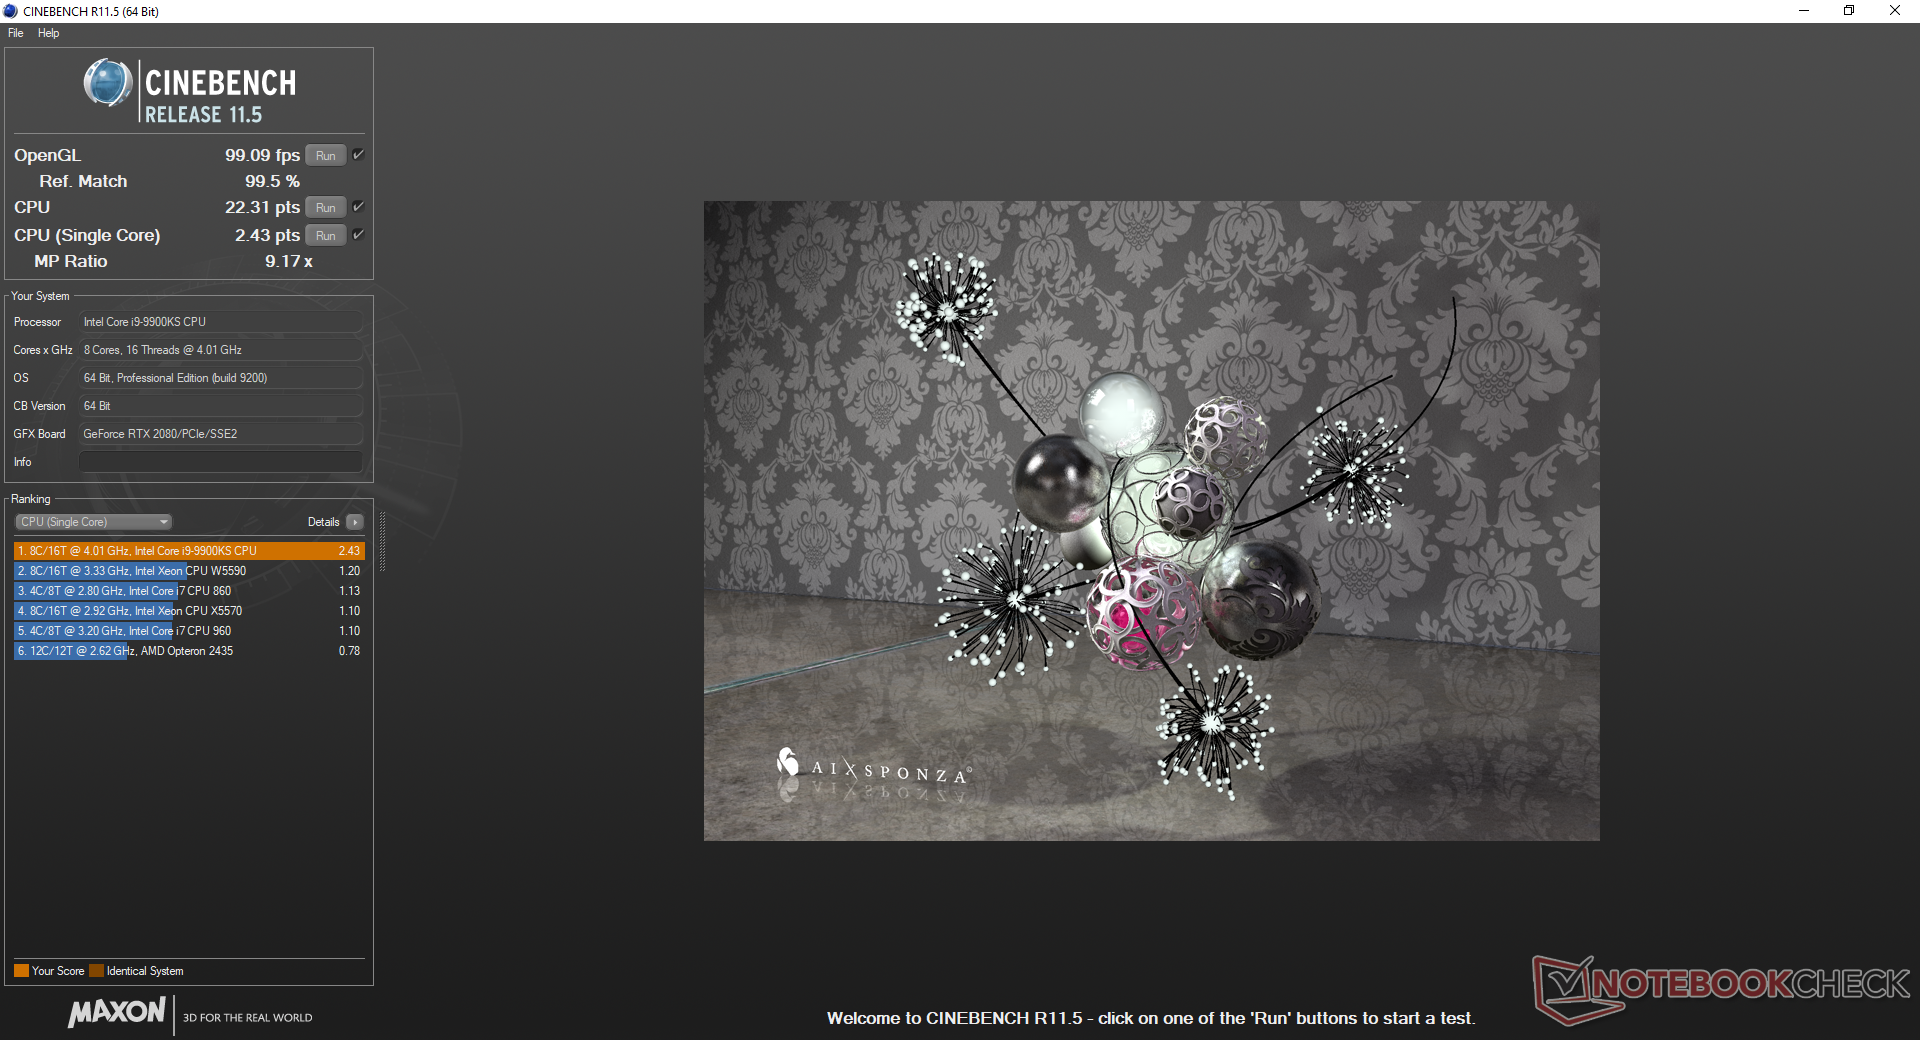
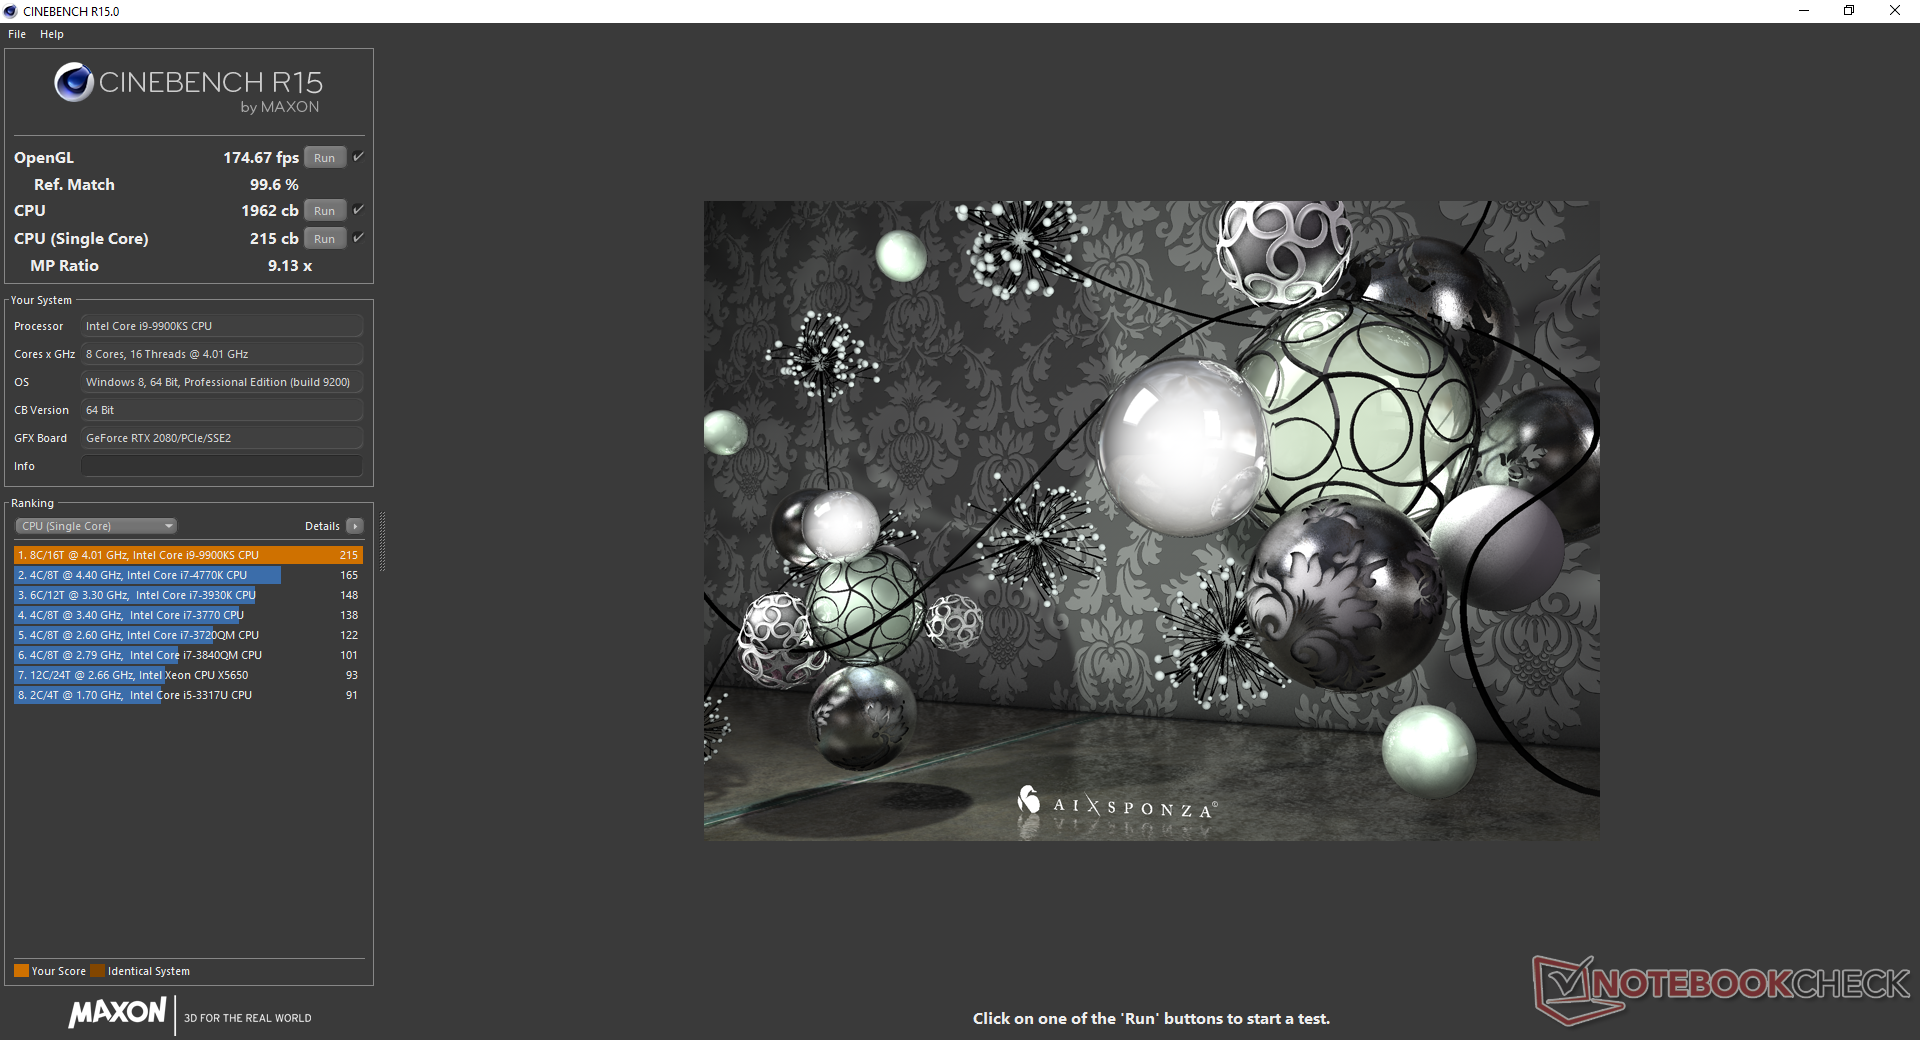
The octa-core Core i9-9900KS offers approximately 45 percent faster multi-thread performance than both the hexa-core Core i7-8700K on our older Sky X4C and the Core i9-9980HK in the latest Apple MacBook Pro 15. Nonetheless, raw performance is only within 1 to 2 percent of the Core i9-9900K. Performance sustainability is good, but we think it could be a little better; running CineBench R15 Multi-Thread in a loop results in an 8 percent dip in performance over time. The more massive MSI GT76 is able to sustain faster clock rates for longer with the "slower" Core i9-9900K as shown by our graph below.
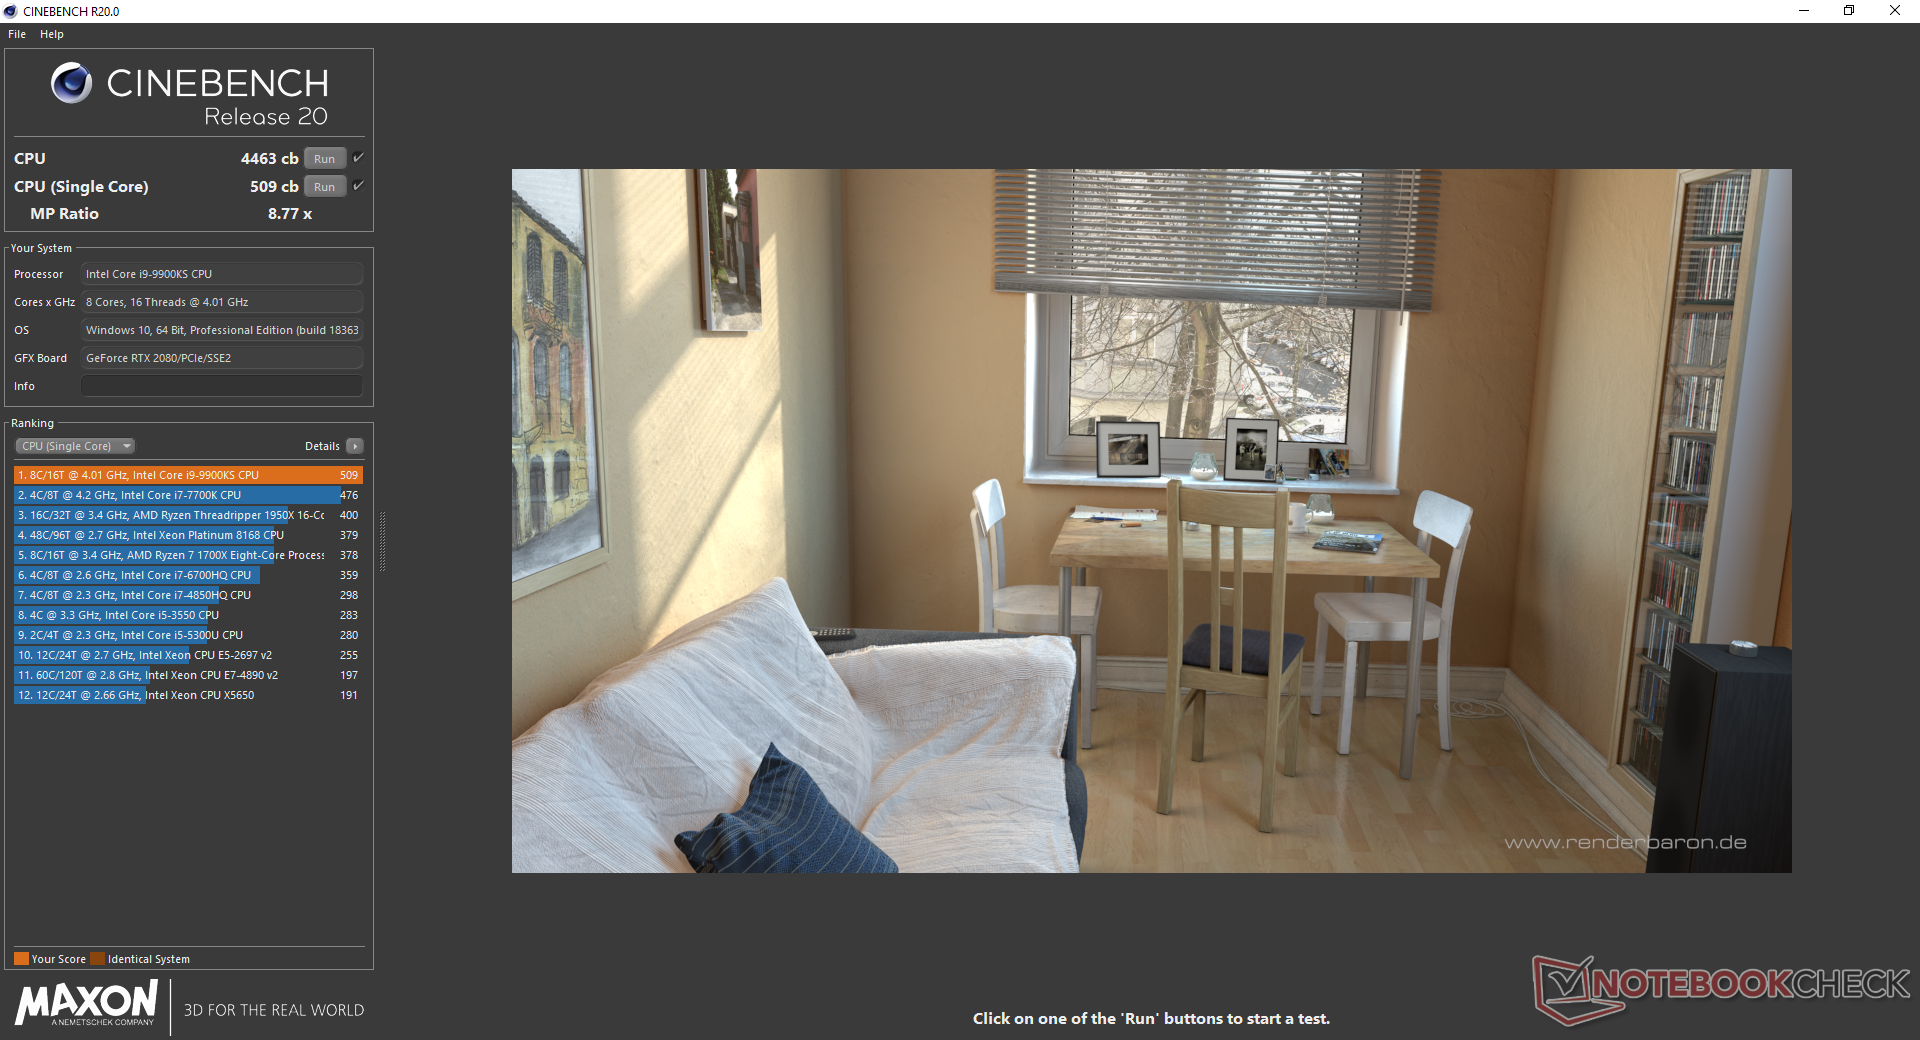
| Cinebench R20 | |
| CPU (Single Core) | |
| AMD Radeon RX Vega 64 | |
| Eurocom Sky X4C i9-9900KS | |
| Medion Erazer X15805 | |
| Apple MacBook Pro 15 2019 i9 Vega 20 | |
| MSI Prestige 15 A10SC | |
| MSI GE75 9SG | |
| Schenker Key 16 | |
| Eurocom Nightsky Ti15 | |
| AMD Ryzen 1800X - Asus Crosshair VI Hero | |
| Razer Blade Stealth i7-1065G7 Iris Plus | |
| MSI GL62M 7RD-077 | |
| CPU (Multi Core) | |
| AMD Radeon RX Vega 64 | |
| Eurocom Sky X4C i9-9900KS | |
| MSI GE75 9SG | |
| AMD Ryzen 1800X - Asus Crosshair VI Hero | |
| Apple MacBook Pro 15 2019 i9 Vega 20 | |
| Medion Erazer X15805 | |
| Eurocom Nightsky Ti15 | |
| MSI Prestige 15 A10SC | |
| Schenker Key 16 | |
| MSI GL62M 7RD-077 | |
| Razer Blade Stealth i7-1065G7 Iris Plus | |
| Cinebench R11.5 | |
| CPU Single 64Bit | |
| Eurocom Sky X4C i9-9900KS | |
| AMD Radeon RX Vega 64 | |
| Eurocom Sky X4C | |
| MSI GE75 9SG | |
| Eurocom Nightsky Ti15 | |
| AMD Ryzen 1800X - Asus Crosshair VI Hero | |
| MSI GL62M 7RD-077 | |
| Asus GL702ZC-GC104T | |
| CPU Multi 64Bit | |
| AMD Radeon RX Vega 64 | |
| Eurocom Sky X4C i9-9900KS | |
| MSI GE75 9SG | |
| AMD Ryzen 1800X - Asus Crosshair VI Hero | |
| Asus GL702ZC-GC104T | |
| Eurocom Sky X4C | |
| Eurocom Nightsky Ti15 | |
| MSI GL62M 7RD-077 | |
| Cinebench R10 | |
| Rendering Multiple CPUs 32Bit | |
| Eurocom Sky X4C i9-9900KS | |
| AMD Radeon RX Vega 64 | |
| MSI GE75 9SG | |
| Eurocom Sky X4C | |
| Medion Erazer X15805 | |
| Schenker Key 16 | |
| AMD Ryzen 1800X - Asus Crosshair VI Hero | |
| Asus GL702ZC-GC104T | |
| MSI GL62M 7RD-077 | |
| Rendering Single 32Bit | |
| Eurocom Sky X4C i9-9900KS | |
| Medion Erazer X15805 | |
| Eurocom Sky X4C | |
| MSI GE75 9SG | |
| Schenker Key 16 | |
| AMD Radeon RX Vega 64 | |
| MSI GL62M 7RD-077 | |
| AMD Ryzen 1800X - Asus Crosshair VI Hero | |
| Asus GL702ZC-GC104T | |
| wPrime 2.10 - 1024m | |
| Eurocom Sky X4C | |
| MSI GE75 9SG | |
| AMD Ryzen 1800X - Asus Crosshair VI Hero | |
| Eurocom Sky X4C i9-9900KS | |
| AMD Radeon RX Vega 64 | |
| X264 HD Benchmark 4.0 | |
| Pass 2 | |
| AMD Radeon RX Vega 64 | |
| Eurocom Sky X4C i9-9900KS | |
| MSI GE75 9SG | |
| Asus GL702ZC-GC104T | |
| AMD Ryzen 1800X - Asus Crosshair VI Hero | |
| Pass 1 | |
| Eurocom Sky X4C i9-9900KS | |
| AMD Radeon RX Vega 64 | |
| MSI GE75 9SG | |
| AMD Ryzen 1800X - Asus Crosshair VI Hero | |
| Asus GL702ZC-GC104T | |
| WinRAR - Result | |
| Eurocom Sky X4C i9-9900KS | |
| AMD Radeon RX Vega 64 | |
| MSI GE75 9SG | |
| AMD Ryzen 1800X - Asus Crosshair VI Hero | |
| Asus GL702ZC-GC104T | |
| TrueCrypt | |
| Serpent Mean 100MB | |
| AMD Radeon RX Vega 64 | |
| Eurocom Sky X4C i9-9900KS | |
| Asus GL702ZC-GC104T | |
| Eurocom Sky X4C | |
| MSI GE75 9SG | |
| Twofish Mean 100MB | |
| AMD Radeon RX Vega 64 | |
| Eurocom Sky X4C i9-9900KS | |
| AMD Ryzen 1800X - Asus Crosshair VI Hero | |
| Asus GL702ZC-GC104T | |
| Eurocom Sky X4C | |
| MSI GE75 9SG | |
| AES Mean 100MB | |
| Eurocom Sky X4C i9-9900KS | |
| AMD Radeon RX Vega 64 | |
| AMD Ryzen 1800X - Asus Crosshair VI Hero | |
| MSI GE75 9SG | |
| Eurocom Sky X4C | |
| Asus GL702ZC-GC104T | |
| Geekbench 4.0 | |
| Compute OpenCL Score | |
| Eurocom Sky X4C i9-9900KS | |
| MSI GL62M 7RD-077 | |
| 64 Bit Multi-Core Score | |
| Eurocom Sky X4C i9-9900KS | |
| AMD Ryzen 1800X - Asus Crosshair VI Hero | |
| MSI GL62M 7RD-077 | |
| 64 Bit Single-Core Score | |
| Eurocom Sky X4C i9-9900KS | |
| AMD Ryzen 1800X - Asus Crosshair VI Hero | |
| MSI GL62M 7RD-077 | |
| Blender - v2.79 BMW27 CPU | |
| MSI GE75 9SG | |
| AMD Ryzen 1800X - Asus Crosshair VI Hero | |
| Eurocom Sky X4C i9-9900KS | |
| AMD Radeon RX Vega 64 | |
| 7-Zip 18.03 | |
| 7z b 4 | |
| AMD Radeon RX Vega 64 | |
| Eurocom Sky X4C i9-9900KS | |
| MSI GE75 9SG | |
| 7z b 4 -mmt1 | |
| Eurocom Sky X4C i9-9900KS | |
| AMD Radeon RX Vega 64 | |
| MSI GE75 9SG | |
| HWBOT x265 Benchmark v2.2 - 4k Preset | |
| AMD Radeon RX Vega 64 | |
| Eurocom Sky X4C i9-9900KS | |
| MSI GE75 9SG | |
| MSI GL62M 7RD-077 | |
* ... smaller is better
System Performance
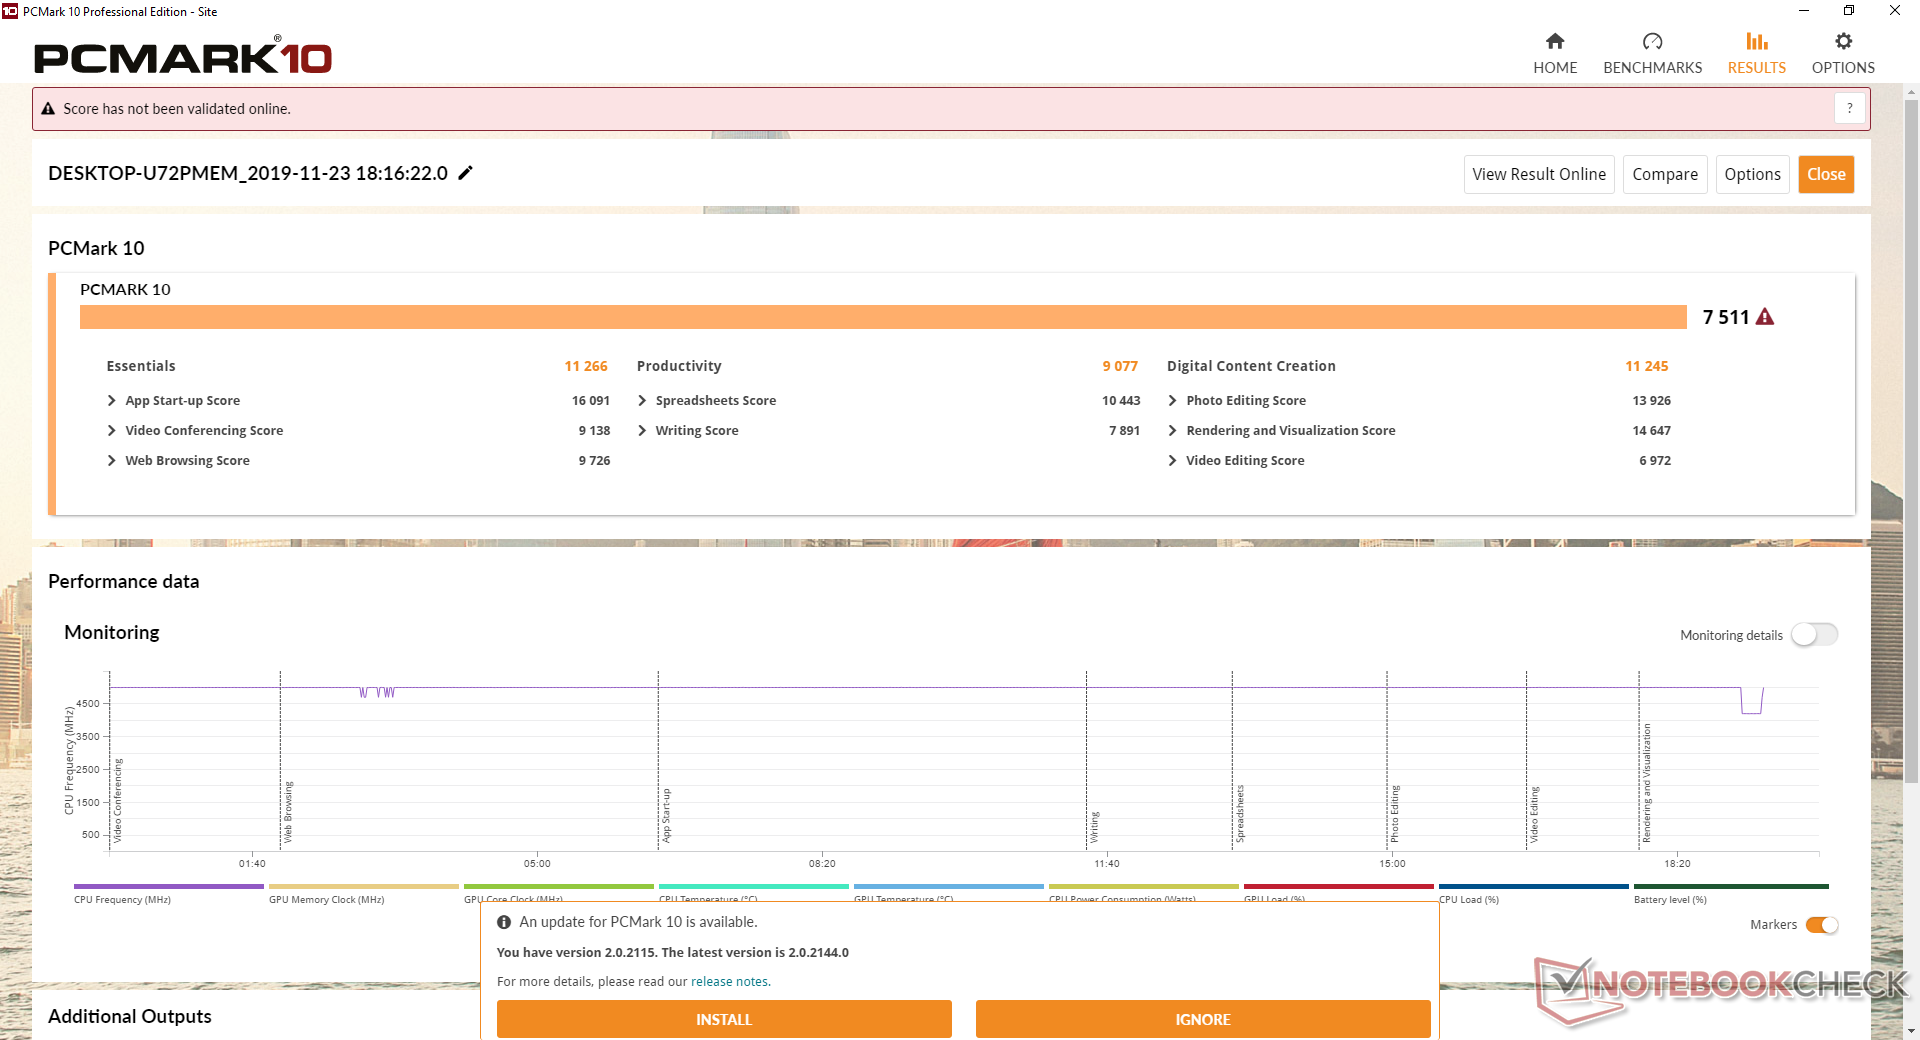
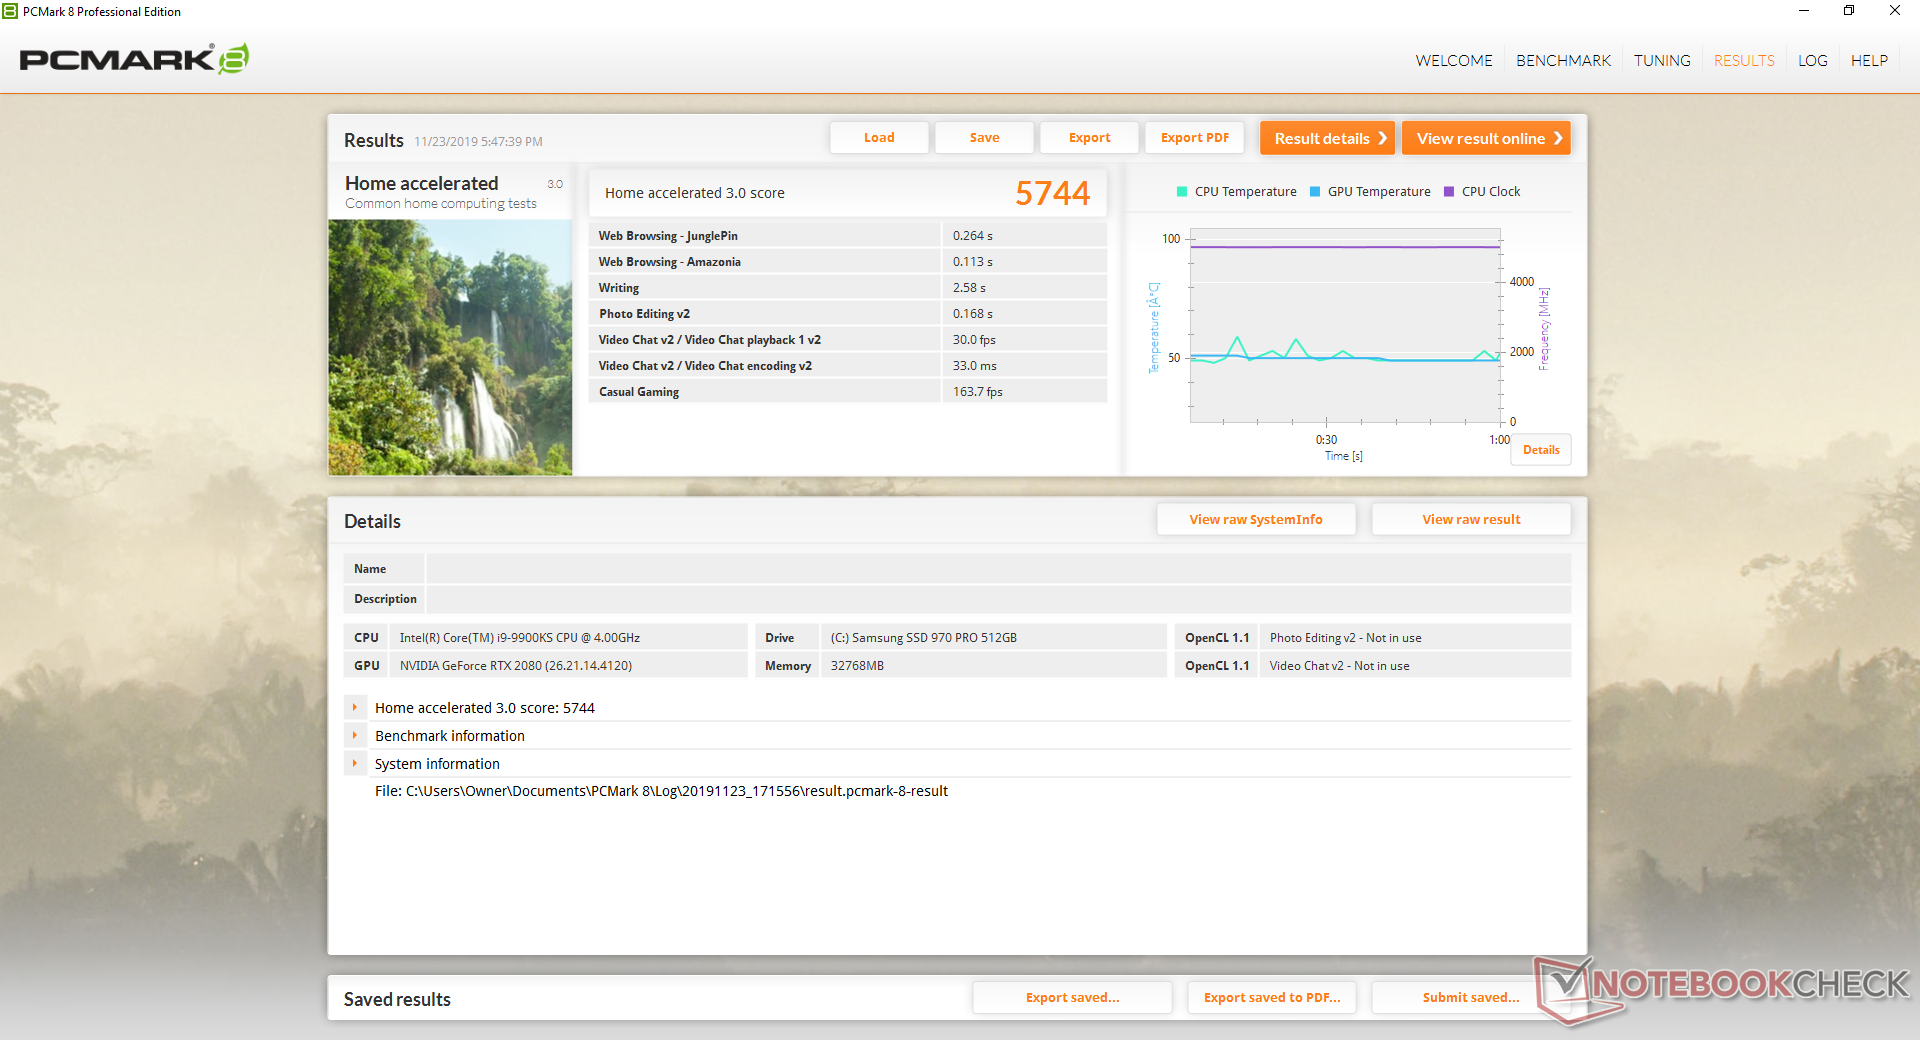
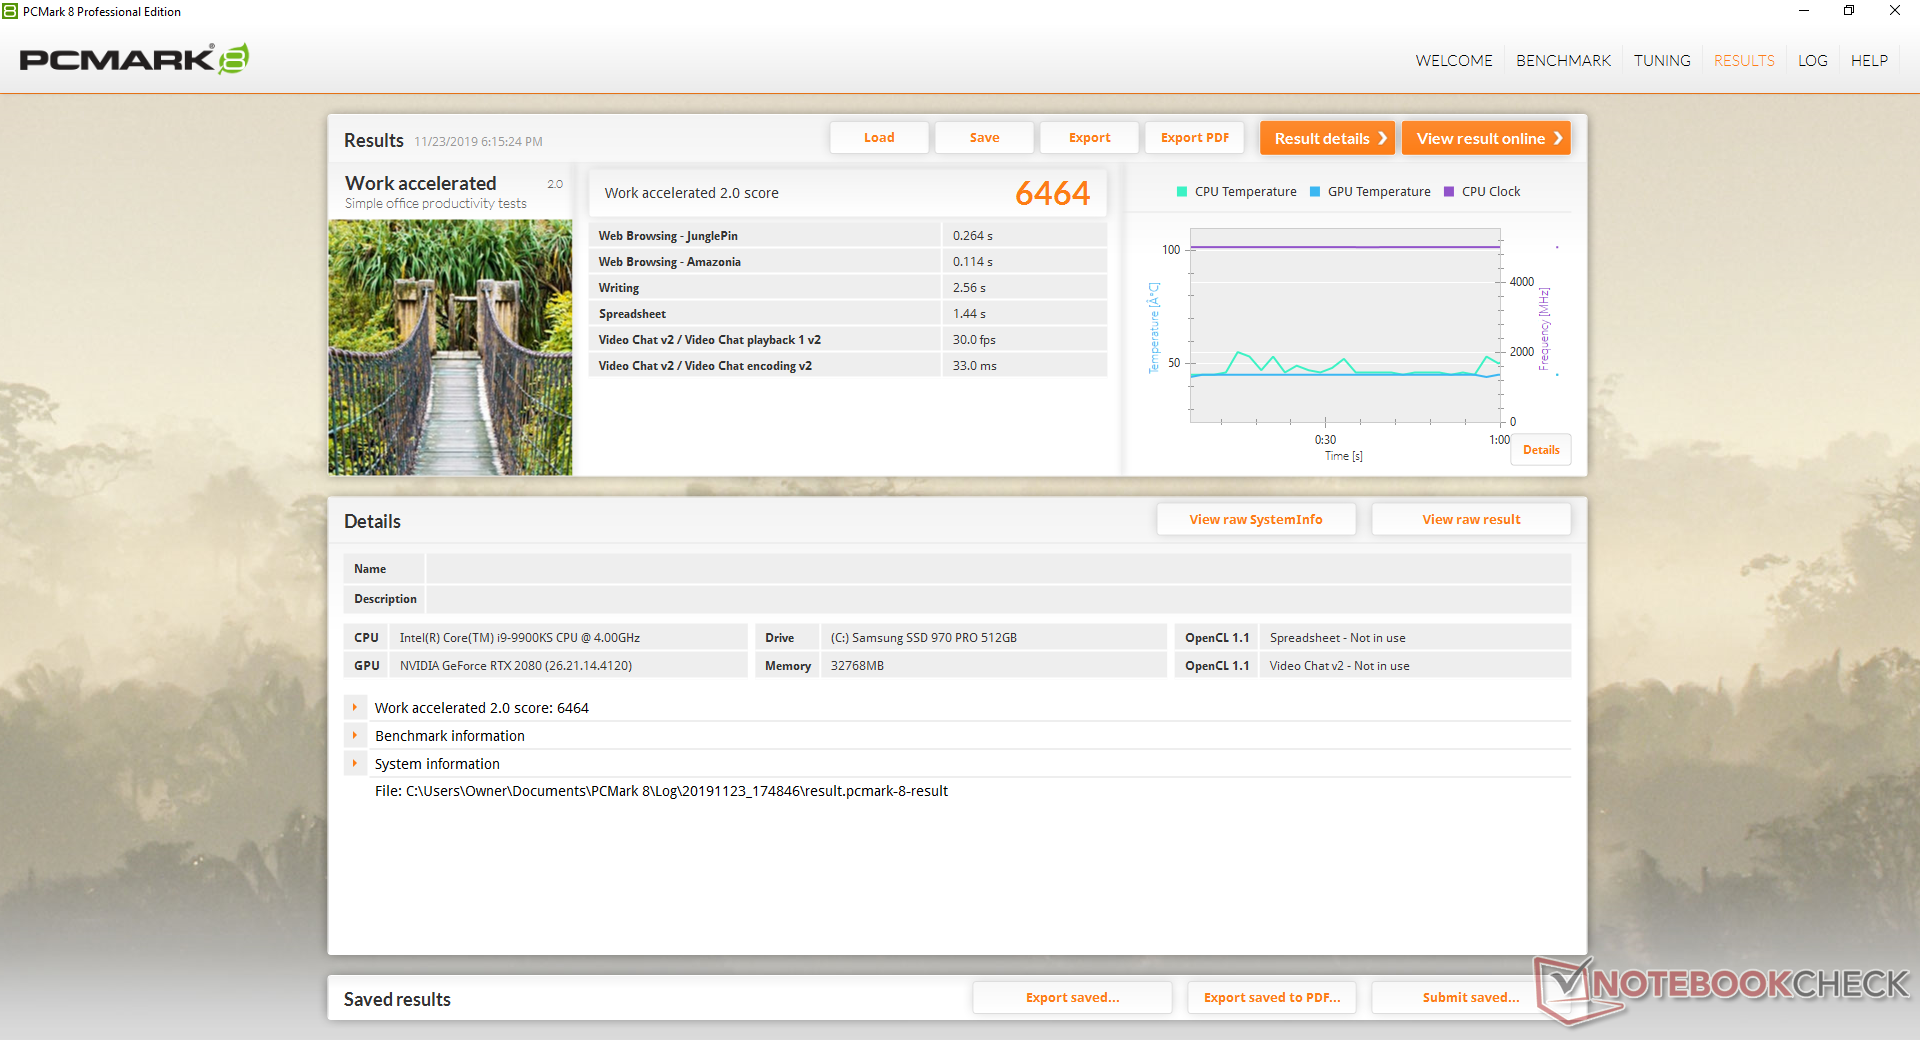
Eurocom laptops have some of the highest PCMark scores in our database and the X4C is no different. In fact, it currently has the highest PCMark 10 score at 7511 points compared to 7151 points on the Sky X7C. We experienced no software or hardware issues during our time with the test unit.
| PCMark 8 | |
| Home Score Accelerated v2 | |
| Eurocom Sky X4C i9-9900KS | |
| Eurocom Sky X7C i9-9900K | |
| Alienware Area-51m i9-9900K RTX 2080 | |
| Asus GL702ZC-GC104T | |
| Work Score Accelerated v2 | |
| Eurocom Sky X4C i9-9900KS | |
| Eurocom Sky X7C i9-9900K | |
| Alienware Area-51m i9-9900K RTX 2080 | |
| Asus GL702ZC-GC104T | |
| PCMark 8 Home Score Accelerated v2 | 5744 points | |
| PCMark 8 Work Score Accelerated v2 | 6464 points | |
| PCMark 10 Score | 7511 points | |
Help | ||
Storage Devices
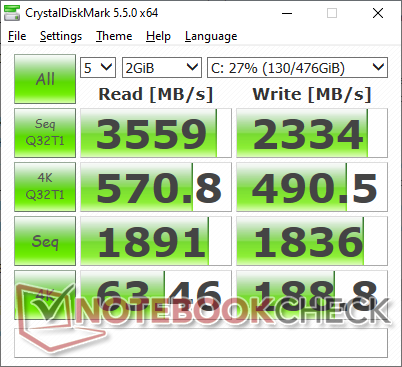
A total of four internal storage bays (2x M.2 2280 + 2x 2.5-inch SATA III) are available. Our test unit comes with the NVMe Samsung SSD 970 Pro compared to the NVMe Samsung SSD 960 Pro on our 2018 Sky X4C for faster read performances.
See our table of HDDs and SSDs for more benchmark comparisons.
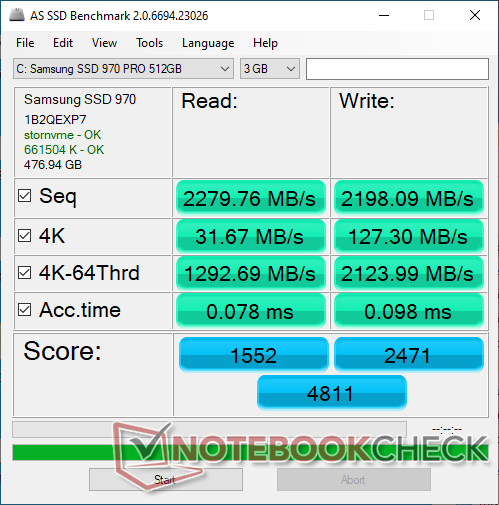
| Eurocom Sky X4C i9-9900KS Samsung SSD 970 Pro 512GB | MSI GE63VR 7RF Raider Toshiba HG6 THNSNJ256G8NY | Asus Strix Scar III G531GW-AZ062T Intel SSD 660p SSDPEKNW512G8 | Lenovo Legion Y740-15ICHg WDC PC SN520 SDAPMUW-128G | MSI GT63 Titan 8RG-046 CUK Cyclone 500GB M.2 NVMe | Eurocom Sky X4C Samsung SSD 960 Pro 1TB m.2 NVMe | |
|---|---|---|---|---|---|---|
| AS SSD | -64% | -54% | -50% | -8% | 3% | |
| Seq Read (MB/s) | 2280 | 506 -78% | 1163 -49% | 1372 -40% | 2399 5% | 2541 11% |
| Seq Write (MB/s) | 2198 | 447 -80% | 919 -58% | 746 -66% | 1665 -24% | 1989 -10% |
| 4K Read (MB/s) | 31.67 | 19.55 -38% | 48.88 54% | 35.42 12% | 49.17 55% | 44.83 42% |
| 4K Write (MB/s) | 127.3 | 77.3 -39% | 90.1 -29% | 99.9 -22% | 87.7 -31% | 129.6 2% |
| 4K-64 Read (MB/s) | 1293 | 350.3 -73% | 323.8 -75% | 302.1 -77% | 1144 -12% | 1646 27% |
| 4K-64 Write (MB/s) | 2124 | 170.6 -92% | 403.8 -81% | 191.4 -91% | 648 -69% | 1375 -35% |
| Access Time Read * (ms) | 0.078 | 0.168 -115% | 0.24 -208% | 0.132 -69% | 0.05 36% | 0.032 59% |
| Access Time Write * (ms) | 0.098 | 0.045 54% | 0.046 53% | 0.037 62% | 0.042 57% | 0.03 69% |
| Score Read (Points) | 1552 | 420 -73% | 489 -68% | 475 -69% | 1433 -8% | 1945 25% |
| Score Write (Points) | 2471 | 293 -88% | 586 -76% | 366 -85% | 902 -63% | 1703 -31% |
| Score Total (Points) | 4811 | 930 -81% | 1332 -72% | 1065 -78% | 3040 -37% | 4615 -4% |
| Copy ISO MB/s (MB/s) | 3007 | 1269 -58% | 1062 -65% | 1908 -37% | ||
| Copy Program MB/s (MB/s) | 731 | 452.8 -38% | 426 -42% | 467.2 -36% | ||
| Copy Game MB/s (MB/s) | 1756 | 755 -57% | 650 -63% | 1055 -40% |
* ... smaller is better

GPU Performance
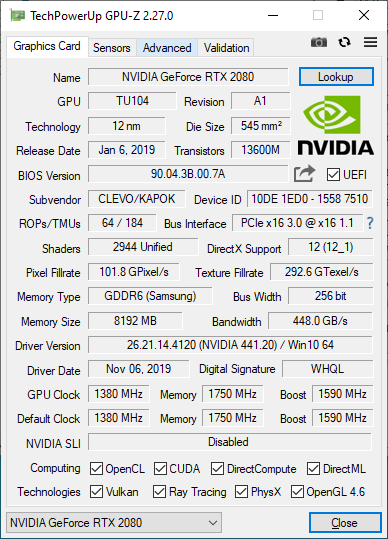
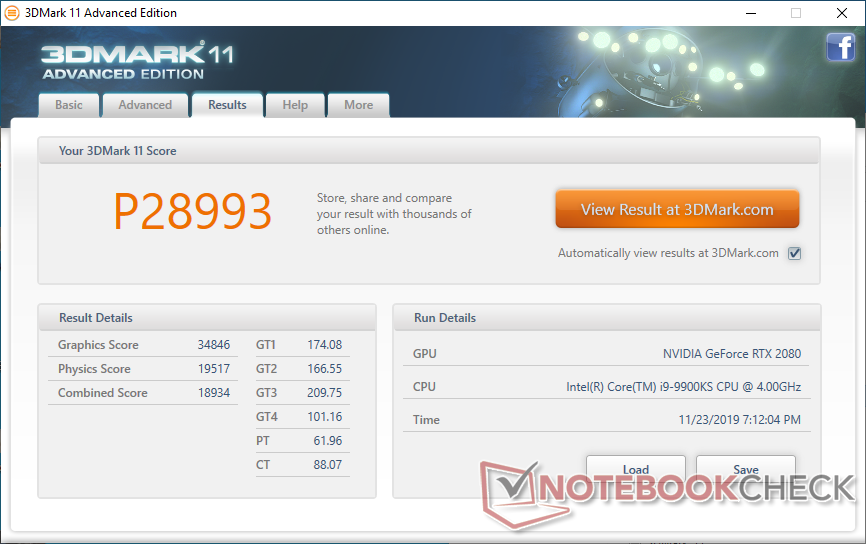
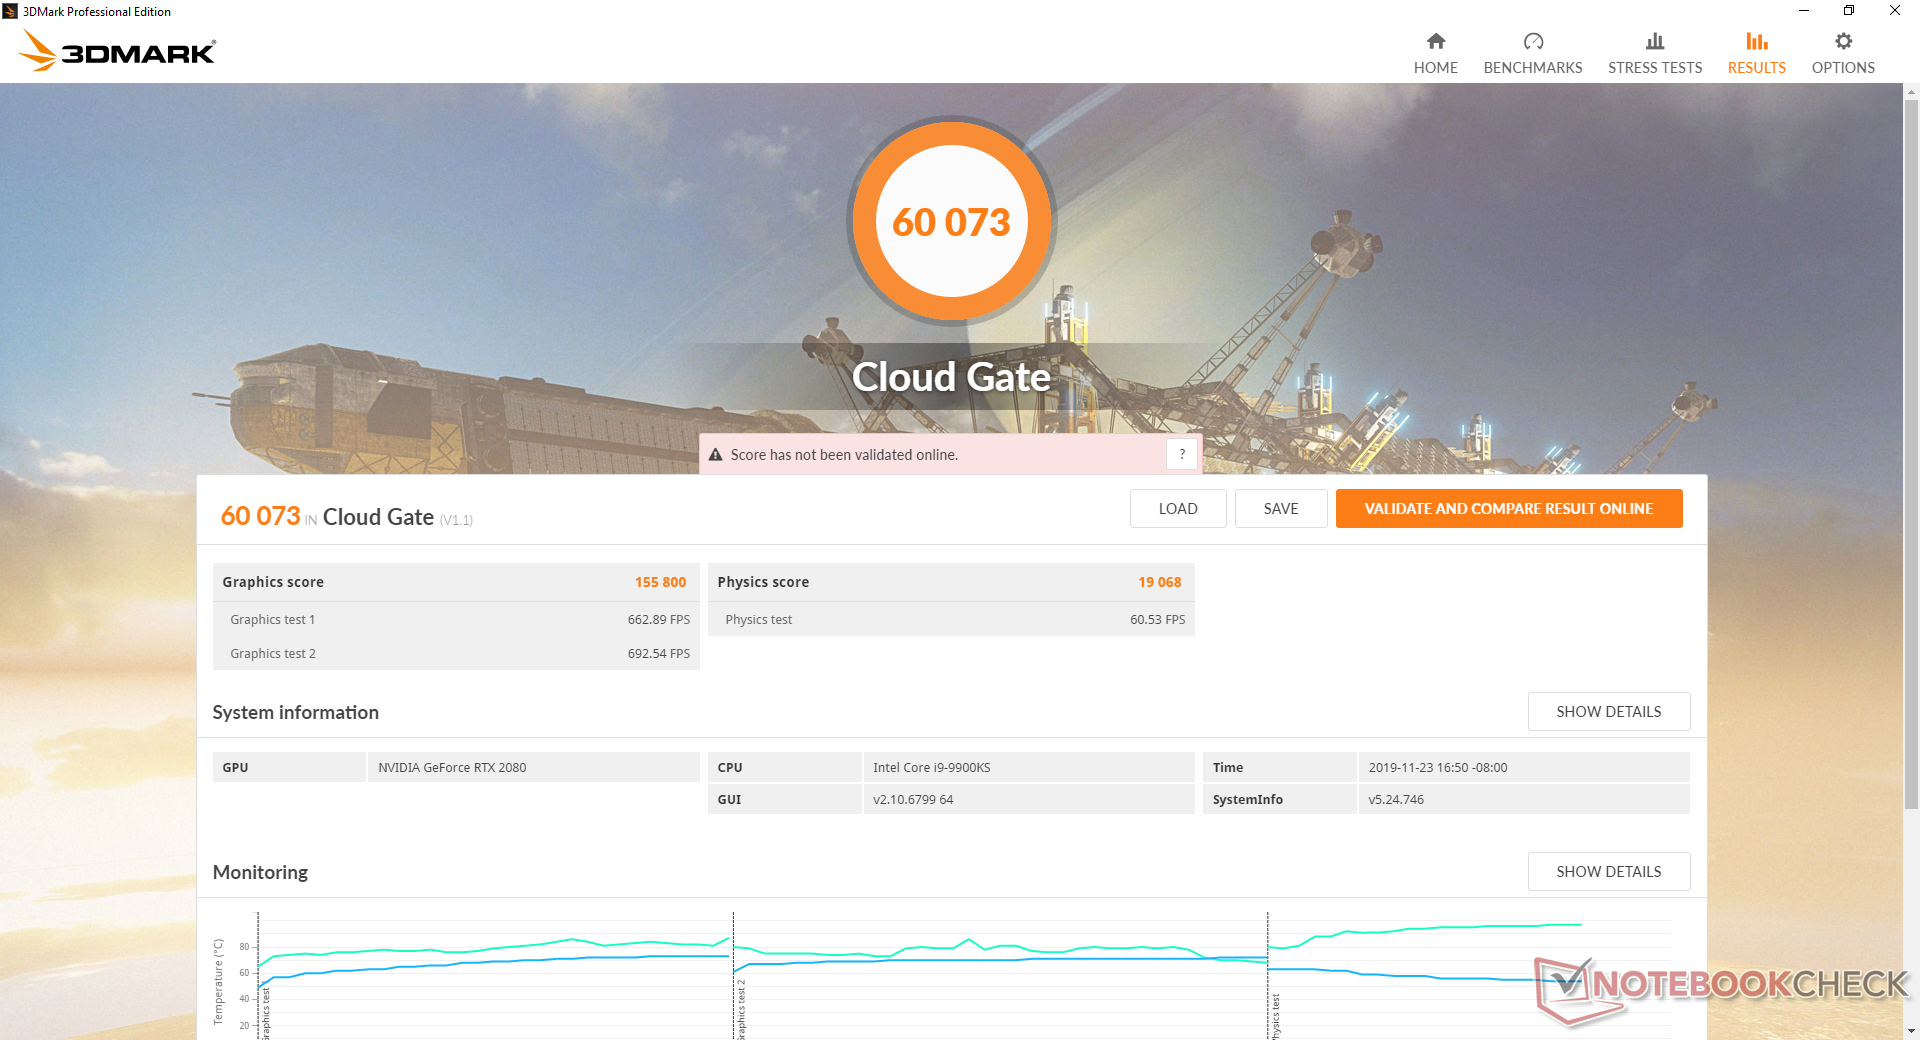
At stock, the GeForce RTX 2080 in our Eurocom is about 6 to 8 percent slower than the same GPU in the overclocked Dell Alienware Area-51m. A "proper" desktop RTX 2080 can offer about 8 to 15 percent faster performance than our Eurocom GPU.
See our dedicated page on the mobile GeForce RTX 2080 for more technical information and benchmark comparisons. Nvidia is expected to launch mobile Super options for laptops in 2020.
| 3DMark 06 Standard Score | 47829 points | |
| 3DMark 11 Performance | 28993 points | |
| 3DMark Cloud Gate Standard Score | 60073 points | |
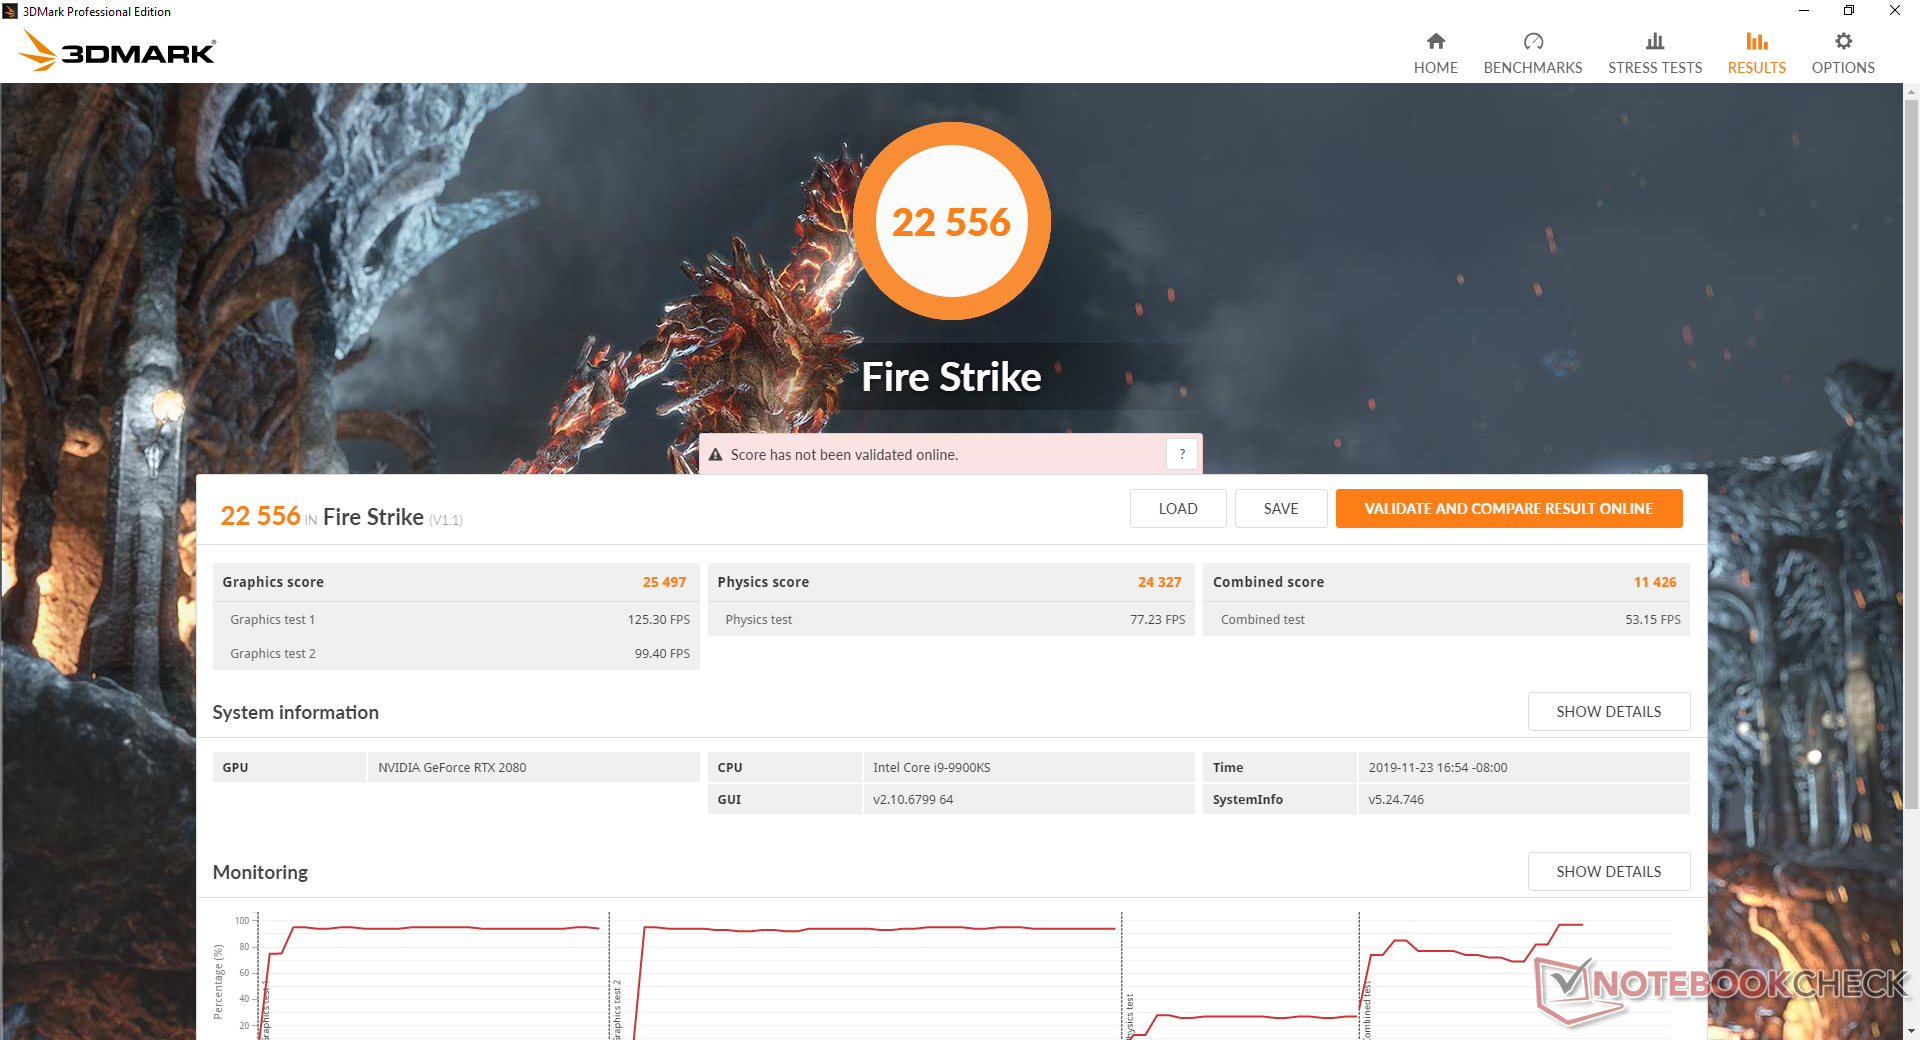
| 3DMark Fire Strike Score | 22556 points | |
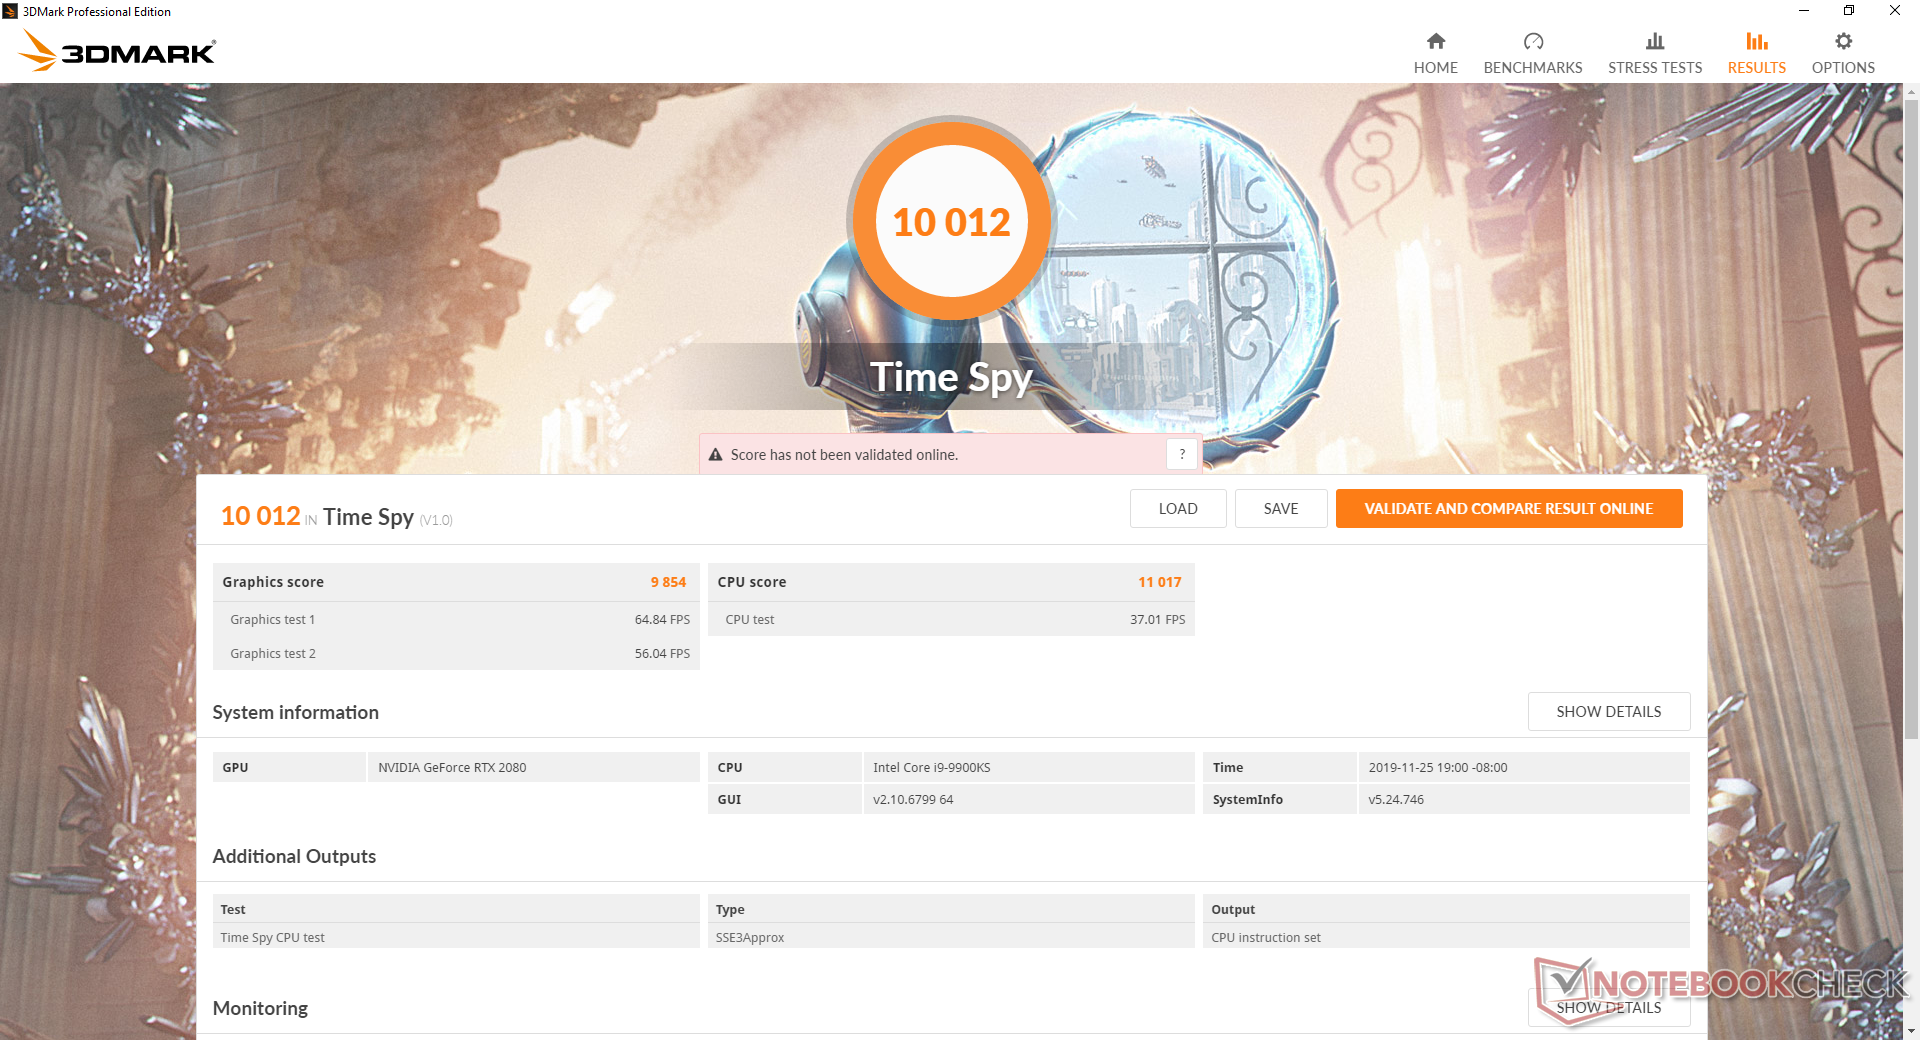
| 3DMark Time Spy Score | 10012 points | |
Help | ||
| low | med. | high | ultra | |
|---|---|---|---|---|
| BioShock Infinite (2013) | 528 | 443.5 | 408.6 | 208.2 |
| The Witcher 3 (2015) | 414.3 | 284.2 | 175.9 | 95.5 |
| Shadow of the Tomb Raider (2018) | 178 | 141 | 134 | 124 |
Emissions
System Noise
It would be unrealistic to expect quiet fans considering the 15.6-inch form factor and high-end components inside. When running demanding loads like games, fan noise can be as high as 55 to 59 dB(A) to be louder than most gaming laptops and on par with the MSI GT76 Titan. Even the Alienware Area-51m with the i9-9900K and overclocked RTX 2080 runs quieter (51 dB(A)) when under similar conditions.
The good news, however, is that the Eurocom is quiet when you expect it to be quiet and it's only loud when you expect it to be loud. For example, fan noise during low loads like web browsing or video streaming top out at only 31.7 dB(A). The fans may pulse occasionally, but these are short-lived and not bothersome. Only when running very demanding loads will the fans begin to ramp up exponentially in noise.
We can notice no coil whine or electronic noise from our test unit.
| Eurocom Sky X4C i9-9900KS GeForce RTX 2080 Mobile, i9-9900KS, Samsung SSD 970 Pro 512GB | Eurocom Sky X7C i9-9900K GeForce RTX 2080 Mobile, i9-9900K, 2x Samsung SSD 970 Pro 512GB (RAID 0) | MSI GT76 Titan DT 9SG GeForce RTX 2080 Mobile, i9-9900K, 2x Samsung PM961 MZVLW256HEHP (RAID 0) | Alienware Area-51m i9-9900K RTX 2080 GeForce RTX 2080 Mobile, i9-9900K, 2x SK Hynix PC400 512GB (RAID 0) | Asus GL702ZC-GC104T Radeon RX 580 (Laptop), R7 1700, SanDisk SD8SN8U256G1002 | Asus Strix Scar III G531GW-AZ062T GeForce RTX 2070 Mobile, i7-9750H, Intel SSD 660p SSDPEKNW512G8 | |
|---|---|---|---|---|---|---|
| Noise | -2% | -19% | -16% | -17% | -6% | |
| off / environment * (dB) | 28.1 | 28.9 -3% | 30 -7% | 28.1 -0% | 31 -10% | 30 -7% |
| Idle Minimum * (dB) | 28.5 | 29.7 -4% | 33 -16% | 28.1 1% | 32 -12% | 30.6 -7% |
| Idle Average * (dB) | 28.7 | 29.7 -3% | 34 -18% | 28.6 -0% | 38 -32% | 30.6 -7% |
| Idle Maximum * (dB) | 29.5 | 30 -2% | 44 -49% | 51 -73% | 40 -36% | 37.7 -28% |
| Load Average * (dB) | 31.2 | 36.5 -17% | 47 -51% | 51 -63% | 42 -35% | 36.5 -17% |
| Witcher 3 ultra * (dB) | 55.1 | 49 11% | 53 4% | 51 7% | 54 2% | 52.1 5% |
| Load Maximum * (dB) | 59.3 | 57 4% | 59 1% | 51 14% | 57 4% | 48.1 19% |
* ... smaller is better
Noise level
| Idle |
| 28.5 / 28.7 / 29.5 dB(A) |
| Load |
| 31.2 / 59.3 dB(A) |
 | ||
30 dB silent 40 dB(A) audible 50 dB(A) loud |
||
min: | ||
Temperature
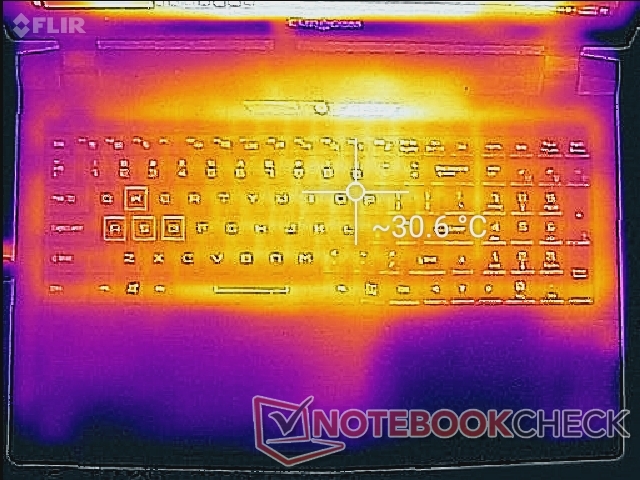
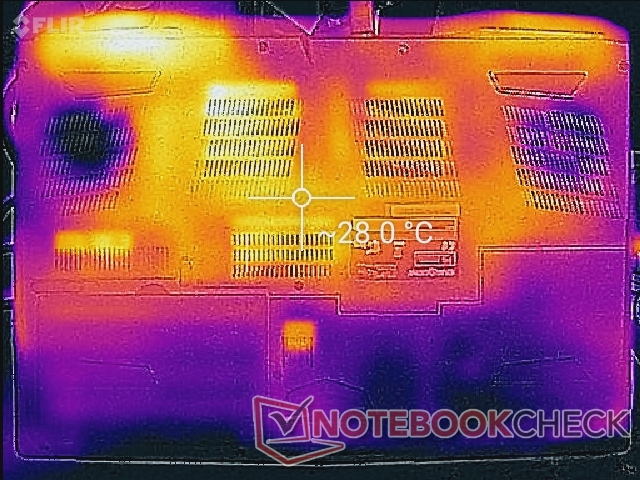
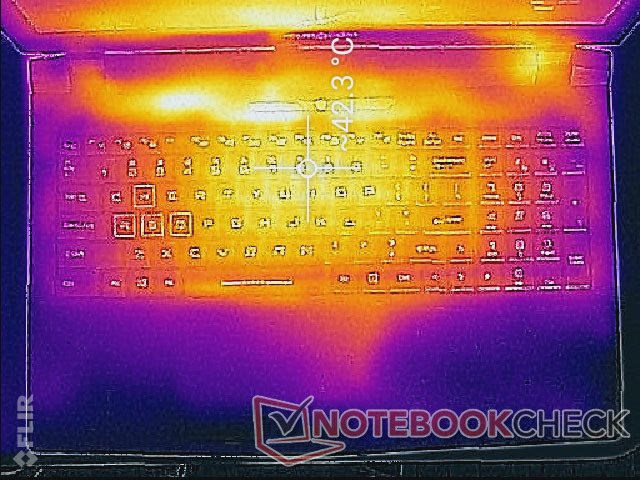
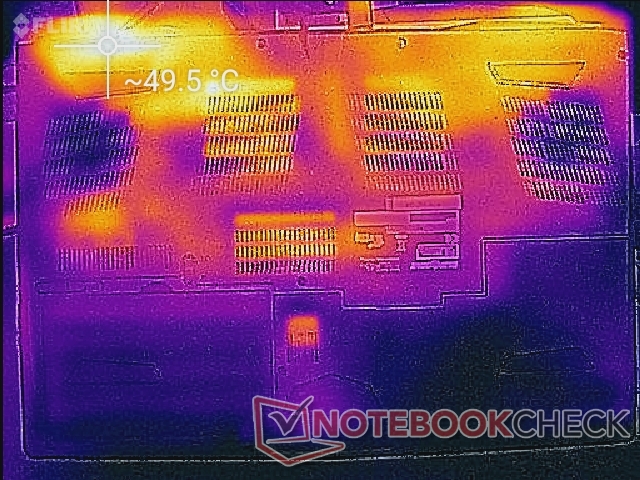
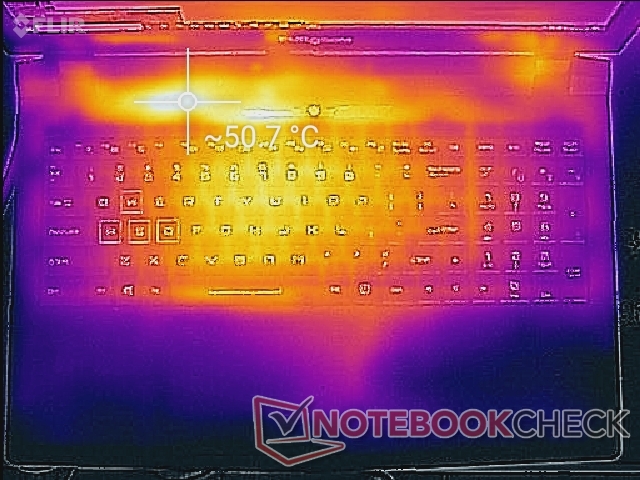
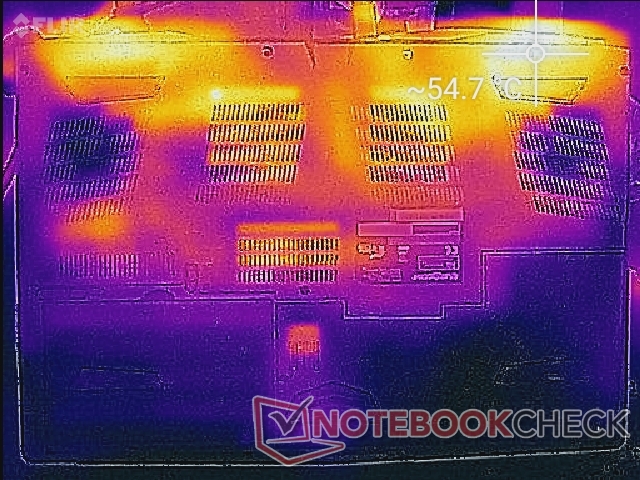
Surface temperatures are never uncomfortabe despite the fast components inside. At worst, hot spots can become as warm as 51 C when under high processing stress. These spots are thankfully above the first row of keyboard keys where users are unlikely to touch. The middle of the keyboard can become as warm 42 C while the palm rests, WASD keys, NumPad, and touchpad remain relatively cool.
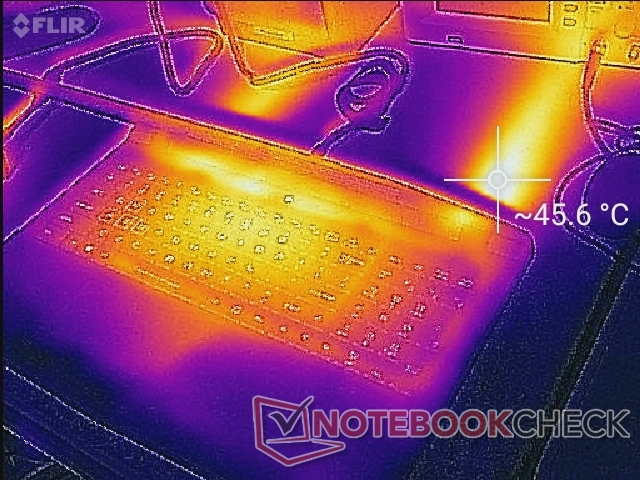
(-) The maximum temperature on the upper side is 51.6 °C / 125 F, compared to the average of 40.4 °C / 105 F, ranging from 21.2 to 68.8 °C for the class Gaming.
(-) The bottom heats up to a maximum of 54.6 °C / 130 F, compared to the average of 43.2 °C / 110 F
(+) In idle usage, the average temperature for the upper side is 27.7 °C / 82 F, compared to the device average of 33.9 °C / 93 F.
(±) Playing The Witcher 3, the average temperature for the upper side is 33.1 °C / 92 F, compared to the device average of 33.9 °C / 93 F.
(+) The palmrests and touchpad are cooler than skin temperature with a maximum of 28.8 °C / 83.8 F and are therefore cool to the touch.
(±) The average temperature of the palmrest area of similar devices was 28.8 °C / 83.8 F (0 °C / 0 F).
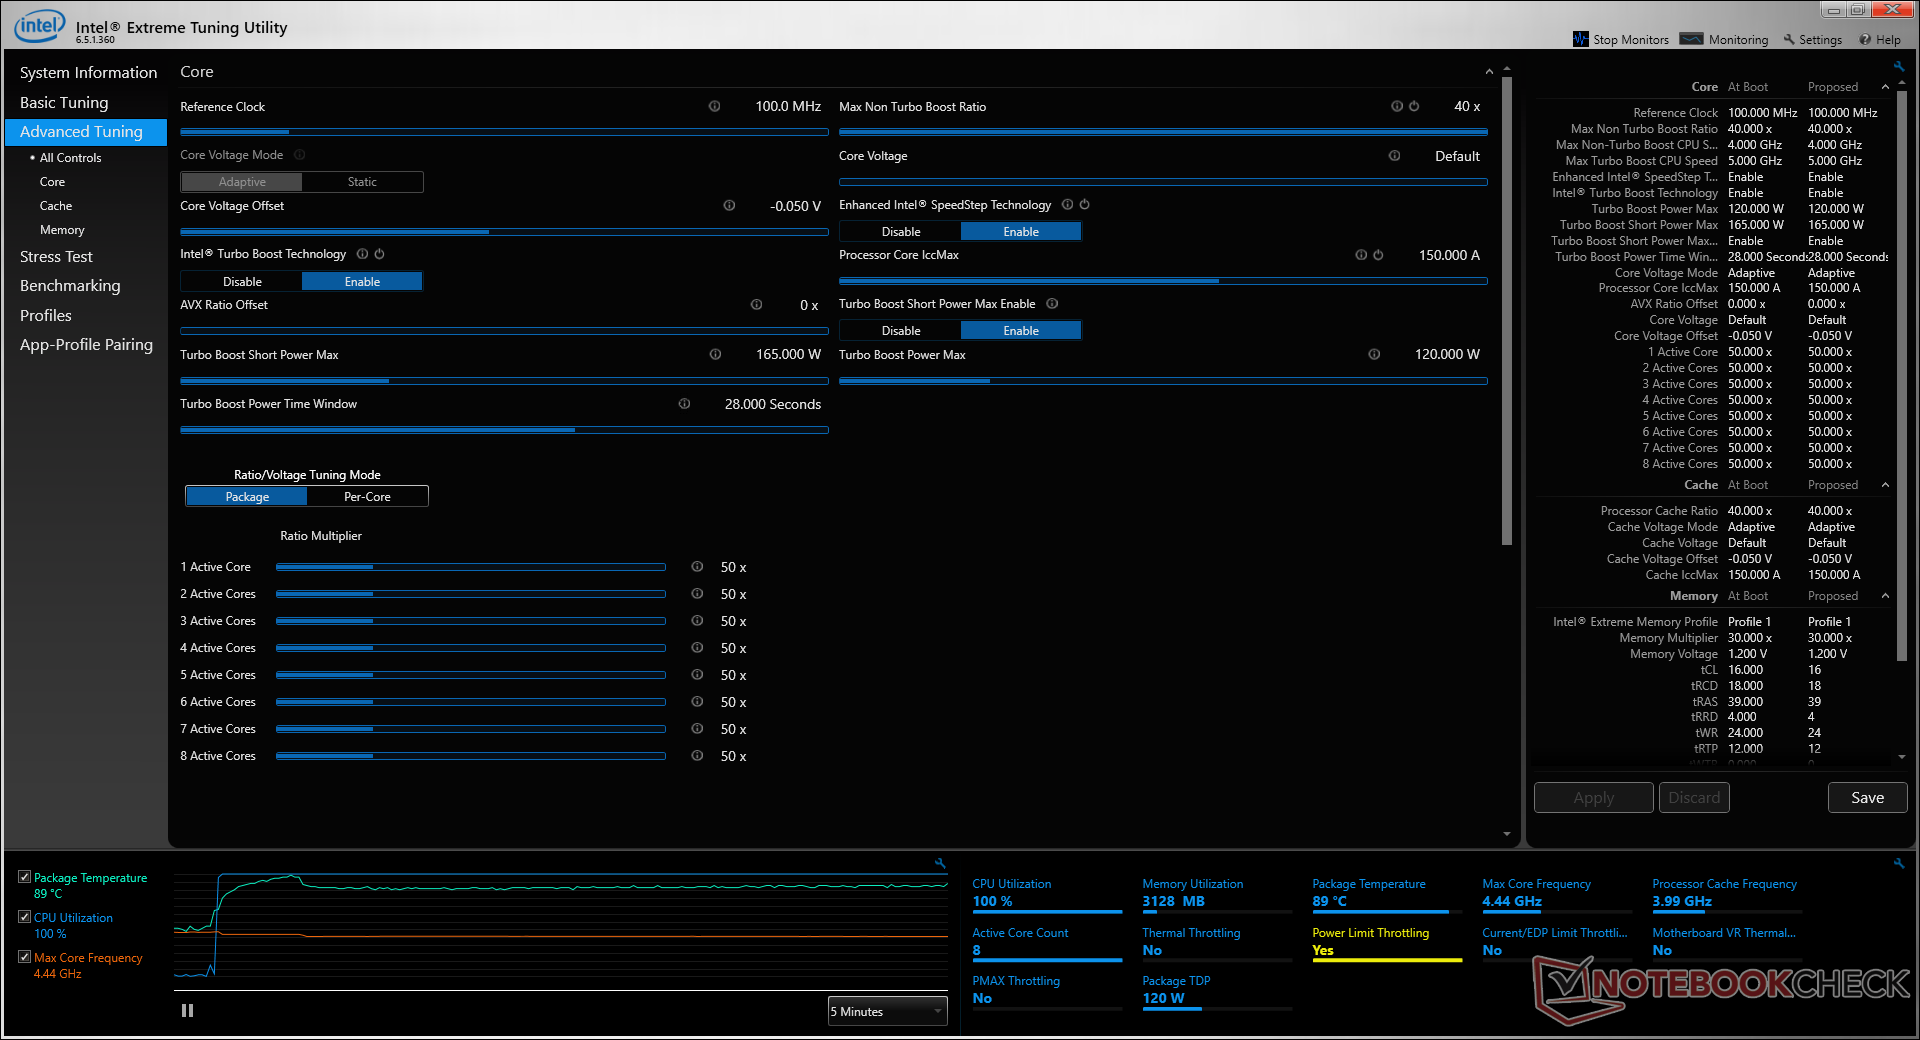
Stress Test
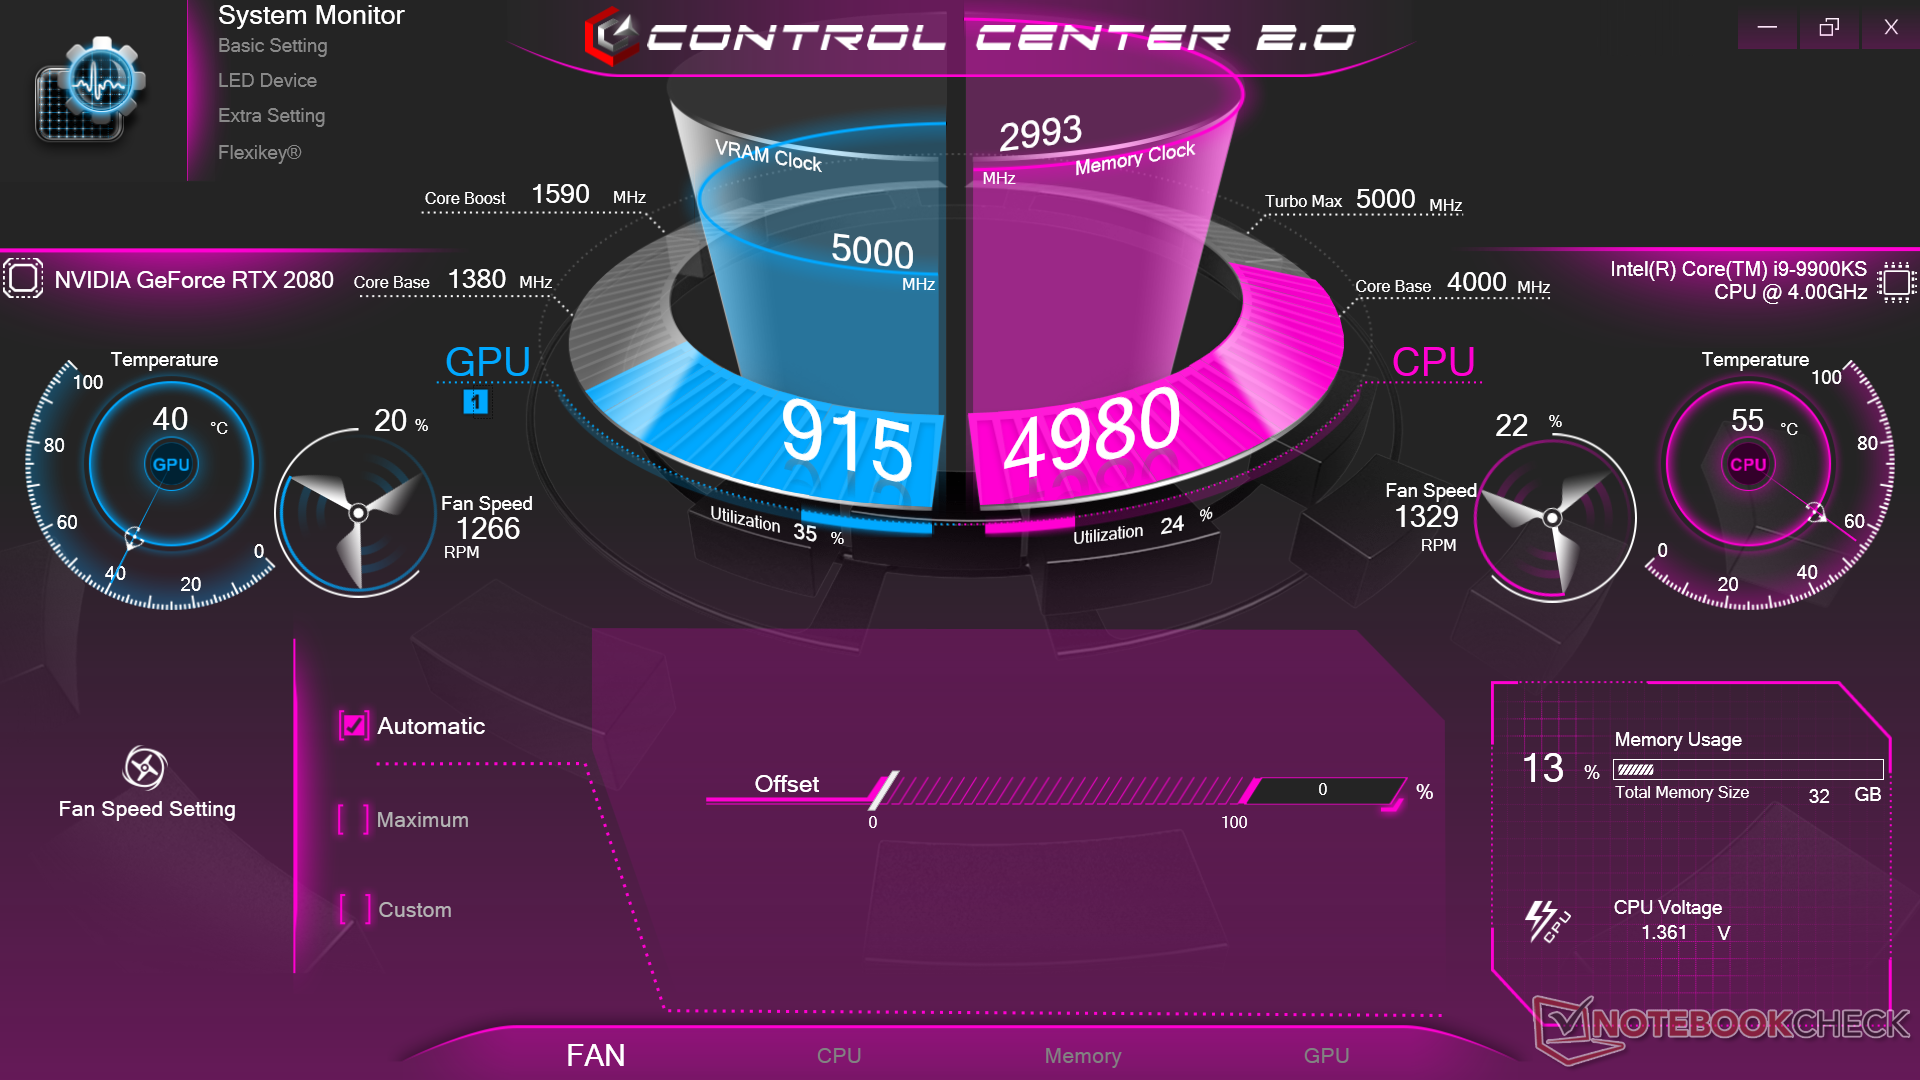
We stress the laptop with synthetic loads to identify for any potential throttling or stability issues. When running Prime95, the CPU would spike up to 4.7 GHz and at a core temperature of 98 C for about 30 seconds. Afterwards, clock rates drop to about 4.4 GHz in order to maintain a slightly cooler core temperature of 88 C. While there is thermal overhead for overclocking, the gap is so small that you won't be able to squeeze much more out of the Core i9-9900KS in practice.
Note that the CPU and GPU do not share heat pipes unlike on most other gaming laptops. GPU temperature idles at just 41 C while the CPU can be over 90 C to allow for independent overclocking. In this case, the GPU will have better overclocking potential than the CPU as it averages around 80 C when under extreme loads. Overall, users can expect >80 C when gaming on this particular Sky X4C SKU.
Running on battery power will limit performance. A Fire Strike run on batteries returns Physics and Graphics scores of 13000 and 13973 points, respectively, compared to 24327 and 25497 points when on mains.
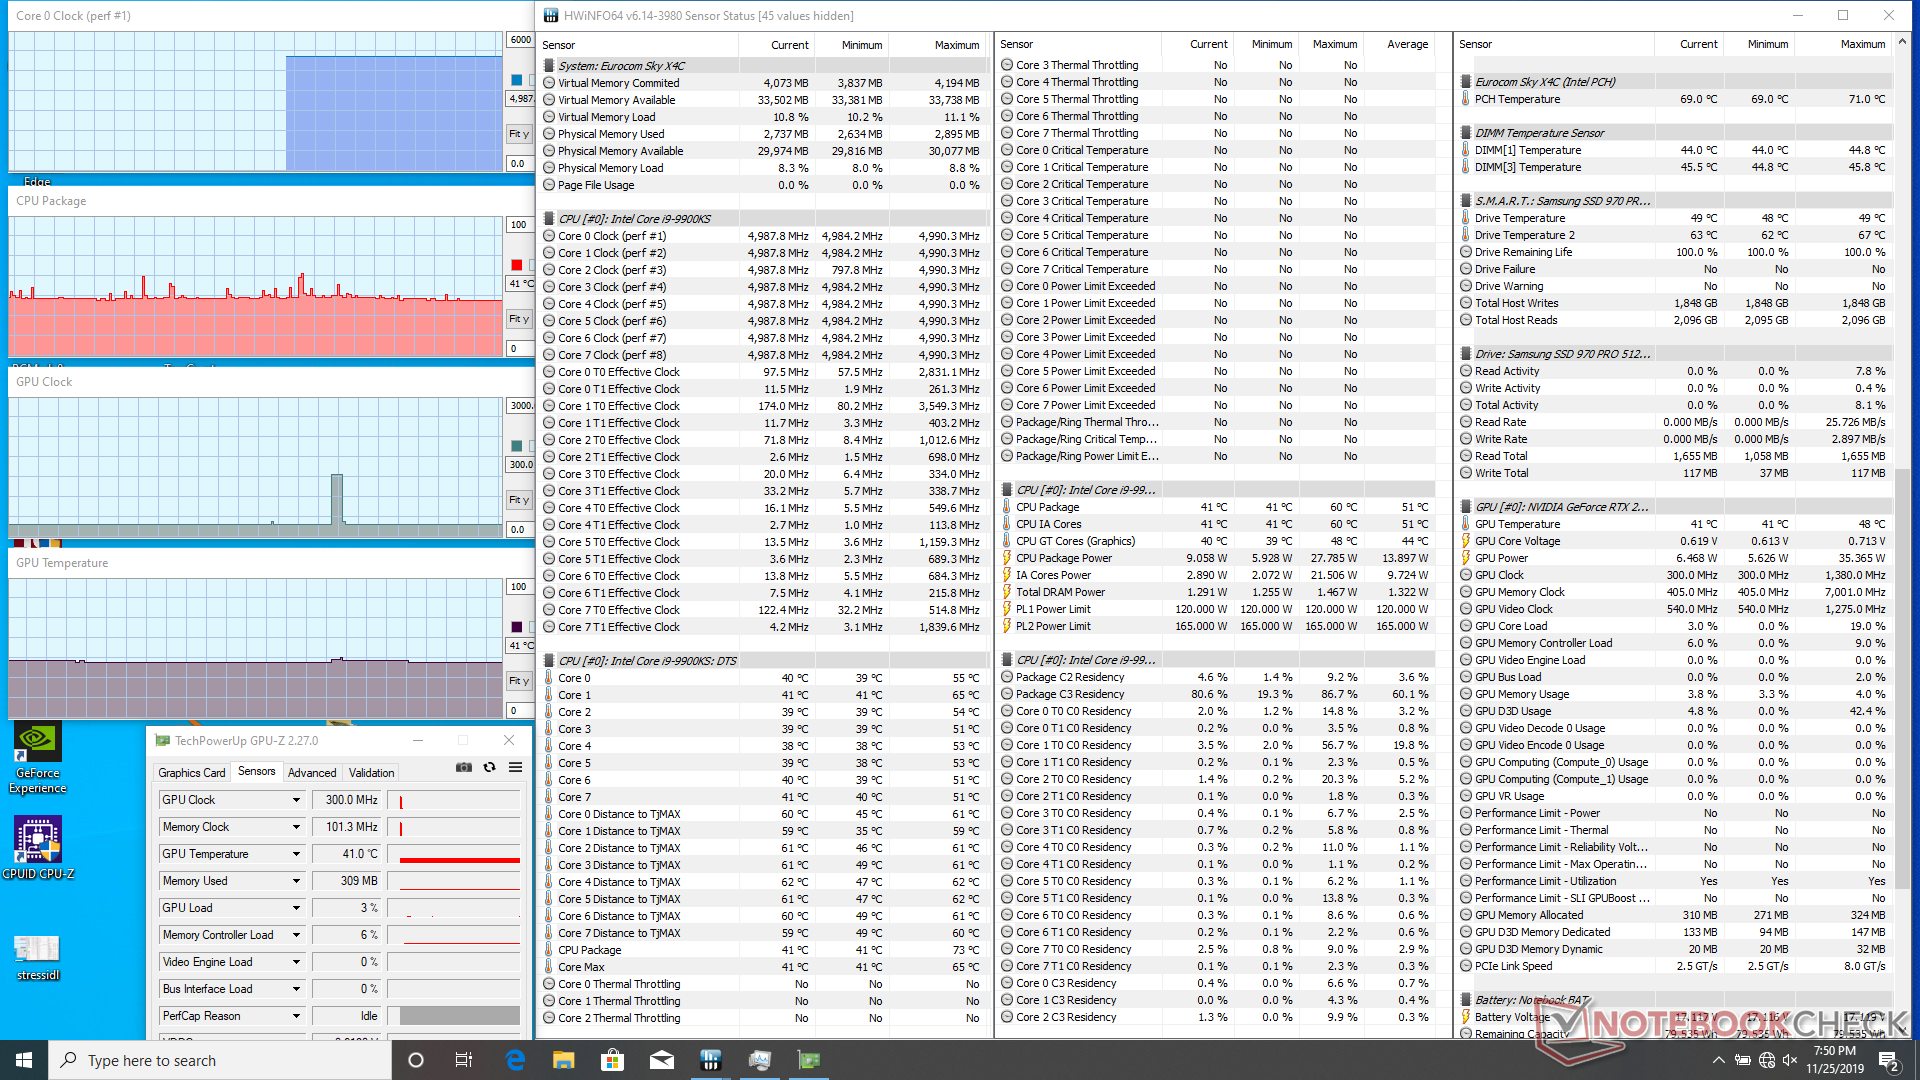
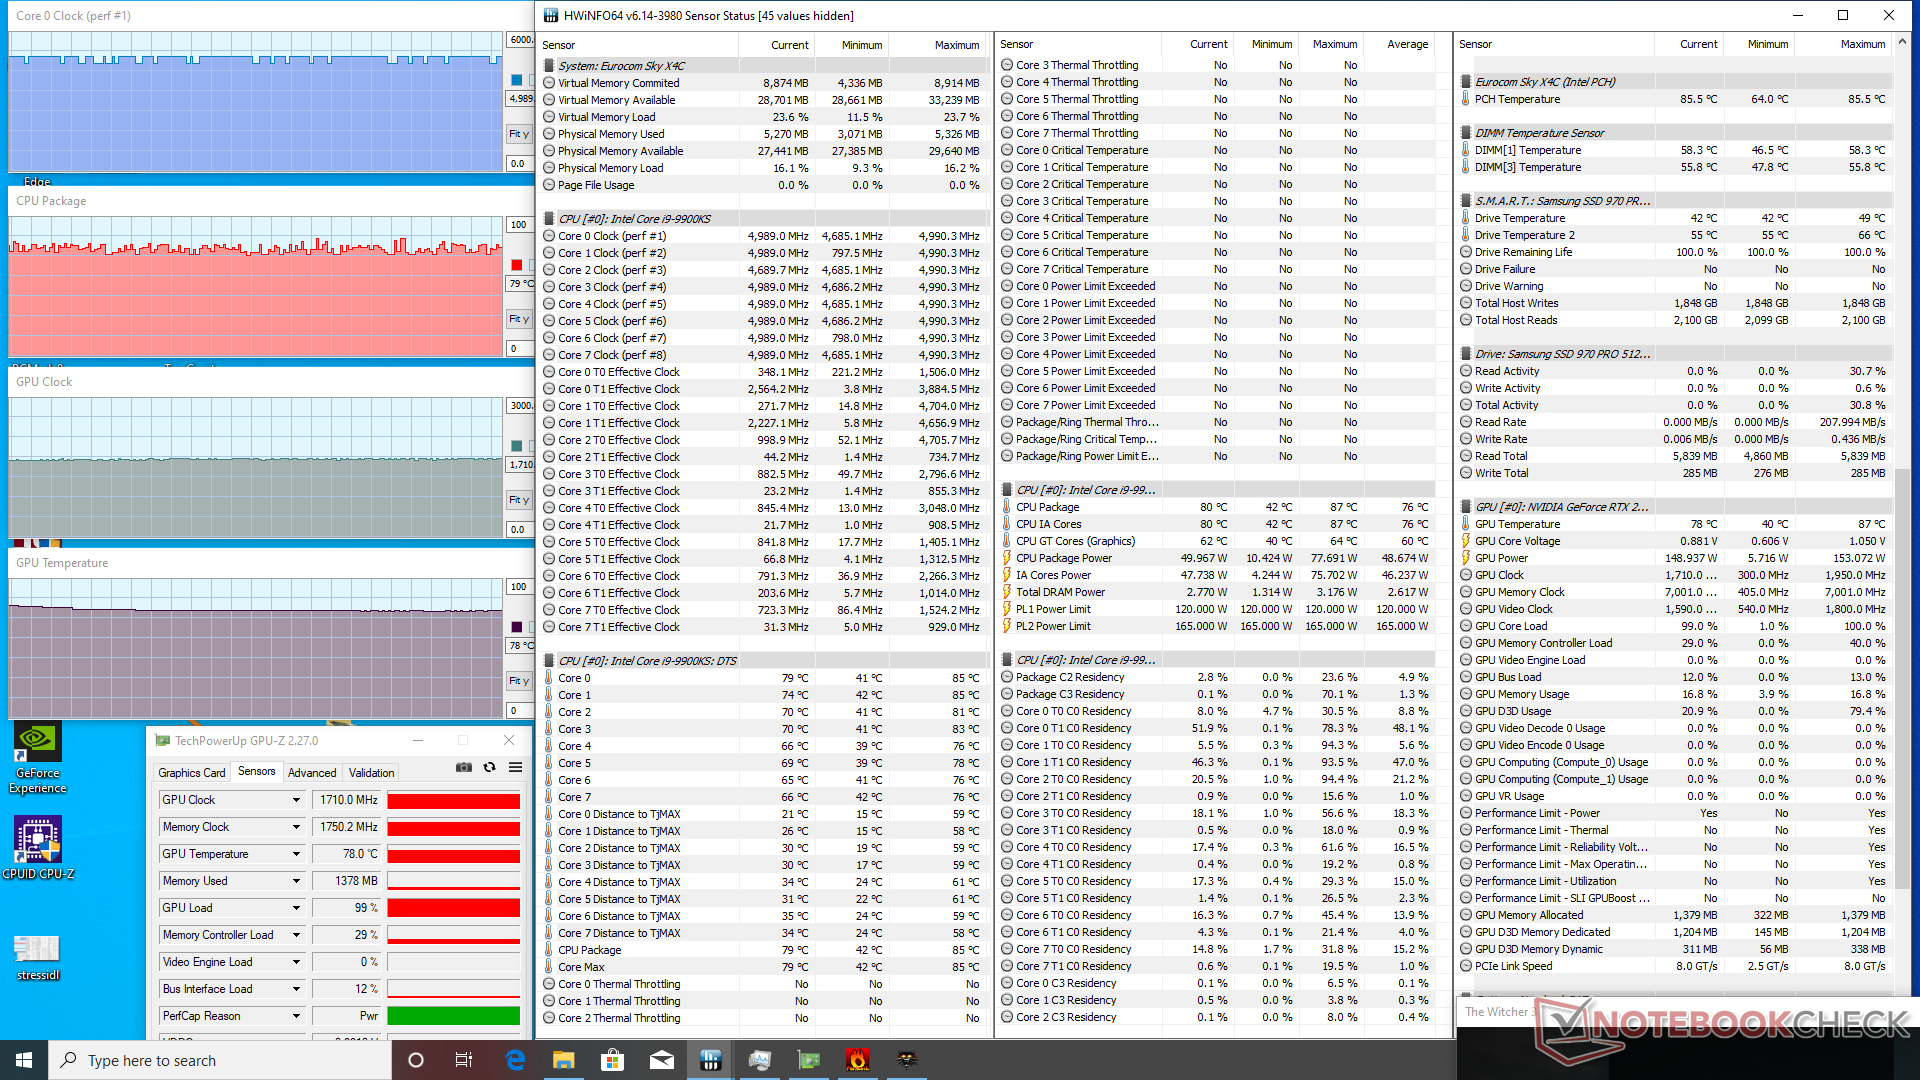
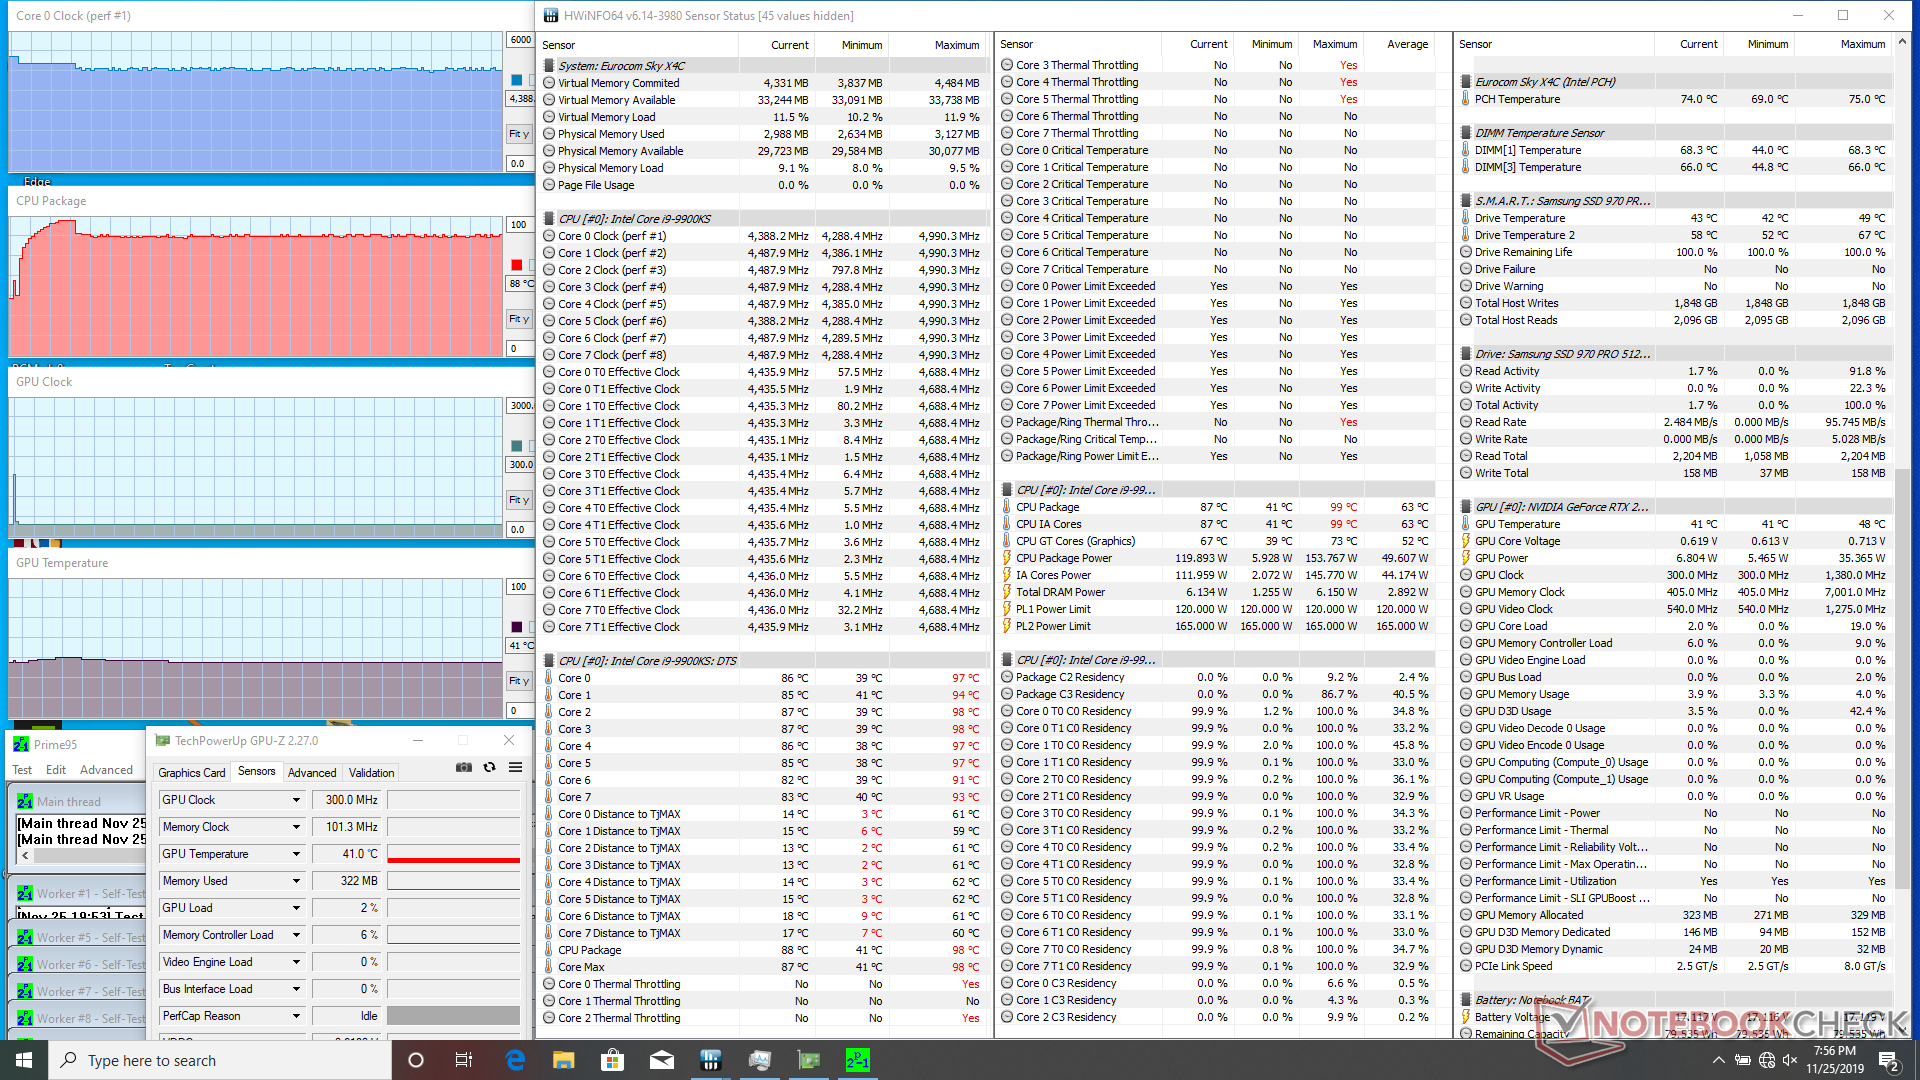
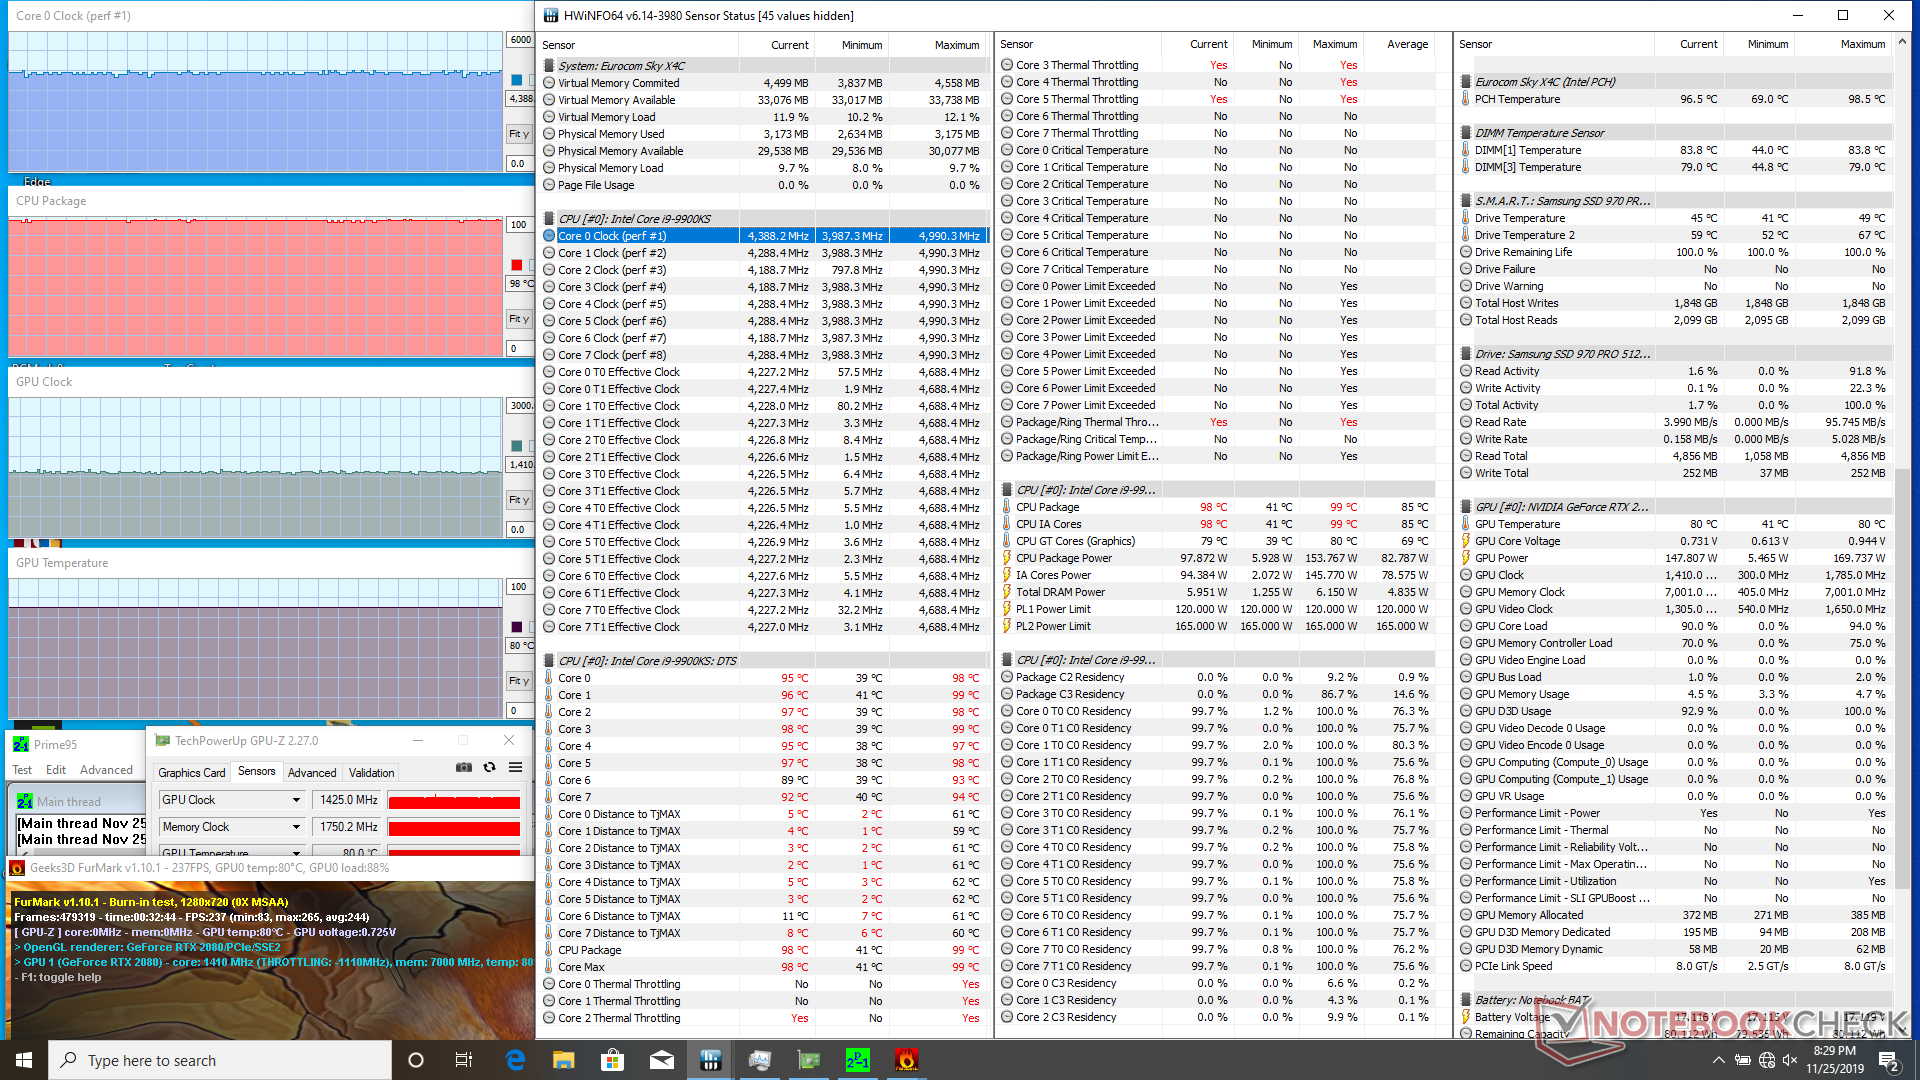

| CPU Clock (GHz) | GPU Clock (MHz) | Average CPU Temperature (°C) | Average GPU Temperature (°C) | |
| System Idle | -- | -- | 41 | 41 |
| Prime95 Stress | 4.4 | 88 | -- | 41 |
| Prime95 + FurMark Stress | 4.4 | 1425 | 98 | 80 |
| Witcher 3 Stress | 4.8 - 5.0 | 1710 | ~79 | 78 |
Speakers

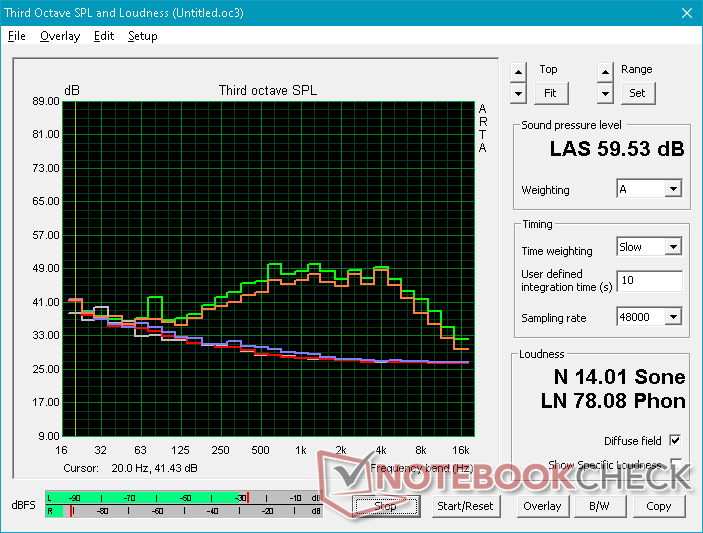
Eurocom Sky X4C i9-9900KS audio analysis
(±) | speaker loudness is average but good (77.6 dB)
Bass 100 - 315 Hz
(-) | nearly no bass - on average 15.7% lower than median
(±) | linearity of bass is average (10.3% delta to prev. frequency)
Mids 400 - 2000 Hz
(±) | higher mids - on average 7.1% higher than median
(±) | linearity of mids is average (11.6% delta to prev. frequency)
Highs 2 - 16 kHz
(+) | balanced highs - only 3.9% away from median
(±) | linearity of highs is average (10.6% delta to prev. frequency)
Overall 100 - 16.000 Hz
(-) | overall sound is not linear (30.7% difference to median)
Compared to same class
» 96% of all tested devices in this class were better, 2% similar, 2% worse
» The best had a delta of 6%, average was 18%, worst was 132%
Compared to all devices tested
» 89% of all tested devices were better, 3% similar, 8% worse
» The best had a delta of 4%, average was 24%, worst was 134%
Apple MacBook 12 (Early 2016) 1.1 GHz audio analysis
(+) | speakers can play relatively loud (83.6 dB)
Bass 100 - 315 Hz
(±) | reduced bass - on average 11.3% lower than median
(±) | linearity of bass is average (14.2% delta to prev. frequency)
Mids 400 - 2000 Hz
(+) | balanced mids - only 2.4% away from median
(+) | mids are linear (5.5% delta to prev. frequency)
Highs 2 - 16 kHz
(+) | balanced highs - only 2% away from median
(+) | highs are linear (4.5% delta to prev. frequency)
Overall 100 - 16.000 Hz
(+) | overall sound is linear (10.2% difference to median)
Compared to same class
» 7% of all tested devices in this class were better, 2% similar, 91% worse
» The best had a delta of 5%, average was 18%, worst was 53%
Compared to all devices tested
» 5% of all tested devices were better, 1% similar, 94% worse
» The best had a delta of 4%, average was 24%, worst was 134%
Energy Management
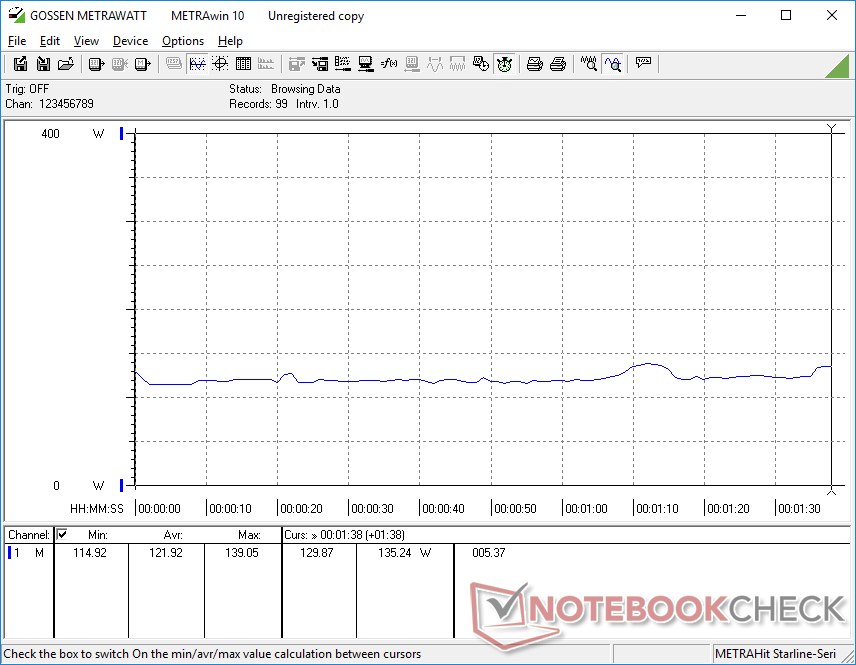
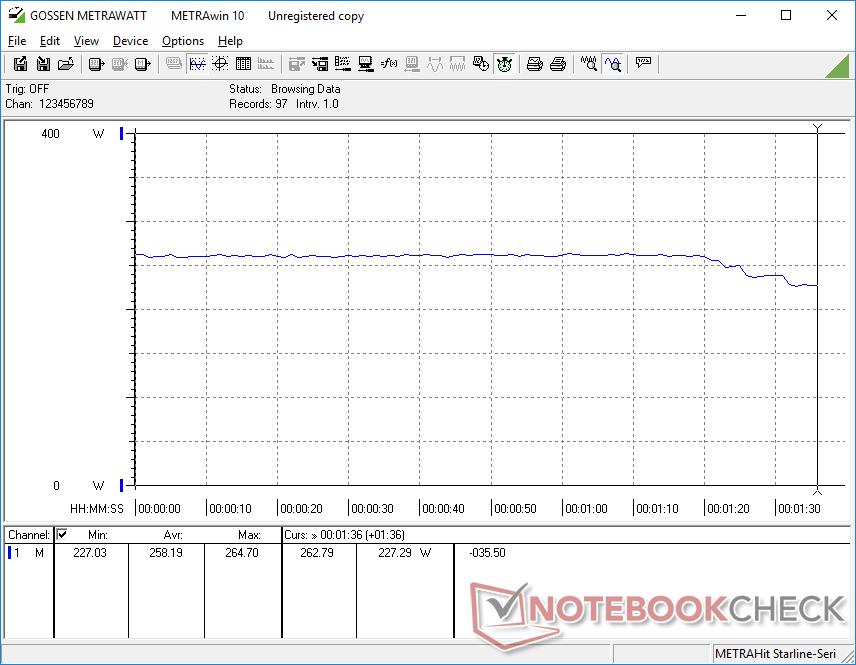
Power Consumption
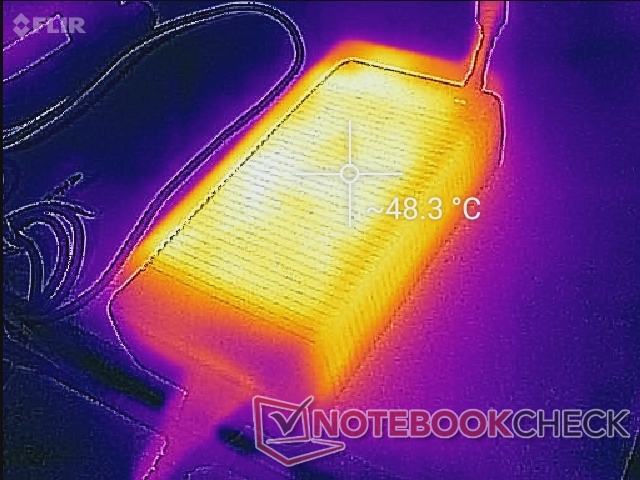
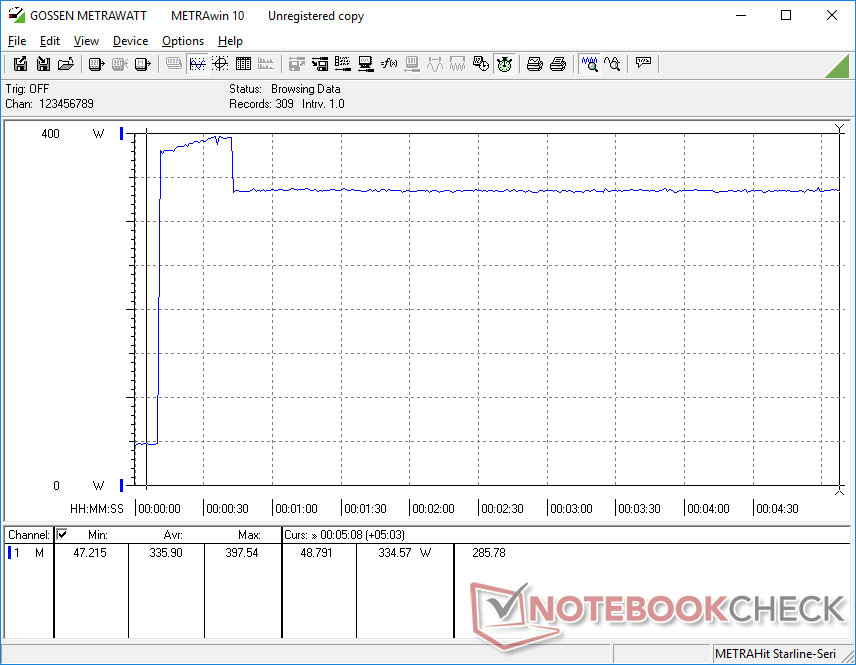
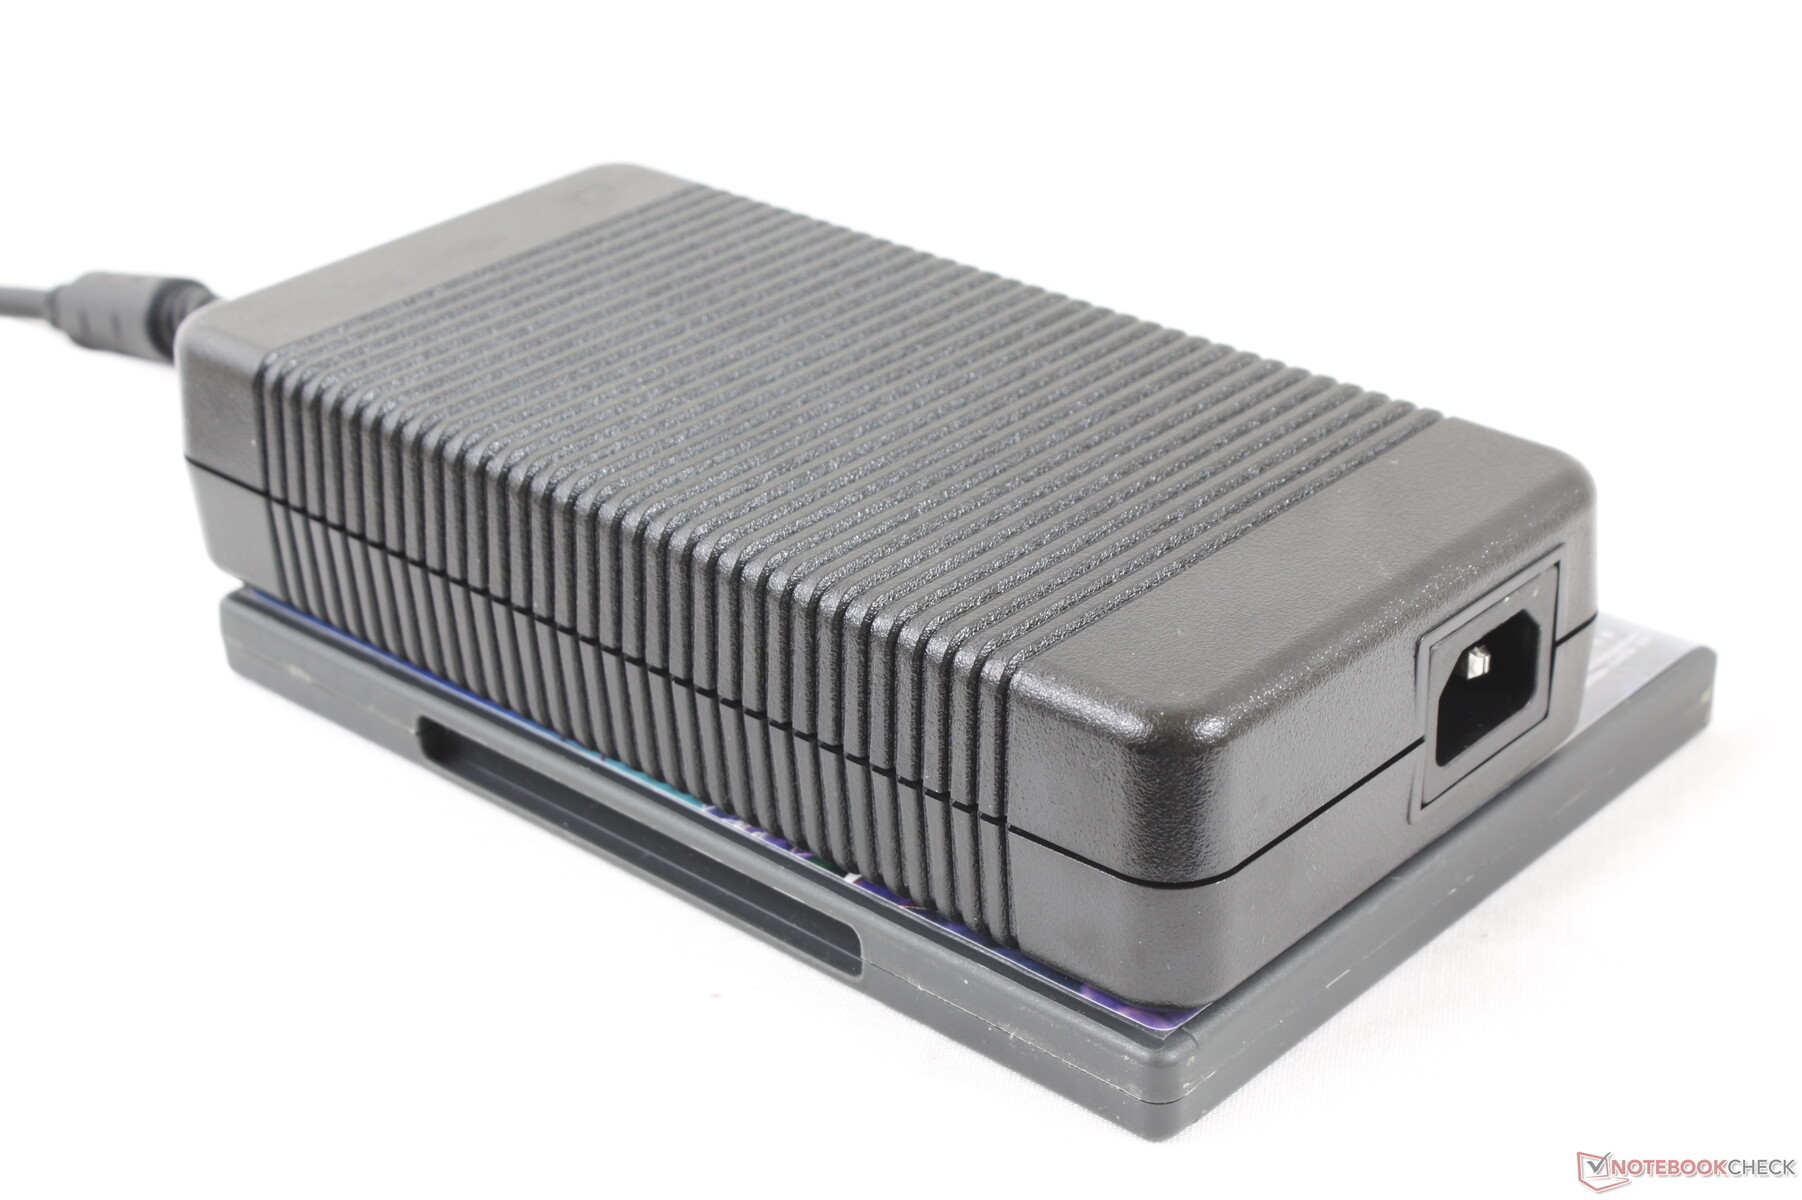
The more powerful i9-9900KS and RTX 2080 come at a cost. When compared to last year's Sky X4C with the i7-8700K and GTX 1080, our newer Sky X4C consumes 50 percent more power (172 W vs. 258 W) when gaming. We're able to measure a temporary maximum consumption of 398 W from the large (~20 x 10 x 4.3 cm) 330 W when running both Prime95 and FurMark simultaneously. This eventually falls and stabilizes at 335 W meaning that you won't be able to both recharge the system and run extreme loads at the same time.
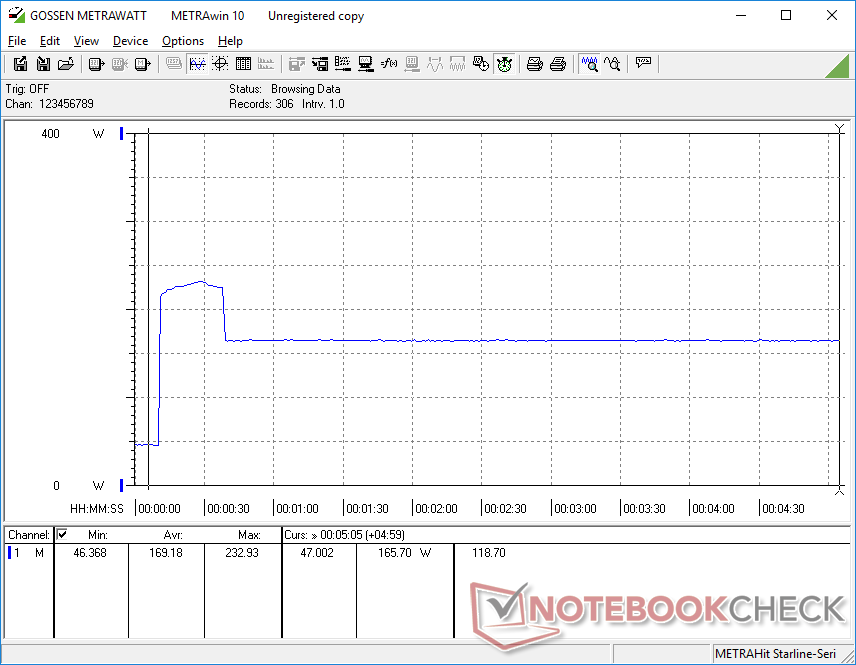
When running Prime95 only, consumption will spike to 233 W for about 30 seconds before falling and stabilizing at 166 W thereafter. This behavior mirrors our Prime95 stress test observations above where clock rates would only be fastest during the first 30 seconds before eventually falling.
| Off / Standby | |
| Idle | |
| Load |
|
Key:
min: | |
| Eurocom Sky X4C i9-9900KS i9-9900KS, GeForce RTX 2080 Mobile, Samsung SSD 970 Pro 512GB, IPS, 1920x1080, 15.6" | Alienware Area-51m i9-9900K RTX 2080 i9-9900K, GeForce RTX 2080 Mobile, 2x SK Hynix PC400 512GB (RAID 0), IPS, 1920x1080, 17.3" | MSI GT63 Titan 8RG-046 i7-8750H, GeForce GTX 1080 Mobile, CUK Cyclone 500GB M.2 NVMe, TN, 1920x1080, 15.6" | Asus GL702ZC-GC104T R7 1700, Radeon RX 580 (Laptop), SanDisk SD8SN8U256G1002, IPS, 1920x1080, 17.3" | MSI GE63VR 7RF Raider i7-7700HQ, GeForce GTX 1070 Mobile, Toshiba HG6 THNSNJ256G8NY, TN LED, 1920x1080, 15.6" | Eurocom Sky X4C i7-8700K, GeForce GTX 1080 Mobile, Samsung SSD 960 Pro 1TB m.2 NVMe, IPS, 3840x2160, 15.6" | |
|---|---|---|---|---|---|---|
| Power Consumption | 2% | 25% | -3% | 46% | 18% | |
| Idle Minimum * (Watt) | 33.4 | 23.3 30% | 26.4 21% | 43 -29% | 11 67% | 30.2 10% |
| Idle Average * (Watt) | 40.5 | 33.5 17% | 30 26% | 50 -23% | 16 60% | 34.7 14% |
| Idle Maximum * (Watt) | 44 | 38.4 13% | 30.6 30% | 57 -30% | 21 52% | 37.8 14% |
| Load Average * (Watt) | 121.9 | 114.1 6% | 90.4 26% | 125 -3% | 92 25% | 130.3 -7% |
| Witcher 3 ultra * (Watt) | 258.2 | 339.5 -31% | 255.6 1% | 180 30% | 185 28% | 172.2 33% |
| Load Maximum * (Watt) | 397.6 | 485.1 -22% | 224.4 44% | 240 40% | 224 44% | 217.7 45% |
* ... smaller is better
Battery Life
Runtimes from the removable 82 Wh battery remain about the same as our 2018 Sky X4C. Users can expect just over 2.5 hours of real-world WLAN use before automatic shutdown. Charging from empty to full capacity takes about 2 hours.
The system cannot be recharged via USB Type-C.
| Eurocom Sky X4C i9-9900KS i9-9900KS, GeForce RTX 2080 Mobile, 82 Wh | Lenovo Legion Y740-15ICHg i7-9750H, GeForce RTX 2070 Max-Q, 57 Wh | Alienware Area-51m i9-9900K RTX 2080 i9-9900K, GeForce RTX 2080 Mobile, 90 Wh | MSI GT76 Titan DT 9SG i9-9900K, GeForce RTX 2080 Mobile, 90 Wh | Asus Strix Scar III G531GW-AZ062T i7-9750H, GeForce RTX 2070 Mobile, 66 Wh | Eurocom Sky X4C i7-8700K, GeForce GTX 1080 Mobile, 82 Wh | |
|---|---|---|---|---|---|---|
| Battery runtime | 7% | -25% | 79% | 100% | -7% | |
| WiFi v1.3 (h) | 2.8 | 3 7% | 2.1 -25% | 5 79% | 5.6 100% | 2.6 -7% |
| Reader / Idle (h) | 2.6 | 6.8 | 3 | |||
| Load (h) | 1.1 | 0.9 | 1.4 |
Pros
Cons
Verdict
The original Core i9-9900K didn't have much overclocking headroom and so it's unsurprising that the Core i9-9900KS is no different. At stock, the Core i9-9900KS in the Sky X4C will stabilize at 4.4 GHz and 88 C or just 400 MHz above the base clock rate of the processor. Larger laptops like the Alienware Area-51m and MSI GT76 with the i9-9900K are able to match or outperform the i9-9900KS in our Eurocom. As versatile as this three-year old Clevo chassis may be, the Core i9 series is pushing it to its limits with not much room to spare. It's about time for Clevo to update this system to better exploit the high Turbo Boost potential of Intel Core i9 CPUs.
From a gen-to-gen perspective, the i9-9900K and 9900KS are about 35 to 45 percent faster than the i7-8700K and i7-9700K. You can still benefit from upgrading to a Core i9 in this regard, but just don't expect much CPU overclocking potential on the Sky X4C laptop.
Super fast, but also super warm. Configuring a laptop with the Core i9-9900KS is more about bragging rights especially when the original Core i9-9900K performs very similarly. The Eurocom Sky X4C is able to run the i9-9900KS stably at a clock rate 10 percent higher than the base clock rate even though the CPU is capable of more on a proper desktop.
Eurocom Sky X4C i9-9900KS
- 11/28/2019 v7 (old)
Allen Ngo
Price comparison
