Eurocom RX315 laptop review: The MSI GS66 Stealth alternative
")
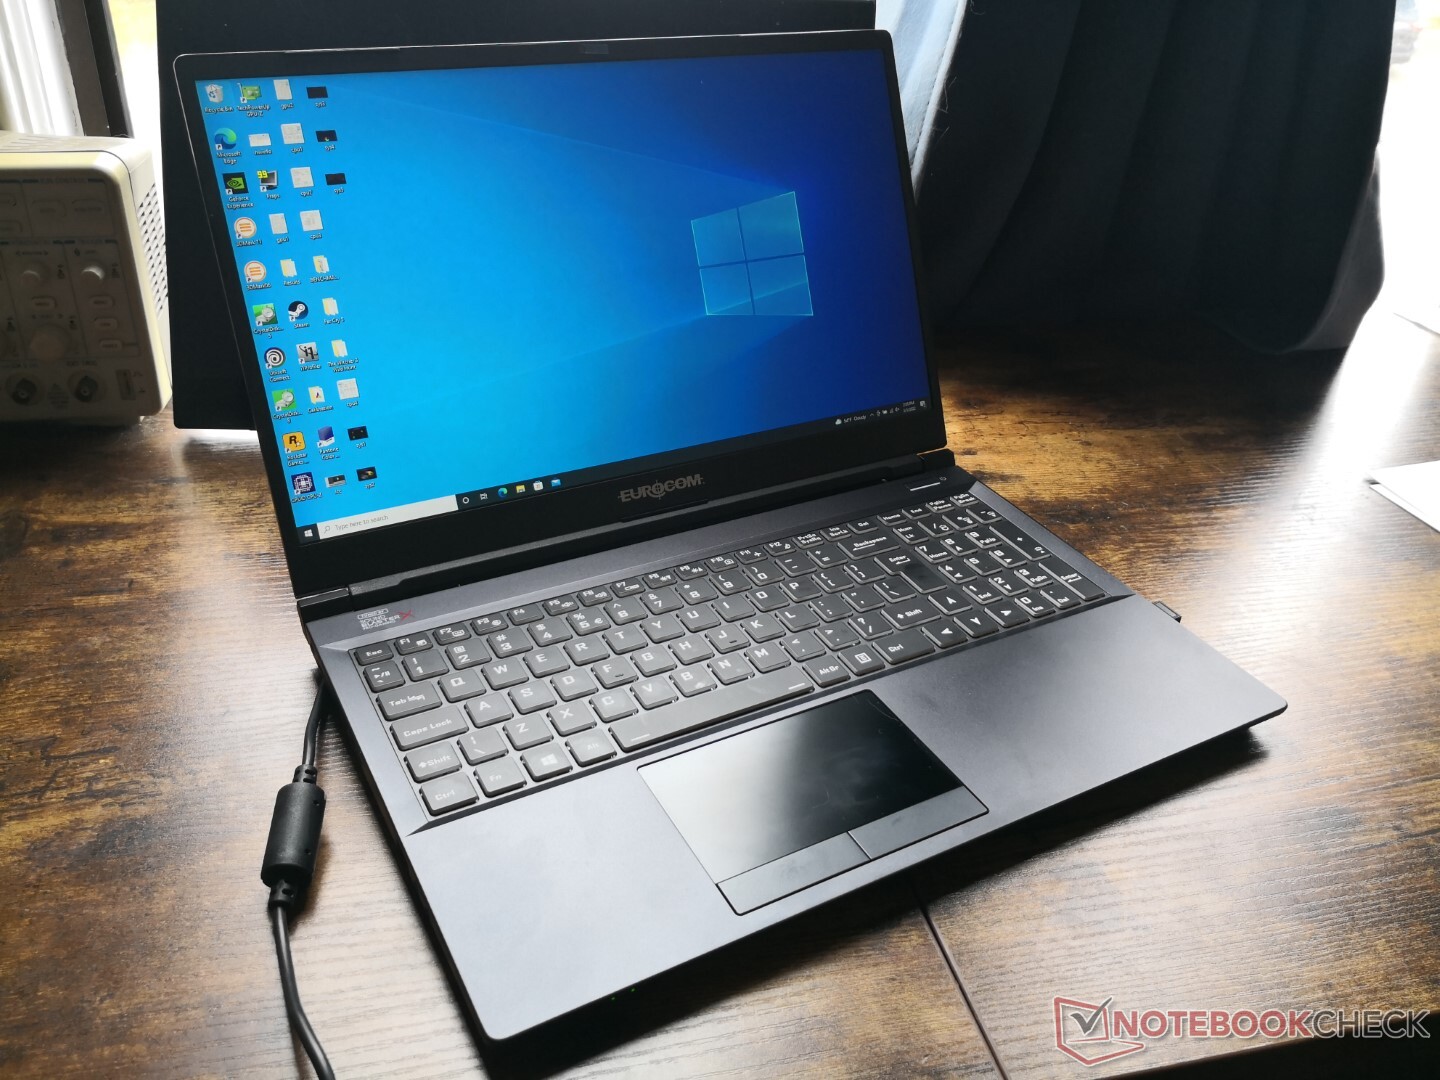
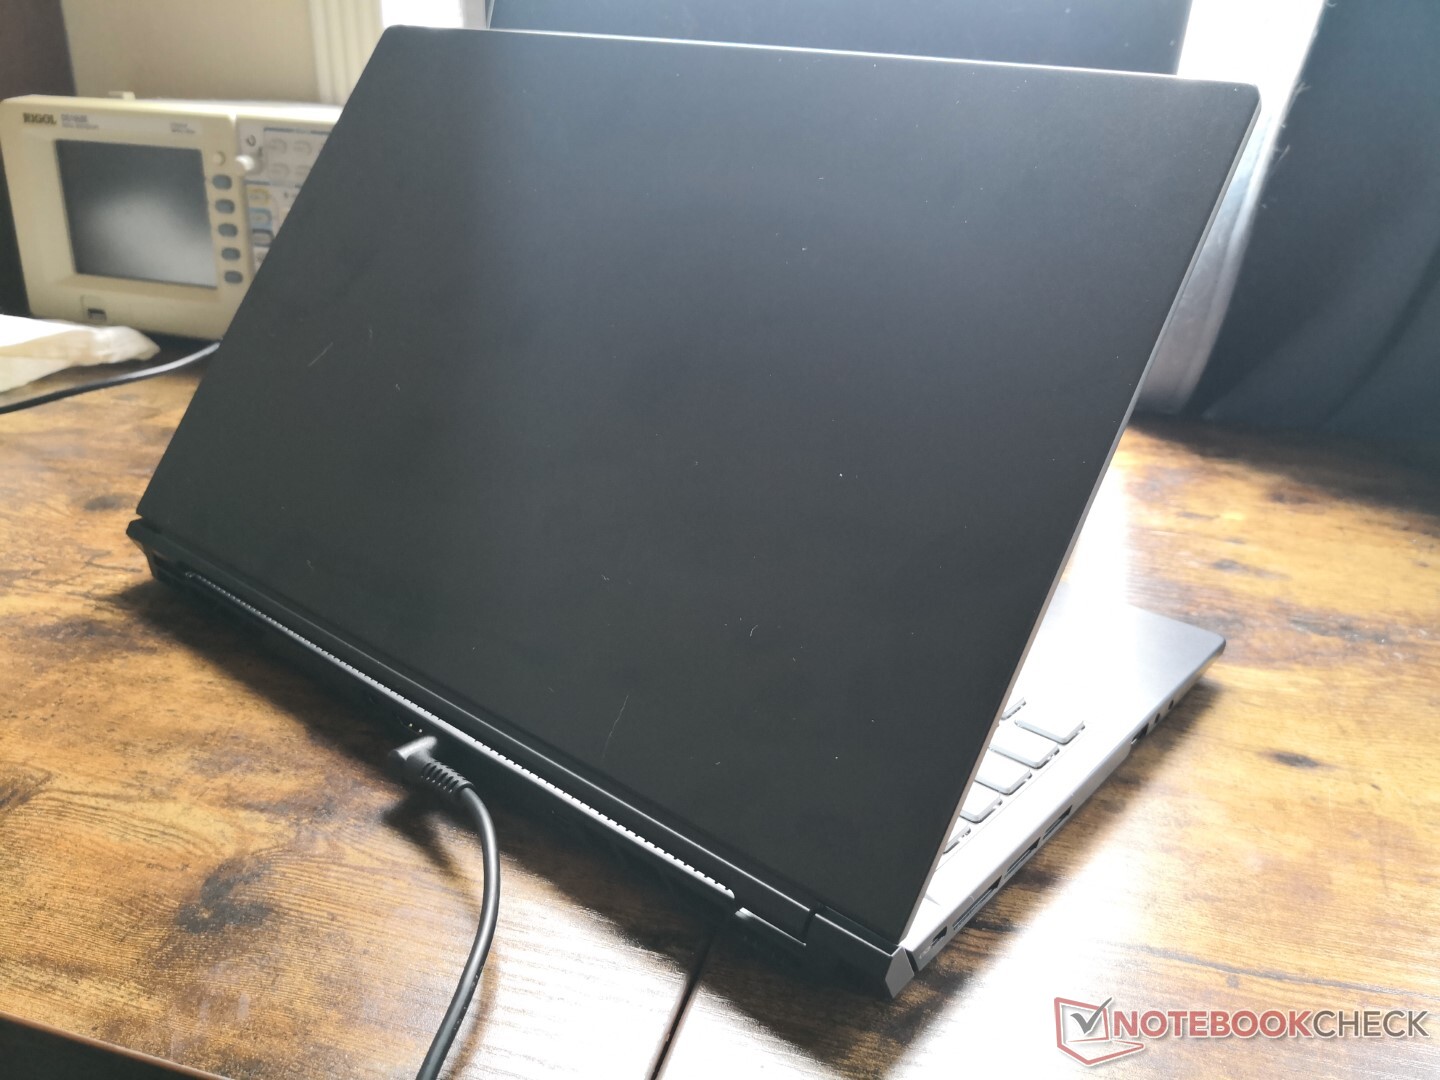
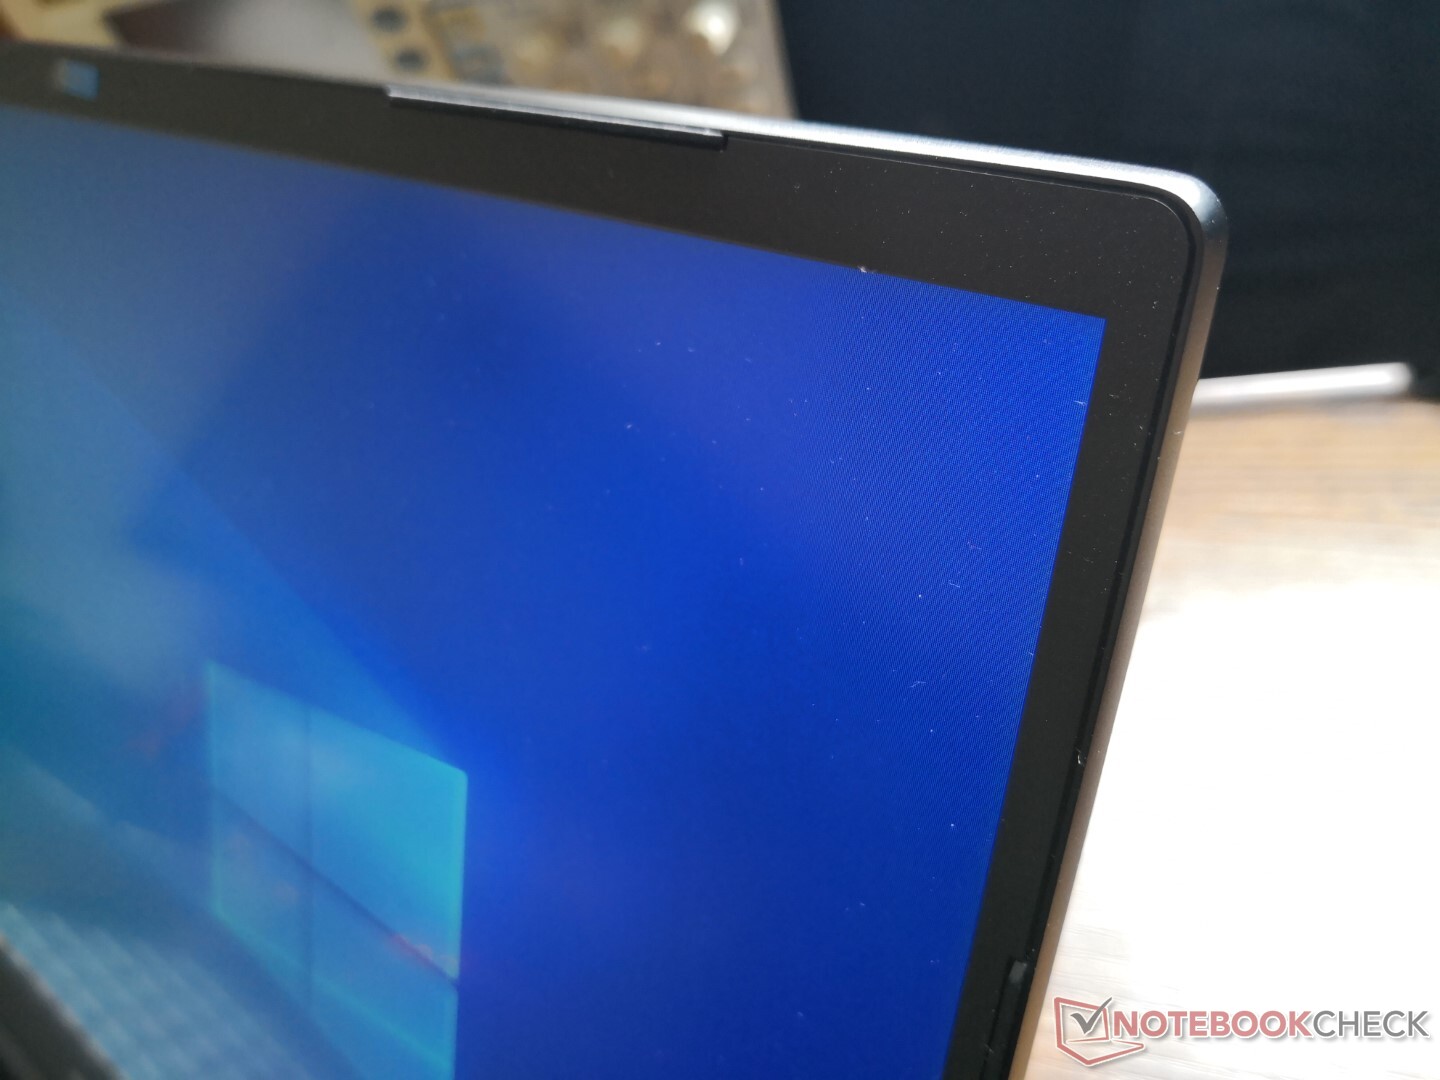
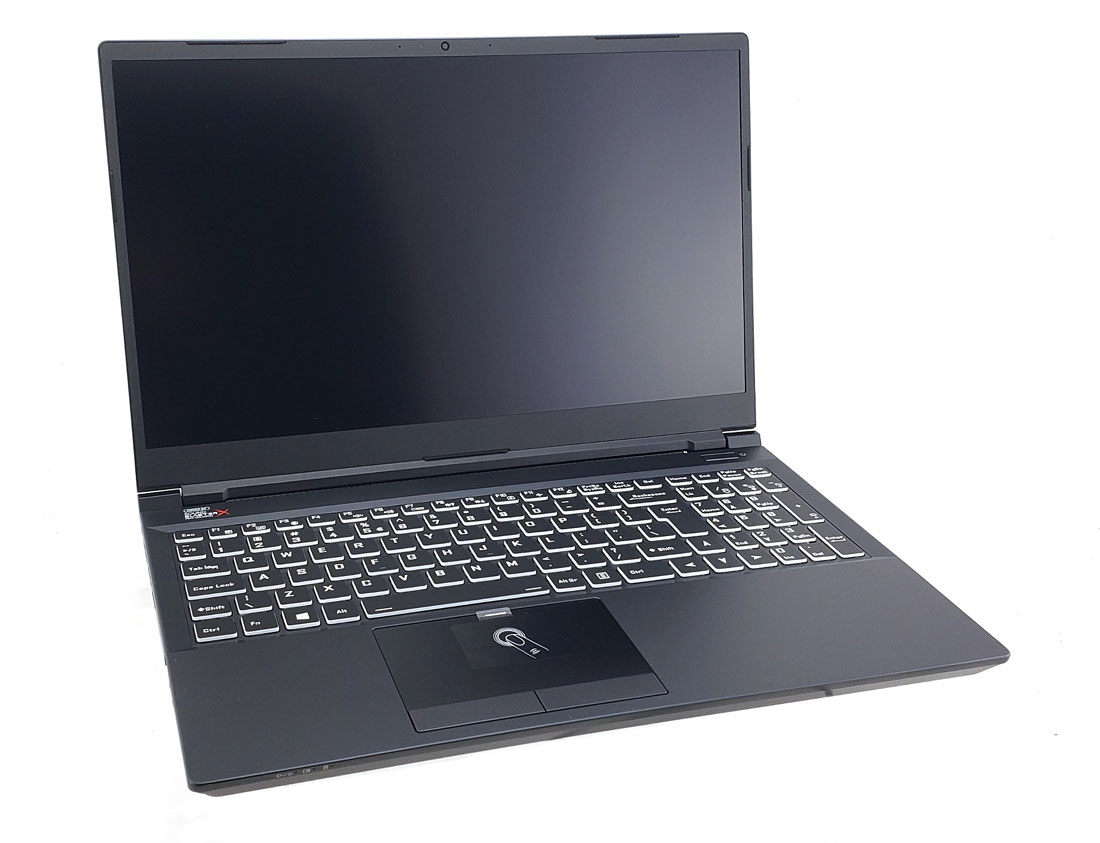
The Eurocom RX315 NH57AF1 is a different configuration of the Schenker XMG Pro 15 that we reviewed earlier this year. Thus, we recommend checking out our existing Schenker review to learn more about the chassis and physical features as both models are visually identical. This page will instead focus on the performance users can expect from the RX315.
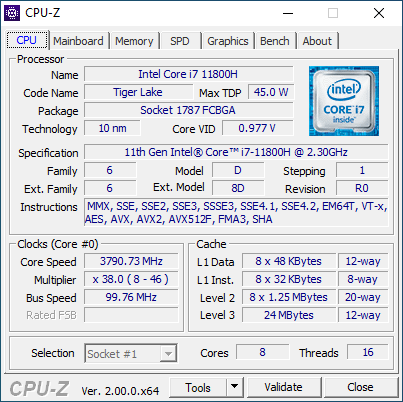
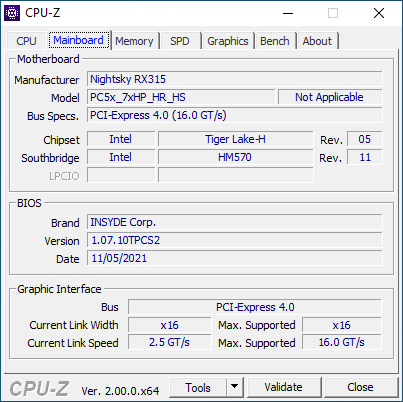
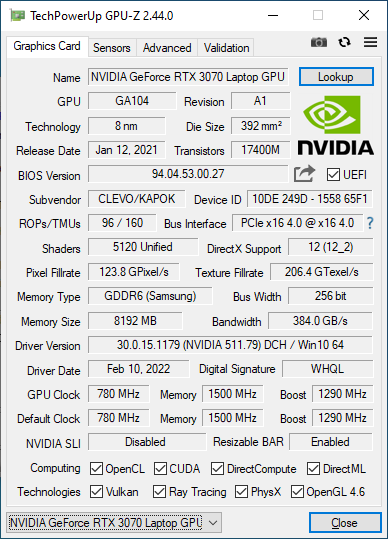
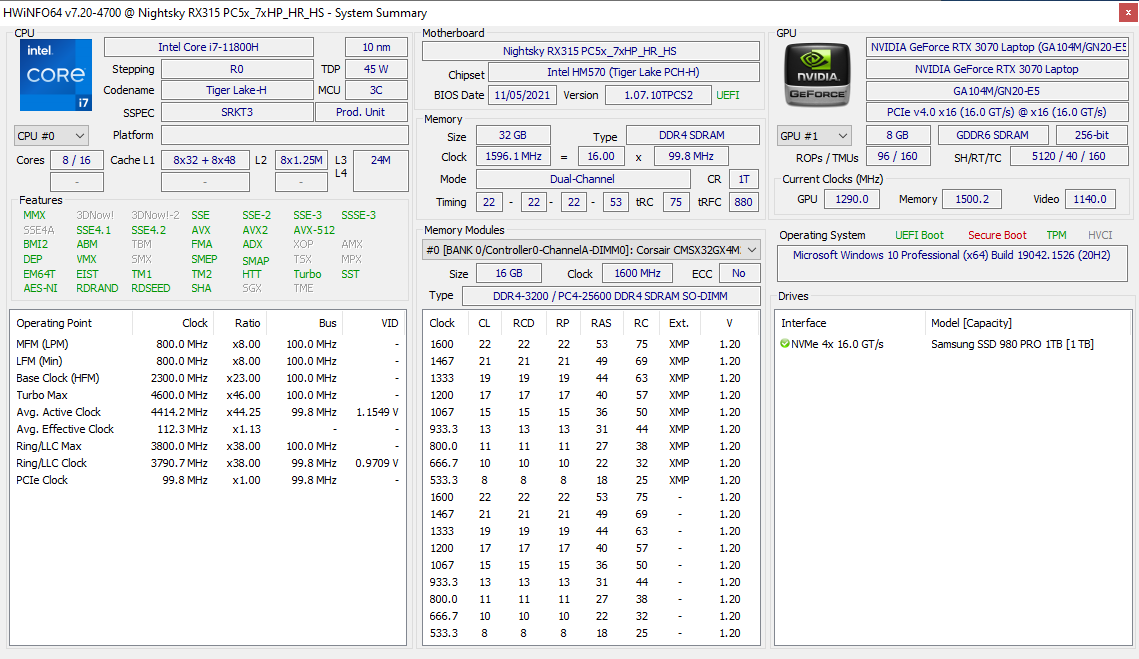
Our unit as reviewed comes with the 11th gen Core i7-11800H CPU, 105 W TGP GeForce RTX 3070 GPU, and 240 Hz IPS display. Additional configuration options can be found here. Eurocom says 12th gen Intel CPUs and the RTX 3080 Ti are coming in the near future.
Alternatives to the RX315 include other ultrathin 15.6-inch gaming laptops like the MSI GS66, Asus Zephyrus S15 series, Razer Blade 15, or the Alienware X15. The Eurocom RX315 should not be confused with the thicker ARX15 or ARX315.
More Eurocom reviews:
Potential Competitors in Comparison
Rating | Date | Model | Weight | Height | Size | Resolution | Price |
|---|---|---|---|---|---|---|---|
| 85.2 % v7 (old) | 03 / 2022 | Eurocom RX315 NH57AF1 i7-11800H, GeForce RTX 3070 Laptop GPU | 2 kg | 20 mm | 15.60" | 1920x1080 | |
| 84.5 % v7 (old) | 02 / 2022 | MSI Stealth GS66 12UGS i7-12700H, GeForce RTX 3070 Ti Laptop GPU | 2.2 kg | 19.8 mm | 15.60" | 2560x1440 | |
| 83 % v7 (old) | 01 / 2022 | Eurocom Nightsky ARX315 R9 5900X, GeForce RTX 3070 Laptop GPU | 2.6 kg | 32.5 mm | 15.60" | 1920x1080 | |
| 86.1 % v7 (old) | 11 / 2021 | Alienware m15 R6, i7-11800H RTX 3080 i7-11800H, GeForce RTX 3080 Laptop GPU | 2.5 kg | 22.85 mm | 15.60" | 1920x1080 | |
| 82.7 % v7 (old) | 10 / 2021 | Dell G15 5515 R7 5800H, GeForce RTX 3050 Ti Laptop GPU | 2.4 kg | 24.9 mm | 15.60" | 1920x1080 | |
| 88.9 % v7 (old) | 07 / 2021 | Razer Blade 15 Advanced (Mid 2021) i7-11800H, GeForce RTX 3080 Laptop GPU | 2 kg | 16.99 mm | 15.60" | 1920x1080 |
Case
Communication
Webcam


Maintenance
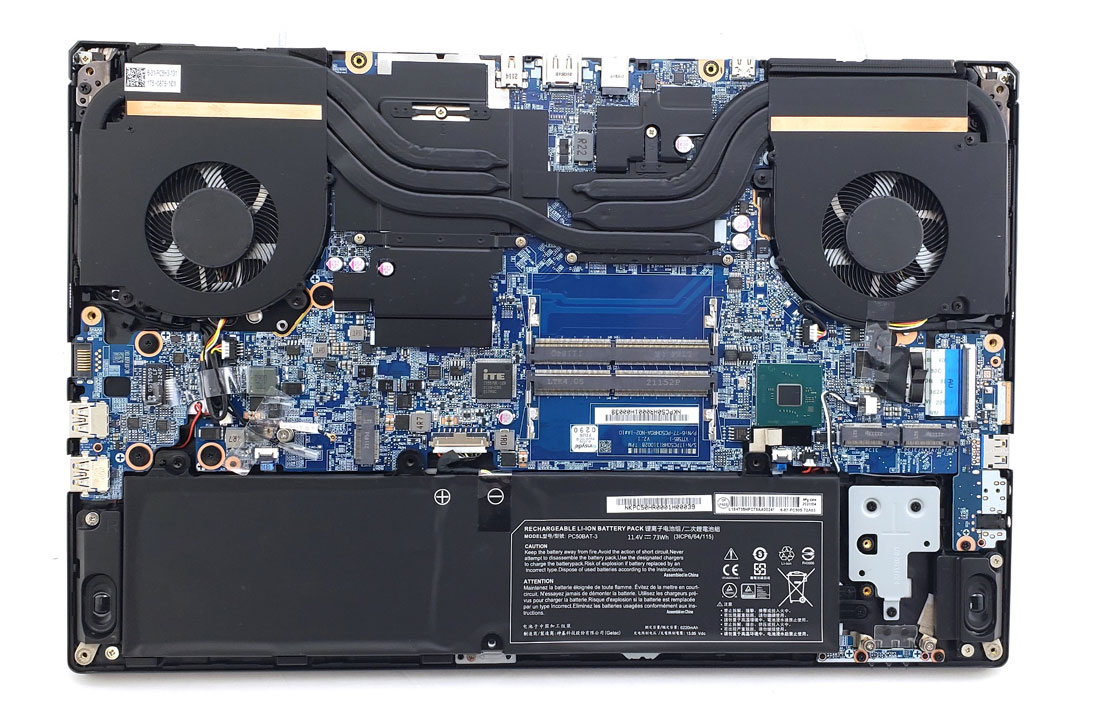
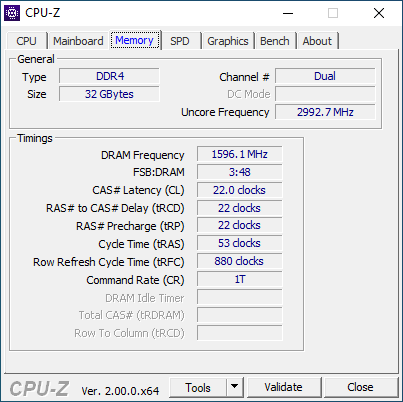
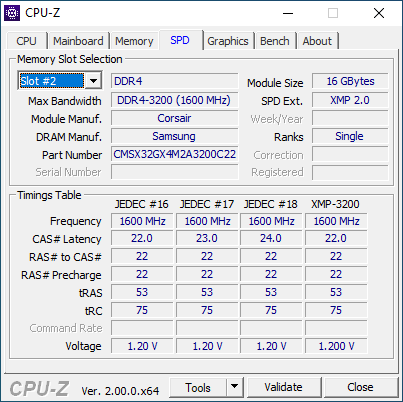
Users can install up to two DDR4 SODIMM RAM modules, two PCIe4 x4 M.2 2280 NVMe SSDs, and a WLAN module.
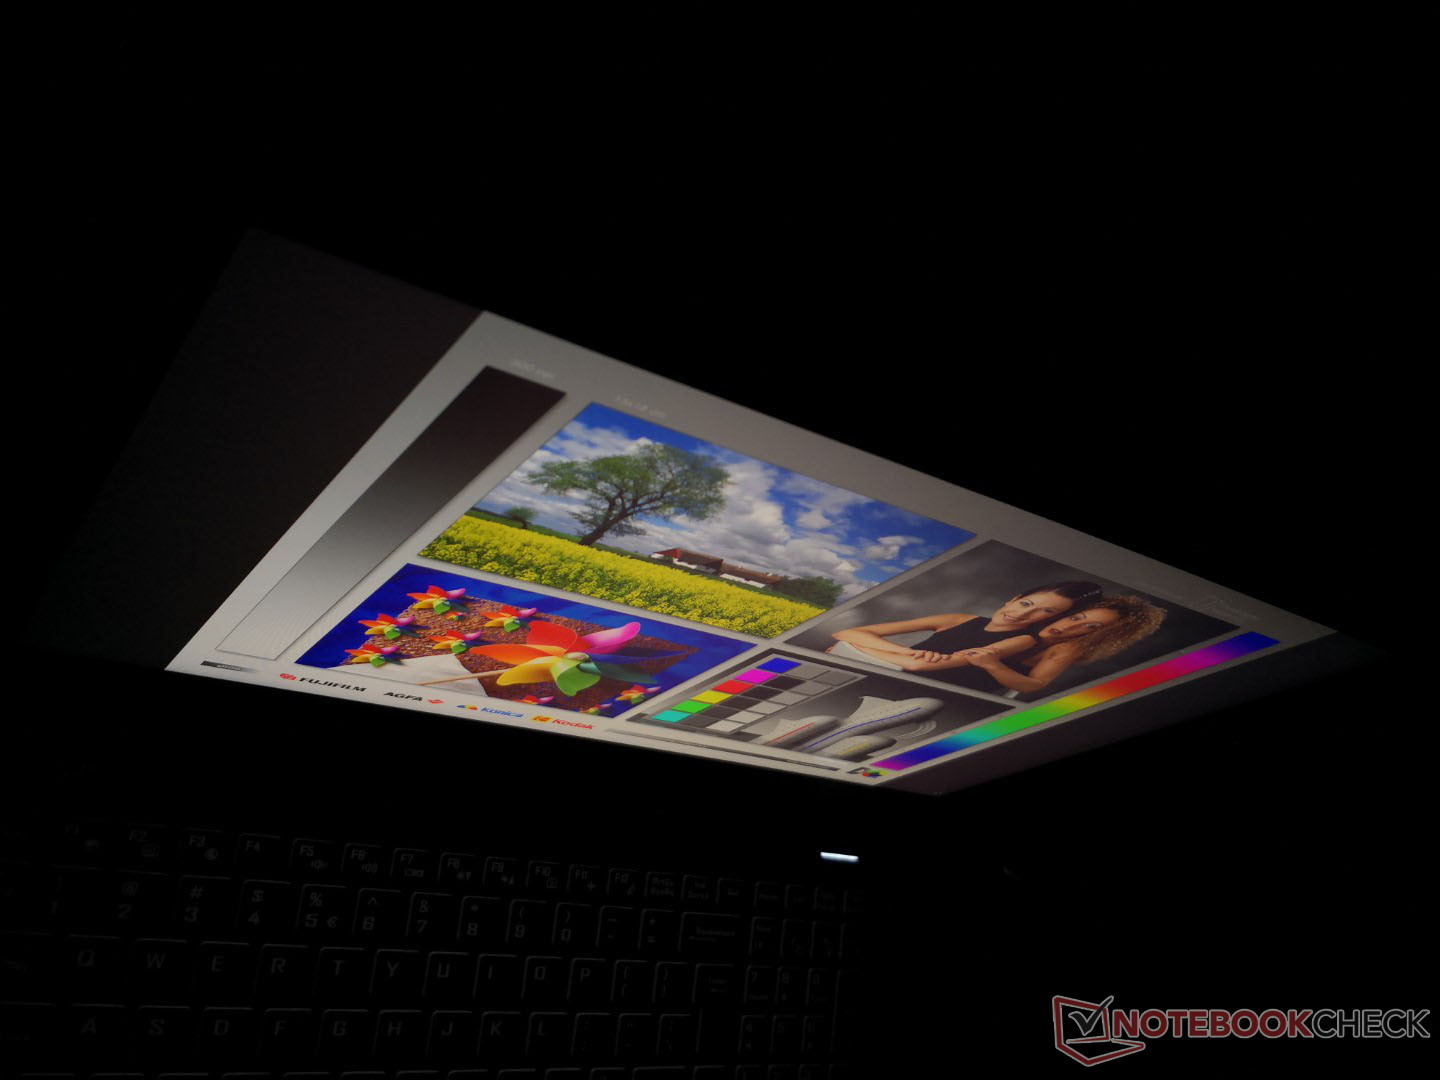
Display
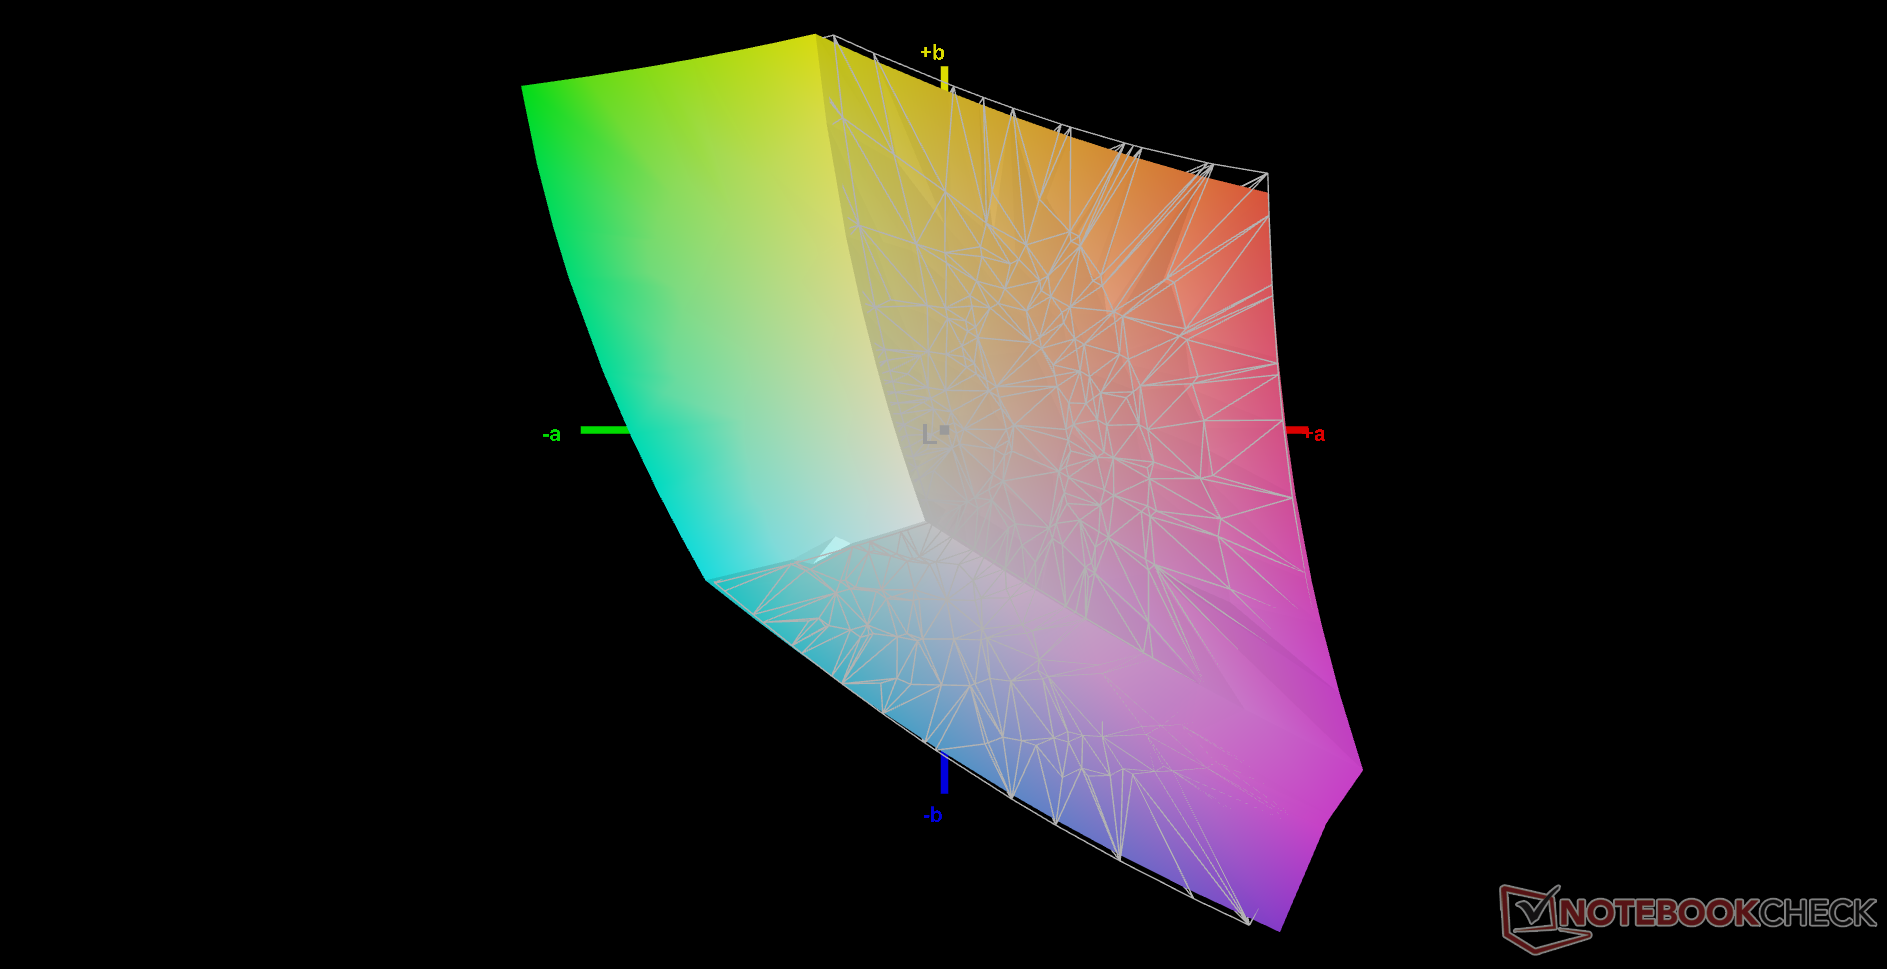
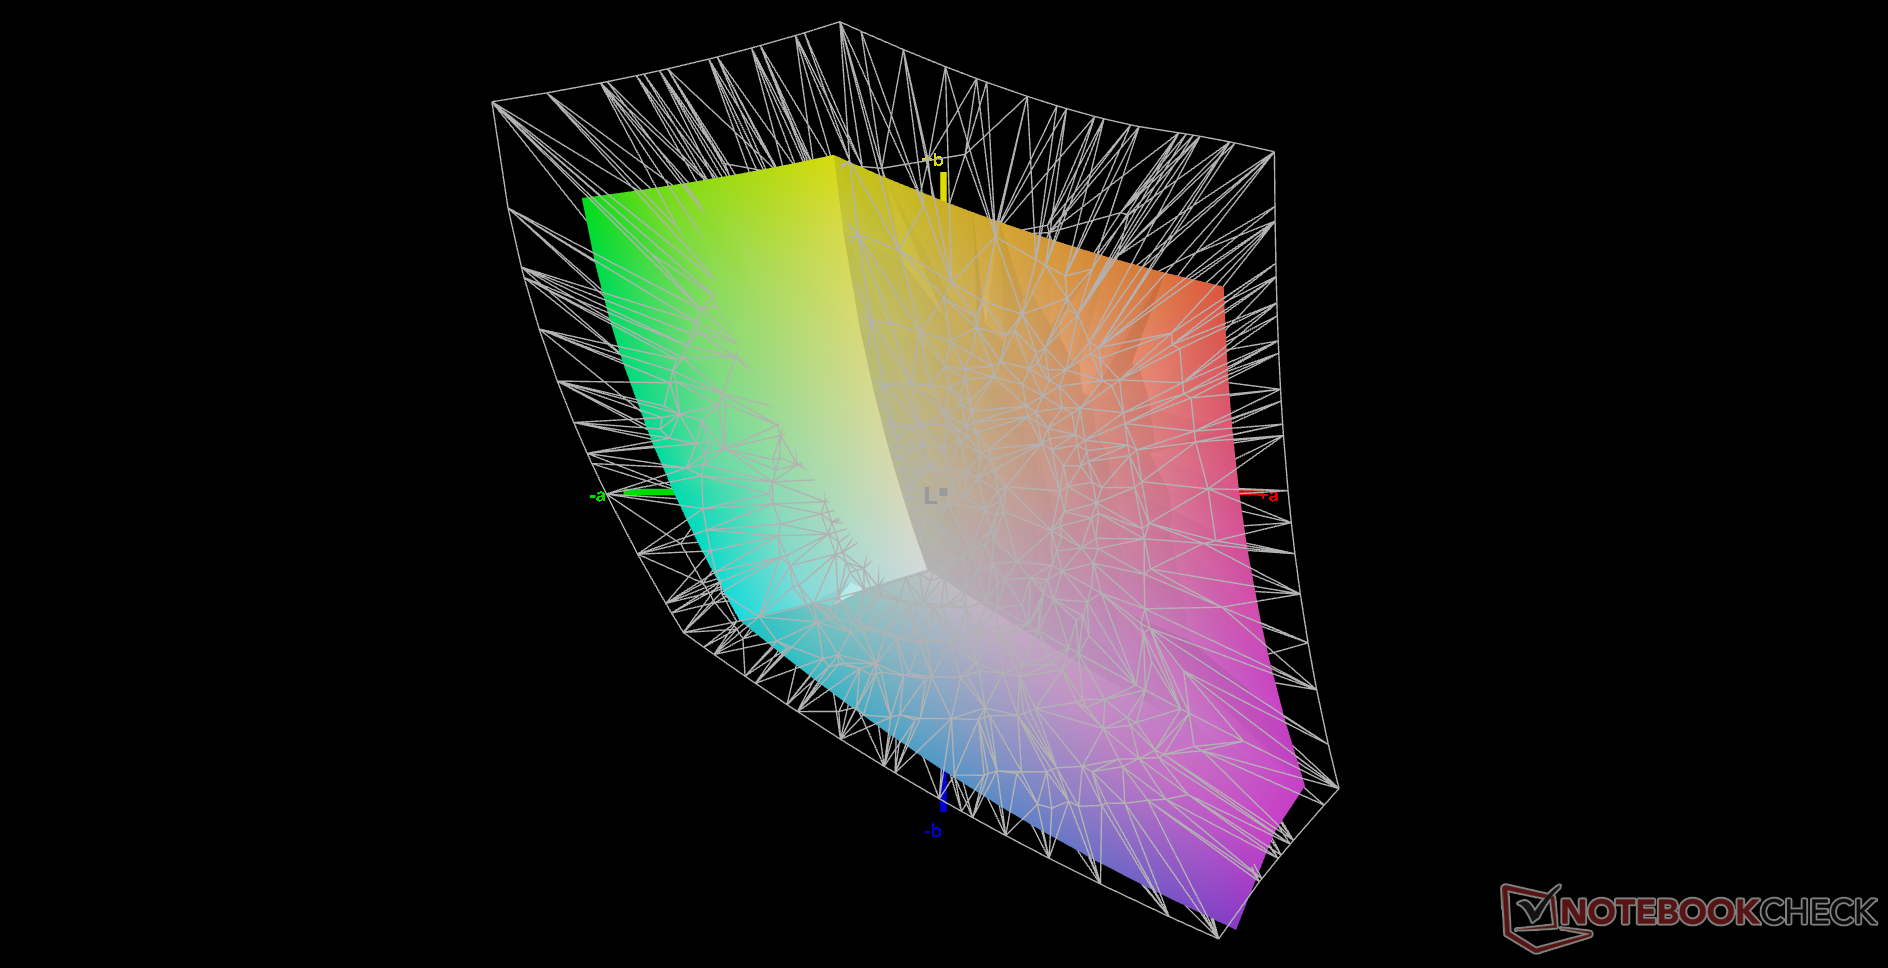
When compared to the 4K OLED option, our FHD IPS panel has slower black-white and gray-gray response times, a dimmer backlight, lower contrast ratio, and a narrower gamut for overall lower picture quality. In return, users get a much faster 240 Hz native refresh rate for reduced screen tearing and smoother gameplay. G-Sync is not supported on the internal monitor, however.

| |||||||||||||||||||||||||
Brightness Distribution: 91 %
Center on Battery: 291.3 cd/m²
Contrast: 832:1 (Black: 0.35 cd/m²)
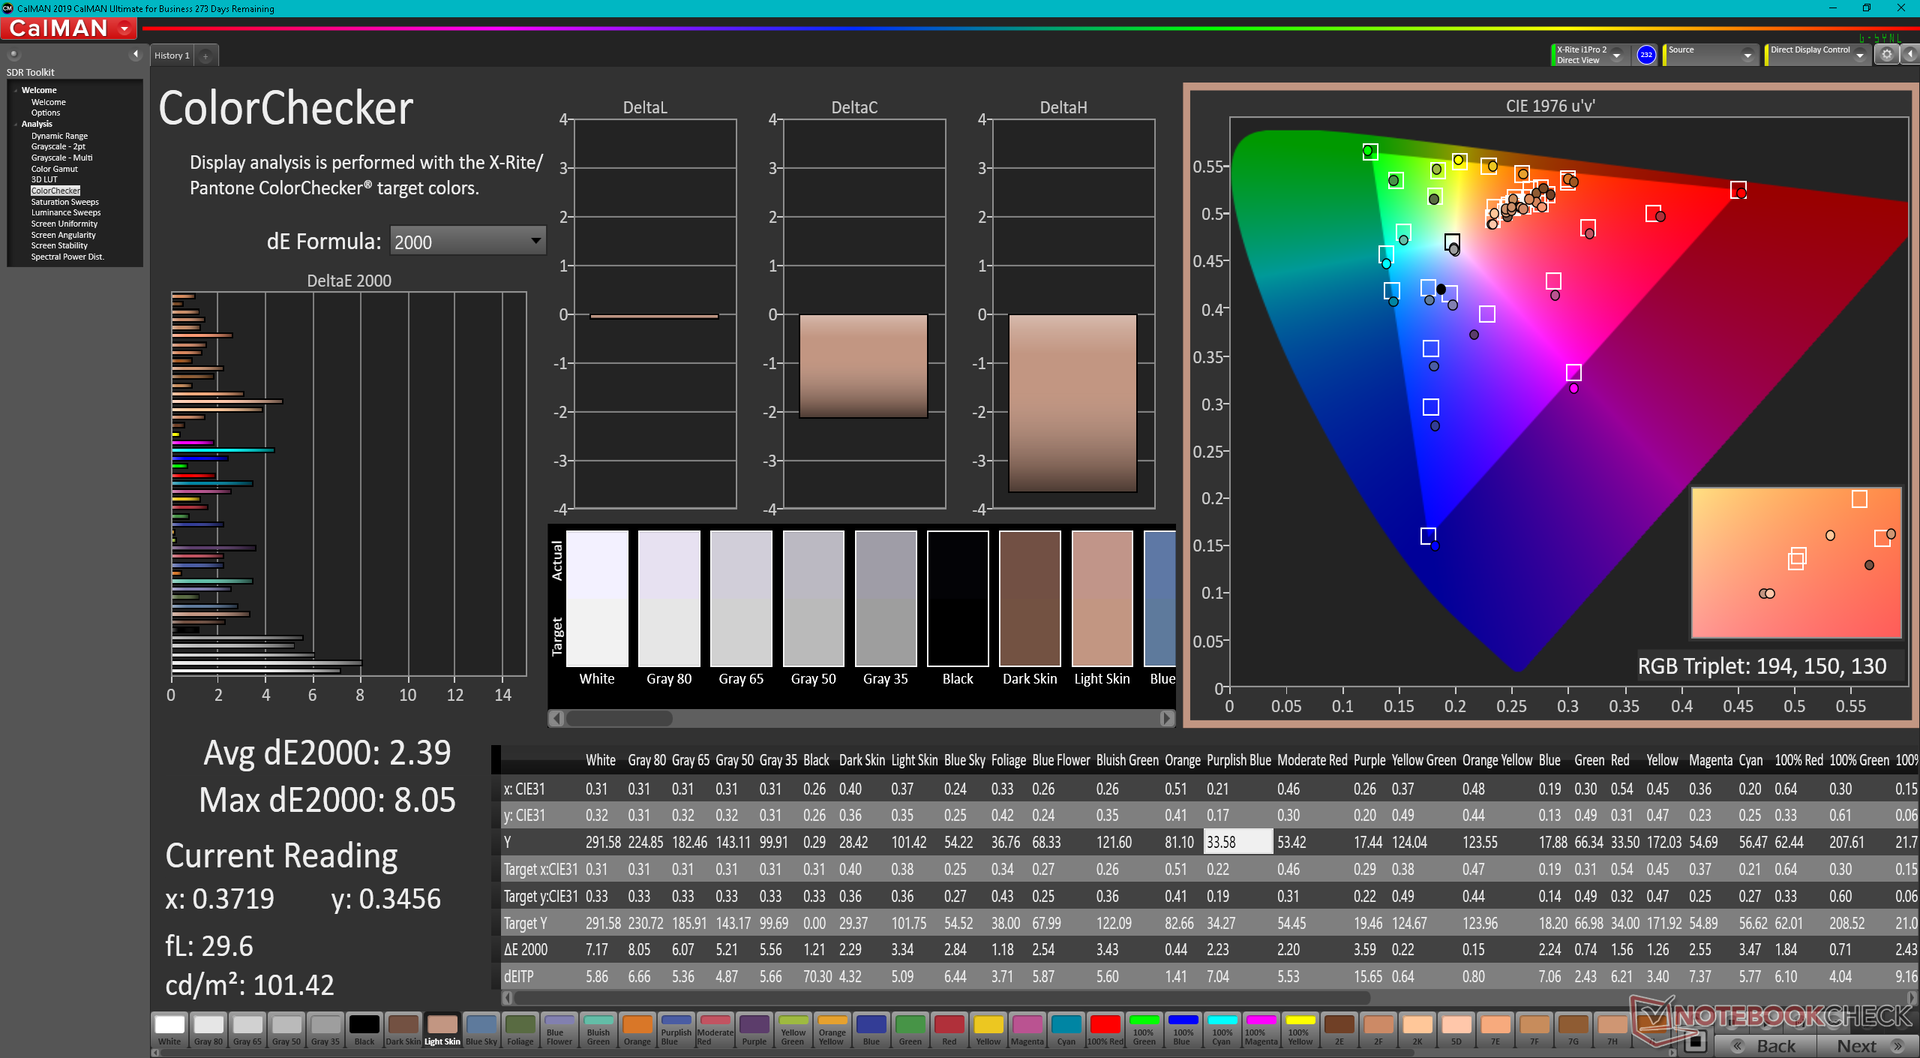
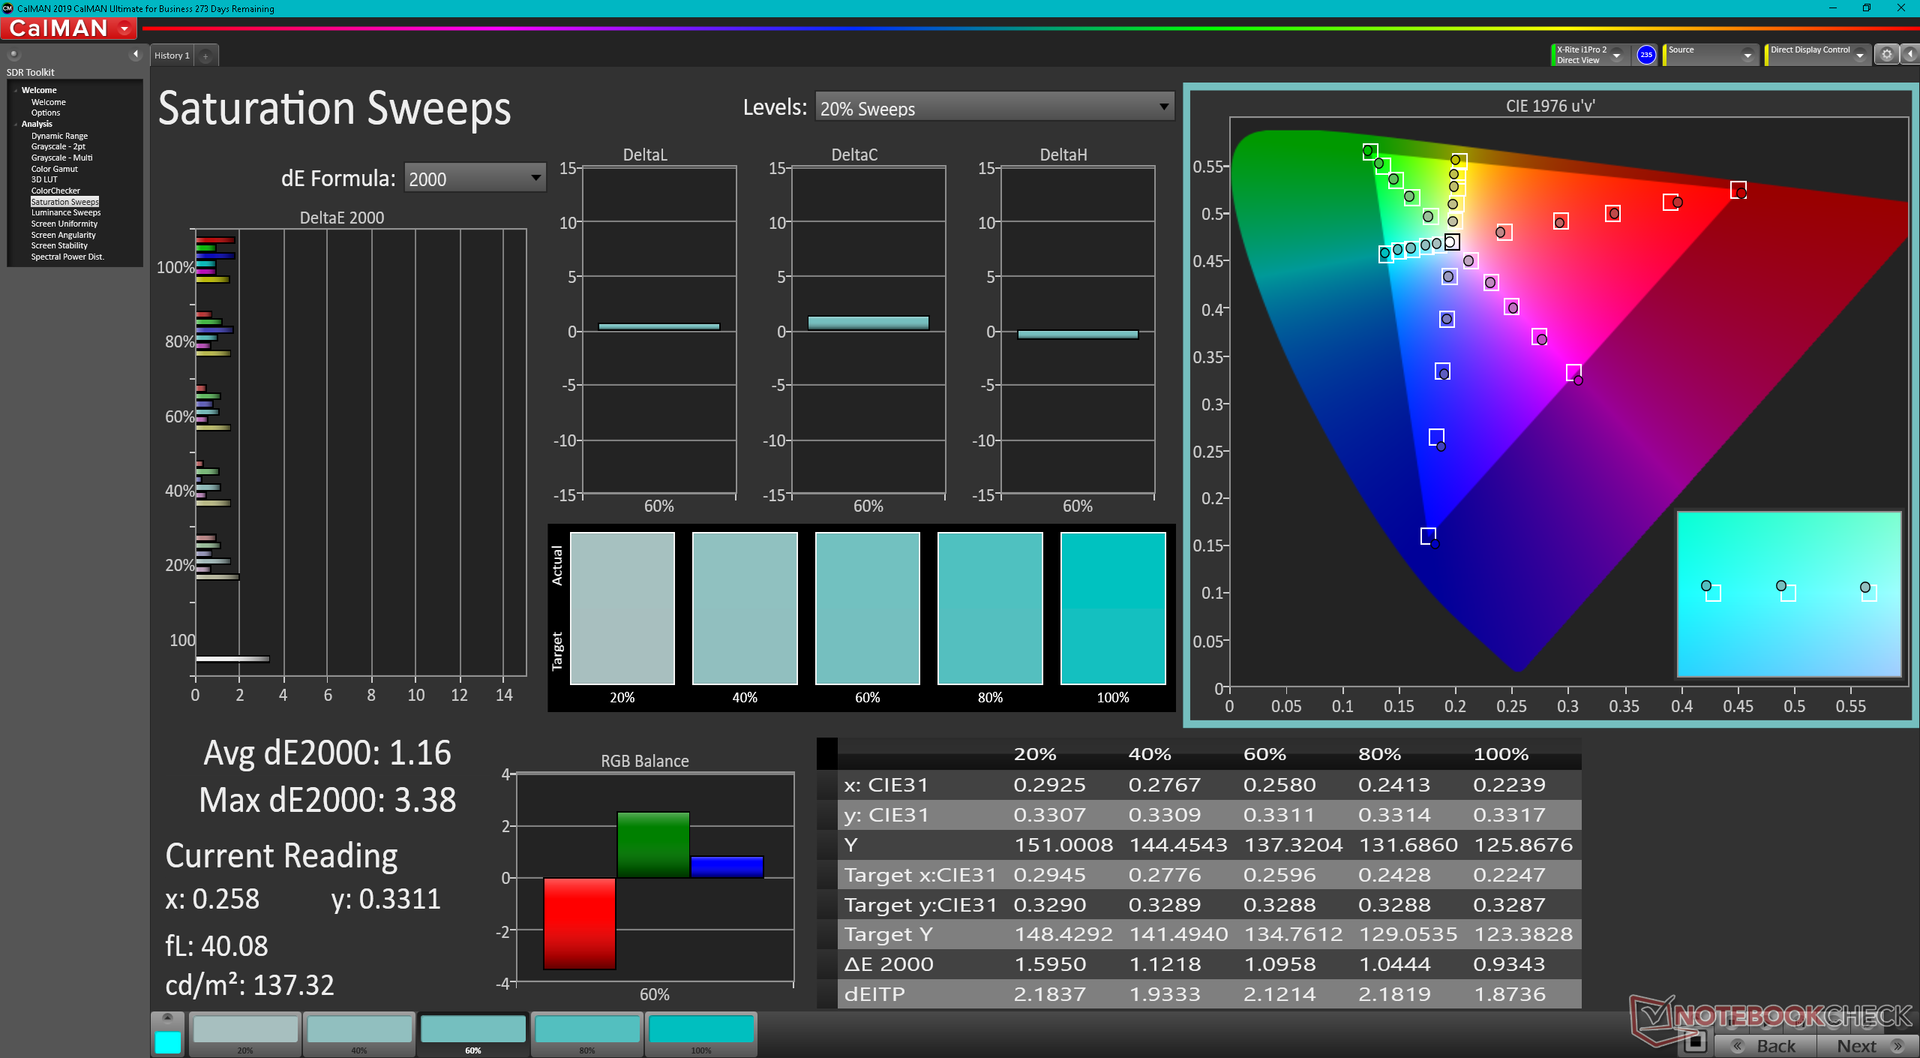
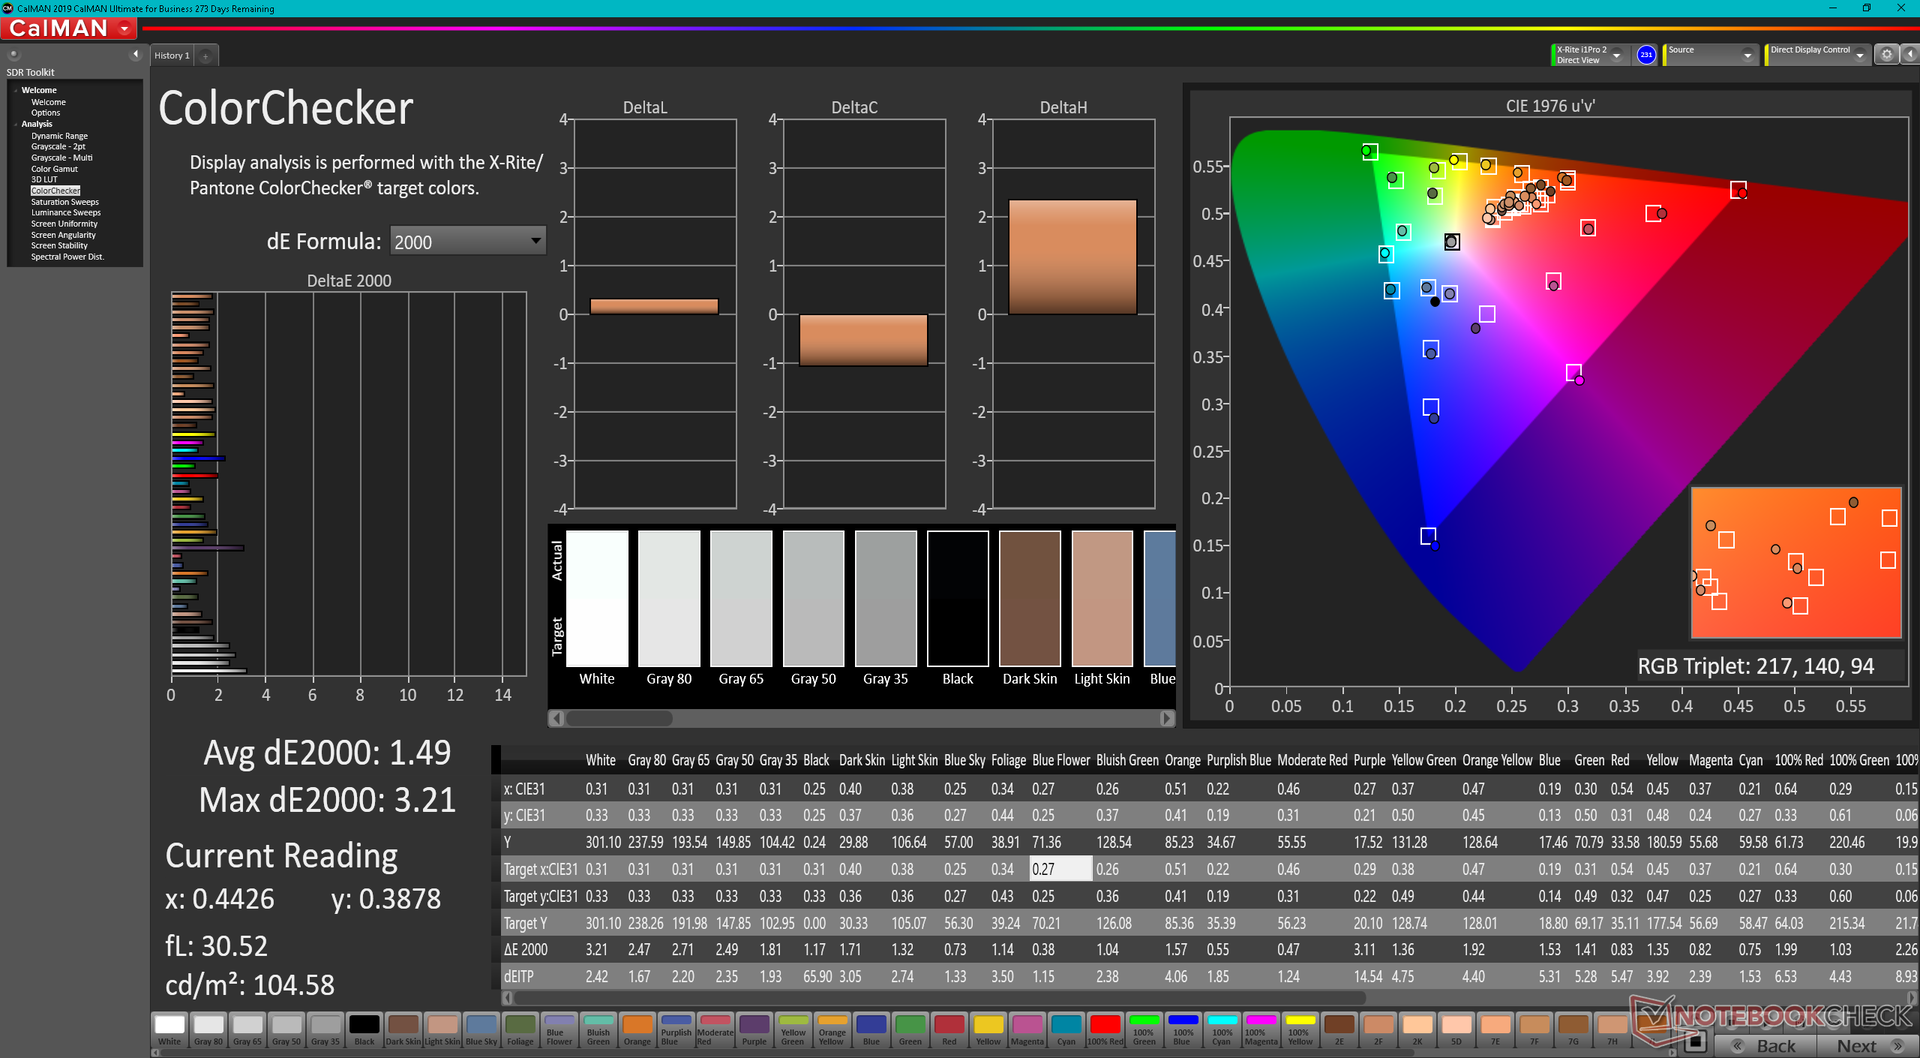
ΔE ColorChecker Calman: 2.39 | ∀{0.5-29.43 Ø4.73}
calibrated: 1.49
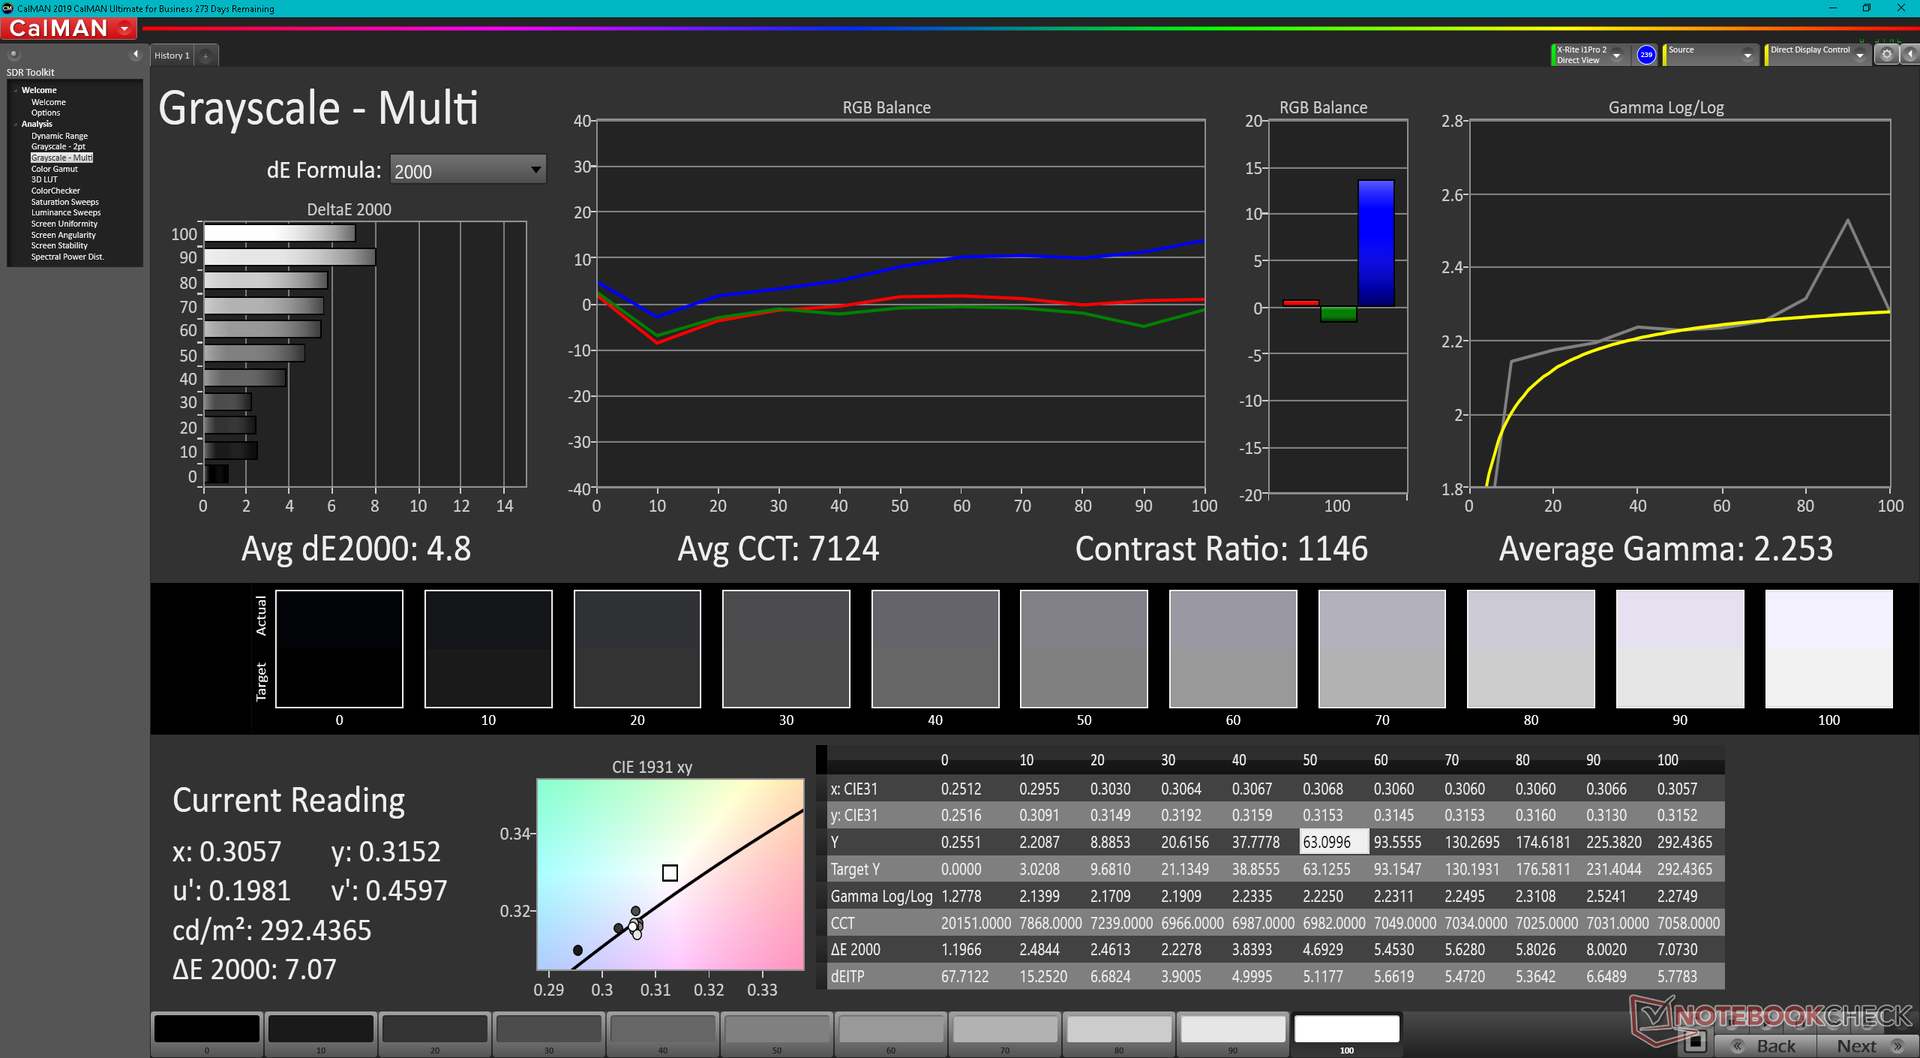
ΔE Greyscale Calman: 4.8 | ∀{0.09-98 Ø4.97}
68.5% AdobeRGB 1998 (Argyll 3D)
98% sRGB (Argyll 3D)
67.5% Display P3 (Argyll 3D)
Gamma: 2.25
CCT: 7124 K
| Eurocom RX315 NH57AF1 Sharp LQ156M1JW03, IPS, 1920x1080, 15.6" | MSI Stealth GS66 12UGS Sharp LQ156T1JW04 (SHP153C), IPS-Level, 2560x1440, 15.6" | Eurocom Nightsky ARX315 Sharp LQ156M1JW03, IPS, 1920x1080, 15.6" | Alienware m15 R6, i7-11800H RTX 3080 AU Optronics AUO9092 (B156HAN), IPS, 1920x1080, 15.6" | Dell G15 5515 BOE092A, IPS, 1920x1080, 15.6" | Razer Blade 15 Advanced (Mid 2021) TL156VDXP02-0, IPS, 1920x1080, 15.6" | |
|---|---|---|---|---|---|---|
| Display | 23% | 4% | 8% | -42% | -0% | |
| Display P3 Coverage (%) | 67.5 | 96.4 43% | 67.9 1% | 74.1 10% | 39.1 -42% | 66.9 -1% |
| sRGB Coverage (%) | 98 | 99.7 2% | 99.7 2% | 99.5 2% | 56.9 -42% | 97.1 -1% |
| AdobeRGB 1998 Coverage (%) | 68.5 | 85.6 25% | 73.7 8% | 75.7 11% | 40.4 -41% | 69 1% |
| Response Times | 35% | -22% | 63% | -94% | 37% | |
| Response Time Grey 50% / Grey 80% * (ms) | 10.4 ? | 6 ? 42% | 15.2 ? -46% | 2.8 73% | 25.2 ? -142% | 4.2 ? 60% |
| Response Time Black / White * (ms) | 11.6 ? | 8.4 ? 28% | 11.2 ? 3% | 5.6 52% | 16.8 ? -45% | 10 ? 14% |
| PWM Frequency (Hz) | 22730 ? | 23150 ? | 200 ? | |||
| Screen | -4% | 10% | -3% | -55% | 21% | |
| Brightness middle (cd/m²) | 291.3 | 272 -7% | 312.8 7% | 359 23% | 278 -5% | 353.4 21% |
| Brightness (cd/m²) | 273 | 253 -7% | 294 8% | 344 26% | 262 -4% | 340 25% |
| Brightness Distribution (%) | 91 | 87 -4% | 90 -1% | 85 -7% | 83 -9% | 92 1% |
| Black Level * (cd/m²) | 0.35 | 0.25 29% | 0.28 20% | 0.35 -0% | 0.36 -3% | 0.31 11% |
| Contrast (:1) | 832 | 1088 31% | 1117 34% | 1026 23% | 772 -7% | 1140 37% |
| Colorchecker dE 2000 * | 2.39 | 3.73 -56% | 2.96 -24% | 3.3 -38% | 5.74 -140% | 2.17 9% |
| Colorchecker dE 2000 max. * | 8.05 | 9.43 -17% | 6.23 23% | 4.84 40% | 19.63 -144% | 5.69 29% |
| Colorchecker dE 2000 calibrated * | 1.49 | 0.98 34% | 3.28 -120% | 4.7 -215% | 1.05 30% | |
| Greyscale dE 2000 * | 4.8 | 6.5 -35% | 4.2 12% | 3.66 24% | 3.1 35% | 3.4 29% |
| Gamma | 2.25 98% | 2.172 101% | 2.32 95% | 2.43 91% | 2.011 109% | 2.2 100% |
| CCT | 7124 91% | 6485 100% | 7145 91% | 5896 110% | 6207 105% | 6830 95% |
| Total Average (Program / Settings) | 18% /
8% | -3% /
4% | 23% /
9% | -64% /
-57% | 19% /
19% |
* ... smaller is better
Color temperature is slightly too cool out of the box. Average grayscale and color deltaE values would improve from 4.8 and 2.39 to 2.1 and 1.49, respectively, after calibrating with our X-Rite colorimeter.
Display Response Times
| ↔ Response Time Black to White | ||
|---|---|---|
| 11.6 ms ... rise ↗ and fall ↘ combined | ↗ 5.6 ms rise | 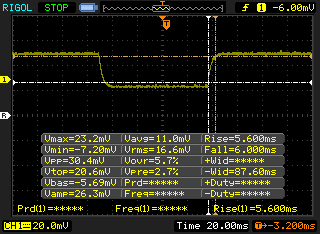 |
| ↘ 6 ms fall | ||
| The screen shows good response rates in our tests, but may be too slow for competitive gamers. In comparison, all tested devices range from 0.1 (minimum) to 240 (maximum) ms. » 31 % of all devices are better. This means that the measured response time is better than the average of all tested devices (19.9 ms). | ||
| ↔ Response Time 50% Grey to 80% Grey | ||
| 10.4 ms ... rise ↗ and fall ↘ combined | ↗ 5.2 ms rise | 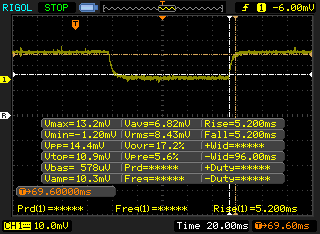 |
| ↘ 5.2 ms fall | ||
| The screen shows good response rates in our tests, but may be too slow for competitive gamers. In comparison, all tested devices range from 0.165 (minimum) to 636 (maximum) ms. » 24 % of all devices are better. This means that the measured response time is better than the average of all tested devices (31.1 ms). | ||
Screen Flickering / PWM (Pulse-Width Modulation)
| Screen flickering / PWM detected | 22730 Hz | ≤ 24 % brightness setting | 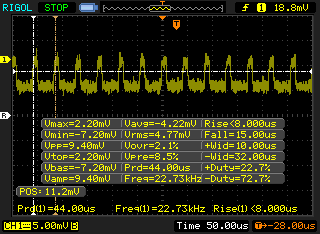 |
The display backlight flickers at 22730 Hz (worst case, e.g., utilizing PWM) Flickering detected at a brightness setting of 24 % and below. There should be no flickering or PWM above this brightness setting. The frequency of 22730 Hz is quite high, so most users sensitive to PWM should not notice any flickering. In comparison: 52 % of all tested devices do not use PWM to dim the display. If PWM was detected, an average of 7798 (minimum: 5 - maximum: 343500) Hz was measured. | |||
Performance
Testing Conditions
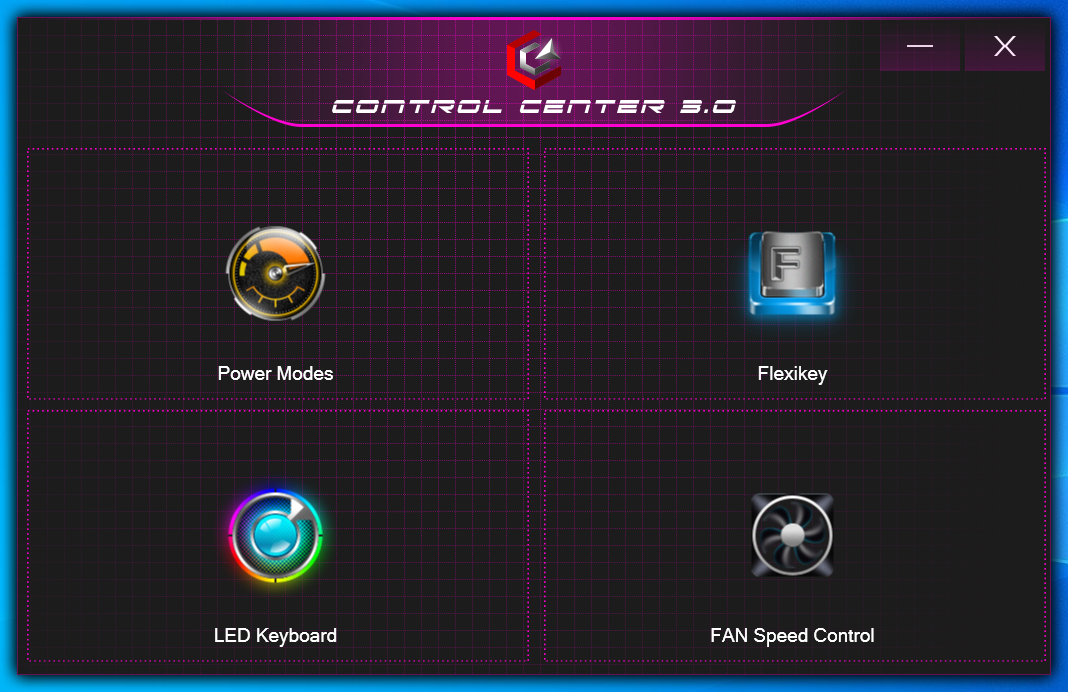
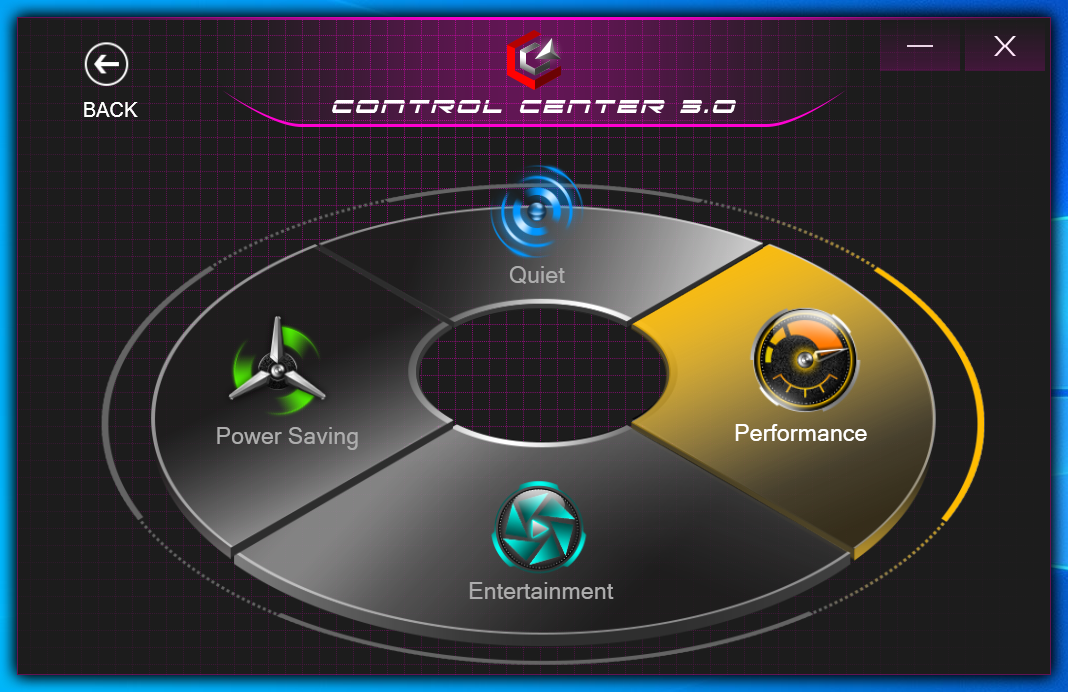
Our unit was set to Performance mode via the Control Center 3.0 software prior to running our performance benchmarks below for the highest possible scores. Users should become familiar with this software as important features are toggled here including keyboard lighting, fan control, and more.
Keep in mind that there is no MUX on the RX315.
Processor
The Core i7-11800H is performing where we expect it to be relative to other laptops equipped with the same CPU. No other processor options are currently available.
Cinebench R15 Multi Loop
Cinebench R20: CPU (Multi Core) | CPU (Single Core)
Cinebench R15: CPU Multi 64Bit | CPU Single 64Bit
Blender: v2.79 BMW27 CPU
7-Zip 18.03: 7z b 4 | 7z b 4 -mmt1
Geekbench 5.5: Multi-Core | Single-Core
HWBOT x265 Benchmark v2.2: 4k Preset
LibreOffice : 20 Documents To PDF
R Benchmark 2.5: Overall mean
| Cinebench R20 / CPU (Multi Core) | |
| Corsair One i300 | |
| MSI Stealth GS66 12UGS | |
| MSI Vector GP66 12UGS | |
| Eurocom Nightsky ARX315 | |
| Schenker XMG Apex 15 NH57E PS | |
| Eurocom RX315 NH57AF1 | |
| Average Intel Core i7-11800H (2498 - 5408, n=50) | |
| Schenker XMG Core 15 Ampere | |
| Alienware m15 R4 RTX 3080 | |
| Gigabyte G5 GD | |
| Razer Blade 15 Advanced Model Early 2021 | |
| Cinebench R20 / CPU (Single Core) | |
| Corsair One i300 | |
| MSI Vector GP66 12UGS | |
| MSI Stealth GS66 12UGS | |
| Eurocom Nightsky ARX315 | |
| Eurocom RX315 NH57AF1 | |
| Average Intel Core i7-11800H (520 - 586, n=47) | |
| Gigabyte G5 GD | |
| Schenker XMG Apex 15 NH57E PS | |
| Schenker XMG Core 15 Ampere | |
| Alienware m15 R4 RTX 3080 | |
| Razer Blade 15 Advanced Model Early 2021 | |
| Cinebench R15 / CPU Single 64Bit | |
| Corsair One i300 | |
| MSI Vector GP66 12UGS | |
| MSI Stealth GS66 12UGS | |
| Eurocom Nightsky ARX315 | |
| Schenker XMG Apex 15 NH57E PS | |
| Eurocom RX315 NH57AF1 | |
| Average Intel Core i7-11800H (201 - 231, n=46) | |
| Gigabyte G5 GD | |
| Razer Blade 15 Advanced Model Early 2021 | |
| Alienware m15 R4 RTX 3080 | |
| Schenker XMG Core 15 Ampere | |
| HWBOT x265 Benchmark v2.2 / 4k Preset | |
| Corsair One i300 | |
| MSI Vector GP66 12UGS | |
| MSI Stealth GS66 12UGS | |
| Eurocom Nightsky ARX315 | |
| Schenker XMG Apex 15 NH57E PS | |
| Eurocom RX315 NH57AF1 | |
| Average Intel Core i7-11800H (7.38 - 17.4, n=46) | |
| Schenker XMG Core 15 Ampere | |
| Alienware m15 R4 RTX 3080 | |
| Gigabyte G5 GD | |
| Razer Blade 15 Advanced Model Early 2021 | |
| LibreOffice / 20 Documents To PDF | |
| Alienware m15 R4 RTX 3080 | |
| Schenker XMG Core 15 Ampere | |
| Razer Blade 15 Advanced Model Early 2021 | |
| Schenker XMG Apex 15 NH57E PS | |
| Eurocom RX315 NH57AF1 | |
| Eurocom Nightsky ARX315 | |
| Average Intel Core i7-11800H (38.6 - 59.9, n=45) | |
| Gigabyte G5 GD | |
| MSI Stealth GS66 12UGS | |
| MSI Vector GP66 12UGS | |
| Corsair One i300 | |
* ... smaller is better
AIDA64: FP32 Ray-Trace | FPU Julia | CPU SHA3 | CPU Queen | FPU SinJulia | FPU Mandel | CPU AES | CPU ZLib | FP64 Ray-Trace | CPU PhotoWorxx
| Performance rating | |
| Eurocom Nightsky ARX315 | |
| Alienware m15 R6, i7-11800H RTX 3080 | |
| Eurocom RX315 NH57AF1 | |
| Dell G15 5515 | |
| MSI Stealth GS66 12UGS | |
| Average Intel Core i7-11800H | |
| Razer Blade 15 Advanced (Mid 2021) -9! | |
| AIDA64 / FP32 Ray-Trace | |
| Alienware m15 R6, i7-11800H RTX 3080 | |
| Eurocom RX315 NH57AF1 | |
| Dell G15 5515 | |
| Average Intel Core i7-11800H (8772 - 15961, n=20) | |
| Eurocom Nightsky ARX315 | |
| MSI Stealth GS66 12UGS | |
| AIDA64 / FPU Julia | |
| Eurocom Nightsky ARX315 | |
| Dell G15 5515 | |
| Alienware m15 R6, i7-11800H RTX 3080 | |
| Eurocom RX315 NH57AF1 | |
| Average Intel Core i7-11800H (39404 - 65636, n=20) | |
| MSI Stealth GS66 12UGS | |
| AIDA64 / CPU SHA3 | |
| Alienware m15 R6, i7-11800H RTX 3080 | |
| Eurocom RX315 NH57AF1 | |
| Average Intel Core i7-11800H (2599 - 4439, n=20) | |
| MSI Stealth GS66 12UGS | |
| Eurocom Nightsky ARX315 | |
| Dell G15 5515 | |
| AIDA64 / CPU Queen | |
| Eurocom Nightsky ARX315 | |
| MSI Stealth GS66 12UGS | |
| Dell G15 5515 | |
| Alienware m15 R6, i7-11800H RTX 3080 | |
| Eurocom RX315 NH57AF1 | |
| Average Intel Core i7-11800H (85233 - 91941, n=20) | |
| AIDA64 / FPU SinJulia | |
| Eurocom Nightsky ARX315 | |
| Dell G15 5515 | |
| MSI Stealth GS66 12UGS | |
| Alienware m15 R6, i7-11800H RTX 3080 | |
| Eurocom RX315 NH57AF1 | |
| Average Intel Core i7-11800H (6420 - 9792, n=20) | |
| AIDA64 / FPU Mandel | |
| Eurocom Nightsky ARX315 | |
| Dell G15 5515 | |
| Alienware m15 R6, i7-11800H RTX 3080 | |
| Eurocom RX315 NH57AF1 | |
| Average Intel Core i7-11800H (23365 - 39464, n=20) | |
| MSI Stealth GS66 12UGS | |
| AIDA64 / CPU AES | |
| Alienware m15 R6, i7-11800H RTX 3080 | |
| Eurocom RX315 NH57AF1 | |
| Eurocom Nightsky ARX315 | |
| Average Intel Core i7-11800H (74617 - 149388, n=20) | |
| Dell G15 5515 | |
| MSI Stealth GS66 12UGS | |
| AIDA64 / CPU ZLib | |
| MSI Stealth GS66 12UGS | |
| Eurocom Nightsky ARX315 | |
| Alienware m15 R6, i7-11800H RTX 3080 | |
| Eurocom RX315 NH57AF1 | |
| Dell G15 5515 | |
| Average Intel Core i7-11800H (461 - 830, n=43) | |
| Razer Blade 15 Advanced (Mid 2021) | |
| AIDA64 / FP64 Ray-Trace | |
| Alienware m15 R6, i7-11800H RTX 3080 | |
| Eurocom RX315 NH57AF1 | |
| Dell G15 5515 | |
| Average Intel Core i7-11800H (4545 - 8717, n=21) | |
| Eurocom Nightsky ARX315 | |
| MSI Stealth GS66 12UGS | |
| AIDA64 / CPU PhotoWorxx | |
| MSI Stealth GS66 12UGS | |
| Alienware m15 R6, i7-11800H RTX 3080 | |
| Eurocom RX315 NH57AF1 | |
| Average Intel Core i7-11800H (11898 - 26757, n=21) | |
| Eurocom Nightsky ARX315 | |
| Dell G15 5515 | |
System Performance
| PCMark 10 / Score | |
| MSI Stealth GS66 12UGS | |
| Razer Blade 15 Advanced (Mid 2021) | |
| Eurocom Nightsky ARX315 | |
| Alienware m15 R6, i7-11800H RTX 3080 | |
| Eurocom RX315 NH57AF1 | |
| Average Intel Core i7-11800H, NVIDIA GeForce RTX 3070 Laptop GPU (6126 - 7311, n=11) | |
| Dell G15 5515 | |
| PCMark 10 / Essentials | |
| Razer Blade 15 Advanced (Mid 2021) | |
| MSI Stealth GS66 12UGS | |
| Eurocom Nightsky ARX315 | |
| Eurocom RX315 NH57AF1 | |
| Average Intel Core i7-11800H, NVIDIA GeForce RTX 3070 Laptop GPU (9248 - 10832, n=11) | |
| Alienware m15 R6, i7-11800H RTX 3080 | |
| Dell G15 5515 | |
| PCMark 10 / Productivity | |
| MSI Stealth GS66 12UGS | |
| Eurocom Nightsky ARX315 | |
| Alienware m15 R6, i7-11800H RTX 3080 | |
| Eurocom RX315 NH57AF1 | |
| Average Intel Core i7-11800H, NVIDIA GeForce RTX 3070 Laptop GPU (8571 - 9669, n=11) | |
| Razer Blade 15 Advanced (Mid 2021) | |
| Dell G15 5515 | |
| PCMark 10 / Digital Content Creation | |
| MSI Stealth GS66 12UGS | |
| Razer Blade 15 Advanced (Mid 2021) | |
| Alienware m15 R6, i7-11800H RTX 3080 | |
| Eurocom Nightsky ARX315 | |
| Eurocom RX315 NH57AF1 | |
| Average Intel Core i7-11800H, NVIDIA GeForce RTX 3070 Laptop GPU (7627 - 10851, n=11) | |
| Dell G15 5515 | |
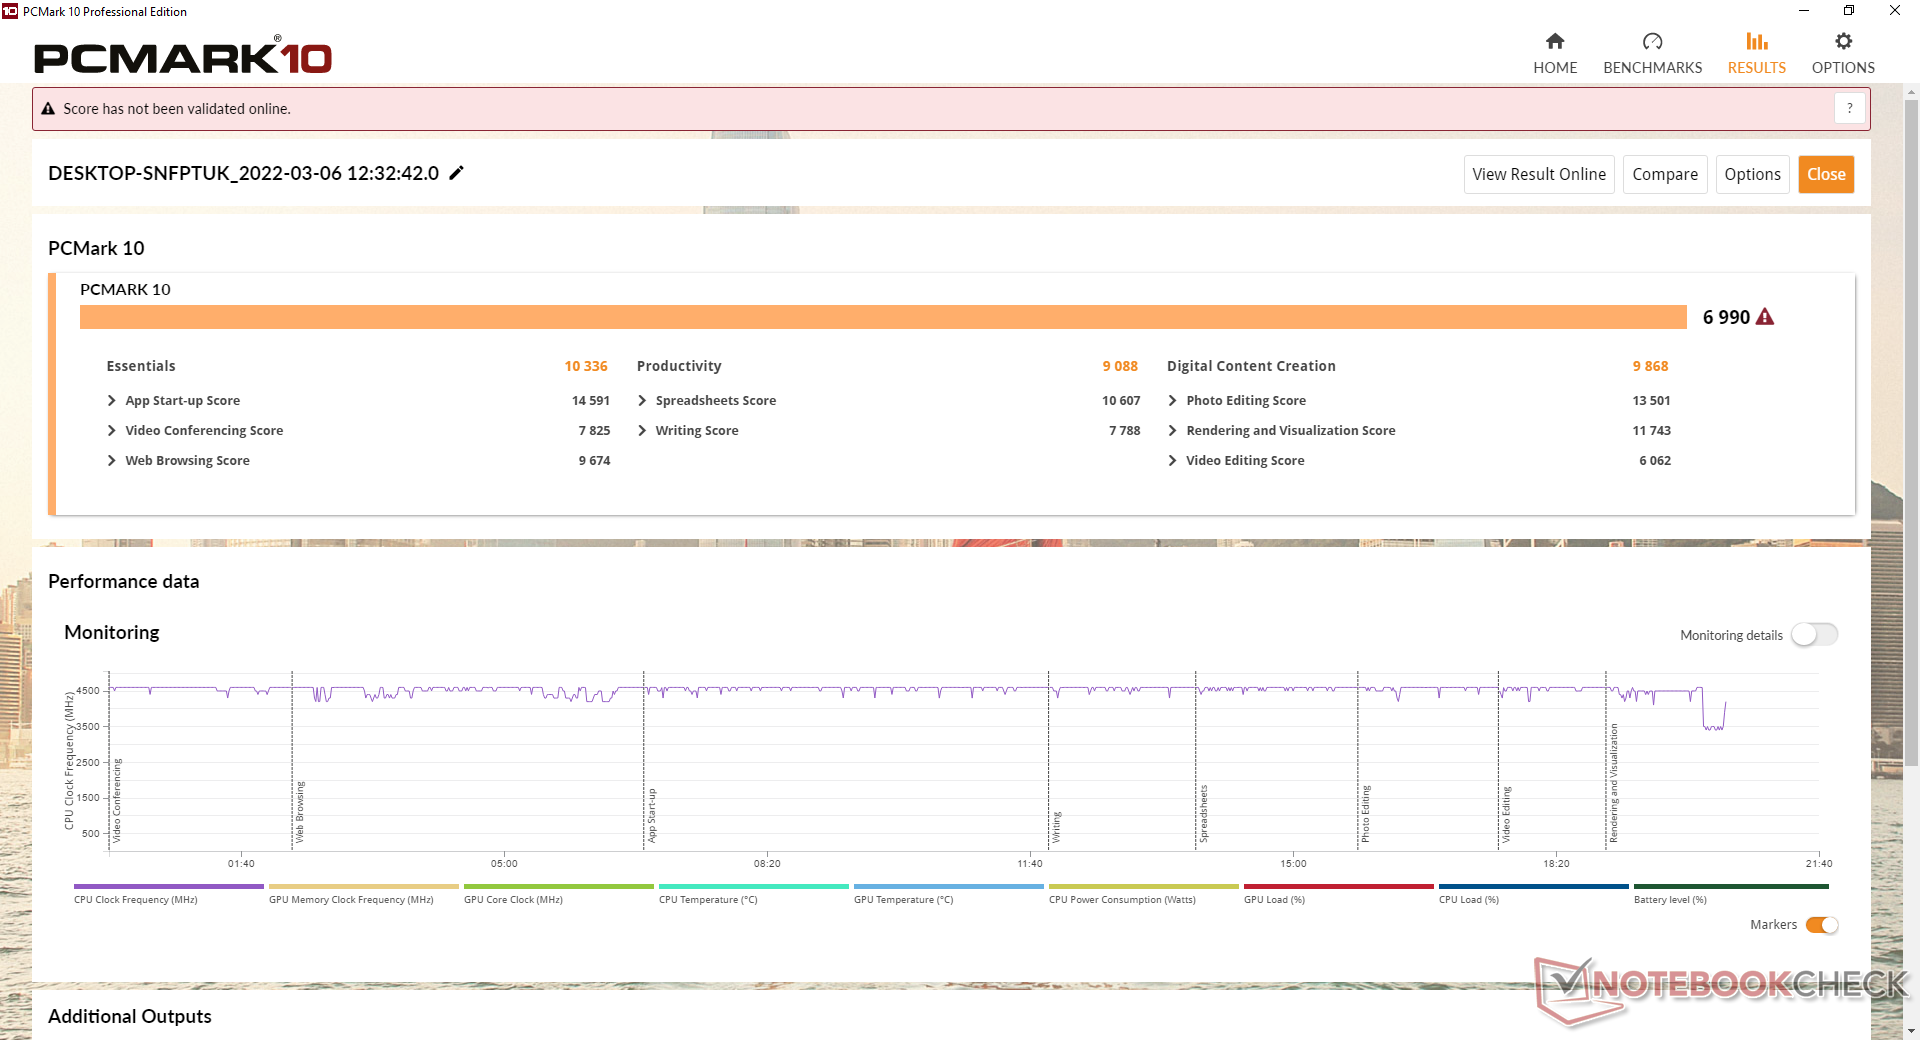
| PCMark 10 Score | 6990 points | |
Help | ||
| AIDA64 / Memory Copy | |
| MSI Stealth GS66 12UGS | |
| Alienware m15 R6, i7-11800H RTX 3080 | |
| Eurocom RX315 NH57AF1 | |
| Average Intel Core i7-11800H (24508 - 48144, n=21) | |
| Eurocom Nightsky ARX315 | |
| Dell G15 5515 | |
| AIDA64 / Memory Read | |
| MSI Stealth GS66 12UGS | |
| Alienware m15 R6, i7-11800H RTX 3080 | |
| Eurocom RX315 NH57AF1 | |
| Eurocom Nightsky ARX315 | |
| Average Intel Core i7-11800H (25882 - 50365, n=20) | |
| Dell G15 5515 | |
| AIDA64 / Memory Write | |
| MSI Stealth GS66 12UGS | |
| Eurocom Nightsky ARX315 | |
| Alienware m15 R6, i7-11800H RTX 3080 | |
| Eurocom RX315 NH57AF1 | |
| Average Intel Core i7-11800H (22240 - 46214, n=20) | |
| Dell G15 5515 | |
| AIDA64 / Memory Latency | |
| Alienware m15 R6, i7-11800H RTX 3080 | |
| MSI Stealth GS66 12UGS | |
| Eurocom RX315 NH57AF1 | |
| Dell G15 5515 | |
| Eurocom Nightsky ARX315 | |
| Average Intel Core i7-11800H (71.9 - 104.1, n=44) | |
| Razer Blade 15 Advanced (Mid 2021) | |
* ... smaller is better
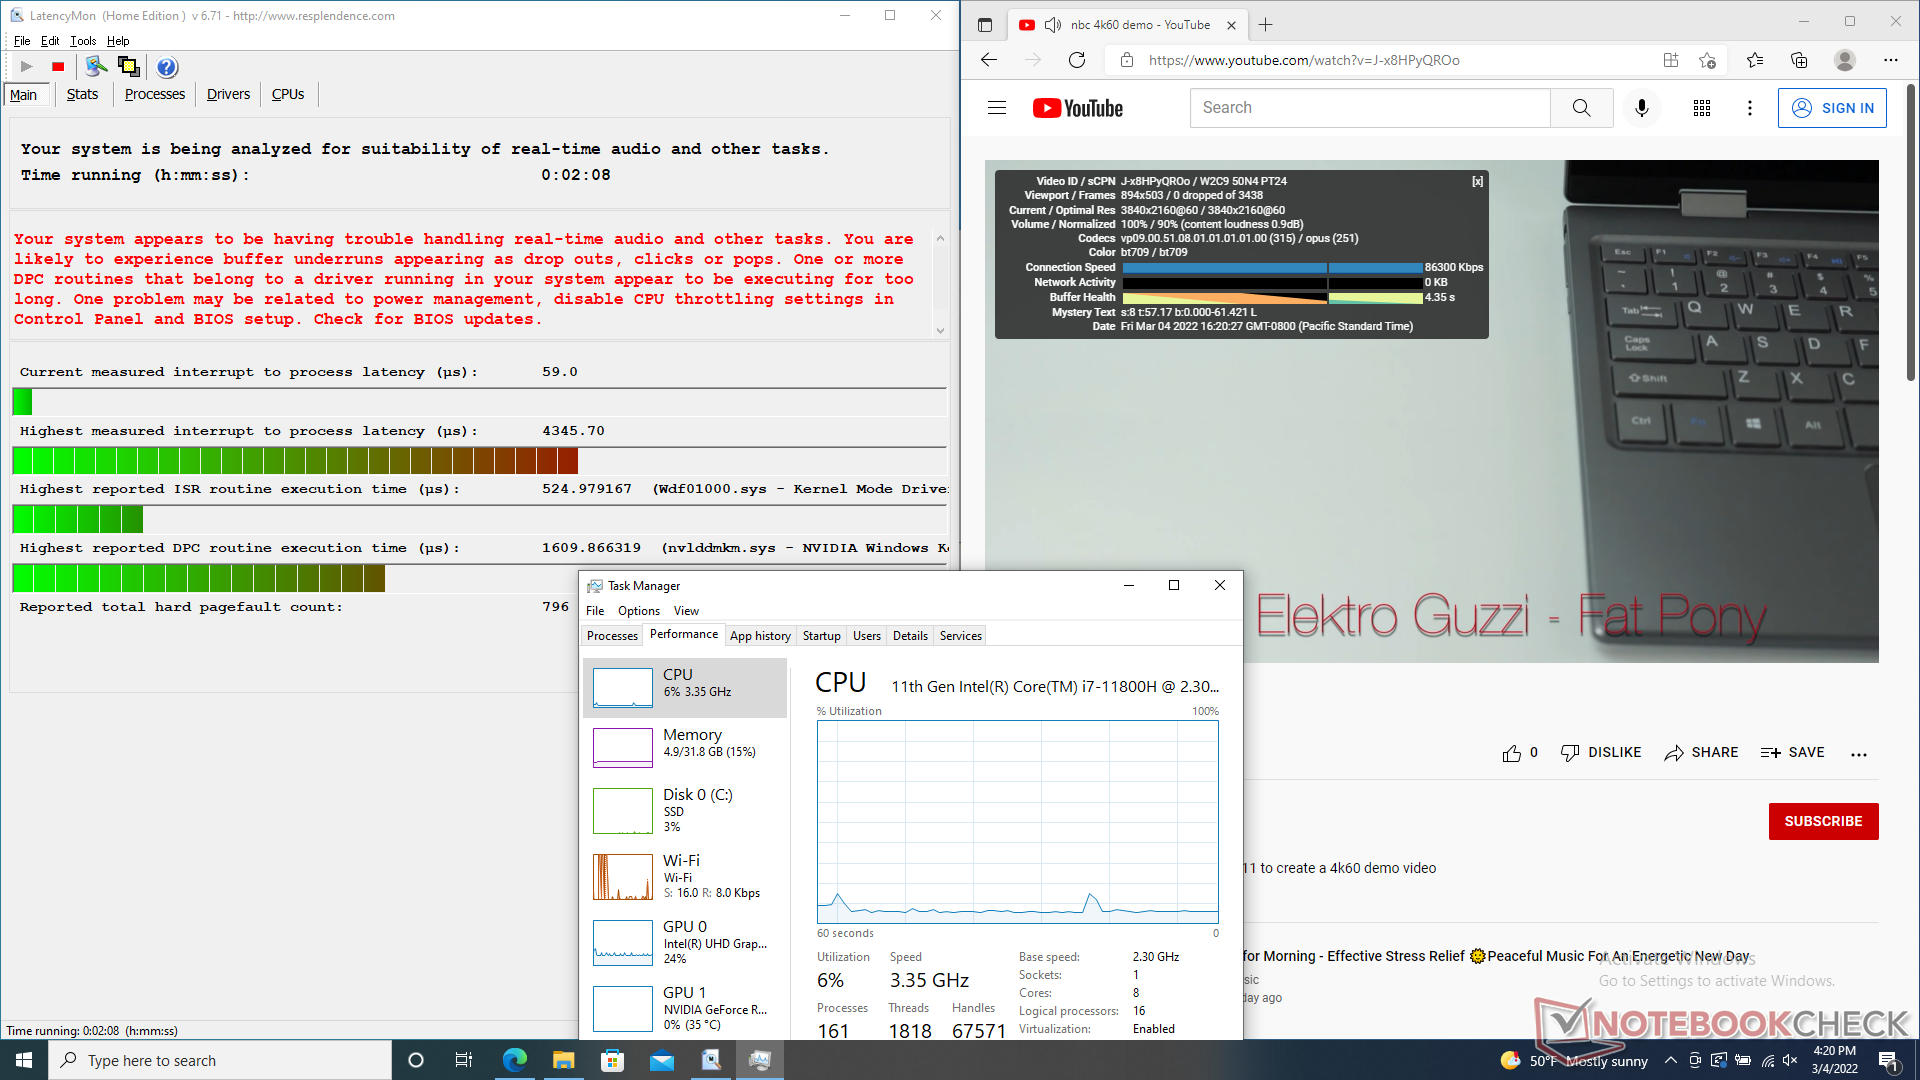
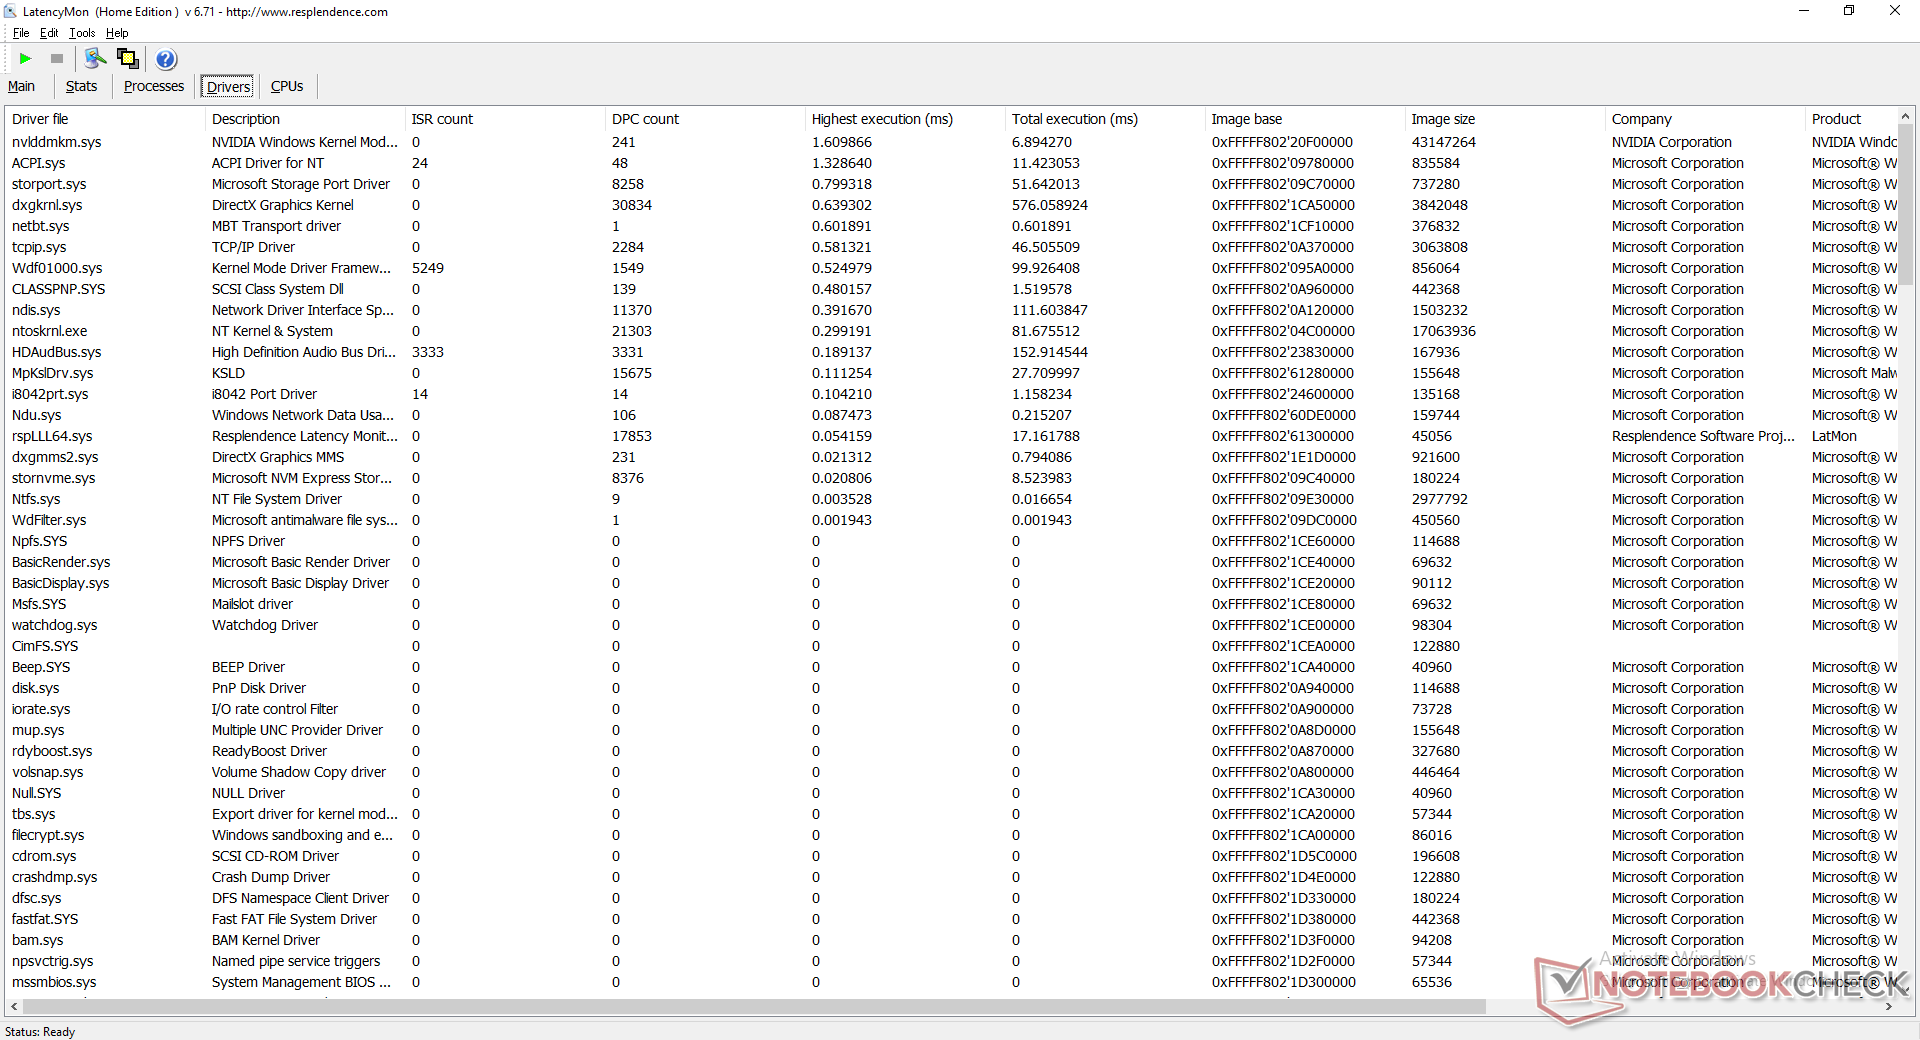
DPC Latency
LatencyMon reveals DPC issues when opening multiple browser tabs of our homepage. 4K UHD video playback at 60 FPS is otherwise smooth with no dropped frames.
| DPC Latencies / LatencyMon - interrupt to process latency (max), Web, Youtube, Prime95 | |
| Razer Blade 15 Advanced (Mid 2021) | |
| Eurocom RX315 NH57AF1 | |
| MSI Stealth GS66 12UGS | |
| Alienware m15 R6, i7-11800H RTX 3080 | |
| Dell G15 5515 | |
| Eurocom Nightsky ARX315 | |
* ... smaller is better
Storage Devices
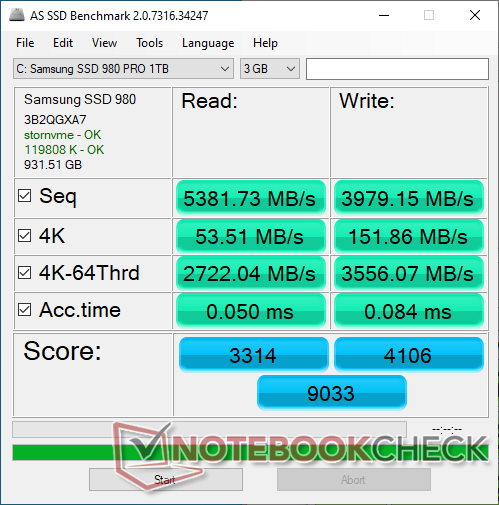
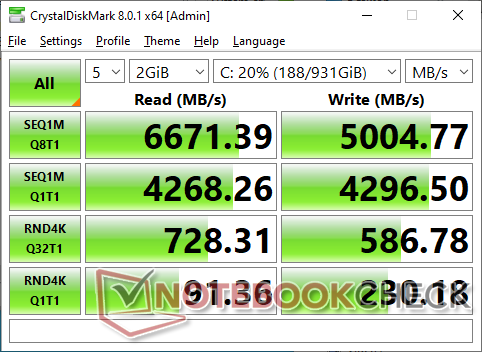
The PCIe4 x4 1 TB Samsung SSD 980 Pro in our unit can reach transfer rates of up to 6500 MB/s. Performance sustainability is also pretty good as this maximum rate would fall just slightly to 5900 MB/s during the latter third of our DiskSpd stress test.

* ... smaller is better
Disk Throttling: DiskSpd Read Loop, Queue Depth 8
GPU Performance
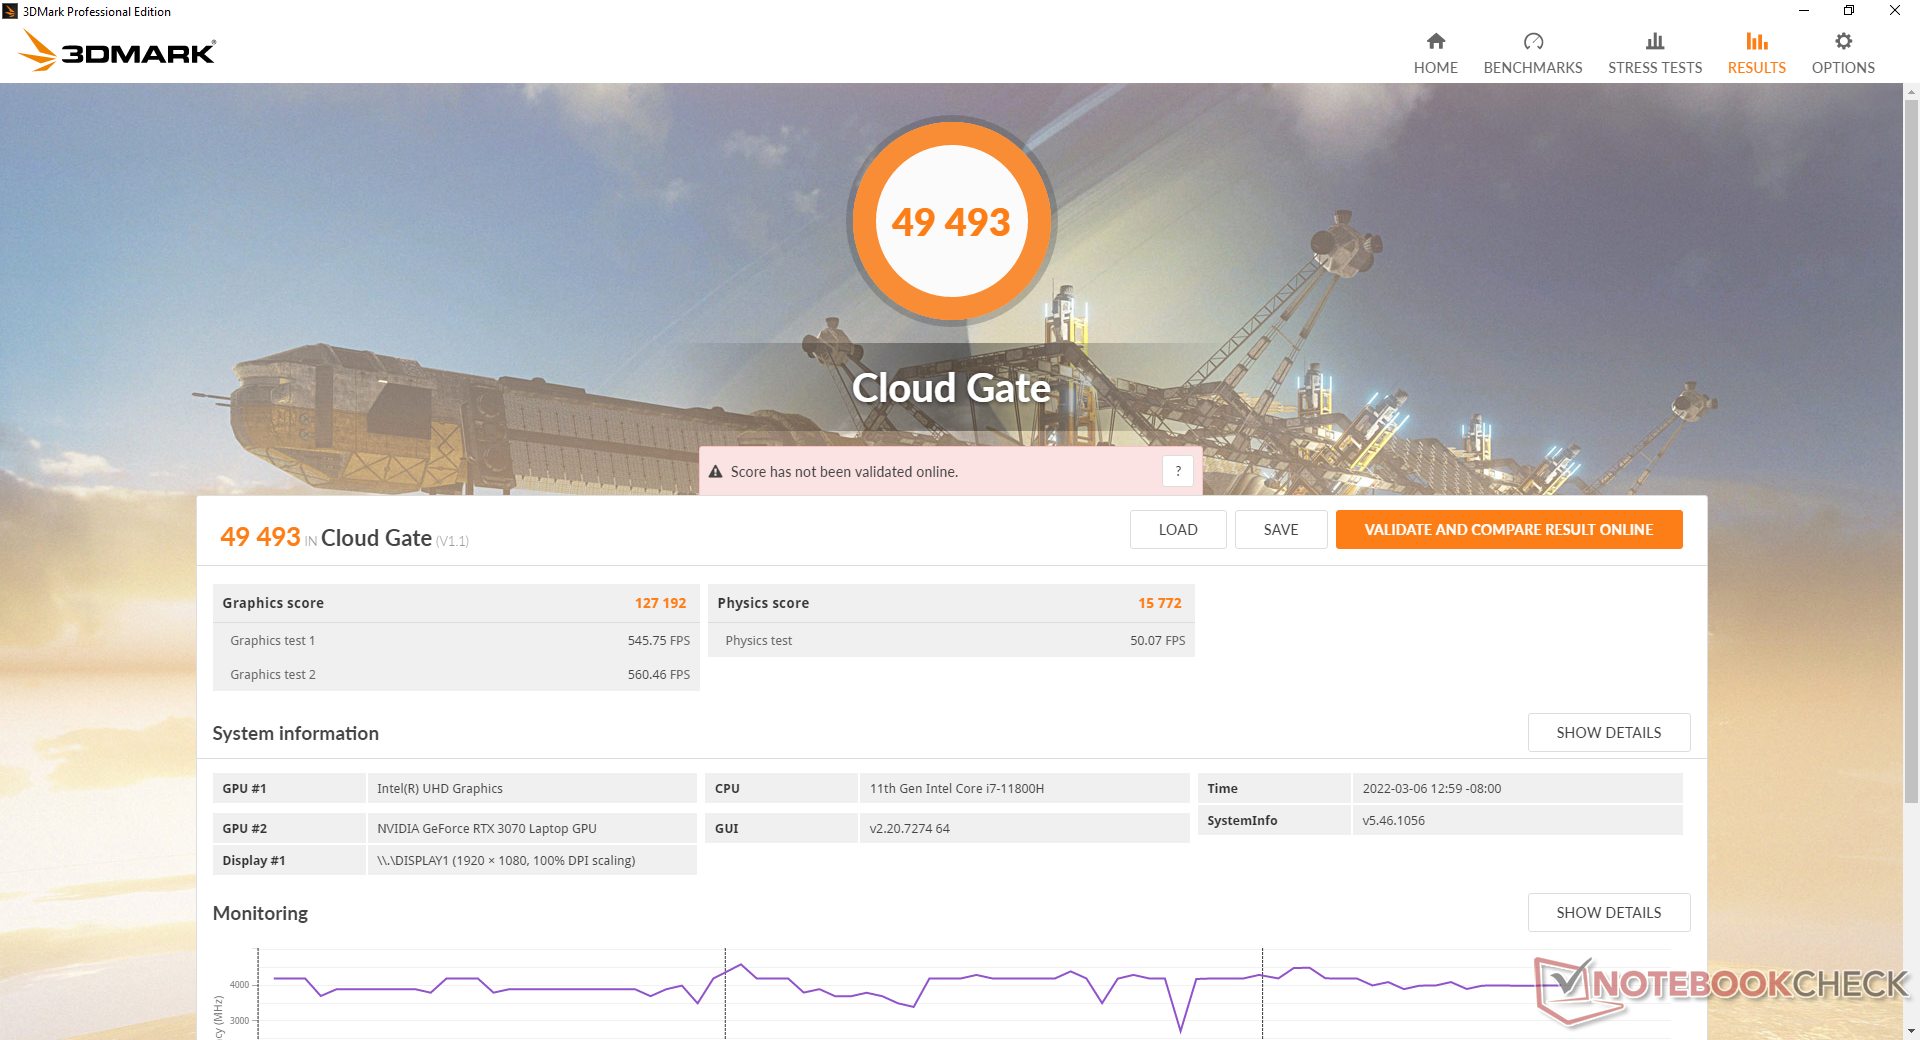
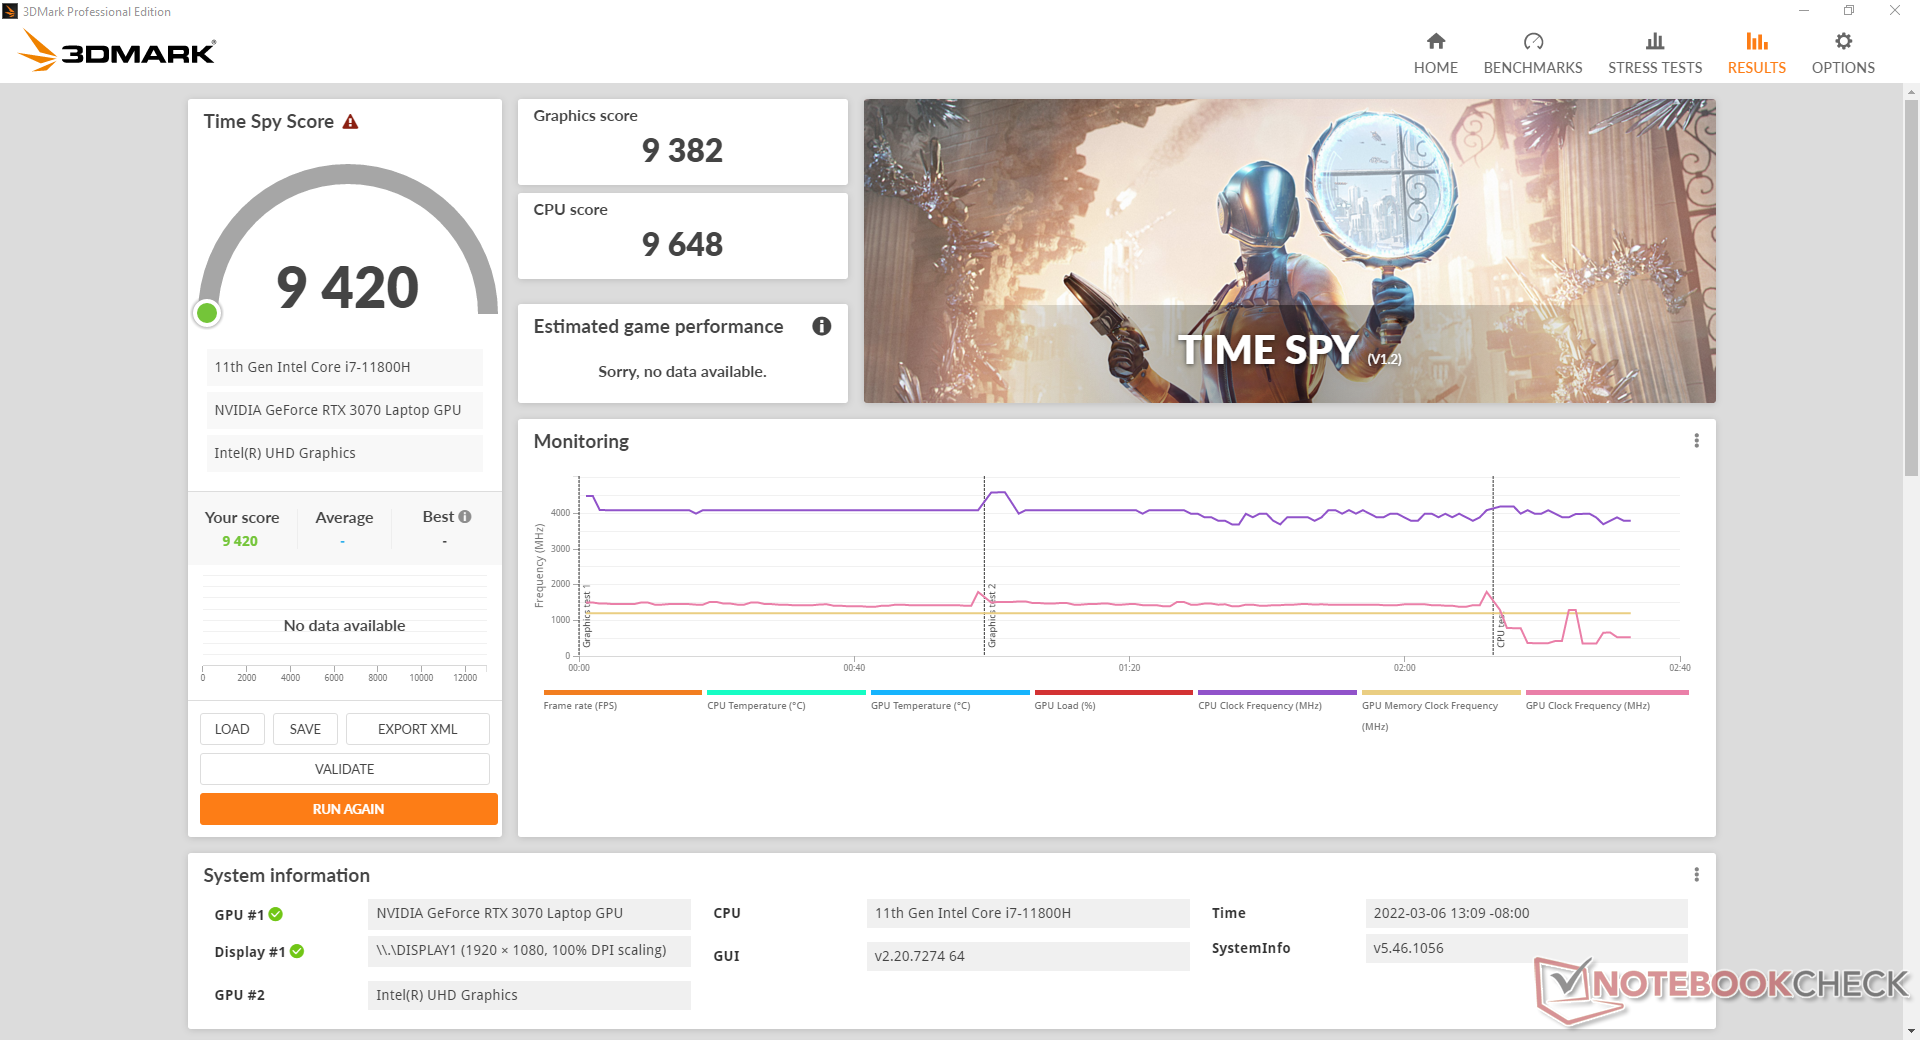
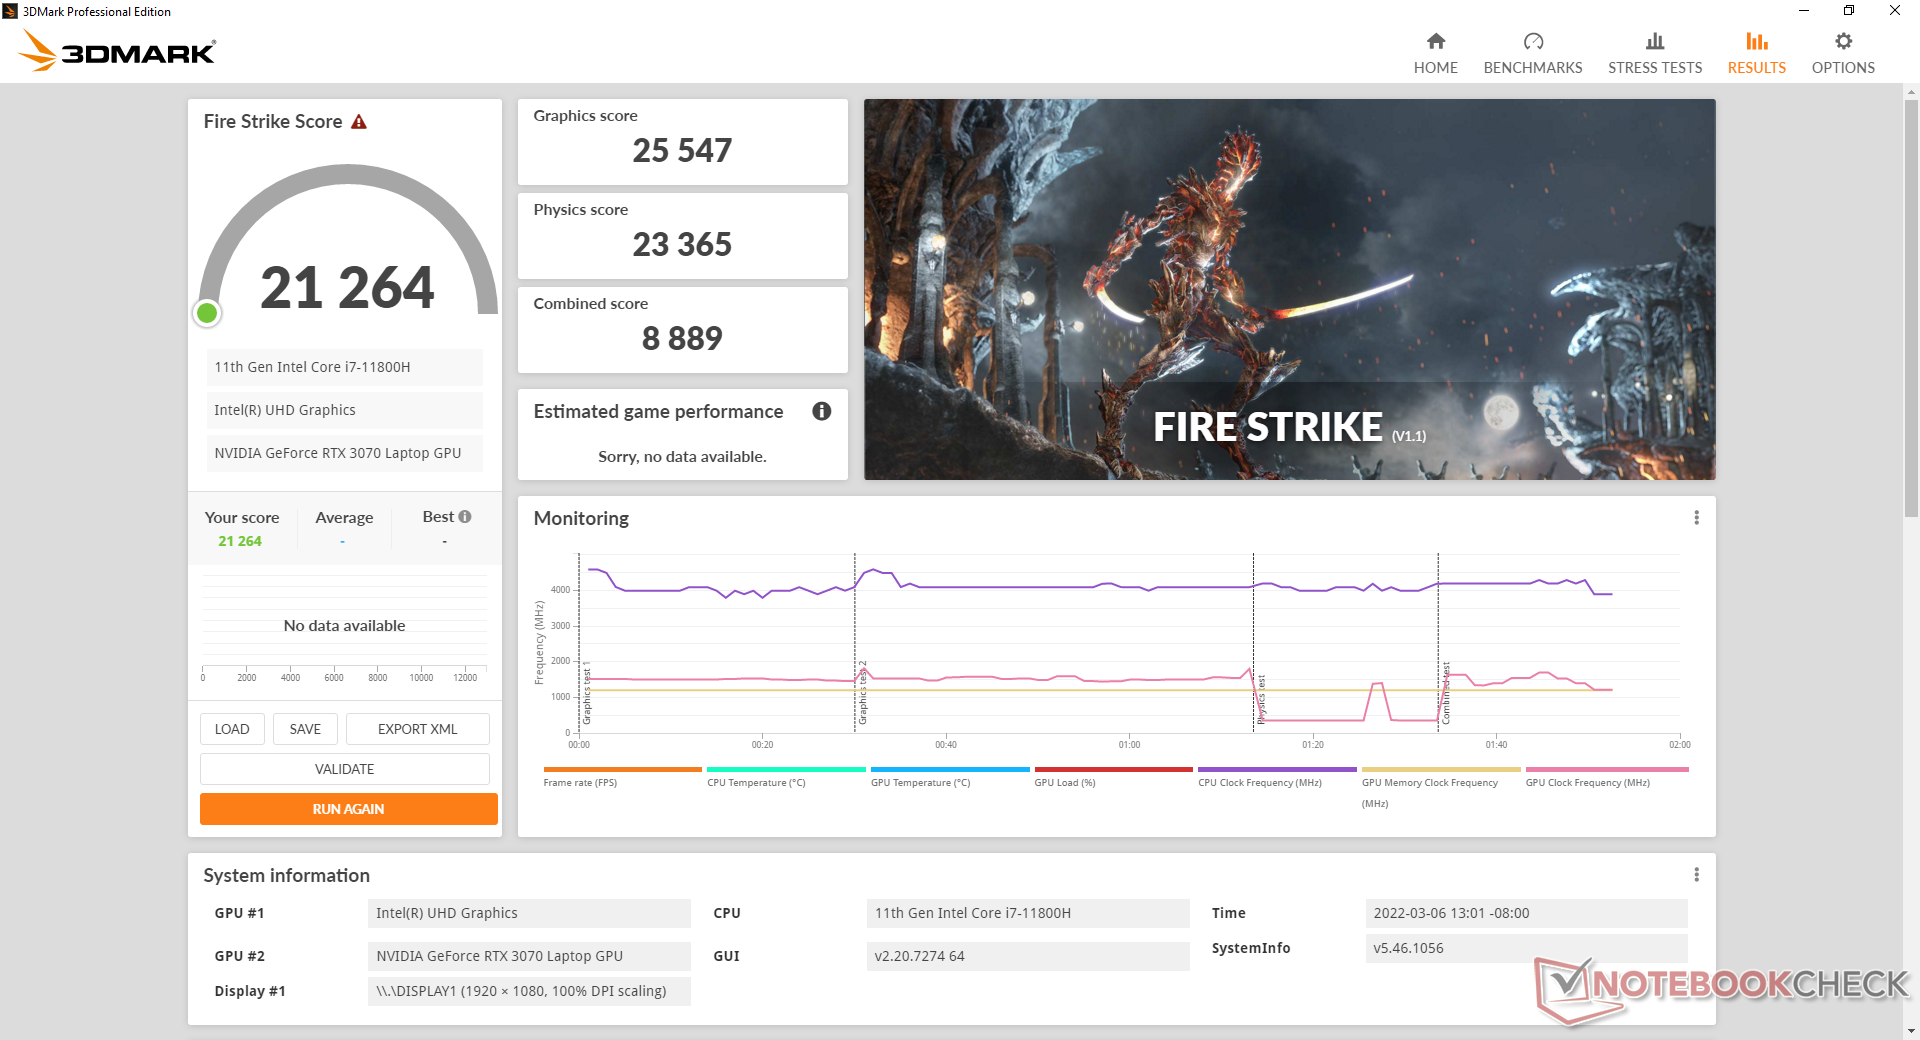
The 105 W GeForce RTX 3070 is about 15 to 20 percent slower than the new 150 W GeForce RTX 3070 Ti. Overall performance is where we expect it to be relative to other laptops with the same mobile RTX 3070 GPU.
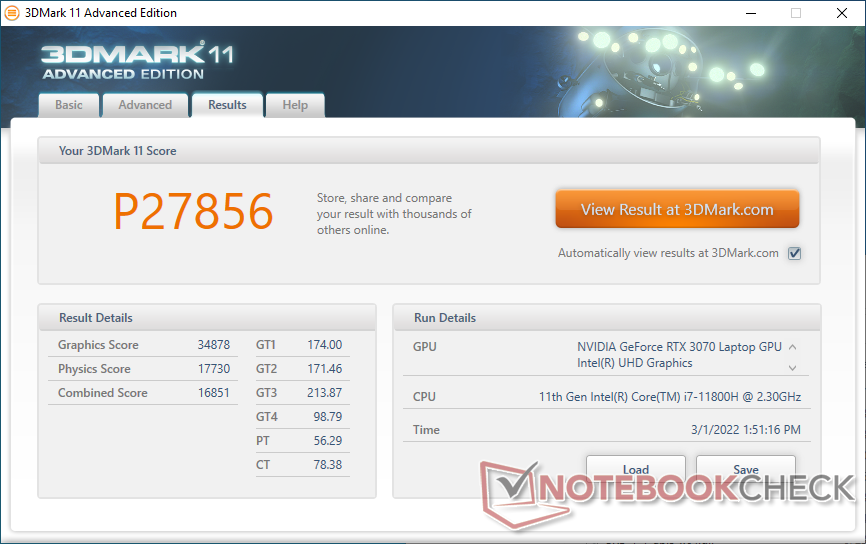
| 3DMark 11 Performance | 27856 points | |
| 3DMark Cloud Gate Standard Score | 49493 points | |
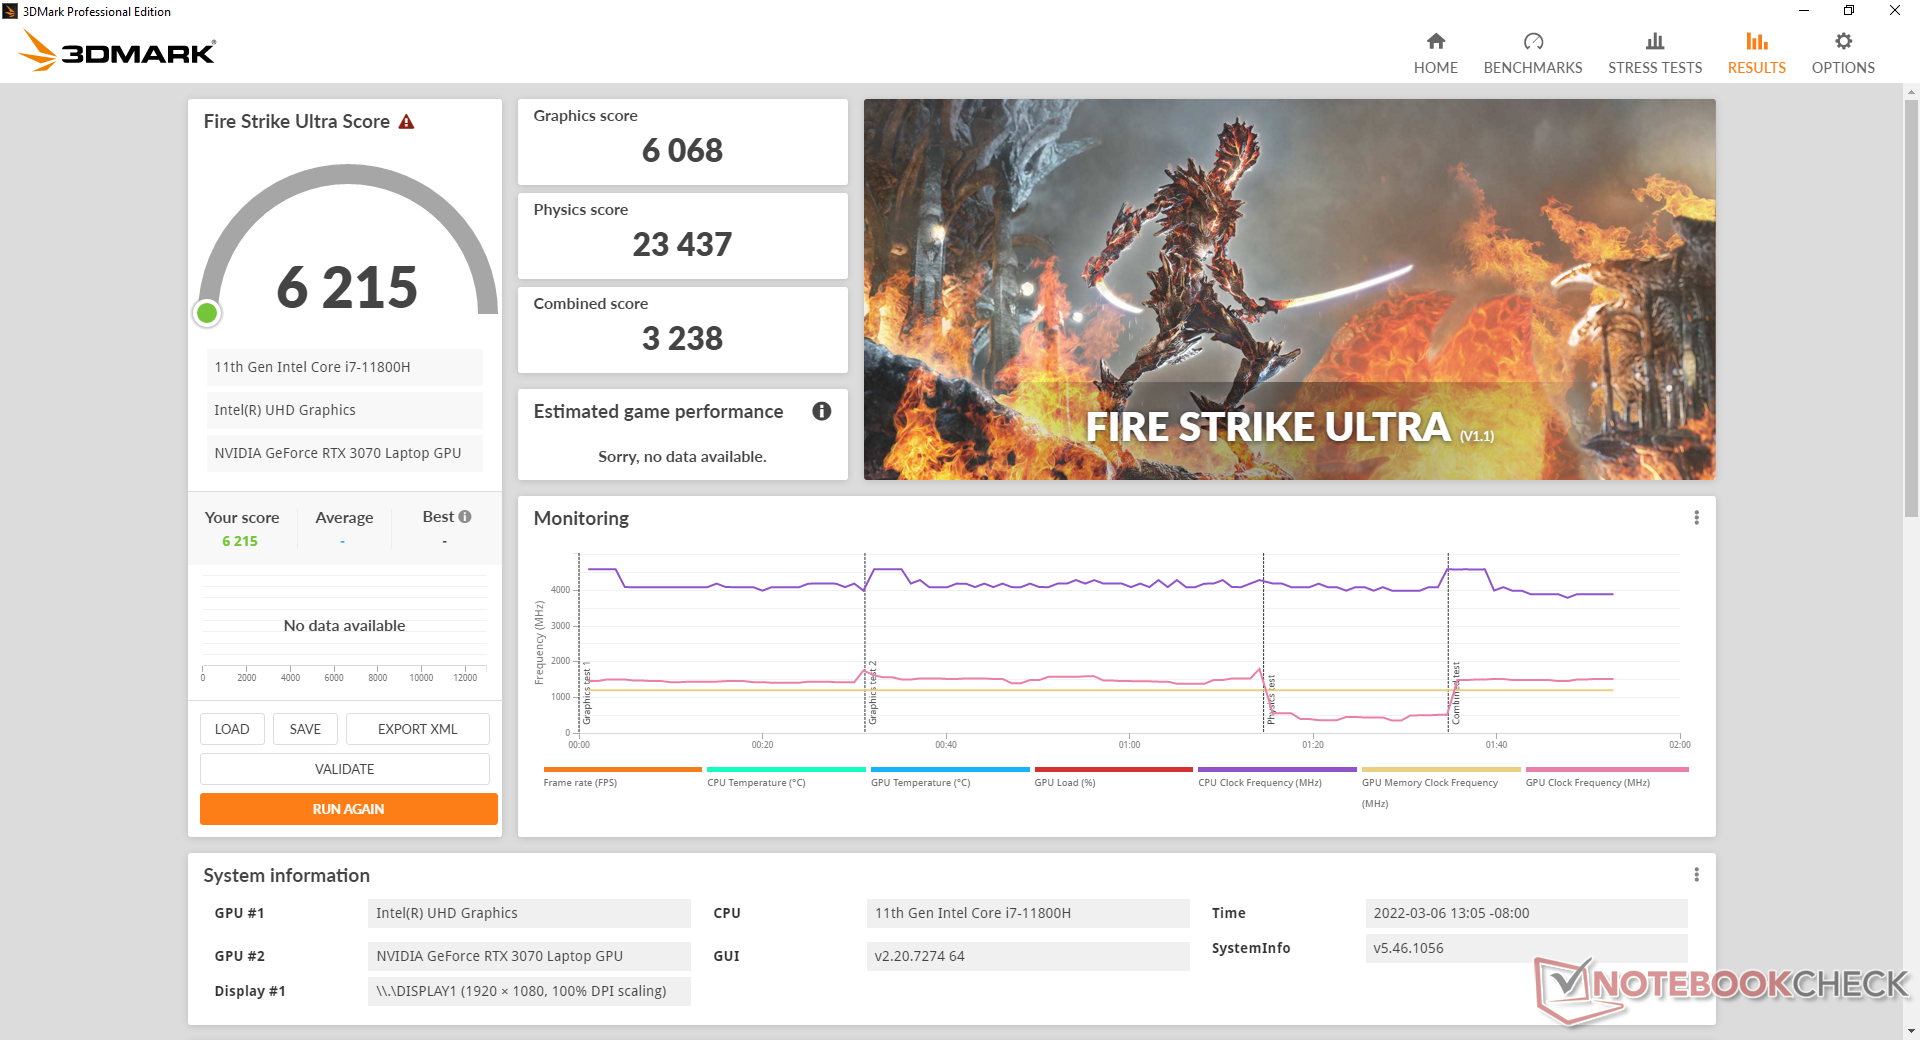
| 3DMark Fire Strike Score | 21264 points | |
| 3DMark Time Spy Score | 9420 points | |
Help | ||
Witcher 3 FPS Chart
| low | med. | high | ultra | |
|---|---|---|---|---|
| GTA V (2015) | 182 | 176 | 159 | 95.5 |
| The Witcher 3 (2015) | 388.1 | 279.3 | 177.8 | 96.5 |
| Dota 2 Reborn (2015) | 163 | 146 | 137 | 129 |
| Final Fantasy XV Benchmark (2018) | 162 | 116 | 90.4 | |
| X-Plane 11.11 (2018) | 125 | 104 | 82.9 | |
| Far Cry 5 (2018) | 148 | 120 | 114 | 107 |
| Strange Brigade (2018) | 442 | 236 | 193 | 171 |
Emissions
System Noise
Fan noise is highly dependent on the four power profile Control Center settings: Quiet, Power Saving, Entertainment, and Performance. There is a fifth manual maximum fan mode setting as well which fixes the fans to their loudest at 57 dB(A) no matter the onscreen load.
It's recommended to run the system on Power Saving mode if simply web browsing or word processing as the fans tend to pulse very frequently between 26 and 34 dB(A) on Performance mode. Gaming on Performance mode is louder than what we recorded on the Razer Blade 15 Advanced or MSI GS66.
Noise level
| Idle |
| 26.4 / 31 / 34 dB(A) |
| Load |
| 47.8 / 57.1 dB(A) |
 | ||
30 dB silent 40 dB(A) audible 50 dB(A) loud |
||
min: | ||
| Eurocom RX315 NH57AF1 GeForce RTX 3070 Laptop GPU, i7-11800H, Samsung SSD 980 Pro 1TB MZ-V8P1T0BW | MSI Stealth GS66 12UGS GeForce RTX 3070 Ti Laptop GPU, i7-12700H, WDC PC SN810 1TB | Eurocom Nightsky ARX315 GeForce RTX 3070 Laptop GPU, R9 5900X, Samsung SSD 980 Pro 1TB MZ-V8P1T0BW | Alienware m15 R6, i7-11800H RTX 3080 GeForce RTX 3080 Laptop GPU, i7-11800H, Samsung PM9A1 MZVL21T0HCLR | Dell G15 5515 GeForce RTX 3050 Ti Laptop GPU, R7 5800H, Samsung PM991a MZ9LQ512HBLU-00BD1 | Razer Blade 15 Advanced (Mid 2021) GeForce RTX 3080 Laptop GPU, i7-11800H, SSSTC CA6-8D1024 | |
|---|---|---|---|---|---|---|
| Noise | 3% | -4% | 12% | 12% | 12% | |
| off / environment * (dB) | 26.3 | 24 9% | 25.3 4% | 23 13% | 24 9% | 25.1 5% |
| Idle Minimum * (dB) | 26.4 | 31 -17% | 25.9 2% | 23 13% | 25 5% | 25.3 4% |
| Idle Average * (dB) | 31 | 32 -3% | 27.9 10% | 23 26% | 26 16% | 25.3 18% |
| Idle Maximum * (dB) | 34 | 35 -3% | 40.8 -20% | 30 12% | 30 12% | 25.3 26% |
| Load Average * (dB) | 47.8 | 48 -0% | 55.2 -15% | 41.26 14% | 44 8% | 42 12% |
| Witcher 3 ultra * (dB) | 51.7 | 43 17% | 52.4 -1% | 53.4 -3% | 44 15% | 45.6 12% |
| Load Maximum * (dB) | 57.1 | 48 16% | 60.3 -6% | 53.37 7% | 48 16% | 51.6 10% |
* ... smaller is better
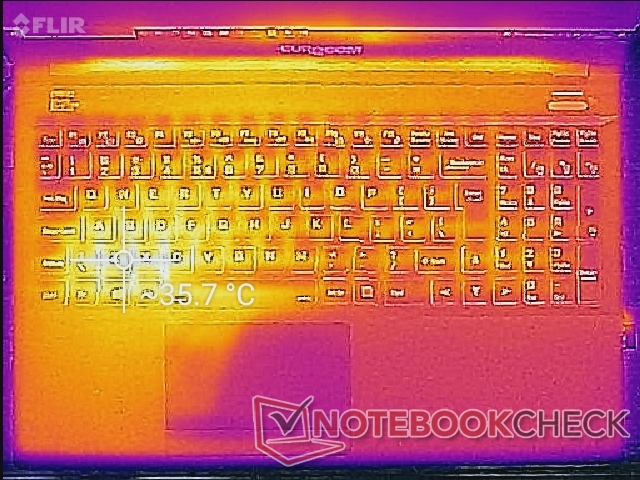
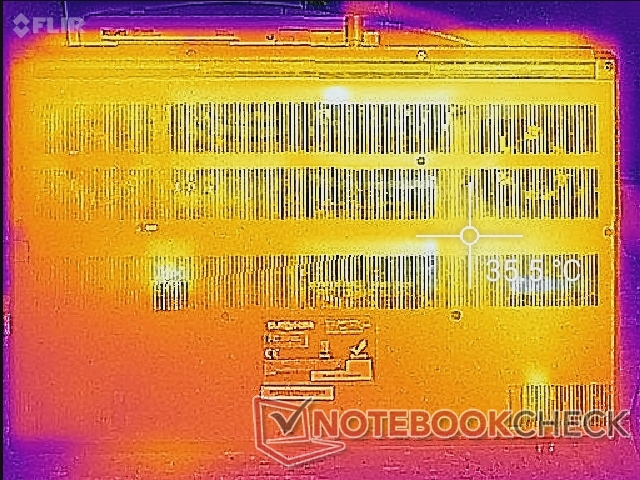
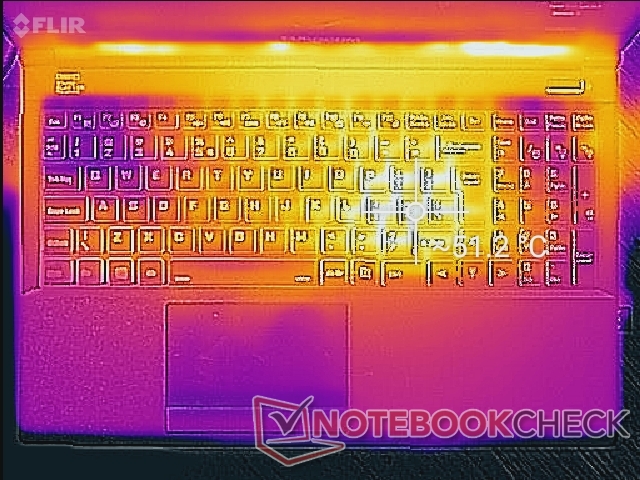
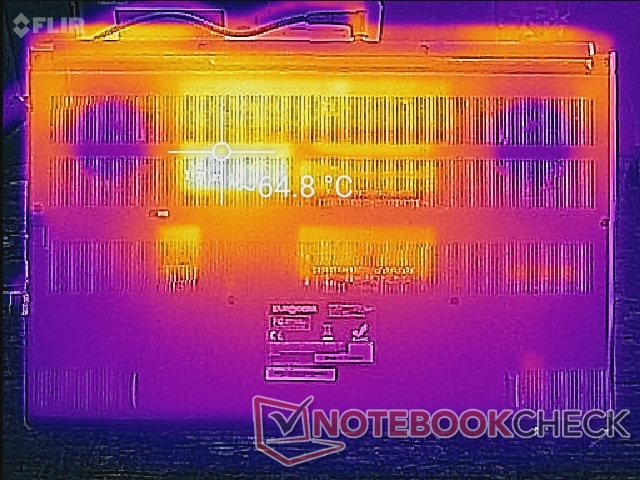
Temperature
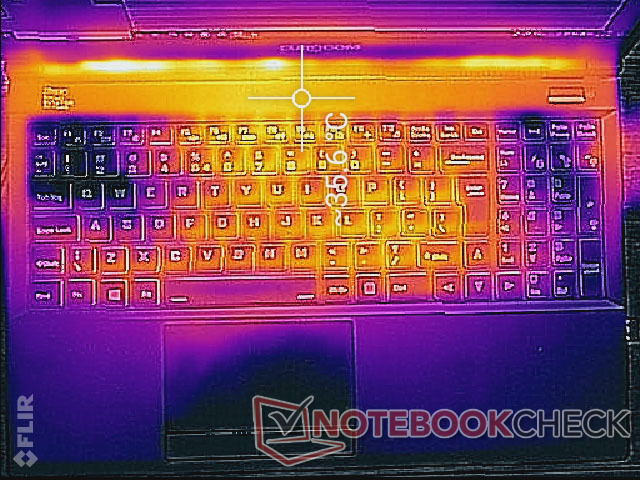
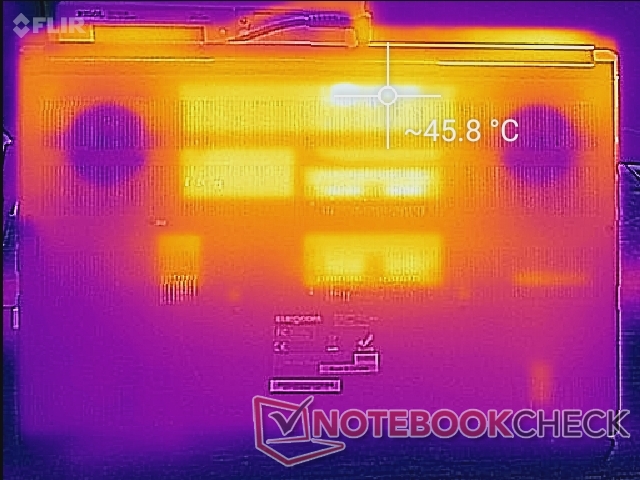
Surface temperatures when gaming can be as warm as 51 C near the keyboard center compared to 44 C on the Razer Blade 15. Like on most gaming laptops, the two fans are positioned underneath the WASD and numpad keys to keep these sections of the laptop relatively cool no matter the load.
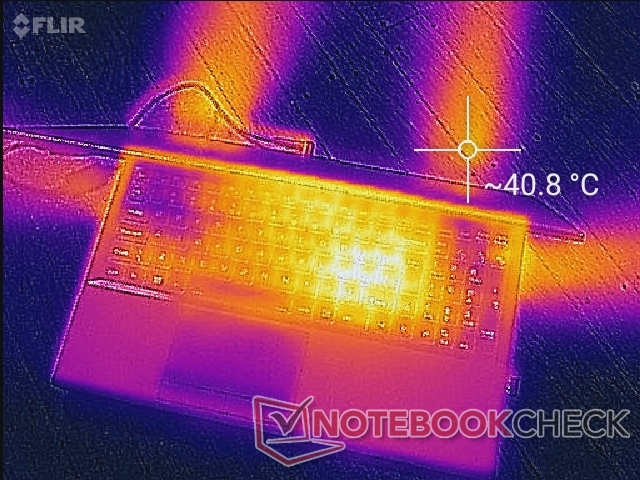
(+) The maximum temperature on the upper side is 36 °C / 97 F, compared to the average of 40.4 °C / 105 F, ranging from 21.2 to 68.8 °C for the class Gaming.
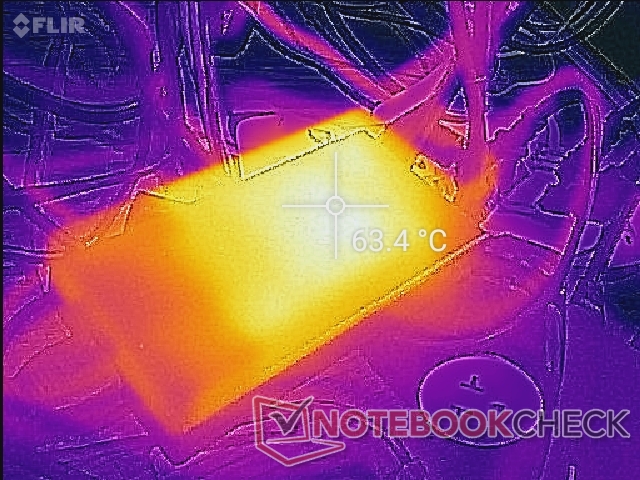
(-) The bottom heats up to a maximum of 46 °C / 115 F, compared to the average of 43.2 °C / 110 F
(+) In idle usage, the average temperature for the upper side is 31.4 °C / 89 F, compared to the device average of 33.9 °C / 93 F.
(±) Playing The Witcher 3, the average temperature for the upper side is 37.1 °C / 99 F, compared to the device average of 33.9 °C / 93 F.
(+) The palmrests and touchpad are cooler than skin temperature with a maximum of 31.2 °C / 88.2 F and are therefore cool to the touch.
(-) The average temperature of the palmrest area of similar devices was 28.8 °C / 83.8 F (-2.4 °C / -4.4 F).
| Eurocom RX315 NH57AF1 Intel Core i7-11800H, NVIDIA GeForce RTX 3070 Laptop GPU | MSI Stealth GS66 12UGS Intel Core i7-12700H, NVIDIA GeForce RTX 3070 Ti Laptop GPU | Eurocom Nightsky ARX315 AMD Ryzen 9 5900X, NVIDIA GeForce RTX 3070 Laptop GPU | Alienware m15 R6, i7-11800H RTX 3080 Intel Core i7-11800H, NVIDIA GeForce RTX 3080 Laptop GPU | Dell G15 5515 AMD Ryzen 7 5800H, NVIDIA GeForce RTX 3050 Ti Laptop GPU | Razer Blade 15 Advanced (Mid 2021) Intel Core i7-11800H, NVIDIA GeForce RTX 3080 Laptop GPU | |
|---|---|---|---|---|---|---|
| Heat | -6% | -5% | -25% | 3% | -14% | |
| Maximum Upper Side * (°C) | 36 | 54 -50% | 36.2 -1% | 61 -69% | 50 -39% | 51 -42% |
| Maximum Bottom * (°C) | 46 | 59 -28% | 49.6 -8% | 58 -26% | 49 -7% | 52 -13% |
| Idle Upper Side * (°C) | 35.6 | 26 27% | 32.6 8% | 38 -7% | 26 27% | 35.2 1% |
| Idle Bottom * (°C) | 36.8 | 27 27% | 43.2 -17% | 36 2% | 26 29% | 37.8 -3% |
* ... smaller is better
Stress Test
When running Prime95, the CPU would boost to 3.5 to 3.7 GHz for the first 70 seconds at a 95 W package draw and 99 C core temperature. Afterwards, the CPU would stabilize at a more comfortable 76 C and 54 W package draw albeit at a lower clock rate of 2.8 GHz.
When running Witcher 3, the GPU would stabilize at 1575 MHz and 87 C. GPU-Z reports a board power draw of 102 W which is very close to the advertised 105 W TGP target.
Running on battery power will limit performance. A Fire Strike test on batteries would return Physics and Graphics scores of 15083 and 2154 points, respectively, compared to 23365 and 25547 points when on mains.
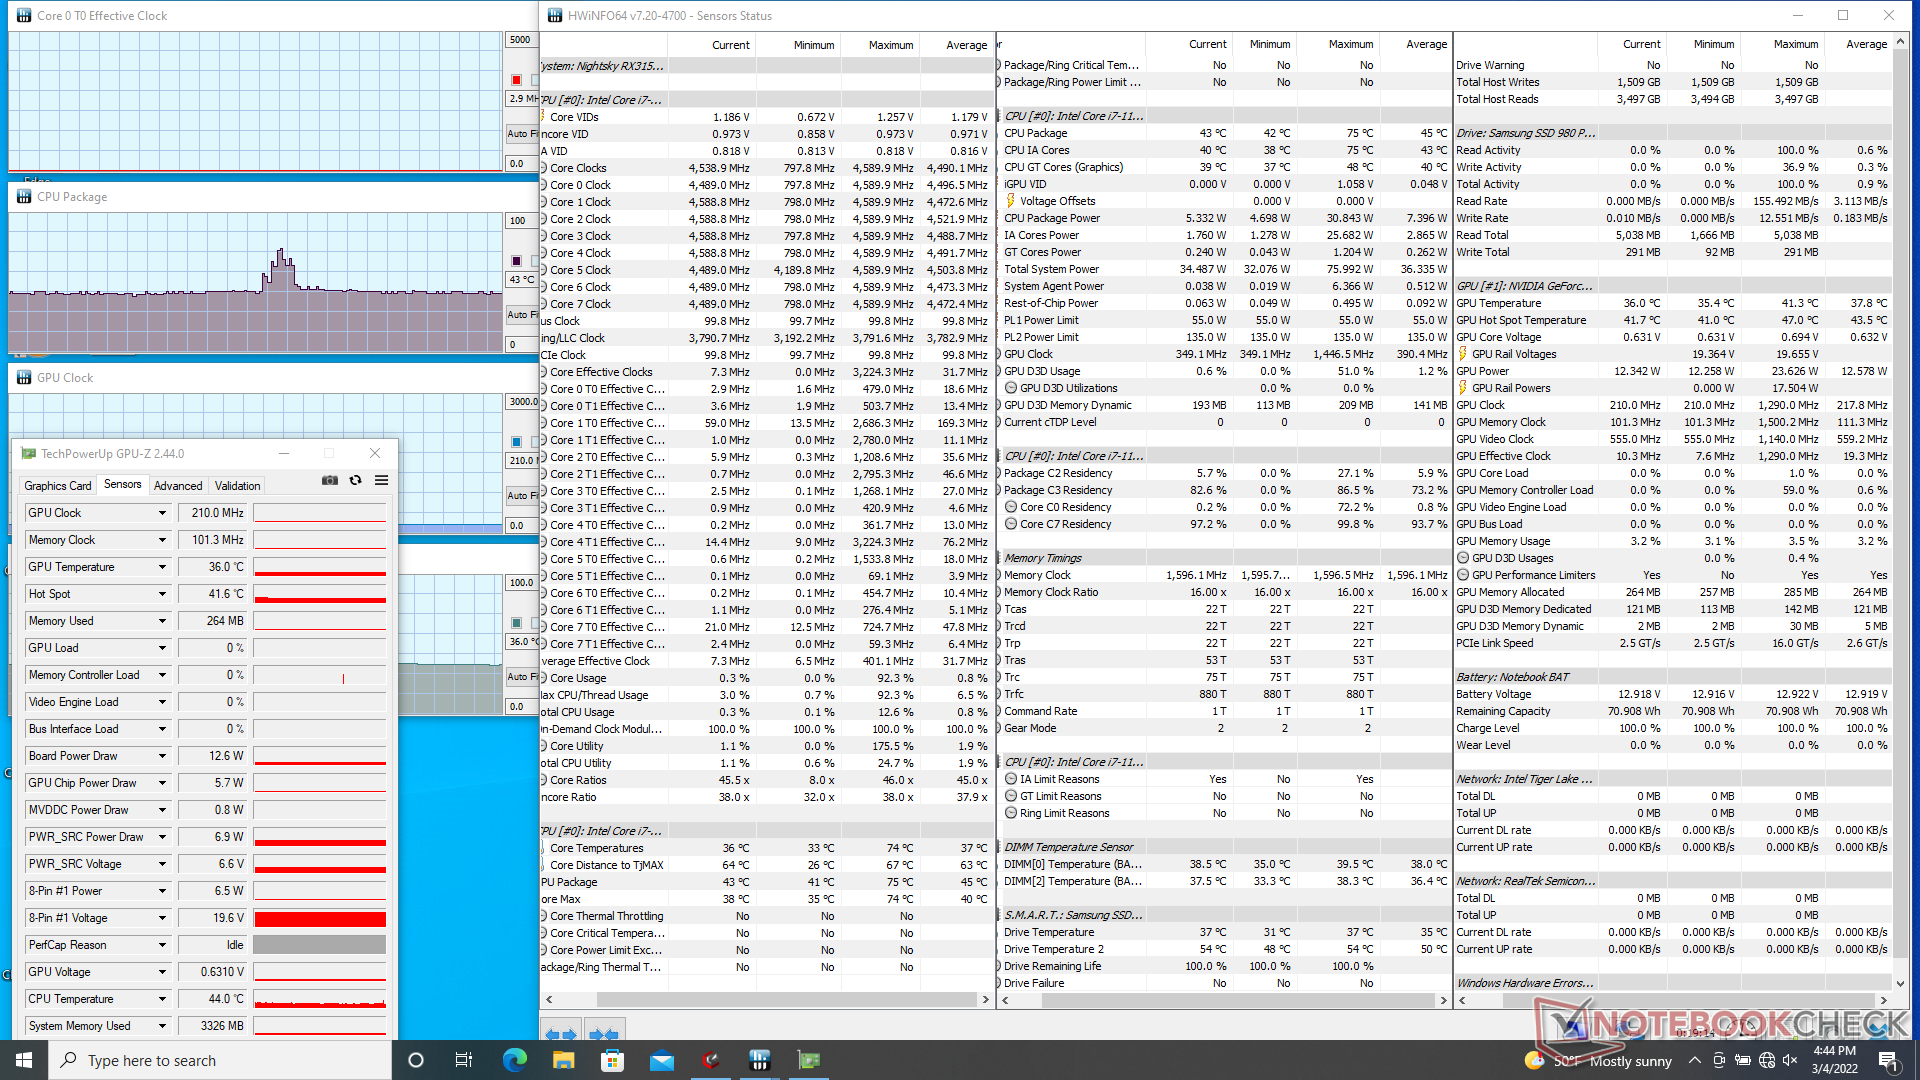
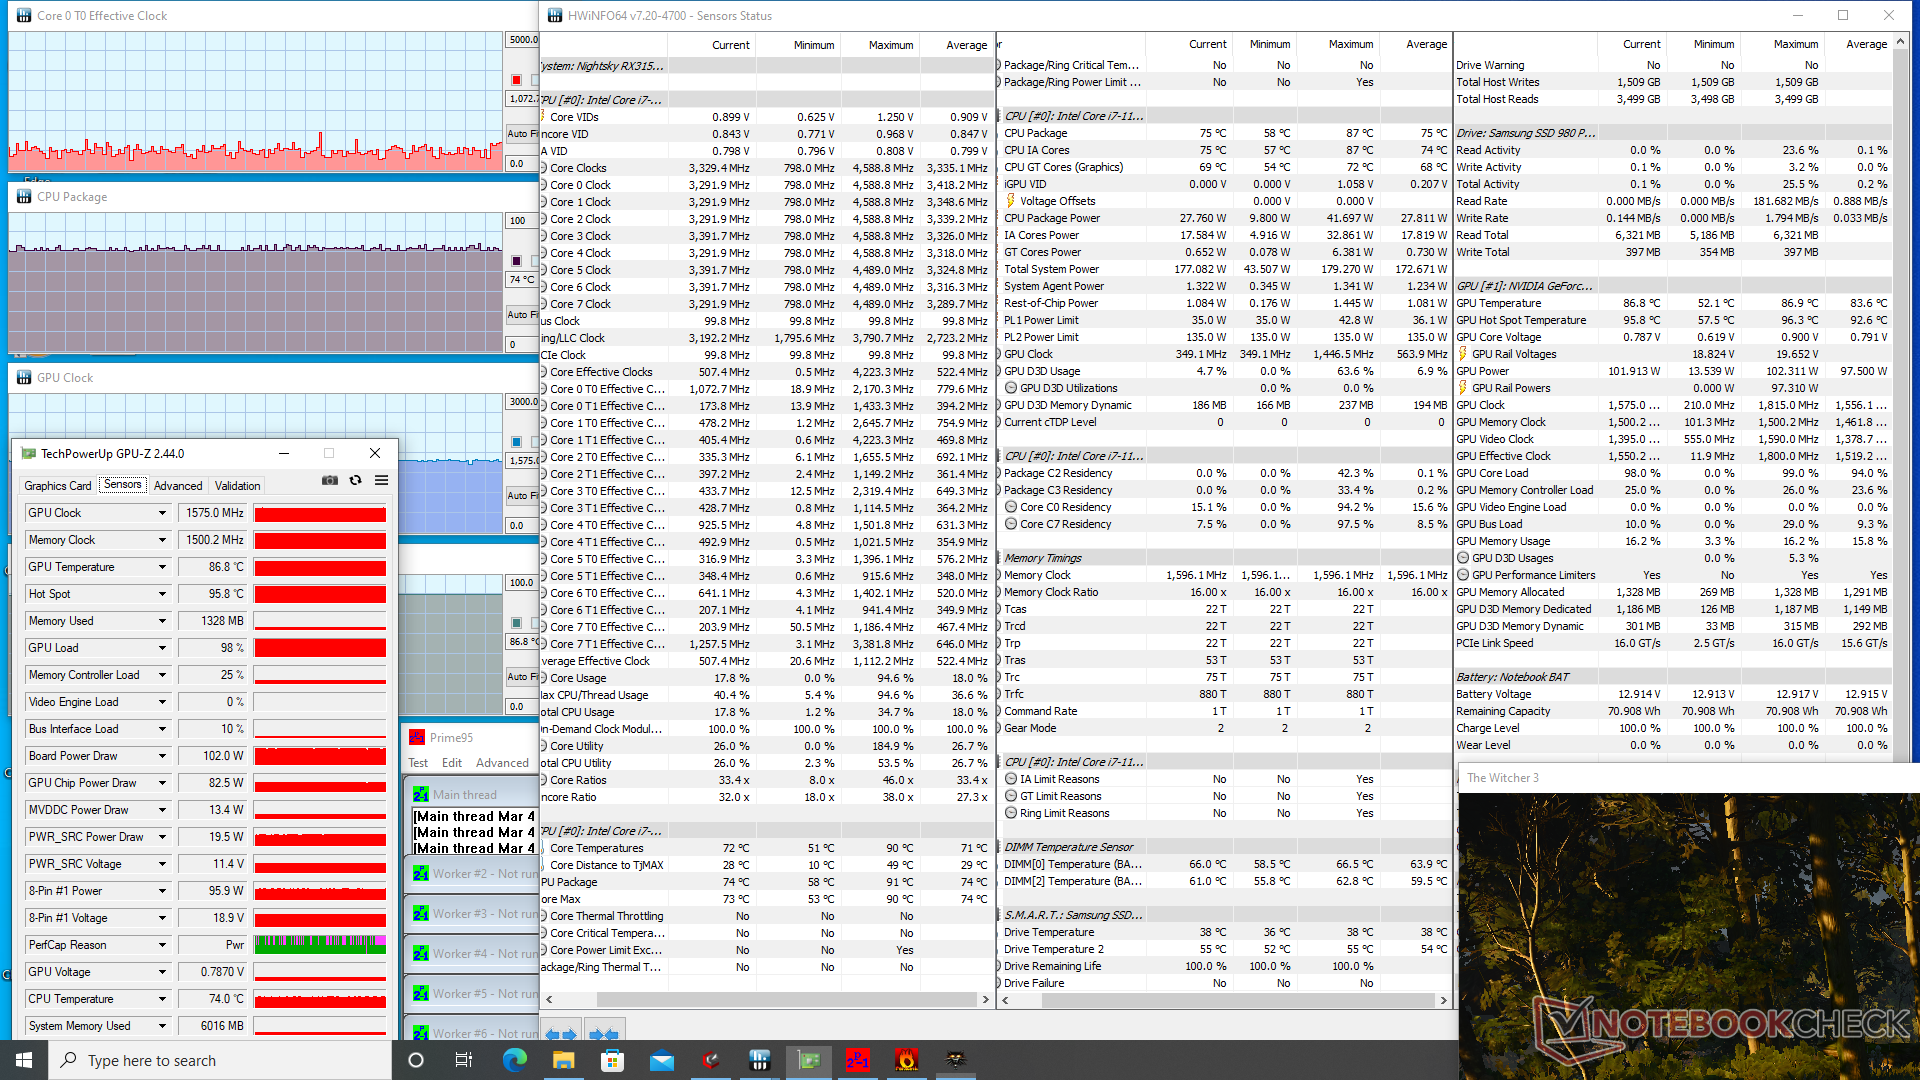
| CPU Clock (GHz) | GPU Clock (MHz) | Average CPU Temperature (°C) | Average GPU Temperature (°C) | |
| System Idle | -- | -- | 43 | 36 |
| Prime95 Stress | 2.6 | -- | 76 | 46 |
| Prime95 + FurMark Stress | 1.6 - 2.1 | 700 - 1800 | 70 - 78 | 60 - 77 |
| Witcher 3 Stress | ~1.0 | 1575 | 74 | 87 |
Speakers
Eurocom RX315 NH57AF1 audio analysis
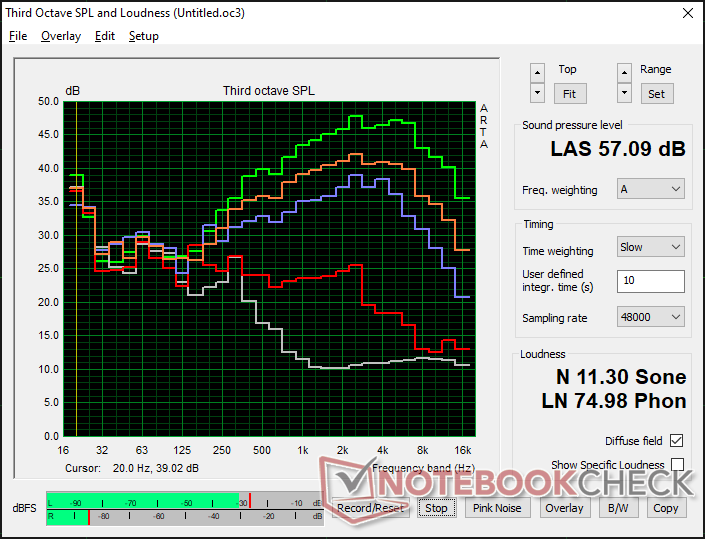
(+) | speakers can play relatively loud (86.1 dB)
Bass 100 - 315 Hz
(-) | nearly no bass - on average 26.3% lower than median
(±) | linearity of bass is average (11.2% delta to prev. frequency)
Mids 400 - 2000 Hz
(±) | higher mids - on average 11% higher than median
(±) | linearity of mids is average (10.3% delta to prev. frequency)
Highs 2 - 16 kHz
(±) | higher highs - on average 6.9% higher than median
(+) | highs are linear (6.7% delta to prev. frequency)
Overall 100 - 16.000 Hz
(-) | overall sound is not linear (33.3% difference to median)
Compared to same class
» 98% of all tested devices in this class were better, 1% similar, 1% worse
» The best had a delta of 6%, average was 18%, worst was 132%
Compared to all devices tested
» 92% of all tested devices were better, 1% similar, 7% worse
» The best had a delta of 4%, average was 24%, worst was 134%
Apple MacBook Pro 16 2021 M1 Pro audio analysis
(+) | speakers can play relatively loud (84.7 dB)
Bass 100 - 315 Hz
(+) | good bass - only 3.8% away from median
(+) | bass is linear (5.2% delta to prev. frequency)
Mids 400 - 2000 Hz
(+) | balanced mids - only 1.3% away from median
(+) | mids are linear (2.1% delta to prev. frequency)
Highs 2 - 16 kHz
(+) | balanced highs - only 1.9% away from median
(+) | highs are linear (2.7% delta to prev. frequency)
Overall 100 - 16.000 Hz
(+) | overall sound is linear (4.6% difference to median)
Compared to same class
» 0% of all tested devices in this class were better, 0% similar, 100% worse
» The best had a delta of 5%, average was 17%, worst was 45%
Compared to all devices tested
» 0% of all tested devices were better, 0% similar, 100% worse
» The best had a delta of 4%, average was 24%, worst was 134%
Energy Management
Power Consumption
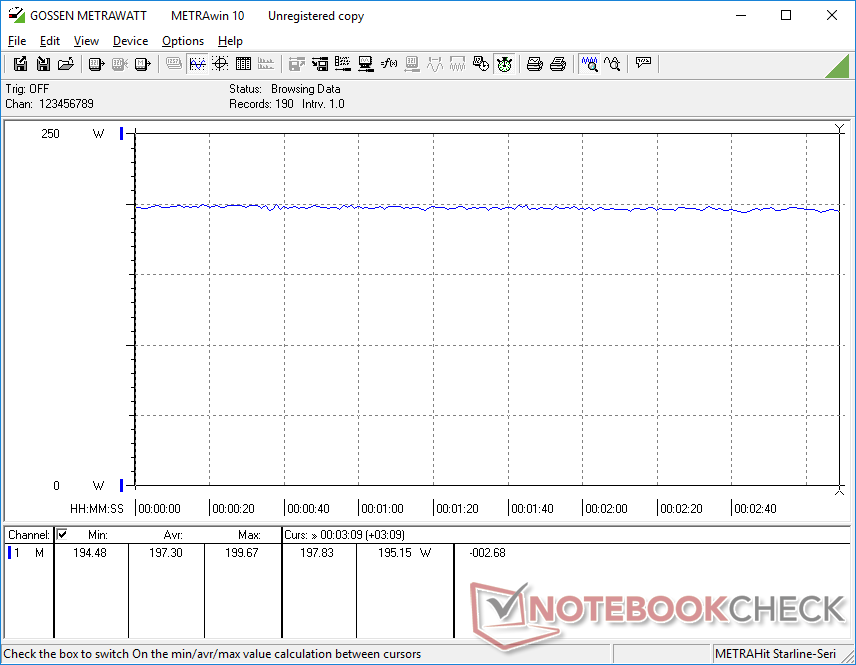
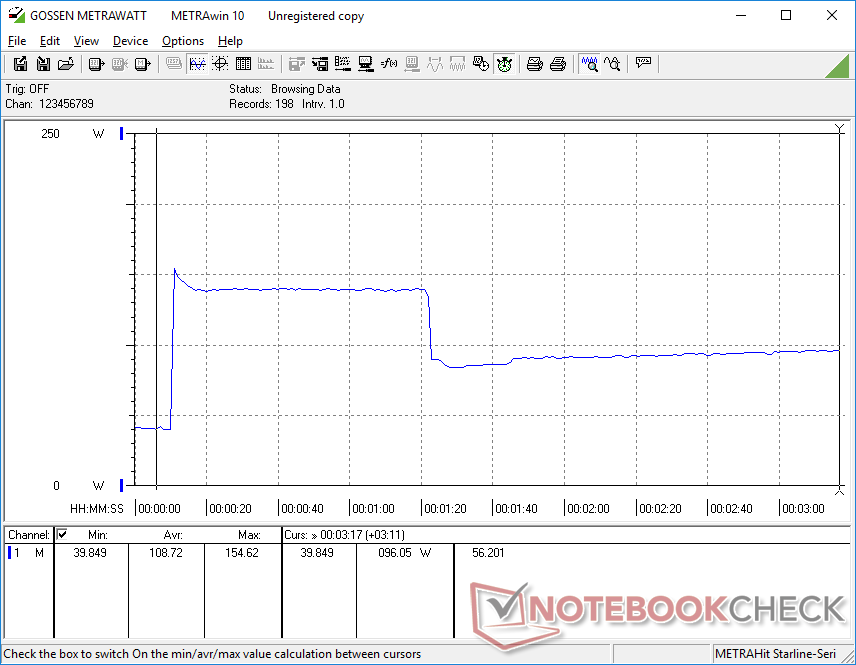
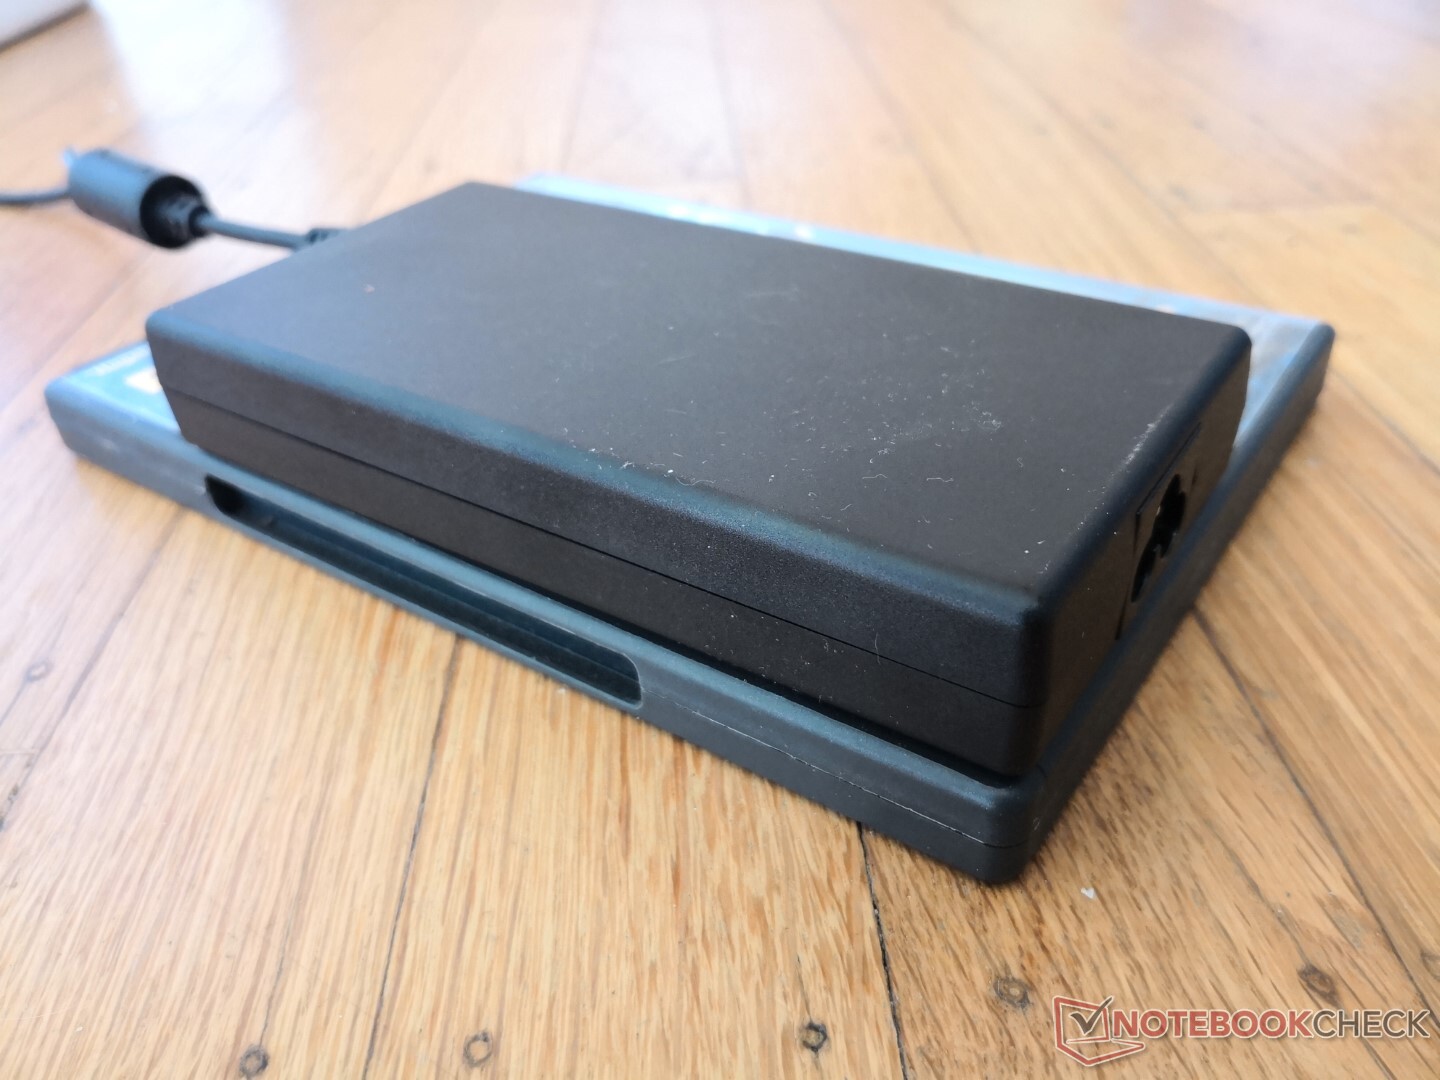
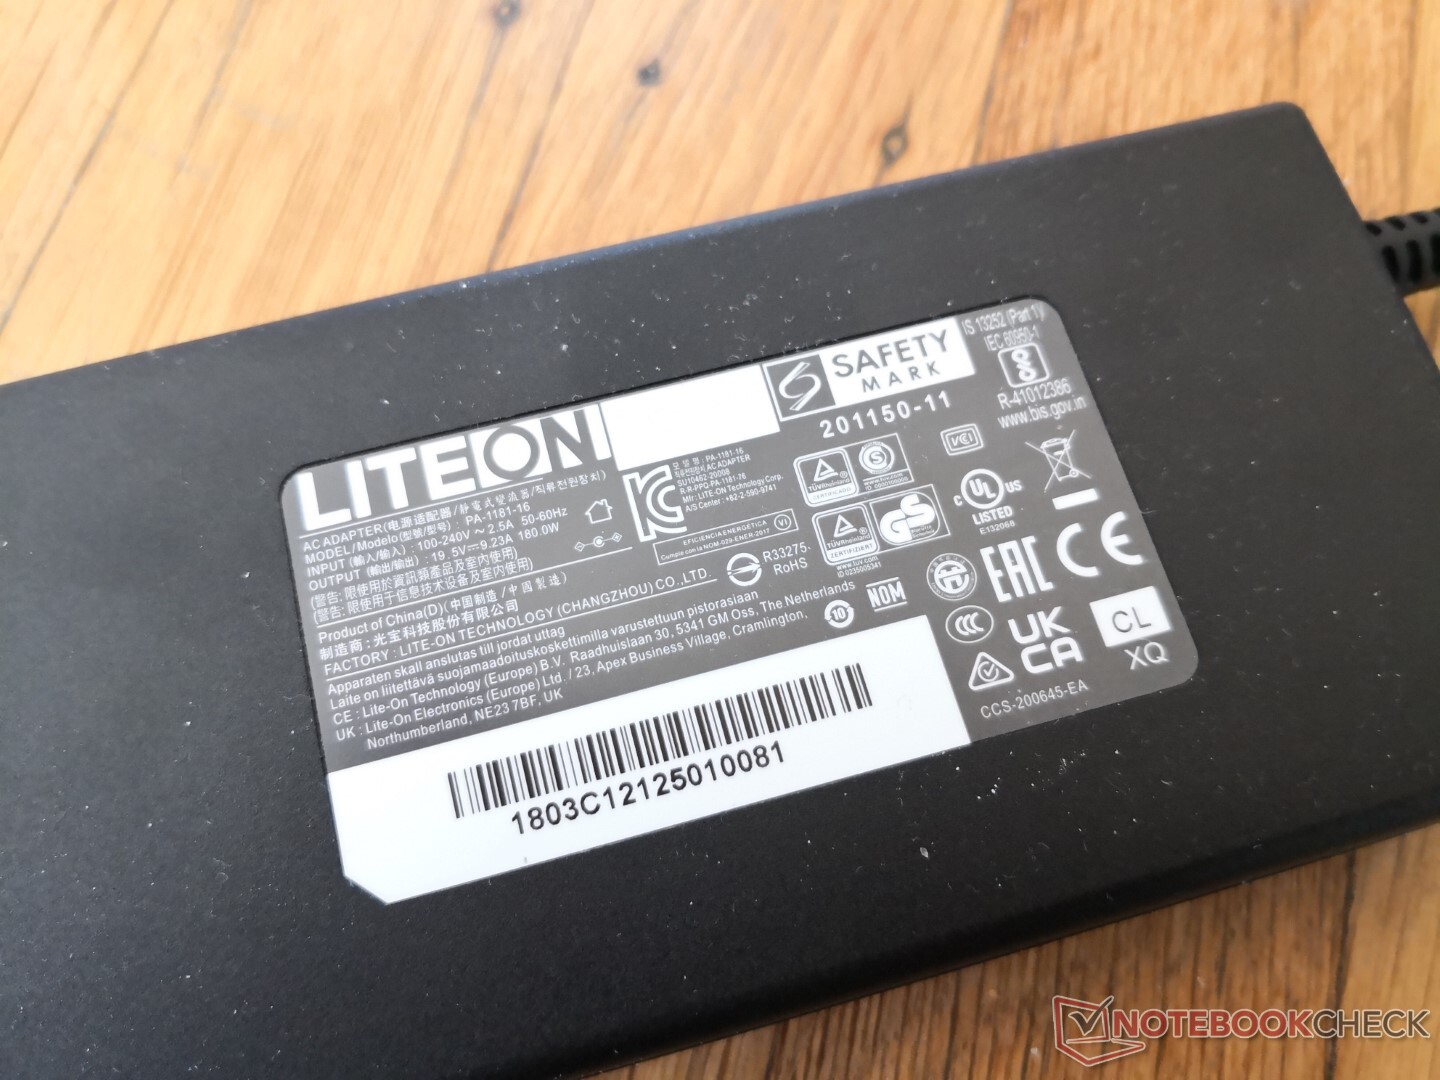
The system demands more power than what the limited 180 W AC adapter is rated to provide. When running Witcher 3, for example, power consumption would be a steady 197 W. The small 180 W adapter (~14.5 x 7.4 x 2.5 cm) is definitely more portable than most other AC adapters for gaming laptops, but a larger and more capable adapter could have potentially allowed for higher sustained performance and faster charging rates when gaming.

| Off / Standby | |
| Idle | |
| Load |
|
Key:
min: | |
| Eurocom RX315 NH57AF1 i7-11800H, GeForce RTX 3070 Laptop GPU, Samsung SSD 980 Pro 1TB MZ-V8P1T0BW, IPS, 1920x1080, 15.6" | MSI Stealth GS66 12UGS i7-12700H, GeForce RTX 3070 Ti Laptop GPU, WDC PC SN810 1TB, IPS-Level, 2560x1440, 15.6" | Eurocom Nightsky ARX315 R9 5900X, GeForce RTX 3070 Laptop GPU, Samsung SSD 980 Pro 1TB MZ-V8P1T0BW, IPS, 1920x1080, 15.6" | Alienware m15 R6, i7-11800H RTX 3080 i7-11800H, GeForce RTX 3080 Laptop GPU, Samsung PM9A1 MZVL21T0HCLR, IPS, 1920x1080, 15.6" | Dell G15 5515 R7 5800H, GeForce RTX 3050 Ti Laptop GPU, Samsung PM991a MZ9LQ512HBLU-00BD1, IPS, 1920x1080, 15.6" | Razer Blade 15 Advanced (Mid 2021) i7-11800H, GeForce RTX 3080 Laptop GPU, SSSTC CA6-8D1024, IPS, 1920x1080, 15.6" | |
|---|---|---|---|---|---|---|
| Power Consumption | 8% | -141% | 1% | 35% | -17% | |
| Idle Minimum * (Watt) | 12.7 | 11 13% | 55 -333% | 14 -10% | 5 61% | 19.5 -54% |
| Idle Average * (Watt) | 16.4 | 16 2% | 68.2 -316% | 18 -10% | 9 45% | 23.3 -42% |
| Idle Maximum * (Watt) | 36.1 | 23 36% | 72.5 -101% | 29 20% | 20 45% | 40.1 -11% |
| Load Average * (Watt) | 101.5 | 110 -8% | 149.2 -47% | 93 8% | 94 7% | 98.9 3% |
| Witcher 3 ultra * (Watt) | 197 | 151 23% | 233 -18% | 190 4% | 123 38% | 174 12% |
| Load Maximum * (Watt) | 196.1 | 230 -17% | 255.8 -30% | 203 -4% | 172 12% | 214 -9% |
* ... smaller is better
Power Consumption Witcher 3 / Stresstest
Power Consumption external Monitor
Battery Life
Expect just under 5 hours of real-world WLAN use on the Balanced profile with the integrated GPU active. Charging with the included AC adapter takes about 2.5 hours, but this will slow to a crawl when running games due to the low 180 W output. Charging via USB-C adapters is not supported.
| Eurocom RX315 NH57AF1 i7-11800H, GeForce RTX 3070 Laptop GPU, 71 Wh | MSI Stealth GS66 12UGS i7-12700H, GeForce RTX 3070 Ti Laptop GPU, 99.9 Wh | Eurocom Nightsky ARX315 R9 5900X, GeForce RTX 3070 Laptop GPU, 62 Wh | Alienware m15 R6, i7-11800H RTX 3080 i7-11800H, GeForce RTX 3080 Laptop GPU, 84 Wh | Dell G15 5515 R7 5800H, GeForce RTX 3050 Ti Laptop GPU, 56 Wh | Razer Blade 15 Advanced (Mid 2021) i7-11800H, GeForce RTX 3080 Laptop GPU, 80 Wh | |
|---|---|---|---|---|---|---|
| Battery runtime | 13% | -79% | 4% | 67% | 23% | |
| WiFi v1.3 (h) | 4.8 | 5.4 13% | 1 -79% | 5 4% | 8 67% | 5.9 23% |
| Reader / Idle (h) | 7.8 | 13.5 | ||||
| Load (h) | 1.6 | 1.6 | 1.5 | |||
| H.264 (h) | 5.6 | 8.8 |
Pros
Cons
Verdict
Key advantages of the Eurocom RX315 over competing ultrathin gaming laptops like the Razer Blade 15 or MSI GS66 are its lower weight and easier serviceability. Owners can easily install up to two M.2 SSDs versus just one on the Blade 15 while the GS66 is both a larger and heavier model overall. These attributes may be desirable for users who travel a lot and have a second M.2 SSD they wish to install.
Strong ultrathin performer with easy serviceability and comfortable keyboard keys.
The cooling solution and battery of the RX315 are not as effective or large, respectively, as the ones on the aforementioned Razer or MSI alternatives. Fan noise is therefore louder on the Eurocom to compensate while battery life is generally shorter overall. Chassis rigidity is also a step or two below the Blade 15 or GS66 for slightly weaker first impressions.
Price and Availability
The Eurocom Nightsky RX315 is currently shipping starting at $2750 USD with the Core i7-11800H CPU and GeForce RTX 3070 GPU.
Eurocom RX315 NH57AF1
- 03/08/2022 v7 (old)
Allen Ngo
Price comparison
