Eurocom Blitz Ultra laptop review: Easy-to-service professional solution
Verdict — Highly Serviceable, But In Need Of More Display Options
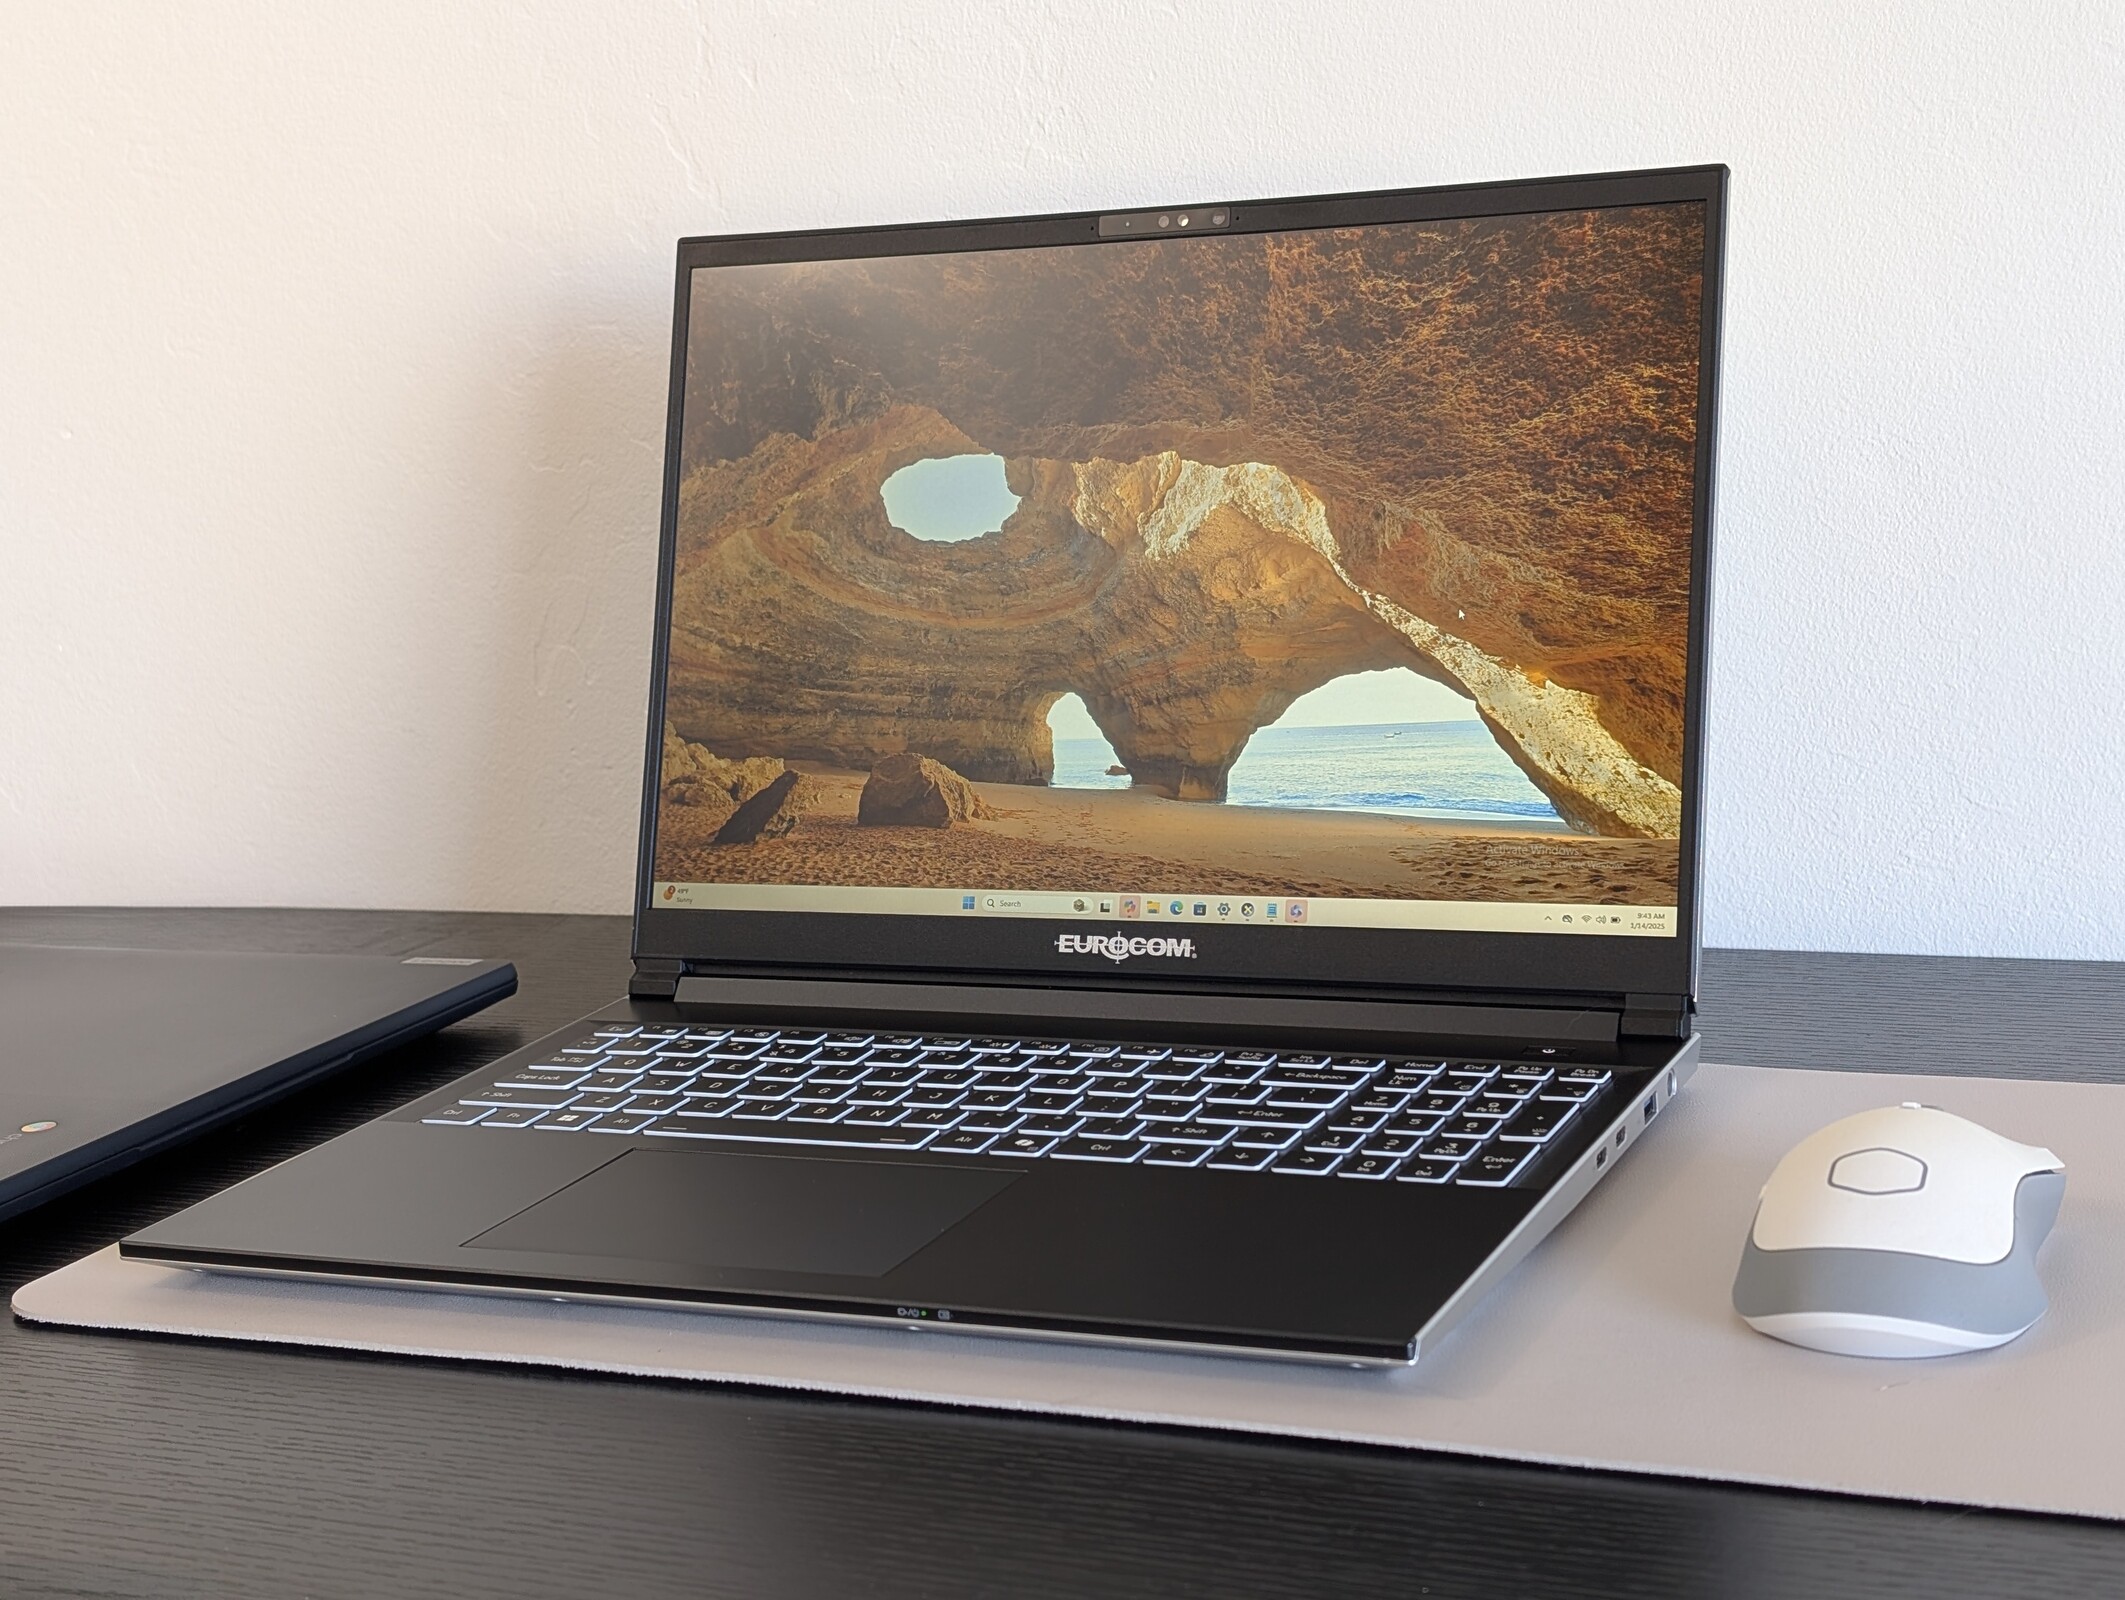
The Eurocom Blitz Ultra knows its audience and so it excels in specific features like the ability to configure with no webcam at all and an easy-to-service design that isn't as closed or integrated as consumer-oriented alternatives from big name brands. The simple logo-free appearance is made to fit in essentially any scenario while being reasonably portable considering the large 16-inch screen size.
Aspects that could be improved upon include the lack of any display options and the strong tendency for the fans to pulse if not set to Quiet mode. The former is particularly disappointing because the included 1200p IPS panel is of lower quality than expected to be unfit for graphics editing or other applications where color accuracy is important. It's also quite dim for poor outdoor visibility. Meanwhile, the fans can get rather loud and noticeable on Performance mode even though the processor isn't as fast or efficient as some of the latest AMD solutions. The Lenovo ThinkPad T16 series offers more display and processor options in that regard.
Pros
Cons
Price and Availability
Eurocom is now shipping the Blitz Ultra starting at $1360 for the base Core Ultra 5 125H configuration up to over $6000 if configured with maximum RAM and storage.
- $41.98Puccy Anti Blue Light Tempered Glass Screen Protector Film, compatible with Eurocom Blitz Ultra 16 16" Tablet (Active Area Cover Only) Protective Protectors Guard
- $22.98Puccy 3 Pack Screen Protector, compatible with Eurocom Blitz Ultra 16 16" Tablet TPU Film Guard ( Not Tempered Glass Protectors)
- $39.98Puccy Tempered Glass Screen Protector Film, compatible with Eurocom Blitz Ultra 16 16" Tablet (Active Area Cover Only) Protective Protectors Guard
Potential Competitors in Comparison
Image | Model / Review | Price | Weight | Height | Display |
|---|---|---|---|---|---|
1. 77%  | Eurocom Blitz Ultra 16 Intel Core Ultra 7 155H ⎘ Intel Arc 8-Core iGPU ⎘ 64 GB Memory | Amazon: 1. $41.98 Puccy Anti Blue Light Temper... 2. $22.98 Puccy 3 Pack Screen Protecto... 3. $39.98 Puccy Tempered Glass Screen ... List Price: 2000 USD | 1.9 kg | 18 mm | 16.00" 1920x1200 142 PPI IPS |
2. 83%  | Lenovo ThinkBook 16 G7 IML Intel Core Ultra 5 125U ⎘ Intel Graphics 4-Core iGPU (Meteor / Arrow Lake) ⎘ 16 GB Memory, 512 GB SSD | Amazon: List Price: 750 USD | 1.8 kg | 17.5 mm | 16.00" 1920x1200 142 PPI IPS |
3. 81.9%  | MSI Summit A16 AI Plus A3HMTG AMD Ryzen AI 9 365 ⎘ AMD Radeon 880M ⎘ 32 GB Memory, 1024 GB SSD | Amazon: List Price: 1600 USD | 2.1 kg | 16.85 mm | 16.00" 2560x1600 189 PPI IPS |
4. 79.1%  | Acer Aspire 16 A16-51GM-77G2 Intel Core 7 150U ⎘ NVIDIA GeForce RTX 2050 Mobile ⎘ 16 GB Memory, 1024 GB SSD | Amazon: List Price: 929 Euro | 1.9 kg | 21 mm | 16.00" 1920x1200 142 PPI IPS |
5. 85.6%  | Lenovo ThinkPad T16 Gen 3 21MN005XGE Intel Core Ultra 5 125U ⎘ Intel Graphics 4-Core iGPU (Meteor / Arrow Lake) ⎘ 32 GB Memory, 1000 GB SSD | Amazon: List Price: 1800 Euro | 2 kg | 23.7 mm | 16.00" 1920x1200 142 PPI IPS LED |
| Asus Vivobook S16 S5606M Intel Core Ultra 7 155H ⎘ Intel Arc 8-Core iGPU ⎘ 16 GB Memory, 1024 GB SSD | Amazon: 1. $1,699.99 ASUS Vivobook S16 Laptop (20... 2. $1,599.99 ASUS Vivobook S16 AI PC Lapt... 3. $1,299.99 ASUS Vivobook S16 Laptop (20... | 1.6 kg | 16 mm | 16.00" 3200x2000 236 PPI OLED |
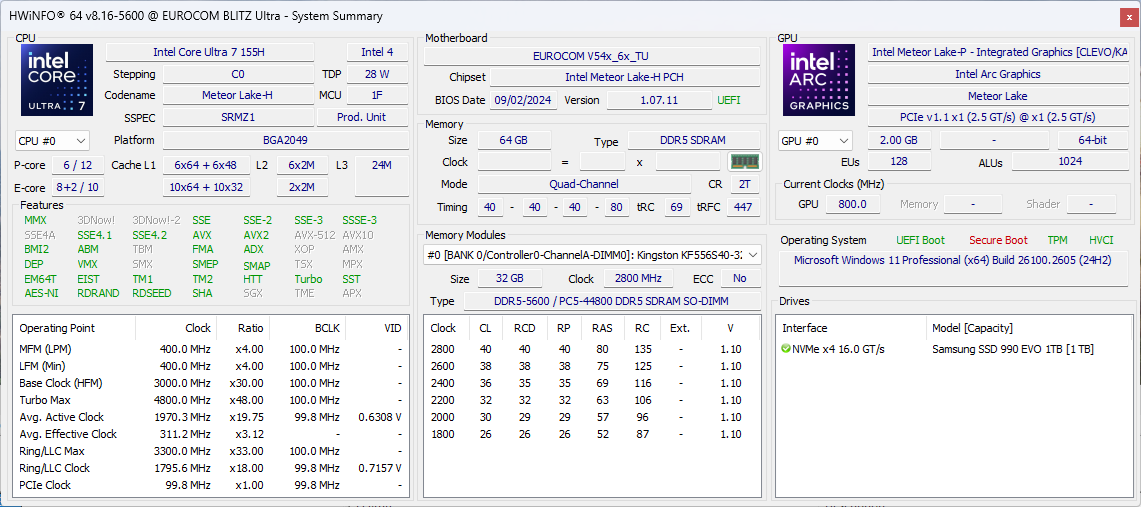
The Blitz Ultra is Eurocom's thin-and-light multimedia/office model shipping with Meteor Lake-H CPU options. It foregoes discrete GPUs for a more portable form factor.
Options range from the Core Ultra 5 125H to the Core Ultra 7 155H while the 1200p IPS display remains fixed across all SKUs. A 14-inch model is also available with the same CPU options. Eurocom models in particular appeal to many government and private industries for their ease of servicing and disassembly.
Alternatives to the Blitz Ultra include other 16-inch multimedia/office laptops from popular makers like the Asus Vivobook S16, Lenovo ThinkPad T16 Gen 3, or Acer Aspire 16.
More Eurocom reviews:
Specifications
Case
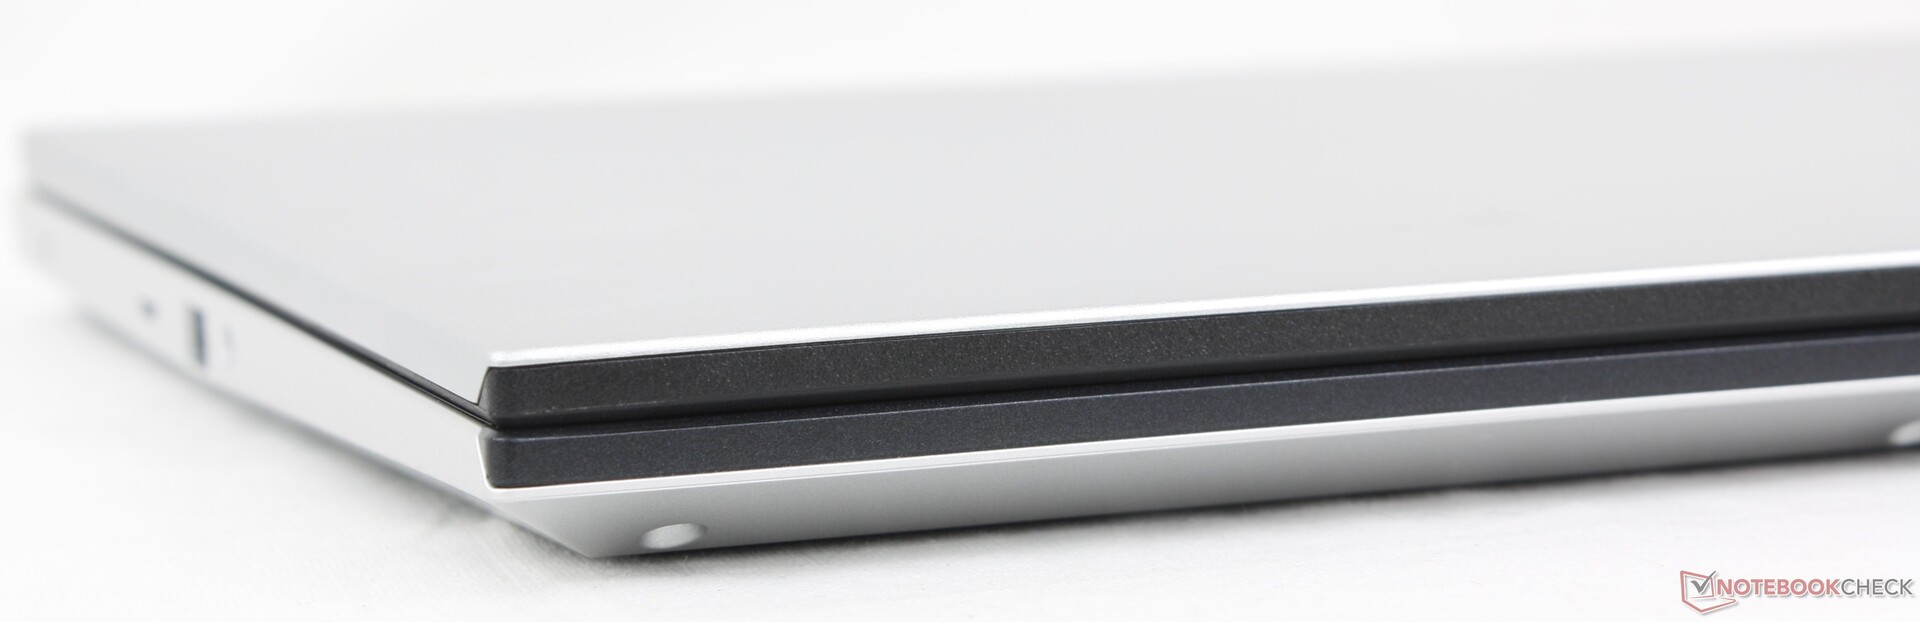
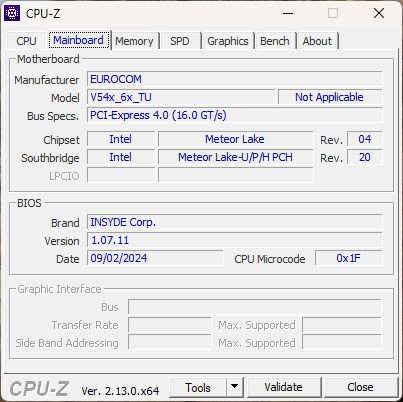
The matte black and silver design is based off of the Clevo V5x0TU white label consisting of mostly metal alloy for the outer lid and base. While it is MIL-STD 810H certified, its thin chassis materials can nonetheless warp and bend more readily than denser unibody designs like the Razer Blade 16. For example, applying pressure down the keyboard center will visibly warp the surface much more so than on other high-end 16-inch models like the HP Spectre x360 16 or Lenovo ThinkPad T16.
Size and weight are otherwise average for the category with some competitors like the Lenovo ThinkBook 16 G7 IML being ever-so-slightly thinner and lighter.
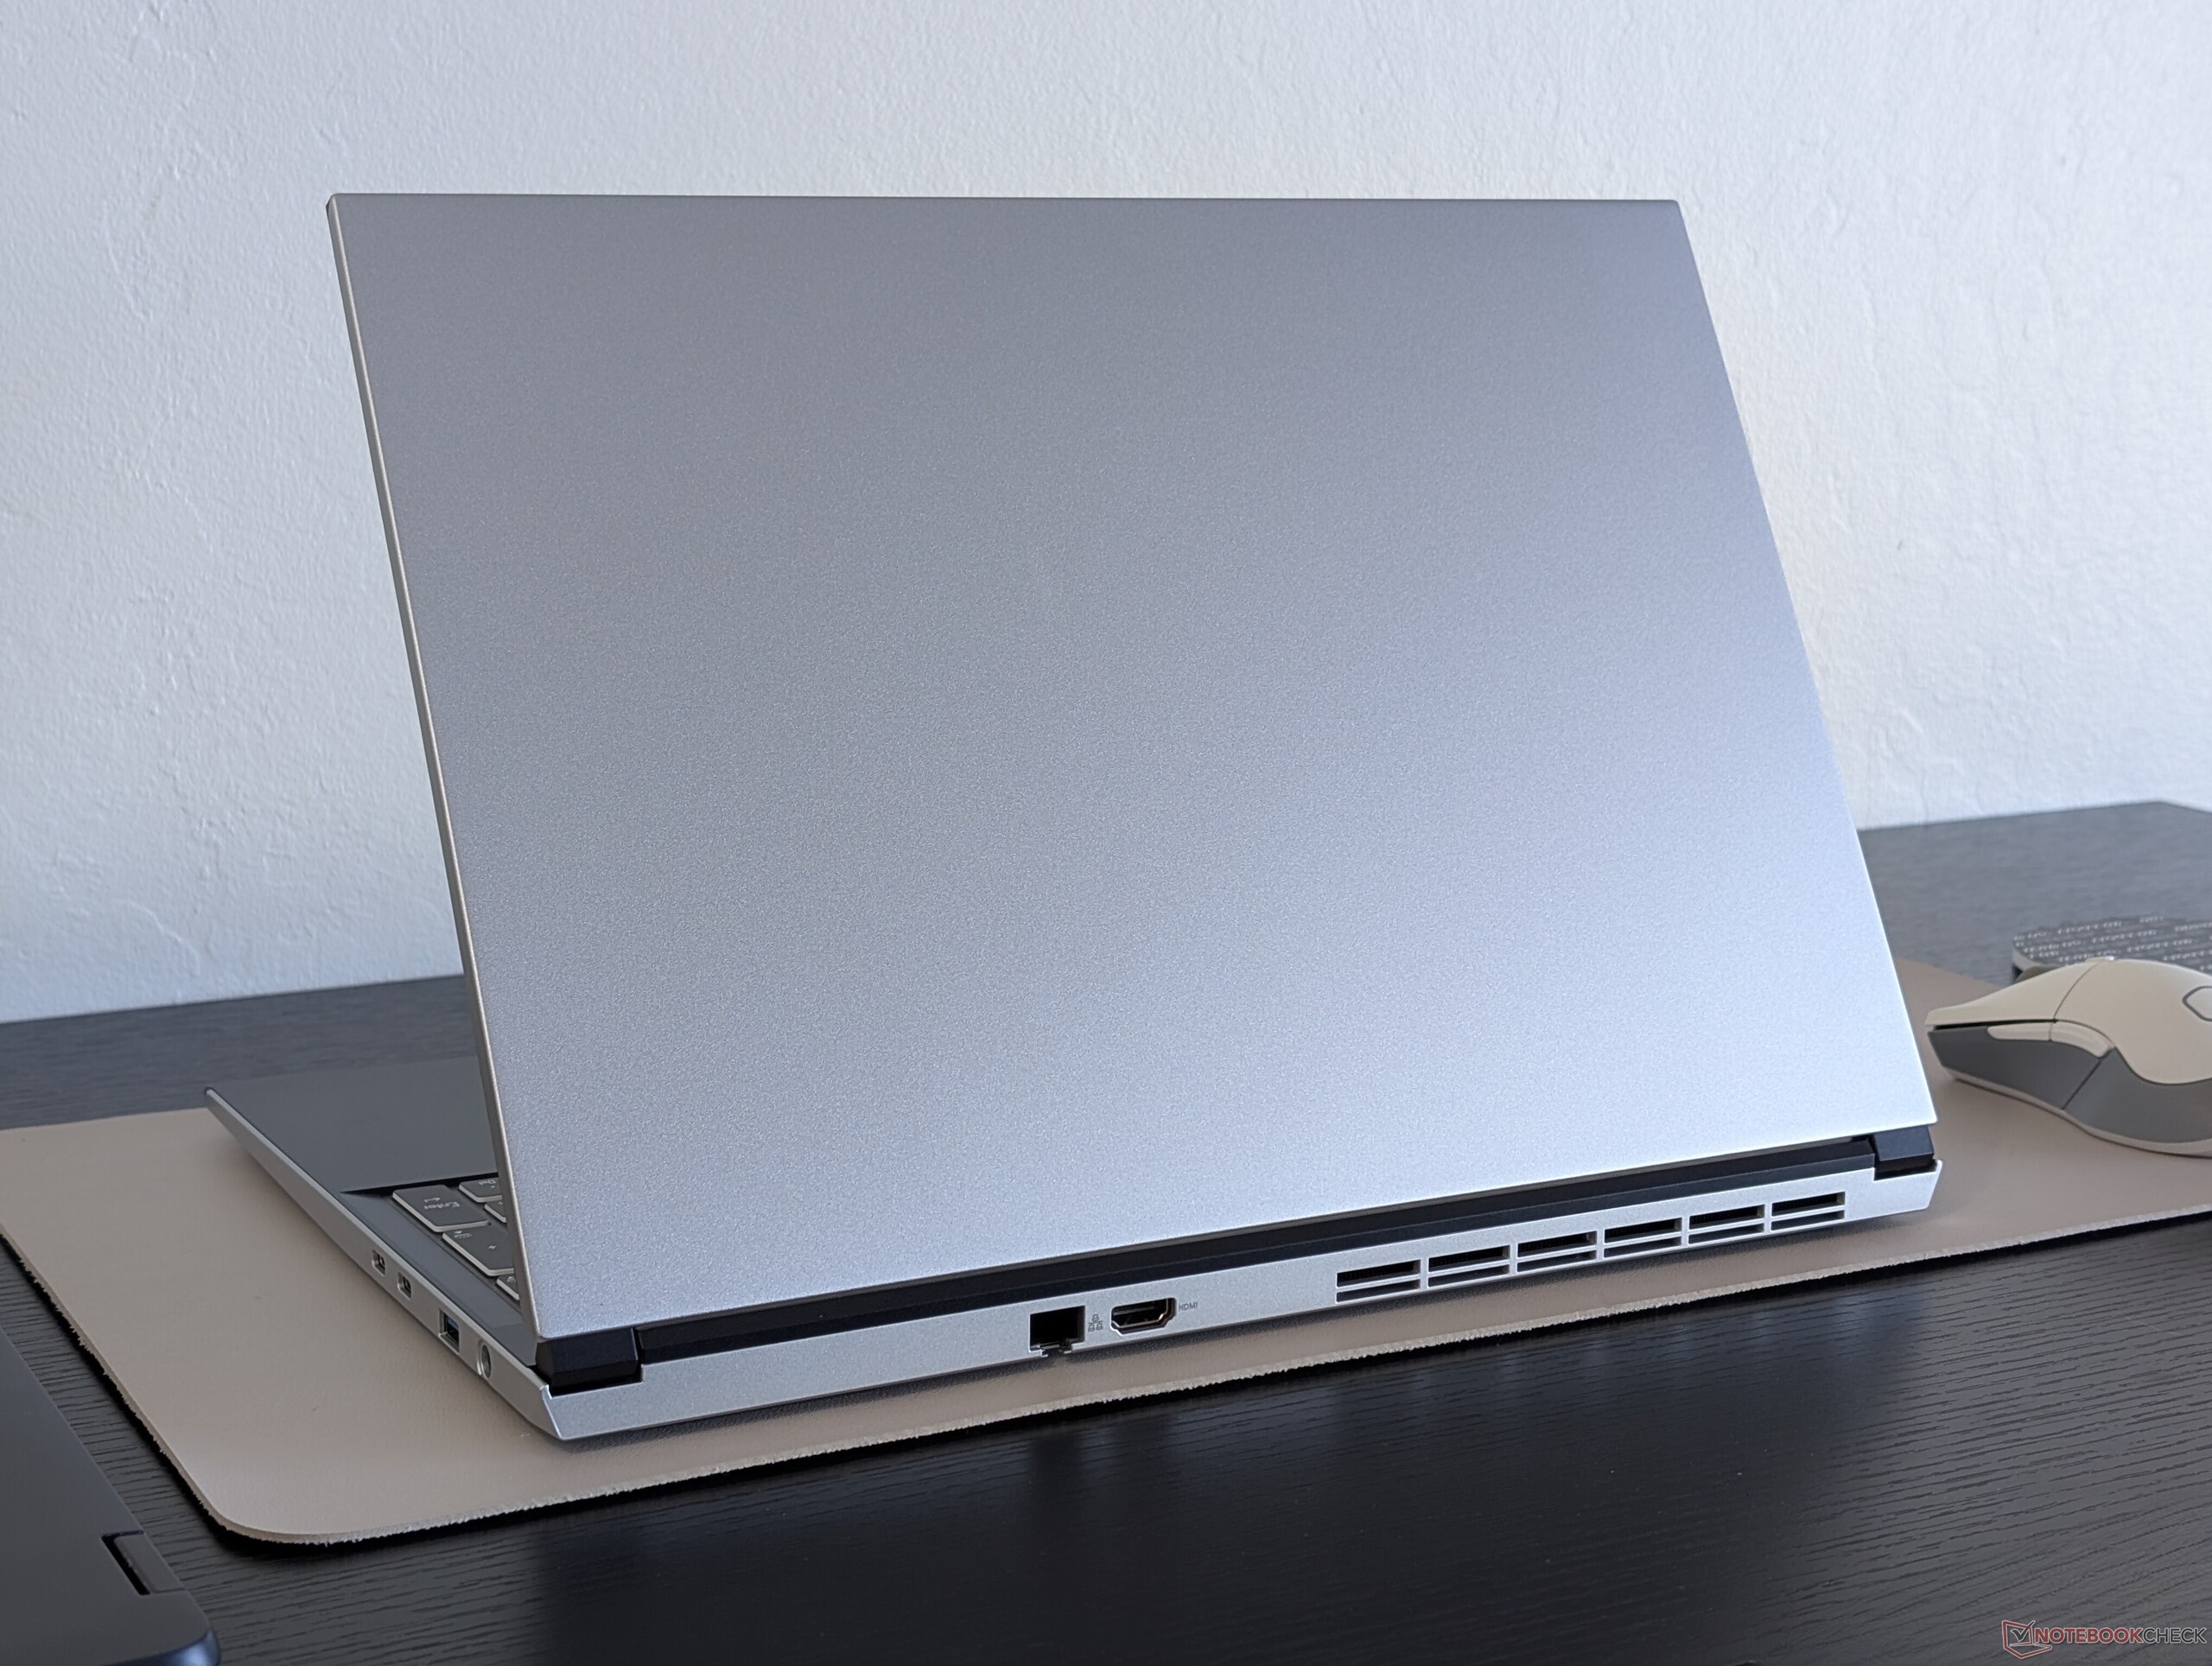
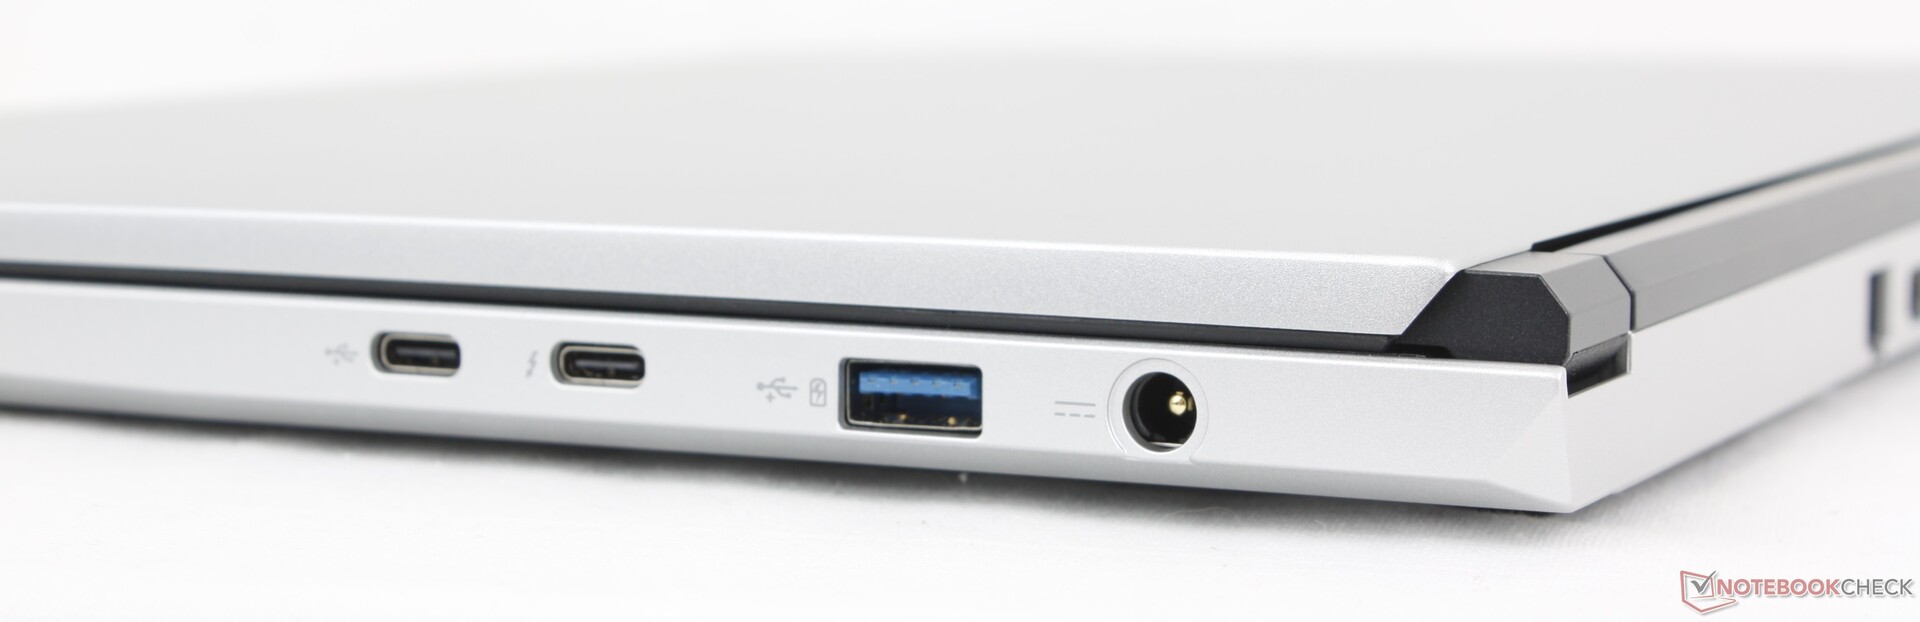
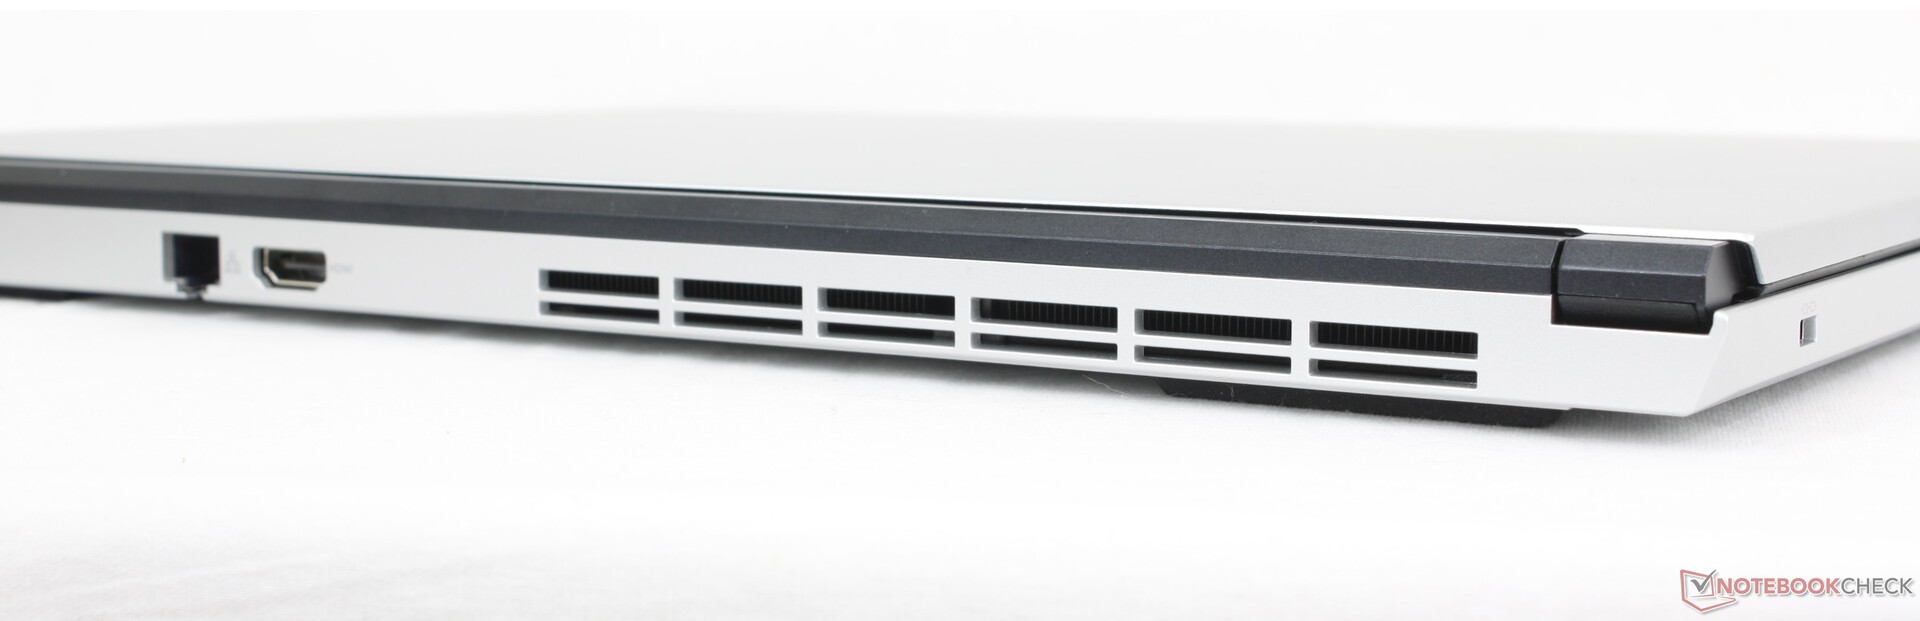
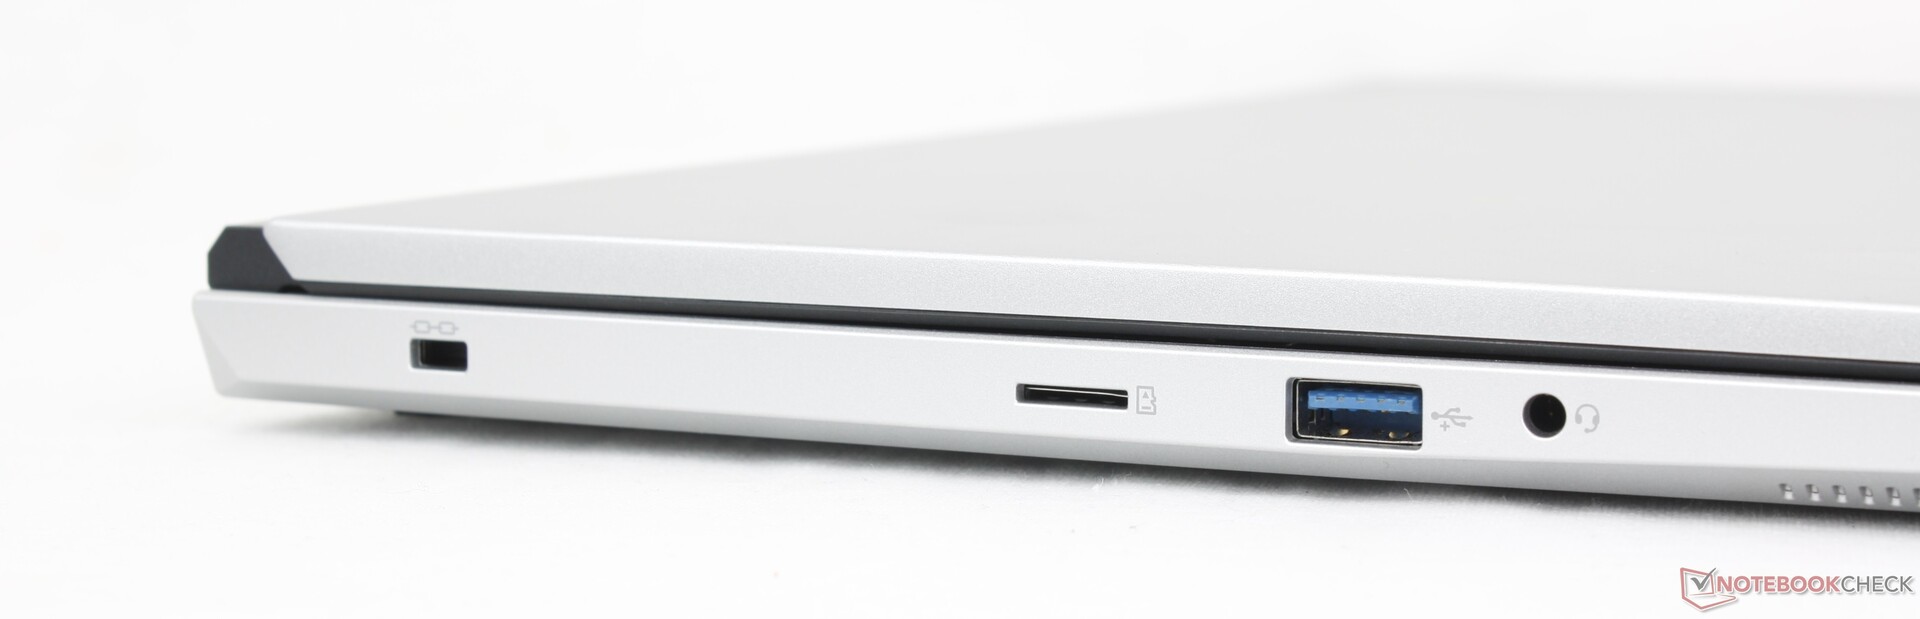
Connectivity
While port options are great, keep in mind that the two USB-C ports are not identical as only one supports Thunderbolt 4 and DisplayPort. The ports are otherwise spaced nicely apart unlike on the Asus VivoBook Pro 16 where most of the ports are cramped together.
SD Card Reader
| SD Card Reader | |
| average JPG Copy Test (av. of 3 runs) | |
| MSI Summit A16 AI Plus A3HMTG (AV Pro SD microSD 128 GB V60) | |
| Lenovo ThinkBook 16 G7 IML (Toshiba Exceria Pro SDXC 64 GB UHS-II) | |
| Eurocom Blitz Ultra 16 (AV Pro SD microSD 128 GB V60) | |
| Asus Vivobook S16 S5606M | |
| maximum AS SSD Seq Read Test (1GB) | |
| MSI Summit A16 AI Plus A3HMTG (AV Pro SD microSD 128 GB V60) | |
| Eurocom Blitz Ultra 16 (AV Pro SD microSD 128 GB V60) | |
| Lenovo ThinkBook 16 G7 IML (Toshiba Exceria Pro SDXC 64 GB UHS-II) | |
| Asus Vivobook S16 S5606M | |
Communication
Webcam
The webcam is disappointing at only 1 MP or 720p with no higher resolution options, IR, or even privacy shutter. An option to configure without any webcam at all is available.


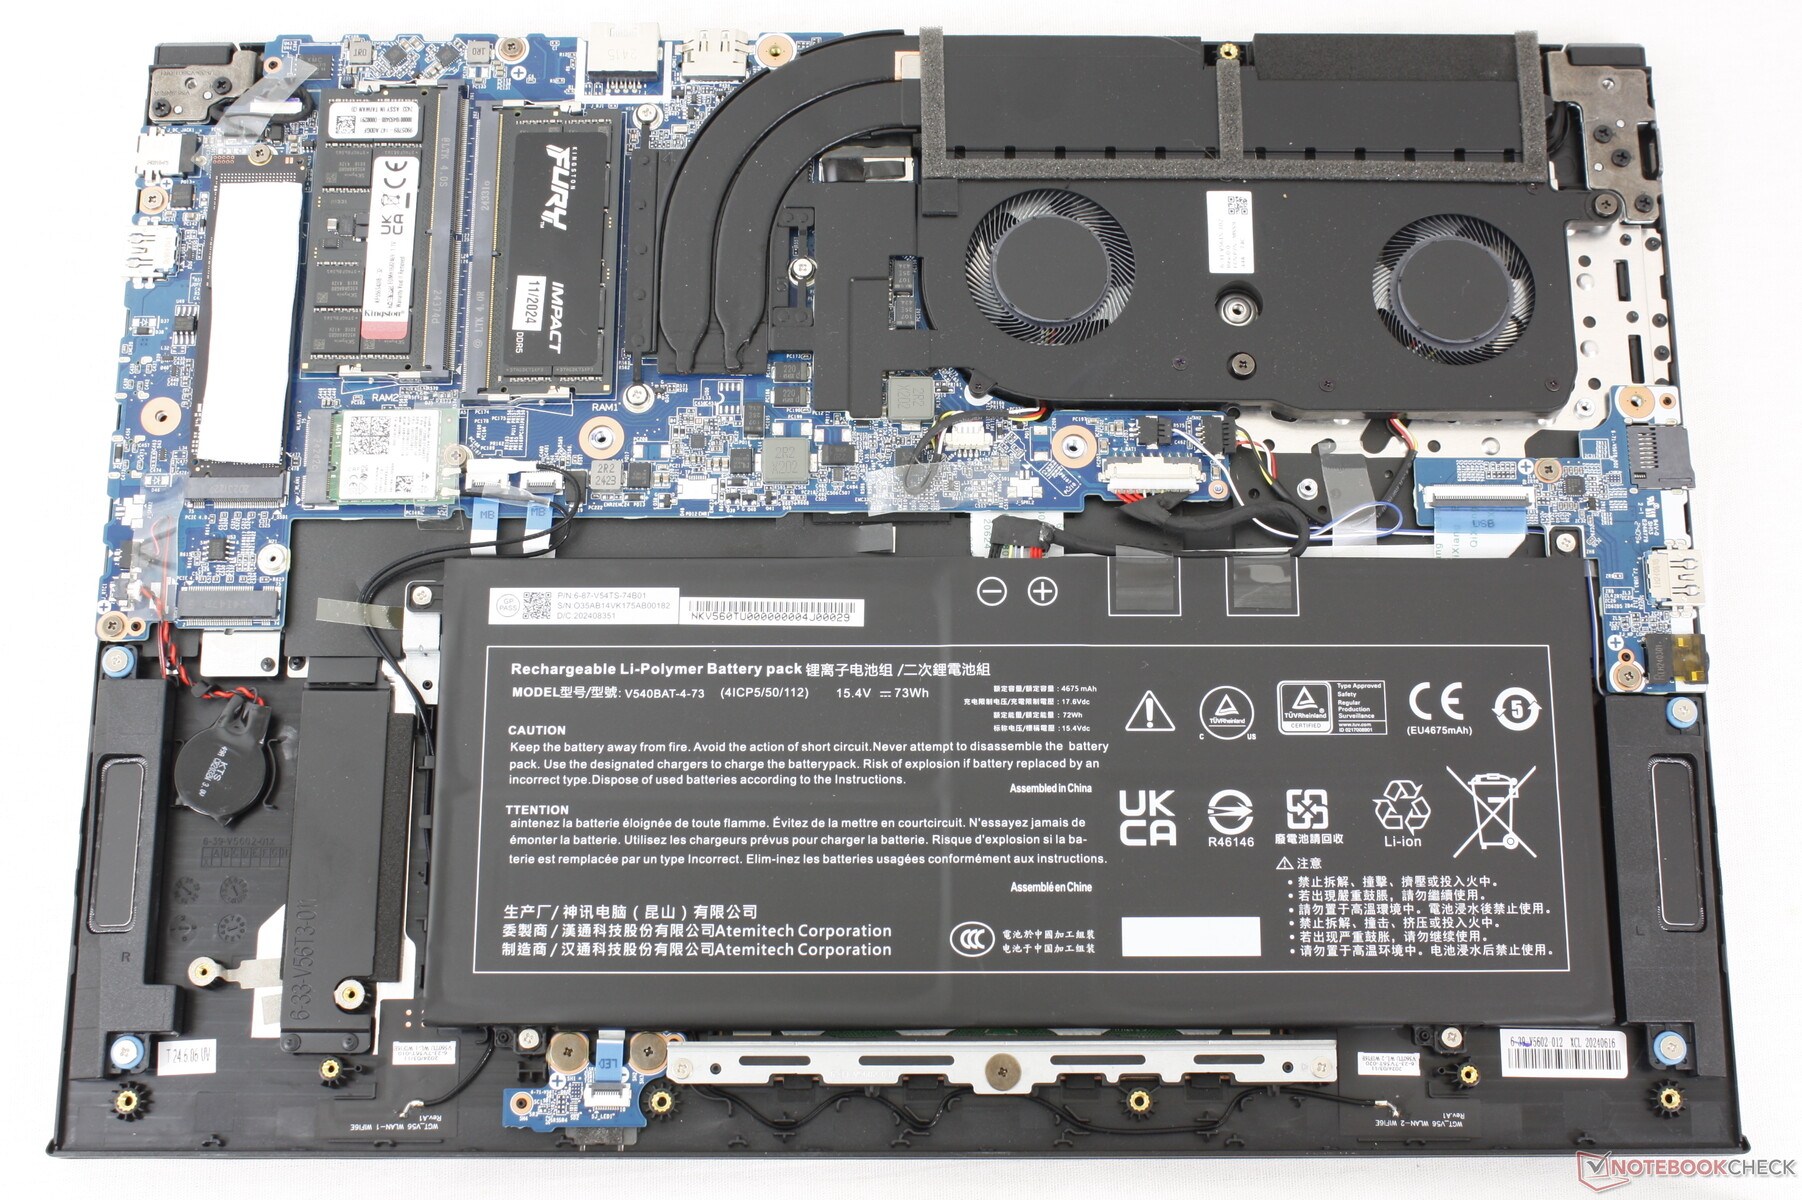
Maintenance
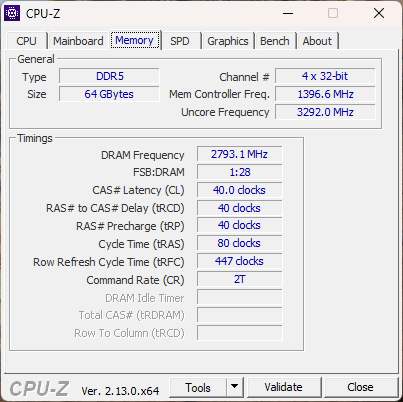
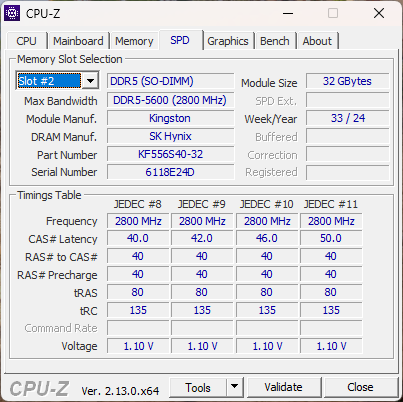
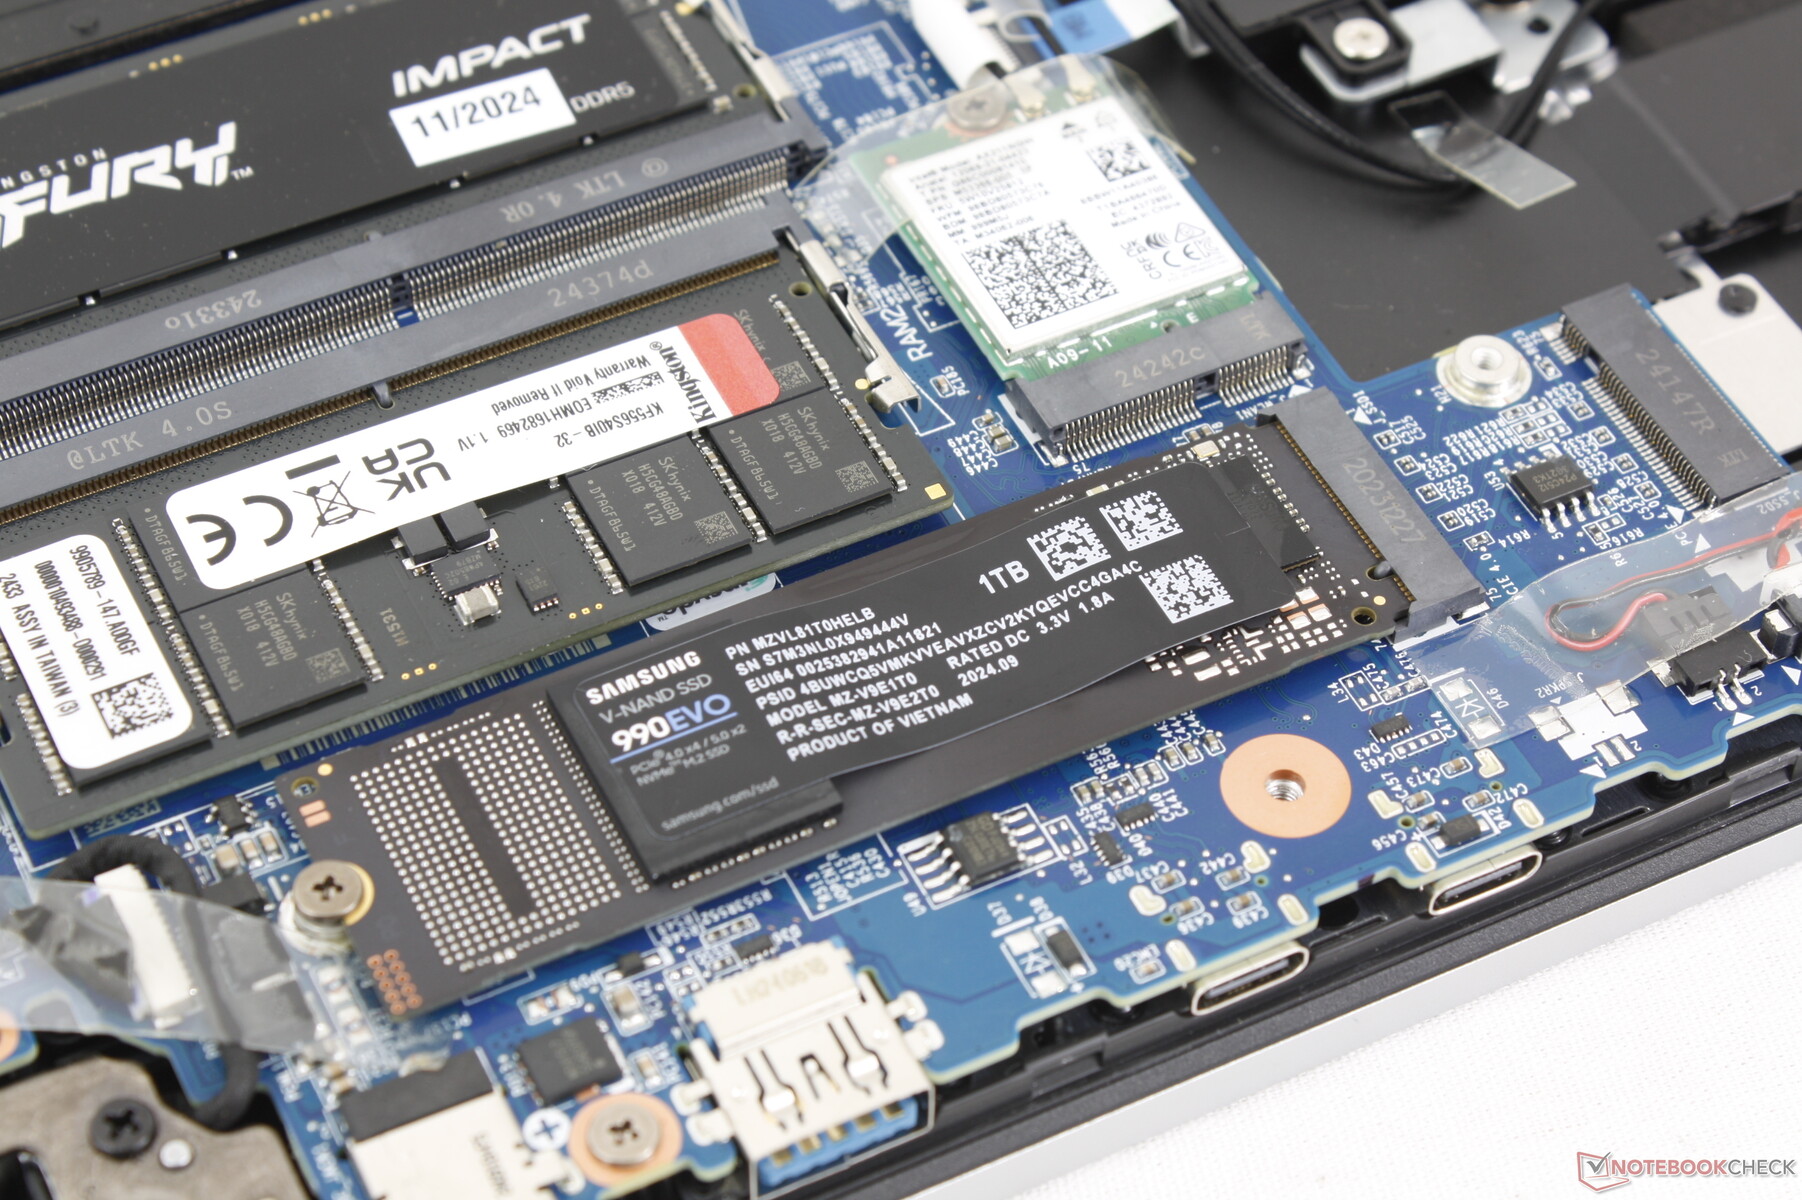
The bottom panel is easily removable with just a Phillips screwdriver. Users can install up to two DDR5 SODIMM modules up to 96 GB total and two M.2 2280 PCIe4 x4 SSDs.
Sustainability
The maker does not state any sustainability measures taken during manufacturing. The packaging is mostly cardboard with protective foam and plastic.
Accessories And Warranty
There are no extras in the box other than the usual AC adapter and paperwork. The usual one-year limited manufacturer warranty applies with options to upgrade to three years.
Input Devices
Keyboard
The typing experience is similar across most Eurocom models as they can all be sourced from Clevo or Tongfang designs. In this case, the keyboard is identical to the one on the Raptor X17 except for the now-mandatory Co-Pilot key. Clatter is quieter than on many other 16-inch laptops albeit at the cost of softer feedback.
Touchpad
The clickpad is decent in size (8.3 x 12.2 cm) and responsive for cursor control. However, feedback when inputting a click is on the spongy side to be unreliable for multi-touch actions.
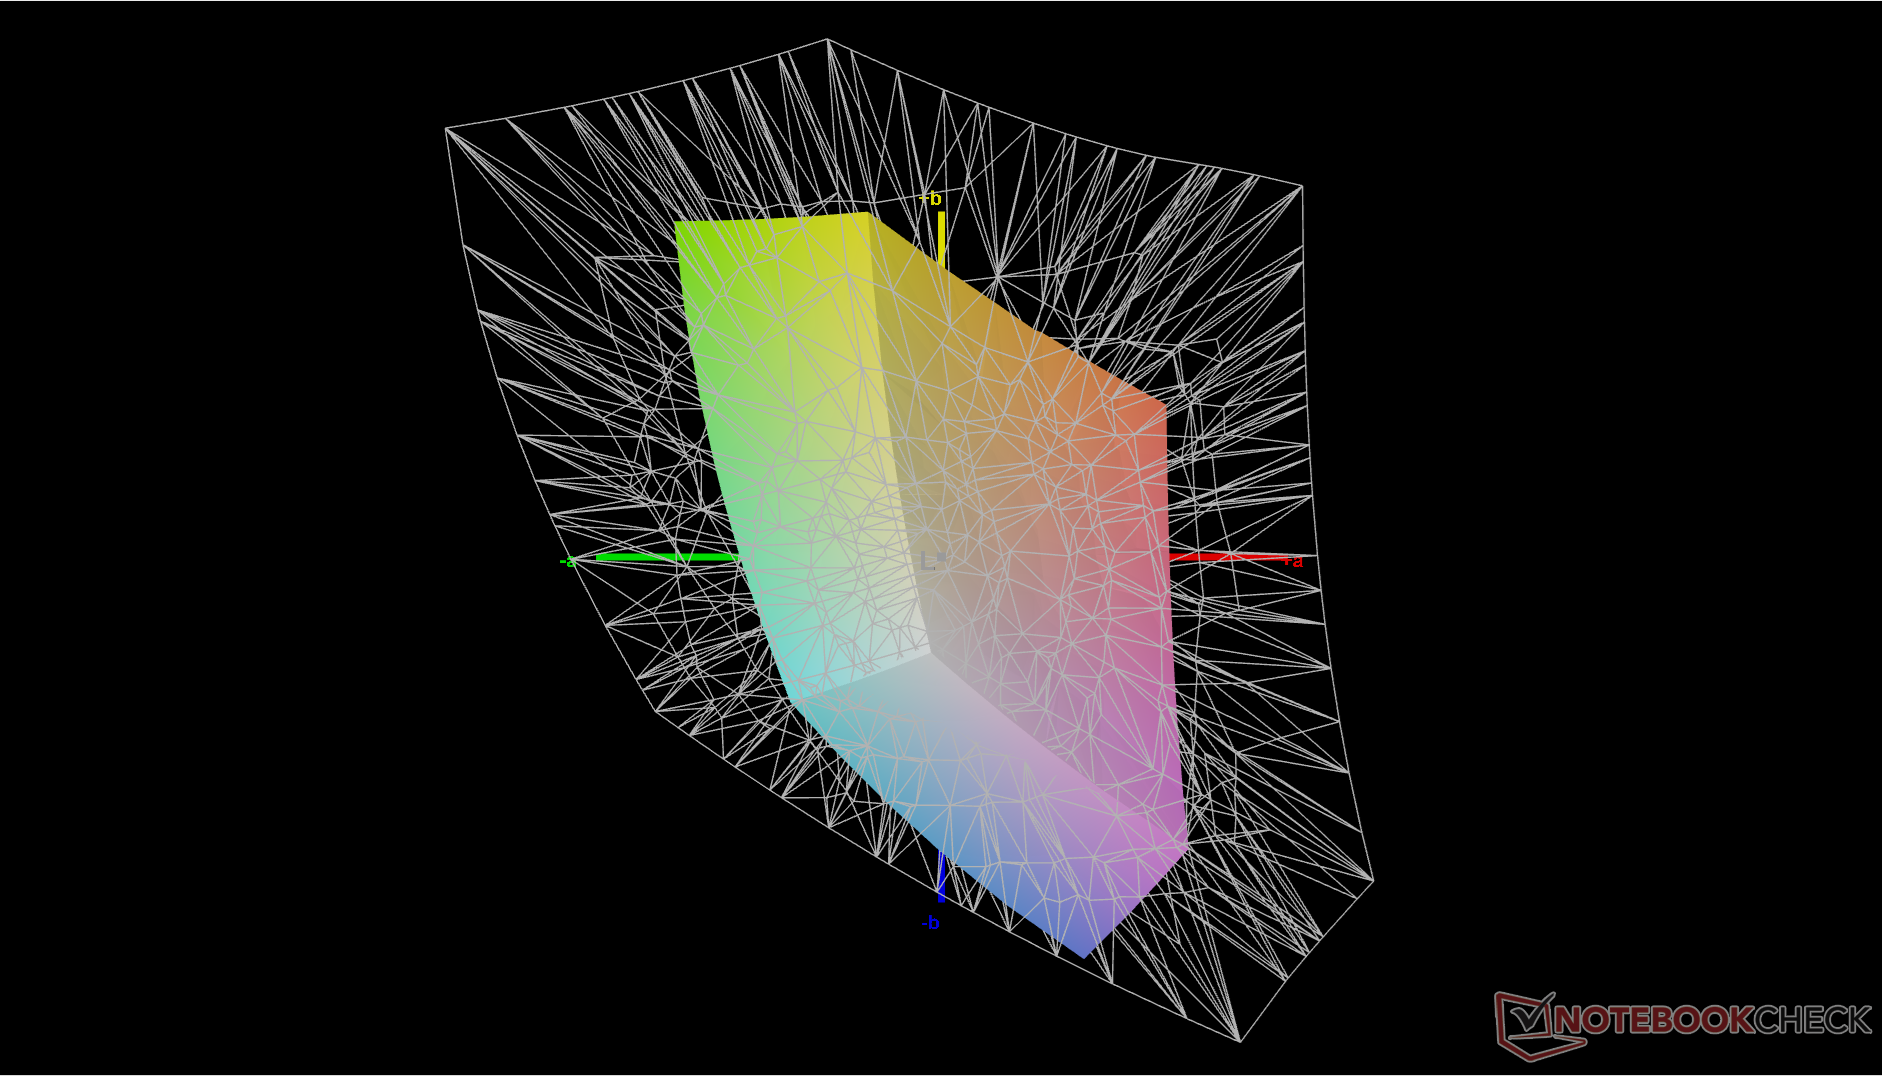
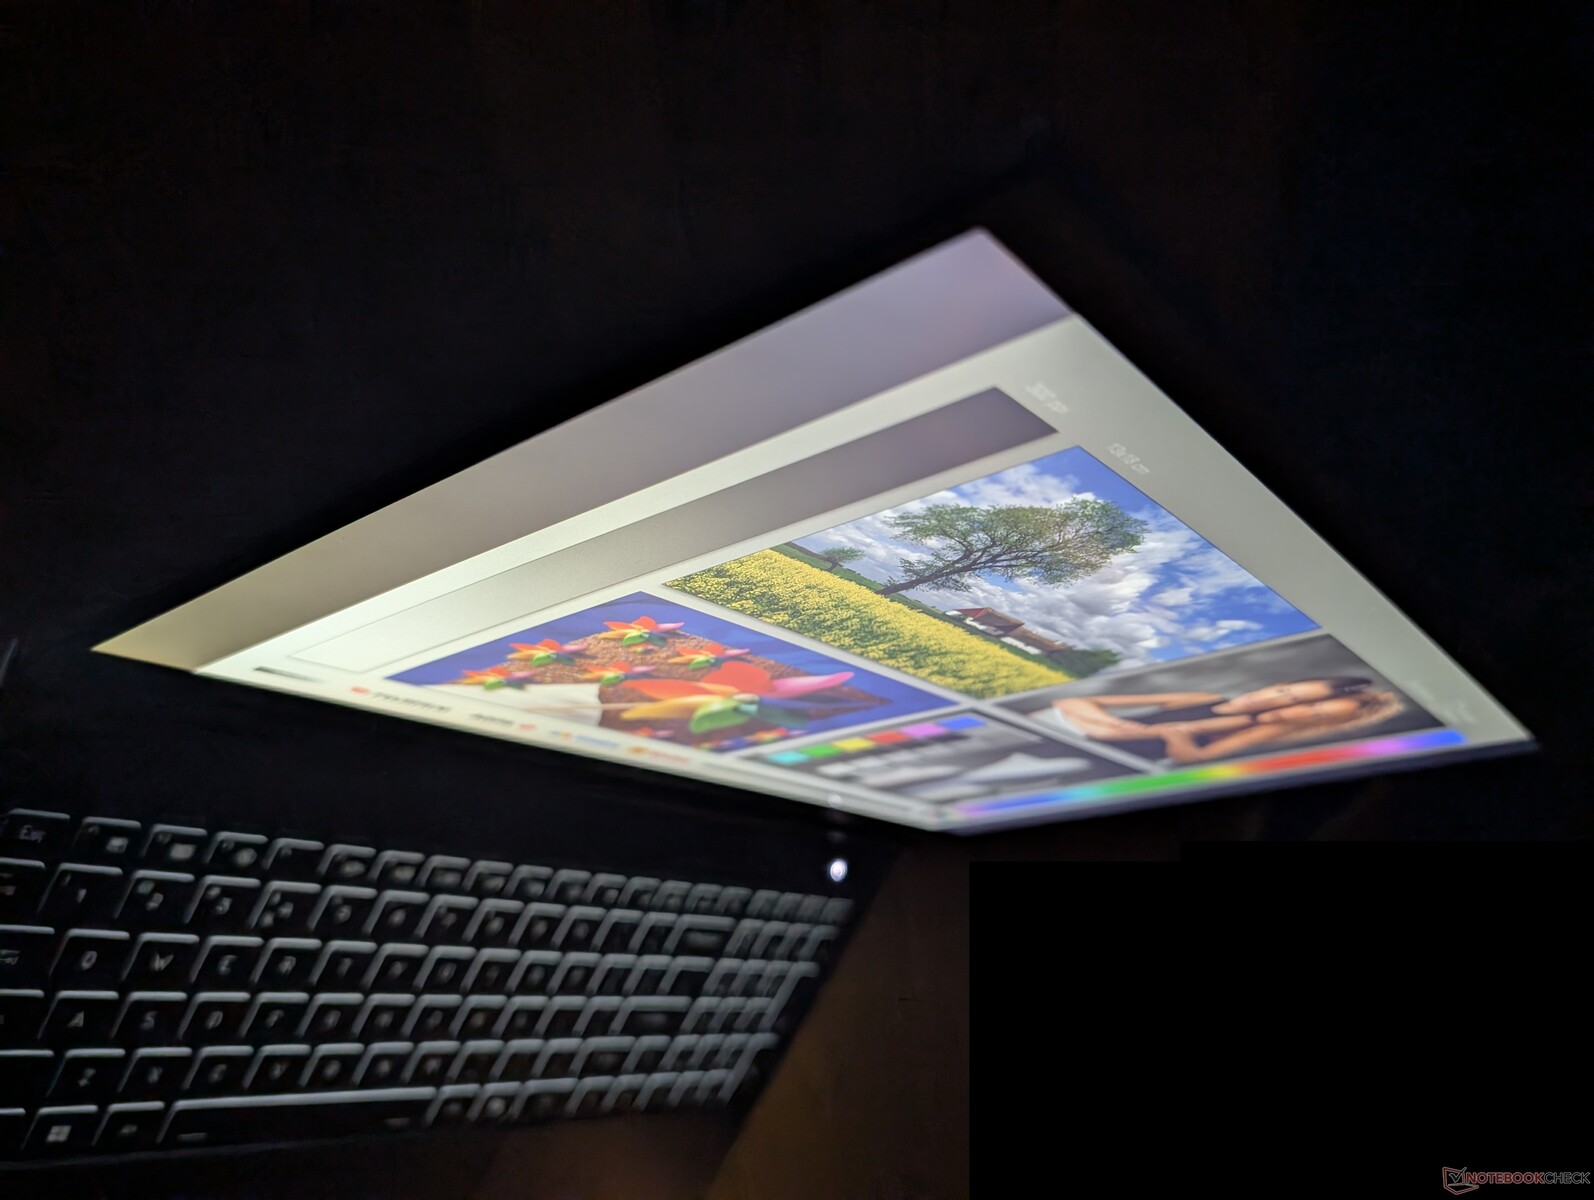
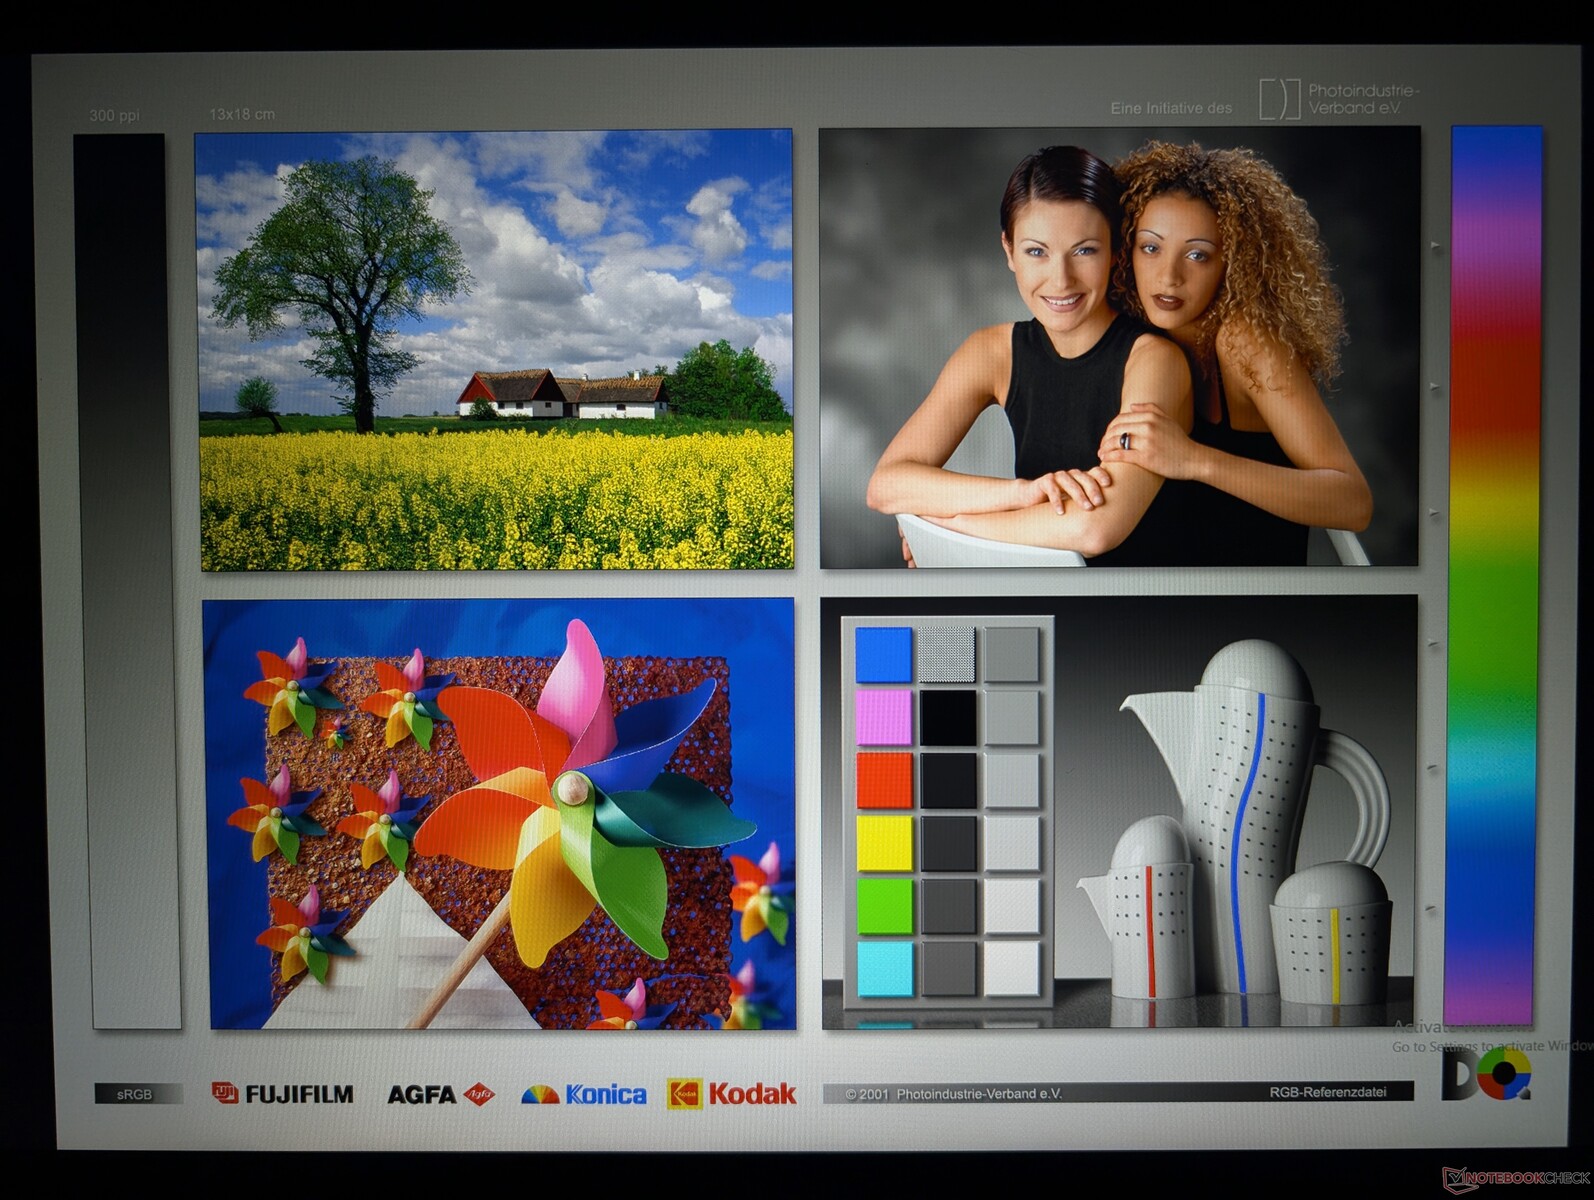
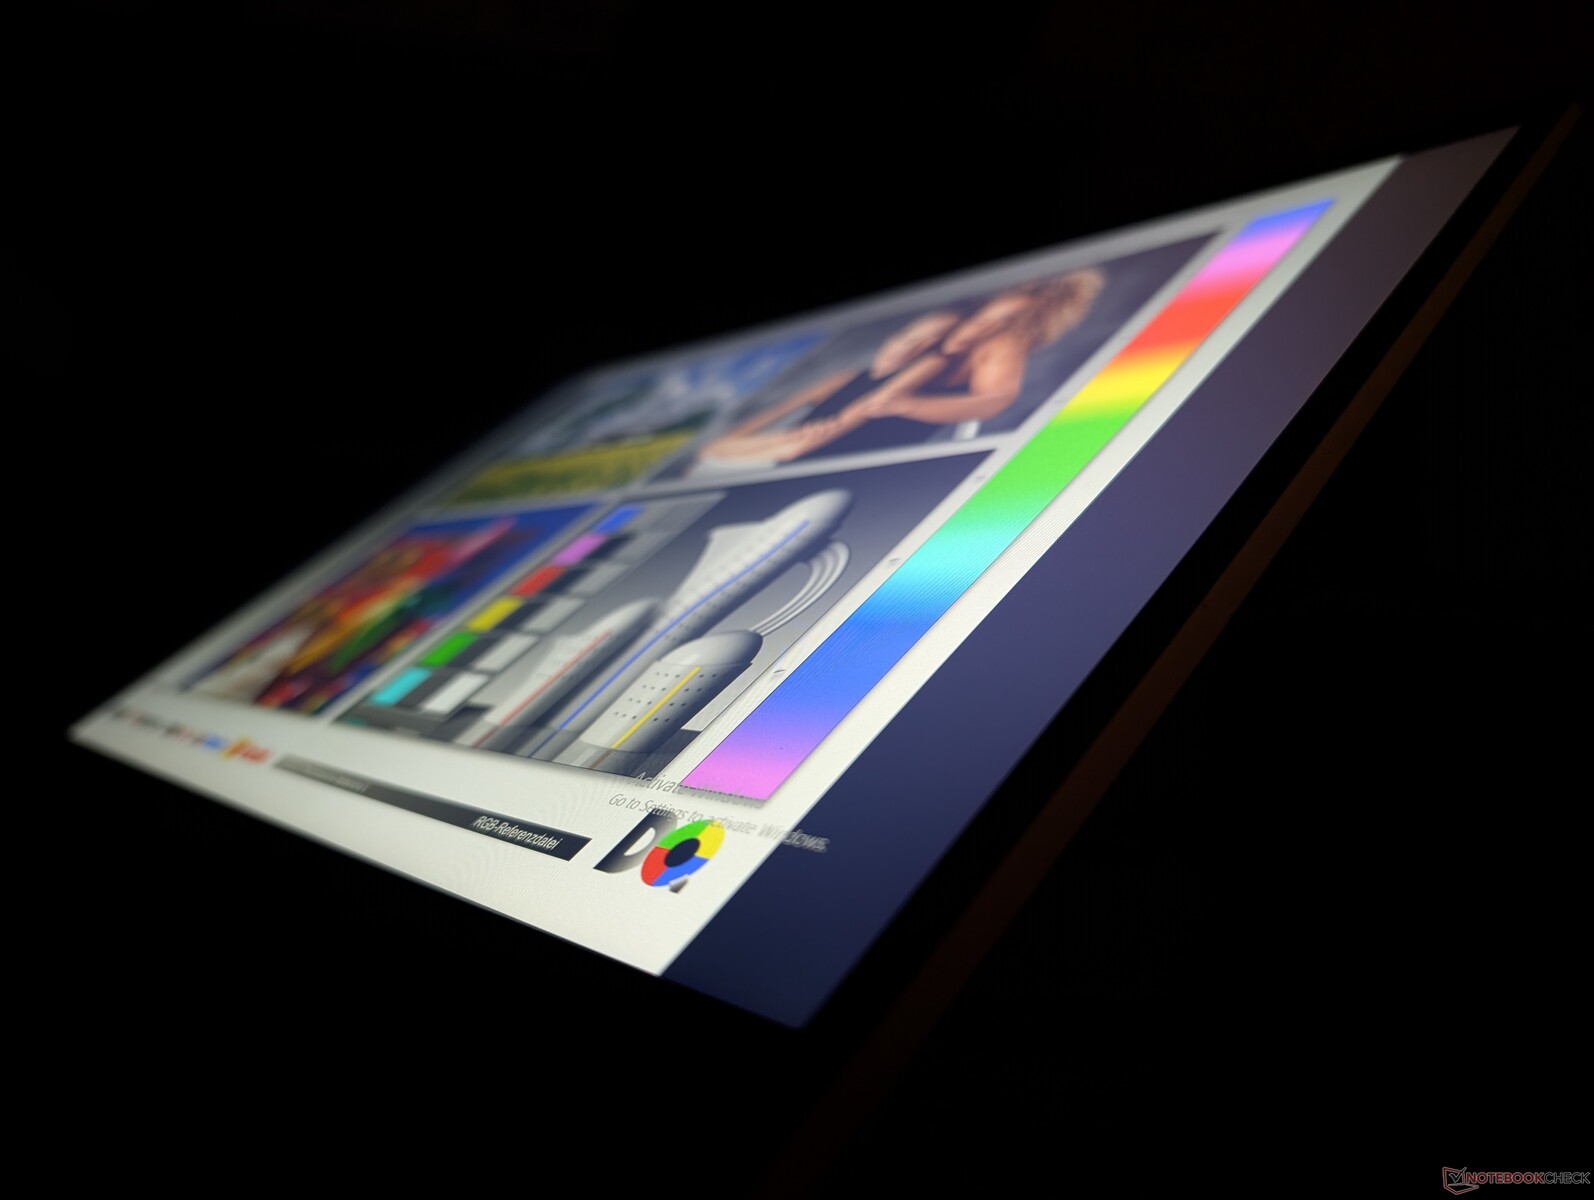
Display
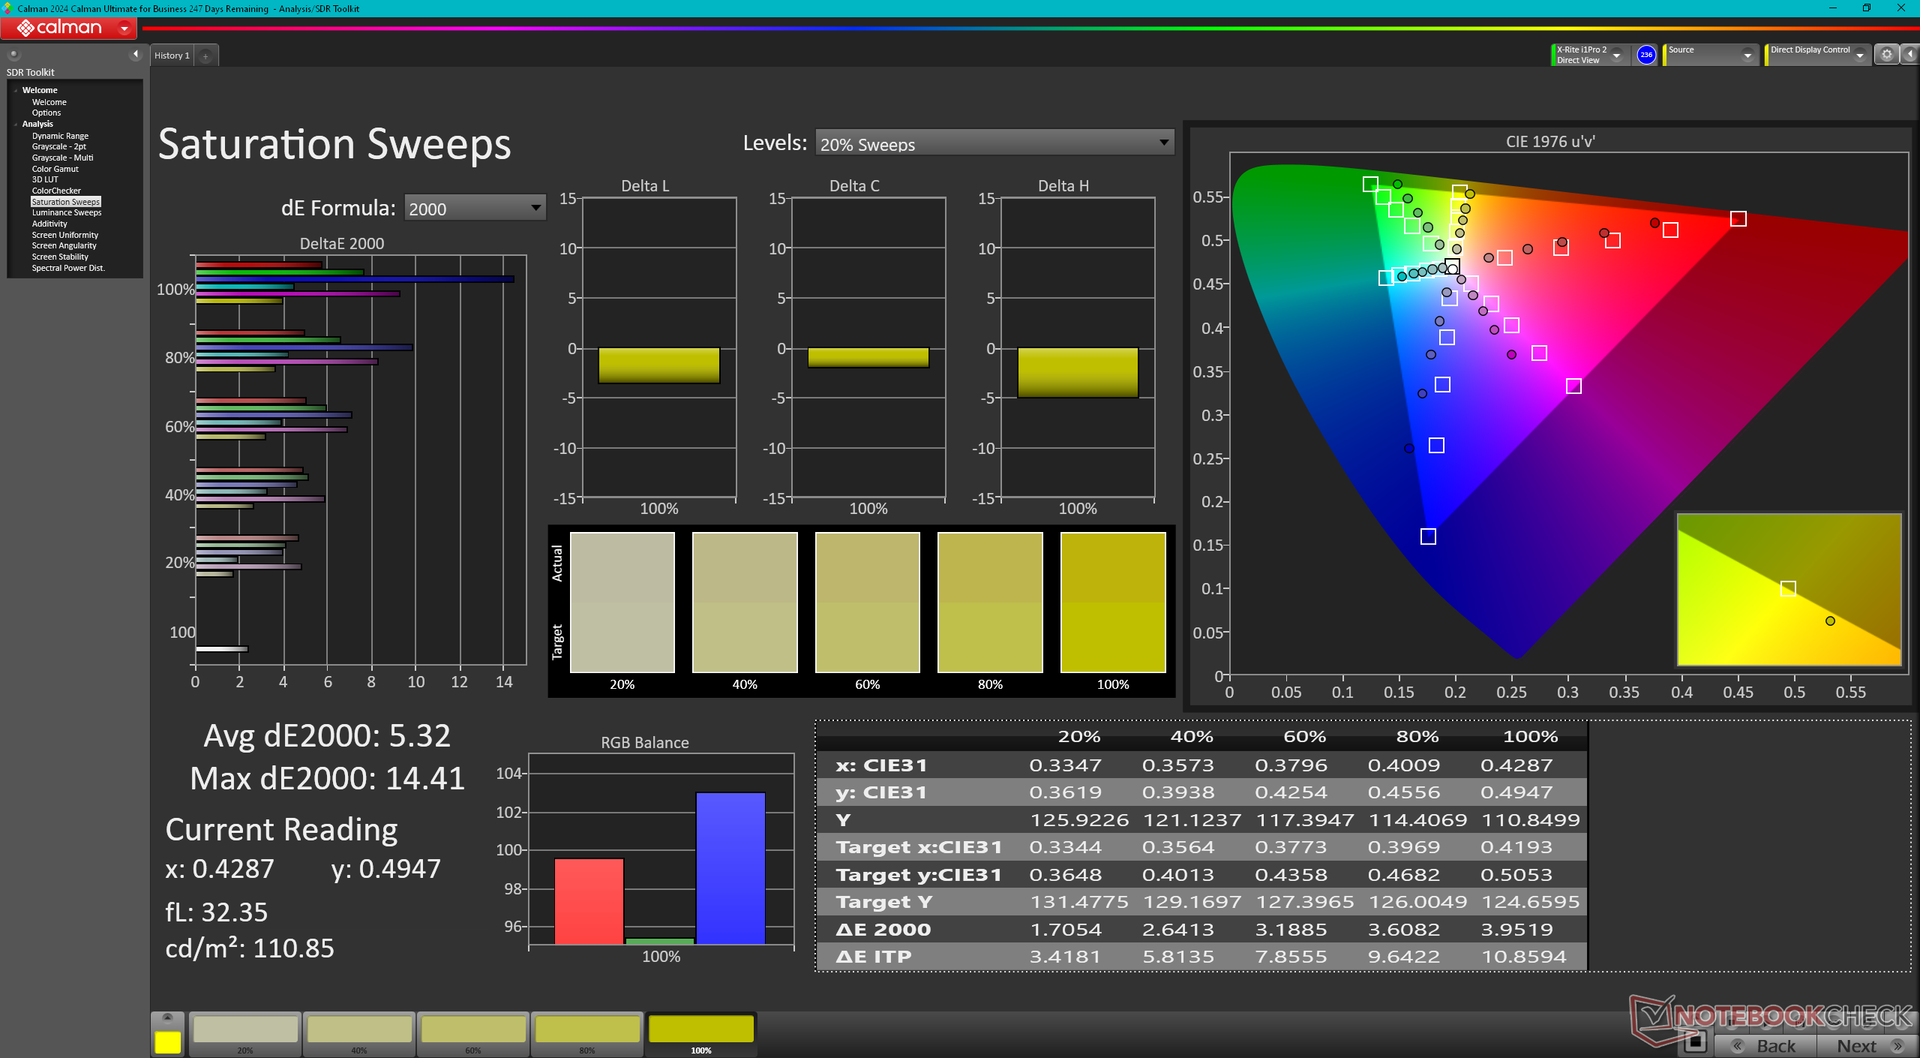
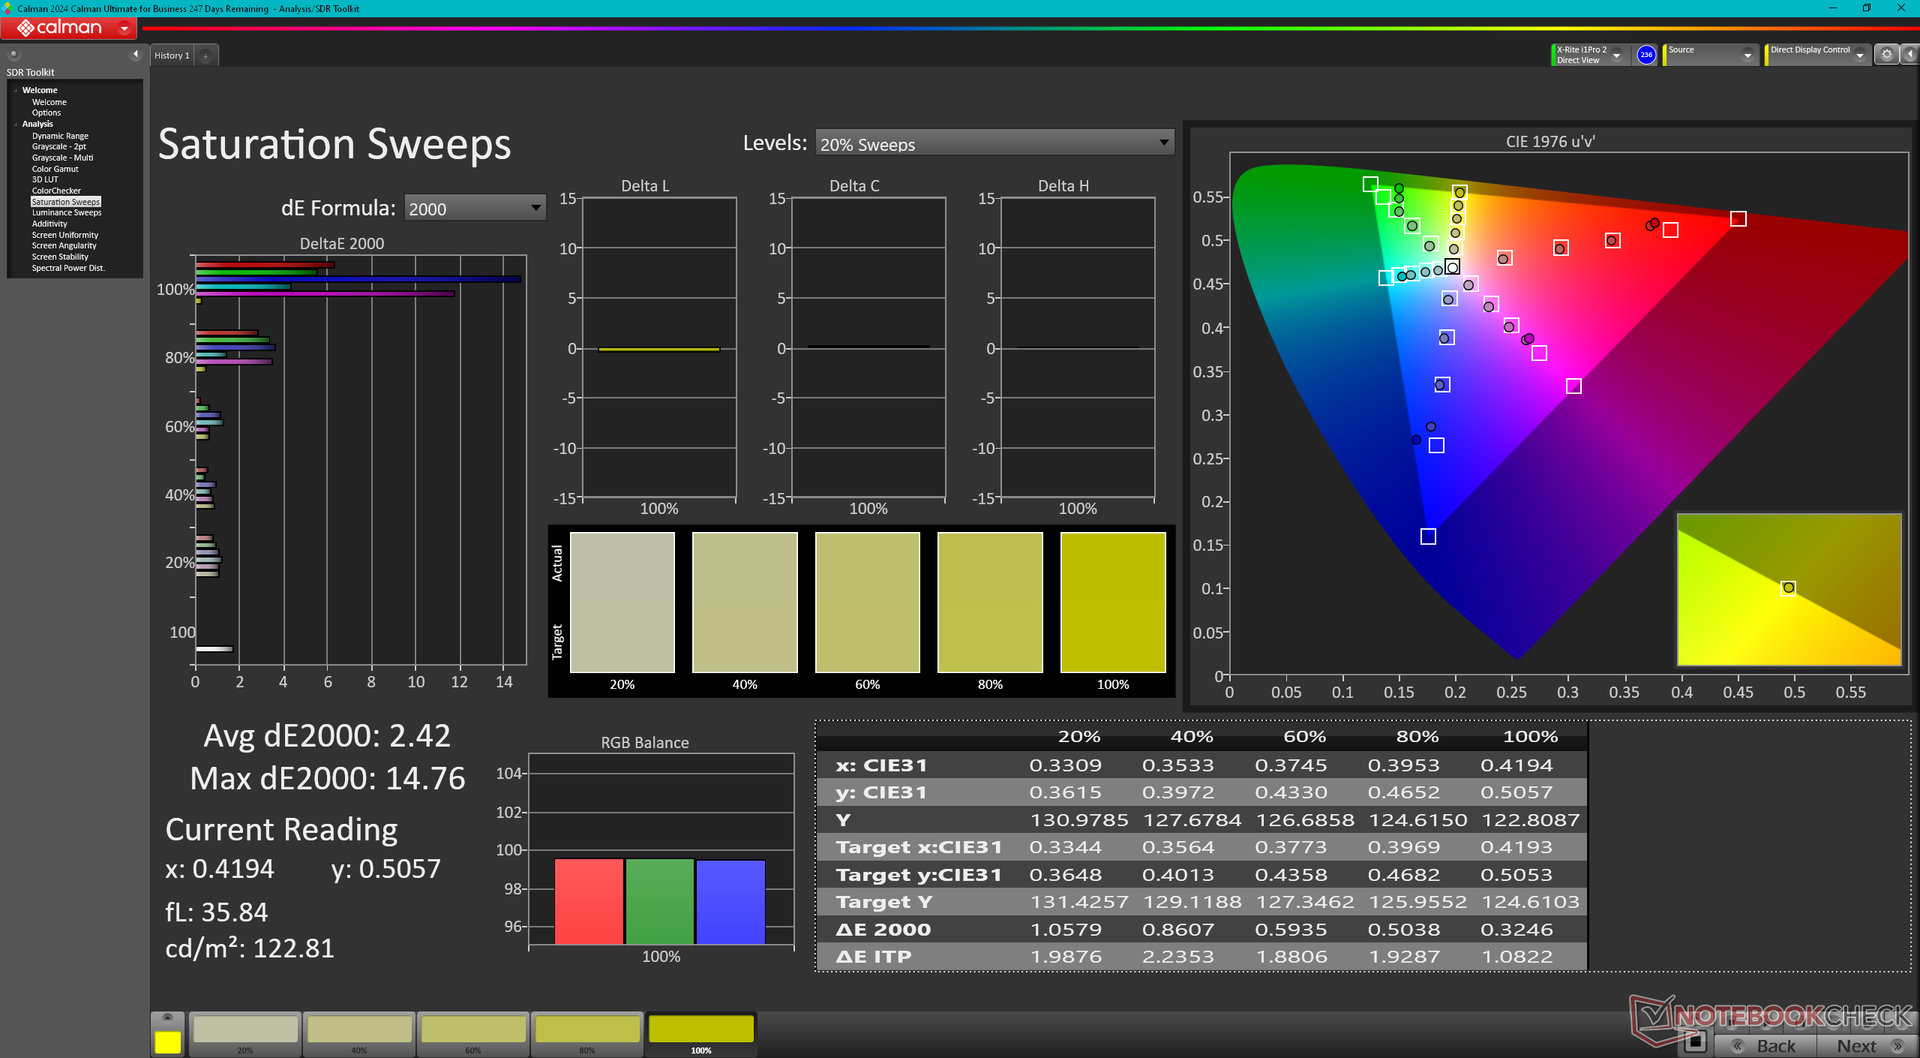
The IPS display is as basic as it gets with its ~60 percent sRGB colors, 60 Hz refresh rate, and mediocre 255-nit maximum brightness level. More modern IPS displays, such as the one on the MSI Summit A16 AI Plus, offer vastly superior colors, faster refresh rates, and a brighter backlight for noticeably better image quality and outdoor visibility.


| |||||||||||||||||||||||||
Brightness Distribution: 80 %
Center on Battery: 255 cd/m²
Contrast: 981:1 (Black: 0.26 cd/m²)
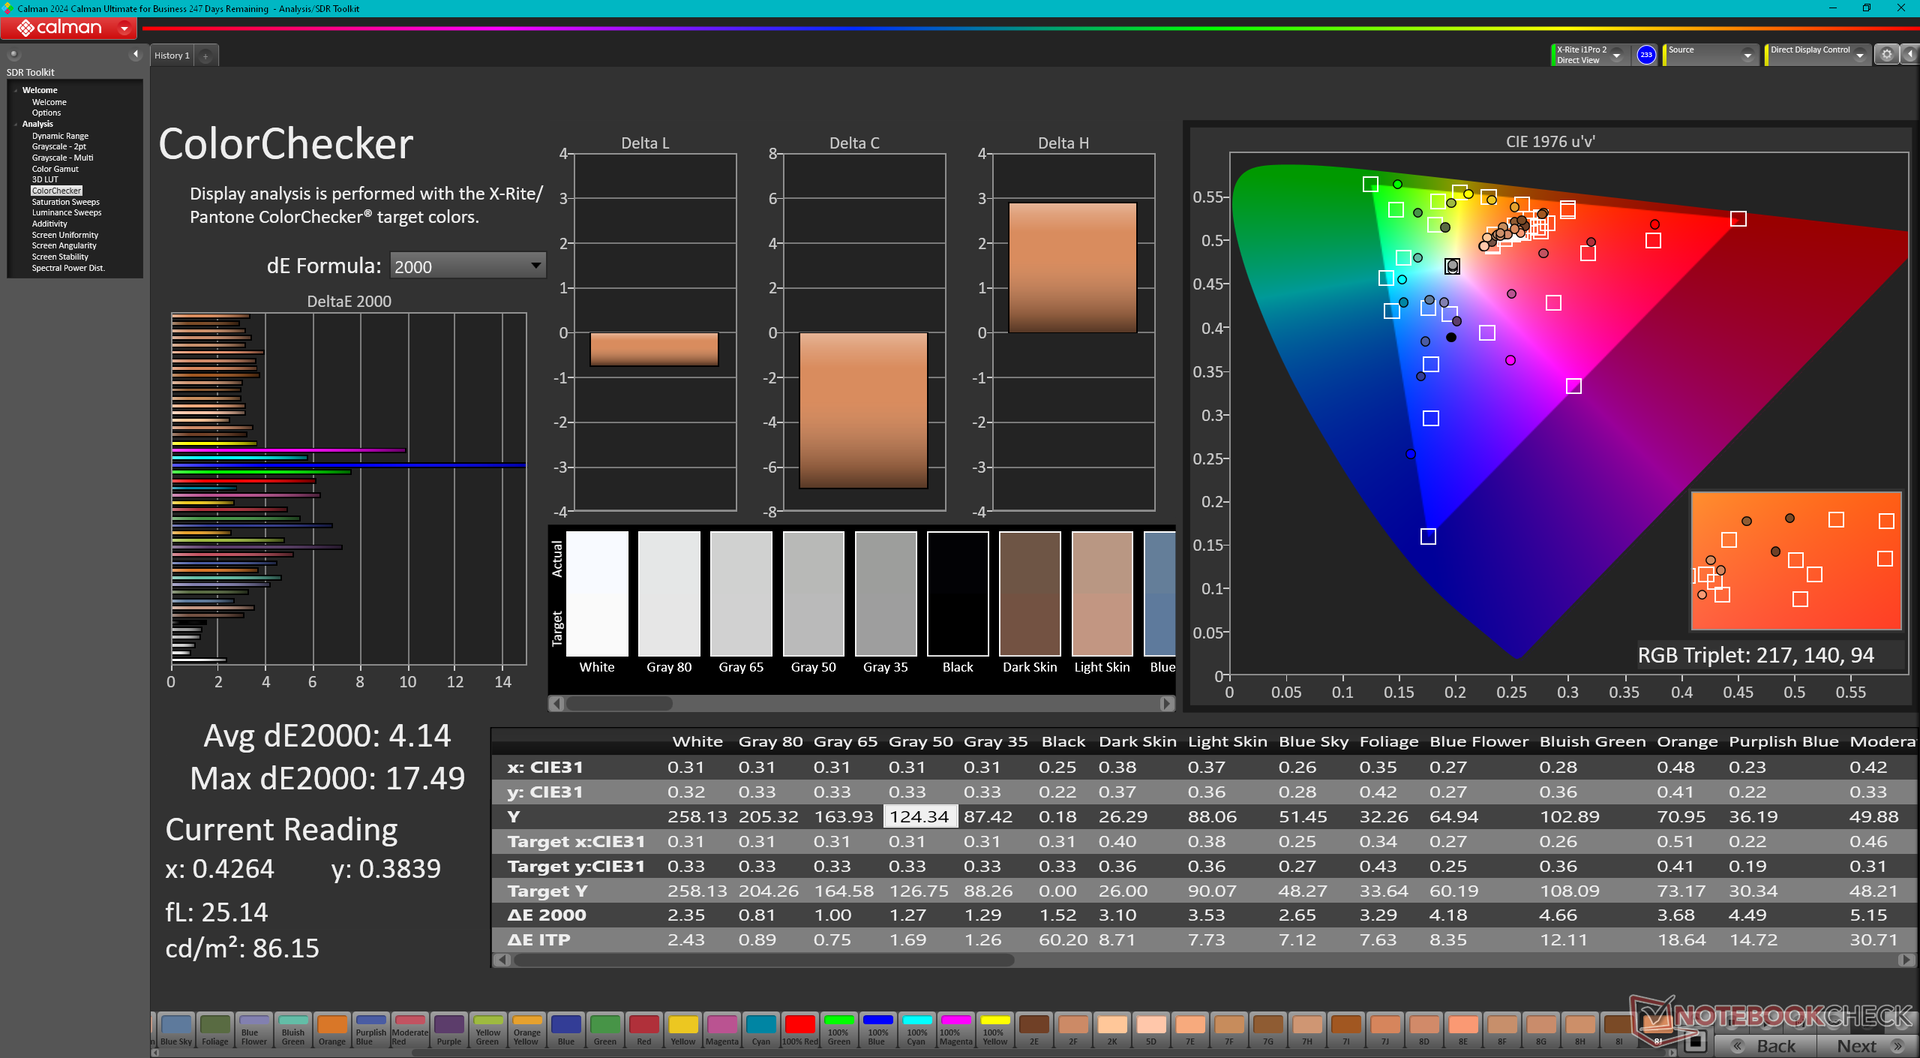
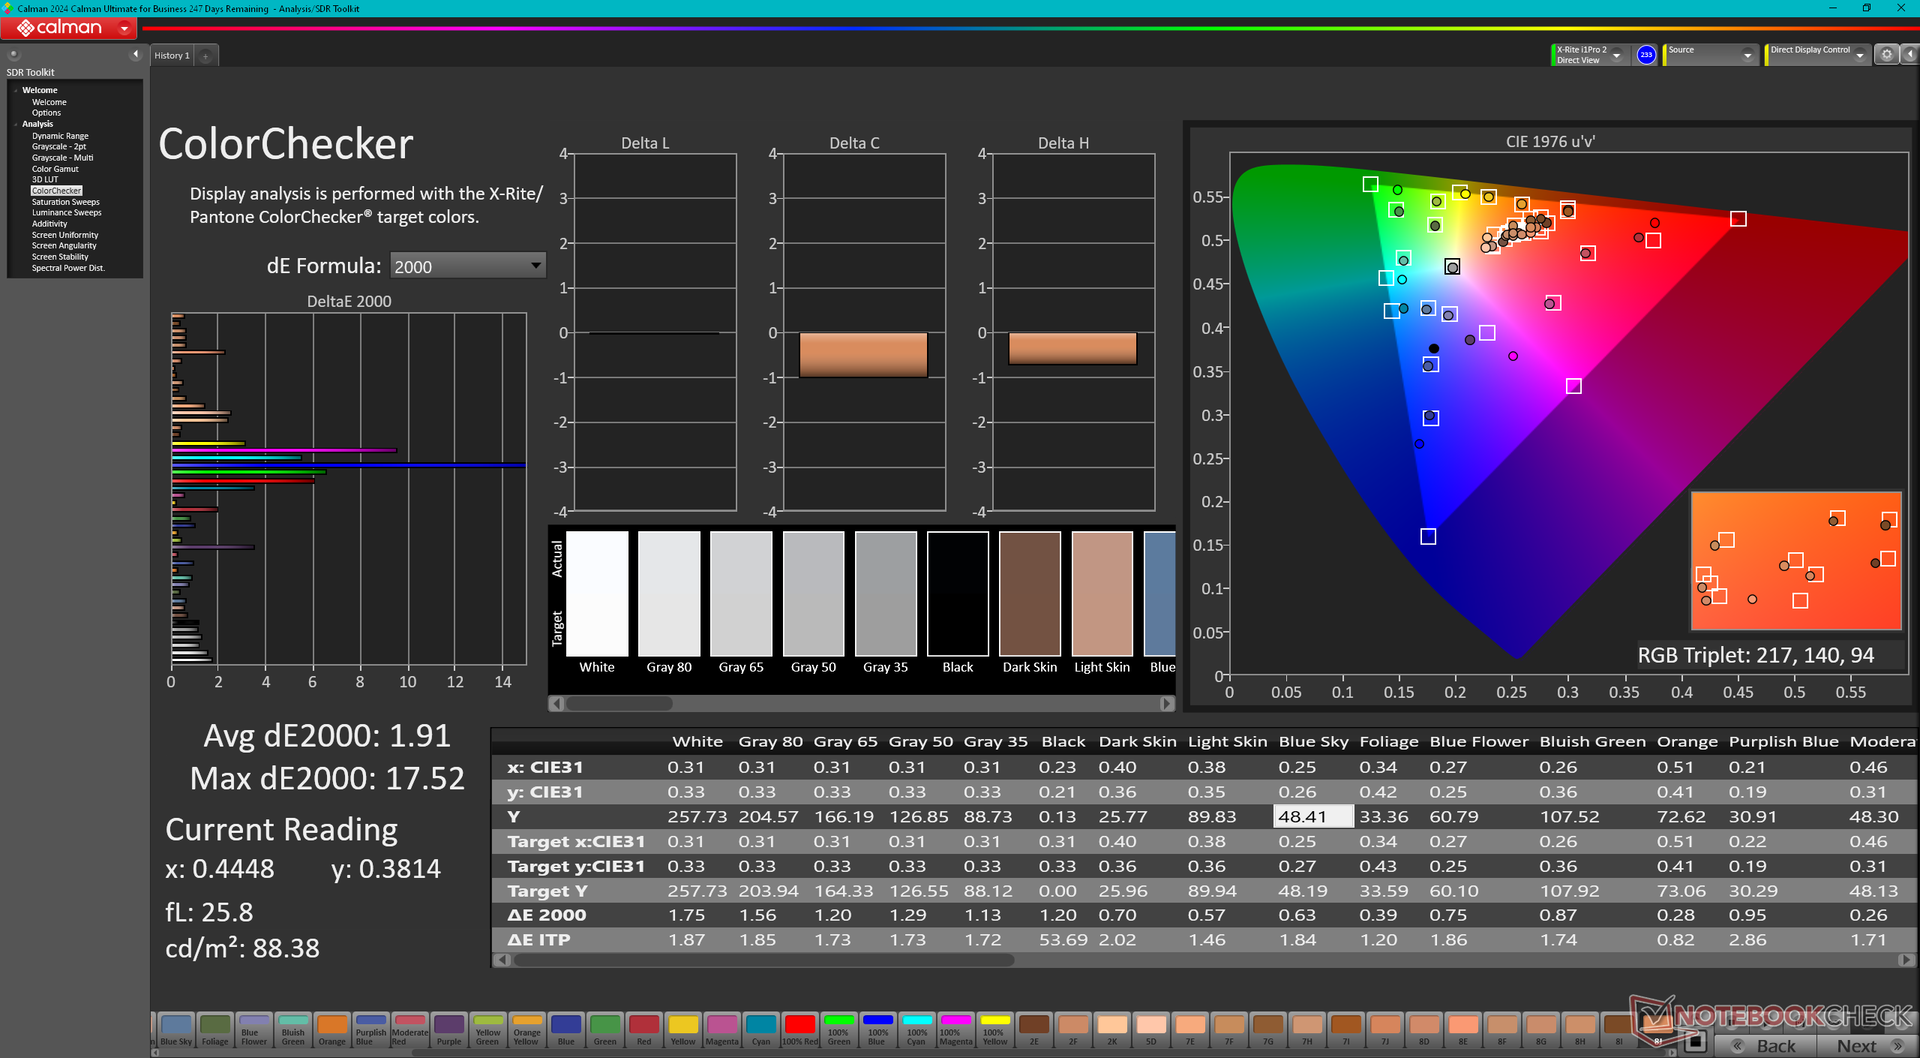
ΔE ColorChecker Calman: 4.14 | ∀{0.5-29.43 Ø4.71}
calibrated: 1.91
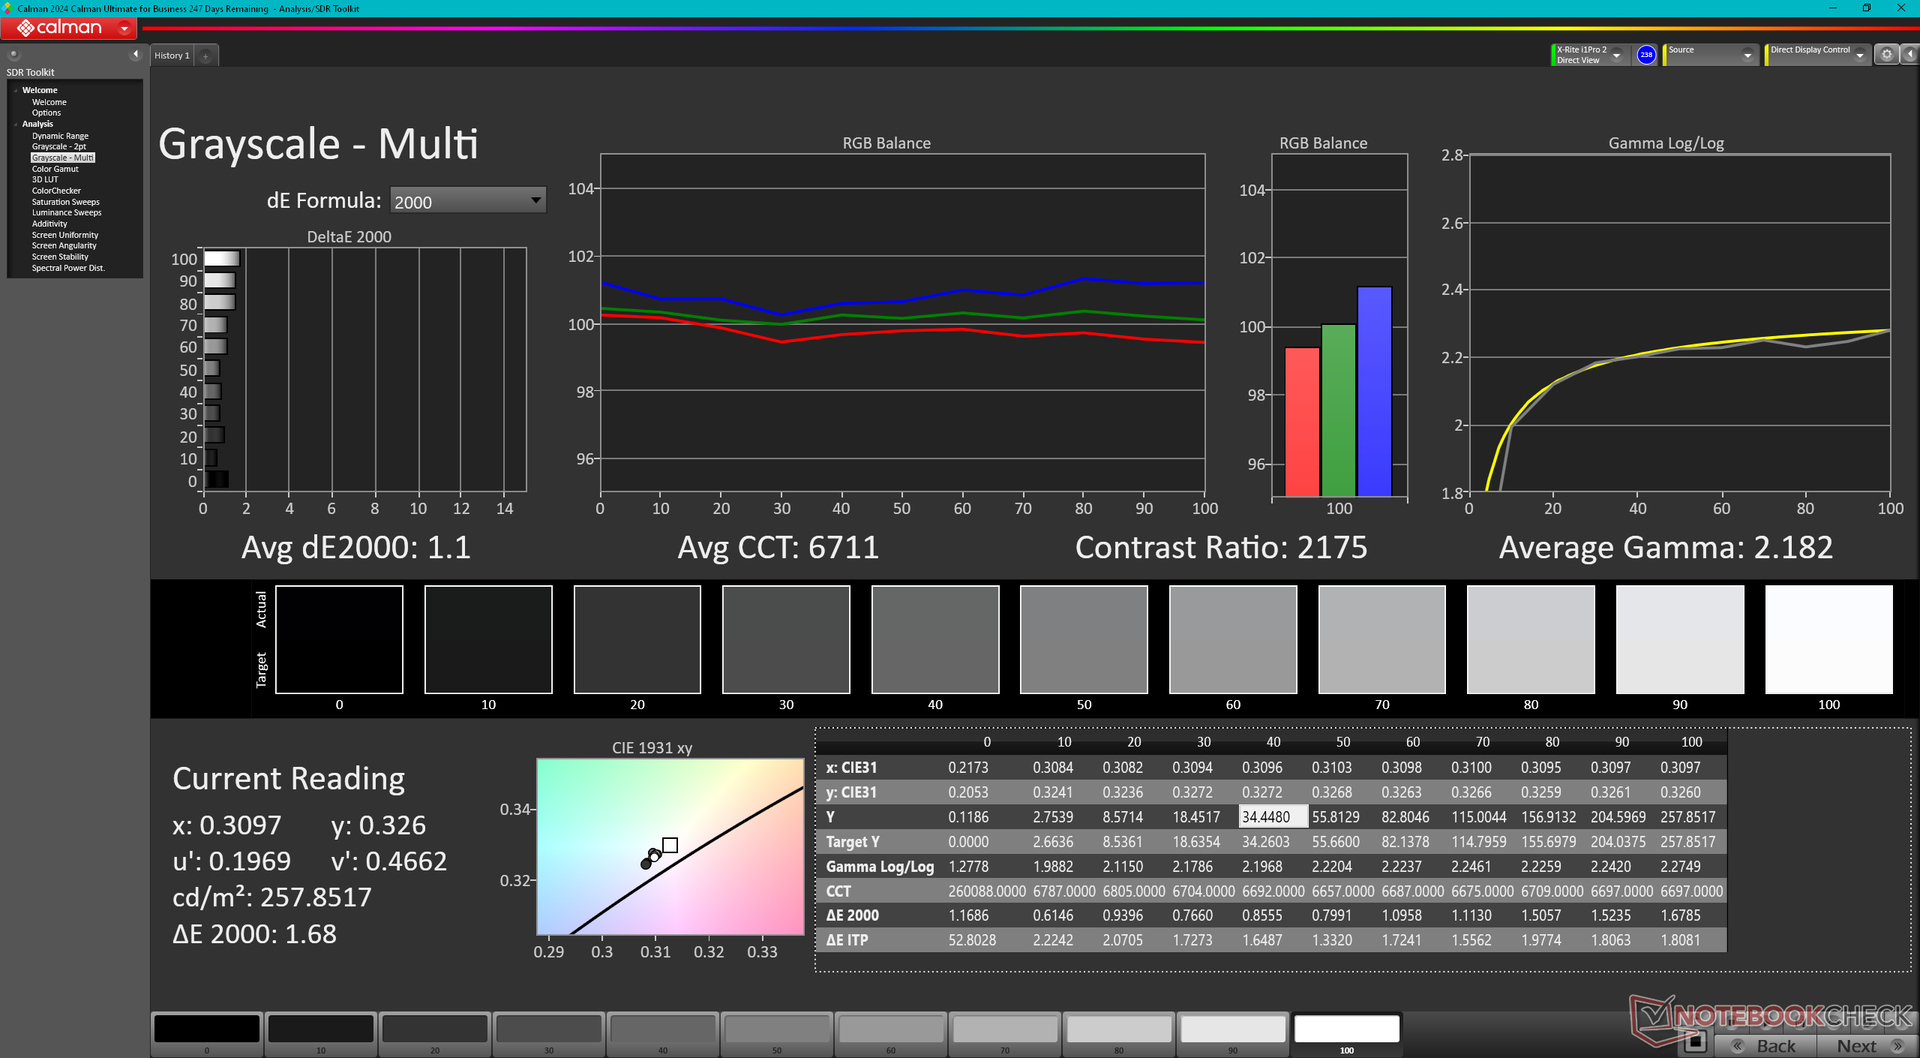
ΔE Greyscale Calman: 1.1 | ∀{0.09-98 Ø4.96}
42.4% AdobeRGB 1998 (Argyll 3D)
60.8% sRGB (Argyll 3D)
41.1% Display P3 (Argyll 3D)
Gamma: 2.18
CCT: 6552 K
| Eurocom Blitz Ultra 16 AU Optronics AUOF49A, IPS, 1920x1200, 16", 60 Hz | Lenovo ThinkBook 16 G7 IML LEN160WUXGA, IPS, 1920x1200, 16", 60 Hz | MSI Summit A16 AI Plus A3HMTG AU Optronics B16QAN02.N, IPS, 2560x1600, 16", 165 Hz | Acer Aspire 16 A16-51GM-77G2 N160JCA-EEK (Chi Mei CMN163D), IPS, 1920x1200, 16", 60 Hz | Lenovo ThinkPad T16 Gen 3 21MN005XGE B160UAN01.K, IPS LED, 1920x1200, 16", 60 Hz | Asus VivoBook Pro 16 Au Optronics B160QAN02.L, IPS, 2560x1600, 16", 120 Hz | |
|---|---|---|---|---|---|---|
| Display | 1% | 100% | 4% | 81% | 102% | |
| Display P3 Coverage (%) | 41.1 | 41.6 1% | 96.8 136% | 42.3 3% | 79 92% | 98.5 140% |
| sRGB Coverage (%) | 60.8 | 61.2 1% | 99.8 64% | 63.6 5% | 99.9 64% | 99.9 64% |
| AdobeRGB 1998 Coverage (%) | 42.4 | 43 1% | 84.7 100% | 43.7 3% | 79.8 88% | 86.1 103% |
| Response Times | 16% | 49% | -26% | -34% | 74% | |
| Response Time Grey 50% / Grey 80% * (ms) | 24.2 ? | 18.4 ? 24% | 12.9 ? 47% | 31.4 ? -30% | 33.6 ? -39% | 2 ? 92% |
| Response Time Black / White * (ms) | 18 ? | 16.5 ? 8% | 8.9 ? 51% | 22 ? -22% | 23.3 ? -29% | 8 ? 56% |
| PWM Frequency (Hz) | ||||||
| Screen | -93% | 18% | -19% | 8% | 21% | |
| Brightness middle (cd/m²) | 255 | 321.2 26% | 475.4 86% | 352 38% | 468 84% | 504 98% |
| Brightness (cd/m²) | 240 | 319 33% | 440 83% | 324 35% | 434 81% | 465 94% |
| Brightness Distribution (%) | 80 | 92 15% | 89 11% | 86 8% | 90 13% | 87 9% |
| Black Level * (cd/m²) | 0.26 | 0.37 -42% | 0.36 -38% | 0.27 -4% | 0.23 12% | 0.35 -35% |
| Contrast (:1) | 981 | 868 -12% | 1321 35% | 1304 33% | 2035 107% | 1440 47% |
| Colorchecker dE 2000 * | 4.14 | 8.7 -110% | 2.99 28% | 4.41 -7% | 3.4 18% | 1.83 56% |
| Colorchecker dE 2000 max. * | 17.49 | 19.85 -13% | 7.64 56% | 15.04 14% | 7.2 59% | 5.51 68% |
| Colorchecker dE 2000 calibrated * | 1.91 | 1.82 5% | 0.74 61% | 3.52 -84% | 1.8 6% | 1.34 30% |
| Greyscale dE 2000 * | 1.1 | 9.2 -736% | 2.9 -164% | 3.32 -202% | 4.5 -309% | 3.02 -175% |
| Gamma | 2.18 101% | 2.83 78% | 2.31 95% | 2.44 90% | 2.1 105% | 2.39 92% |
| CCT | 6552 99% | 6200 105% | 6472 100% | 7122 91% | 6373 102% | 6688 97% |
| Total Average (Program / Settings) | -25% /
-57% | 56% /
40% | -14% /
-15% | 18% /
18% | 66% /
46% |
* ... smaller is better
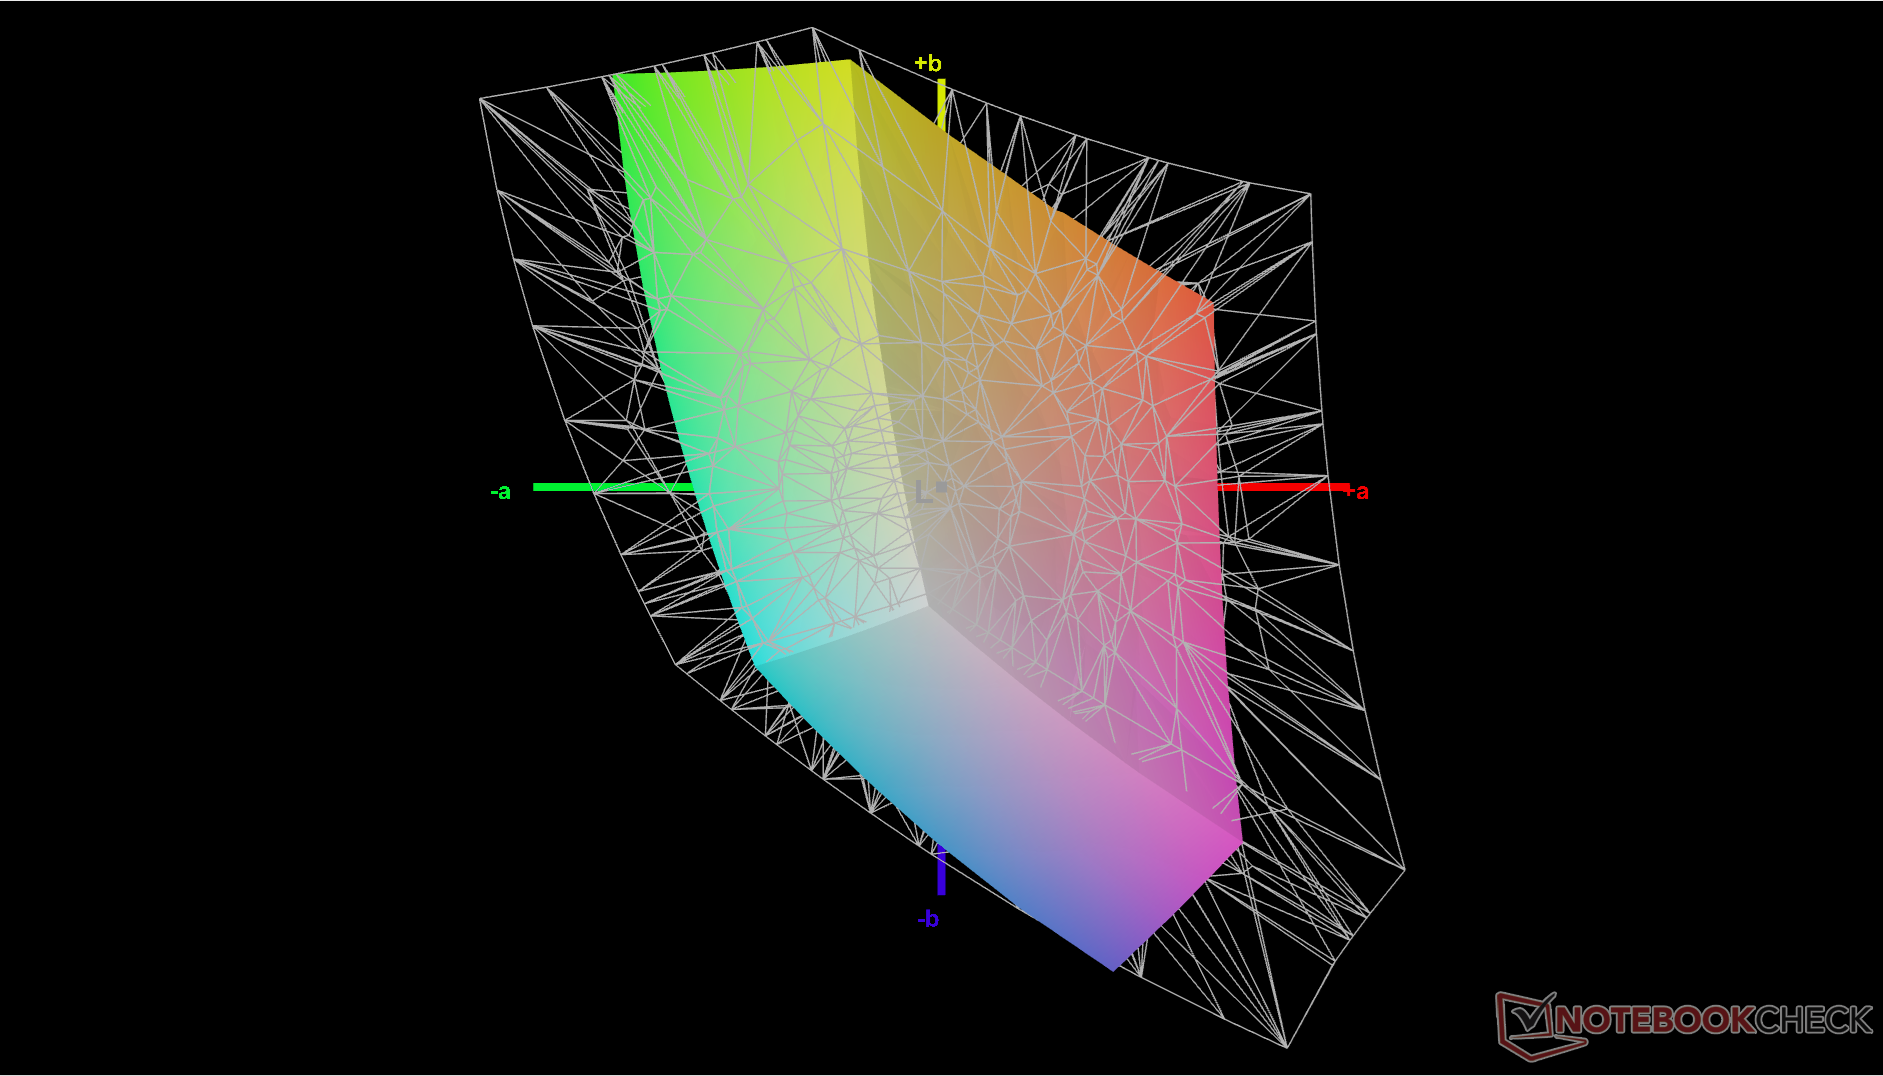
The panel is well-calibrated out of the box with an average grayscale DeltaE value of just 1.1. However, its limited color reproduction as mentioned above means the maximum color deltaE can be quite high at over 17 even after our own X-Rite calibration test.

Display Response Times
| ↔ Response Time Black to White | ||
|---|---|---|
| 18 ms ... rise ↗ and fall ↘ combined | ↗ 9.7 ms rise | 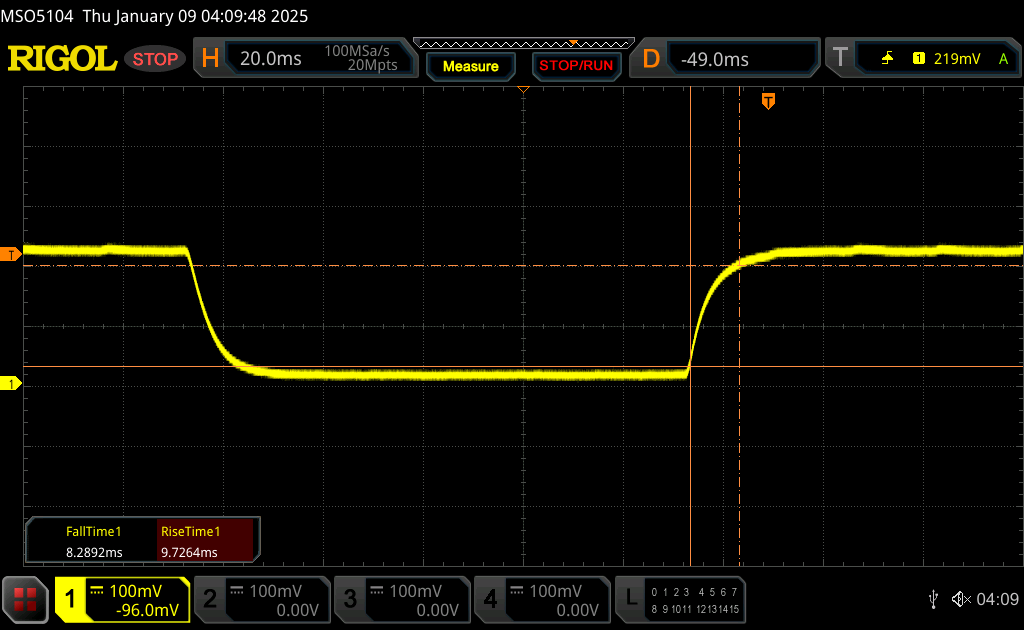 |
| ↘ 8.3 ms fall | ||
| The screen shows good response rates in our tests, but may be too slow for competitive gamers. In comparison, all tested devices range from 0.1 (minimum) to 240 (maximum) ms. » 40 % of all devices are better. This means that the measured response time is similar to the average of all tested devices (19.8 ms). | ||
| ↔ Response Time 50% Grey to 80% Grey | ||
| 24.2 ms ... rise ↗ and fall ↘ combined | ↗ 11.8 ms rise | 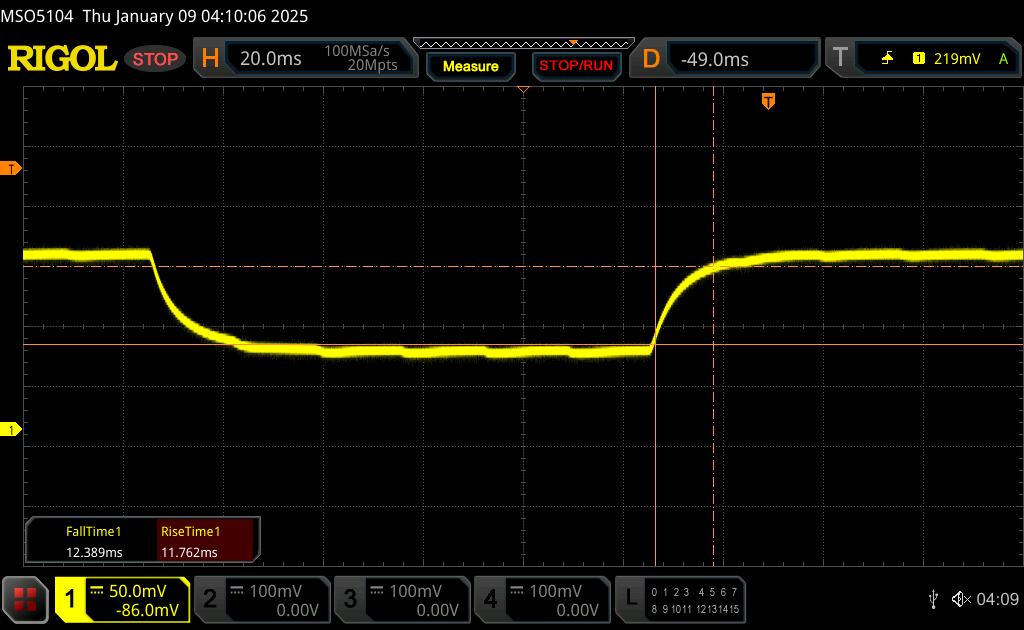 |
| ↘ 12.4 ms fall | ||
| The screen shows good response rates in our tests, but may be too slow for competitive gamers. In comparison, all tested devices range from 0.165 (minimum) to 636 (maximum) ms. » 35 % of all devices are better. This means that the measured response time is better than the average of all tested devices (30.9 ms). | ||
Screen Flickering / PWM (Pulse-Width Modulation)
| Screen flickering / PWM not detected | 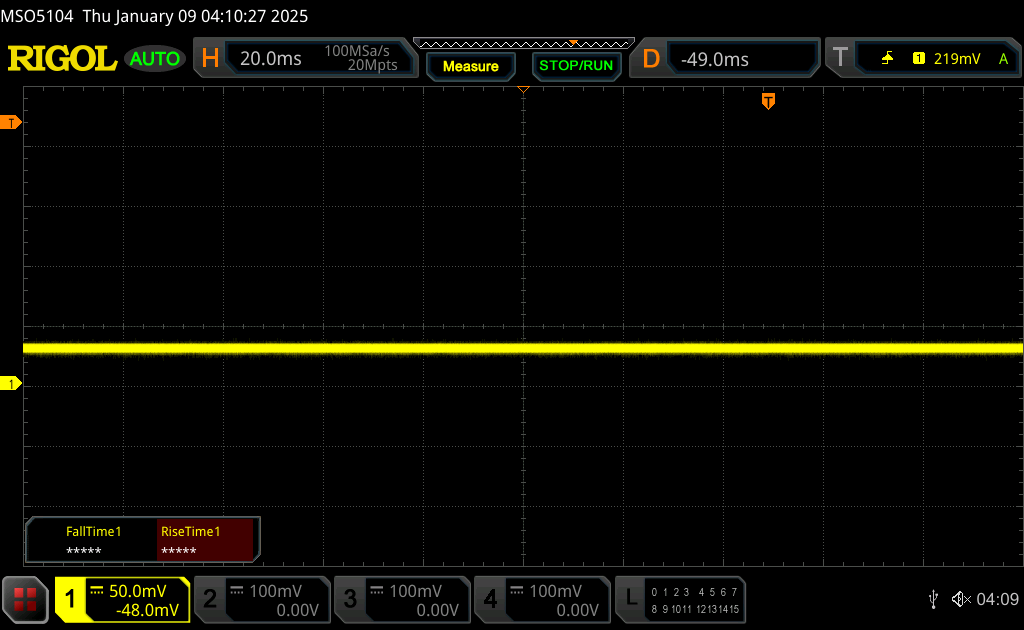 | ||
In comparison: 52 % of all tested devices do not use PWM to dim the display. If PWM was detected, an average of 7748 (minimum: 5 - maximum: 343500) Hz was measured. | |||
Performance
Testing Conditions
We set Control Center to Performance mode prior to running the benchmarks below. Owners are recommended to become familiar with the pre-installed software as it is the hub for controlling most features of the system.
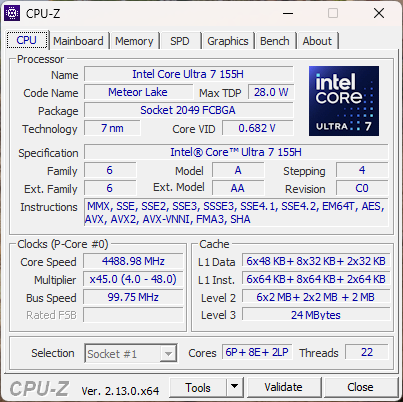
Processor
Processor performance is within a few percentage points of the average laptop in our database with the same Core Ultra 7 155H CPU. Unfortunately, it is little more than a rebrand of last year's Core i7-13700H and the even older Core i7-12700H meaning minimal year-over-year gains at best.
Cinebench R15 Multi Loop
Cinebench R23: Multi Core | Single Core
Cinebench R20: CPU (Multi Core) | CPU (Single Core)
Cinebench R15: CPU Multi 64Bit | CPU Single 64Bit
Blender: v2.79 BMW27 CPU
7-Zip 18.03: 7z b 4 | 7z b 4 -mmt1
Geekbench 6.7: Multi-Core | Single-Core
Geekbench 5.5: Multi-Core | Single-Core
HWBOT x265 Benchmark v2.2: 4k Preset
LibreOffice : 20 Documents To PDF
R Benchmark 2.5: Overall mean
| CPU Performance rating | |
| MSI Summit A16 AI Plus A3HMTG | |
| Framework Laptop 16 | |
| Ninkear A16 Pro | |
| Eurocom Blitz Ultra 16 | |
| Average Intel Core Ultra 7 155H | |
| HP Victus 16-r0077ng | |
| Asus VivoBook Pro 16 -2! | |
| Acer Aspire 16 A16-51GM-77G2 | |
| Samsung Galaxy Book5 Pro 360 | |
| Samsung Galaxy Book4 Pro 360 -1! | |
| Lenovo ThinkBook 16 G7 IML | |
| Lenovo ThinkPad L16 Gen 1 21L70010GE -1! | |
| HWBOT x265 Benchmark v2.2 / 4k Preset | |
| MSI Summit A16 AI Plus A3HMTG | |
| Framework Laptop 16 | |
| Ninkear A16 Pro | |
| Eurocom Blitz Ultra 16 | |
| HP Victus 16-r0077ng | |
| Average Intel Core Ultra 7 155H (9.93 - 21.2, n=50) | |
| Asus VivoBook Pro 16 | |
| Samsung Galaxy Book5 Pro 360 | |
| Lenovo ThinkPad L16 Gen 1 21L70010GE | |
| Lenovo ThinkBook 16 G7 IML | |
| Samsung Galaxy Book4 Pro 360 | |
| Acer Aspire 16 A16-51GM-77G2 | |
* ... smaller is better
AIDA64: FP32 Ray-Trace | FPU Julia | CPU SHA3 | CPU Queen | FPU SinJulia | FPU Mandel | CPU AES | CPU ZLib | FP64 Ray-Trace | CPU PhotoWorxx
| Performance rating | |
| MSI Summit A16 AI Plus A3HMTG | |
| Asus Vivobook S16 S5606M | |
| Eurocom Blitz Ultra 16 | |
| Average Intel Core Ultra 7 155H | |
| Lenovo ThinkPad T16 Gen 3 21MN005XGE | |
| Lenovo ThinkBook 16 G7 IML | |
| Acer Aspire 16 A16-51GM-77G2 | |
| AIDA64 / FP32 Ray-Trace | |
| MSI Summit A16 AI Plus A3HMTG | |
| Asus Vivobook S16 S5606M | |
| Eurocom Blitz Ultra 16 | |
| Average Intel Core Ultra 7 155H (6670 - 18470, n=50) | |
| Lenovo ThinkPad T16 Gen 3 21MN005XGE | |
| Lenovo ThinkBook 16 G7 IML | |
| Acer Aspire 16 A16-51GM-77G2 | |
| AIDA64 / FPU Julia | |
| MSI Summit A16 AI Plus A3HMTG | |
| Asus Vivobook S16 S5606M | |
| Eurocom Blitz Ultra 16 | |
| Average Intel Core Ultra 7 155H (40905 - 93181, n=50) | |
| Lenovo ThinkPad T16 Gen 3 21MN005XGE | |
| Lenovo ThinkBook 16 G7 IML | |
| Acer Aspire 16 A16-51GM-77G2 | |
| AIDA64 / CPU SHA3 | |
| MSI Summit A16 AI Plus A3HMTG | |
| Asus Vivobook S16 S5606M | |
| Eurocom Blitz Ultra 16 | |
| Average Intel Core Ultra 7 155H (1940 - 4436, n=50) | |
| Lenovo ThinkPad T16 Gen 3 21MN005XGE | |
| Lenovo ThinkBook 16 G7 IML | |
| Acer Aspire 16 A16-51GM-77G2 | |
| AIDA64 / CPU Queen | |
| MSI Summit A16 AI Plus A3HMTG | |
| Asus Vivobook S16 S5606M | |
| Average Intel Core Ultra 7 155H (64698 - 94181, n=50) | |
| Eurocom Blitz Ultra 16 | |
| Acer Aspire 16 A16-51GM-77G2 | |
| Lenovo ThinkPad T16 Gen 3 21MN005XGE | |
| Lenovo ThinkBook 16 G7 IML | |
| AIDA64 / FPU SinJulia | |
| MSI Summit A16 AI Plus A3HMTG | |
| Asus Vivobook S16 S5606M | |
| Average Intel Core Ultra 7 155H (5639 - 10647, n=50) | |
| Eurocom Blitz Ultra 16 | |
| Lenovo ThinkBook 16 G7 IML | |
| Lenovo ThinkPad T16 Gen 3 21MN005XGE | |
| Acer Aspire 16 A16-51GM-77G2 | |
| AIDA64 / FPU Mandel | |
| MSI Summit A16 AI Plus A3HMTG | |
| Asus Vivobook S16 S5606M | |
| Eurocom Blitz Ultra 16 | |
| Average Intel Core Ultra 7 155H (18236 - 47685, n=50) | |
| Lenovo ThinkBook 16 G7 IML | |
| Lenovo ThinkPad T16 Gen 3 21MN005XGE | |
| Acer Aspire 16 A16-51GM-77G2 | |
| AIDA64 / CPU AES | |
| Average Intel Core Ultra 7 155H (45713 - 152179, n=50) | |
| Asus Vivobook S16 S5606M | |
| MSI Summit A16 AI Plus A3HMTG | |
| Eurocom Blitz Ultra 16 | |
| Lenovo ThinkBook 16 G7 IML | |
| Lenovo ThinkPad T16 Gen 3 21MN005XGE | |
| Acer Aspire 16 A16-51GM-77G2 | |
| AIDA64 / CPU ZLib | |
| MSI Summit A16 AI Plus A3HMTG | |
| Asus Vivobook S16 S5606M | |
| Eurocom Blitz Ultra 16 | |
| Average Intel Core Ultra 7 155H (557 - 1250, n=50) | |
| Lenovo ThinkBook 16 G7 IML | |
| Lenovo ThinkPad T16 Gen 3 21MN005XGE | |
| Acer Aspire 16 A16-51GM-77G2 | |
| AIDA64 / FP64 Ray-Trace | |
| MSI Summit A16 AI Plus A3HMTG | |
| Eurocom Blitz Ultra 16 | |
| Asus Vivobook S16 S5606M | |
| Average Intel Core Ultra 7 155H (3569 - 9802, n=50) | |
| Lenovo ThinkPad T16 Gen 3 21MN005XGE | |
| Lenovo ThinkBook 16 G7 IML | |
| Acer Aspire 16 A16-51GM-77G2 | |
| AIDA64 / CPU PhotoWorxx | |
| Eurocom Blitz Ultra 16 | |
| MSI Summit A16 AI Plus A3HMTG | |
| Asus Vivobook S16 S5606M | |
| Average Intel Core Ultra 7 155H (32719 - 54223, n=50) | |
| Lenovo ThinkPad T16 Gen 3 21MN005XGE | |
| Acer Aspire 16 A16-51GM-77G2 | |
| Lenovo ThinkBook 16 G7 IML | |
System Performance
CrossMark: Overall | Productivity | Creativity | Responsiveness
WebXPRT 3: Overall
WebXPRT 4: Overall
Mozilla Kraken 1.1: Total
| PCMark 10 / Score | |
| MSI Summit A16 AI Plus A3HMTG | |
| Acer Aspire 16 A16-51GM-77G2 | |
| Average Intel Core Ultra 7 155H, Intel Arc 8-Core iGPU (4809 - 7529, n=34) | |
| Eurocom Blitz Ultra 16 | |
| Asus Vivobook S16 S5606M | |
| Lenovo ThinkPad T16 Gen 3 21MN005XGE | |
| Lenovo ThinkBook 16 G7 IML | |
| PCMark 10 / Essentials | |
| MSI Summit A16 AI Plus A3HMTG | |
| Acer Aspire 16 A16-51GM-77G2 | |
| Average Intel Core Ultra 7 155H, Intel Arc 8-Core iGPU (7605 - 11289, n=34) | |
| Eurocom Blitz Ultra 16 | |
| Lenovo ThinkPad T16 Gen 3 21MN005XGE | |
| Lenovo ThinkBook 16 G7 IML | |
| Asus Vivobook S16 S5606M | |
| PCMark 10 / Productivity | |
| MSI Summit A16 AI Plus A3HMTG | |
| Asus Vivobook S16 S5606M | |
| Acer Aspire 16 A16-51GM-77G2 | |
| Average Intel Core Ultra 7 155H, Intel Arc 8-Core iGPU (6042 - 10591, n=34) | |
| Eurocom Blitz Ultra 16 | |
| Lenovo ThinkPad T16 Gen 3 21MN005XGE | |
| Lenovo ThinkBook 16 G7 IML | |
| PCMark 10 / Digital Content Creation | |
| MSI Summit A16 AI Plus A3HMTG | |
| Eurocom Blitz Ultra 16 | |
| Average Intel Core Ultra 7 155H, Intel Arc 8-Core iGPU (4985 - 10709, n=34) | |
| Asus Vivobook S16 S5606M | |
| Acer Aspire 16 A16-51GM-77G2 | |
| Lenovo ThinkPad T16 Gen 3 21MN005XGE | |
| Lenovo ThinkBook 16 G7 IML | |
| CrossMark / Overall | |
| Acer Aspire 16 A16-51GM-77G2 | |
| MSI Summit A16 AI Plus A3HMTG | |
| Eurocom Blitz Ultra 16 | |
| Average Intel Core Ultra 7 155H, Intel Arc 8-Core iGPU (1366 - 1903, n=34) | |
| Asus Vivobook S16 S5606M | |
| Lenovo ThinkPad T16 Gen 3 21MN005XGE | |
| Lenovo ThinkBook 16 G7 IML | |
| CrossMark / Productivity | |
| Acer Aspire 16 A16-51GM-77G2 | |
| Eurocom Blitz Ultra 16 | |
| MSI Summit A16 AI Plus A3HMTG | |
| Average Intel Core Ultra 7 155H, Intel Arc 8-Core iGPU (1291 - 1798, n=33) | |
| Asus Vivobook S16 S5606M | |
| Lenovo ThinkPad T16 Gen 3 21MN005XGE | |
| Lenovo ThinkBook 16 G7 IML | |
| CrossMark / Creativity | |
| MSI Summit A16 AI Plus A3HMTG | |
| Eurocom Blitz Ultra 16 | |
| Acer Aspire 16 A16-51GM-77G2 | |
| Average Intel Core Ultra 7 155H, Intel Arc 8-Core iGPU (1519 - 1929, n=33) | |
| Asus Vivobook S16 S5606M | |
| Lenovo ThinkPad T16 Gen 3 21MN005XGE | |
| Lenovo ThinkBook 16 G7 IML | |
| CrossMark / Responsiveness | |
| Acer Aspire 16 A16-51GM-77G2 | |
| Eurocom Blitz Ultra 16 | |
| Average Intel Core Ultra 7 155H, Intel Arc 8-Core iGPU (939 - 1802, n=33) | |
| MSI Summit A16 AI Plus A3HMTG | |
| Asus Vivobook S16 S5606M | |
| Lenovo ThinkPad T16 Gen 3 21MN005XGE | |
| Lenovo ThinkBook 16 G7 IML | |
| WebXPRT 3 / Overall | |
| MSI Summit A16 AI Plus A3HMTG | |
| Acer Aspire 16 A16-51GM-77G2 | |
| Eurocom Blitz Ultra 16 | |
| Asus Vivobook S16 S5606M | |
| Average Intel Core Ultra 7 155H, Intel Arc 8-Core iGPU (252 - 299, n=34) | |
| Lenovo ThinkPad T16 Gen 3 21MN005XGE | |
| Lenovo ThinkBook 16 G7 IML | |
| WebXPRT 4 / Overall | |
| Acer Aspire 16 A16-51GM-77G2 | |
| MSI Summit A16 AI Plus A3HMTG | |
| Eurocom Blitz Ultra 16 | |
| Average Intel Core Ultra 7 155H, Intel Arc 8-Core iGPU (166.4 - 309, n=29) | |
| Lenovo ThinkPad T16 Gen 3 21MN005XGE | |
| Lenovo ThinkBook 16 G7 IML | |
| Mozilla Kraken 1.1 / Total | |
| Lenovo ThinkBook 16 G7 IML | |
| Lenovo ThinkPad T16 Gen 3 21MN005XGE | |
| Average Intel Core Ultra 7 155H, Intel Arc 8-Core iGPU (517 - 614, n=35) | |
| Asus Vivobook S16 S5606M | |
| Eurocom Blitz Ultra 16 | |
| Acer Aspire 16 A16-51GM-77G2 | |
| MSI Summit A16 AI Plus A3HMTG | |
* ... smaller is better
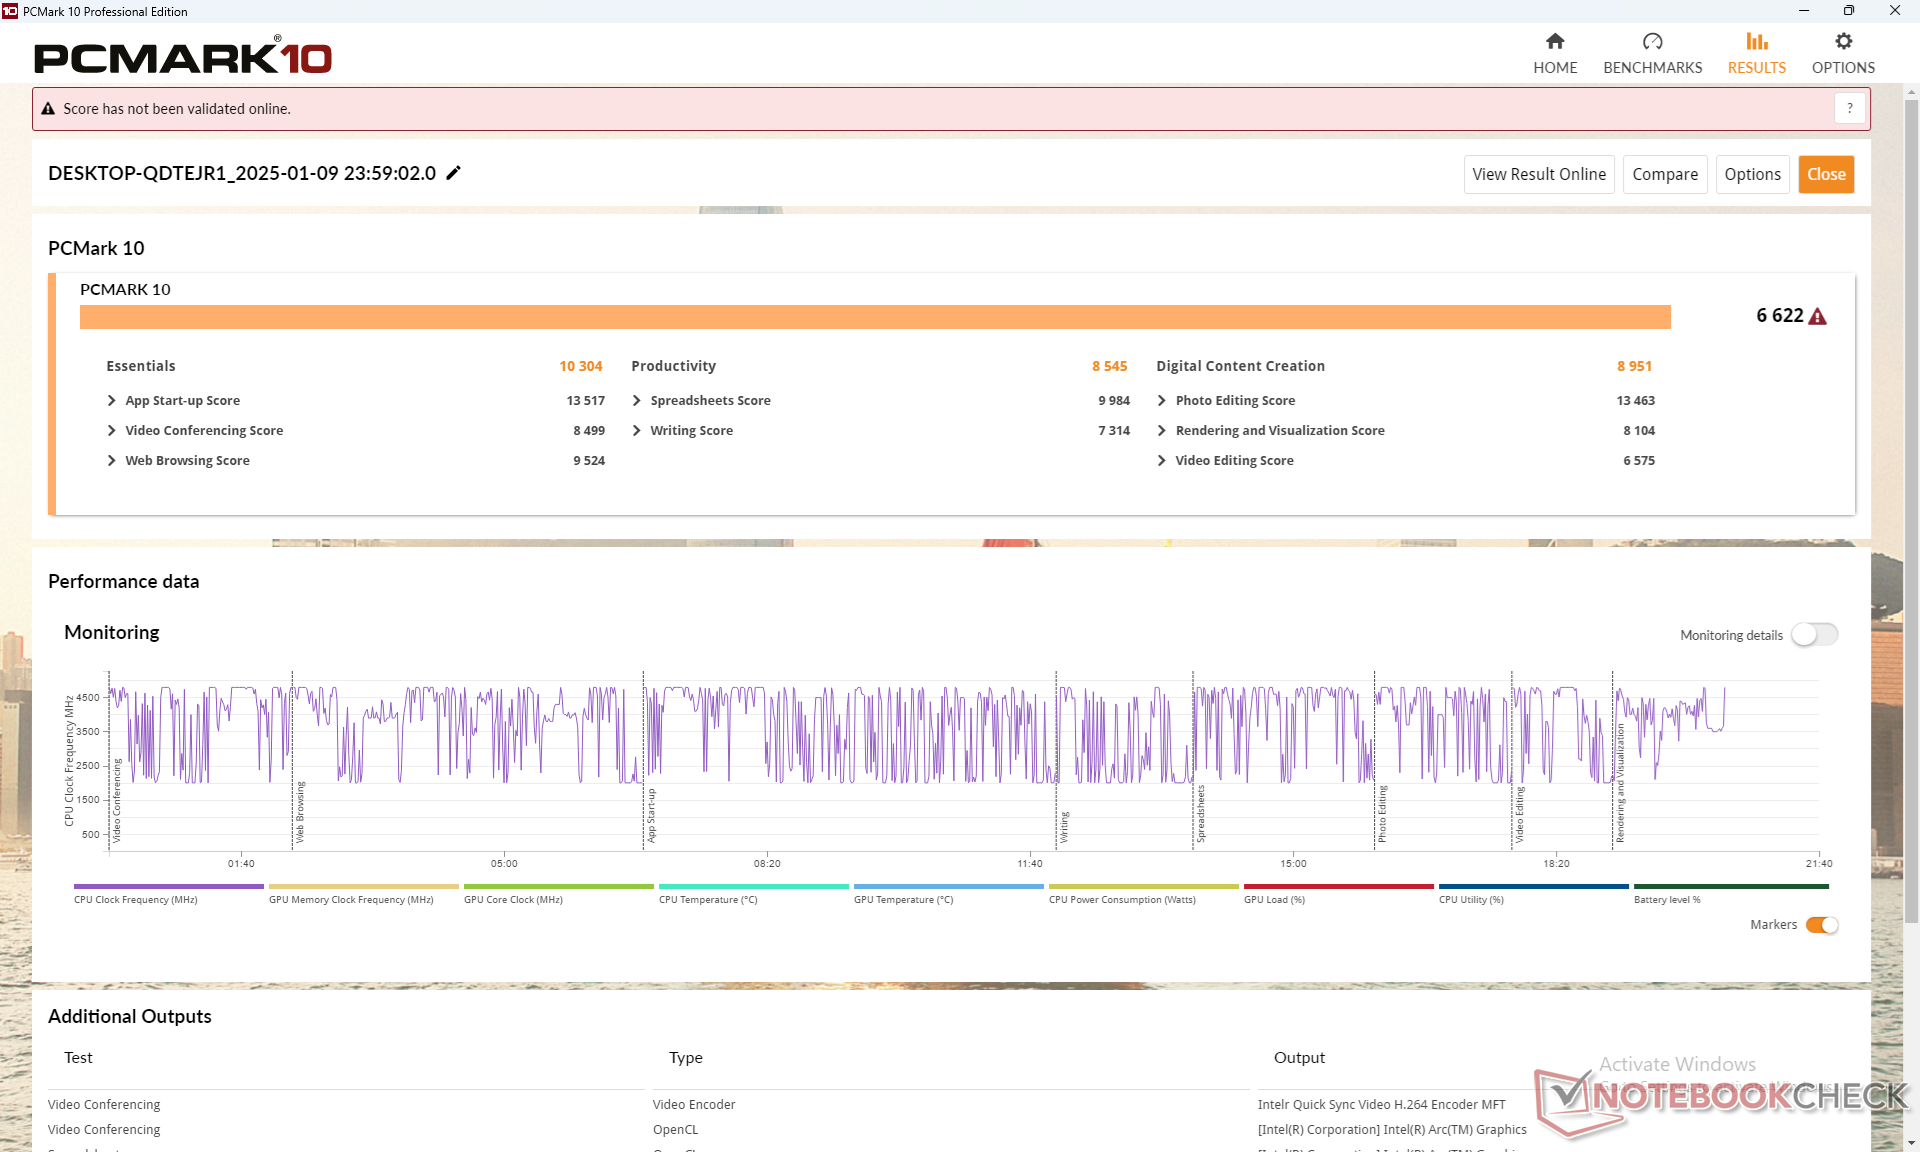
| PCMark 10 Score | 6622 points | |
Help | ||
| AIDA64 / Memory Copy | |
| MSI Summit A16 AI Plus A3HMTG | |
| Average Intel Core Ultra 7 155H (62397 - 96791, n=50) | |
| Eurocom Blitz Ultra 16 | |
| Lenovo ThinkPad T16 Gen 3 21MN005XGE | |
| Acer Aspire 16 A16-51GM-77G2 | |
| Lenovo ThinkBook 16 G7 IML | |
| Asus VivoBook Pro 16 | |
| AIDA64 / Memory Read | |
| MSI Summit A16 AI Plus A3HMTG | |
| Eurocom Blitz Ultra 16 | |
| Average Intel Core Ultra 7 155H (60544 - 90647, n=50) | |
| Lenovo ThinkPad T16 Gen 3 21MN005XGE | |
| Acer Aspire 16 A16-51GM-77G2 | |
| Lenovo ThinkBook 16 G7 IML | |
| Asus VivoBook Pro 16 | |
| AIDA64 / Memory Write | |
| MSI Summit A16 AI Plus A3HMTG | |
| Eurocom Blitz Ultra 16 | |
| Average Intel Core Ultra 7 155H (58692 - 93451, n=50) | |
| Lenovo ThinkPad T16 Gen 3 21MN005XGE | |
| Acer Aspire 16 A16-51GM-77G2 | |
| Lenovo ThinkBook 16 G7 IML | |
| Asus VivoBook Pro 16 | |
| AIDA64 / Memory Latency | |
| Average Intel Core Ultra 7 155H (116.2 - 233, n=50) | |
| Lenovo ThinkBook 16 G7 IML | |
| Lenovo ThinkPad T16 Gen 3 21MN005XGE | |
| MSI Summit A16 AI Plus A3HMTG | |
| Eurocom Blitz Ultra 16 | |
| Asus VivoBook Pro 16 | |
| Acer Aspire 16 A16-51GM-77G2 | |
* ... smaller is better
DPC Latency
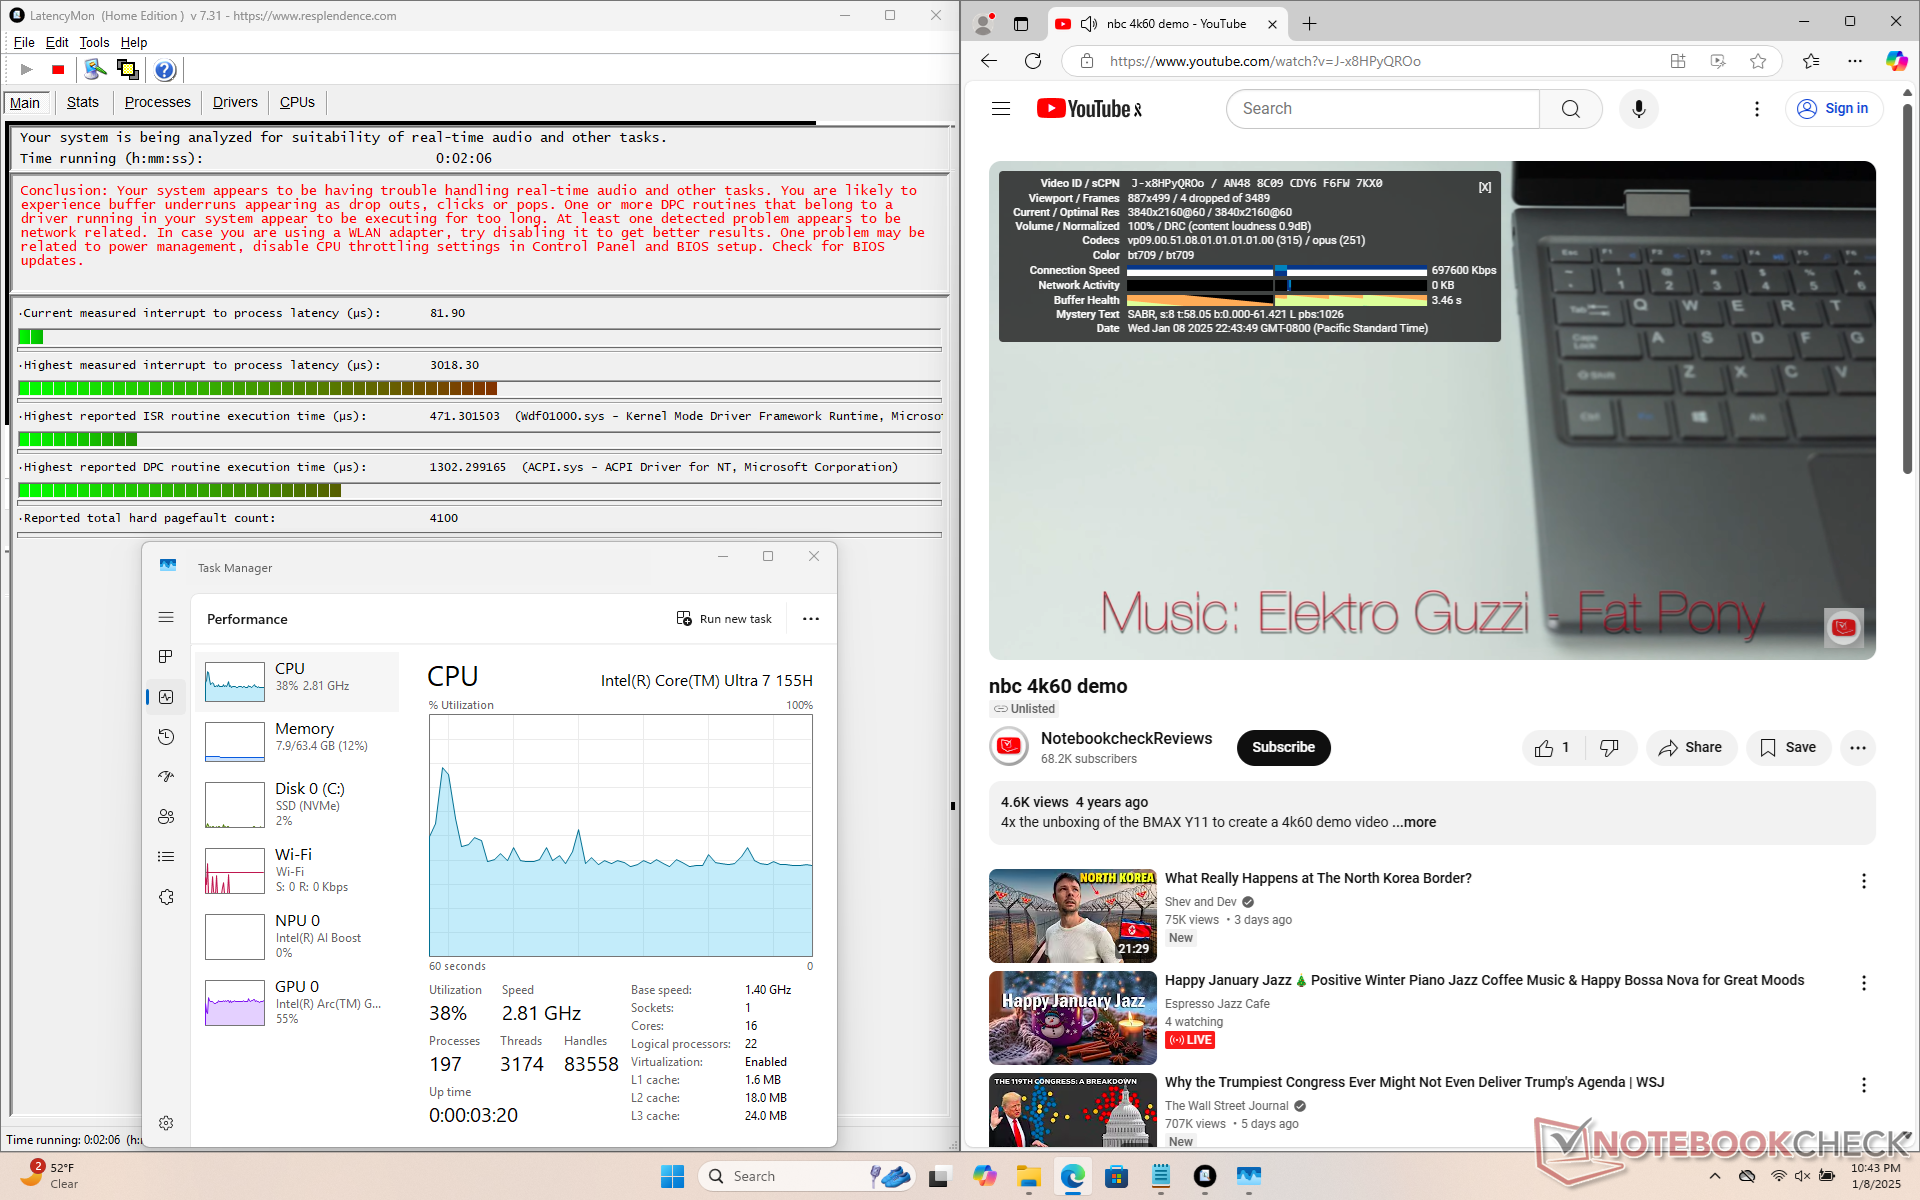
LatencyMon reveals DPC issues when opening multiple browser tabs of our homepage. Furthermore, playing 4K60 content on YouTube would result in at least a few dropped frames even after multiple retests which is disappointing to see on a professional system powered by a Core-H series CPU.

| DPC Latencies / LatencyMon - interrupt to process latency (max), Web, Youtube, Prime95 | |
| MSI Summit A16 AI Plus A3HMTG | |
| Eurocom Blitz Ultra 16 | |
| Acer Aspire 16 A16-51GM-77G2 | |
| Asus VivoBook Pro 16 | |
| Lenovo ThinkBook 16 G7 IML | |
| Lenovo ThinkPad T16 Gen 3 21MN005XGE | |
* ... smaller is better
Storage Devices
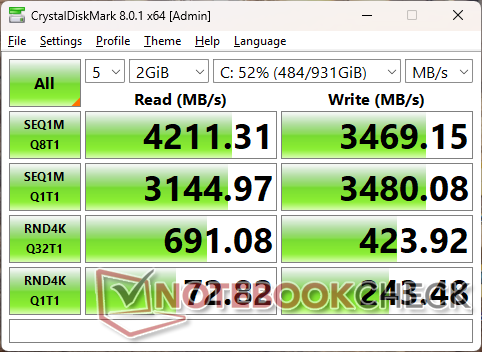
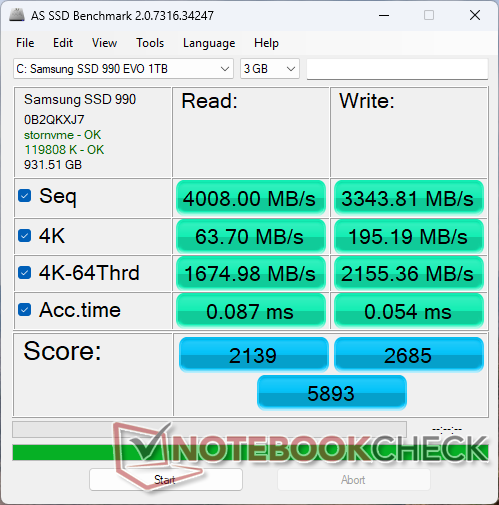
Our test unit ships with a 1 TB Samsung 990 Evo Pro for maximum transfer rates of up to 4400 MB/s. Performance is sustainable with no throttling issues, but faster drives are available for speeds of over 7000 MB/s.

| Drive Performance rating - Percent | |
| Acer Aspire 16 A16-51GM-77G2 | |
| Eurocom Blitz Ultra 16 | |
| Lenovo ThinkPad T16 Gen 3 21MN005XGE | |
| Asus VivoBook Pro 16 | |
| MSI Summit A16 AI Plus A3HMTG | |
| Lenovo ThinkBook 16 G7 IML | |
* ... smaller is better
Disk Throttling: DiskSpd Read Loop, Queue Depth 8
GPU Performance
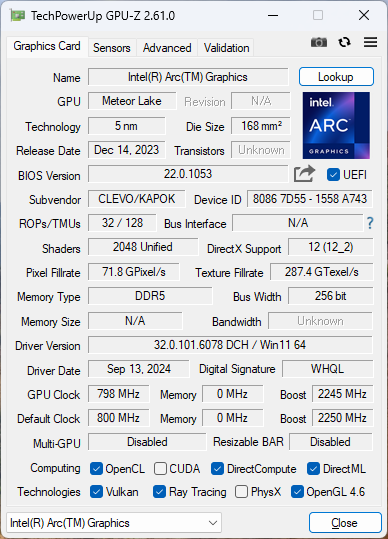
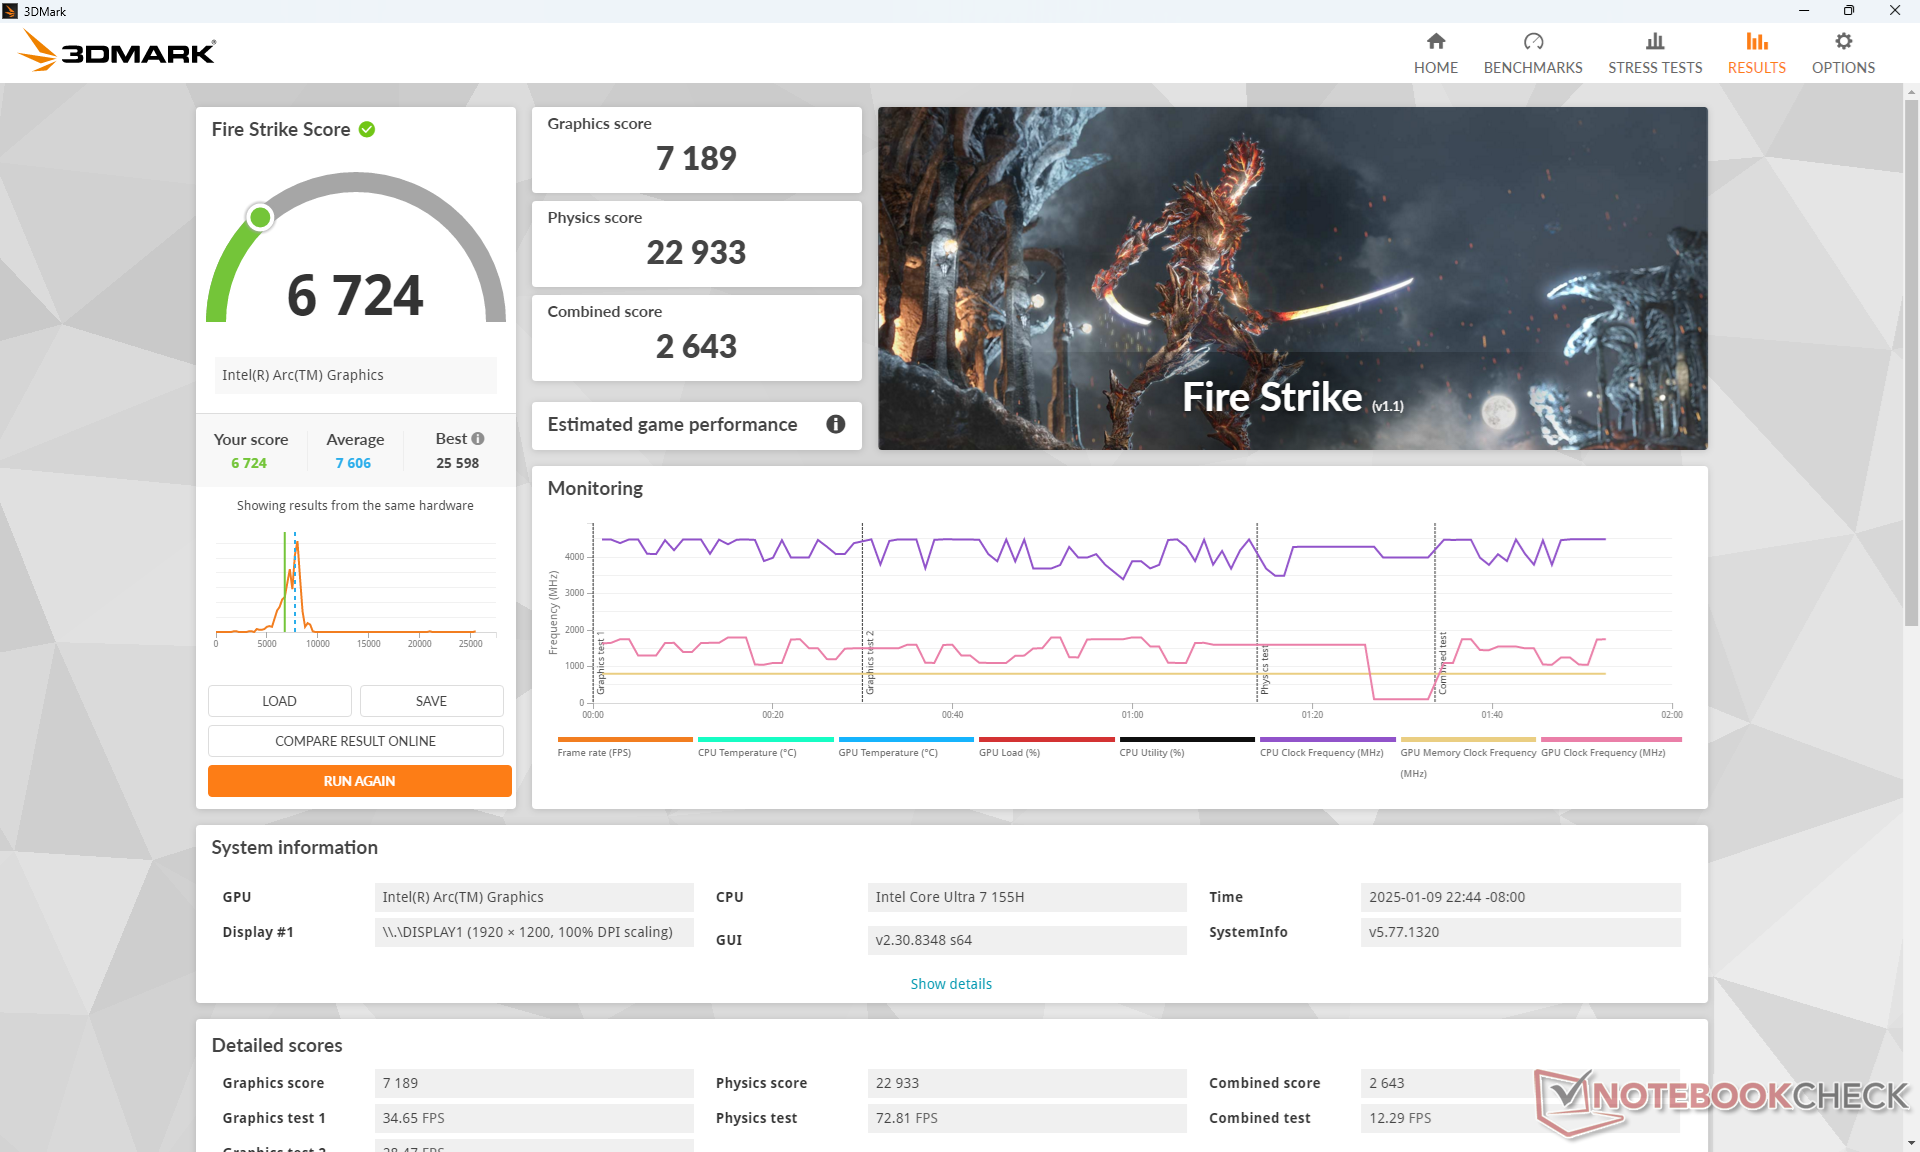
The Arc 8 GPU is barely a year old and it is already behind the latest alternatives from AMD. The Radeon 880M, for example, can outpace our GPU by up to 30 percent according to the DX11-based Fire Strike benchmark to be roughly on par with last year's Radeon 780M. It is nonetheless still a significant upgrade from the older Iris Xe series.
| Power Profile | Graphics Score | Physics Score | Combined Score |
| Performance Mode | 7189 | 22933 | 2643 |
| Balanced Mode | 7168 (-0%) | 21727 (-5%) | 2678 (-0%) |
| Battery Power | 4090 (-43%) | 16388 (-29%) | 1335 (-49%) |
Running on Balanced mode does not impact performance significantly. However, battery power can reduce performance by almost 50 percent even when set to Performance mode.
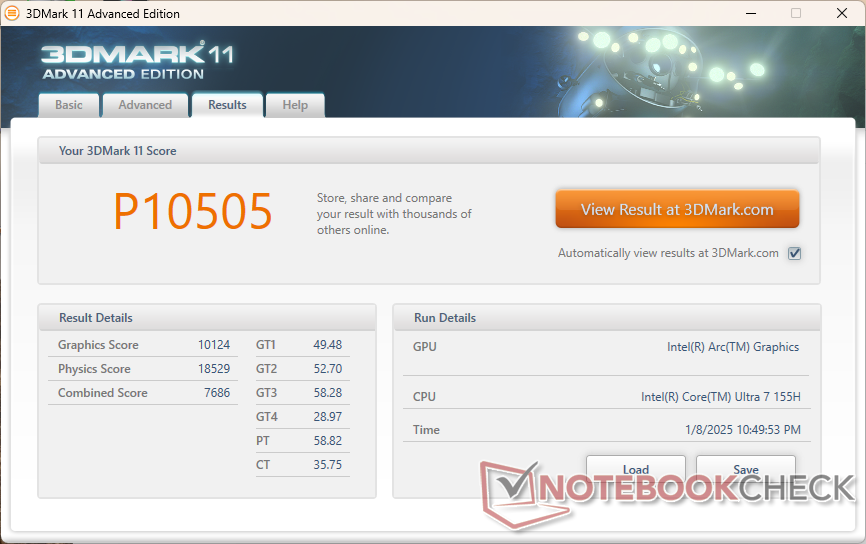
| 3DMark 11 Performance | 10505 points | |
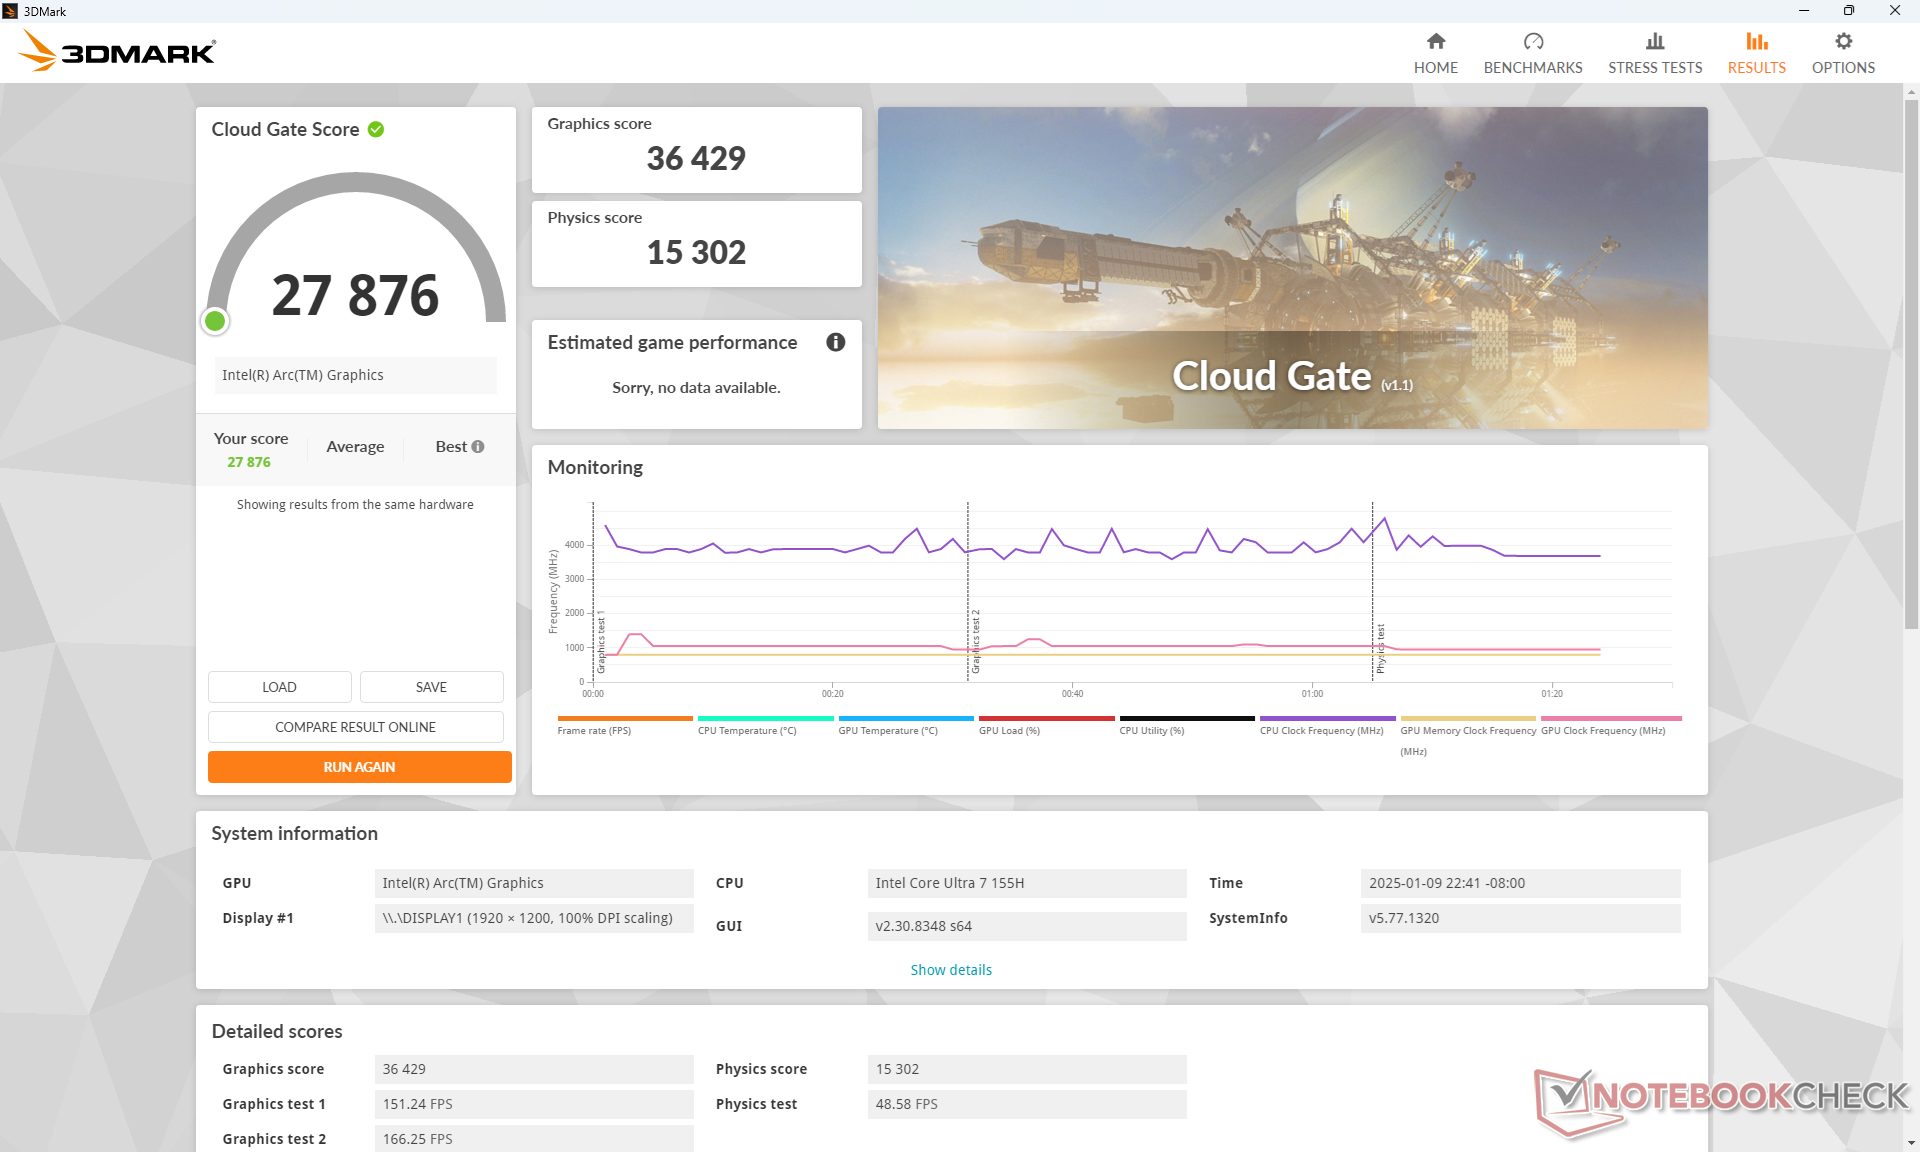
| 3DMark Cloud Gate Standard Score | 27876 points | |
| 3DMark Fire Strike Score | 6724 points | |
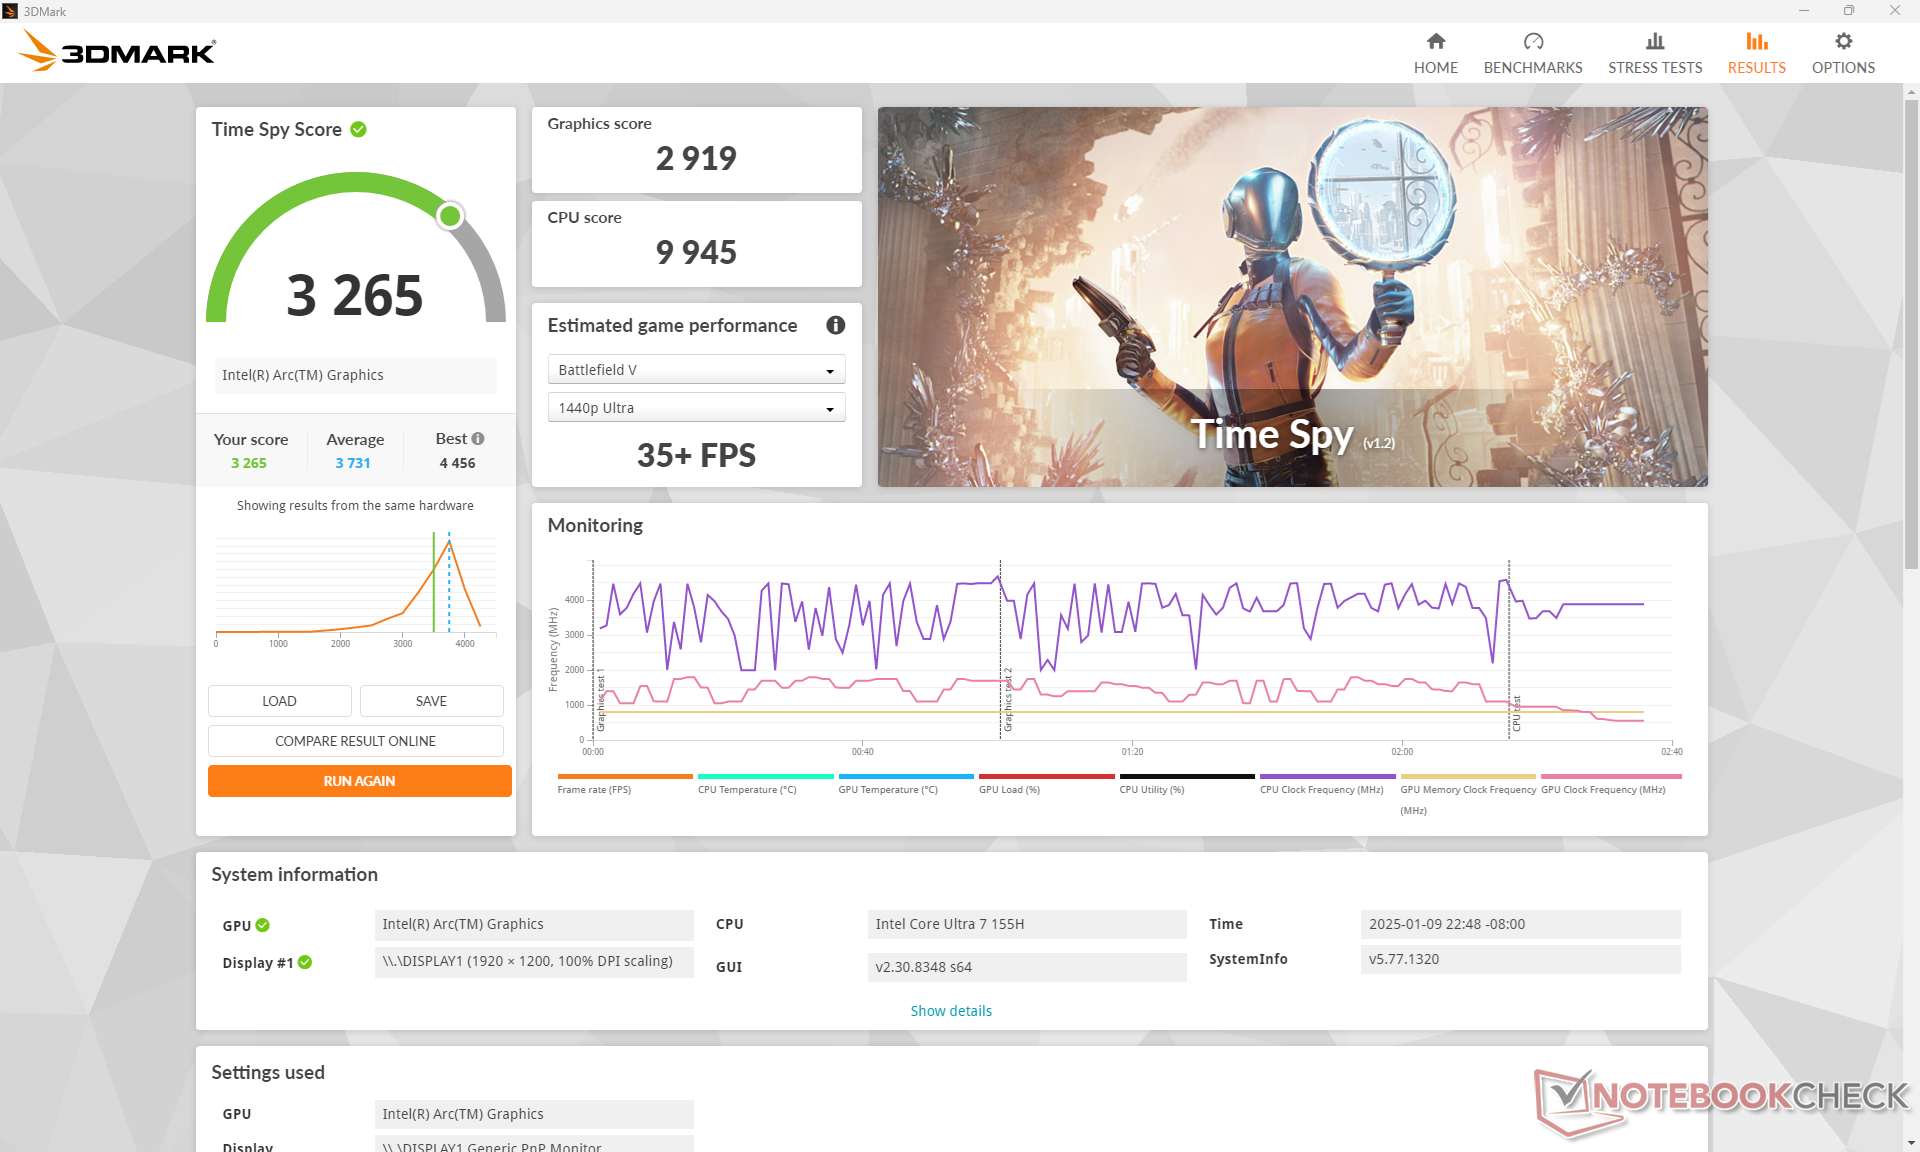
| 3DMark Time Spy Score | 3265 points | |
Help | ||
* ... smaller is better
| Tiny Tina's Wonderlands | |
| 1280x720 Lowest Preset (DX12) | |
| MSI Summit A16 AI Plus A3HMTG | |
| Eurocom Blitz Ultra 16 | |
| Average Intel Arc 8-Core iGPU (60 - 96.1, n=13) | |
| Lenovo ThinkBook 16 G7 IML | |
| 1920x1080 Low Preset (DX12) | |
| Framework Laptop 16 | |
| MSI Summit A16 AI Plus A3HMTG | |
| Eurocom Blitz Ultra 16 | |
| Average Intel Arc 8-Core iGPU (41.5 - 54.6, n=13) | |
| Lenovo ThinkBook 16 G7 IML | |
| 1920x1080 Medium Preset (DX12) | |
| Framework Laptop 16 | |
| MSI Summit A16 AI Plus A3HMTG | |
| Eurocom Blitz Ultra 16 | |
| Average Intel Arc 8-Core iGPU (31.7 - 45, n=13) | |
| Lenovo ThinkBook 16 G7 IML | |
| 1920x1080 High Preset (DX12) | |
| Framework Laptop 16 | |
| MSI Summit A16 AI Plus A3HMTG | |
| Average Intel Arc 8-Core iGPU (22 - 31.6, n=13) | |
| Eurocom Blitz Ultra 16 | |
| Lenovo ThinkBook 16 G7 IML | |
| 1920x1080 Badass Preset (DX12) | |
| Framework Laptop 16 | |
| MSI Summit A16 AI Plus A3HMTG | |
| Average Intel Arc 8-Core iGPU (17.7 - 25.9, n=13) | |
| Eurocom Blitz Ultra 16 | |
| Lenovo ThinkBook 16 G7 IML | |
Cyberpunk 2077 ultra FPS Chart
| low | med. | high | ultra | |
|---|---|---|---|---|
| GTA V (2015) | 158.7 | 145.9 | 35.4 | 14.6 |
| Dota 2 Reborn (2015) | 102.1 | 89.7 | 69.3 | 66.6 |
| Final Fantasy XV Benchmark (2018) | 60.8 | 33.4 | 23 | |
| X-Plane 11.11 (2018) | 51.9 | 39.7 | 34.4 | |
| Far Cry 5 (2018) | 64 | 38 | 35 | 32 |
| Strange Brigade (2018) | 143.6 | 63.2 | 52.5 | 43.7 |
| Tiny Tina's Wonderlands (2022) | 50.7 | 40 | 27.6 | 22.3 |
| F1 22 (2022) | 64.5 | 58.2 | 44 | 12.1 |
| Baldur's Gate 3 (2023) | 27.4 | 22.8 | 20 | 19.3 |
| Cyberpunk 2077 (2023) | 25.8 | 21.5 | 19 | 17 |
Emissions
System Noise
Fan noise would frequently pulse to 29 dB(A) against a background of 22.7 dB(A) even when idling on desktop. It's thus recommended to run on Quiet mode instead of Entertainment or Performance if the pulsing fans are a concern. When compared to other 16-inch laptops, the fans in our Eurocom tend to reach maximum RPM much sooner when running demanding loads.
Noise level
| Idle |
| 23.2 / 23.3 / 29 dB(A) |
| Load |
| 45.4 / 53.4 dB(A) |
 | ||
30 dB silent 40 dB(A) audible 50 dB(A) loud |
||
min: | ||
| Eurocom Blitz Ultra 16 Arc 8-Core, Ultra 7 155H | Lenovo ThinkBook 16 G7 IML Graphics 4-Core iGPU (Arrow Lake), Ultra 5 125U, SK hynix HFS512GEJ4X112N | MSI Summit A16 AI Plus A3HMTG Radeon 880M, Ryzen AI 9 365, Samsung PM9C1 MZVL81T0HELB-00BTW | Acer Aspire 16 A16-51GM-77G2 GeForce RTX 2050 Mobile, Core 7 150U, WD PC SN740 SDDQNQD-1T00-1014 | Lenovo ThinkPad T16 Gen 3 21MN005XGE Graphics 4-Core iGPU (Arrow Lake), Ultra 5 125U, Lenovo UMIS RPETJ1T24MHP2QDQ | Asus VivoBook Pro 16 GeForce RTX 3050 Ti Laptop GPU, i7-12700H, Intel SSD 670p SSDPEKNU010TZ | |
|---|---|---|---|---|---|---|
| Noise | 21% | -0% | -0% | 6% | -9% | |
| off / environment * (dB) | 22.7 | 23.1 -2% | 23.8 -5% | 23 -1% | 24.7 -9% | 25.2 -11% |
| Idle Minimum * (dB) | 23.2 | 23.1 -0% | 25 -8% | 23 1% | 24.7 -6% | 25.2 -9% |
| Idle Average * (dB) | 23.3 | 23.1 1% | 25 -7% | 23 1% | 24.7 -6% | 25.2 -8% |
| Idle Maximum * (dB) | 29 | 23.1 20% | 29.5 -2% | 31 -7% | 24.7 15% | 25.2 13% |
| Load Average * (dB) | 45.4 | 23.2 49% | 37.5 17% | 46.57 -3% | 34 25% | 55.1 -21% |
| Cyberpunk 2077 ultra * (dB) | 50.3 | 29.2 42% | 46.5 8% | 50 1% | 45.9 9% | |
| Load Maximum * (dB) | 53.4 | 32.6 39% | 56.1 -5% | 50 6% | 46.2 13% | 61.5 -15% |
* ... smaller is better
Temperature
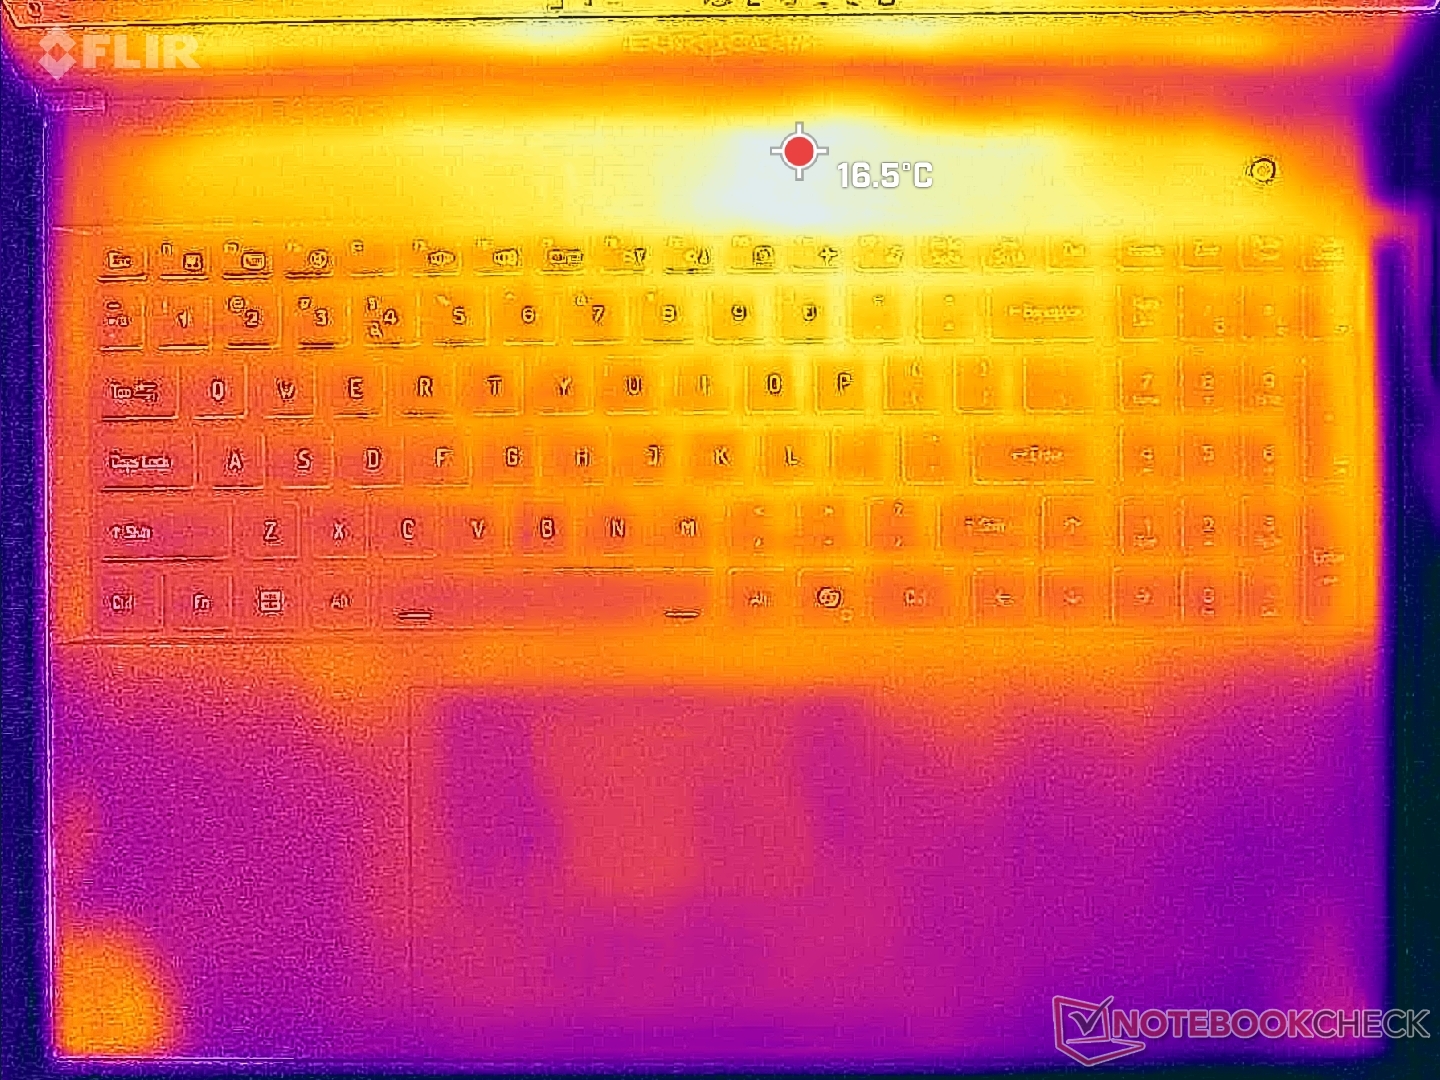
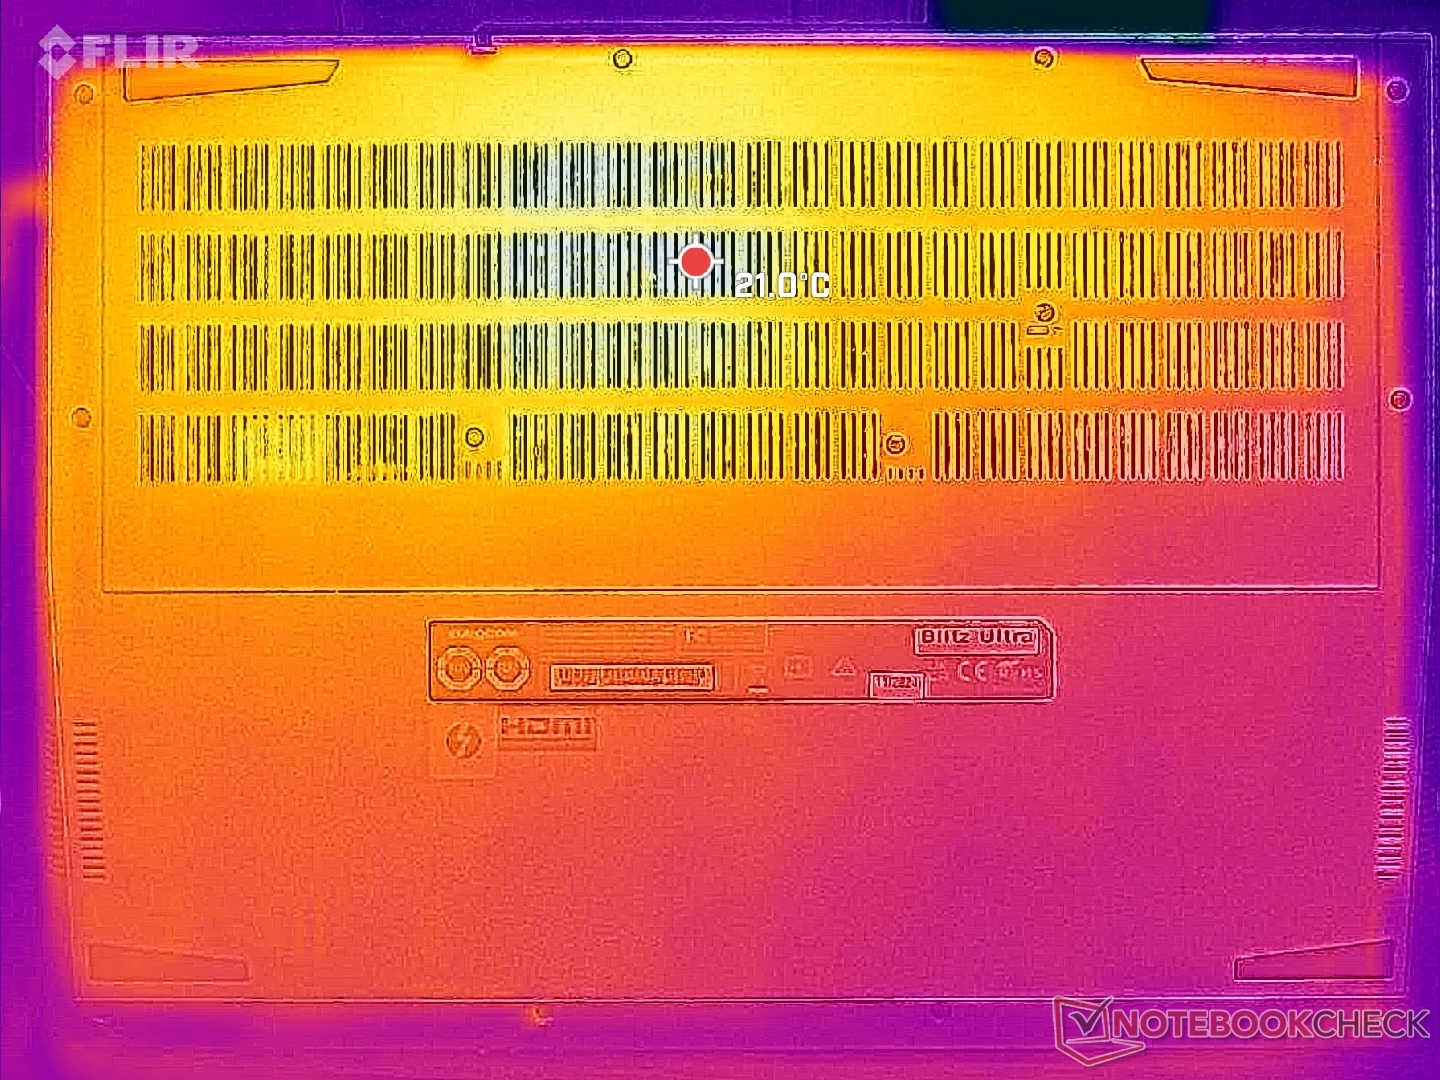
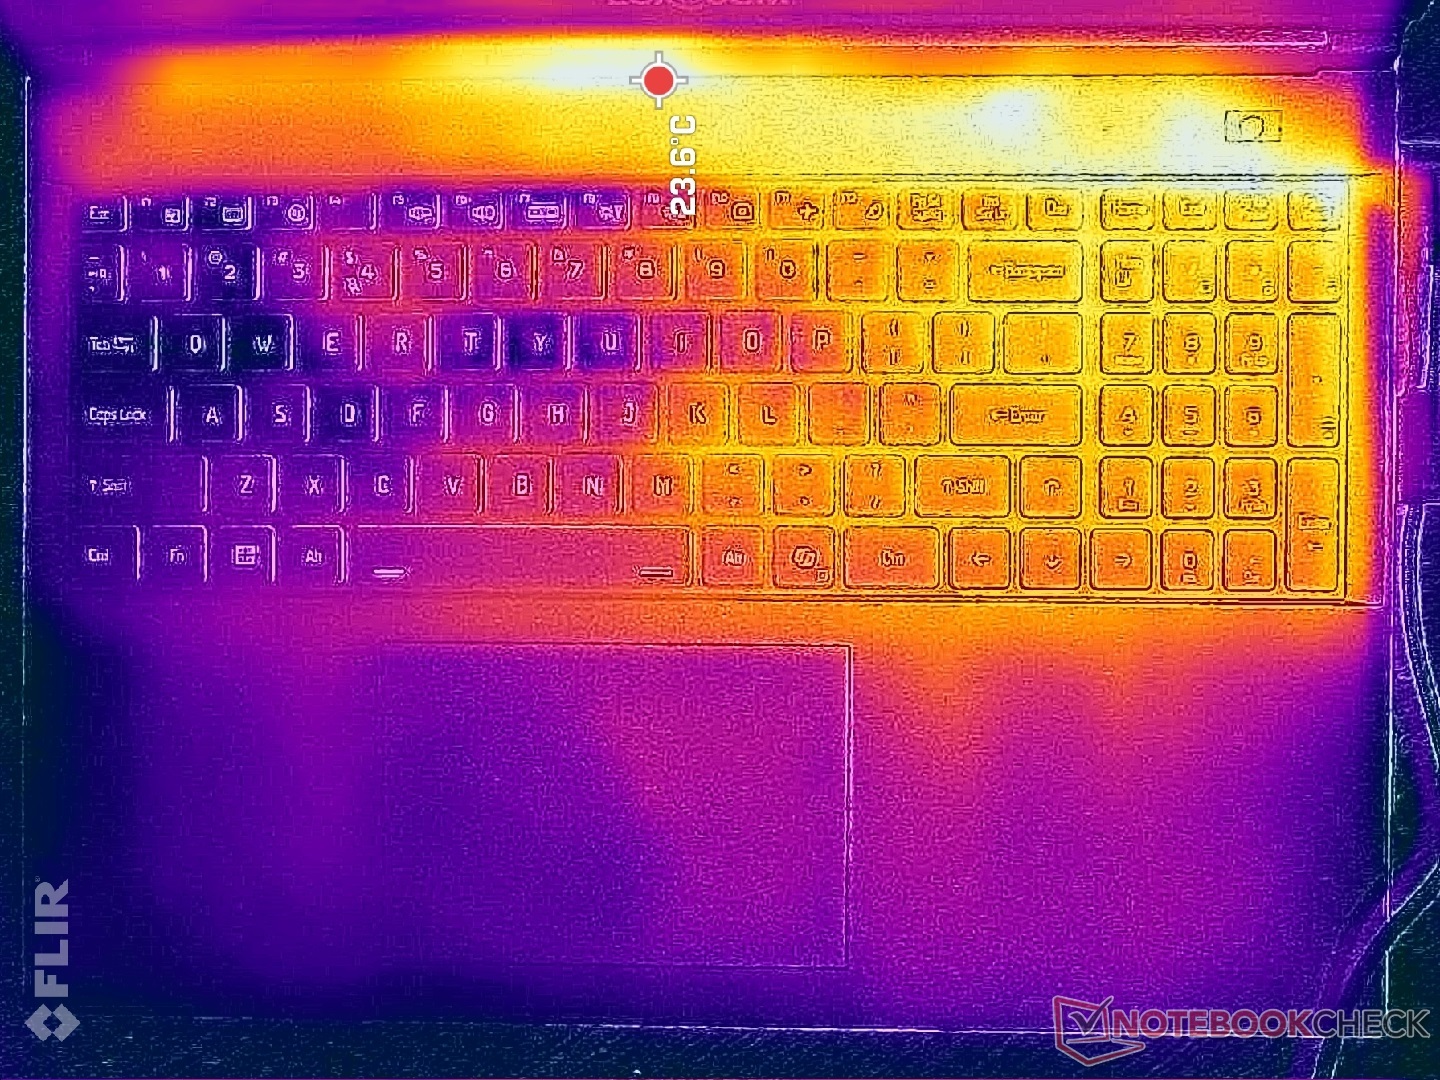
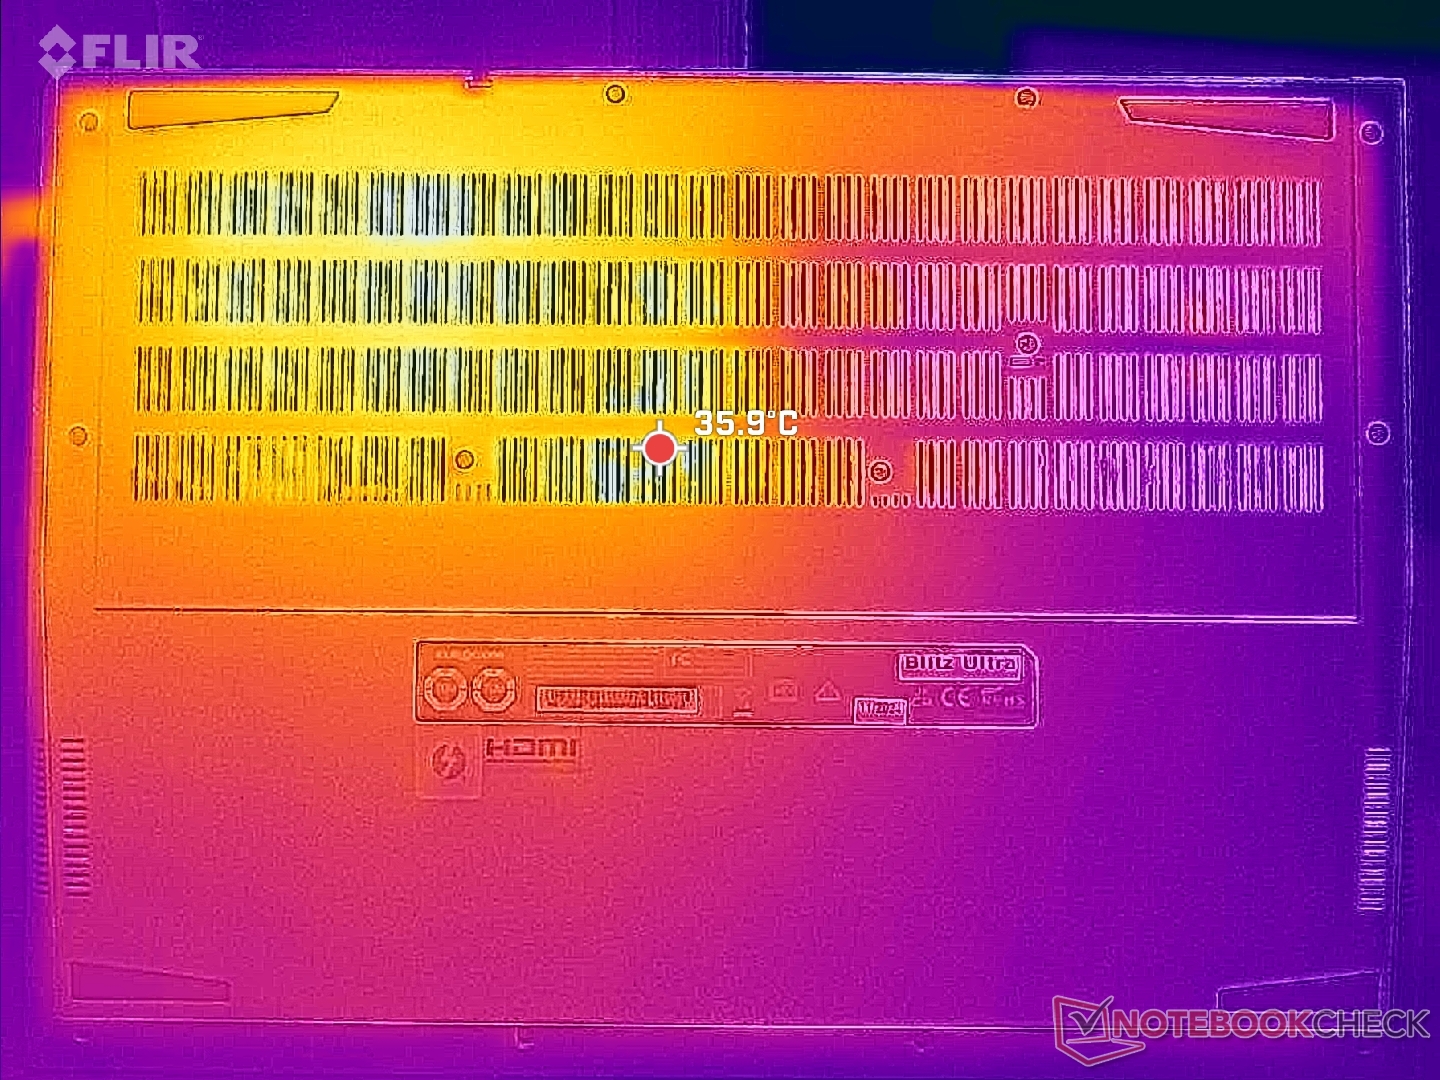
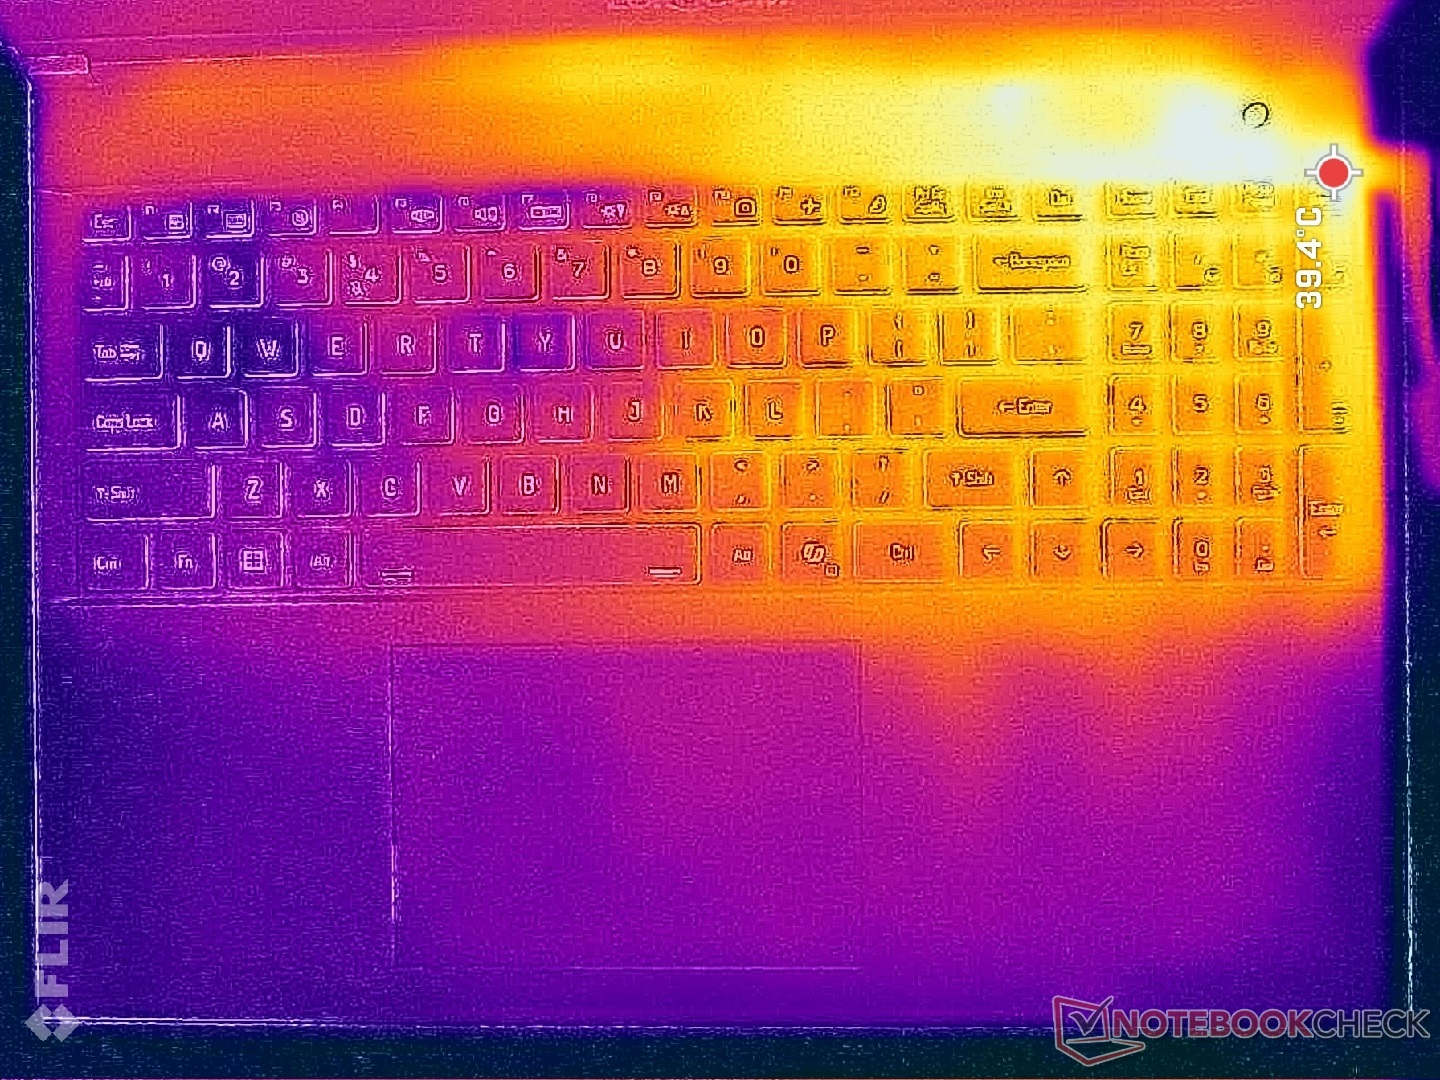
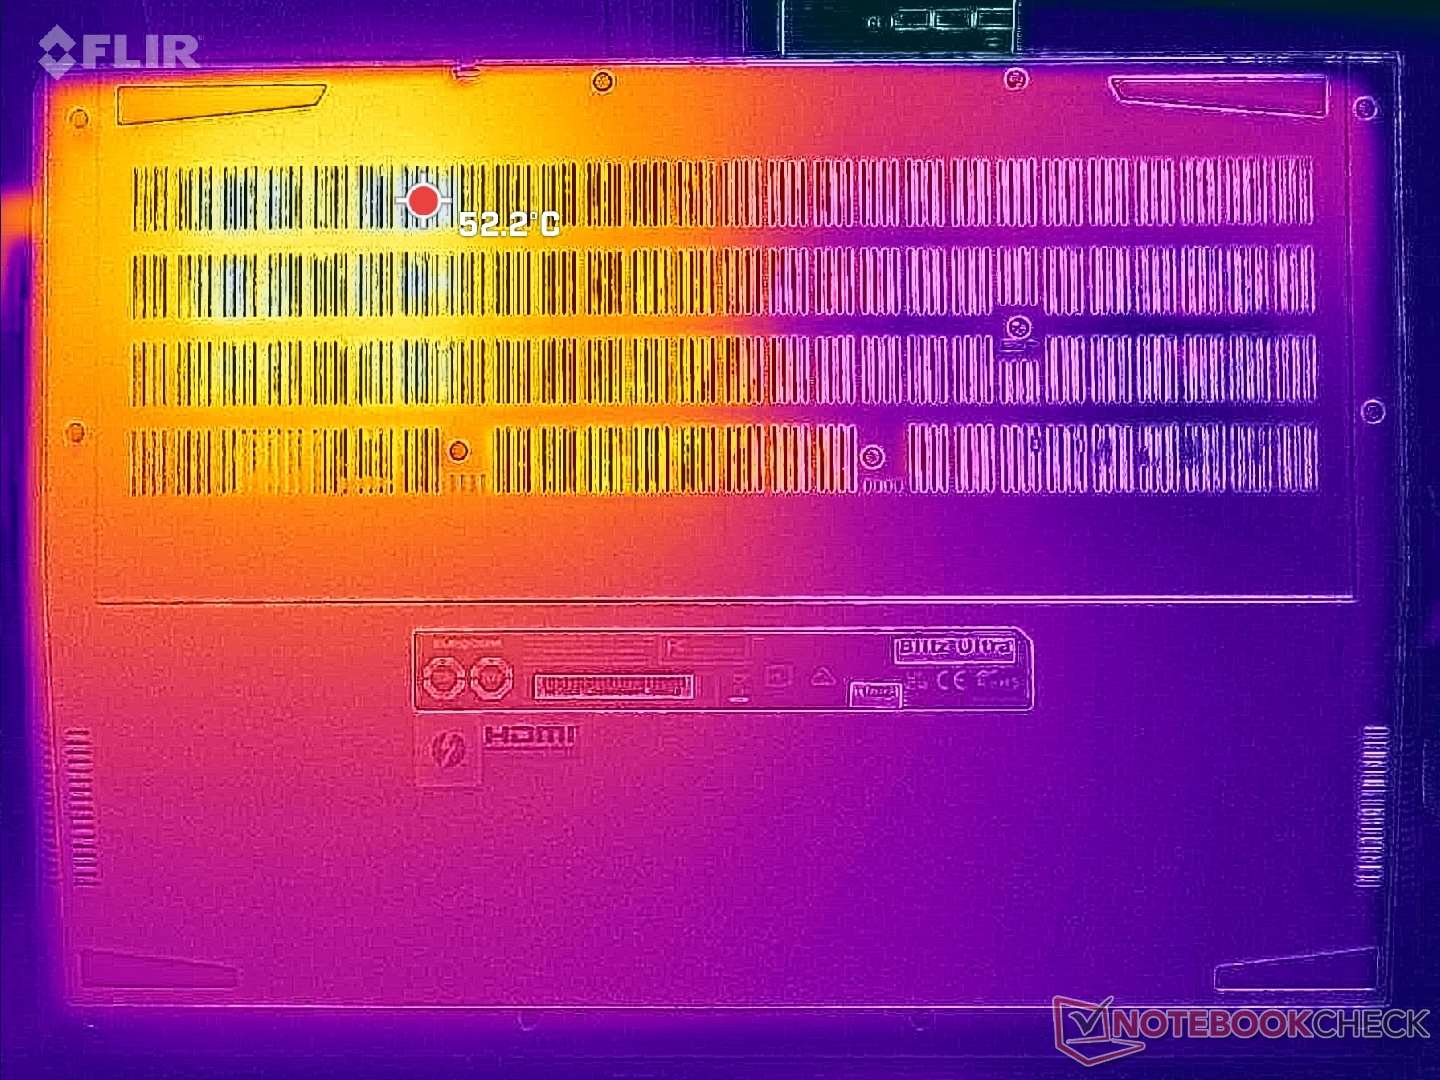
Surface temperatures are warmest on the right half of the chassis where hot spots can reach a toasty 39 C and 50 C on the keyboard deck and bottom cover, respectively. These areas are thankfully toward the rear where skin contact is minimal during use.
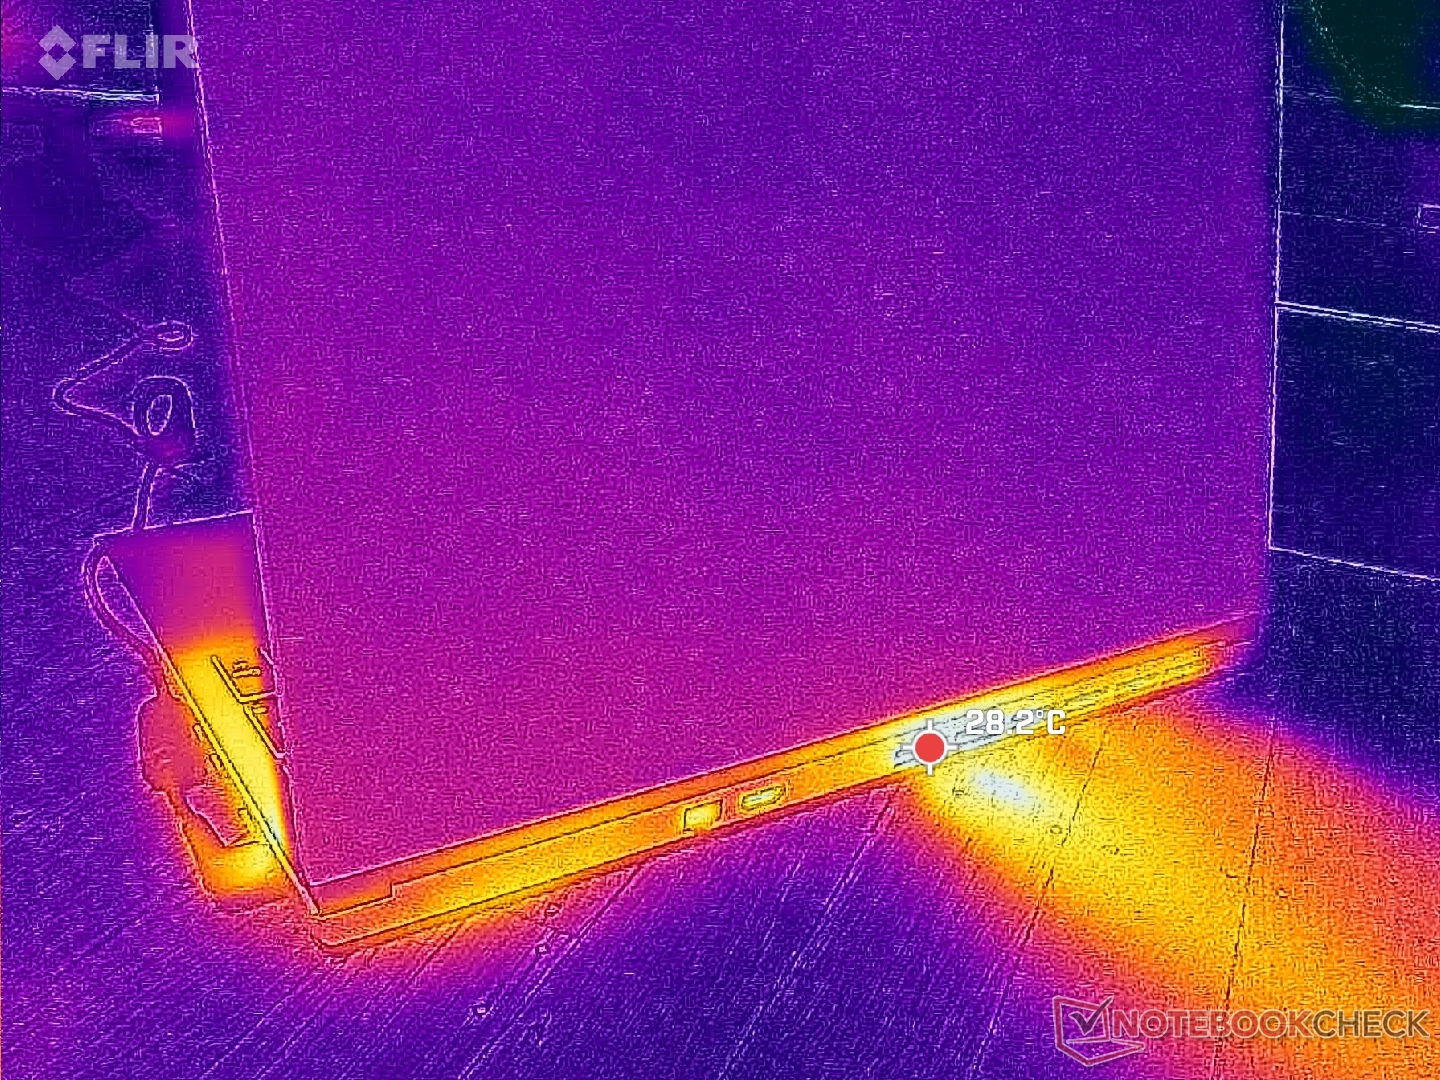
(+) The maximum temperature on the upper side is 38.2 °C / 101 F, compared to the average of 36.8 °C / 98 F, ranging from 21 to 71 °C for the class Multimedia.
(-) The bottom heats up to a maximum of 49.8 °C / 122 F, compared to the average of 39.1 °C / 102 F
(+) In idle usage, the average temperature for the upper side is 21.9 °C / 71 F, compared to the device average of 31.3 °C / 88 F.
(+) 3: The average temperature for the upper side is 25 °C / 77 F, compared to the average of 31.3 °C / 88 F for the class Multimedia.
(+) The palmrests and touchpad are cooler than skin temperature with a maximum of 26.2 °C / 79.2 F and are therefore cool to the touch.
(+) The average temperature of the palmrest area of similar devices was 28.7 °C / 83.7 F (+2.5 °C / 4.5 F).
| Eurocom Blitz Ultra 16 Intel Core Ultra 7 155H, Intel Arc 8-Core iGPU | Lenovo ThinkBook 16 G7 IML Intel Core Ultra 5 125U, Intel Graphics 4-Core iGPU (Meteor / Arrow Lake) | MSI Summit A16 AI Plus A3HMTG AMD Ryzen AI 9 365, AMD Radeon 880M | Acer Aspire 16 A16-51GM-77G2 Intel Core 7 150U, NVIDIA GeForce RTX 2050 Mobile | Lenovo ThinkPad T16 Gen 3 21MN005XGE Intel Core Ultra 5 125U, Intel Graphics 4-Core iGPU (Meteor / Arrow Lake) | Asus VivoBook Pro 16 Intel Core i7-12700H, NVIDIA GeForce RTX 3050 Ti Laptop GPU | |
|---|---|---|---|---|---|---|
| Heat | 6% | -18% | -21% | 2% | -28% | |
| Maximum Upper Side * (°C) | 38.2 | 33.2 13% | 52.8 -38% | 47 -23% | 37.1 3% | 44.2 -16% |
| Maximum Bottom * (°C) | 49.8 | 41.2 17% | 42 16% | 50 -0% | 43.7 12% | 53 -6% |
| Idle Upper Side * (°C) | 23.2 | 23.4 -1% | 30.6 -32% | 31 -34% | 24.9 -7% | 32.1 -38% |
| Idle Bottom * (°C) | 25.6 | 26.6 -4% | 29.6 -16% | 32 -25% | 26 -2% | 38.4 -50% |
* ... smaller is better
Stress Test
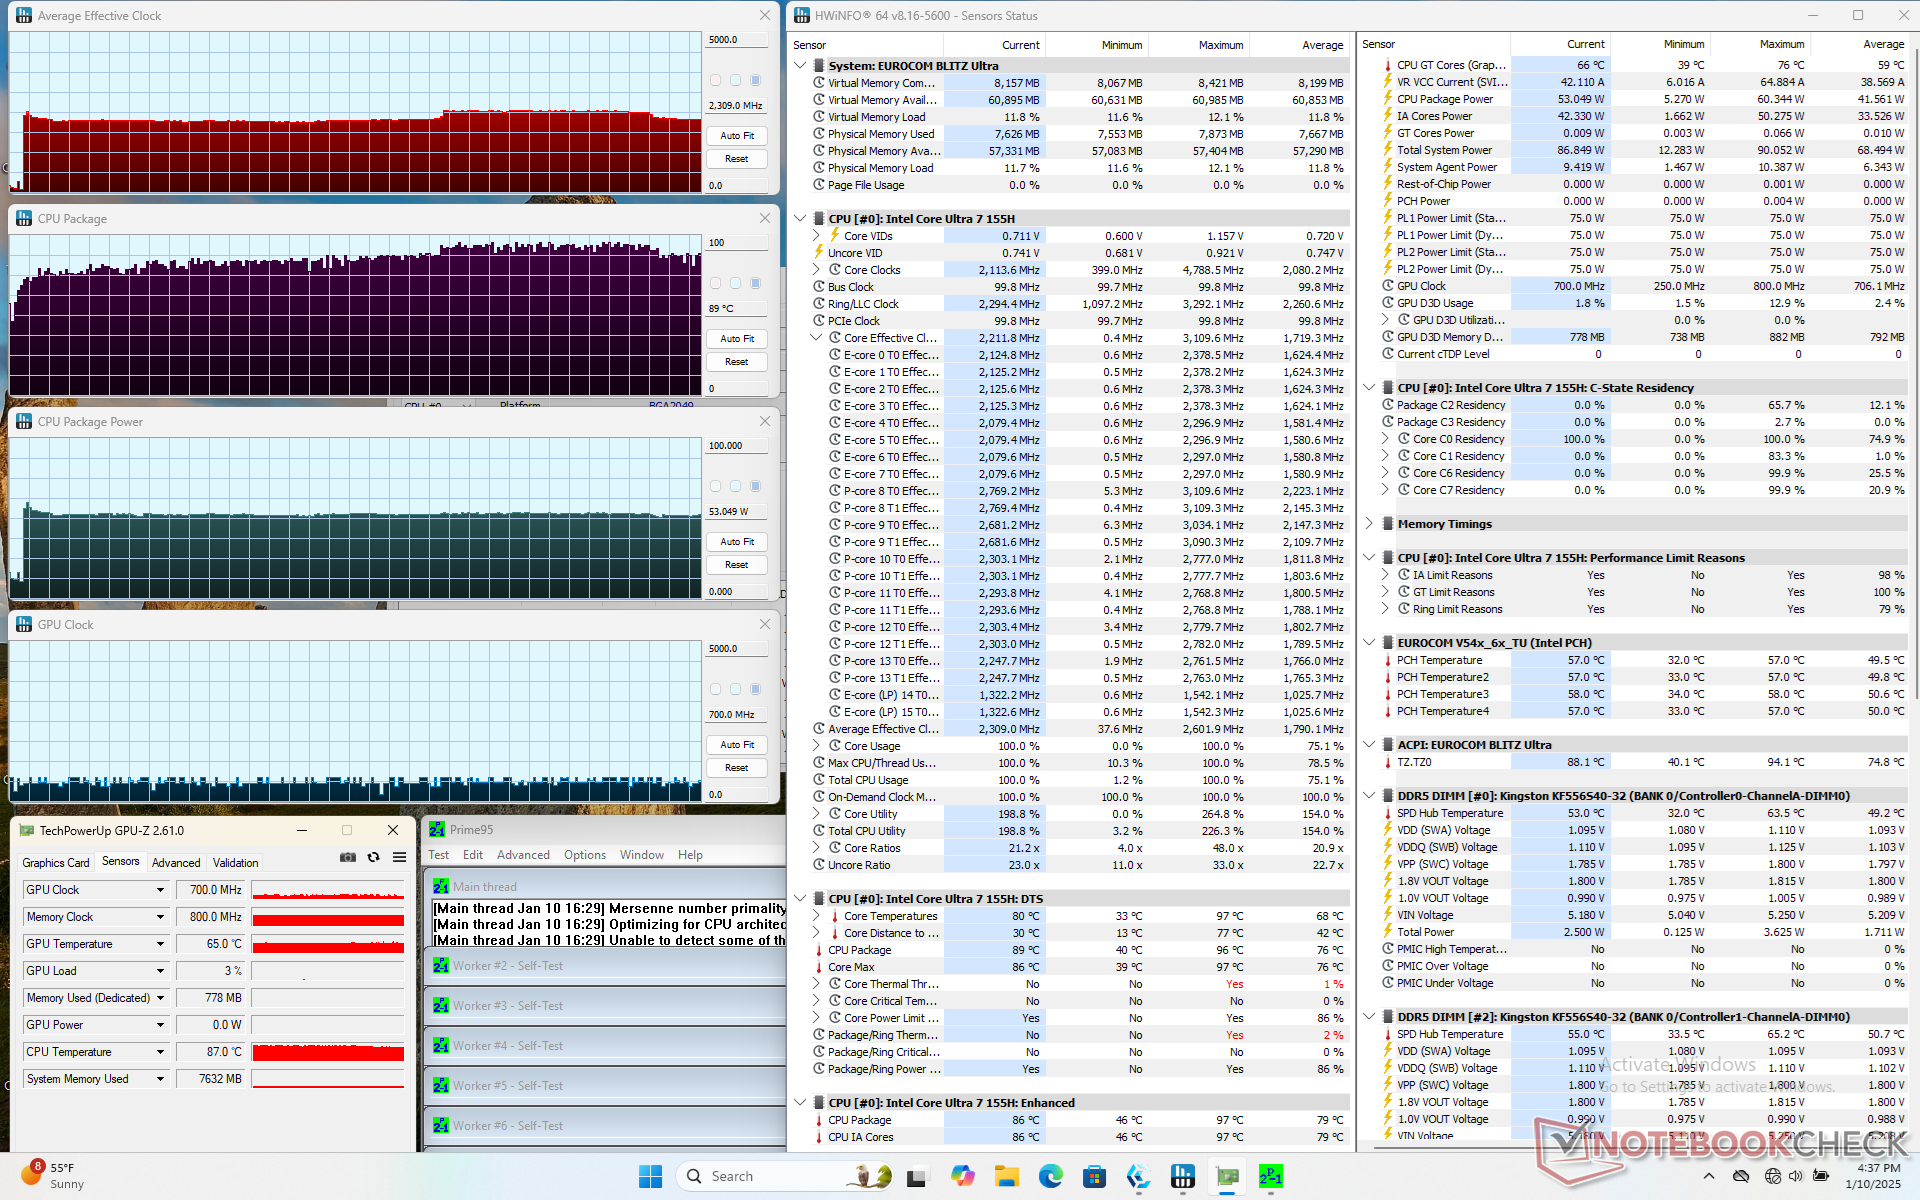
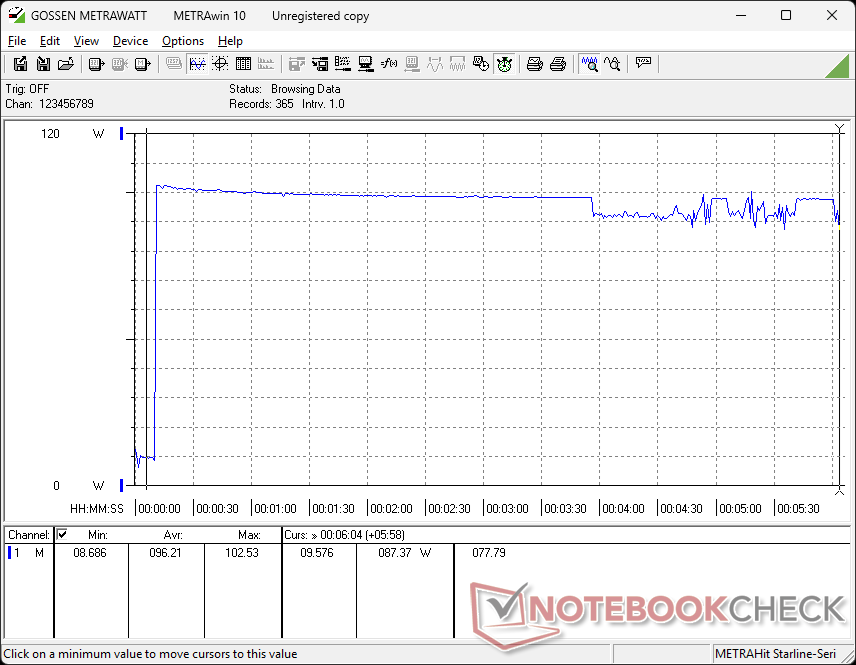
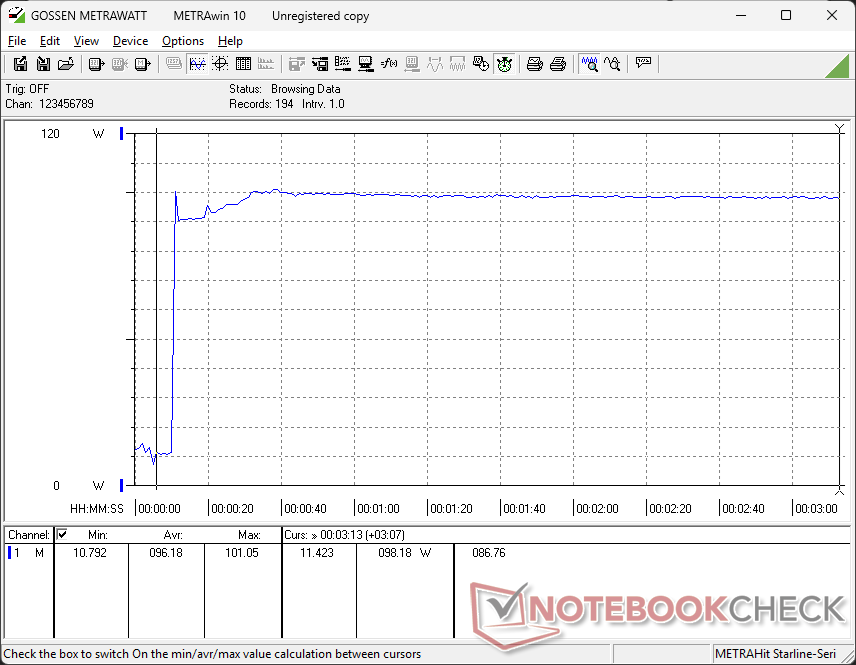
Core temperature would hover around 90 C when running Prime95 stress to be warmer than what we would like for an H-series system. The More powerful Ryzen 9 MSI Summit A16 AI Plus, for example, would stabilize closer to the 80 C range. Package power would spike to 60 W during the start of the test before almost immediately falling to 53 W.
When running Cyberpunk 2077 to represent typical gaming stress, core temperature would stabilize at 72 C compared to 75 C on the aforementioned MSI under similar conditions.
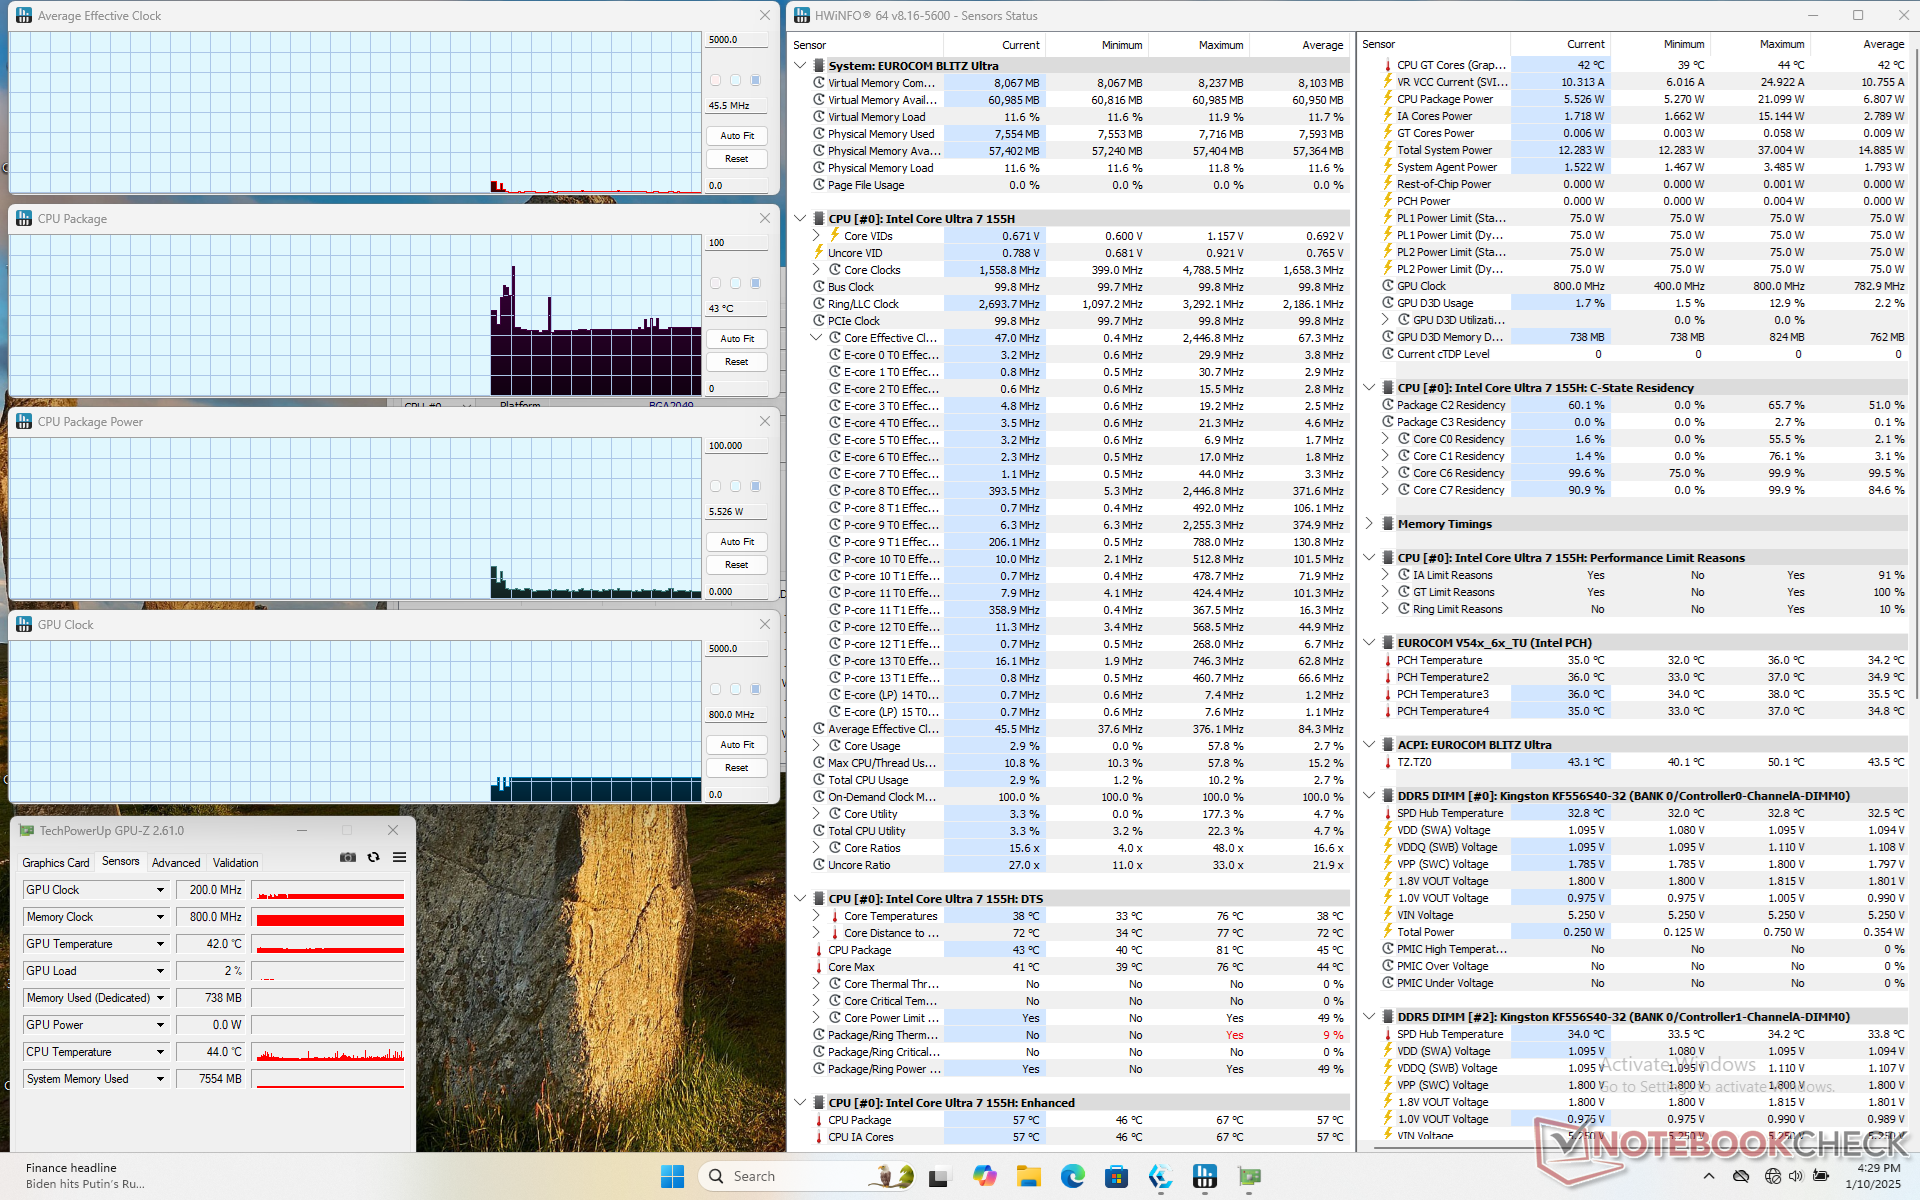
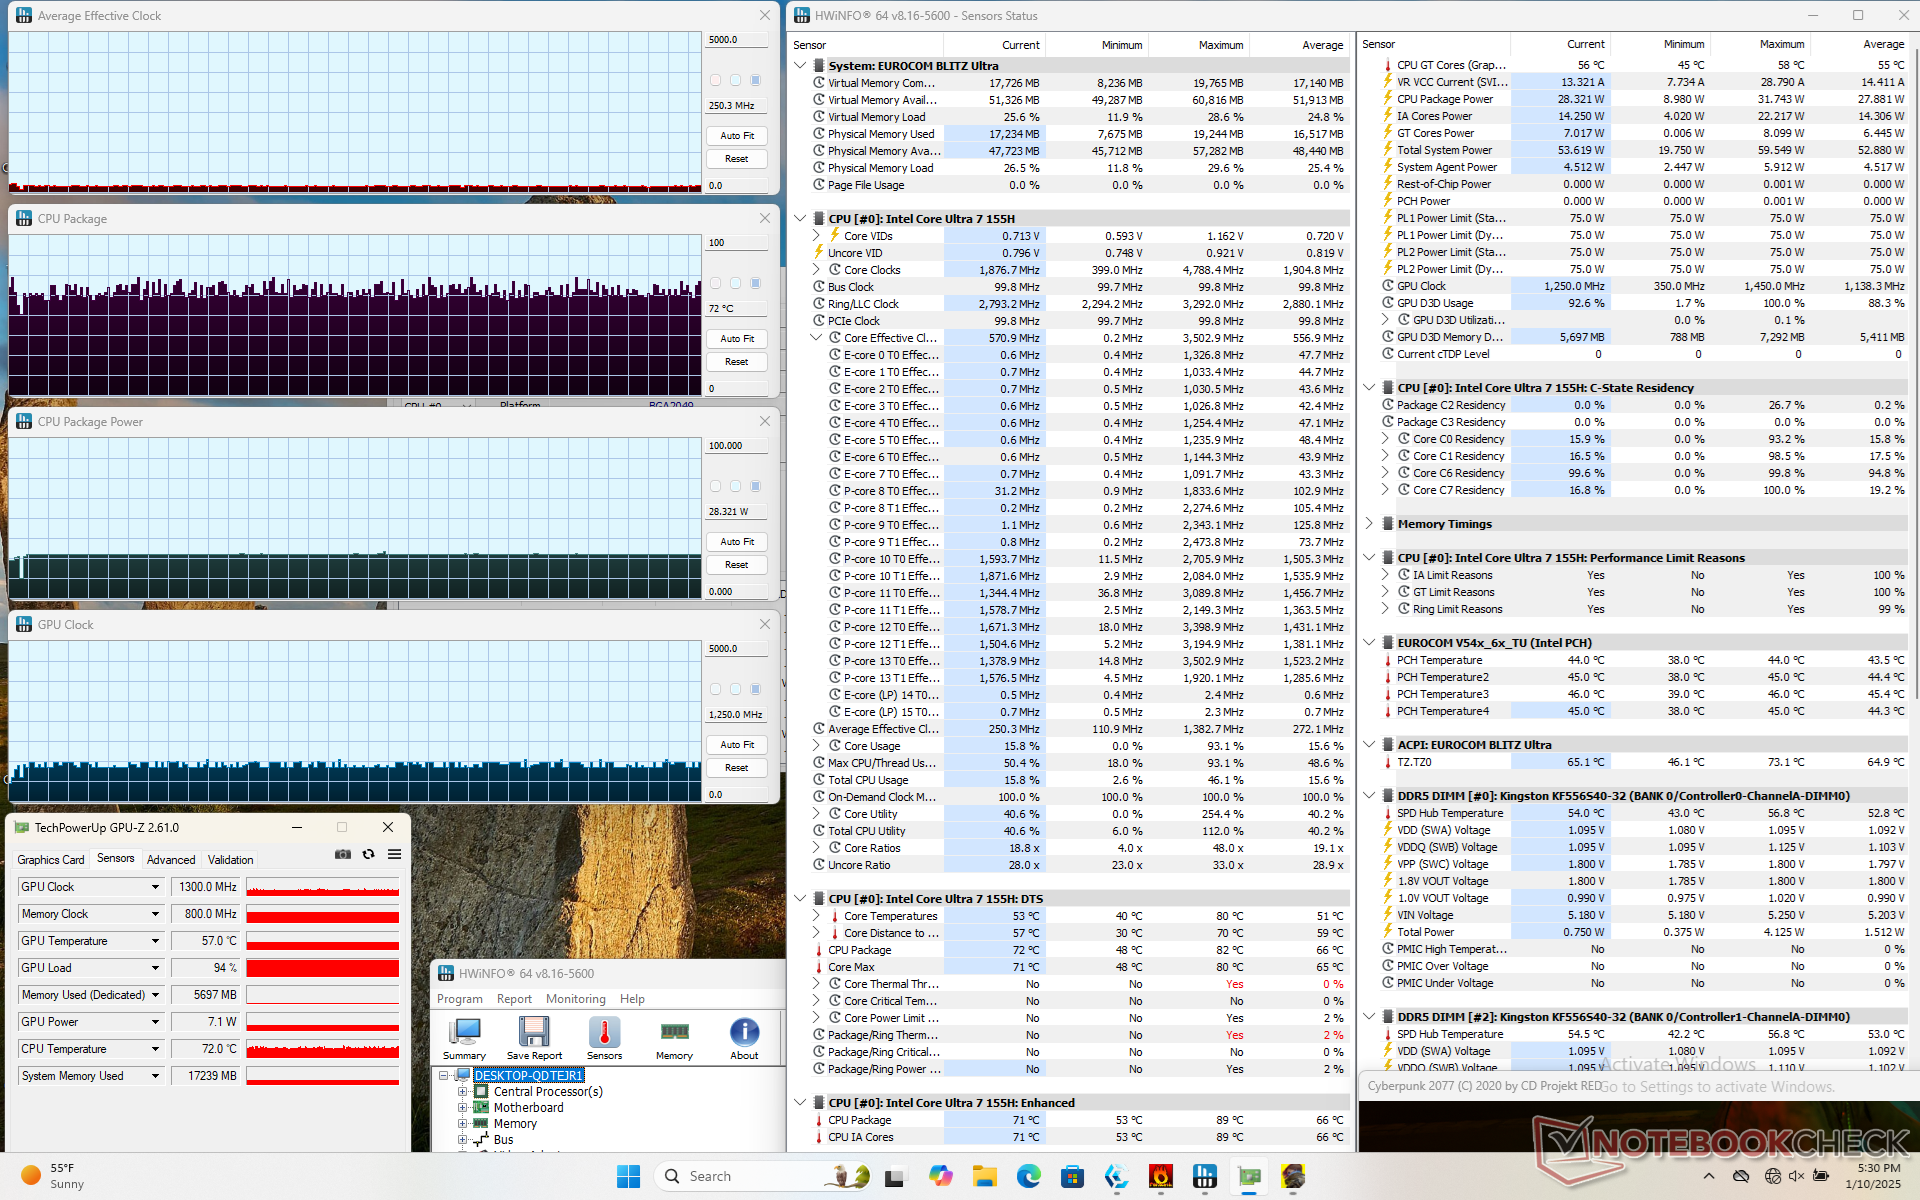
| Average CPU Clock (GHz) | GPU Clock (MHz) | Average CPU Temperature (°C) | |
| System Idle | -- | -- | 43 |
| Prime95 Stress | 2.3 | -- | 89 |
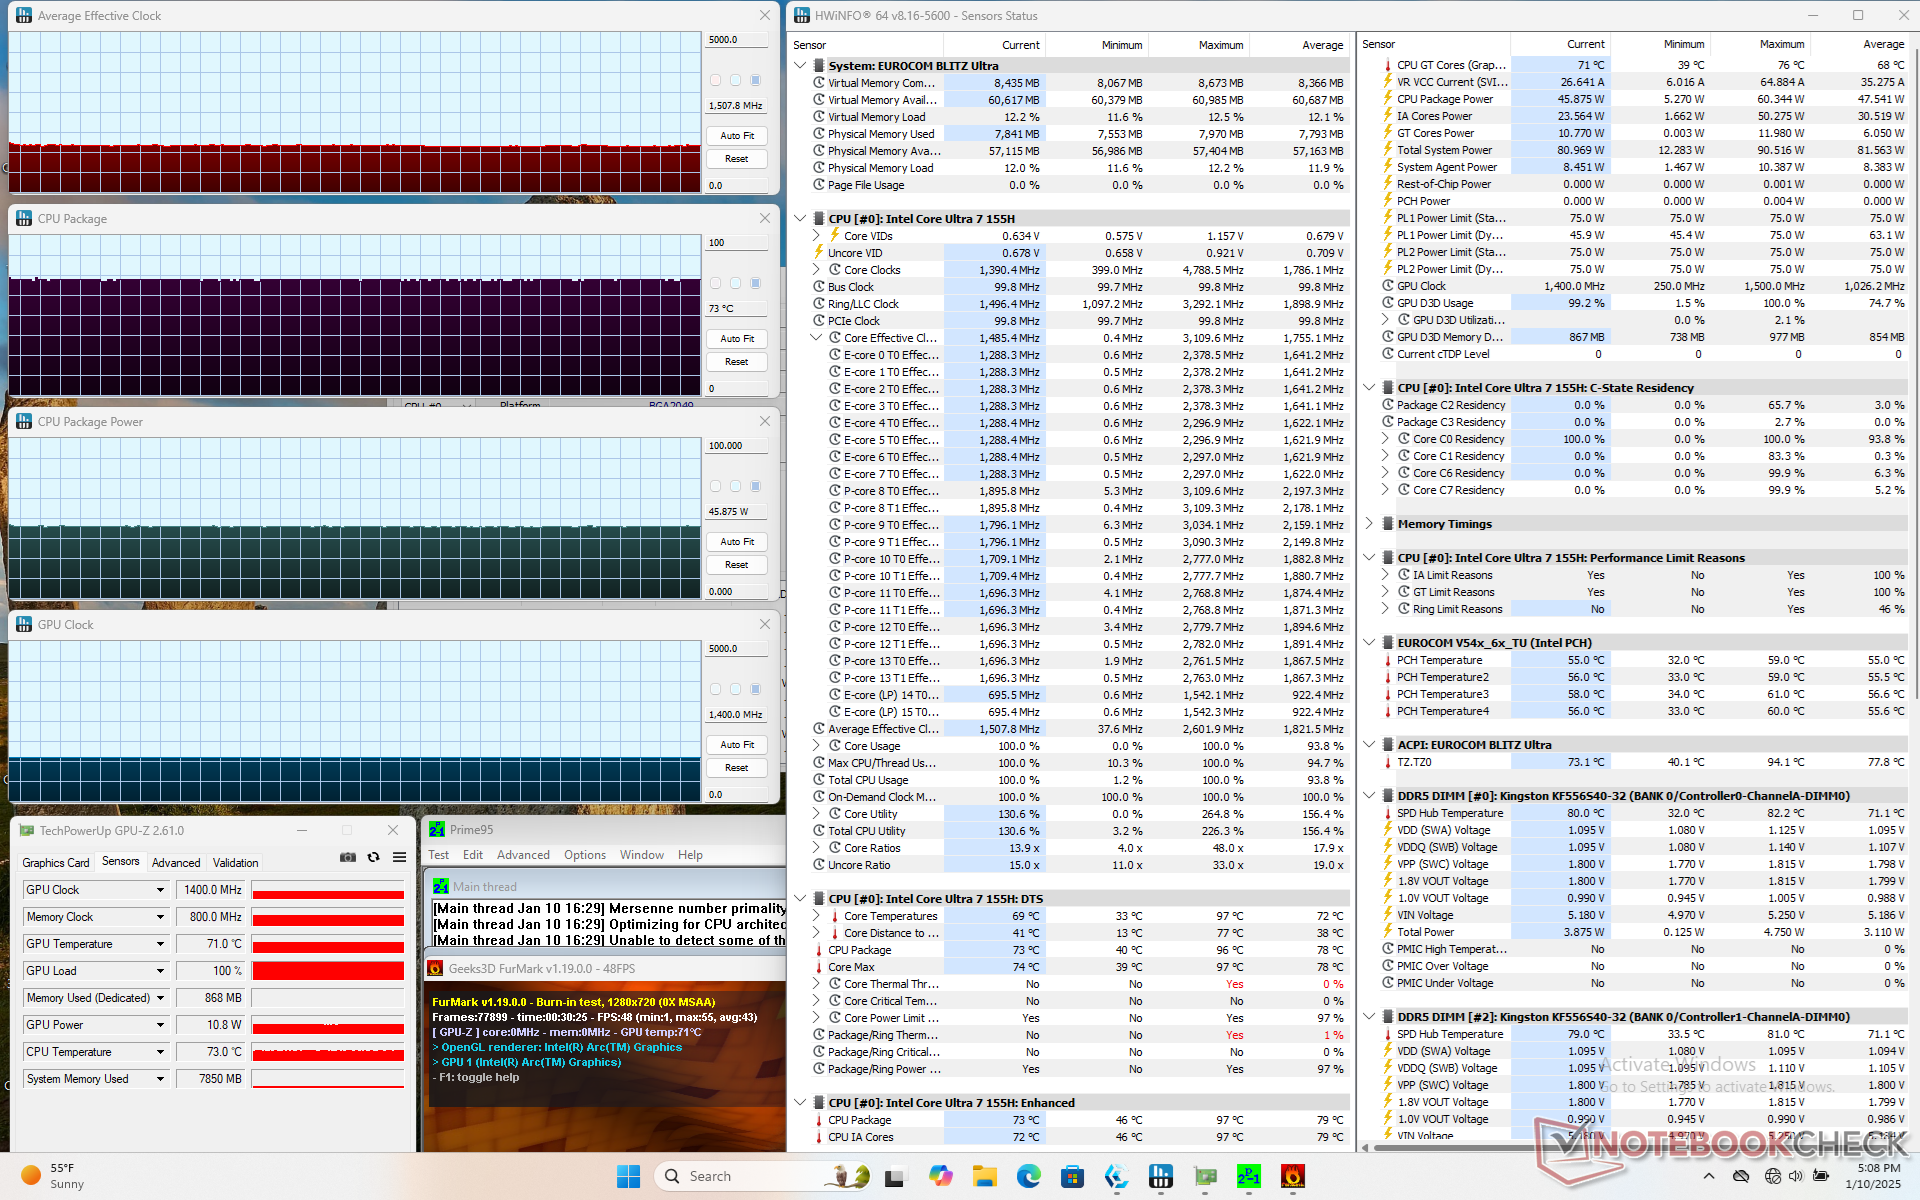
| Prime95 + FurMark Stress | 1.5 | 1400 | 73 |
| Cyberpunk 2077 Stress | 0.25 | 1300 | 72 |
Speakers
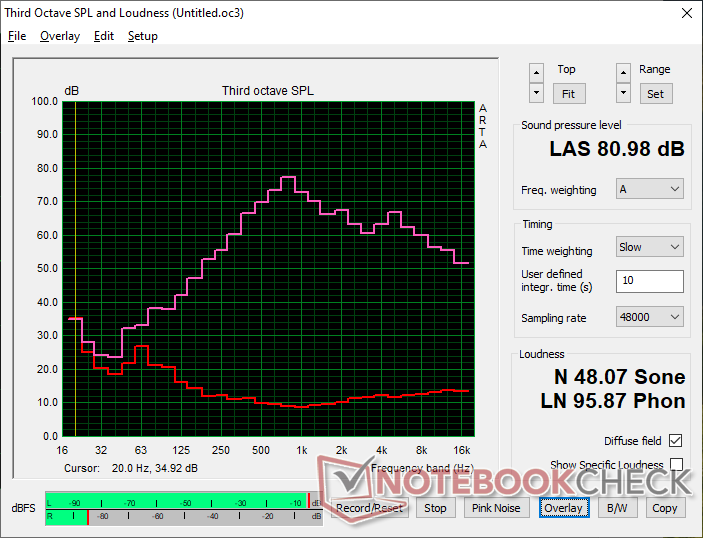
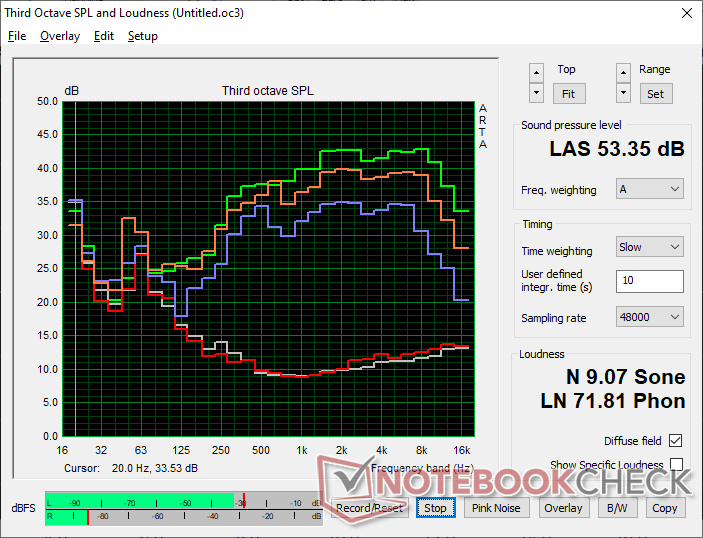
Eurocom Blitz Ultra 16 audio analysis
(±) | speaker loudness is average but good (81 dB)
Bass 100 - 315 Hz
(±) | reduced bass - on average 13.2% lower than median
(±) | linearity of bass is average (7.5% delta to prev. frequency)
Mids 400 - 2000 Hz
(±) | higher mids - on average 7.9% higher than median
(±) | linearity of mids is average (7.1% delta to prev. frequency)
Highs 2 - 16 kHz
(+) | balanced highs - only 2.3% away from median
(+) | highs are linear (6.7% delta to prev. frequency)
Overall 100 - 16.000 Hz
(±) | linearity of overall sound is average (16.5% difference to median)
Compared to same class
» 43% of all tested devices in this class were better, 7% similar, 50% worse
» The best had a delta of 5%, average was 17%, worst was 45%
Compared to all devices tested
» 28% of all tested devices were better, 6% similar, 66% worse
» The best had a delta of 4%, average was 23%, worst was 134%
Apple MacBook Pro 16 2021 M1 Pro audio analysis
(+) | speakers can play relatively loud (84.7 dB)
Bass 100 - 315 Hz
(+) | good bass - only 3.8% away from median
(+) | bass is linear (5.2% delta to prev. frequency)
Mids 400 - 2000 Hz
(+) | balanced mids - only 1.3% away from median
(+) | mids are linear (2.1% delta to prev. frequency)
Highs 2 - 16 kHz
(+) | balanced highs - only 1.9% away from median
(+) | highs are linear (2.7% delta to prev. frequency)
Overall 100 - 16.000 Hz
(+) | overall sound is linear (4.6% difference to median)
Compared to same class
» 0% of all tested devices in this class were better, 0% similar, 100% worse
» The best had a delta of 5%, average was 17%, worst was 45%
Compared to all devices tested
» 0% of all tested devices were better, 0% similar, 100% worse
» The best had a delta of 4%, average was 23%, worst was 134%
Energy Management
Power Consumption
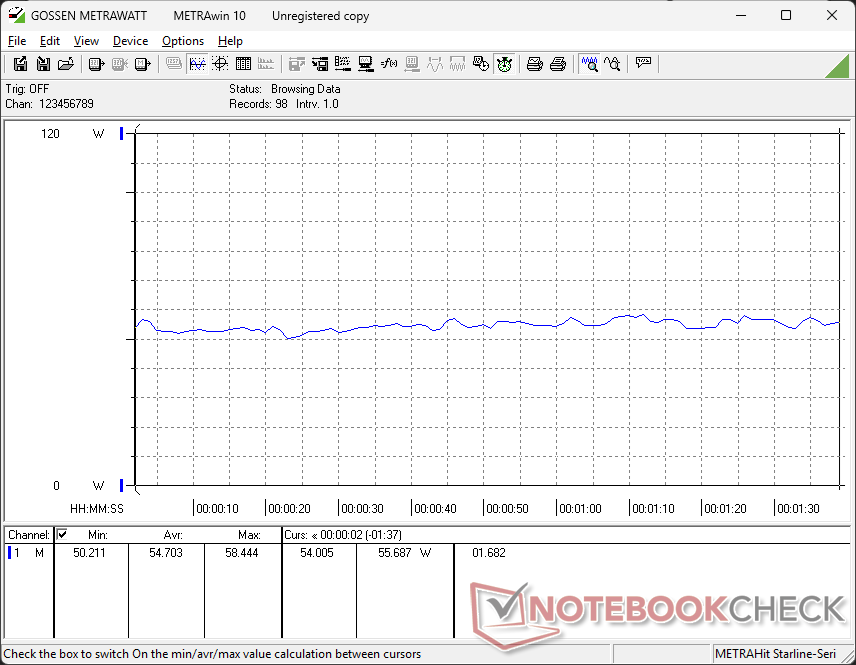
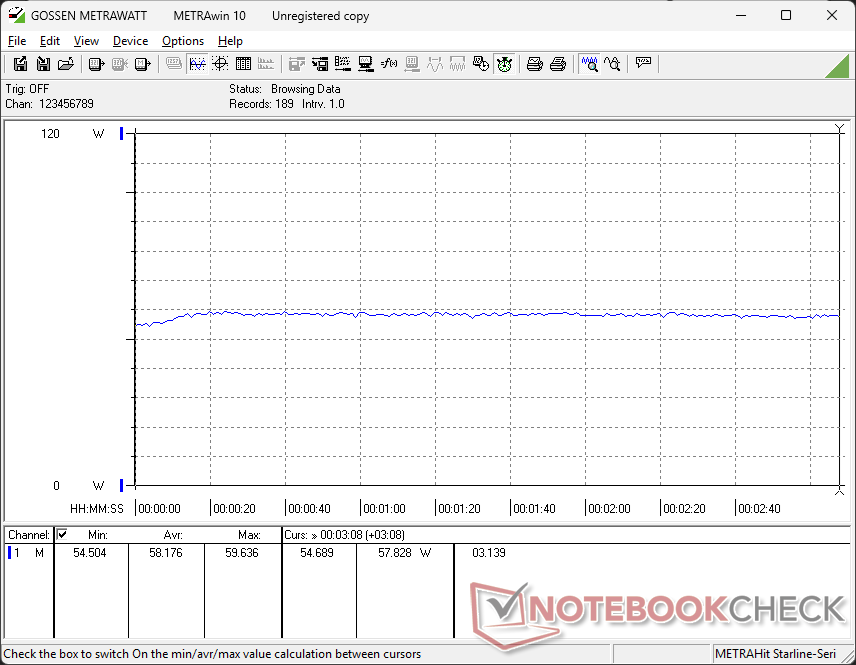
Idling power consumption isn't noticeably greater than the ThinkBook 16 G7 or MSI Summit A16 AI powered by Core-U and Ryzen AI 9 processors, respectively. When running Cyberpunk 2077, however, average consumption would be nearly identical to the MSI system even though our Intel GPU is much slower for inferior performance-per-watt. Similar results can be found when running Prime95 as well.
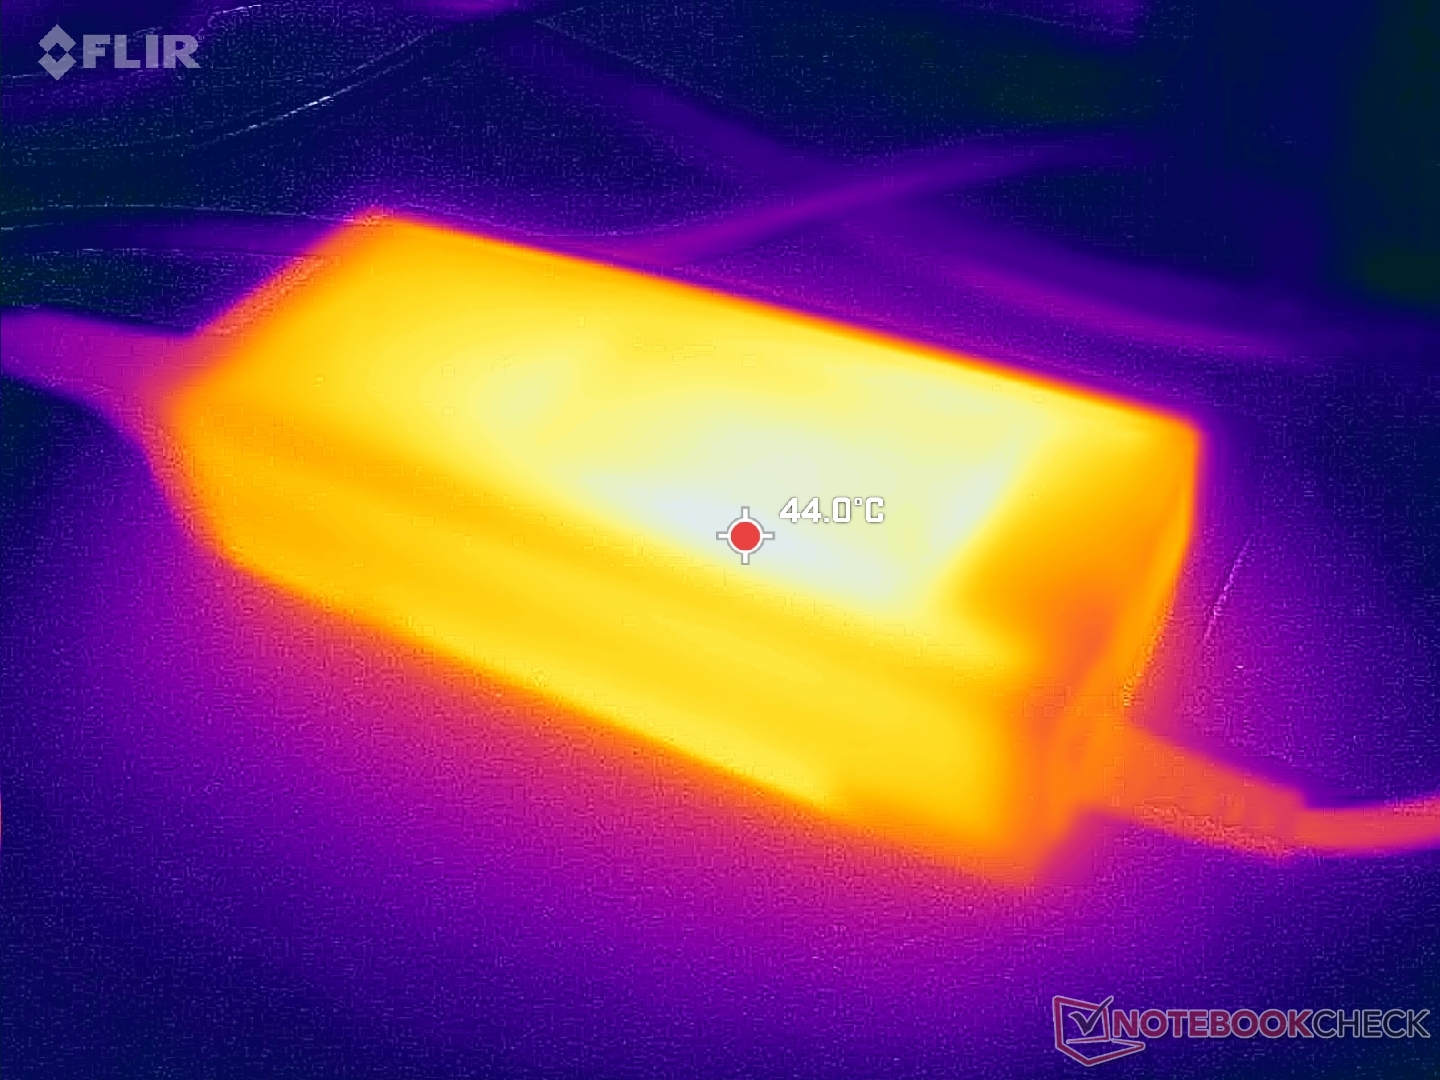
We're able to record a maximum draw of 103 W from the small (~12.5 x 5 x 3 cm) 90 W barrel-type AC adapter. We would like to see the model move fully to USB-C charging for future iterations.
| Off / Standby | |
| Idle | |
| Load |
|
Key:
min: | |
| Eurocom Blitz Ultra 16 Ultra 7 155H, Arc 8-Core, , IPS, 1920x1200, 16" | Lenovo ThinkBook 16 G7 IML Ultra 5 125U, Graphics 4-Core iGPU (Arrow Lake), SK hynix HFS512GEJ4X112N, IPS, 1920x1200, 16" | MSI Summit A16 AI Plus A3HMTG Ryzen AI 9 365, Radeon 880M, Samsung PM9C1 MZVL81T0HELB-00BTW, IPS, 2560x1600, 16" | Acer Aspire 16 A16-51GM-77G2 Core 7 150U, GeForce RTX 2050 Mobile, WD PC SN740 SDDQNQD-1T00-1014, IPS, 1920x1200, 16" | Lenovo ThinkPad T16 Gen 3 21MN005XGE Ultra 5 125U, Graphics 4-Core iGPU (Arrow Lake), Lenovo UMIS RPETJ1T24MHP2QDQ, IPS LED, 1920x1200, 16" | Asus VivoBook Pro 16 i7-12700H, GeForce RTX 3050 Ti Laptop GPU, Intel SSD 670p SSDPEKNU010TZ, IPS, 2560x1600, 16" | |
|---|---|---|---|---|---|---|
| Power Consumption | 24% | -9% | -35% | 27% | -74% | |
| Idle Minimum * (Watt) | 5.9 | 4.3 27% | 5.4 8% | 8.8 -49% | 3.1 47% | 8.7 -47% |
| Idle Average * (Watt) | 8.6 | 8.9 -3% | 11 -28% | 12.8 -49% | 6.4 26% | 13.1 -52% |
| Idle Maximum * (Watt) | 9.3 | 9.1 2% | 11.2 -20% | 14.1 -52% | 7.9 15% | 18.3 -97% |
| Load Average * (Watt) | 54.7 | 31.7 42% | 76.6 -40% | 80 -46% | 44 20% | 116 -112% |
| Cyberpunk 2077 ultra external monitor * (Watt) | 55.6 | 35.2 37% | 49.2 12% | 72 -29% | 36.7 34% | |
| Cyberpunk 2077 ultra * (Watt) | 58.1 | 39.4 32% | 61.1 -5% | 73.5 -27% | 40.6 30% | |
| Load Maximum * (Watt) | 101.1 | 66.7 34% | 91.8 9% | 90.53 10% | 86.5 14% | 162 -60% |
| Witcher 3 ultra * (Watt) | 117.6 |
* ... smaller is better
Power Consumption Cyberpunk / Stress Test
Power Consumption external Monitor
Battery Life
WLAN runtime from the 72 Wh battery is comparable to many other 16-inch multimedia laptops at almost 9 hours of constant browsing.
| Eurocom Blitz Ultra 16 Ultra 7 155H, Arc 8-Core, 72 Wh | Lenovo ThinkBook 16 G7 IML Ultra 5 125U, Graphics 4-Core iGPU (Arrow Lake), 45 Wh | MSI Summit A16 AI Plus A3HMTG Ryzen AI 9 365, Radeon 880M, 82 Wh | Acer Aspire 16 A16-51GM-77G2 Core 7 150U, GeForce RTX 2050 Mobile, 48.5 Wh | Lenovo ThinkPad T16 Gen 3 21MN005XGE Ultra 5 125U, Graphics 4-Core iGPU (Arrow Lake), 86 Wh | Asus VivoBook Pro 16 i7-12700H, GeForce RTX 3050 Ti Laptop GPU, 70 Wh | |
|---|---|---|---|---|---|---|
| Battery runtime | 0% | 3% | 15% | 56% | -17% | |
| WiFi v1.3 (h) | 8.8 | 8.8 0% | 9.1 3% | 10.1 15% | 13.7 56% | 7.3 -17% |
| Reader / Idle (h) | 19.2 | |||||
| Load (h) | 1.3 | 2.2 | 2 | |||
| H.264 (h) | 8.3 |
Notebookcheck Rating
Eurocom Blitz Ultra 16
- 01/13/2025 v8
Allen Ngo
 Total Sustainability Score:
 Transparency
The selection of devices to be reviewed is made by our editorial team. The test sample was provided to the author as a loan by the manufacturer or retailer for the purpose of this review. The lender had no influence on this review, nor did the manufacturer receive a copy of this review before publication. There was no obligation to publish this review. As an independent media company, Notebookcheck is not subjected to the authority of manufacturers, retailers or publishers.
This is how Notebookcheck is testing
Every year, Notebookcheck independently reviews hundreds of laptops and smartphones using standardized procedures to ensure that all results are comparable. We have continuously developed our test methods for around 20 years and set industry standards in the process. In our test labs, high-quality measuring equipment is utilized by experienced technicians and editors. These tests involve a multi-stage validation process. Our complex rating system is based on hundreds of well-founded measurements and benchmarks, which maintains objectivity. Further information on our test methods can be found here.
