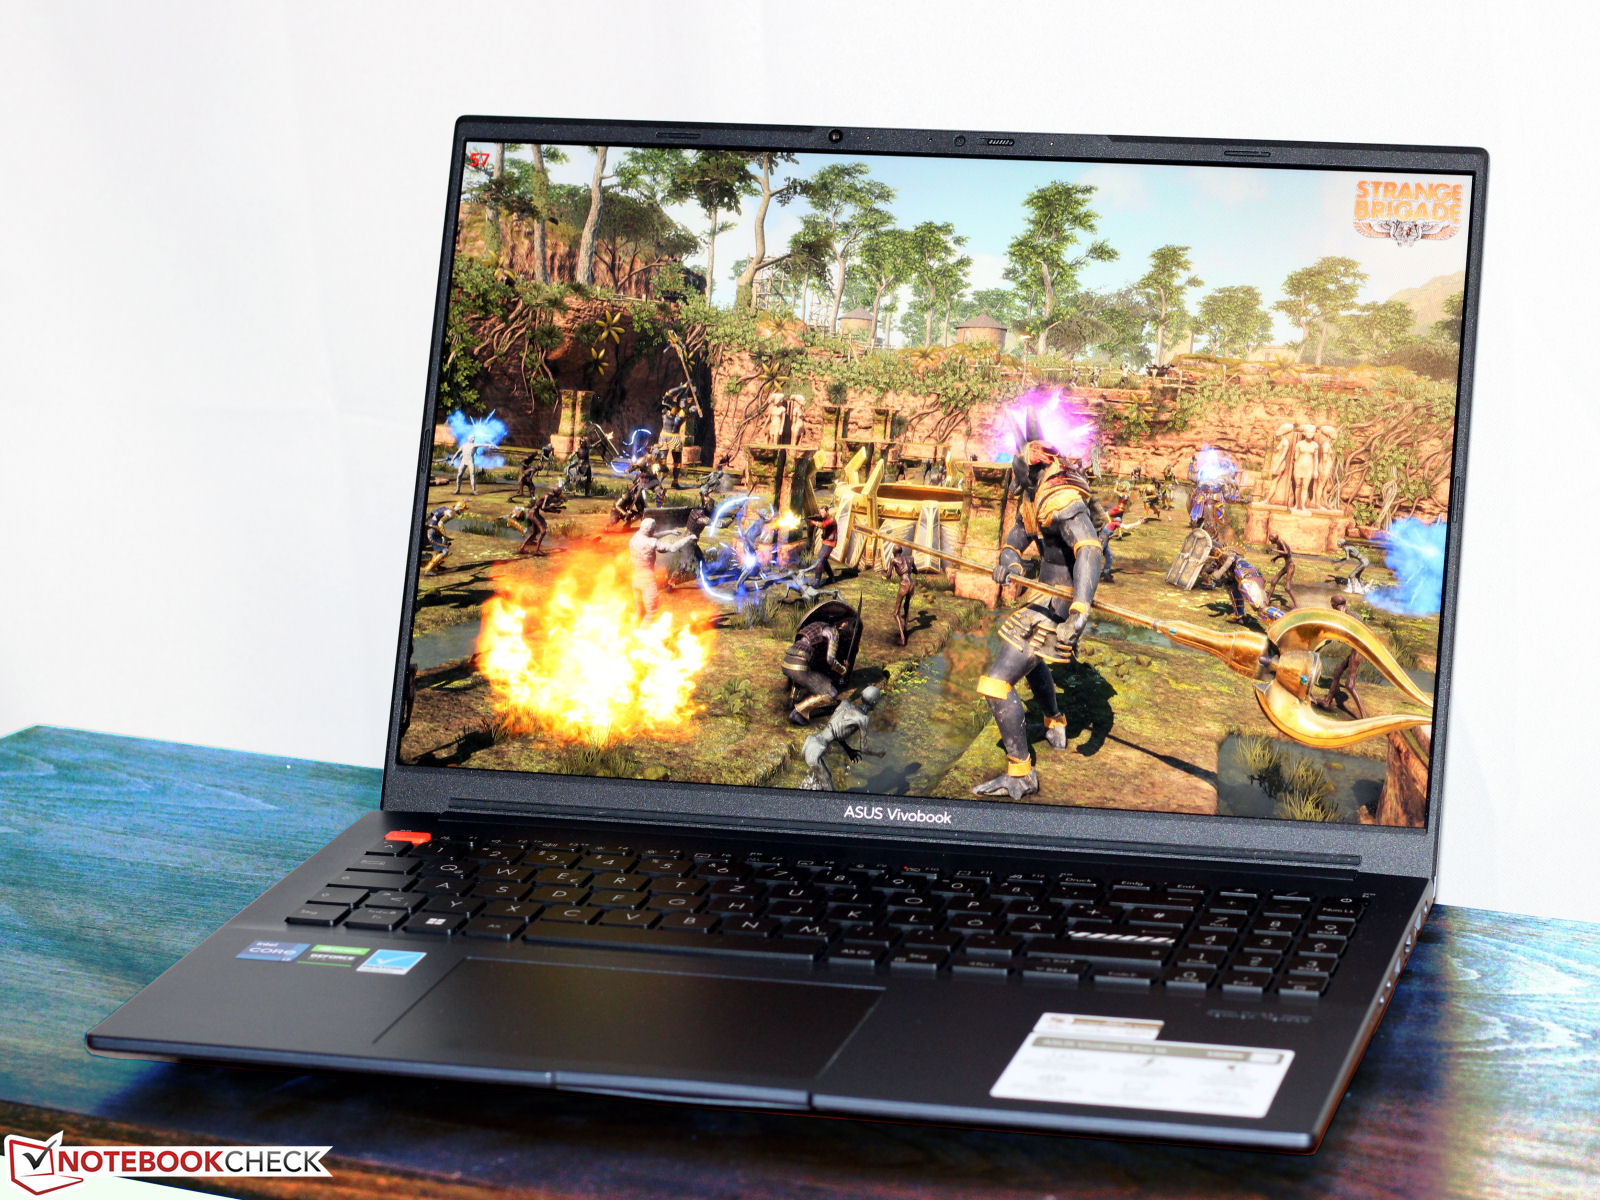
Asus VivoBook Pro 16 review: A multimedia laptop with a Core i7, RTX 3050 Ti and DCI-P3
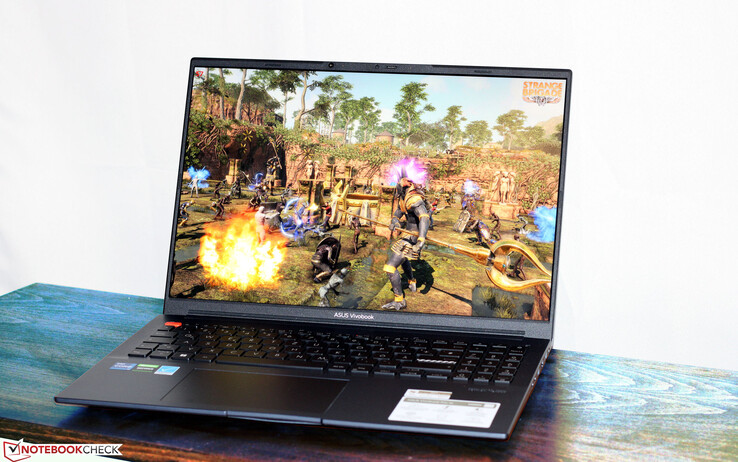
The Asus VivoBook is a portable 16-inch laptop for gamers and creative workers. The laptop comes with fitting hardware: A Core i7-12700H, GeForce RTX 3050 Ti and a bright IPS display in 16:10 format which has great color accuracy. This laptop is similar to the VivoBook Pro 16X which we previously tested - but they are not built identically. Competitors to this laptop include the Dell Inspiron 16 Plus 7620, the XMG Fusion 15 (Mid 22) and the Acer Swift X 16.
possible competitors compared
Rating | Date | Model | Weight | Height | Size | Resolution | Price |
|---|---|---|---|---|---|---|---|
| 86.3 % v7 (old) | 05 / 2023 | Asus VivoBook Pro 16 i7-12700H, GeForce RTX 3050 Ti Laptop GPU | 1.9 kg | 20 mm | 16.00" | 2560x1600 | |
| 86.4 % v7 (old) | 11 / 2022 | Acer Swift X SFX16-52G-77RX i7-1260P, A370M | 1.8 kg | 21.2 mm | 16.00" | 2560x1600 | |
| 87.4 % v7 (old) | 08 / 2022 | Dell Inspiron 16 Plus 7620 i7-12700H, GeForce RTX 3050 Ti Laptop GPU | 2.1 kg | 18.99 mm | 16.00" | 3072x1920 | |
| 87.4 % v7 (old) | 08 / 2022 | Schenker XMG Fusion 15 (Mid 22) i7-11800H, GeForce RTX 3070 Laptop GPU | 1.9 kg | 21.65 mm | 15.60" | 2560x1440 |
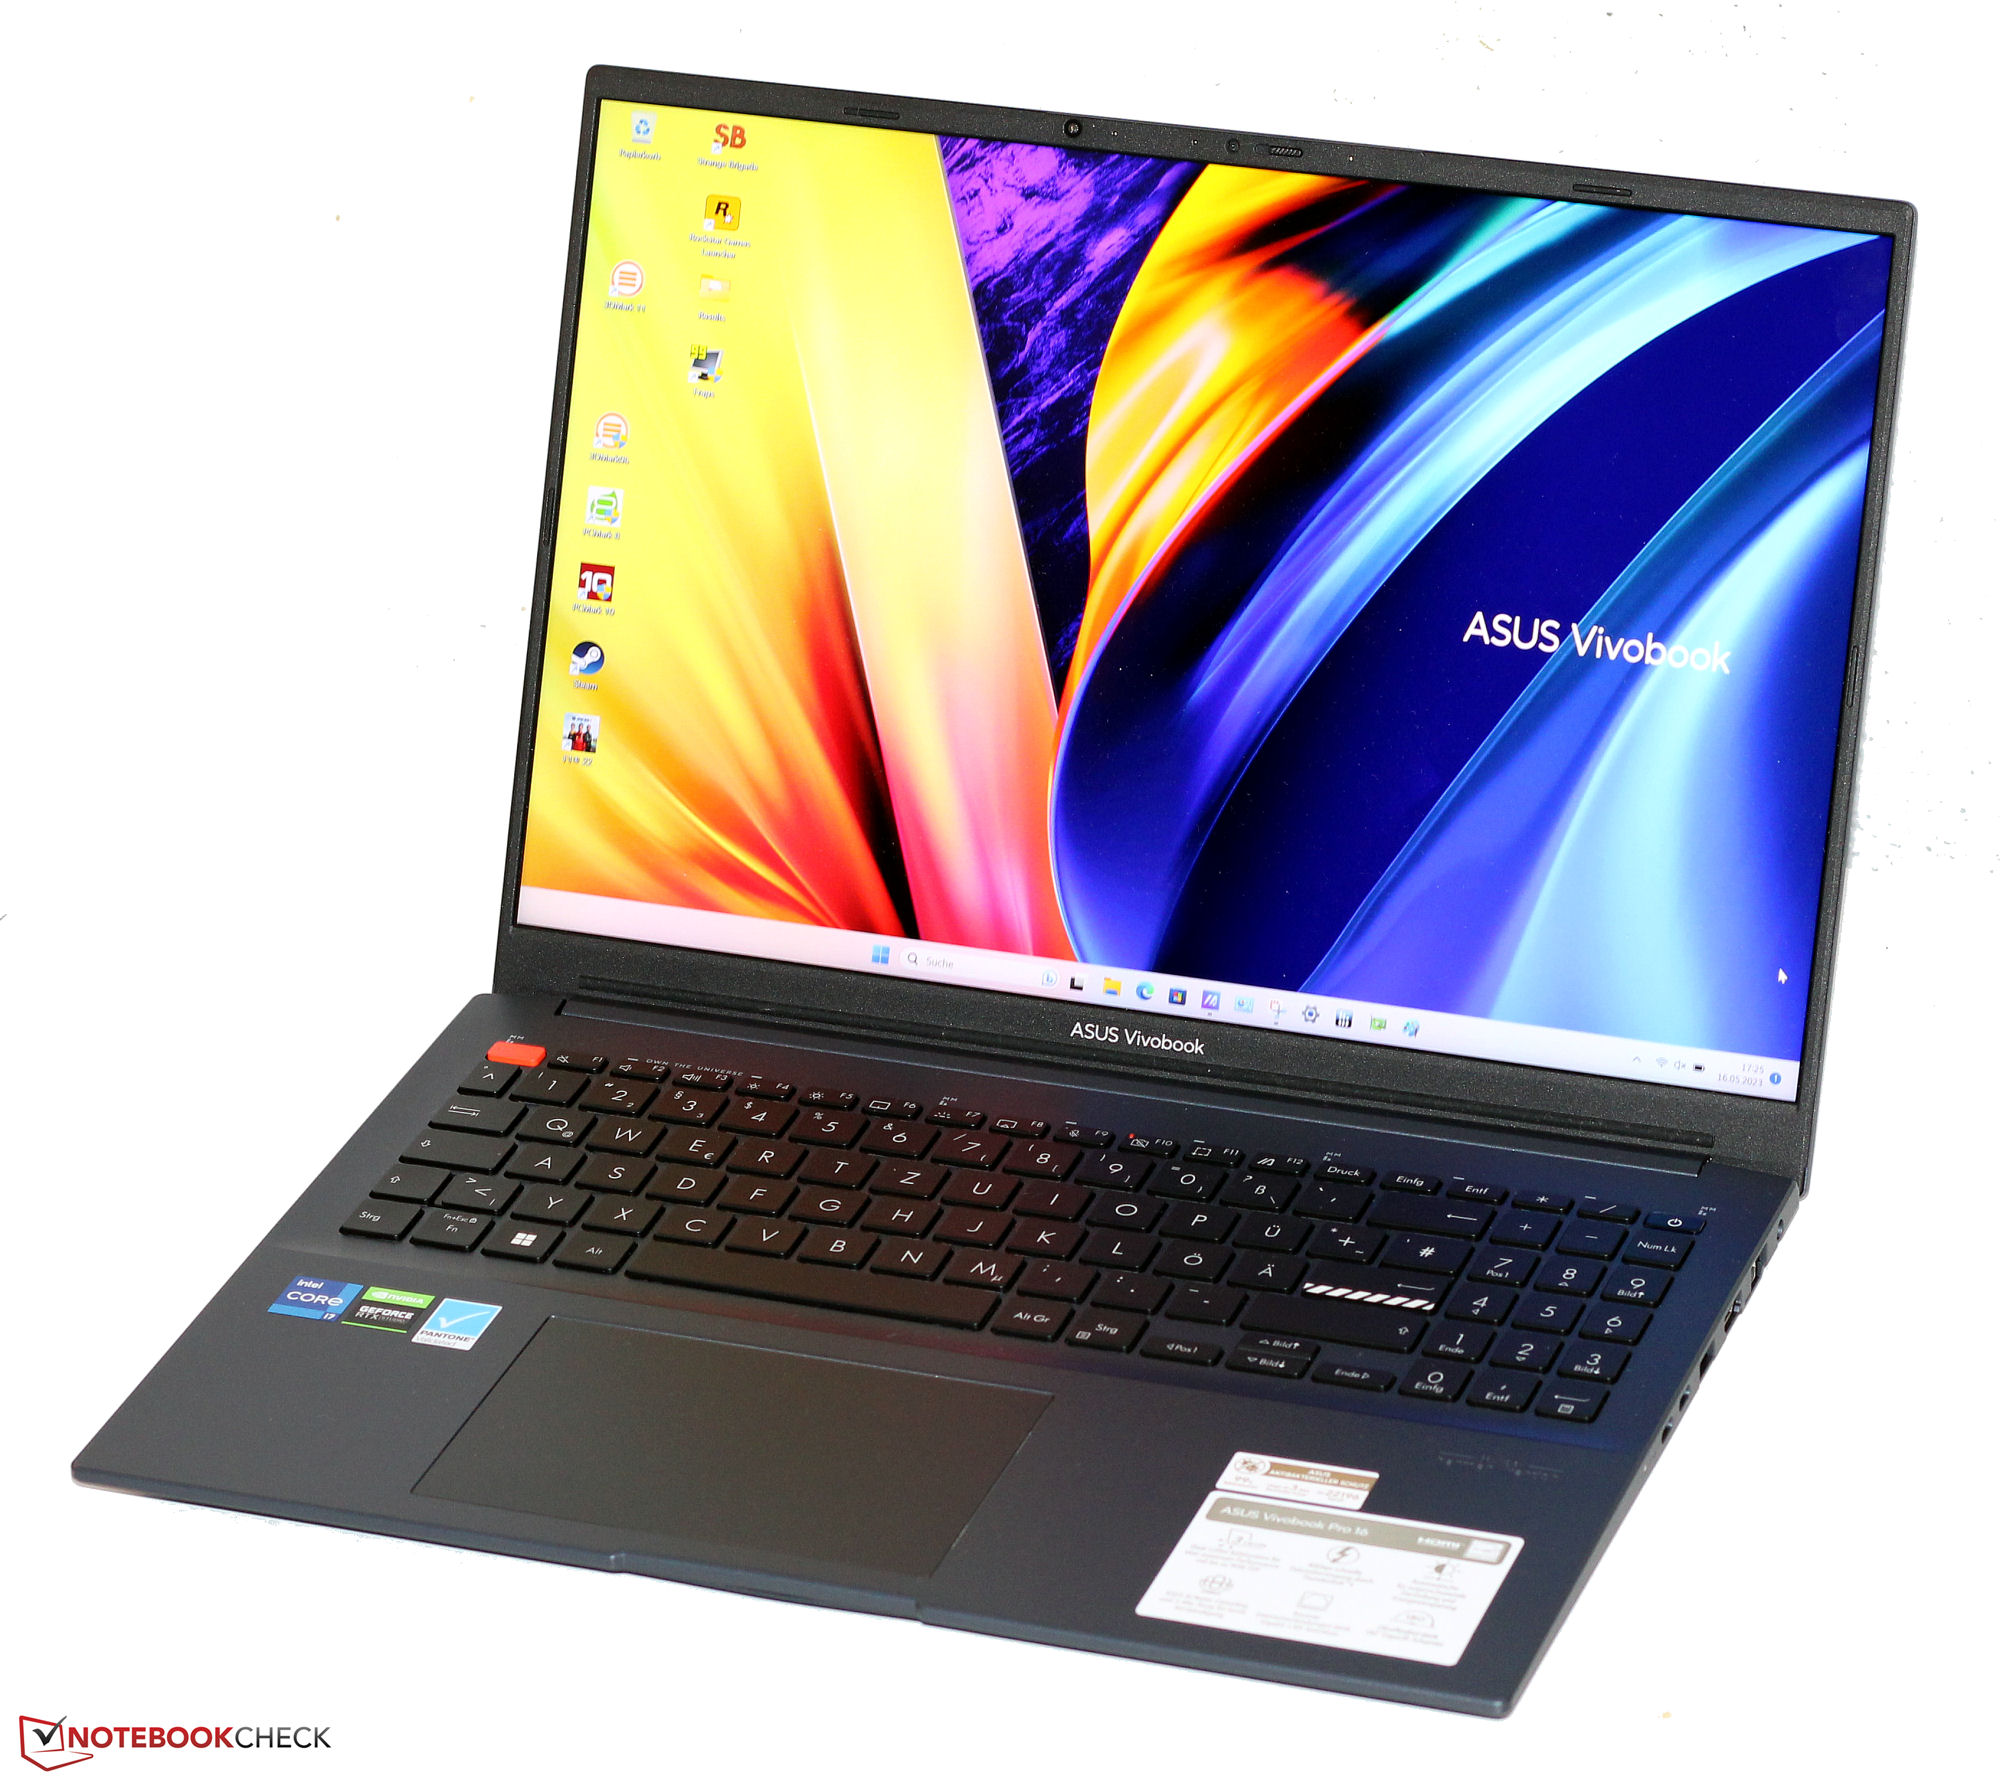
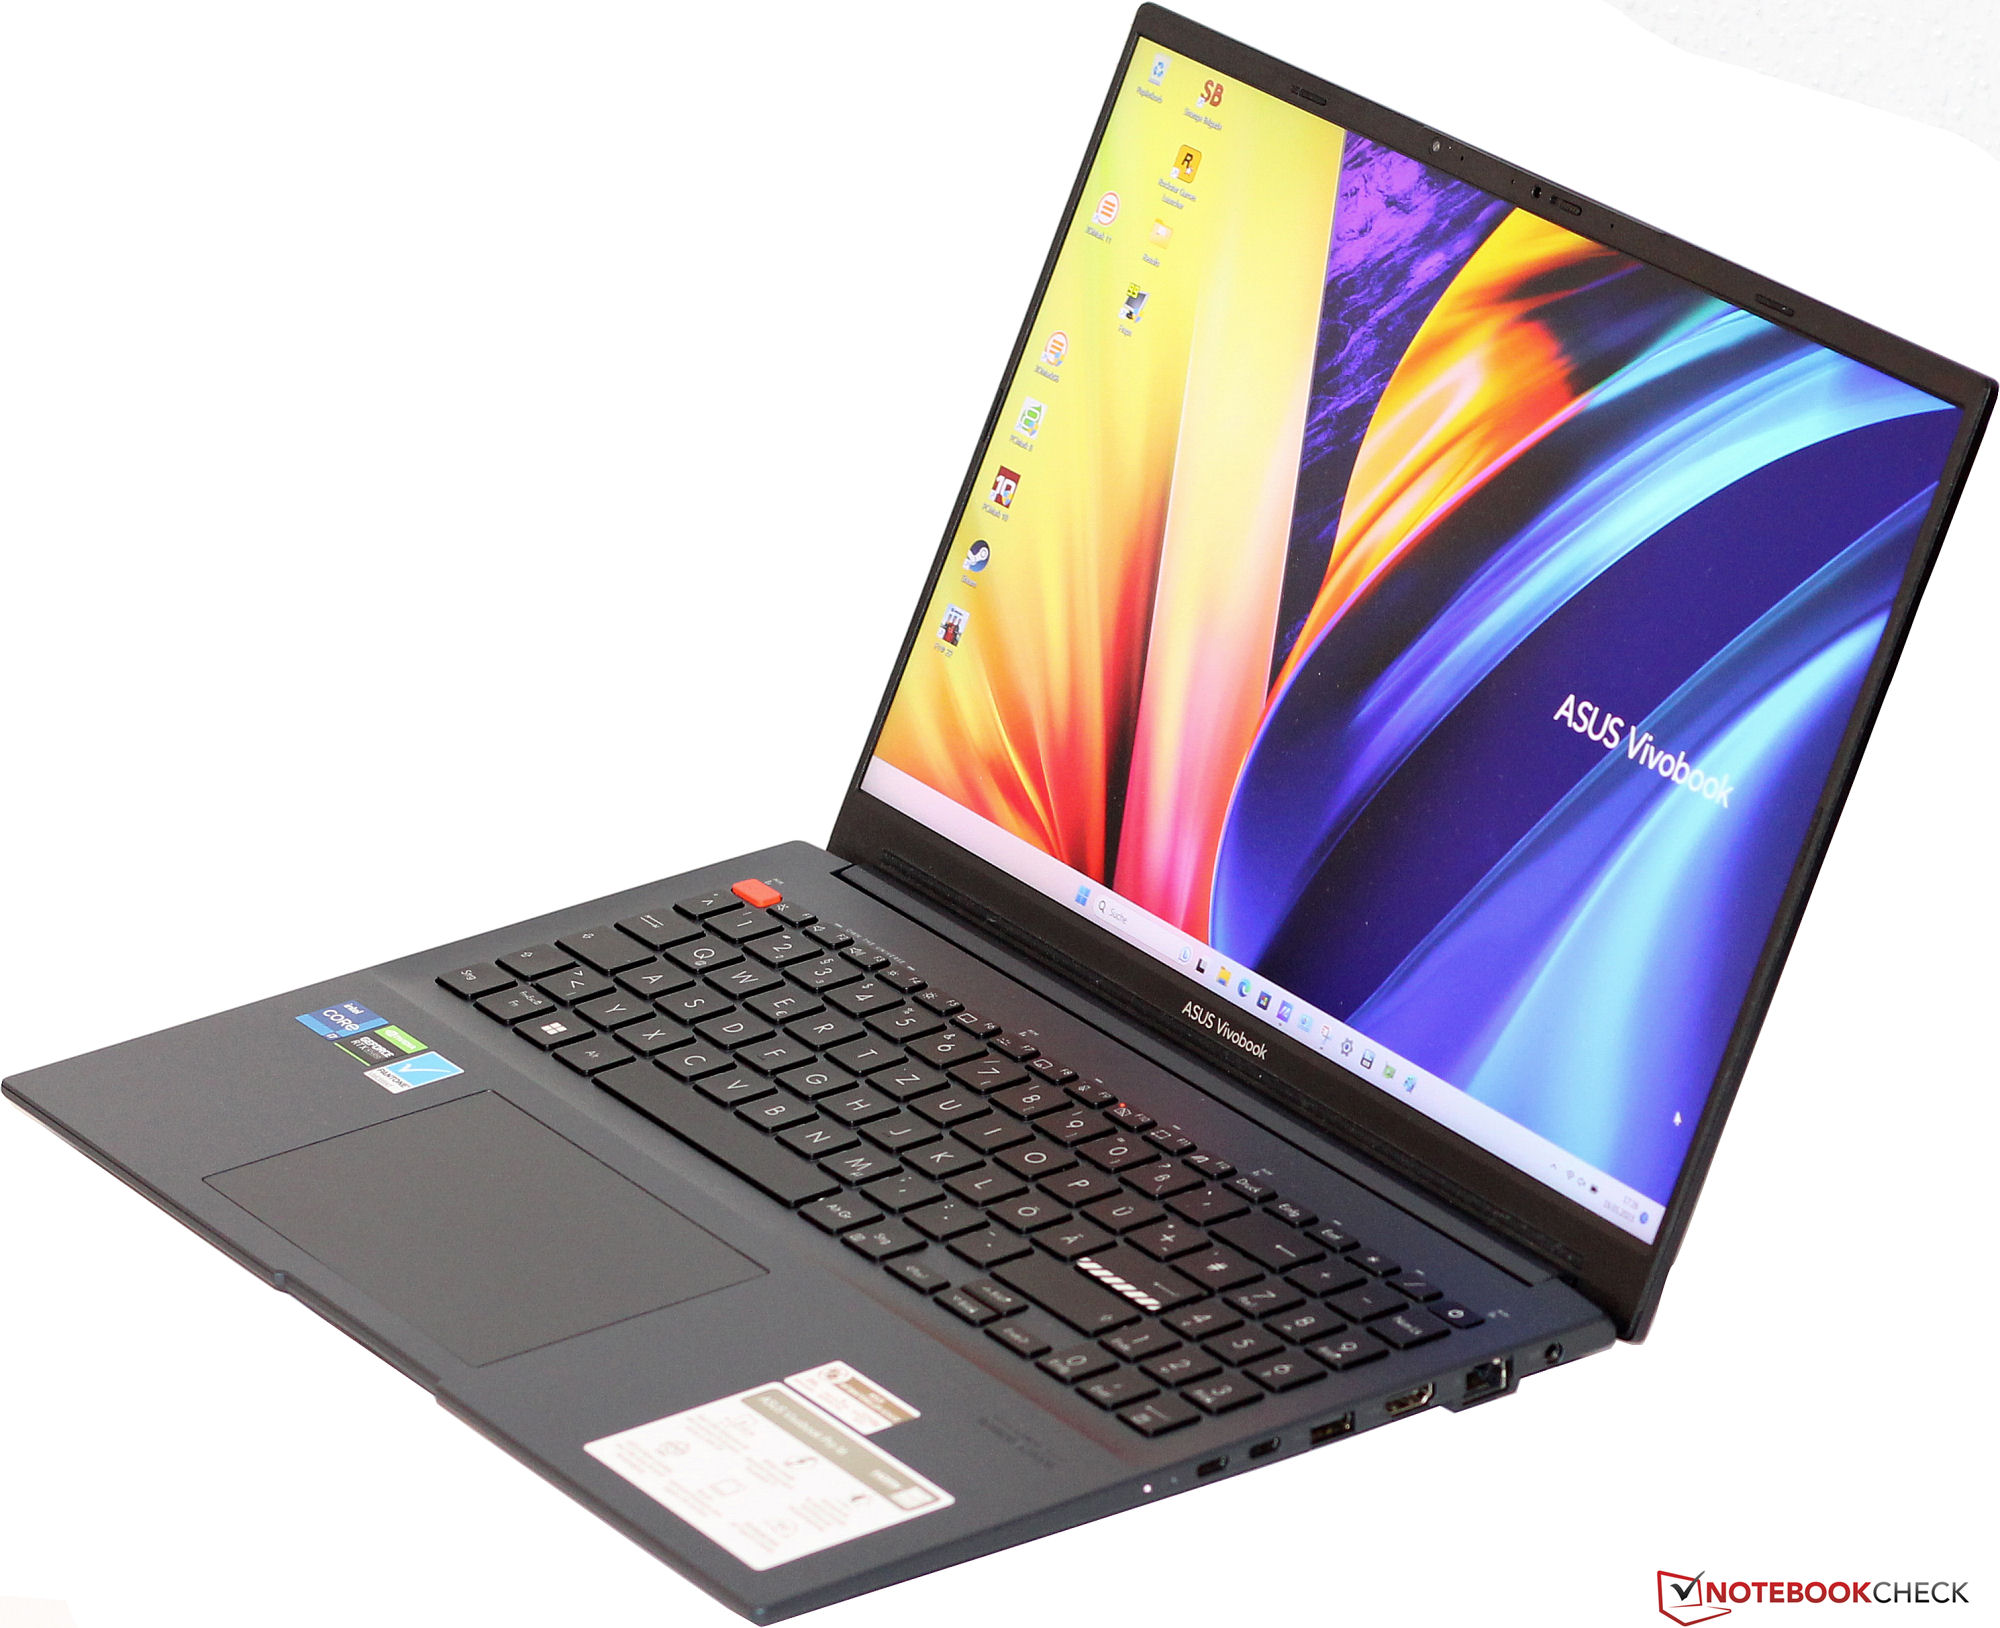
Case & features - The VivoBook with Thunderbolt 4
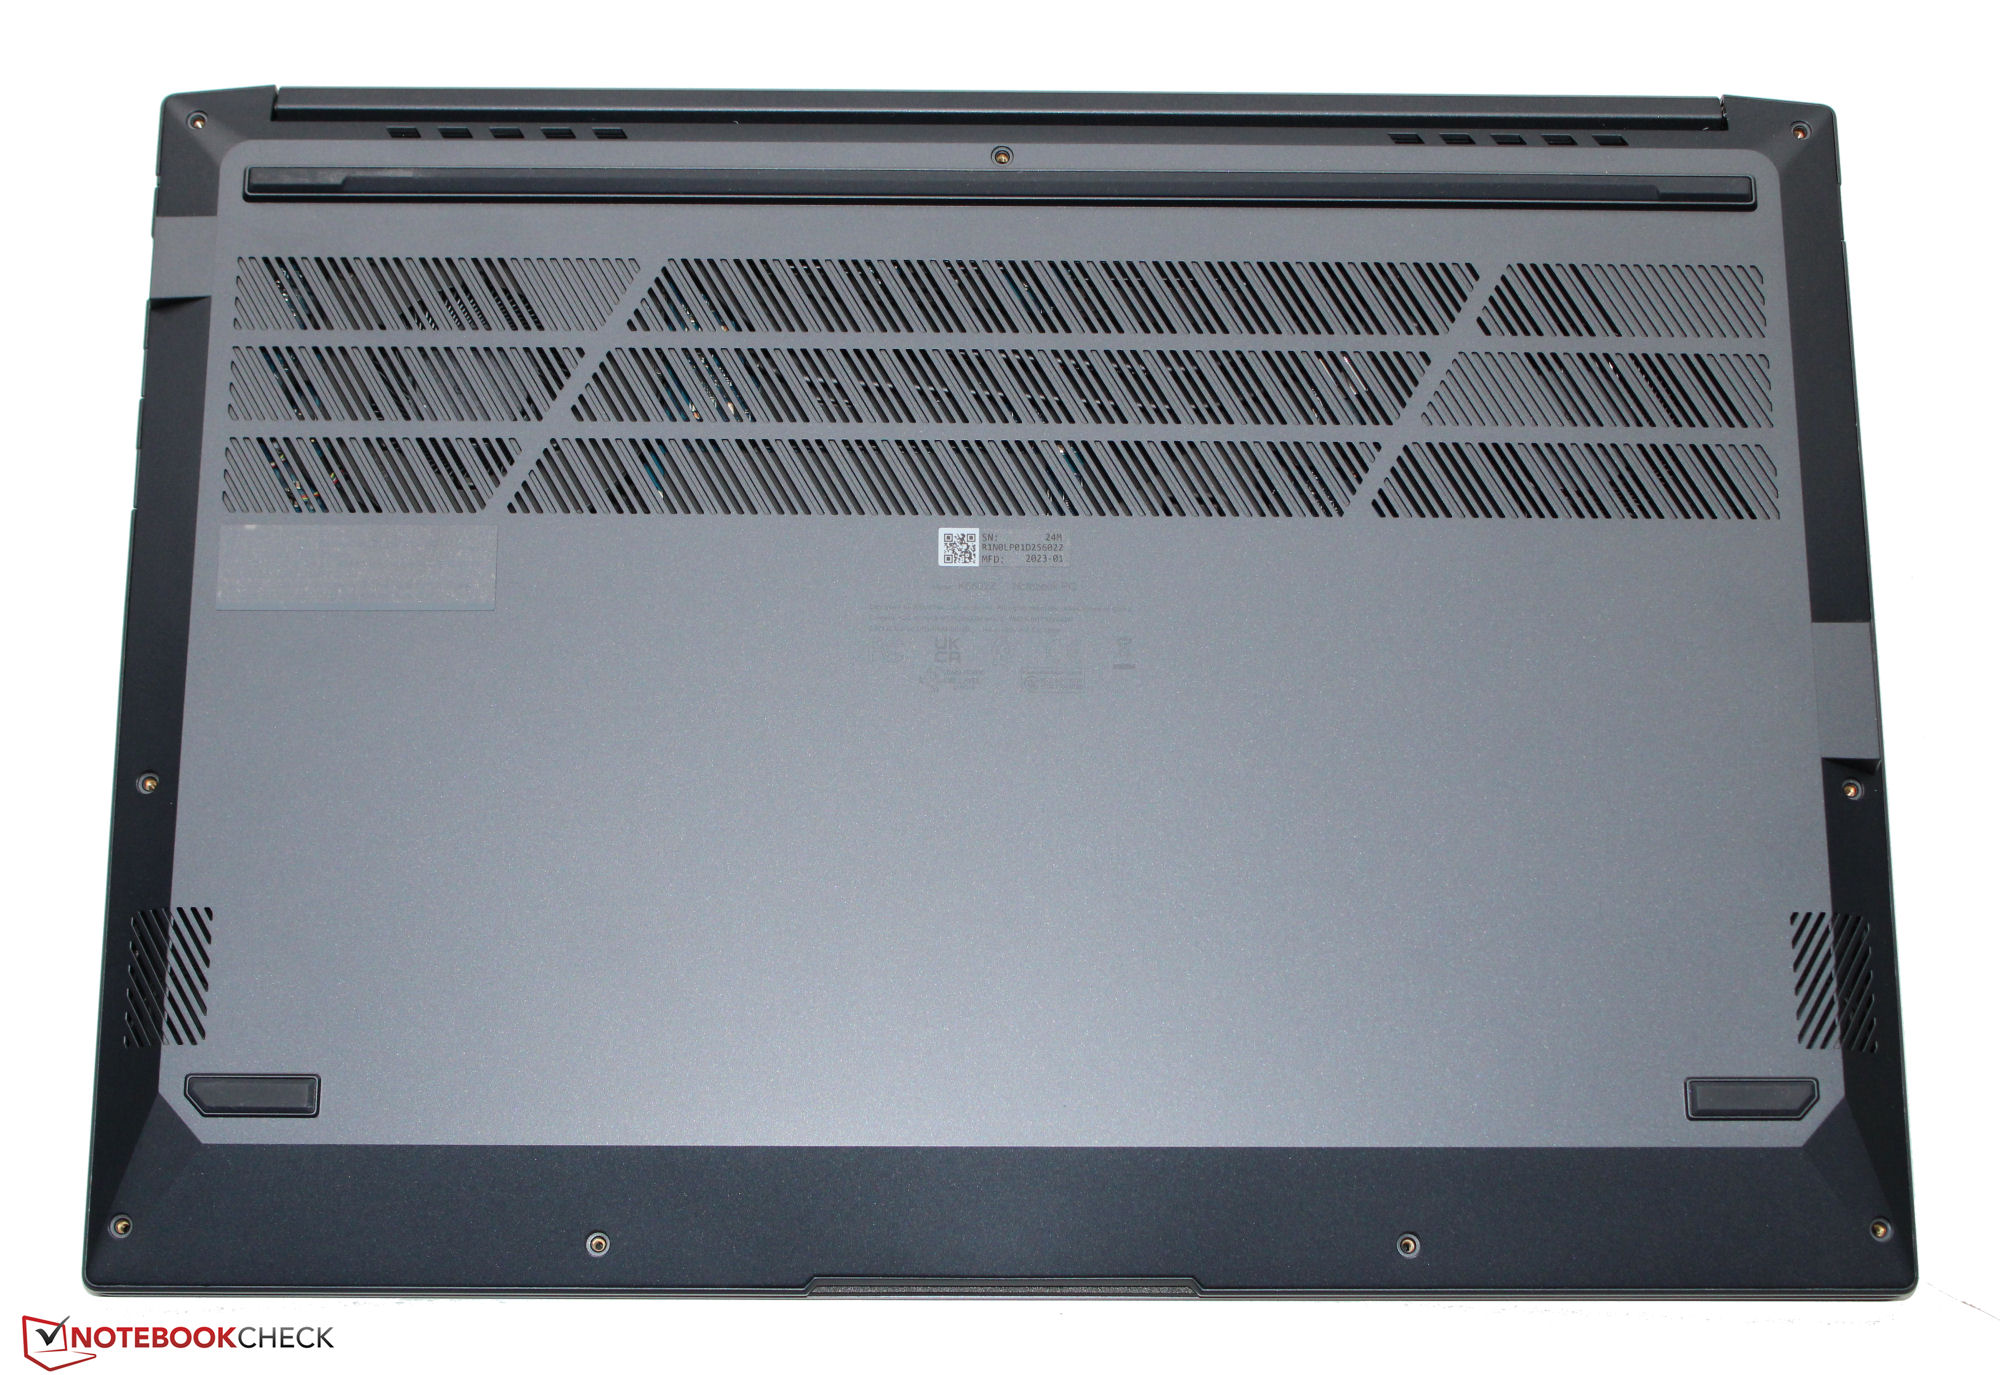
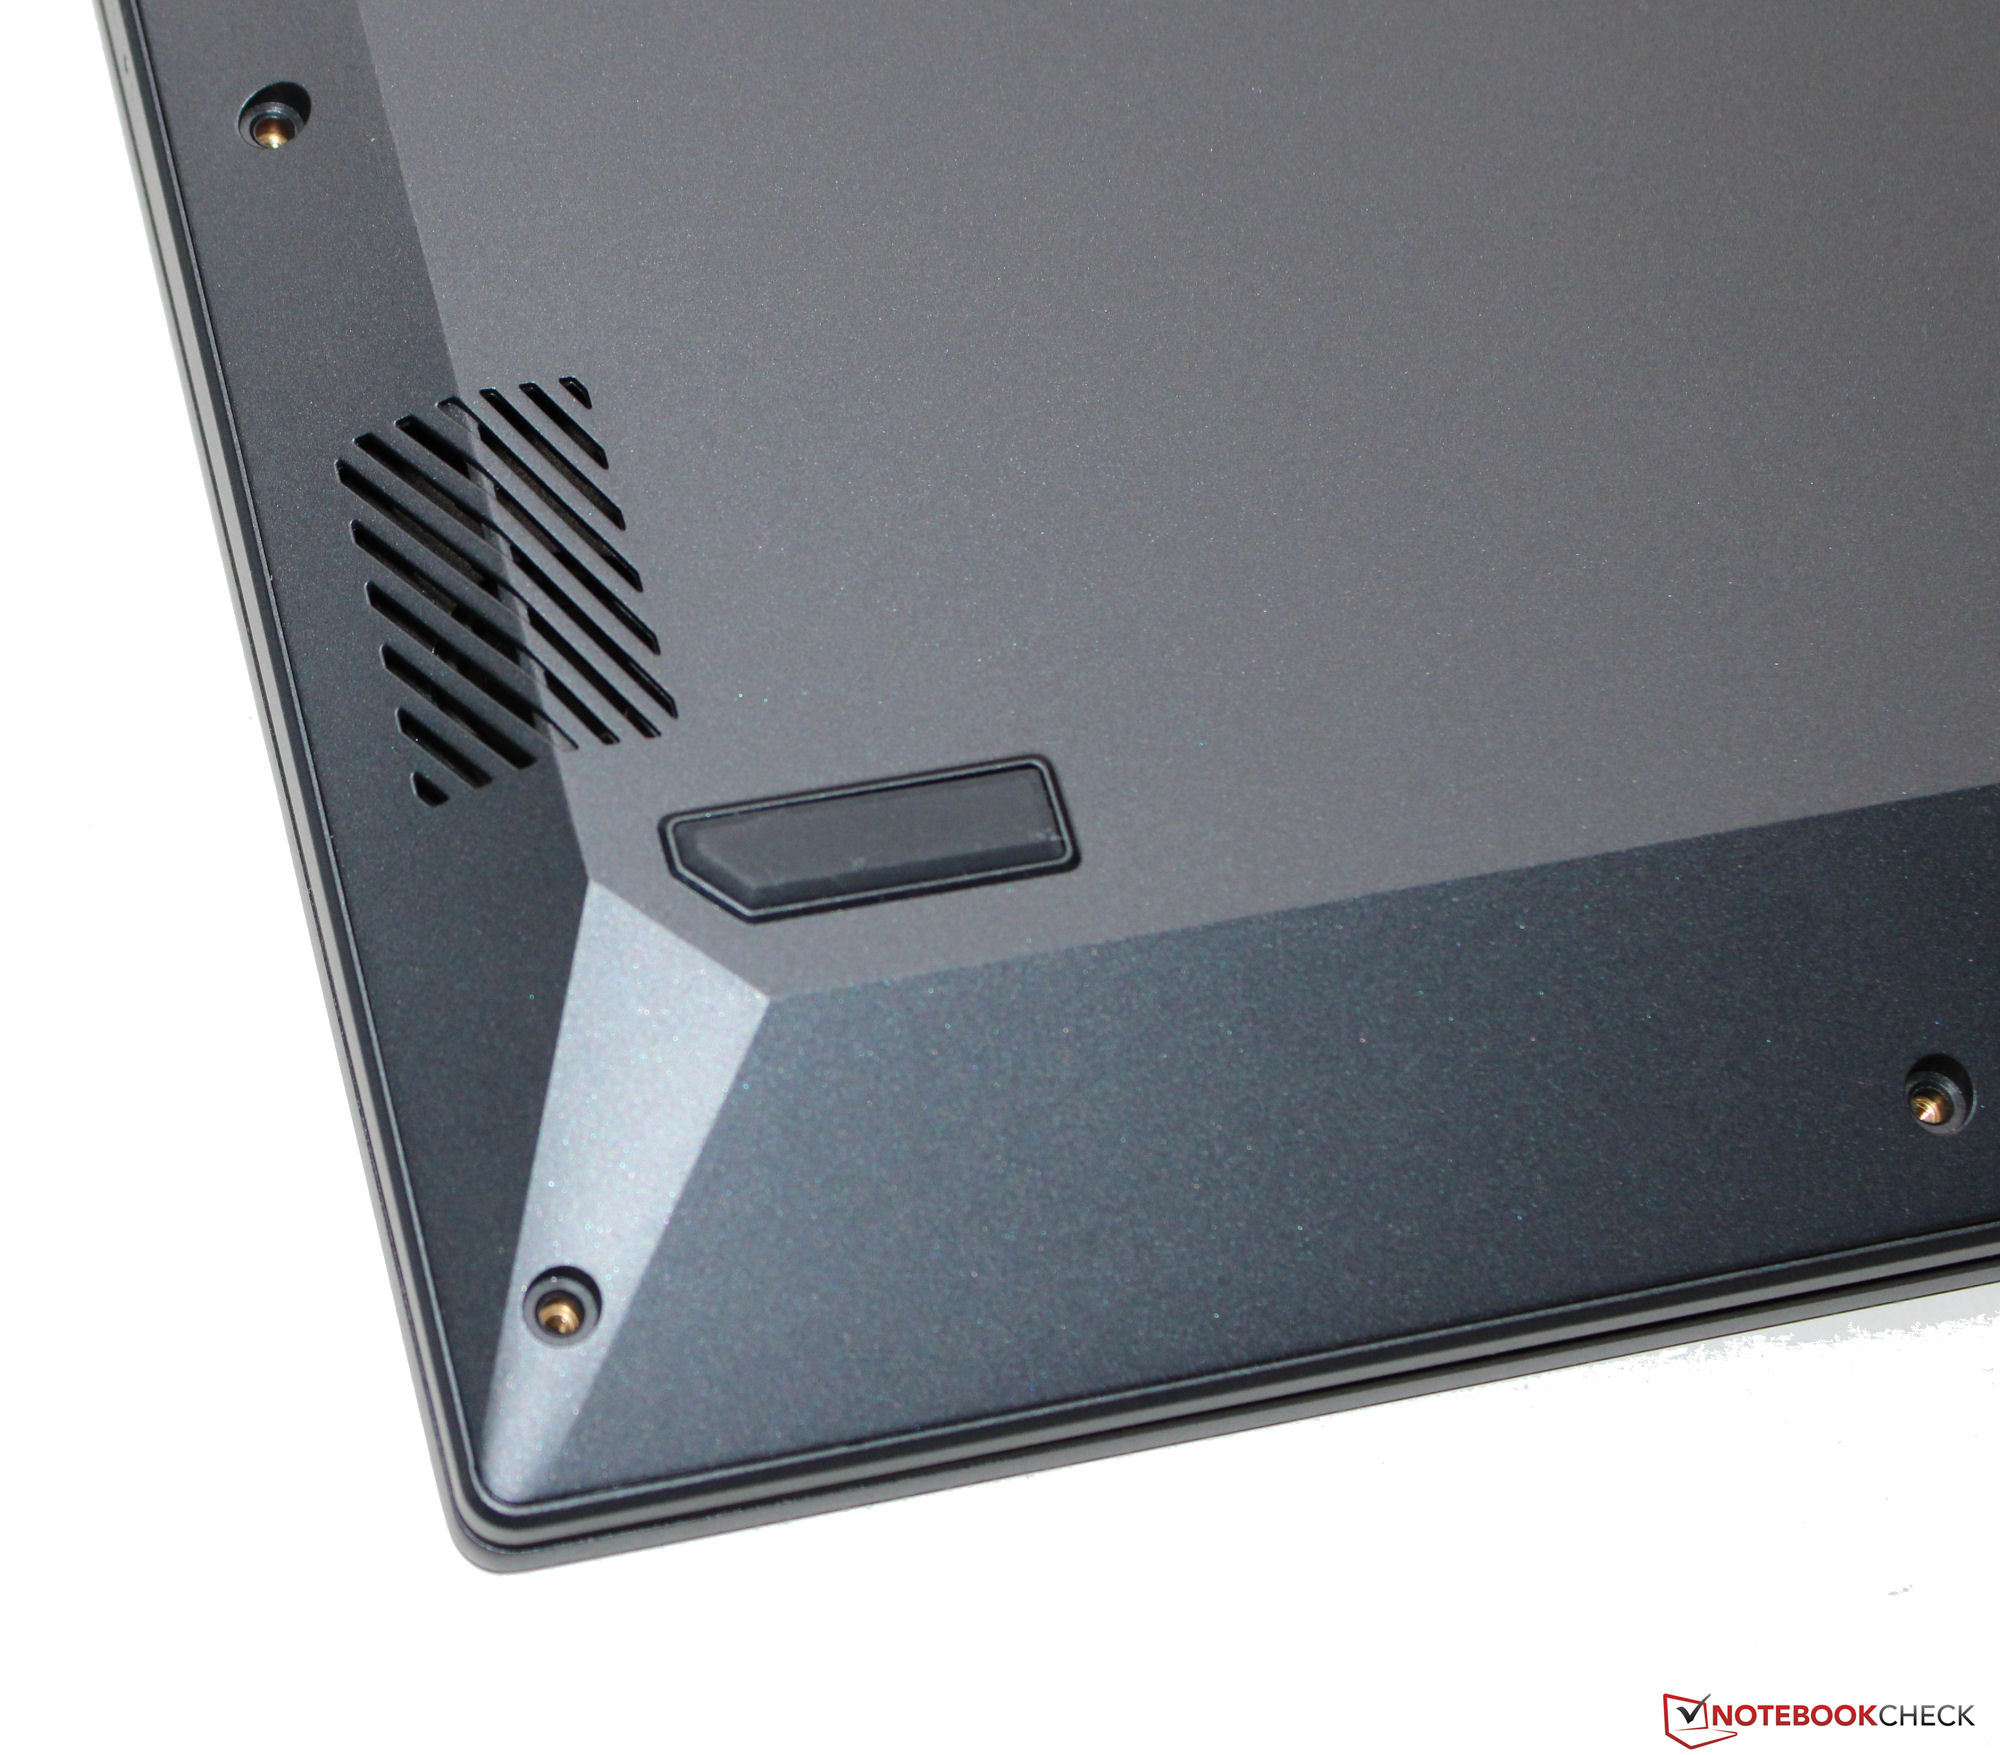
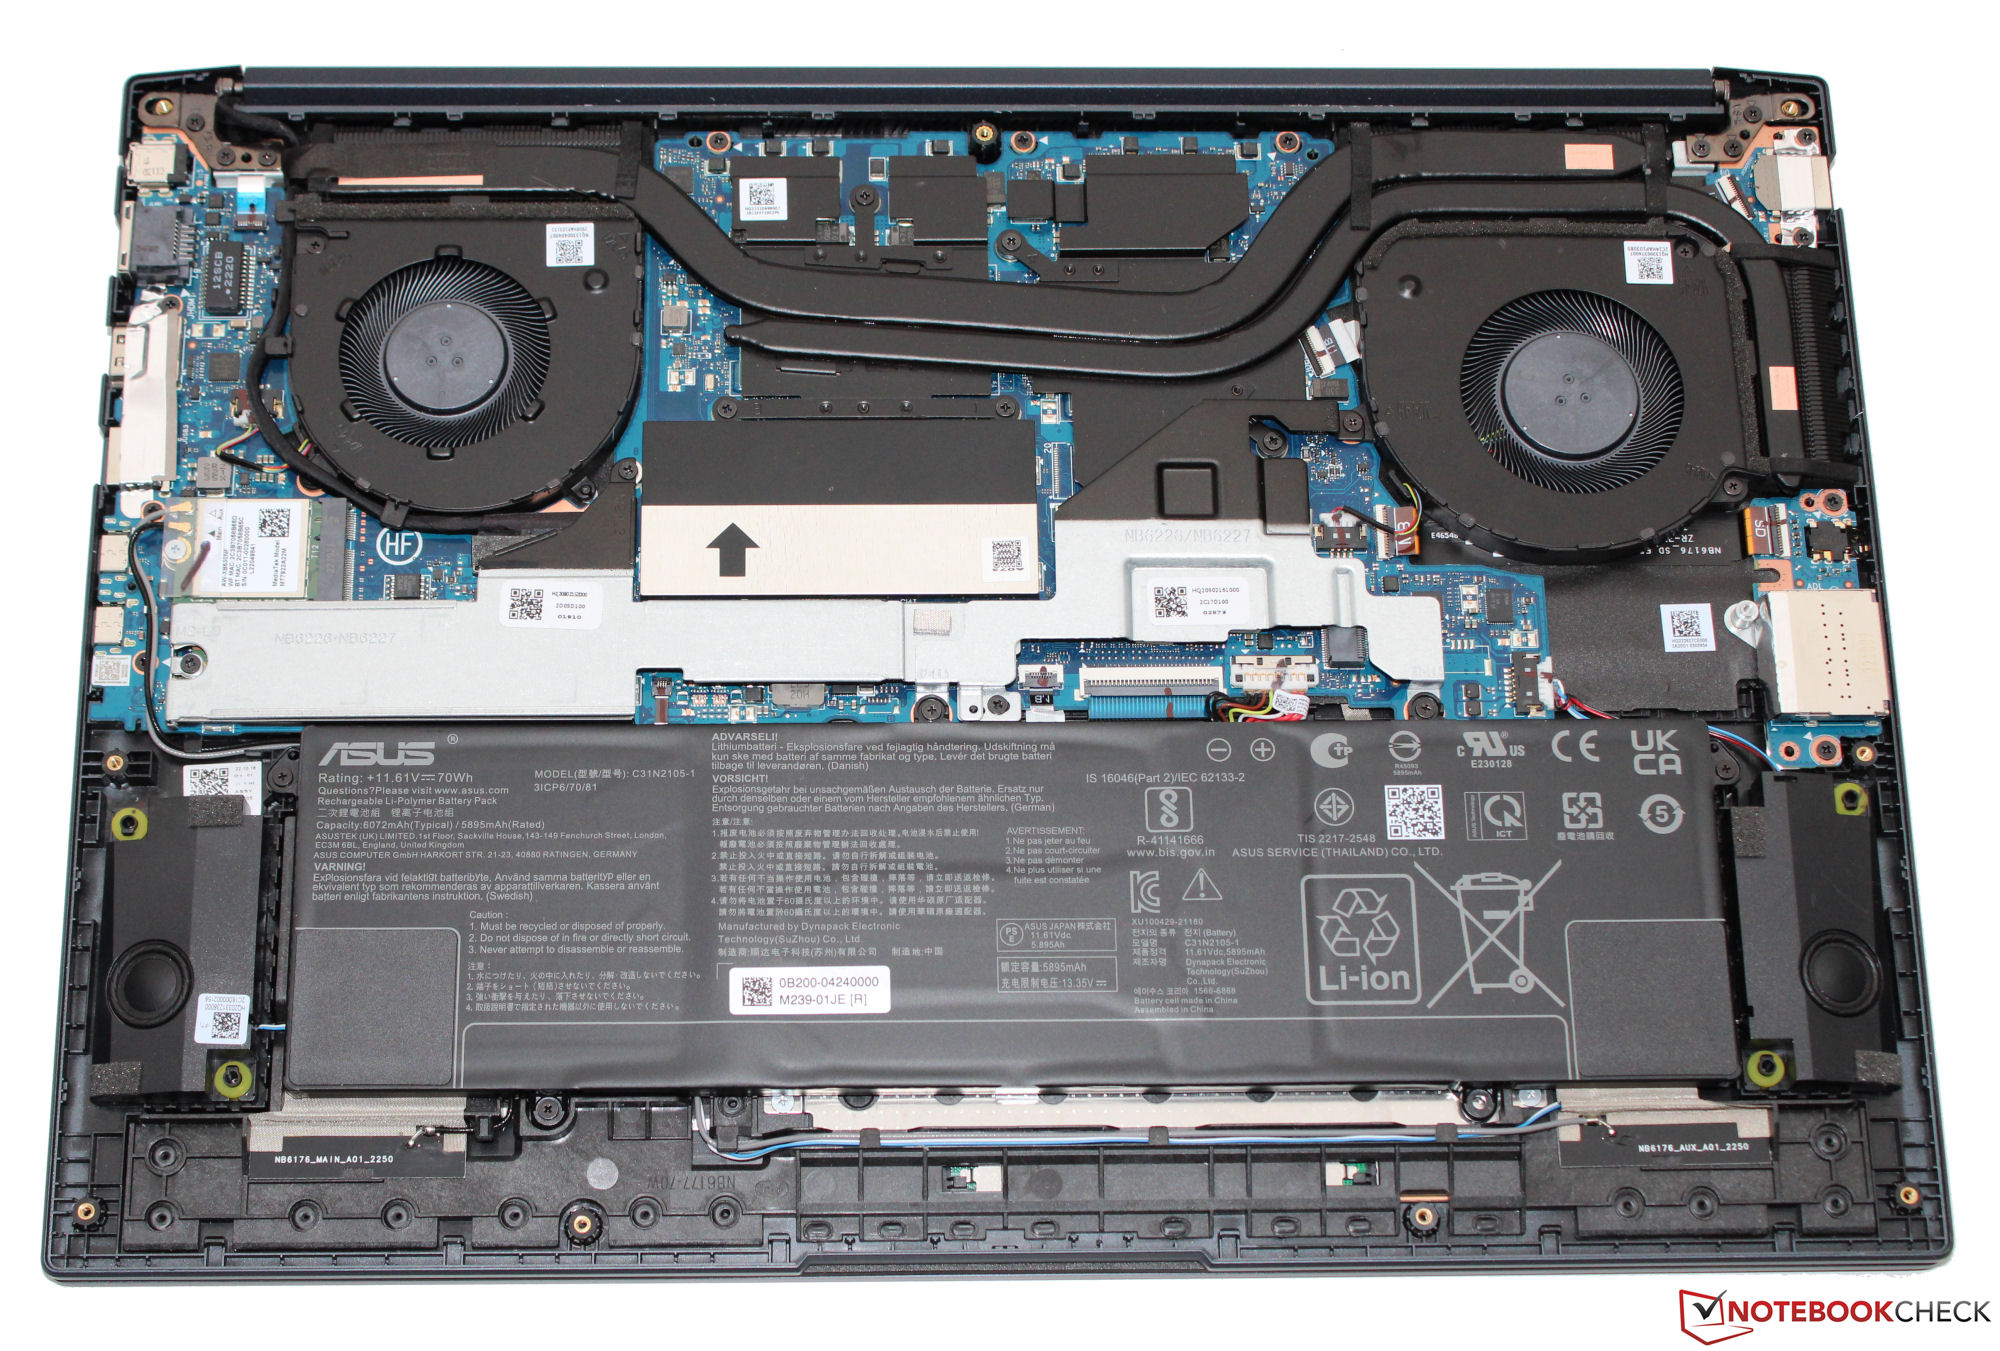
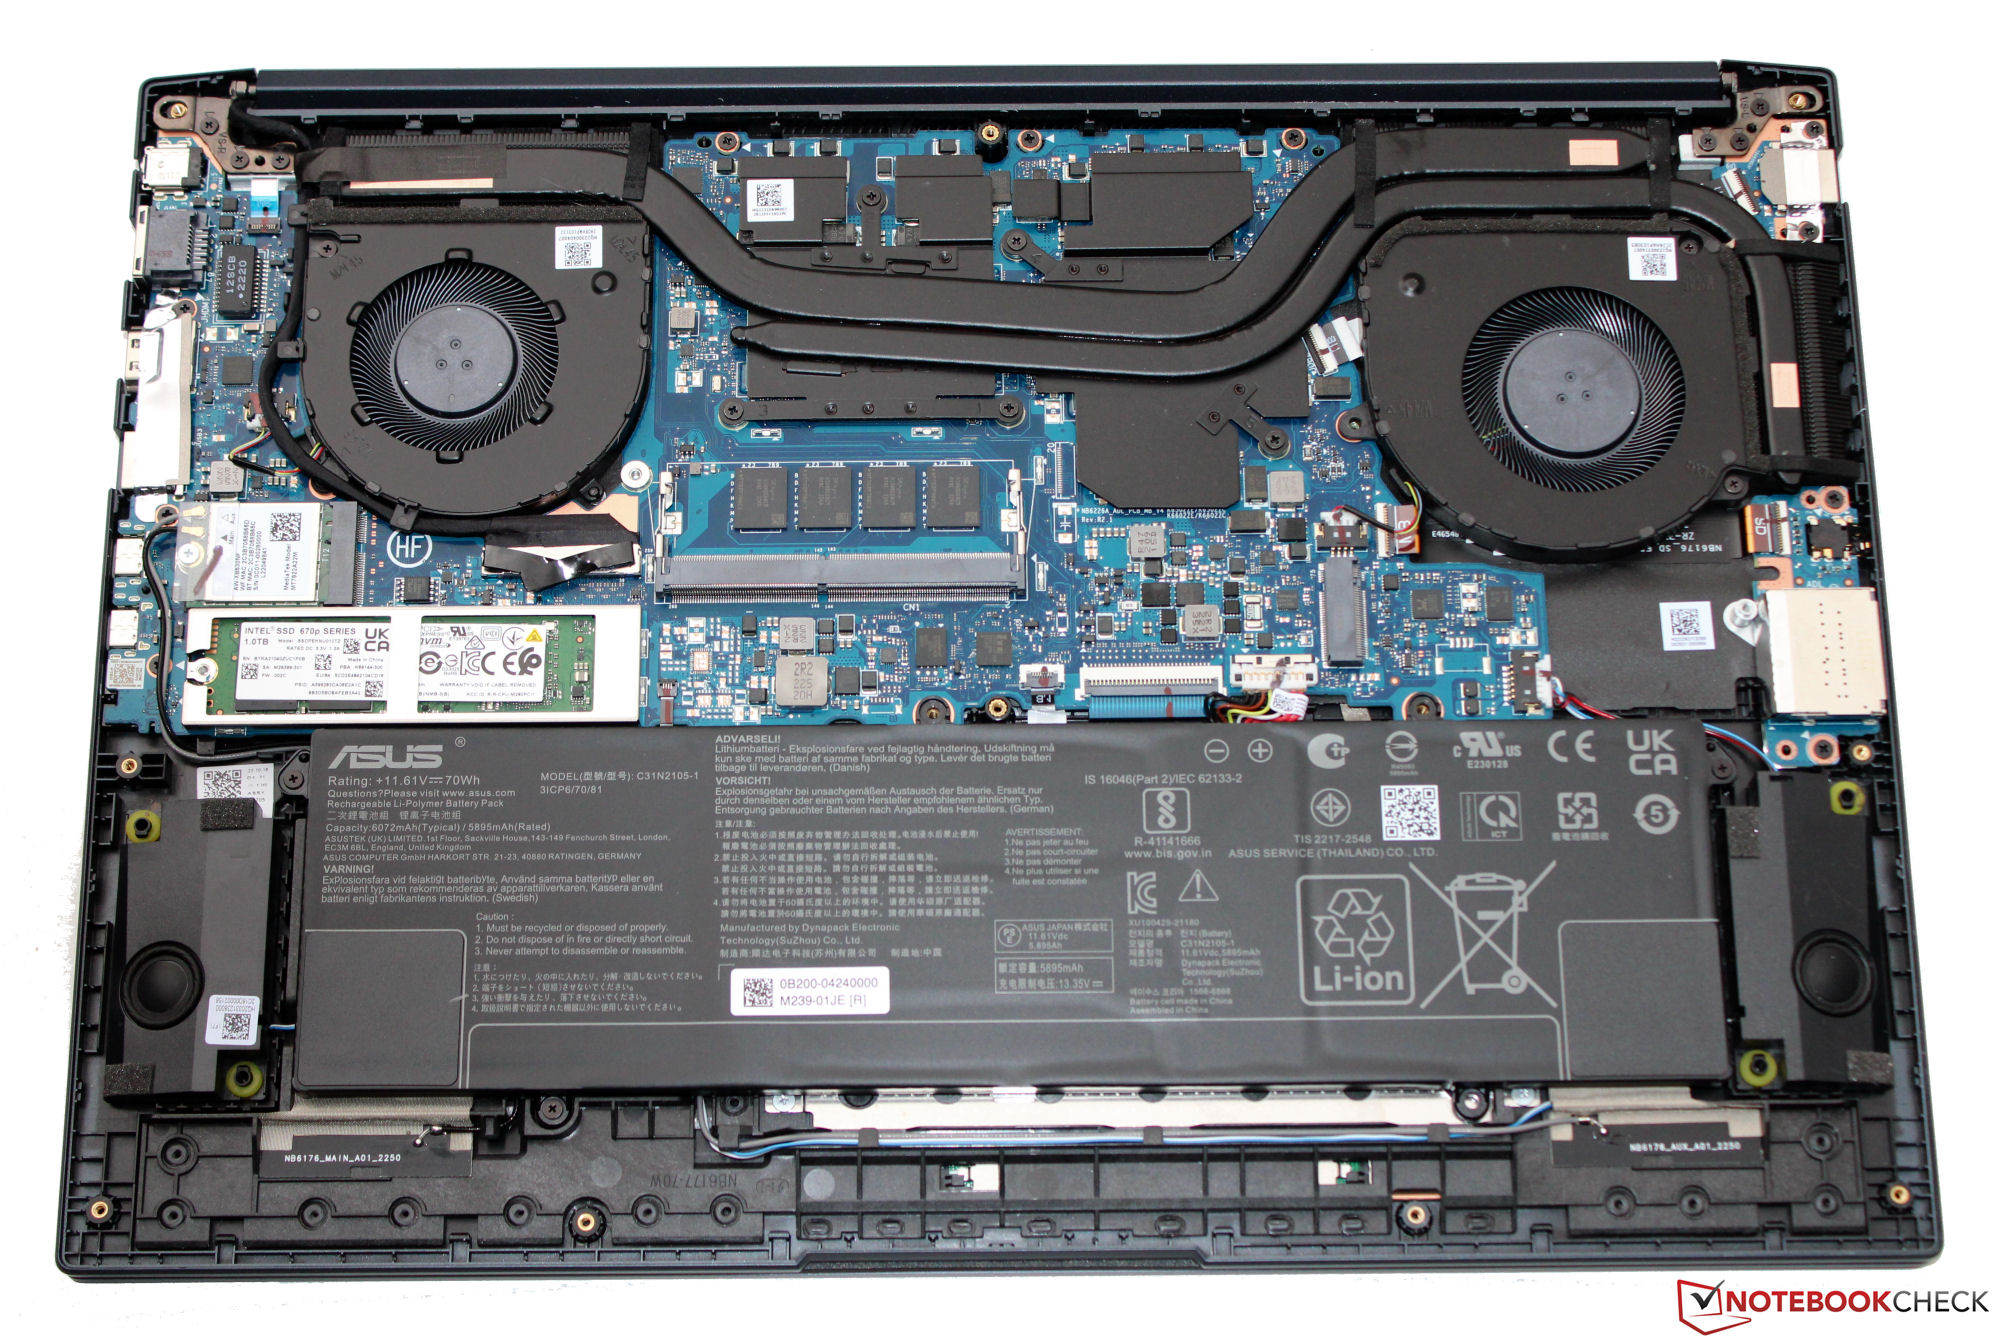
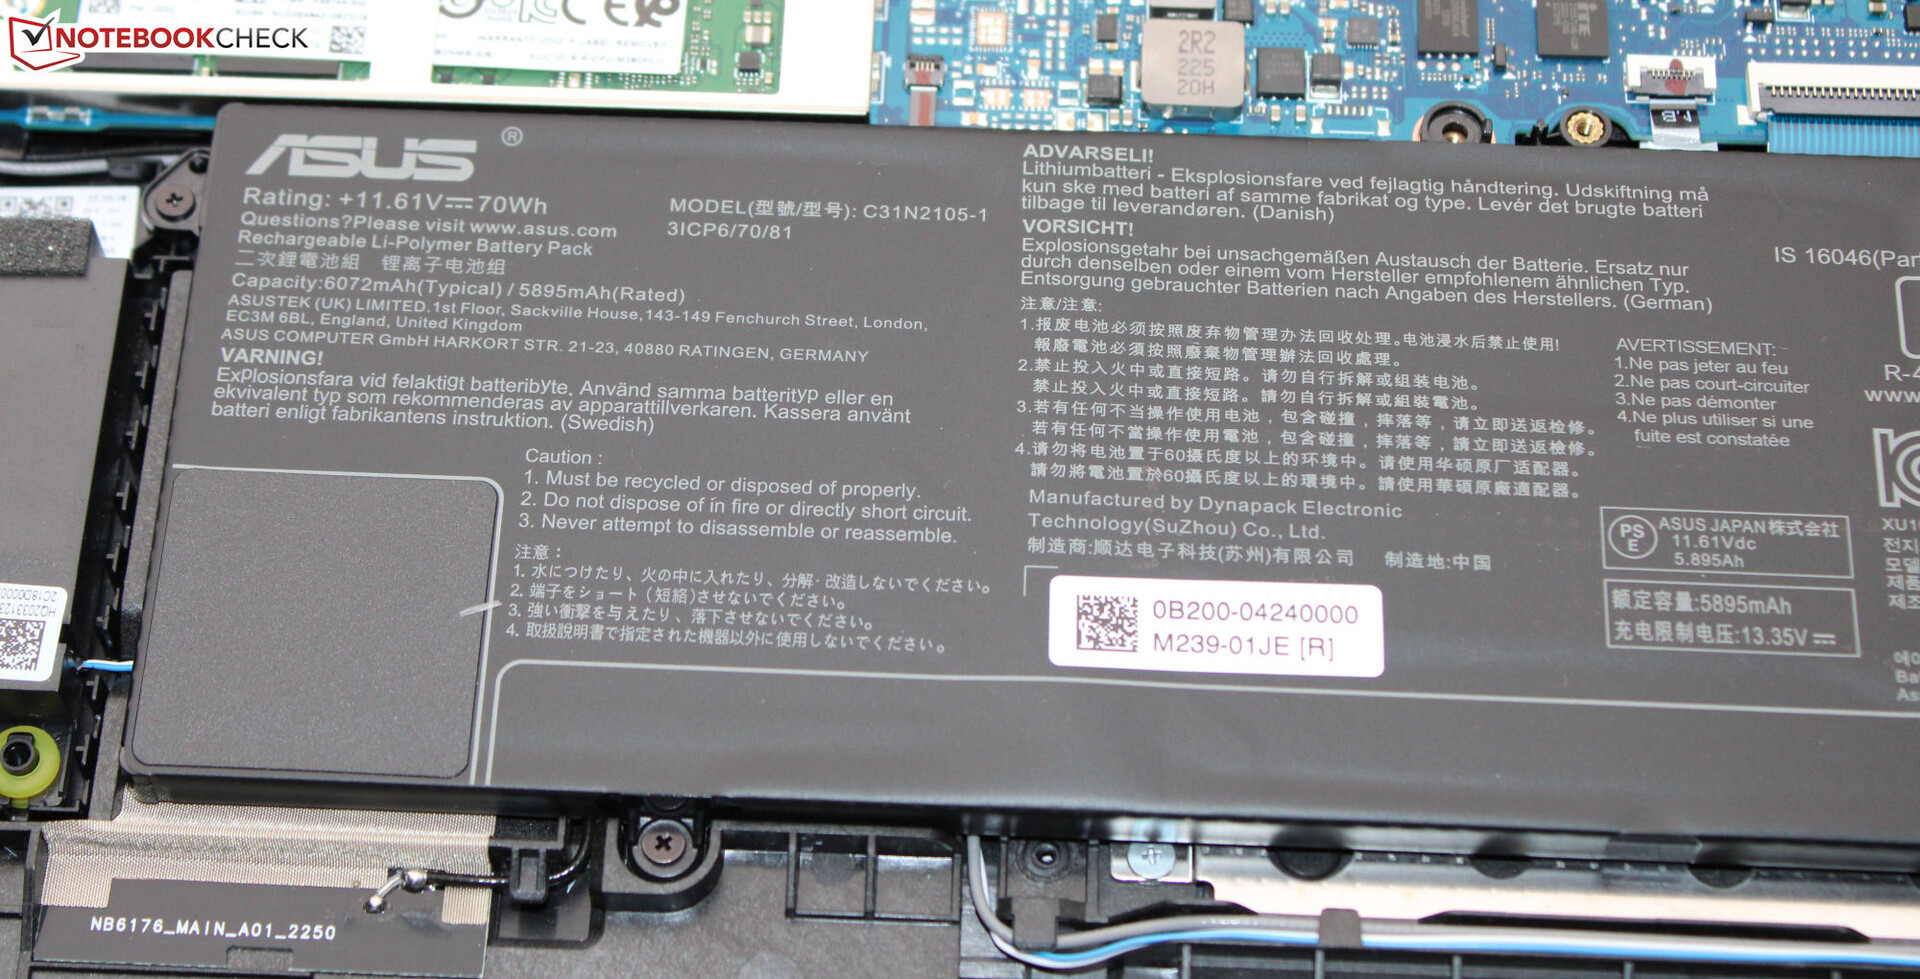
The VivoBook is dark blue (Quiet Blue) in color and has smooth, matte surfaces. Its base unit (plastic) and lid (aluminum back) can be twisted a little too easily. The maximum angle at which you can open the lid measures 180 degrees. The battery (screwed in, not glued on) as well as the rest of the laptop's innards can be accessed once you have removed the bottom of the case.
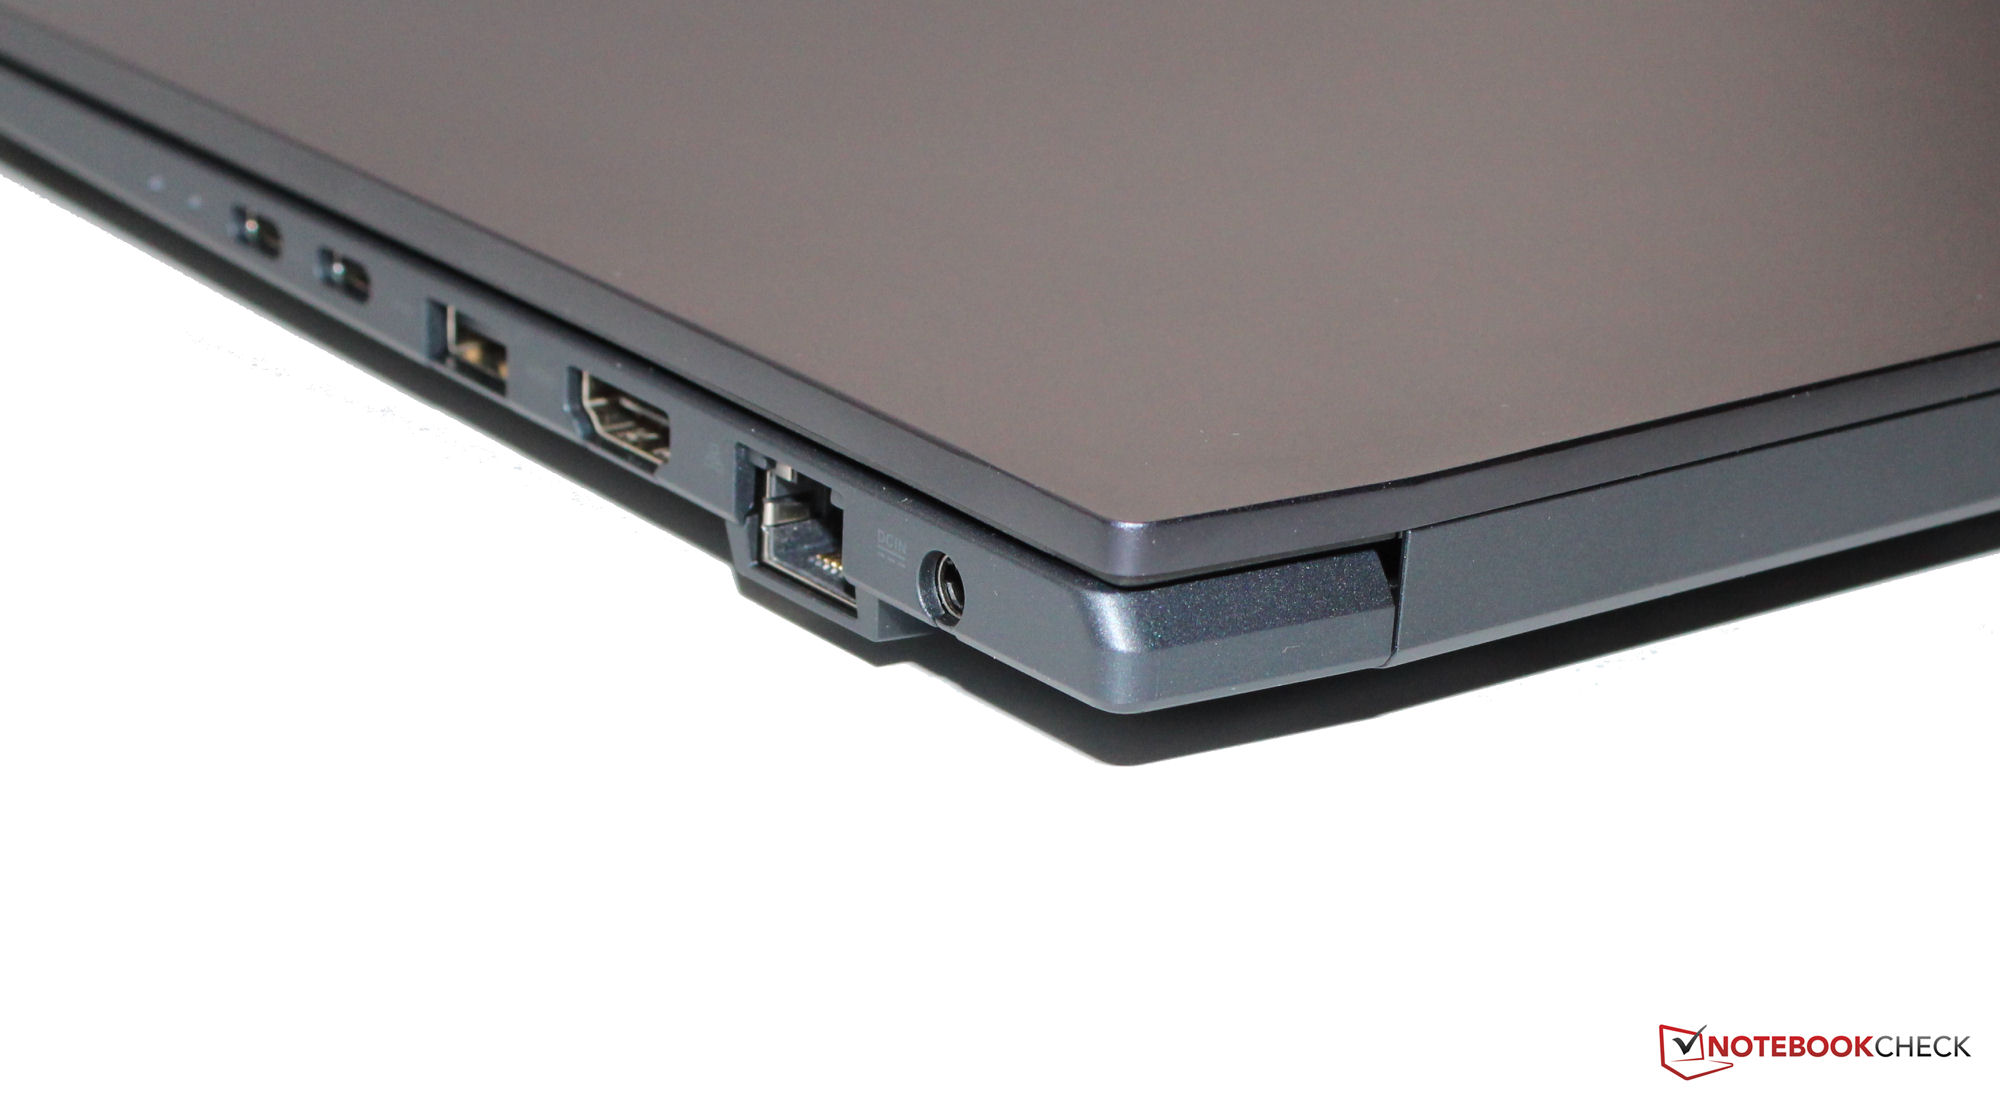
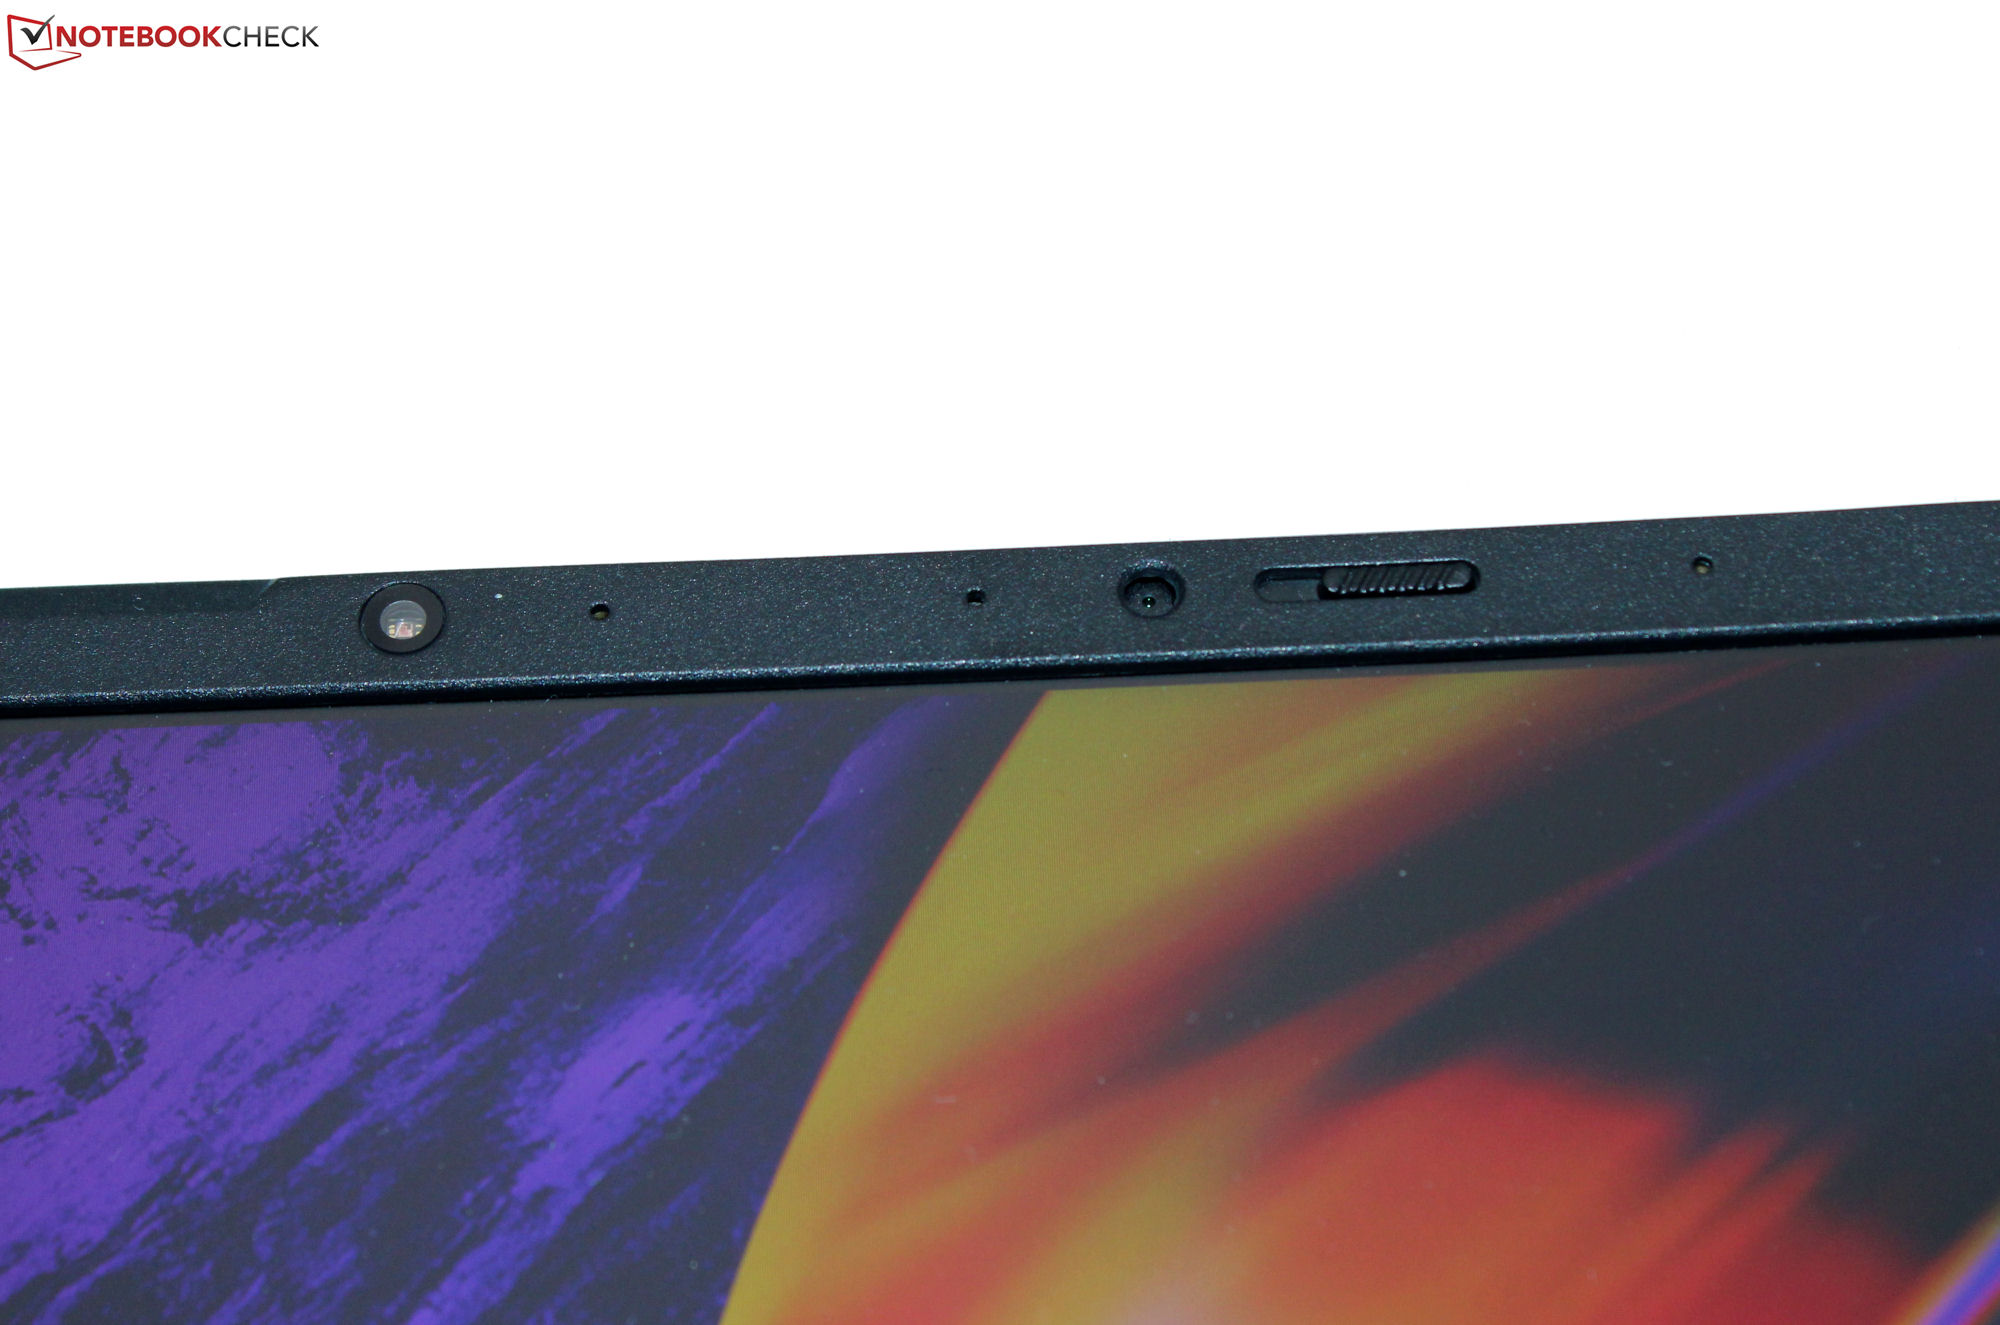
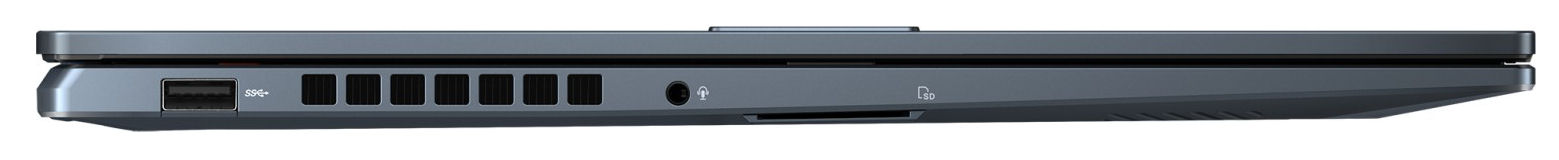
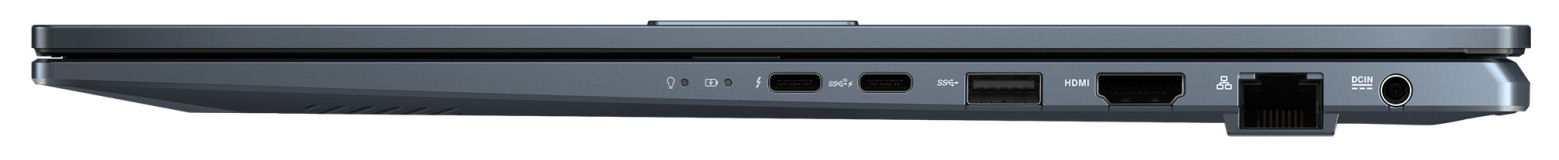
The device has two USB-A ports (USB 3.2 Gen 1) as well as two USB-C ports (1x Thunderbolt 4, 1x USB 3.2 Gen 2). The latter support power delivery and the TB4 port can also output a DisplayPort signal. In total, there are two video outputs (1x DP, 1x HDMI). The SD card reader (reference card: AV PRO microSD 128 GB V60) delivers about average speeds. A positive: The webcam (2.1 MP, max. 1,920 x 1,080 pixels) has a mechanical cover.
Under optimal conditions (no WiFi devices in close vicinity, short distance between laptop and server PC), you can achieve great WiFi data rates. The laptop uses a WiFi 6E chip (Mediatek MT7922). Wired connections are taken care of by a Realtek chip (RTL 816878111; 1 GBit/s).
| SD Card Reader | |
| average JPG Copy Test (av. of 3 runs) | |
| Average of class Multimedia (22.2 - 531, n=44, last 2 years) | |
| Schenker XMG Fusion 15 (Mid 22) (AV PRO microSD 128 GB V60) | |
| Asus VivoBook Pro 16 (AV Pro SD microSD 128 GB V60) | |
| Dell Inspiron 16 Plus 7620 (Toshiba Exceria Pro SDXC 64 GB UHS-II) | |
| maximum AS SSD Seq Read Test (1GB) | |
| Average of class Multimedia (27.9 - 1455, n=43, last 2 years) | |
| Asus VivoBook Pro 16 (AV Pro SD microSD 128 GB V60) | |
| Dell Inspiron 16 Plus 7620 (Toshiba Exceria Pro SDXC 64 GB UHS-II) | |


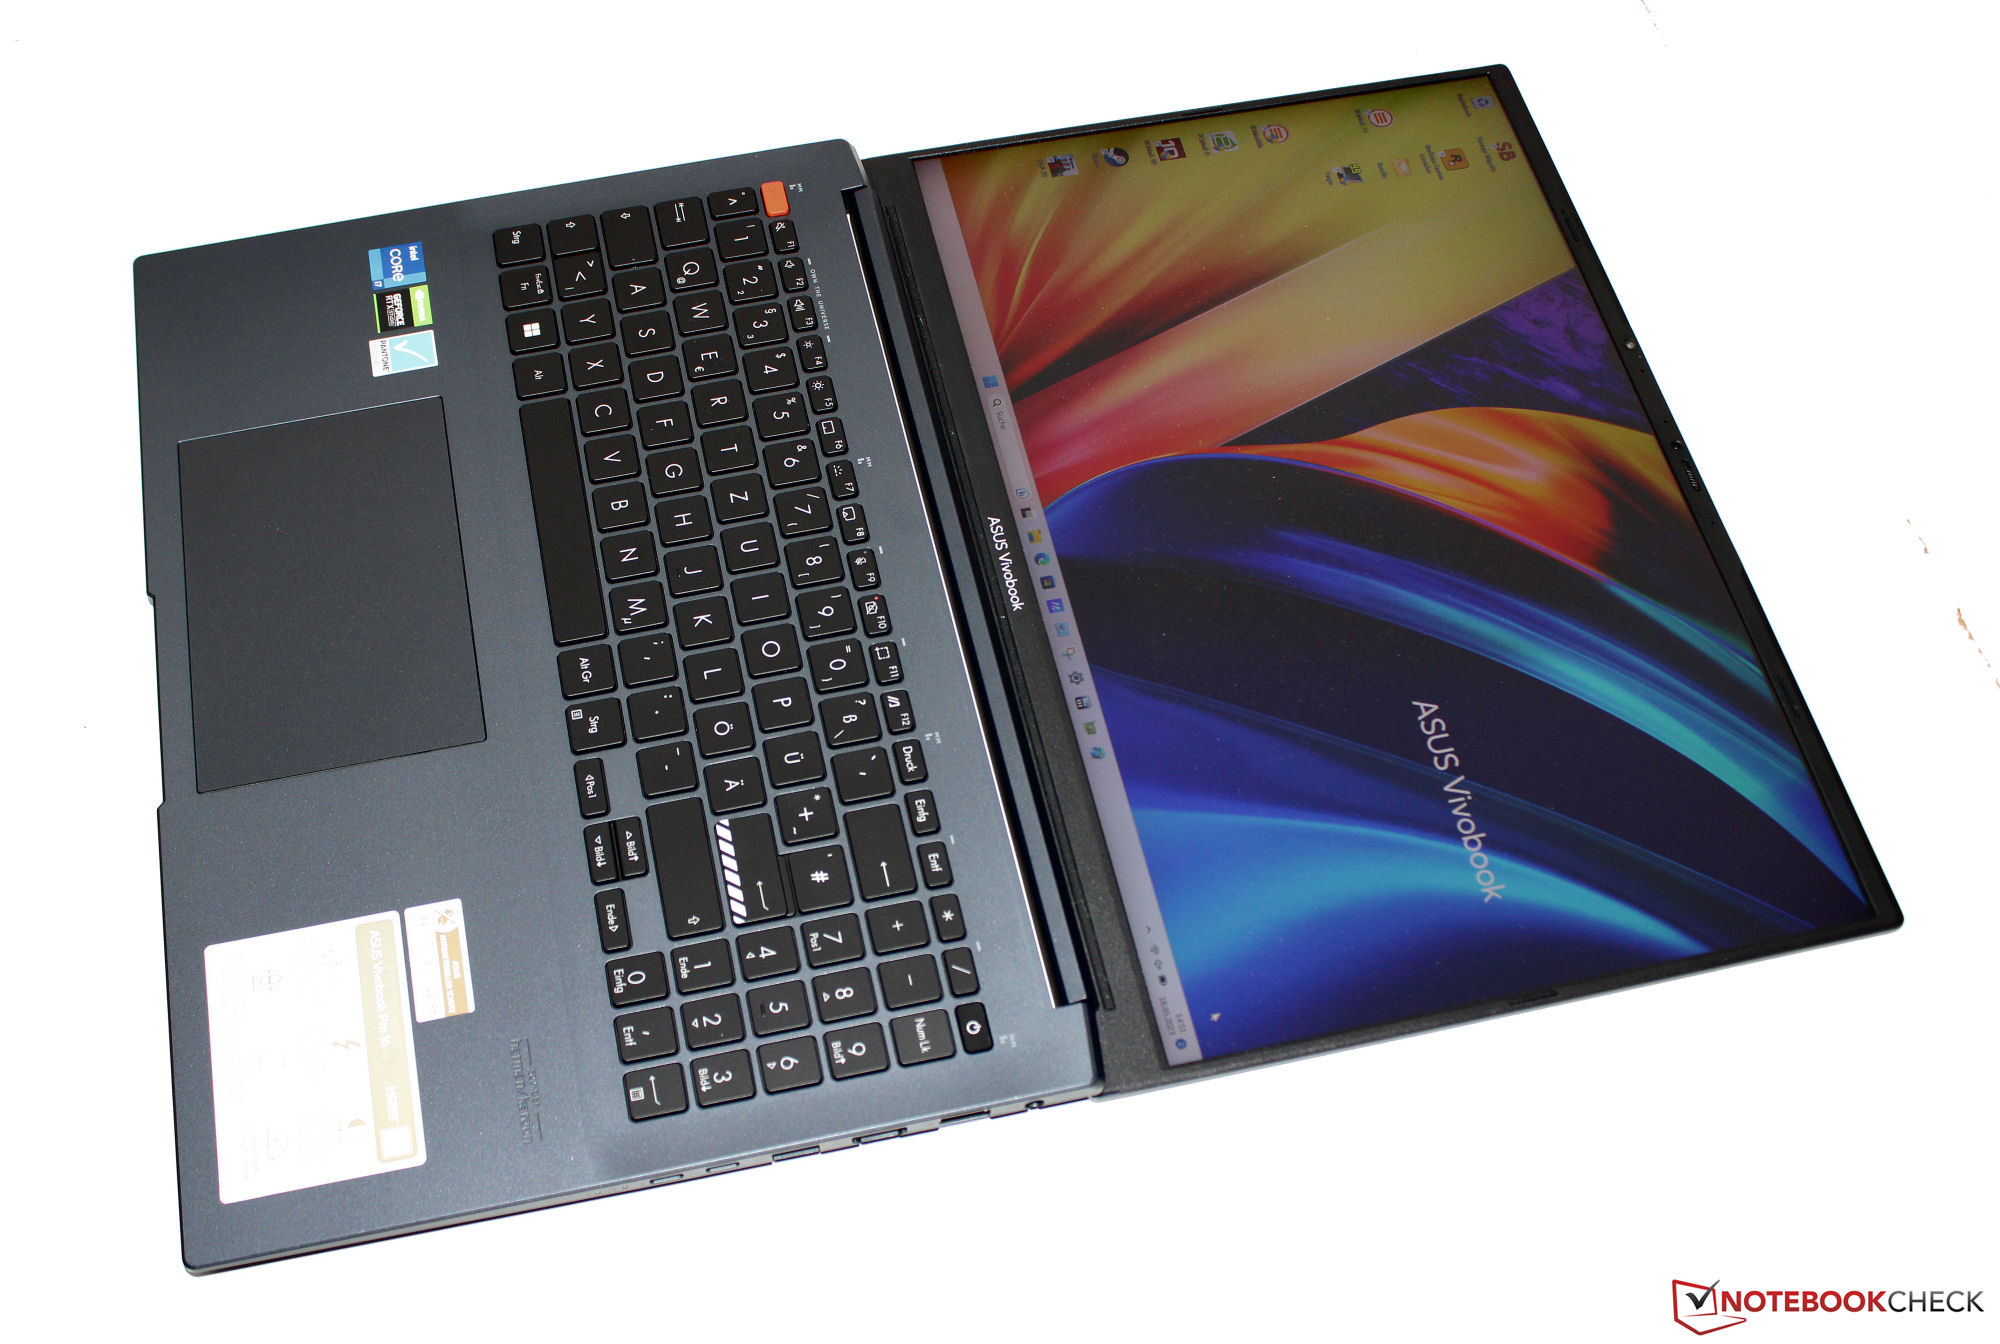
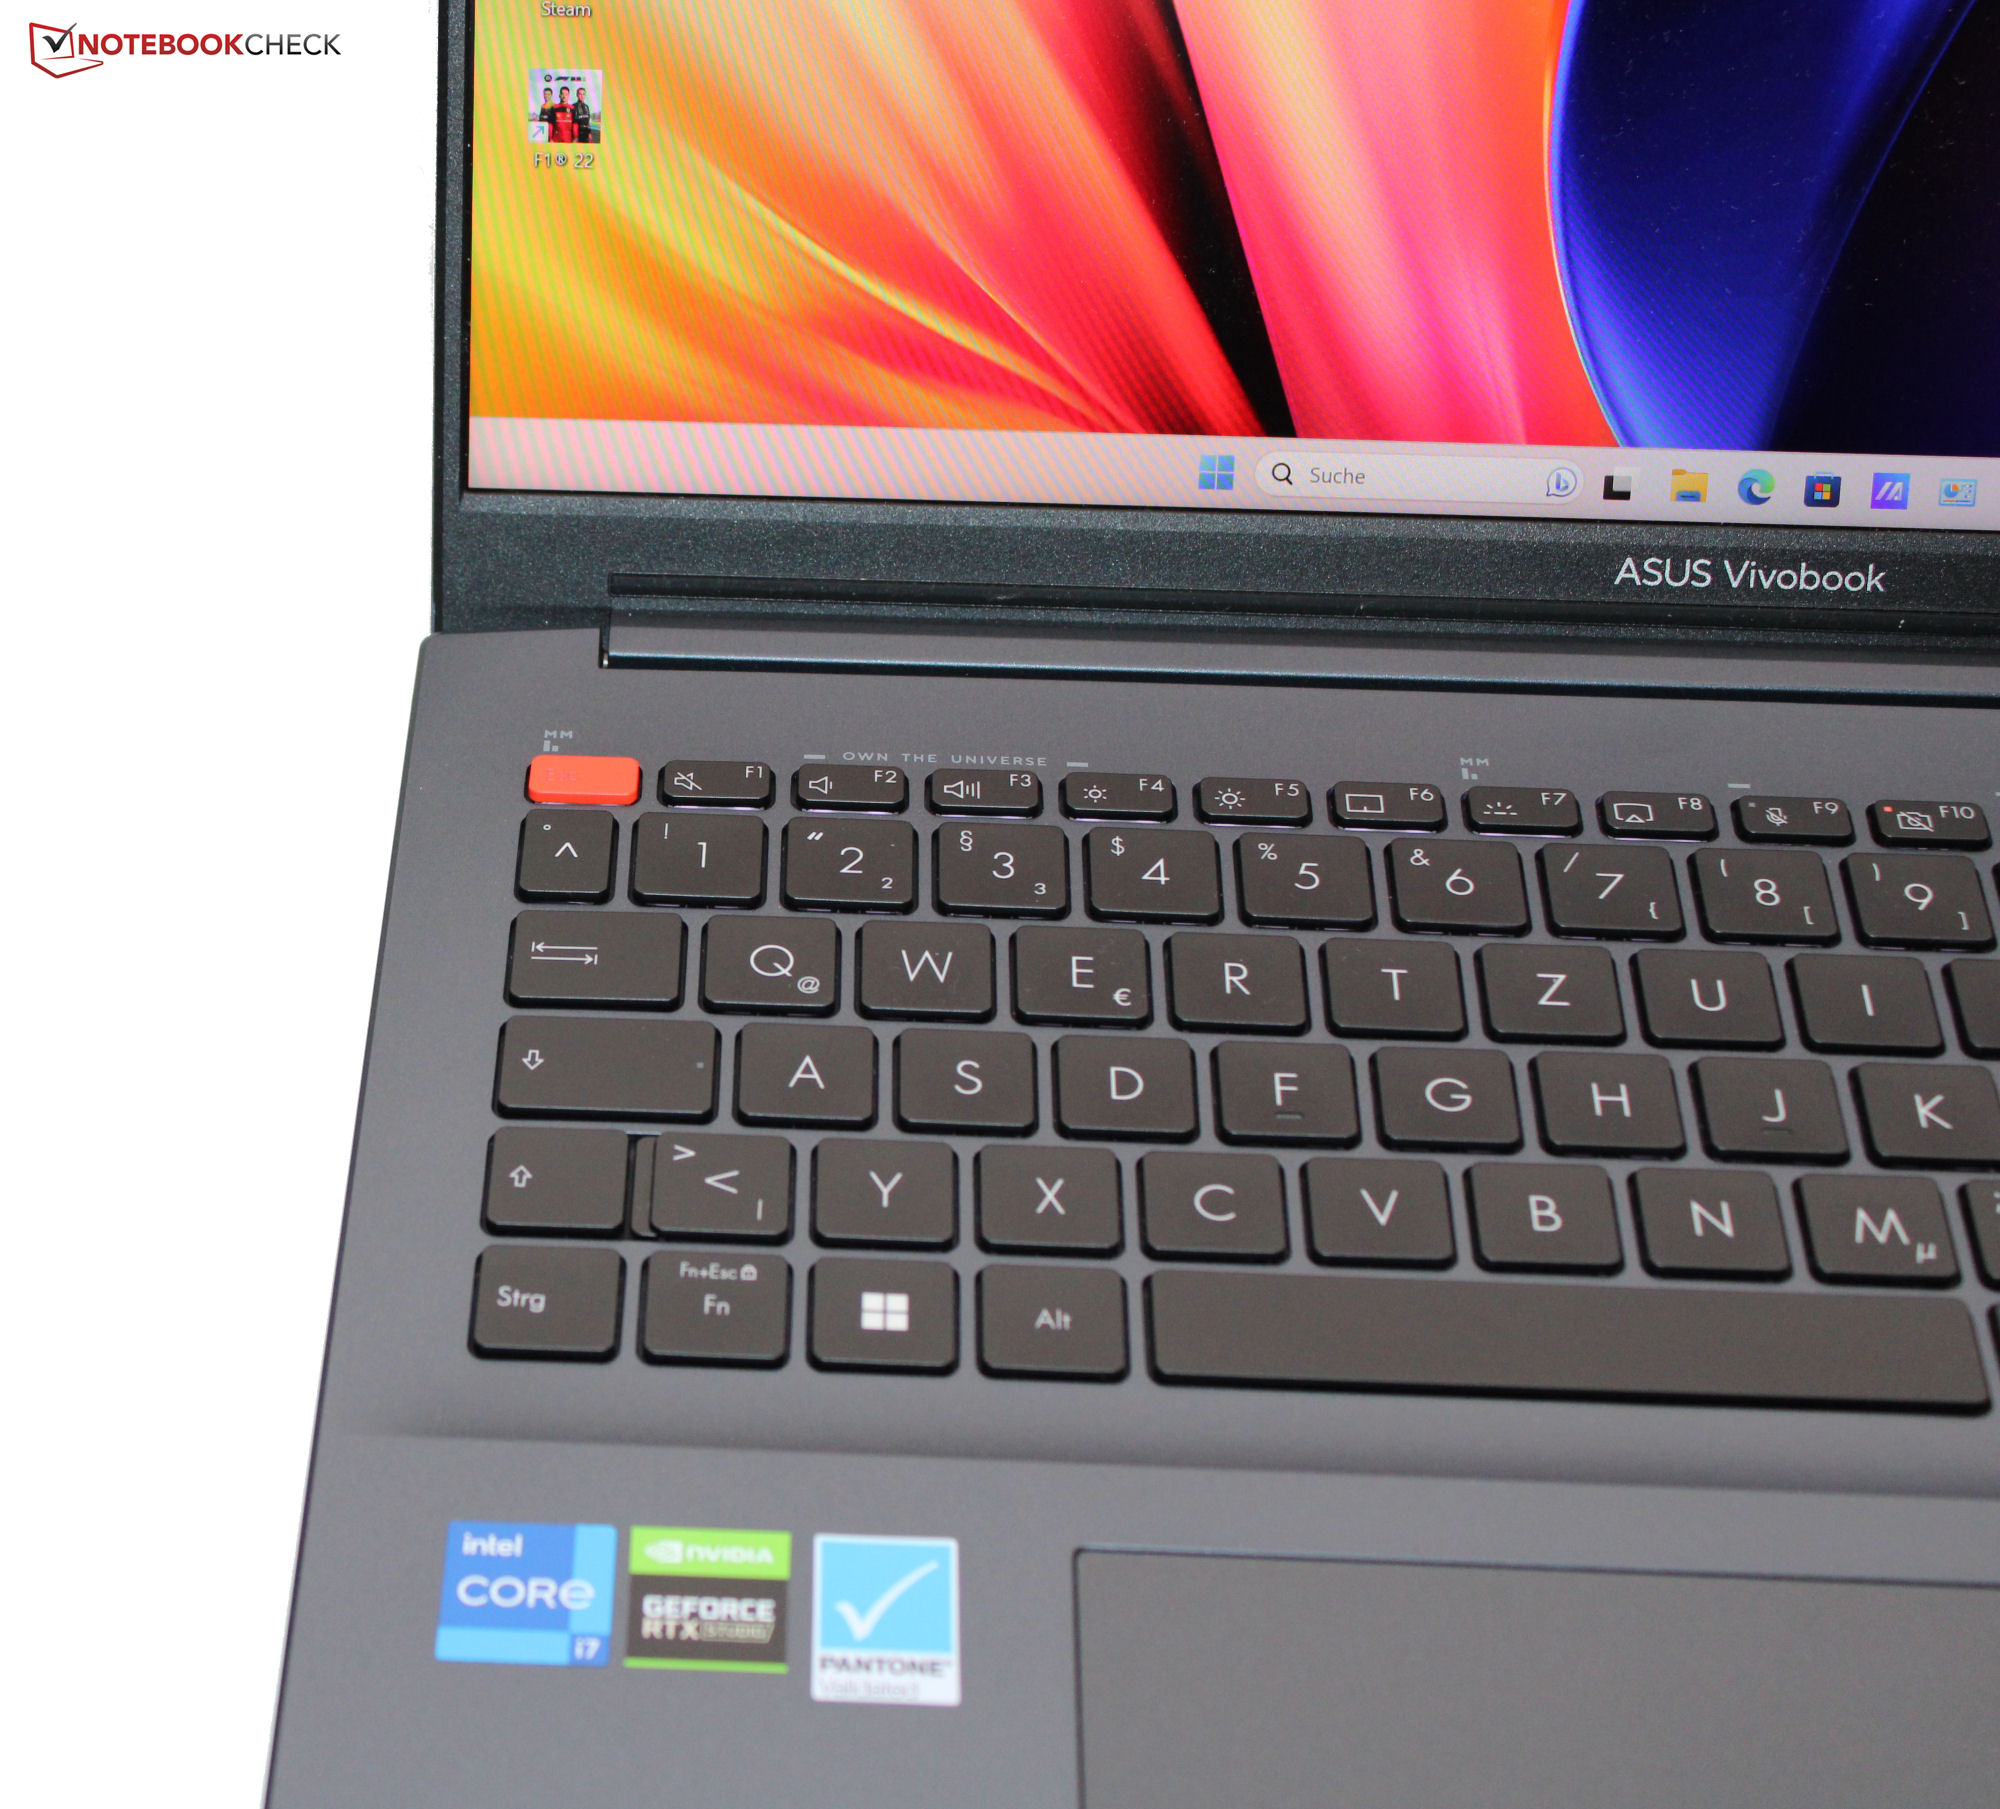
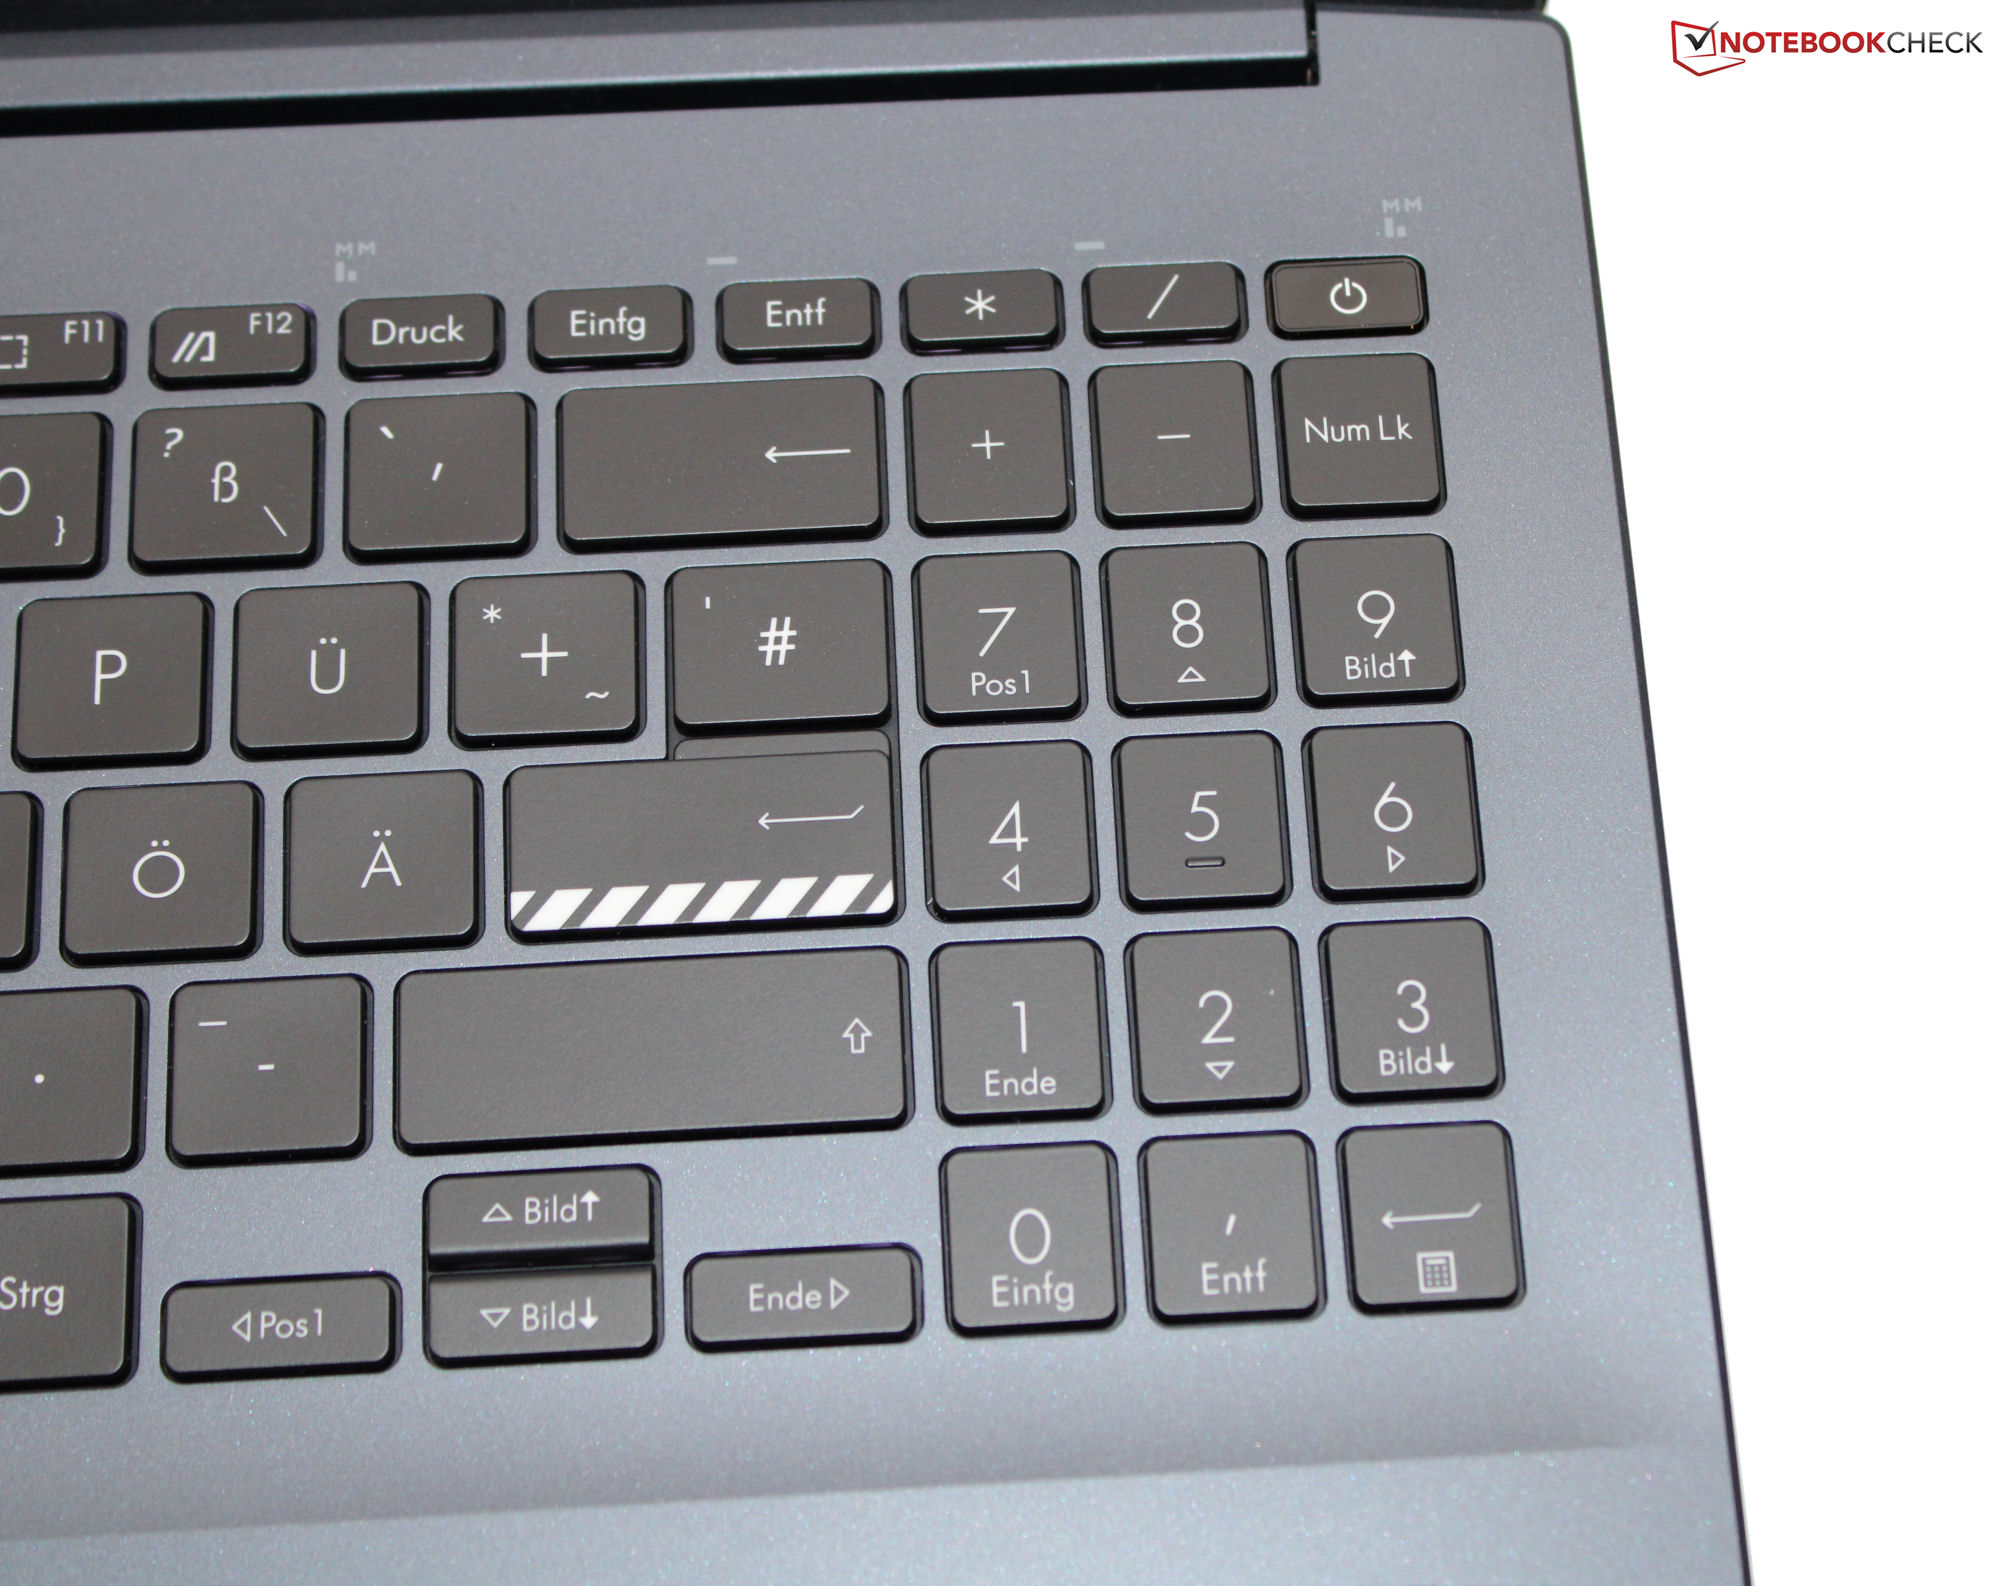
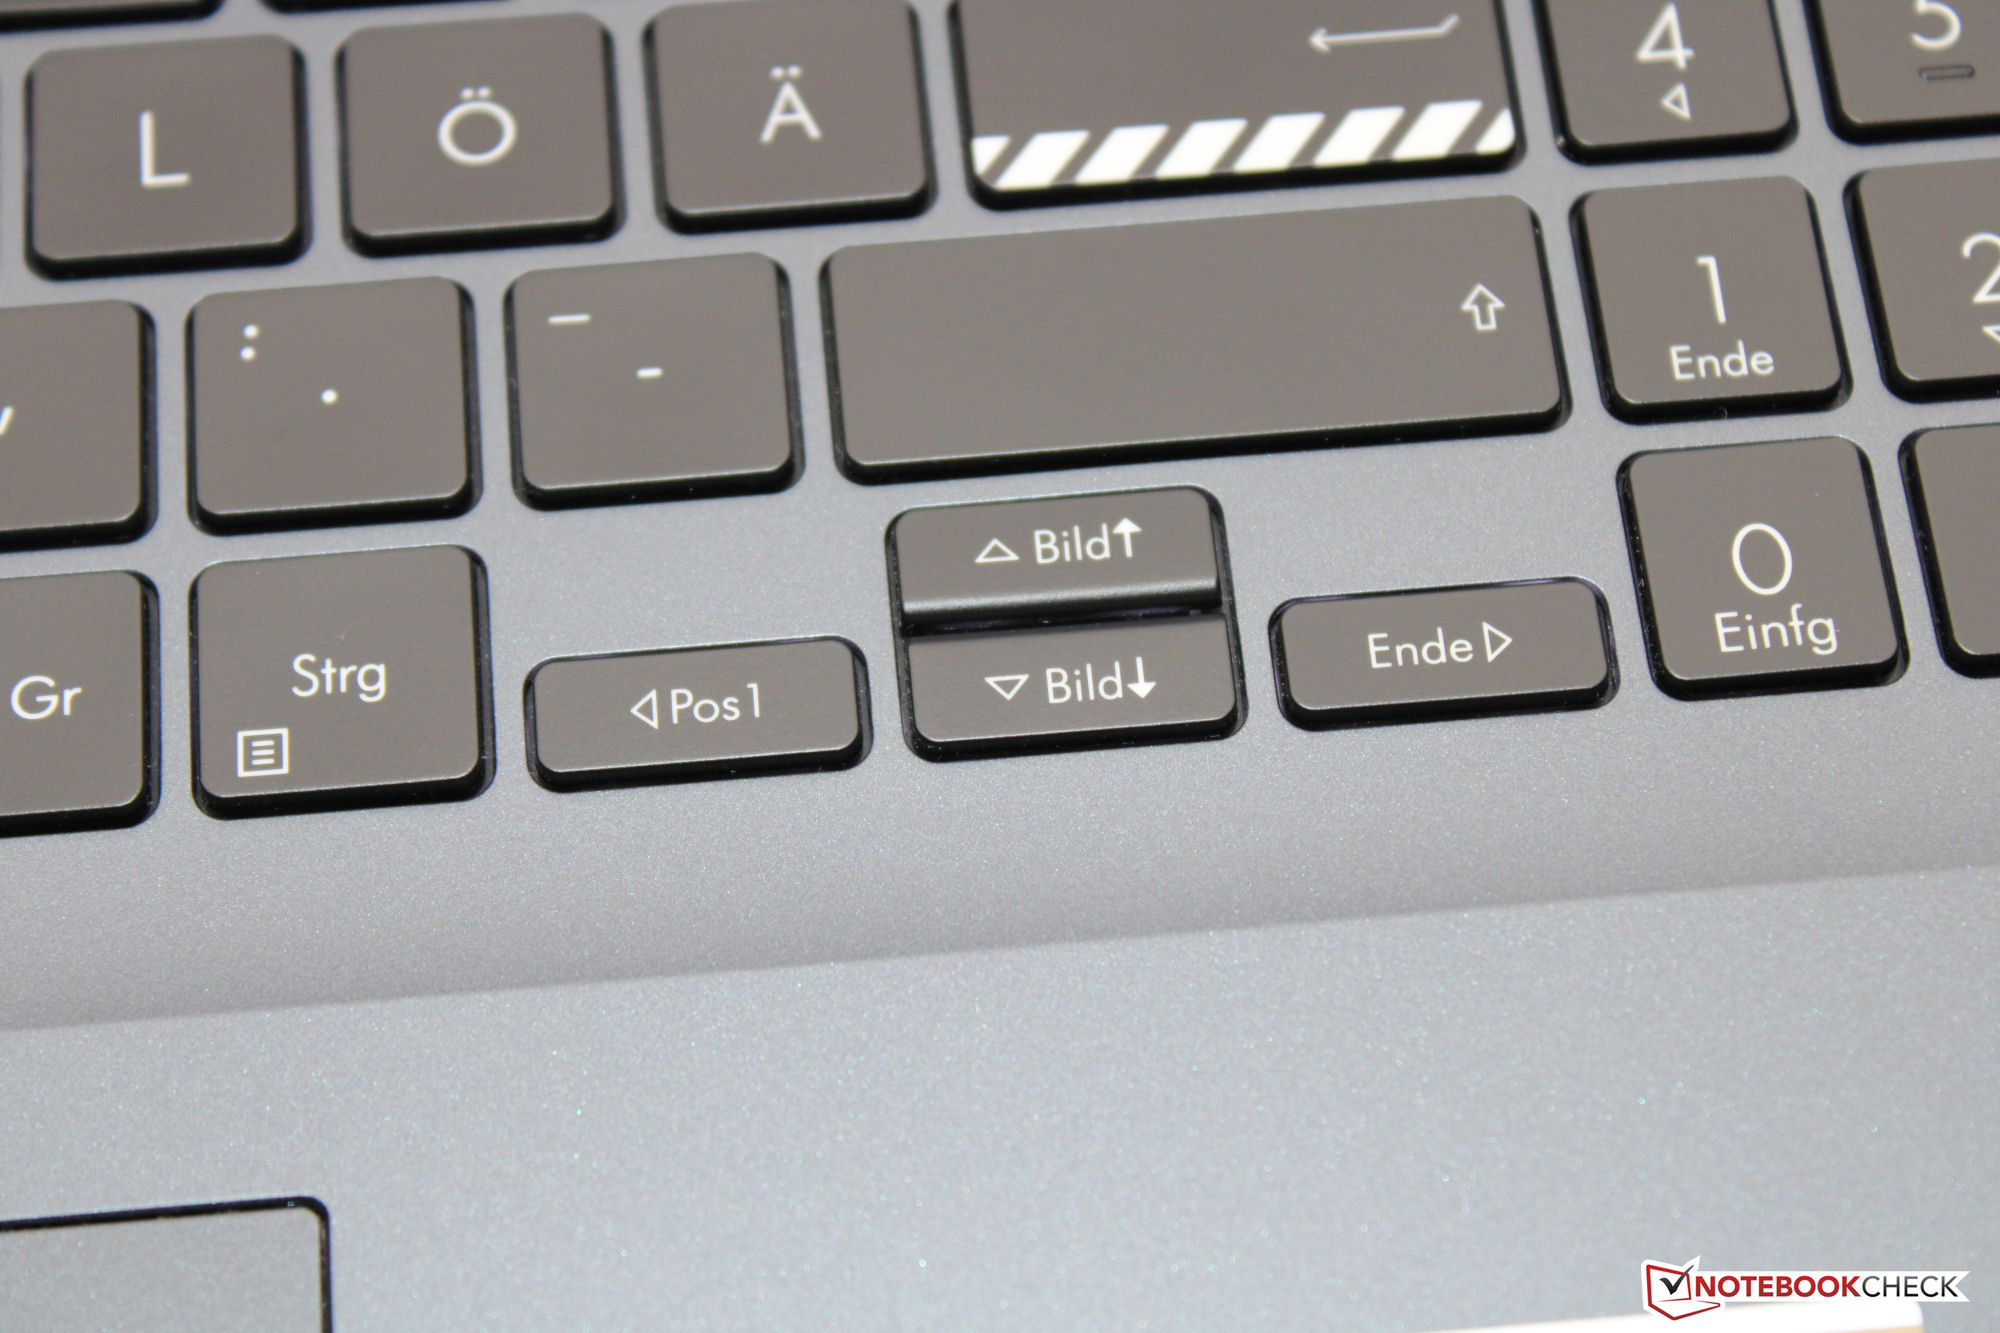
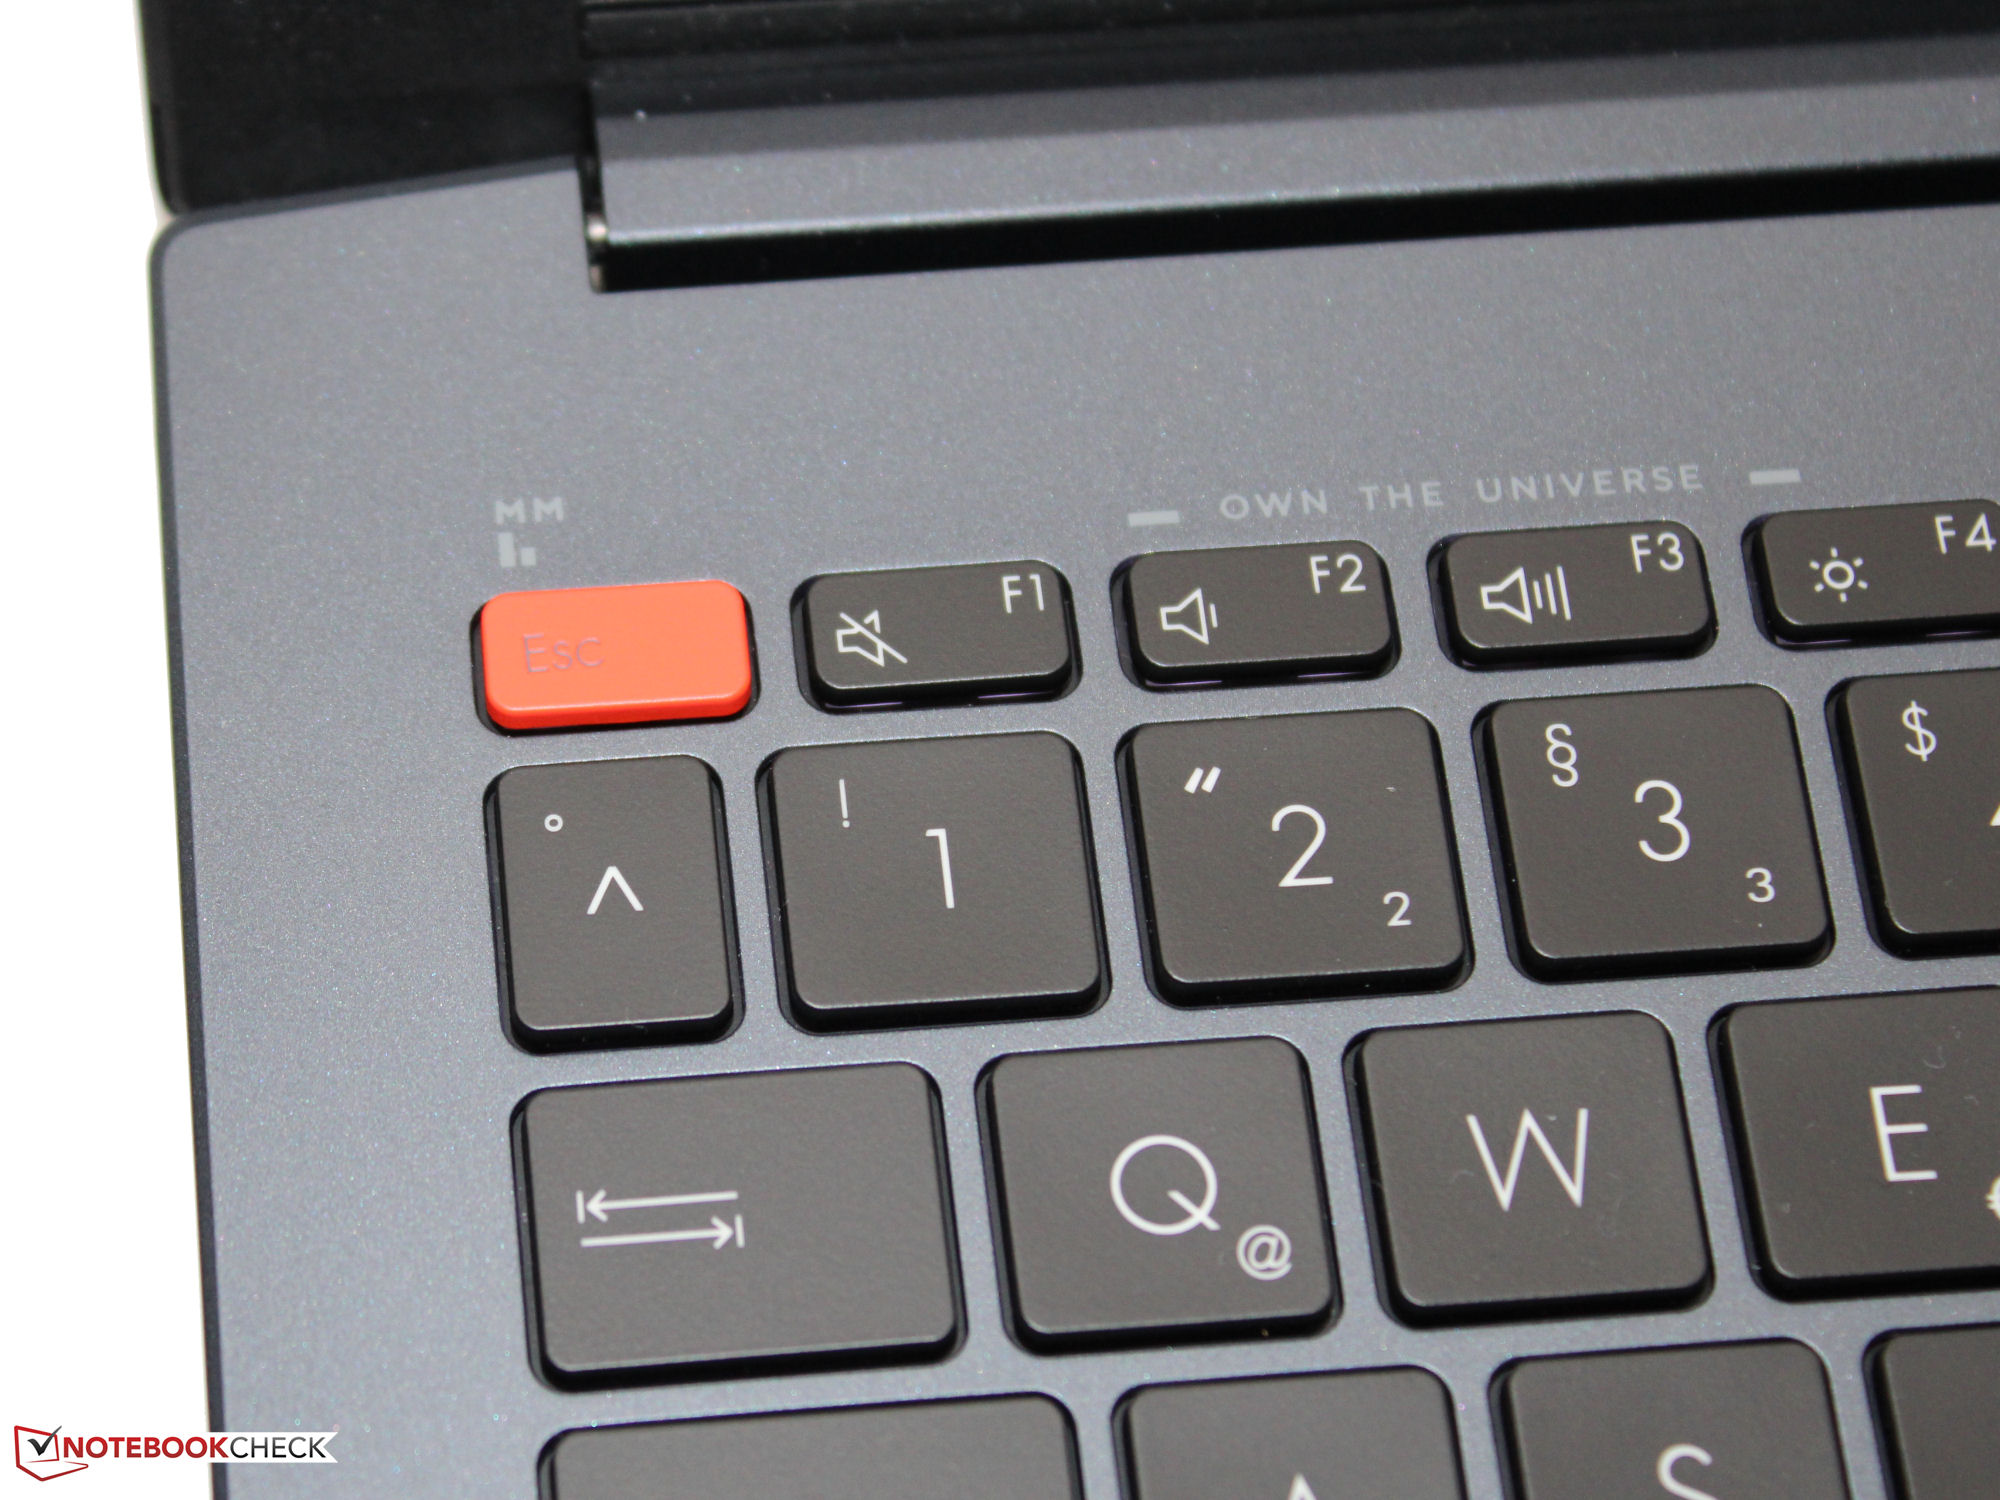
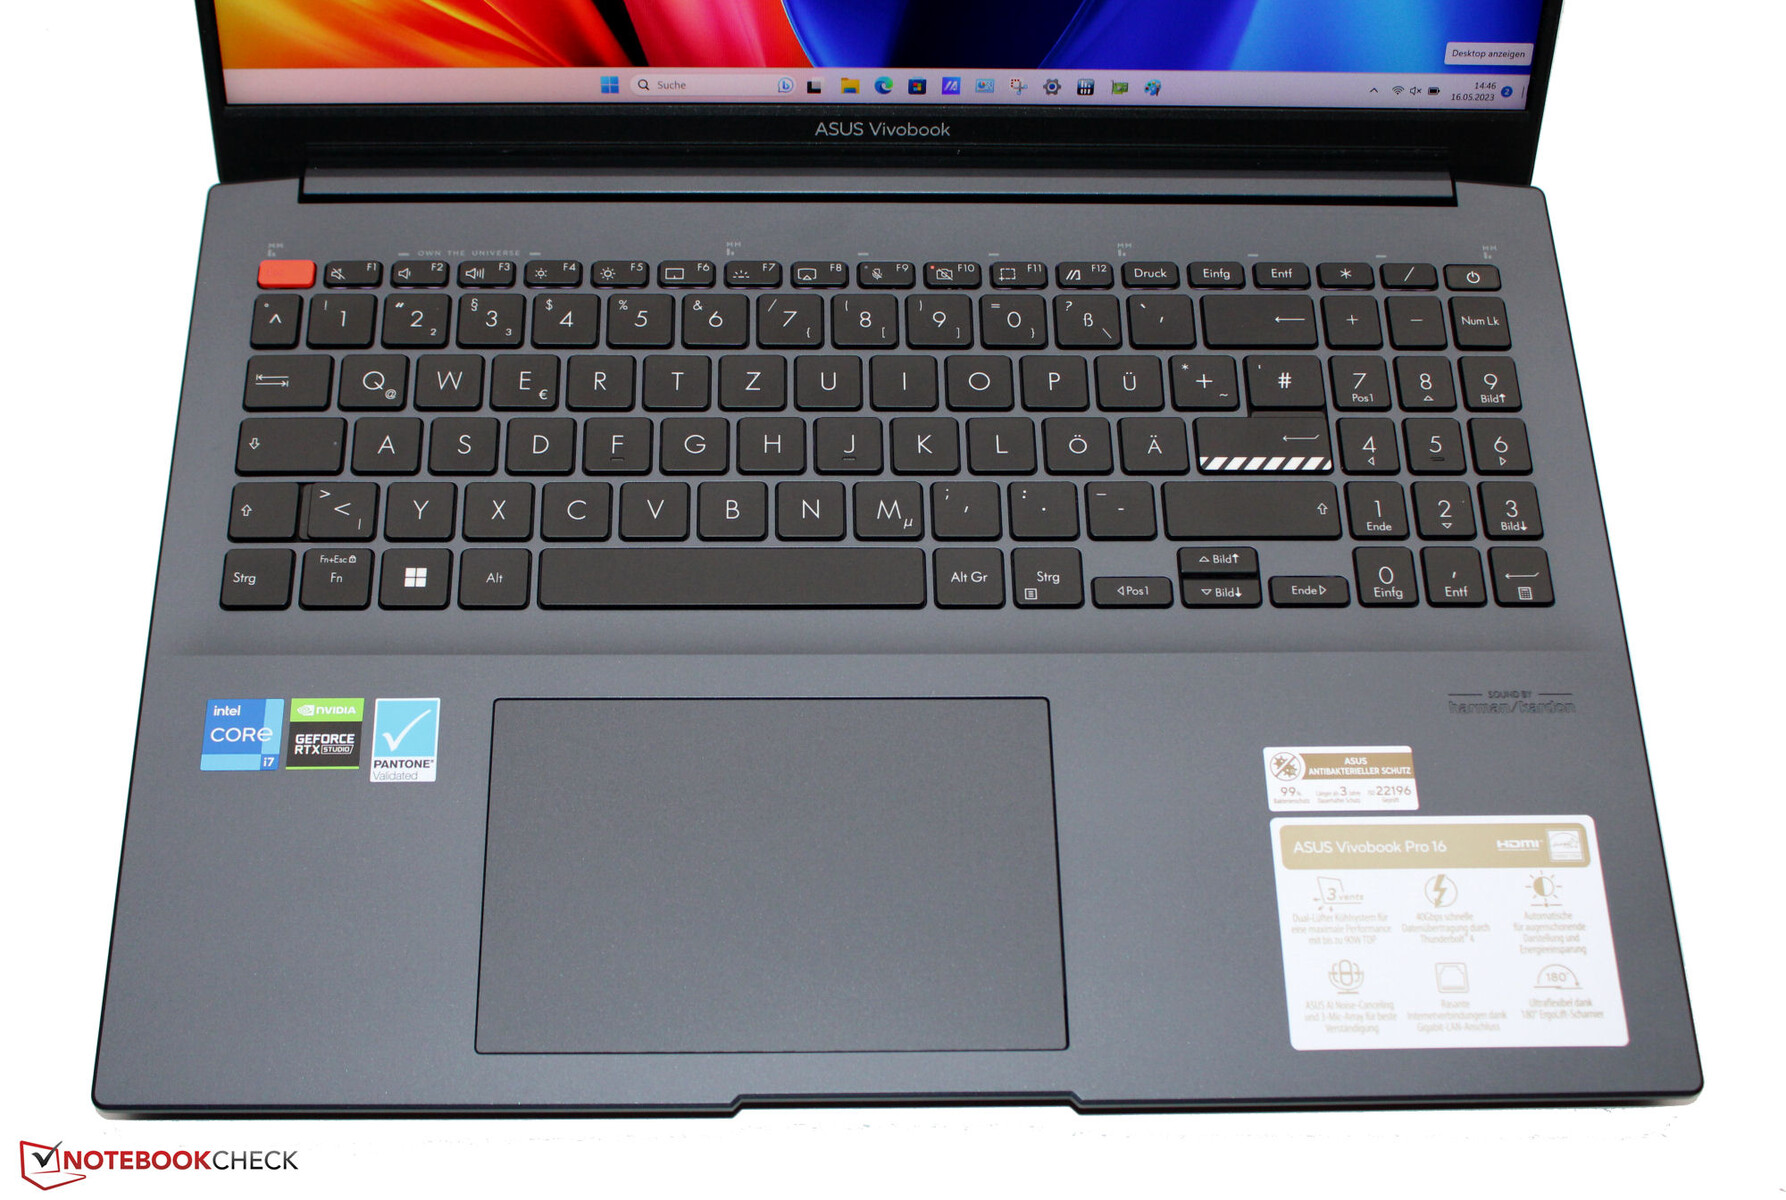
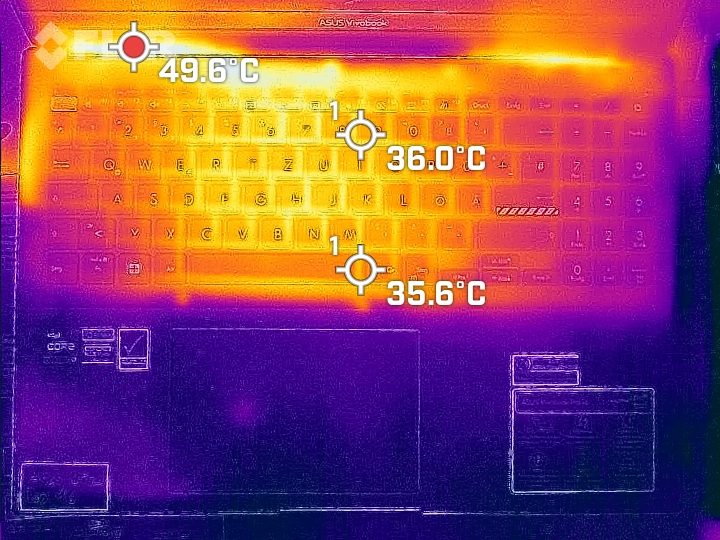
Input devices - The Asus computer with an illuminated keyboard
The chiclet keyboard's keys (partially curved and with three lighting modes) have a medium-level lift and a clear pressure point. They have nice levels of resistance - but they could feel a little crisper. The keyboard has a slight give when you are typing - this isn't really anything negative. All-in-all, the Asus laptop's keyboard is fine for everyday use.
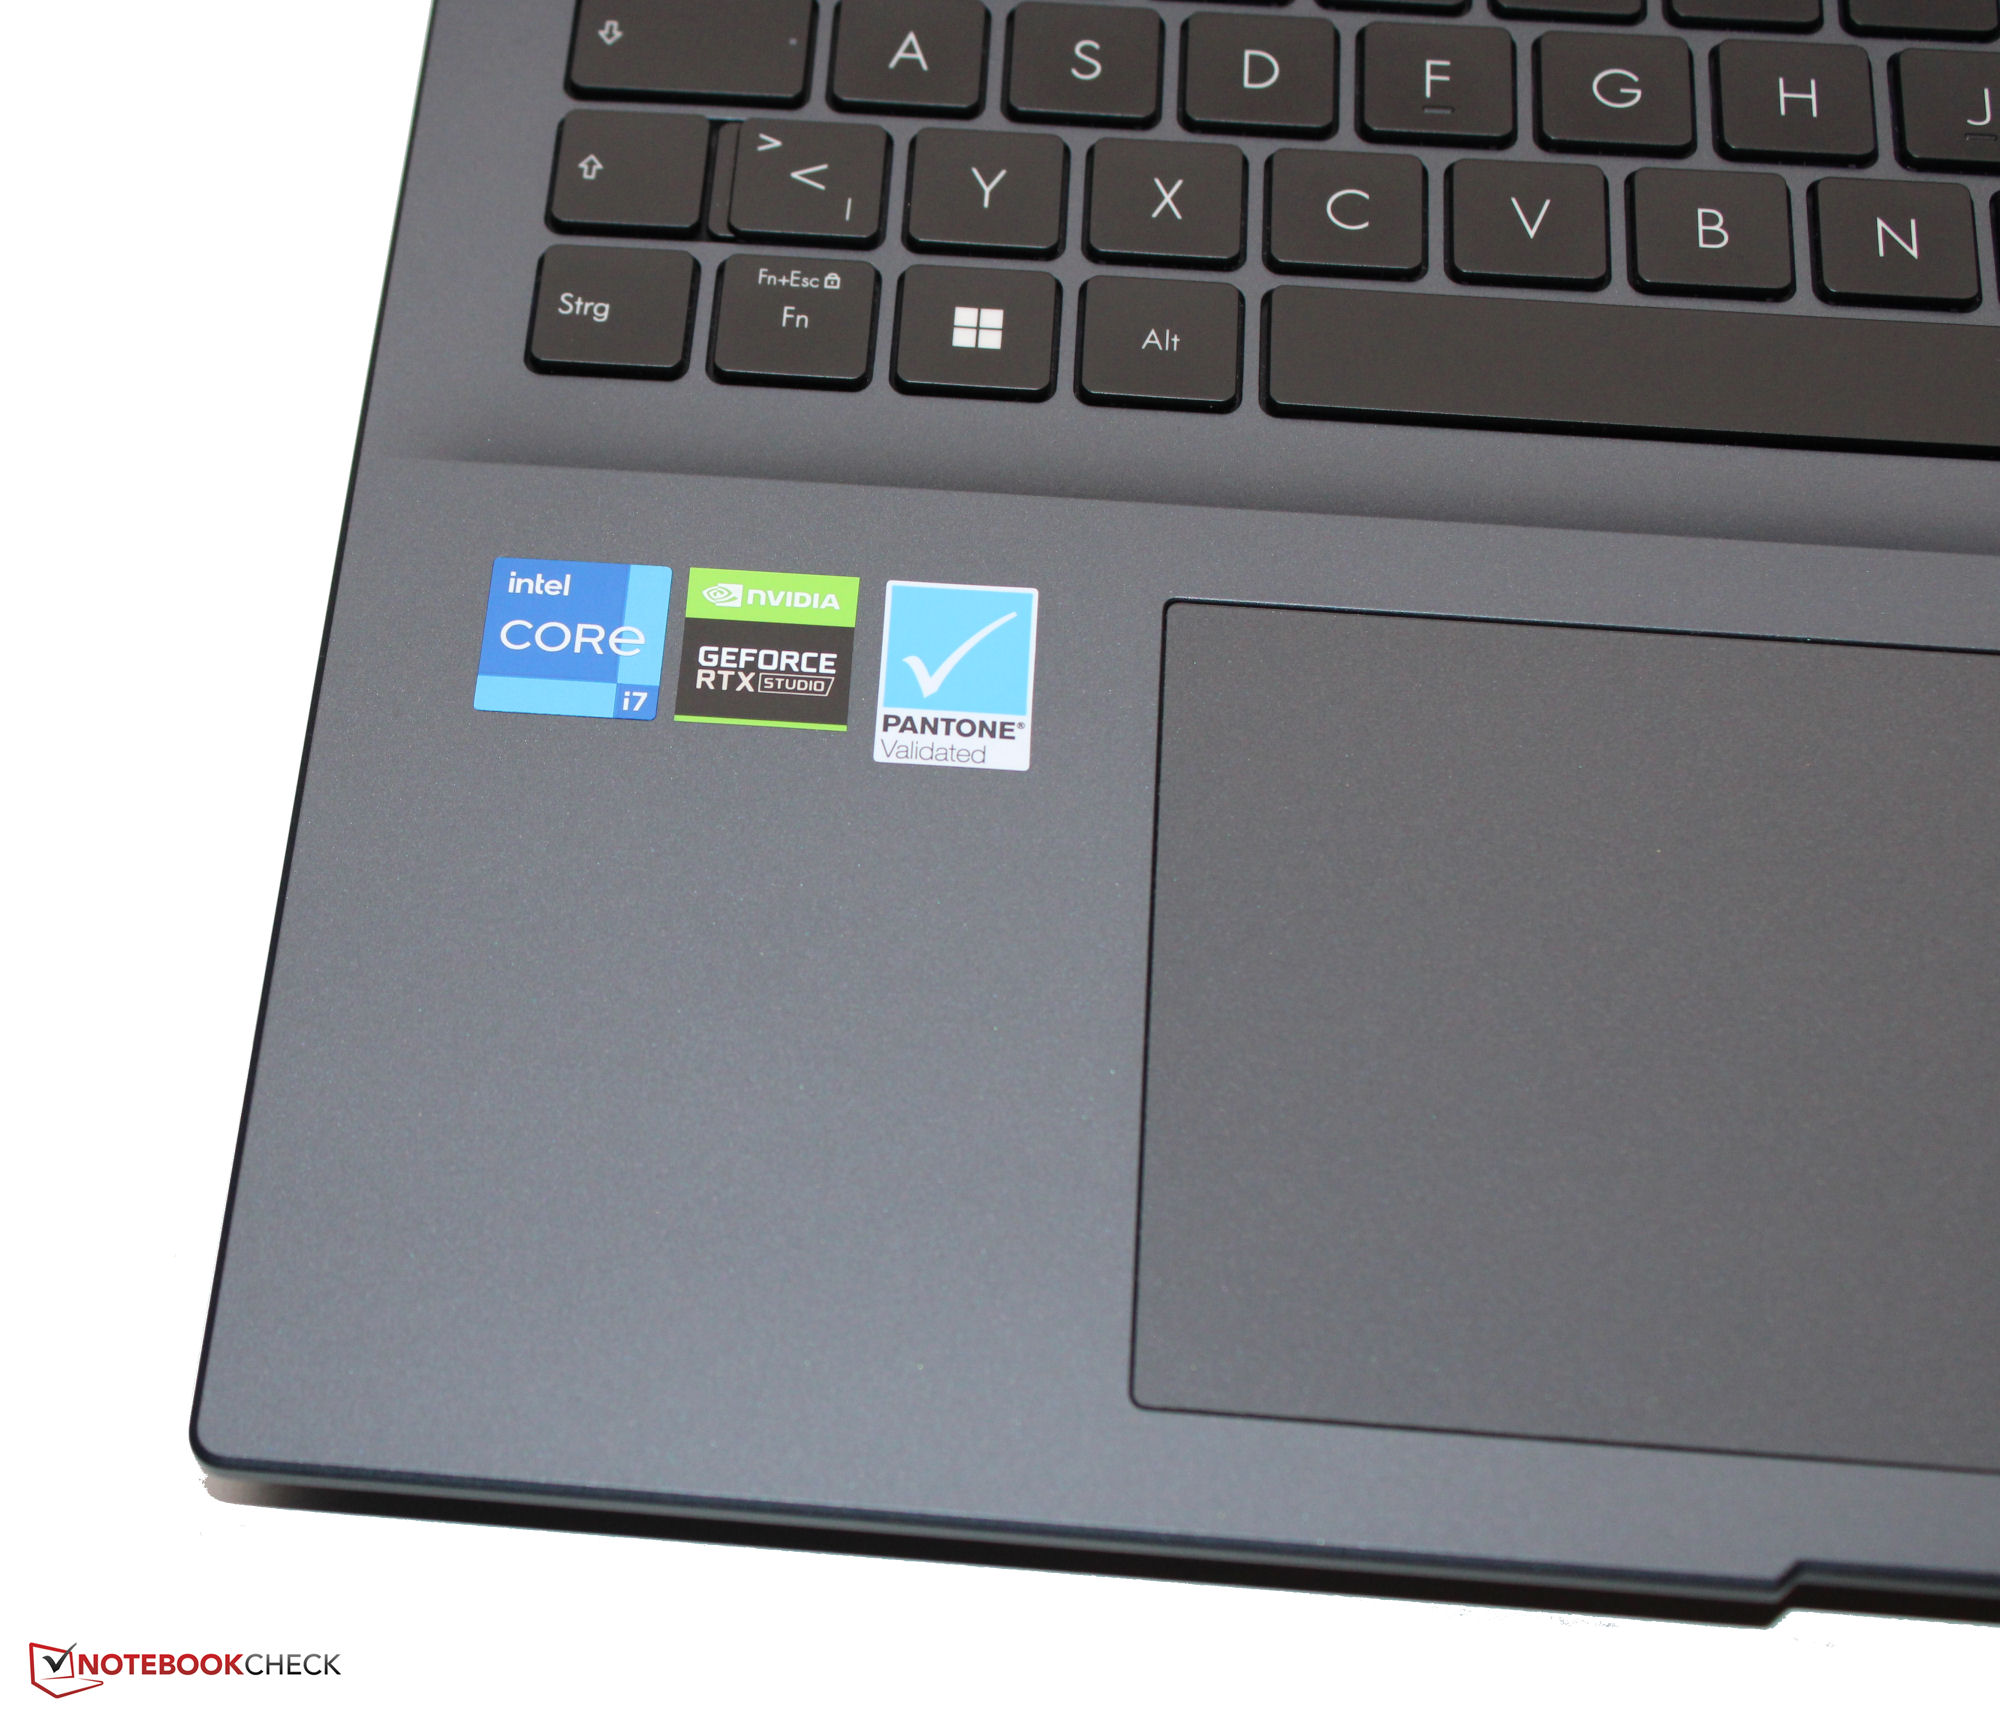
A click pad (13 x 8.5 cm) replaces the need for a mouse and its smooth surface means your fingers glide over it comfortably. It reacts to inputs all the way to the edges, has a minimal lift and a clear pressure point.
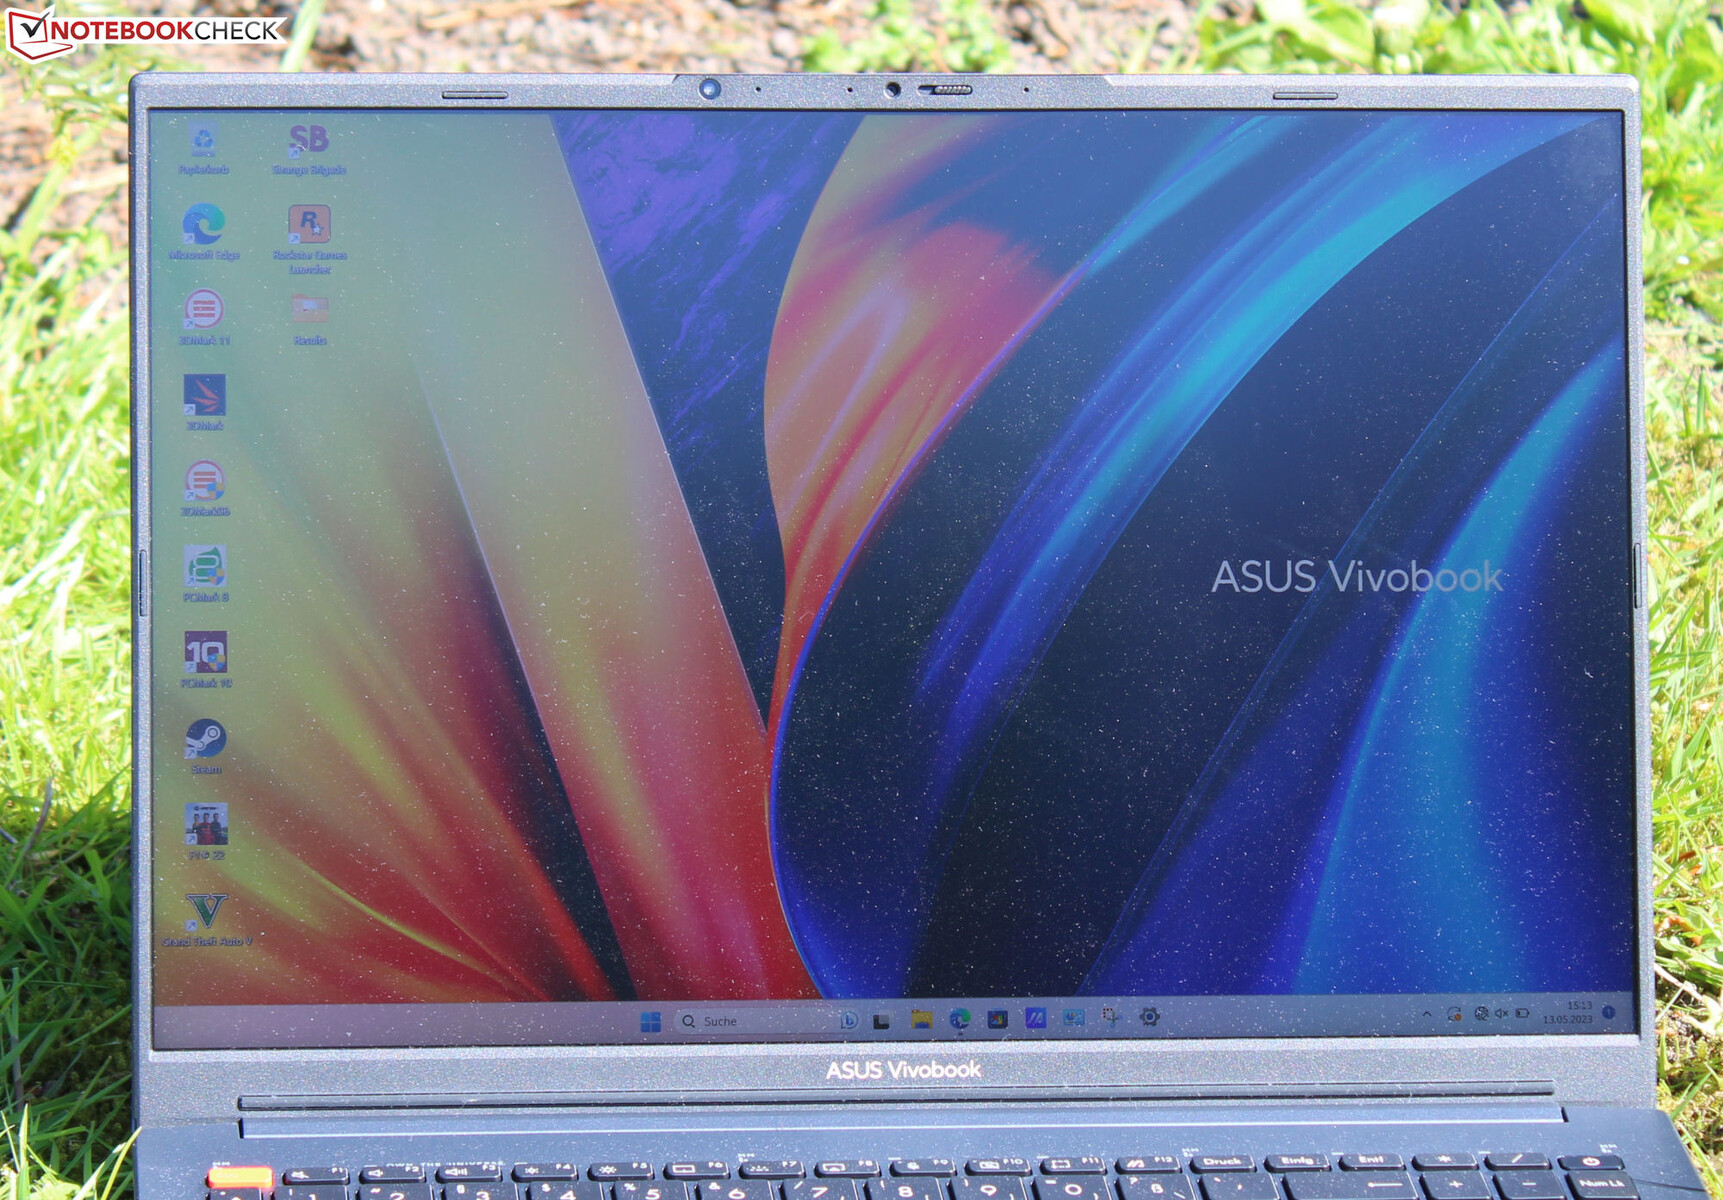
Display - 16:10 panel with DCI-P3 coverage

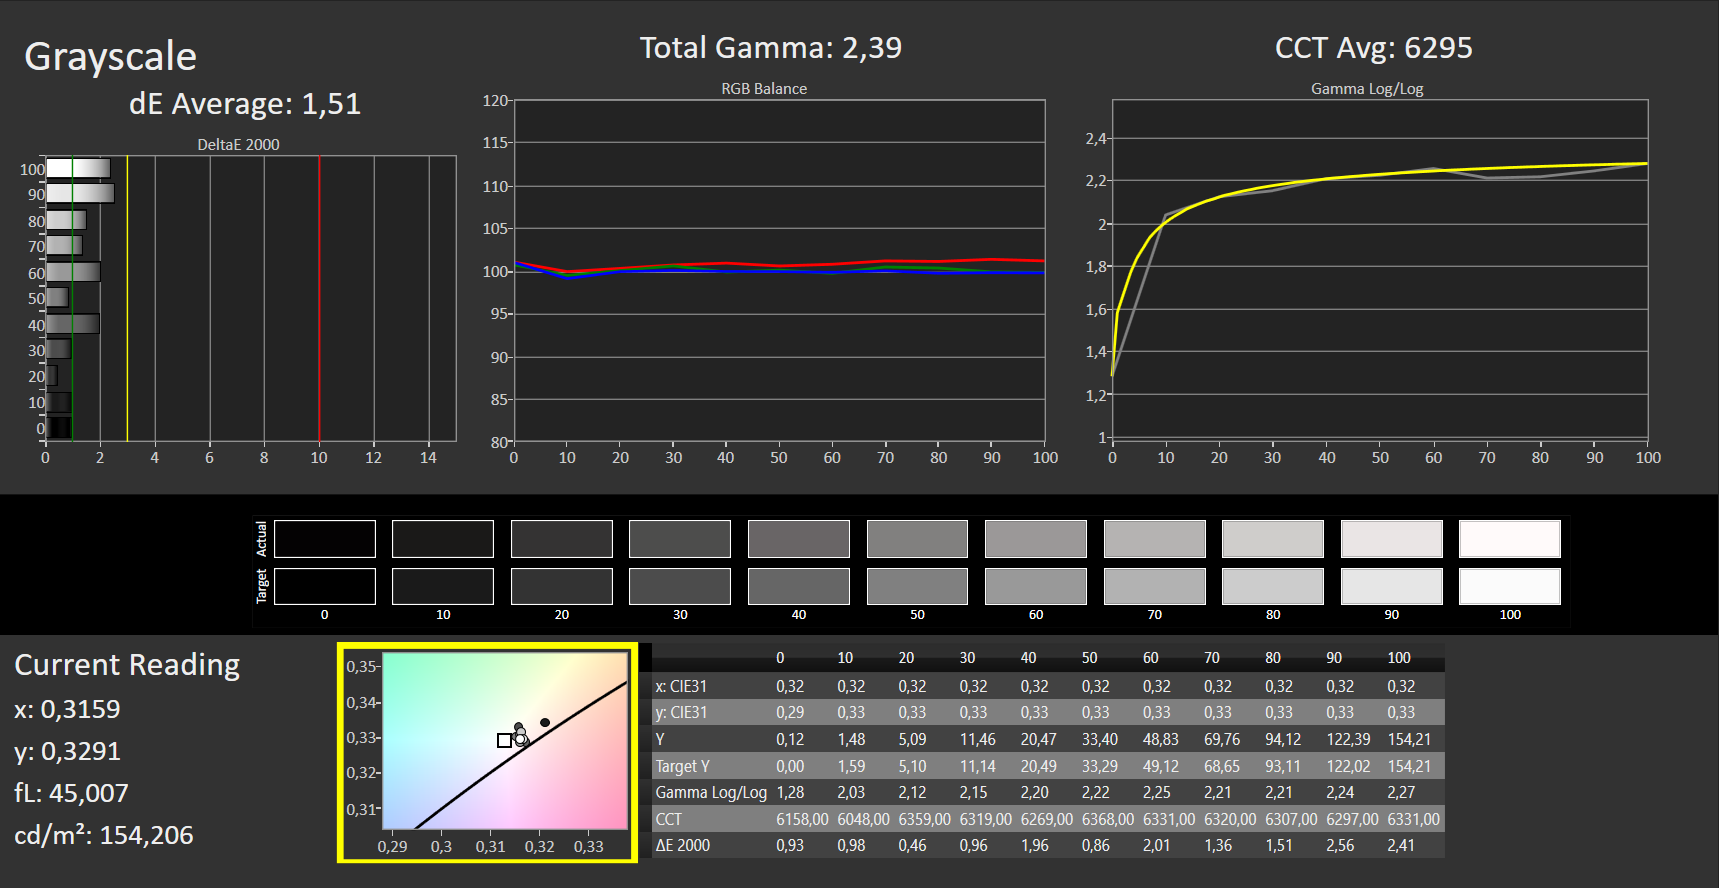
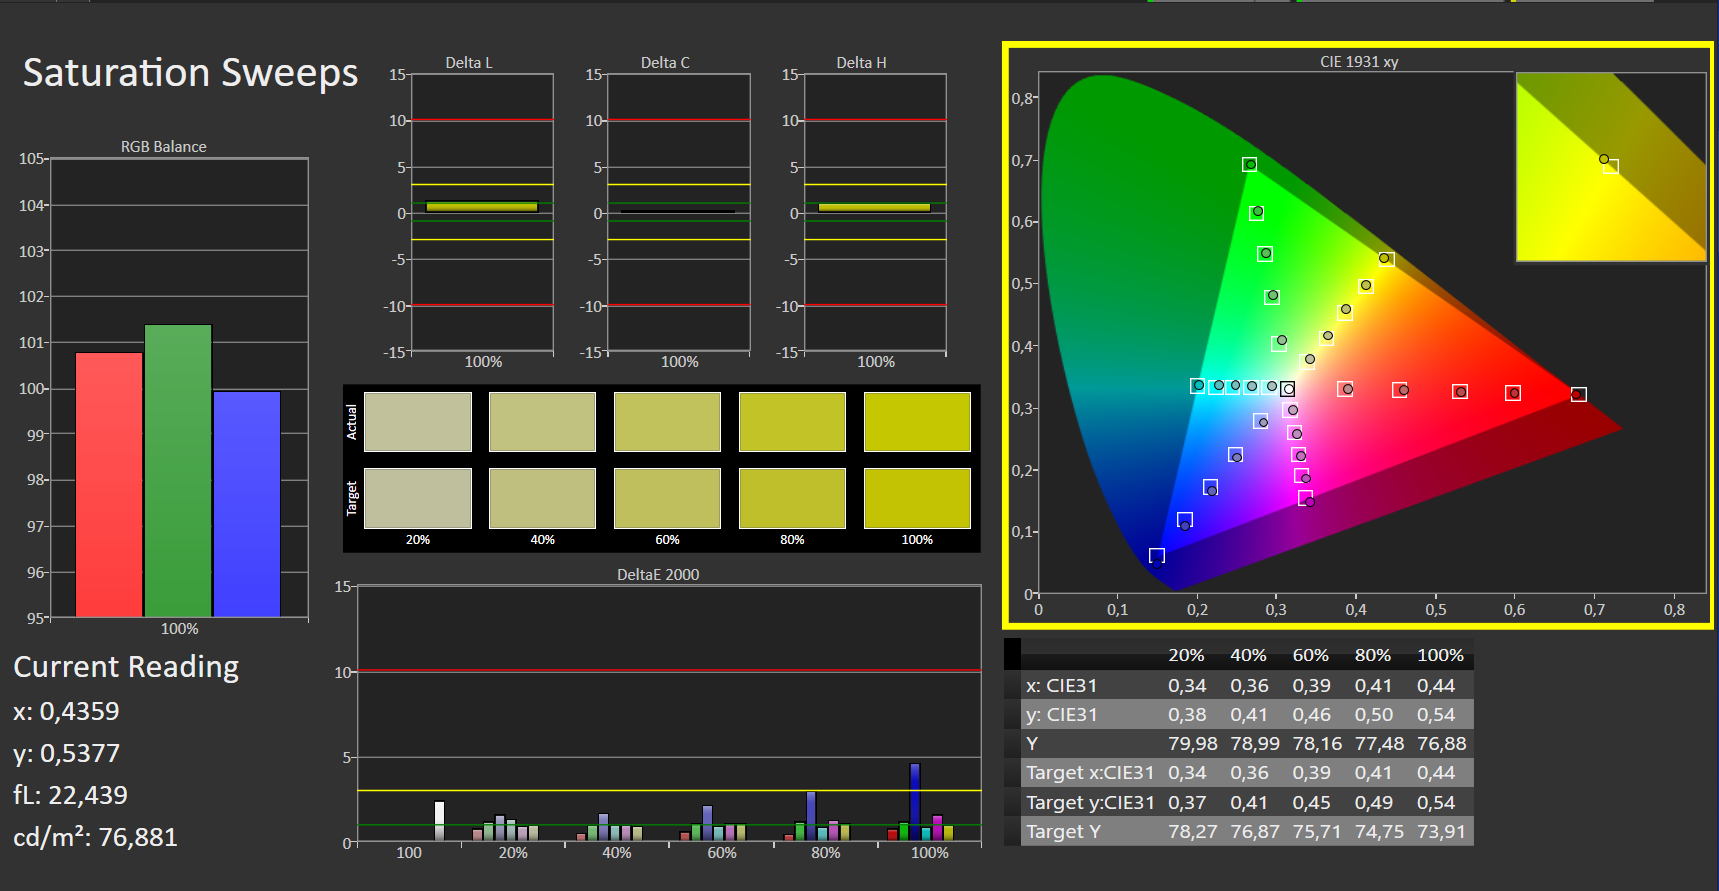
The fast-reacting 120-Hz panel in 16:10 format shows no signs of PWM flickering at all brightness levels. Brightness and contrast on the matte 16-inch display (2,560 x 1,600 pixels) are exactly as they should be (> 300 cd/m² or 1.000:1).
| |||||||||||||||||||||||||
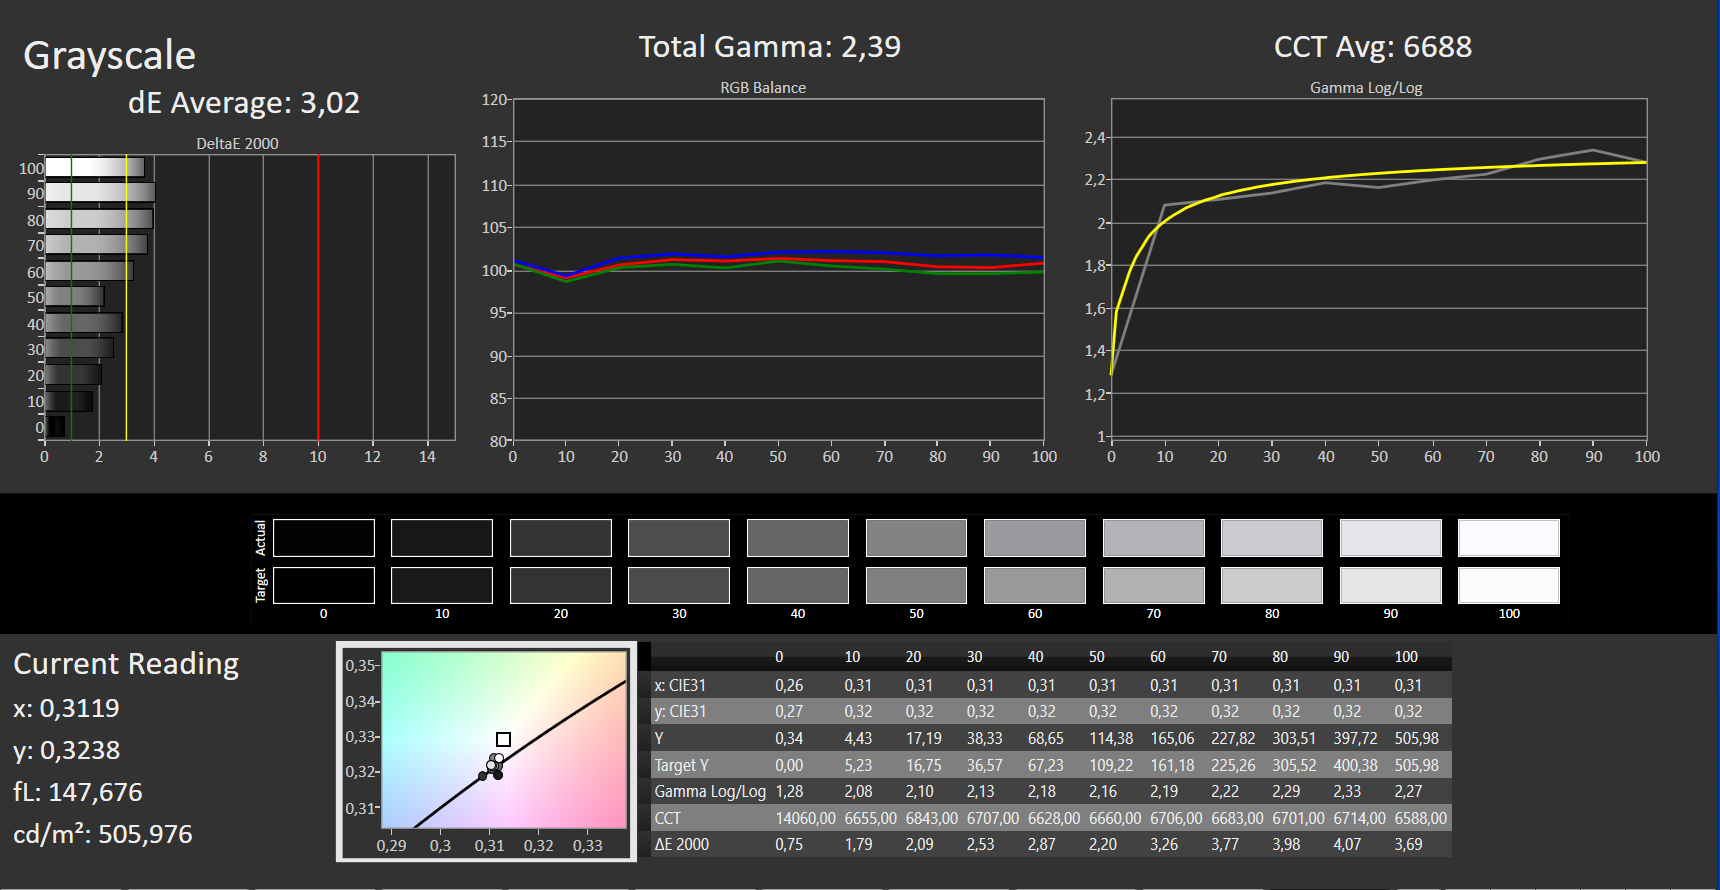
Brightness Distribution: 87 %
Center on Battery: 509 cd/m²
Contrast: 1440:1 (Black: 0.35 cd/m²)
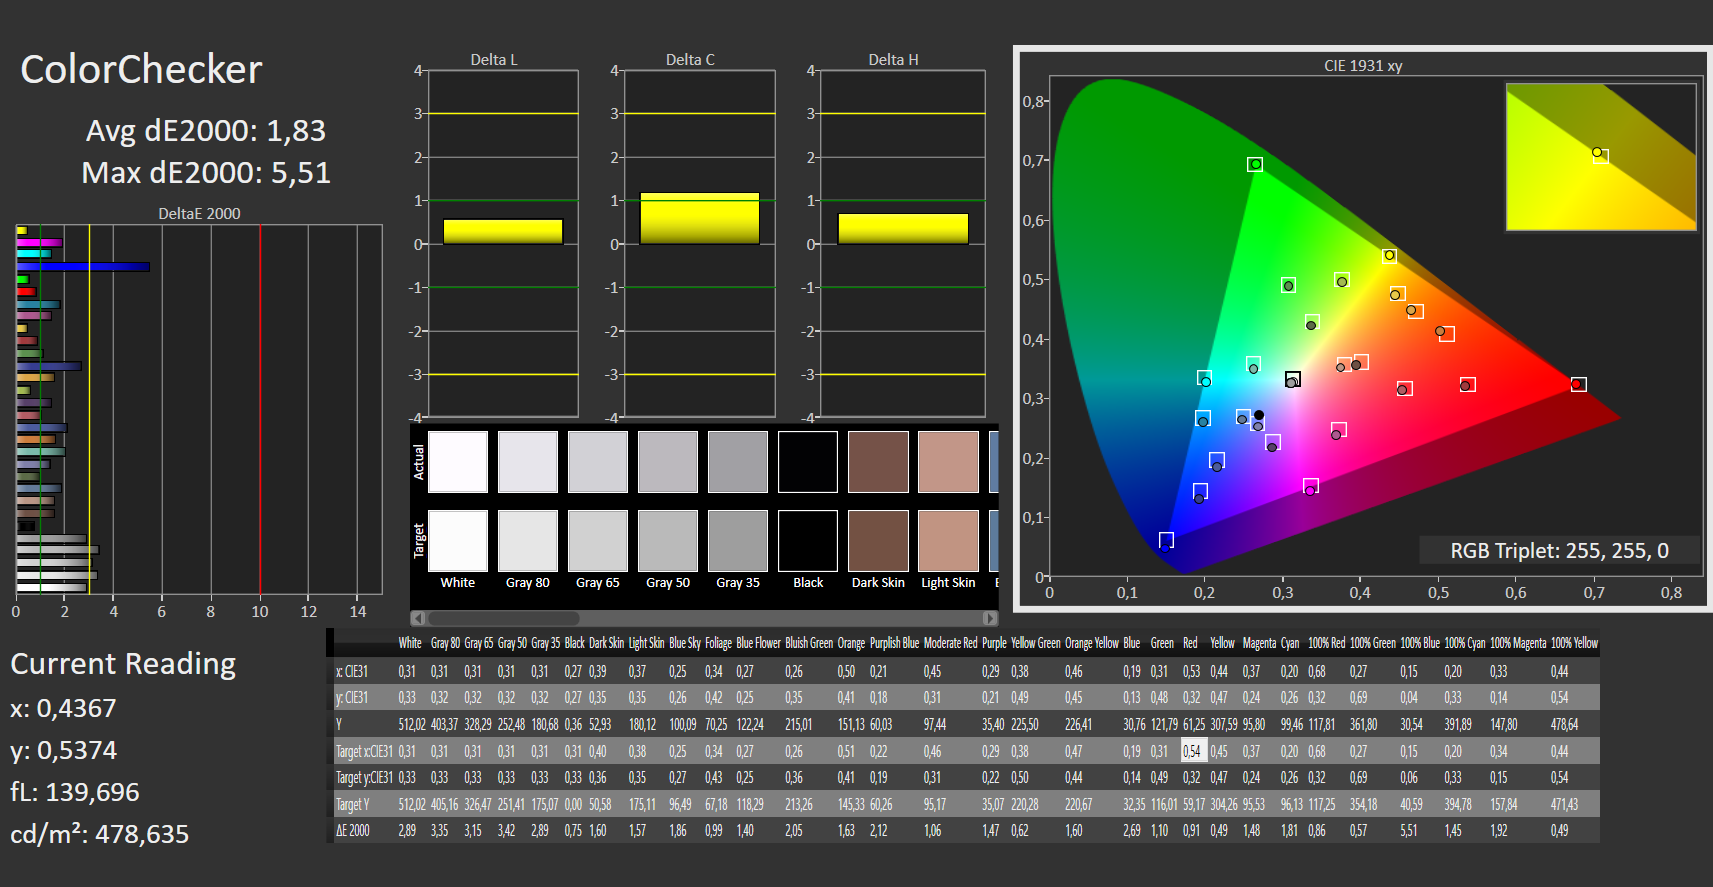
ΔE ColorChecker Calman: 1.83 | ∀{0.5-29.43 Ø4.73}
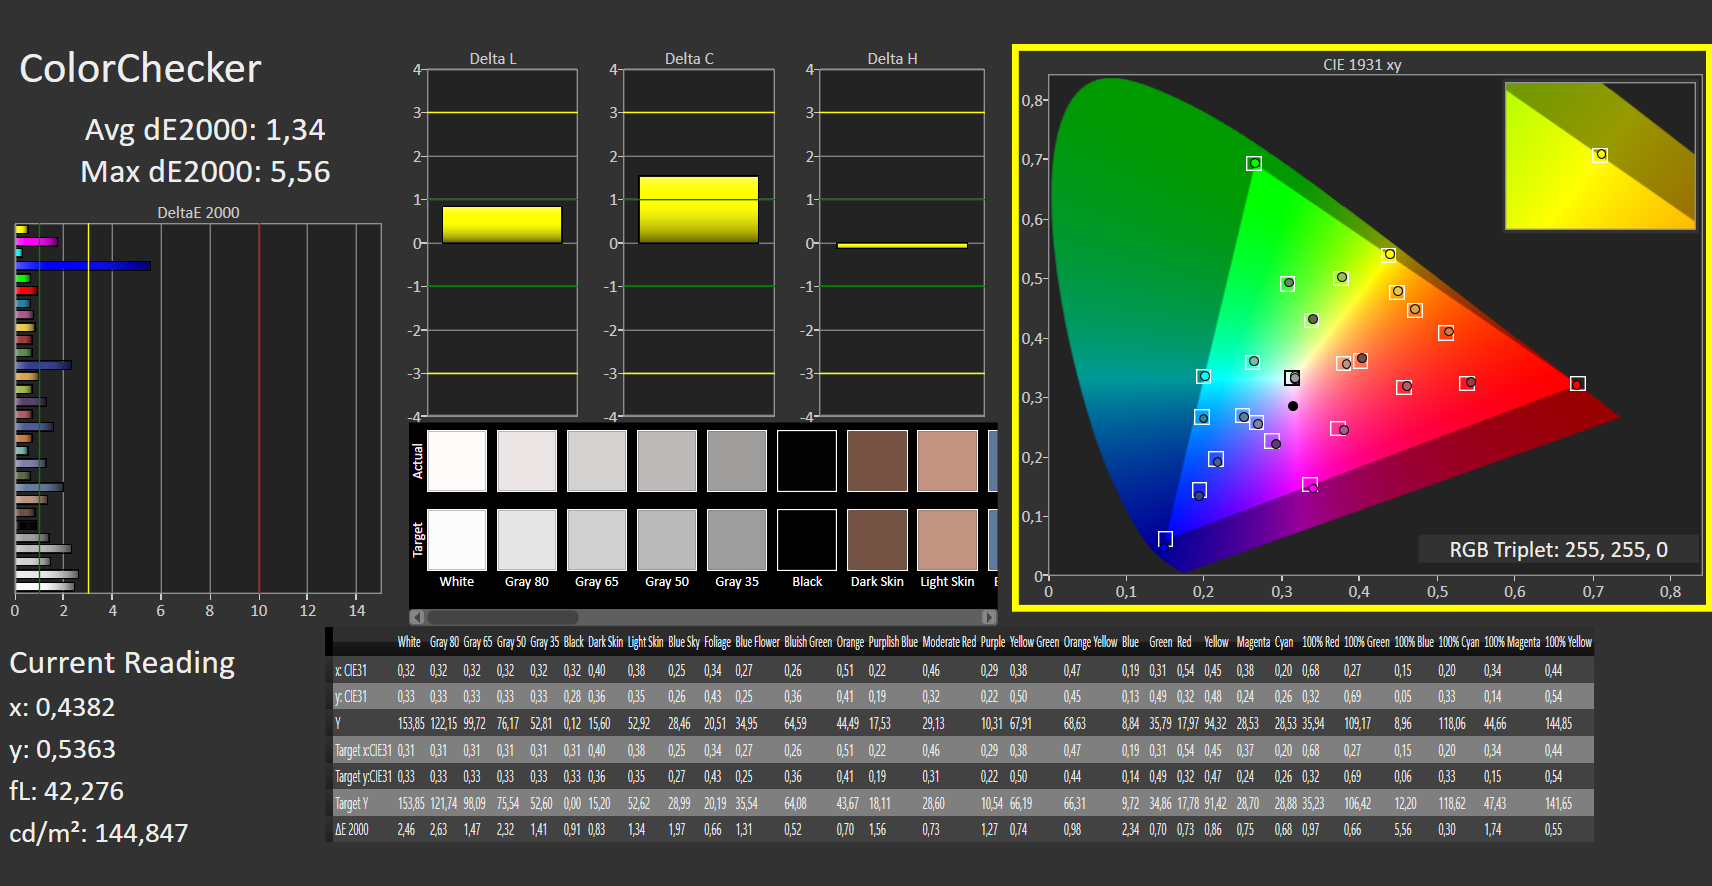
calibrated: 1.34
ΔE Greyscale Calman: 3.02 | ∀{0.09-98 Ø4.97}
86.1% AdobeRGB 1998 (Argyll 3D)
99.9% sRGB (Argyll 3D)
98.5% Display P3 (Argyll 3D)
Gamma: 2.39
CCT: 6688 K
| Asus VivoBook Pro 16 Au Optronics B160QAN02.L, IPS, 2560x1600, 16" | Dell Inspiron 16 Plus 7620 BOE NE16N41, IPS, 3072x1920, 16" | Schenker XMG Fusion 15 (Mid 22) BOE CQ NE156QHM-NY2, IPS, 2560x1440, 15.6" | Acer Swift X SFX16-52G-77RX B160QAN02.M, IPS-LED, 2560x1600, 16" | |
|---|---|---|---|---|
| Display | -14% | -19% | -11% | |
| Display P3 Coverage (%) | 98.5 | 70.8 -28% | 67.3 -32% | 76.4 -22% |
| sRGB Coverage (%) | 99.9 | 99.5 0% | 96.7 -3% | 100 0% |
| AdobeRGB 1998 Coverage (%) | 86.1 | 73.2 -15% | 68.2 -21% | 76.6 -11% |
| Response Times | -1025% | -234% | -819% | |
| Response Time Grey 50% / Grey 80% * (ms) | 2 ? | 38 ? -1800% | 11.6 ? -480% | 33 ? -1550% |
| Response Time Black / White * (ms) | 8 ? | 28 ? -250% | 7 ? 12% | 15 ? -88% |
| PWM Frequency (Hz) | ||||
| Screen | 7% | -32% | -4% | |
| Brightness middle (cd/m²) | 504 | 288.9 -43% | 326 -35% | 411 -18% |
| Brightness (cd/m²) | 465 | 276 -41% | 303 -35% | 378 -19% |
| Brightness Distribution (%) | 87 | 92 6% | 89 2% | 83 -5% |
| Black Level * (cd/m²) | 0.35 | 0.26 26% | 0.33 6% | 0.29 17% |
| Contrast (:1) | 1440 | 1111 -23% | 988 -31% | 1417 -2% |
| Colorchecker dE 2000 * | 1.83 | 1.88 -3% | 2.73 -49% | 2.18 -19% |
| Colorchecker dE 2000 max. * | 5.51 | 4.37 21% | 9.54 -73% | 4.84 12% |
| Colorchecker dE 2000 calibrated * | 1.34 | 0.42 69% | 1.36 -1% | 1.48 -10% |
| Greyscale dE 2000 * | 3.02 | 1.4 54% | 5.2 -72% | 2.68 11% |
| Gamma | 2.39 92% | 2.3 96% | 2.074 106% | 2.43 91% |
| CCT | 6688 97% | 6634 98% | 6911 94% | 6717 97% |
| Total Average (Program / Settings) | -344% /
-145% | -95% /
-58% | -278% /
-122% |
* ... smaller is better
The screen's X Rite Pantone certification means it has a very natural color depiction: With deviations of around 1.8, it delivers acceptable results (DeltaE < 3) straight out of the box. Calibrating it leads to a smaller deviation of 1.3 and more balanced gray tones. Color accuracy is no problem: The panel can depict the entire DCI P3 color space and 86 per cent of the Adobe RGB space.
Display Response Times
| ↔ Response Time Black to White | ||
|---|---|---|
| 8 ms ... rise ↗ and fall ↘ combined | ↗ 1 ms rise |  |
| ↘ 7 ms fall | ||
| The screen shows fast response rates in our tests and should be suited for gaming. In comparison, all tested devices range from 0.1 (minimum) to 240 (maximum) ms. » 22 % of all devices are better. This means that the measured response time is better than the average of all tested devices (19.9 ms). | ||
| ↔ Response Time 50% Grey to 80% Grey | ||
| 2 ms ... rise ↗ and fall ↘ combined | ↗ 1 ms rise |  |
| ↘ 1 ms fall | ||
| The screen shows very fast response rates in our tests and should be very well suited for fast-paced gaming. In comparison, all tested devices range from 0.165 (minimum) to 636 (maximum) ms. » 9 % of all devices are better. This means that the measured response time is better than the average of all tested devices (31.1 ms). | ||
Screen Flickering / PWM (Pulse-Width Modulation)
| Screen flickering / PWM not detected |     | ||
In comparison: 52 % of all tested devices do not use PWM to dim the display. If PWM was detected, an average of 7810 (minimum: 5 - maximum: 343500) Hz was measured. | |||
Its viewing angle stable IPS panel can easily be read from any angle. Outdoors, the display generally remains legible as long as the sun isn't shining too strongly.
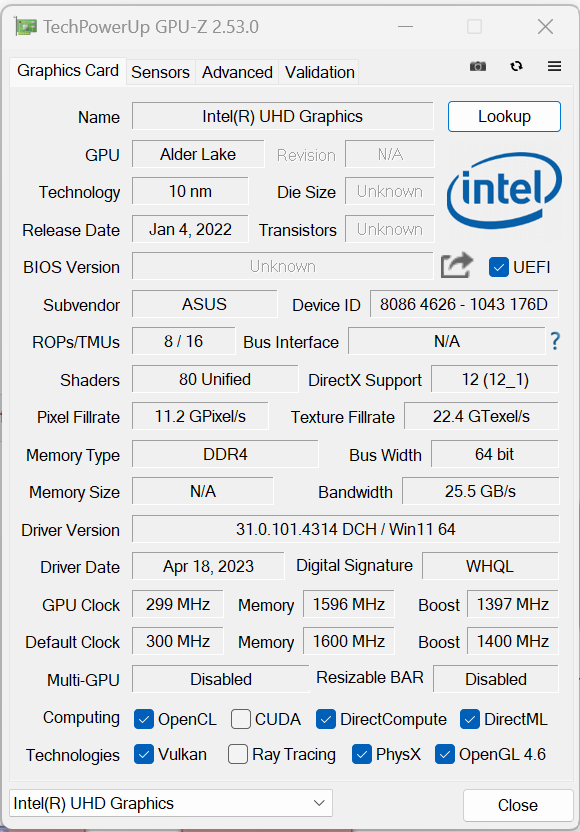
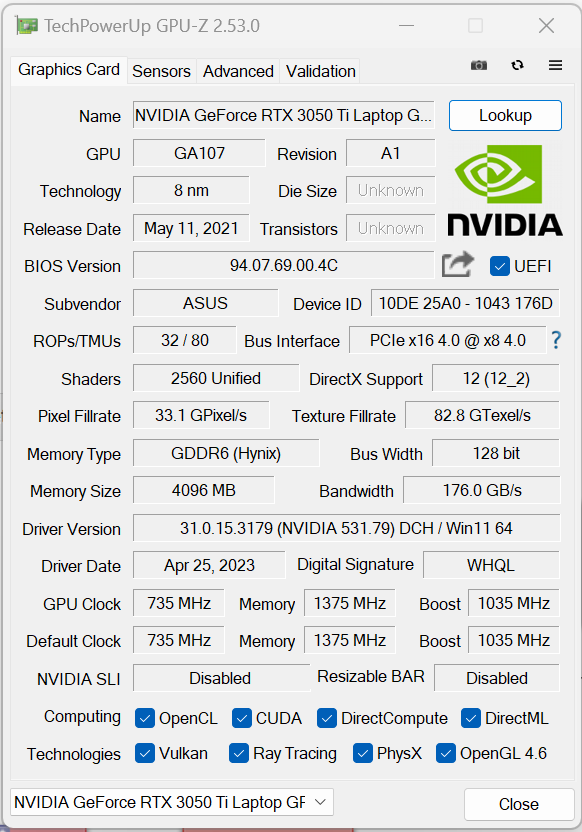
Performance - Alder Lake and Ampere
The VivoBook Pro 16 series consists of 5 model ranges (see model number) which are based on varying CPU and GPU generations. The present K6602ZE model uses Alder Lake CPUs and a GeForce-RTX-3050-T GPU. Our test device's MRSP is $1,247. Other variants were not available at the time of testing.
Testing conditions
You can switch between three manufacturer-specific cooling modes (see table) using the key combination "Fn" + "F". We used "standard mode" (benchmarks) and "whisper mode" (battery test).
| Performance mode | Standard mode | Whisper mode | |
|---|---|---|---|
| Power Limit 1 (HWInfo) | 80 watts | 50 watts | 28 watts |
| Power Limit 2 (HWInfo) | 120 watts | 120 watts | 120 watts |
| TGP (Witcher 3) | 65 watts | 50 watts | 25 watts |
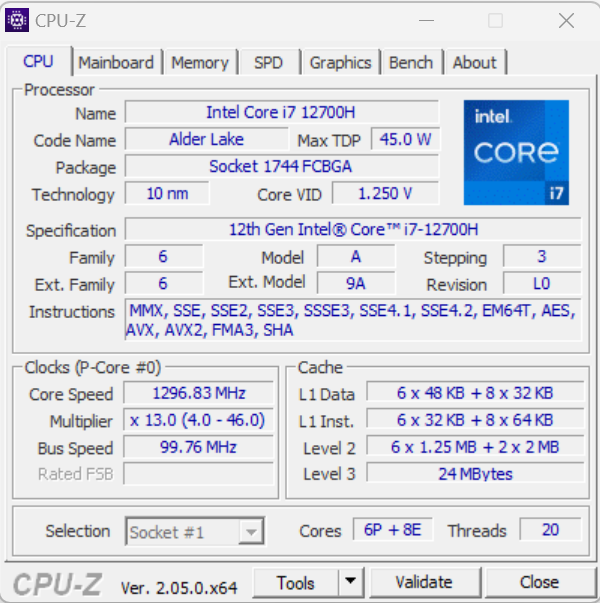
Processor
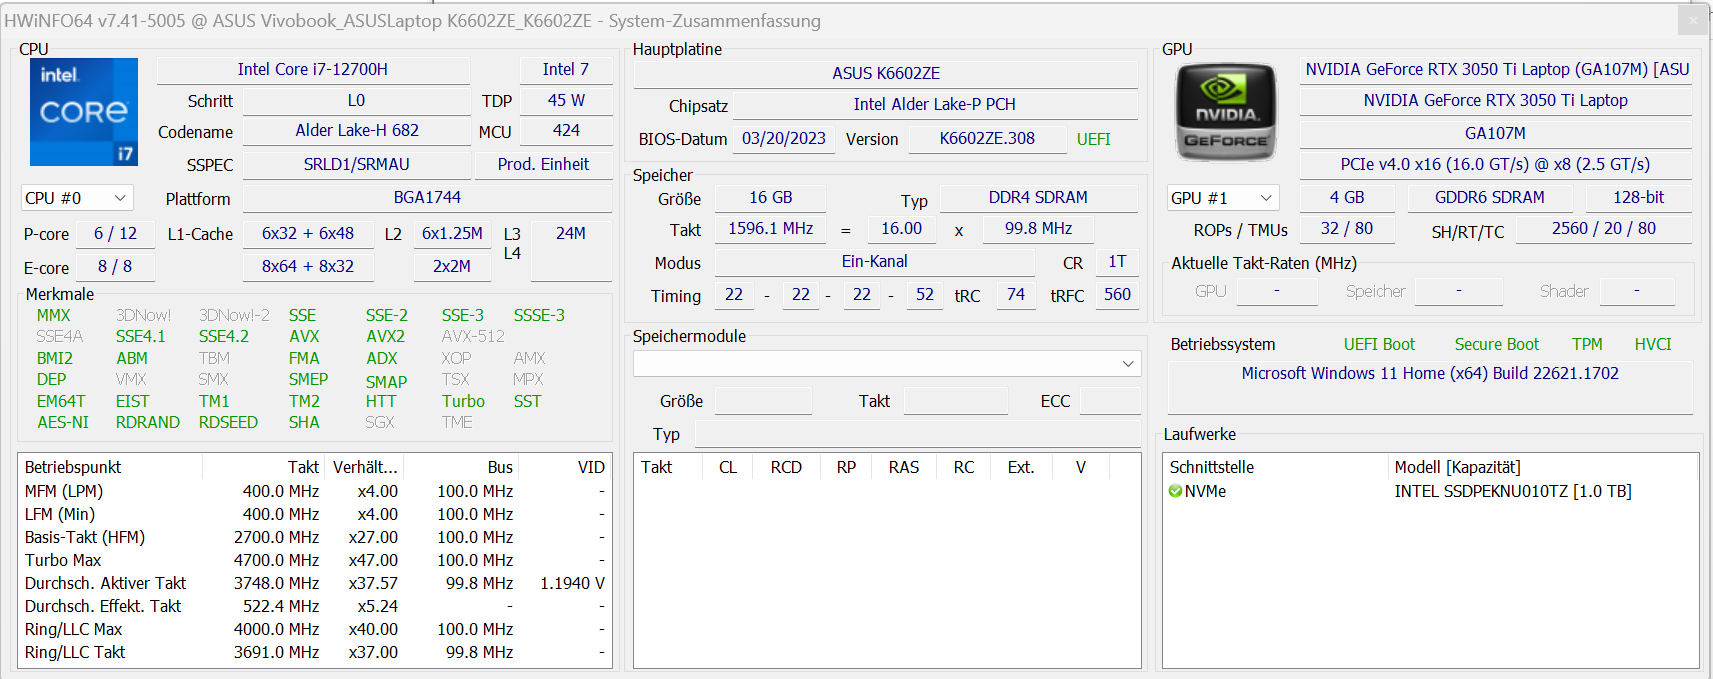
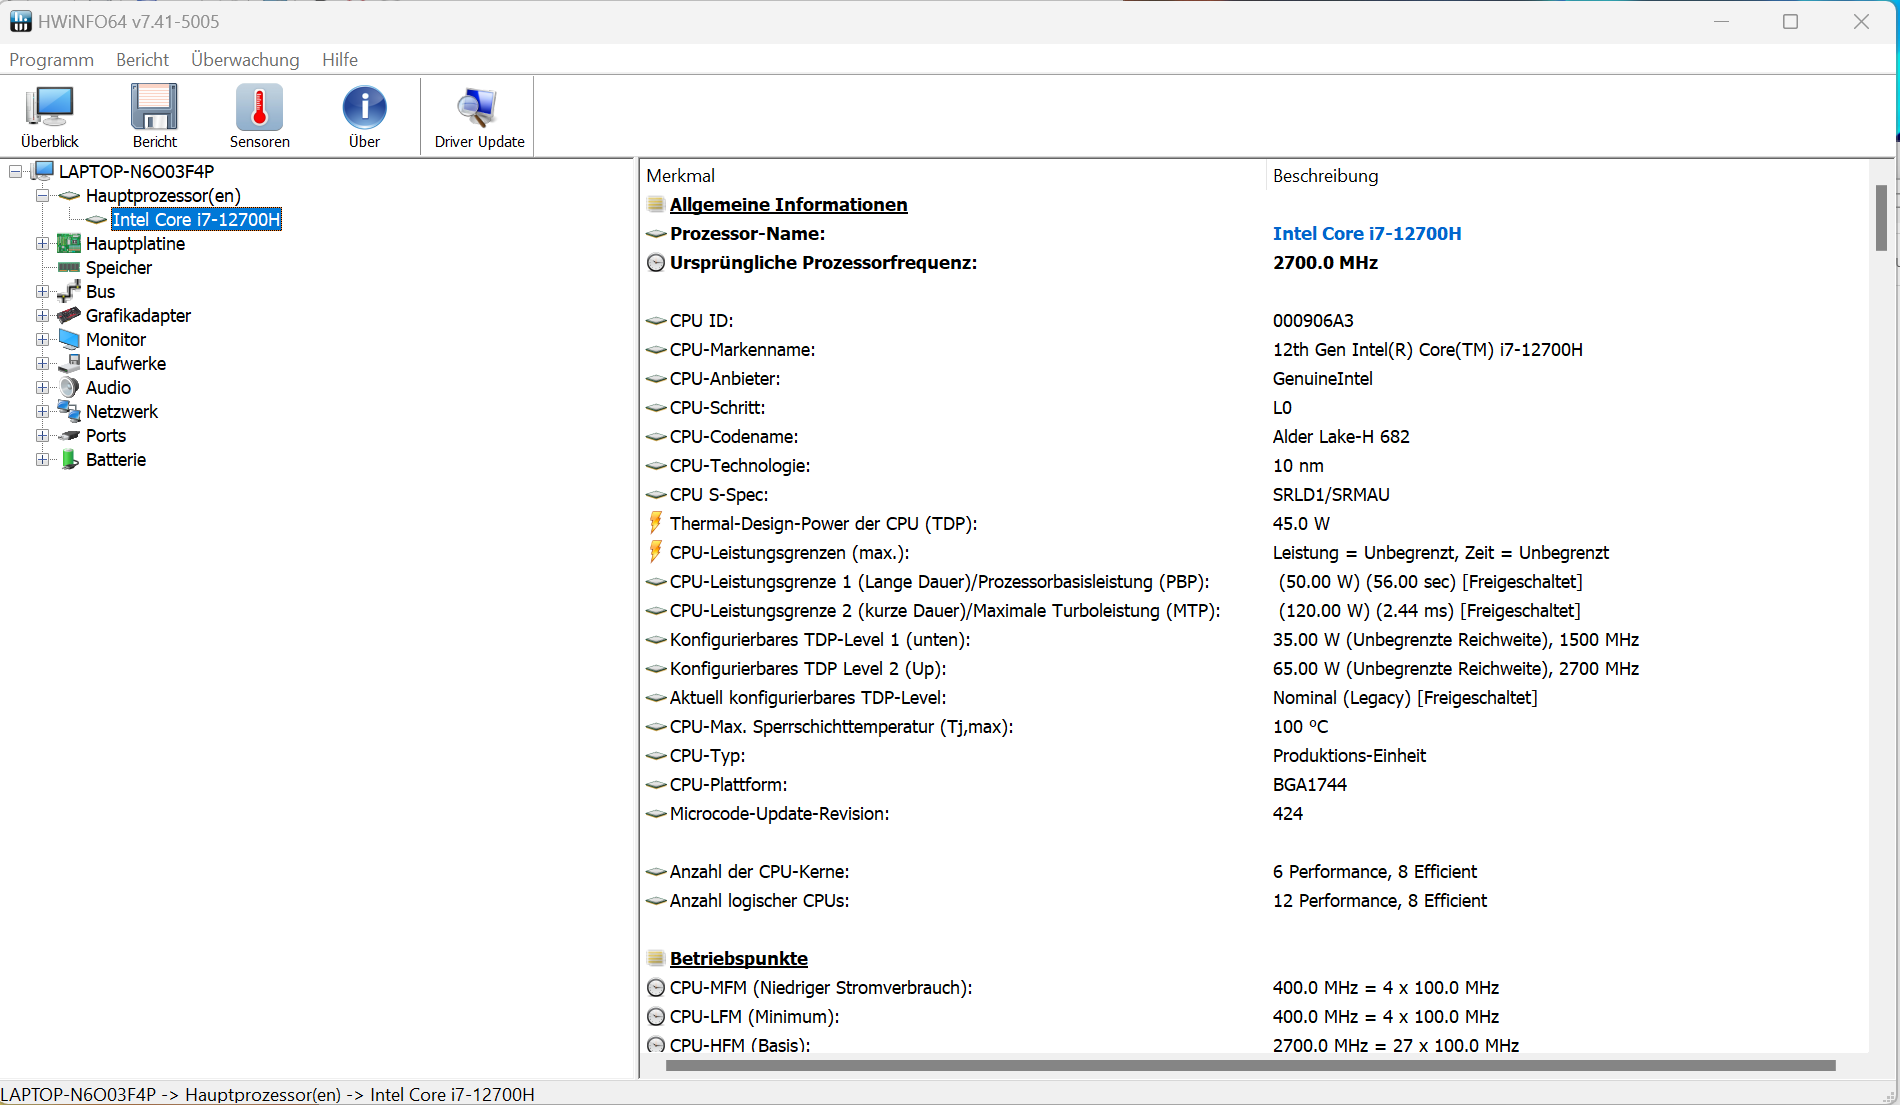
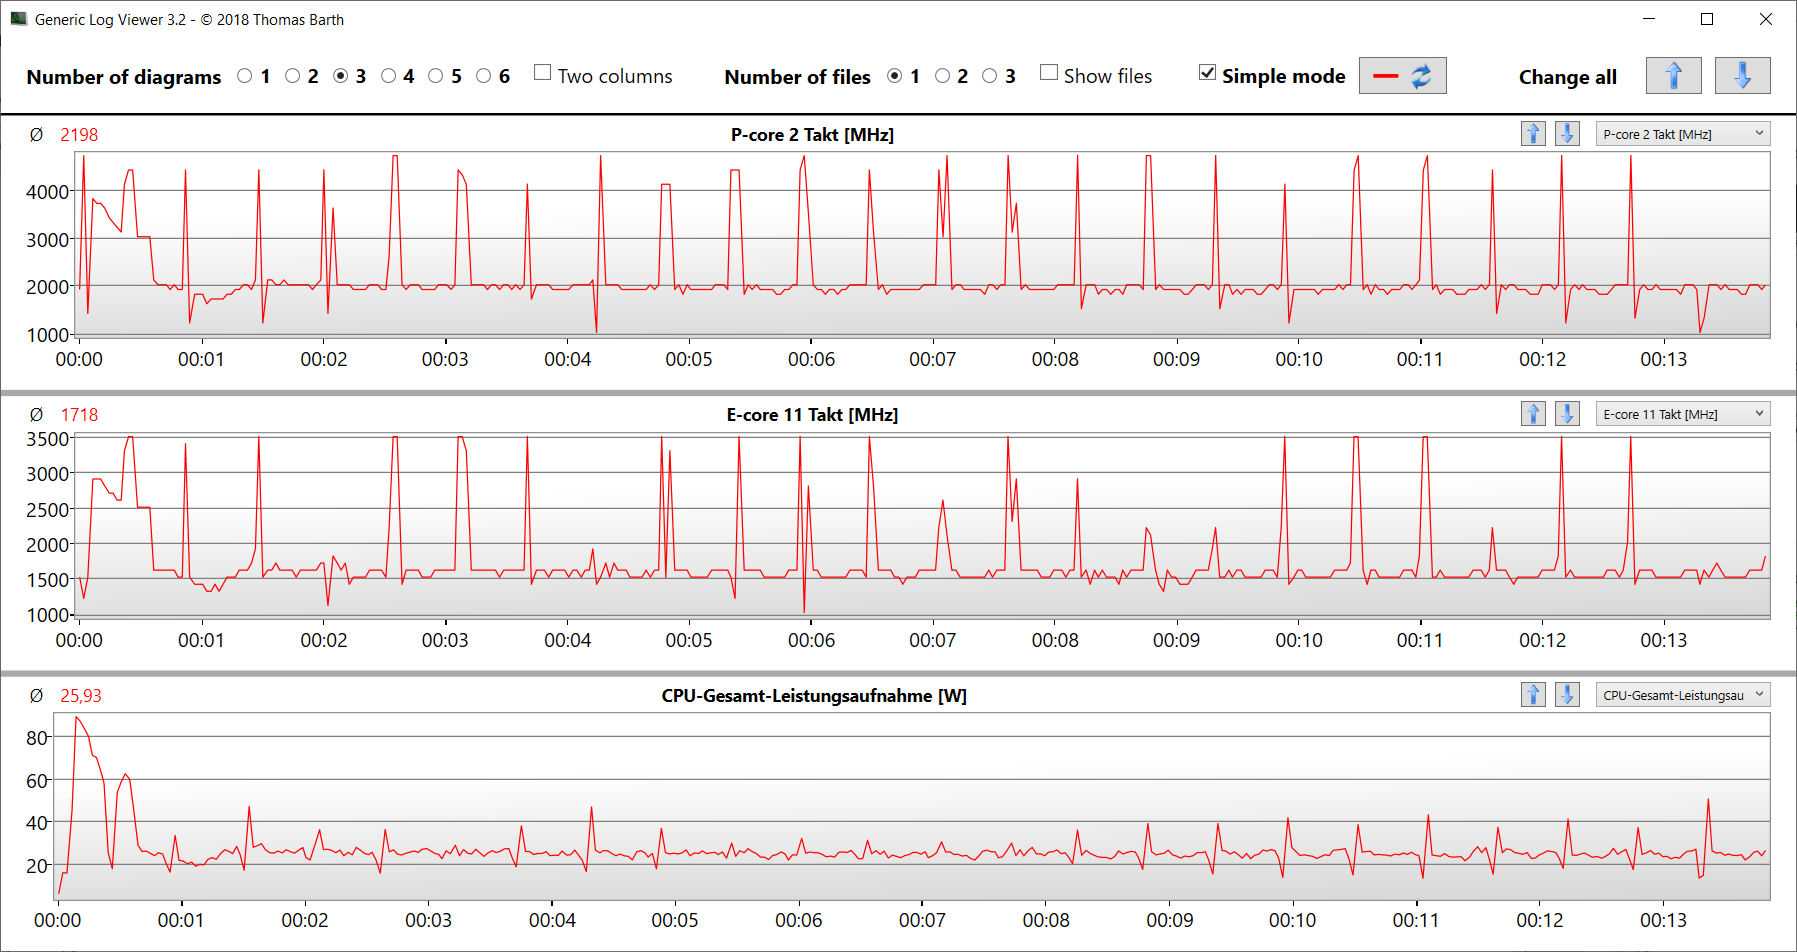
The laptop's Core-i7-12700H processor (Alder Lake) consists of 6 performance cores (hyper threading, 2.4 - 4.7 GHz) and 8 efficiency cores (no hyper threading, 1.8 - 3.5 GHz). In total, this adds up to 20 logical CPU cores.
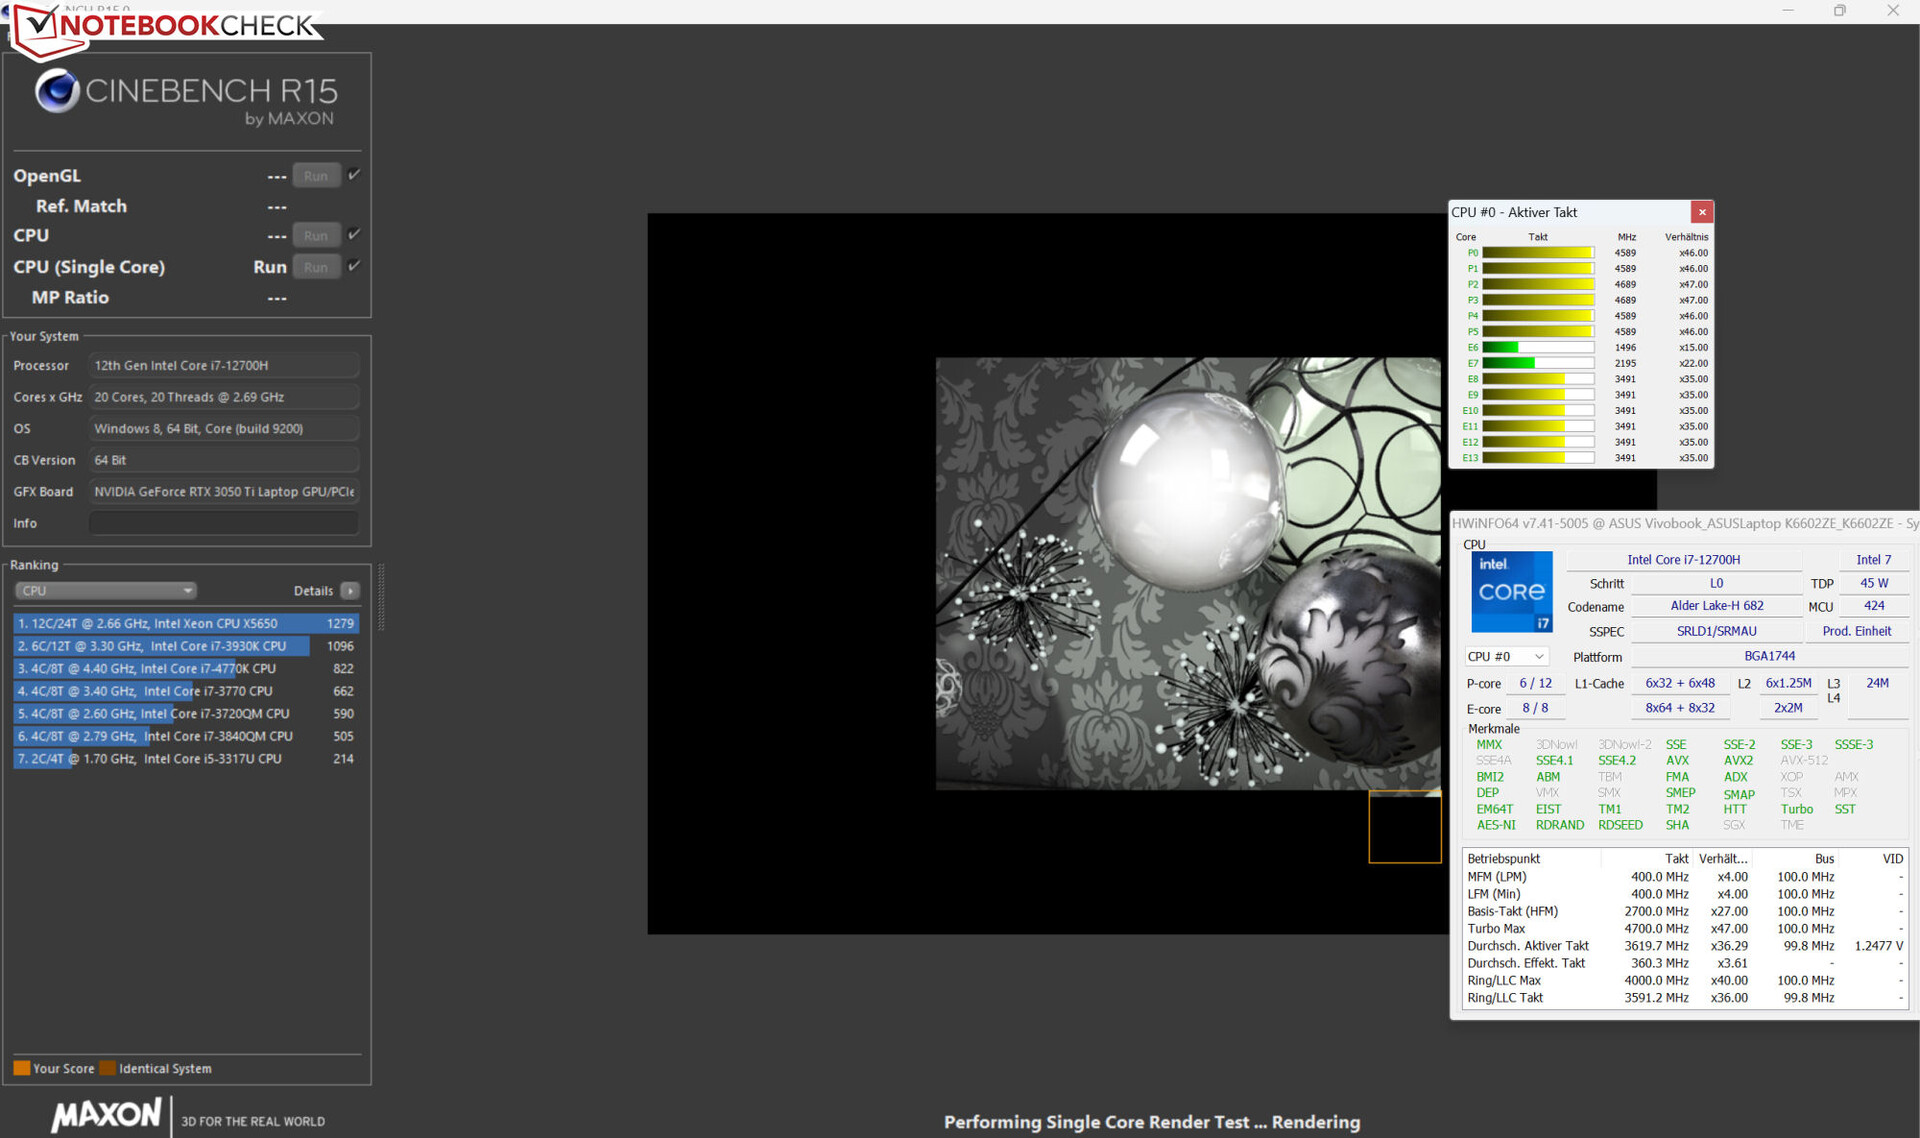
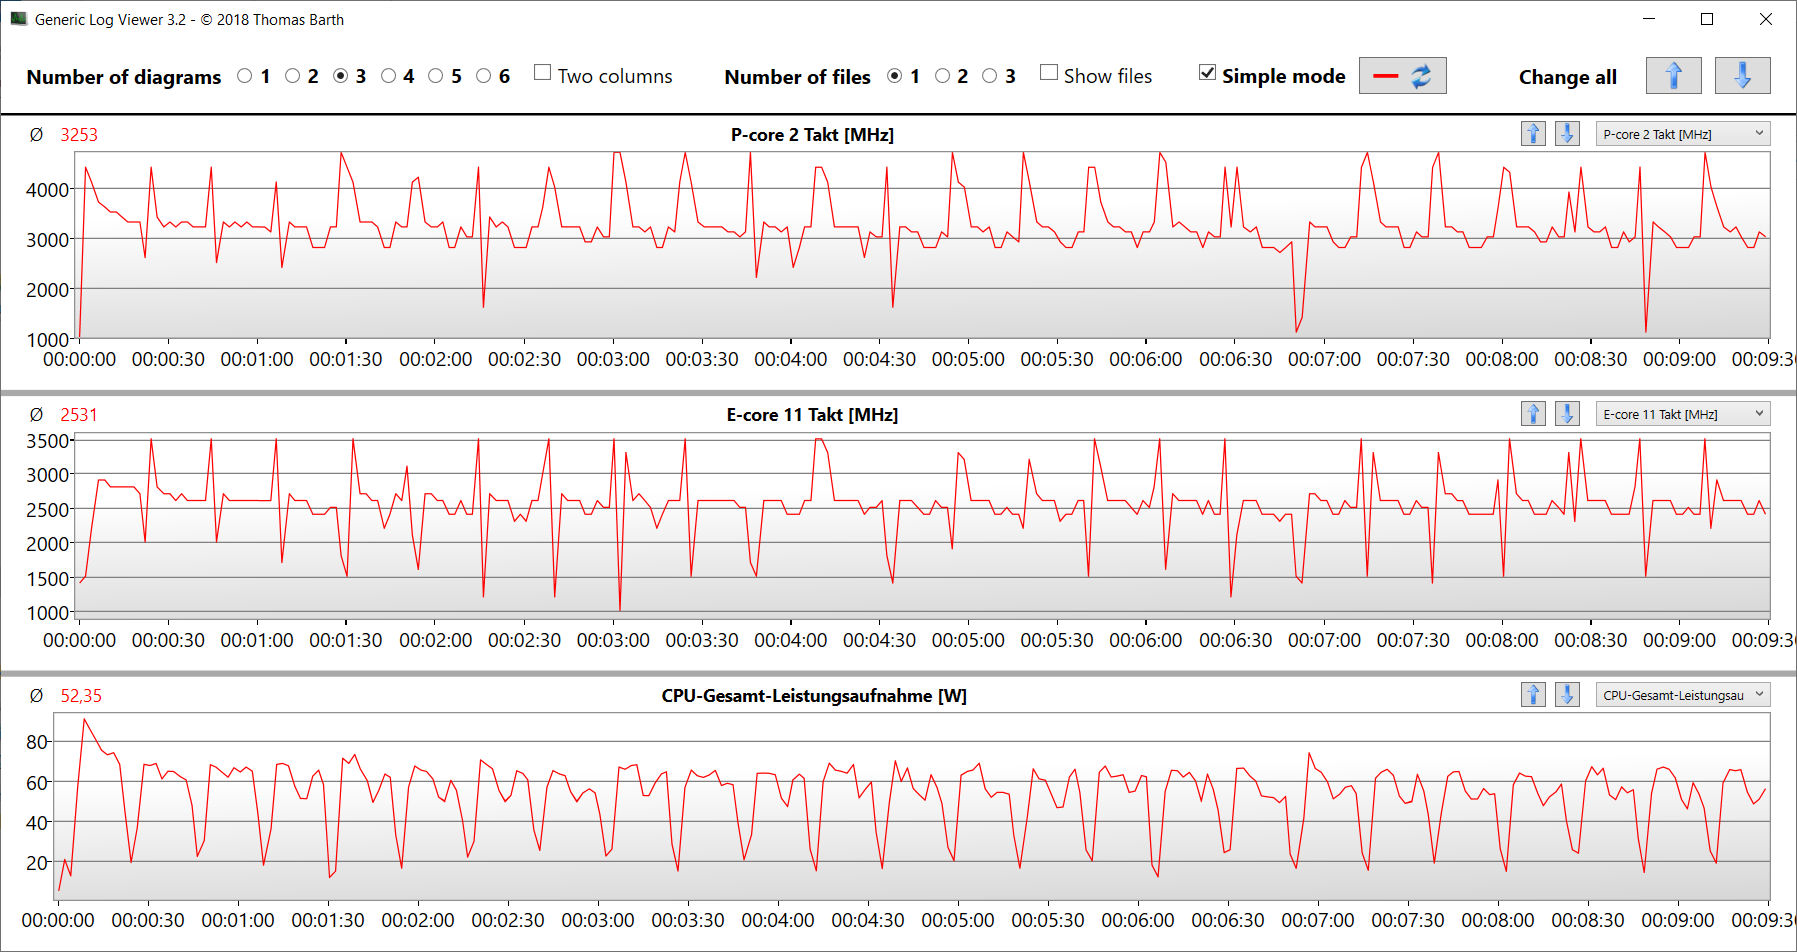
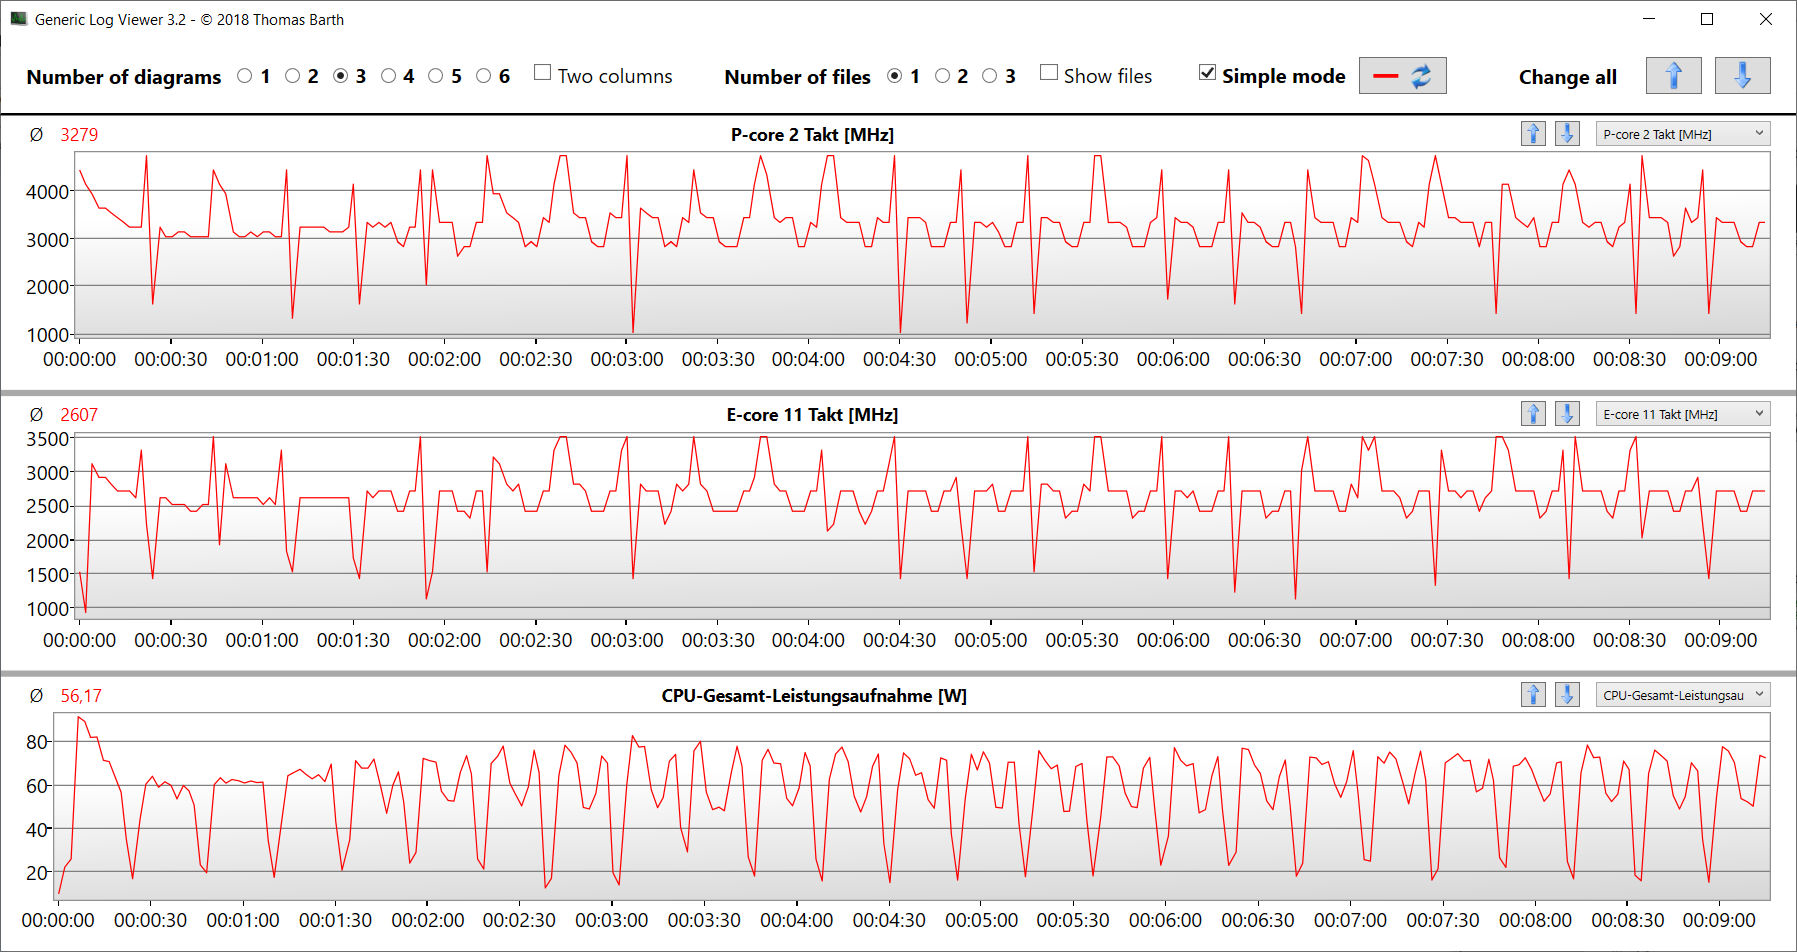
We measured the best benchmark results using activated "performance mode" - although, the distance to "standard mode" was minimal. In any way, these values lay below the CPU's average. In battery mode, its single-thread performance (127 points) was reduced to a greater extent than its multi-thread performance (1,695 points).
The CB15 loop test showed: Continuous multi-thread load led the turbo clock rate to drop from the first to the fourth run. Subsequently, the rates stayed constant. Using "performance mode" led to no performance improvement.
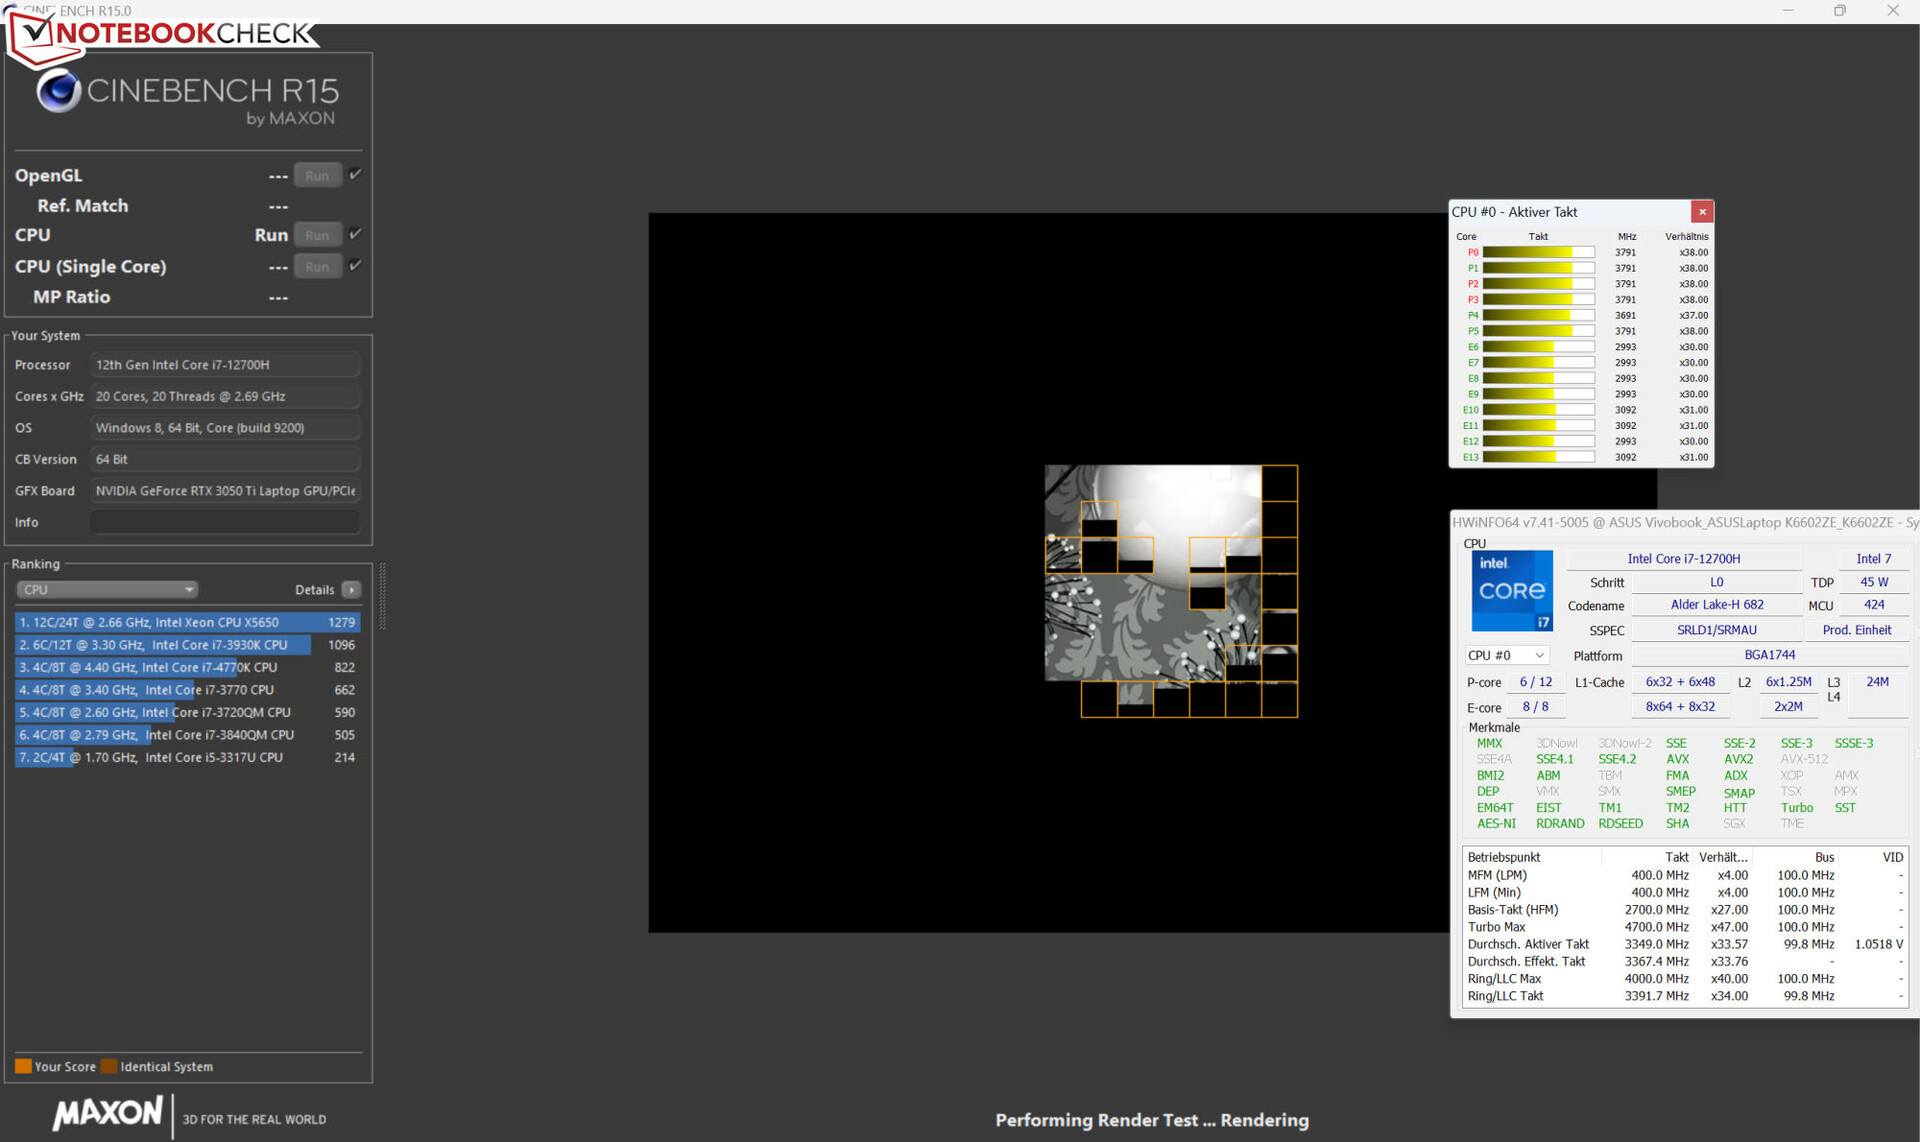
Cinebench R15 Multi continuous test
| CPU Performance rating - Percent | |
| Average of class Multimedia | |
| Average Intel Core i7-12700H | |
| Dell Inspiron 16 Plus 7620 | |
| Asus VivoBook Pro 16 | |
| Acer Swift X SFX16-52G-77RX | |
| Schenker XMG Fusion 15 (Mid 22) | |
* ... smaller is better
AIDA64: FP32 Ray-Trace | FPU Julia | CPU SHA3 | CPU Queen | FPU SinJulia | FPU Mandel | CPU AES | CPU ZLib | FP64 Ray-Trace | CPU PhotoWorxx
| Performance rating | |
| Average of class Multimedia | |
| Schenker XMG Fusion 15 (Mid 22) | |
| Asus VivoBook Pro 16 | |
| Dell Inspiron 16 Plus 7620 | |
| Average Intel Core i7-12700H | |
| Acer Swift X SFX16-52G-77RX | |
| AIDA64 / FP32 Ray-Trace | |
| Average of class Multimedia (2214 - 50388, n=61, last 2 years) | |
| Asus VivoBook Pro 16 (v6.75.6100) | |
| Dell Inspiron 16 Plus 7620 (v6.70.6000) | |
| Schenker XMG Fusion 15 (Mid 22) (v6.70.6000) | |
| Average Intel Core i7-12700H (2585 - 17957, n=64) | |
| Acer Swift X SFX16-52G-77RX (v6.70.6000) | |
| AIDA64 / FPU Julia | |
| Average of class Multimedia (12867 - 201874, n=62, last 2 years) | |
| Asus VivoBook Pro 16 (v6.75.6100) | |
| Dell Inspiron 16 Plus 7620 (v6.70.6000) | |
| Schenker XMG Fusion 15 (Mid 22) (v6.70.6000) | |
| Average Intel Core i7-12700H (12439 - 90760, n=64) | |
| Acer Swift X SFX16-52G-77RX (v6.70.6000) | |
| AIDA64 / CPU SHA3 | |
| Schenker XMG Fusion 15 (Mid 22) (v6.70.6000) | |
| Average of class Multimedia (653 - 8623, n=62, last 2 years) | |
| Asus VivoBook Pro 16 (v6.75.6100) | |
| Average Intel Core i7-12700H (833 - 4242, n=64) | |
| Dell Inspiron 16 Plus 7620 (v6.70.6000) | |
| Acer Swift X SFX16-52G-77RX (v6.70.6000) | |
| AIDA64 / CPU Queen | |
| Asus VivoBook Pro 16 (v6.75.6100) | |
| Average Intel Core i7-12700H (57923 - 103202, n=63) | |
| Dell Inspiron 16 Plus 7620 (v6.70.6000) | |
| Schenker XMG Fusion 15 (Mid 22) | |
| Acer Swift X SFX16-52G-77RX (v6.70.6000) | |
| Average of class Multimedia (13483 - 181505, n=50, last 2 years) | |
| AIDA64 / FPU SinJulia | |
| Average of class Multimedia (1240 - 28794, n=62, last 2 years) | |
| Average Intel Core i7-12700H (3249 - 9939, n=64) | |
| Asus VivoBook Pro 16 (v6.75.6100) | |
| Schenker XMG Fusion 15 (Mid 22) (v6.70.6000) | |
| Dell Inspiron 16 Plus 7620 (v6.70.6000) | |
| Acer Swift X SFX16-52G-77RX (v6.70.6000) | |
| AIDA64 / FPU Mandel | |
| Average of class Multimedia (6395 - 105740, n=61, last 2 years) | |
| Schenker XMG Fusion 15 (Mid 22) (v6.70.6000) | |
| Asus VivoBook Pro 16 (v6.75.6100) | |
| Dell Inspiron 16 Plus 7620 (v6.70.6000) | |
| Average Intel Core i7-12700H (7135 - 44760, n=64) | |
| Acer Swift X SFX16-52G-77RX (v6.70.6000) | |
| AIDA64 / CPU AES | |
| Schenker XMG Fusion 15 (Mid 22) (v6.70.6000) | |
| Average Intel Core i7-12700H (31839 - 144360, n=64) | |
| Average of class Multimedia (13243 - 126790, n=62, last 2 years) | |
| Asus VivoBook Pro 16 (v6.75.6100) | |
| Dell Inspiron 16 Plus 7620 (v6.70.6000) | |
| Acer Swift X SFX16-52G-77RX (v6.70.6000) | |
| AIDA64 / CPU ZLib | |
| Average of class Multimedia (167.2 - 2022, n=62, last 2 years) | |
| Dell Inspiron 16 Plus 7620 (v6.70.6000) | |
| Average Intel Core i7-12700H (305 - 1171, n=64) | |
| Asus VivoBook Pro 16 (v6.75.6100) | |
| Schenker XMG Fusion 15 (Mid 22) (v6.70.6000) | |
| Acer Swift X SFX16-52G-77RX (v6.70.6000) | |
| AIDA64 / FP64 Ray-Trace | |
| Average of class Multimedia (1014 - 26875, n=62, last 2 years) | |
| Asus VivoBook Pro 16 (v6.75.6100) | |
| Schenker XMG Fusion 15 (Mid 22) (v6.70.6000) | |
| Dell Inspiron 16 Plus 7620 (v6.70.6000) | |
| Average Intel Core i7-12700H (1437 - 9692, n=64) | |
| Acer Swift X SFX16-52G-77RX (v6.70.6000) | |
| AIDA64 / CPU PhotoWorxx | |
| Average of class Multimedia (12860 - 88154, n=62, last 2 years) | |
| Acer Swift X SFX16-52G-77RX (v6.70.6000) | |
| Dell Inspiron 16 Plus 7620 (v6.70.6000) | |
| Average Intel Core i7-12700H (12863 - 52207, n=64) | |
| Schenker XMG Fusion 15 (Mid 22) (v6.70.6000) | |
| Asus VivoBook Pro 16 (v6.75.6100) | |
System performance
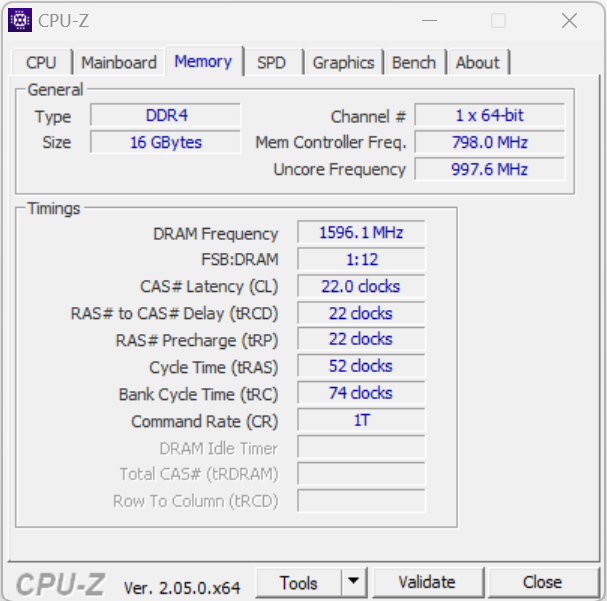
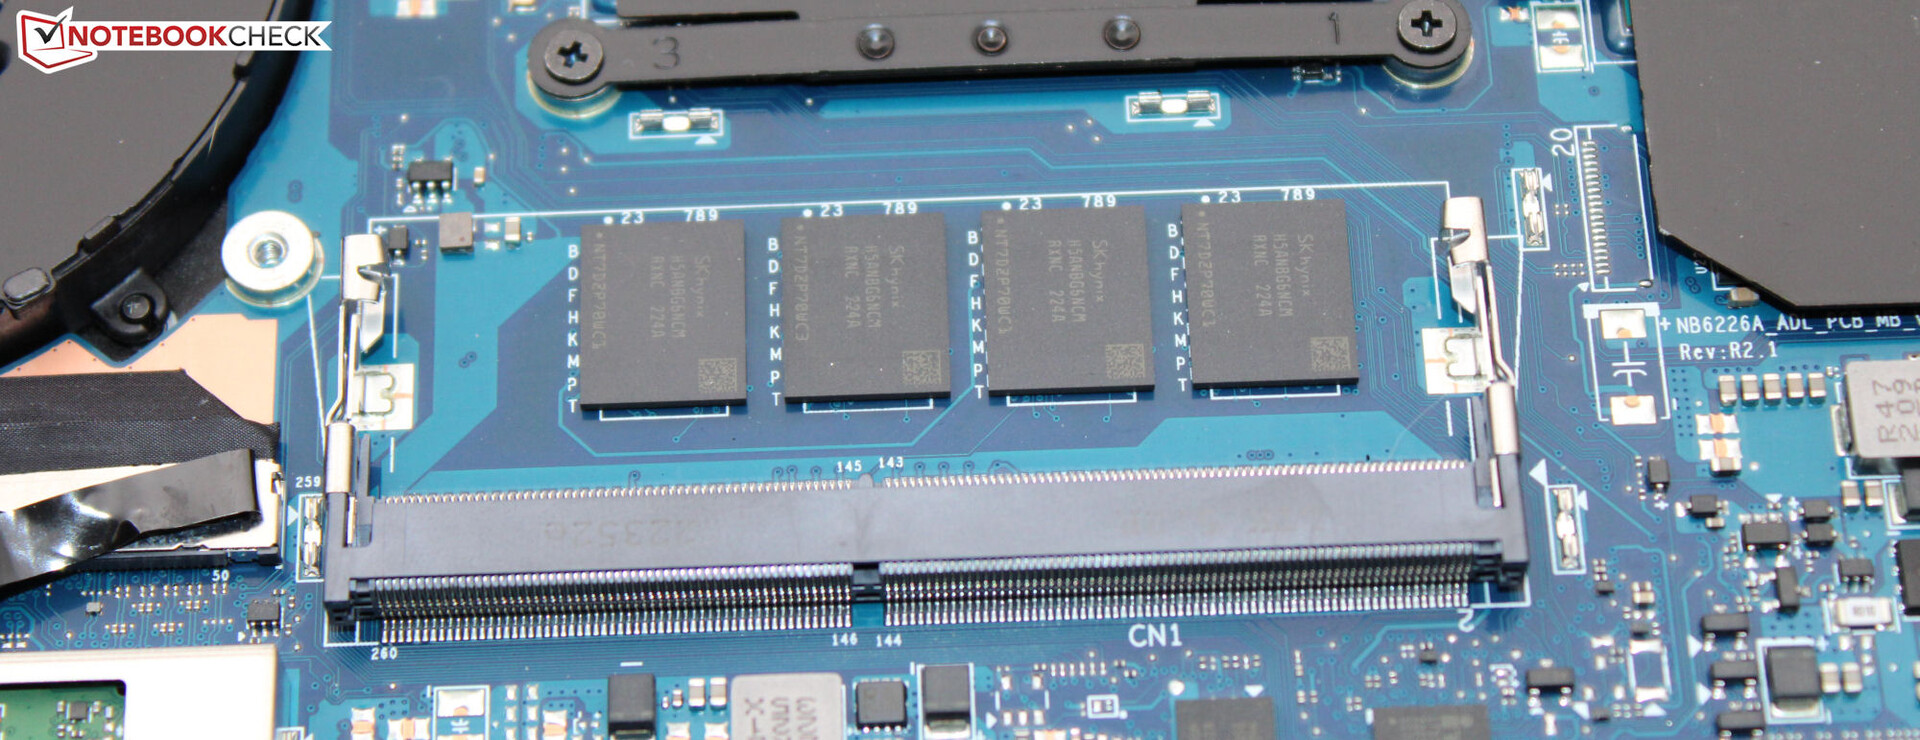
Its smoothly running system masters gaming, streaming and rendering. One part of its processing power lay idle, as the RAM (16 GB, DDR4-3200, onboard) only runs in single-channel mode. Installing a memory module (= dual-channel mode active) would solve this issue - and it would also boost its data rates to similar levels compared to its competitors with the same storage.
CrossMark: Overall | Productivity | Creativity | Responsiveness
| PCMark 10 / Score | |
| Average of class Multimedia (4325 - 10386, n=59, last 2 years) | |
| Dell Inspiron 16 Plus 7620 | |
| Average Intel Core i7-12700H, NVIDIA GeForce RTX 3050 Ti Laptop GPU (6623 - 7075, n=5) | |
| Asus VivoBook Pro 16 | |
| Schenker XMG Fusion 15 (Mid 22) | |
| Acer Swift X SFX16-52G-77RX | |
| PCMark 10 / Essentials | |
| Acer Swift X SFX16-52G-77RX | |
| Average of class Multimedia (8025 - 11664, n=58, last 2 years) | |
| Average Intel Core i7-12700H, NVIDIA GeForce RTX 3050 Ti Laptop GPU (9540 - 10970, n=5) | |
| Dell Inspiron 16 Plus 7620 | |
| Schenker XMG Fusion 15 (Mid 22) | |
| Asus VivoBook Pro 16 | |
| PCMark 10 / Productivity | |
| Average of class Multimedia (7323 - 18233, n=58, last 2 years) | |
| Dell Inspiron 16 Plus 7620 | |
| Average Intel Core i7-12700H, NVIDIA GeForce RTX 3050 Ti Laptop GPU (8530 - 9555, n=5) | |
| Asus VivoBook Pro 16 | |
| Schenker XMG Fusion 15 (Mid 22) | |
| Acer Swift X SFX16-52G-77RX | |
| PCMark 10 / Digital Content Creation | |
| Average of class Multimedia (3651 - 16240, n=58, last 2 years) | |
| Dell Inspiron 16 Plus 7620 | |
| Asus VivoBook Pro 16 | |
| Average Intel Core i7-12700H, NVIDIA GeForce RTX 3050 Ti Laptop GPU (8855 - 9542, n=5) | |
| Acer Swift X SFX16-52G-77RX | |
| Schenker XMG Fusion 15 (Mid 22) | |
| CrossMark / Overall | |
| Average of class Multimedia (866 - 2728, n=68, last 2 years) | |
| Dell Inspiron 16 Plus 7620 | |
| Acer Swift X SFX16-52G-77RX | |
| Average Intel Core i7-12700H, NVIDIA GeForce RTX 3050 Ti Laptop GPU (1654 - 1872, n=5) | |
| Asus VivoBook Pro 16 | |
| Schenker XMG Fusion 15 (Mid 22) | |
| CrossMark / Productivity | |
| Average of class Multimedia (931 - 2489, n=68, last 2 years) | |
| Acer Swift X SFX16-52G-77RX | |
| Asus VivoBook Pro 16 | |
| Average Intel Core i7-12700H, NVIDIA GeForce RTX 3050 Ti Laptop GPU (1595 - 1792, n=5) | |
| Dell Inspiron 16 Plus 7620 | |
| Schenker XMG Fusion 15 (Mid 22) | |
| CrossMark / Creativity | |
| Average of class Multimedia (907 - 3465, n=68, last 2 years) | |
| Dell Inspiron 16 Plus 7620 | |
| Average Intel Core i7-12700H, NVIDIA GeForce RTX 3050 Ti Laptop GPU (1699 - 1993, n=5) | |
| Acer Swift X SFX16-52G-77RX | |
| Asus VivoBook Pro 16 | |
| Schenker XMG Fusion 15 (Mid 22) | |
| CrossMark / Responsiveness | |
| Asus VivoBook Pro 16 | |
| Acer Swift X SFX16-52G-77RX | |
| Schenker XMG Fusion 15 (Mid 22) | |
| Average Intel Core i7-12700H, NVIDIA GeForce RTX 3050 Ti Laptop GPU (1383 - 1768, n=5) | |
| Dell Inspiron 16 Plus 7620 | |
| Average of class Multimedia (605 - 2024, n=68, last 2 years) | |
| PCMark 8 Home Score Accelerated v2 | 4565 points | |
| PCMark 8 Work Score Accelerated v2 | 5386 points | |
| PCMark 10 Score | 6652 points | |
Help | ||
| AIDA64 / Memory Copy | |
| Average of class Multimedia (21158 - 132135, n=62, last 2 years) | |
| Acer Swift X SFX16-52G-77RX | |
| Dell Inspiron 16 Plus 7620 | |
| Average Intel Core i7-12700H (25615 - 80511, n=64) | |
| Schenker XMG Fusion 15 (Mid 22) | |
| Asus VivoBook Pro 16 | |
| AIDA64 / Memory Read | |
| Average of class Multimedia (19699 - 174586, n=62, last 2 years) | |
| Acer Swift X SFX16-52G-77RX | |
| Dell Inspiron 16 Plus 7620 | |
| Average Intel Core i7-12700H (25586 - 79442, n=64) | |
| Schenker XMG Fusion 15 (Mid 22) | |
| Asus VivoBook Pro 16 | |
| AIDA64 / Memory Write | |
| Average of class Multimedia (17733 - 134998, n=62, last 2 years) | |
| Acer Swift X SFX16-52G-77RX | |
| Dell Inspiron 16 Plus 7620 | |
| Average Intel Core i7-12700H (23679 - 88660, n=64) | |
| Schenker XMG Fusion 15 (Mid 22) | |
| Asus VivoBook Pro 16 | |
| AIDA64 / Memory Latency | |
| Average of class Multimedia (7 - 535, n=61, last 2 years) | |
| Acer Swift X SFX16-52G-77RX | |
| Dell Inspiron 16 Plus 7620 | |
| Schenker XMG Fusion 15 (Mid 22) | |
| Asus VivoBook Pro 16 | |
| Average Intel Core i7-12700H (76.2 - 133.9, n=62) | |
* ... smaller is better
DPC latency
The standardized latency monitor test (web surfing, 4k video playback, Prime95 high-load) revealed some anomalies. The system does not seem to be suitable for real-time video and audio editing. Future software updates could lead to improvements or even degradations.
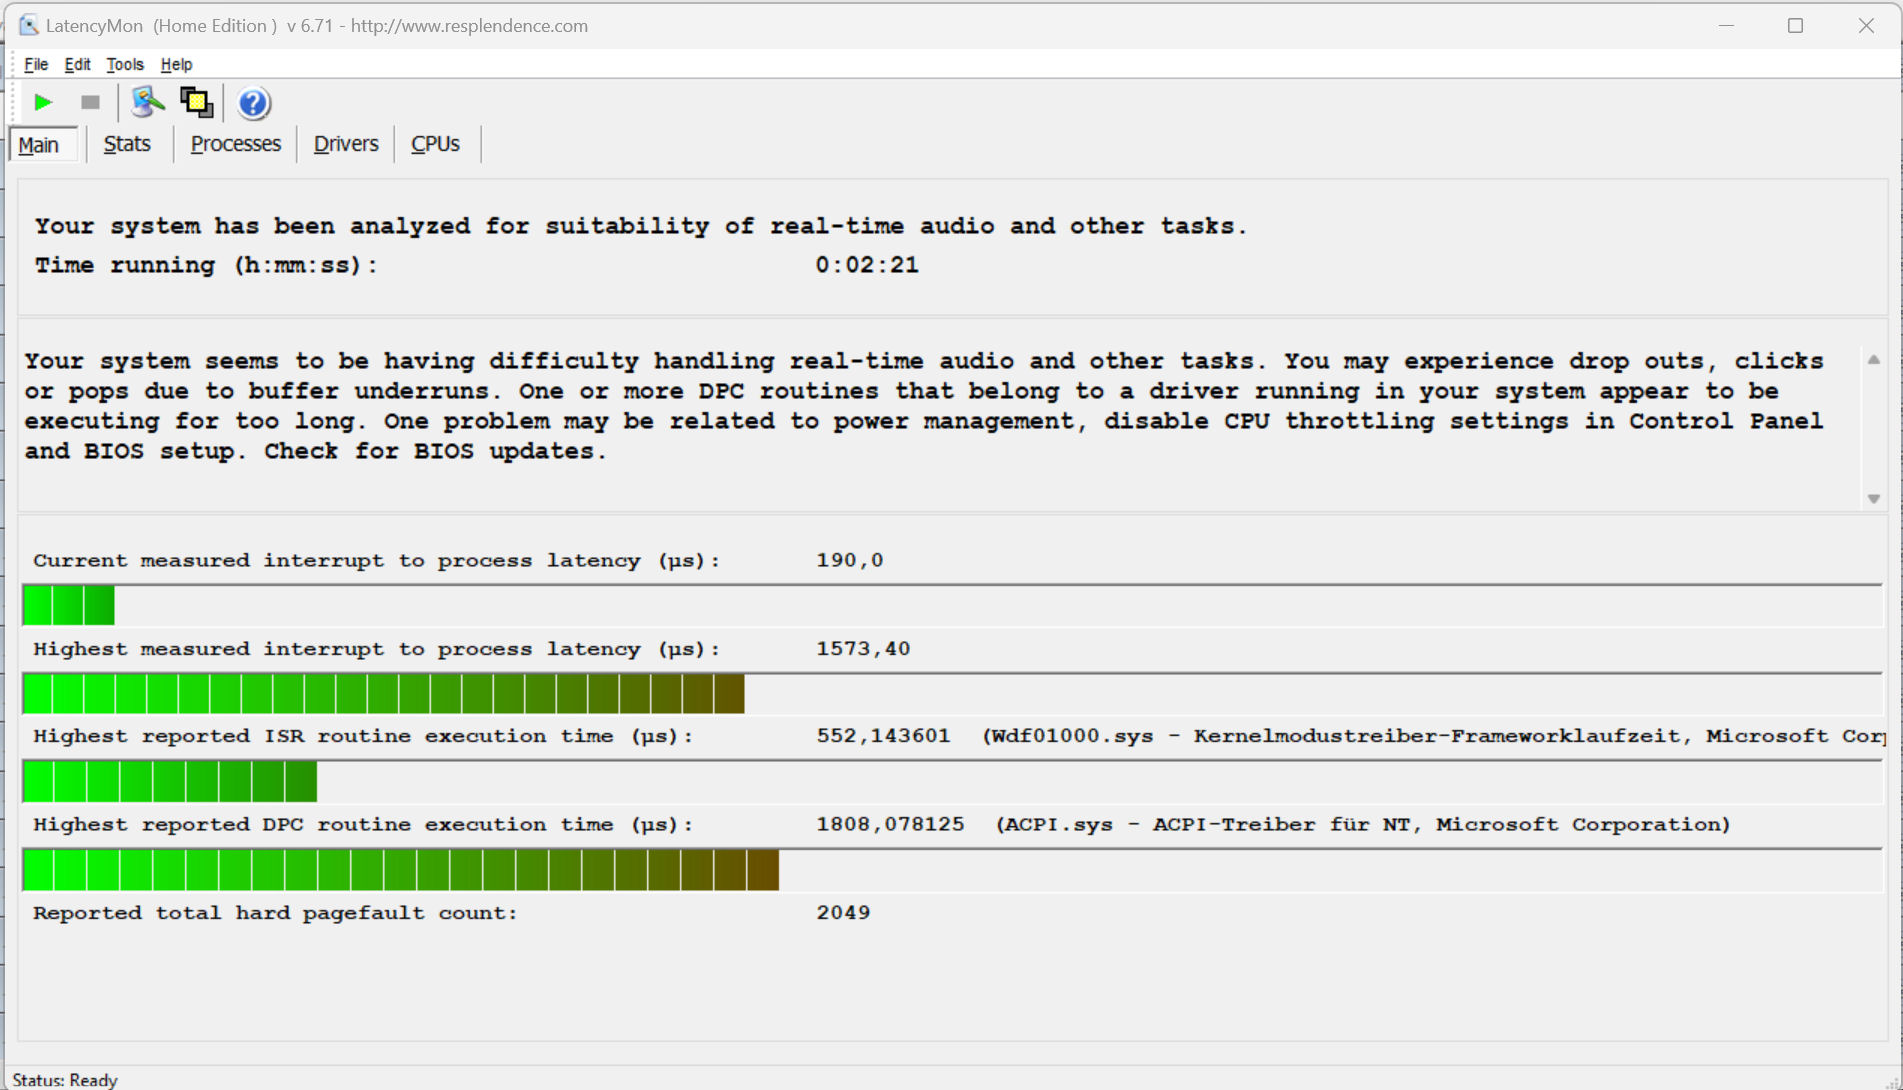
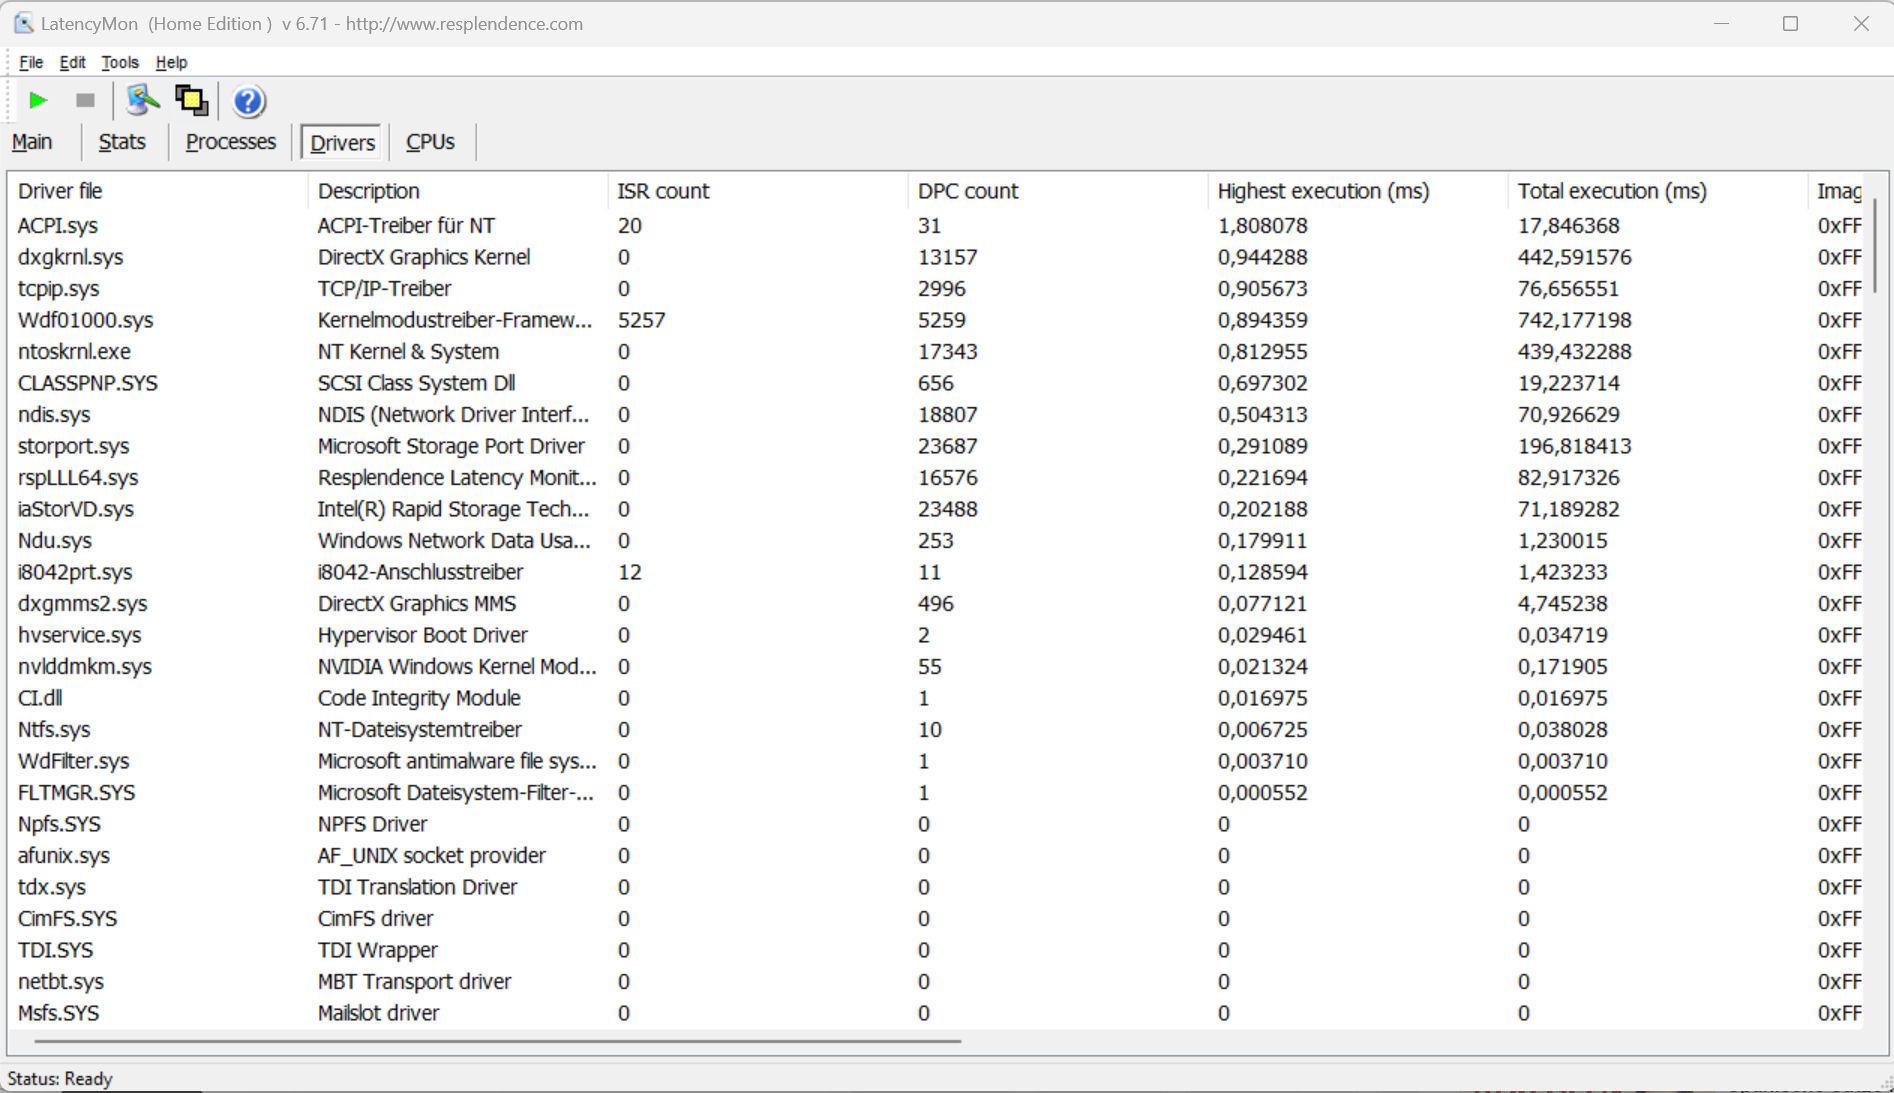
| DPC Latencies / LatencyMon - interrupt to process latency (max), Web, Youtube, Prime95 | |
| Schenker XMG Fusion 15 (Mid 22) | |
| Asus VivoBook Pro 16 | |
| Dell Inspiron 16 Plus 7620 | |
| Acer Swift X SFX16-52G-77RX | |
* ... smaller is better
Storage devices
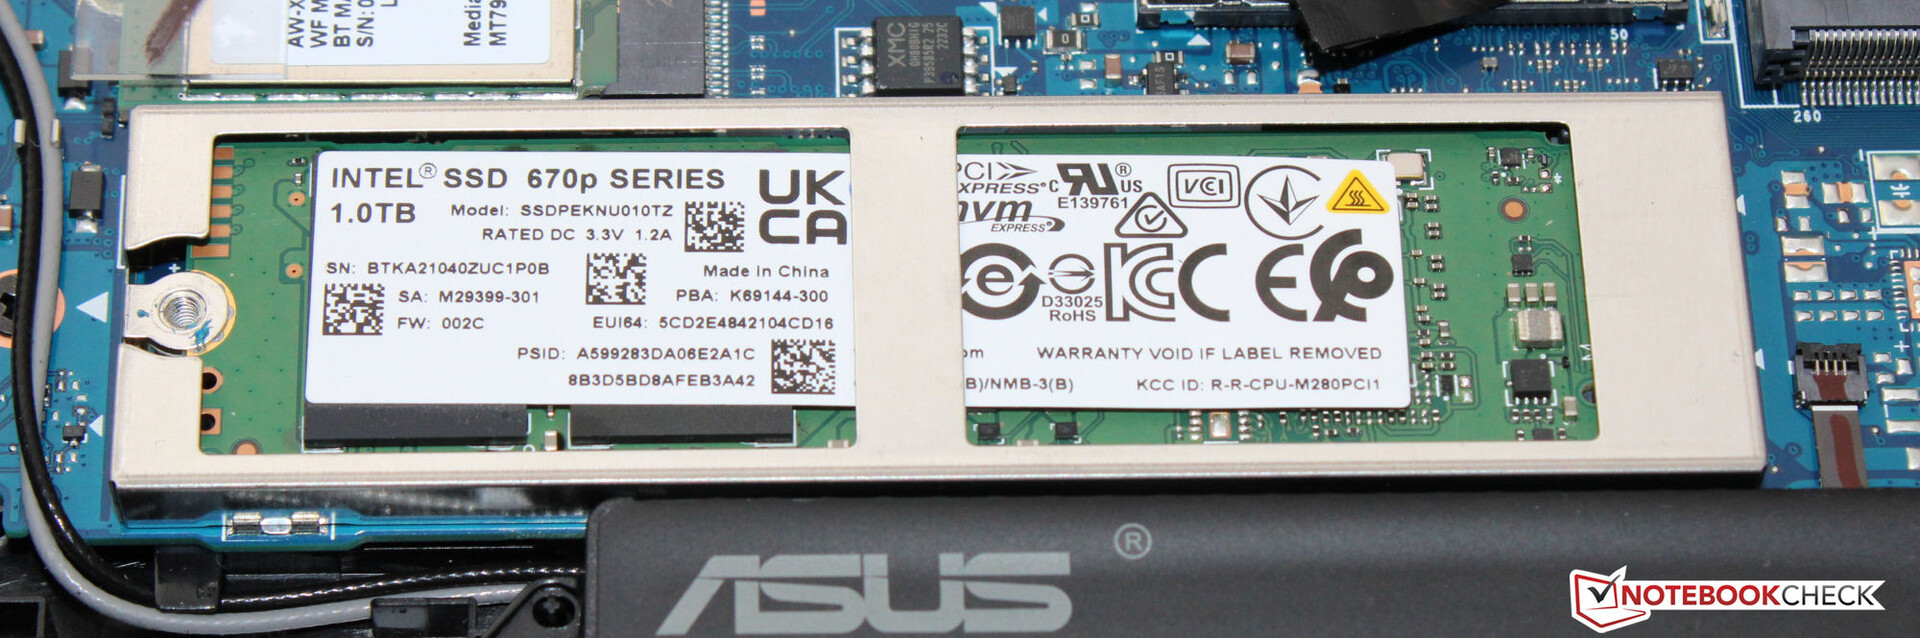
Asus has equipped the notebook with a PCIe-3 SSD (M.2-2280) from Intel, which has a capacity of 1 TB. It delivers good data rates but can't be classed as an SSD elite. The computer offers space for a second SSD.

* ... smaller is better
reading continuous performance: DiskSpd Read Loop, Queue Depth 8
Graphics card
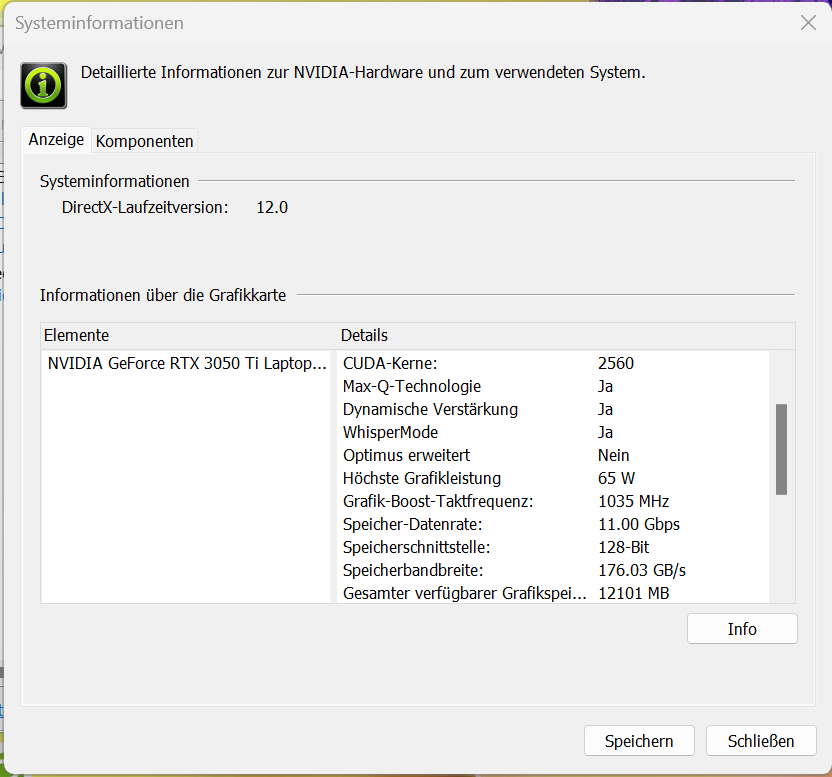
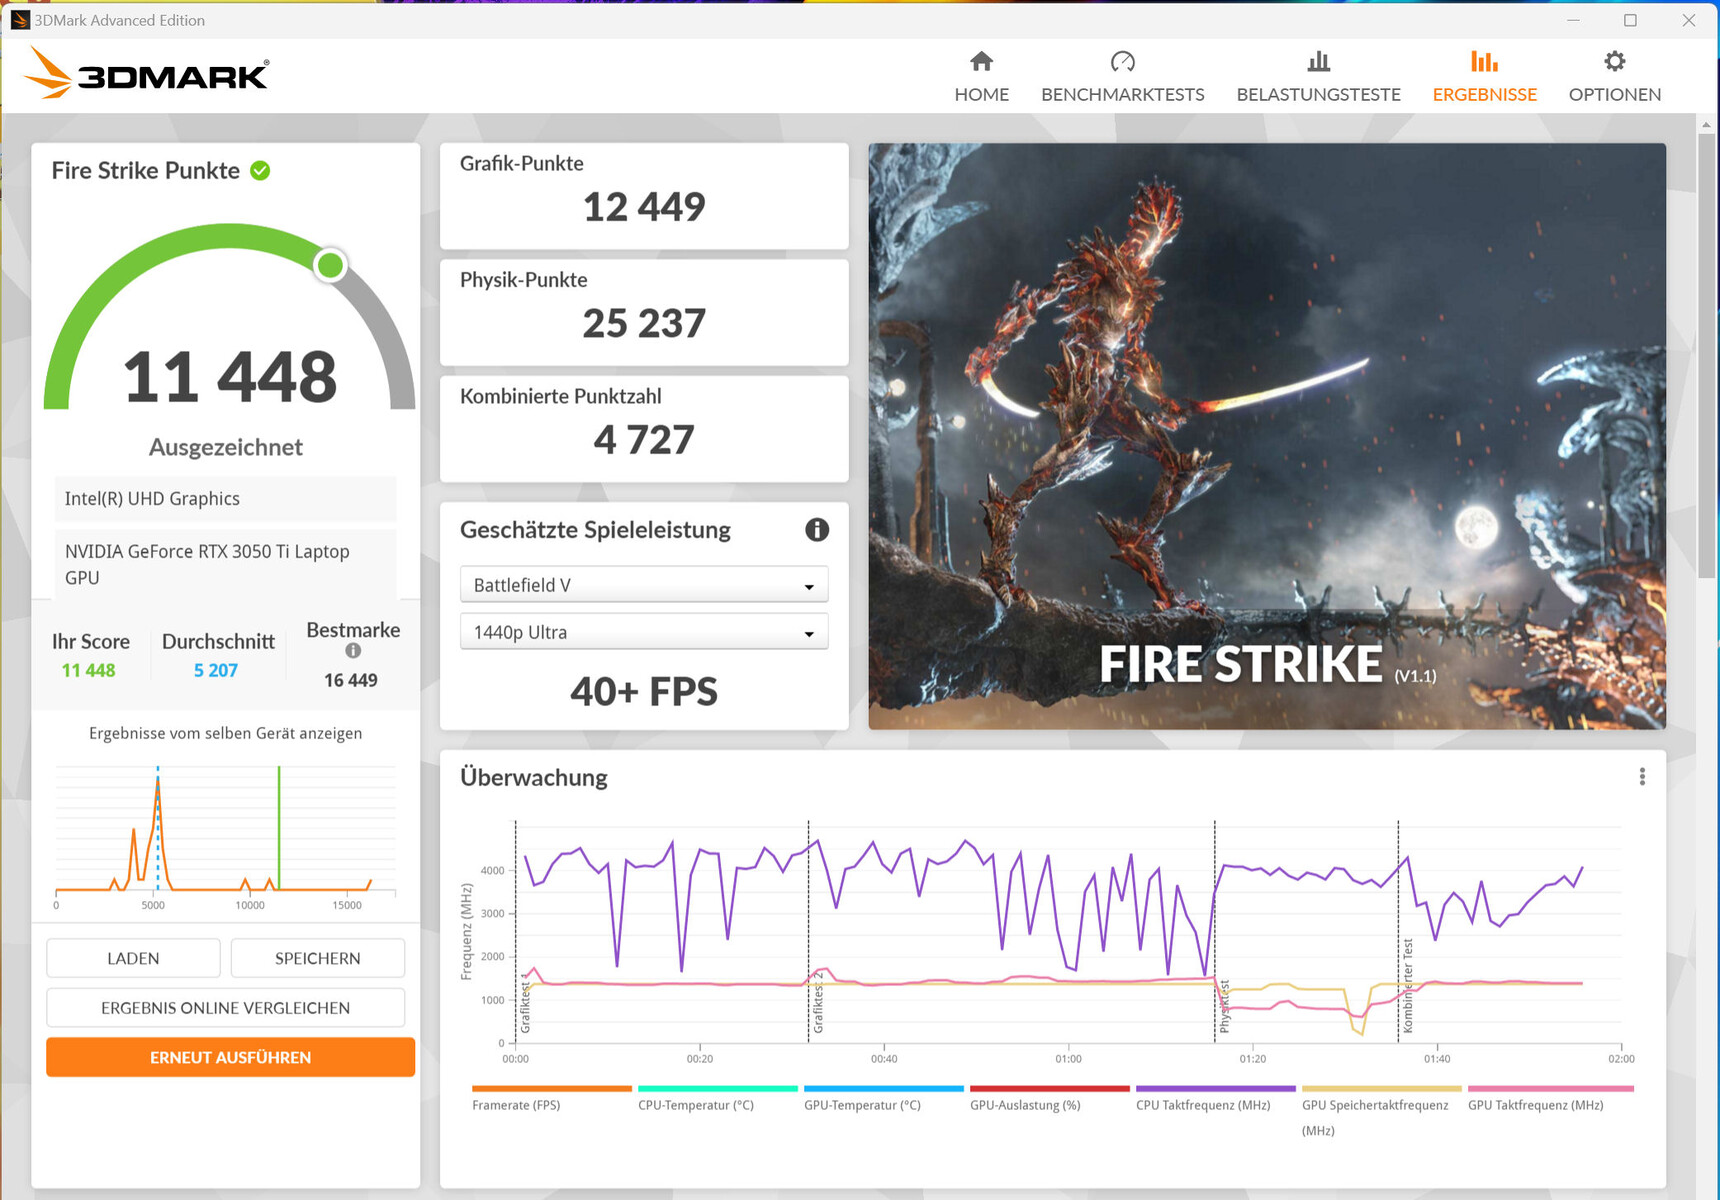
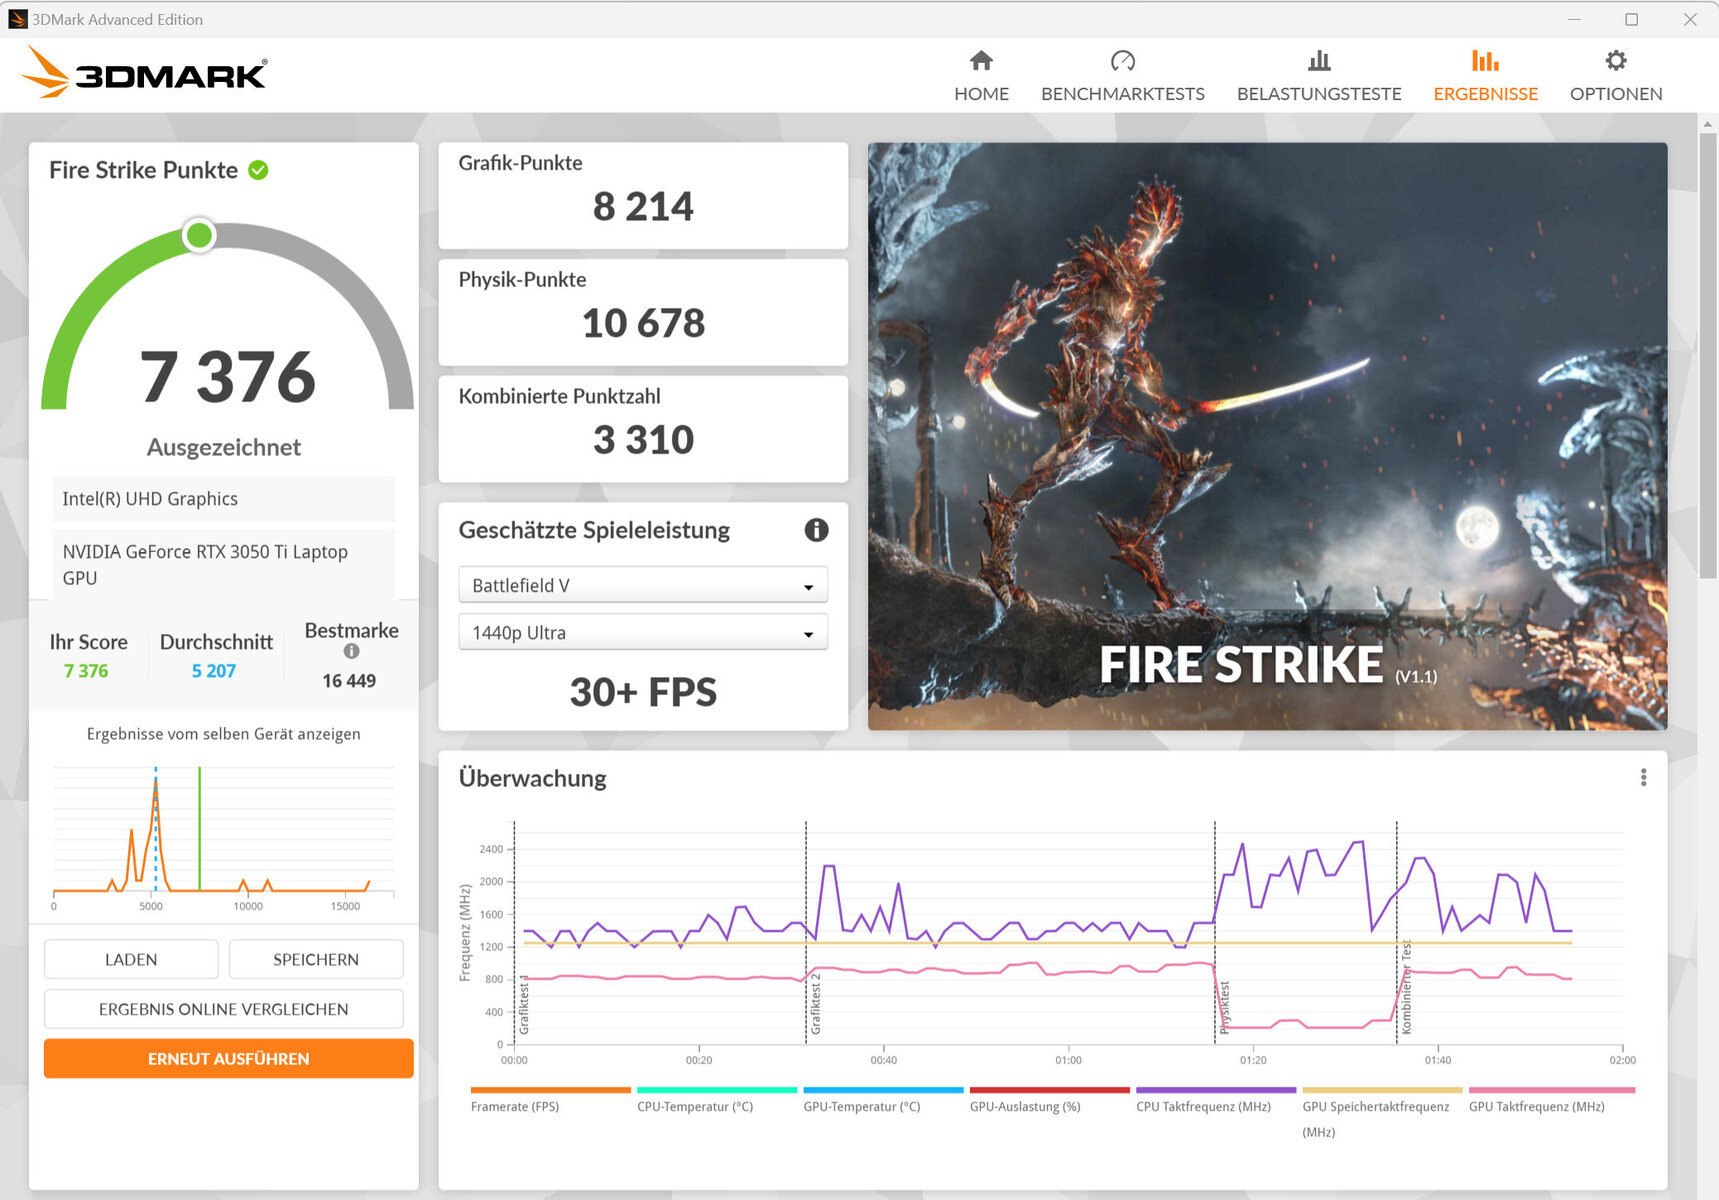
Our benchmarks and game tests revealed the GeForce RTX 3050 Ti Laptop GPU's (TGP: 65 watts) performance rates to fall just under the GPU's average ("standard mode"). Using "performance mode" led to 10 to 15 per cent higher rates - according to the Witcher 3 test, the TGP was exhausted. Using dGPU mode (via the MyAsus app) led to no improvement in performance.
The computer allows for FHD gaming using low to high settings and HD gaming using low to medium settings (whisper mode). The latter lowered the TGP to 25 watts, which resulted in lower noise emissions.
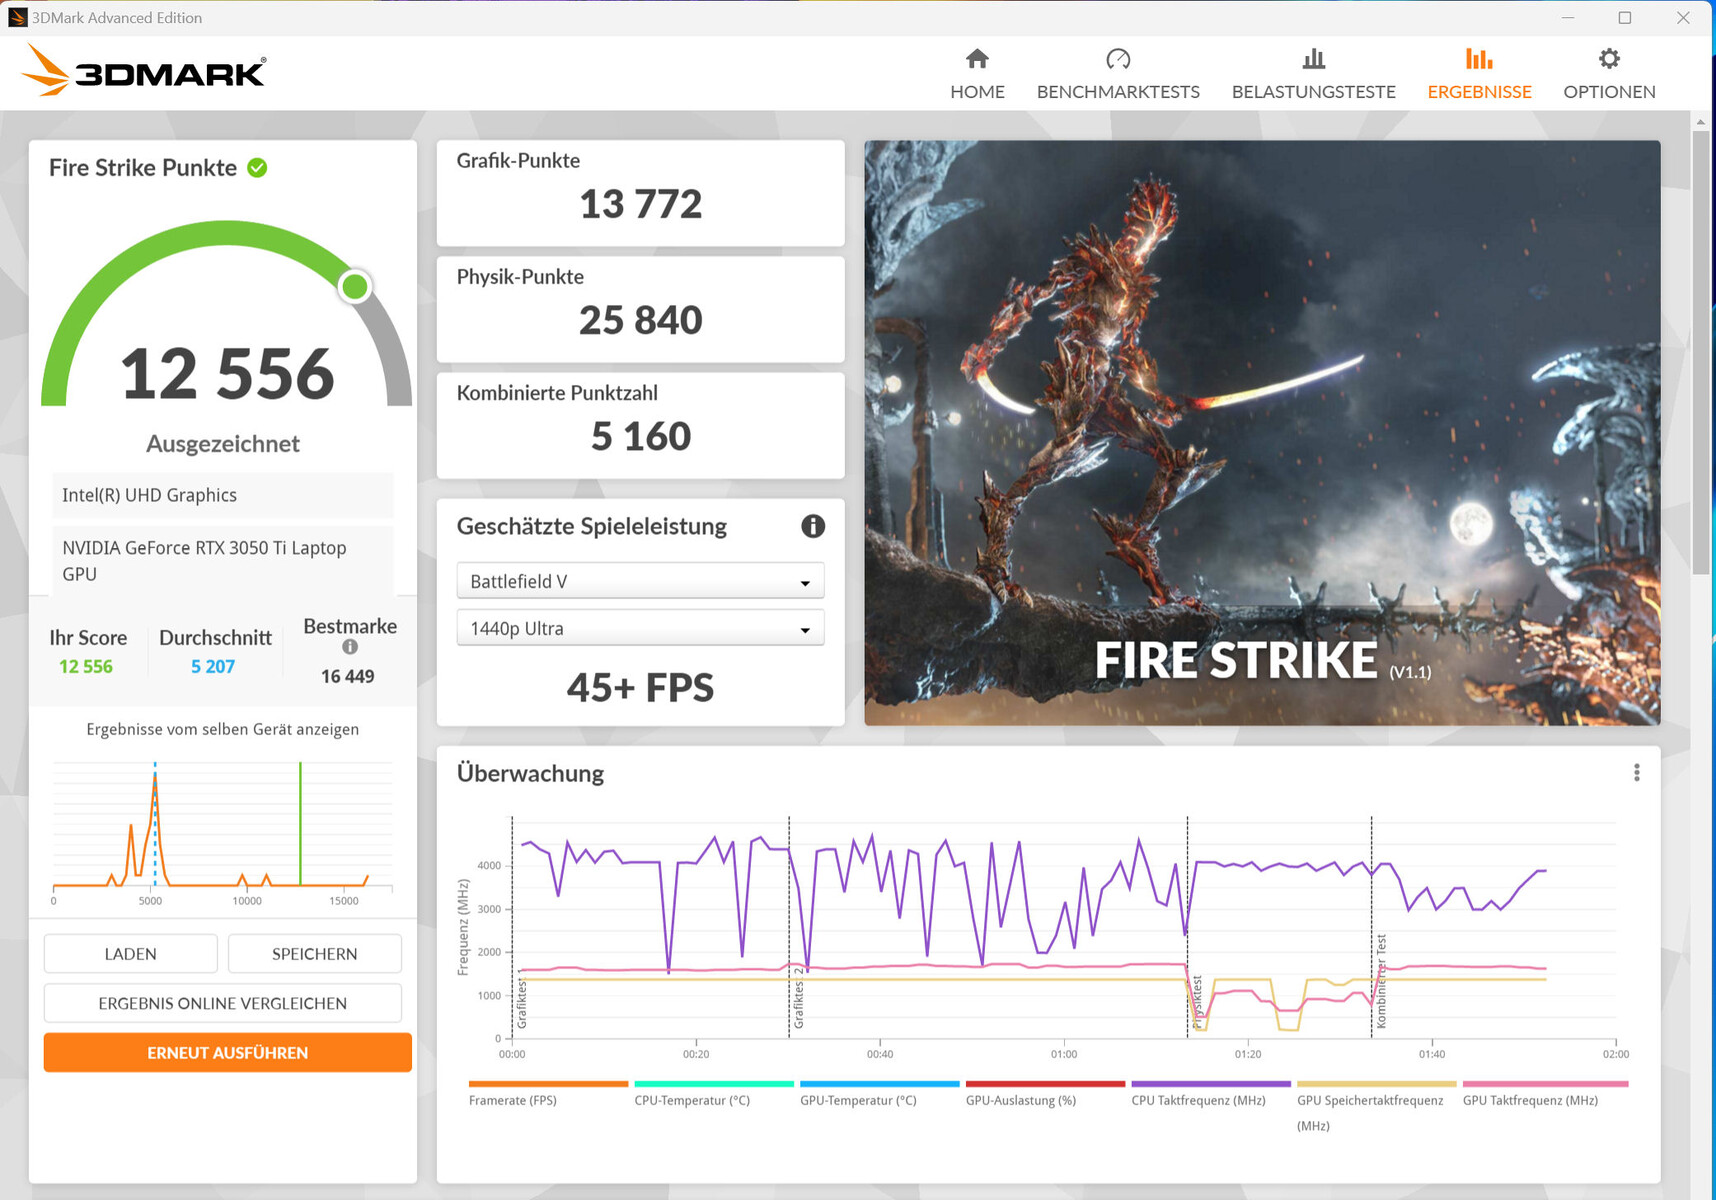

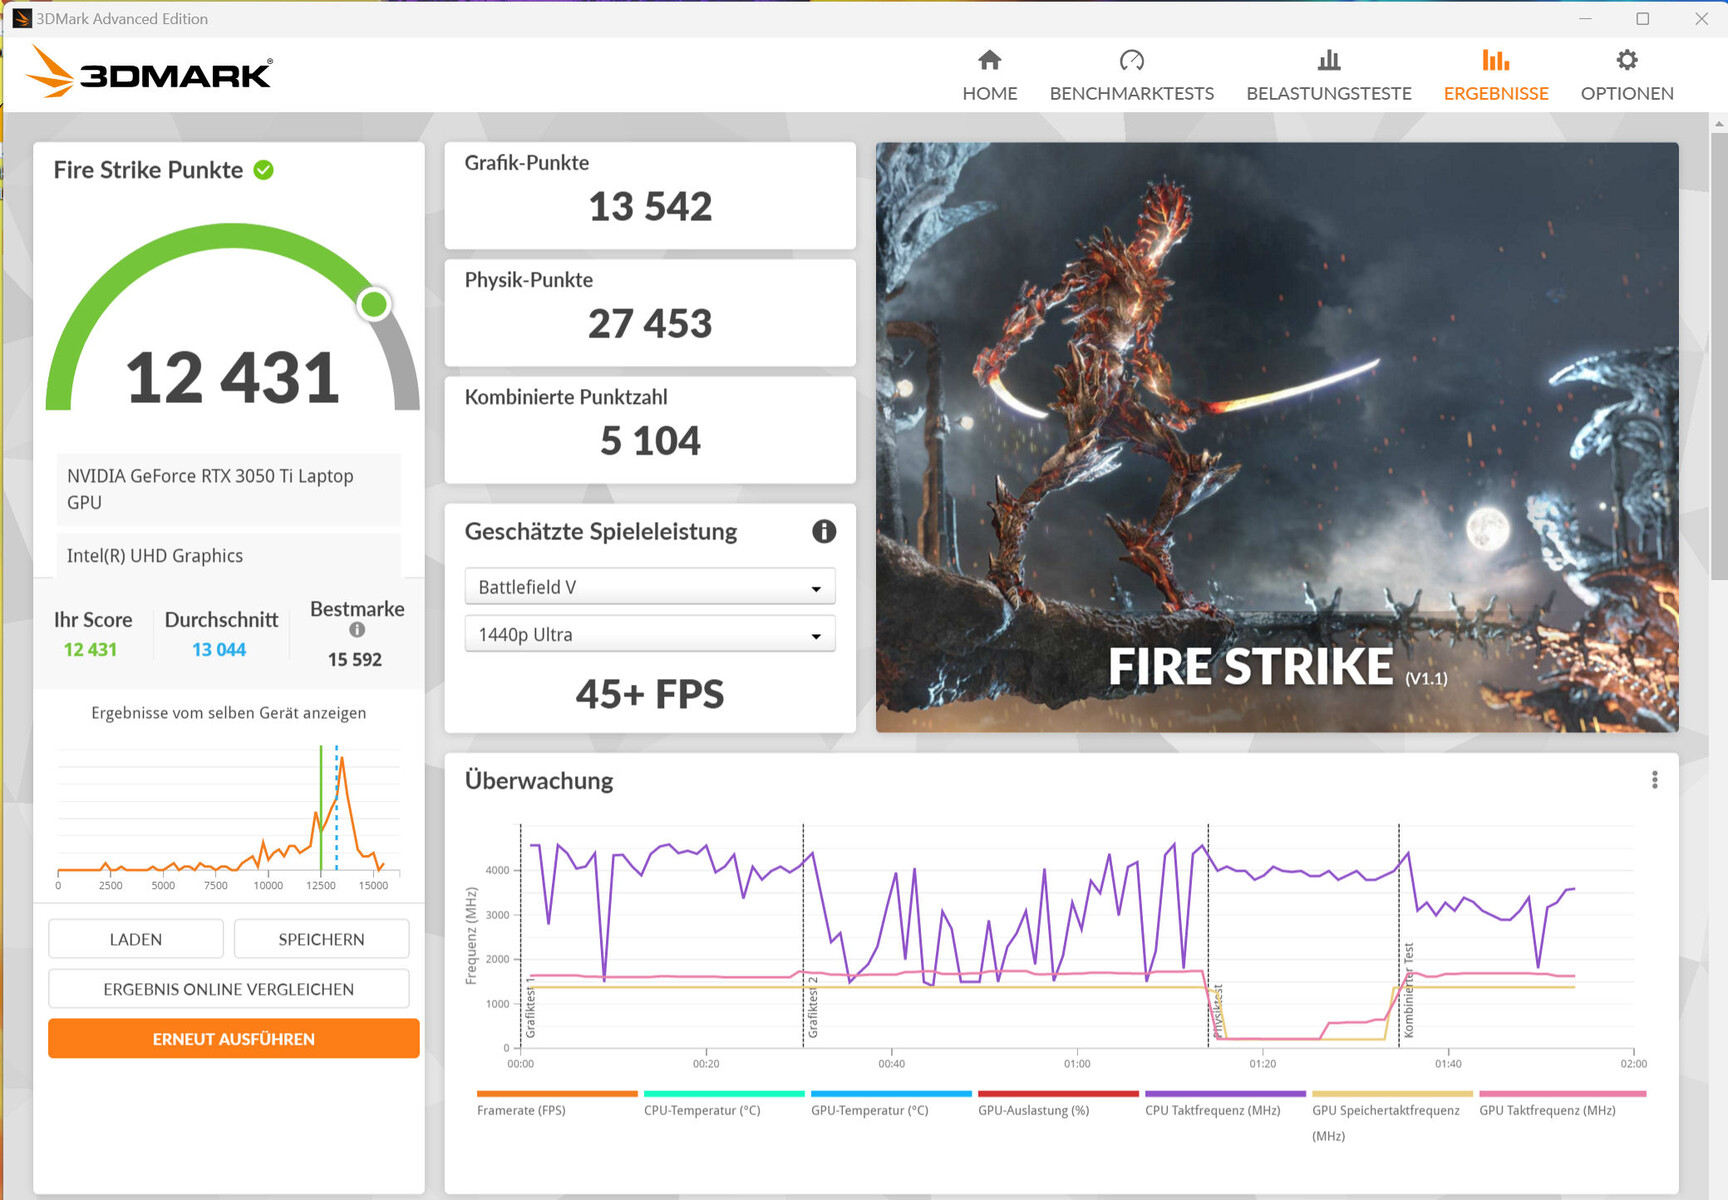
| 3DMark 06 Standard Score | 45370 points | |
| 3DMark 11 Performance | 16180 points | |
| 3DMark Cloud Gate Standard Score | 45033 points | |
| 3DMark Fire Strike Score | 11448 points | |
| 3DMark Time Spy Score | 4969 points | |
Help | ||
| V-Ray Benchmark Next 4.10 | |
| GPU | |
| Schenker XMG Fusion 15 (Mid 22) (v4.10.07 ) | |
| Average of class Multimedia (32 - 1191, n=61, last 2 years) | |
| Average NVIDIA GeForce RTX 3050 Ti Laptop GPU (171 - 216, n=22) | |
| Asus VivoBook Pro 16 (v4.10.07 ) | |
| Acer Swift X SFX16-52G-77RX (v4.10.07 ) | |
| CPU | |
| Average of class Multimedia (4772 - 35165, n=61, last 2 years) | |
| Asus VivoBook Pro 16 (v4.10.07 ) | |
| Acer Swift X SFX16-52G-77RX (v4.10.07 ) | |
| Schenker XMG Fusion 15 (Mid 22) (v4.10.07 ) | |
| Average NVIDIA GeForce RTX 3050 Ti Laptop GPU (5796 - 16665, n=22) | |
* ... smaller is better
| The Witcher 3 - 1920x1080 Ultra Graphics & Postprocessing (HBAO+) | |
| Schenker XMG Fusion 15 (Mid 22) | |
| Dell Inspiron 16 Plus 7620 | |
| Average of class Multimedia (11 - 121, n=14, last 2 years) | |
| Average NVIDIA GeForce RTX 3050 Ti Laptop GPU (19 - 58.5, n=29) | |
| Asus VivoBook Pro 16 | |
| Acer Swift X SFX16-52G-77RX | |
| Final Fantasy XV Benchmark - 1920x1080 High Quality | |
| Schenker XMG Fusion 15 (Mid 22) (1.3) | |
| Dell Inspiron 16 Plus 7620 (1.3) | |
| Average of class Multimedia (7.61 - 144.4, n=67, last 2 years) | |
| Average NVIDIA GeForce RTX 3050 Ti Laptop GPU (23.5 - 106, n=24) | |
| Asus VivoBook Pro 16 (1.3) | |
| Acer Swift X SFX16-52G-77RX (1.3) | |
| Strange Brigade - 1920x1080 ultra AA:ultra AF:16 | |
| Schenker XMG Fusion 15 (Mid 22) (1.47.22.14 D3D12) | |
| Dell Inspiron 16 Plus 7620 (1.47.22.14 D3D12) | |
| Average of class Multimedia (13.3 - 303, n=67, last 2 years) | |
| Average NVIDIA GeForce RTX 3050 Ti Laptop GPU (34.8 - 101.3, n=25) | |
| Asus VivoBook Pro 16 (1.47.22.14 D3D12) | |
| Acer Swift X SFX16-52G-77RX (1.47.22.14 D3D12) | |
| Dota 2 Reborn - 1920x1080 ultra (3/3) best looking | |
| Dell Inspiron 16 Plus 7620 | |
| Schenker XMG Fusion 15 (Mid 22) | |
| Average NVIDIA GeForce RTX 3050 Ti Laptop GPU (67.3 - 145, n=27) | |
| Asus VivoBook Pro 16 | |
| Average of class Multimedia (29 - 179.9, n=69, last 2 years) | |
| Acer Swift X SFX16-52G-77RX | |
Witcher 3 FPS diagram
| low | med. | high | ultra | QHD | |
|---|---|---|---|---|---|
| GTA V (2015) | 175.1 | 170.9 | 111.9 | 53.8 | 39 |
| The Witcher 3 (2015) | 218.5 | 150.8 | 87.6 | 47.1 | |
| Dota 2 Reborn (2015) | 134.6 | 118.9 | 108.5 | 101.6 | |
| Final Fantasy XV Benchmark (2018) | 112.7 | 65 | 46.2 | 32 | |
| X-Plane 11.11 (2018) | 125.4 | 110.2 | 90.5 | ||
| Strange Brigade (2018) | 241 | 121.2 | 98.3 | 84.5 | 61 |
| Doom Eternal (2020) | 188.1 | 120 | |||
| Flight Simulator 2020 (2020) | 99 | 52.1 | 38.4 | 26.4 | 19.6 |
| F1 22 (2022) | 127.5 | 115.3 | 73.1 | 24.3 | 17.4 |
| FIFA 23 (2022) | 78.2 | ||||
| Uncharted Legacy of Thieves Collection (2022) | 48.4 | 30.5 | 20.6 | 20 | 14.1 |
| Call of Duty Modern Warfare 2 2022 (2022) | 63 | 58 | 44 | 36 | |
| Spider-Man Miles Morales (2022) | 66.6 | 53.6 | 44.8 | 36.8 | 26.3 |
| The Callisto Protocol (2022) | 82.5 | 62.2 | 58.3 | 31.7 | 21.4 |
| Need for Speed Unbound (2022) | 73.9 | 62.6 | 35.5 | 27.9 | 15.6 |
| High On Life (2023) | 104.7 | 77.5 | 60.3 | 50.8 | 31.8 |
| The Witcher 3 v4 (2023) | 88.4 | 75.6 | 36.8 | 32.4 | 19.6 |
| Dead Space Remake (2023) | 37.2 | 35.1 | 28.2 | 24.6 | 9.81 |
| Hogwarts Legacy (2023) | 63.9 | 50 | 40.2 | 32.8 | 25 |
| Returnal (2023) | 52 | 50 | 45 | 34 | 27 |
| Atomic Heart (2023) | 94.3 | 71.4 | 41.6 | 32.3 | 24.5 |
| Company of Heroes 3 (2023) | 106.2 | 91.1 | 68.4 | 68.5 | 48.8 |
| Sons of the Forest (2023) | 54.9 | 38.8 | 35.4 | 33.3 | 25.6 |
| Resident Evil 4 Remake (2023) | 74.6 | 47.4 | 41 | 8.97 | 7.82 |
| The Last of Us (2023) | 44.9 | 32.9 | 25.6 | ||
| Dead Island 2 (2023) | 95.7 | 75.7 | 64.1 | 58 | 45.9 |
| Star Wars Jedi Survivor (2023) | 36.9 | 31 | 28.9 | 25.8 | 15.4 |
Emissions & power - The Asus computer is noisy
Noise emissions
In idle mode as well as in everyday use (office, internet), the laptop generally works quietly - even silently at times. At full load, we measured noise emissions up to 61.5 dB(A) ("performance mode") - much too high. Using "standard mode" led to a more balanced noise-to-performance ratio - even so, the cooler made quite a racket.
"Whisper mode" will probably be most users' first choice - it does exactly what it says on the tin. The fans run at low speeds even at load and are barely audible - at the expense of processing power. Gaming is still possible, but only in HD.
Noise level
| Idle |
| 25.2 / 25.2 / 25.2 dB(A) |
| Load |
| 55.1 / 61.5 dB(A) |
 | ||
30 dB silent 40 dB(A) audible 50 dB(A) loud |
||
min: | ||
| Asus VivoBook Pro 16 GeForce RTX 3050 Ti Laptop GPU, i7-12700H, Intel SSD 670p SSDPEKNU010TZ | Dell Inspiron 16 Plus 7620 GeForce RTX 3050 Ti Laptop GPU, i7-12700H, Kioxia BG5 KBG50ZNS512G | Schenker XMG Fusion 15 (Mid 22) GeForce RTX 3070 Laptop GPU, i7-11800H, Samsung SSD 980 Pro 1TB MZ-V8P1T0BW | Acer Swift X SFX16-52G-77RX A370M, i7-1260P, WDC PC SN810 1TB | |
|---|---|---|---|---|
| Noise | 3% | 0% | 8% | |
| off / environment * (dB) | 25.2 | 23.3 8% | 26 -3% | 25 1% |
| Idle Minimum * (dB) | 25.2 | 25.7 -2% | 26 -3% | 25 1% |
| Idle Average * (dB) | 25.2 | 26.1 -4% | 28 -11% | 25 1% |
| Idle Maximum * (dB) | 25.2 | 30.6 -21% | 31 -23% | 25 1% |
| Load Average * (dB) | 55.1 | 46.2 16% | 45 18% | 44.7 19% |
| Load Maximum * (dB) | 61.5 | 49.4 20% | 48 22% | 45.6 26% |
| Witcher 3 ultra * (dB) | 49.2 | 46 |
* ... smaller is better
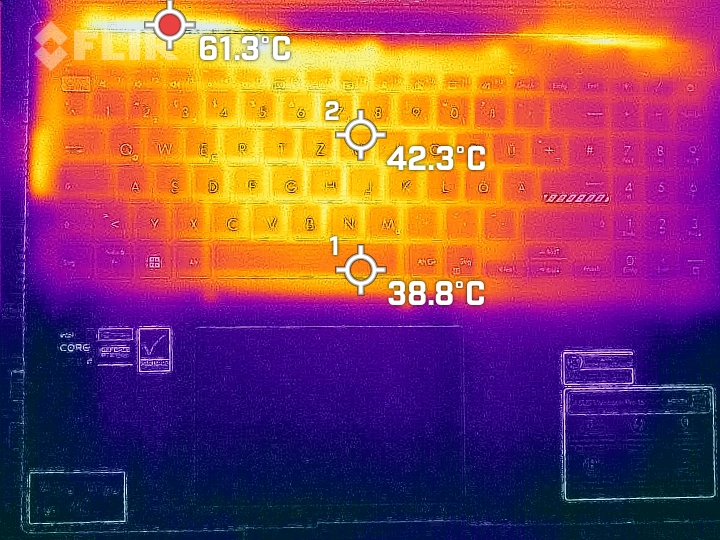
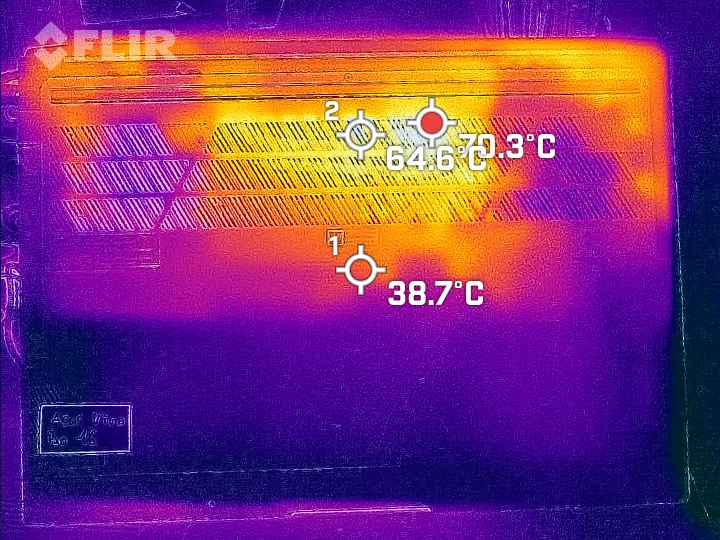
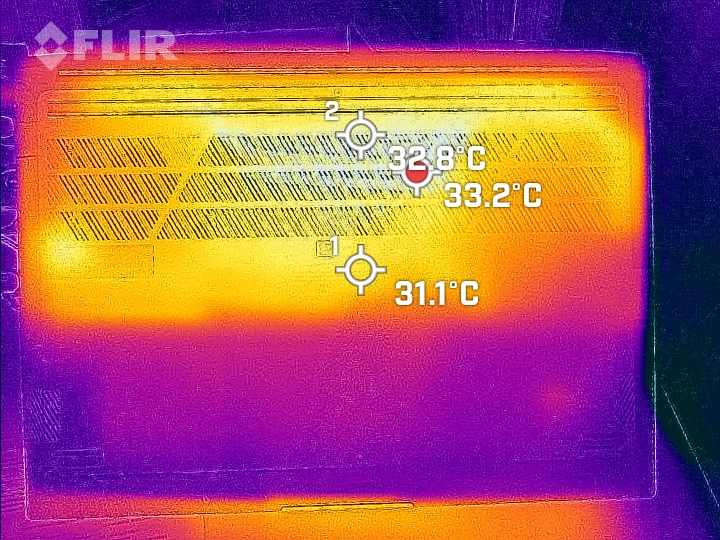
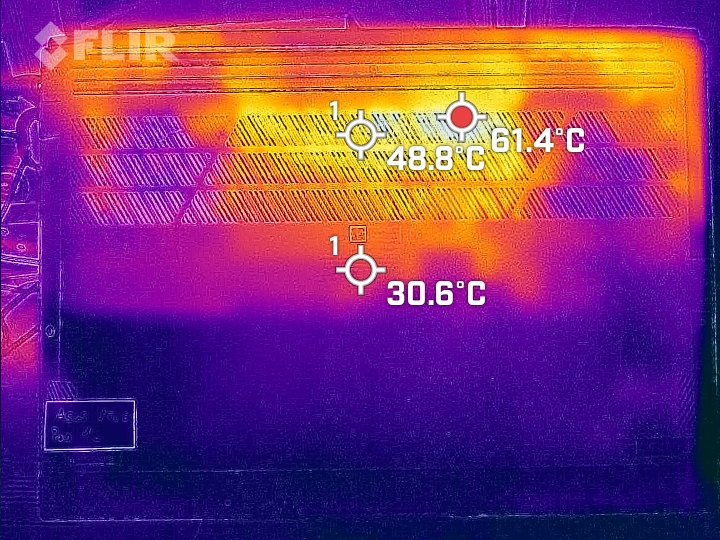
Temperature
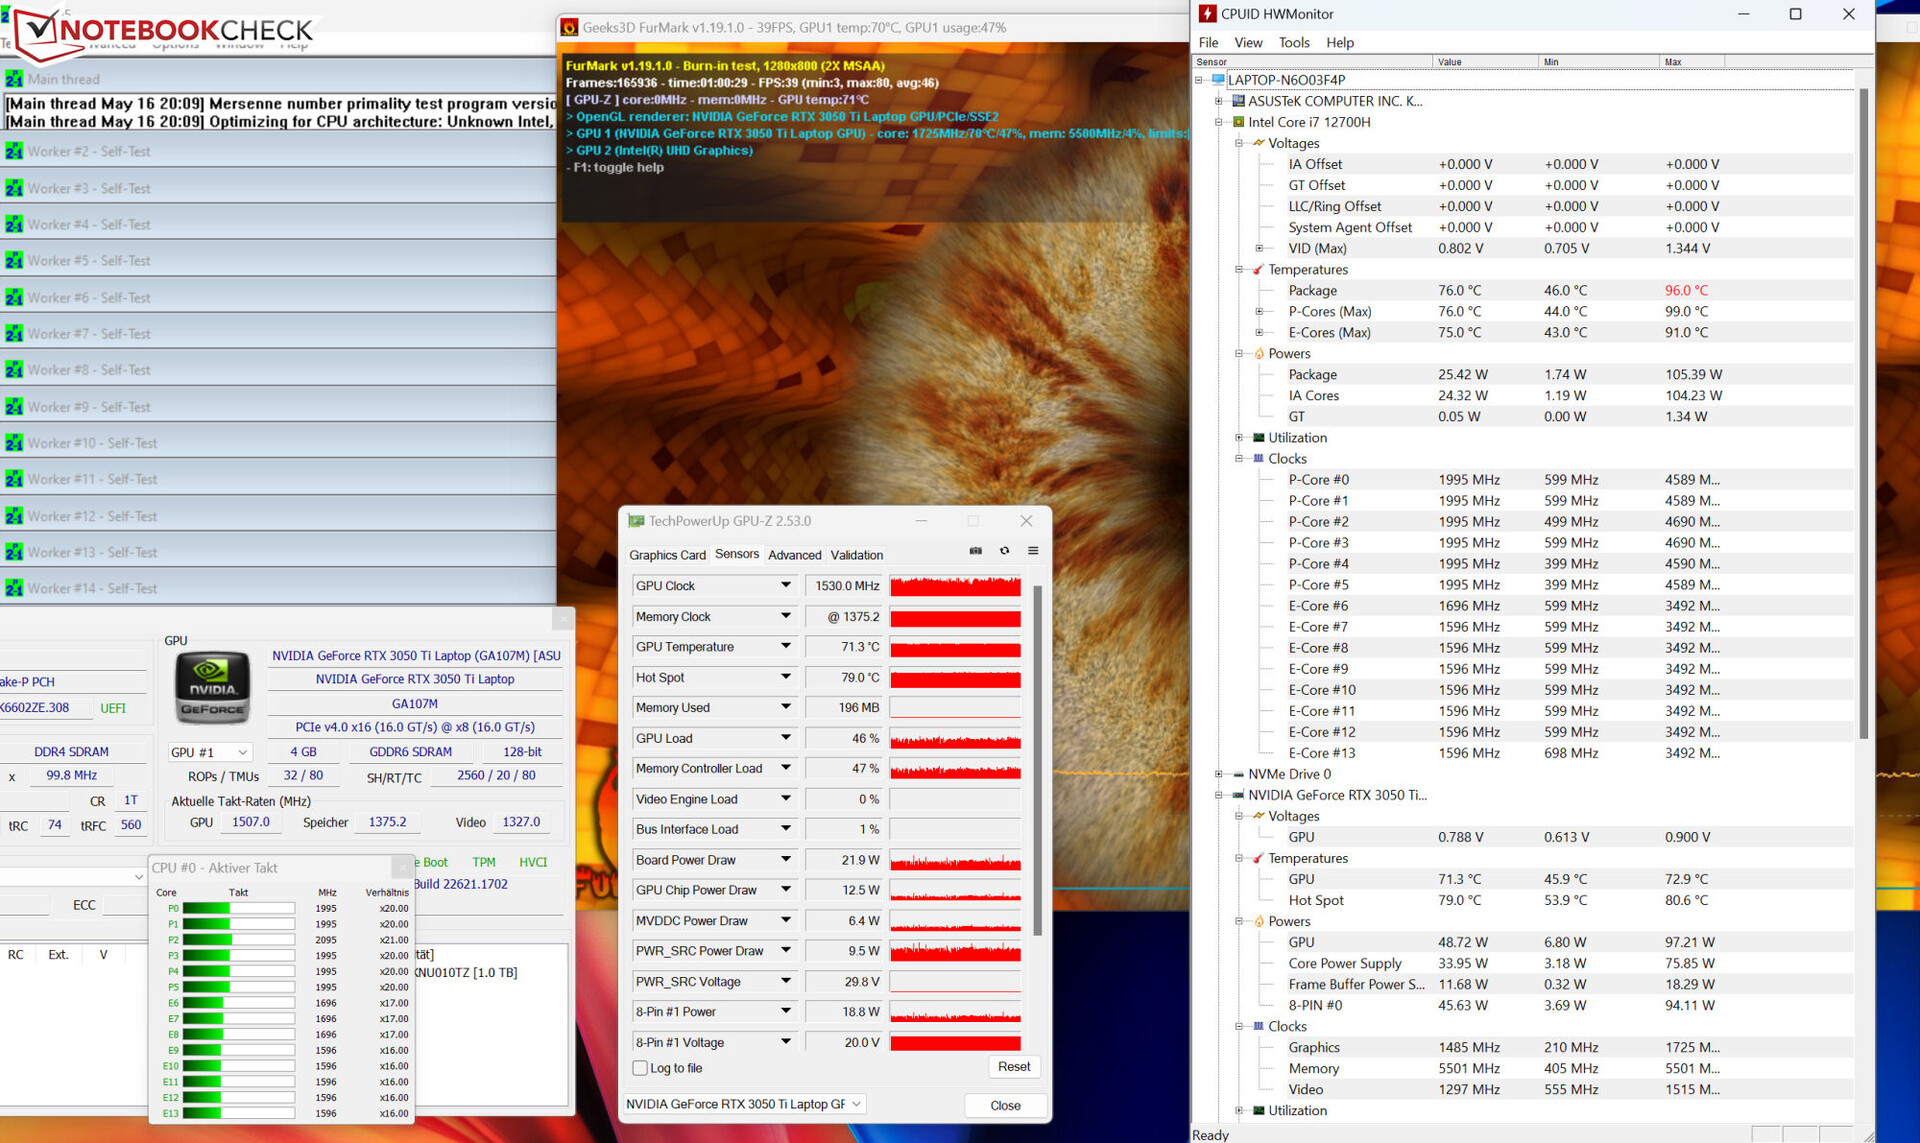
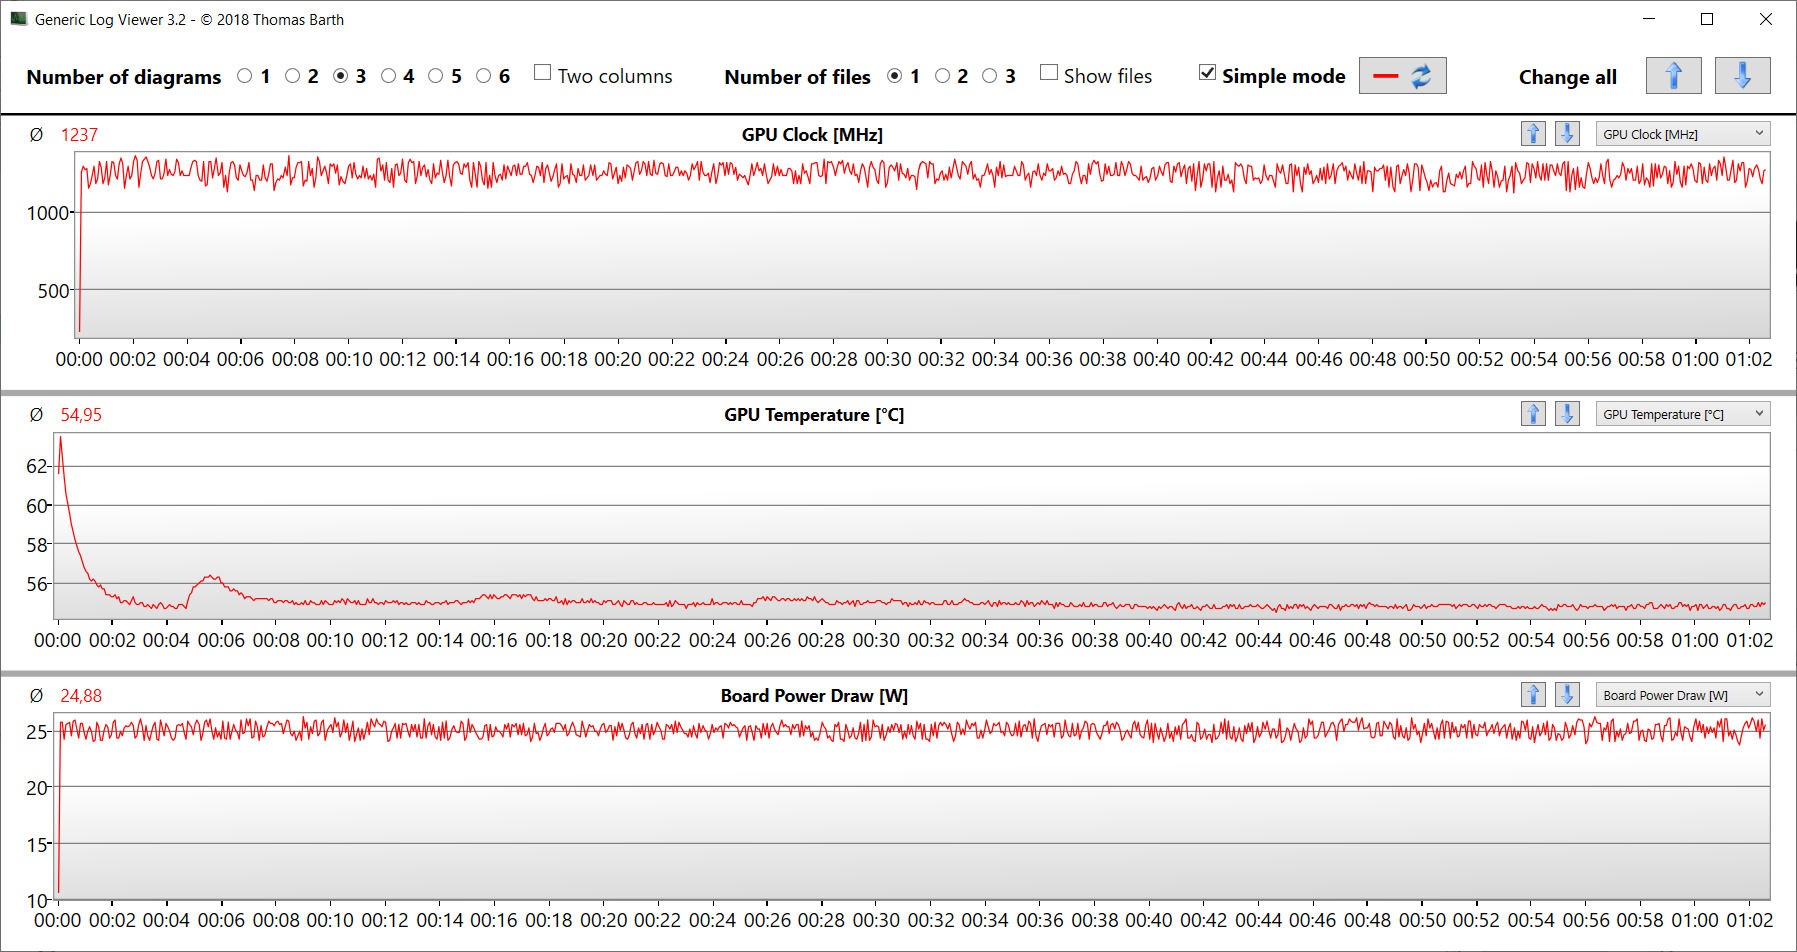
At load, the laptop did reach quite high temperatures but on average its temperatures reached moderate levels. This means that we measured a maximum of 55.5 °C during our stress test. In everyday use, however, temperates generally find themselves within an acceptable range.
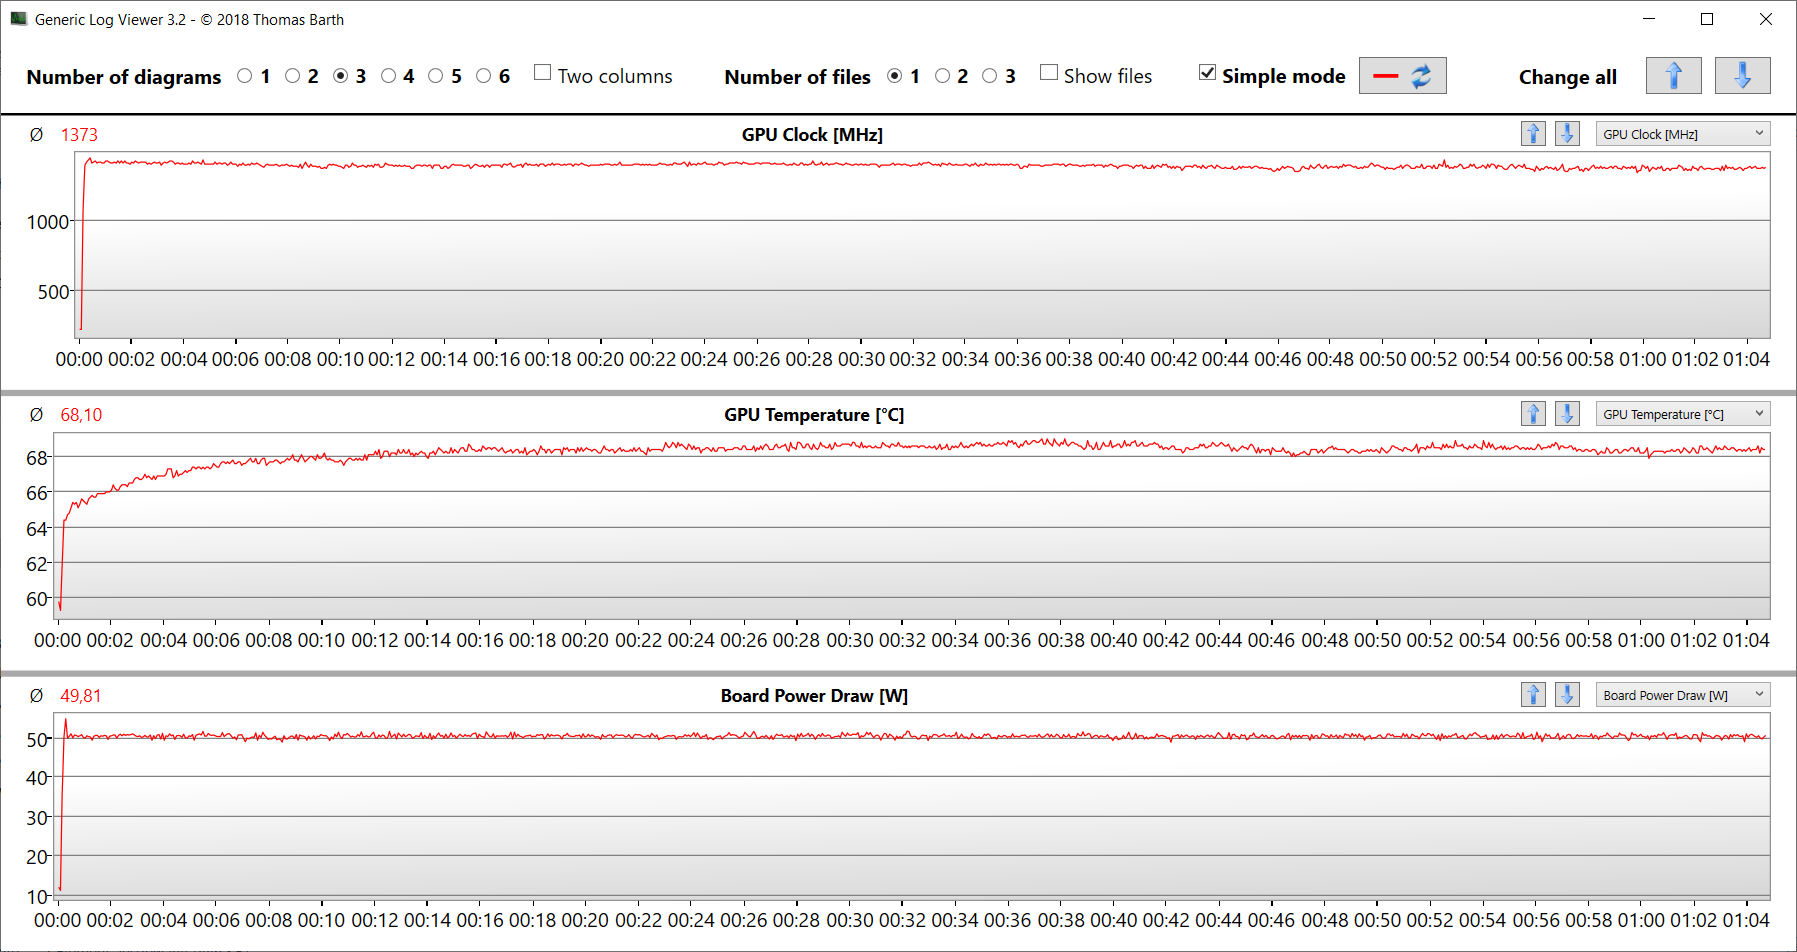
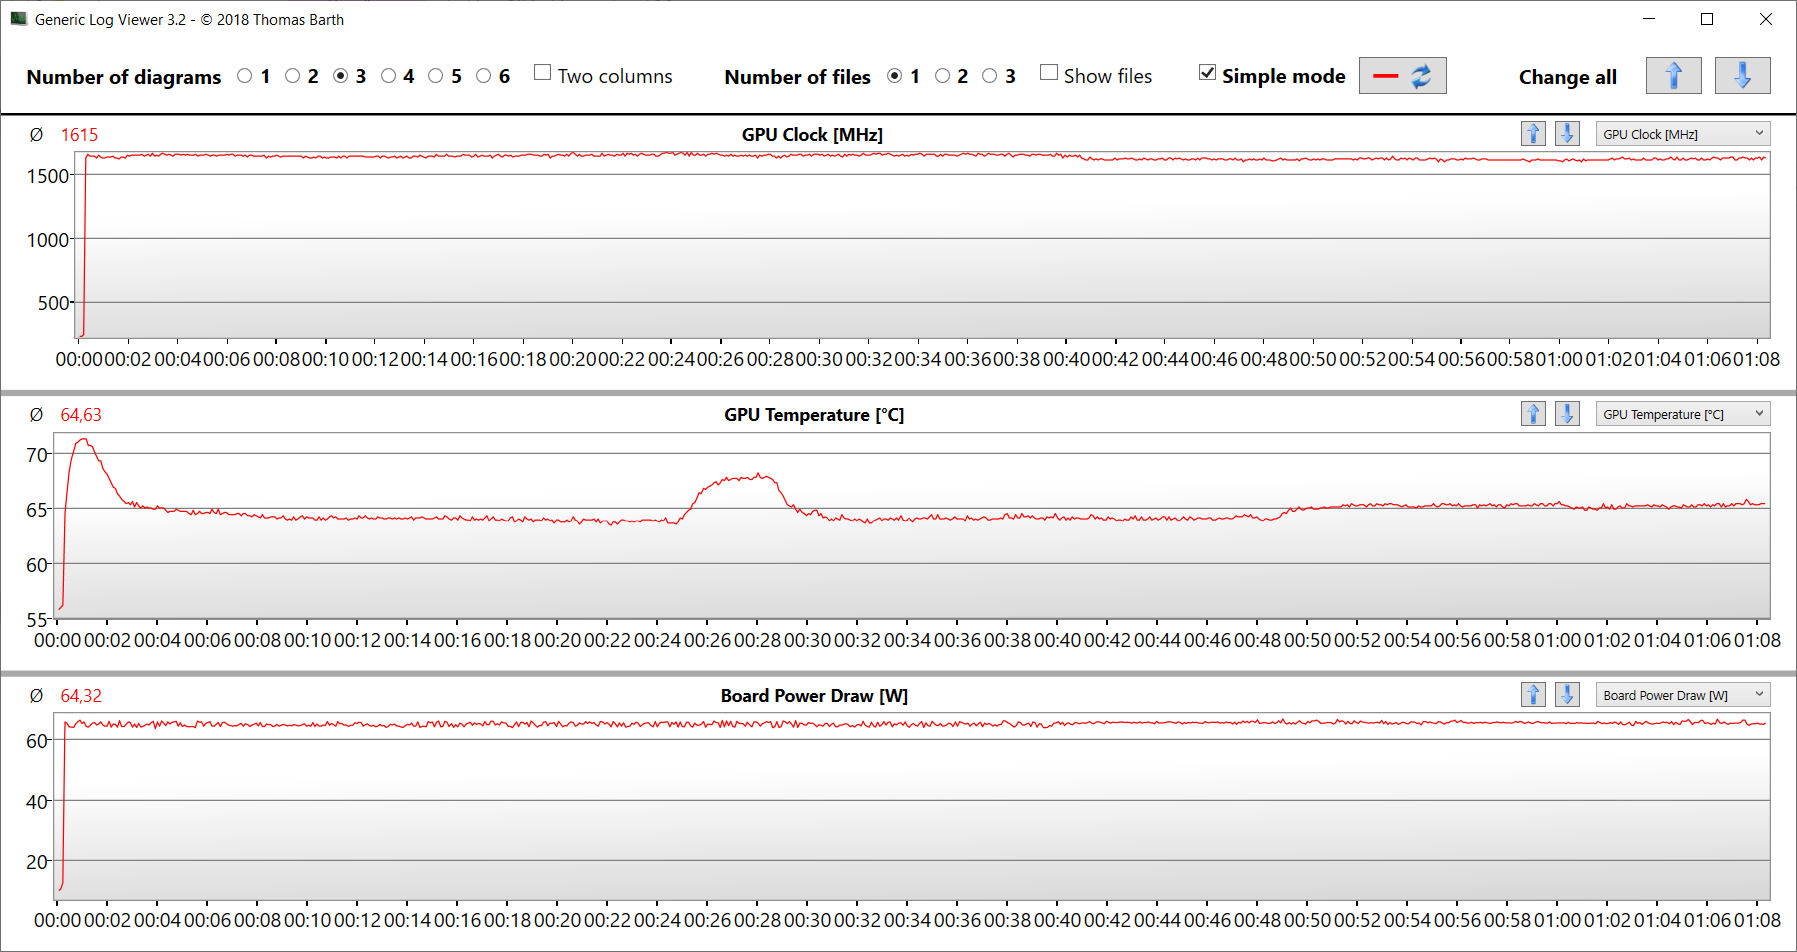
The stress test (Prime95 and Furmark in continuous use) simulates an extreme scenario in order to test how stable the system remains at full load. The CPU began the stress test with average clock rates (P: 3.2 - 3.3 GHz; E: 2.7 GHz) and the graphics core had a rate of 1.1 - 1.4 GHz. While the CPU rates sank over the course of the test, the GPU clock rates rose by a little bit.
(±) The maximum temperature on the upper side is 44.2 °C / 112 F, compared to the average of 36.8 °C / 98 F, ranging from 21 to 71 °C for the class Multimedia.
(-) The bottom heats up to a maximum of 53 °C / 127 F, compared to the average of 39.1 °C / 102 F
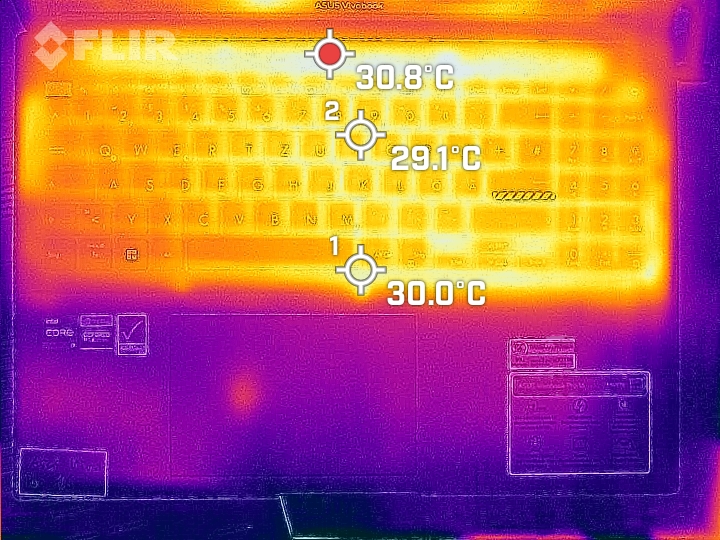
(+) In idle usage, the average temperature for the upper side is 27.9 °C / 82 F, compared to the device average of 31.3 °C / 88 F.
(±) Playing The Witcher 3, the average temperature for the upper side is 33.3 °C / 92 F, compared to the device average of 31.3 °C / 88 F.
(+) The palmrests and touchpad are cooler than skin temperature with a maximum of 23.7 °C / 74.7 F and are therefore cool to the touch.
(+) The average temperature of the palmrest area of similar devices was 28.7 °C / 83.7 F (+5 °C / 9 F).
| Asus VivoBook Pro 16 Intel Core i7-12700H, NVIDIA GeForce RTX 3050 Ti Laptop GPU | Dell Inspiron 16 Plus 7620 Intel Core i7-12700H, NVIDIA GeForce RTX 3050 Ti Laptop GPU | Schenker XMG Fusion 15 (Mid 22) Intel Core i7-11800H, NVIDIA GeForce RTX 3070 Laptop GPU | Acer Swift X SFX16-52G-77RX Intel Core i7-1260P, Intel Arc A370M | |
|---|---|---|---|---|
| Heat | 10% | -13% | 3% | |
| Maximum Upper Side * (°C) | 44.2 | 46 -4% | 52 -18% | 49.4 -12% |
| Maximum Bottom * (°C) | 53 | 45.8 14% | 63 -19% | 55.5 -5% |
| Idle Upper Side * (°C) | 32.1 | 29.2 9% | 37 -15% | 28.4 12% |
| Idle Bottom * (°C) | 38.4 | 31 19% | 38 1% | 32.6 15% |
* ... smaller is better
Speakers
The stereo speakers produce a decent sound, but hardly any bass.
Asus VivoBook Pro 16 audio analysis
(+) | speakers can play relatively loud (88.5 dB)
Bass 100 - 315 Hz
(-) | nearly no bass - on average 20.8% lower than median
(±) | linearity of bass is average (12.8% delta to prev. frequency)
Mids 400 - 2000 Hz
(+) | balanced mids - only 2.2% away from median
(+) | mids are linear (4.7% delta to prev. frequency)
Highs 2 - 16 kHz
(±) | higher highs - on average 7.4% higher than median
(+) | highs are linear (5.9% delta to prev. frequency)
Overall 100 - 16.000 Hz
(±) | linearity of overall sound is average (16.2% difference to median)
Compared to same class
» 41% of all tested devices in this class were better, 7% similar, 51% worse
» The best had a delta of 5%, average was 17%, worst was 45%
Compared to all devices tested
» 26% of all tested devices were better, 6% similar, 68% worse
» The best had a delta of 4%, average was 24%, worst was 134%
Dell Inspiron 16 Plus 7620 audio analysis
(+) | speakers can play relatively loud (87.8 dB)
Bass 100 - 315 Hz
(-) | nearly no bass - on average 22.2% lower than median
(±) | linearity of bass is average (9.7% delta to prev. frequency)
Mids 400 - 2000 Hz
(+) | balanced mids - only 3.3% away from median
(+) | mids are linear (5.3% delta to prev. frequency)
Highs 2 - 16 kHz
(+) | balanced highs - only 2.5% away from median
(+) | highs are linear (4.7% delta to prev. frequency)
Overall 100 - 16.000 Hz
(+) | overall sound is linear (13.4% difference to median)
Compared to same class
» 28% of all tested devices in this class were better, 5% similar, 68% worse
» The best had a delta of 5%, average was 17%, worst was 45%
Compared to all devices tested
» 14% of all tested devices were better, 4% similar, 83% worse
» The best had a delta of 4%, average was 24%, worst was 134%
Power consumption
The laptop didn't show any conspicuous energy consumption rates. The values we measured are on a normal level for the installed hardware. The Witcher 3 test was run with constant power consumption. Its power supply (150 watts) is sufficiently sized.
| Off / Standby | |
| Idle | |
| Load |
|
Key:
min: | |
| Asus VivoBook Pro 16 i7-12700H, GeForce RTX 3050 Ti Laptop GPU, Intel SSD 670p SSDPEKNU010TZ, IPS, 2560x1600, 16" | Dell Inspiron 16 Plus 7620 i7-12700H, GeForce RTX 3050 Ti Laptop GPU, Kioxia BG5 KBG50ZNS512G, IPS, 3072x1920, 16" | Schenker XMG Fusion 15 (Mid 22) i7-11800H, GeForce RTX 3070 Laptop GPU, Samsung SSD 980 Pro 1TB MZ-V8P1T0BW, IPS, 2560x1440, 15.6" | Acer Swift X SFX16-52G-77RX i7-1260P, A370M, WDC PC SN810 1TB, IPS-LED, 2560x1600, 16" | Average NVIDIA GeForce RTX 3050 Ti Laptop GPU | Average of class Multimedia | |
|---|---|---|---|---|---|---|
| Power Consumption | 12% | -26% | 42% | 10% | 33% | |
| Idle Minimum * (Watt) | 8.7 | 6.8 22% | 12 -38% | 3.7 57% | 8.2 ? 6% | 5.68 ? 35% |
| Idle Average * (Watt) | 13.1 | 9.6 27% | 17 -30% | 7.6 42% | 12.6 ? 4% | 10 ? 24% |
| Idle Maximum * (Watt) | 18.3 | 17 7% | 24 -31% | 11.1 39% | 17.2 ? 6% | 12.4 ? 32% |
| Load Average * (Watt) | 116 | 117.5 -1% | 106 9% | 70 40% | 92 ? 21% | 65.1 ? 44% |
| Witcher 3 ultra * (Watt) | 117.6 | 113.1 4% | 159.9 -36% | 68.8 41% | ||
| Load Maximum * (Watt) | 162 | 137.4 15% | 208 -28% | 108 33% | 139.1 ? 14% | 112.6 ? 30% |
* ... smaller is better
power consumption Witcher 3 / stress test
Power consumption with external monitor
Battery life
The 16-inch laptop managed a runtime of 7:14 h in our practical WLAN test (mapping of the load when calling up websites via a script) - a decent, but not terrific value. Within the comparison field, the VivoBook takes the last place.
Pros
Cons
Verdict - A multimedia allrounder with an impressive screen
Video and photo editing, streaming, rendering and gaming: These all belong to the VivoBook Pro 16's core strengths. Its Core 7-12700H and GeForce RTX 3050 Ti Laptop deliver all the necessary power - both components consistently run with high clock rates. Although, it isn't quite used to its full potential, as the RAM only runs in single-channel mode.
Asus' VivoBook Pro 16 is a laptop fit for gamers and creators who don't place too much importance on having the newest hardware.
The laptop only heats up a little at load, but it can get very loud - or too loud, even. A positive: The device offers a whisper mode which can lower the noise emissions the laptop produces at the expense of its performance - which can at least allow for a little more relaxed working.
Its compact build, relatively small weight (1.9 kg) and decent runtimes (WLAN: 7:15 h) make the VivoBook quite a mobile device. A positive: The battery can be charged using a USB-C power supply (min. 65 watts, 20 V) - both USB-C ports support power delivery. You don't have to continue using the proprietary power supply included.
Our test sample doesn't have an OLED screen, but it is generally available within the VivoBook Pro 16 series. You shouldn't miss it: The installed IPS screen (16 inches, 2,560 x 1,600 pixels) in 16:10 format impresses with its brightness, good contrast, stable viewing angles, short reaction times, great color depiction and excellent color space coverage.
Alternatively, you could take a look at the Dell Inspiron 16 Plus 7620: With comparable performance, it offers considerably better runtimes. A budget-friendly alternative is the Acer Swift X 16, which delivers lower graphics performance - but it can offer very good runtimes and a price of around $1,000.
Price and availability
The version of the Asus VivoBook Pro 16 which we tested can be purchased on Amazon for $1,247.
Asus VivoBook Pro 16
- 05/22/2023 v7 (old)
Sascha Mölck
Transparency
The selection of devices to be reviewed is made by our editorial team. The test sample was provided to the author as a loan by the manufacturer or retailer for the purpose of this review. The lender had no influence on this review, nor did the manufacturer receive a copy of this review before publication. There was no obligation to publish this review. As an independent media company, Notebookcheck is not subjected to the authority of manufacturers, retailers or publishers.
This is how Notebookcheck is testing
Every year, Notebookcheck independently reviews hundreds of laptops and smartphones using standardized procedures to ensure that all results are comparable. We have continuously developed our test methods for around 20 years and set industry standards in the process. In our test labs, high-quality measuring equipment is utilized by experienced technicians and editors. These tests involve a multi-stage validation process. Our complex rating system is based on hundreds of well-founded measurements and benchmarks, which maintains objectivity. Further information on our test methods can be found here.
Price comparison

