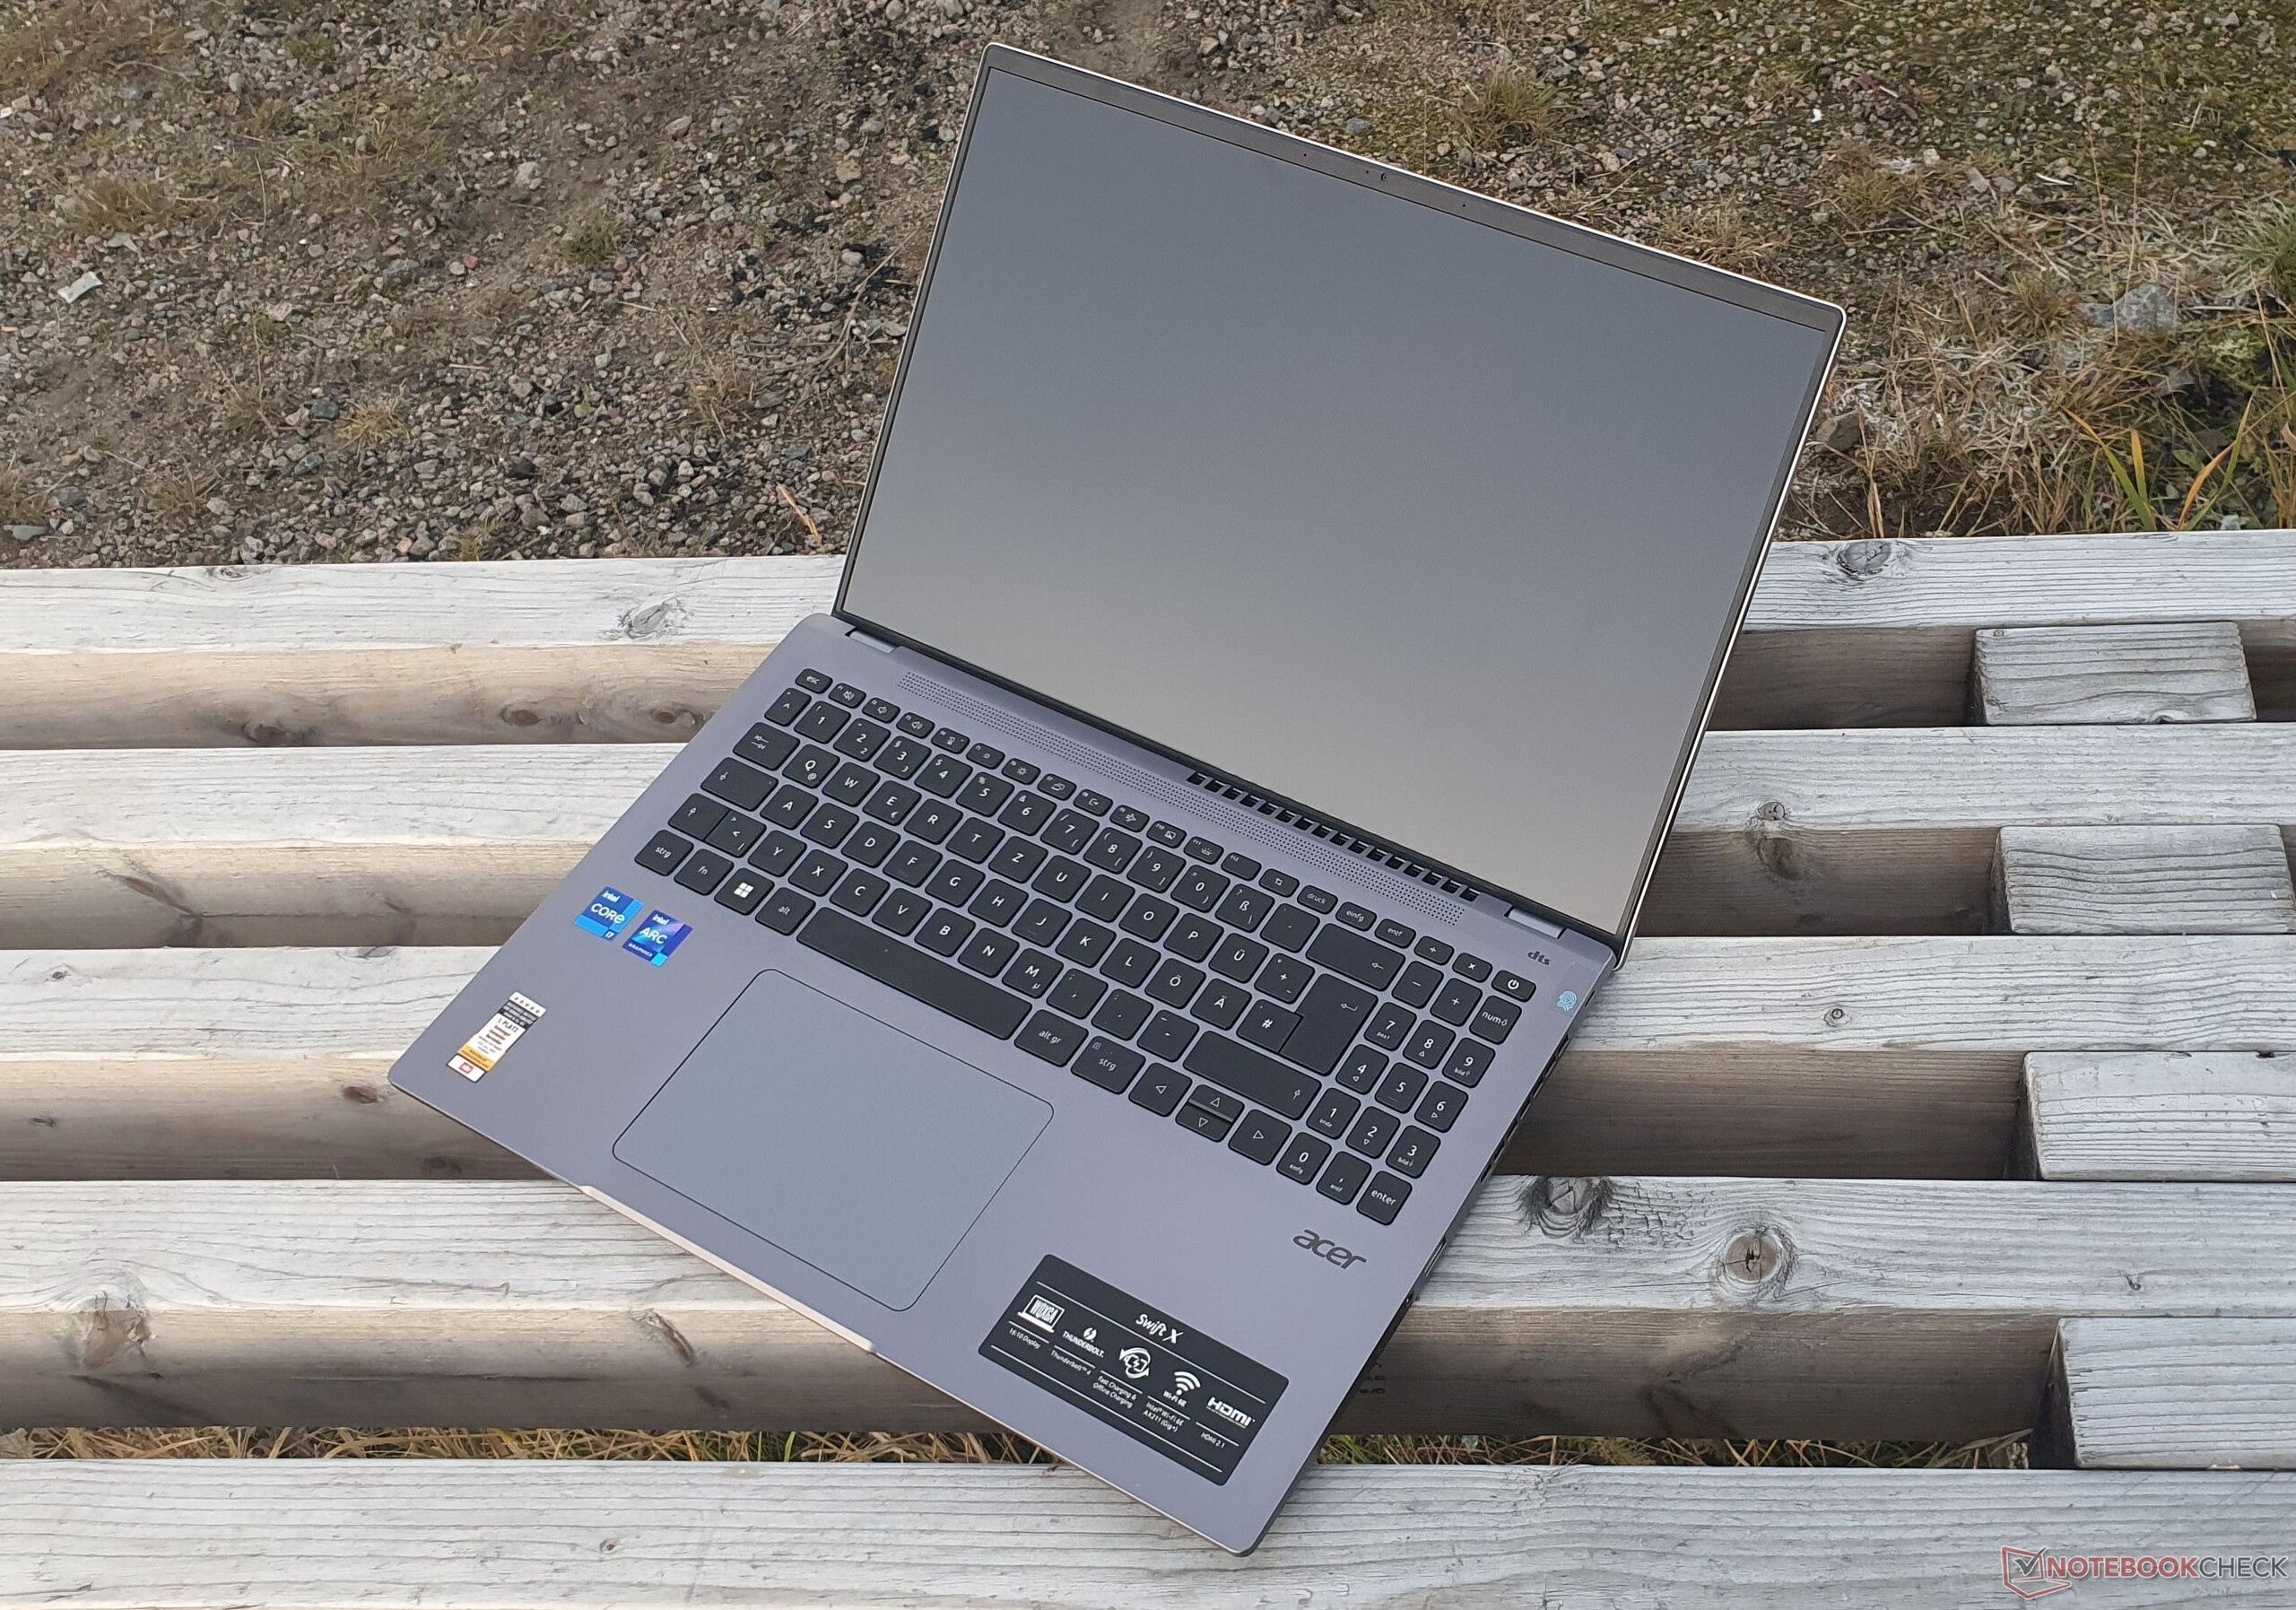
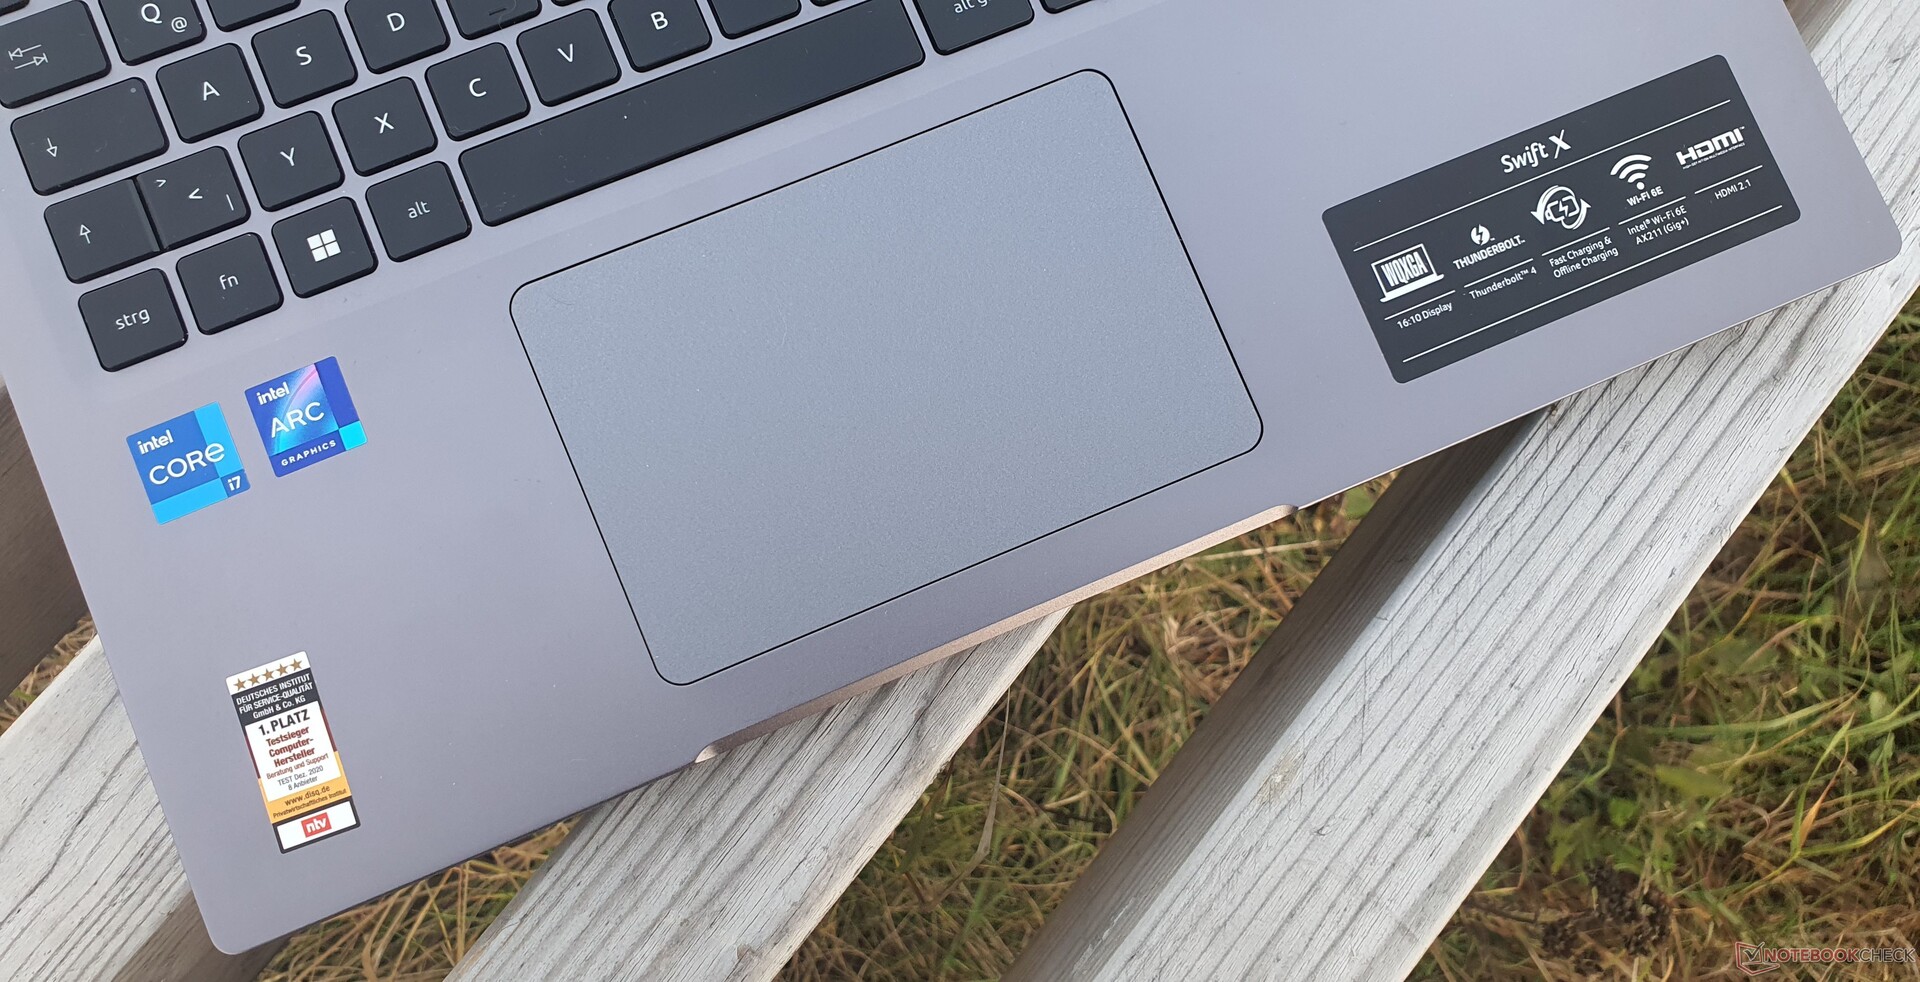
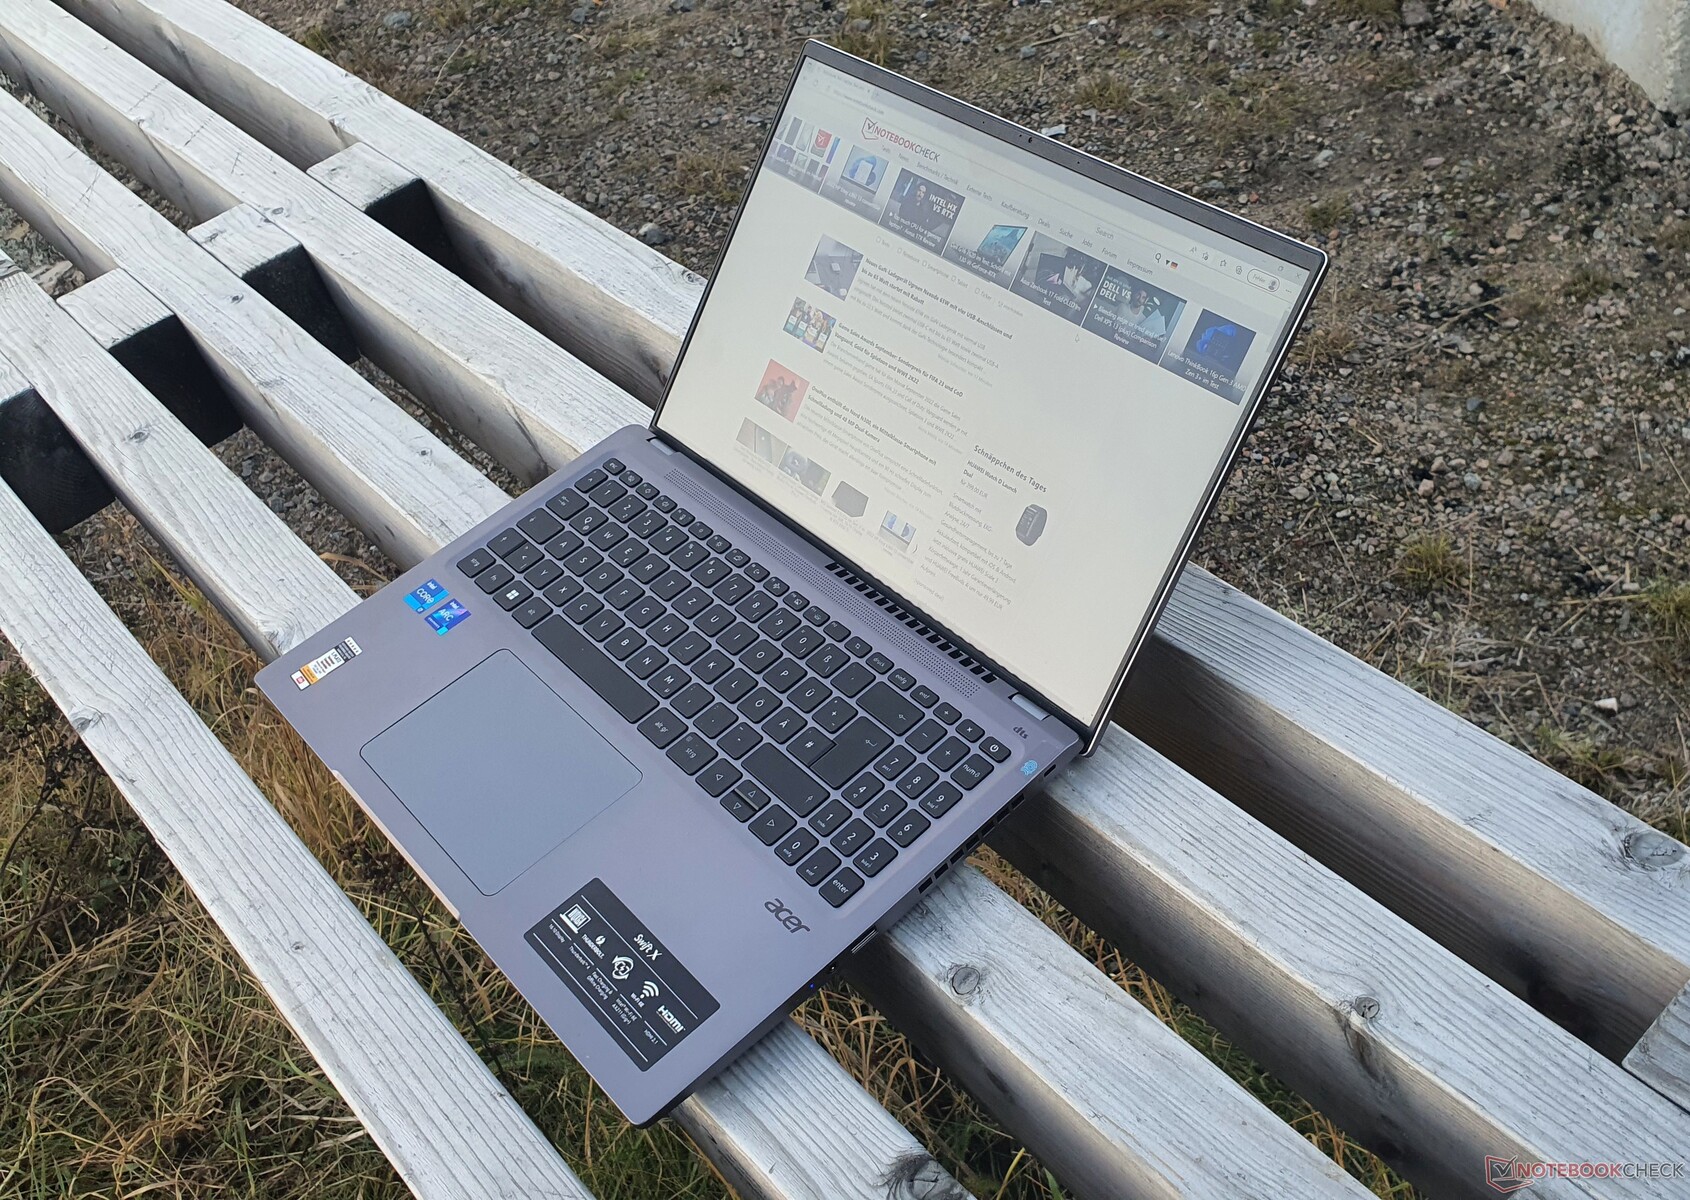
Acer Swift X 16 (2022) review: 16-inch laptop with powerful updates
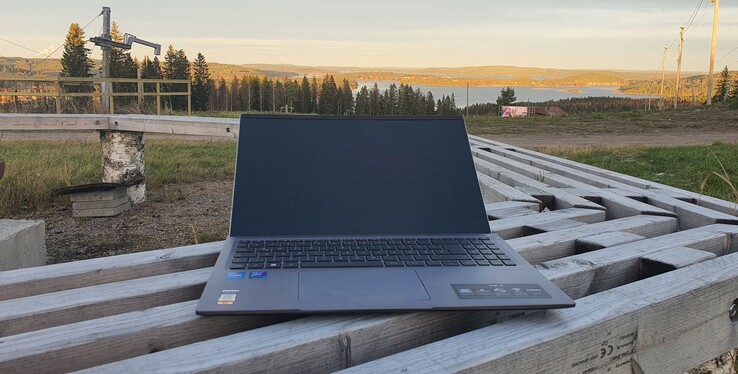
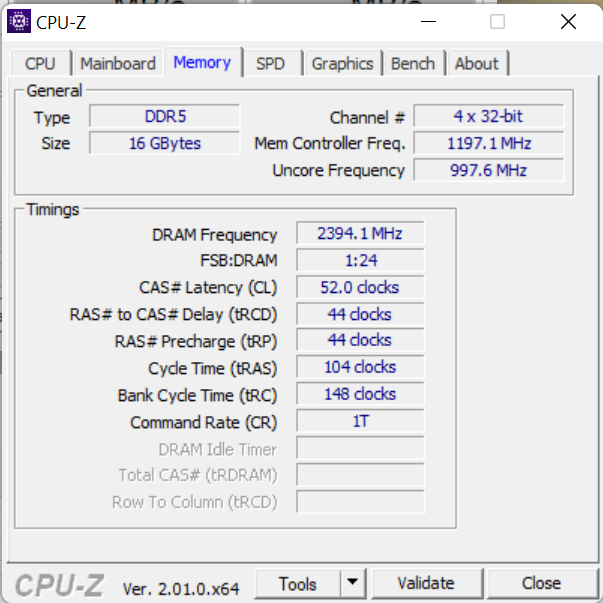
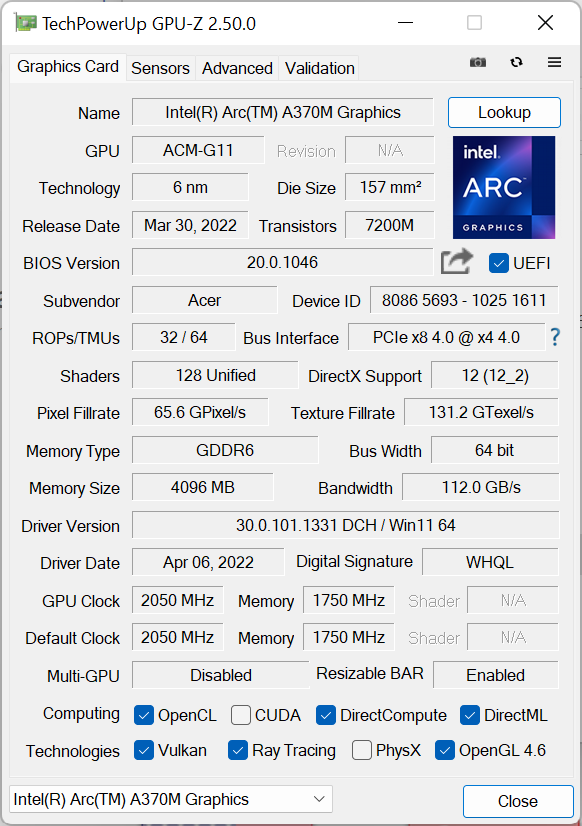
The Acer Swift X 16 (2022) has received many improvements: A bright 16-inch display with a 2.5K resolution in the 16:10 format run by Intel Arc A370M, a Core i7-1260P, and a fast 1-TB PCIe 4.0 SSD. In all cases, there is 16 GB of soldered DDR5 4800 RAM. Some smaller improvements such as HDMI 2.1 and the 1080p webcam also benefit the multimedia laptop.
With the current generation of the Swift X 16, Acer is able to remedy many shortcomings of the predecessor. But how does Intel's Arc A370M perform compared to an Nvidia GeForce RTX 3050 Ti in comparison devices such as the Dell Inspiron 16 Plus and Asus Vivobook Pro 16X, or the RTX 2050 in the Lenovo ThinkBook 16 G4+?
Since aside from the CPU and SSD, the sibling model we recently tested is identical, for details on the case, equipment, input devices, and communication, we refer you to the corresponding review of the Acer Swift X SFX16-52G-52VE. Even the display used is identical.
Additional Acer reviews:
Possible Competitors in Comparison
Rating | Date | Model | Weight | Height | Size | Resolution | Price |
|---|---|---|---|---|---|---|---|
| 86.4 % v7 (old) | 11 / 2022 | Acer Swift X SFX16-52G-77RX i7-1260P, A370M | 1.8 kg | 21.2 mm | 16.00" | 2560x1600 | |
| 88.4 % v7 (old) | 09 / 2022 | Lenovo ThinkBook 16 G4+ IAP i7-12700H, GeForce RTX 2050 Mobile | 1.8 kg | 16.5 mm | 16.00" | 2560x1600 | |
| 87.4 % v7 (old) | 08 / 2022 | Dell Inspiron 16 Plus 7620 i7-12700H, GeForce RTX 3050 Ti Laptop GPU | 2.1 kg | 18.99 mm | 16.00" | 3072x1920 | |
| 86.9 % v7 (old) | 09 / 2022 | HP Envy 16 h0112nr i7-12700H, GeForce RTX 3060 Laptop GPU | 2.3 kg | 19.8 mm | 16.00" | 3840x2400 | |
| 86.2 % v7 (old) | 11 / 2022 | Acer Swift X SFX16-52G-52VE i5-1240P, A370M | 1.8 kg | 21.3 mm | 16.00" | 2560x1600 | |
| 86.2 % v7 (old) | 07 / 2022 | Acer Swift X SFX16-51G-5388 i5-11320H, GeForce RTX 3050 4GB Laptop GPU | 1.8 kg | 18.9 mm | 16.10" | 1920x1080 | |
| 85.7 % v7 (old) | 09 / 2022 | Lenovo IdeaPad 5 Pro 16ARH7 R5 6600HS, Radeon 660M | 1.9 kg | 18.4 mm | 16.00" | 2560x1600 | |
v (old) | 12 / 2021 | Asus Vivobook Pro 16X-M7600QE R9 5900HX, GeForce RTX 3050 Ti Laptop GPU | 1.9 kg | 19 mm | 16.10" | 3840x2400 |
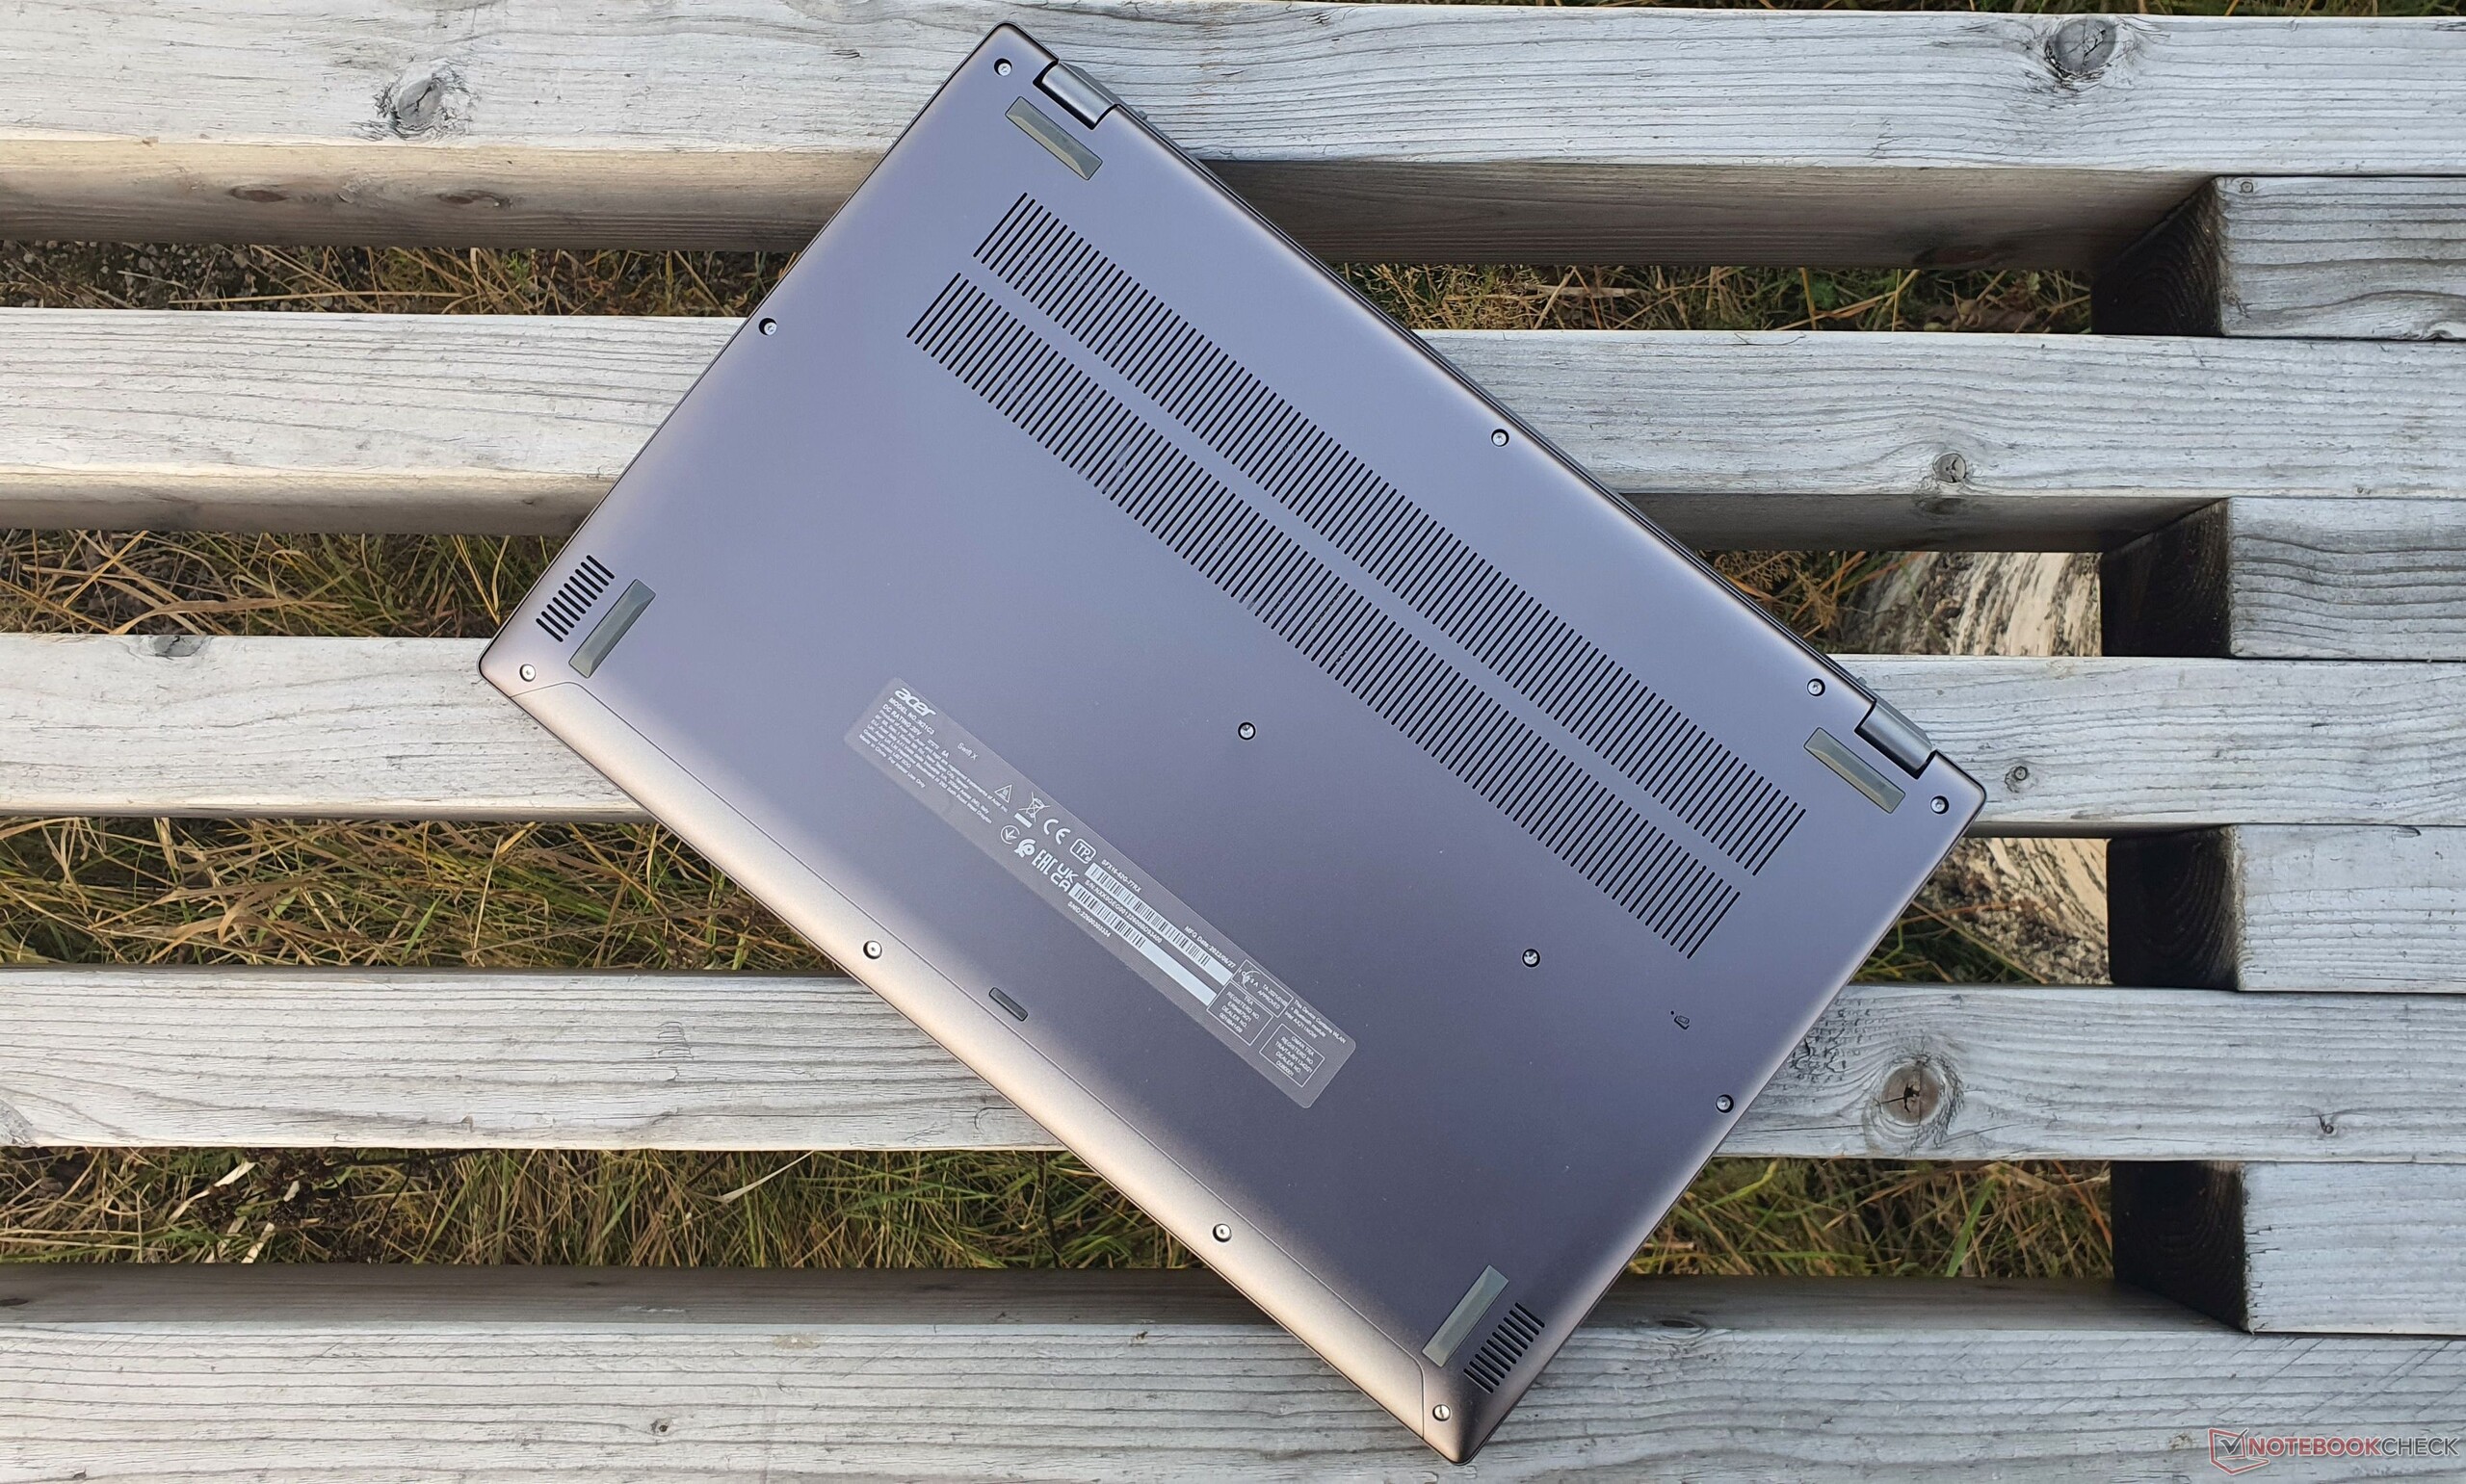
Since the whole case bottom is bulged, this results in a maximum case thickness of about 21 mm (~0.83 in). The manufacturer specification of 17.9 mm (~0.7 in) refers to a measurement that doesn't take this bulge into account.
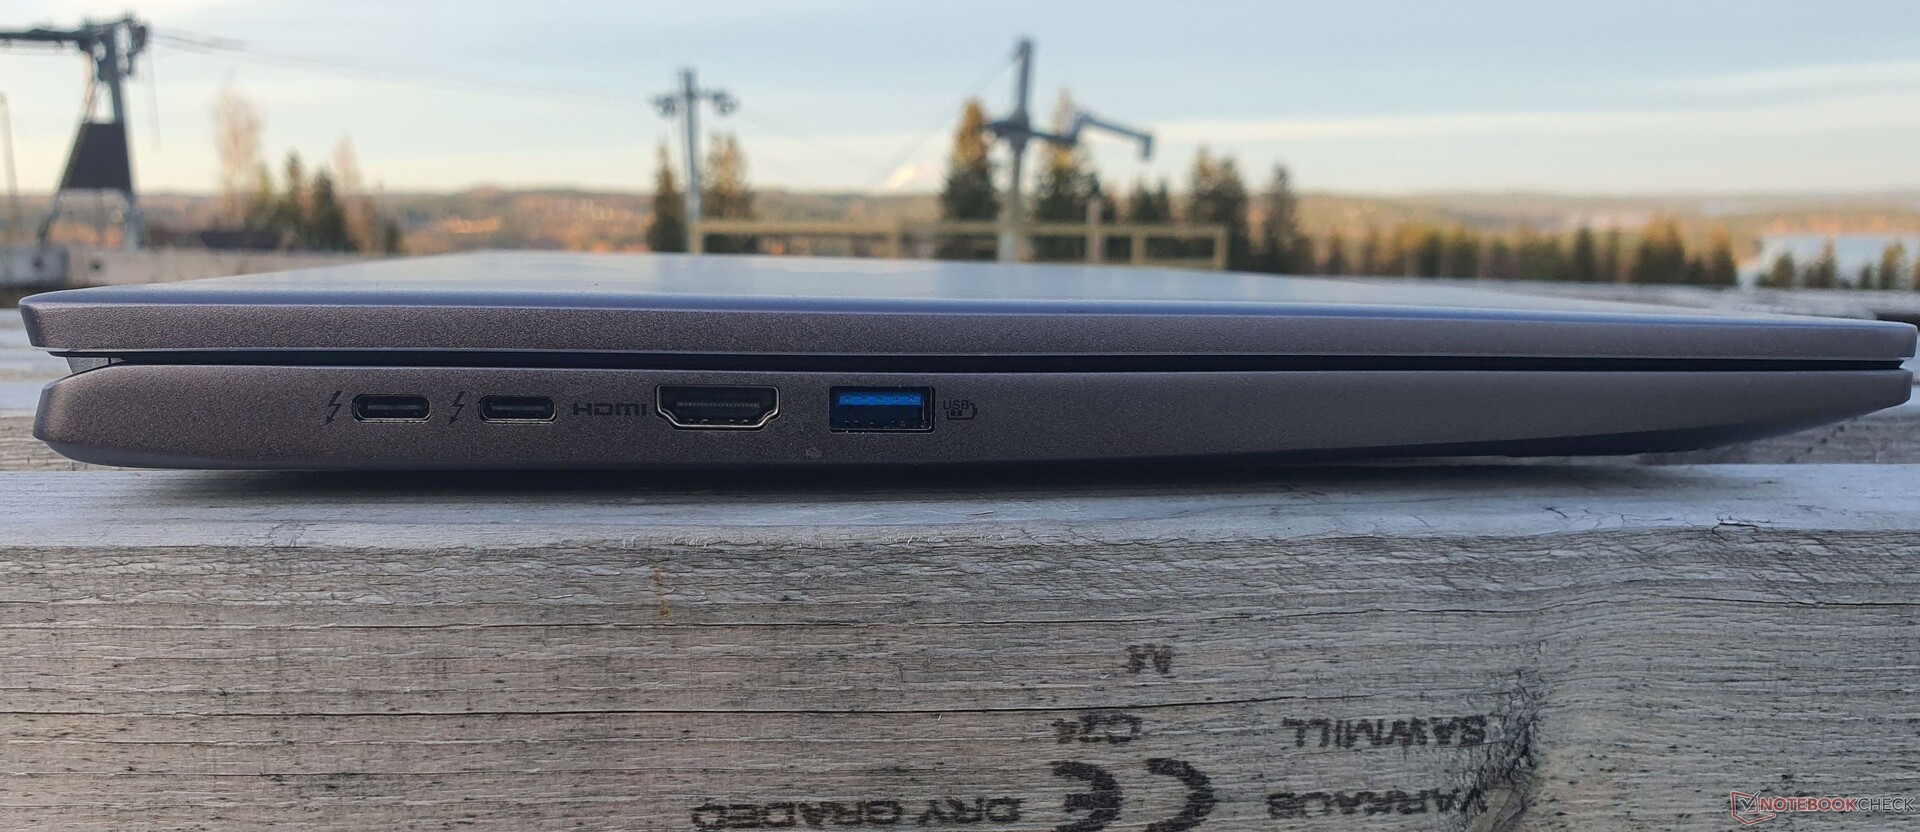
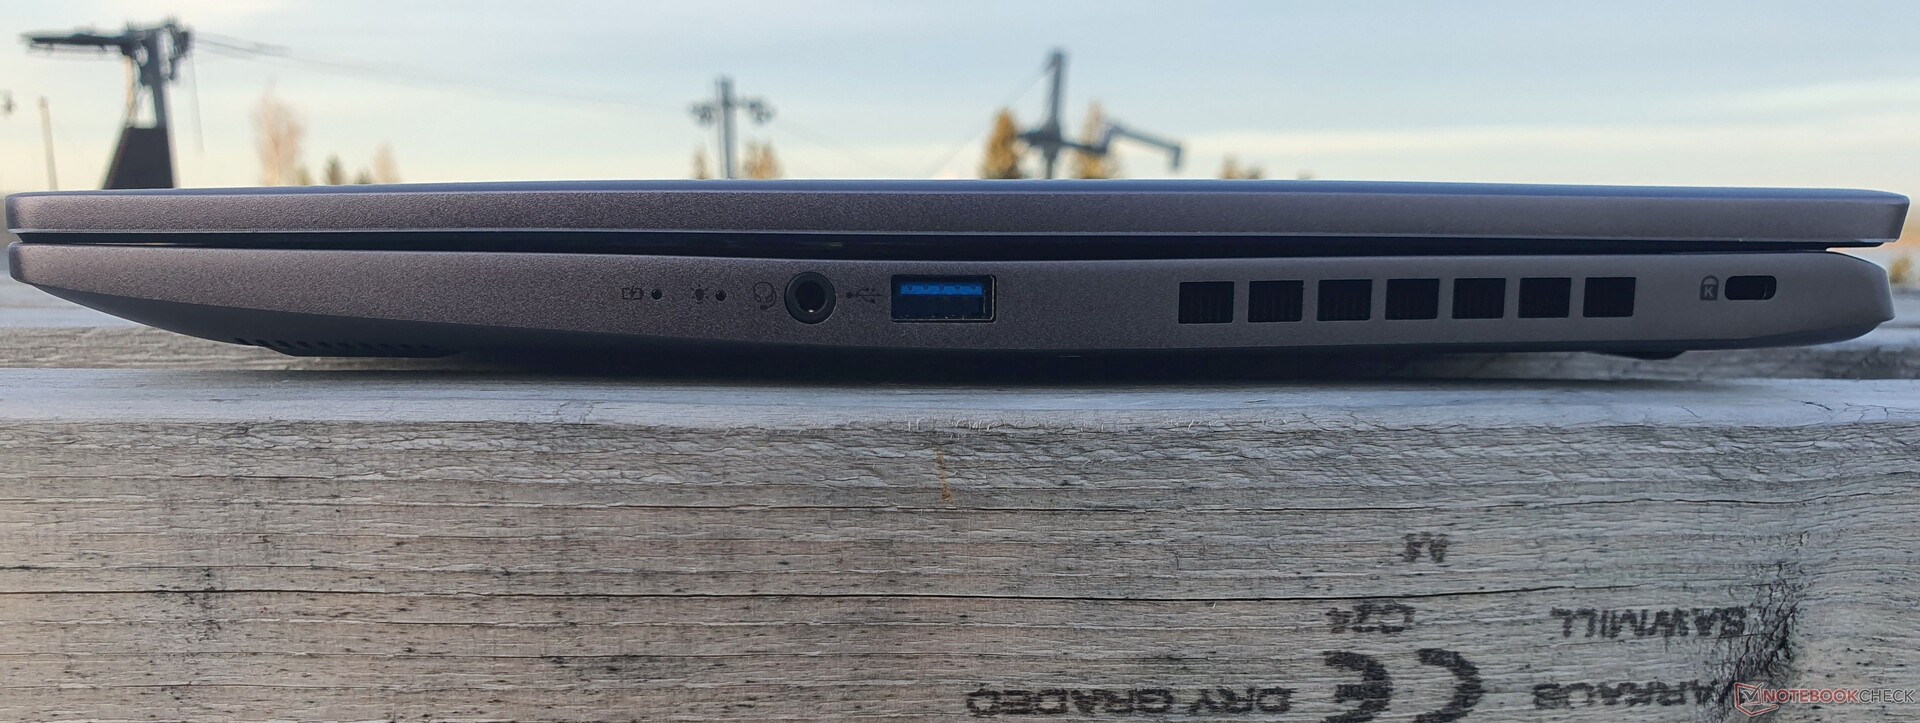
Equipment: Update to HDMI 2.1 & TB4 for the Acer Swift X
| Networking | |
| Acer Swift X SFX16-52G-77RX | |
| iperf3 receive AXE11000 | |
| iperf3 transmit AXE11000 | |
| Acer Swift X SFX16-52G-52VE | |
| iperf3 receive AXE11000 | |
| iperf3 transmit AXE11000 | |
| Acer Swift X SFX16-51G-5388 | |
| iperf3 transmit AX12 | |
| iperf3 receive AX12 | |
| Lenovo ThinkBook 16 G4+ IAP | |
| iperf3 receive AXE11000 | |
| iperf3 transmit AXE11000 | |
| HP Envy 16 h0112nr | |
| iperf3 receive AXE11000 6GHz | |
| iperf3 transmit AXE11000 6GHz | |
| Dell Inspiron 16 Plus 7620 | |
| iperf3 receive AXE11000 6GHz | |
| iperf3 transmit AXE11000 6GHz | |
| Lenovo IdeaPad 5 Pro 16ARH7 | |
| iperf3 receive AXE11000 | |
| iperf3 transmit AXE11000 | |
| Asus Vivobook Pro 16X-M7600QE | |
| iperf3 transmit AX12 | |
| iperf3 receive AX12 | |
WiFi Chart
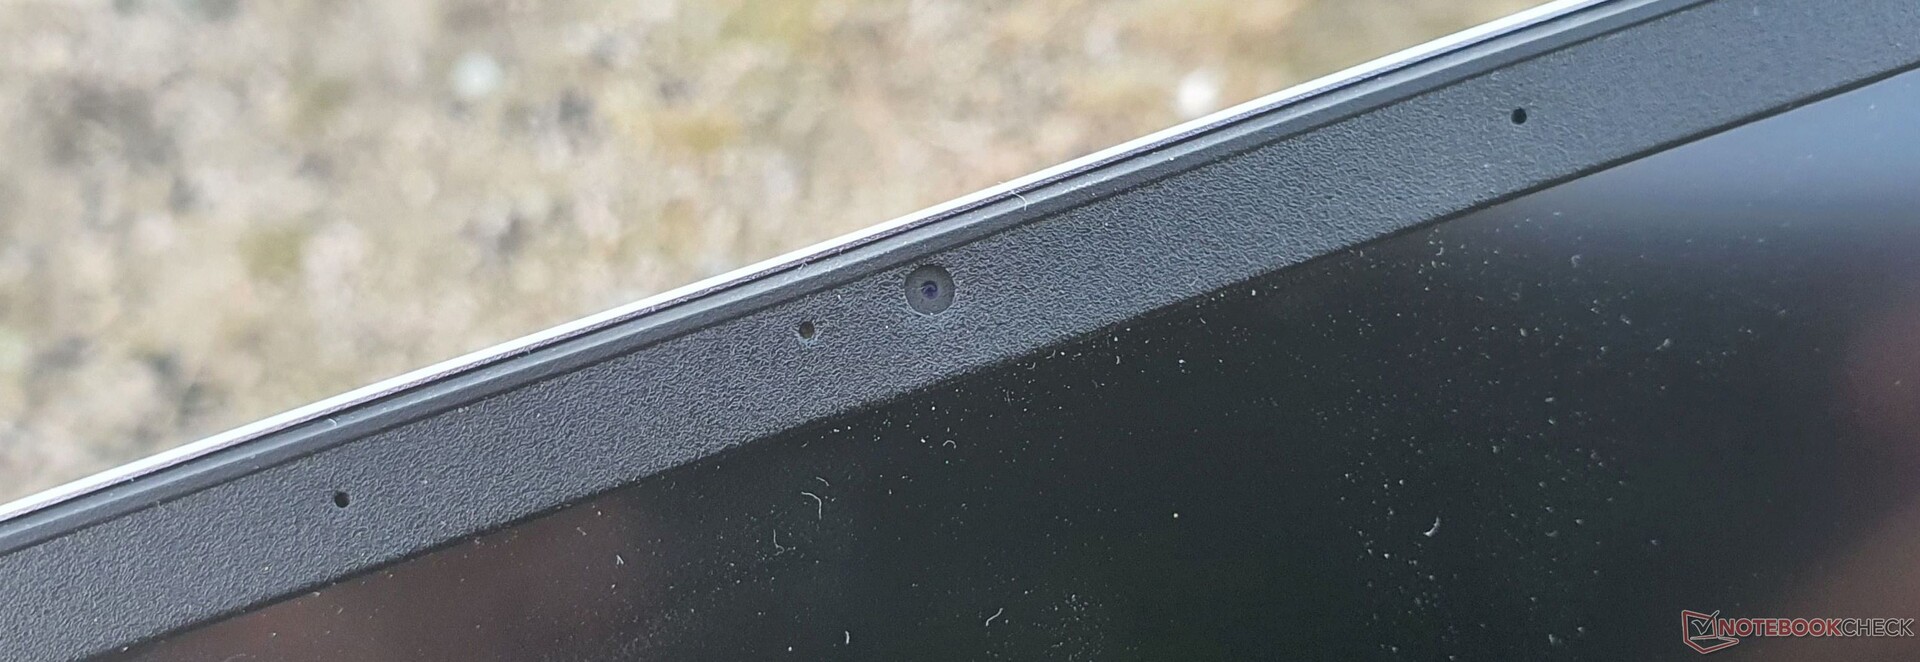
Webcam


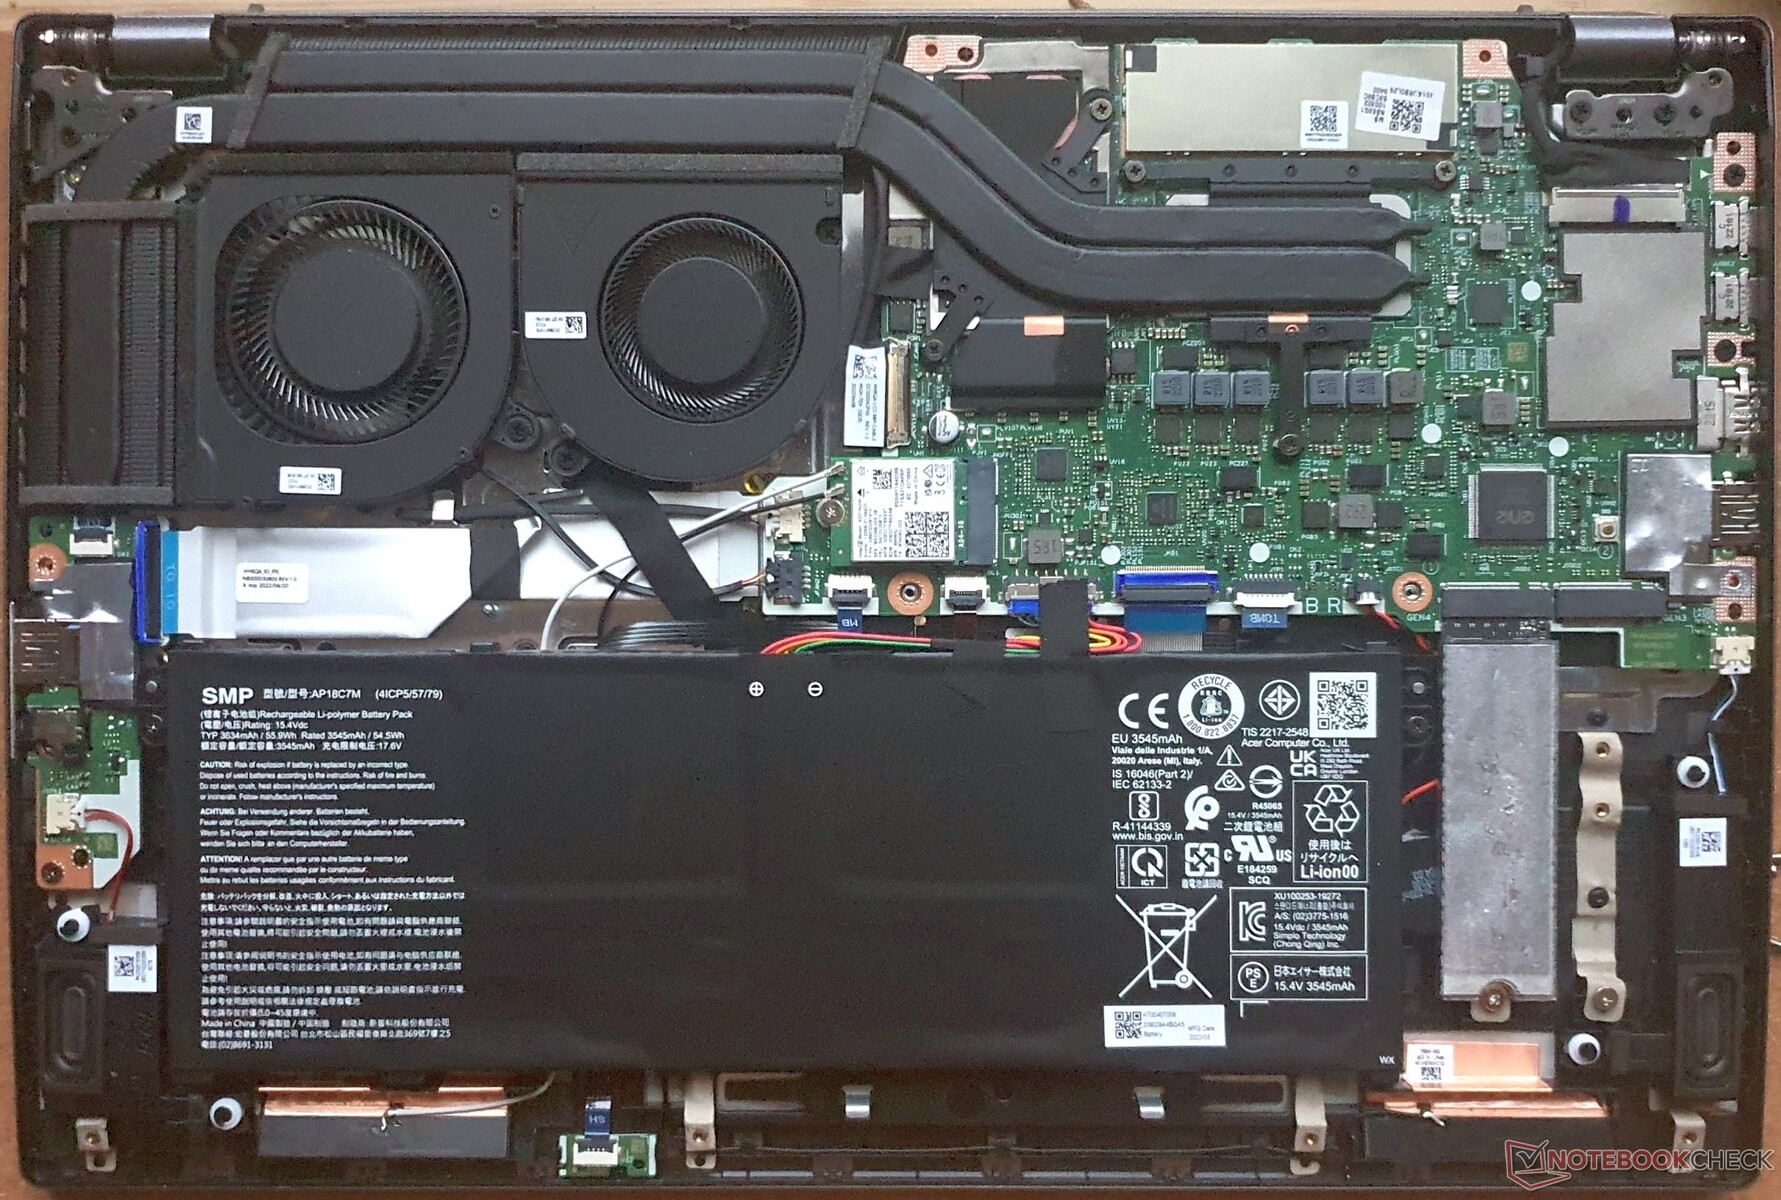
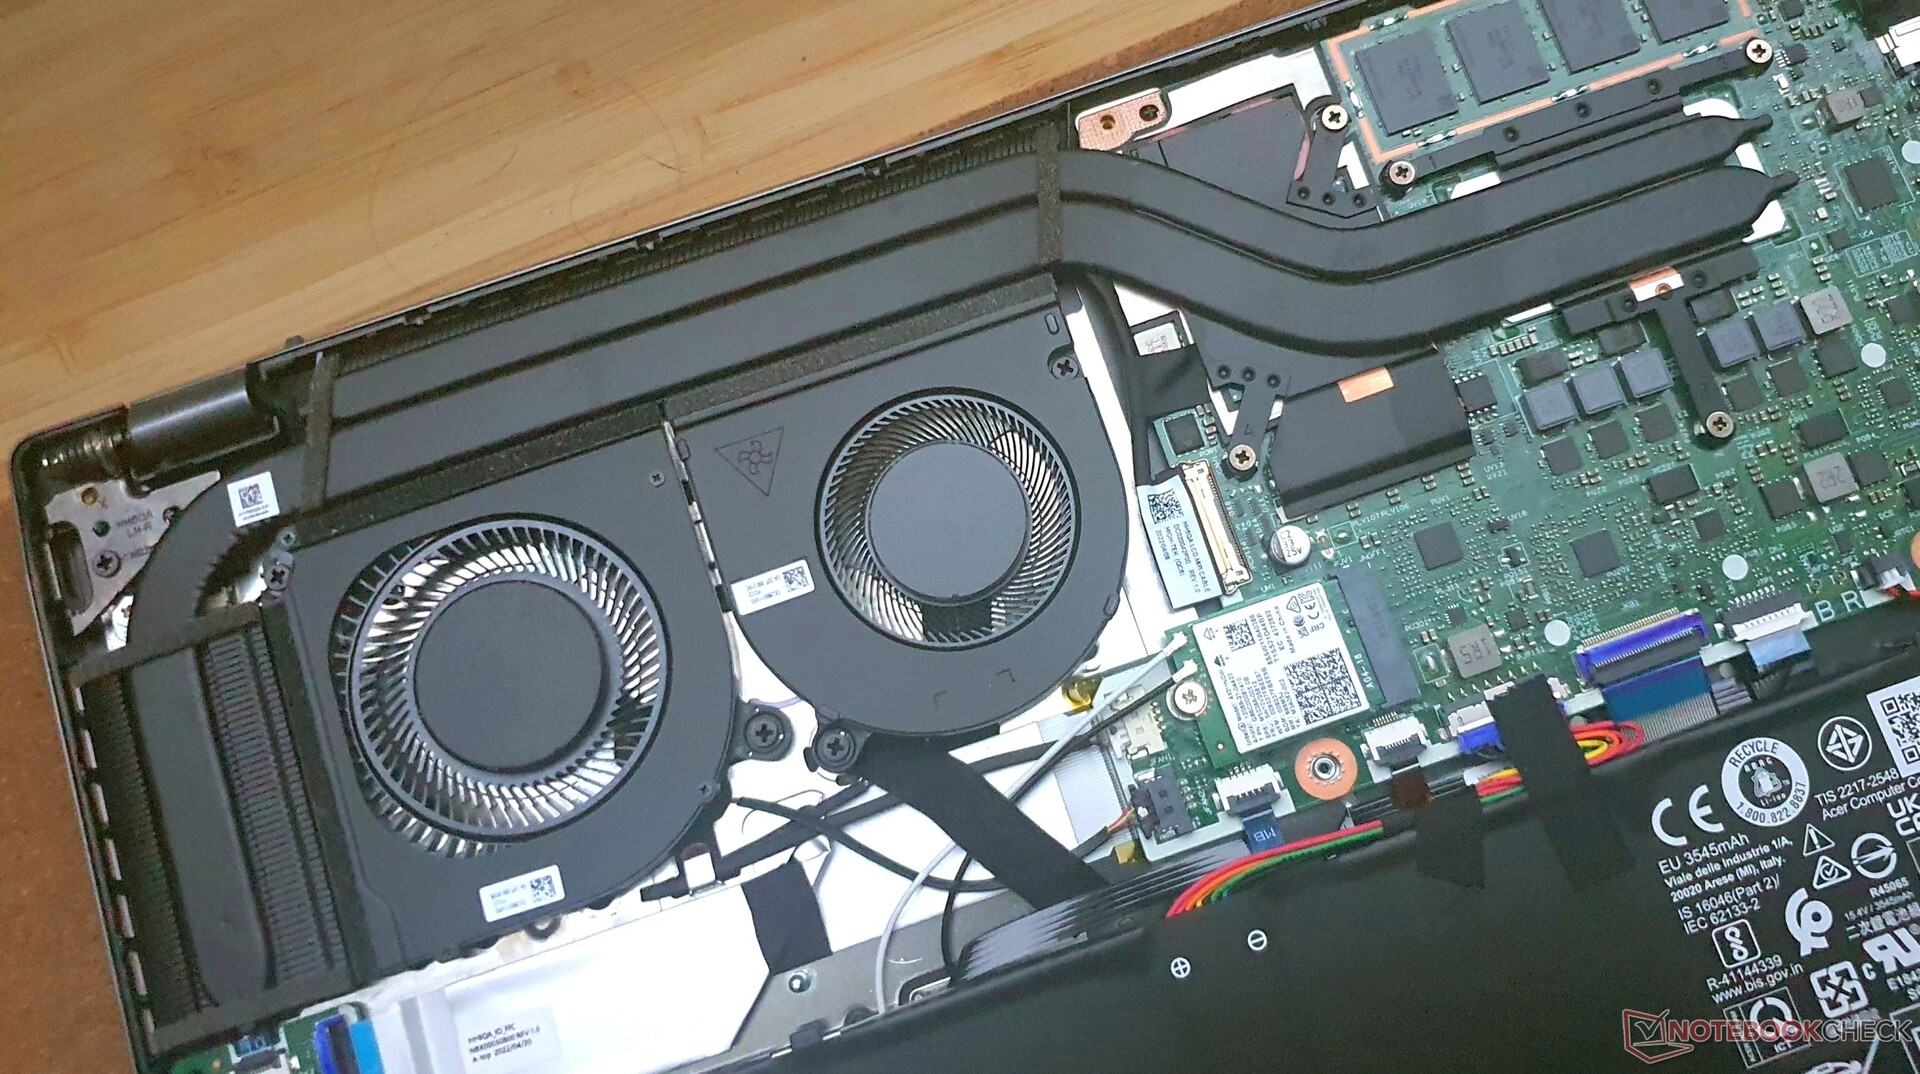
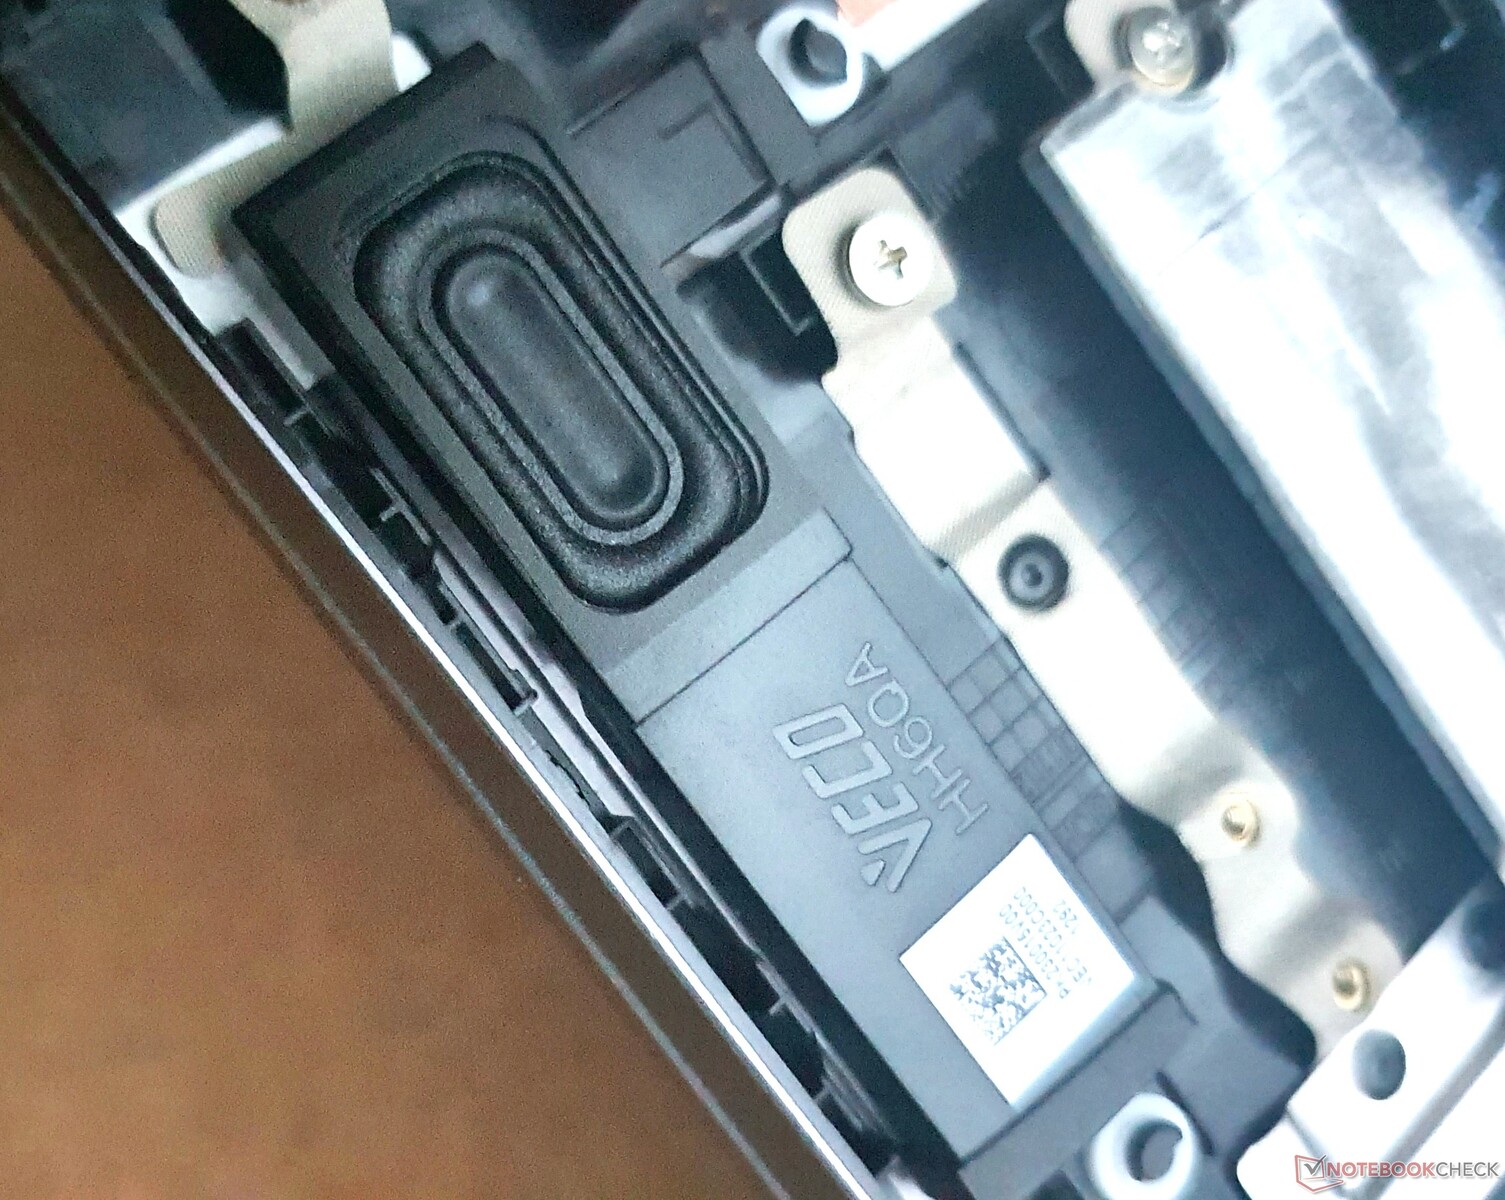
Maintenance
Warranty
Acer offers the usual 2 years of warranty for its Swift series in Germany.
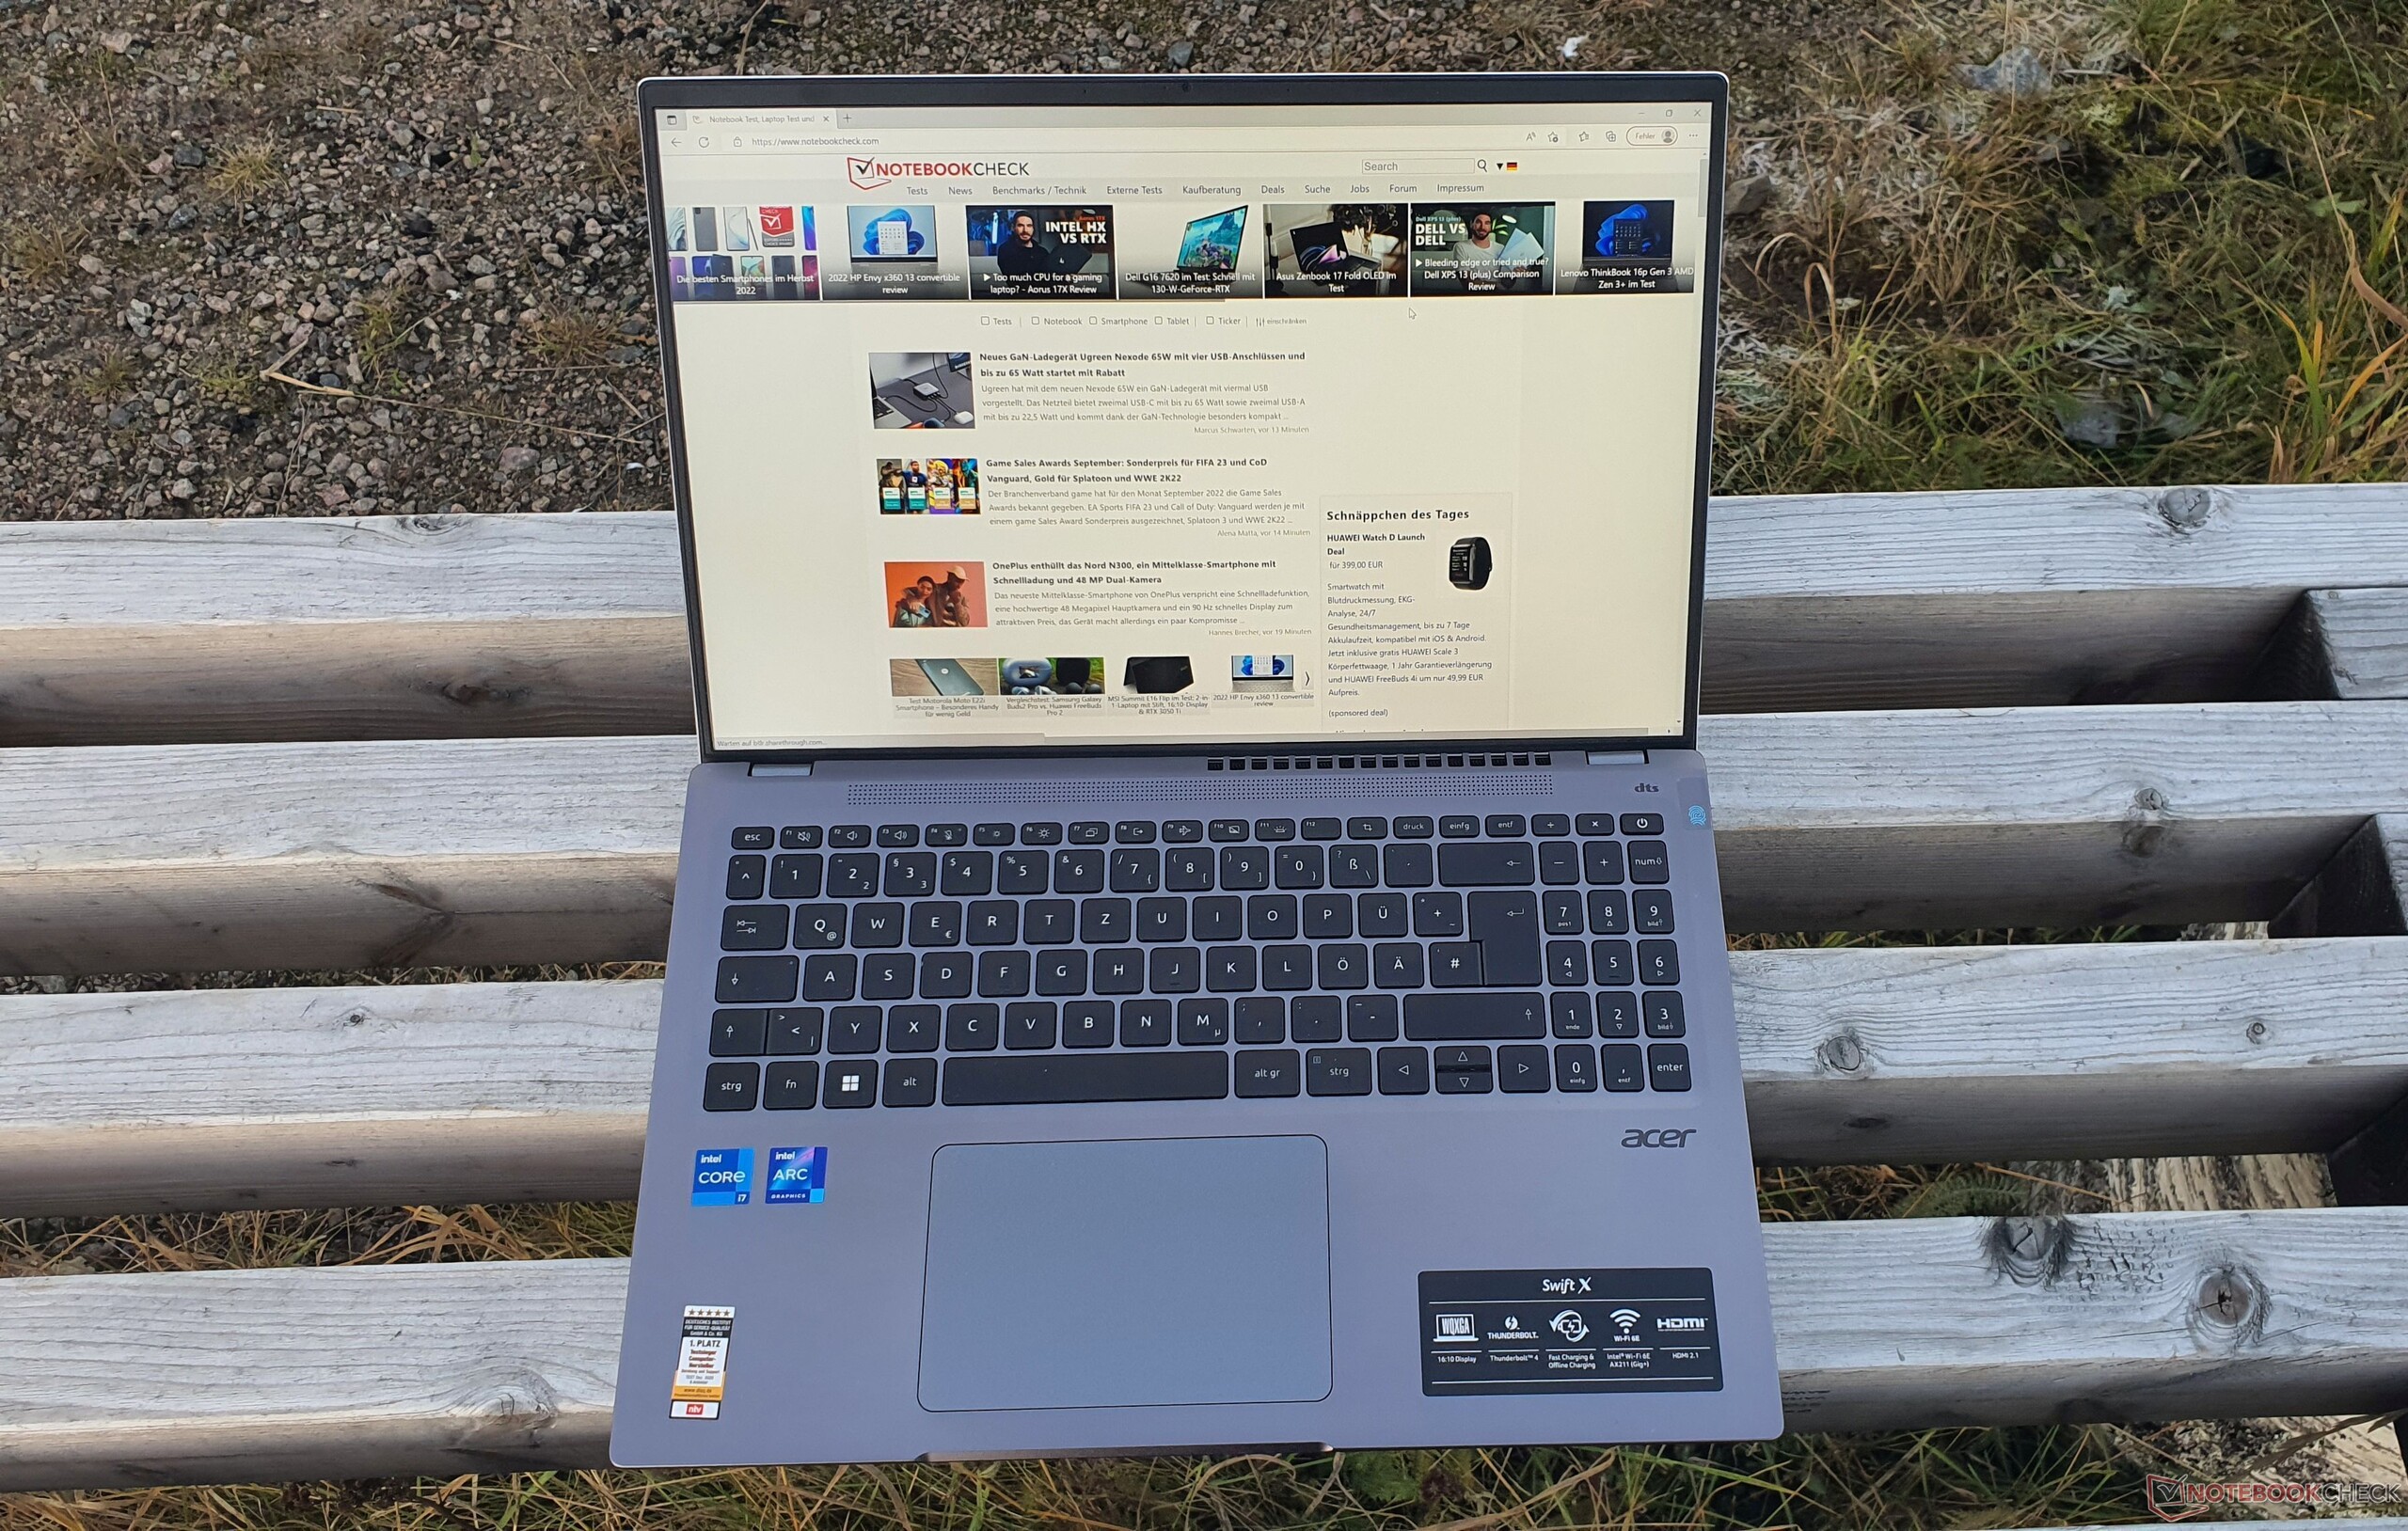
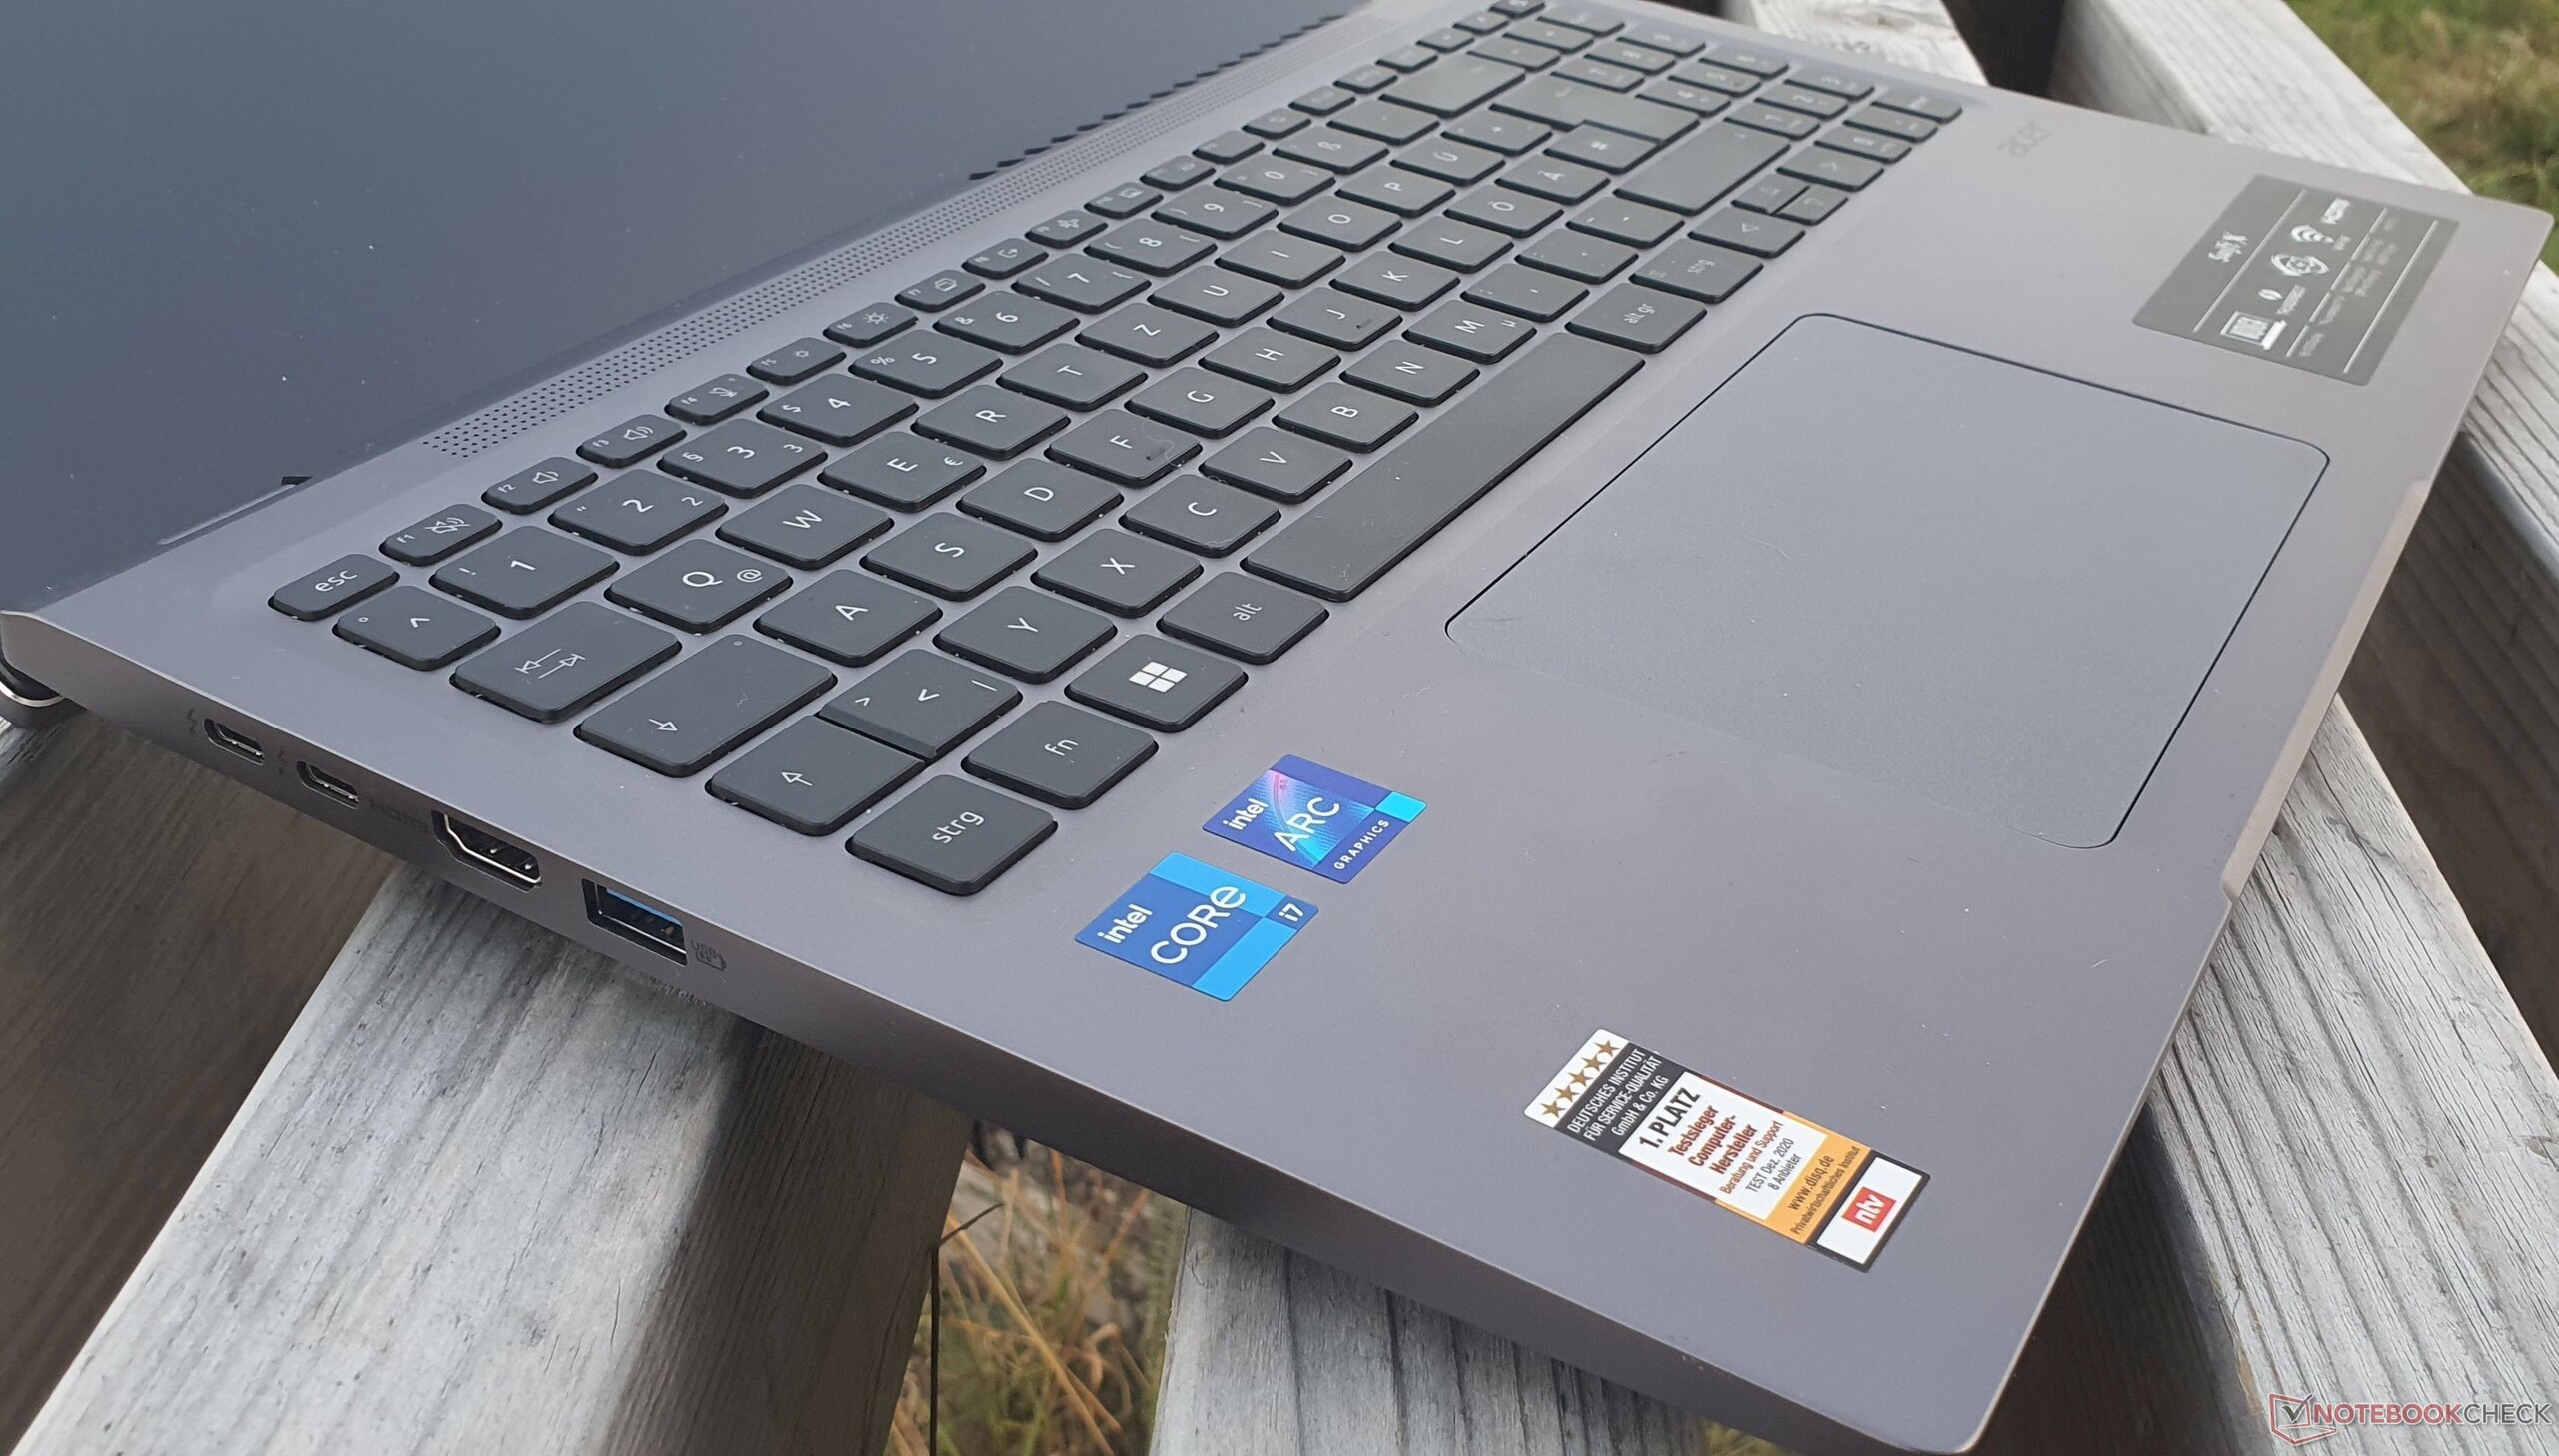
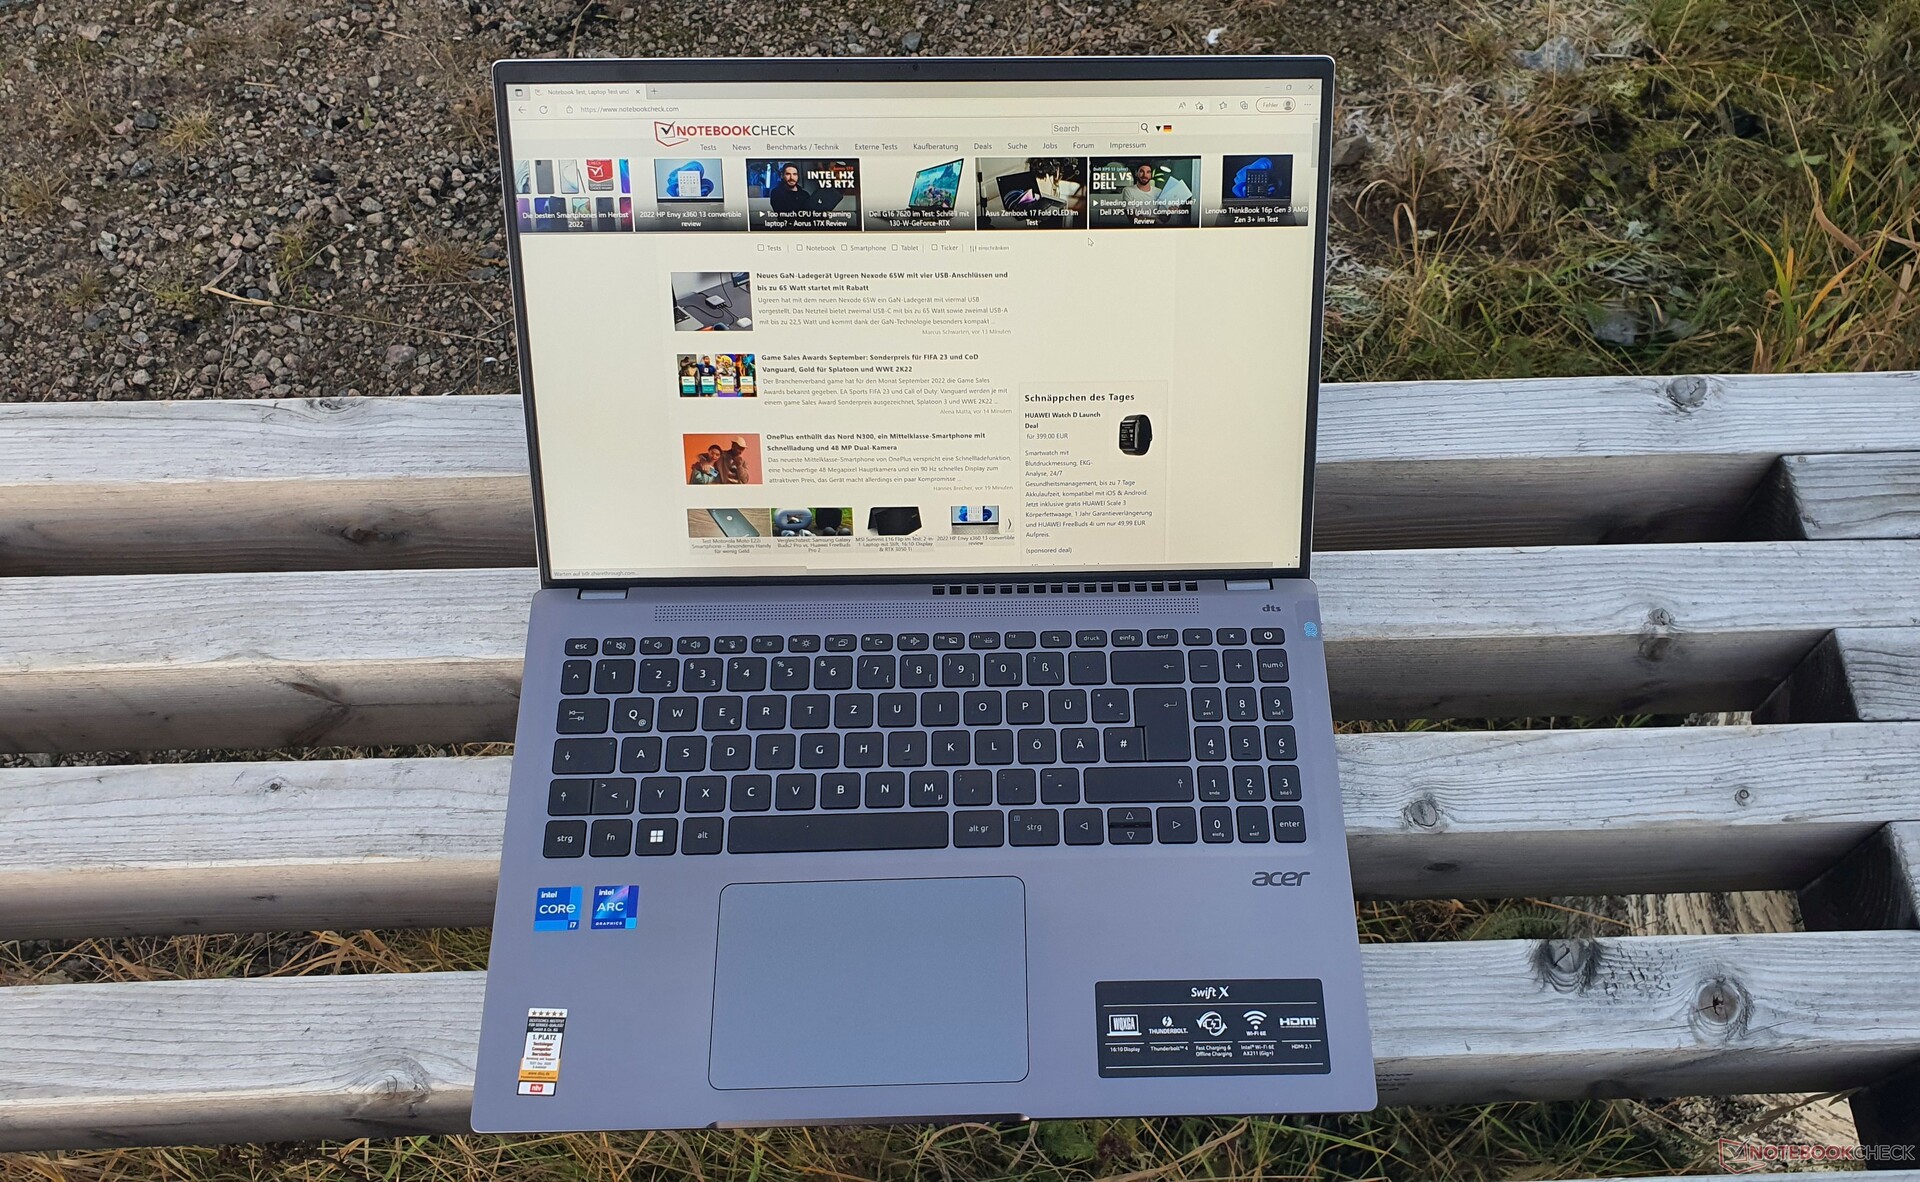
Input Devices: Great keyboard but weak touchpad in the Acer Swift X
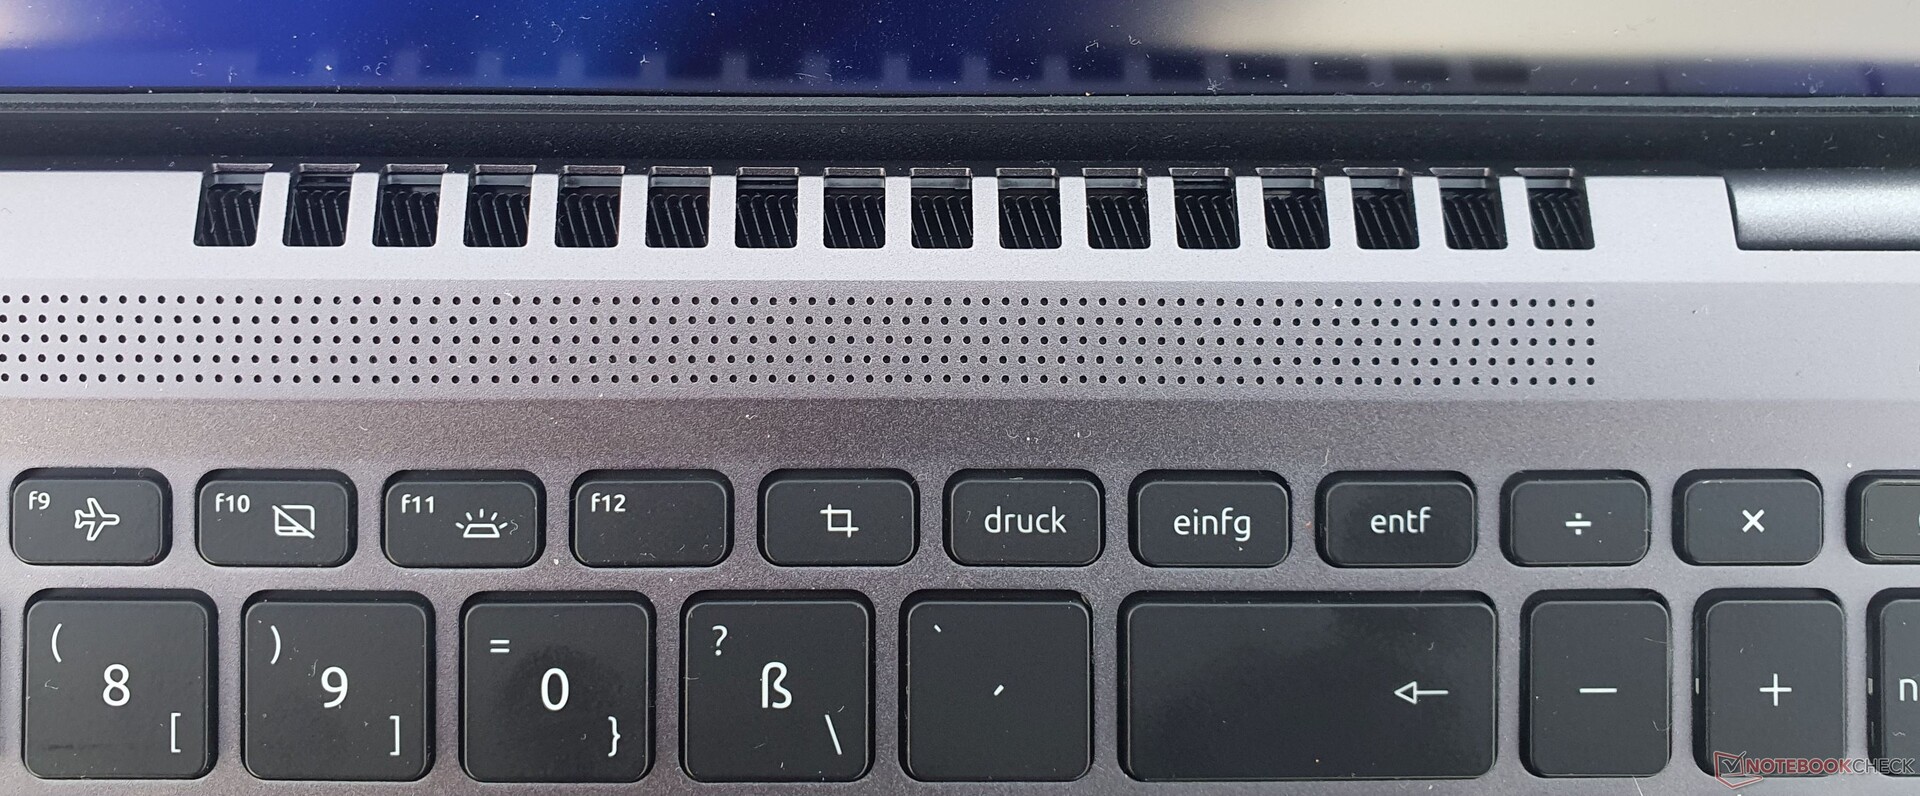
Keyboard
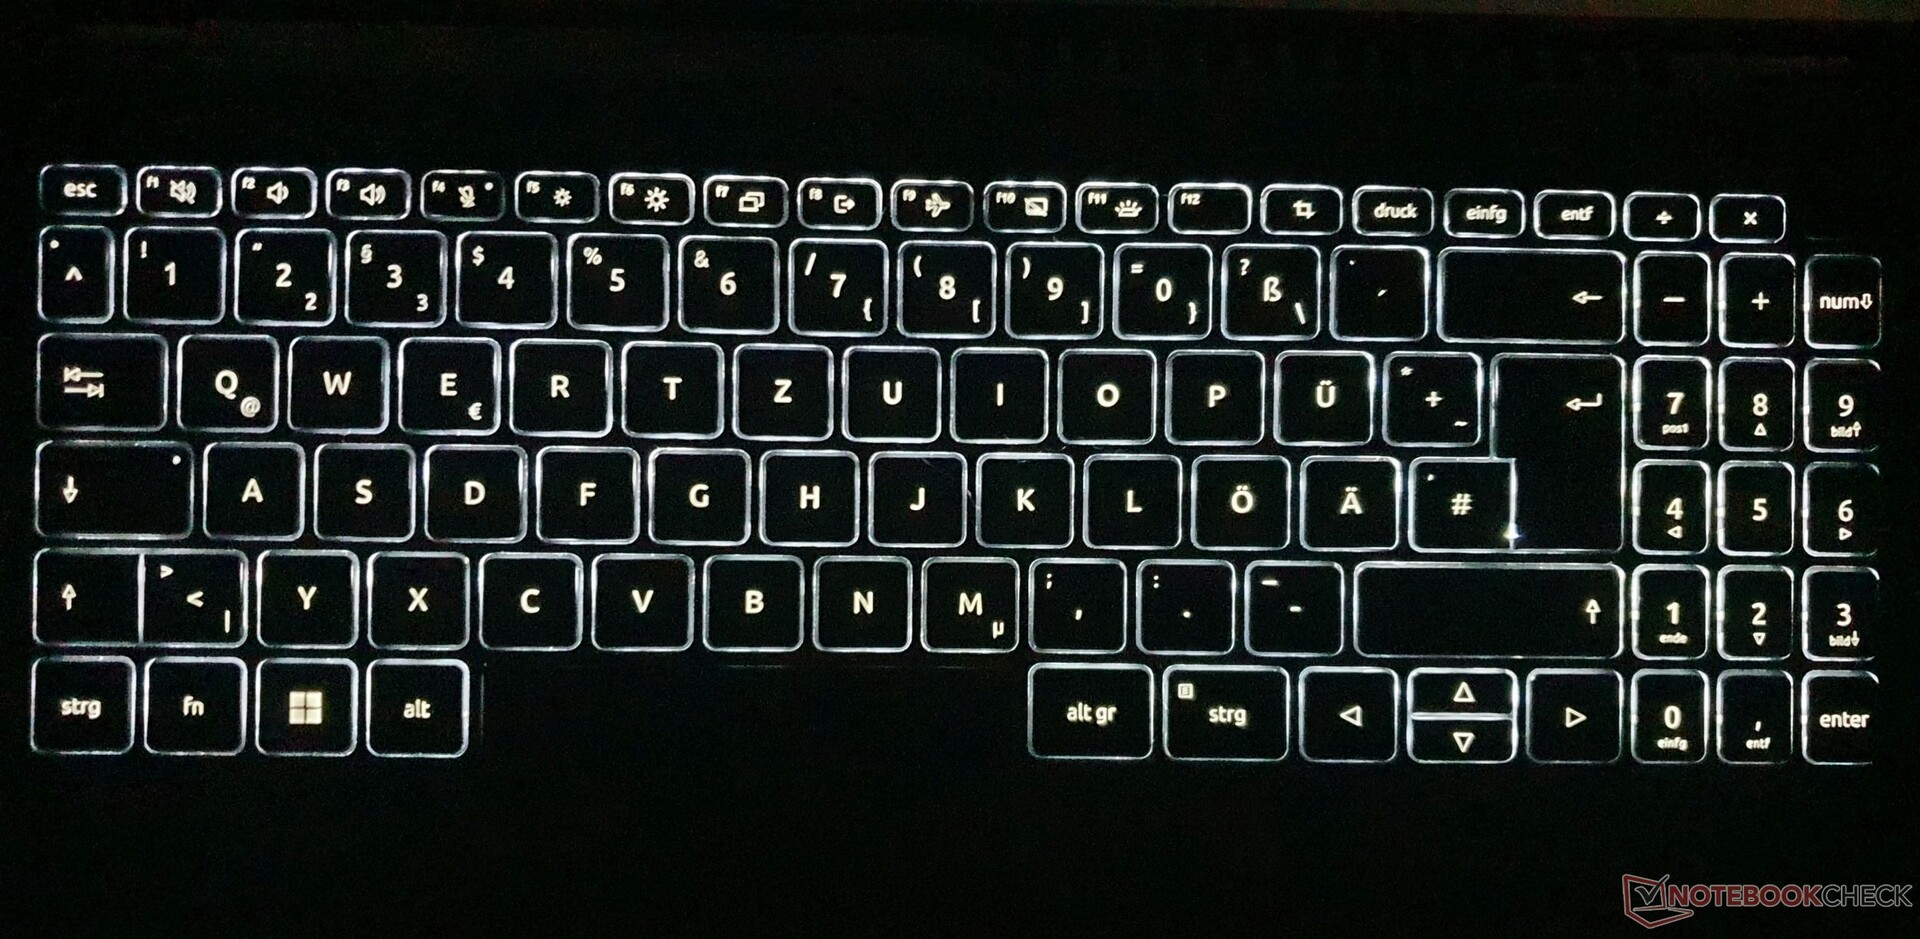
The key size of the 6-row chiclet keyboard is slightly reduced at 15 x 15 mm (~0.59 x 0.59 in). The keystroke is short, but together with a well-adjusted resistance, the pressure point creates a powerful feedback. You can also use it to type longer texts without any problems.
The keyboard does have some give under targeted pressure. While typing, this becomes apparent in form of slightly clattering Enter and Hash keys. The layout of the Acer keyboard has the typical double occupancies, a cramped number block, and smaller Arrow Up/Down keys.
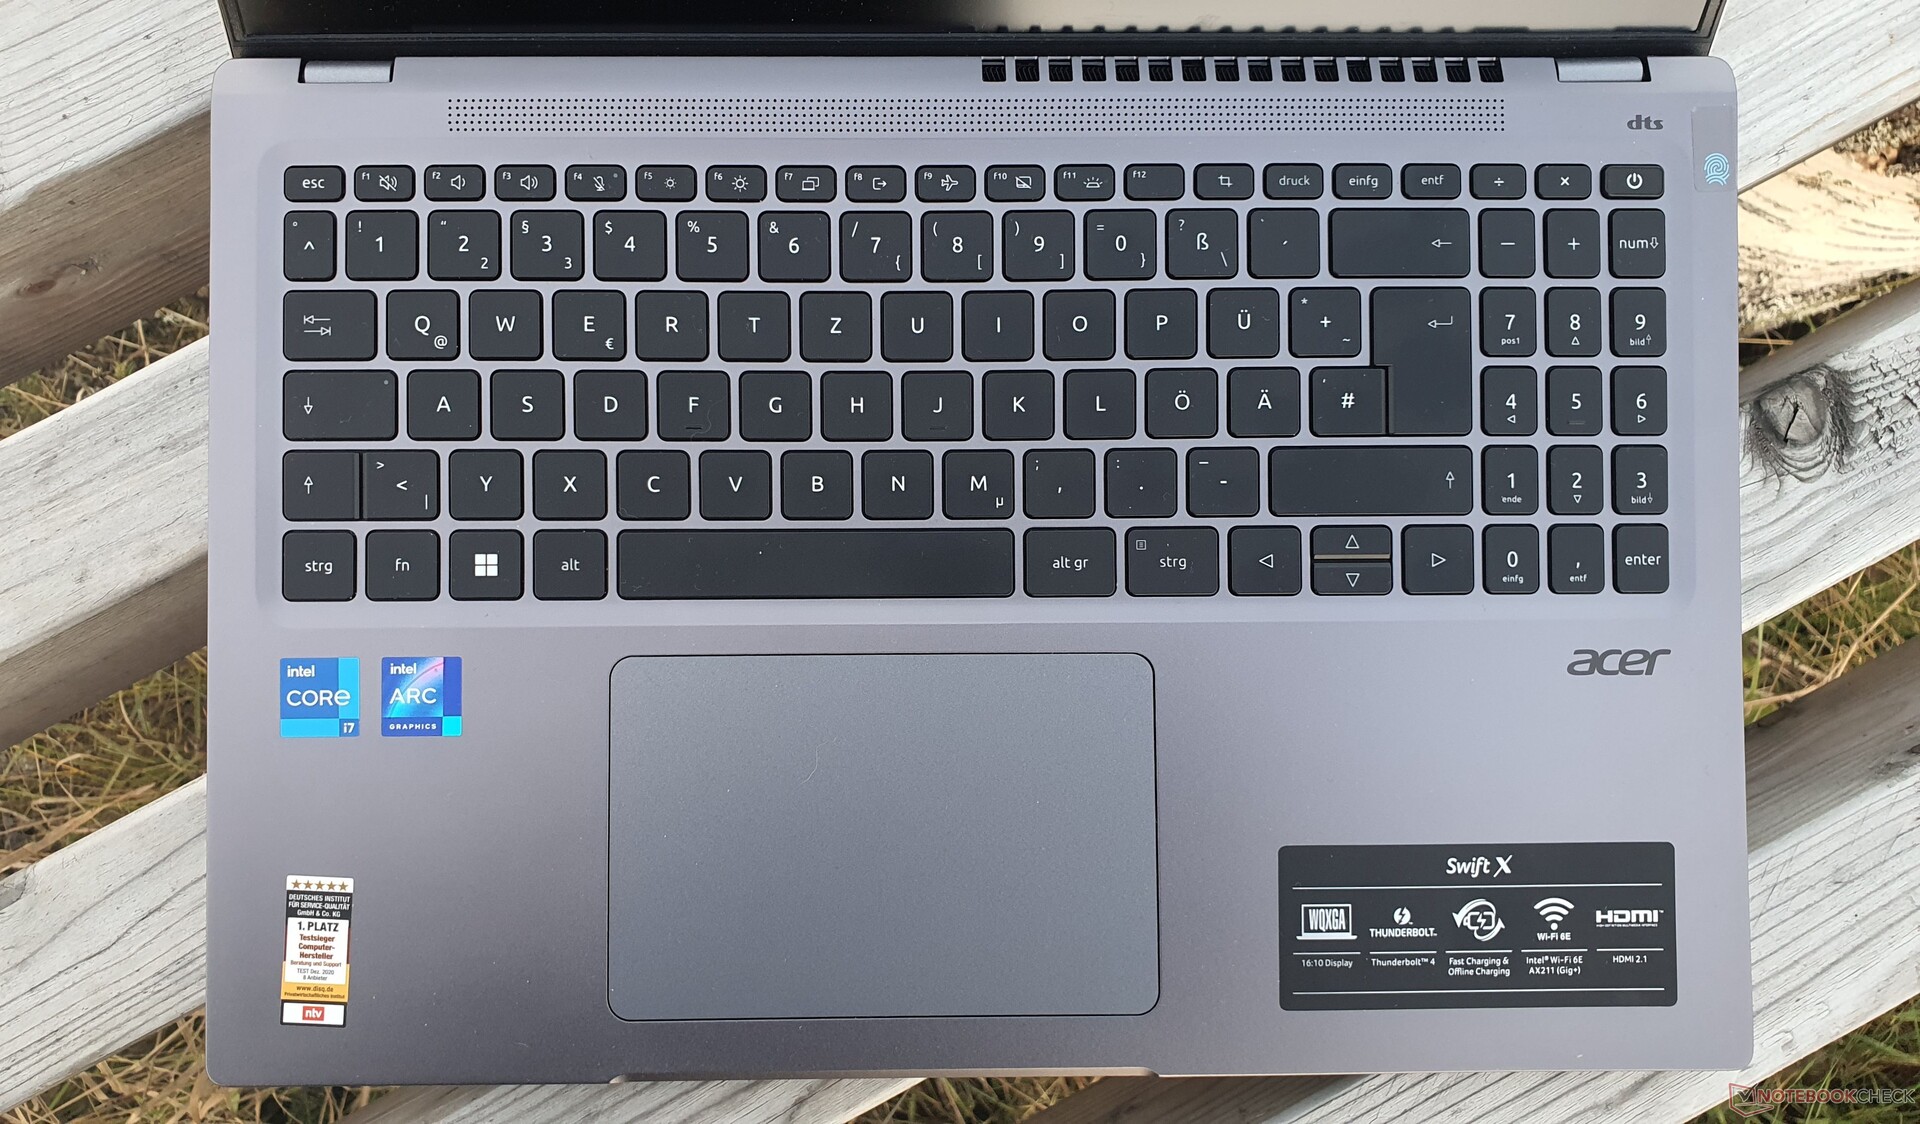
Touchpad
This year, Acer has equipped the Swift X 16 with its "OceanGlass" touchpad. The 12.7 x 8.3 cm (~5 x 3.3 in) surface is slippery with an almost oily feeling, making accurate input almost impossible. Drag-and-drop movements are also much harder to execute. The integrated click keys with a medium stroke are dull and clatter when the fingers slide across the touchpad.
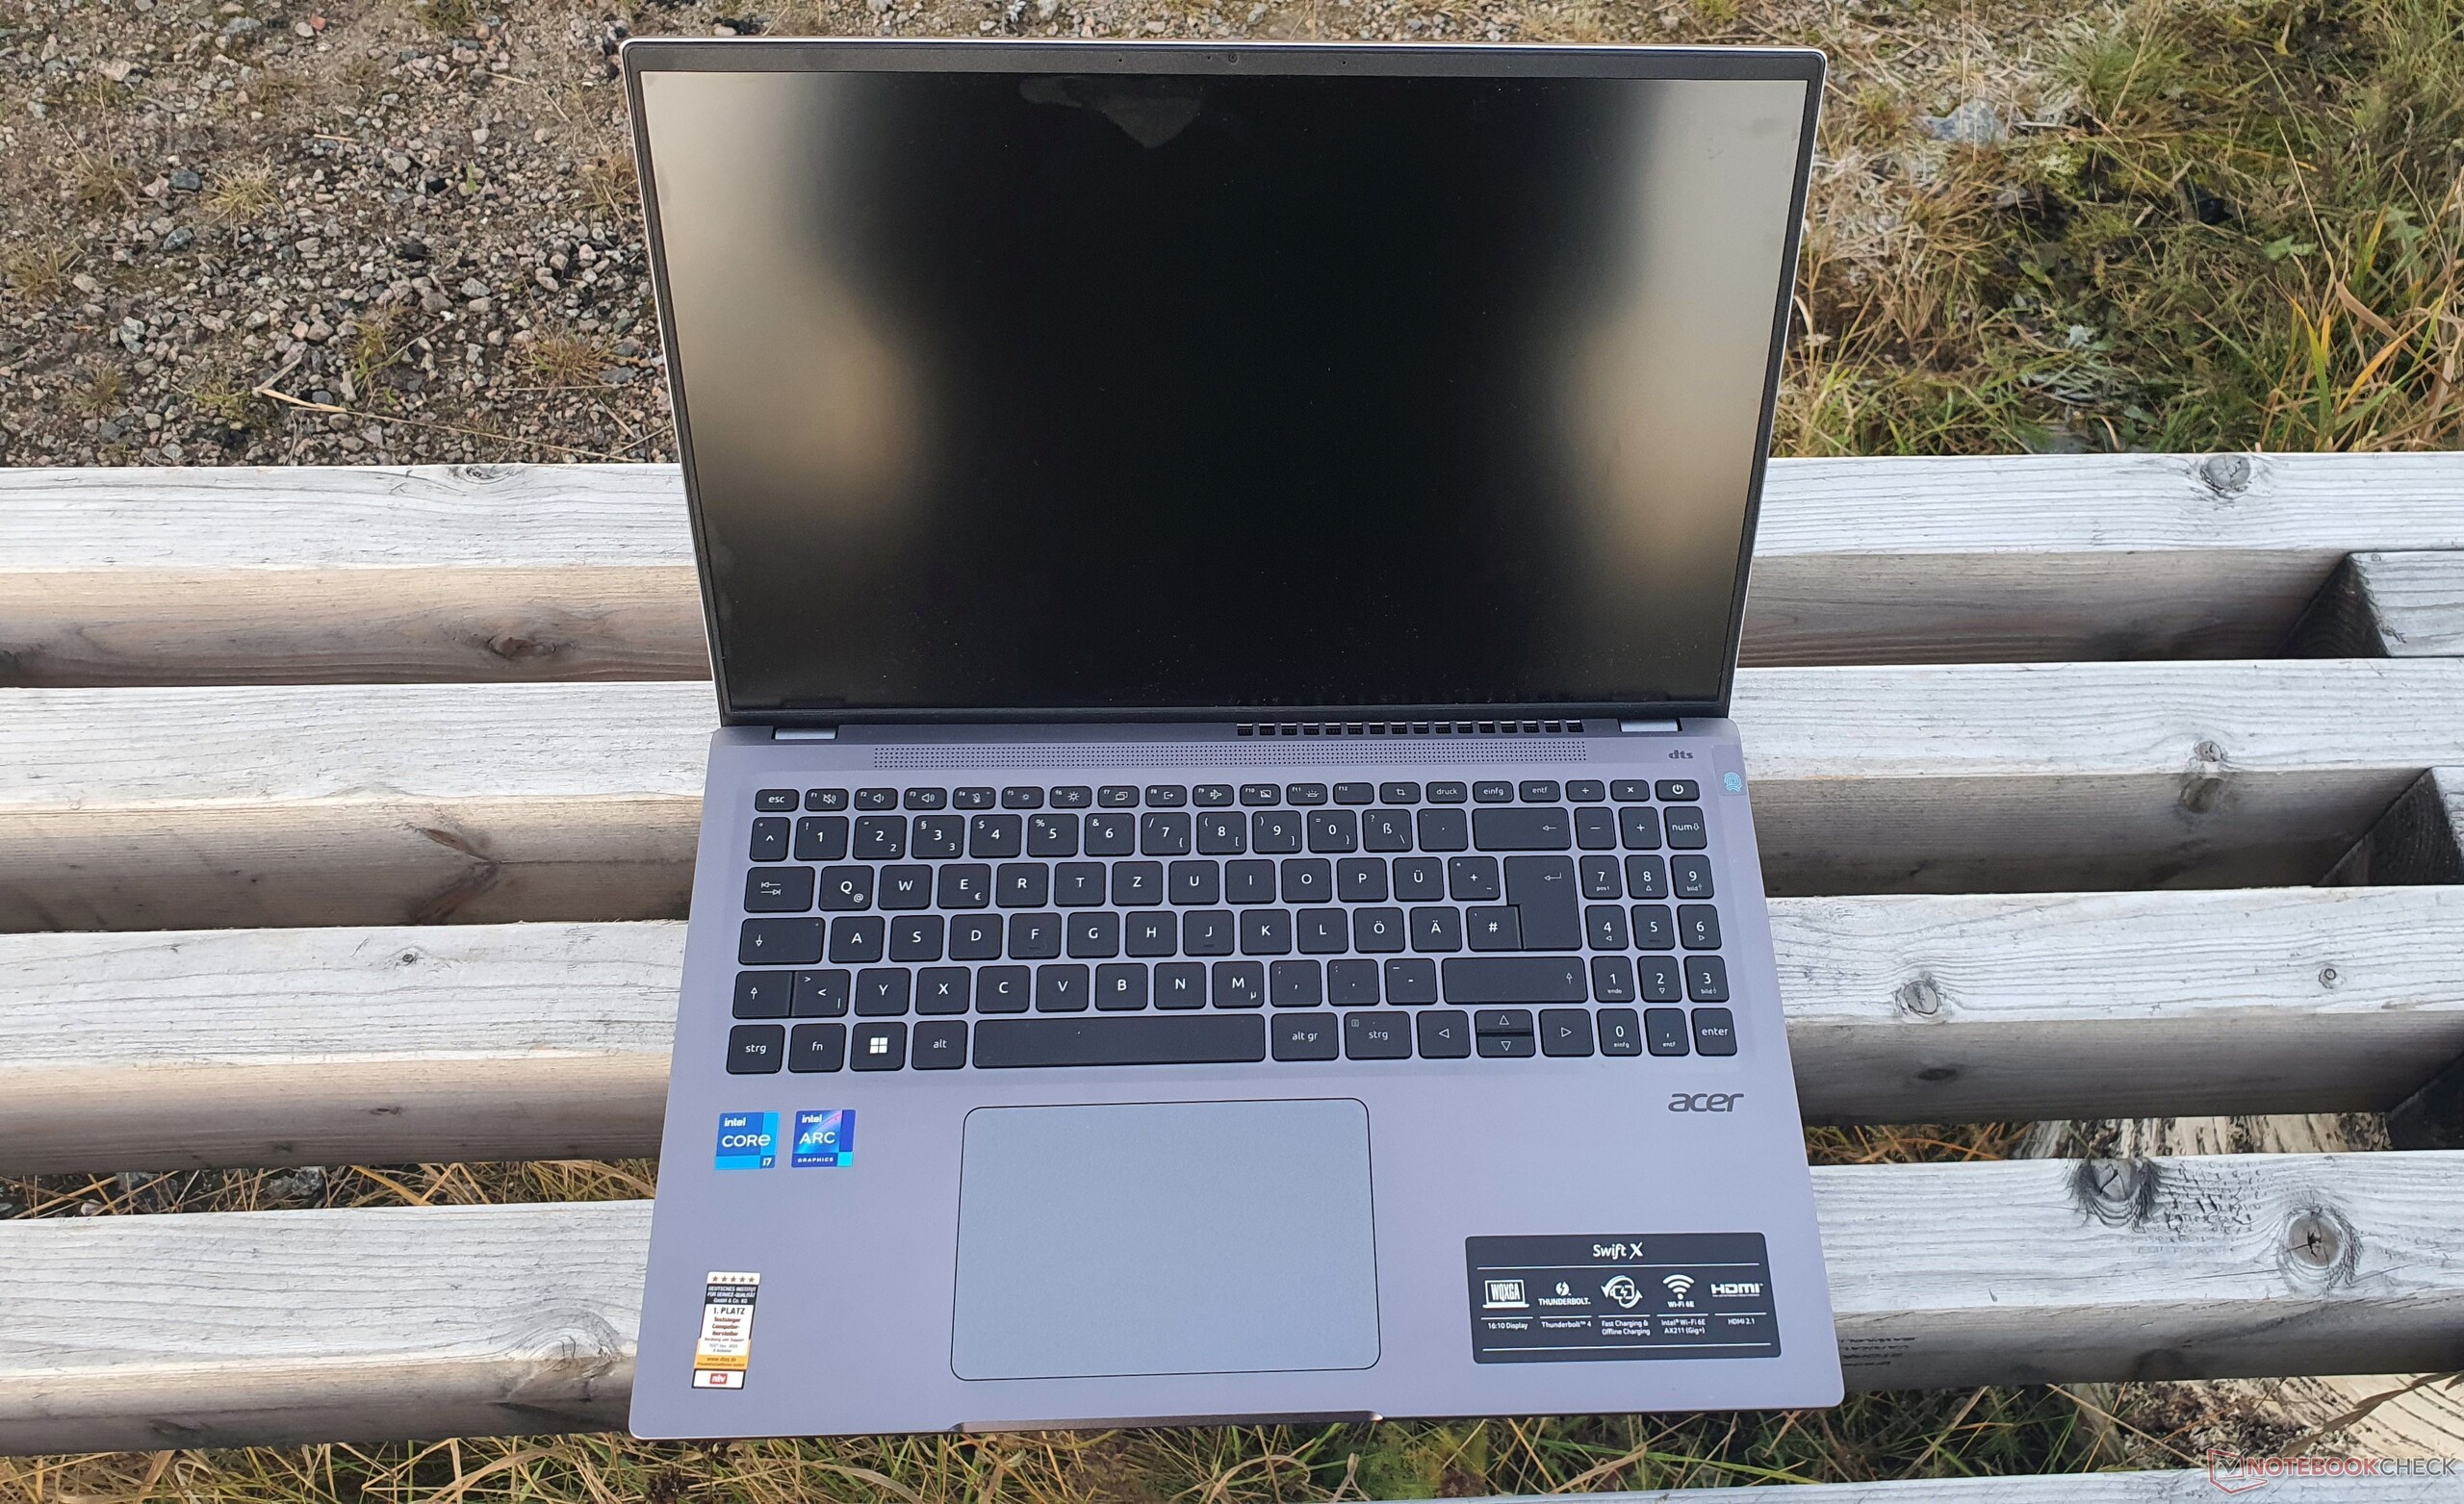
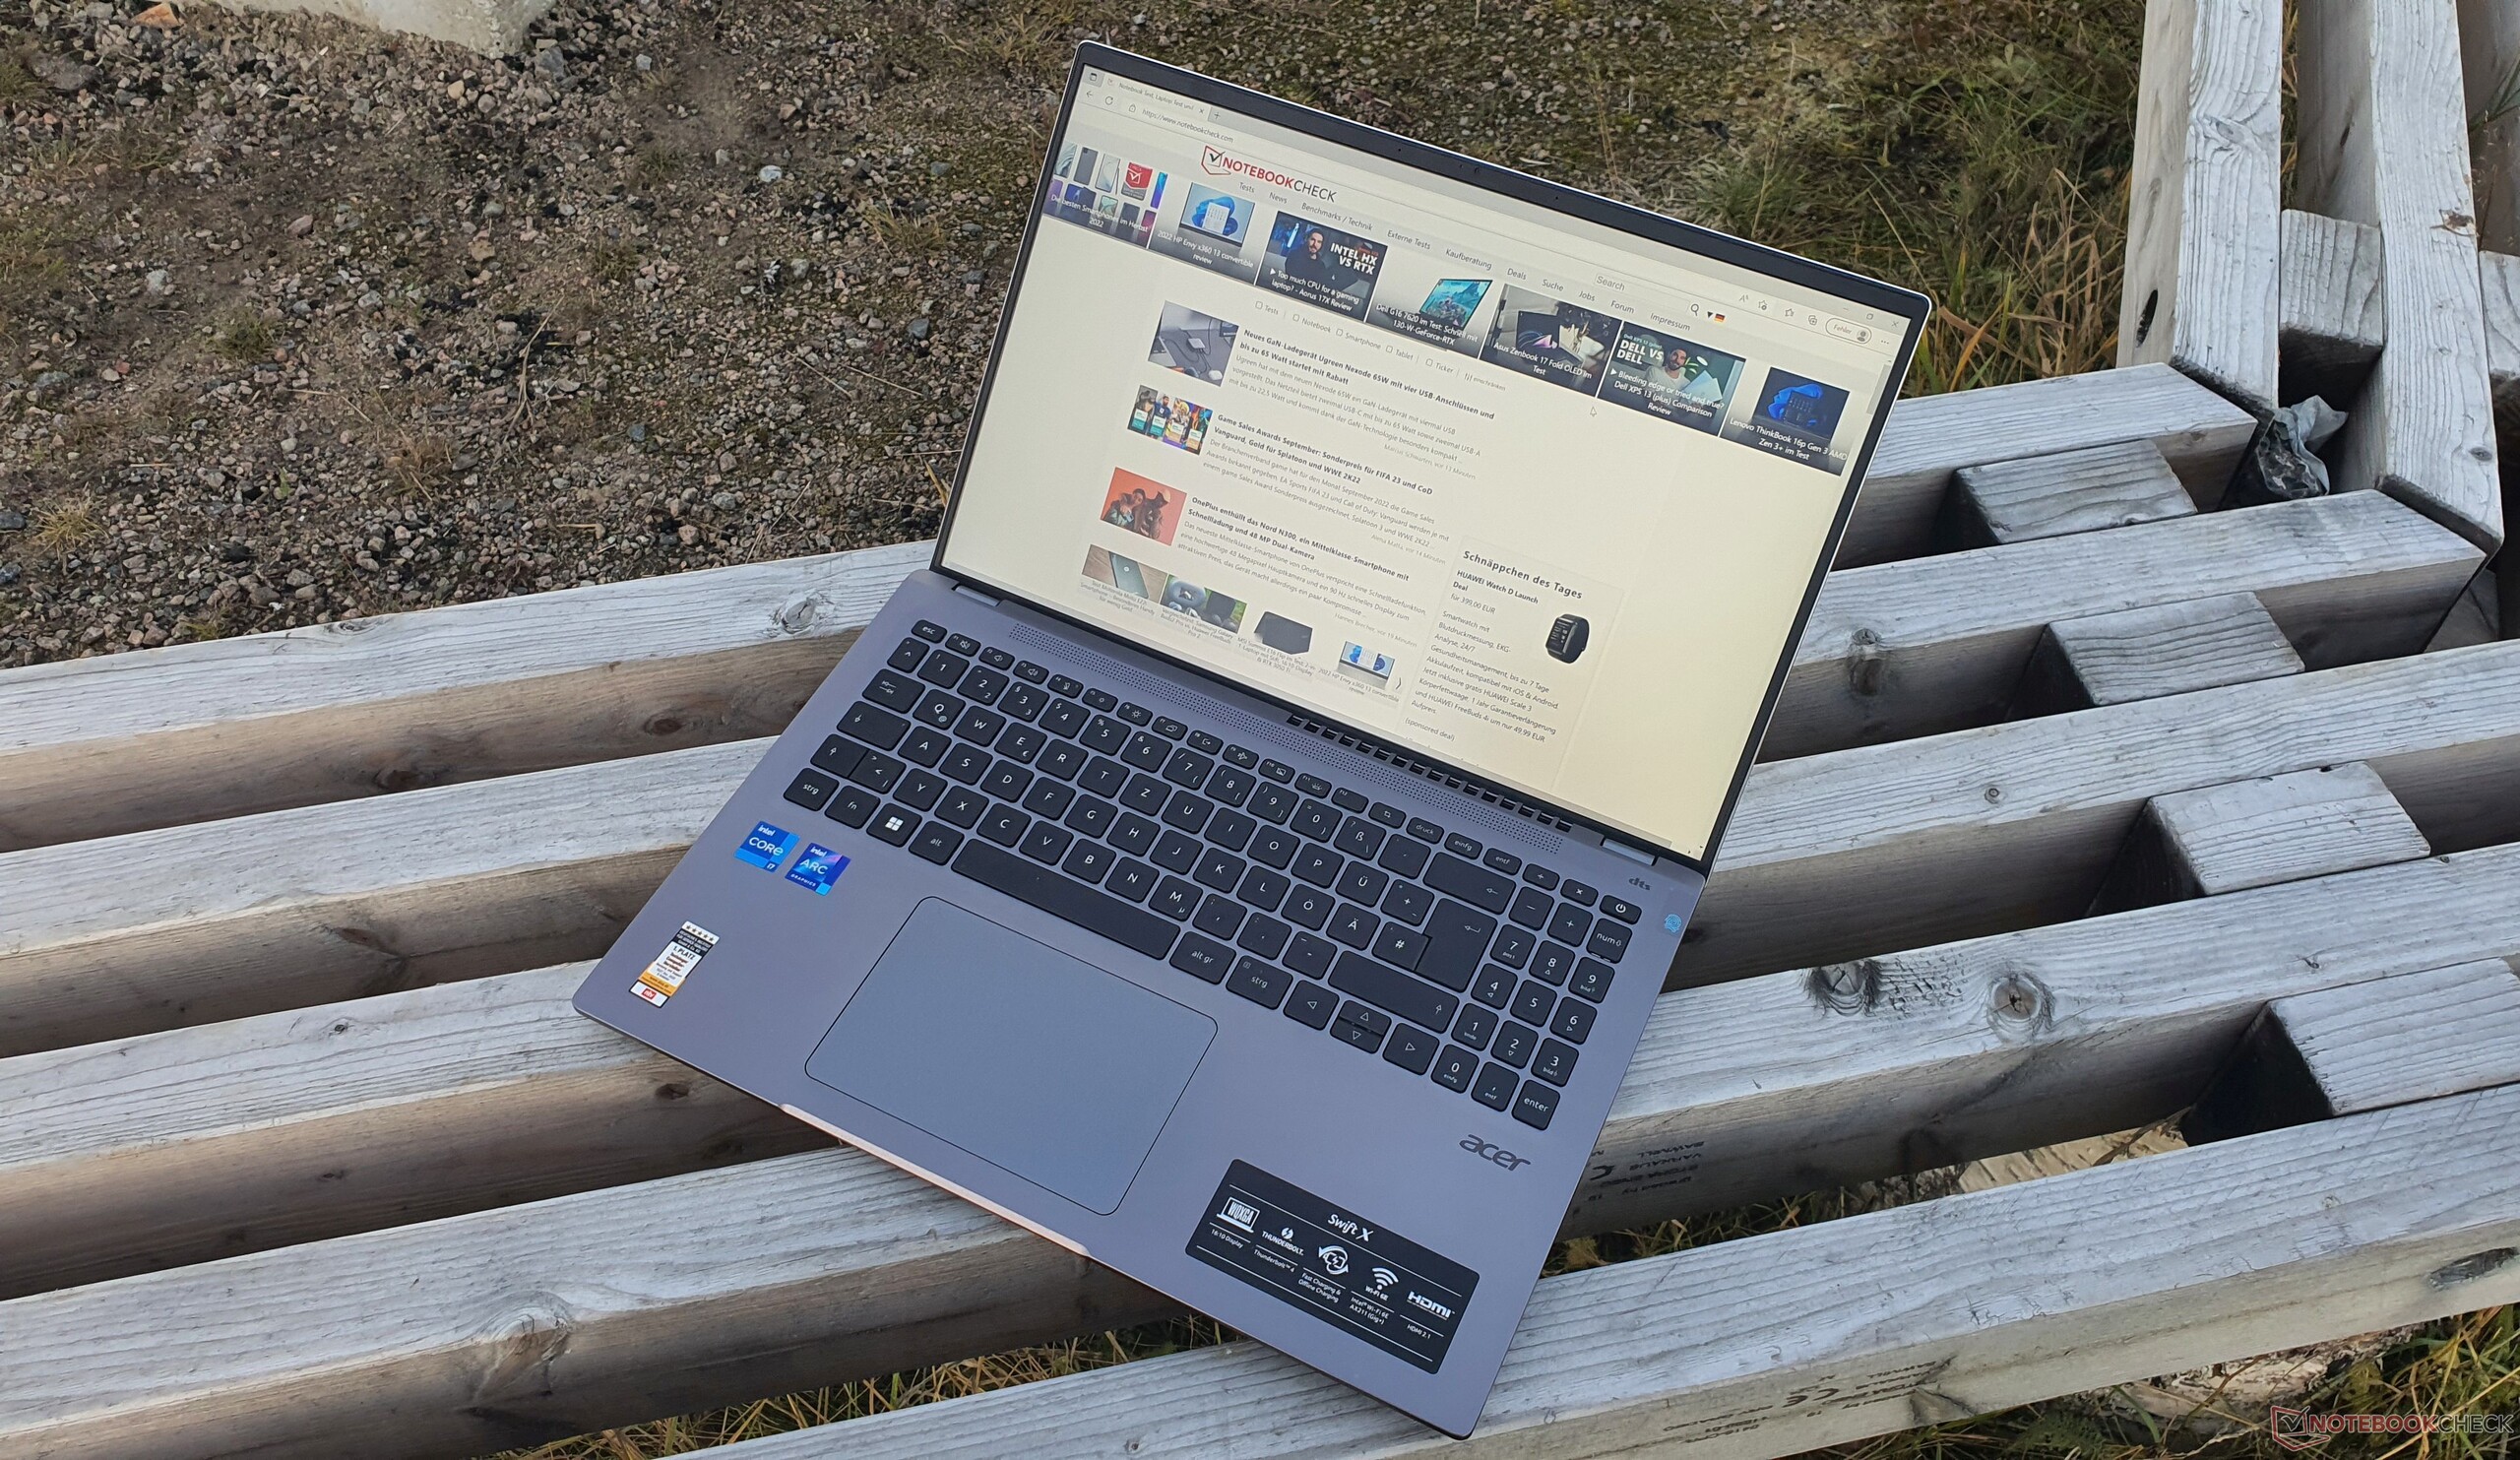
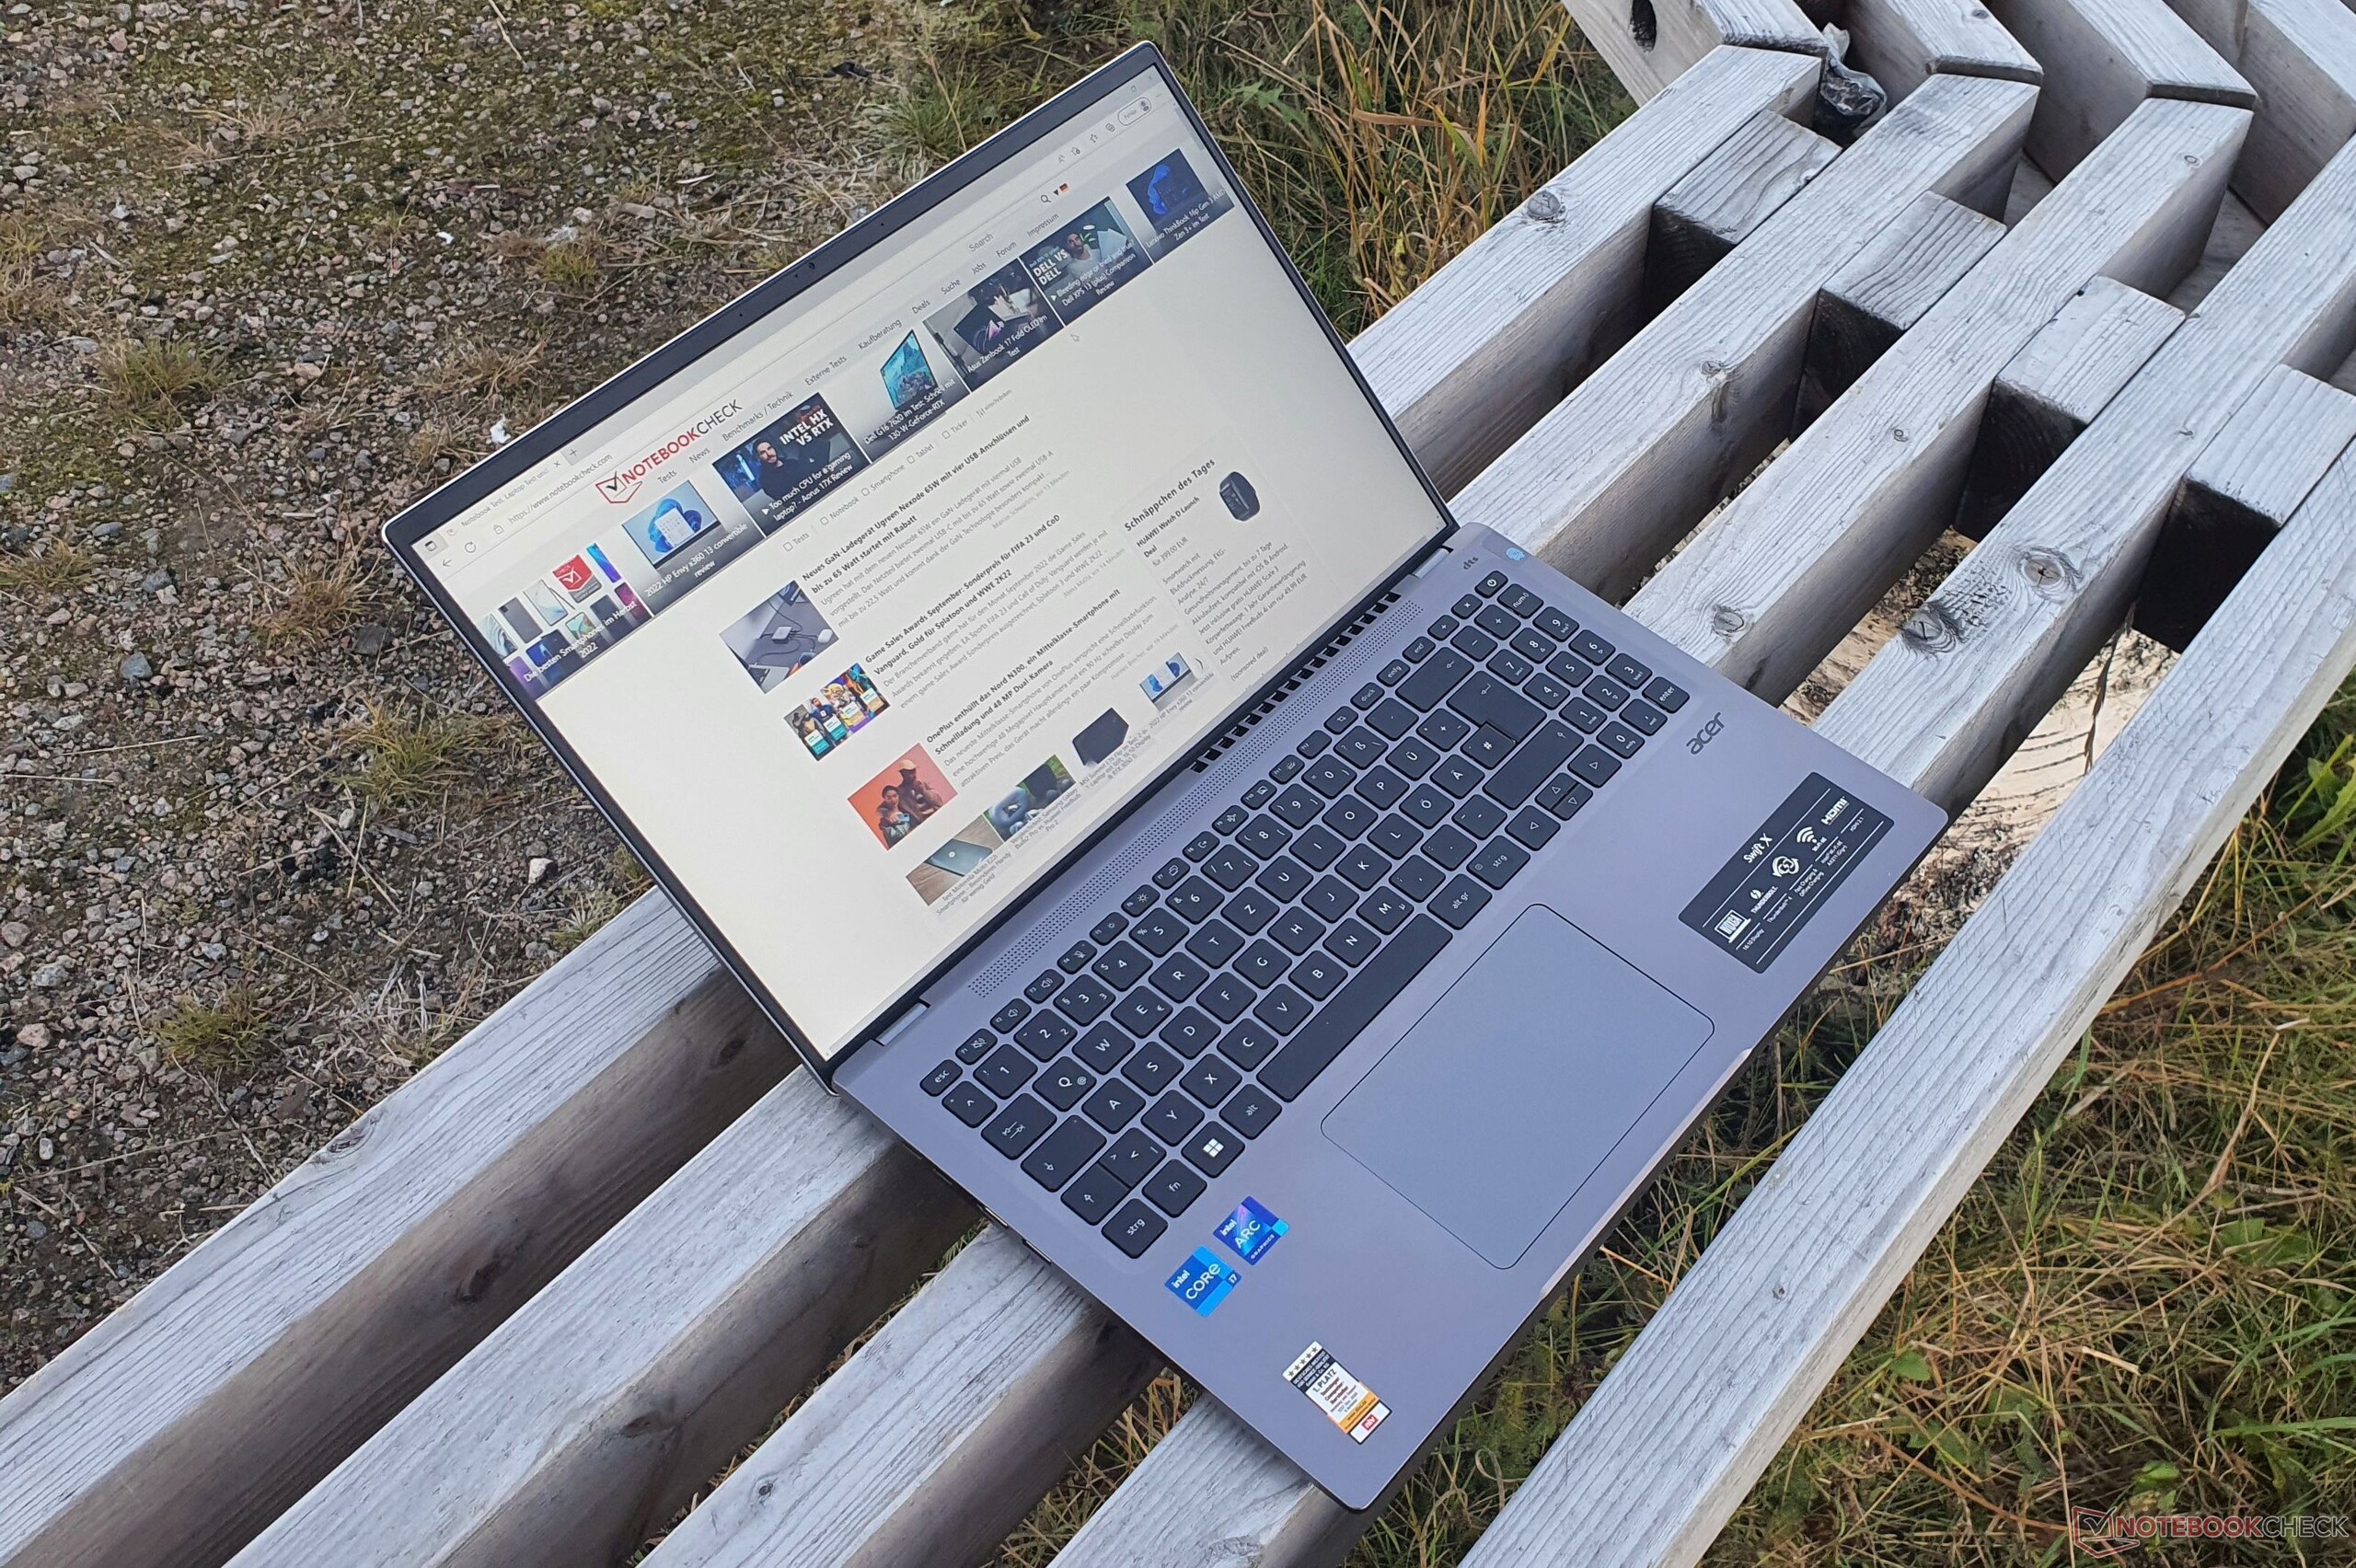
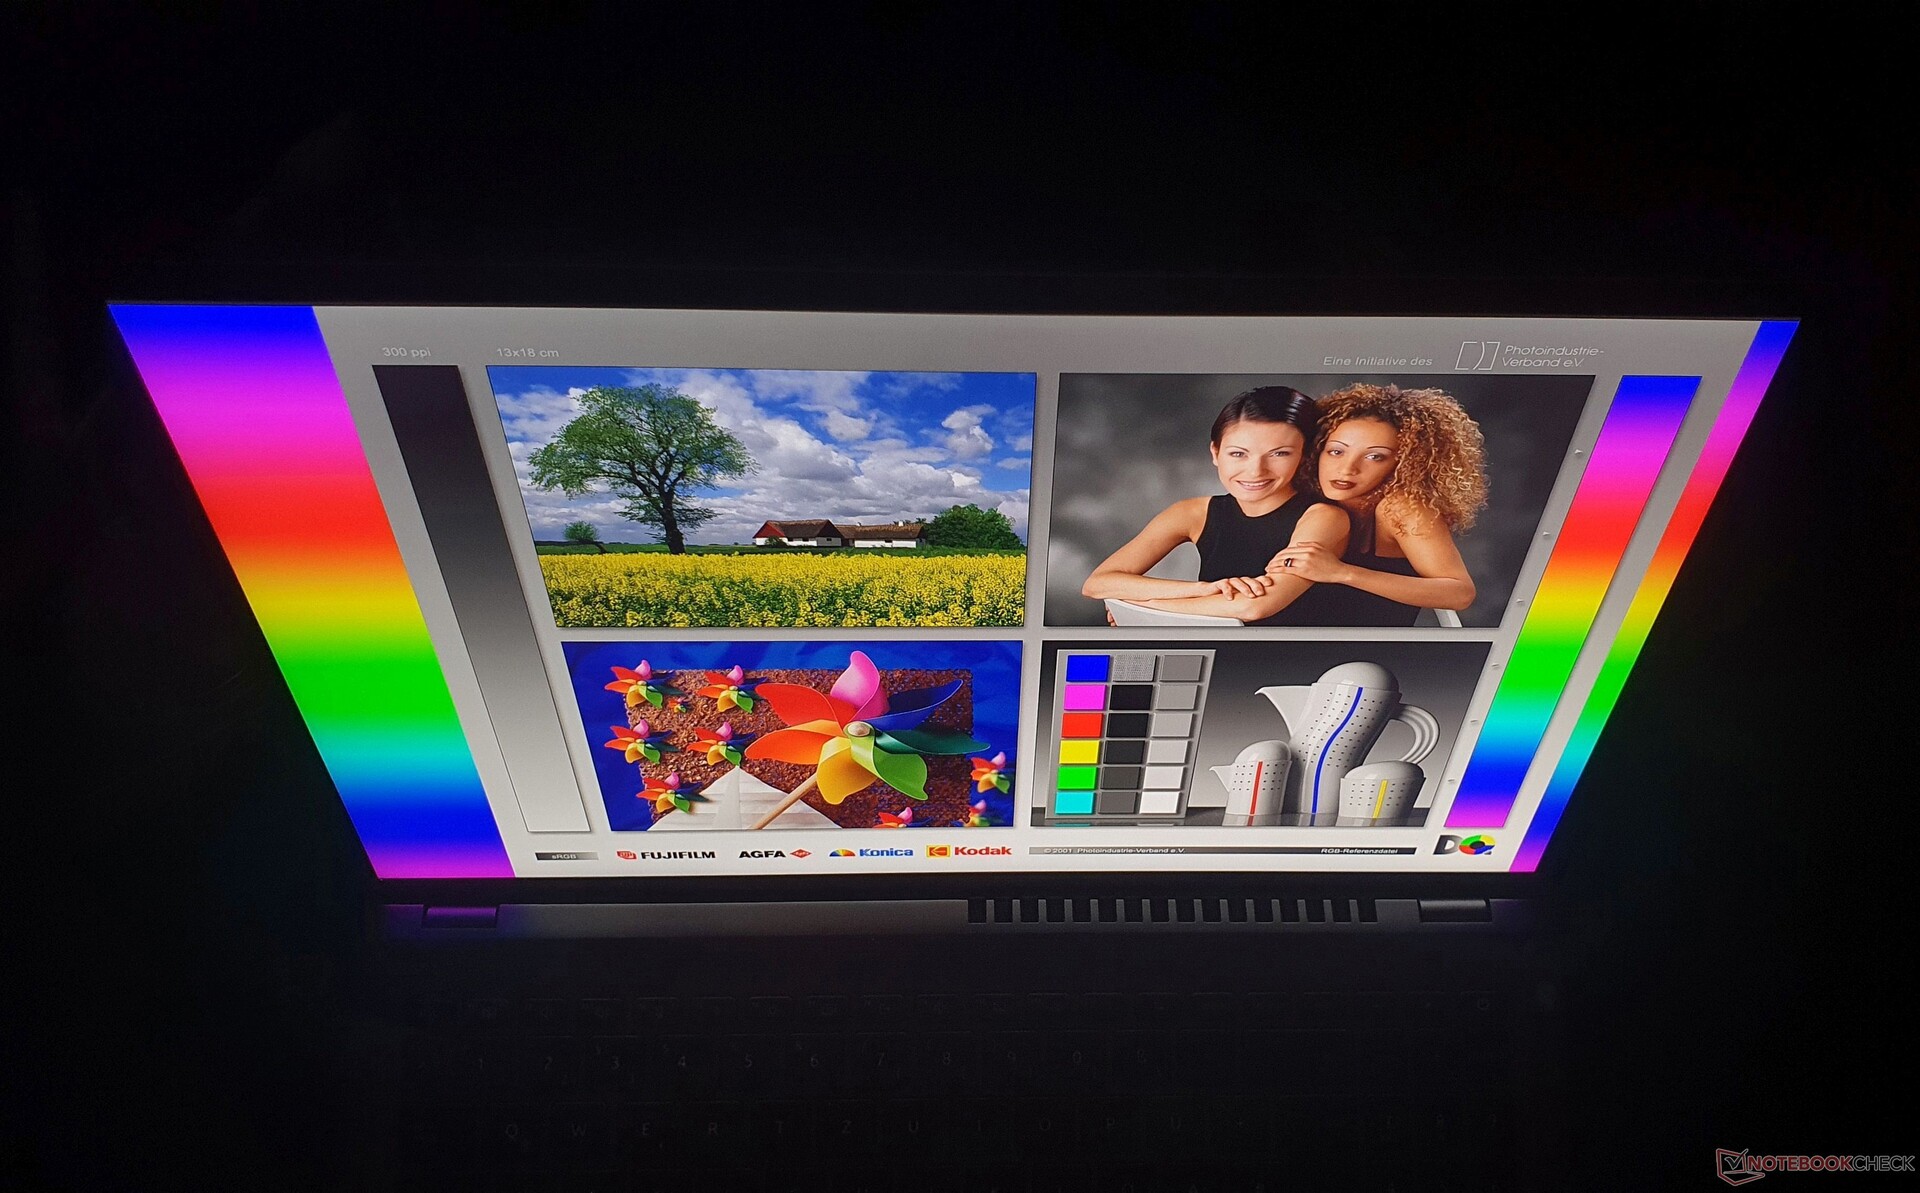
Display: A bright 2.5K panel and finally 16:10 in the Swift X 16

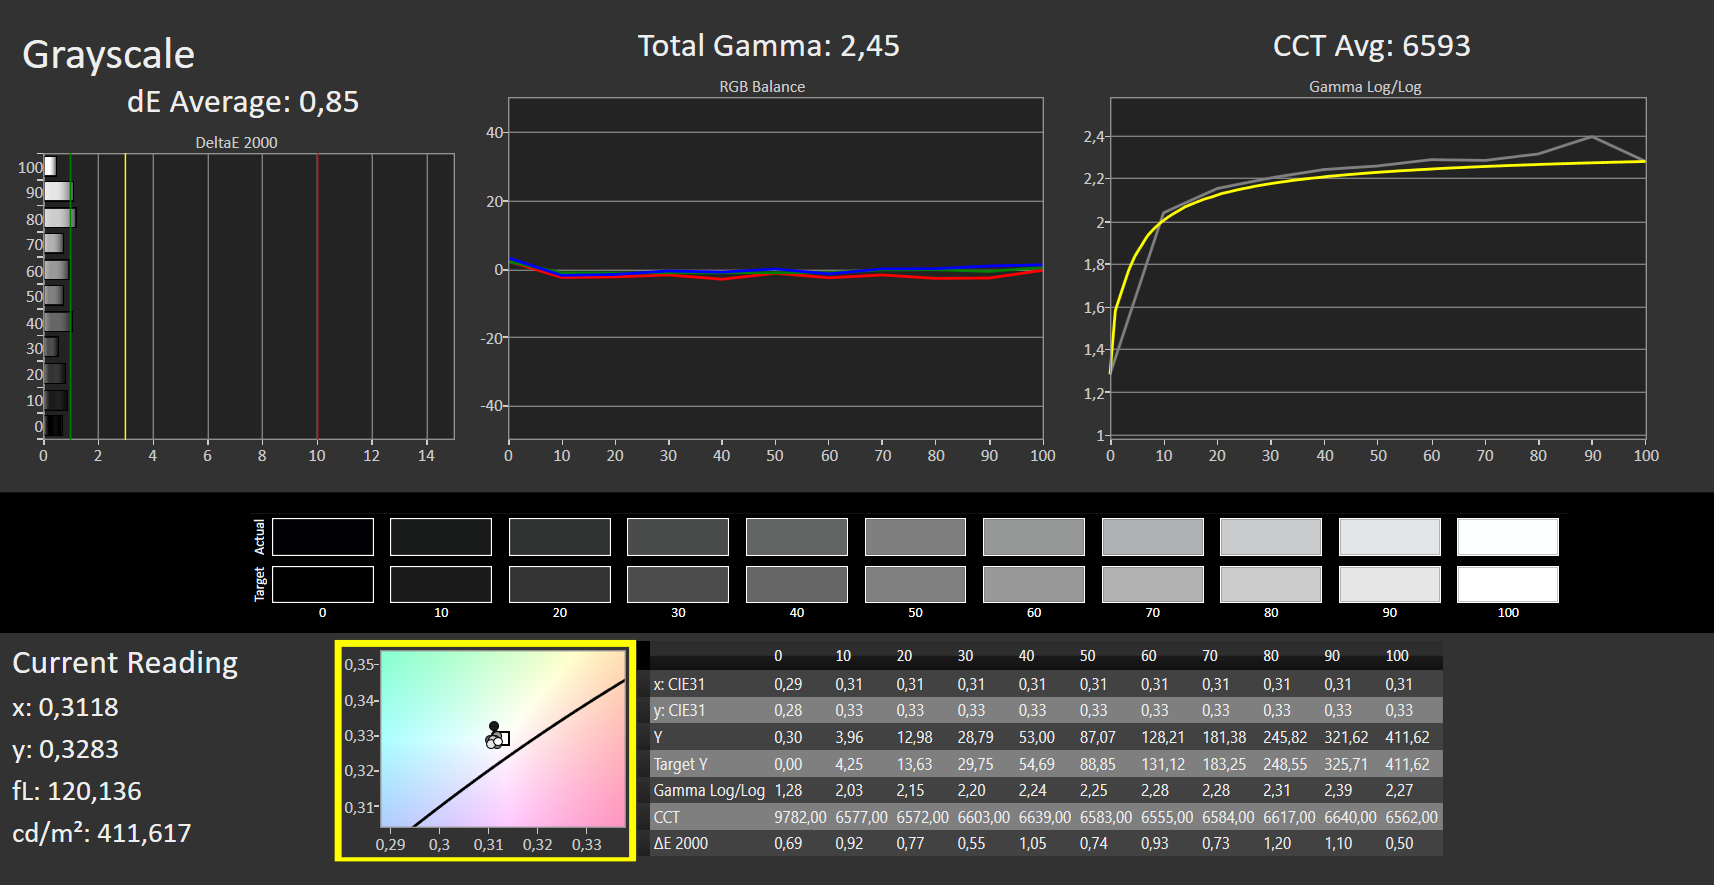
The matte panel with the label "B160QAN02.M" is the same as in the sibling model. In contrast to the predecessor, the 16:10 format is used here, and the brightness is now a good 378 nits.
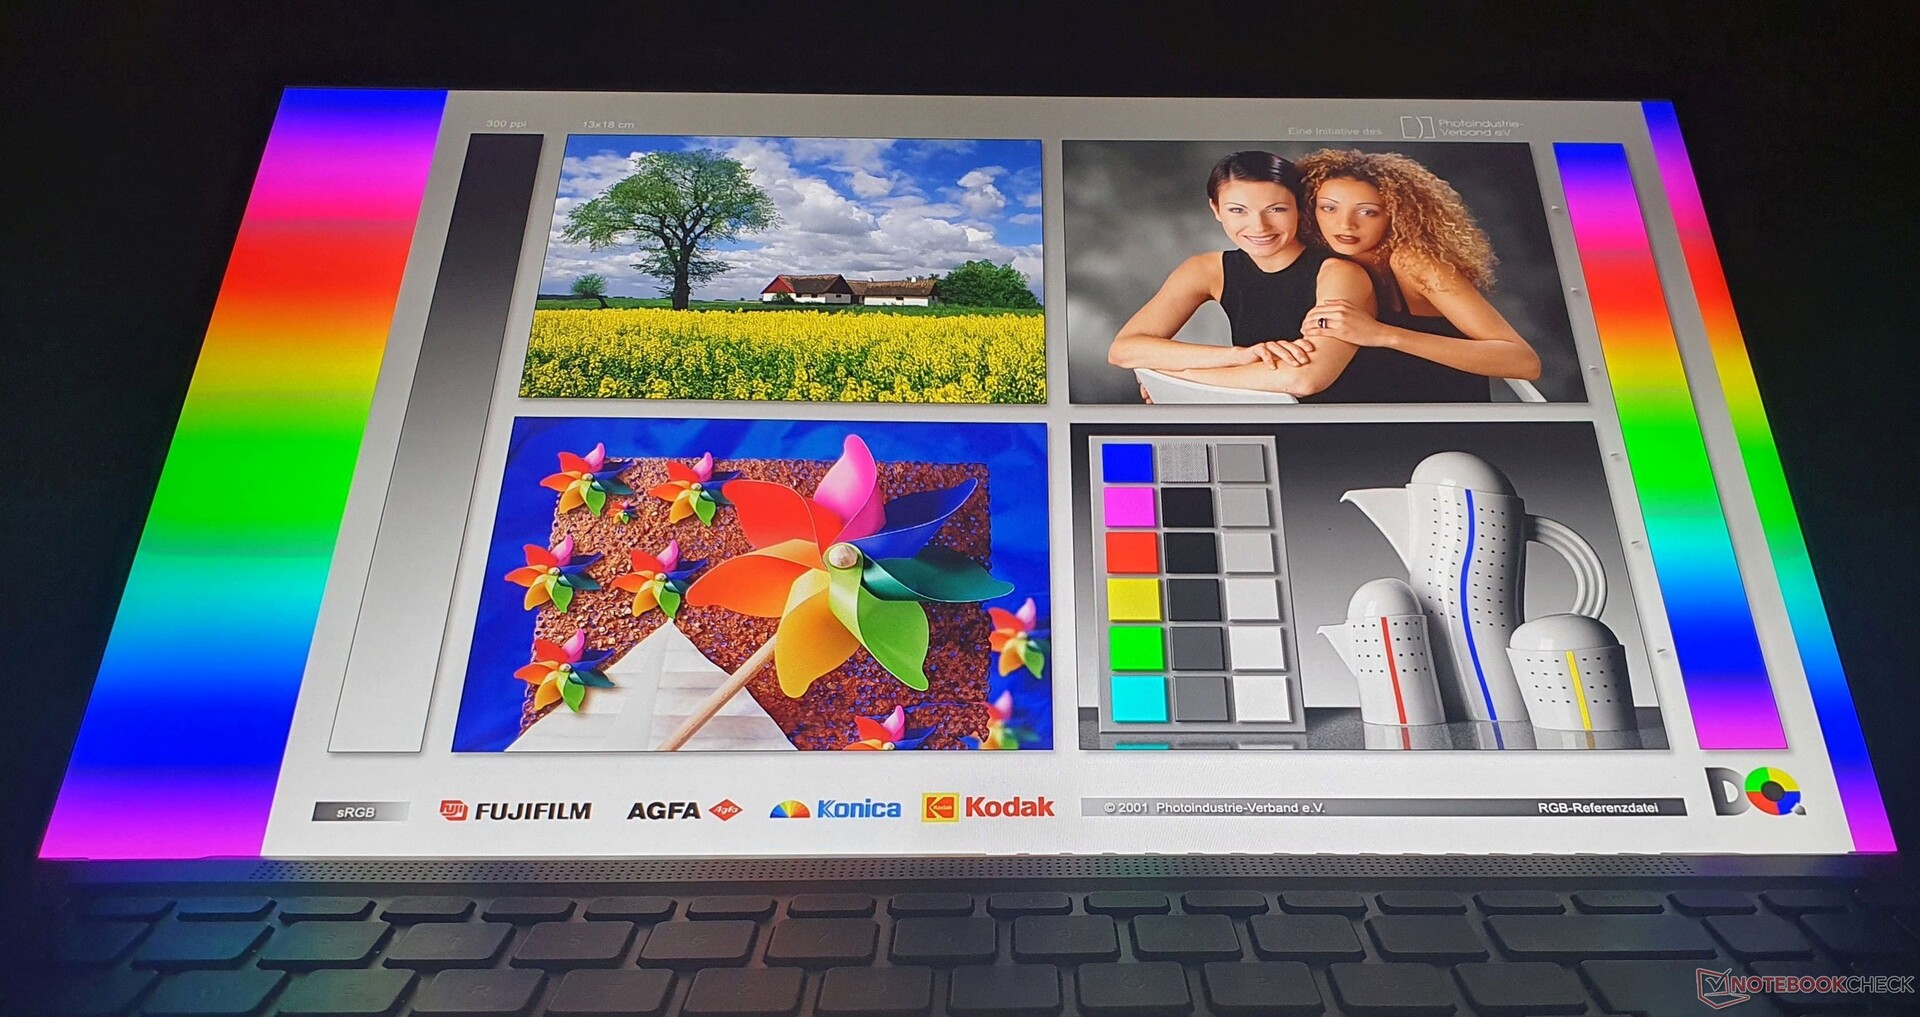
The resolution of 2,560 x 1,600 pixels in a 16-inch panel results in a sharp display. The Asus Vivobook Pro 16X and HP's Envy 16 offer a 3,840 x 2,400 pixel resolution and OLED panels.
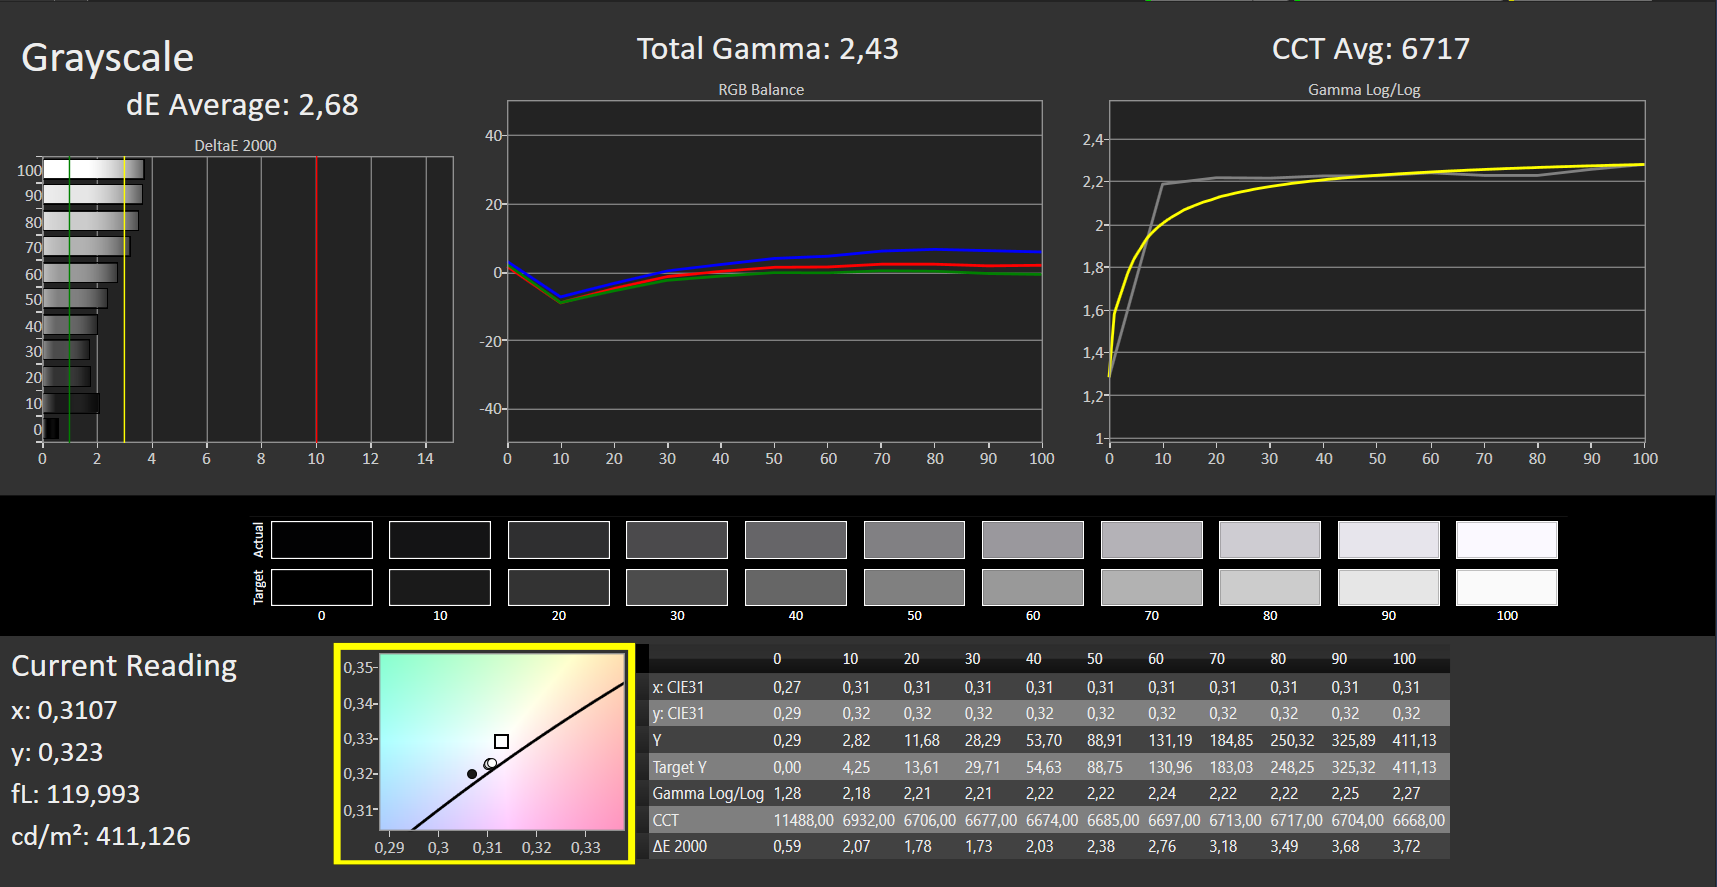
The contrast of 1,417:1 and black value of 0.29 nits lead to a saturated black. The white value of 6,717K is also close to the ideal of 6,500K.
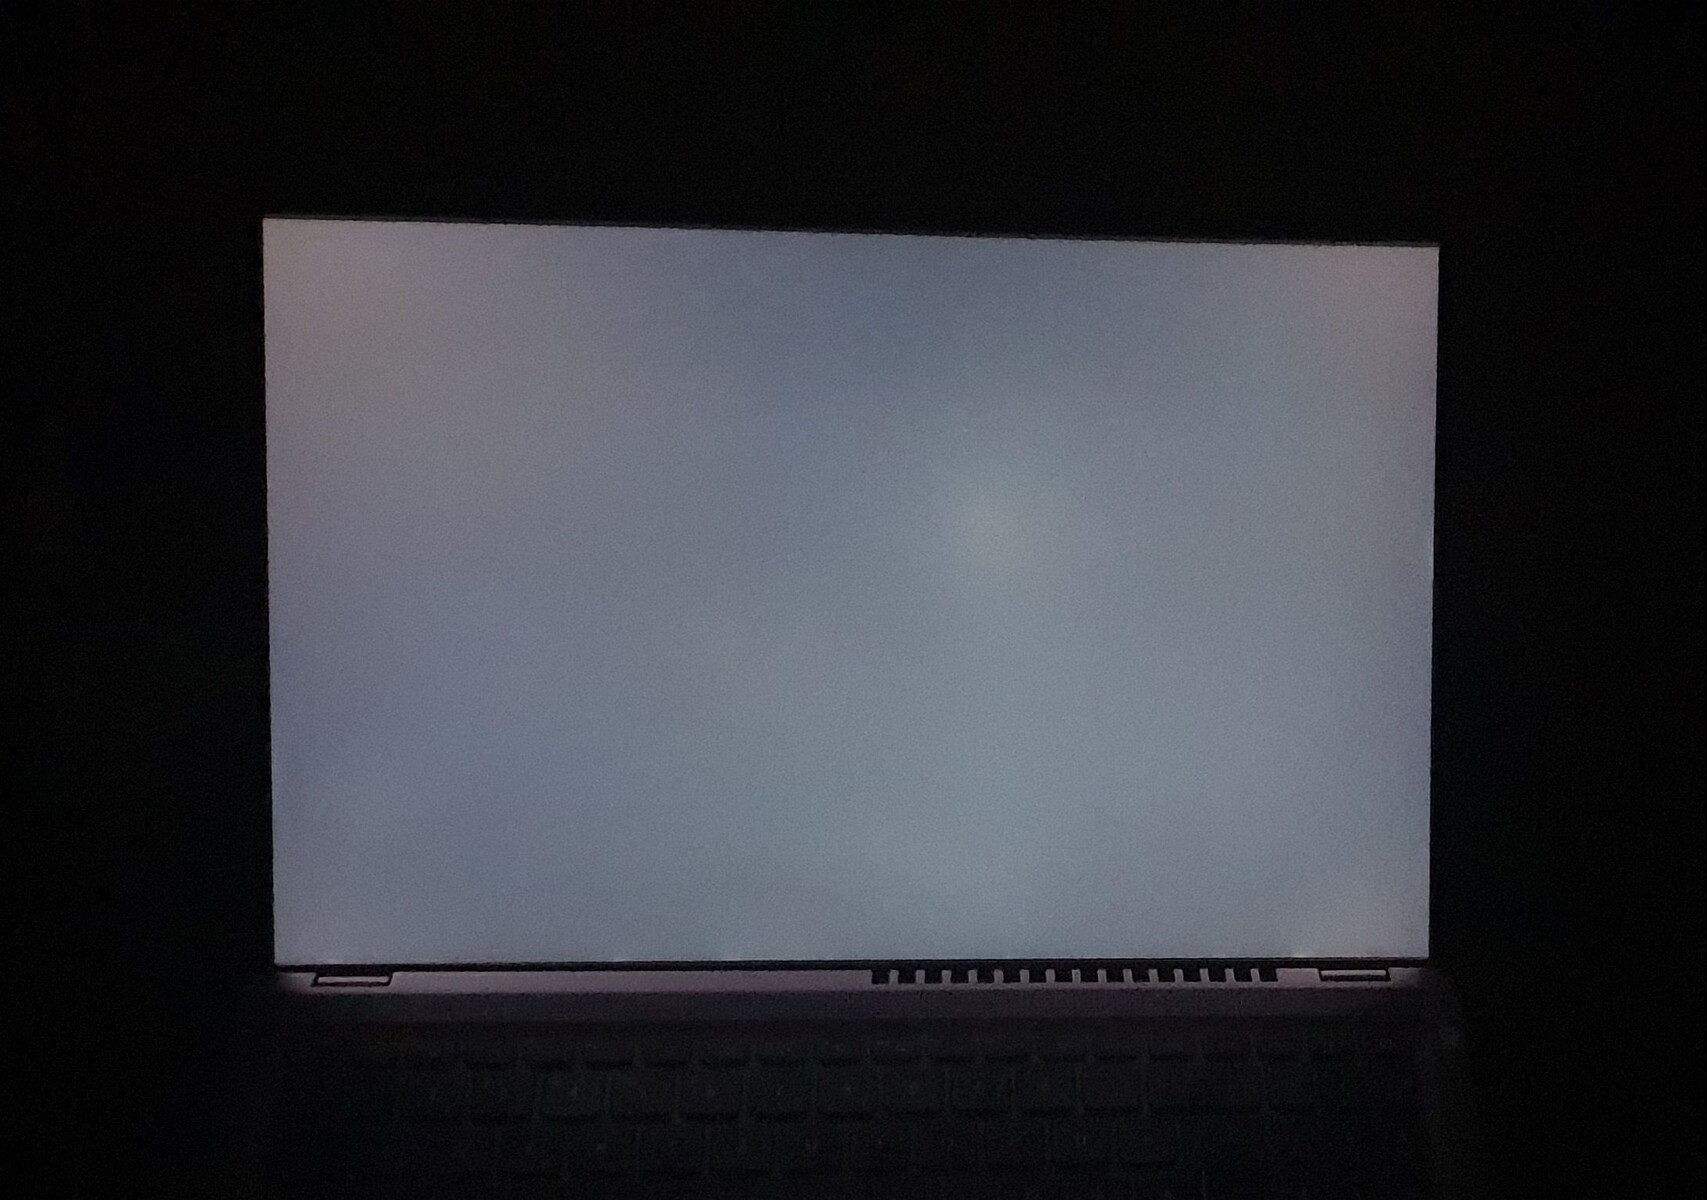
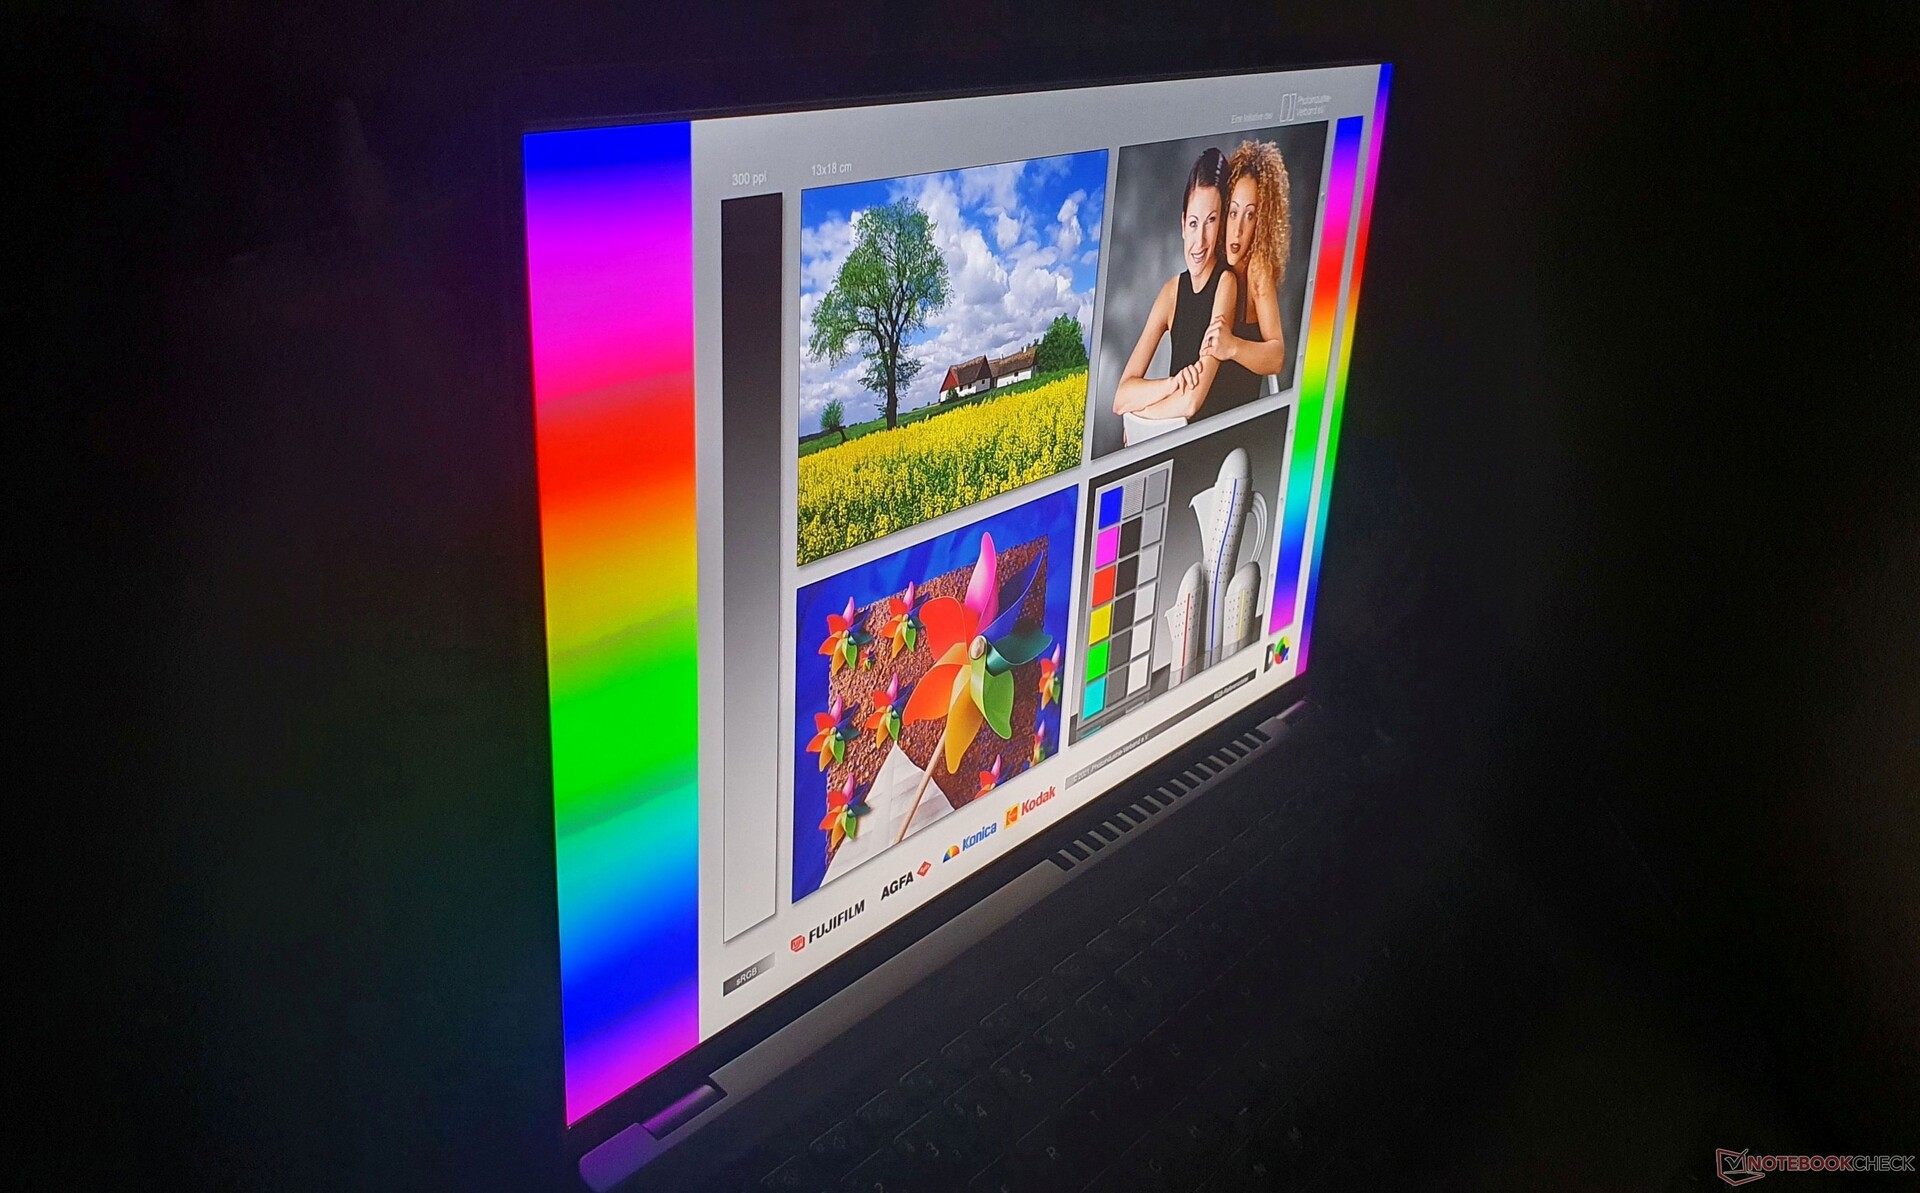
At 83%, the brightness distribution is not very even, but this doesn't become apparent in everyday operation. Alternatively, a panel with 1,920 x 1,200 pixels is also available. There is no PWM flickering.
| |||||||||||||||||||||||||
Brightness Distribution: 83 %
Center on Battery: 411 cd/m²
Contrast: 1417:1 (Black: 0.29 cd/m²)
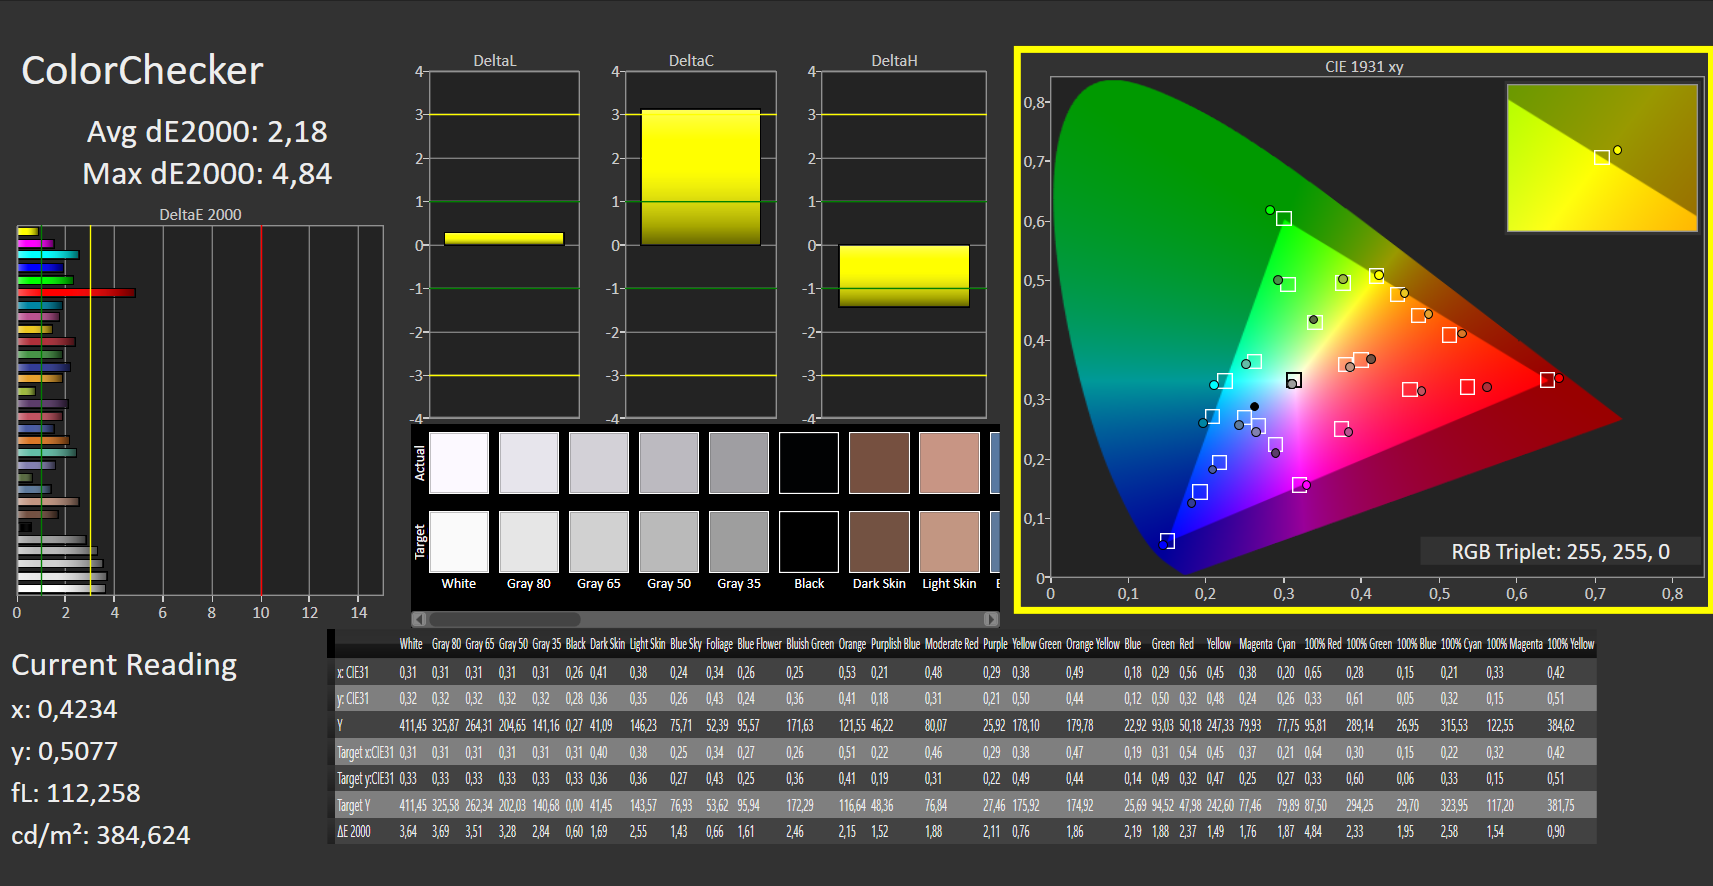
ΔE ColorChecker Calman: 2.18 | ∀{0.5-29.43 Ø4.71}
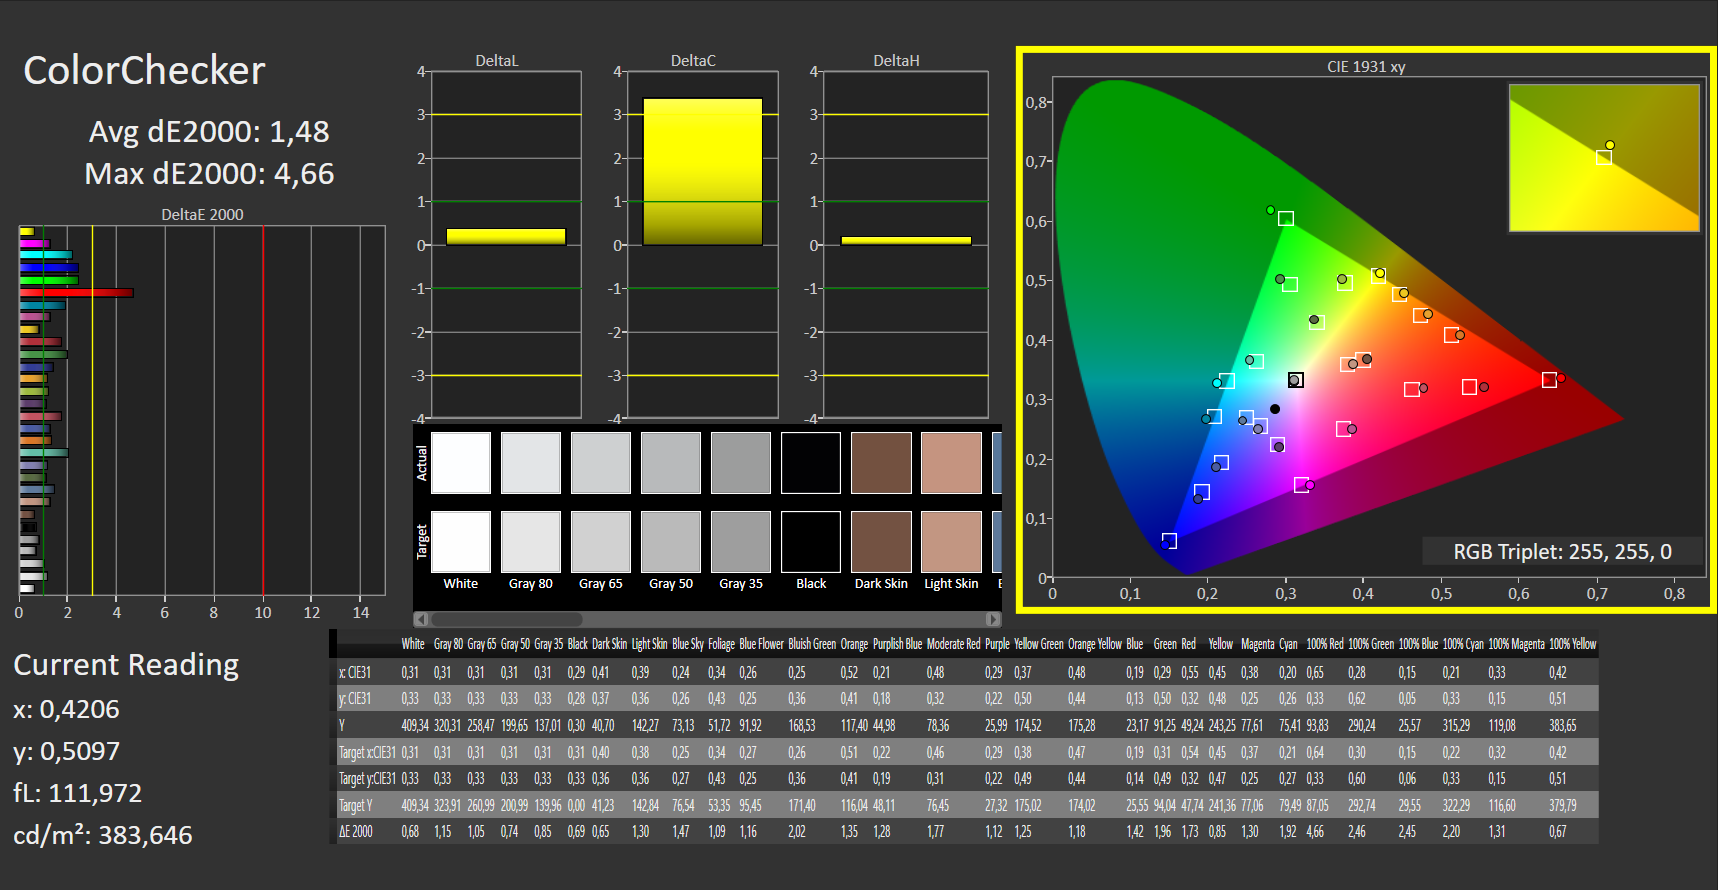
calibrated: 1.48
ΔE Greyscale Calman: 2.68 | ∀{0.09-98 Ø4.96}
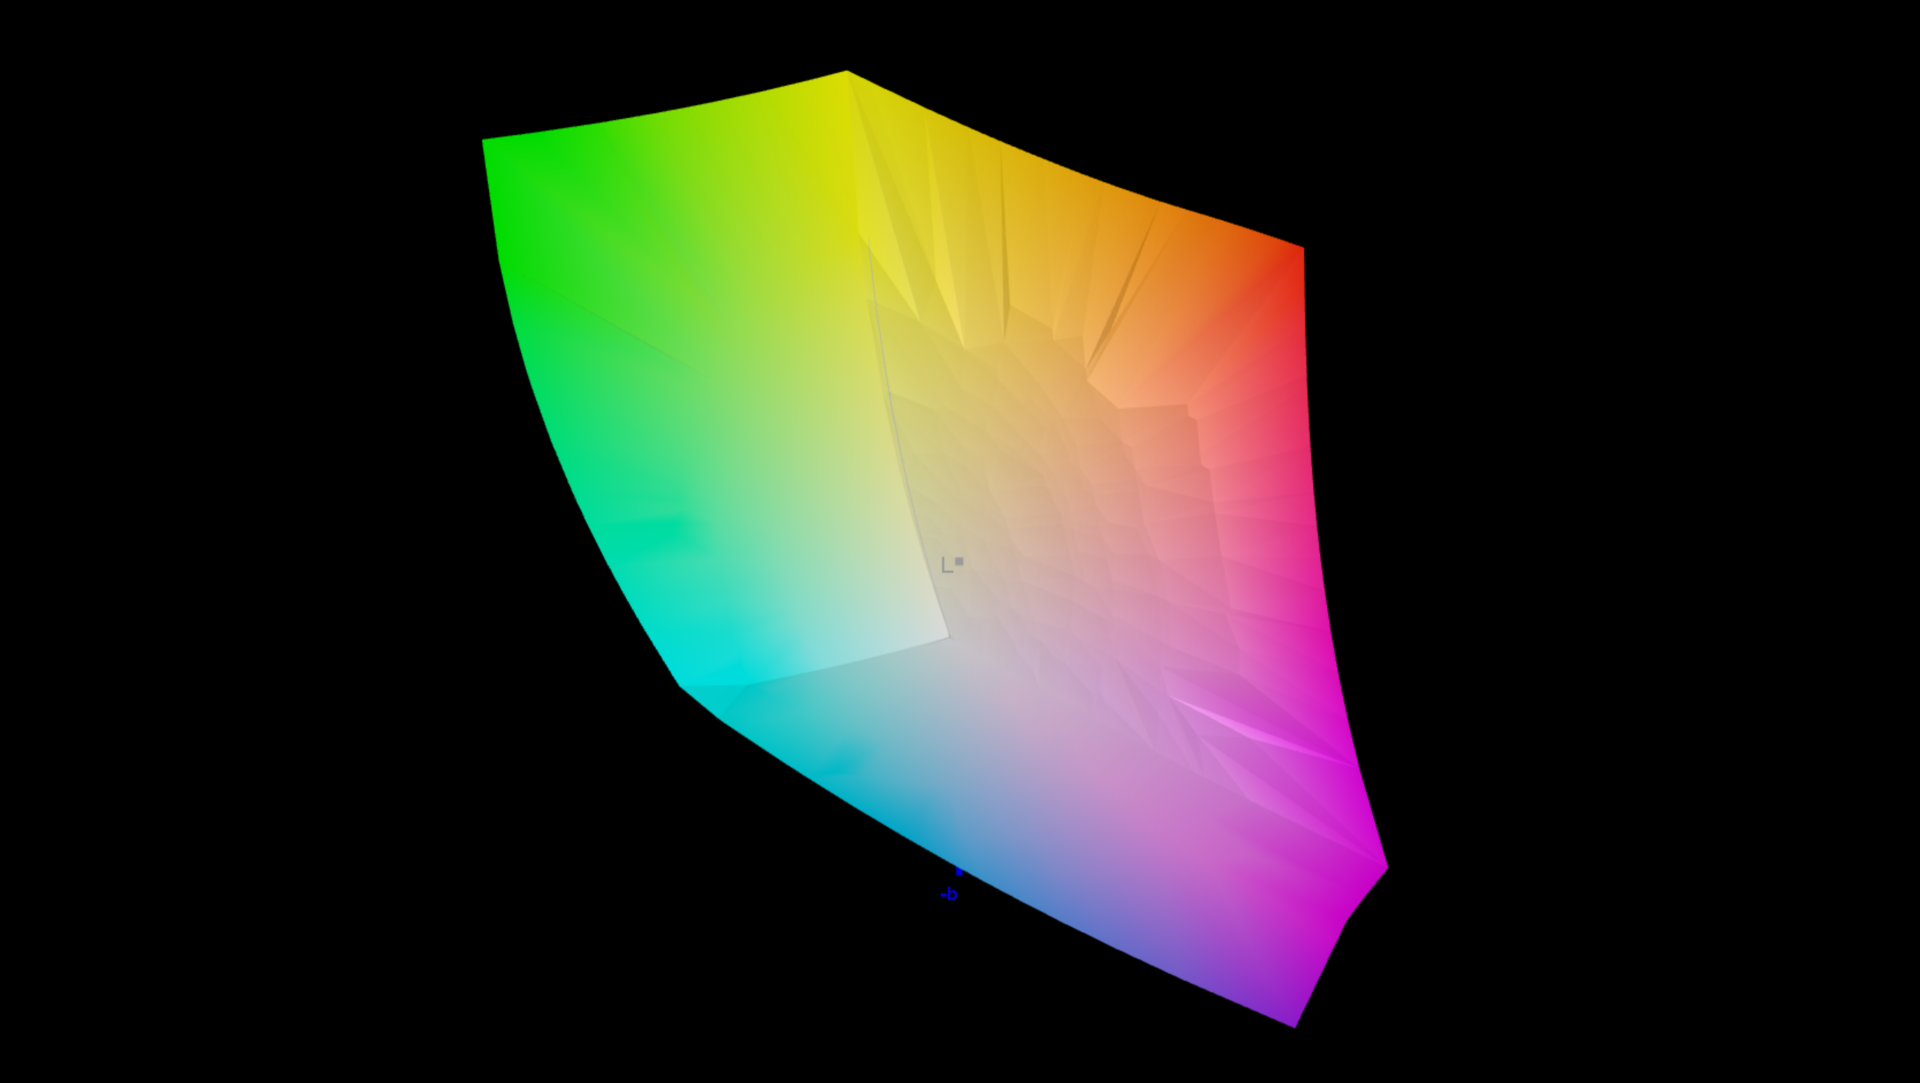
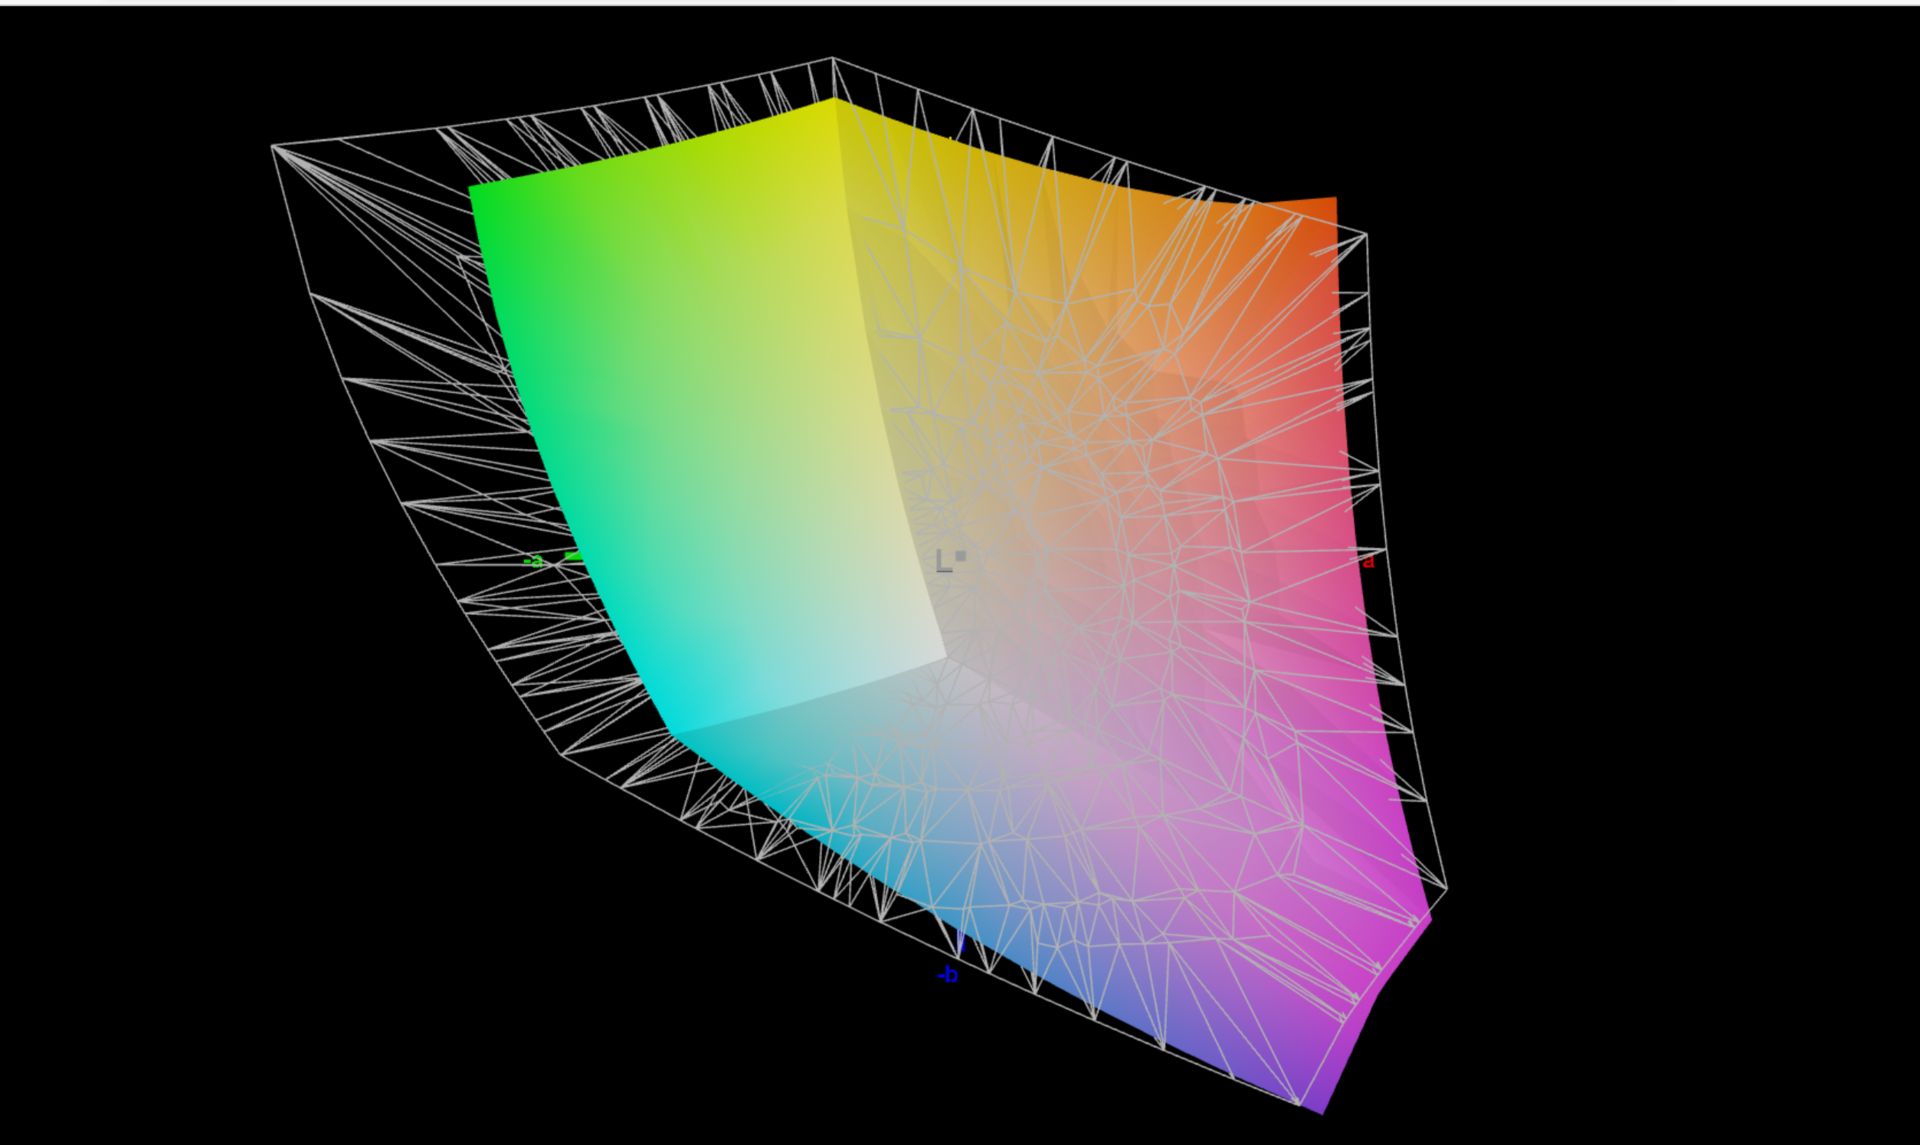
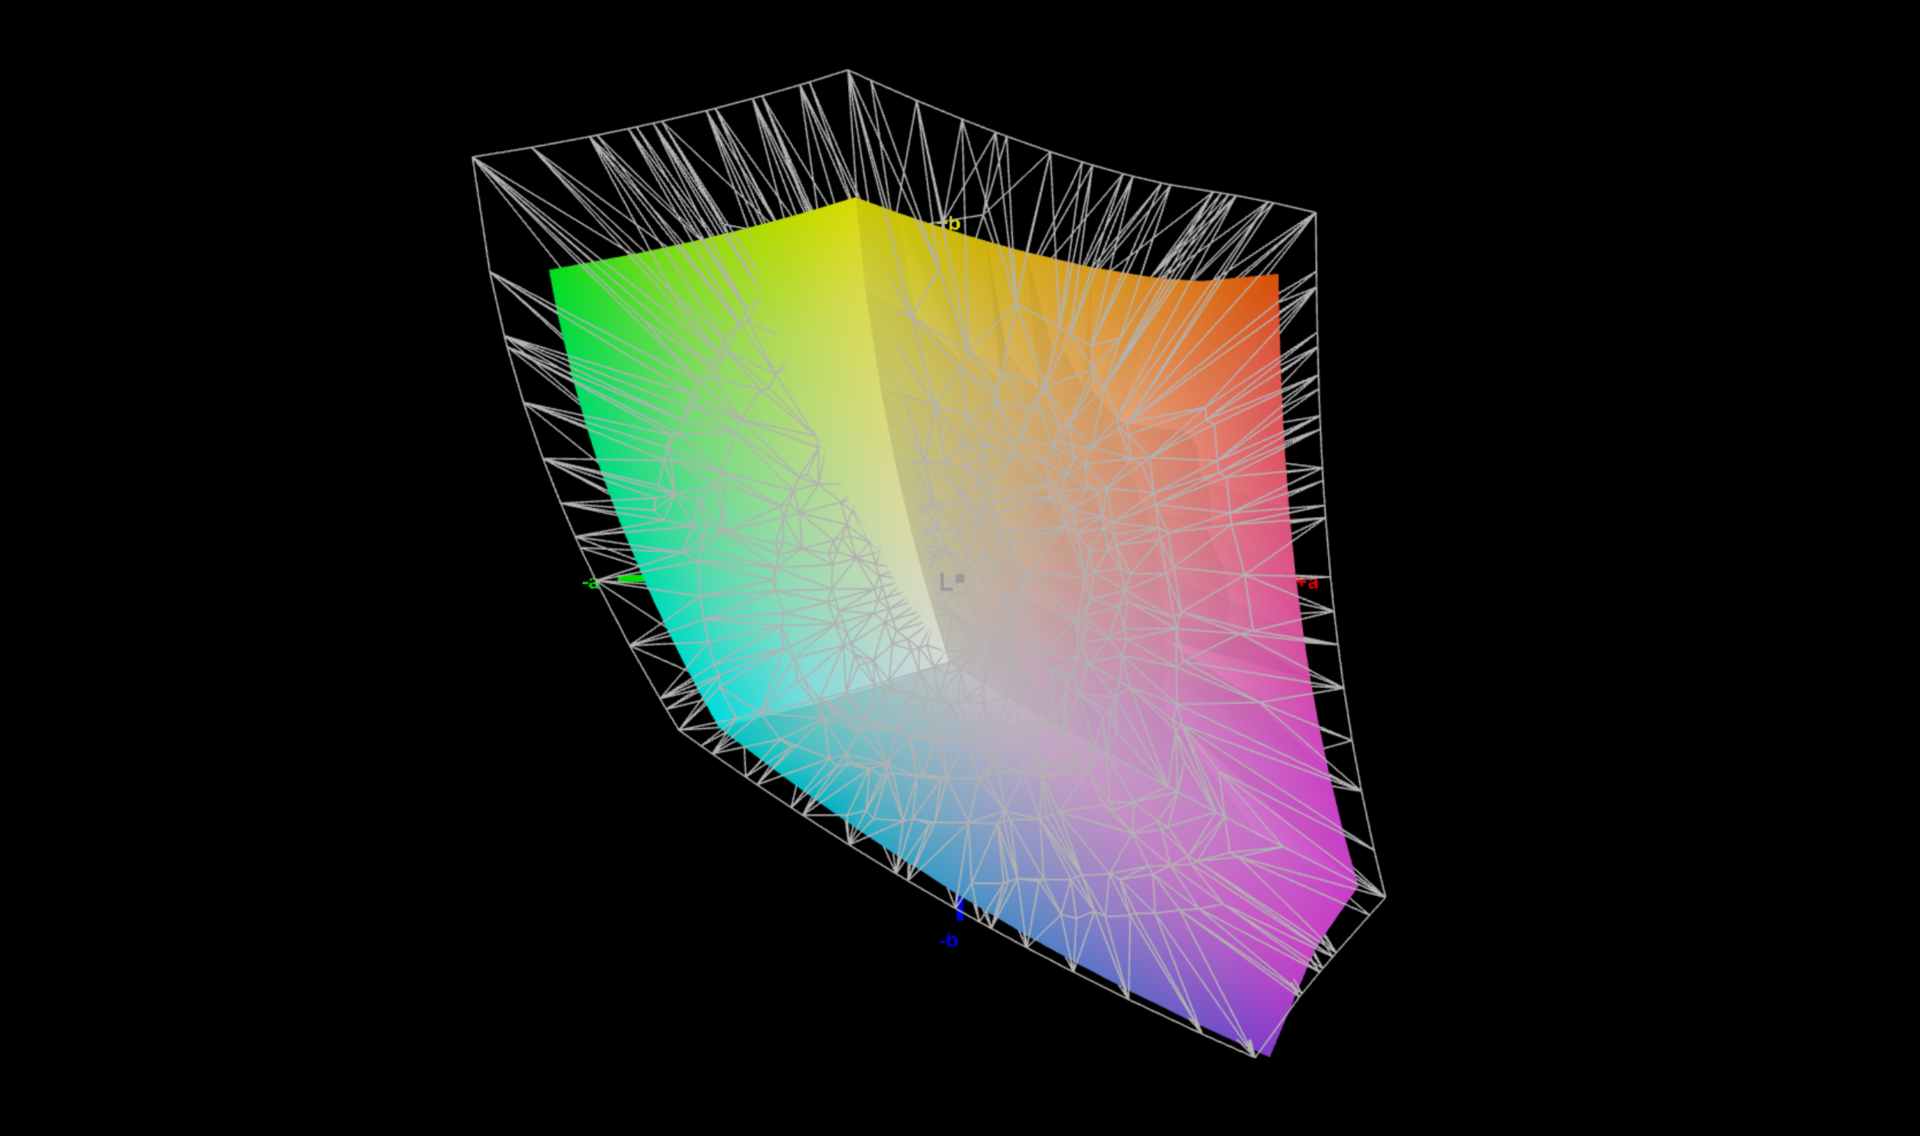
76.6% AdobeRGB 1998 (Argyll 3D)
100% sRGB (Argyll 3D)
76.4% Display P3 (Argyll 3D)
Gamma: 2.43
CCT: 6717 K
| Acer Swift X SFX16-52G-77RX B160QAN02.M, IPS-LED, 2560x1600, 16" | Acer Swift X SFX16-52G-52VE AU Optronics AUOBD9E, , 2560x1600, 16" | Acer Swift X SFX16-51G-5388 Chi Mei N161HCA-EA3, , 1920x1080, 16.1" | Lenovo ThinkBook 16 G4+ IAP LEN160WQXGA, IPS, 2560x1600, 16" | Dell Inspiron 16 Plus 7620 BOE NE16N41, IPS, 3072x1920, 16" | HP Envy 16 h0112nr Samsung SDC4174, OLED, 3840x2400, 16" | Lenovo IdeaPad 5 Pro 16ARH7 AUO B160QAN02.H, IPS, 2560x1600, 16" | Asus Vivobook Pro 16X-M7600QE Samsung ATNA60YV02-0, OLED, 3840x2400, 16.1" | |
|---|---|---|---|---|---|---|---|---|
| Display | -0% | -11% | -6% | -4% | 15% | -10% | 19% | |
| Display P3 Coverage (%) | 76.4 | 75.75 -1% | 65.1 -15% | 69.6 -9% | 70.8 -7% | 99.3 30% | 65 -15% | 99.8 31% |
| sRGB Coverage (%) | 100 | 100 0% | 95.65 -4% | 97.5 -2% | 99.5 0% | 100 0% | 98 -2% | 100 0% |
| AdobeRGB 1998 Coverage (%) | 76.6 | 76.51 0% | 66.75 -13% | 71.7 -6% | 73.2 -4% | 88 15% | 67.2 -12% | 96.9 27% |
| Response Times | -10% | -12% | -6% | -51% | 91% | 55% | 91% | |
| Response Time Grey 50% / Grey 80% * (ms) | 33 ? | 37 ? -12% | 30 ? 9% | 32.7 ? 1% | 38 ? -15% | 2 ? 94% | 14.1 ? 57% | 2 ? 94% |
| Response Time Black / White * (ms) | 15 ? | 16 ? -7% | 20 ? -33% | 16.8 ? -12% | 28 ? -87% | 1.9 ? 87% | 7.1 ? 53% | 2 ? 87% |
| PWM Frequency (Hz) | 240.4 ? | 60 ? | ||||||
| Screen | 14% | 11% | -1% | 10% | 7% | 2% | 12% | |
| Brightness middle (cd/m²) | 411 | 411 0% | 276 -33% | 371 -10% | 288.9 -30% | 328.8 -20% | 415 1% | 392 -5% |
| Brightness (cd/m²) | 378 | 364 -4% | 264 -30% | 357 -6% | 276 -27% | 332 -12% | 409 8% | 396 5% |
| Brightness Distribution (%) | 83 | 81 -2% | 85 2% | 91 10% | 92 11% | 97 17% | 91 10% | 98 18% |
| Black Level * (cd/m²) | 0.29 | 0.295 -2% | 0.16 45% | 0.23 21% | 0.26 10% | 0.32 -10% | ||
| Contrast (:1) | 1417 | 1393 -2% | 1725 22% | 1613 14% | 1111 -22% | 1297 -8% | ||
| Colorchecker dE 2000 * | 2.18 | 1.73 21% | 1.8 17% | 2.6 -19% | 1.88 14% | 1.53 30% | 1.92 12% | 1.74 20% |
| Colorchecker dE 2000 max. * | 4.84 | 2.7 44% | 3.77 22% | 4.4 9% | 4.37 10% | 6.04 -25% | 5.71 -18% | 3.18 34% |
| Colorchecker dE 2000 calibrated * | 1.48 | 1.18 20% | 0.63 57% | 1.3 12% | 0.42 72% | 0.58 61% | 1.85 -25% | |
| Greyscale dE 2000 * | 2.68 | 1.26 53% | 2.76 -3% | 3.7 -38% | 1.4 48% | 1.3 51% | 3.7 -38% | 1.77 34% |
| Gamma | 2.43 91% | 2.35 94% | 2.37 93% | 2.32 95% | 2.3 96% | 2.18 101% | 2.272 97% | 2.22 99% |
| CCT | 6717 97% | 6616 98% | 6564 99% | 7271 89% | 6634 98% | 6362 102% | 7132 91% | 6483 100% |
| Total Average (Program / Settings) | 1% /
8% | -4% /
3% | -4% /
-3% | -15% /
-2% | 38% /
24% | 16% /
7% | 41% /
27% |
* ... smaller is better
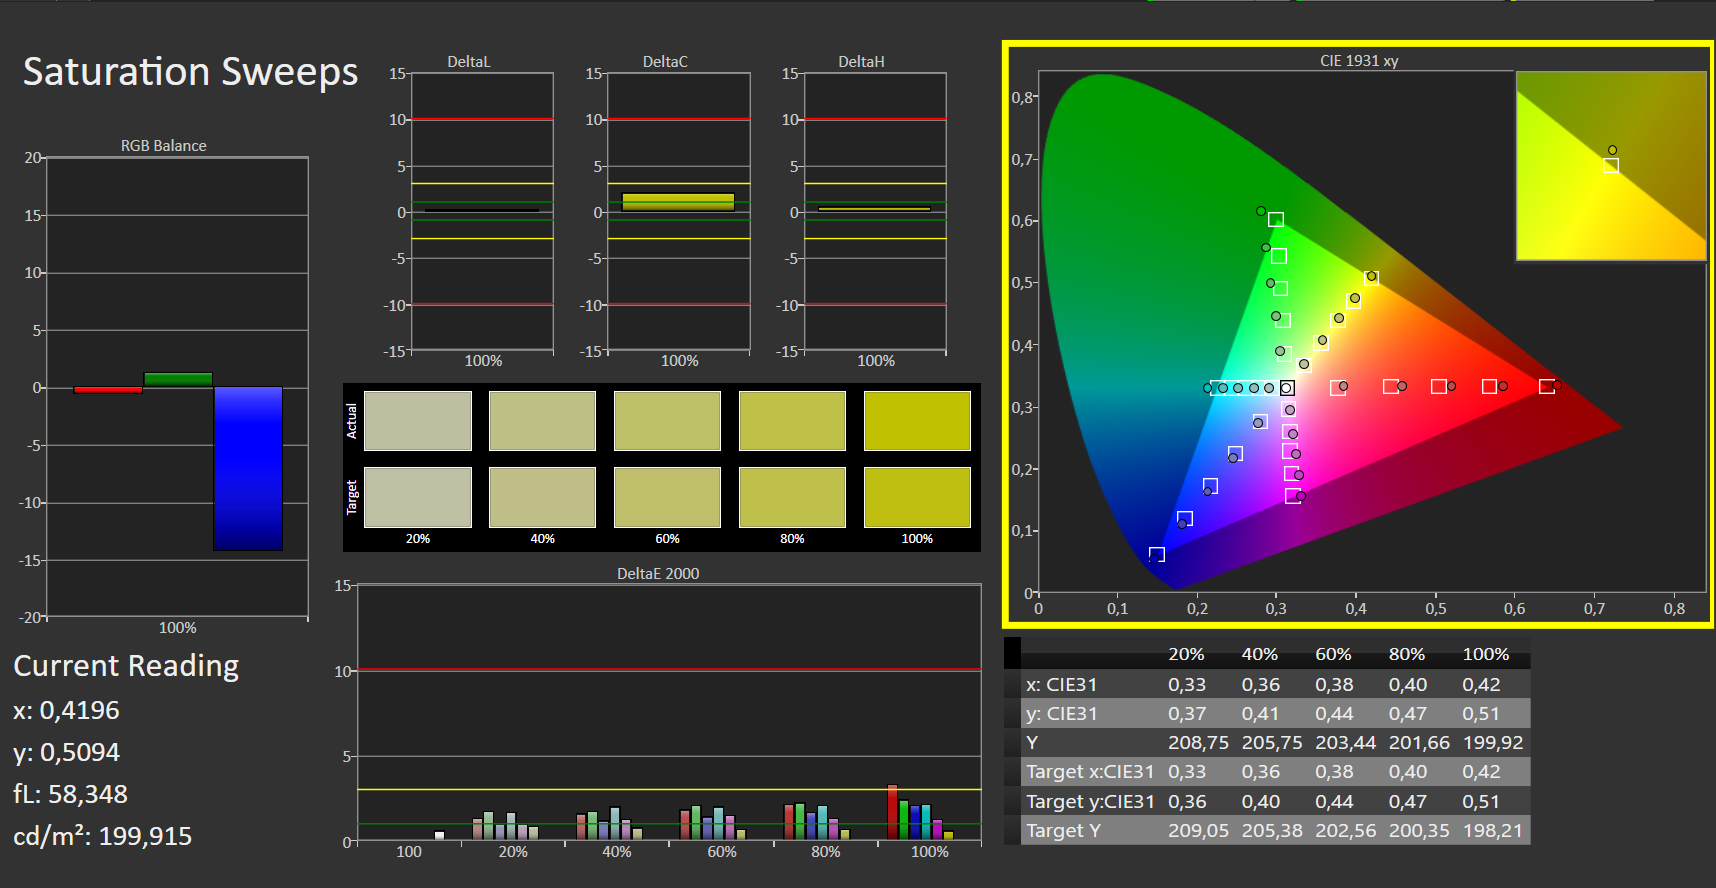
The sRGB color space is covered to 100%, which allows for some less ambitious image and video processing.
The DeltaE value of just above 2 can be reduced to an even more accurate 1.48 after our calibration. Only red color continues to show a significant deviation at a value just below 5. You can download our calibrated color profile in the box on the right next to the brightness distribution graphic.

Display Response Times
| ↔ Response Time Black to White | ||
|---|---|---|
| 15 ms ... rise ↗ and fall ↘ combined | ↗ 5 ms rise |  |
| ↘ 10 ms fall | ||
| The screen shows good response rates in our tests, but may be too slow for competitive gamers. In comparison, all tested devices range from 0.1 (minimum) to 240 (maximum) ms. » 36 % of all devices are better. This means that the measured response time is better than the average of all tested devices (19.8 ms). | ||
| ↔ Response Time 50% Grey to 80% Grey | ||
| 33 ms ... rise ↗ and fall ↘ combined | ↗ 15 ms rise |  |
| ↘ 18 ms fall | ||
| The screen shows slow response rates in our tests and will be unsatisfactory for gamers. In comparison, all tested devices range from 0.165 (minimum) to 636 (maximum) ms. » 45 % of all devices are better. This means that the measured response time is similar to the average of all tested devices (30.9 ms). | ||
Screen Flickering / PWM (Pulse-Width Modulation)
| Screen flickering / PWM not detected |    | ||
In comparison: 52 % of all tested devices do not use PWM to dim the display. If PWM was detected, an average of 7744 (minimum: 5 - maximum: 343500) Hz was measured. | |||
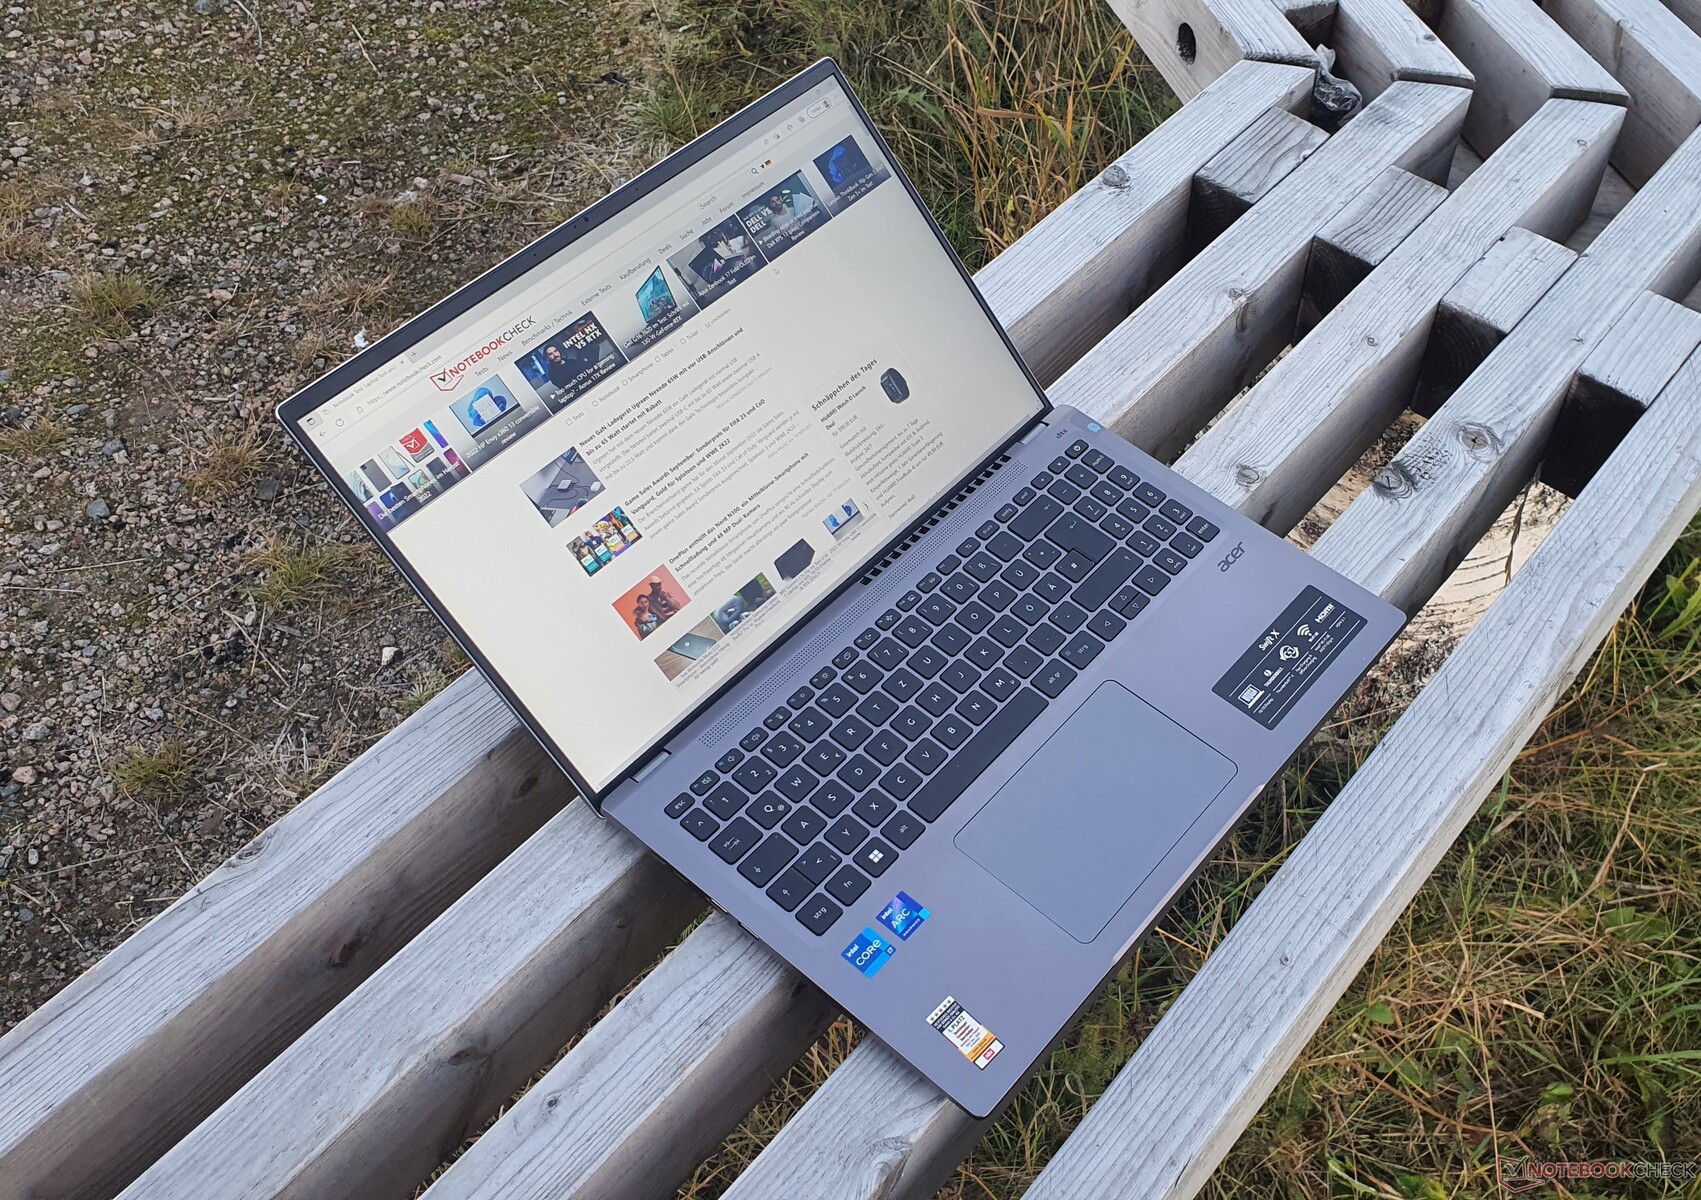
Thanks to the matte display surface, the display brightness of 378 nits is sufficient to allow using the Acer Swift X 16 also outdoors. However, you should still avoid direct sunlight.
Performance: Fast Turbo but weak Intel Arc A370M
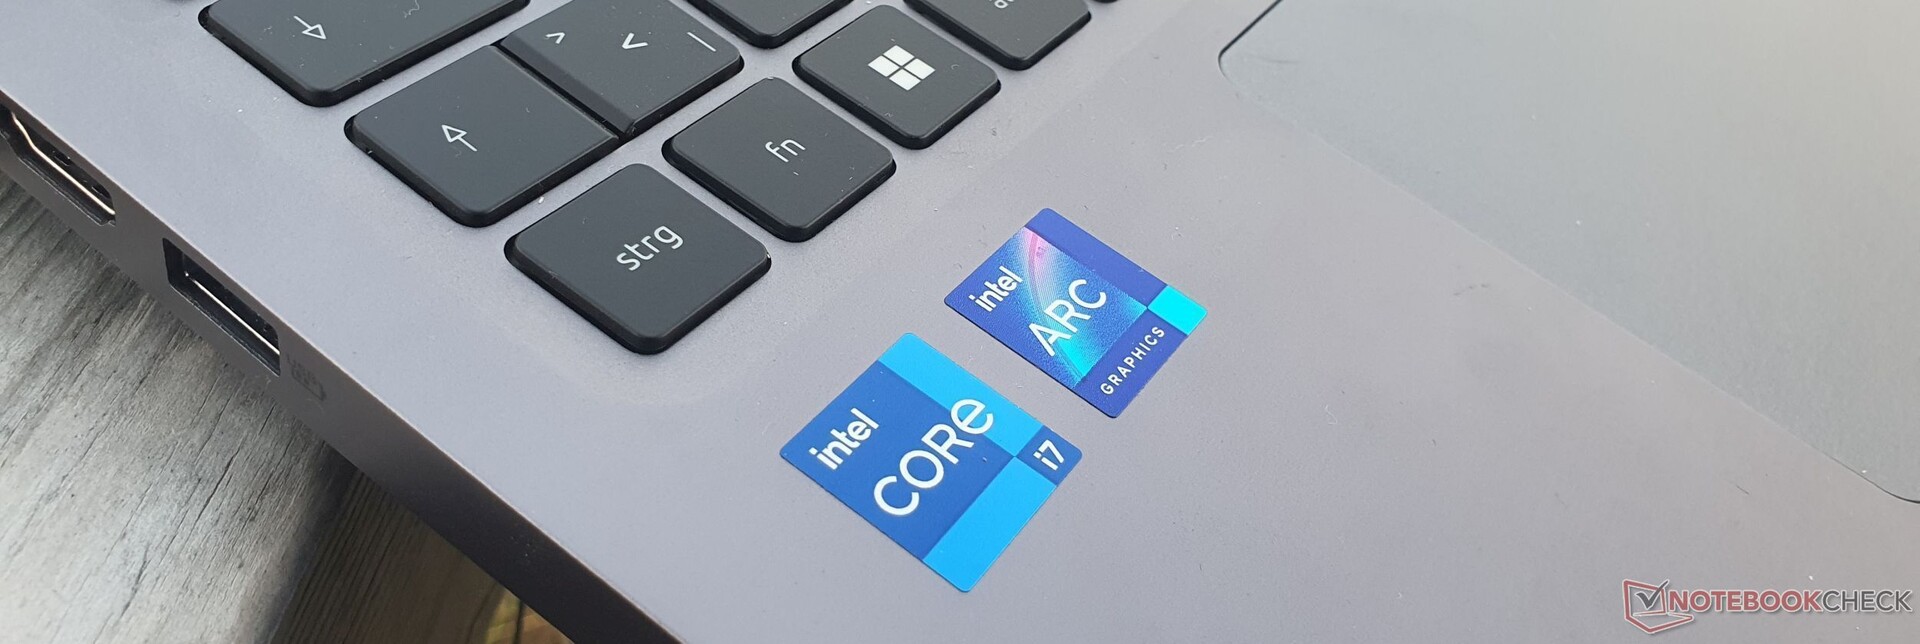
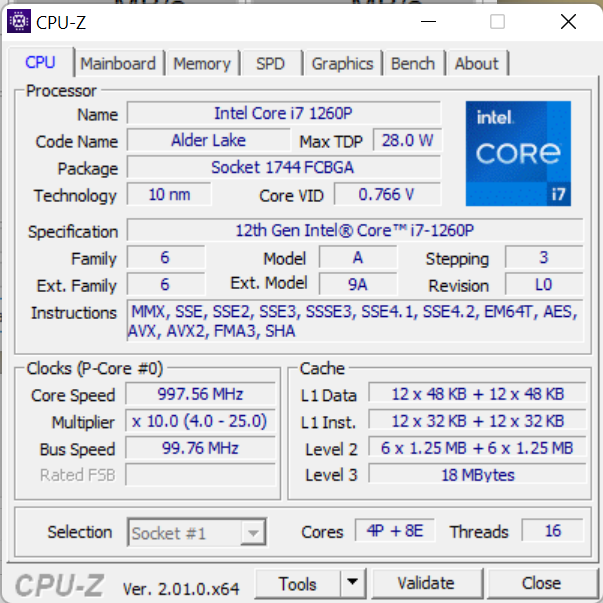
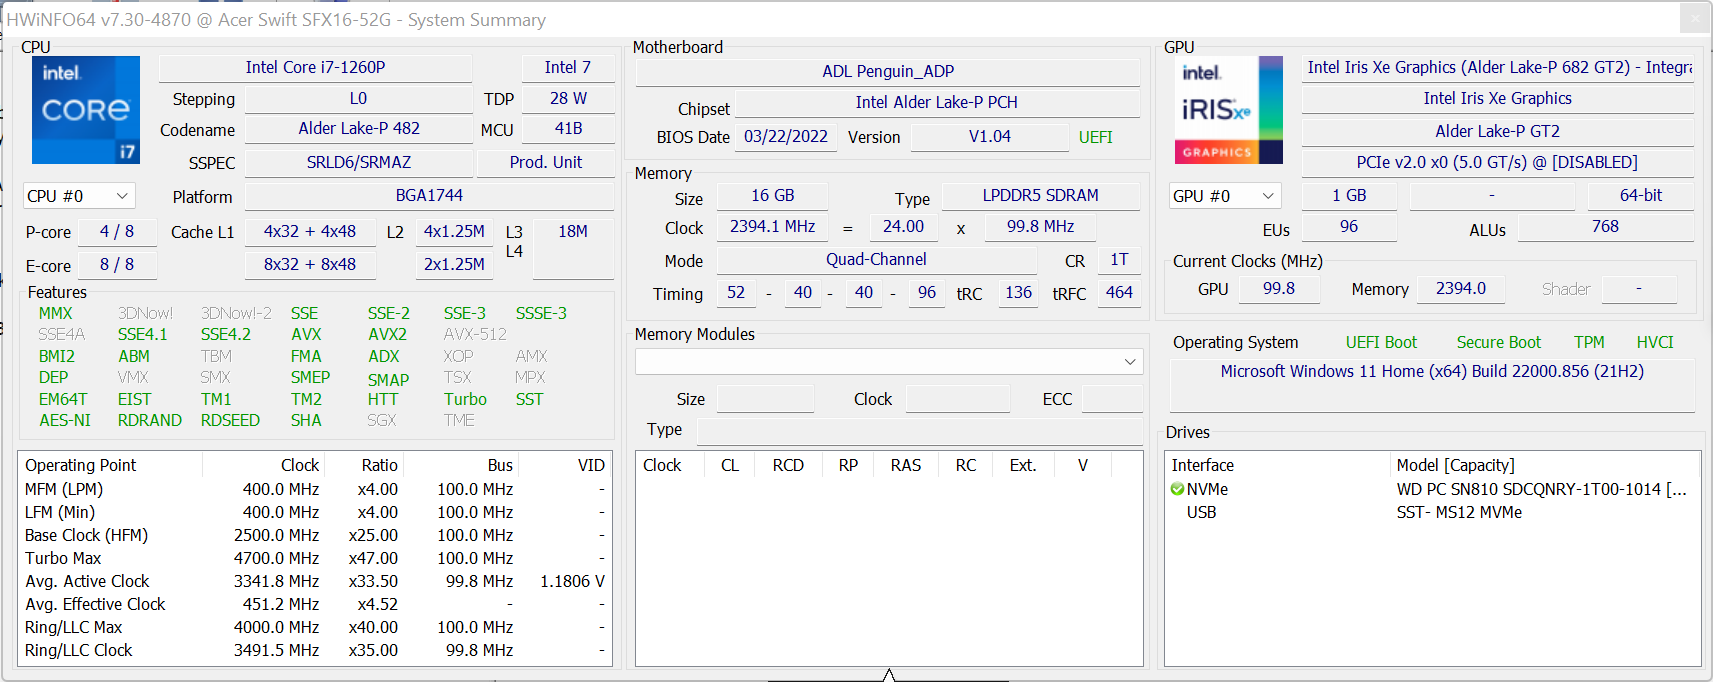
While the sibling model uses an Intel Core i5-1240P and 512-GB PCIe 4.0 SSD, as the only alternative option, our test unit comes with a Core i7-1260P and a faster 1-TB SSD. AMD versions are not available. Both models offer 16 GB soldered DDR5-4800 RAM and Intel's Arc A370M. The 16-inch laptop is designed for example for easy video cutting and media consumption, including Full-HD gaming.
Test Conditions
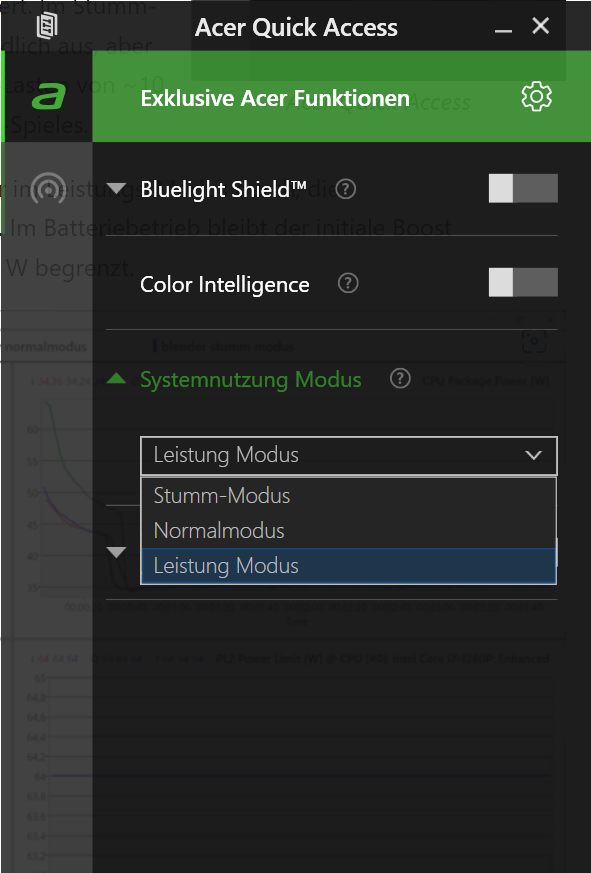
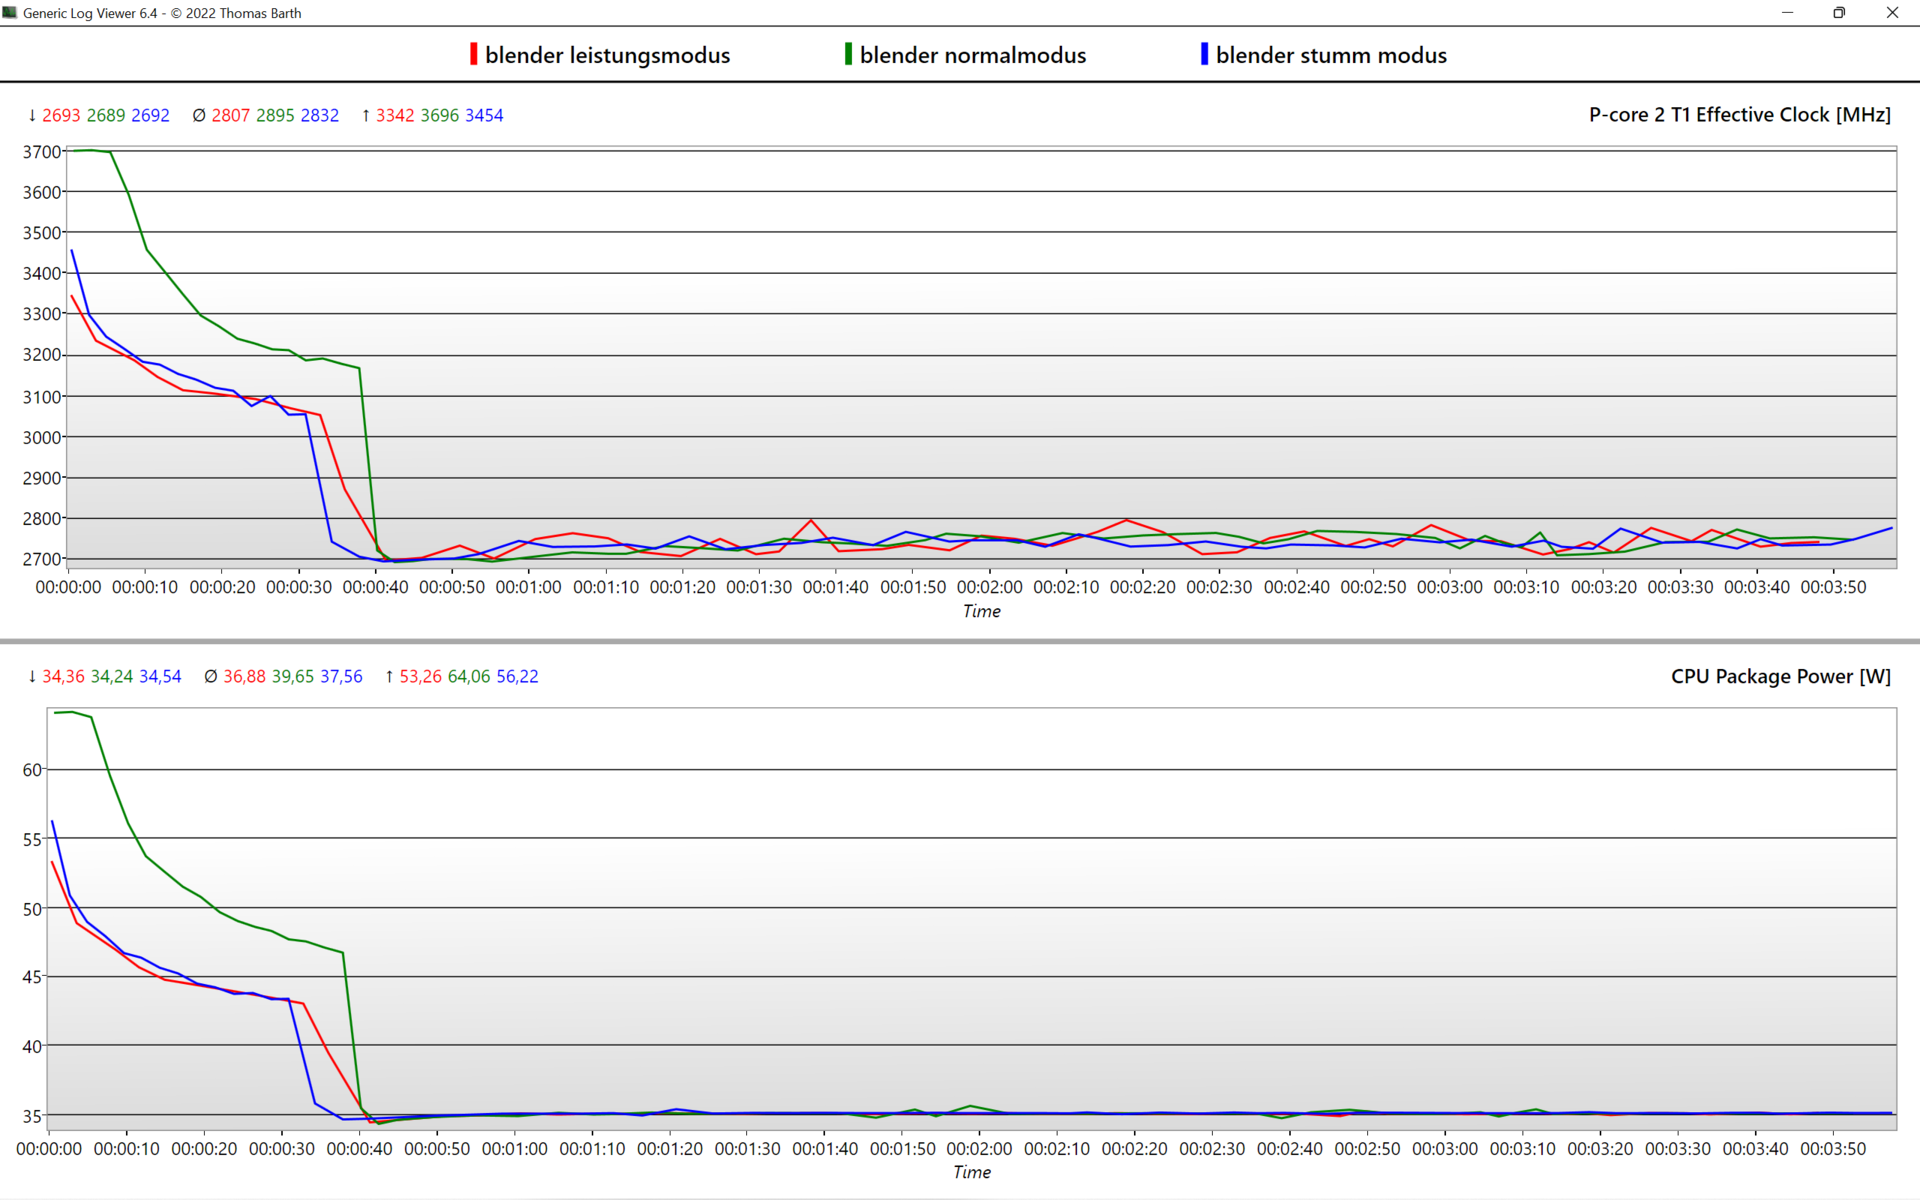
With "Acer Quick Access," you can select among three performance profiles. However, they only have an effect on Intel's Arc GPU, as the chart below shows. The fan behavior is also changed, as we explain in the "Emissions" section below.
We run our performance-related tests in the Performance mode and determine the battery life in the Normal mode. In battery operation, the initial boost of 64 watts is completely left out, and the CPU is limited to 28 watts.
| Performance Mode | Normal Mode | Silent Mode | Battery Mode | |
|---|---|---|---|---|
| CPU | 64 W > 35 W | 56 W > 35 W | 53 W > 35 W | 28 W |
| GPU | 35 W | 25 W | 20 W | 25 W |
Processor
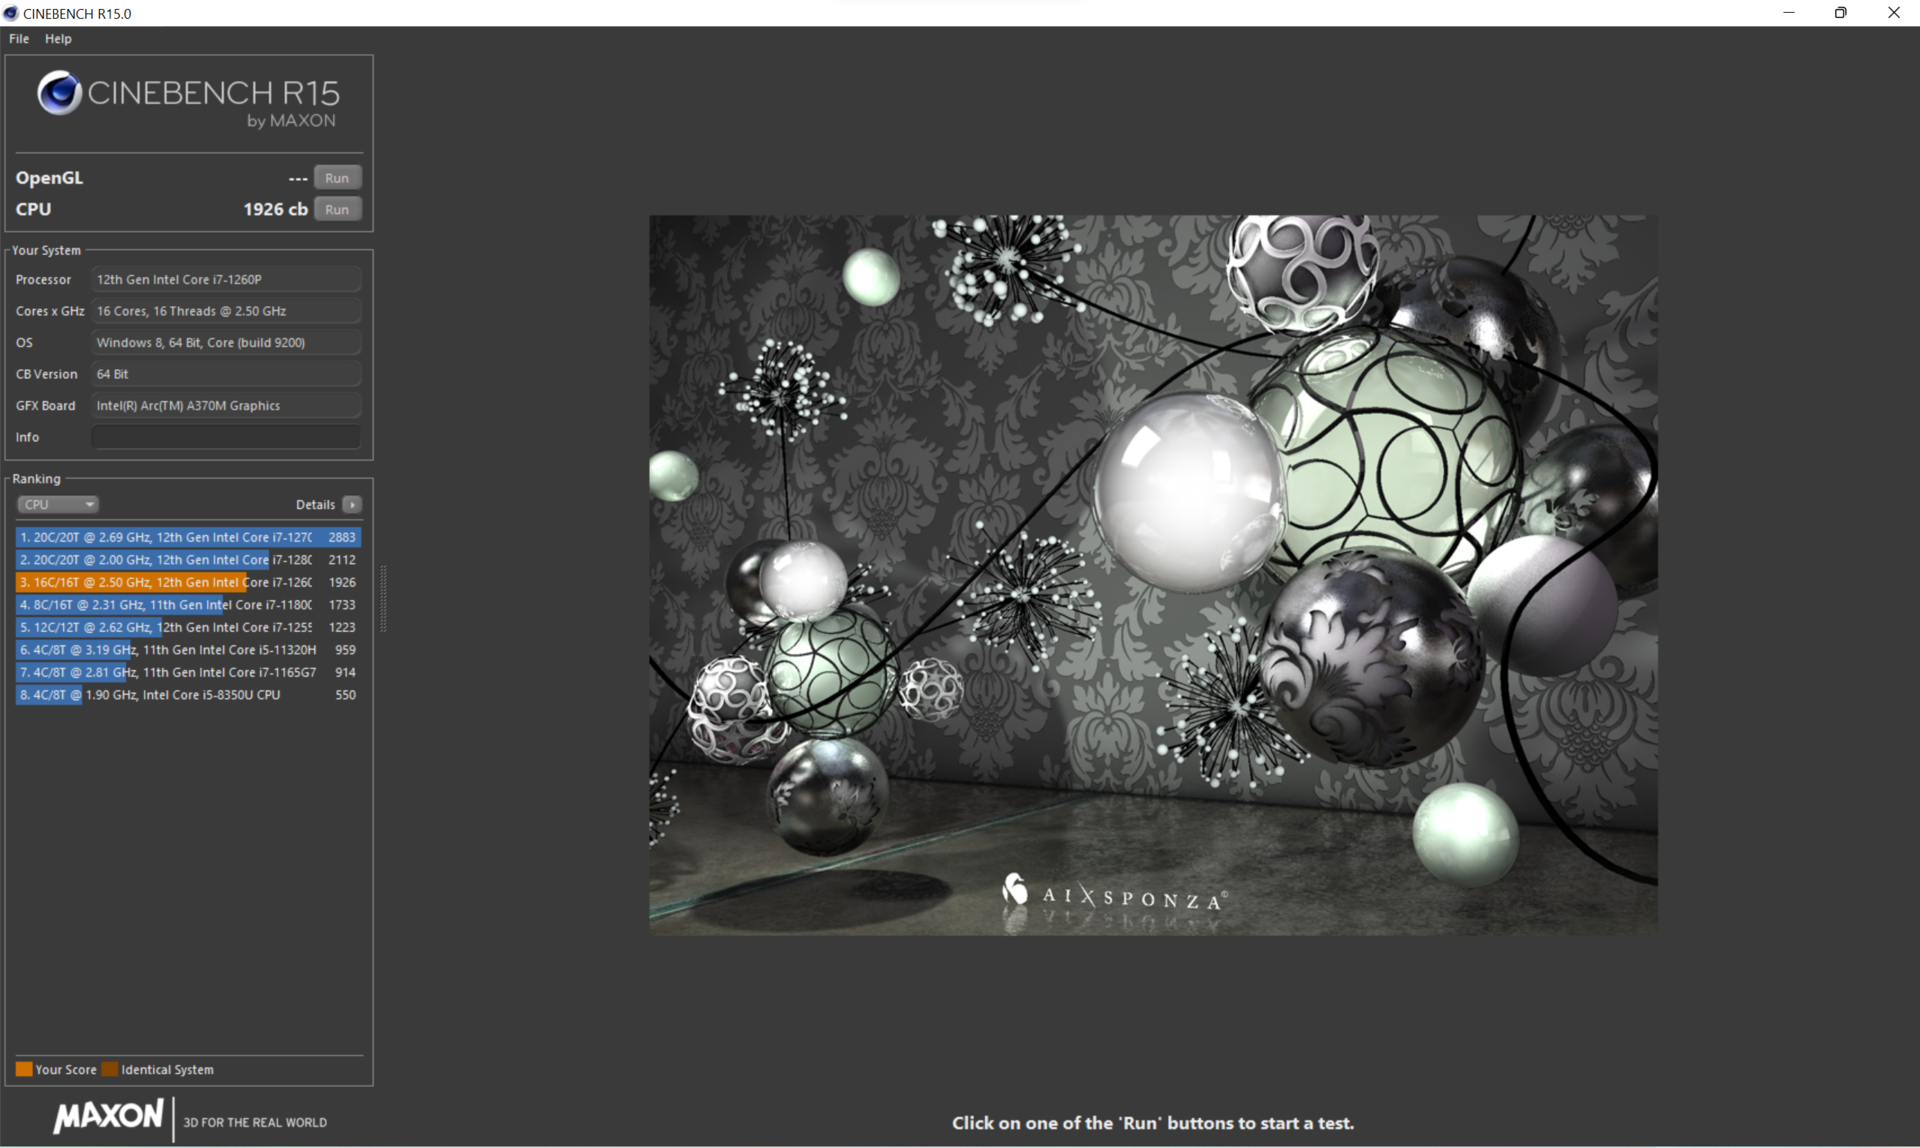
The multicore performance of the Intel Core i7-1260P is at the same level as that of the Core i5 of the sibling model. There is only a 10% advantage in the single-core performance. According to this, the additional 200 Euro (~$198) premium is not justified, despite the larger SSD.
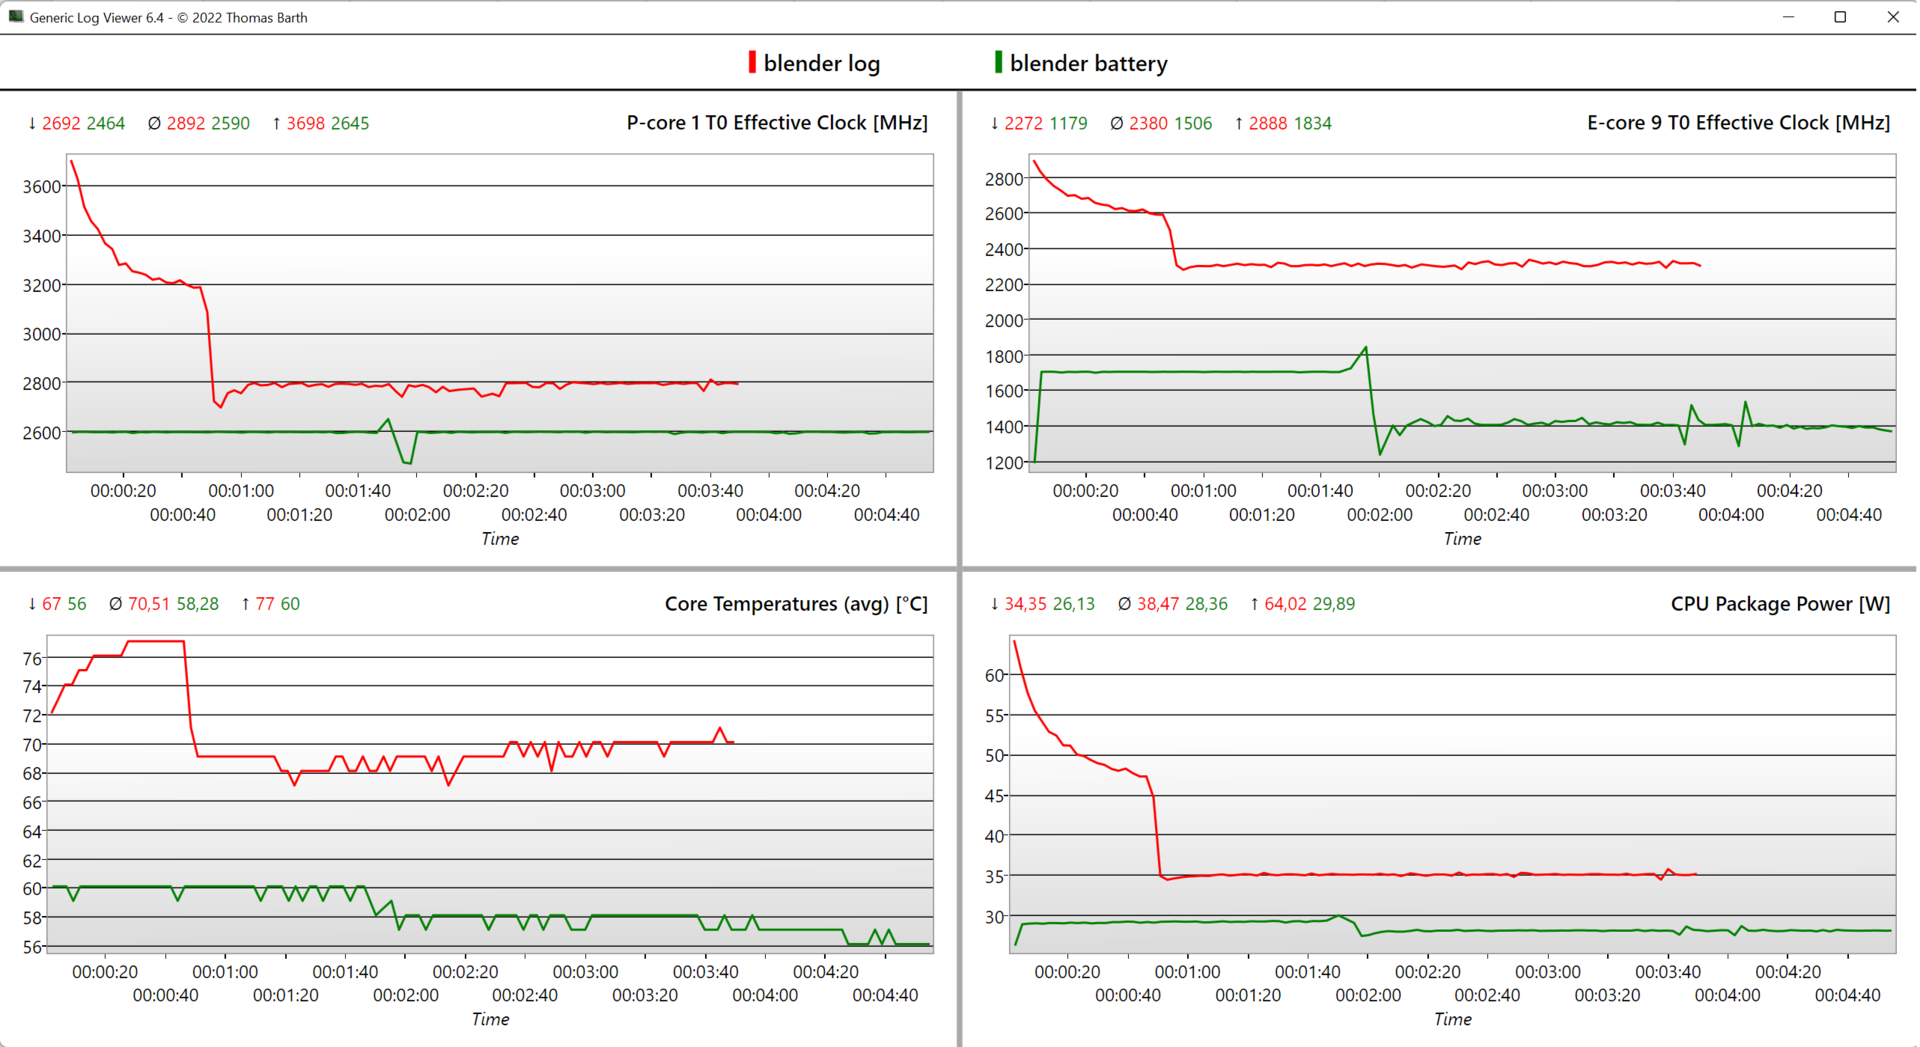
In the beginning, the P cores start out with a clock speed of 3.7 GHz, before gradually dropping to 3.2 GHz within 40 seconds, and when the 35-Watt power limit takes hold, they finally level out at a constant 2.8 GHz. The core temperatures level out at an appropriate 70 °C (158 °F).
The long-term performance surpasses that of the predecessor with a quad-core CPU by ~65% with the same 35-Watt power limit. Even AMD's Ryzen 9 5900X in the Asus Vivobook Pro 16X is only marginally faster in most scenarios. However, the ThinkBook 16 G4+ and Dell's Inspiron 16 Plus lead the rating with a significant advantage thanks to their Core i7-12700H with higher power limits.
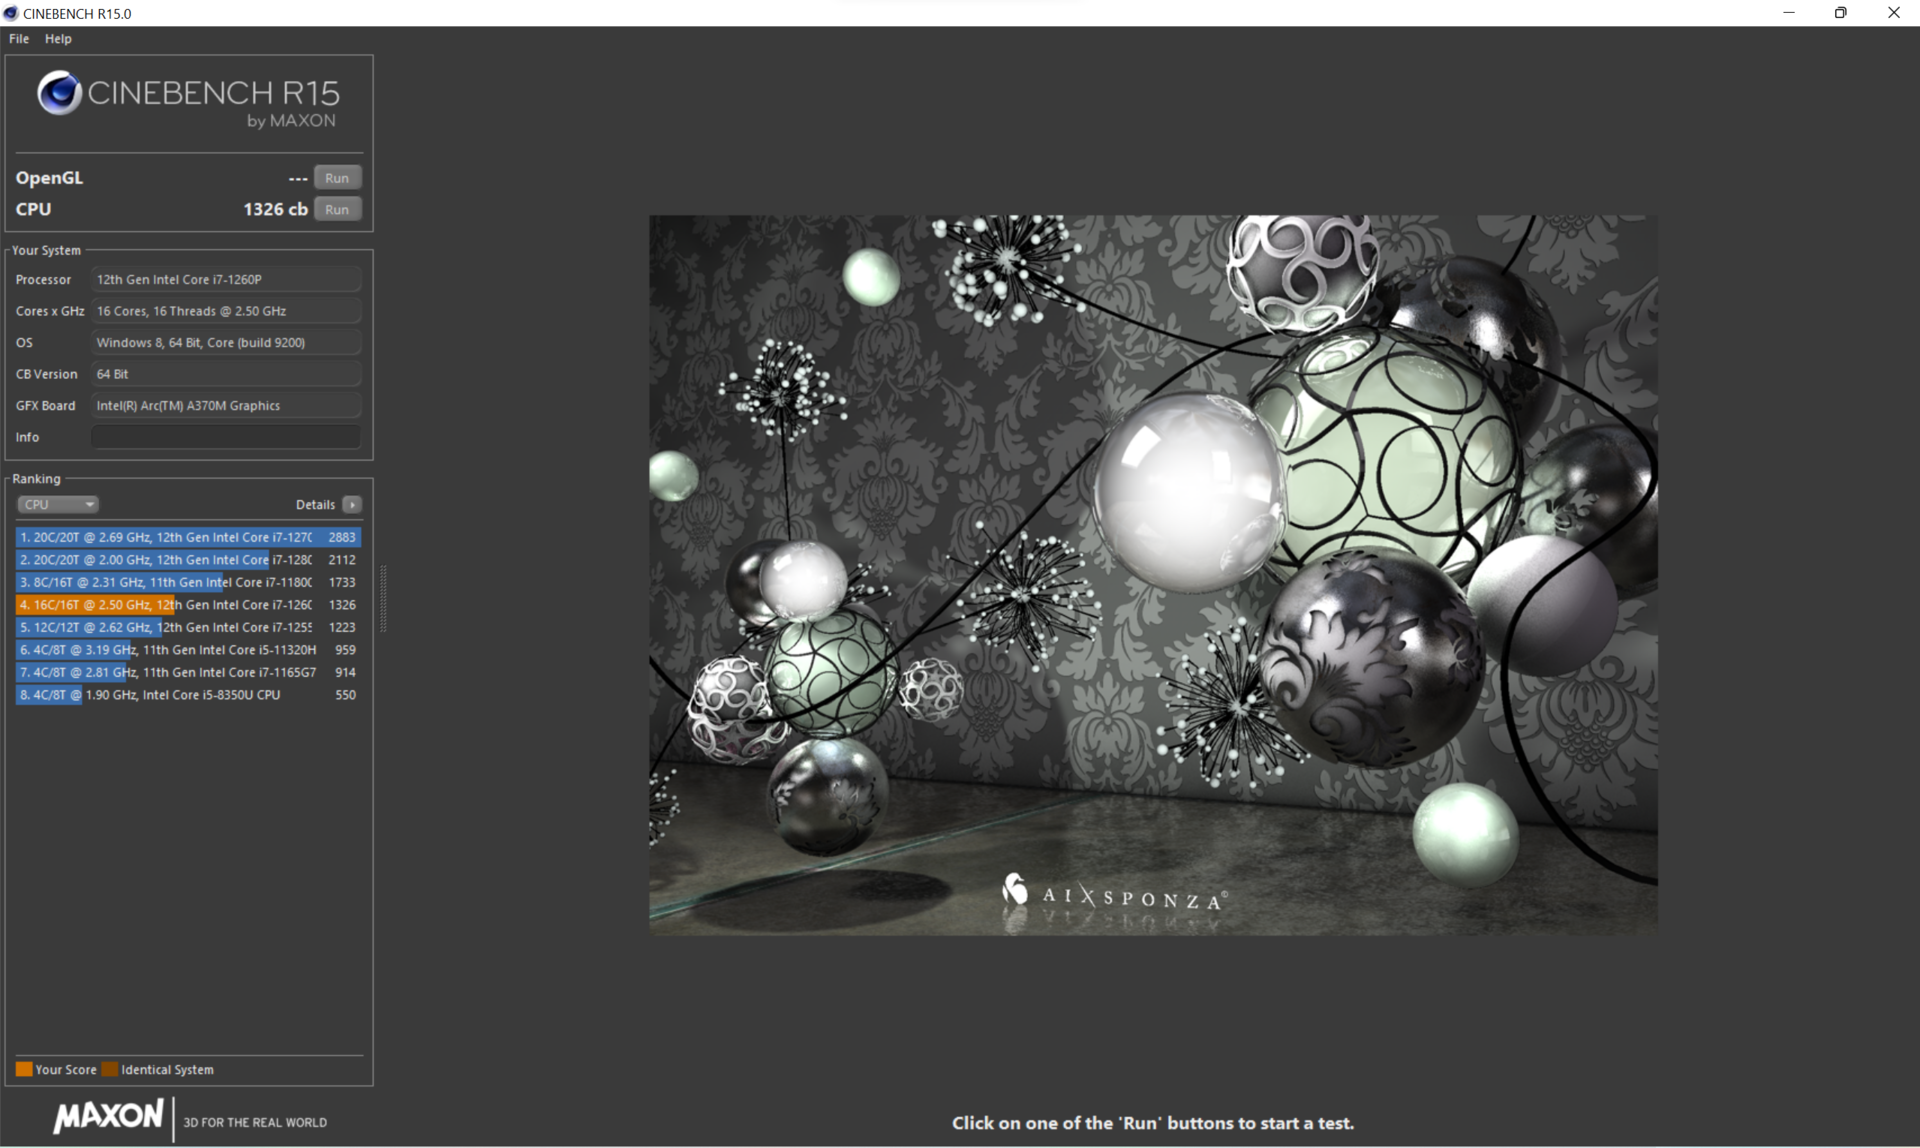
Since there is no Turbo boost and the power is limited to 28 watts in battery operation, the performance drops by 20 to 30%, depending on the scenario.
Cinebench R15 Multi Constant Load Test
Cinebench R23: Multi Core | Single Core
Cinebench R20: CPU (Multi Core) | CPU (Single Core)
Cinebench R15: CPU Multi 64Bit | CPU Single 64Bit
Blender: v2.79 BMW27 CPU
7-Zip 18.03: 7z b 4 | 7z b 4 -mmt1
Geekbench 5.5: Multi-Core | Single-Core
HWBOT x265 Benchmark v2.2: 4k Preset
LibreOffice : 20 Documents To PDF
R Benchmark 2.5: Overall mean
| CPU Performance rating | |
| Average of class Multimedia | |
| Lenovo ThinkBook 16 G4+ IAP | |
| Dell Inspiron 16 Plus 7620 | |
| HP Envy 16 h0112nr | |
| Asus Vivobook Pro 16X-M7600QE | |
| Acer Swift X SFX16-52G-77RX | |
| Acer Swift X SFX16-52G-52VE | |
| Average Intel Core i7-1260P | |
| Lenovo IdeaPad 5 Pro 16ARH7 | |
| Acer Swift X SFX16-51G-5388 | |
| Cinebench R23 / Multi Core | |
| Average of class Multimedia (4861 - 33362, n=65, last 2 years) | |
| Lenovo ThinkBook 16 G4+ IAP | |
| Dell Inspiron 16 Plus 7620 | |
| HP Envy 16 h0112nr | |
| Asus Vivobook Pro 16X-M7600QE | |
| Asus Vivobook Pro 16X-M7600QE | |
| Acer Swift X SFX16-52G-77RX | |
| Acer Swift X SFX16-52G-52VE | |
| Average Intel Core i7-1260P (3173 - 12150, n=27) | |
| Lenovo IdeaPad 5 Pro 16ARH7 | |
| Acer Swift X SFX16-51G-5388 | |
| Cinebench R23 / Single Core | |
| Average of class Multimedia (1128 - 2459, n=64, last 2 years) | |
| Lenovo ThinkBook 16 G4+ IAP | |
| HP Envy 16 h0112nr | |
| Dell Inspiron 16 Plus 7620 | |
| Acer Swift X SFX16-52G-77RX | |
| Average Intel Core i7-1260P (1155 - 1812, n=25) | |
| Acer Swift X SFX16-52G-52VE | |
| Asus Vivobook Pro 16X-M7600QE | |
| Asus Vivobook Pro 16X-M7600QE | |
| Lenovo IdeaPad 5 Pro 16ARH7 | |
| Acer Swift X SFX16-51G-5388 | |
| Cinebench R20 / CPU (Multi Core) | |
| Average of class Multimedia (1887 - 12912, n=56, last 2 years) | |
| Lenovo ThinkBook 16 G4+ IAP | |
| Dell Inspiron 16 Plus 7620 | |
| HP Envy 16 h0112nr | |
| Asus Vivobook Pro 16X-M7600QE | |
| Asus Vivobook Pro 16X-M7600QE | |
| Acer Swift X SFX16-52G-77RX | |
| Acer Swift X SFX16-52G-52VE | |
| Lenovo IdeaPad 5 Pro 16ARH7 | |
| Average Intel Core i7-1260P (1234 - 4748, n=25) | |
| Acer Swift X SFX16-51G-5388 | |
| Cinebench R20 / CPU (Single Core) | |
| Average of class Multimedia (425 - 853, n=56, last 2 years) | |
| Lenovo ThinkBook 16 G4+ IAP | |
| HP Envy 16 h0112nr | |
| Dell Inspiron 16 Plus 7620 | |
| Acer Swift X SFX16-52G-77RX | |
| Average Intel Core i7-1260P (448 - 698, n=25) | |
| Acer Swift X SFX16-52G-52VE | |
| Lenovo IdeaPad 5 Pro 16ARH7 | |
| Asus Vivobook Pro 16X-M7600QE | |
| Asus Vivobook Pro 16X-M7600QE | |
| Acer Swift X SFX16-51G-5388 | |
| Cinebench R15 / CPU Multi 64Bit | |
| Average of class Multimedia (856 - 5224, n=60, last 2 years) | |
| HP Envy 16 h0112nr | |
| Lenovo ThinkBook 16 G4+ IAP | |
| Dell Inspiron 16 Plus 7620 | |
| Asus Vivobook Pro 16X-M7600QE | |
| Asus Vivobook Pro 16X-M7600QE | |
| Acer Swift X SFX16-52G-77RX | |
| Acer Swift X SFX16-52G-52VE | |
| Lenovo IdeaPad 5 Pro 16ARH7 | |
| Average Intel Core i7-1260P (549 - 2034, n=29) | |
| Acer Swift X SFX16-51G-5388 | |
| Cinebench R15 / CPU Single 64Bit | |
| Average of class Multimedia (184.8 - 326, n=58, last 2 years) | |
| Lenovo ThinkBook 16 G4+ IAP | |
| HP Envy 16 h0112nr | |
| Dell Inspiron 16 Plus 7620 | |
| Acer Swift X SFX16-52G-77RX | |
| Asus Vivobook Pro 16X-M7600QE | |
| Asus Vivobook Pro 16X-M7600QE | |
| Lenovo IdeaPad 5 Pro 16ARH7 | |
| Acer Swift X SFX16-52G-52VE | |
| Average Intel Core i7-1260P (165.4 - 260, n=27) | |
| Acer Swift X SFX16-51G-5388 | |
| Blender / v2.79 BMW27 CPU | |
| Acer Swift X SFX16-51G-5388 | |
| Average Intel Core i7-1260P (264 - 906, n=26) | |
| Lenovo IdeaPad 5 Pro 16ARH7 | |
| Acer Swift X SFX16-52G-52VE | |
| Acer Swift X SFX16-52G-77RX | |
| Asus Vivobook Pro 16X-M7600QE | |
| Asus Vivobook Pro 16X-M7600QE | |
| Average of class Multimedia (100 - 557, n=57, last 2 years) | |
| HP Envy 16 h0112nr | |
| Dell Inspiron 16 Plus 7620 | |
| Lenovo ThinkBook 16 G4+ IAP | |
| 7-Zip 18.03 / 7z b 4 | |
| Lenovo ThinkBook 16 G4+ IAP | |
| Dell Inspiron 16 Plus 7620 | |
| Asus Vivobook Pro 16X-M7600QE | |
| Asus Vivobook Pro 16X-M7600QE | |
| Average of class Multimedia (26062 - 130368, n=54, last 2 years) | |
| HP Envy 16 h0112nr | |
| Acer Swift X SFX16-52G-52VE | |
| Lenovo IdeaPad 5 Pro 16ARH7 | |
| Acer Swift X SFX16-52G-77RX | |
| Average Intel Core i7-1260P (16146 - 47064, n=25) | |
| Acer Swift X SFX16-51G-5388 | |
| 7-Zip 18.03 / 7z b 4 -mmt1 | |
| Average of class Multimedia (3666 - 7545, n=55, last 2 years) | |
| Asus Vivobook Pro 16X-M7600QE | |
| Asus Vivobook Pro 16X-M7600QE | |
| HP Envy 16 h0112nr | |
| Lenovo ThinkBook 16 G4+ IAP | |
| Dell Inspiron 16 Plus 7620 | |
| Lenovo IdeaPad 5 Pro 16ARH7 | |
| Average Intel Core i7-1260P (4064 - 5791, n=25) | |
| Acer Swift X SFX16-52G-77RX | |
| Acer Swift X SFX16-52G-52VE | |
| Acer Swift X SFX16-51G-5388 | |
| Geekbench 5.5 / Multi-Core | |
| Average of class Multimedia (4652 - 20422, n=55, last 2 years) | |
| HP Envy 16 h0112nr | |
| Lenovo ThinkBook 16 G4+ IAP | |
| Dell Inspiron 16 Plus 7620 | |
| Acer Swift X SFX16-52G-77RX | |
| Acer Swift X SFX16-52G-52VE | |
| Average Intel Core i7-1260P (3866 - 10570, n=25) | |
| Asus Vivobook Pro 16X-M7600QE | |
| Asus Vivobook Pro 16X-M7600QE | |
| Lenovo IdeaPad 5 Pro 16ARH7 | |
| Acer Swift X SFX16-51G-5388 | |
| Geekbench 5.5 / Single-Core | |
| Average of class Multimedia (805 - 2974, n=55, last 2 years) | |
| Acer Swift X SFX16-52G-77RX | |
| HP Envy 16 h0112nr | |
| Lenovo ThinkBook 16 G4+ IAP | |
| Dell Inspiron 16 Plus 7620 | |
| Average Intel Core i7-1260P (1436 - 1786, n=25) | |
| Acer Swift X SFX16-52G-52VE | |
| Asus Vivobook Pro 16X-M7600QE | |
| Asus Vivobook Pro 16X-M7600QE | |
| Lenovo IdeaPad 5 Pro 16ARH7 | |
| Acer Swift X SFX16-51G-5388 | |
| HWBOT x265 Benchmark v2.2 / 4k Preset | |
| Average of class Multimedia (5.26 - 36.1, n=55, last 2 years) | |
| Lenovo ThinkBook 16 G4+ IAP | |
| Dell Inspiron 16 Plus 7620 | |
| Asus Vivobook Pro 16X-M7600QE | |
| Asus Vivobook Pro 16X-M7600QE | |
| HP Envy 16 h0112nr | |
| Acer Swift X SFX16-52G-77RX | |
| Acer Swift X SFX16-52G-52VE | |
| Lenovo IdeaPad 5 Pro 16ARH7 | |
| Average Intel Core i7-1260P (3.45 - 13.6, n=26) | |
| Acer Swift X SFX16-51G-5388 | |
| LibreOffice / 20 Documents To PDF | |
| Lenovo IdeaPad 5 Pro 16ARH7 | |
| Acer Swift X SFX16-52G-77RX | |
| Asus Vivobook Pro 16X-M7600QE | |
| Asus Vivobook Pro 16X-M7600QE | |
| Acer Swift X SFX16-51G-5388 | |
| Average of class Multimedia (23.9 - 146.7, n=56, last 2 years) | |
| Average Intel Core i7-1260P (40.2 - 65.7, n=25) | |
| Acer Swift X SFX16-52G-52VE | |
| Lenovo ThinkBook 16 G4+ IAP | |
| Dell Inspiron 16 Plus 7620 | |
| HP Envy 16 h0112nr | |
| R Benchmark 2.5 / Overall mean | |
| Acer Swift X SFX16-51G-5388 | |
| Acer Swift X SFX16-52G-52VE | |
| Lenovo IdeaPad 5 Pro 16ARH7 | |
| Average Intel Core i7-1260P (0.4559 - 0.727, n=25) | |
| Asus Vivobook Pro 16X-M7600QE | |
| Asus Vivobook Pro 16X-M7600QE | |
| Dell Inspiron 16 Plus 7620 | |
| Acer Swift X SFX16-52G-77RX | |
| Average of class Multimedia (0.3604 - 0.947, n=55, last 2 years) | |
| Lenovo ThinkBook 16 G4+ IAP | |
| HP Envy 16 h0112nr | |
* ... smaller is better
AIDA64: FP32 Ray-Trace | FPU Julia | CPU SHA3 | CPU Queen | FPU SinJulia | FPU Mandel | CPU AES | CPU ZLib | FP64 Ray-Trace | CPU PhotoWorxx
| Performance rating | |
| Average of class Multimedia | |
| Asus Vivobook Pro 16X-M7600QE | |
| Lenovo ThinkBook 16 G4+ IAP | |
| HP Envy 16 h0112nr | |
| Dell Inspiron 16 Plus 7620 | |
| Lenovo IdeaPad 5 Pro 16ARH7 | |
| Acer Swift X SFX16-52G-77RX | |
| Acer Swift X SFX16-52G-52VE | |
| Average Intel Core i7-1260P | |
| Acer Swift X SFX16-51G-5388 | |
| AIDA64 / FP32 Ray-Trace | |
| Average of class Multimedia (2214 - 50388, n=53, last 2 years) | |
| Lenovo ThinkBook 16 G4+ IAP | |
| Asus Vivobook Pro 16X-M7600QE | |
| Asus Vivobook Pro 16X-M7600QE | |
| Dell Inspiron 16 Plus 7620 | |
| HP Envy 16 h0112nr | |
| Lenovo IdeaPad 5 Pro 16ARH7 | |
| Acer Swift X SFX16-52G-52VE | |
| Acer Swift X SFX16-52G-77RX | |
| Average Intel Core i7-1260P (2176 - 10898, n=26) | |
| Acer Swift X SFX16-51G-5388 | |
| AIDA64 / FPU Julia | |
| Asus Vivobook Pro 16X-M7600QE | |
| Asus Vivobook Pro 16X-M7600QE | |
| Average of class Multimedia (12867 - 201874, n=53, last 2 years) | |
| Lenovo ThinkBook 16 G4+ IAP | |
| Lenovo IdeaPad 5 Pro 16ARH7 | |
| Dell Inspiron 16 Plus 7620 | |
| HP Envy 16 h0112nr | |
| Acer Swift X SFX16-52G-77RX | |
| Acer Swift X SFX16-52G-52VE | |
| Average Intel Core i7-1260P (11015 - 56906, n=26) | |
| Acer Swift X SFX16-51G-5388 | |
| AIDA64 / CPU SHA3 | |
| Average of class Multimedia (626 - 8623, n=53, last 2 years) | |
| Lenovo ThinkBook 16 G4+ IAP | |
| Asus Vivobook Pro 16X-M7600QE | |
| Asus Vivobook Pro 16X-M7600QE | |
| Dell Inspiron 16 Plus 7620 | |
| HP Envy 16 h0112nr | |
| Lenovo IdeaPad 5 Pro 16ARH7 | |
| Acer Swift X SFX16-52G-77RX | |
| Acer Swift X SFX16-52G-52VE | |
| Acer Swift X SFX16-51G-5388 | |
| Average Intel Core i7-1260P (669 - 2709, n=26) | |
| AIDA64 / CPU Queen | |
| Lenovo ThinkBook 16 G4+ IAP | |
| HP Envy 16 h0112nr | |
| Asus Vivobook Pro 16X-M7600QE | |
| Asus Vivobook Pro 16X-M7600QE | |
| Dell Inspiron 16 Plus 7620 | |
| Acer Swift X SFX16-52G-77RX | |
| Lenovo IdeaPad 5 Pro 16ARH7 | |
| Average of class Multimedia (13483 - 181505, n=40, last 2 years) | |
| Average Intel Core i7-1260P (42571 - 82493, n=26) | |
| Acer Swift X SFX16-52G-52VE | |
| Acer Swift X SFX16-51G-5388 | |
| AIDA64 / FPU SinJulia | |
| Asus Vivobook Pro 16X-M7600QE | |
| Asus Vivobook Pro 16X-M7600QE | |
| Lenovo ThinkBook 16 G4+ IAP | |
| Lenovo IdeaPad 5 Pro 16ARH7 | |
| Dell Inspiron 16 Plus 7620 | |
| Average of class Multimedia (886 - 28794, n=53, last 2 years) | |
| HP Envy 16 h0112nr | |
| Acer Swift X SFX16-52G-77RX | |
| Acer Swift X SFX16-52G-52VE | |
| Average Intel Core i7-1260P (2901 - 6975, n=26) | |
| Acer Swift X SFX16-51G-5388 | |
| AIDA64 / FPU Mandel | |
| Asus Vivobook Pro 16X-M7600QE | |
| Asus Vivobook Pro 16X-M7600QE | |
| Average of class Multimedia (6395 - 105740, n=53, last 2 years) | |
| Lenovo IdeaPad 5 Pro 16ARH7 | |
| Lenovo ThinkBook 16 G4+ IAP | |
| Dell Inspiron 16 Plus 7620 | |
| HP Envy 16 h0112nr | |
| Acer Swift X SFX16-52G-77RX | |
| Acer Swift X SFX16-52G-52VE | |
| Acer Swift X SFX16-51G-5388 | |
| Average Intel Core i7-1260P (5950 - 26376, n=26) | |
| AIDA64 / CPU AES | |
| Asus Vivobook Pro 16X-M7600QE | |
| Asus Vivobook Pro 16X-M7600QE | |
| HP Envy 16 h0112nr | |
| Lenovo ThinkBook 16 G4+ IAP | |
| Dell Inspiron 16 Plus 7620 | |
| Average of class Multimedia (8171 - 126790, n=53, last 2 years) | |
| Acer Swift X SFX16-51G-5388 | |
| Acer Swift X SFX16-52G-77RX | |
| Acer Swift X SFX16-52G-52VE | |
| Average Intel Core i7-1260P (16041 - 92356, n=26) | |
| Lenovo IdeaPad 5 Pro 16ARH7 | |
| AIDA64 / CPU ZLib | |
| Lenovo ThinkBook 16 G4+ IAP | |
| Dell Inspiron 16 Plus 7620 | |
| Average of class Multimedia (143.8 - 2022, n=53, last 2 years) | |
| Acer Swift X SFX16-52G-52VE | |
| HP Envy 16 h0112nr | |
| Asus Vivobook Pro 16X-M7600QE | |
| Asus Vivobook Pro 16X-M7600QE | |
| Acer Swift X SFX16-52G-77RX | |
| Lenovo IdeaPad 5 Pro 16ARH7 | |
| Average Intel Core i7-1260P (259 - 771, n=26) | |
| Acer Swift X SFX16-51G-5388 | |
| AIDA64 / FP64 Ray-Trace | |
| Average of class Multimedia (1014 - 26875, n=53, last 2 years) | |
| Asus Vivobook Pro 16X-M7600QE | |
| Asus Vivobook Pro 16X-M7600QE | |
| Lenovo ThinkBook 16 G4+ IAP | |
| Dell Inspiron 16 Plus 7620 | |
| HP Envy 16 h0112nr | |
| Lenovo IdeaPad 5 Pro 16ARH7 | |
| Acer Swift X SFX16-52G-77RX | |
| Acer Swift X SFX16-52G-52VE | |
| Average Intel Core i7-1260P (1237 - 5858, n=26) | |
| Acer Swift X SFX16-51G-5388 | |
| AIDA64 / CPU PhotoWorxx | |
| Average of class Multimedia (8187 - 88154, n=53, last 2 years) | |
| Acer Swift X SFX16-52G-52VE | |
| Acer Swift X SFX16-52G-77RX | |
| Lenovo ThinkBook 16 G4+ IAP | |
| HP Envy 16 h0112nr | |
| Acer Swift X SFX16-51G-5388 | |
| Dell Inspiron 16 Plus 7620 | |
| Average Intel Core i7-1260P (13261 - 43652, n=26) | |
| Lenovo IdeaPad 5 Pro 16ARH7 | |
| Asus Vivobook Pro 16X-M7600QE | |
| Asus Vivobook Pro 16X-M7600QE | |
System Performance
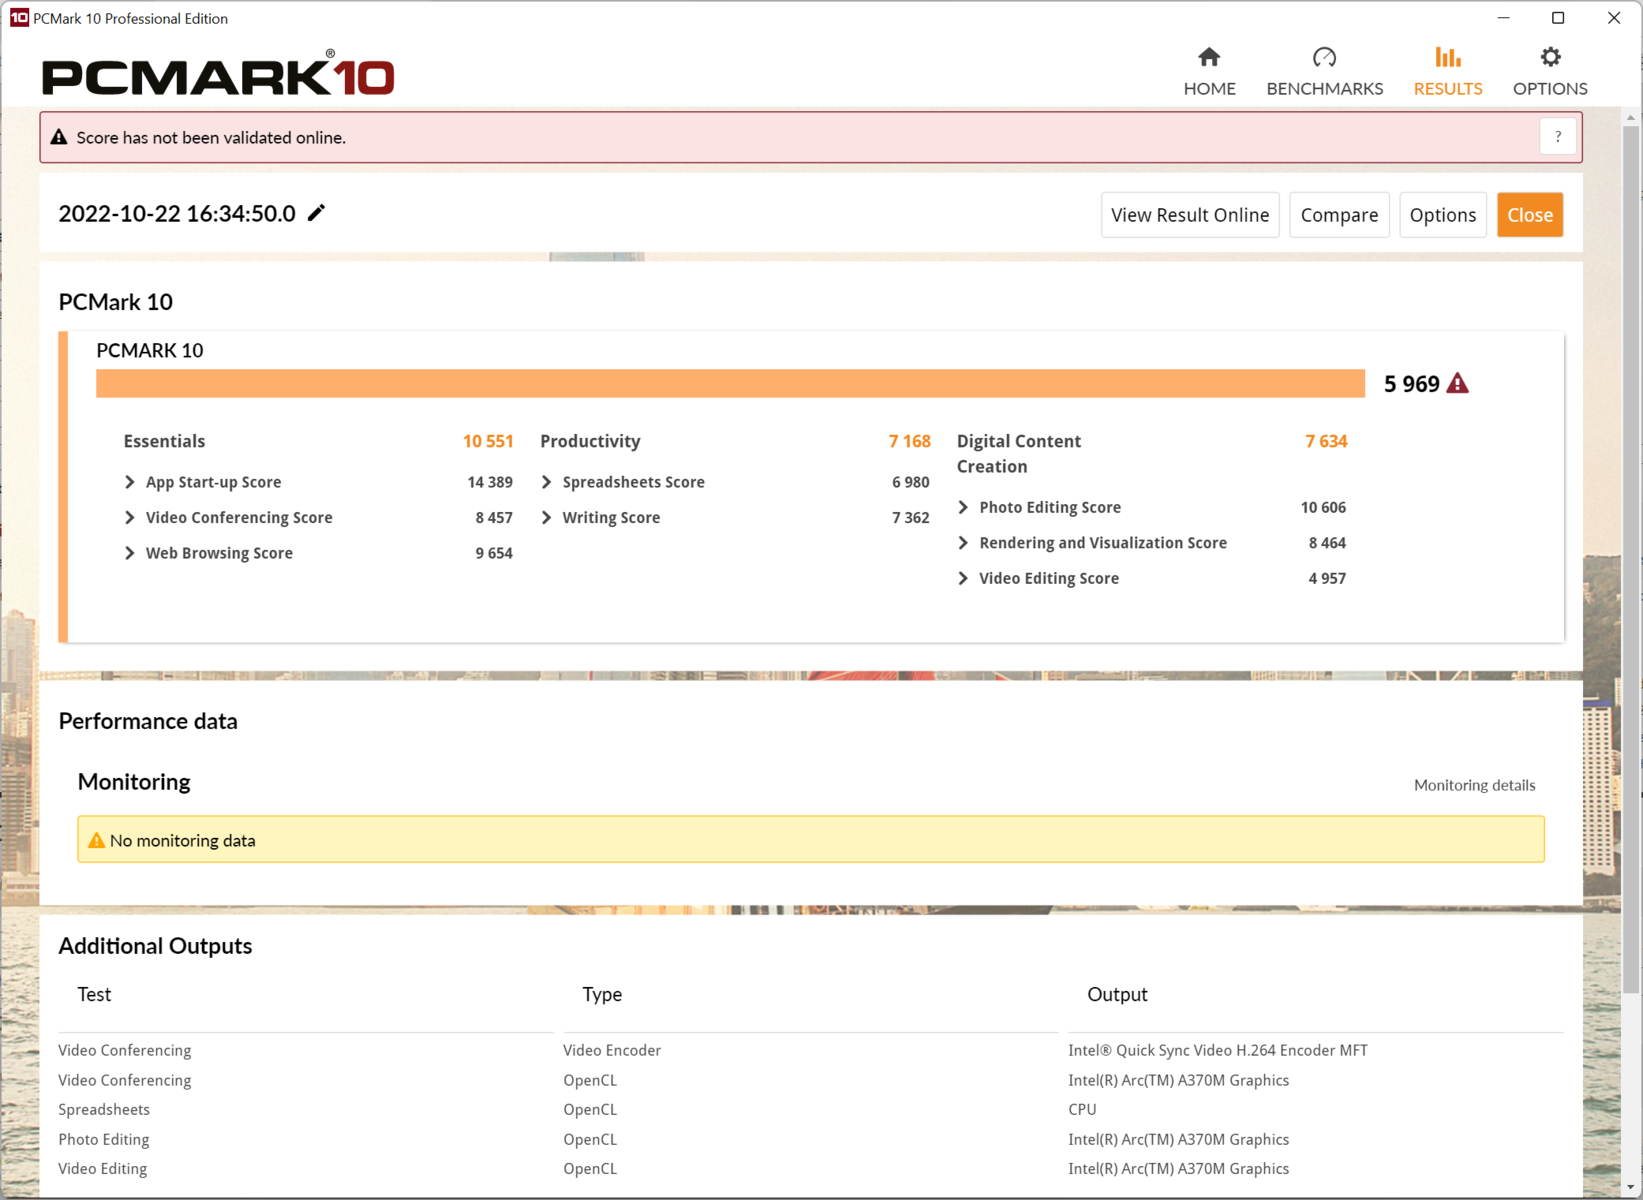
Similar to the sibling model, the system performance is at a high level, particularly during web surfing, due to the high Turbo boost in Intel processors.
Due to its RTX 3060, the HP Envy 16 is able to move ahead particularly in the area of content creation. During the CPU-heavy web surfing, the distance to the Core i7-12700H used in that laptop is reduced to between 10 and 15%.
CrossMark: Overall | Productivity | Creativity | Responsiveness
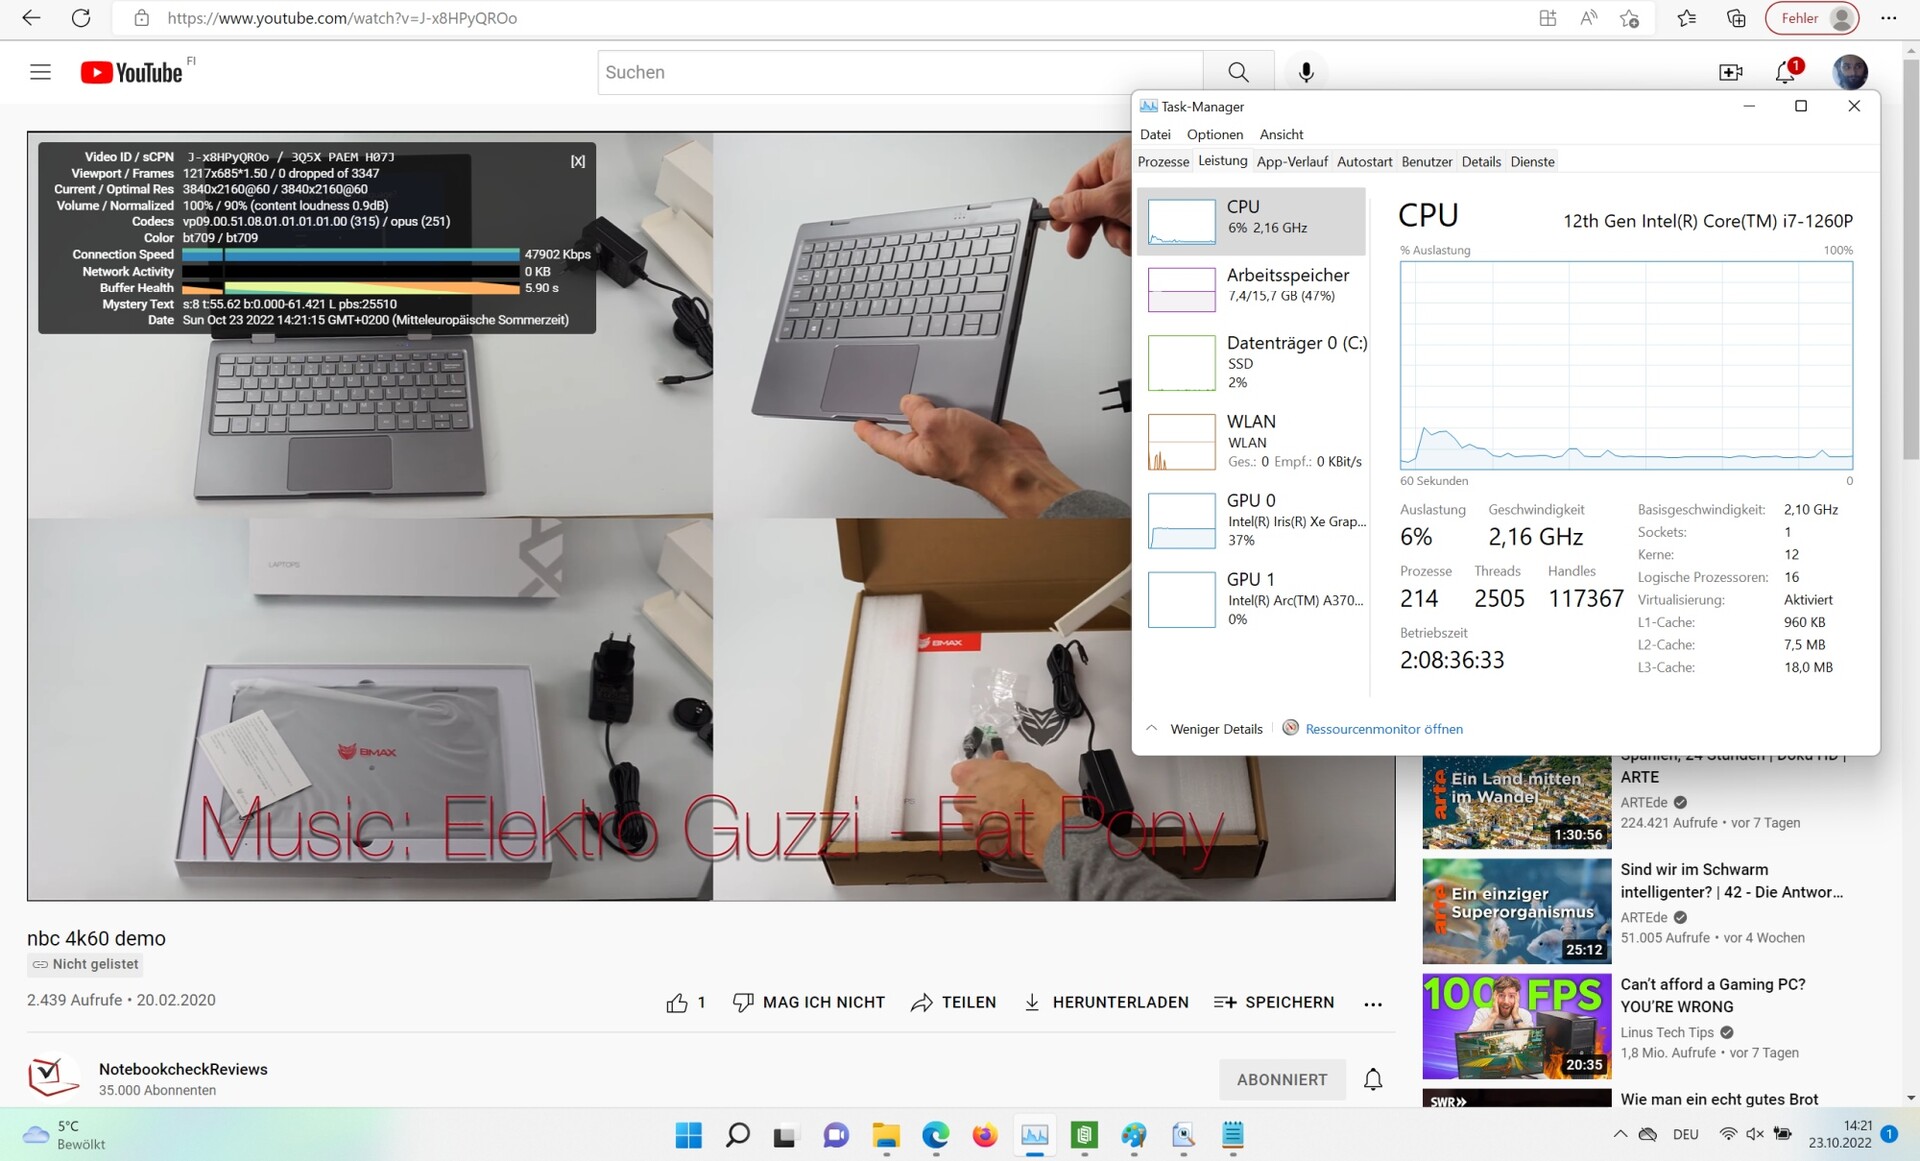
Youtube: 2160p60 CPU Load
Sunspider: 1.0 Total Score
Mozilla Kraken 1.1: Total
Speedometer 2.0: Result 2.0
Octane V2: Total Score
Jetstream 2: 2.0 Total
WebXPRT 3: Overall
WebXPRT 4: Overall
| PCMark 10 / Score | |
| Average of class Multimedia (4325 - 10386, n=51, last 2 years) | |
| HP Envy 16 h0112nr | |
| Dell Inspiron 16 Plus 7620 | |
| Asus Vivobook Pro 16X-M7600QE | |
| Acer Swift X SFX16-52G-77RX | |
| Average Intel Core i7-1260P, Intel Arc A370M (n=1) | |
| Acer Swift X SFX16-52G-52VE | |
| Lenovo IdeaPad 5 Pro 16ARH7 | |
| Acer Swift X SFX16-51G-5388 | |
| PCMark 10 / Essentials | |
| HP Envy 16 h0112nr | |
| Acer Swift X SFX16-52G-77RX | |
| Average Intel Core i7-1260P, Intel Arc A370M (n=1) | |
| Average of class Multimedia (8025 - 11664, n=50, last 2 years) | |
| Asus Vivobook Pro 16X-M7600QE | |
| Dell Inspiron 16 Plus 7620 | |
| Lenovo IdeaPad 5 Pro 16ARH7 | |
| Acer Swift X SFX16-52G-52VE | |
| Acer Swift X SFX16-51G-5388 | |
| PCMark 10 / Productivity | |
| Average of class Multimedia (7323 - 18233, n=50, last 2 years) | |
| Asus Vivobook Pro 16X-M7600QE | |
| HP Envy 16 h0112nr | |
| Dell Inspiron 16 Plus 7620 | |
| Lenovo IdeaPad 5 Pro 16ARH7 | |
| Acer Swift X SFX16-51G-5388 | |
| Acer Swift X SFX16-52G-52VE | |
| Acer Swift X SFX16-52G-77RX | |
| Average Intel Core i7-1260P, Intel Arc A370M (n=1) | |
| PCMark 10 / Digital Content Creation | |
| HP Envy 16 h0112nr | |
| Average of class Multimedia (3651 - 16240, n=50, last 2 years) | |
| Dell Inspiron 16 Plus 7620 | |
| Asus Vivobook Pro 16X-M7600QE | |
| Acer Swift X SFX16-52G-77RX | |
| Average Intel Core i7-1260P, Intel Arc A370M (n=1) | |
| Acer Swift X SFX16-52G-52VE | |
| Acer Swift X SFX16-51G-5388 | |
| Lenovo IdeaPad 5 Pro 16ARH7 | |
| CrossMark / Overall | |
| Average of class Multimedia (866 - 2728, n=59, last 2 years) | |
| HP Envy 16 h0112nr | |
| Lenovo ThinkBook 16 G4+ IAP | |
| Dell Inspiron 16 Plus 7620 | |
| Acer Swift X SFX16-52G-77RX | |
| Average Intel Core i7-1260P, Intel Arc A370M (n=1) | |
| Acer Swift X SFX16-52G-52VE | |
| Acer Swift X SFX16-51G-5388 | |
| CrossMark / Productivity | |
| Average of class Multimedia (931 - 2489, n=59, last 2 years) | |
| HP Envy 16 h0112nr | |
| Lenovo ThinkBook 16 G4+ IAP | |
| Acer Swift X SFX16-52G-77RX | |
| Average Intel Core i7-1260P, Intel Arc A370M (n=1) | |
| Dell Inspiron 16 Plus 7620 | |
| Acer Swift X SFX16-51G-5388 | |
| Acer Swift X SFX16-52G-52VE | |
| CrossMark / Creativity | |
| Average of class Multimedia (907 - 3465, n=59, last 2 years) | |
| HP Envy 16 h0112nr | |
| Lenovo ThinkBook 16 G4+ IAP | |
| Dell Inspiron 16 Plus 7620 | |
| Acer Swift X SFX16-52G-77RX | |
| Average Intel Core i7-1260P, Intel Arc A370M (n=1) | |
| Acer Swift X SFX16-52G-52VE | |
| Acer Swift X SFX16-51G-5388 | |
| CrossMark / Responsiveness | |
| Acer Swift X SFX16-52G-77RX | |
| Average Intel Core i7-1260P, Intel Arc A370M (n=1) | |
| HP Envy 16 h0112nr | |
| Lenovo ThinkBook 16 G4+ IAP | |
| Average of class Multimedia (605 - 2024, n=59, last 2 years) | |
| Dell Inspiron 16 Plus 7620 | |
| Acer Swift X SFX16-52G-52VE | |
| Acer Swift X SFX16-51G-5388 | |
| Youtube / 2160p60 CPU Load | |
| Average of class Multimedia (3 - 46, n=51, last 2 years) | |
| Acer Swift X SFX16-52G-52VE (42, 1) | |
| Lenovo ThinkBook 16 G4+ IAP (43, 8) | |
| Acer Swift X SFX16-52G-77RX (37) | |
| Average Intel Core i7-1260P, Intel Arc A370M (n=1) | |
| Asus Vivobook Pro 16X-M7600QE (76, 38) | |
| Dell Inspiron 16 Plus 7620 (46, 1) | |
| HP Envy 16 h0112nr (45, 3) | |
| Lenovo IdeaPad 5 Pro 16ARH7 (1) | |
| Sunspider / 1.0 Total Score | |
| Lenovo IdeaPad 5 Pro 16ARH7 | |
| Acer Swift X SFX16-52G-77RX | |
| Average Intel Core i7-1260P, Intel Arc A370M (n=1) | |
| Average of class Multimedia (n=1last 2 years) | |
| Mozilla Kraken 1.1 / Total | |
| Acer Swift X SFX16-51G-5388 | |
| Lenovo IdeaPad 5 Pro 16ARH7 | |
| Asus Vivobook Pro 16X-M7600QE | |
| Asus Vivobook Pro 16X-M7600QE | |
| Acer Swift X SFX16-52G-77RX | |
| Average Intel Core i7-1260P, Intel Arc A370M (n=1) | |
| Acer Swift X SFX16-52G-52VE | |
| HP Envy 16 h0112nr | |
| Dell Inspiron 16 Plus 7620 | |
| Lenovo ThinkBook 16 G4+ IAP | |
| Average of class Multimedia (228 - 835, n=65, last 2 years) | |
| Speedometer 2.0 / Result 2.0 | |
| Average of class Multimedia (337 - 946, n=29, last 2 years) | |
| Lenovo ThinkBook 16 G4+ IAP | |
| Acer Swift X SFX16-52G-77RX | |
| Average Intel Core i7-1260P, Intel Arc A370M (n=1) | |
| Octane V2 / Total Score | |
| Average of class Multimedia (79641 - 153175, n=29, last 2 years) | |
| Lenovo ThinkBook 16 G4+ IAP | |
| Acer Swift X SFX16-52G-77RX | |
| Average Intel Core i7-1260P, Intel Arc A370M (n=1) | |
| Acer Swift X SFX16-52G-52VE | |
| Acer Swift X SFX16-51G-5388 | |
| Jetstream 2 / 2.0 Total | |
| Average of class Multimedia (287 - 481, n=30, last 2 years) | |
| HP Envy 16 h0112nr | |
| Dell Inspiron 16 Plus 7620 | |
| Lenovo ThinkBook 16 G4+ IAP | |
| Acer Swift X SFX16-52G-77RX | |
| Average Intel Core i7-1260P, Intel Arc A370M (n=1) | |
| Acer Swift X SFX16-52G-52VE | |
| Acer Swift X SFX16-51G-5388 | |
| WebXPRT 3 / Overall | |
| Average of class Multimedia (136.4 - 596, n=62, last 2 years) | |
| HP Envy 16 h0112nr | |
| Dell Inspiron 16 Plus 7620 | |
| Lenovo ThinkBook 16 G4+ IAP | |
| Asus Vivobook Pro 16X-M7600QE | |
| Acer Swift X SFX16-52G-77RX | |
| Average Intel Core i7-1260P, Intel Arc A370M (n=1) | |
| Acer Swift X SFX16-52G-52VE | |
| Acer Swift X SFX16-51G-5388 | |
| Lenovo IdeaPad 5 Pro 16ARH7 | |
| WebXPRT 4 / Overall | |
| Average of class Multimedia (167.3 - 402, n=64, last 2 years) | |
| HP Envy 16 h0112nr | |
| Lenovo ThinkBook 16 G4+ IAP | |
| Dell Inspiron 16 Plus 7620 | |
| Acer Swift X SFX16-52G-77RX | |
| Average Intel Core i7-1260P, Intel Arc A370M (n=1) | |
| Acer Swift X SFX16-52G-52VE | |
| Acer Swift X SFX16-51G-5388 | |
* ... smaller is better
| PCMark 10 Score | 5969 points | |
Help | ||
| AIDA64 / Memory Copy | |
| Average of class Multimedia (11299 - 132135, n=53, last 2 years) | |
| Acer Swift X SFX16-52G-77RX | |
| Acer Swift X SFX16-52G-52VE | |
| Lenovo ThinkBook 16 G4+ IAP | |
| HP Envy 16 h0112nr | |
| Acer Swift X SFX16-51G-5388 | |
| Dell Inspiron 16 Plus 7620 | |
| Average Intel Core i7-1260P (25125 - 71544, n=25) | |
| Lenovo IdeaPad 5 Pro 16ARH7 | |
| Asus Vivobook Pro 16X-M7600QE | |
| Asus Vivobook Pro 16X-M7600QE | |
| AIDA64 / Memory Read | |
| Average of class Multimedia (11624 - 174586, n=53, last 2 years) | |
| Lenovo ThinkBook 16 G4+ IAP | |
| Acer Swift X SFX16-52G-77RX | |
| HP Envy 16 h0112nr | |
| Acer Swift X SFX16-52G-52VE | |
| Dell Inspiron 16 Plus 7620 | |
| Average Intel Core i7-1260P (24983 - 72065, n=25) | |
| Acer Swift X SFX16-51G-5388 | |
| Asus Vivobook Pro 16X-M7600QE | |
| Asus Vivobook Pro 16X-M7600QE | |
| Lenovo IdeaPad 5 Pro 16ARH7 | |
| AIDA64 / Memory Write | |
| Lenovo IdeaPad 5 Pro 16ARH7 | |
| Average of class Multimedia (11755 - 134998, n=53, last 2 years) | |
| Acer Swift X SFX16-51G-5388 | |
| Acer Swift X SFX16-52G-77RX | |
| HP Envy 16 h0112nr | |
| Acer Swift X SFX16-52G-52VE | |
| Lenovo ThinkBook 16 G4+ IAP | |
| Dell Inspiron 16 Plus 7620 | |
| Average Intel Core i7-1260P (23512 - 66799, n=25) | |
| Asus Vivobook Pro 16X-M7600QE | |
| Asus Vivobook Pro 16X-M7600QE | |
| AIDA64 / Memory Latency | |
| Average of class Multimedia (7 - 535, n=52, last 2 years) | |
| Lenovo IdeaPad 5 Pro 16ARH7 | |
| Acer Swift X SFX16-51G-5388 | |
| Acer Swift X SFX16-52G-77RX | |
| Lenovo ThinkBook 16 G4+ IAP | |
| Acer Swift X SFX16-52G-52VE | |
| Dell Inspiron 16 Plus 7620 | |
| HP Envy 16 h0112nr | |
| Average Intel Core i7-1260P (77.9 - 118.4, n=21) | |
| Asus Vivobook Pro 16X-M7600QE | |
| Asus Vivobook Pro 16X-M7600QE | |
* ... smaller is better
DPC Latencies
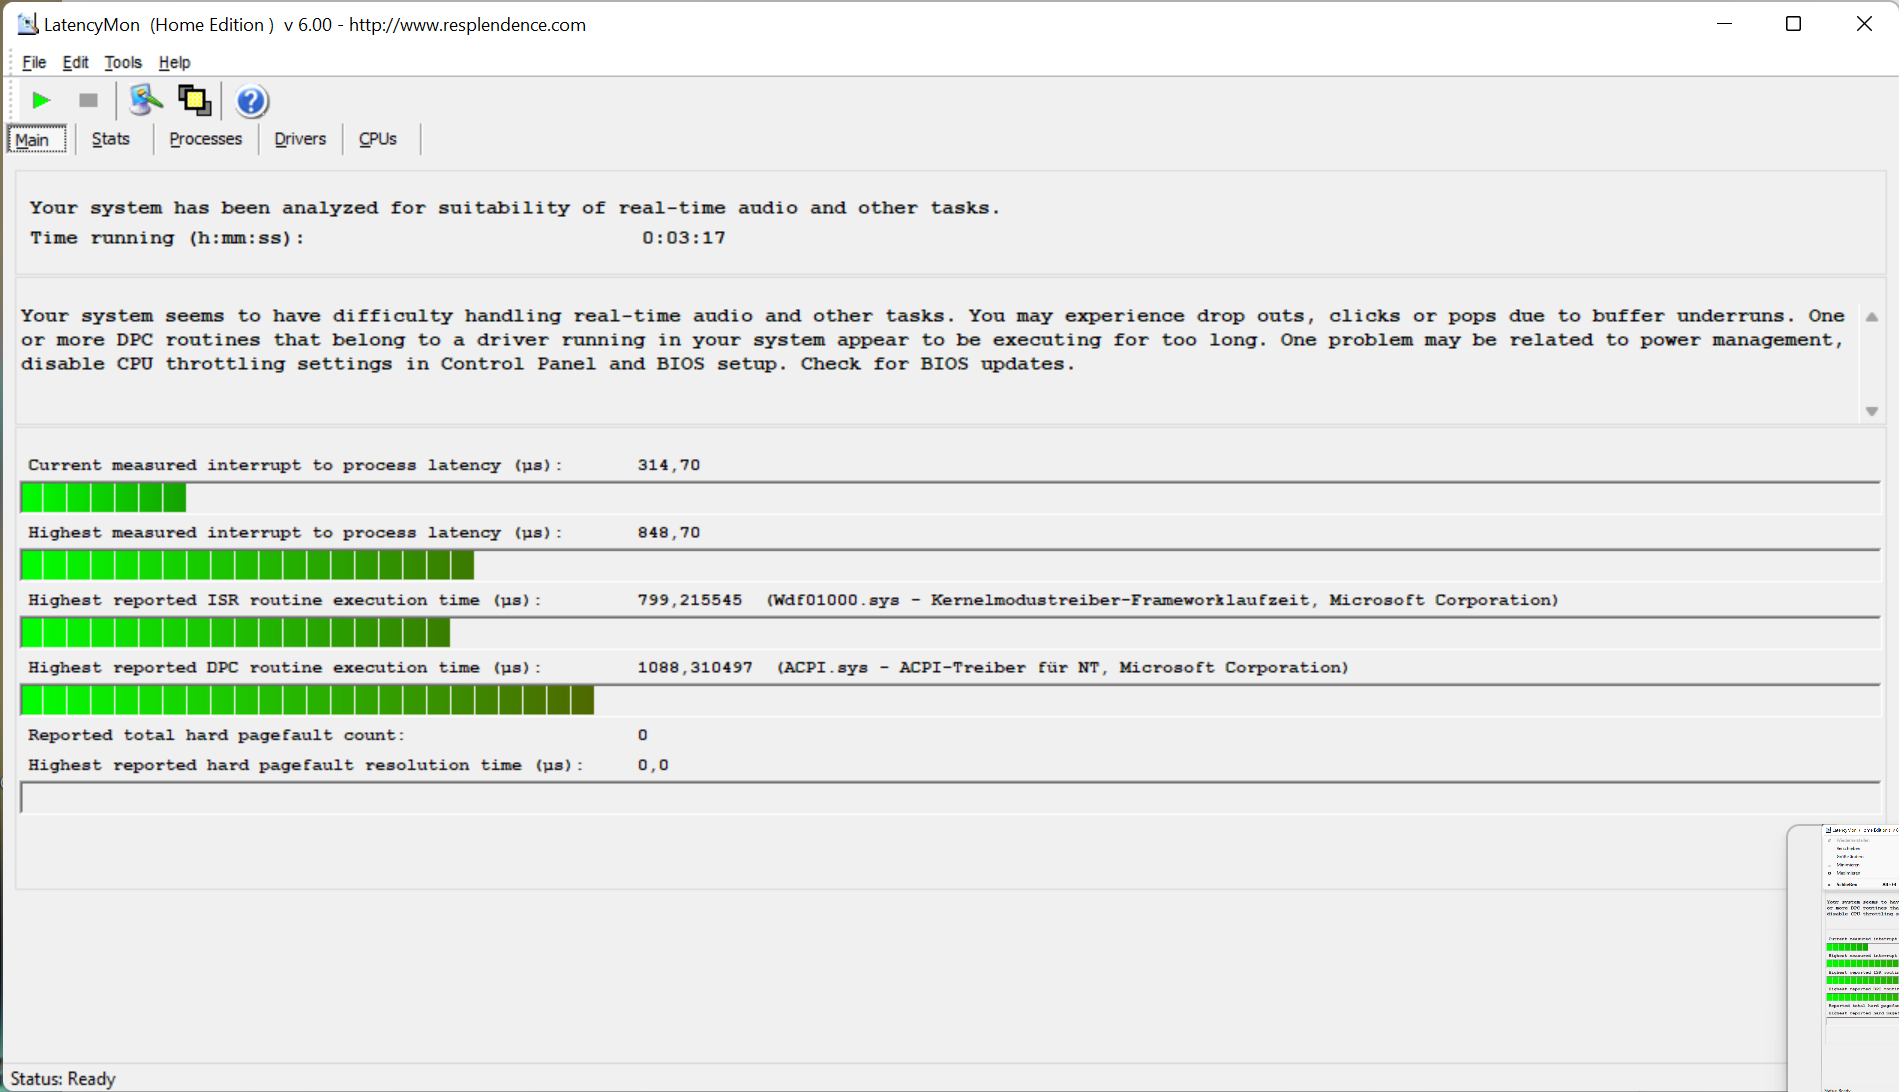
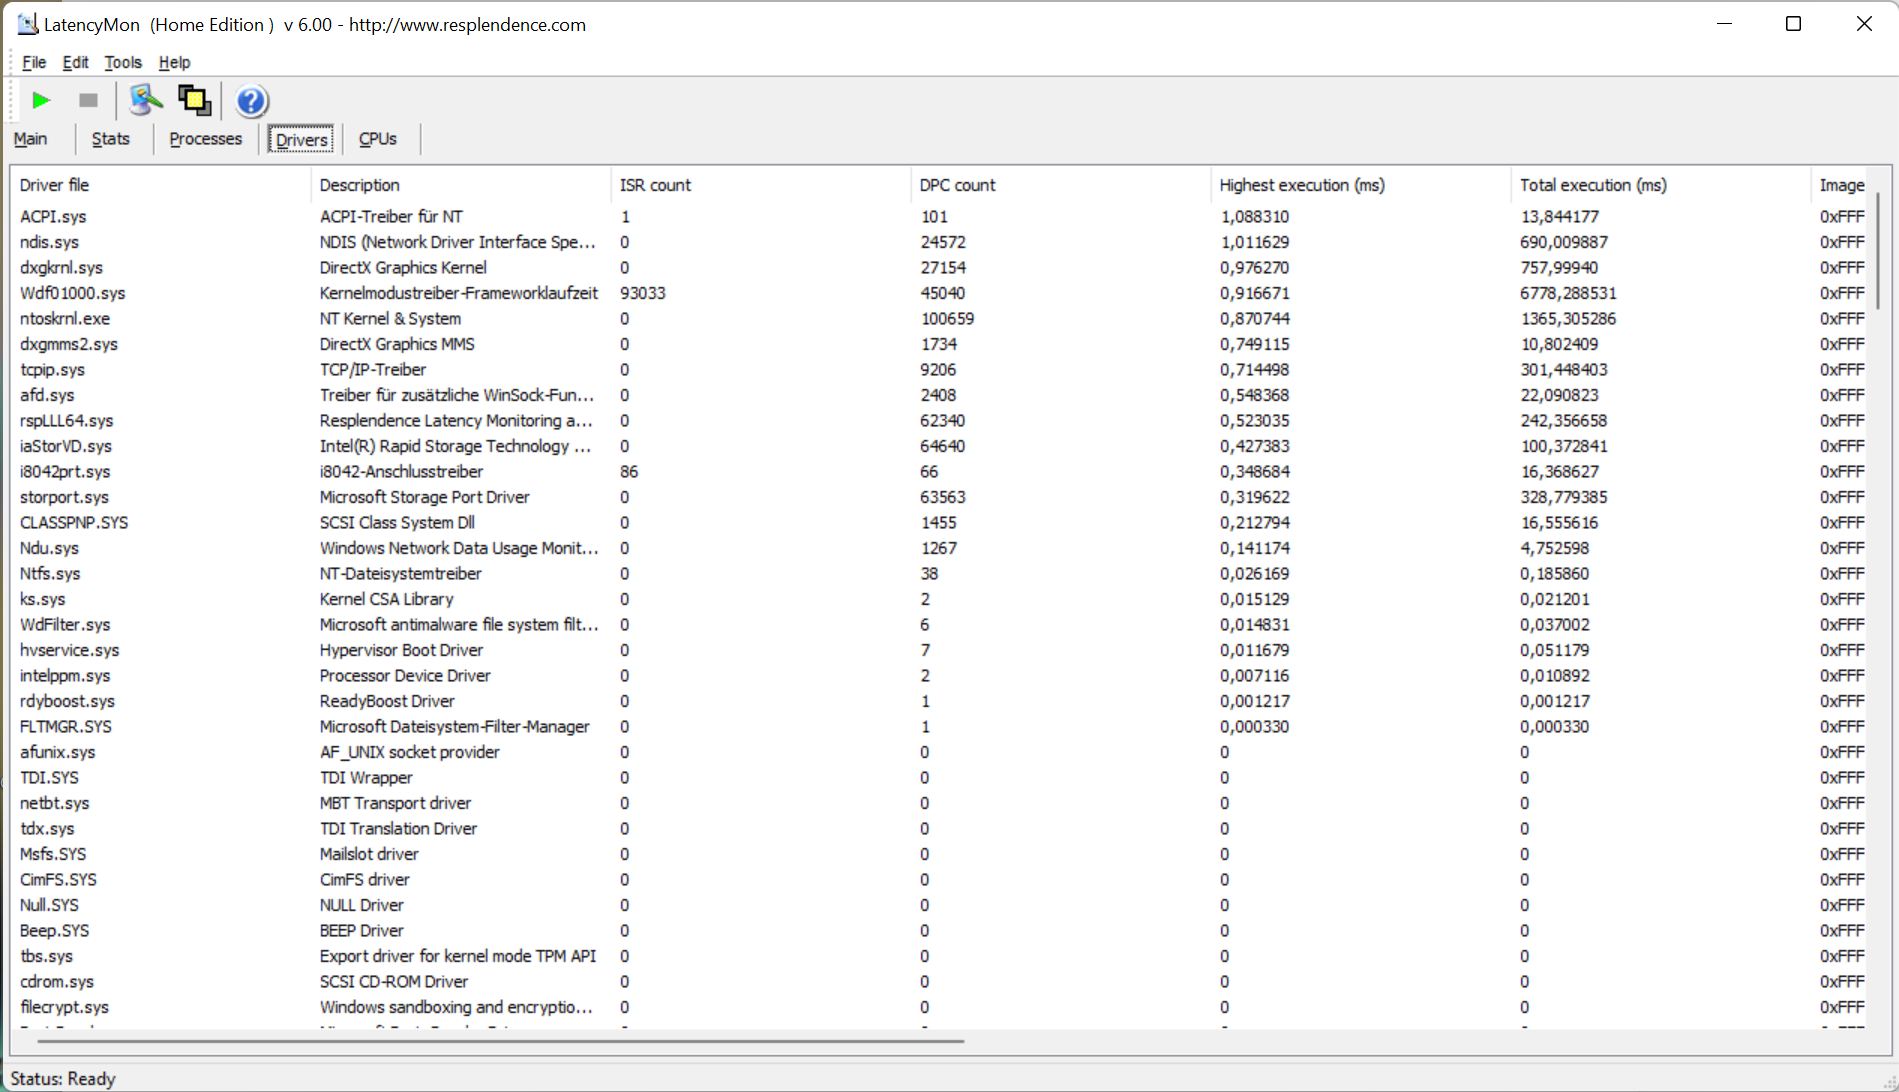
| DPC Latencies / LatencyMon - interrupt to process latency (max), Web, Youtube, Prime95 | |
| Acer Swift X SFX16-51G-5388 | |
| Lenovo ThinkBook 16 G4+ IAP | |
| Asus Vivobook Pro 16X-M7600QE | |
| Acer Swift X SFX16-52G-52VE | |
| Dell Inspiron 16 Plus 7620 | |
| HP Envy 16 h0112nr | |
| Acer Swift X SFX16-52G-77RX | |
| Lenovo IdeaPad 5 Pro 16ARH7 | |
* ... smaller is better
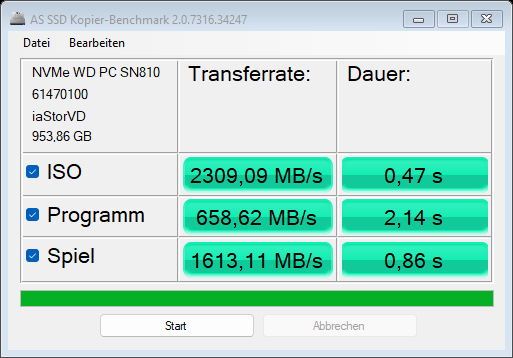
Storage Solution
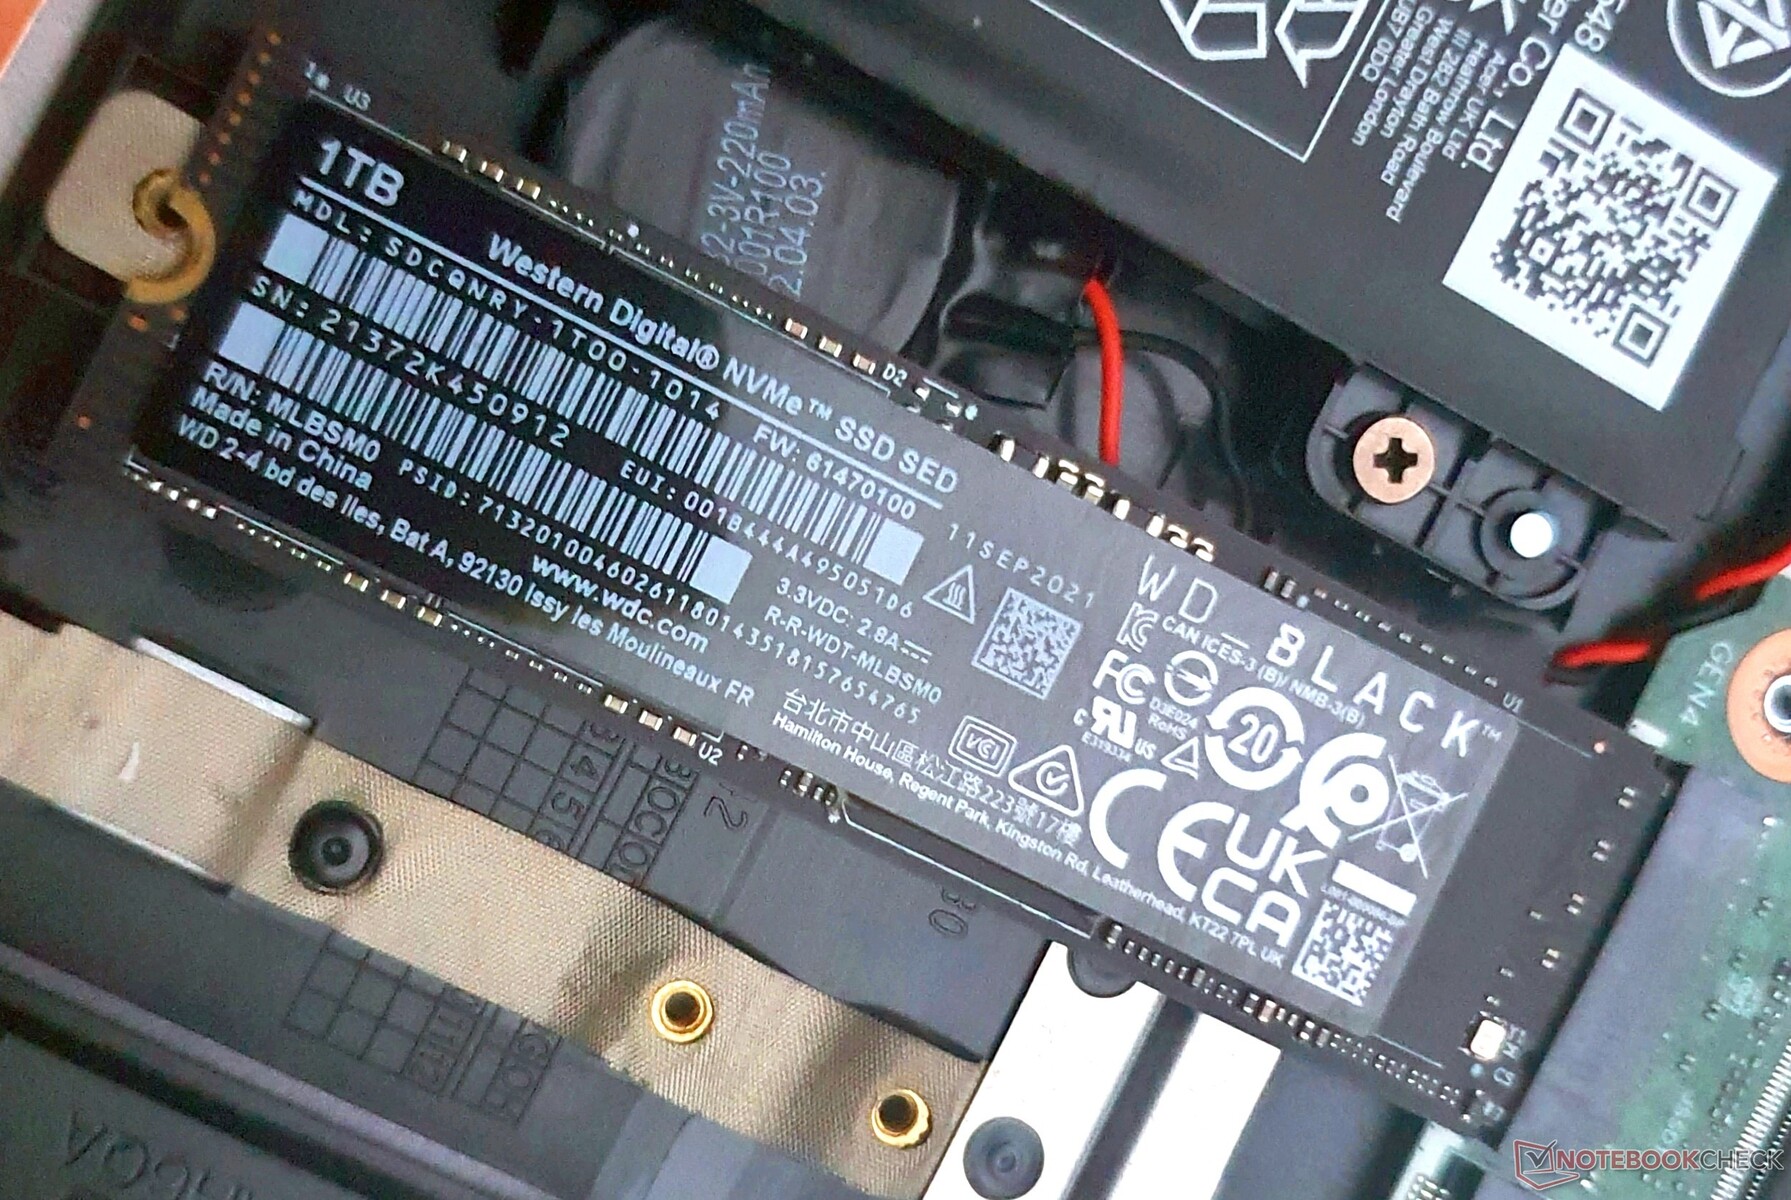
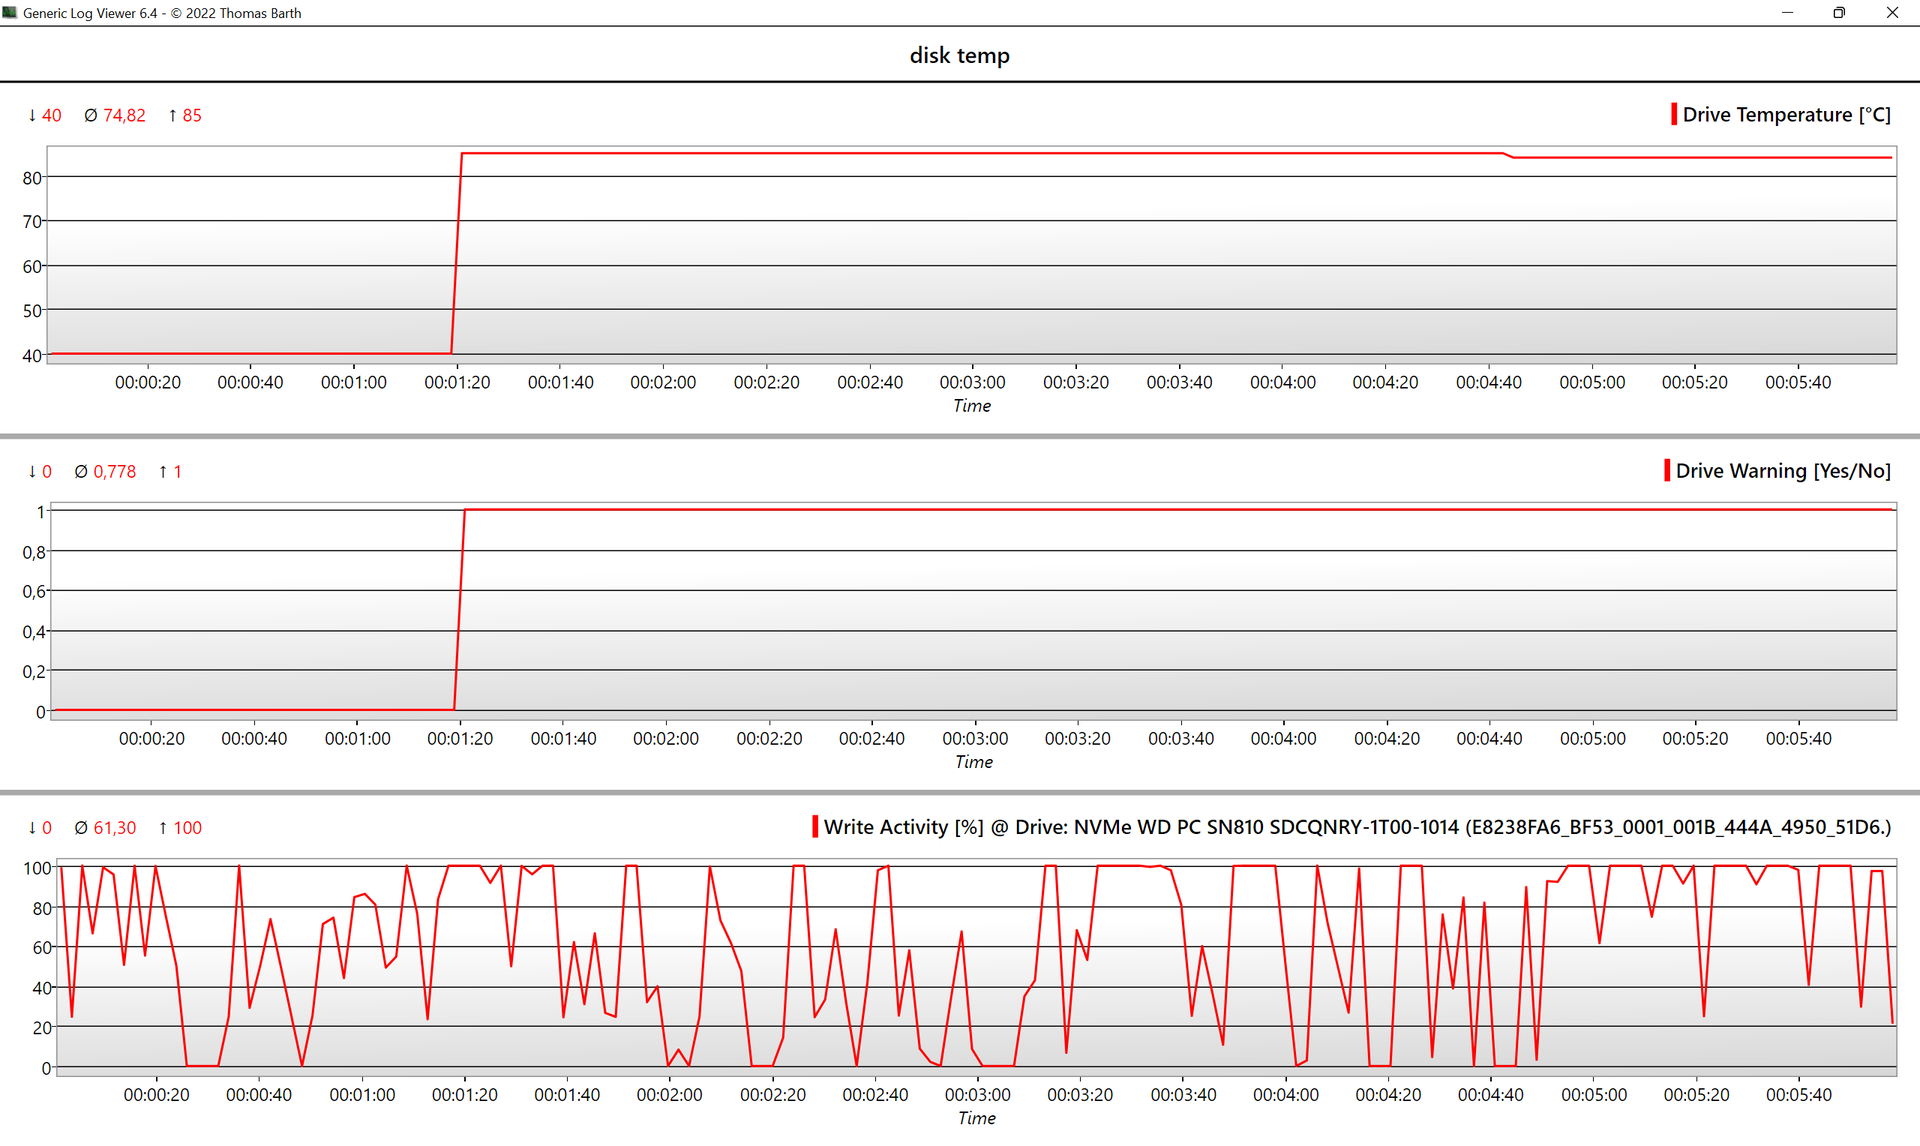
With its very high transfer rates, the 1-TB SSD from Western Digital does justice to the PCIe 4.0 standard.
While the direct predecessor of the Acer Swift X places at the bottom of our SSD performance ratings, this year's model is able to place at the very top leaving some distance to the next models.
The sibling model with a 512-GB SSD is also surpassed significantly. However, the SSDs in both models are throttled heavily due to overheating.
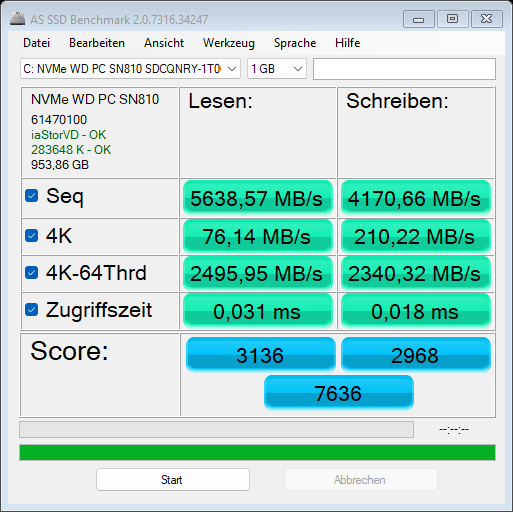
| Acer Swift X SFX16-52G-77RX WDC PC SN810 1TB | Acer Swift X SFX16-52G-52VE Micron 3400 MTFDKBA512TFH 512GB | Acer Swift X SFX16-51G-5388 Samsung PM991 MZVLQ512HBLU | Lenovo ThinkBook 16 G4+ IAP Micron 2450 1TB MTFDKCD1T0TFK | Dell Inspiron 16 Plus 7620 Kioxia BG5 KBG50ZNS512G | Lenovo IdeaPad 5 Pro 16ARH7 Samsung PM9A1 MZVL2512HCJQ | |
|---|---|---|---|---|---|---|
| AS SSD | -39% | -55% | -70% | -69% | -53% | |
| Seq Read (MB/s) | 5639 | 3200 -43% | 2744.12 -51% | 2825 -50% | 2693.29 -52% | 4687.88 -17% |
| Seq Write (MB/s) | 4171 | 3430 -18% | 1559.79 -63% | 1852 -56% | 1683.46 -60% | 2697.07 -35% |
| 4K Read (MB/s) | 76.1 | 63.1 -17% | 51.41 -32% | 58.44 -23% | 65.01 -15% | 61.12 -20% |
| 4K Write (MB/s) | 210.2 | 141.6 -33% | 156.13 -26% | 227.47 8% | 197.81 -6% | 125.7 -40% |
| 4K-64 Read (MB/s) | 2496 | 1354 -46% | 1014.34 -59% | 954.65 -62% | 855.48 -66% | 827.56 -67% |
| 4K-64 Write (MB/s) | 2340 | 1802 -23% | 940.2 -60% | 2413.44 3% | 395.8 -83% | 1884.06 -19% |
| Access Time Read * (ms) | 0.031 | 0.064 -106% | 0.073 -135% | 0.026 16% | 0.078 -152% | 0.073 -135% |
| Access Time Write * (ms) | 0.018 | 0.026 -44% | 0.028 -56% | 0.131 -628% | 0.06 -233% | 0.04 -122% |
| Score Read (Points) | 3136 | 1737 -45% | 1340 -57% | 1296 -59% | 1190 -62% | 1357 -57% |
| Score Write (Points) | 2968 | 2287 -23% | 1252 -58% | 2826 -5% | 762 -74% | 2279 -23% |
| Score Total (Points) | 7636 | 4936 -35% | 3229 -58% | 4750 -38% | 2529 -67% | 4247 -44% |
| Copy ISO MB/s (MB/s) | 2309 | 1363.82 -41% | 2155.05 -7% | 1634.1 -29% | ||
| Copy Program MB/s (MB/s) | 658.6 | 433.2 -34% | 414.57 -37% | 379.46 -42% | ||
| Copy Game MB/s (MB/s) | 1613 | 1055.69 -35% | 1055.89 -35% | 1174.45 -27% | ||
| DiskSpd | -25% | -71% | -50% | -56% | -40% | |
| seq read (MB/s) | 4206 | 2619 -38% | 1248 -70% | 2124 -50% | 2355 -44% | 3304 -21% |
| seq write (MB/s) | 5015 | 3900 -22% | 790 -84% | 2677 -47% | 2020 -60% | 2744 -45% |
| seq q8 t1 read (MB/s) | 6940 | 6439 -7% | 1655 -76% | 3377 -51% | 2569 -63% | 6708 -3% |
| seq q8 t1 write (MB/s) | 5031 | 3911 -22% | 871 -83% | 3241 -36% | 2752 -45% | 4857 -3% |
| 4k q32 t16 read (MB/s) | 2605 | 1522 -42% | 778 -70% | 923 -65% | 652 -75% | 824 -68% |
| 4k q32 t16 write (MB/s) | 2780 | 2390 -14% | 640 -77% | 501 -82% | 408 -85% | 299 -89% |
| 4k q1 t1 read (MB/s) | 88 | 65.3 -26% | 43.2 -51% | 61.2 -30% | 62.7 -29% | 63.4 -28% |
| 4k q1 t1 write (MB/s) | 305 | 208 -32% | 123.5 -60% | 187.8 -38% | 162.6 -47% | 125.7 -59% |
| Total Average (Program / Settings) | -32% /
-33% | -63% /
-61% | -60% /
-62% | -63% /
-64% | -47% /
-47% |
* ... smaller is better
* ... smaller is better
Constant Performance Reading: DiskSpd Read Loop, Queue Depth 8
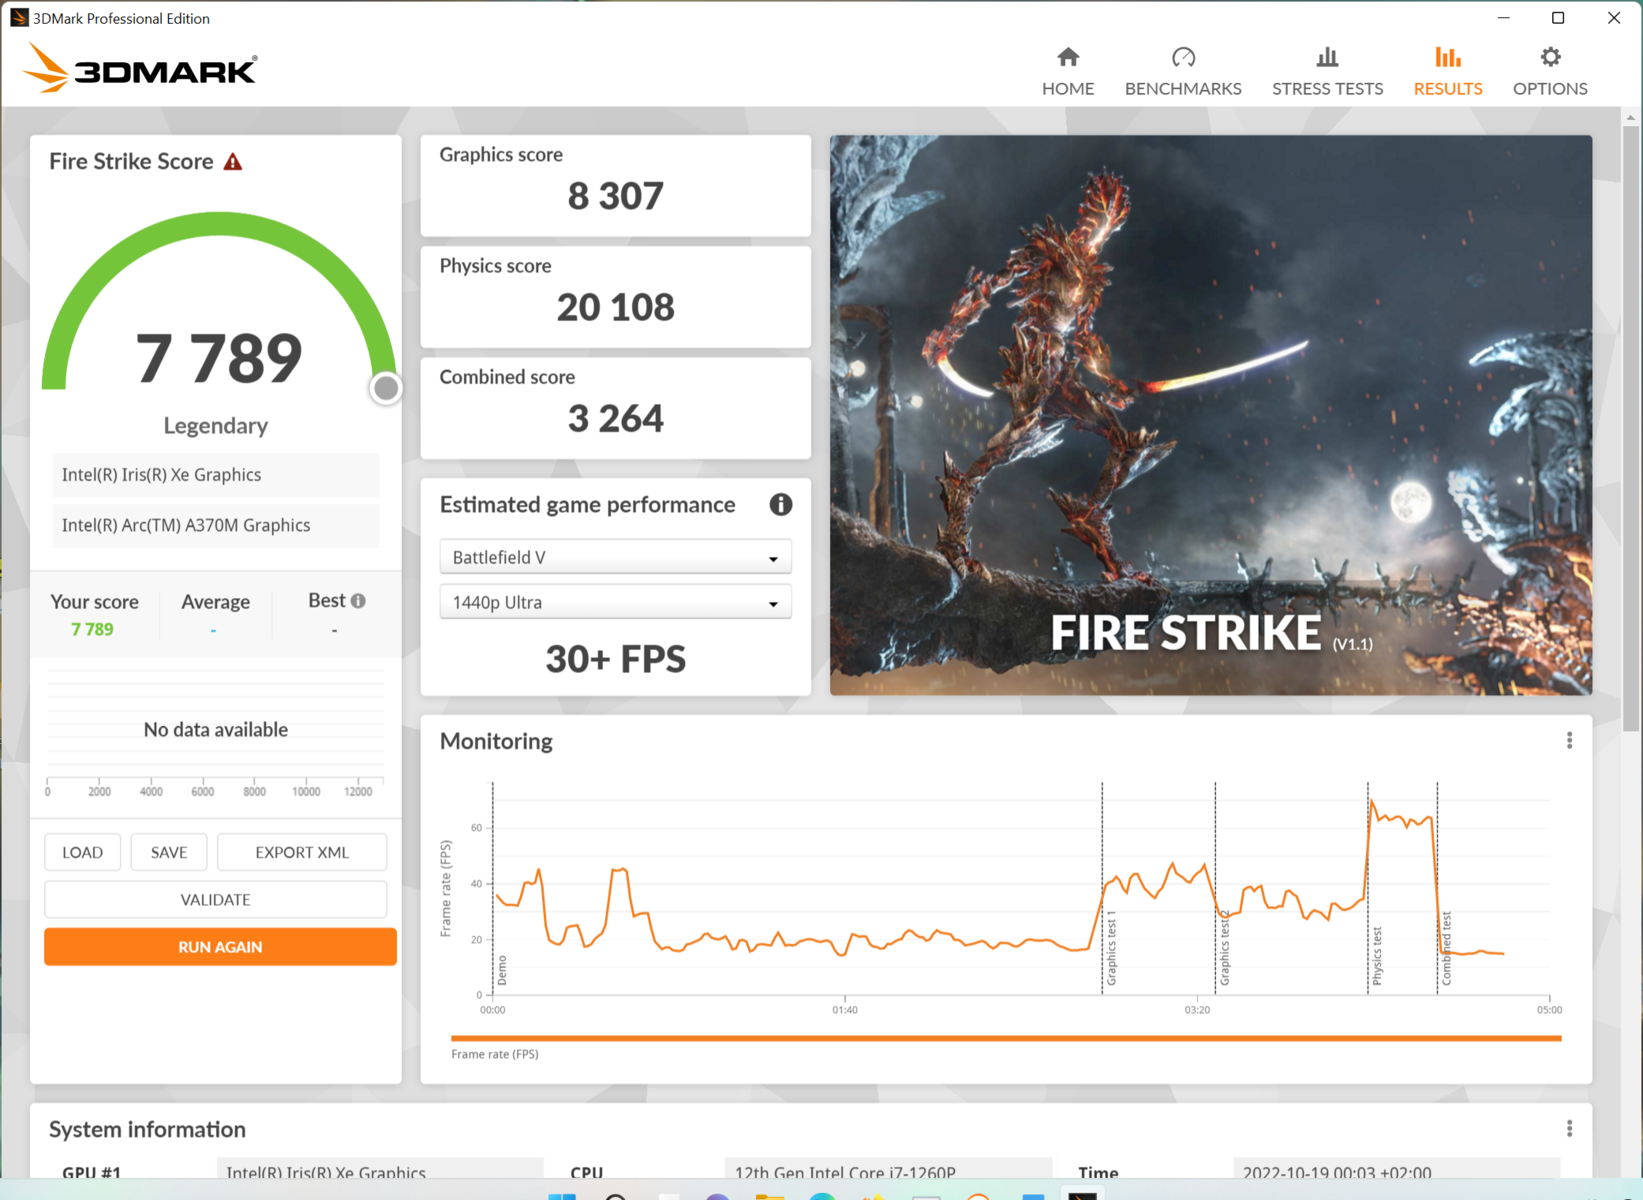
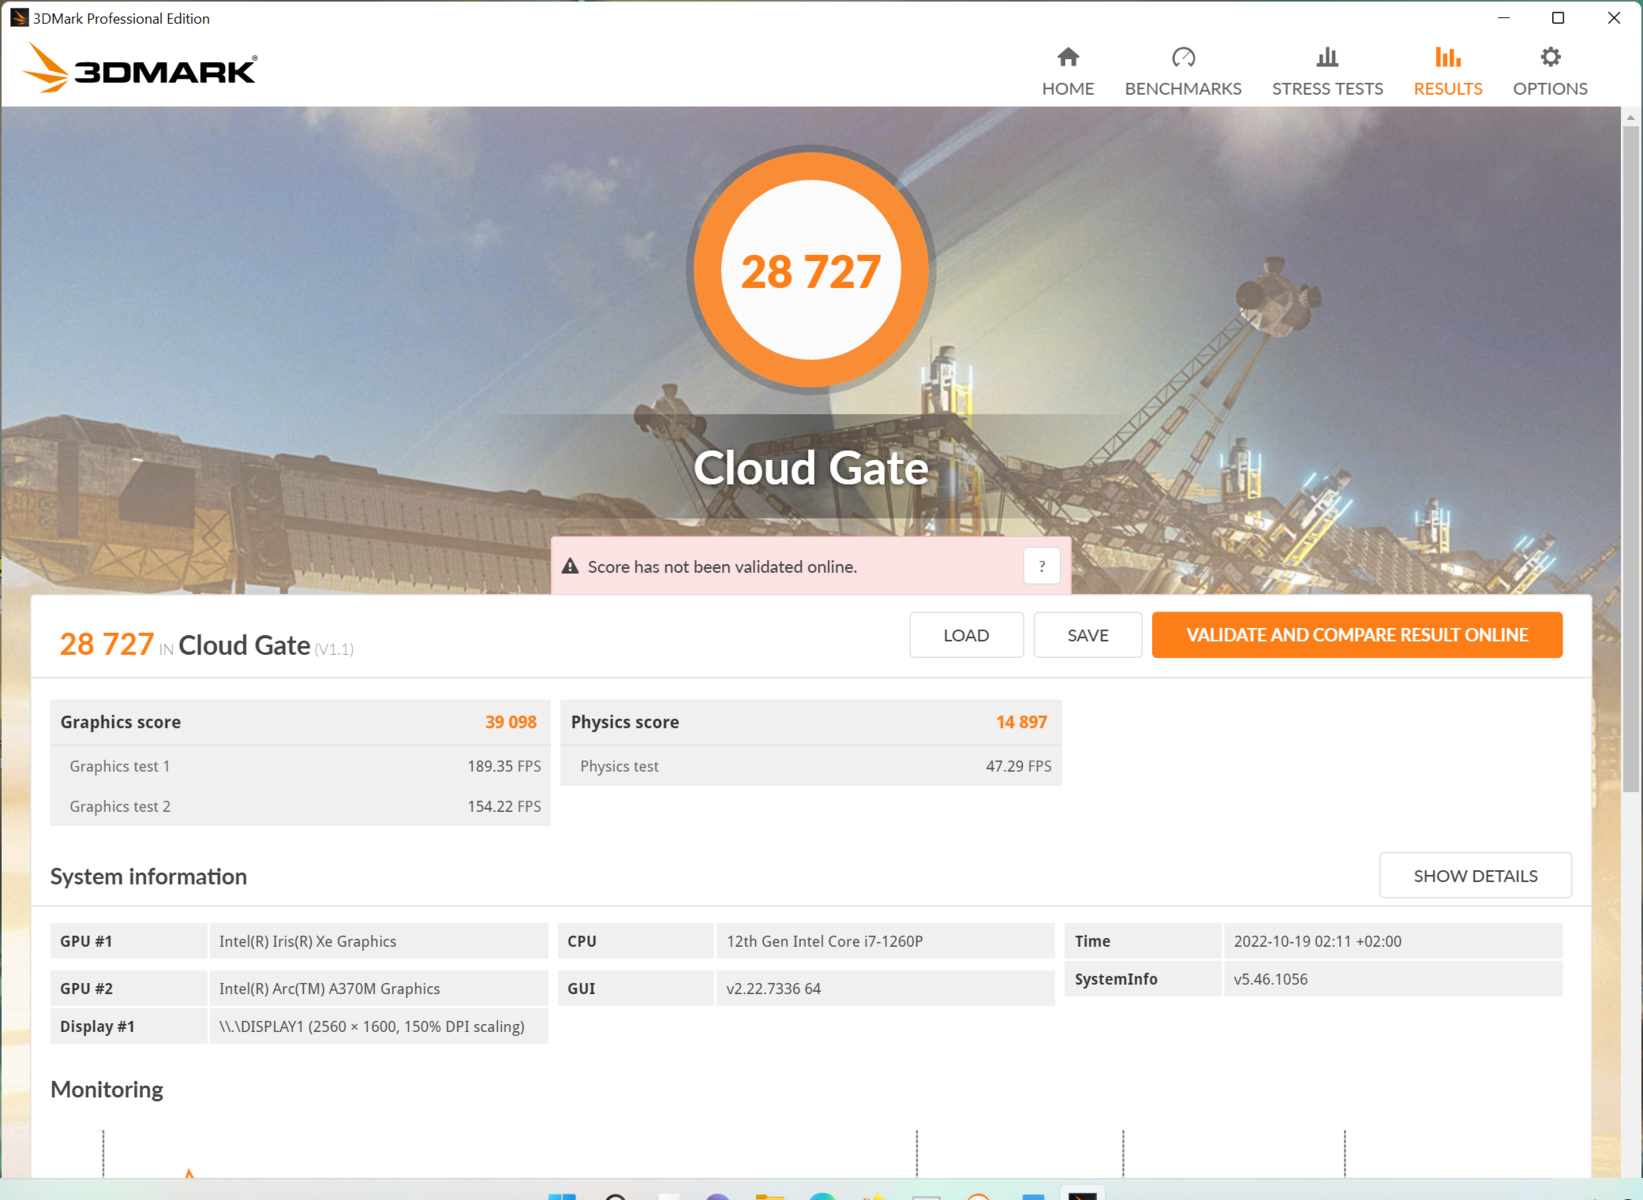
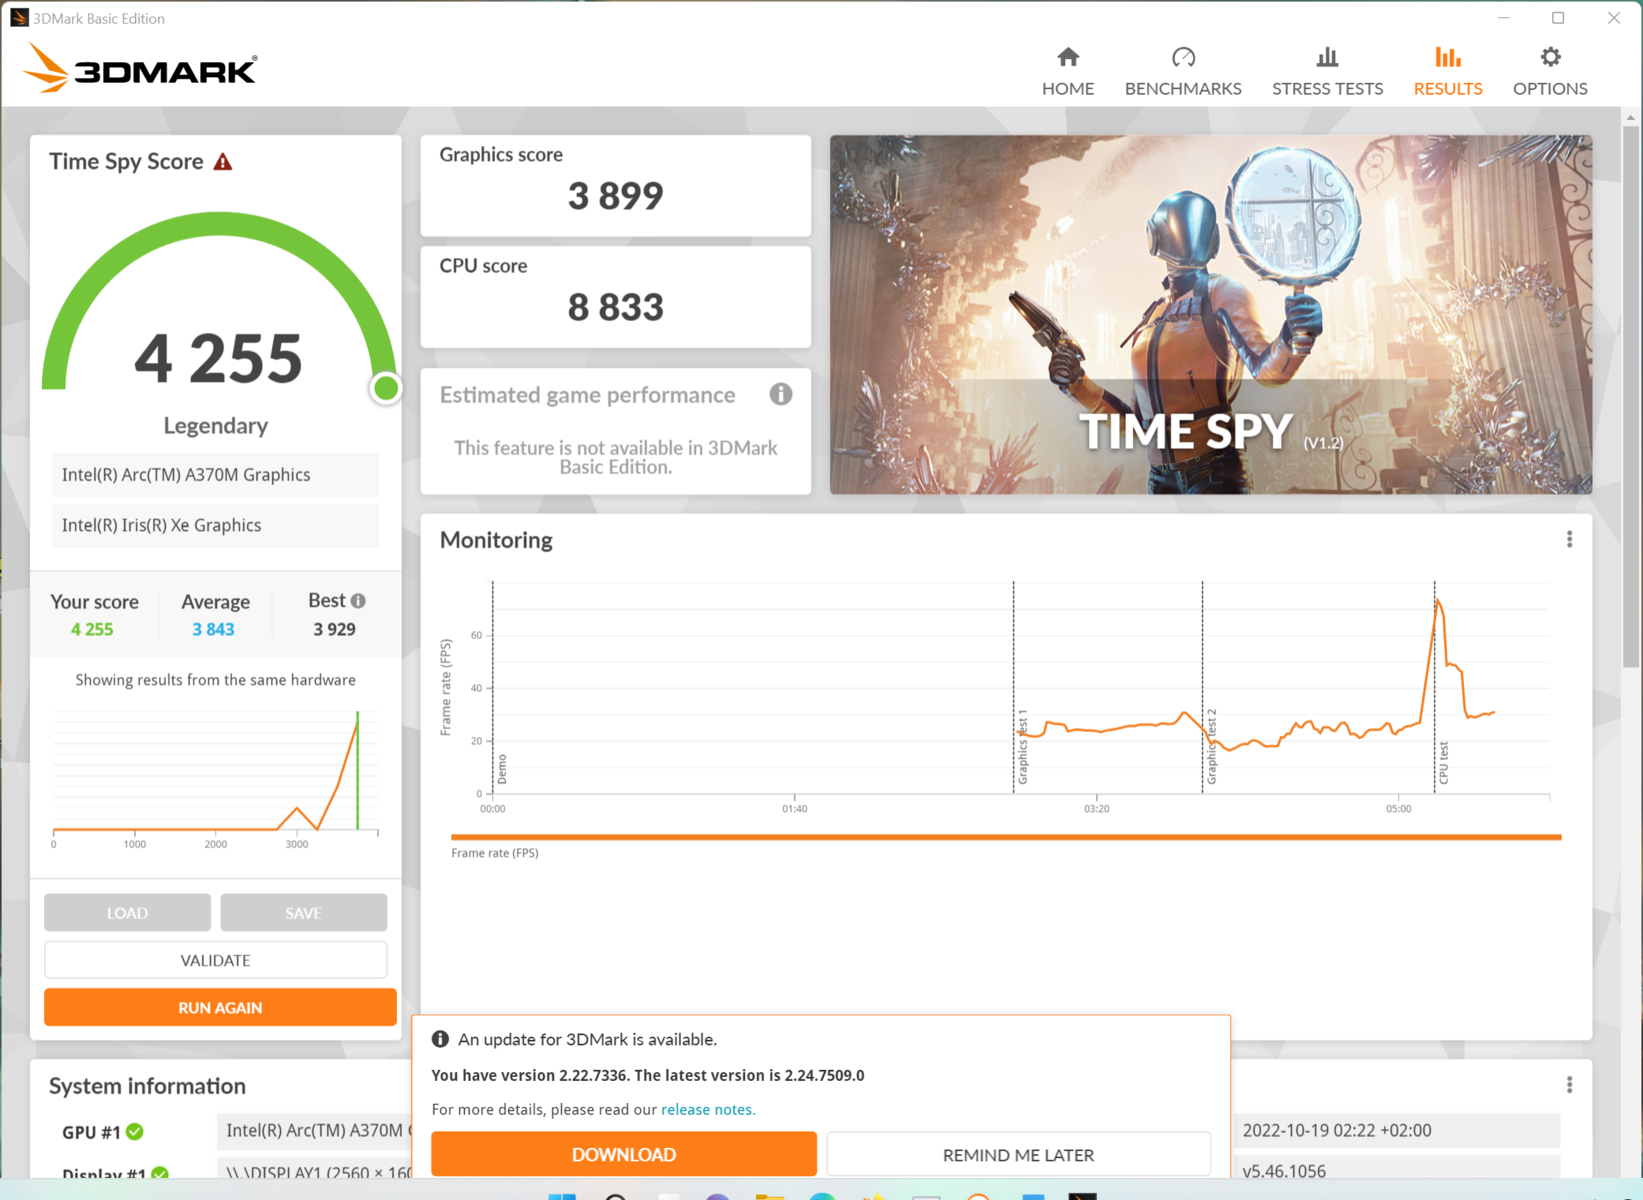
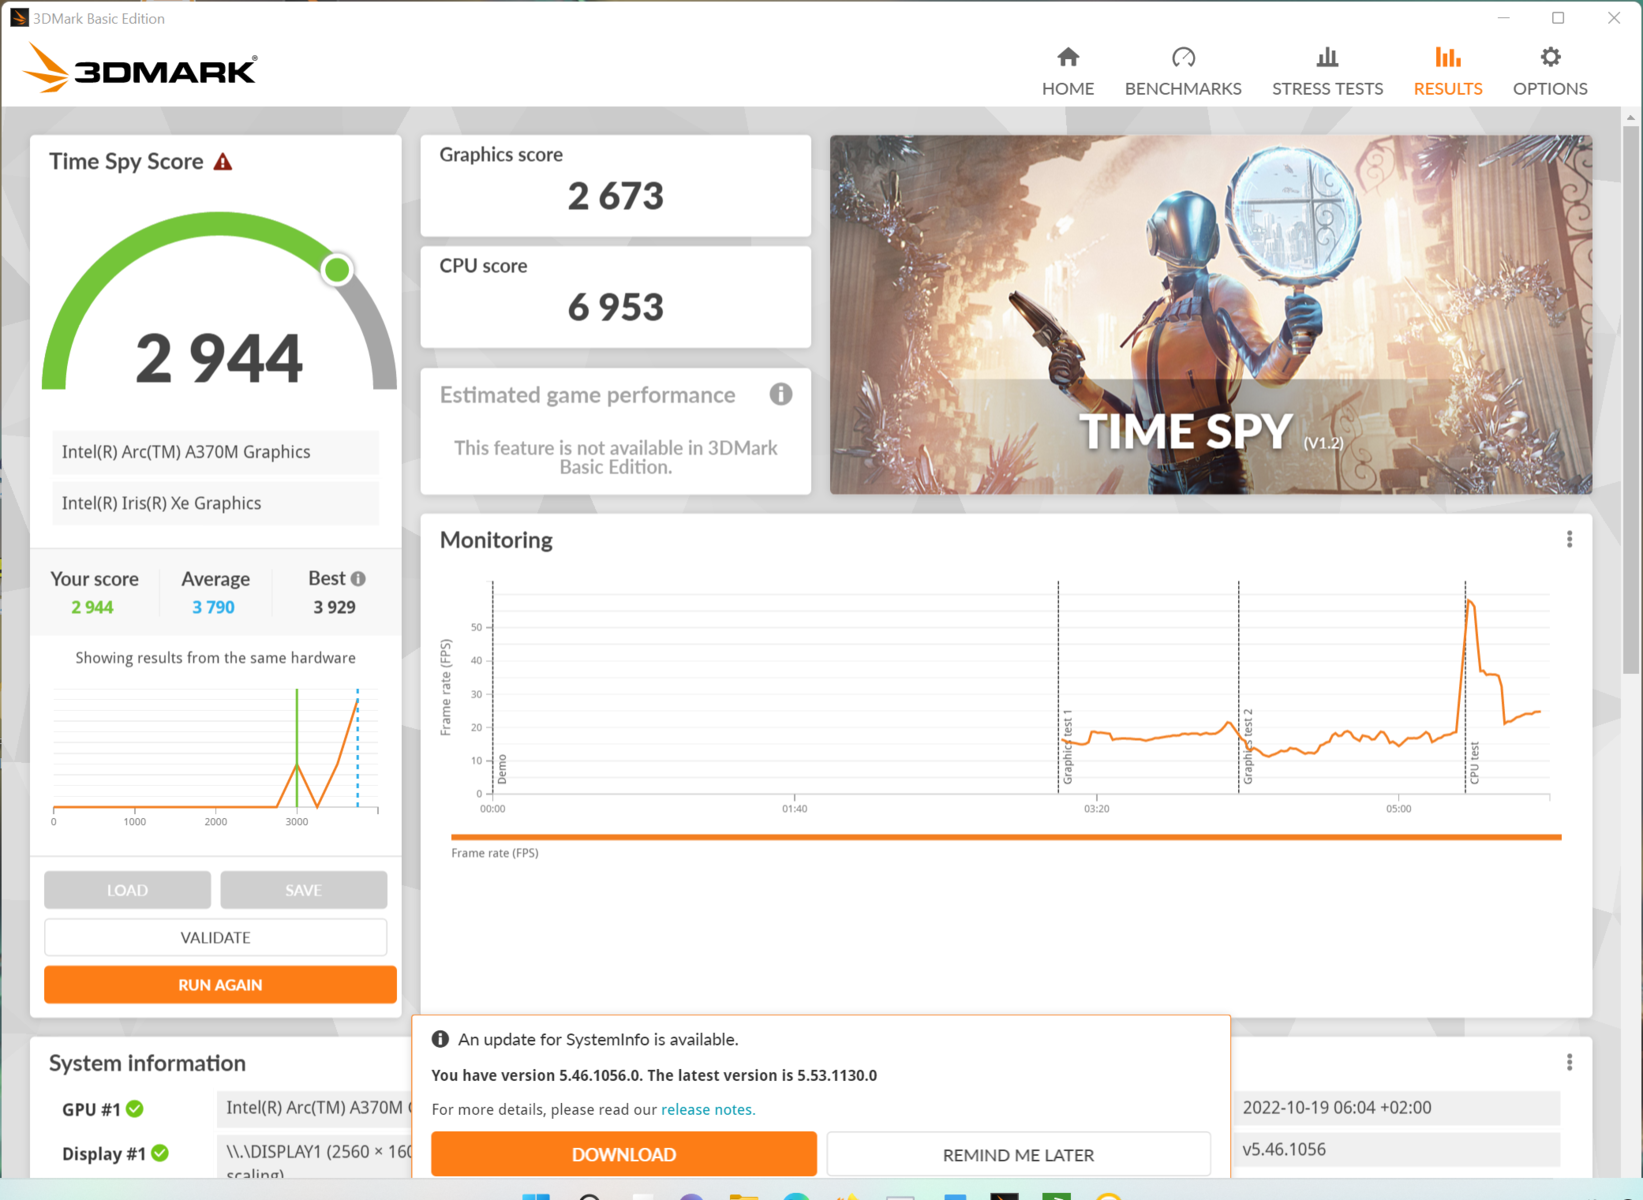
Graphics Card
The Intel Arc A370M used here is the variant with the lowest TGP of 35 watts. On average, the RTX 3050 in the predecessor model and the Asus Vivobook Pro 16X is about 50% faster in the synthetic benchmarks. In the workstation related 3D benchmarks, this can quickly become up to 150 or 200%. The synthetic performance of an integrated AMD Radeon 680M lies about at the level of the Arc A370M.
In battery operation, the graphics performance is reduced by an additional 30%.
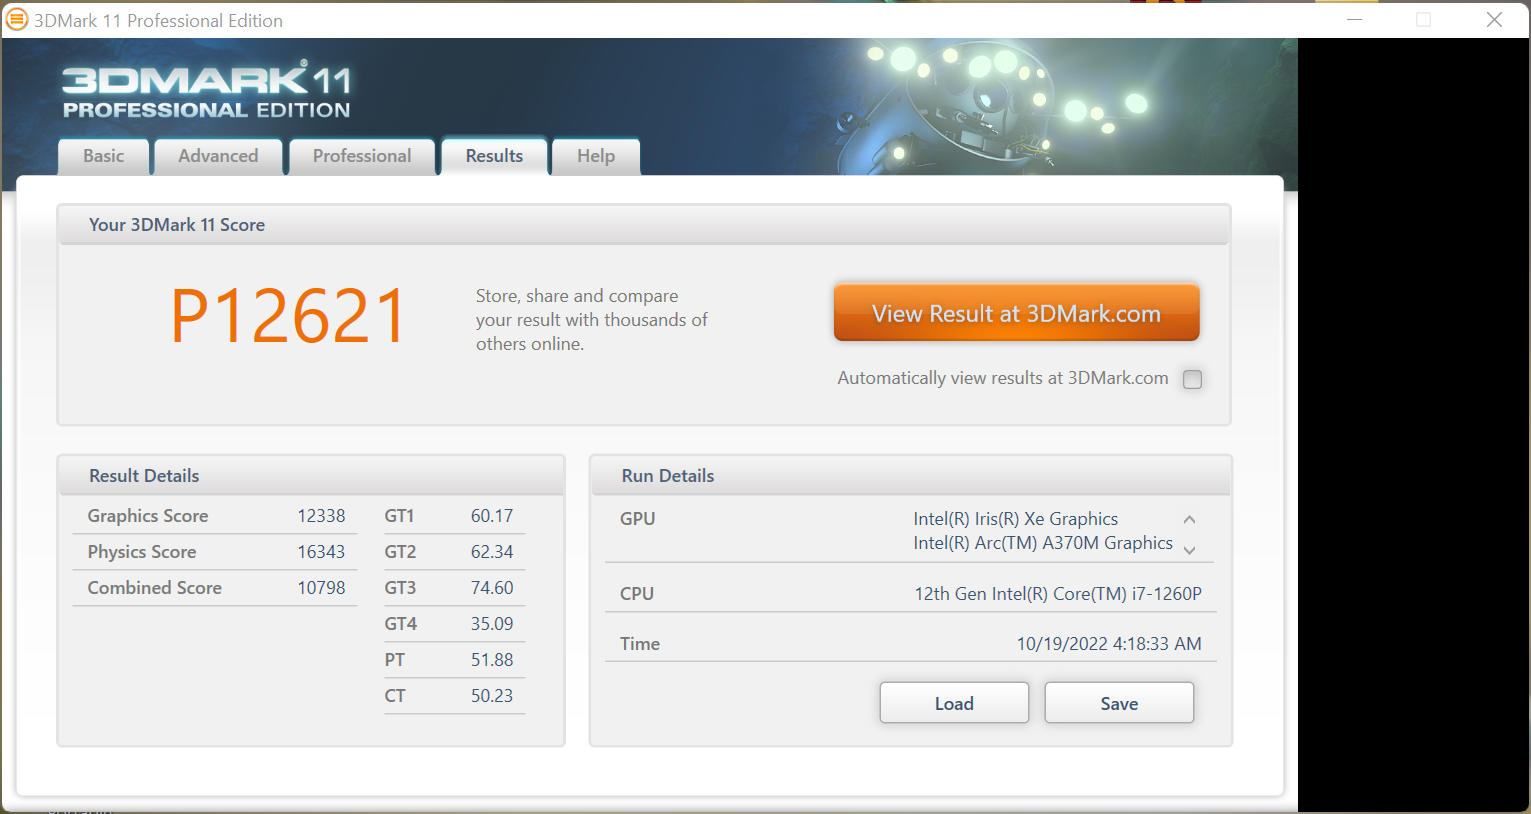
| 3DMark 11 Performance | 12621 points | |
| 3DMark Cloud Gate Standard Score | 28727 points | |
| 3DMark Fire Strike Score | 7789 points | |
| 3DMark Time Spy Score | 4255 points | |
Help | ||
| Blender | |
| v3.3 Classroom oneAPI/Intel | |
| Acer Swift X SFX16-52G-77RX | |
| v3.3 Classroom HIP/AMD | |
| Lenovo ThinkPad T14 G3-21CF004NGE | |
| v3.3 Classroom CUDA | |
| HP ZBook Firefly 14 G9-6B8A2EA | |
| Acer Swift X SFX16-51G-5388 | |
| HP Envy 16 h0112nr | |
| Dell Inspiron 16 Plus 7620 | |
| v3.3 Classroom CPU | |
| HP ZBook Firefly 14 G9-6B8A2EA | |
| Acer Swift X SFX16-51G-5388 | |
| Acer Swift X SFX16-52G-77RX | |
| Acer Swift X SFX16-52G-52VE | |
| Lenovo ThinkPad T14 G3-21CF004NGE | |
| HP Envy 16 h0112nr | |
| Dell Inspiron 16 Plus 7620 | |
* ... smaller is better
Gaming Performance
In games, the Intel Arc A370M is surpassed by 60% by the RTX 3050 Ti in the Vivobook Pro 16X, and by about 100% by the Dell Inspiron 16. In some games, this advantage becomes extreme at 200 to 300%, which is due to some insufficient driver optimizations of the still fairly young graphics unit.
The GeForce RTX 3060 in the HP Envy 16 is about 3 times faster in almost any case, and an integrated Radeon 680M is only surpassed by 10 to 20%.
If you select a lower resolution (Full HD) than the native QHD+ and leave the details at medium to high, most games can be displayed smoothly. However, in modern games high detail levels are then only rarely possible.
| The Witcher 3 - 1920x1080 High Graphics & Postprocessing (Nvidia HairWorks Off) | |
| HP Envy 16 h0112nr | |
| Dell Inspiron 16 Plus 7620 | |
| Lenovo ThinkBook 16 G4+ IAP | |
| Average of class Multimedia (22 - 157, n=5, last 2 years) | |
| Acer Swift X SFX16-51G-5388 | |
| Acer Swift X SFX16-52G-77RX | |
| Lenovo IdeaCentre AIO 3 24IAP7 | |
| Acer Swift X SFX16-52G-52VE | |
| Lenovo IdeaPad 5 Pro 16ARH7 | |
| Shadow of the Tomb Raider | |
| 1920x1080 High Preset AA:SM | |
| Average of class Multimedia (26 - 143, n=8, last 2 years) | |
| Average Intel Arc A370M (39 - 42, n=2) | |
| Acer Swift X SFX16-52G-77RX | |
| 1920x1080 Highest Preset AA:T | |
| Average of class Multimedia (23 - 129, n=8, last 2 years) | |
| Acer Swift X SFX16-52G-77RX | |
| Average Intel Arc A370M (n=1) | |
| God of War | |
| 1920x1080 Original Preset | |
| Acer Swift X SFX16-52G-77RX | |
| Average Intel Arc A370M (30 - 31.8, n=3) | |
| Acer Swift X SFX16-52G-52VE | |
| Lenovo IdeaPad 5 Pro 16ARH7 | |
| 1920x1080 High Preset | |
| Acer Swift X SFX16-52G-77RX | |
| Average Intel Arc A370M (24 - 25.6, n=3) | |
| Acer Swift X SFX16-52G-52VE | |
| Lenovo IdeaPad 5 Pro 16ARH7 | |
| GRID Legends | |
| 1920x1080 Ultra Preset | |
| Acer Swift X SFX16-52G-77RX | |
| Average Intel Arc A370M (41.7 - 41.9, n=2) | |
| Acer Swift X SFX16-52G-52VE | |
| 2560x1440 Ultra Preset | |
| Acer Swift X SFX16-52G-77RX | |
| Average Intel Arc A370M (31.3 - 34.4, n=2) | |
| Acer Swift X SFX16-52G-52VE | |
The Witcher 3 FPS Chart
| low | med. | high | ultra | QHD | 4K | |
|---|---|---|---|---|---|---|
| GTA V (2015) | 148.6 | 136.9 | 41.4 | 16.4 | 11 | |
| The Witcher 3 (2015) | 168.8 | 100 | 53 | 26.3 | ||
| Dota 2 Reborn (2015) | 99.1 | 83.5 | 68.4 | 66.3 | 39.5 | |
| Final Fantasy XV Benchmark (2018) | 70.4 | 37.9 | 26.3 | 19.3 | ||
| X-Plane 11.11 (2018) | 34.7 | 27.8 | 24 | 22.2 | ||
| Far Cry 5 (2018) | 90 | 49 | 46 | 43 | 29 | |
| Strange Brigade (2018) | 175.8 | 73.2 | 61.4 | 52.1 | ||
| Shadow of the Tomb Raider (2018) | 67 | 49 | 39 | 32 | 20 | |
| God of War (2022) | 35.8 | 31.8 | 25.6 | 20.4 | 12.4 | |
| GRID Legends (2022) | 95.6 | 69.4 | 55 | 41.9 | 34.4 |
Emissions: The Acer Swift X 16 likes to blow a lot of air
Noise Emissions
The fans are loudest in Performance mode and also run most of the time under very low load.
In Normal mode, they run quieter and are at least hardly noticeable under low load. But this also changes again under slightly higher load.
In Silent mode, the fans remain turned off significantly more often, but they also start running already under CPU loads of only about 10%, for example when you download a Steam game.
At 44.7 dB(A) on average, the fans aren't really quiet under heavier load either. The 36.5 dB(A) of the Core-i5 model are significantly quieter.
However, all the other devices in our test field are similarly loud under load. While charging, we hear some electronic noises near the USB-C port from time to time.
Noise level
| Idle |
| 25 / 25 / 25 dB(A) |
| Load |
| 44.7 / 45.6 dB(A) |
 | ||
30 dB silent 40 dB(A) audible 50 dB(A) loud |
||
min: | ||
| Acer Swift X SFX16-52G-77RX A370M, i7-1260P, WDC PC SN810 1TB | Acer Swift X SFX16-52G-52VE A370M, i5-1240P, Micron 3400 MTFDKBA512TFH 512GB | Lenovo ThinkBook 16 G4+ IAP GeForce RTX 2050 Mobile, i7-12700H, Micron 2450 1TB MTFDKCD1T0TFK | Dell Inspiron 16 Plus 7620 GeForce RTX 3050 Ti Laptop GPU, i7-12700H, Kioxia BG5 KBG50ZNS512G | HP Envy 16 h0112nr GeForce RTX 3060 Laptop GPU, i7-12700H, Micron 3400 1TB MTFDKBA1T0TFH | Asus Vivobook Pro 16X-M7600QE GeForce RTX 3050 Ti Laptop GPU, R9 5900HX, SK Hynix HFM001TD3JX013N | |
|---|---|---|---|---|---|---|
| Noise | 3% | 1% | -6% | -1% | -4% | |
| off / environment * (dB) | 25 | 25 -0% | 24.2 3% | 23.3 7% | 22.8 9% | 26 -4% |
| Idle Minimum * (dB) | 25 | 25 -0% | 24.2 3% | 25.7 -3% | 22.9 8% | 27 -8% |
| Idle Average * (dB) | 25 | 25 -0% | 24.2 3% | 26.1 -4% | 22.9 8% | 27 -8% |
| Idle Maximum * (dB) | 25 | 26.4 -6% | 24.2 3% | 30.6 -22% | 30.5 -22% | 27.5 -10% |
| Load Average * (dB) | 44.7 | 36.5 18% | 47 -5% | 46.2 -3% | 41.4 7% | 41.7 7% |
| Load Maximum * (dB) | 45.6 | 43 6% | 47 -3% | 49.4 -8% | 51.4 -13% | 45.3 1% |
| Witcher 3 ultra * (dB) | 47 | 49.2 | 51.1 |
* ... smaller is better
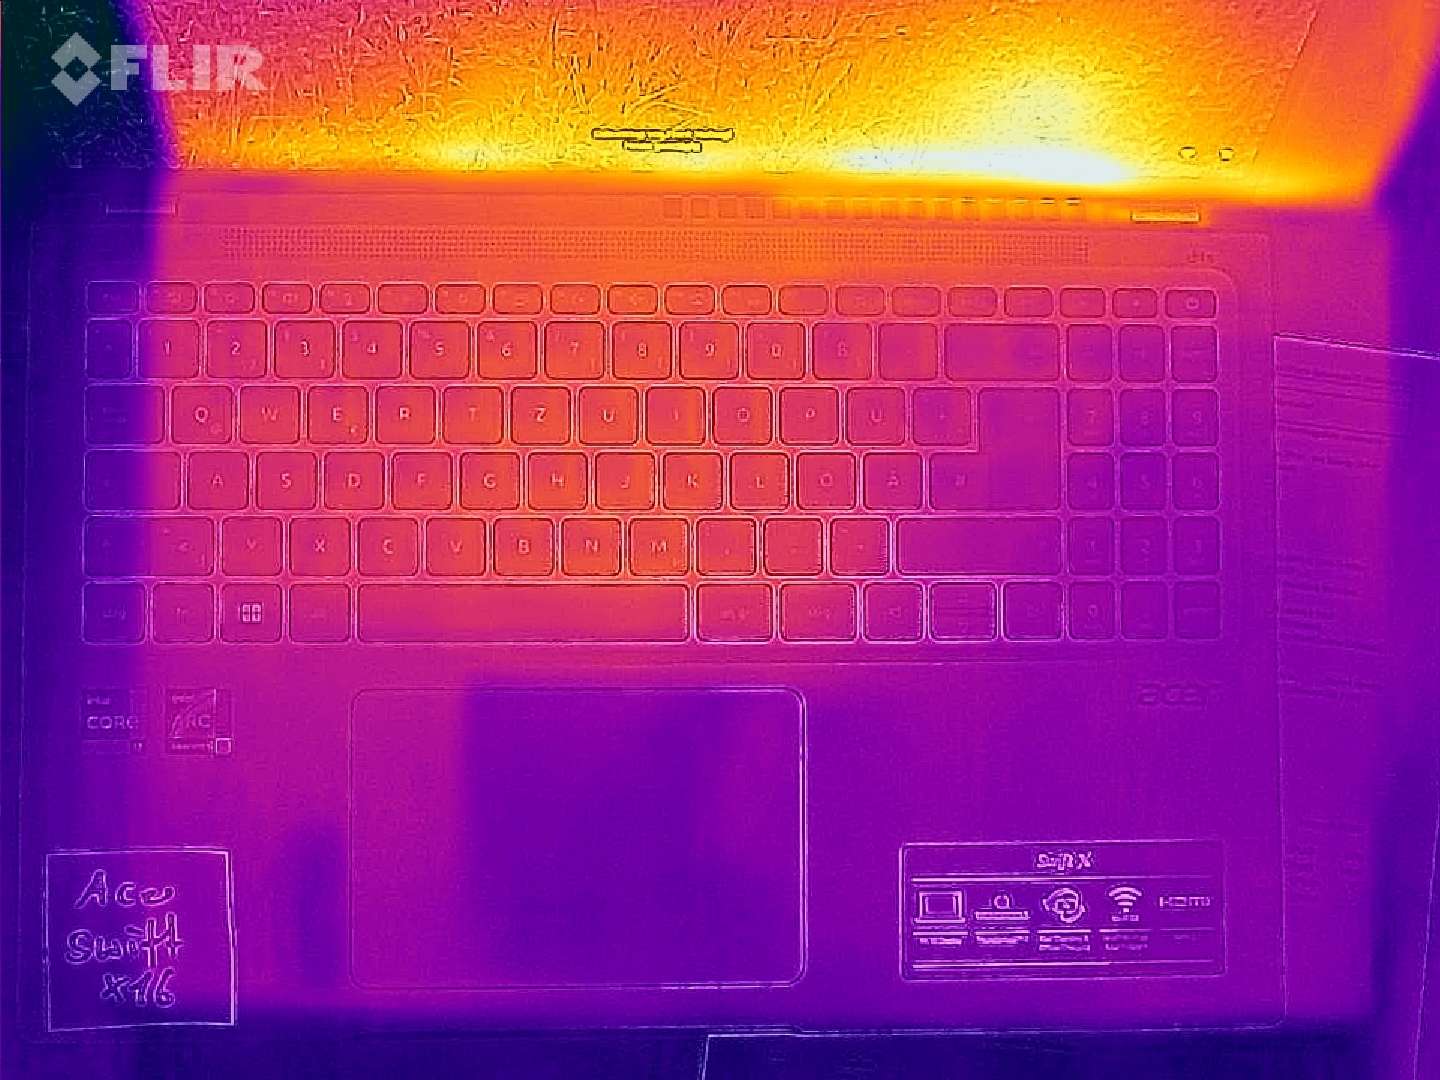
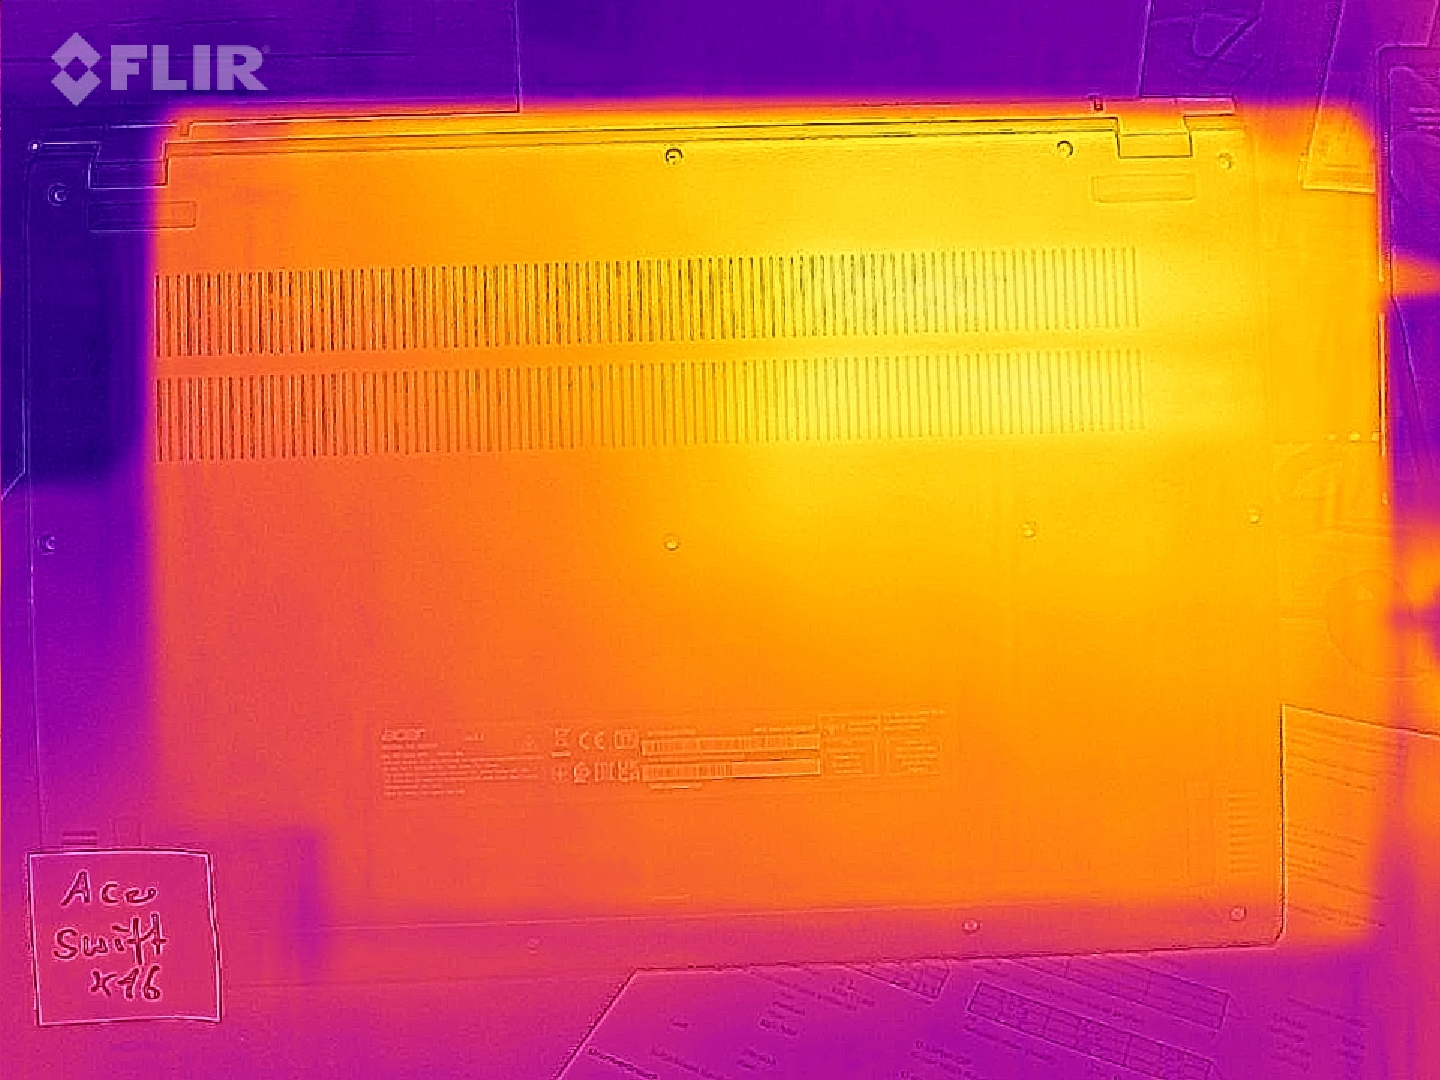
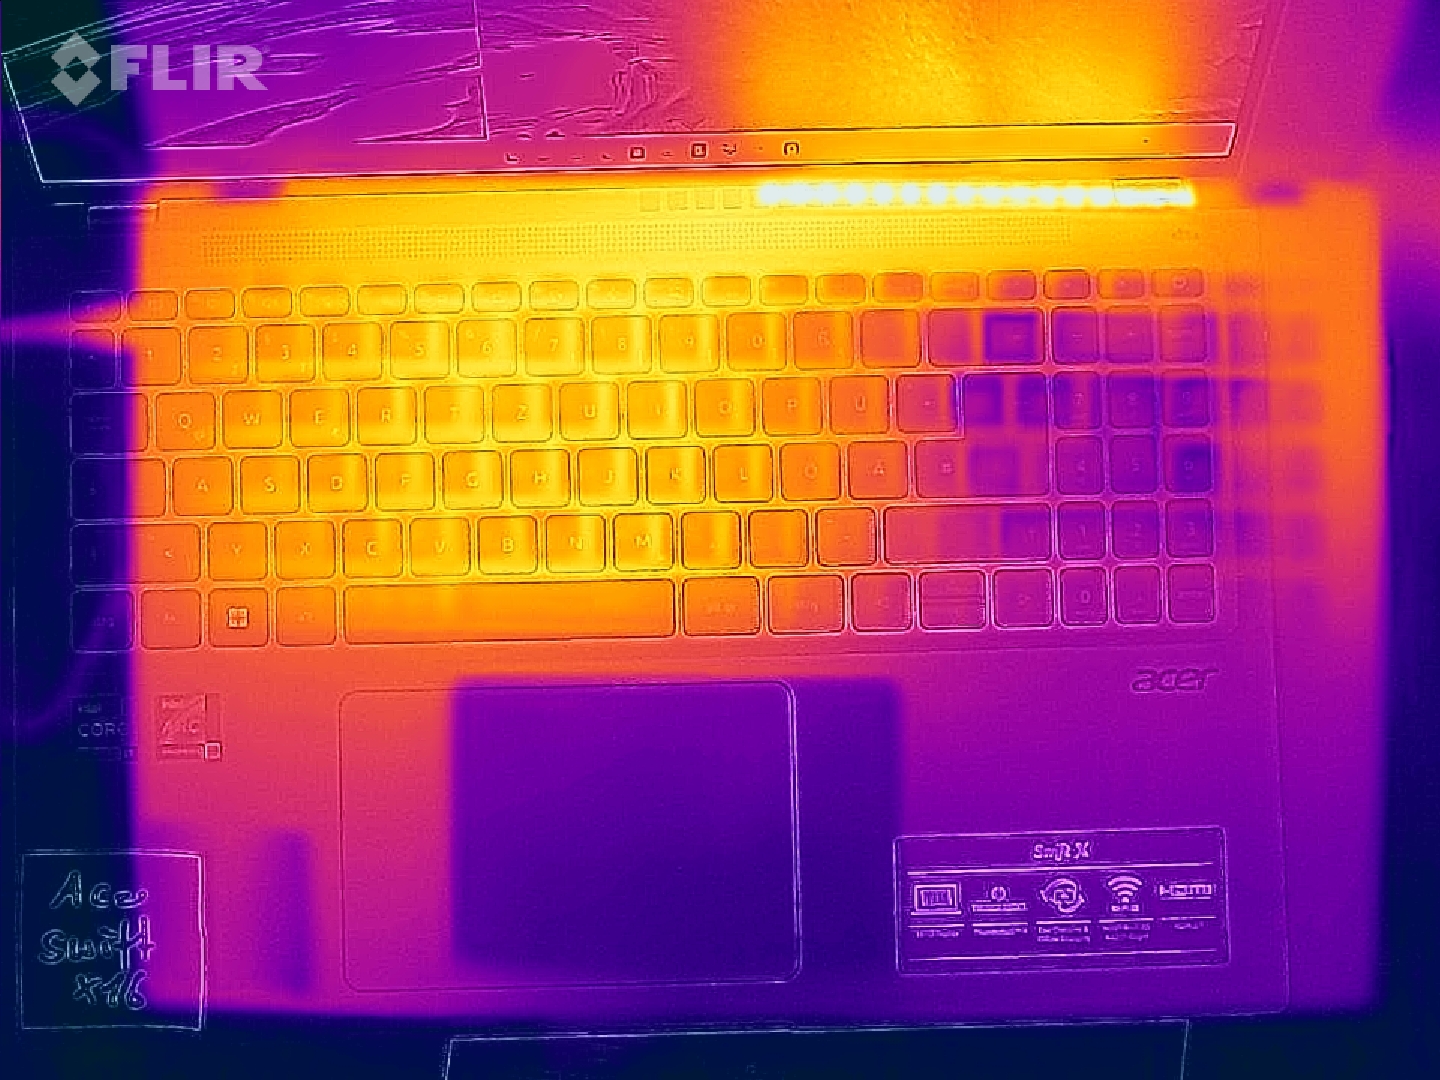
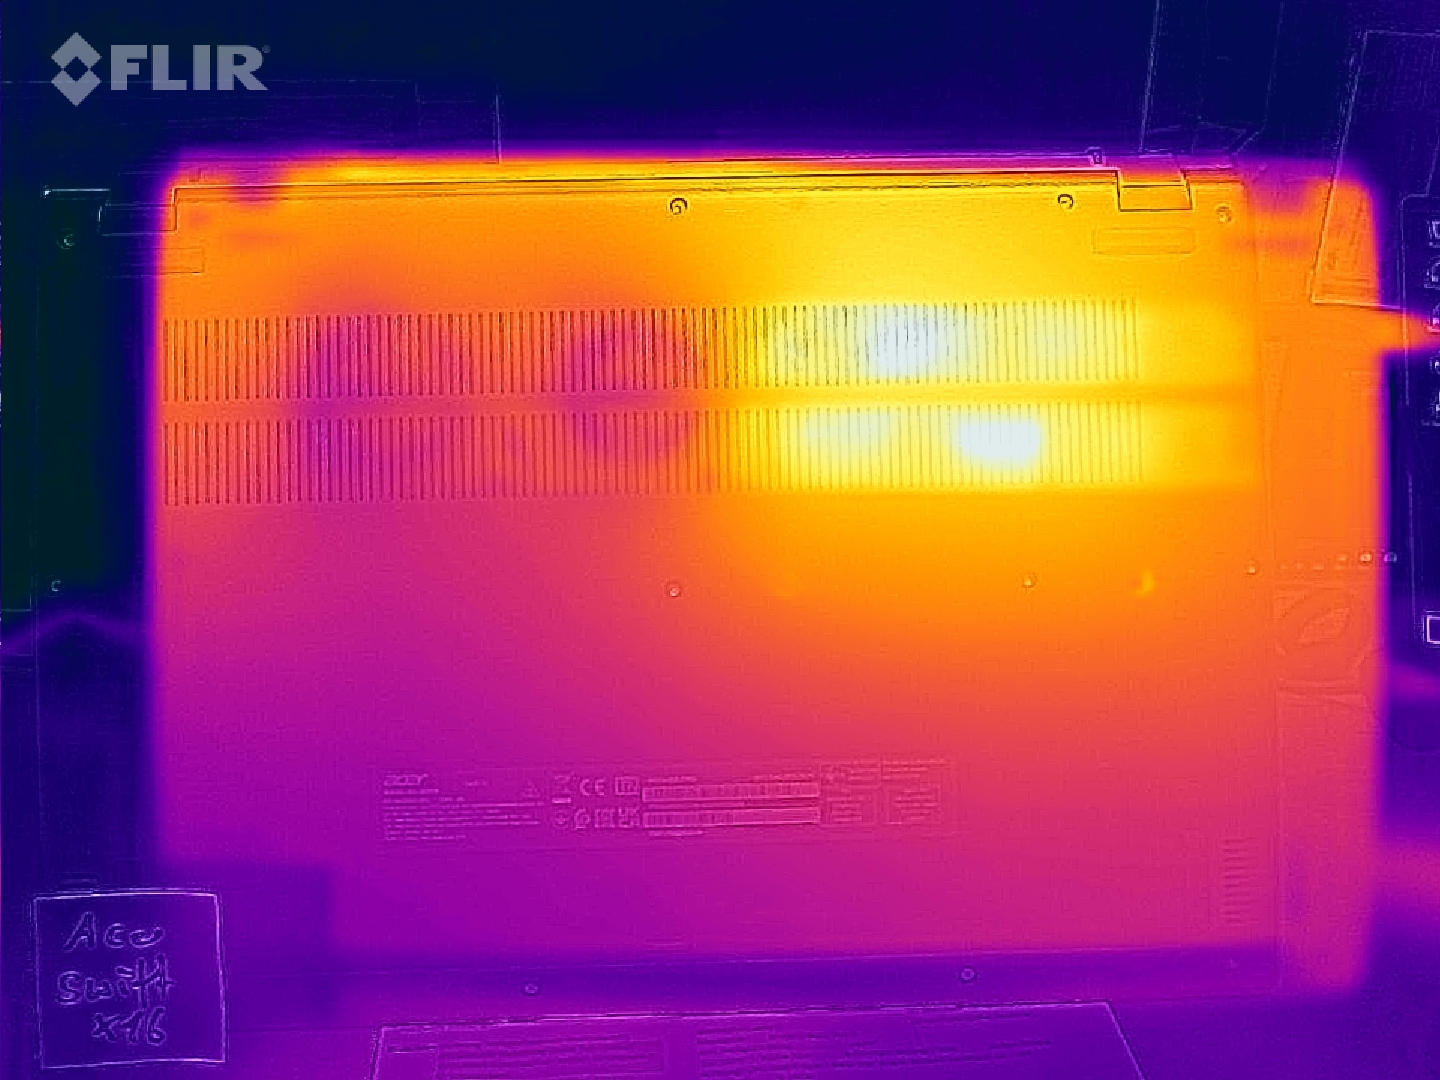
Temperatures
Not only is the cooling system loud, but it is also weak. Particularly the area above the keyboard near the fan vents can get uncomfortably hot under full load, and the device bottom then also heats up with a hotspot of up to 55.5 °C (131 °F). Even with more powerful components, the competitors know to stay cooler.
(-) The maximum temperature on the upper side is 49.4 °C / 121 F, compared to the average of 36.8 °C / 98 F, ranging from 21 to 71 °C for the class Multimedia.
(-) The bottom heats up to a maximum of 55.5 °C / 132 F, compared to the average of 39.1 °C / 102 F
(+) In idle usage, the average temperature for the upper side is 25.9 °C / 79 F, compared to the device average of 31.3 °C / 88 F.
(-) The palmrests and touchpad can get very hot to the touch with a maximum of 49.4 °C / 120.9 F.
(-) The average temperature of the palmrest area of similar devices was 28.7 °C / 83.7 F (-20.7 °C / -37.2 F).
| Acer Swift X SFX16-52G-77RX Intel Core i7-1260P, Intel Arc A370M | Acer Swift X SFX16-52G-52VE Intel Core i5-1240P, Intel Arc A370M | Lenovo ThinkBook 16 G4+ IAP Intel Core i7-12700H, NVIDIA GeForce RTX 2050 Mobile | Dell Inspiron 16 Plus 7620 Intel Core i7-12700H, NVIDIA GeForce RTX 3050 Ti Laptop GPU | HP Envy 16 h0112nr Intel Core i7-12700H, NVIDIA GeForce RTX 3060 Laptop GPU | Lenovo IdeaPad 5 Pro 16ARH7 AMD Ryzen 5 6600HS, AMD Radeon 660M | Asus Vivobook Pro 16X-M7600QE AMD Ryzen 9 5900HX, NVIDIA GeForce RTX 3050 Ti Laptop GPU | |
|---|---|---|---|---|---|---|---|
| Heat | -0% | 12% | 7% | 3% | 10% | 15% | |
| Maximum Upper Side * (°C) | 49.4 | 52 -5% | 42.9 13% | 46 7% | 45.2 9% | 46 7% | 39.4 20% |
| Maximum Bottom * (°C) | 55.5 | 50.4 9% | 50.6 9% | 45.8 17% | 44 21% | 48 14% | 43.6 21% |
| Idle Upper Side * (°C) | 28.4 | 30 -6% | 26 8% | 29.2 -3% | 33.6 -18% | 28 1% | 27.6 3% |
| Idle Bottom * (°C) | 32.6 | 32.4 1% | 26.5 19% | 31 5% | 32.6 -0% | 27 17% | 27.5 16% |
* ... smaller is better
Stress Test
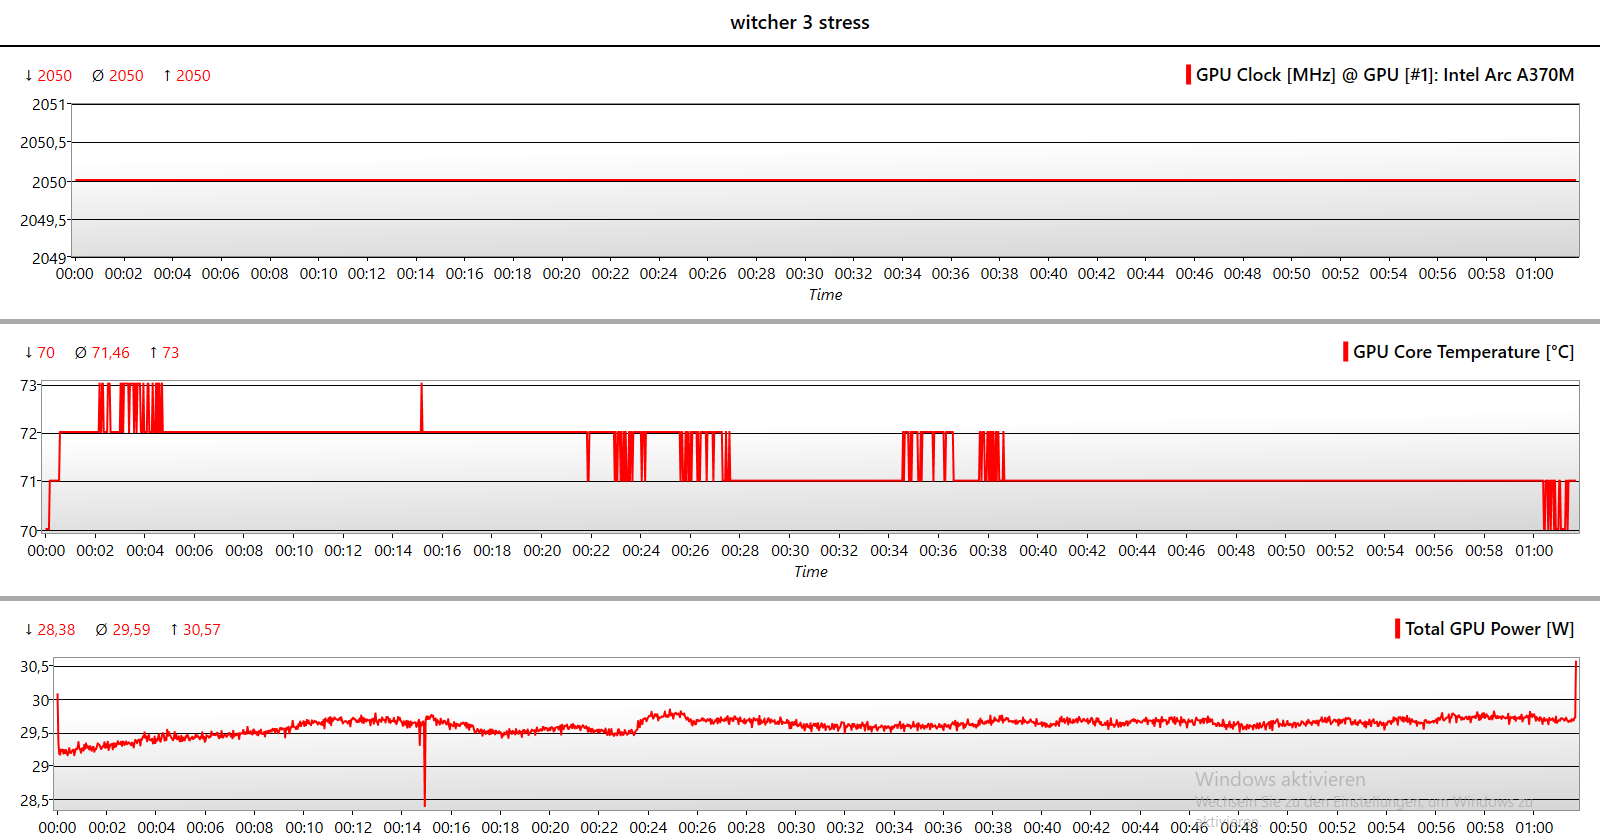
Even in the hour-long, combined stress test with Prime95 and FurMark, the GPU clock speed stays only 5% below the maximum. The processor is then throttled from 35 to 25 watts, reaching a temperature of 88 °C (190 °F), while the GPU levels out at 86 °C (187 °F). The P cores will then have a clock speed of only about 1.75 GHz, which is below the basic clock speed of 2.1 GHz. During pure CPU stress, the speed doesn't go below this limit.
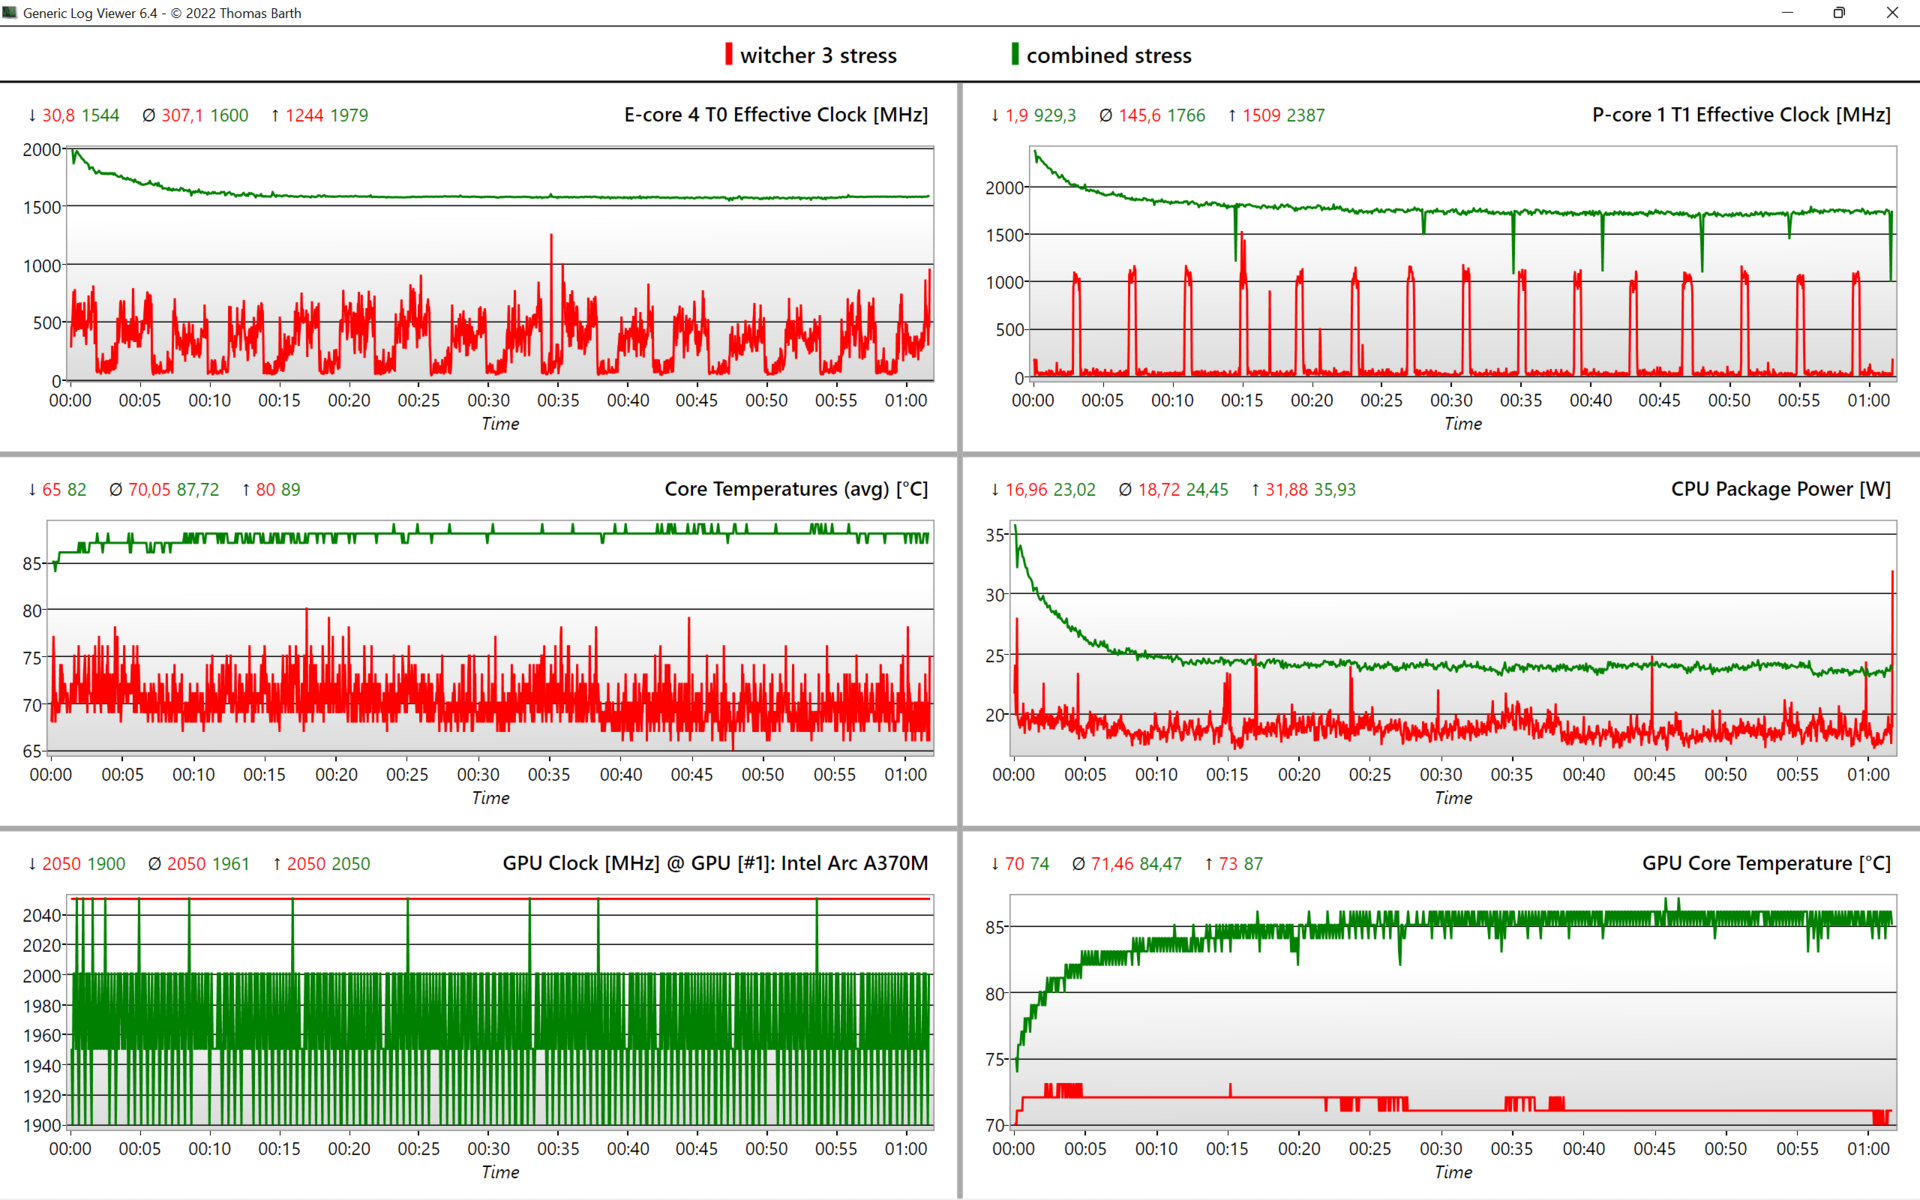
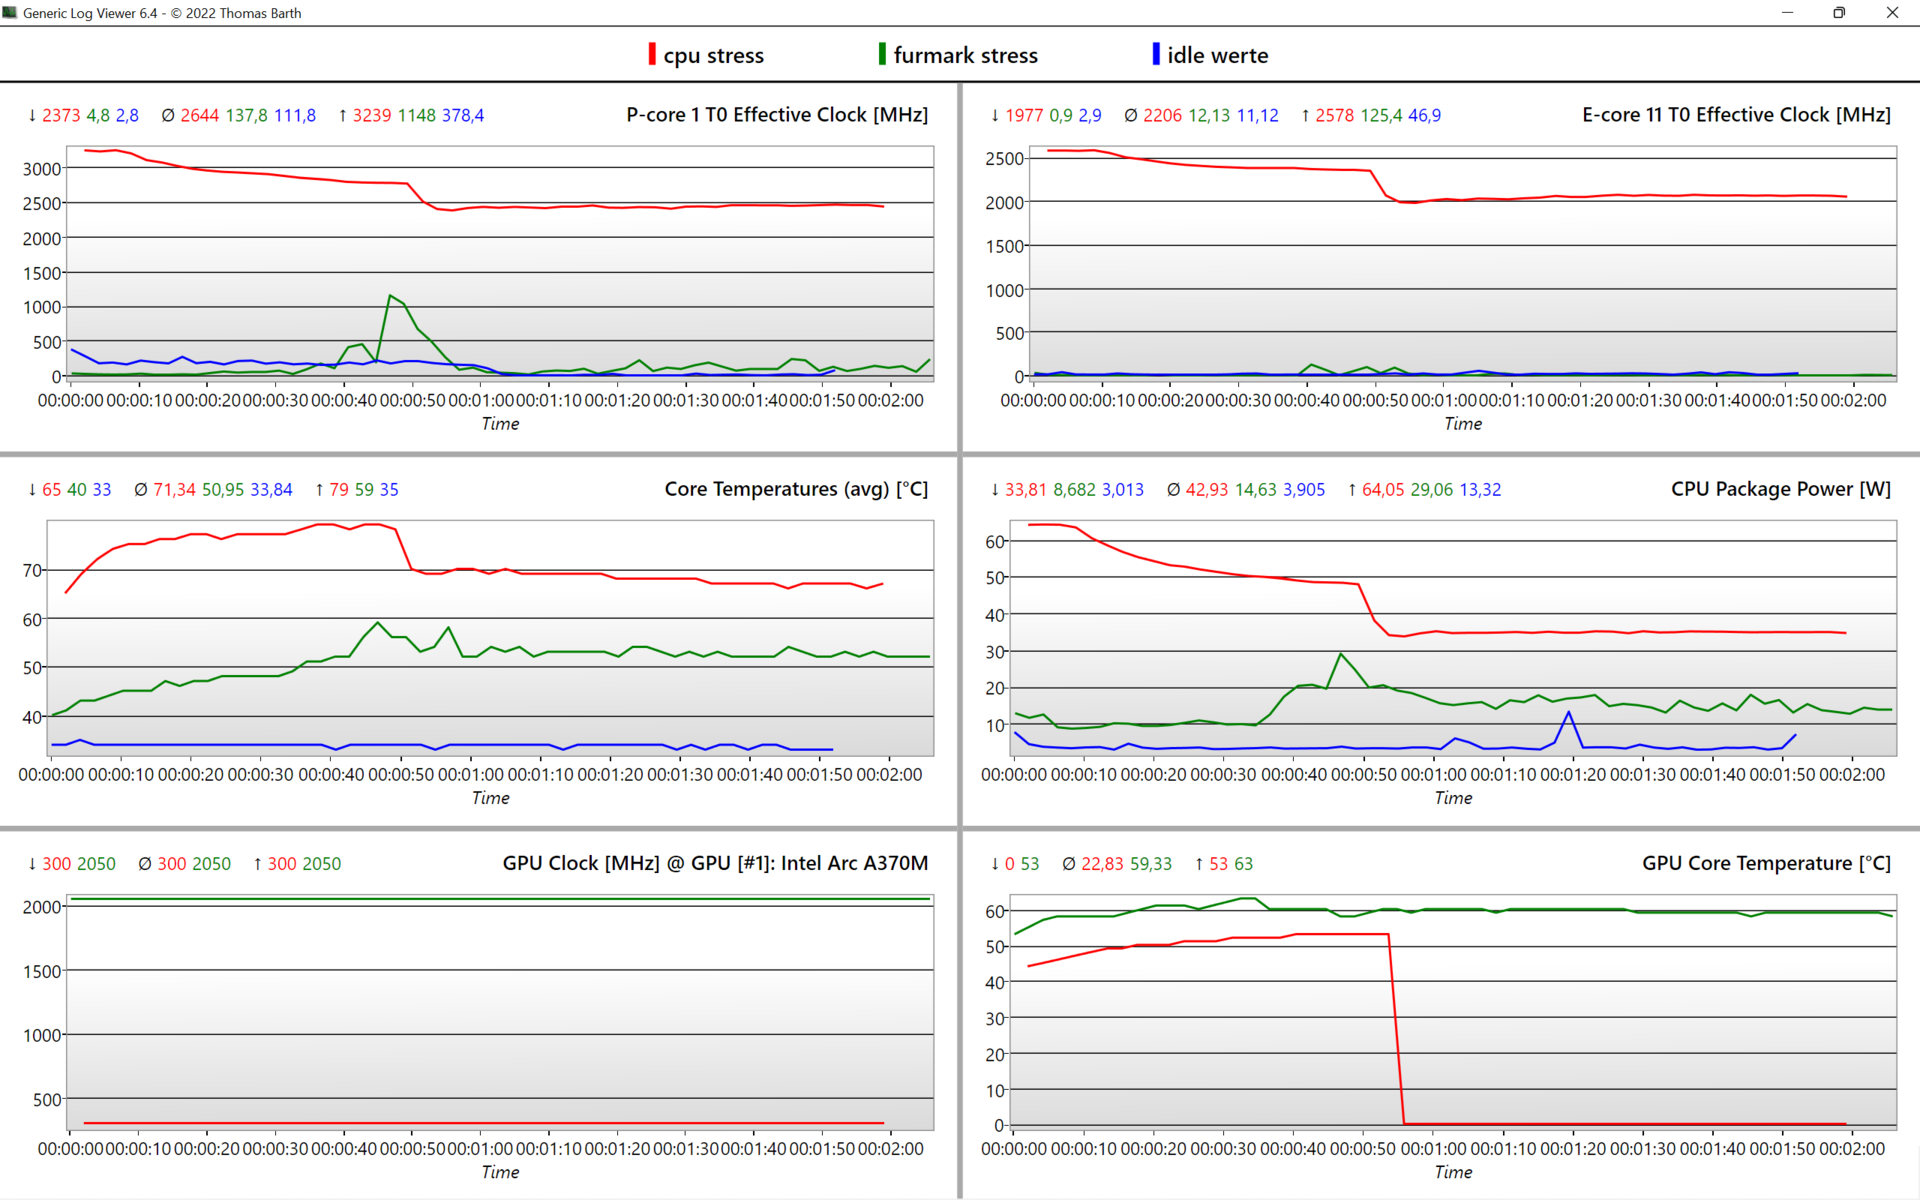
| CPU Clock E-/P-Cores (GHz) | GPU Clock (MHz) | Average CPU Temperature (°C) | Average GPU Temperature (°C) | |
| System Idle | - | 300 | 34 | 29 |
| Prime95 Stress | 2.1 / 2.5 | 300 | 67 | 53 |
| Prime95 + FurMark Stress | 1.6 / 1.75 | 1,960 | 88 | 86 |
| FurMark Stress | - | 2,050 | 52 | 60 |
| Witcher 3 Stress | 0.3 / 0.15 | 2,050 | 70 | 71 |
Speakers
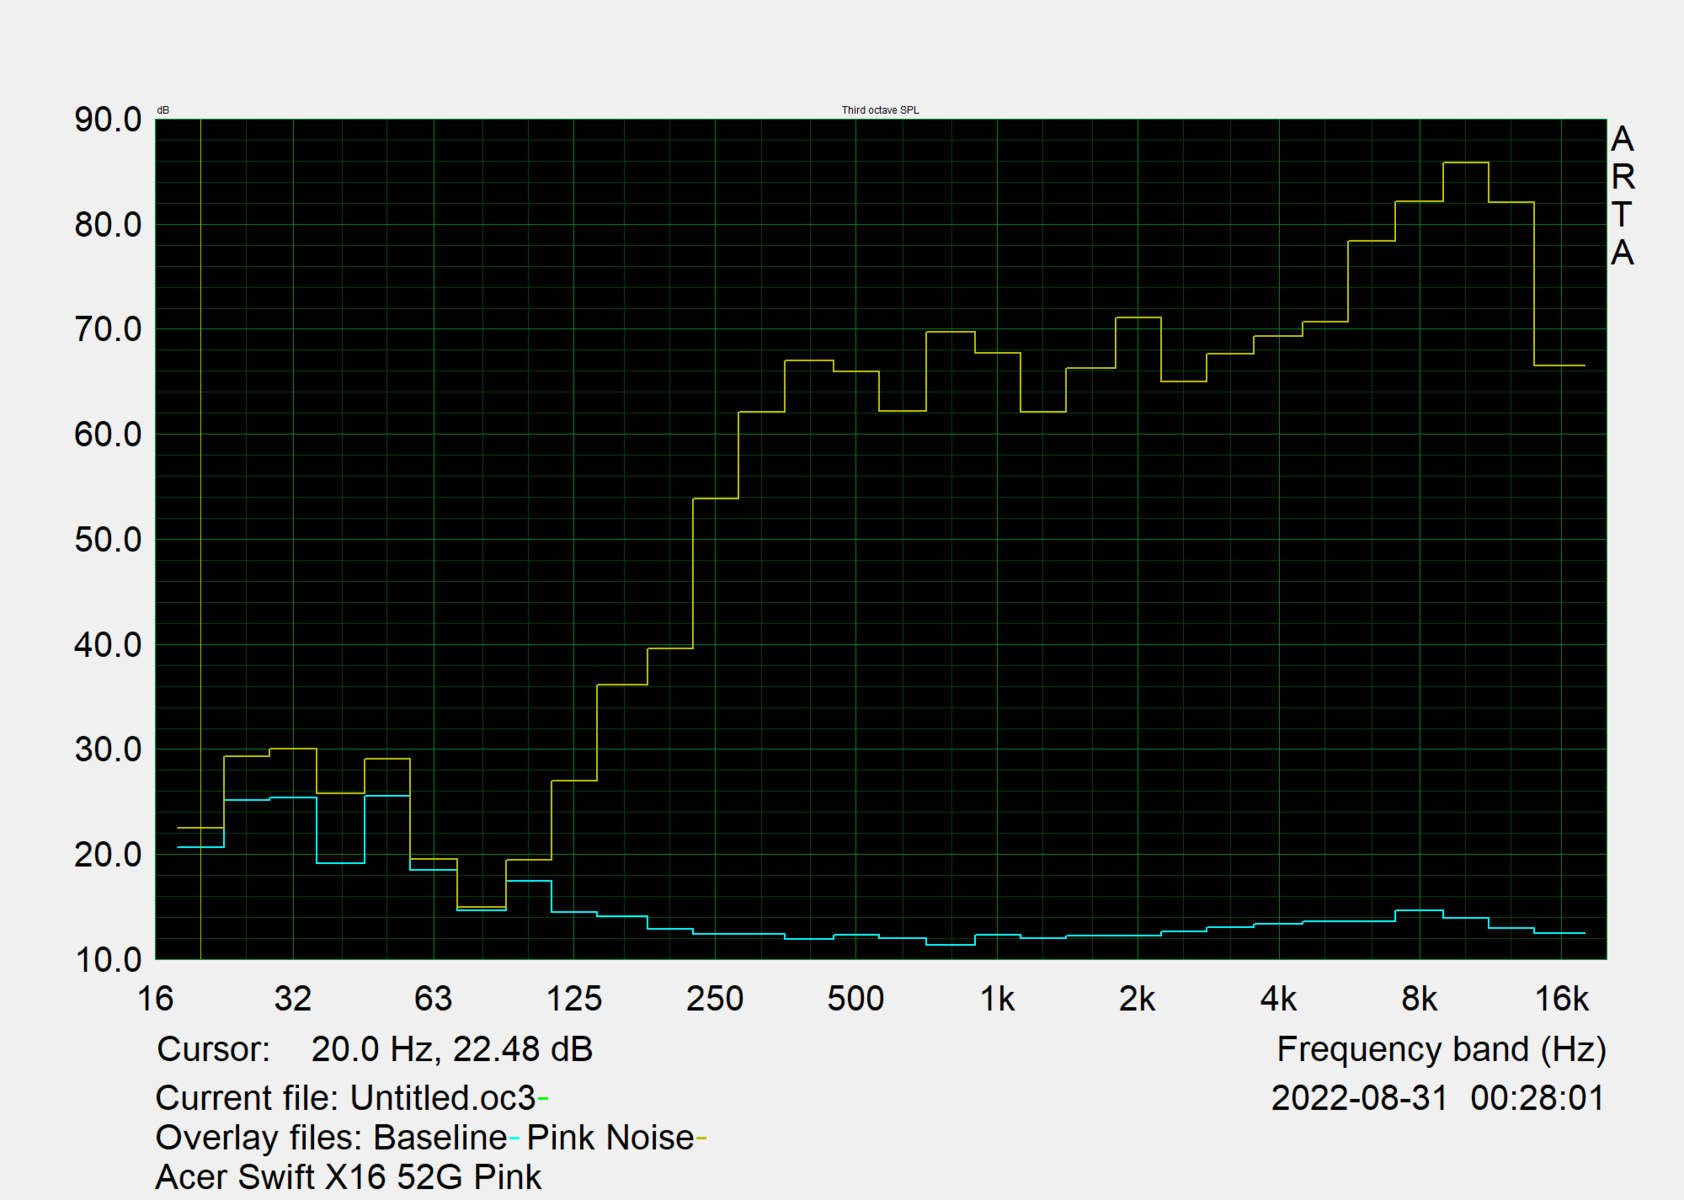
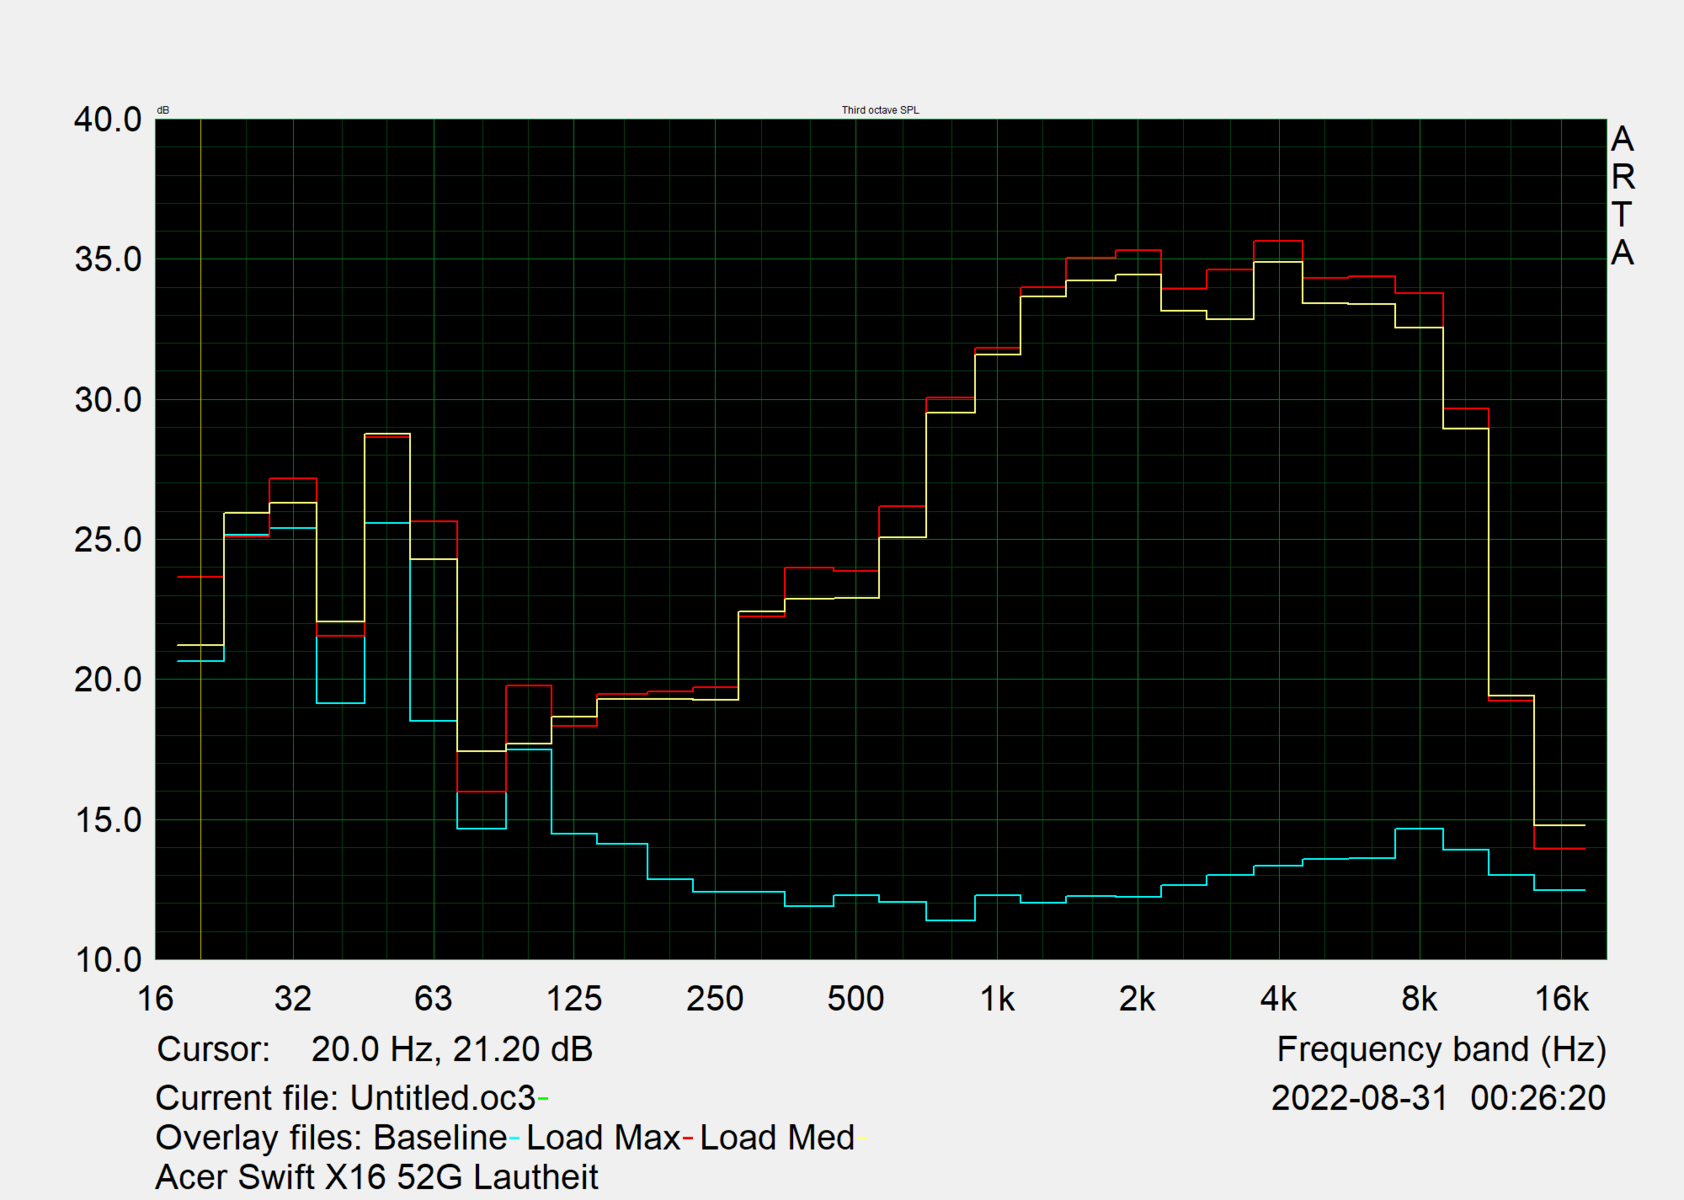
The sound of the speakers, which point upward, is poor in bass and has a below-average quality. However, at almost 88 dB(A), they manage to fill even a large room. If you only need to reproduce voices, they are sufficient, but if you want to enjoy music, you should use external audio devices via the audio port or Bluetooth.
Acer Swift X SFX16-52G-77RX audio analysis
(+) | speakers can play relatively loud (87.8 dB)
Bass 100 - 315 Hz
(-) | nearly no bass - on average 26.8% lower than median
(±) | linearity of bass is average (14.6% delta to prev. frequency)
Mids 400 - 2000 Hz
(+) | balanced mids - only 2.4% away from median
(±) | linearity of mids is average (7.9% delta to prev. frequency)
Highs 2 - 16 kHz
(±) | higher highs - on average 8.1% higher than median
(±) | linearity of highs is average (7.1% delta to prev. frequency)
Overall 100 - 16.000 Hz
(±) | linearity of overall sound is average (20.6% difference to median)
Compared to same class
» 70% of all tested devices in this class were better, 8% similar, 22% worse
» The best had a delta of 5%, average was 17%, worst was 45%
Compared to all devices tested
» 55% of all tested devices were better, 8% similar, 37% worse
» The best had a delta of 4%, average was 23%, worst was 134%
Lenovo ThinkBook 16 G4+ IAP audio analysis
(±) | speaker loudness is average but good (77.6 dB)
Bass 100 - 315 Hz
(-) | nearly no bass - on average 17.3% lower than median
(±) | linearity of bass is average (10.3% delta to prev. frequency)
Mids 400 - 2000 Hz
(+) | balanced mids - only 4.6% away from median
(+) | mids are linear (4.6% delta to prev. frequency)
Highs 2 - 16 kHz
(+) | balanced highs - only 1.6% away from median
(+) | highs are linear (6.2% delta to prev. frequency)
Overall 100 - 16.000 Hz
(±) | linearity of overall sound is average (15.7% difference to median)
Compared to same class
» 39% of all tested devices in this class were better, 5% similar, 56% worse
» The best had a delta of 5%, average was 17%, worst was 45%
Compared to all devices tested
» 24% of all tested devices were better, 5% similar, 71% worse
» The best had a delta of 4%, average was 23%, worst was 134%
Power Management: Ample battery life and a low consumption of the Swift X
Power Consumption
During everyday tasks, we measure about 7.6 watts, which can only be beaten by few devices in the multimedia class, such as the IdeaPad 5 Pro 16.
Around 70 watts during gaming and in other load scenarios are the same that the predecessor with the Nvidia RTX 3050 also used. According to our database, devices with an integrated RDNA 2 GPU from AMD are even significantly more efficient at about 45 watts. On the other hand, the HP Envy 16 with the RTX 3060 consumes about twice the power while gaming (133 watts).
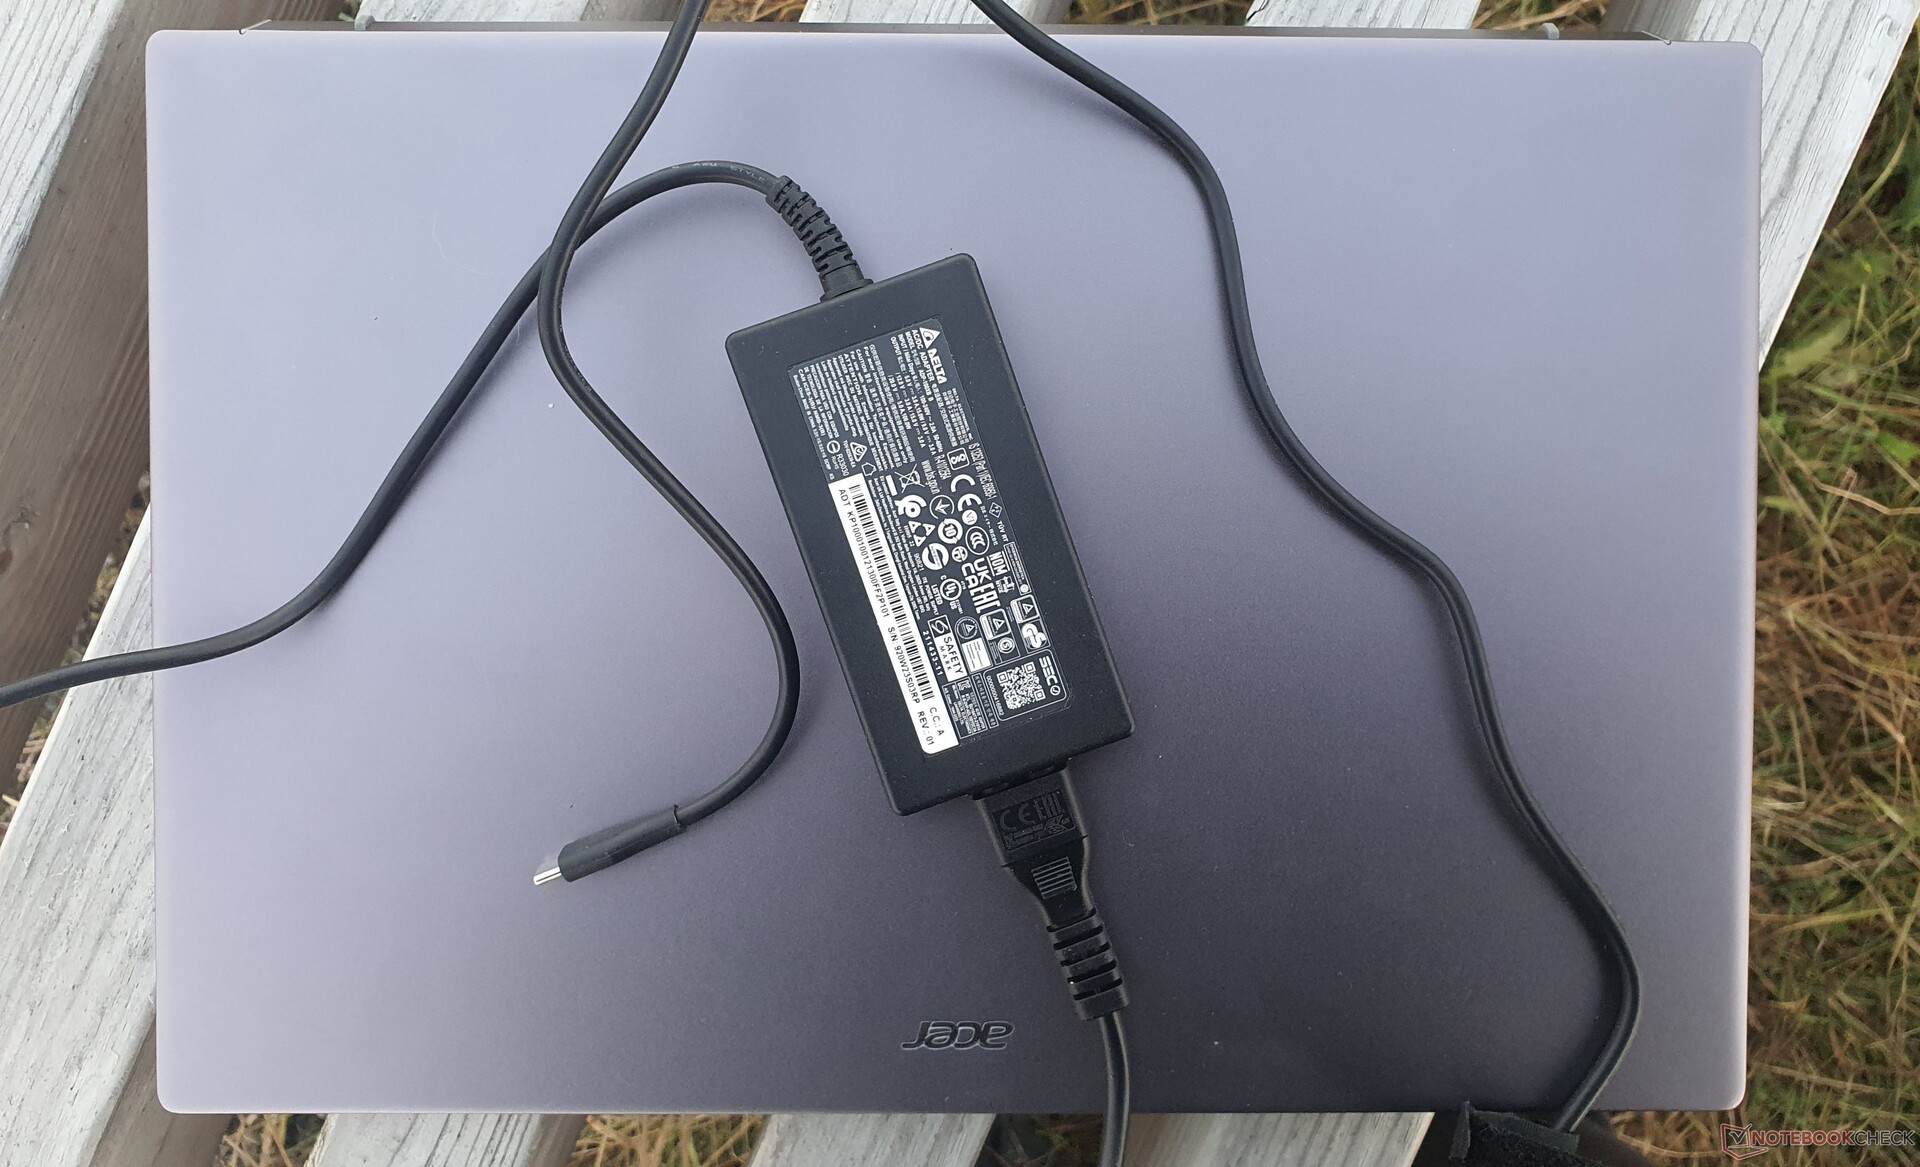
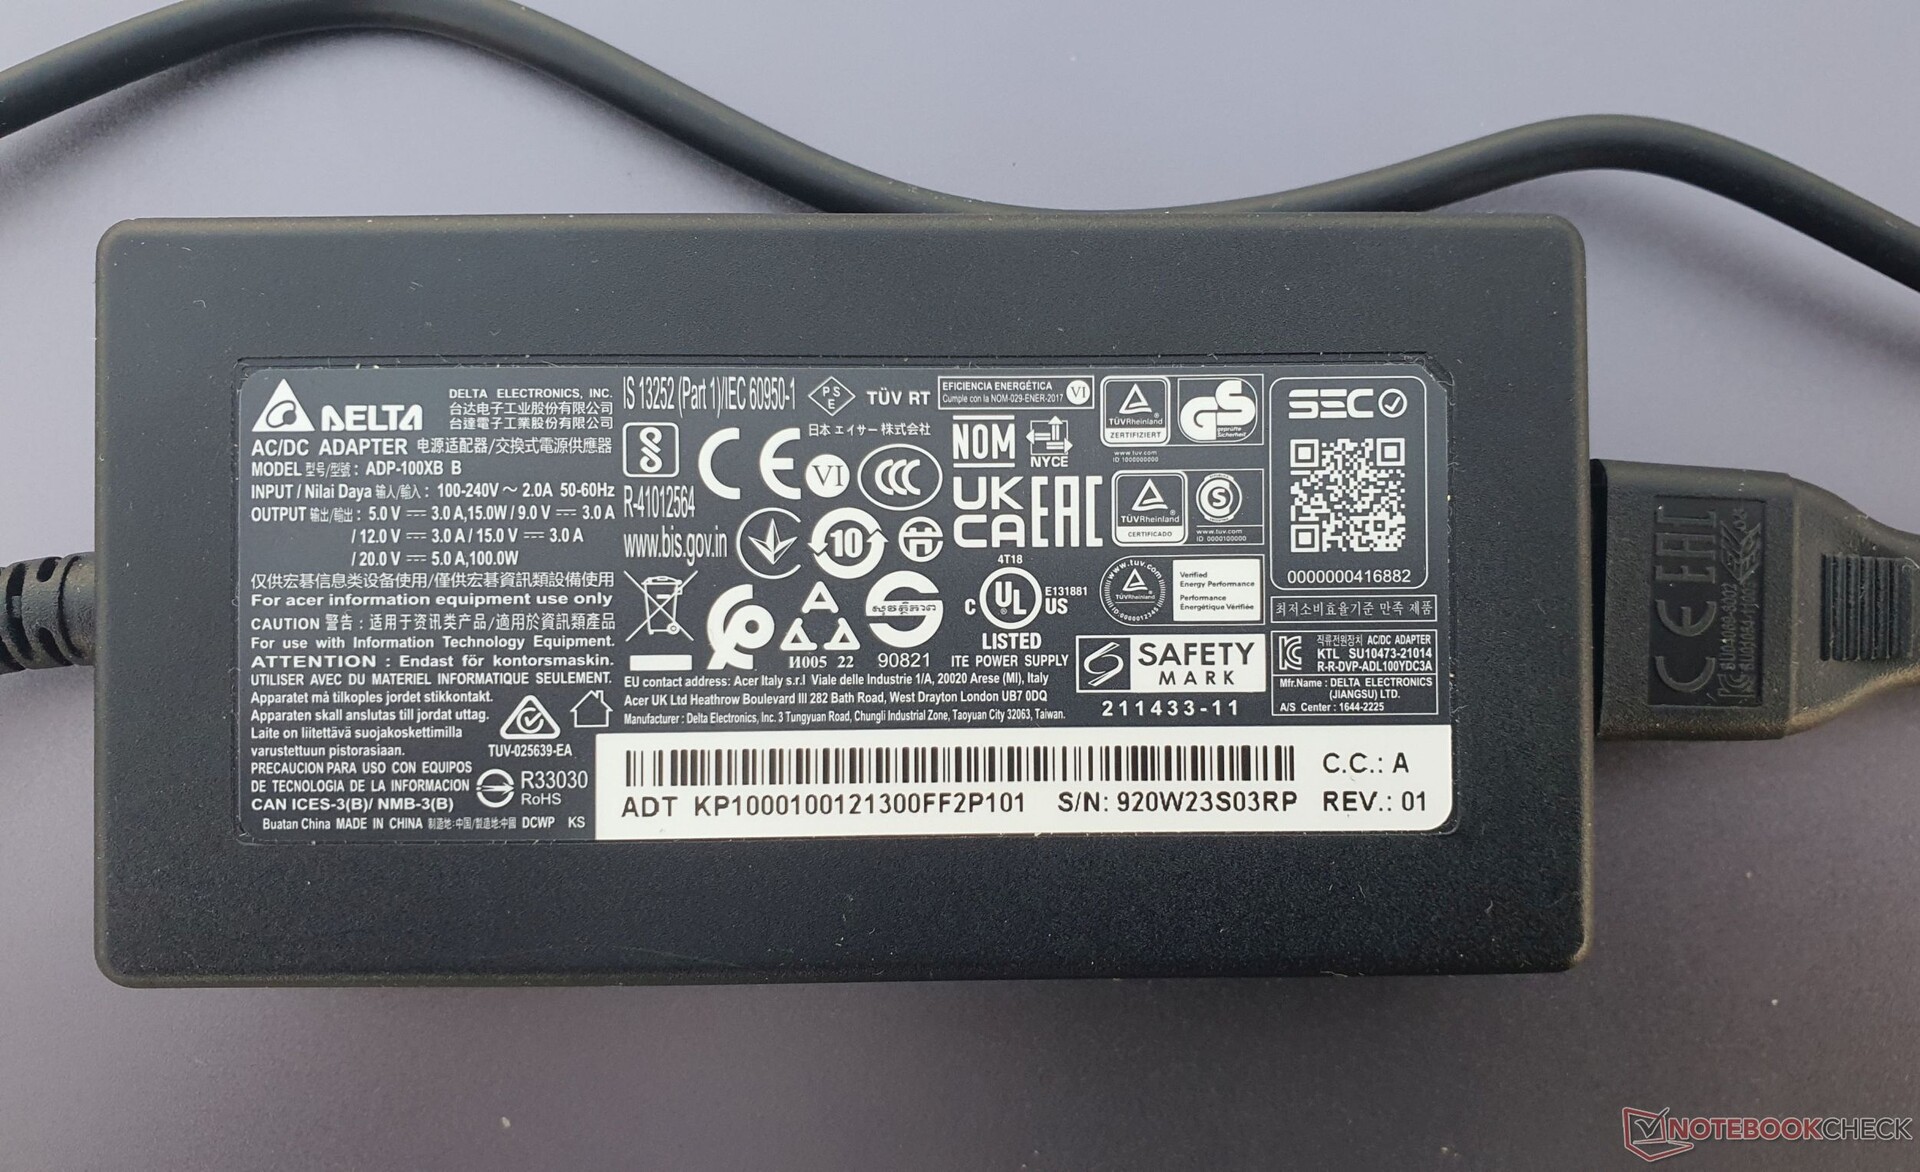
The 100 Watt USB-C charger is sufficient, since peak loads of just above 100 watts only occur during the unrealistic scenario of our combined stress test, which wouldn't really happen in everyday operation. They could possibly only occur in the first second, for example under full pure CPU load or during gaming.
| Off / Standby | |
| Idle | |
| Load |
|
Key:
min: | |
| Acer Swift X SFX16-52G-77RX i7-1260P, A370M, WDC PC SN810 1TB, IPS-LED, 2560x1600, 16" | Acer Swift X SFX16-52G-52VE i5-1240P, A370M, Micron 3400 MTFDKBA512TFH 512GB, , 2560x1600, 16" | Lenovo ThinkBook 16 G4+ IAP i7-12700H, GeForce RTX 2050 Mobile, Micron 2450 1TB MTFDKCD1T0TFK, IPS, 2560x1600, 16" | Dell Inspiron 16 Plus 7620 i7-12700H, GeForce RTX 3050 Ti Laptop GPU, Kioxia BG5 KBG50ZNS512G, IPS, 3072x1920, 16" | HP Envy 16 h0112nr i7-12700H, GeForce RTX 3060 Laptop GPU, Micron 3400 1TB MTFDKBA1T0TFH, OLED, 3840x2400, 16" | Asus Vivobook Pro 16X-M7600QE R9 5900HX, GeForce RTX 3050 Ti Laptop GPU, SK Hynix HFM001TD3JX013N, OLED, 3840x2400, 16.1" | Average of class Multimedia | |
|---|---|---|---|---|---|---|---|
| Power Consumption | -9% | -22% | -54% | -103% | -50% | -19% | |
| Idle Minimum * (Watt) | 3.7 | 5.7 -54% | 5 -35% | 6.8 -84% | 10 -170% | 8.2 -122% | 5.62 ? -52% |
| Idle Average * (Watt) | 7.6 | 8 -5% | 11.2 -47% | 9.6 -26% | 10.9 -43% | 16.2 -113% | 10.2 ? -34% |
| Idle Maximum * (Watt) | 11.1 | 10.4 6% | 11.6 -5% | 17 -53% | 27.8 -150% | 19.7 -77% | 12.5 ? -13% |
| Load Average * (Watt) | 70 | 74 -6% | 89.3 -28% | 117.5 -68% | 116.4 -66% | 65.8 6% | 65 ? 7% |
| Witcher 3 ultra * (Watt) | 68.8 | 65 6% | 83 -21% | 113.1 -64% | 133.7 -94% | 65.6 5% | |
| Load Maximum * (Watt) | 108 | 108.5 -0% | 102 6% | 137.4 -27% | 209.8 -94% | 104 4% | 111.9 ? -4% |
* ... smaller is better
Power Consumption The Witcher 3 / Stress Test
Power Consumption With External Monitor
Battery Life
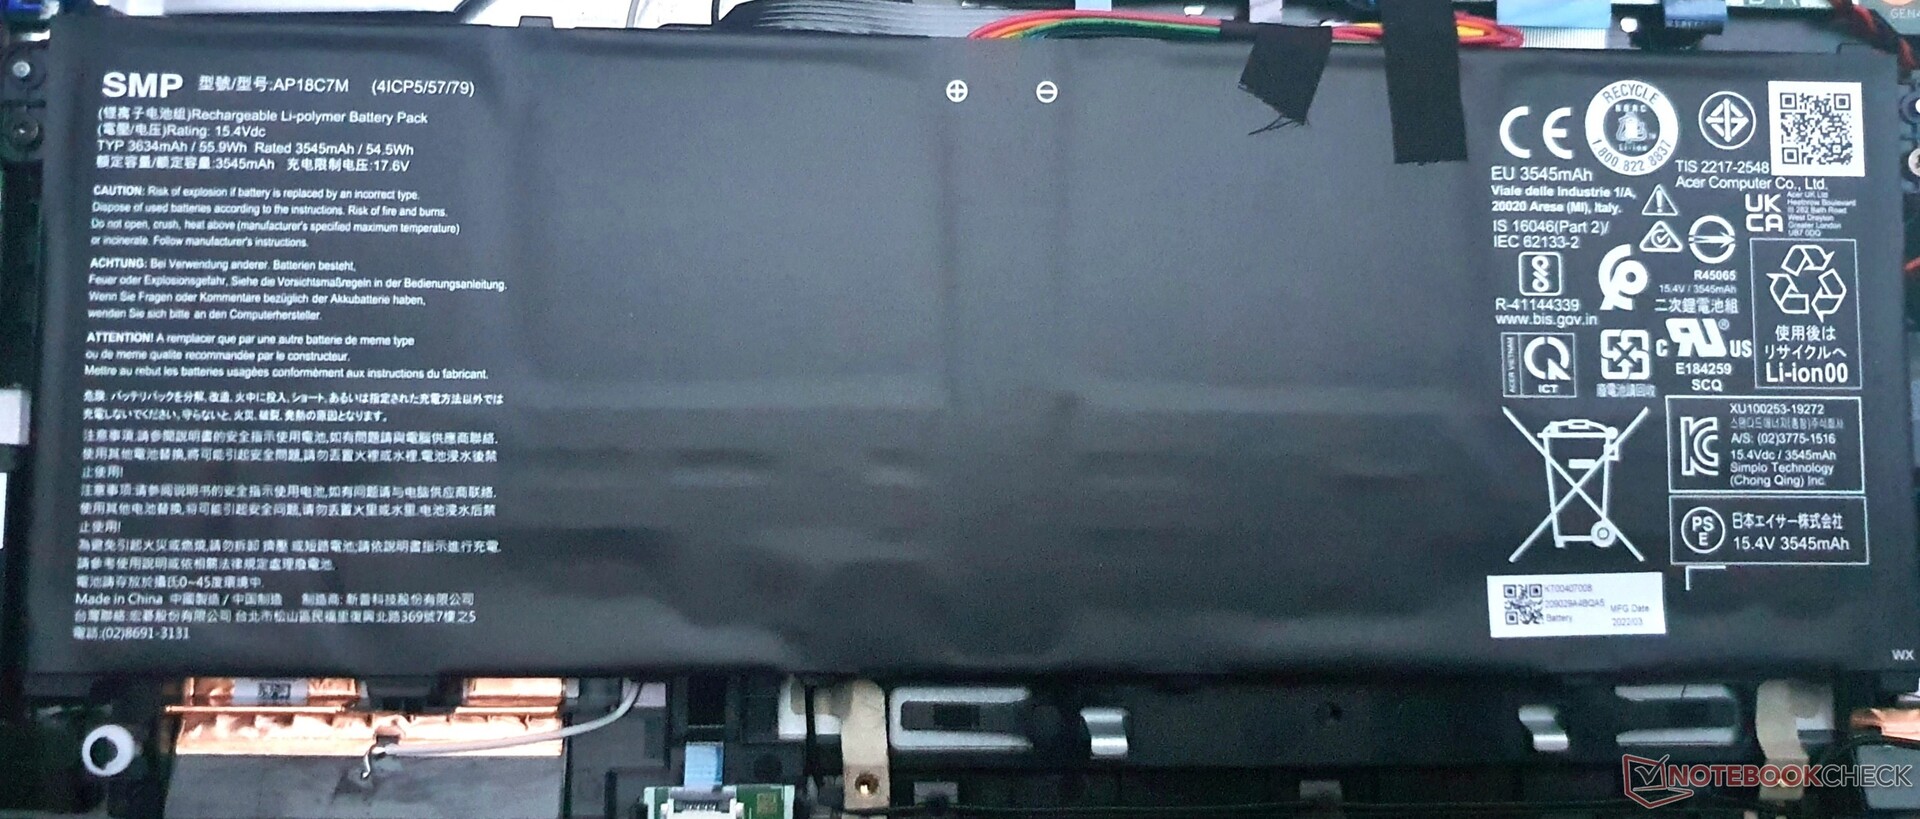
In our WLAN test with the brightness set to 150 nits and in Acer's Normal mode, the Swift X 16 lasts for 9 hours. This is an hour longer than the predecessor and 40 minutes less than the sibling model, although that was tested in the Power Saving mode.
Overall, the values fall within the average of this class. However, the Asus Vivobook Pro 16X lasts for more than 11 hours, while Dell's Inspiron 16 Plus and the Lenovo IdeaPad 5 Pro 16 achieve similar values as the Swift X.
| Acer Swift X SFX16-52G-77RX i7-1260P, A370M, 56 Wh | Acer Swift X SFX16-52G-52VE i5-1240P, A370M, 56 Wh | Acer Swift X SFX16-51G-5388 i5-11320H, GeForce RTX 3050 4GB Laptop GPU, 58.7 Wh | Lenovo ThinkBook 16 G4+ IAP i7-12700H, GeForce RTX 2050 Mobile, 71 Wh | Dell Inspiron 16 Plus 7620 i7-12700H, GeForce RTX 3050 Ti Laptop GPU, 86 Wh | HP Envy 16 h0112nr i7-12700H, GeForce RTX 3060 Laptop GPU, 83 Wh | Lenovo IdeaPad 5 Pro 16ARH7 R5 6600HS, Radeon 660M, 75 Wh | Asus Vivobook Pro 16X-M7600QE R9 5900HX, GeForce RTX 3050 Ti Laptop GPU, 96 Wh | Average of class Multimedia | |
|---|---|---|---|---|---|---|---|---|---|
| Battery runtime | -6% | 2% | 16% | 7% | 16% | 8% | 12% | 49% | |
| H.264 (h) | 10.4 | 9.8 -6% | 8.4 -19% | 12.6 21% | 16.8 ? 62% | ||||
| WiFi v1.3 (h) | 9.1 | 9.7 7% | 8.1 -11% | 8.2 -10% | 9.6 5% | 7.9 -13% | 9.8 8% | 11.3 24% | 12.3 ? 35% |
| Load (h) | 1.1 | 0.9 -18% | 1.5 36% | 1.5 36% | 1.2 9% | 1.6 45% | 1.1 0% | 1.645 ? 50% |
Pros
Cons
Verdict: Despite hefty upgrades, the Acer Swift X 16 still doesn't deliver
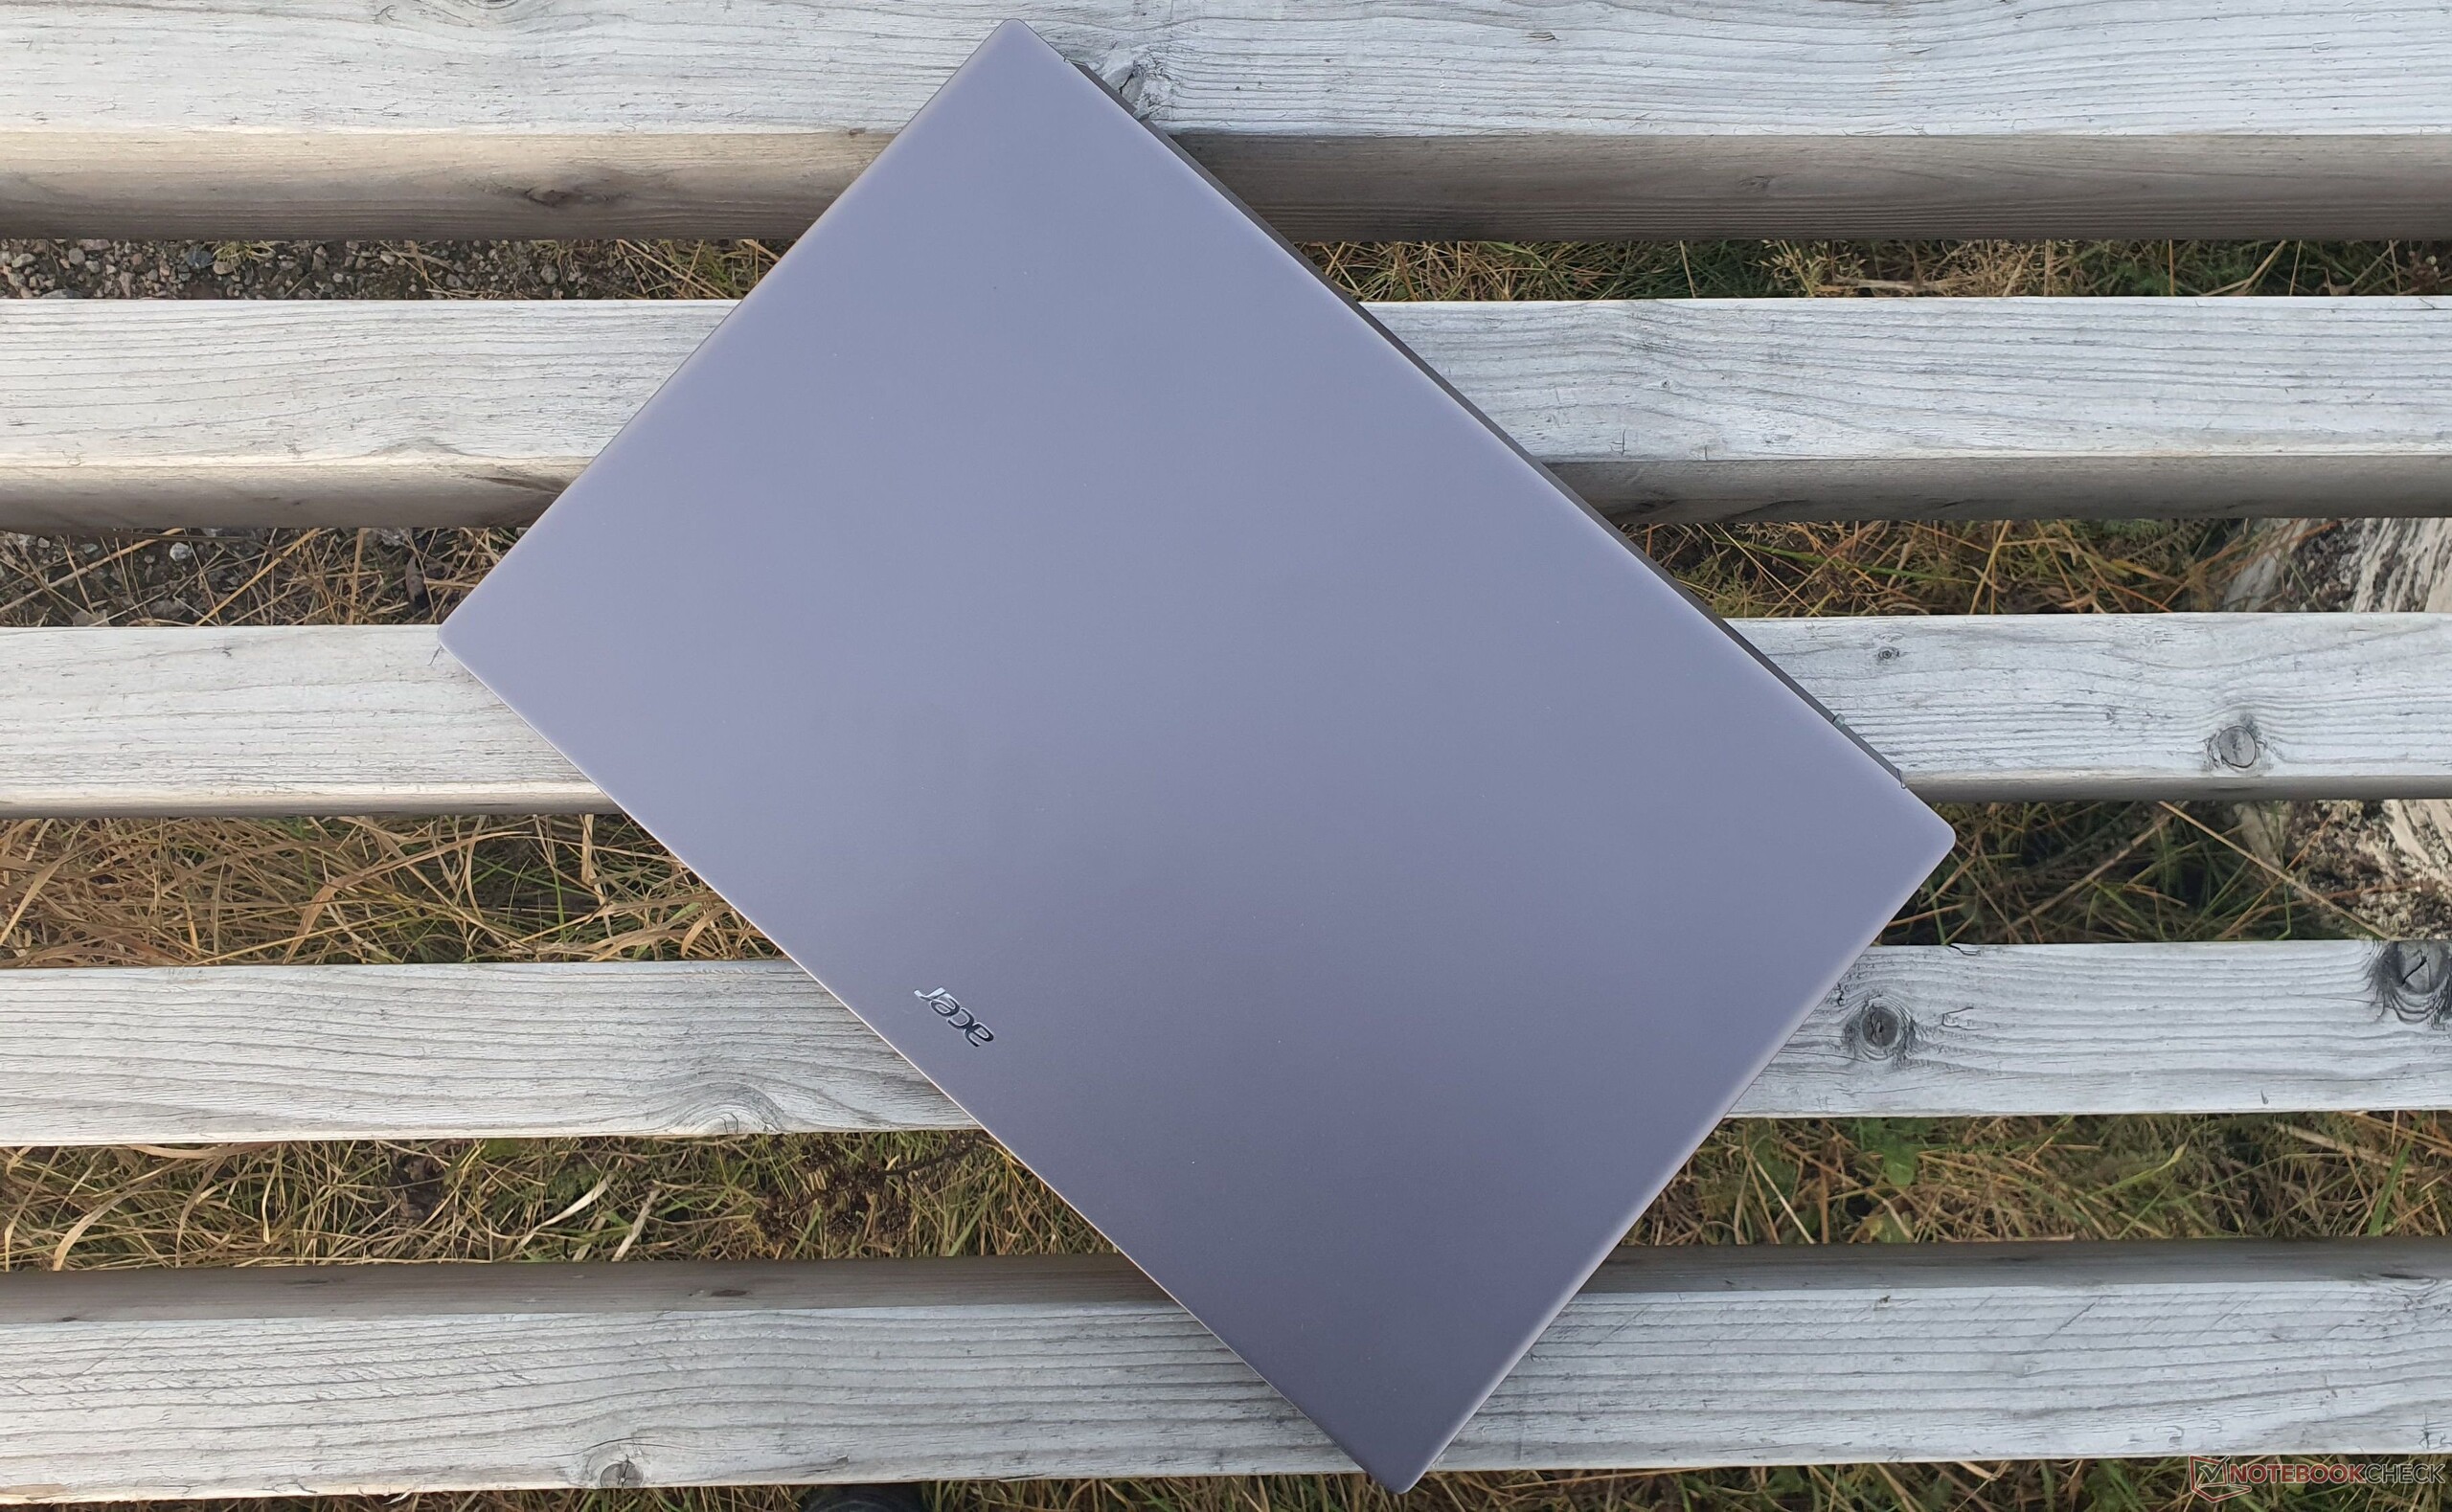
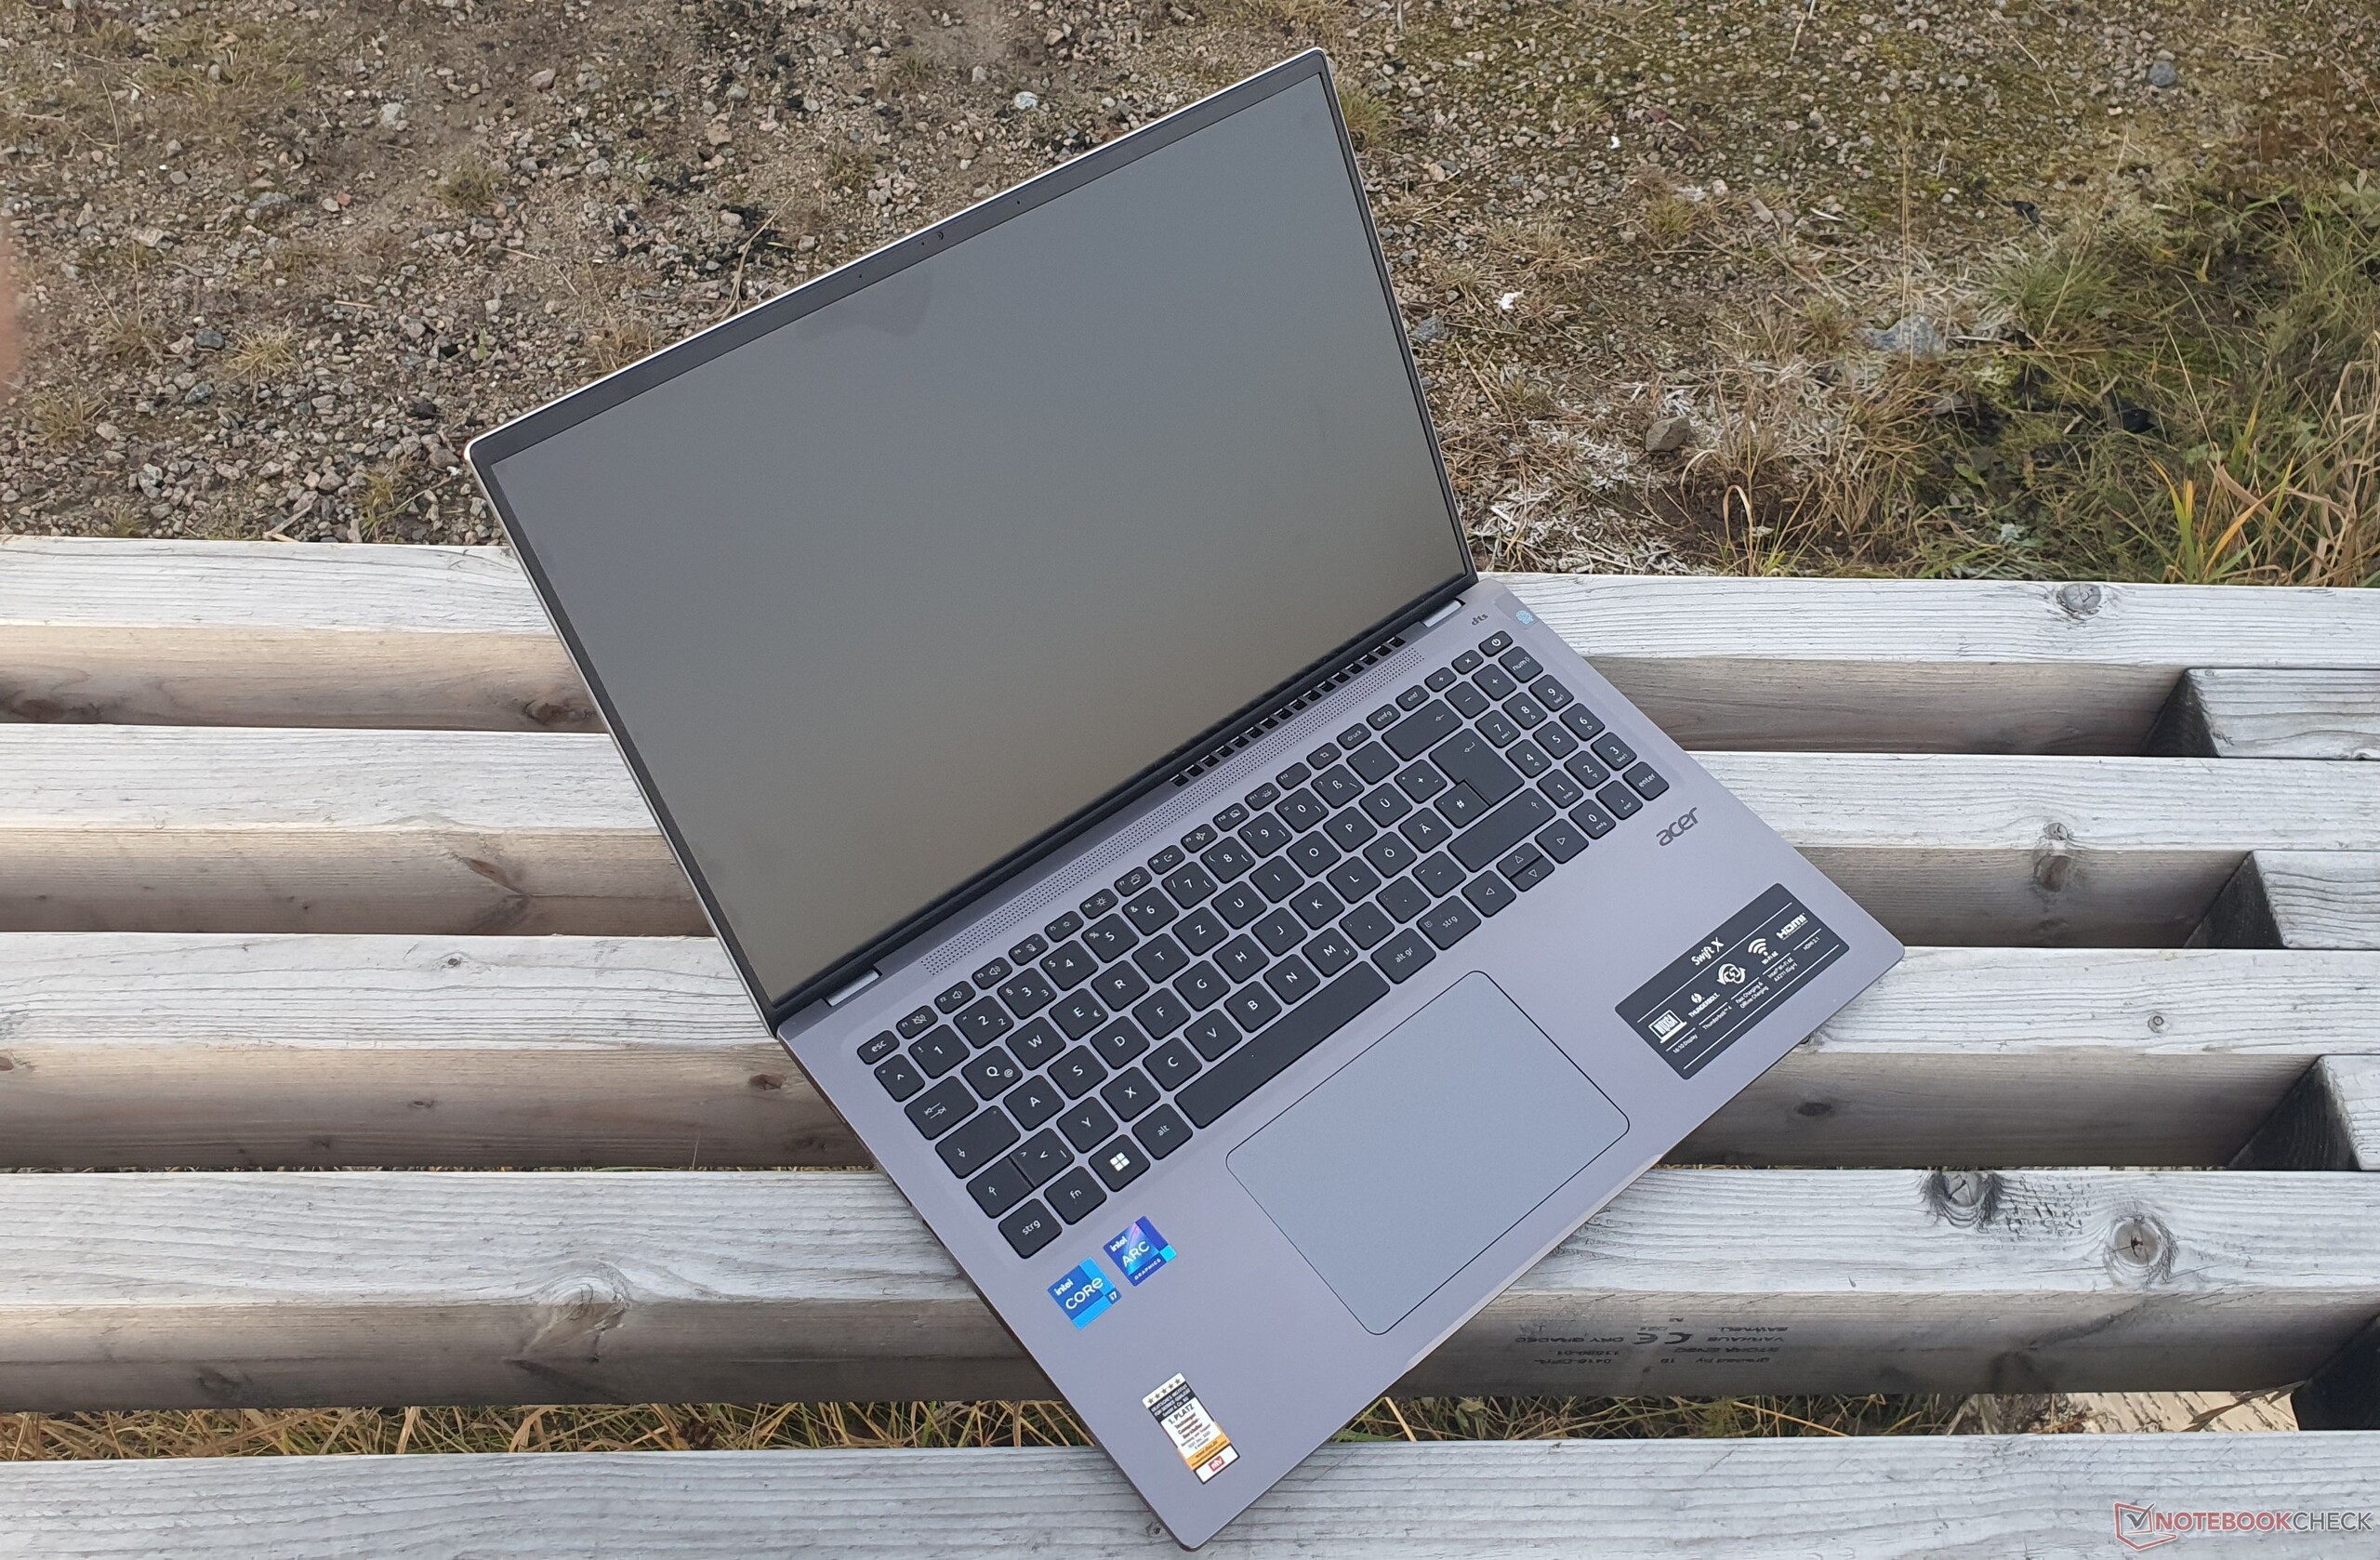
The Acer Swift X 16 (2022) is a compact 16-inch laptop that weighs only 1.75 kg (~3.96 lb). Many problem areas of the predecessor were fortunately remedied. The display is now significantly brighter at 380 nits, offers a high resolution at 2,560 x 1,600 pixels, and we also like the 16:10 format.
Unfortunately, Intel's Arc GPU is not designed for 3D work and also limps behind the GeForce RTX 3050 Ti in the Dell Inspiron 16 Plus and Asus VivoBook Pro 16X while gaming. On the other hand, the system offers a high performance due to Intel's Alder Lake P CPU. In addition, the built-in PCIe 4.0 SSD is one of the fastest, even though it suffers from heavy thermal throttling. But at least, you can install a second full-size M.2 SSD.
Other positive points are the update to HDMI 2.1 and the 1080p webcam, while the case continues to be made from robust metal and the keyboard is also suited for frequent typists. However, the slippery touchpad is significantly worse.
Despite some significant improvements in the display and system performance, considering the decreased graphics performance due to Intel Arc and the high emissions, the price of 1500 Euros (~$1482) is simply too high.
The fan behavior and cooling performance are not very impressive, the speakers continue to be bad, and an AMD version with an efficient iGPU is not available. So overall, we don't see a justification for the high price of 1500 Euros (~$1482). But at least at about the same performance, the Core i5 version with a 512-GB SSD costs 200 Euros (~$198) less.
On the other hand, at even lower costs, the competitors deliver more in many regards, for example, Lenovo's ThinkBook 16 G4+ for 1200 Euros (~$1186) or the IdeaPad 5 Pro 16 for 1000 Euros (~$988). HP's Envy 16 offers a mix of multimedia, business, and gaming and delivers significantly more performance for 1700 Euros (~$1680).
Price and Availability
A US model of the Acer Swift X, the SFX16-52G-73U6 with a 512 GB SSD, 16 GB of RAM, a 1920 x 1200 pixel display, and an Intel Core i7-1260P, can be ordered for $1250 directly from Acer's online shop, and Amazon currently lists this model for $1049.
Acer Swift X SFX16-52G-77RX
- 10/25/2022 v7 (old)
Marvin Gollor
Price comparison

