Acer Swift X SFX16-52G in review: a laptop that balances efficiency and performance


With the Swift X SFX16-52G, Acer offers an ultrabook that is geared towards creative work. Both the Intel Arc A370M graphics card and the available i5-1240P or i7-1260P are designed more for efficient work and not necessarily for top performance. In view of the list price of 1,300 euros, the notebook appears to be optimally equipped and should, therefore, also satisfy more demanding users. This is also complemented by the 16:10 format display with 4 million pixels – without forgetting the three video outputs.
Competitors include similarly designed multimedia laptops with good, but not outstanding graphics performance, such as the Lenovo ThinkBook 16 G4+ or indeed an Asus ZenBook Flip 15 with the same GPU.
Possible competitors in comparison
Rating | Date | Model | Weight | Height | Size | Resolution | Price |
|---|---|---|---|---|---|---|---|
| 86.2 % v7 (old) | 11 / 2022 | Acer Swift X SFX16-52G-52VE i5-1240P, A370M | 1.8 kg | 21.3 mm | 16.00" | 2560x1600 | |
| 80.7 % v7 (old) | 09 / 2022 | Acer Aspire 5 A515-57G-53N8 i5-1240P, GeForce RTX 2050 Mobile | 1.8 kg | 18 mm | 15.60" | 1920x1080 | |
| 89.3 % v7 (old) | 09 / 2022 | Lenovo ThinkPad T16 G1 21BWS00200 i5-1240P, Iris Xe G7 80EUs | 1.9 kg | 20.5 mm | 16.00" | 1920x1200 | |
| 88 % v7 (old) | 06 / 2022 | Asus ZenBook Flip 15 Q539ZD i7-12700H, A370M | 1.8 kg | 18.9 mm | 15.60" | 2880x1620 | |
| 82.8 % v7 (old) | 10 / 2022 | Lenovo IdeaPad Gaming 3 15IAH7 i5-12500H, GeForce RTX 3050 Ti Laptop GPU | 2.4 kg | 26 mm | 15.60" | 1920x1080 | |
| 86 % v7 (old) | 04 / 2022 | HP Omen 16-c0077ng R7 5800H, Radeon RX 6600M | 2.3 kg | 26 mm | 16.10" | 2560x1440 | |
| 88.4 % v7 (old) | 09 / 2022 | Lenovo ThinkBook 16 G4+ IAP i7-12700H, GeForce RTX 2050 Mobile | 1.8 kg | 16.5 mm | 16.00" | 2560x1600 |
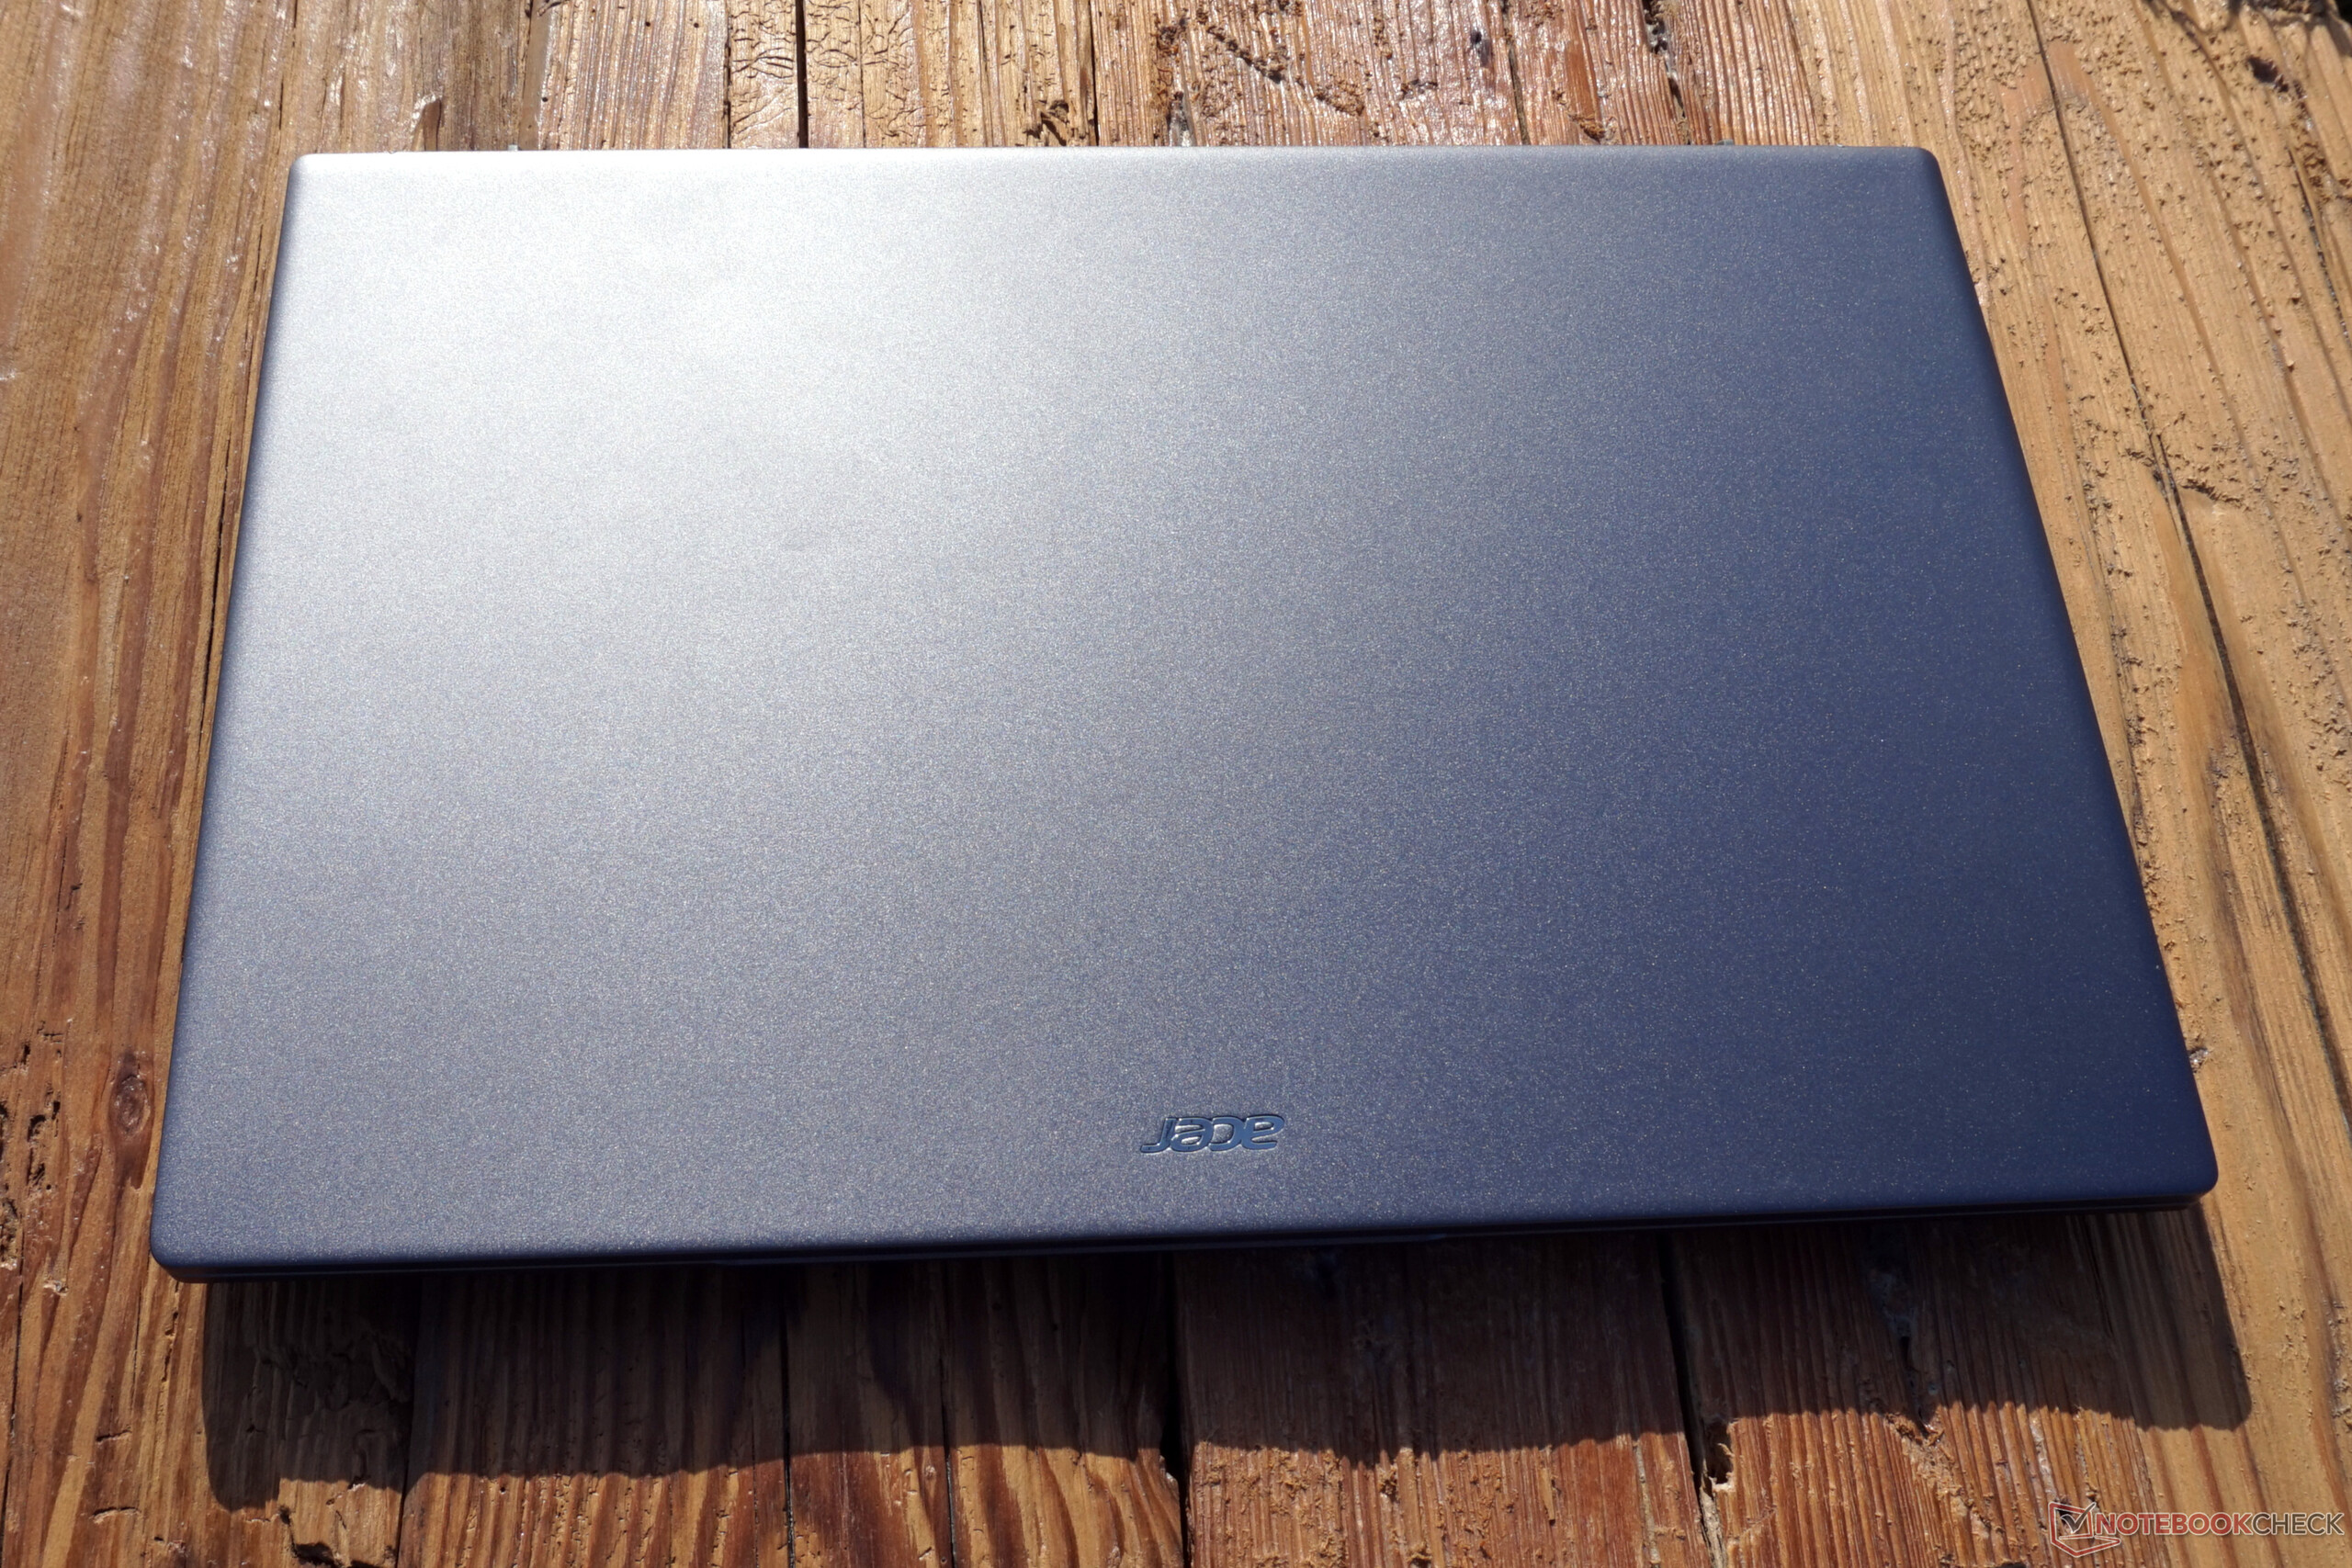
Case – The Swift X is rather discreet
The Swift X appears sophisticated and, above all, robust in the hands. The keyboard frame and metal display cover ensure a good impression. However, the top can be pressed in a little too easily for our liking. The fact that the base is made of plastic is also immediately noticeable. The screen's bezel is a drawback, as its black plastic does not match the otherwise rather elegant look at all.
Overall, the housing is pleasantly firm. The display opens with slight resistance even one-handed and is difficult to deform. From an opening angle of 90°, the edge of the screen, which also has two feet, rests on the desk, which, in addition to a stable stand, also creates better conditions for the air supply.
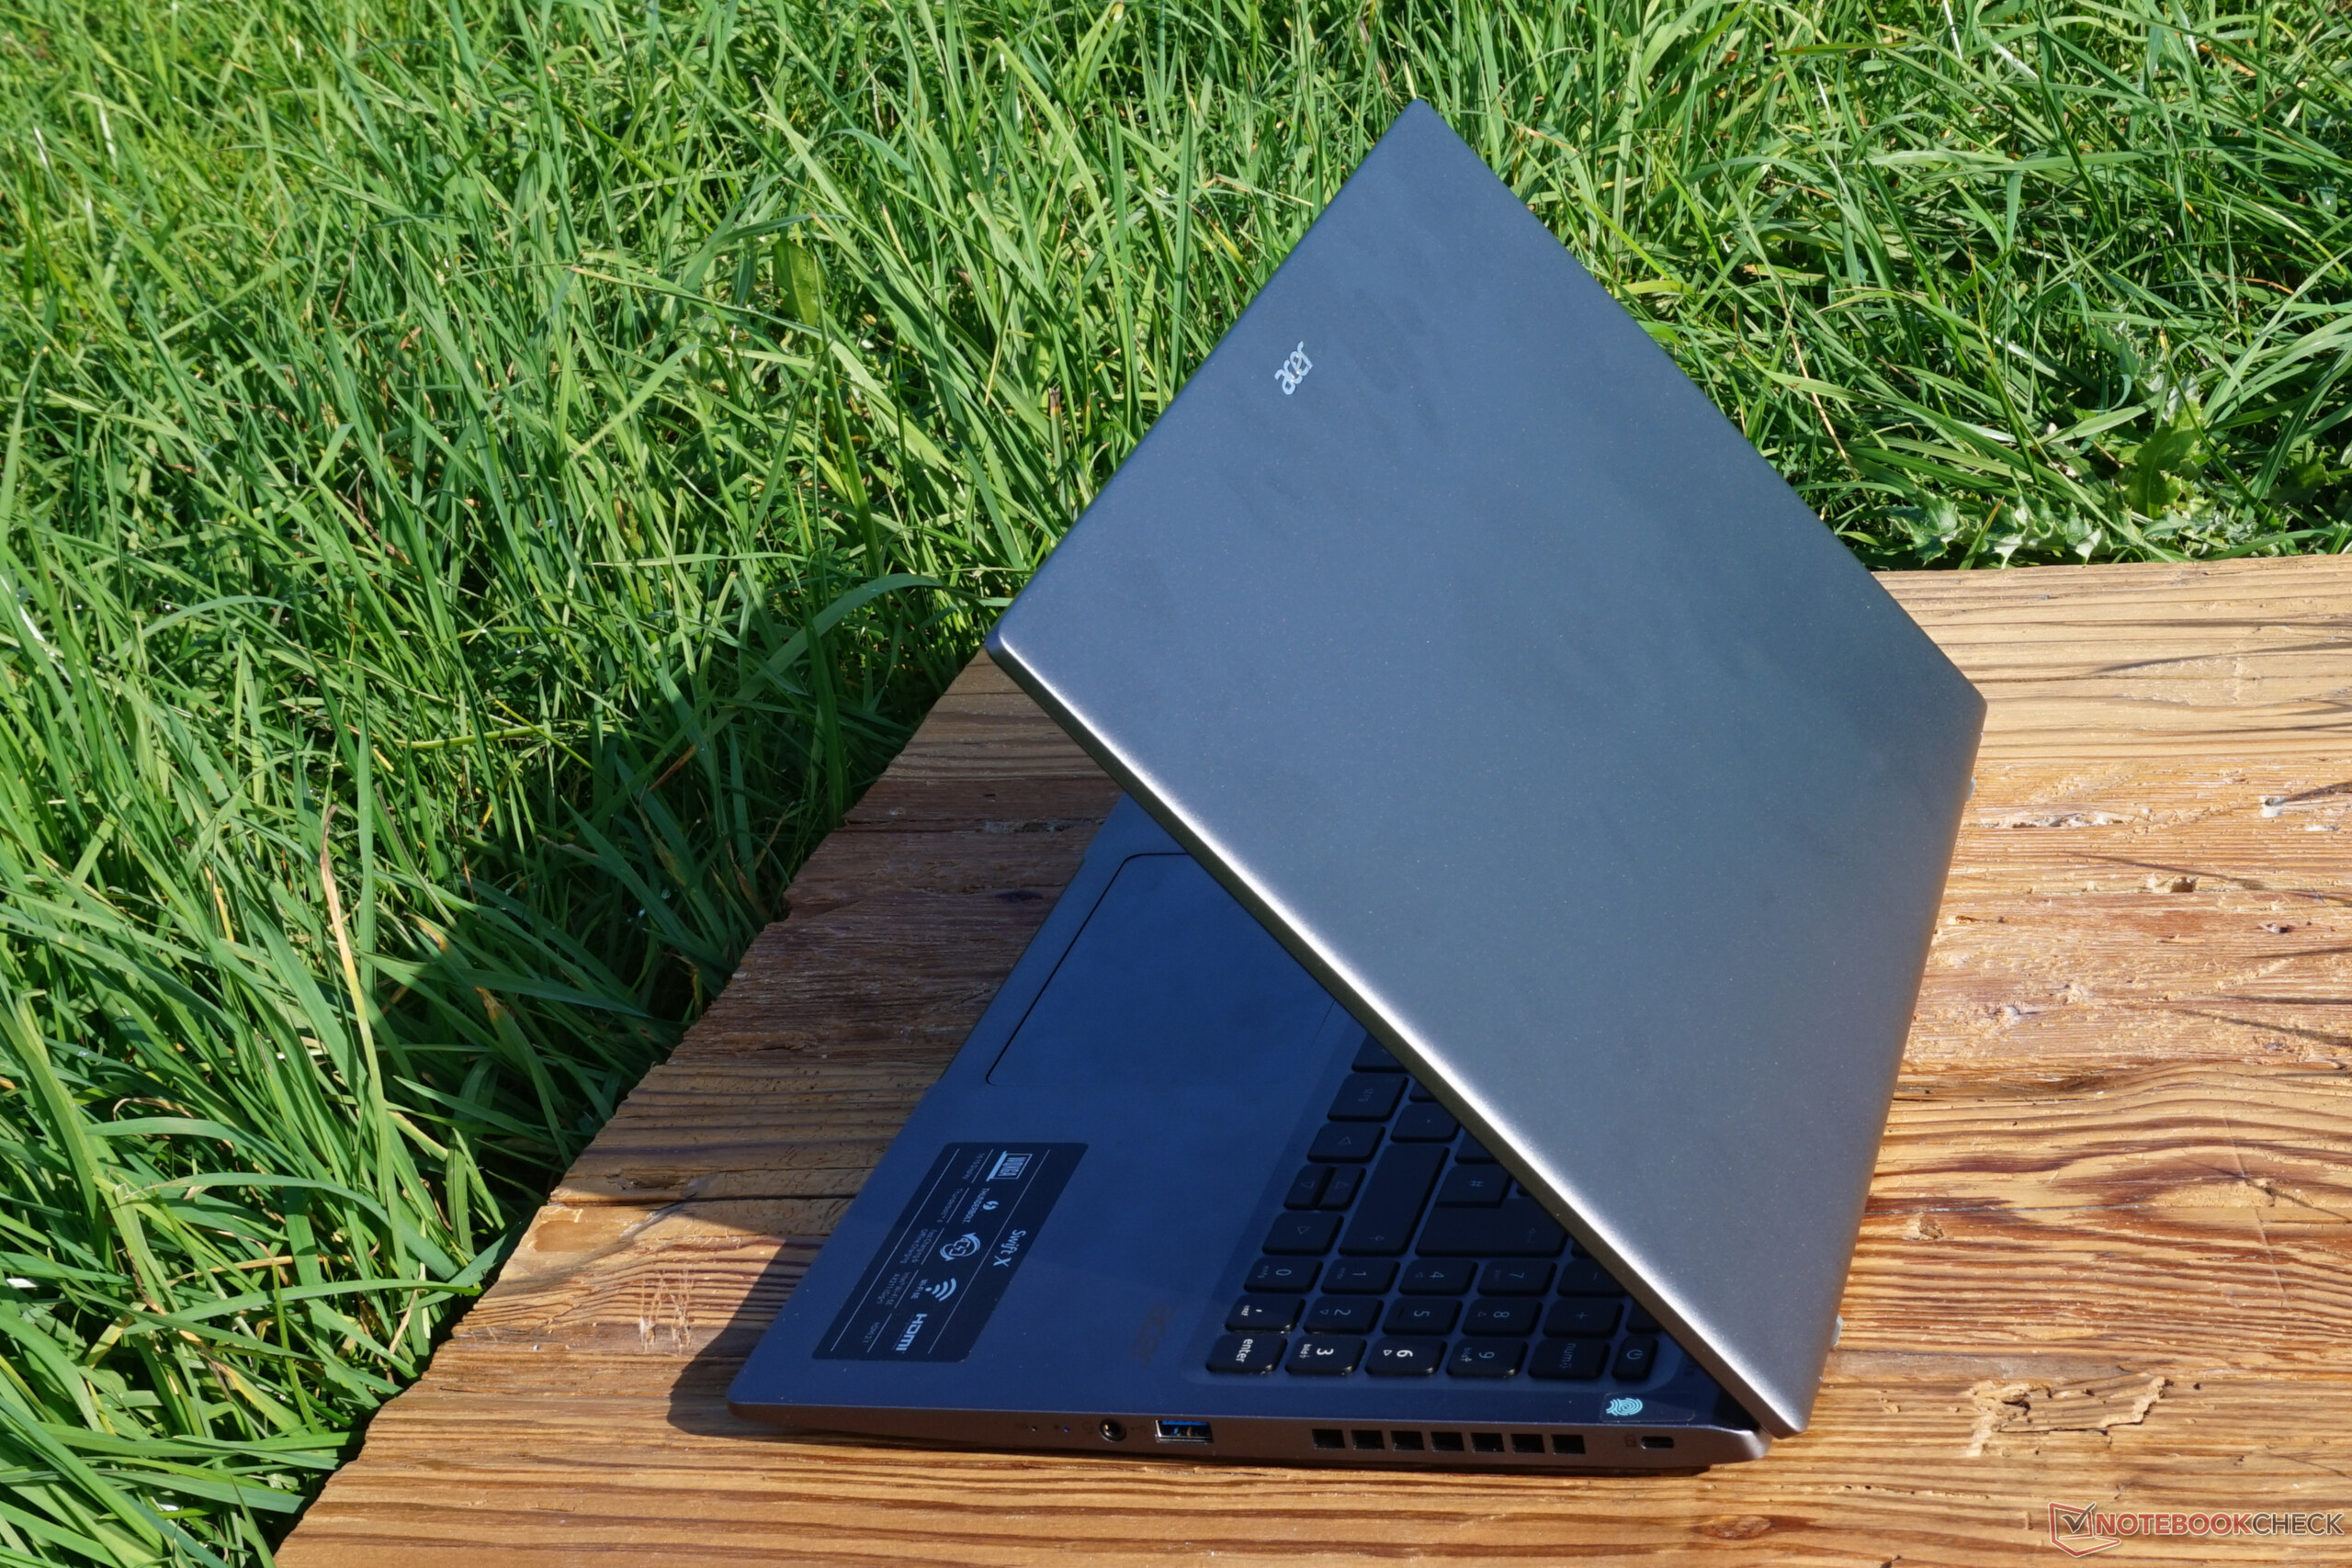
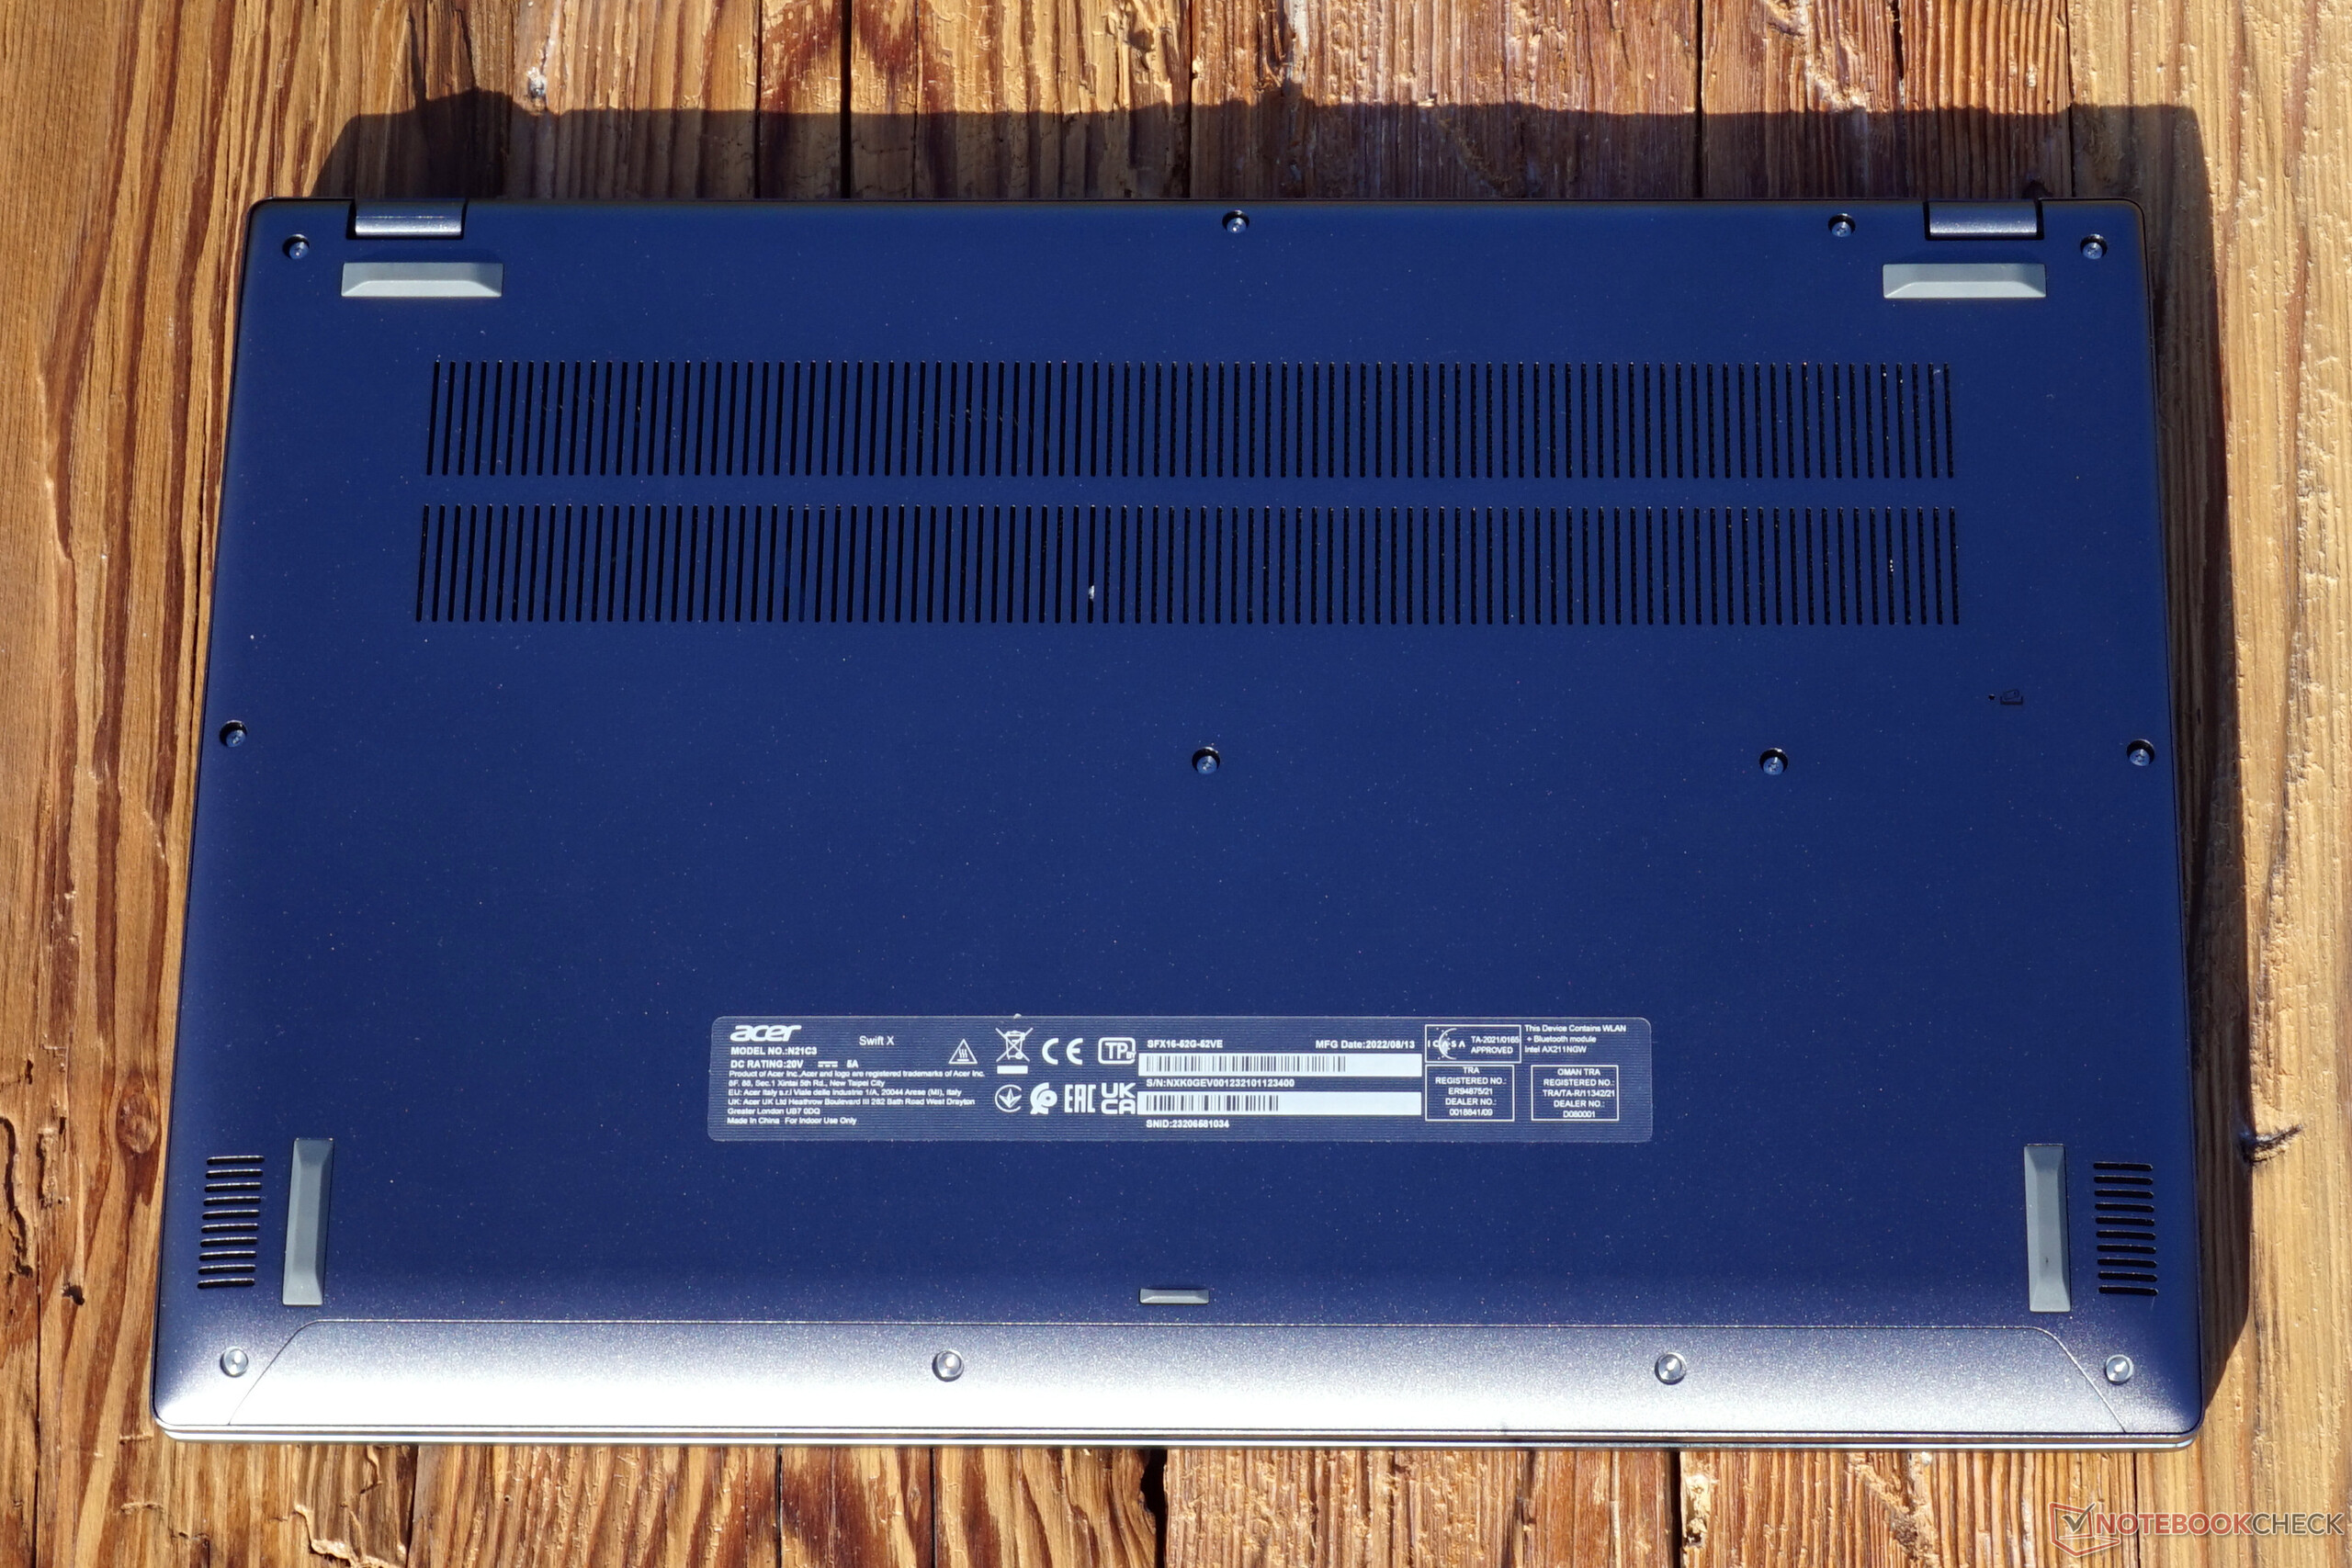
Given the features and a screen diagonal of 16 inches, the weight is restrained at 1.8 kg, which is also due to a few too many plastic components. Thanks to pleasantly narrow screen edges, the laptop's housing is compact and should easily fit into many 15-inch notebook cases.
On paper, the Acer Swift X is one of the thinner devices in its class. That's exactly why we had to measure it several times. Instead of the 17.9 mm specified by Acer, we measure 21.3 mm at the rear and 20.1 mm at the front. The much better value that Acer claims is nowhere to be found. But maybe it's just a database error on their website.
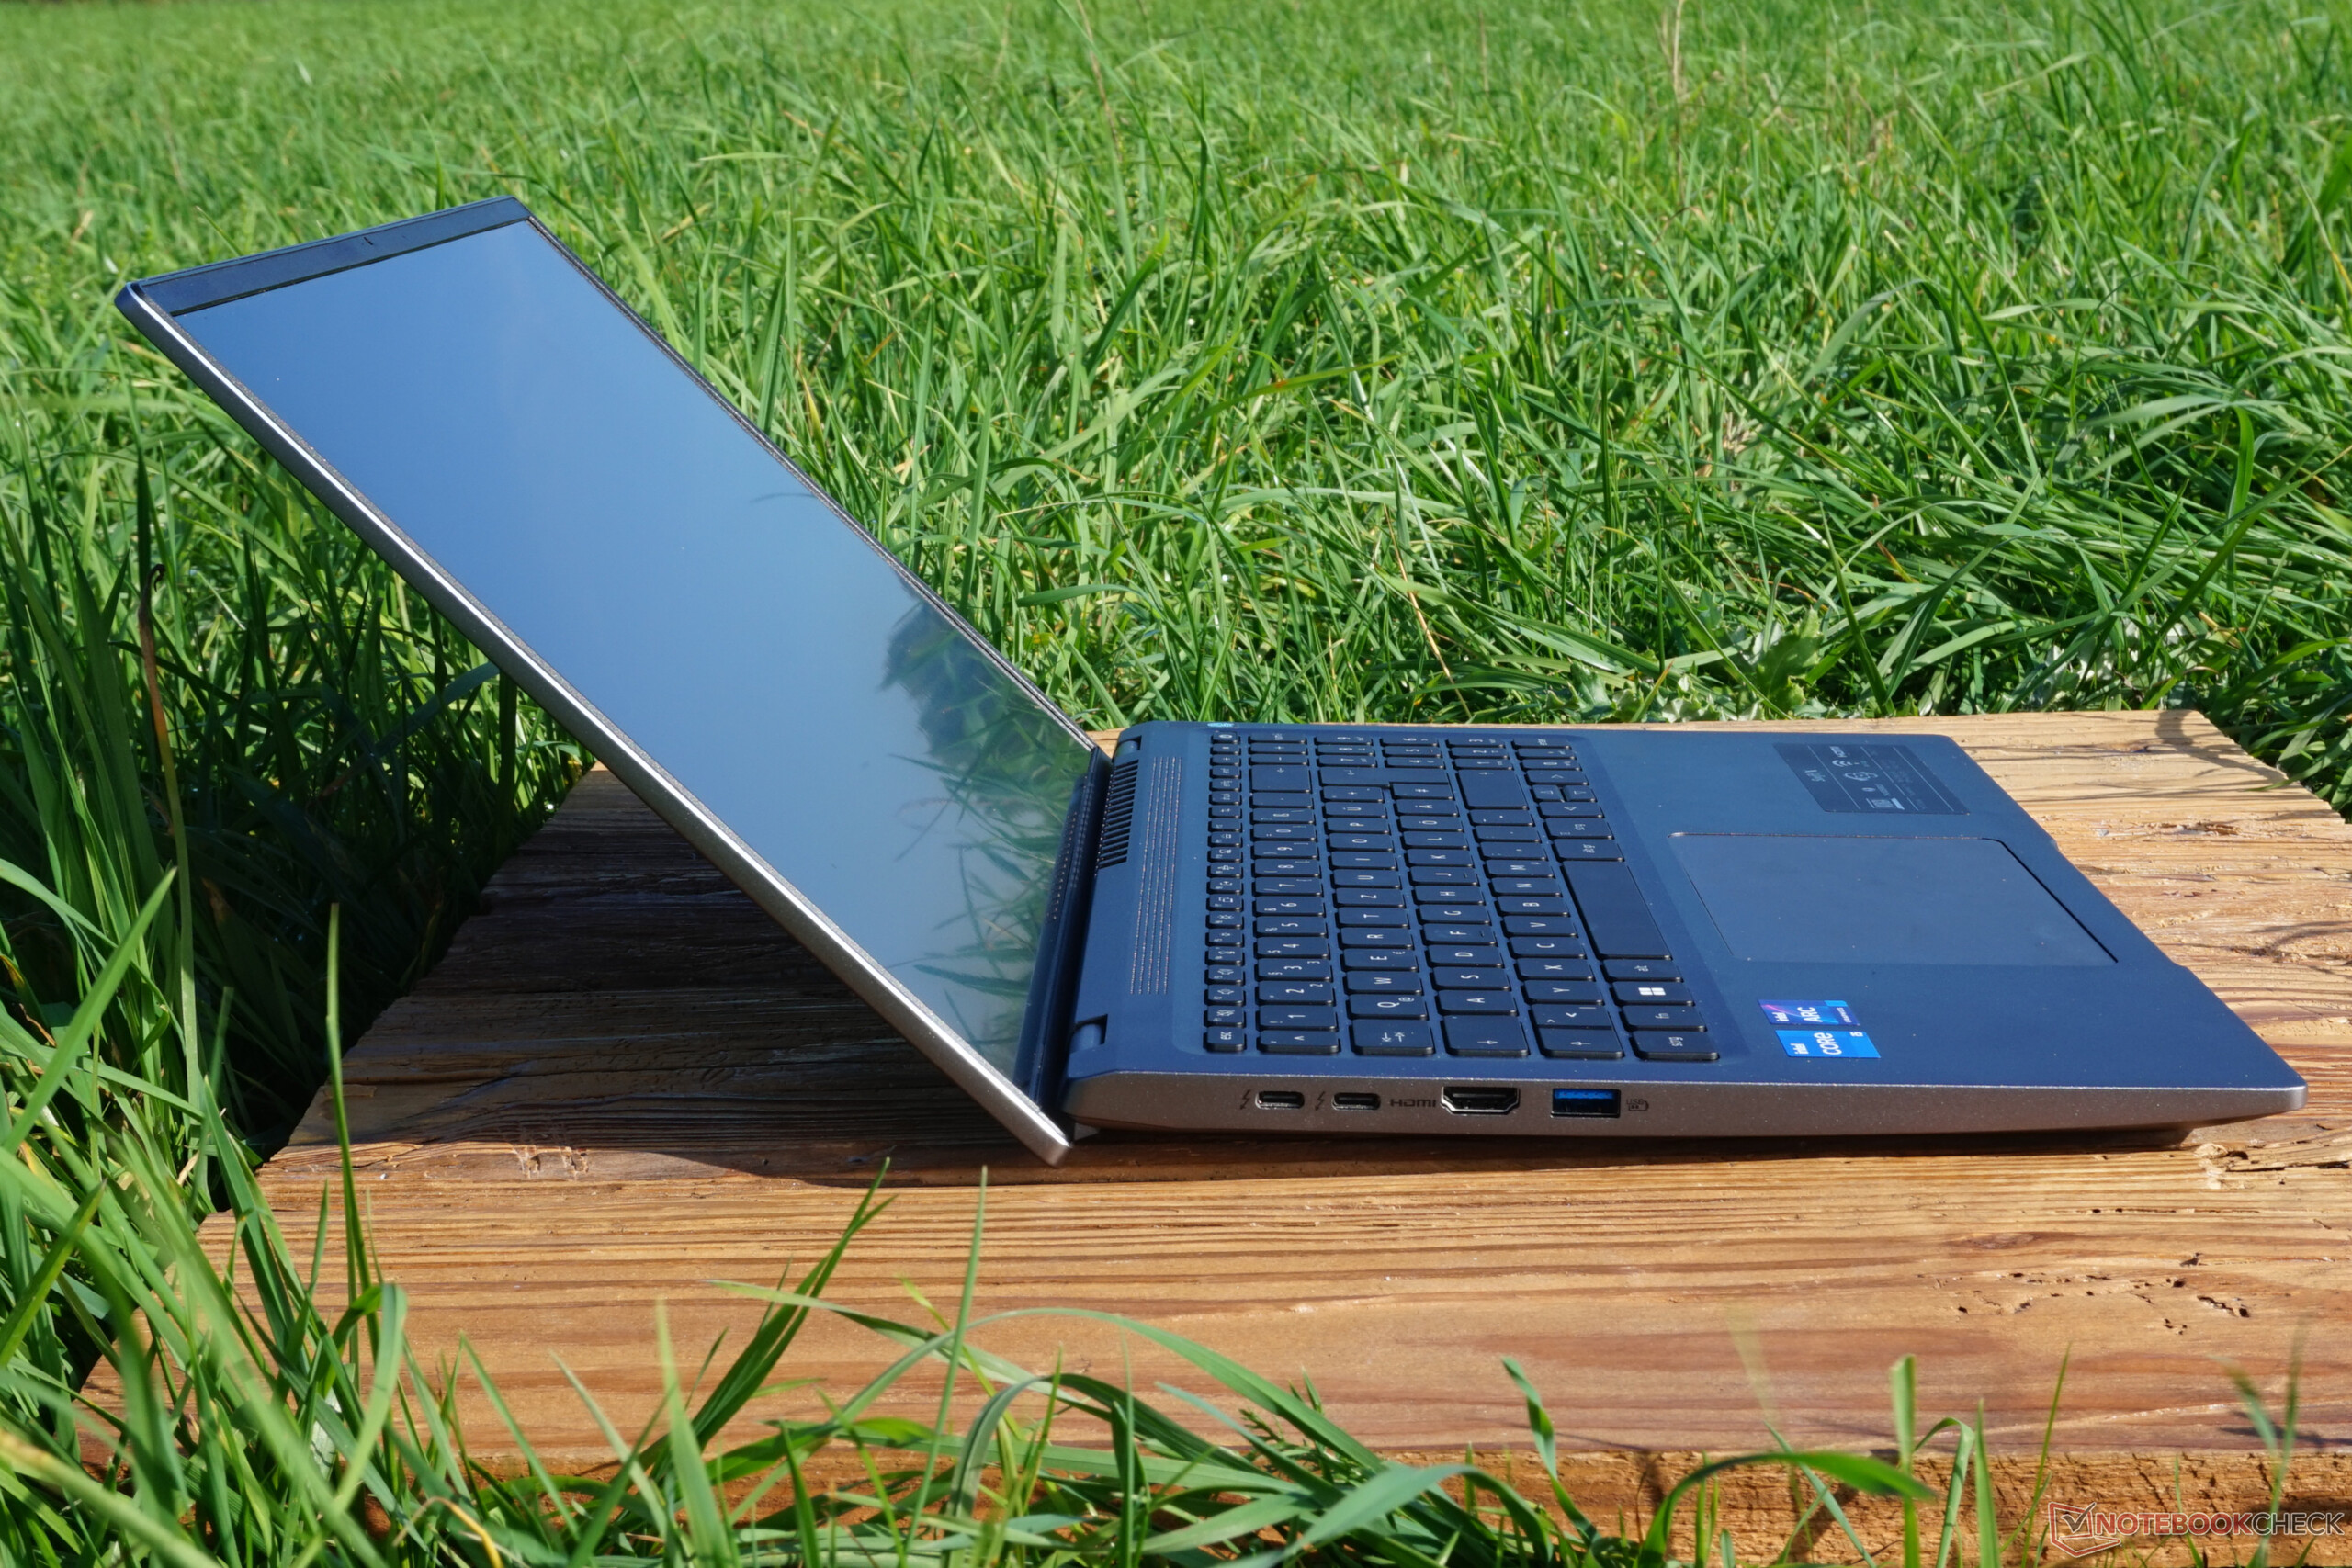
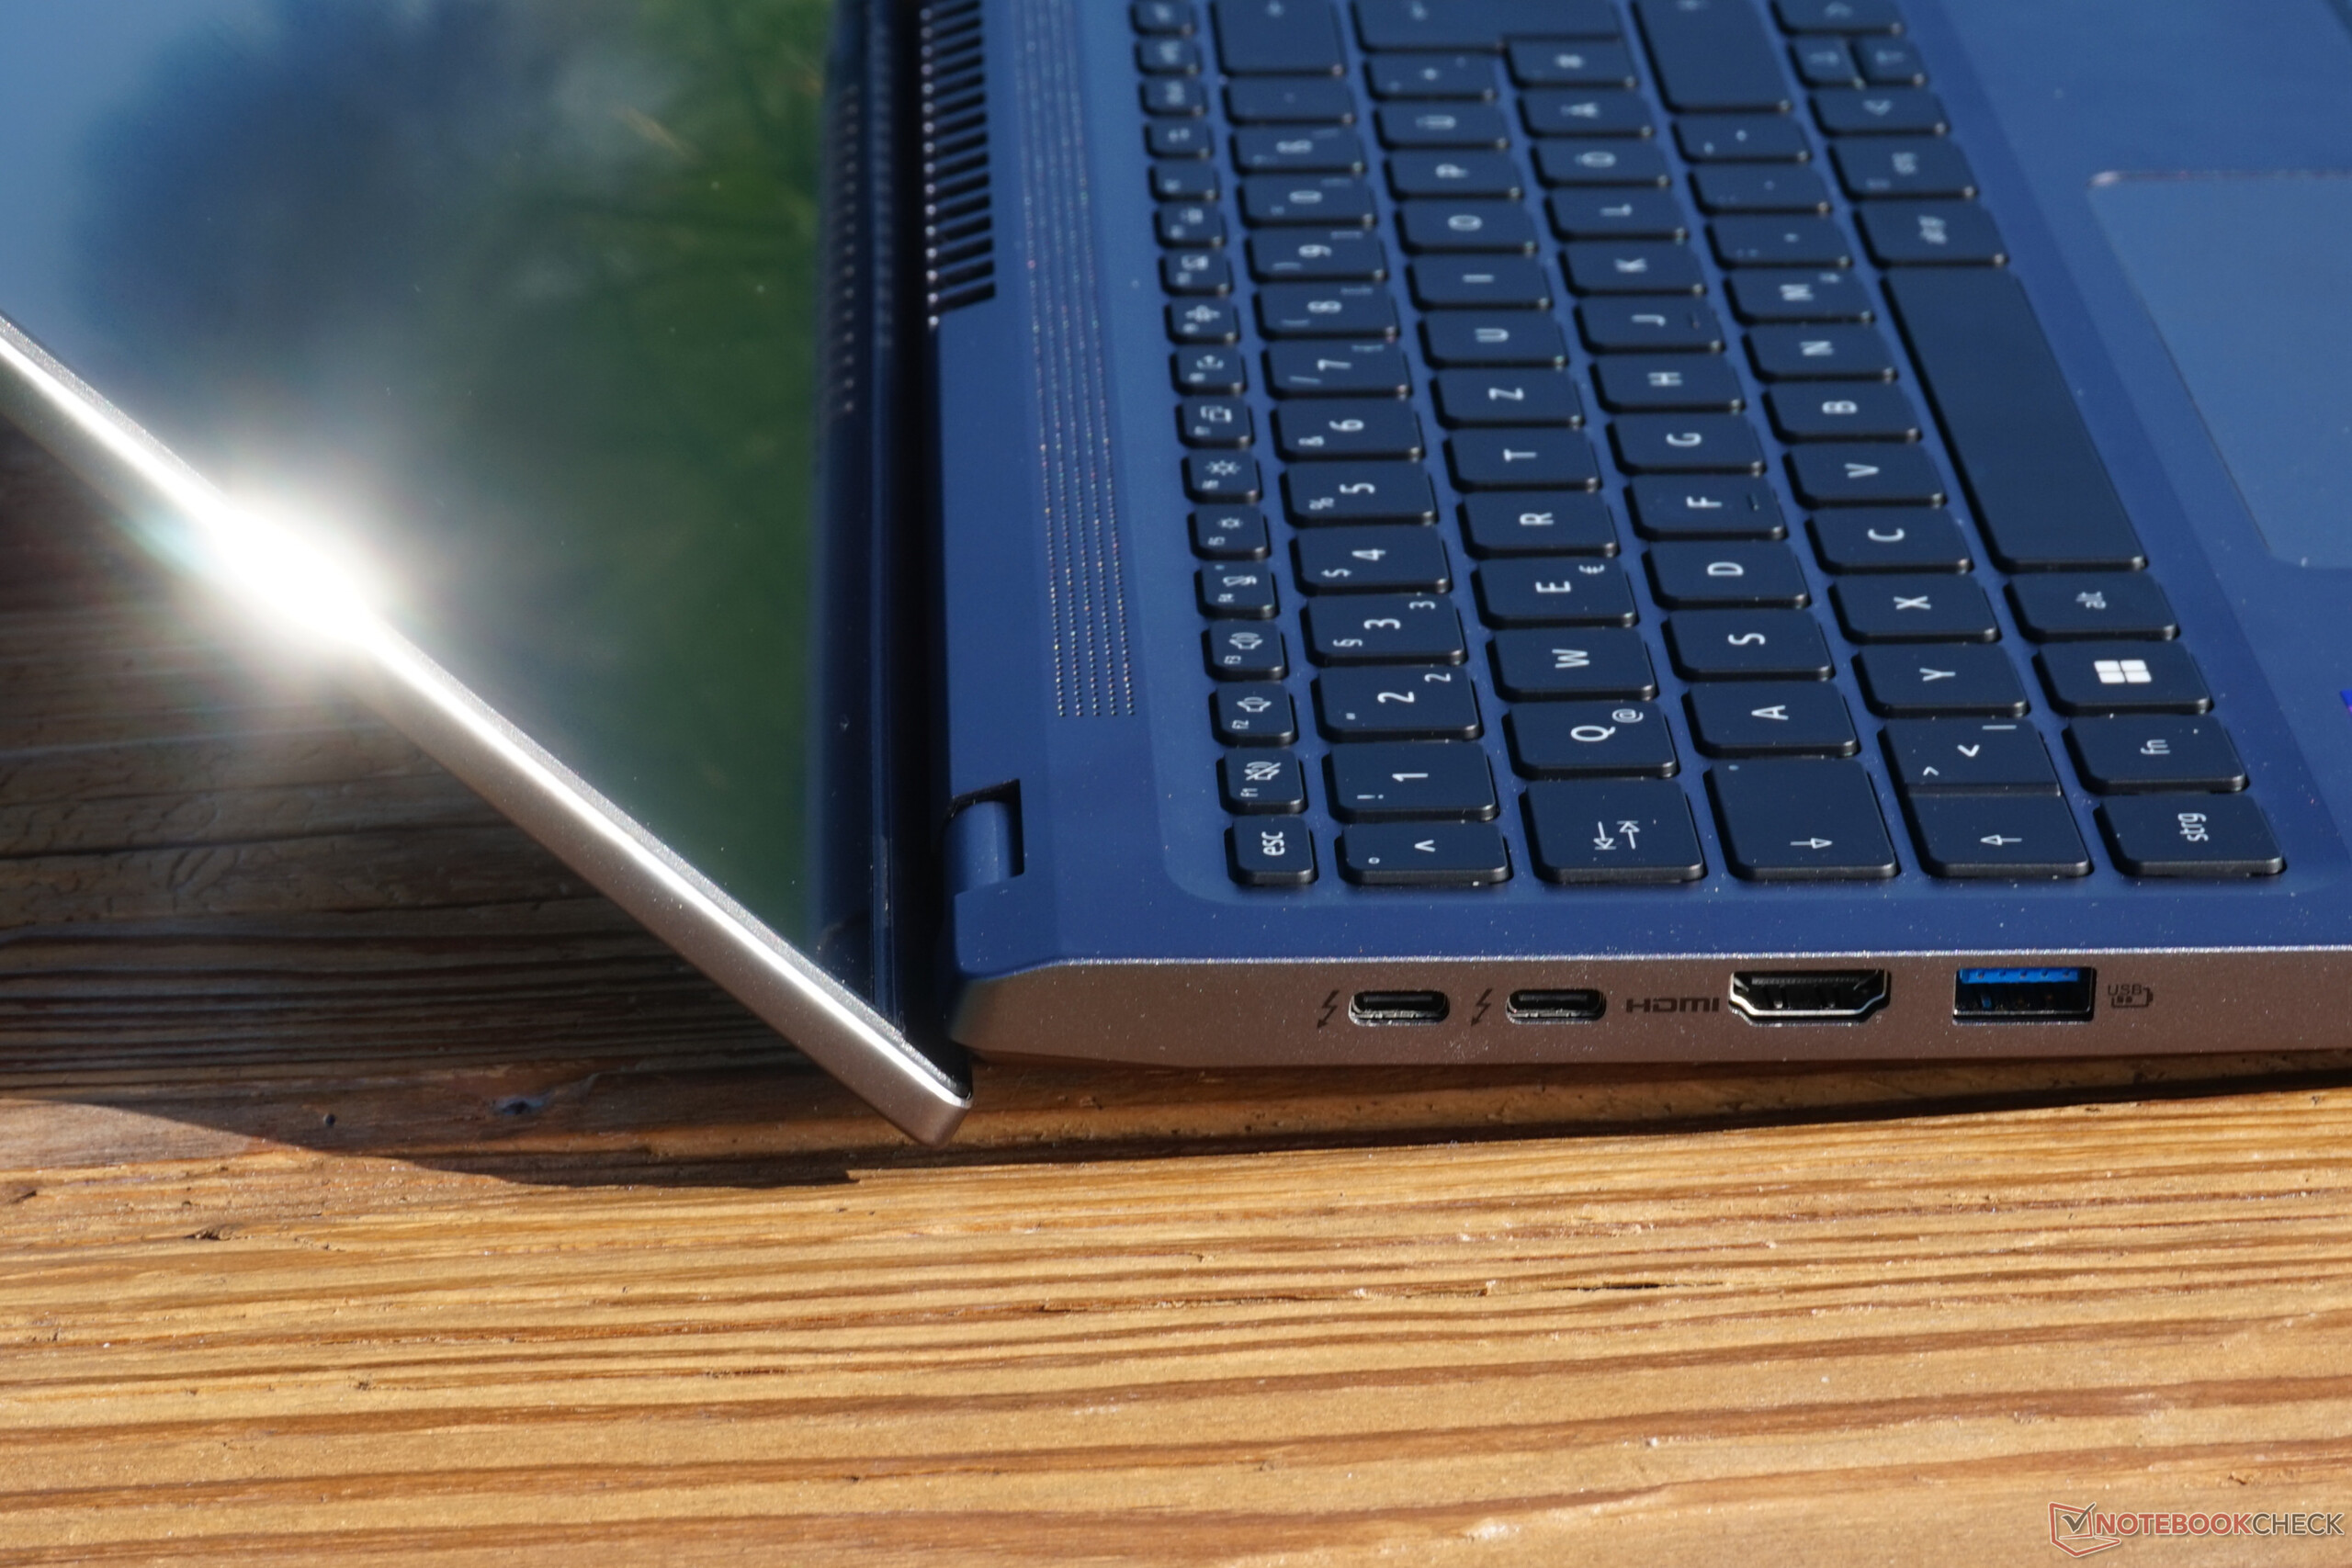
Features – A multimedia notebook with TB4, but not much else
Thunderbolt 4 x 2 may be highlighted in any case. The laptop can be charged using both ports. The maximum transfer rates of 40 Gbit/s also allow connection to high-performance peripherals. In addition, there is another special feature: the USB-A port on the left is always supplied with power. Even when the laptop is completely switched off, the port can be used, for example, for charging your smartphone.
Otherwise, thriftiness tends to prevail. Another USB-A connector on the right, as well as HDMI for the connection to the TV and an analog headset port, are all you get. There is no card slot or LAN port.


Communication
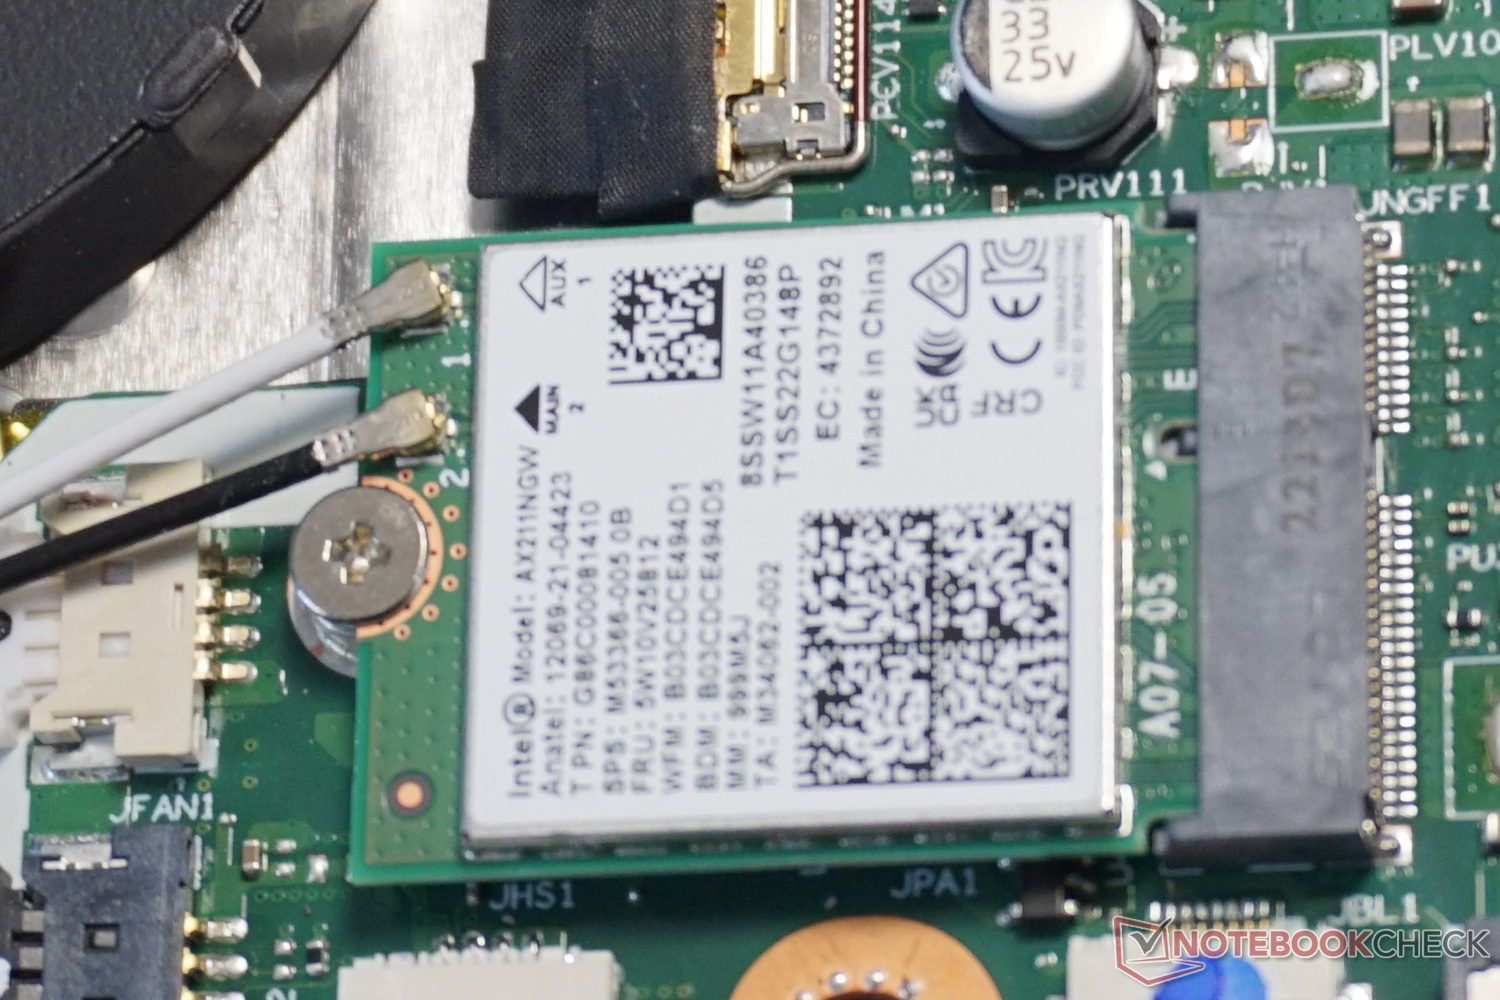
The replaceable Intel AX211 WLAN module behaves according to expectations. The transmission rate remains at a consistently high level when tested and can also be ranked as slightly above average. With a sufficiently good WLAN signal, the lack of a LAN port is hardly an issue.
Webcam
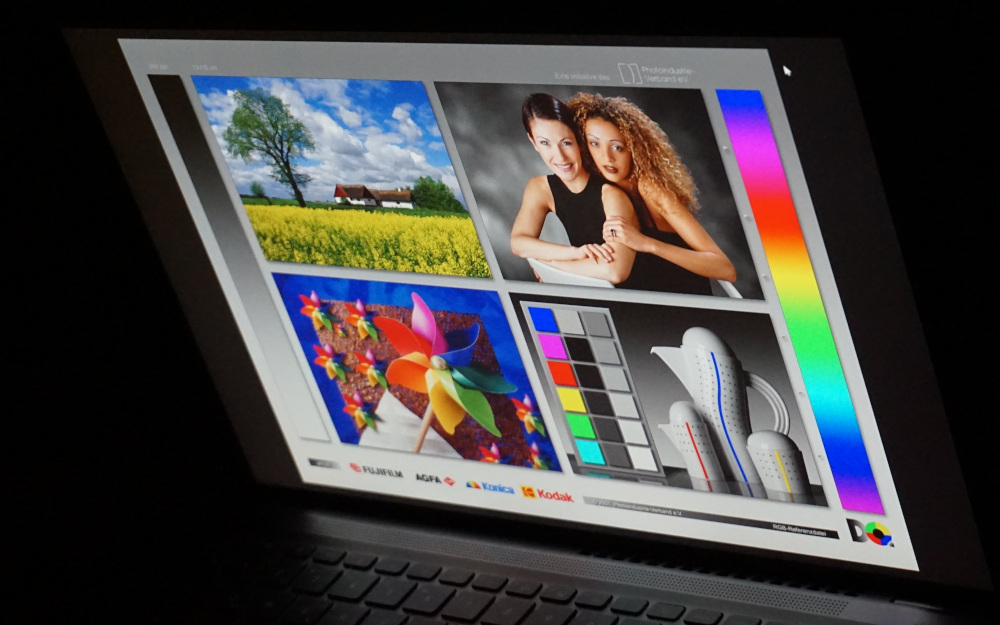
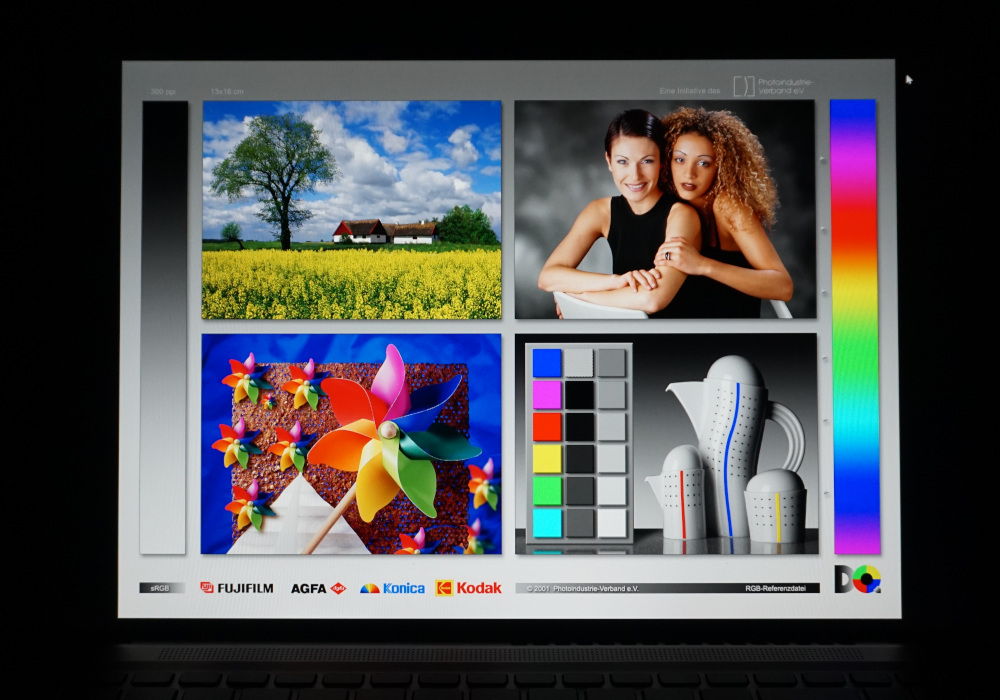
Comparatively high-quality video calls are possible thanks to the full HD resolution. What is striking, however, is the involuntary brightening effect, even with slight changes in the illumination. A cloud or turning on a lamp nearby is enough to trigger an unpleasant flickering. This is easy to see on our color comparison chart. The fields with a particularly significant color deviation are simply brightened by the camera, because it actually takes decent pictures.
At least the microphone is fully convincing. In the test, it picked up the voice with little distortion, almost regardless of which direction the voice came from and how far away the notebook was.


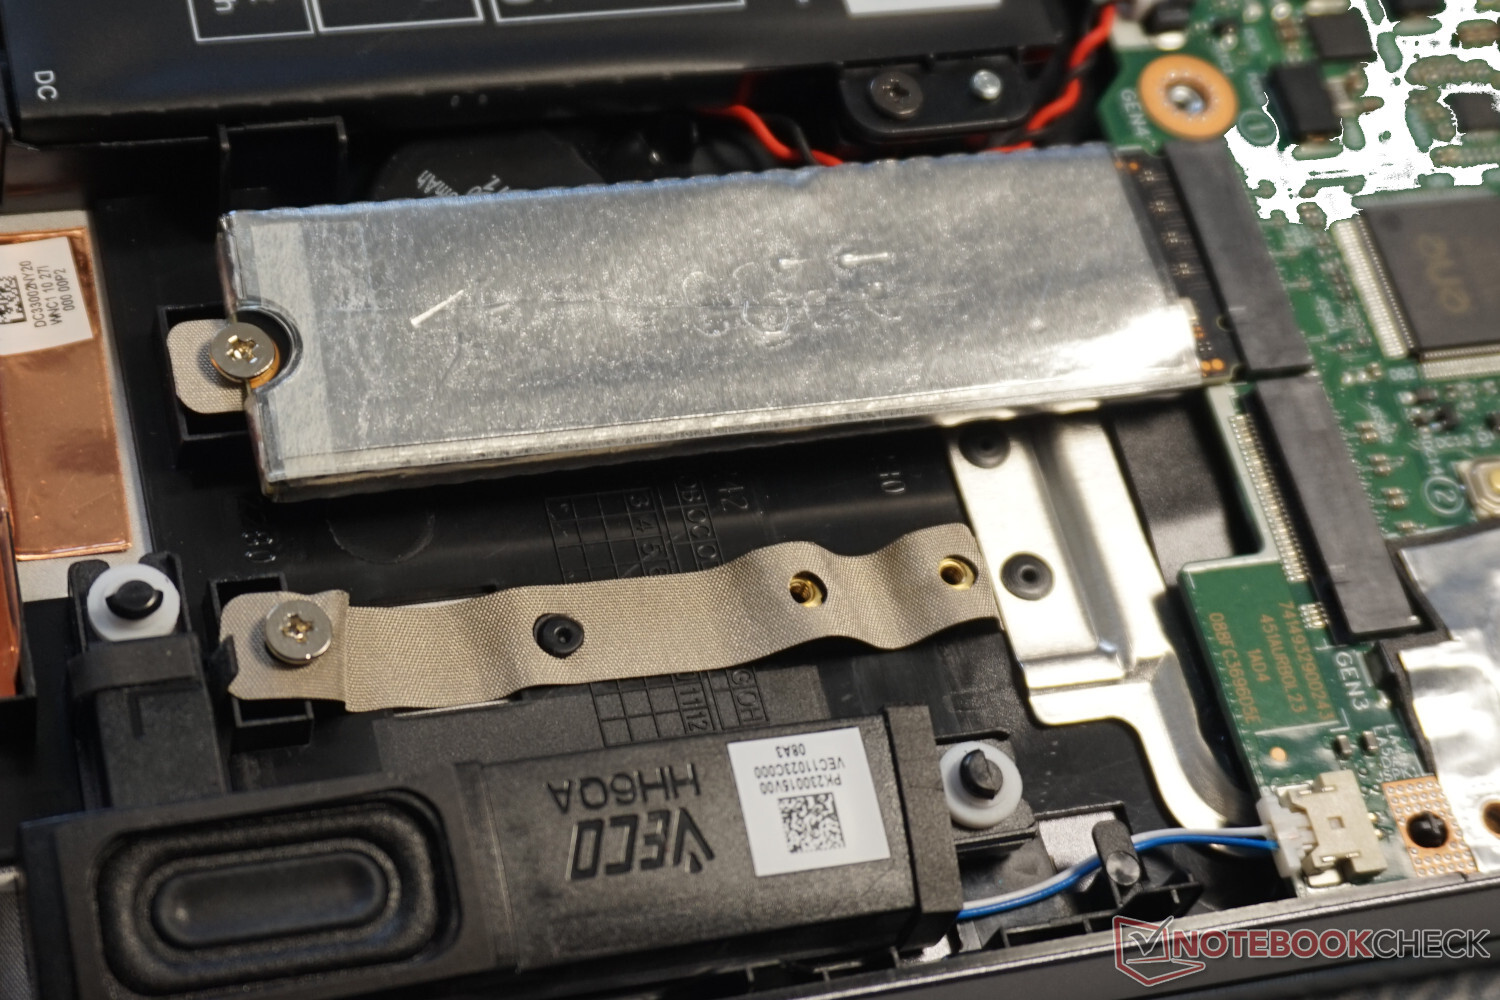
Maintenance
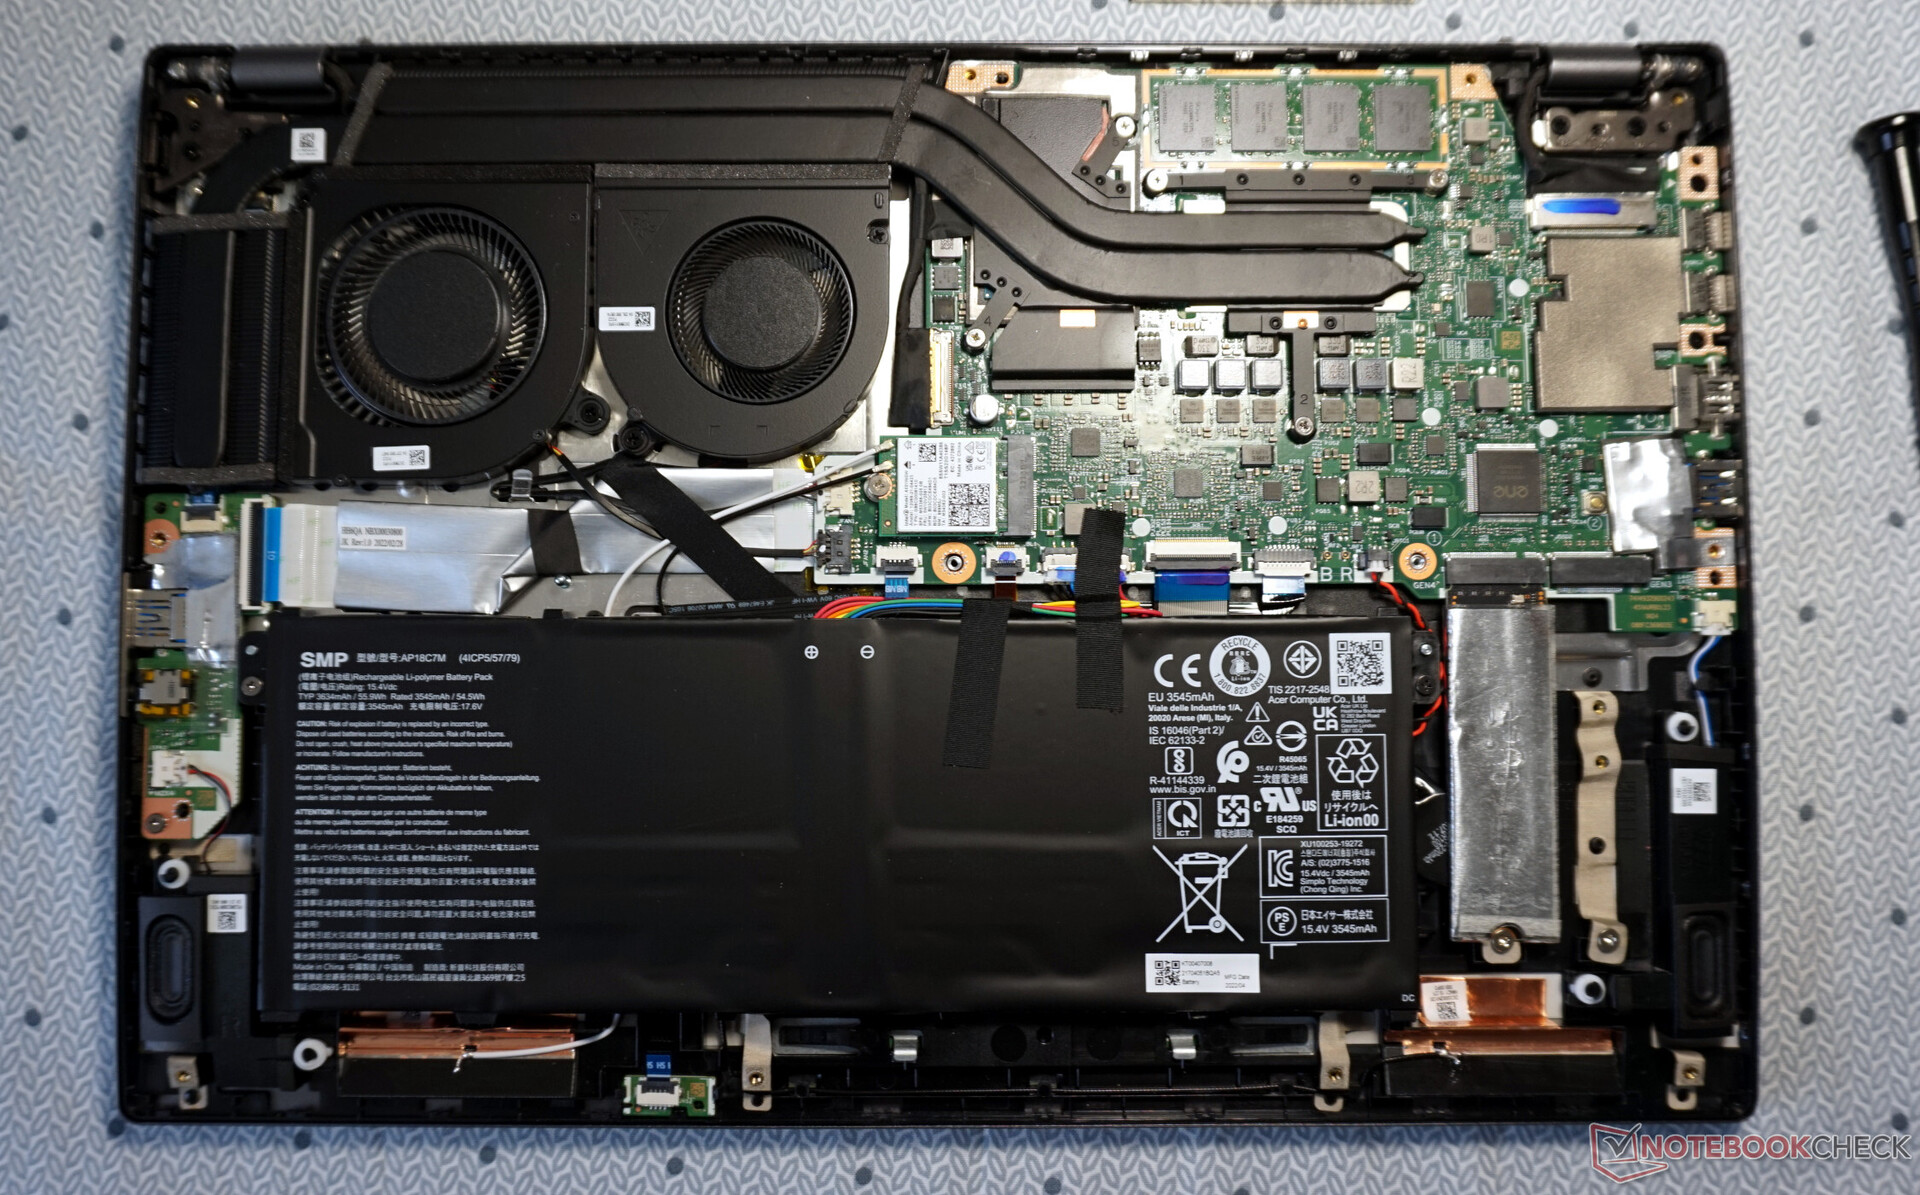
After removing the twelve Torx screws, careful loosening of the base plate is sufficient. This is locked all around with the help of plastic clips, but very evenly and not too tightly.
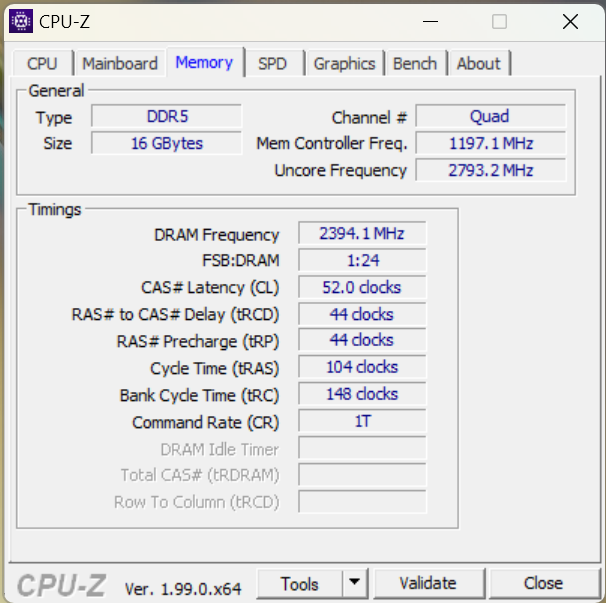
The battery, M.2 SSD and WLAN module can be replaced. Upgrading the memory is even simpler. Besides the standard SSD, an additional slot is free, which, in combination with the comparatively easy access, makes such an upgrade seem realistic even for non-professionals. The RAM, on the other hand, is soldered onto the motherboard, which is why the exclusively available 16 GB is unalterable.
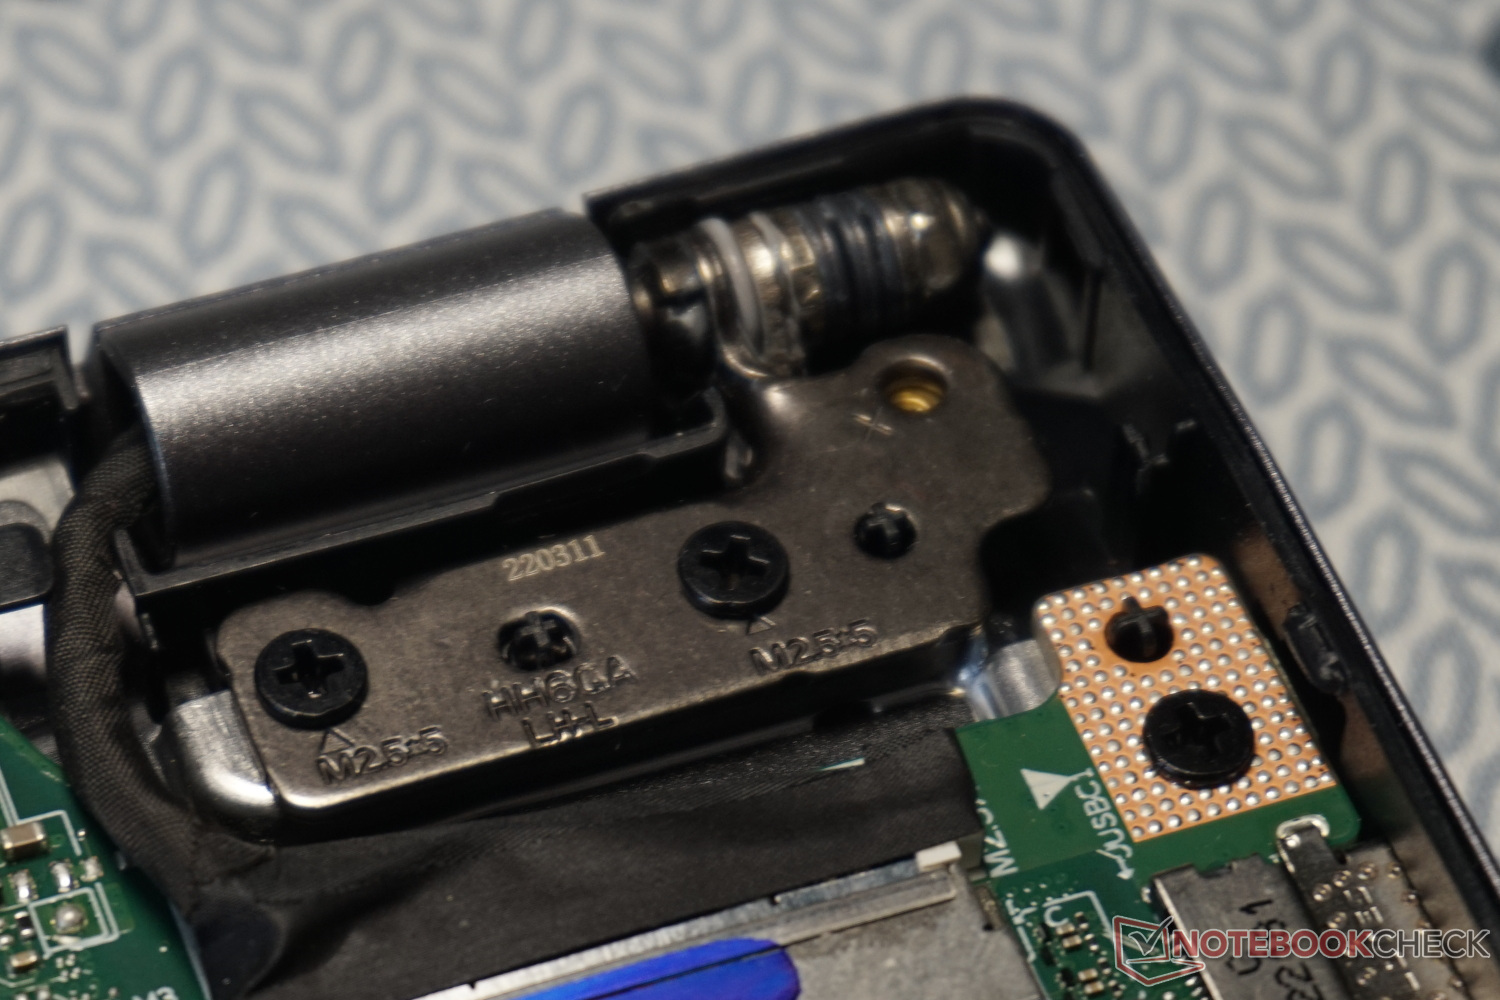
The hinges and their screw connections are a little too delicate. In other, but generally also more expensive laptops, this issue is resolved in a more extensive and therefore also more stable way.
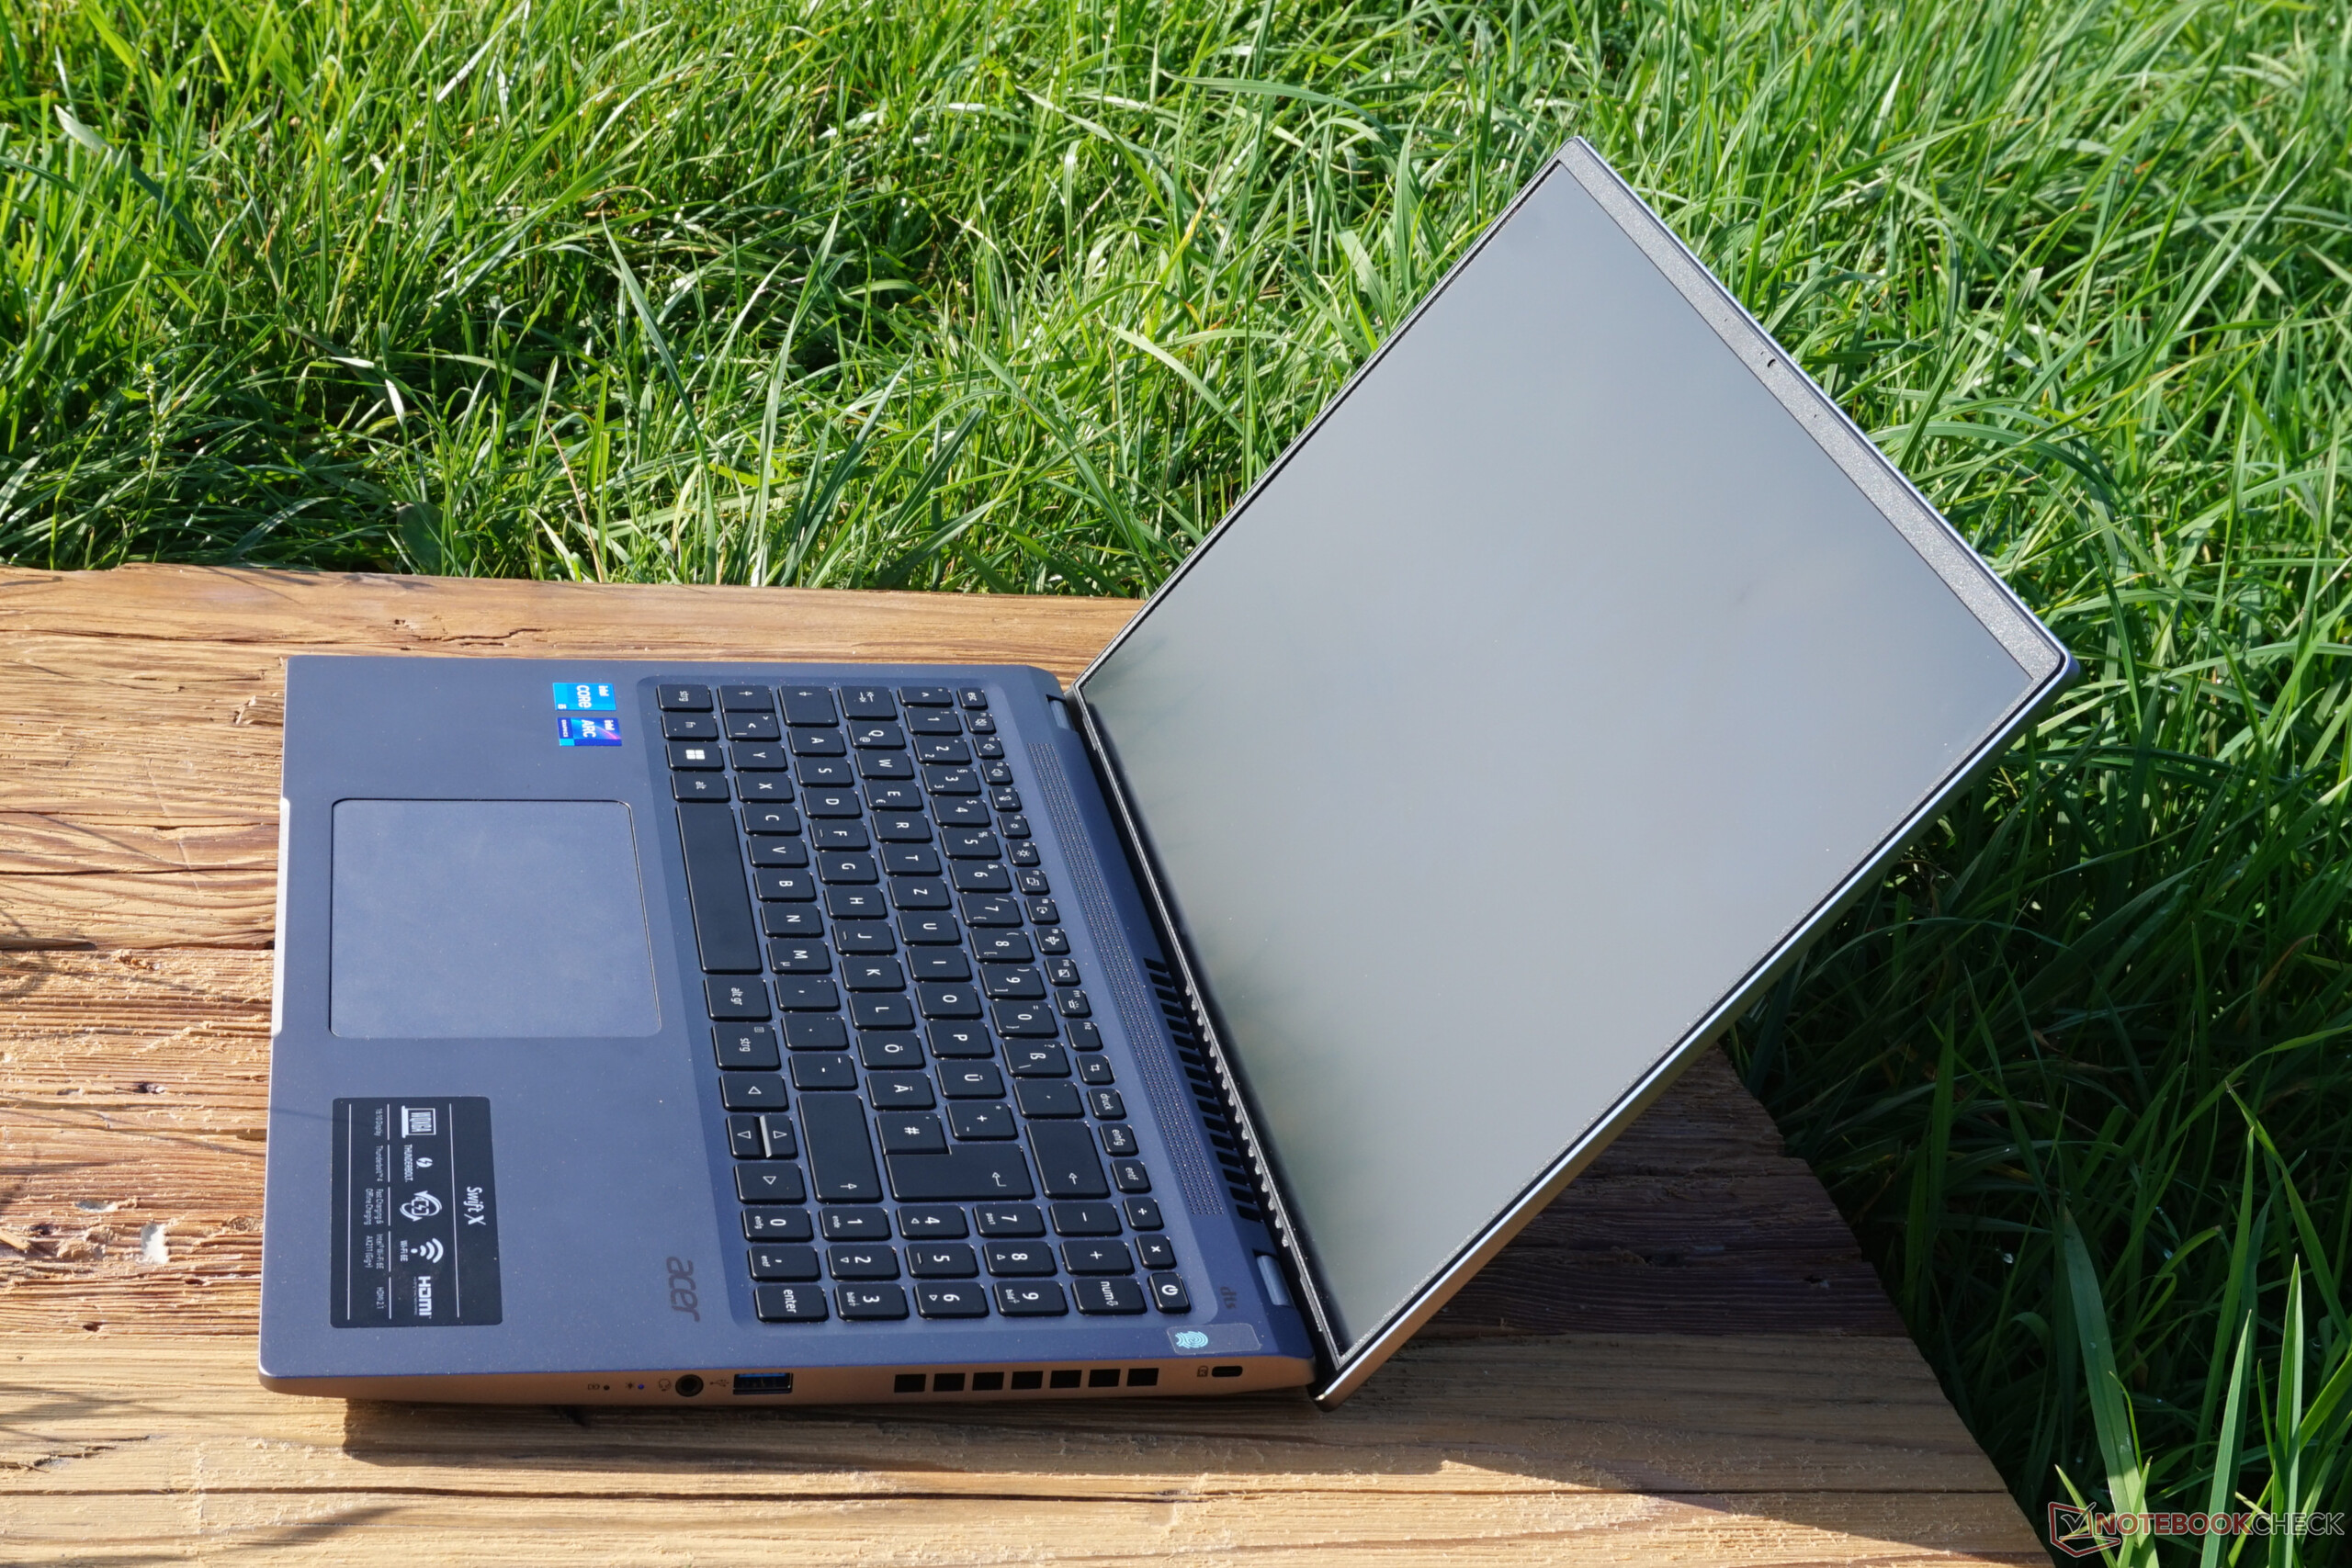
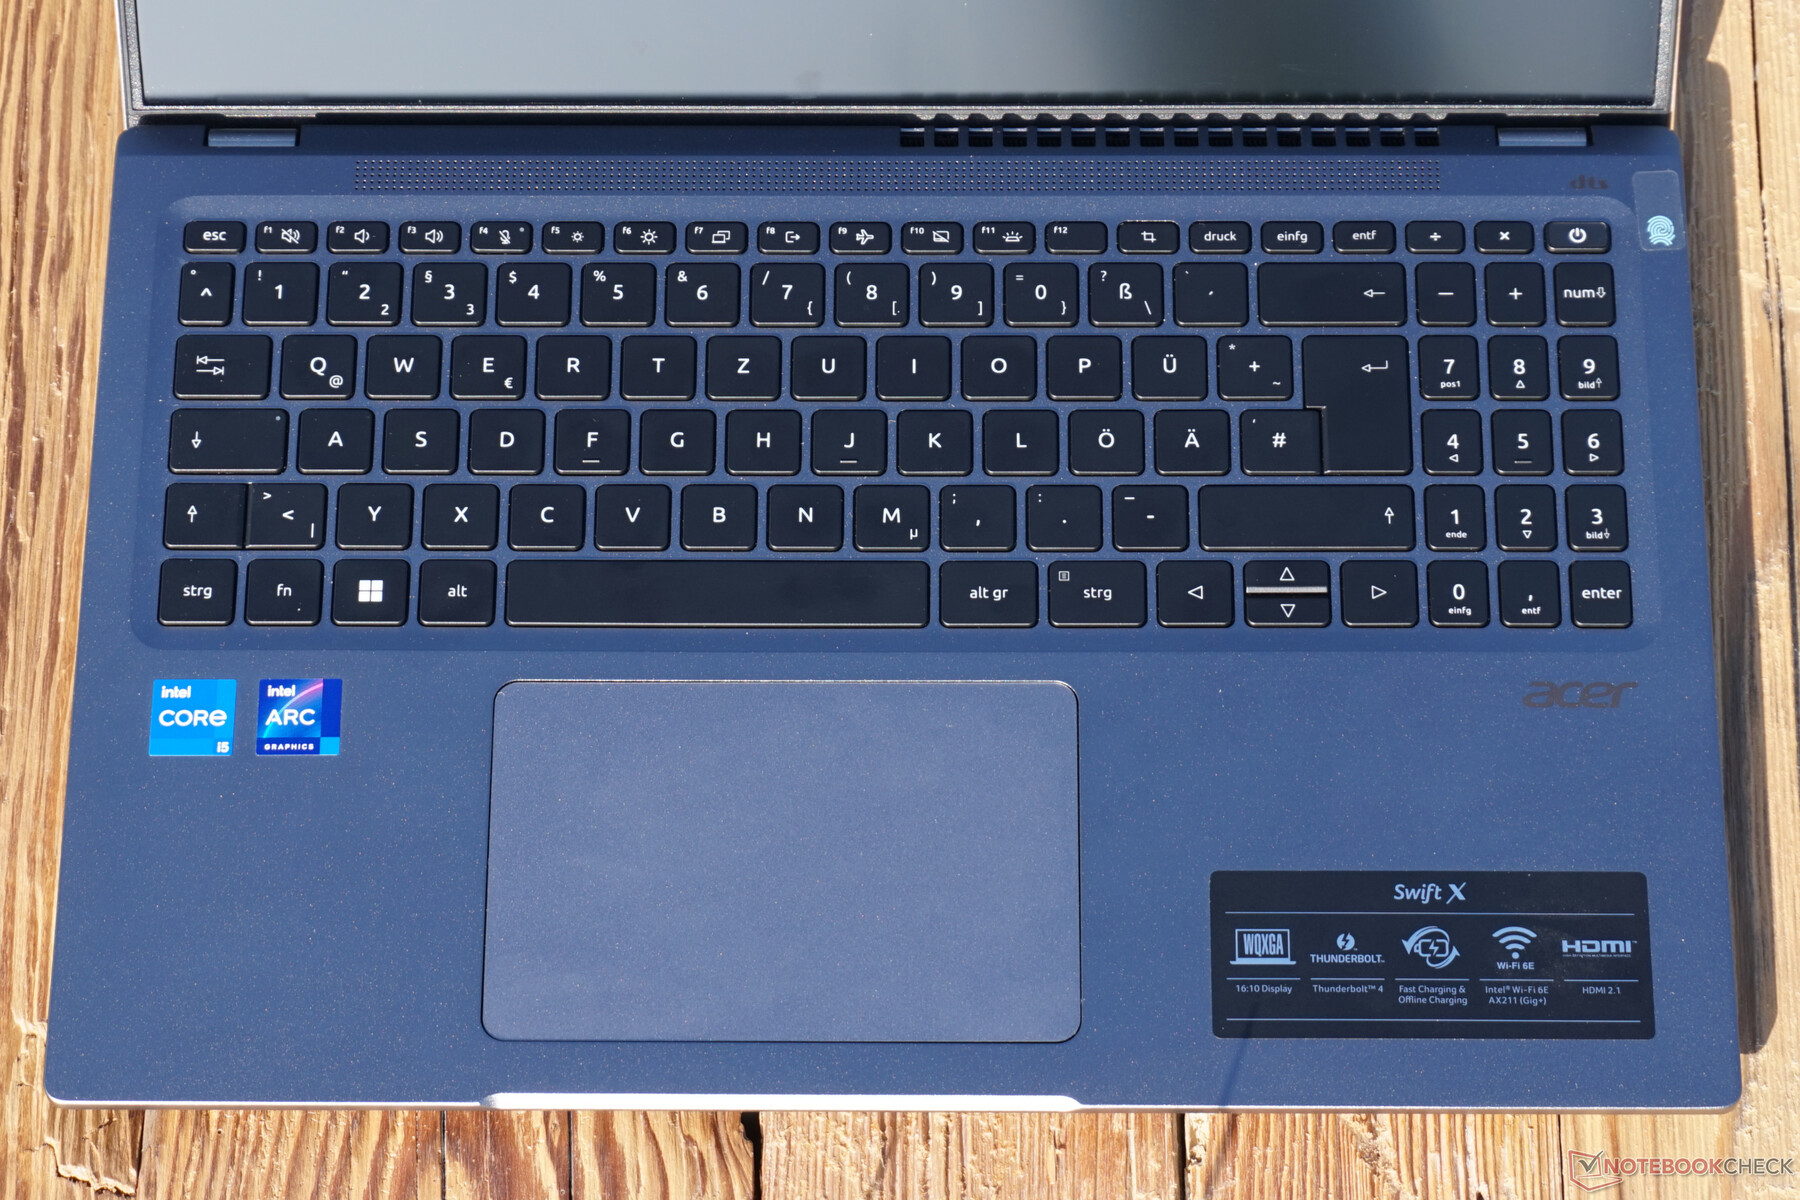
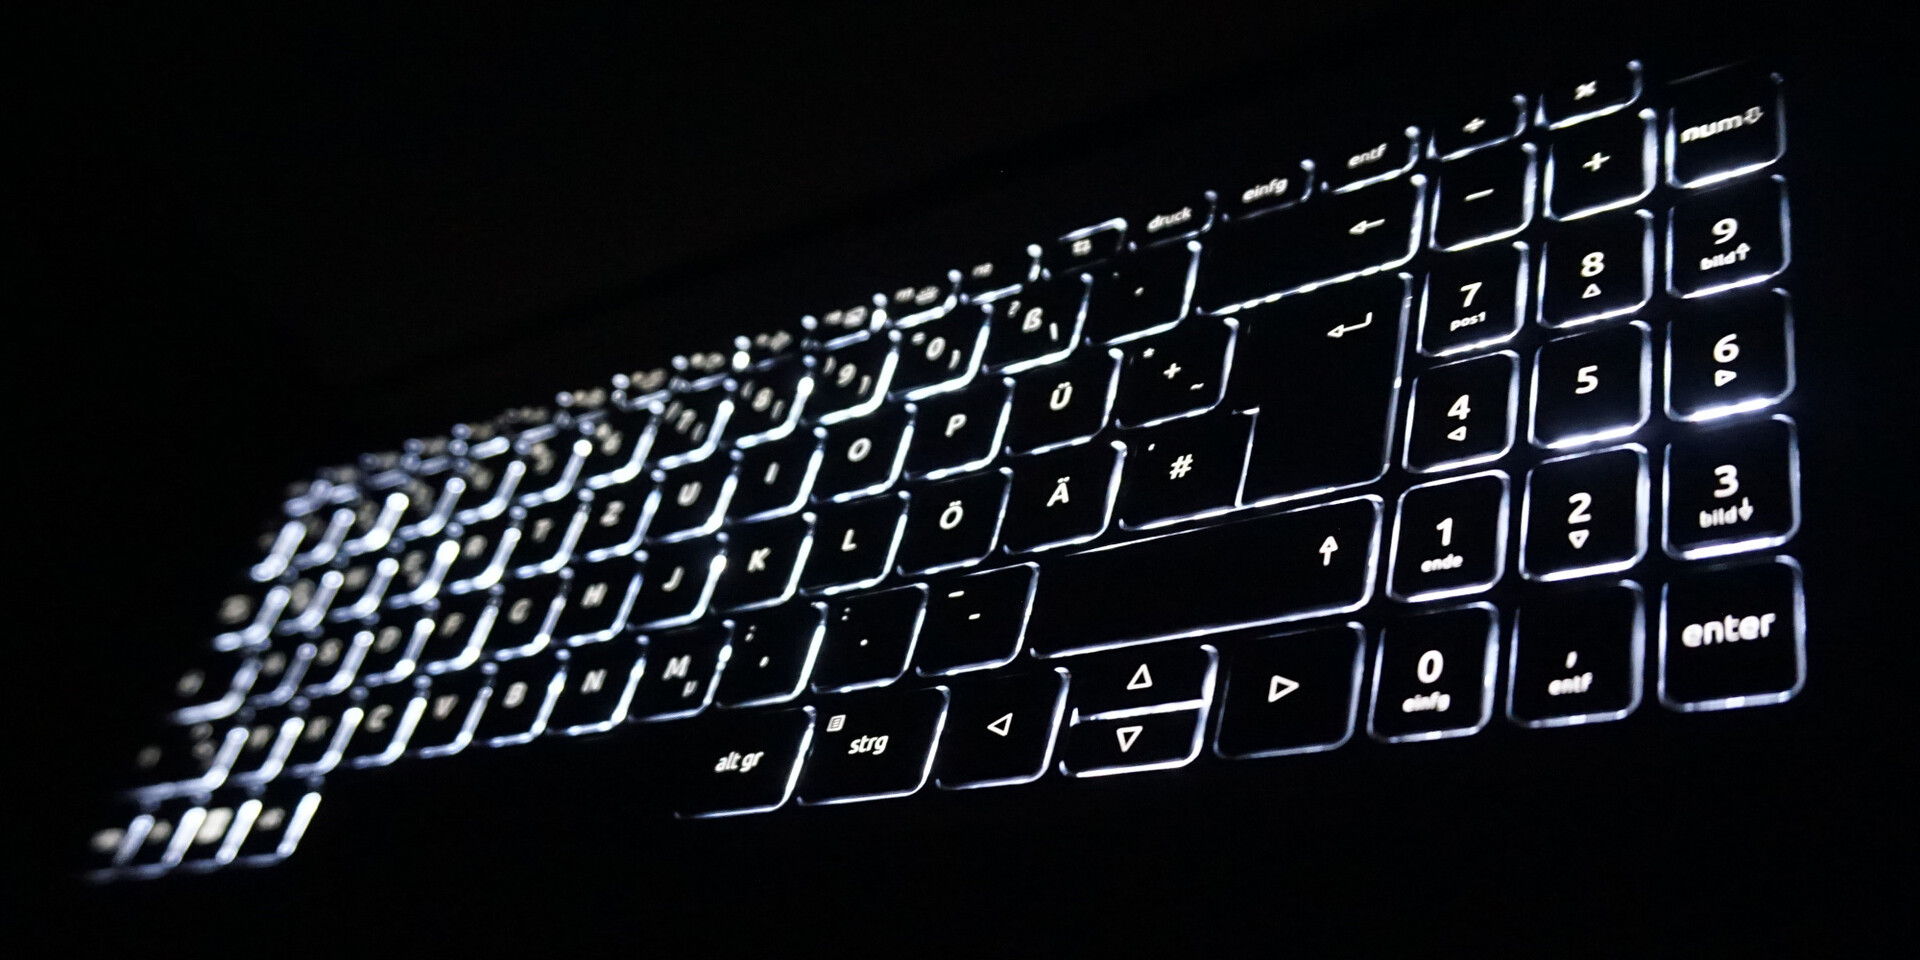
Input devices – the Acer notebook focuses on simplicity
The standard-sized chiclet keyboard is easy to type on and correspondingly fast. The counterpressure is also pleasantly controlled. The stroke, on the other hand, turns out to be short at precisely 1 mm. Over time, this can become uncomfortable if you are used to typing on a large keyboard.
The touchpad underneath is of a practical size and can be operated precisely and smoothly, even with several fingers. The keys hidden in the lower area, on the other hand, seem stiff.
Display – High resolution and precise display on the Acer Swift X


The matte screen offers a coherent resolution of 2,560 by 1,600 pixels, which is best suited for editing digital photos, among other things. For normal reading, writing, and browsing, on the other hand, the recommended magnification of 150% should be adhered to. Otherwise, hardly anything will be visible. The 16:10 aspect ratio is also geared towards media design. This leaves room for buttons above and below typical 16:9 shots.
The maximum brightness of 400 cd/m² is only reached in the center of the display, but the overall picture is bright and also has a decent contrast value. Overall, the image values correspond pretty much exactly to what can be expected from a solid, by no means outstanding multimedia notebook.
Screen bleeding is minimally perceptible in all four corners, but is only annoying when the display content is extremely dark and the environment is also dark.
| |||||||||||||||||||||||||
Brightness Distribution: 81 %
Center on Battery: 316 cd/m²
Contrast: 1393:1 (Black: 0.295 cd/m²)
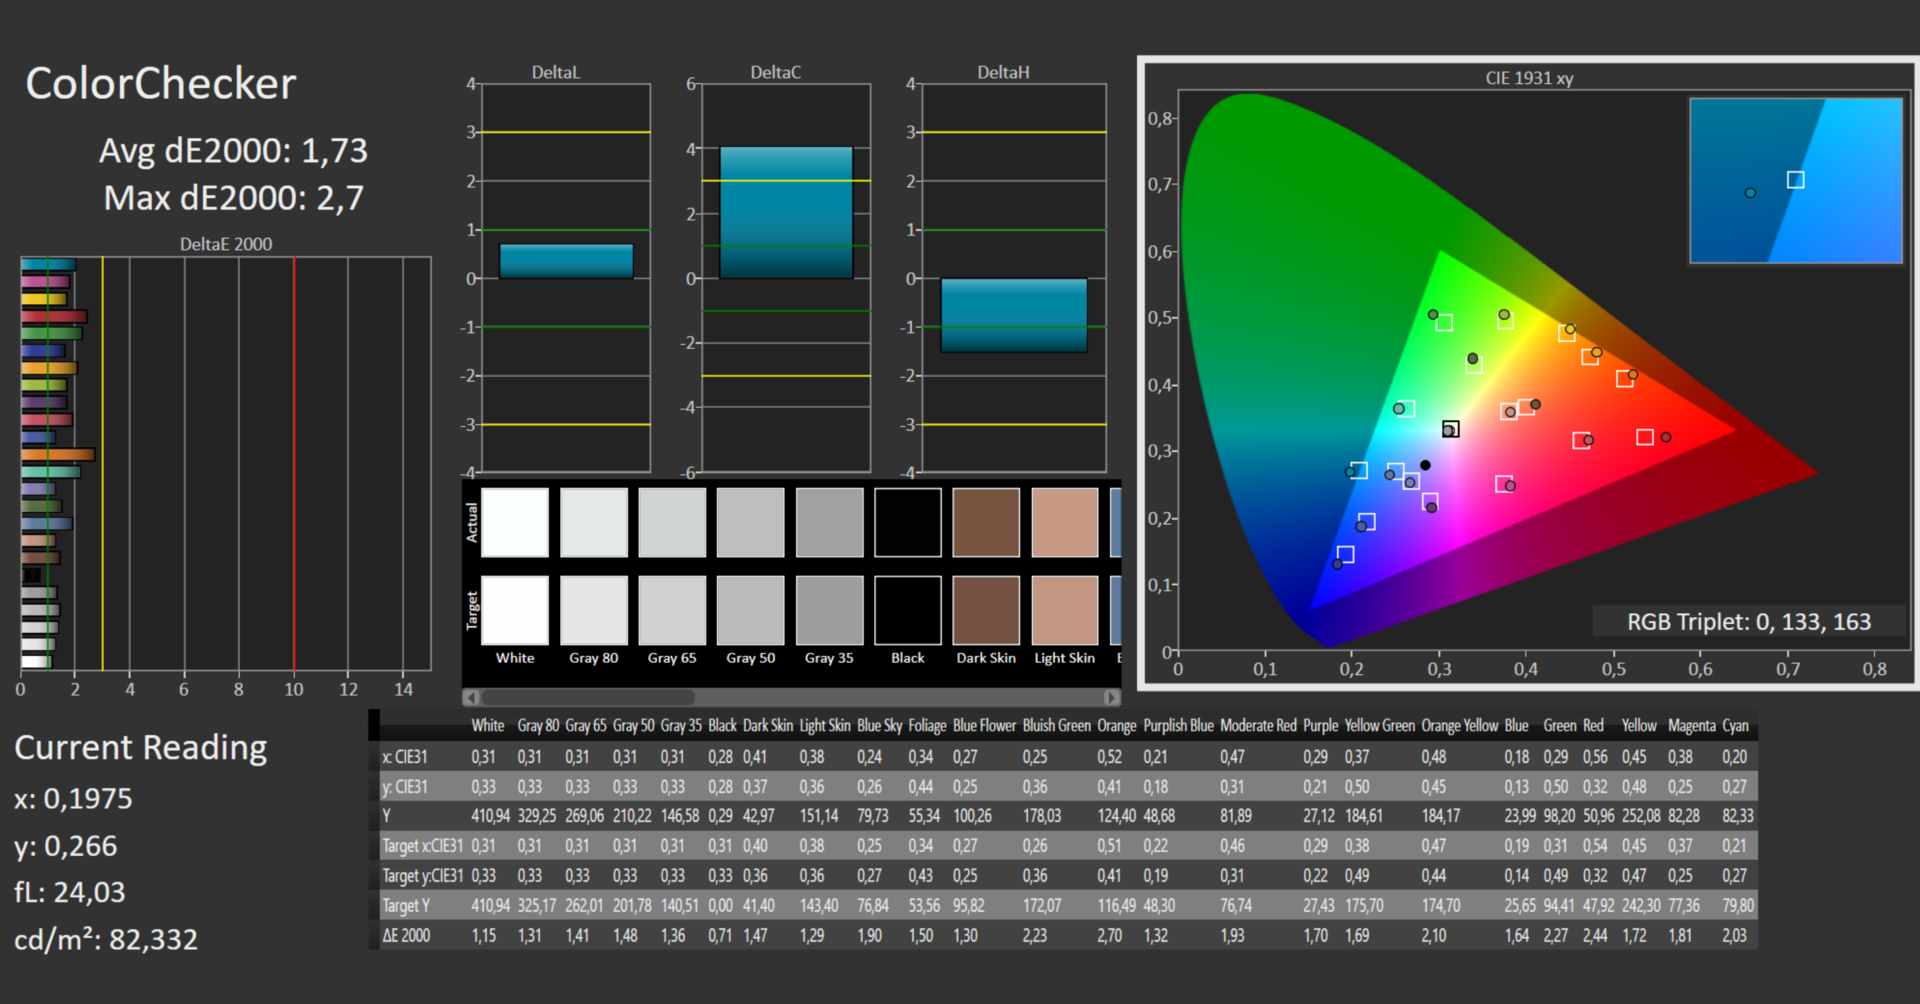
ΔE ColorChecker Calman: 1.73 | ∀{0.5-29.43 Ø4.72}
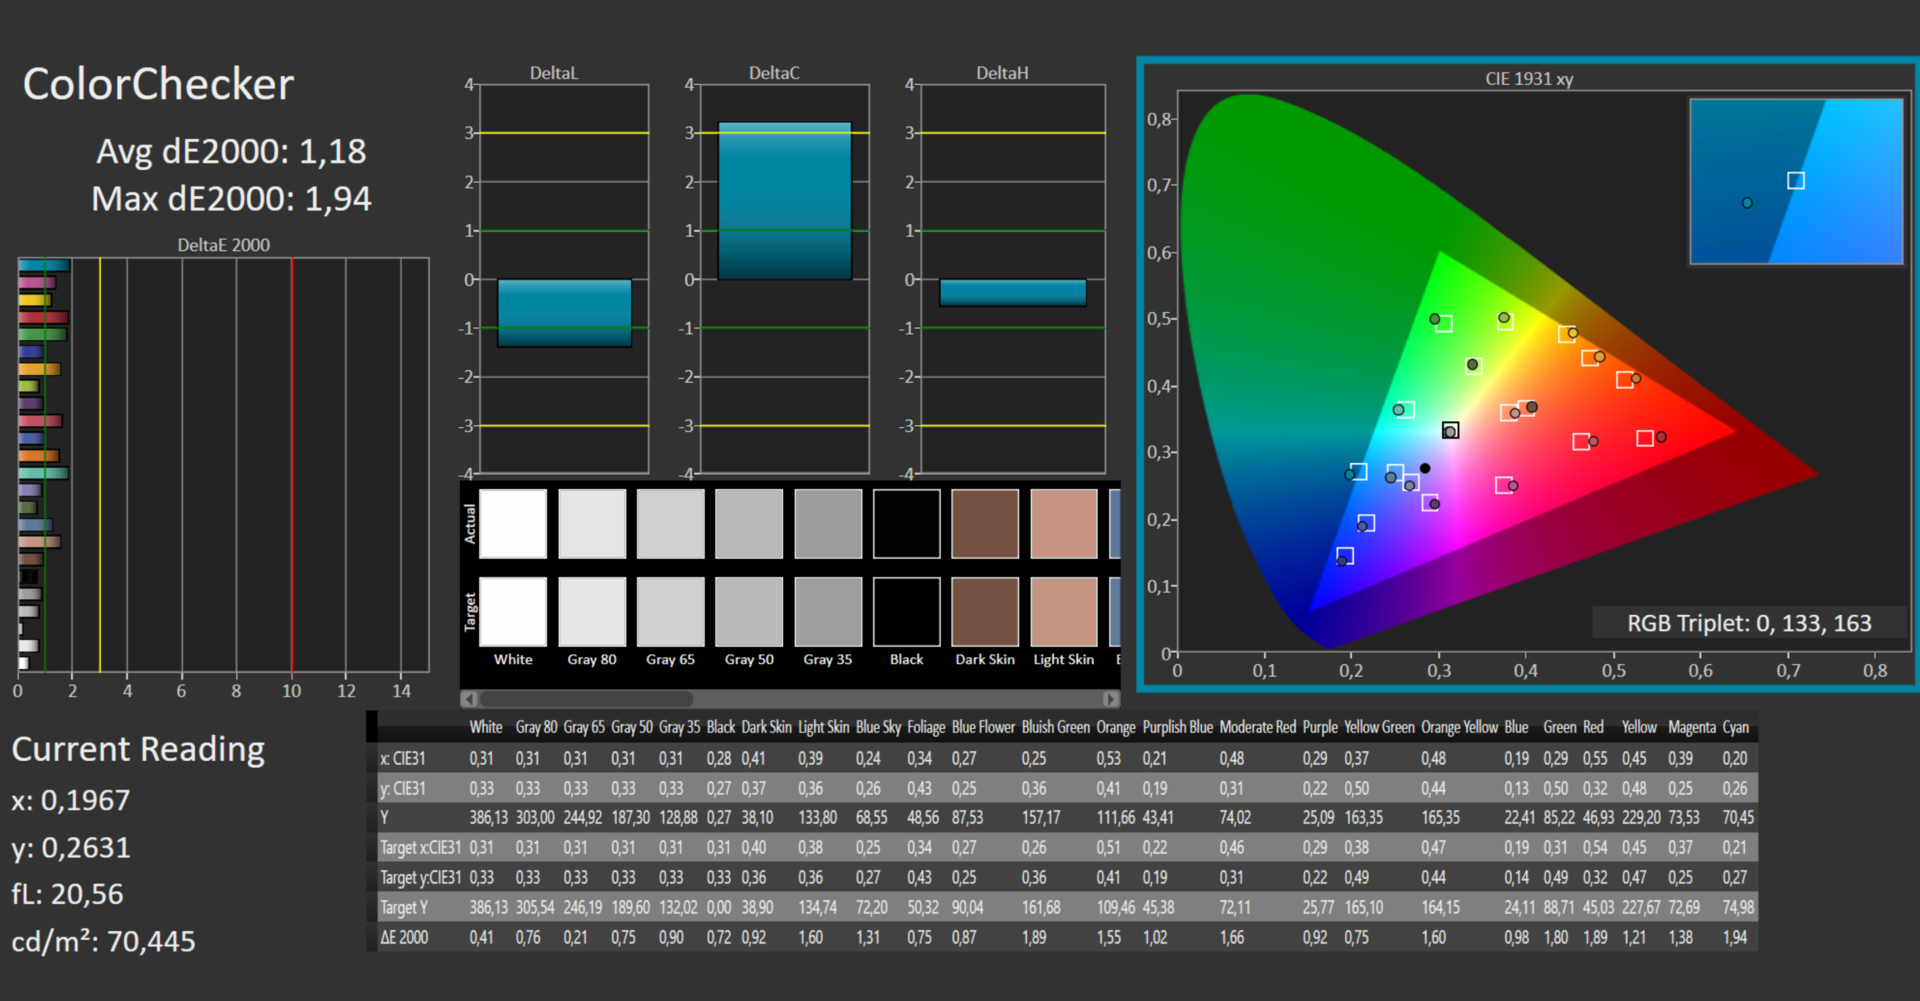
calibrated: 1.18
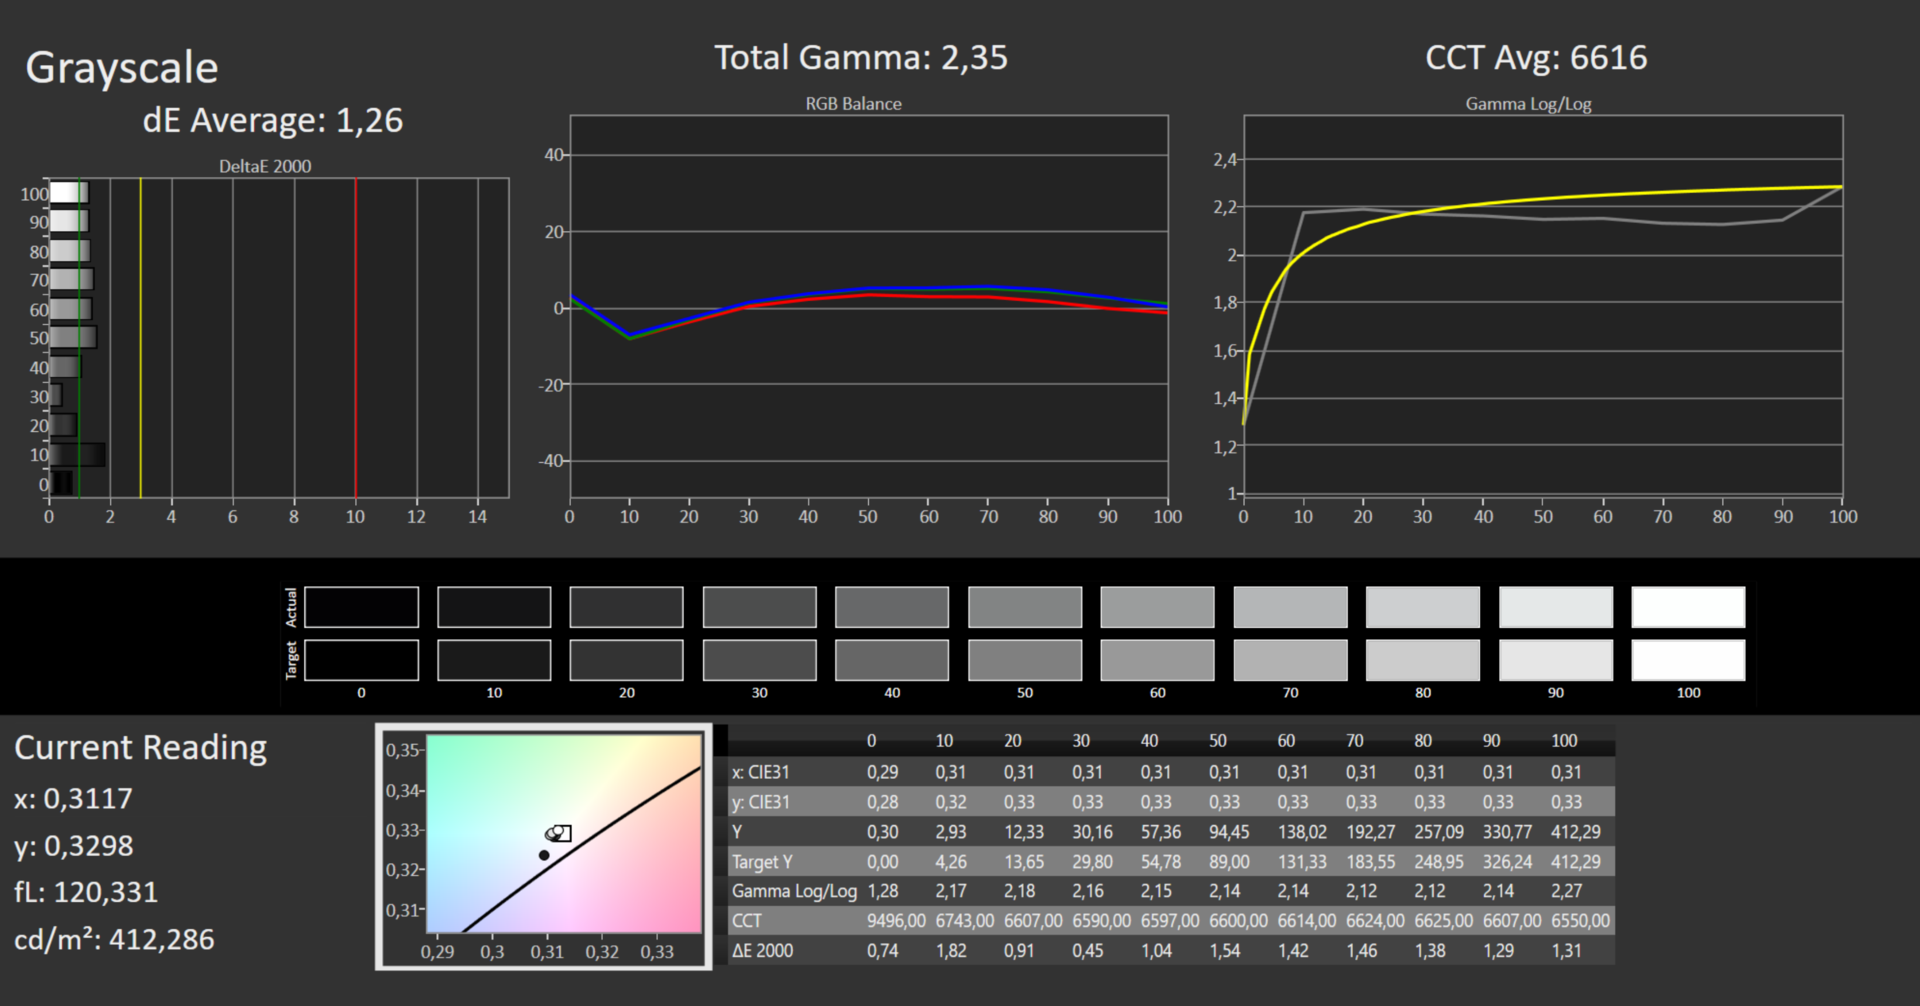
ΔE Greyscale Calman: 1.26 | ∀{0.09-98 Ø4.97}
76.51% AdobeRGB 1998 (Argyll 3D)
100% sRGB (Argyll 3D)
75.75% Display P3 (Argyll 3D)
Gamma: 2.35
CCT: 6616 K
| Acer Swift X SFX16-52G-52VE AU Optronics AUOBD9E, , 2560x1600, 16" | Acer Aspire 5 A515-57G-53N8 CMN N156HCA-EAB, IPS, 1920x1080, 15.6" | Lenovo ThinkPad T16 G1 21BWS00200 B160UAN01.K, IPS, 1920x1200, 16" | Asus ZenBook Flip 15 Q539ZD Samsung ATNA56AC01-0, OLED, 2880x1620, 15.6" | Lenovo IdeaPad Gaming 3 15IAH7 Lenovo LEN156FHD, IPS, 1920x1080, 15.6" | HP Omen 16-c0077ng BOE09E5, IPS, 2560x1440, 16.1" | Lenovo ThinkBook 16 G4+ IAP LEN160WQXGA, IPS, 2560x1600, 16" | |
|---|---|---|---|---|---|---|---|
| Display | -40% | 4% | 20% | -6% | -6% | -5% | |
| Display P3 Coverage (%) | 75.75 | 43.3 -43% | 80.1 6% | 99.8 32% | 69.1 -9% | 68.8 -9% | 69.6 -8% |
| sRGB Coverage (%) | 100 | 65 -35% | 100 0% | 100 0% | 99.2 -1% | 96.9 -3% | 97.5 -2% |
| AdobeRGB 1998 Coverage (%) | 76.51 | 44.8 -41% | 80.5 5% | 97.5 27% | 69.9 -9% | 71.1 -7% | 71.7 -6% |
| Response Times | -25% | 11% | 96% | 56% | 51% | 4% | |
| Response Time Grey 50% / Grey 80% * (ms) | 37 ? | 35.6 ? 4% | 27 ? 27% | 0.8 ? 98% | 13 ? 65% | 13 ? 65% | 32.7 ? 12% |
| Response Time Black / White * (ms) | 16 ? | 24.5 ? -53% | 17 ? -6% | 1.1 ? 93% | 8.4 ? 47% | 10 ? 37% | 16.8 ? -5% |
| PWM Frequency (Hz) | 240.4 ? | ||||||
| Screen | -116% | -79% | -35% | -70% | -76% | -31% | |
| Brightness middle (cd/m²) | 411 | 250 -39% | 404 -2% | 340.1 -17% | 338 -18% | 297 -28% | 371 -10% |
| Brightness (cd/m²) | 364 | 234 -36% | 391 7% | 344 -5% | 329 -10% | 283 -22% | 357 -2% |
| Brightness Distribution (%) | 81 | 79 -2% | 80 -1% | 97 20% | 92 14% | 91 12% | 91 12% |
| Black Level * (cd/m²) | 0.295 | 0.19 36% | 0.29 2% | 0.27 8% | 0.22 25% | 0.23 22% | |
| Contrast (:1) | 1393 | 1316 -6% | 1393 0% | 1252 -10% | 1350 -3% | 1613 16% | |
| Colorchecker dE 2000 * | 1.73 | 3.94 -128% | 3.9 -125% | 2.47 -43% | 2.88 -66% | 3.25 -88% | 2.6 -50% |
| Colorchecker dE 2000 max. * | 2.7 | 16.73 -520% | 8.5 -215% | 5.96 -121% | 9.35 -246% | 6.33 -134% | 4.4 -63% |
| Colorchecker dE 2000 calibrated * | 1.18 | 3.09 -162% | 1.7 -44% | 1.22 -3% | 1.11 6% | 1.3 -10% | |
| Greyscale dE 2000 * | 1.26 | 3.6 -186% | 5.4 -329% | 1.8 -43% | 5 -297% | 6.97 -453% | 3.7 -194% |
| Gamma | 2.35 94% | 2.081 106% | 2.21 100% | 2.2 100% | 2.162 102% | 2.3 96% | 2.32 95% |
| CCT | 6616 98% | 6476 100% | 6242 104% | 6346 102% | 7497 87% | 6050 107% | 7271 89% |
| Total Average (Program / Settings) | -60% /
-87% | -21% /
-48% | 27% /
4% | -7% /
-38% | -10% /
-43% | -11% /
-21% |
* ... smaller is better
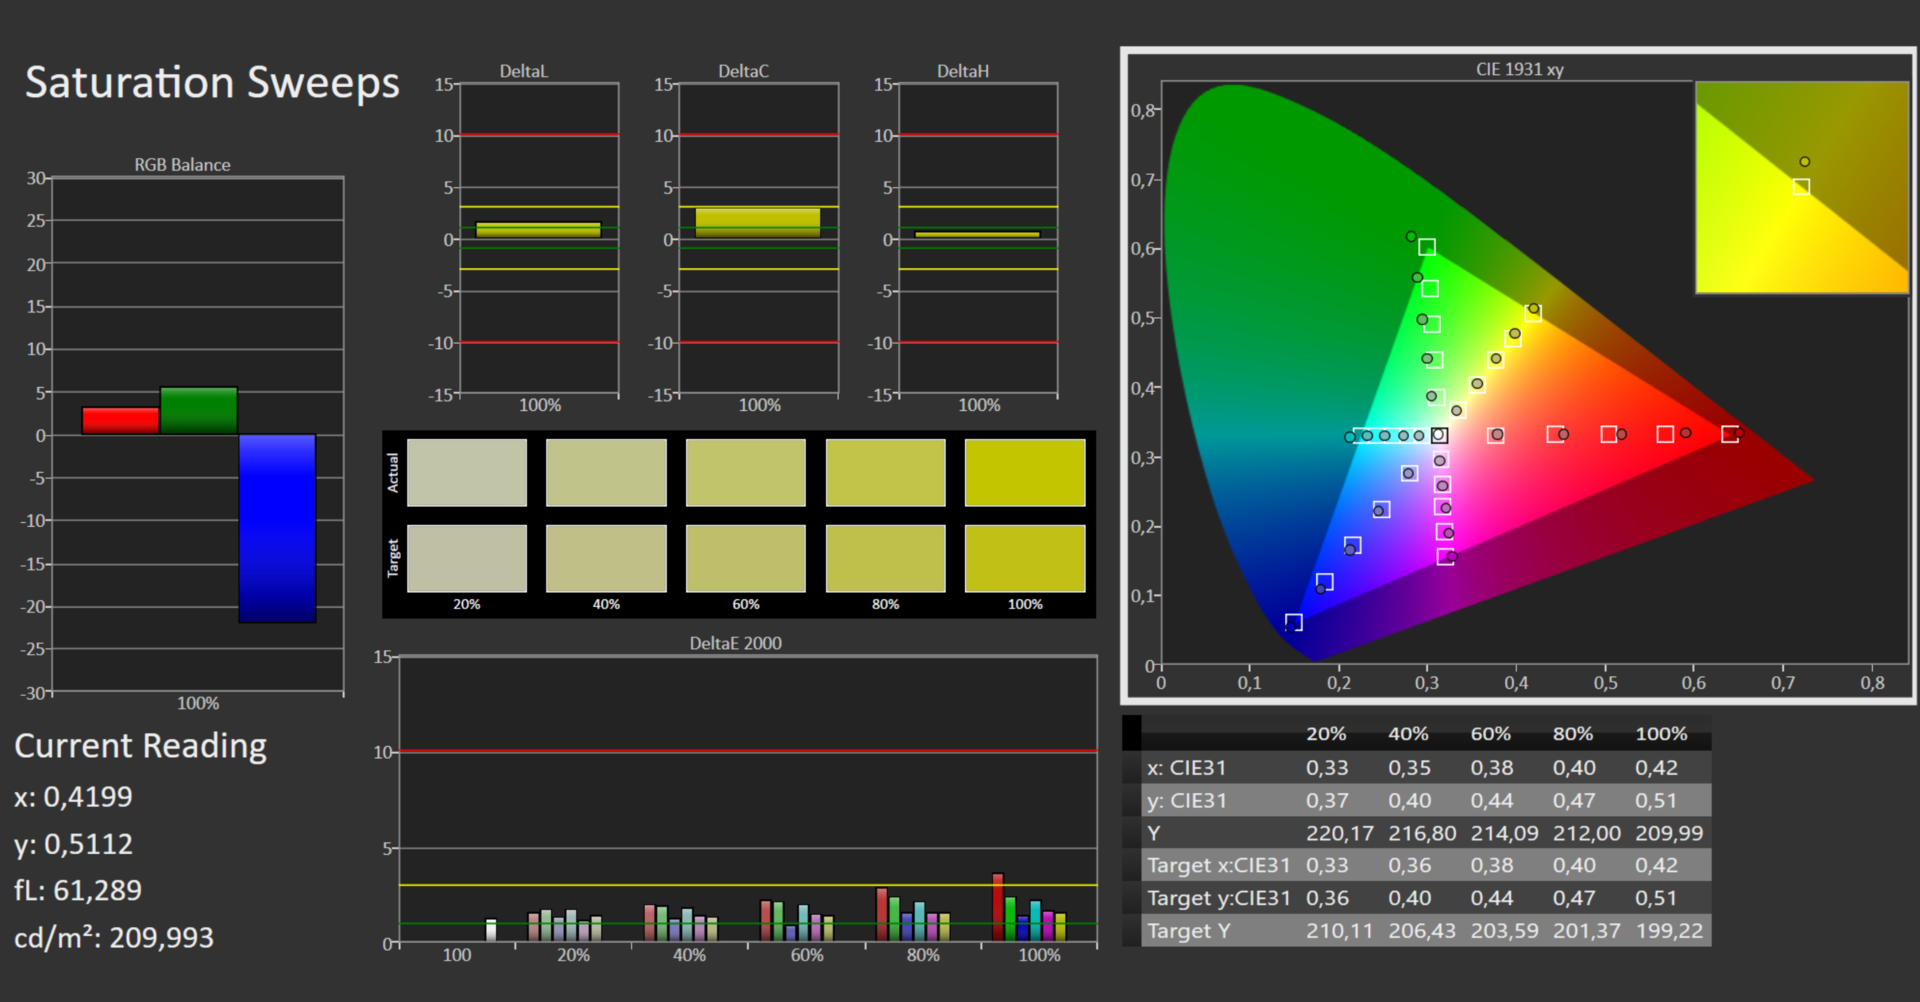
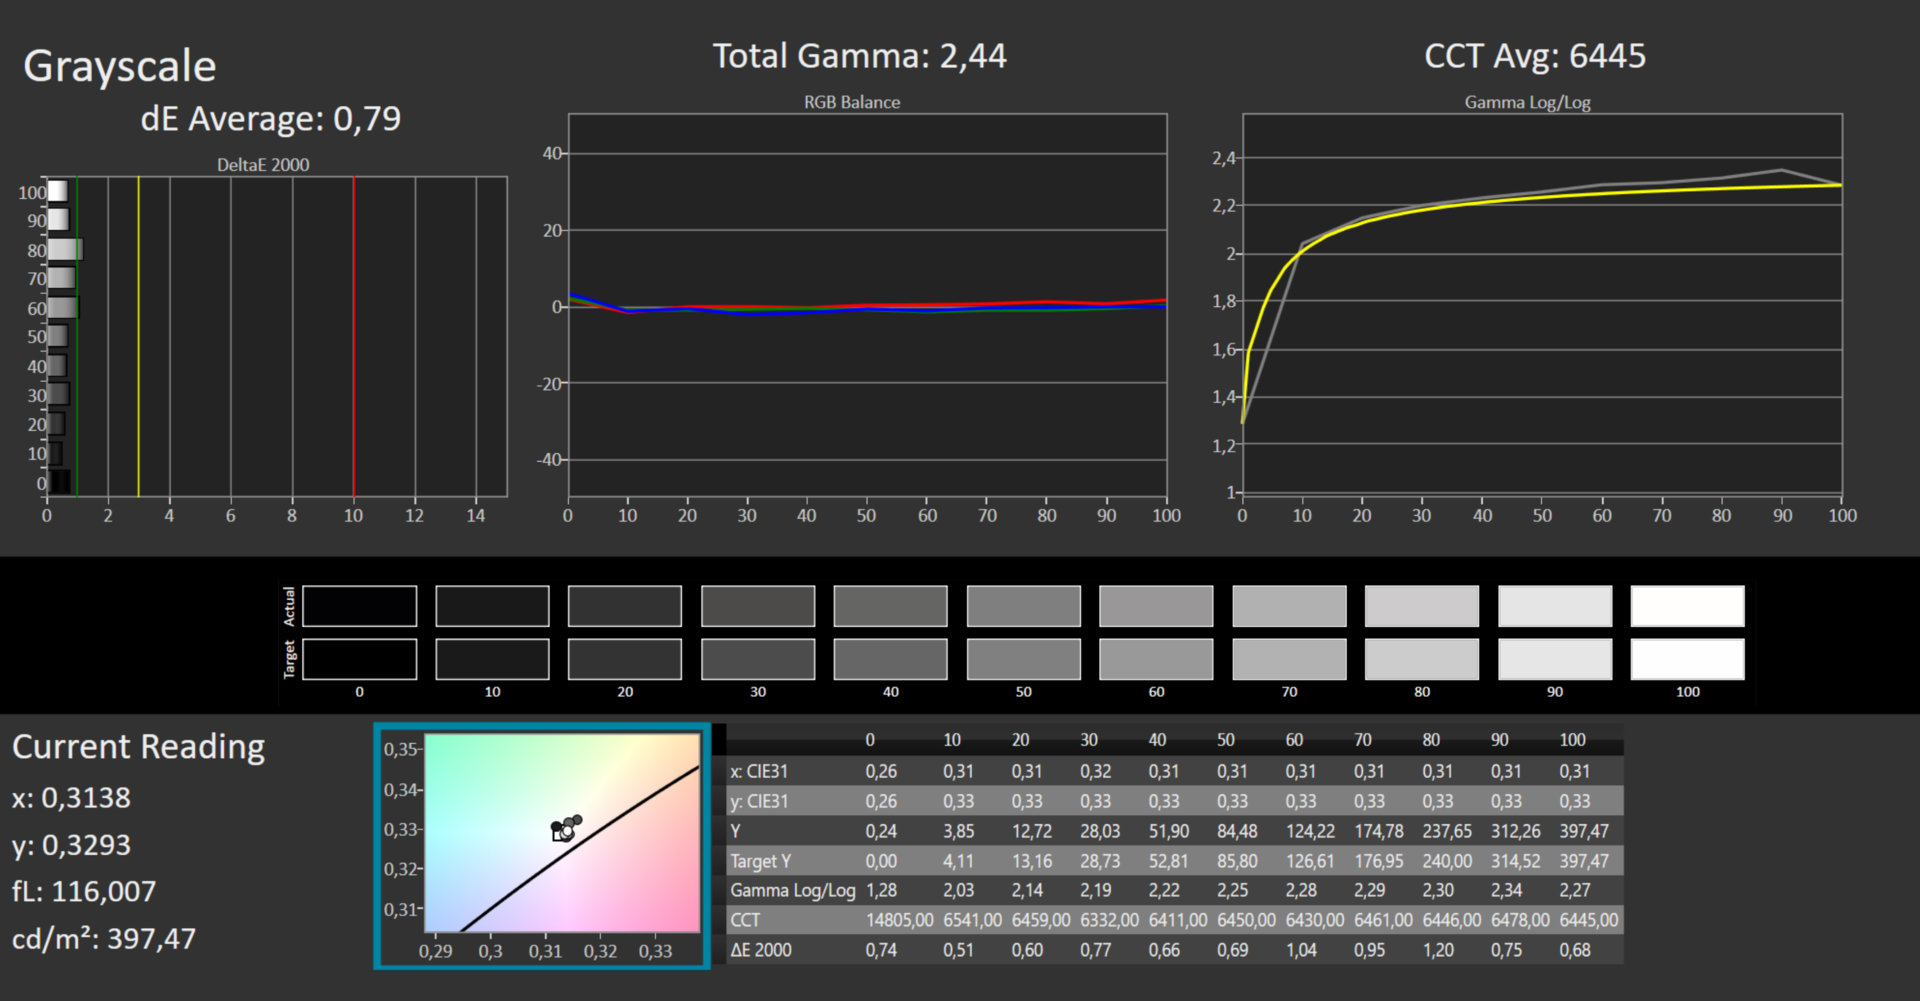
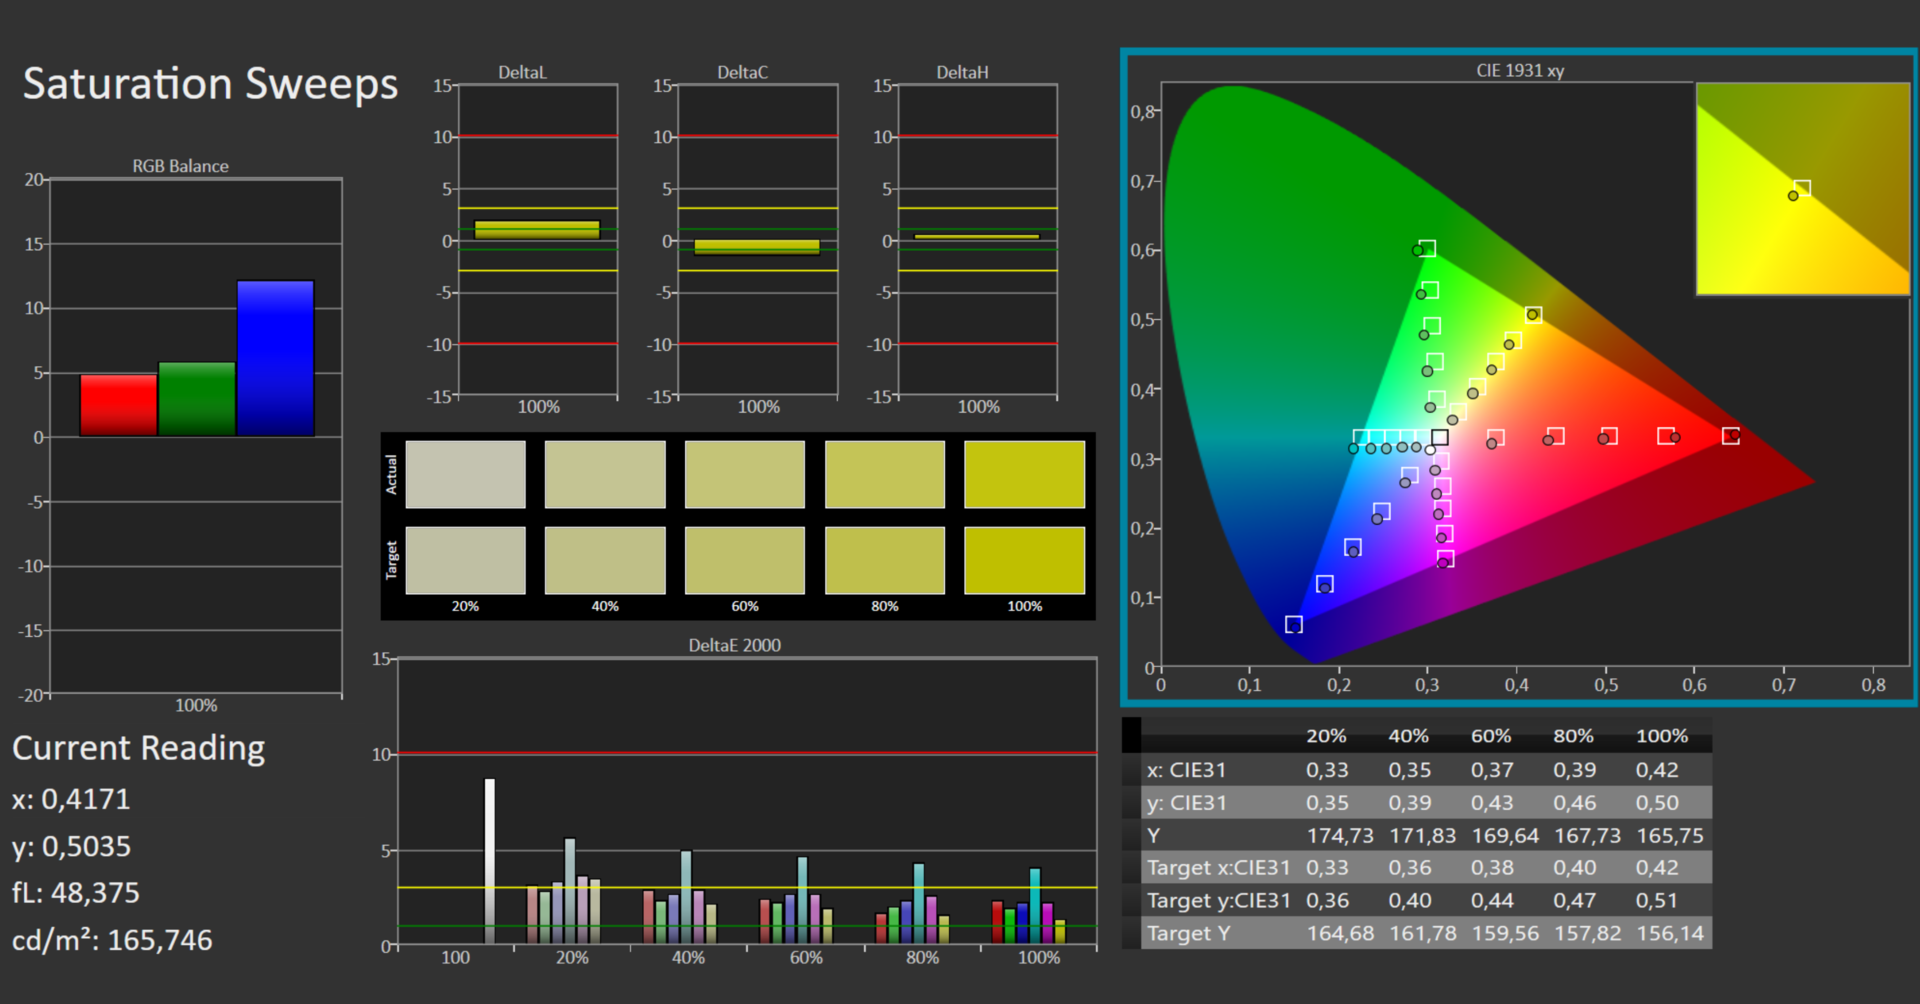
Acer advertises the Swift X with a 100% sRGB coverage and can deliver on that promise. The larger color spaces like AdobeRGB or DCI-P3, on the other hand, are not completely covered. This will not be enough for professional photographers, for example. However, it should satisfy all other users.
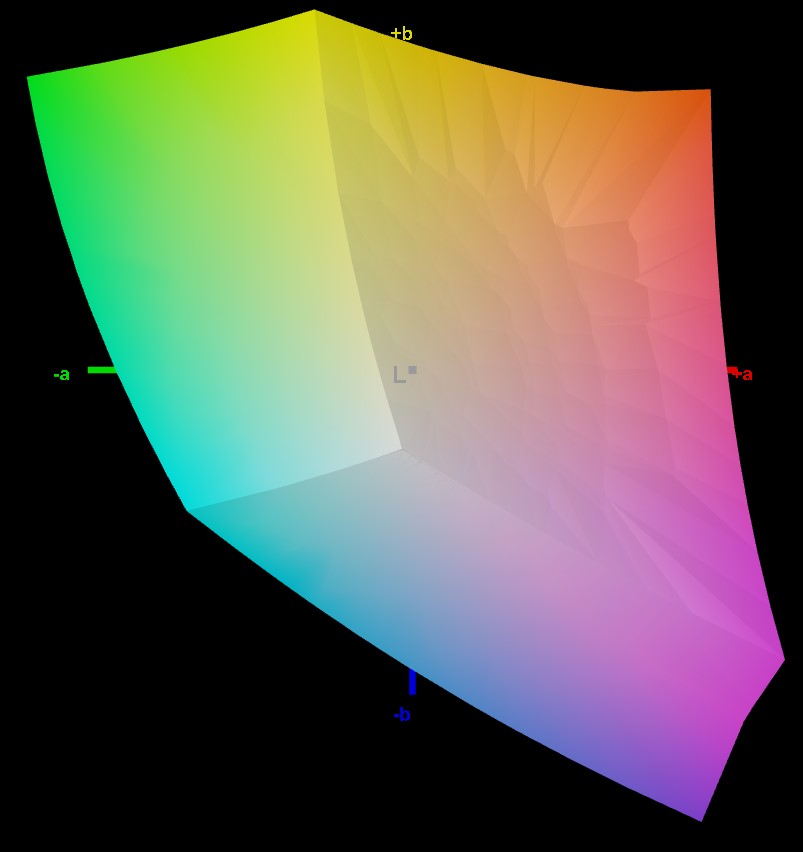
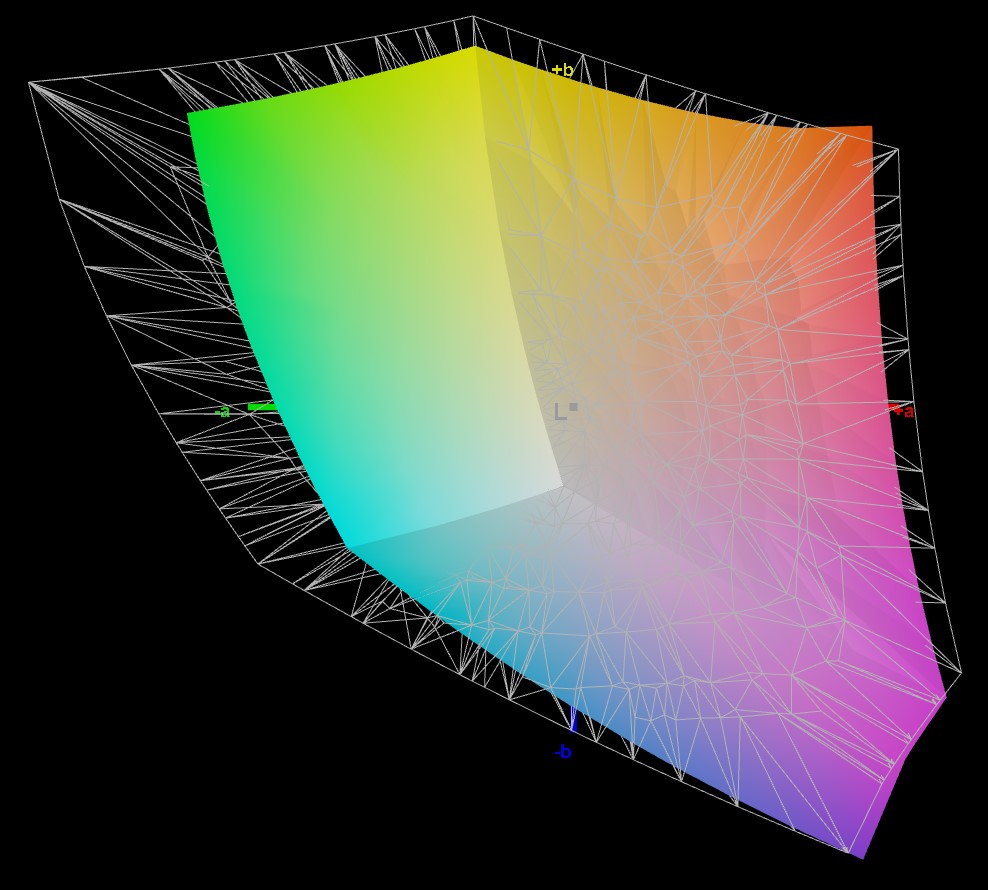
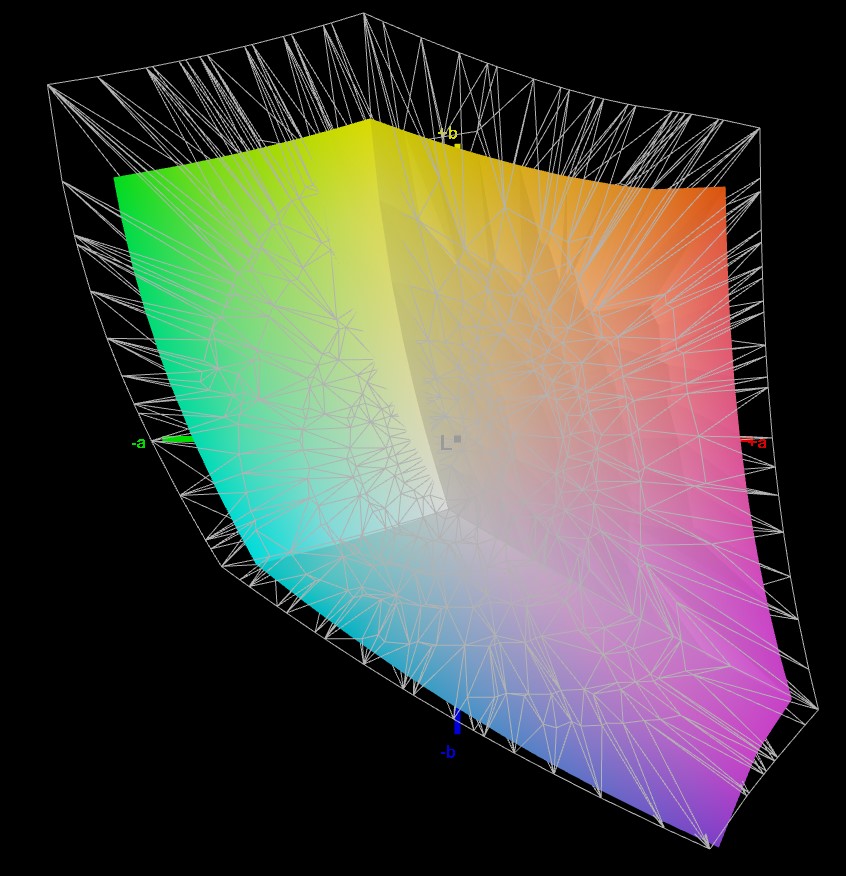
Even the original display shows hardly any color deviations. The DeltaE measured of a maximum of 2.7 can not really be determined with the naked eye. In fact, calibration lowers this value to less than 2. Consequently, the color reproduction rating is excellent. The corresponding profile can be downloaded below the field with the display values
Display Response Times
| ↔ Response Time Black to White | ||
|---|---|---|
| 16 ms ... rise ↗ and fall ↘ combined | ↗ 6 ms rise |  |
| ↘ 10 ms fall | ||
| The screen shows good response rates in our tests, but may be too slow for competitive gamers. In comparison, all tested devices range from 0.1 (minimum) to 240 (maximum) ms. » 37 % of all devices are better. This means that the measured response time is better than the average of all tested devices (19.8 ms). | ||
| ↔ Response Time 50% Grey to 80% Grey | ||
| 37 ms ... rise ↗ and fall ↘ combined | ↗ 17 ms rise |  |
| ↘ 20 ms fall | ||
| The screen shows slow response rates in our tests and will be unsatisfactory for gamers. In comparison, all tested devices range from 0.165 (minimum) to 636 (maximum) ms. » 53 % of all devices are better. This means that the measured response time is worse than the average of all tested devices (31 ms). | ||
Screen Flickering / PWM (Pulse-Width Modulation)
| Screen flickering / PWM not detected |  | ||
In comparison: 52 % of all tested devices do not use PWM to dim the display. If PWM was detected, an average of 7750 (minimum: 5 - maximum: 343500) Hz was measured. | |||
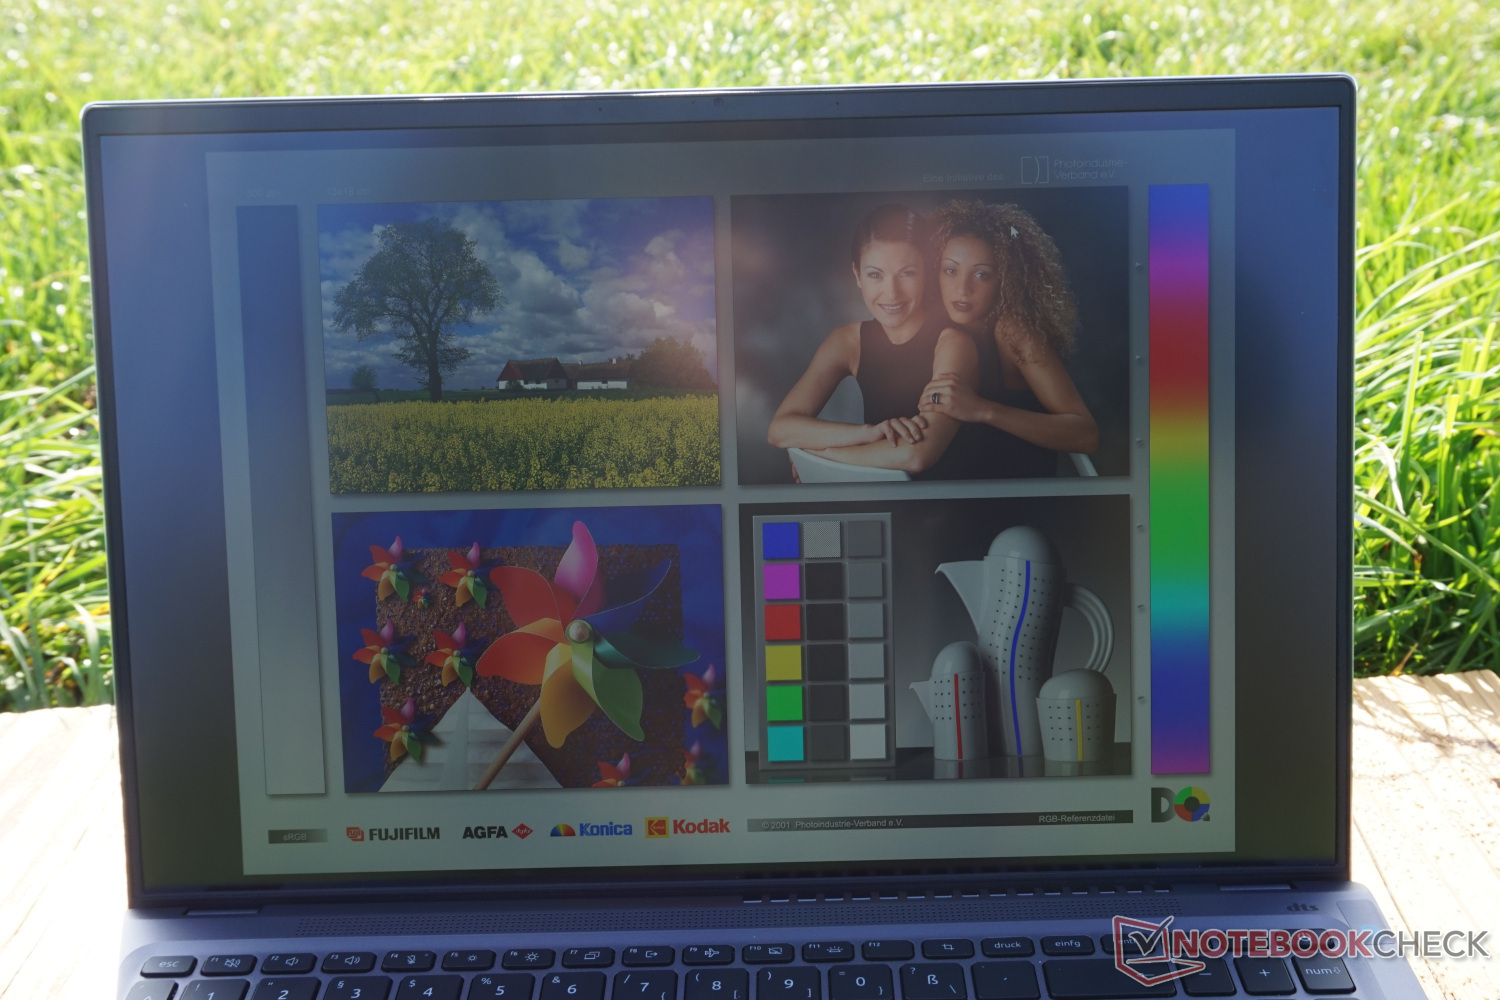
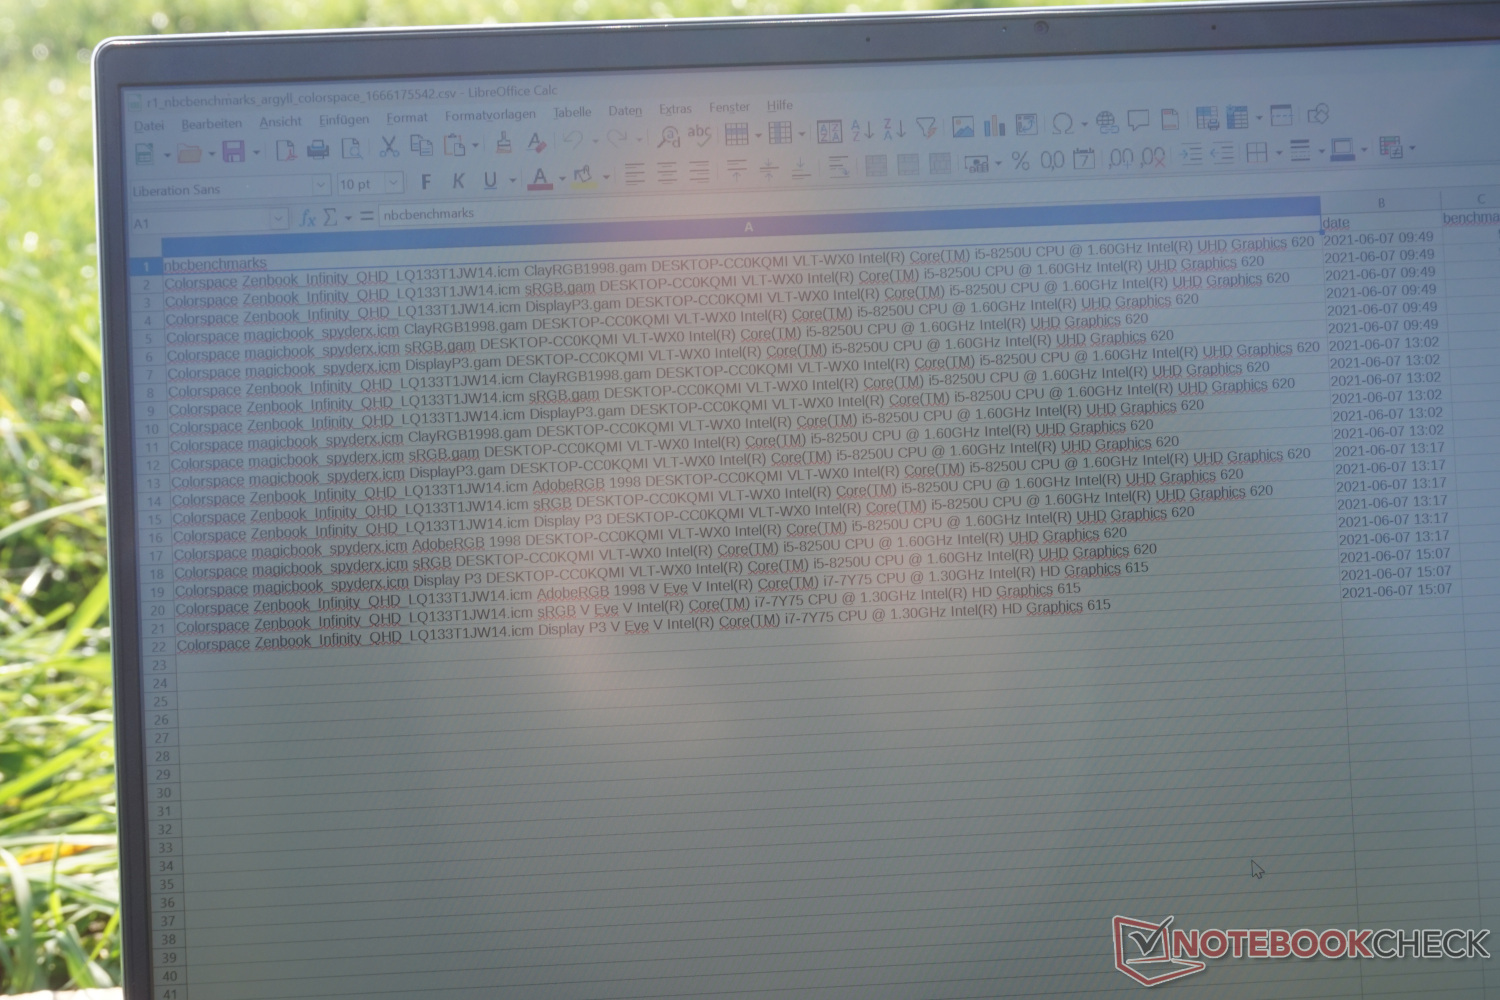
The screen brightness is decent, but still not enough to use the laptop in sunlight. One reason can be found in the quite significant reduction of the brightness from 400 to 300 cd/m². Against the sun, the contents can still be seen quite well. The colors also don't look pale or misrepresented. If you want to work in a shady place outdoors, you shouldn't encounter any problems.
There is the option to impose a higher display brightness in the Windows settings, but this is at the expense of battery life and, from our point of view, with little return.
The IPS panel shows neither color changes nor brightness impairments, regardless of the selected viewing angle. However, given the image technology, you would expect this to be the case.

Performance – Intel Arc and i-Core well adjusted
The Intel Core i5-1240P processor and the Intel Arc A370M are state-of-the-art. What both have in common is that they are characterized more by efficiency than by particularly high performance values.
This way, the laptop will mainly handle everyday tasks at high speed with low power consumption. The graphics performance is primarily geared towards image and video editing. Games can also be played, but with severe restrictions in terms of details and resolution.
Test conditions
If you're looking for versatile customization options, you'll be searching in vain. The processor's power consumption is limited neither in energy-saving mode nor in battery mode. As usual, however, the maximum clock frequency drops in the absence of a power connection, which reduces the performance somewhat.
We performed all performance and benchmark tests with the "best performance" setting. The battery life, on the other hand, was tested with "best energy efficiency". As a rule, Windows selects these settings automatically.
Processor
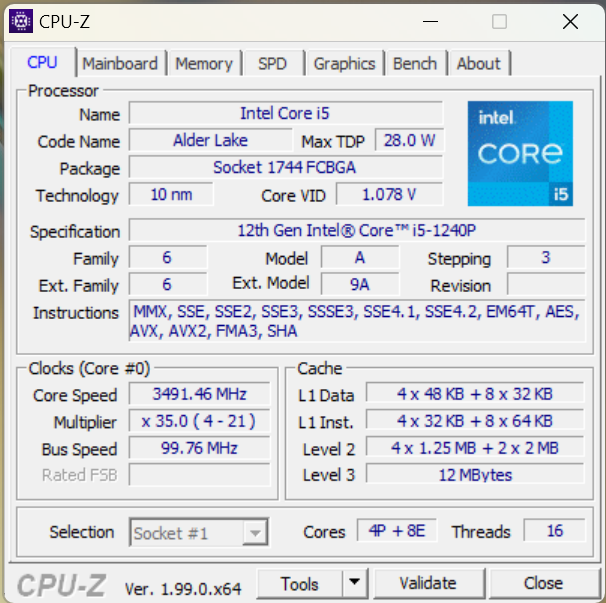
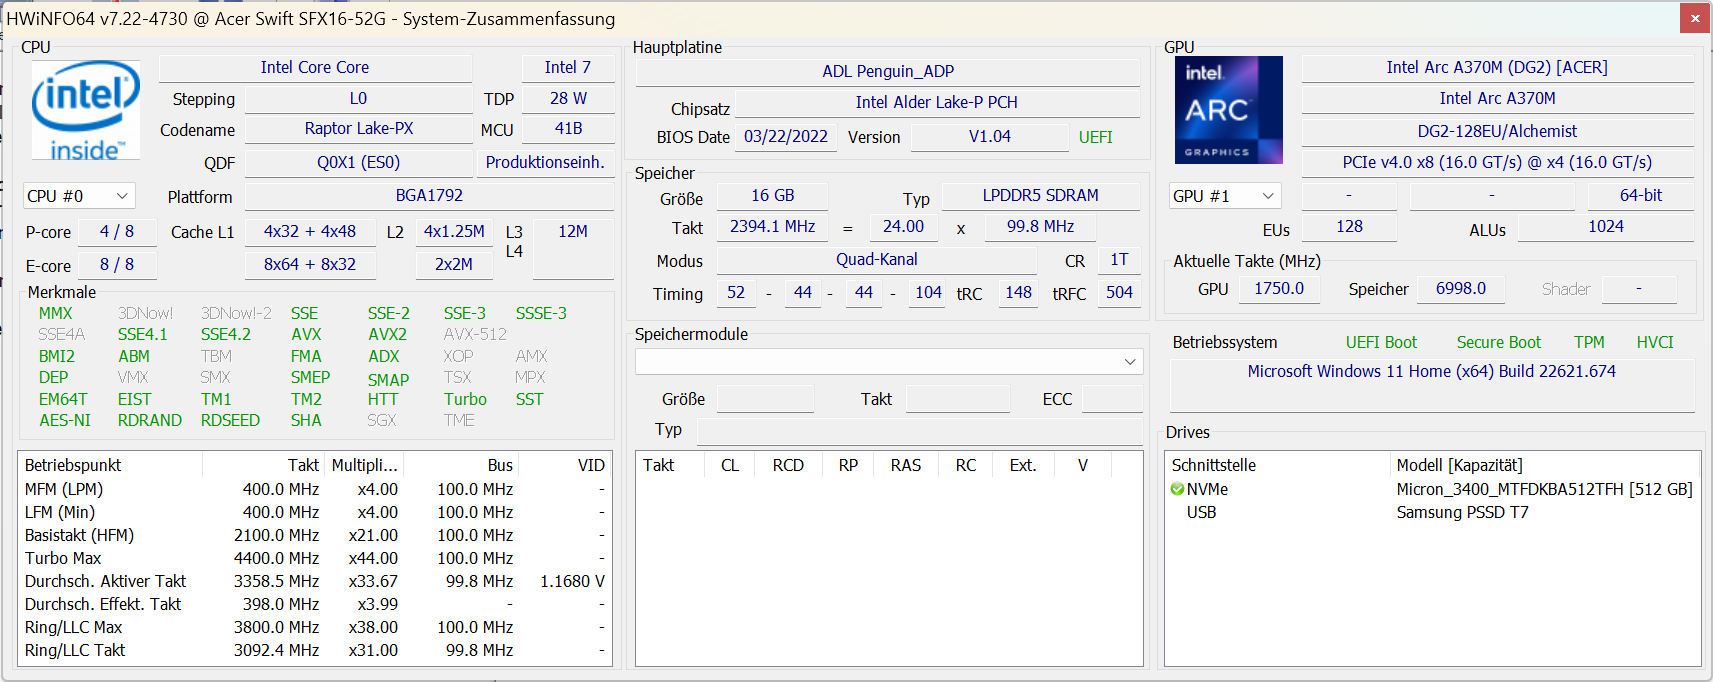
The Intel Core i5-1240P, with 12 cores and 16 threads, is a mid-range processor. It doesn't promise excessive computing power, but remains economical in operation. The Acer Swift X SFX16-52G is set to consume 35 W for up to one minute should it need to perform for a longer period of time. It is even 64 W for fractions of a second. A large part of the power is also available in battery mode. This is shown by a look at PCMark10. The values are only just under 20% below the highest performance with the power supply connected.
Overall, the performance barely stands out from similarly equipped notebooks. The slight advantage over the Lenovo ThinkPad T16 G1 with an identical processor is most likely explained by the separate graphics card. The performance leap compared to Intel processors of the previous generation can be observed clearly in the Cinebench loop, which reflects pure computing power, using the i7-1165G7 as an example.
Additional benchmarks and performance values can be found in our CPU benchmark list.

Cinebench R15 Multi endurance test
Cinebench R23: Multi Core | Single Core
Cinebench R20: CPU (Multi Core) | CPU (Single Core)
Cinebench R15: CPU Multi 64Bit | CPU Single 64Bit
Blender: v2.79 BMW27 CPU
7-Zip 18.03: 7z b 4 | 7z b 4 -mmt1
Geekbench 5.5: Multi-Core | Single-Core
HWBOT x265 Benchmark v2.2: 4k Preset
LibreOffice : 20 Documents To PDF
R Benchmark 2.5: Overall mean
| CPU Performance rating | |
| Average of class Multimedia | |
| Lenovo ThinkBook 16 G4+ IAP | |
| Asus ZenBook Flip 15 Q539ZD | |
| Lenovo IdeaPad Gaming 3 15IAH7 | |
| Acer Swift X SFX16-52G-52VE | |
| Acer Aspire 5 A515-57G-53N8 | |
| HP Omen 16-c0077ng -1! | |
| Lenovo ThinkPad T16 G1 21BWS00200 | |
| Average Intel Core i5-1240P | |
| Cinebench R23 / Multi Core | |
| Average of class Multimedia (4861 - 33362, n=78, last 2 years) | |
| Lenovo ThinkBook 16 G4+ IAP | |
| Asus ZenBook Flip 15 Q539ZD | |
| Lenovo IdeaPad Gaming 3 15IAH7 | |
| HP Omen 16-c0077ng | |
| Acer Swift X SFX16-52G-52VE | |
| Acer Aspire 5 A515-57G-53N8 | |
| Average Intel Core i5-1240P (277 - 11556, n=20) | |
| Lenovo ThinkPad T16 G1 21BWS00200 | |
| Cinebench R23 / Single Core | |
| Average of class Multimedia (1128 - 2459, n=70, last 2 years) | |
| Lenovo ThinkBook 16 G4+ IAP | |
| Asus ZenBook Flip 15 Q539ZD | |
| Acer Aspire 5 A515-57G-53N8 | |
| Lenovo IdeaPad Gaming 3 15IAH7 | |
| Lenovo ThinkPad T16 G1 21BWS00200 | |
| Acer Swift X SFX16-52G-52VE | |
| Average Intel Core i5-1240P (640 - 1689, n=18) | |
| HP Omen 16-c0077ng | |
| Cinebench R20 / CPU (Multi Core) | |
| Average of class Multimedia (1887 - 12912, n=61, last 2 years) | |
| Lenovo ThinkBook 16 G4+ IAP | |
| Asus ZenBook Flip 15 Q539ZD | |
| Lenovo IdeaPad Gaming 3 15IAH7 | |
| HP Omen 16-c0077ng | |
| Acer Swift X SFX16-52G-52VE | |
| Acer Aspire 5 A515-57G-53N8 | |
| Average Intel Core i5-1240P (763 - 4456, n=16) | |
| Lenovo ThinkPad T16 G1 21BWS00200 | |
| Cinebench R20 / CPU (Single Core) | |
| Average of class Multimedia (425 - 853, n=61, last 2 years) | |
| Lenovo ThinkBook 16 G4+ IAP | |
| Asus ZenBook Flip 15 Q539ZD | |
| Lenovo IdeaPad Gaming 3 15IAH7 | |
| Acer Aspire 5 A515-57G-53N8 | |
| Acer Swift X SFX16-52G-52VE | |
| Lenovo ThinkPad T16 G1 21BWS00200 | |
| HP Omen 16-c0077ng | |
| Average Intel Core i5-1240P (251 - 653, n=16) | |
| Cinebench R15 / CPU Multi 64Bit | |
| Average of class Multimedia (856 - 5224, n=65, last 2 years) | |
| Lenovo ThinkBook 16 G4+ IAP | |
| Lenovo IdeaPad Gaming 3 15IAH7 | |
| Asus ZenBook Flip 15 Q539ZD | |
| HP Omen 16-c0077ng | |
| Acer Swift X SFX16-52G-52VE | |
| Lenovo ThinkPad T16 G1 21BWS00200 | |
| Lenovo ThinkPad T16 G1 21BWS00200 | |
| Acer Aspire 5 A515-57G-53N8 | |
| Average Intel Core i5-1240P (407 - 2007, n=19) | |
| Cinebench R15 / CPU Single 64Bit | |
| Average of class Multimedia (184.8 - 326, n=63, last 2 years) | |
| Lenovo ThinkBook 16 G4+ IAP | |
| Asus ZenBook Flip 15 Q539ZD | |
| Lenovo IdeaPad Gaming 3 15IAH7 | |
| Acer Aspire 5 A515-57G-53N8 | |
| Acer Swift X SFX16-52G-52VE | |
| HP Omen 16-c0077ng | |
| Lenovo ThinkPad T16 G1 21BWS00200 | |
| Average Intel Core i5-1240P (91.8 - 243, n=18) | |
| Blender / v2.79 BMW27 CPU | |
| Average Intel Core i5-1240P (285 - 1926, n=16) | |
| Lenovo ThinkPad T16 G1 21BWS00200 | |
| Acer Aspire 5 A515-57G-53N8 | |
| Acer Swift X SFX16-52G-52VE | |
| HP Omen 16-c0077ng | |
| Average of class Multimedia (100 - 557, n=62, last 2 years) | |
| Lenovo IdeaPad Gaming 3 15IAH7 | |
| Lenovo ThinkBook 16 G4+ IAP | |
| Asus ZenBook Flip 15 Q539ZD | |
| 7-Zip 18.03 / 7z b 4 | |
| Lenovo ThinkBook 16 G4+ IAP | |
| Asus ZenBook Flip 15 Q539ZD | |
| Average of class Multimedia (26062 - 130368, n=59, last 2 years) | |
| Acer Swift X SFX16-52G-52VE | |
| Lenovo IdeaPad Gaming 3 15IAH7 | |
| Acer Aspire 5 A515-57G-53N8 | |
| Average Intel Core i5-1240P (7254 - 47002, n=16) | |
| Lenovo ThinkPad T16 G1 21BWS00200 | |
| 7-Zip 18.03 / 7z b 4 -mmt1 | |
| Average of class Multimedia (3666 - 7545, n=60, last 2 years) | |
| Lenovo ThinkBook 16 G4+ IAP | |
| Asus ZenBook Flip 15 Q539ZD | |
| Lenovo IdeaPad Gaming 3 15IAH7 | |
| HP Omen 16-c0077ng | |
| Acer Aspire 5 A515-57G-53N8 | |
| Acer Swift X SFX16-52G-52VE | |
| Lenovo ThinkPad T16 G1 21BWS00200 | |
| Average Intel Core i5-1240P (2197 - 5320, n=16) | |
| Geekbench 5.5 / Multi-Core | |
| Average of class Multimedia (4652 - 20422, n=60, last 2 years) | |
| Asus ZenBook Flip 15 Q539ZD | |
| Lenovo ThinkBook 16 G4+ IAP | |
| Acer Swift X SFX16-52G-52VE | |
| Acer Aspire 5 A515-57G-53N8 | |
| Lenovo IdeaPad Gaming 3 15IAH7 | |
| Average Intel Core i5-1240P (1763 - 10112, n=15) | |
| HP Omen 16-c0077ng | |
| Lenovo ThinkPad T16 G1 21BWS00200 | |
| Geekbench 5.5 / Single-Core | |
| Average of class Multimedia (805 - 2974, n=60, last 2 years) | |
| Lenovo ThinkBook 16 G4+ IAP | |
| Asus ZenBook Flip 15 Q539ZD | |
| Acer Swift X SFX16-52G-52VE | |
| Acer Aspire 5 A515-57G-53N8 | |
| Lenovo IdeaPad Gaming 3 15IAH7 | |
| Lenovo ThinkPad T16 G1 21BWS00200 | |
| Average Intel Core i5-1240P (672 - 1658, n=15) | |
| HP Omen 16-c0077ng | |
| HWBOT x265 Benchmark v2.2 / 4k Preset | |
| Average of class Multimedia (5.26 - 36.1, n=60, last 2 years) | |
| Lenovo ThinkBook 16 G4+ IAP | |
| Asus ZenBook Flip 15 Q539ZD | |
| Lenovo IdeaPad Gaming 3 15IAH7 | |
| HP Omen 16-c0077ng | |
| Acer Swift X SFX16-52G-52VE | |
| Acer Aspire 5 A515-57G-53N8 | |
| Average Intel Core i5-1240P (1.99 - 12.9, n=16) | |
| Lenovo ThinkPad T16 G1 21BWS00200 | |
| LibreOffice / 20 Documents To PDF | |
| HP Omen 16-c0077ng | |
| Average Intel Core i5-1240P (46.4 - 120.5, n=16) | |
| Acer Aspire 5 A515-57G-53N8 | |
| Average of class Multimedia (23.9 - 146.7, n=61, last 2 years) | |
| Lenovo IdeaPad Gaming 3 15IAH7 | |
| Lenovo ThinkPad T16 G1 21BWS00200 | |
| Acer Swift X SFX16-52G-52VE | |
| Asus ZenBook Flip 15 Q539ZD | |
| Lenovo ThinkBook 16 G4+ IAP | |
| R Benchmark 2.5 / Overall mean | |
| Average Intel Core i5-1240P (0.4987 - 1.236, n=16) | |
| Acer Swift X SFX16-52G-52VE | |
| Lenovo ThinkPad T16 G1 21BWS00200 | |
| HP Omen 16-c0077ng | |
| Lenovo IdeaPad Gaming 3 15IAH7 | |
| Acer Aspire 5 A515-57G-53N8 | |
| Average of class Multimedia (0.3604 - 0.947, n=60, last 2 years) | |
| Lenovo ThinkBook 16 G4+ IAP | |
| Asus ZenBook Flip 15 Q539ZD | |
* ... smaller is better
AIDA64: FP32 Ray-Trace | FPU Julia | CPU SHA3 | CPU Queen | FPU SinJulia | FPU Mandel | CPU AES | CPU ZLib | FP64 Ray-Trace | CPU PhotoWorxx
| Performance rating | |
| Average of class Multimedia | |
| HP Omen 16-c0077ng | |
| Lenovo ThinkBook 16 G4+ IAP | |
| Lenovo IdeaPad Gaming 3 15IAH7 | |
| Asus ZenBook Flip 15 Q539ZD | |
| Acer Swift X SFX16-52G-52VE | |
| Lenovo ThinkPad T16 G1 21BWS00200 | |
| Acer Aspire 5 A515-57G-53N8 | |
| Average Intel Core i5-1240P | |
| AIDA64 / FP32 Ray-Trace | |
| Average of class Multimedia (2214 - 50388, n=57, last 2 years) | |
| HP Omen 16-c0077ng | |
| Lenovo ThinkBook 16 G4+ IAP | |
| Lenovo IdeaPad Gaming 3 15IAH7 | |
| Acer Swift X SFX16-52G-52VE | |
| Asus ZenBook Flip 15 Q539ZD | |
| Lenovo ThinkPad T16 G1 21BWS00200 | |
| Average Intel Core i5-1240P (2405 - 9694, n=16) | |
| Acer Aspire 5 A515-57G-53N8 | |
| AIDA64 / FPU Julia | |
| HP Omen 16-c0077ng | |
| Average of class Multimedia (12867 - 201874, n=58, last 2 years) | |
| Lenovo ThinkBook 16 G4+ IAP | |
| Lenovo IdeaPad Gaming 3 15IAH7 | |
| Acer Swift X SFX16-52G-52VE | |
| Lenovo ThinkPad T16 G1 21BWS00200 | |
| Asus ZenBook Flip 15 Q539ZD | |
| Average Intel Core i5-1240P (7407 - 49934, n=16) | |
| Acer Aspire 5 A515-57G-53N8 | |
| AIDA64 / CPU SHA3 | |
| Average of class Multimedia (626 - 8623, n=58, last 2 years) | |
| Lenovo ThinkBook 16 G4+ IAP | |
| Lenovo IdeaPad Gaming 3 15IAH7 | |
| HP Omen 16-c0077ng | |
| Asus ZenBook Flip 15 Q539ZD | |
| Acer Swift X SFX16-52G-52VE | |
| Acer Aspire 5 A515-57G-53N8 | |
| Lenovo ThinkPad T16 G1 21BWS00200 | |
| Average Intel Core i5-1240P (415 - 2462, n=16) | |
| AIDA64 / CPU Queen | |
| Lenovo ThinkBook 16 G4+ IAP | |
| HP Omen 16-c0077ng | |
| Asus ZenBook Flip 15 Q539ZD | |
| Lenovo IdeaPad Gaming 3 15IAH7 | |
| Lenovo ThinkPad T16 G1 21BWS00200 | |
| Acer Aspire 5 A515-57G-53N8 | |
| Average of class Multimedia (13483 - 181505, n=45, last 2 years) | |
| Average Intel Core i5-1240P (29405 - 76736, n=16) | |
| Acer Swift X SFX16-52G-52VE | |
| AIDA64 / FPU SinJulia | |
| HP Omen 16-c0077ng | |
| Lenovo ThinkBook 16 G4+ IAP | |
| Average of class Multimedia (886 - 28794, n=58, last 2 years) | |
| Asus ZenBook Flip 15 Q539ZD | |
| Lenovo IdeaPad Gaming 3 15IAH7 | |
| Acer Swift X SFX16-52G-52VE | |
| Acer Aspire 5 A515-57G-53N8 | |
| Lenovo ThinkPad T16 G1 21BWS00200 | |
| Average Intel Core i5-1240P (2135 - 6540, n=16) | |
| AIDA64 / FPU Mandel | |
| HP Omen 16-c0077ng | |
| Average of class Multimedia (6395 - 105740, n=57, last 2 years) | |
| Lenovo ThinkBook 16 G4+ IAP | |
| Lenovo IdeaPad Gaming 3 15IAH7 | |
| Acer Swift X SFX16-52G-52VE | |
| Asus ZenBook Flip 15 Q539ZD | |
| Lenovo ThinkPad T16 G1 21BWS00200 | |
| Average Intel Core i5-1240P (5113 - 23992, n=16) | |
| Acer Aspire 5 A515-57G-53N8 | |
| AIDA64 / CPU AES | |
| HP Omen 16-c0077ng | |
| Lenovo IdeaPad Gaming 3 15IAH7 | |
| Lenovo ThinkBook 16 G4+ IAP | |
| Average of class Multimedia (8171 - 126790, n=58, last 2 years) | |
| Asus ZenBook Flip 15 Q539ZD | |
| Acer Swift X SFX16-52G-52VE | |
| Lenovo ThinkPad T16 G1 21BWS00200 | |
| Average Intel Core i5-1240P (8849 - 90370, n=16) | |
| Acer Aspire 5 A515-57G-53N8 | |
| AIDA64 / CPU ZLib | |
| Lenovo ThinkBook 16 G4+ IAP | |
| Average of class Multimedia (143.8 - 2022, n=58, last 2 years) | |
| Asus ZenBook Flip 15 Q539ZD | |
| Lenovo IdeaPad Gaming 3 15IAH7 | |
| HP Omen 16-c0077ng | |
| Acer Swift X SFX16-52G-52VE | |
| Acer Aspire 5 A515-57G-53N8 | |
| Lenovo ThinkPad T16 G1 21BWS00200 | |
| Average Intel Core i5-1240P (101.6 - 812, n=16) | |
| AIDA64 / FP64 Ray-Trace | |
| Average of class Multimedia (1014 - 26875, n=58, last 2 years) | |
| HP Omen 16-c0077ng | |
| Lenovo ThinkBook 16 G4+ IAP | |
| Lenovo IdeaPad Gaming 3 15IAH7 | |
| Acer Swift X SFX16-52G-52VE | |
| Asus ZenBook Flip 15 Q539ZD | |
| Lenovo ThinkPad T16 G1 21BWS00200 | |
| Average Intel Core i5-1240P (1154 - 5258, n=16) | |
| Acer Aspire 5 A515-57G-53N8 | |
| AIDA64 / CPU PhotoWorxx | |
| Average of class Multimedia (8187 - 88154, n=58, last 2 years) | |
| Acer Swift X SFX16-52G-52VE | |
| Lenovo ThinkBook 16 G4+ IAP | |
| Asus ZenBook Flip 15 Q539ZD | |
| Average Intel Core i5-1240P (11873 - 43661, n=16) | |
| Acer Aspire 5 A515-57G-53N8 | |
| HP Omen 16-c0077ng | |
| Lenovo ThinkPad T16 G1 21BWS00200 | |
| Lenovo IdeaPad Gaming 3 15IAH7 | |
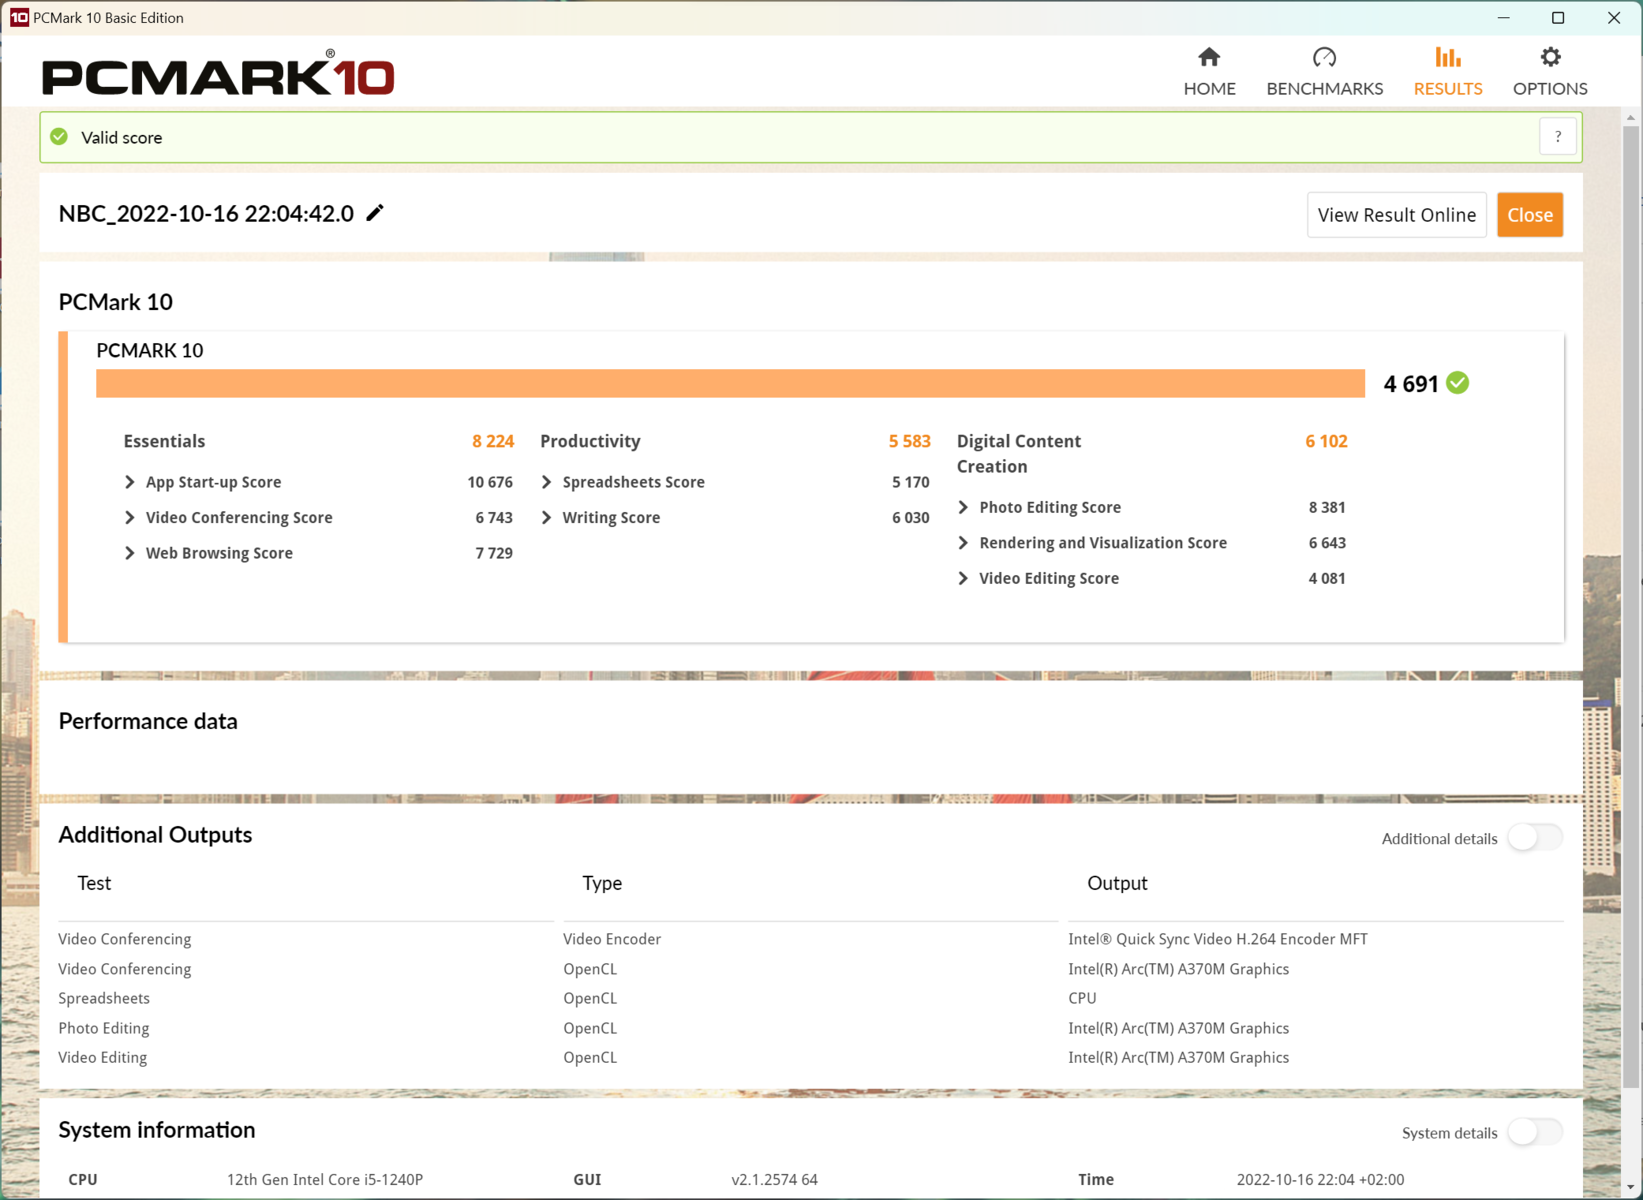
System Performance
From everyday tasks such as browsing, streaming or writing to ambitious editing of pictures and videos, the system does not present any weaknesses. Thanks to sufficient cores, the processor doesn't shy away from multitasking. At most, the Swift X takes a break now and then during complex tasks, including installation processes. In contrast, no delays are noticeable when dealing with the programs.
Graphically demanding tasks, on the other hand, push the rather small Intel Arc A370M graphics unit to its limits relatively quickly. The gaming scores are correspondingly weak, while the synthetic benchmarks for content creation, i.e., media editing, for example, are almost on par with other multimedia notebooks. As a rule, however, they use faster GPUs, which are always responsible for slightly higher ratings. In any case, an overall solid business notebook like the Lenovo ThinkPad T16 G1 with an identical processor can be clearly outpaced.
Using the notebook in battery mode hardly results in any loss of performance. However, the battery is drained quite quickly under heavy workloads despite the rather economical components.
CrossMark: Overall | Productivity | Creativity | Responsiveness
| PCMark 10 / Score | |
| Average of class Multimedia (4325 - 10386, n=56, last 2 years) | |
| HP Omen 16-c0077ng | |
| Lenovo IdeaPad Gaming 3 15IAH7 | |
| Asus ZenBook Flip 15 Q539ZD | |
| Acer Swift X SFX16-52G-52VE | |
| Average Intel Core i5-1240P, Intel Arc A370M (n=1) | |
| Acer Aspire 5 A515-57G-53N8 | |
| Lenovo ThinkPad T16 G1 21BWS00200 | |
| PCMark 10 / Essentials | |
| Asus ZenBook Flip 15 Q539ZD | |
| Average of class Multimedia (8025 - 11664, n=55, last 2 years) | |
| HP Omen 16-c0077ng | |
| Lenovo IdeaPad Gaming 3 15IAH7 | |
| Acer Swift X SFX16-52G-52VE | |
| Average Intel Core i5-1240P, Intel Arc A370M (n=1) | |
| Lenovo ThinkPad T16 G1 21BWS00200 | |
| Acer Aspire 5 A515-57G-53N8 | |
| PCMark 10 / Productivity | |
| Average of class Multimedia (7323 - 18233, n=55, last 2 years) | |
| Lenovo IdeaPad Gaming 3 15IAH7 | |
| HP Omen 16-c0077ng | |
| Acer Aspire 5 A515-57G-53N8 | |
| Acer Swift X SFX16-52G-52VE | |
| Average Intel Core i5-1240P, Intel Arc A370M (n=1) | |
| Asus ZenBook Flip 15 Q539ZD | |
| Lenovo ThinkPad T16 G1 21BWS00200 | |
| PCMark 10 / Digital Content Creation | |
| Average of class Multimedia (3651 - 16240, n=55, last 2 years) | |
| HP Omen 16-c0077ng | |
| Lenovo IdeaPad Gaming 3 15IAH7 | |
| Asus ZenBook Flip 15 Q539ZD | |
| Acer Swift X SFX16-52G-52VE | |
| Average Intel Core i5-1240P, Intel Arc A370M (n=1) | |
| Acer Aspire 5 A515-57G-53N8 | |
| Lenovo ThinkPad T16 G1 21BWS00200 | |
| CrossMark / Overall | |
| Average of class Multimedia (866 - 2728, n=64, last 2 years) | |
| Lenovo ThinkBook 16 G4+ IAP | |
| Asus ZenBook Flip 15 Q539ZD | |
| Acer Swift X SFX16-52G-52VE | |
| Average Intel Core i5-1240P, Intel Arc A370M (n=1) | |
| Lenovo ThinkPad T16 G1 21BWS00200 | |
| CrossMark / Productivity | |
| Average of class Multimedia (931 - 2489, n=64, last 2 years) | |
| Lenovo ThinkBook 16 G4+ IAP | |
| Asus ZenBook Flip 15 Q539ZD | |
| Lenovo ThinkPad T16 G1 21BWS00200 | |
| Acer Swift X SFX16-52G-52VE | |
| Average Intel Core i5-1240P, Intel Arc A370M (n=1) | |
| CrossMark / Creativity | |
| Average of class Multimedia (907 - 3465, n=64, last 2 years) | |
| Asus ZenBook Flip 15 Q539ZD | |
| Lenovo ThinkBook 16 G4+ IAP | |
| Acer Swift X SFX16-52G-52VE | |
| Average Intel Core i5-1240P, Intel Arc A370M (n=1) | |
| Lenovo ThinkPad T16 G1 21BWS00200 | |
| CrossMark / Responsiveness | |
| Lenovo ThinkBook 16 G4+ IAP | |
| Average of class Multimedia (605 - 2024, n=64, last 2 years) | |
| Asus ZenBook Flip 15 Q539ZD | |
| Lenovo ThinkPad T16 G1 21BWS00200 | |
| Acer Swift X SFX16-52G-52VE | |
| Average Intel Core i5-1240P, Intel Arc A370M (n=1) | |
| PCMark 10 Score | 5898 points | |
Help | ||
| AIDA64 / Memory Copy | |
| Average of class Multimedia (11299 - 132135, n=58, last 2 years) | |
| Acer Swift X SFX16-52G-52VE | |
| Asus ZenBook Flip 15 Q539ZD | |
| Lenovo ThinkBook 16 G4+ IAP | |
| Average Intel Core i5-1240P (23312 - 70537, n=16) | |
| Acer Aspire 5 A515-57G-53N8 | |
| HP Omen 16-c0077ng | |
| Lenovo IdeaPad Gaming 3 15IAH7 | |
| Lenovo ThinkPad T16 G1 21BWS00200 | |
| AIDA64 / Memory Read | |
| Average of class Multimedia (11624 - 174586, n=58, last 2 years) | |
| Lenovo ThinkBook 16 G4+ IAP | |
| Asus ZenBook Flip 15 Q539ZD | |
| Acer Swift X SFX16-52G-52VE | |
| Average Intel Core i5-1240P (18989 - 70553, n=16) | |
| Acer Aspire 5 A515-57G-53N8 | |
| HP Omen 16-c0077ng | |
| Lenovo IdeaPad Gaming 3 15IAH7 | |
| Lenovo ThinkPad T16 G1 21BWS00200 | |
| AIDA64 / Memory Write | |
| Average of class Multimedia (11755 - 134998, n=58, last 2 years) | |
| Asus ZenBook Flip 15 Q539ZD | |
| Acer Swift X SFX16-52G-52VE | |
| Lenovo ThinkBook 16 G4+ IAP | |
| Average Intel Core i5-1240P (23454 - 62496, n=16) | |
| Acer Aspire 5 A515-57G-53N8 | |
| HP Omen 16-c0077ng | |
| Lenovo IdeaPad Gaming 3 15IAH7 | |
| Lenovo ThinkPad T16 G1 21BWS00200 | |
| AIDA64 / Memory Latency | |
| Average of class Multimedia (7 - 535, n=57, last 2 years) | |
| Average Intel Core i5-1240P (85.1 - 188.3, n=11) | |
| Lenovo ThinkBook 16 G4+ IAP | |
| Acer Swift X SFX16-52G-52VE | |
| Lenovo IdeaPad Gaming 3 15IAH7 | |
| Lenovo ThinkPad T16 G1 21BWS00200 | |
| HP Omen 16-c0077ng | |
| Asus ZenBook Flip 15 Q539ZD | |
* ... smaller is better
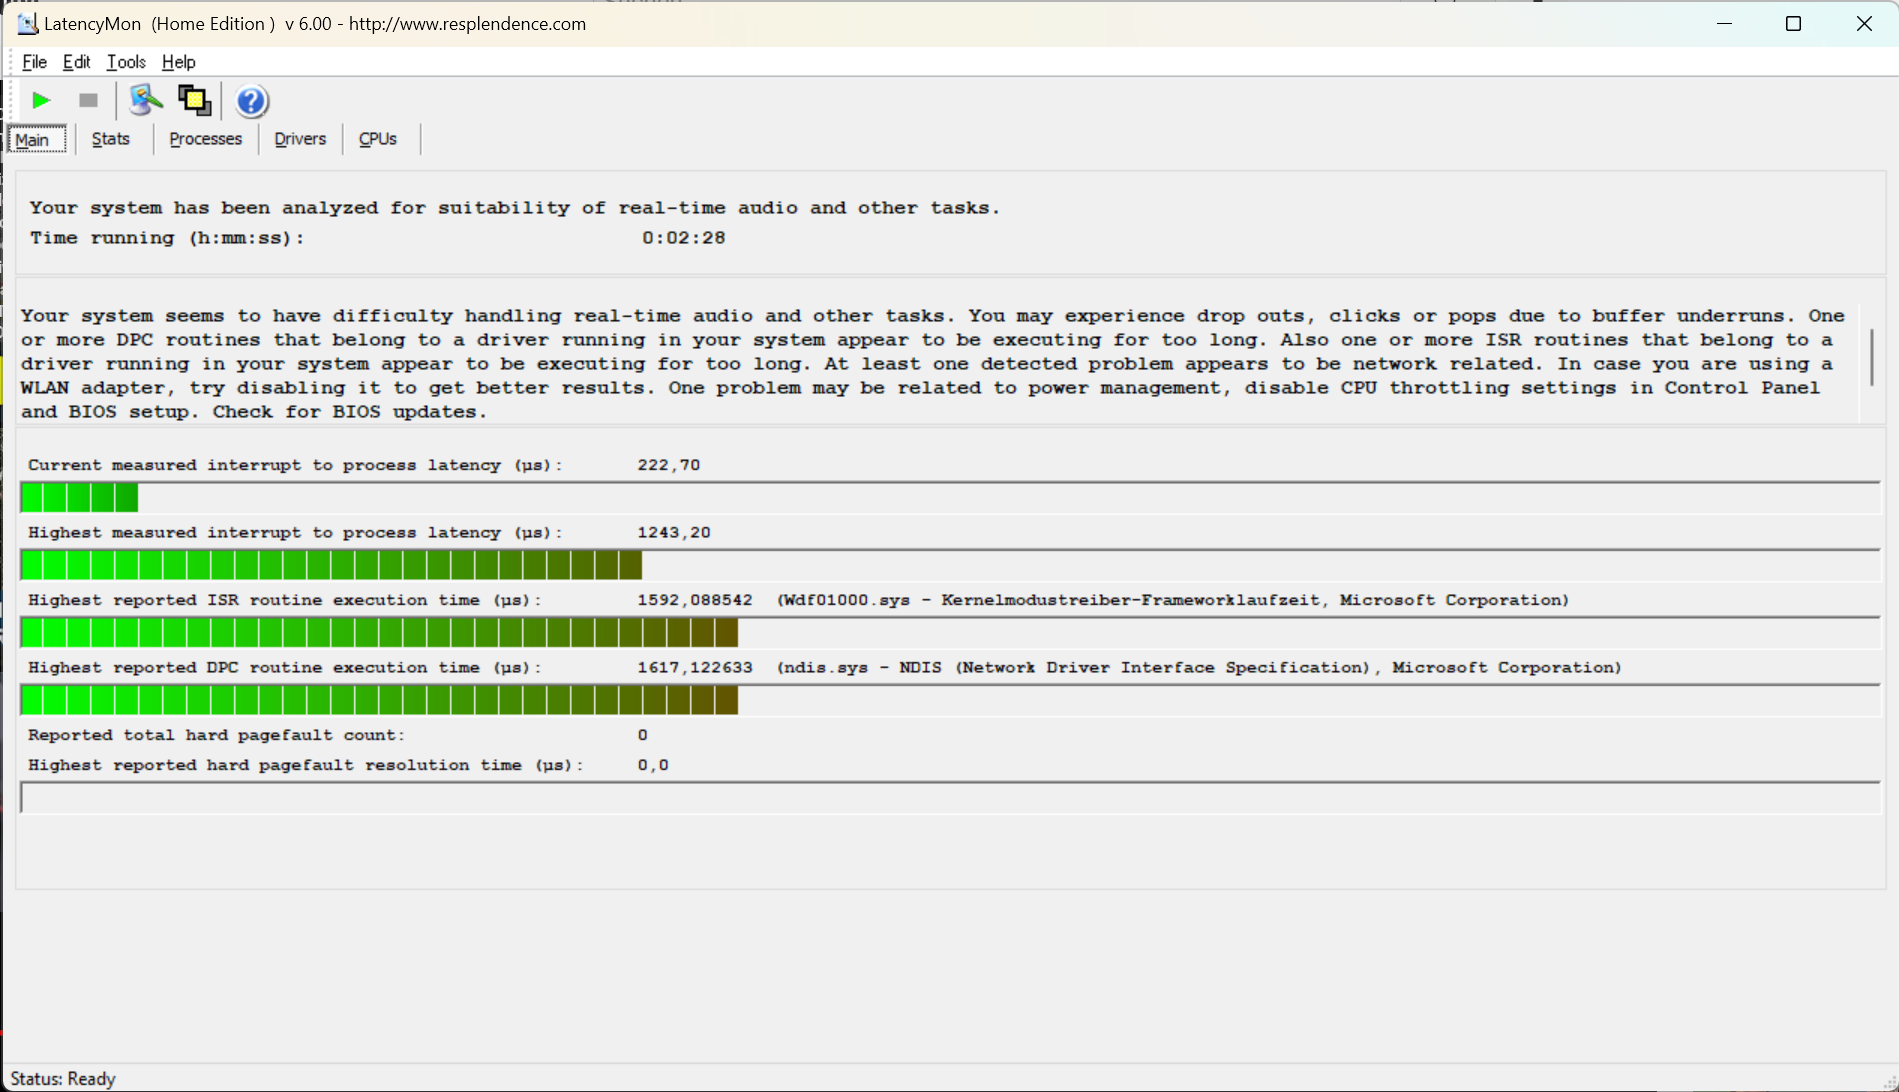
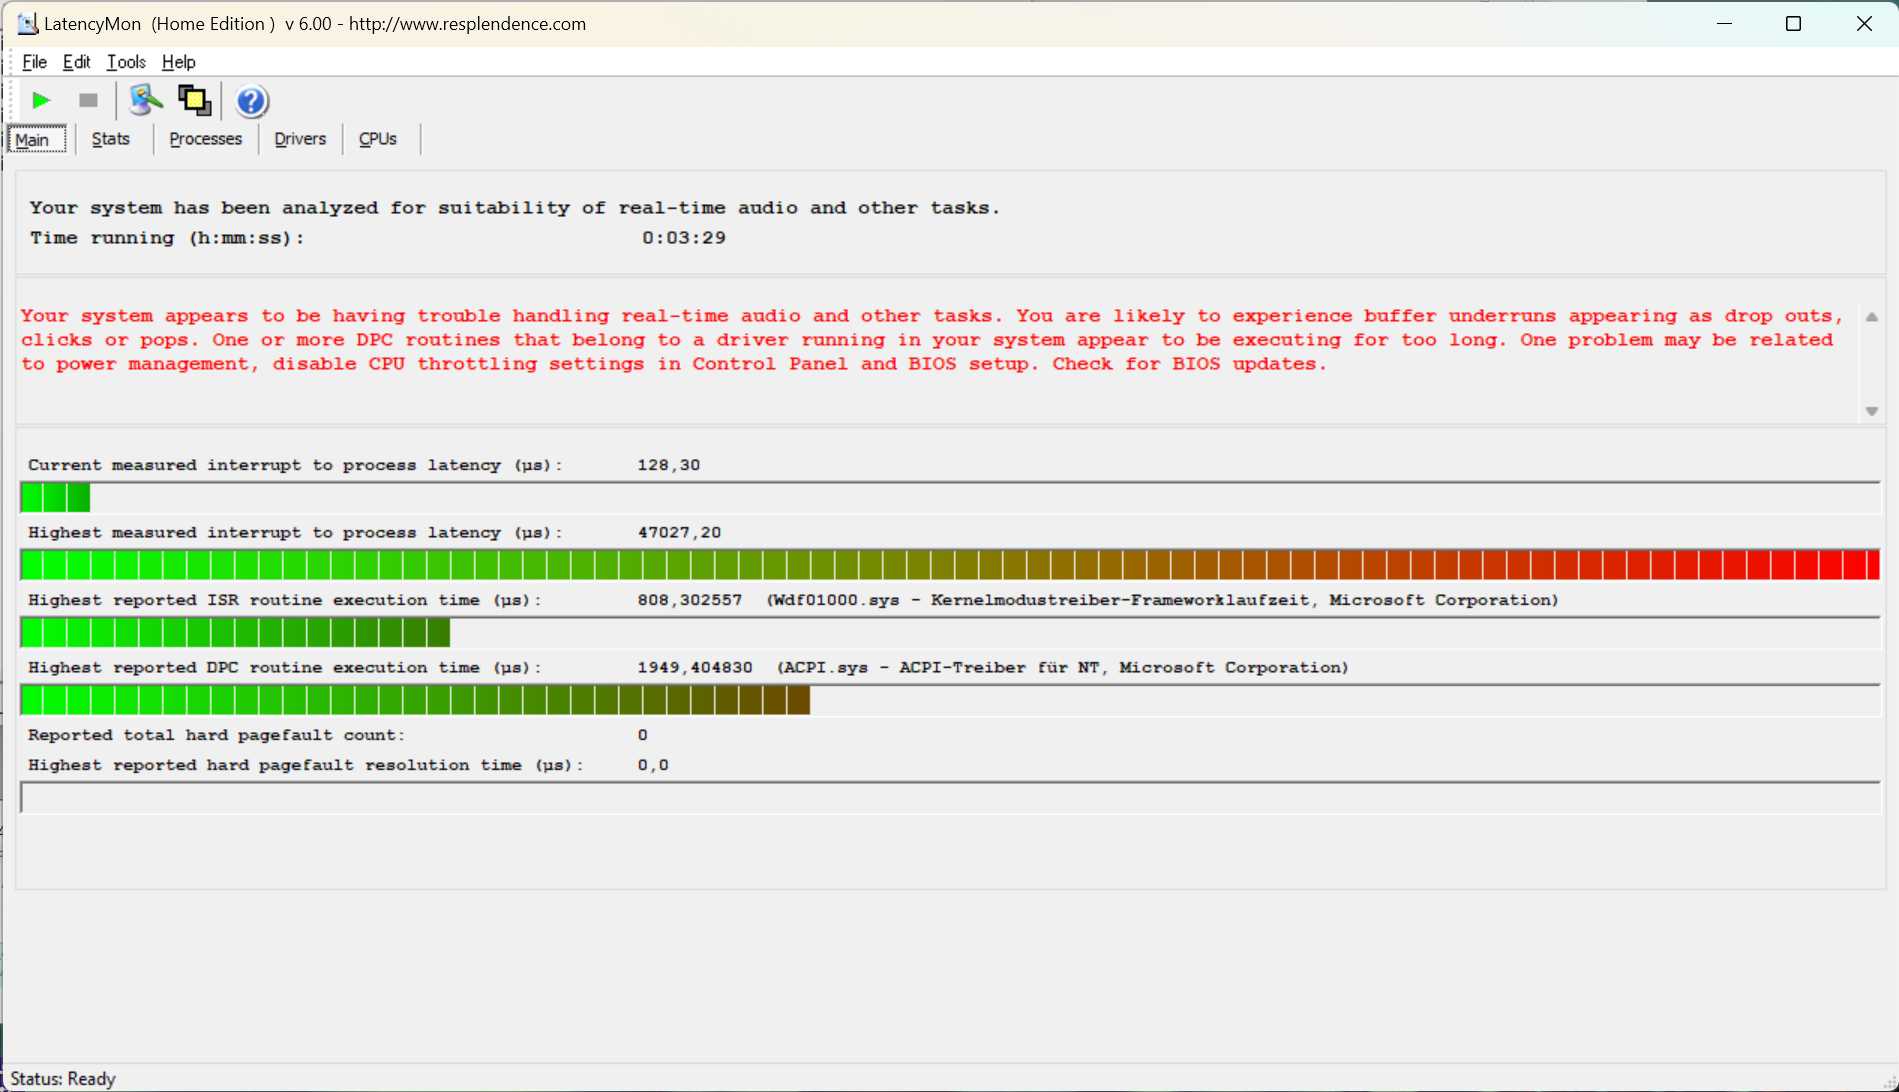
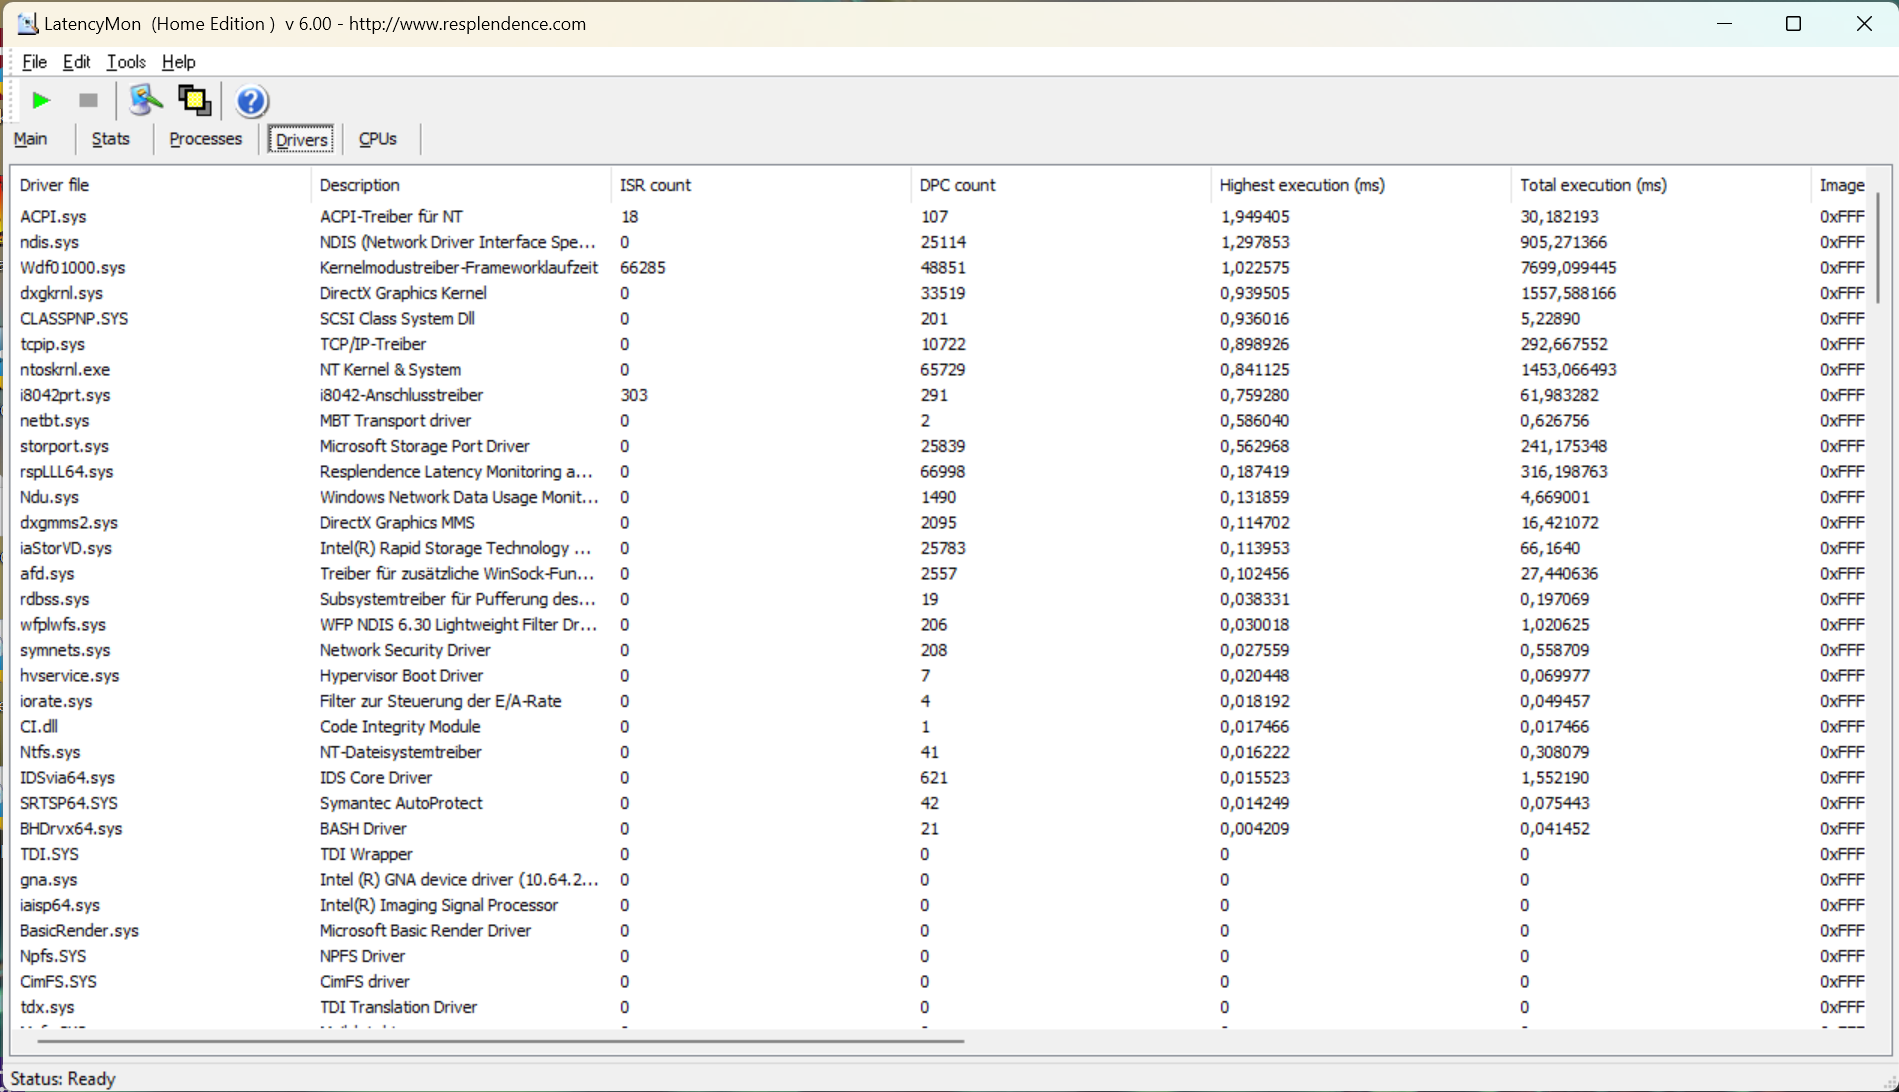
DPC latencies
Acer's notebook is not really suitable for real-time audio and video processing, even though just over 1 ms is decent in comparison with the competition. However, similar problems occur as those experienced by the immediate predecessor, the Acer Swift X SFX16-51G, when "balanced" is selected in the energy-saving plan. Then the latency is beyond acceptable and noticeable interruptions could be perceived either way. However, an update of the BIOS or changed drivers could fix the problem.
| DPC Latencies / LatencyMon - interrupt to process latency (max), Web, Youtube, Prime95 | |
| Lenovo ThinkBook 16 G4+ IAP | |
| HP Omen 16-c0077ng | |
| Acer Aspire 5 A515-57G-53N8 | |
| Lenovo ThinkPad T16 G1 21BWS00200 | |
| Lenovo IdeaPad Gaming 3 15IAH7 | |
| Acer Swift X SFX16-52G-52VE | |
| Asus ZenBook Flip 15 Q539ZD | |
* ... smaller is better
Storage
The M.2 SSD from Micron gives an impressive performance. This is mainly due to the PCIe 4.0 standard, which means that the sequential transfer rates are very high. There's also nothing to complain about in terms of seek times, so the memory won't have a negative impact on the system performance.
However, problems with the cooling become apparent during the endurance test. Therefore, even with larger write volumes, the data rates will decrease significantly. Such a scenario is rather rare in practice, but it indicates that the hard drive temperature is higher than in notebooks that achieve a consistent performance. This can have a negative effect on the service life.

| Acer Swift X SFX16-52G-52VE Micron 3400 MTFDKBA512TFH 512GB | Acer Aspire 5 A515-57G-53N8 Micron 2450 512GB MTFDKBA512TFK | Lenovo ThinkPad T16 G1 21BWS00200 Samsung PM9A1 MZVL2512HCJQ | Asus ZenBook Flip 15 Q539ZD SK Hynix HFM001TD3JX013N | Lenovo IdeaPad Gaming 3 15IAH7 Intel SSD 660p SSDPEKNW512G8 | HP Omen 16-c0077ng Samsung PM981a MZVLB1T0HBLR | Lenovo ThinkBook 16 G4+ IAP Micron 2450 1TB MTFDKCD1T0TFK | Average Micron 3400 MTFDKBA512TFH 512GB | Average of class Multimedia | |
|---|---|---|---|---|---|---|---|---|---|
| Drive Performance rating | |||||||||
| Percent (pt) | 79.3 | 50.8 -36% | 69.8 -12% | 58.1 -27% | 52 -34% | 74.1 -7% | 64.1 -19% | 72.4 -9% | 75.2 -5% |
| DiskSpd | -64% | -17% | -39% | -42% | -18% | -31% | -17% | -12% | |
| seq read (MB/s) | 2619 | 756 -71% | 3645 39% | 2216 -15% | 2168 -17% | 2746 5% | 2124 -19% | 2722 ? 4% | 2944 ? 12% |
| seq write (MB/s) | 3900 | 830 -79% | 2809 -28% | 2029 -48% | 1607 -59% | 2786 -29% | 2677 -31% | 3356 ? -14% | 3129 ? -20% |
| seq q8 t1 read (MB/s) | 6439 | 1023 -84% | 6524 1% | 3554 -45% | 2660 -59% | 3503 -46% | 3377 -48% | 6014 ? -7% | 5727 ? -11% |
| seq q8 t1 write (MB/s) | 3911 | 934 -76% | 4812 23% | 2969 -24% | 1671 -57% | 3016 -23% | 3241 -17% | 3698 ? -5% | 4644 ? 19% |
| 4k q1 t1 read (MB/s) | 65.3 | 18.6 -72% | 68.2 4% | 62.7 -4% | 72.3 11% | 48.8 -25% | 61.2 -6% | 54.8 ? -16% | 62.7 ? -4% |
| 4k q1 t1 write (MB/s) | 208 | 221 6% | 134.8 -35% | 138.2 -34% | 194.3 -7% | 144 -31% | 187.8 -10% | 161.6 ? -22% | 157.9 ? -24% |
| 4k q32 t16 read (MB/s) | 1522 | 416 -73% | 683 -55% | 628 -59% | 474 -69% | 1798 18% | 923 -39% | 1020 ? -33% | 1420 ? -7% |
| 4k q32 t16 write (MB/s) | 2390 | 923 -61% | 293 -88% | 405 -83% | 609 -75% | 2142 -10% | 501 -79% | 1356 ? -43% | 990 ? -59% |
| AS SSD | -47% | -1% | -27% | -24% | 5% | -32% | -3% | -10% | |
| Score Total (Points) | 4936 | 4707 -5% | 4630 -6% | 4202 -15% | 2702 -45% | 5866 19% | 4750 -4% | 4778 ? -3% | 5069 ? 3% |
| Score Read (Points) | 1737 | 1763 1% | 1112 -36% | 1221 -30% | 760 -56% | 2363 36% | 1296 -25% | 1588 ? -9% | 1591 ? -8% |
| Score Write (Points) | 2287 | 2024 -11% | 3010 32% | 2393 5% | 1584 -31% | 2325 2% | 2826 24% | 2443 ? 7% | 2724 ? 19% |
| Seq Read (MB/s) | 3200 | 3123.89 -2% | 3225 1% | 2906.11 -9% | 2432.02 -24% | 3148 -2% | 2825 -12% | 4340 ? 36% | 4496 ? 41% |
| Seq Write (MB/s) | 3430 | 3008.29 -12% | 1567 -54% | 1889.69 -45% | 1229.14 -64% | 2565 -25% | 1852 -46% | 2806 ? -18% | 3066 ? -11% |
| 4K Read (MB/s) | 63.1 | 89.47 42% | 69.7 10% | 57.61 -9% | 75.66 20% | 52.1 -17% | 58.44 -7% | 58.6 ? -7% | 61.6 ? -2% |
| 4K Write (MB/s) | 141.6 | 277.46 96% | 170.9 21% | 135.2 -5% | 242.19 71% | 136.8 -3% | 227.47 61% | 163.1 ? 15% | 185.7 ? 31% |
| 4K-64 Read (MB/s) | 1354 | 1360.83 1% | 720 -47% | 872.52 -36% | 441.63 -67% | 1996 47% | 954.65 -29% | 1096 ? -19% | 1080 ? -20% |
| 4K-64 Write (MB/s) | 1802 | 1446.04 -20% | 2682 49% | 2069.03 15% | 1218.61 -32% | 1931 7% | 2413.44 34% | 1999 ? 11% | 2231 ? 24% |
| Access Time Read * (ms) | 0.064 | 0.106 -66% | 0.059 8% | 0.035 45% | 0.073 -14% | 0.066 -3% | 0.026 59% | 0.0568 ? 11% | 0.06007 ? 6% |
| Access Time Write * (ms) | 0.026 | 0.168 -546% | 0.024 8% | 0.082 -215% | 0.033 -27% | 0.027 -4% | 0.131 -404% | 0.0402 ? -55% | 0.07561 ? -191% |
| Total Average (Program / Settings) | -49% /
-53% | -10% /
-8% | -31% /
-32% | -33% /
-32% | -7% /
-5% | -27% /
-31% | -10% /
-9% | -9% /
-10% |
* ... smaller is better
Continuous load read: DiskSpd Read Loop, Queue Depth 8
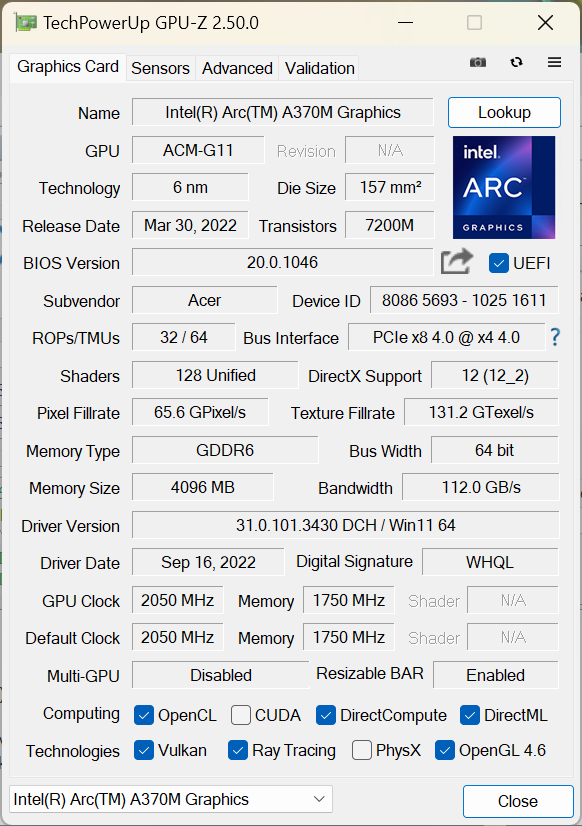
Graphics card
The Intel Arc A370M, which was only released in the spring of 2022, uses the computing unit of the Iris Xe graphics. A total of 8 cores and 8 ray-tracing units are available. 4 GB of video memory is generous given the low performance. A maximum of 45 W is available for the card. Over a prolonged period of time, the value is first reduced to 35 W and finally to 25 W. Therefore, the power supply is at most half of what is typically granted to a gaming graphics card.
Therefore, it can hardly be compared with simple mobile GPUs from the competition. Both the AMD Radeon RX 6500M and the Nvidia GeForce RTX 3050 are clearly superior. Even the Acer Aspire 5 A515-57G with the aged Nvidia GeForce RTX 2050 and a TGP of 35 W is faster, especially when playing games.
Conversely, the A370M can clearly outperform the GeForce MX models, for example. For a multimedia laptop like the Acer Swift X SFX16, it is a spartan but sufficiently powerful choice. Efficiency is paramount here. The results in our tests in 3DMark, Blender and other tests are correspondingly weak. The Swift X is always at the bottom of the performance scale, but still clearly ahead of notebooks without a separate GPU. In Blender, the Intel Arc also performs better than the multimedia laptop average of the last two years.
Further benchmarks and performance values can be found in our GPU benchmark list.
| 3DMark 11 Performance | 12308 points | |
| 3DMark Cloud Gate Standard Score | 27250 points | |
| 3DMark Fire Strike Score | 7717 points | |
| 3DMark Time Spy Score | 3505 points | |
Help | ||
* ... smaller is better
Gaming Performance
Generally, it is also possible to play with the relatively low performance of the Acer Swift X. From the still demanding Witcher 3 from 2015 to the fairly recent Grid Legends, there are settings that deliver playable frame rates. Medium details and full HD resolution can be achieved.
However, even the GeForce RTX 2050 is ahead of the Intel Arc A370M used here in almost all benchmarks. Since this is fairly new, the gap in the benchmark decreases noticeably with more current game titles. Strange Brigade from 2018 can sometimes be played more smoothly than with the RTX 2050. For Grid Legends, both graphics cards are at about the same level. The older the games and, therefore, the technology behind them, the more troublesome it is for the Intel Arc to handle them.
A few problems can still be observed with the Intel Arc driver. In this case, there were crashes in GTA V. The frame rate repeatedly dropped noticeably in Fifa 23 on the lowest quality settings of the device. On the other hand, high settings resulted in a comparatively pleasant gaming experience. Generally, complications are to be expected with newer titles, but usually only with certain settings. Continuously updating to the latest driver version is advisable.
In contrast, entry-level gaming notebooks like the Lenovo IdeaPad Gaming 3 can almost consistently generate twice as many frames per second.
| GTA V - 1920x1080 High/On (Advanced Graphics Off) AA:2xMSAA + FX AF:8x | |
| HP Omen 16-c0077ng | |
| Lenovo IdeaPad Gaming 3 15IAH7 | |
| Lenovo ThinkBook 16 G4+ IAP | |
| Average of class Multimedia (19.5 - 186.1, n=52, last 2 years) | |
| Acer Aspire 5 A515-57G-53N8 | |
| Average Intel Arc A370M (40.5 - 41.4, n=3) | |
| Asus ZenBook Flip 15 Q539ZD | |
| Acer Swift X SFX16-52G-52VE | |
| Lenovo ThinkPad T16 G1 21BWS00200 | |
The stress test with Witcher 3 on the highest settings shows stable behavior. Shortly after starting, the frame rate falls minimally, but then remains absolutely stable. This means that the dual fan can cool the GPU and CPU sufficiently and a further reduction of the power consumption is not necessary, even in exceptional situations.
Witcher 3 FPS-Diagramm
| low | med. | high | ultra | QHD | |
|---|---|---|---|---|---|
| GTA V (2015) | 145.4 | 135.1 | 40.5 | 0 | 9.67 |
| The Witcher 3 (2015) | 121 | 87 | 45 | 25 | |
| Dota 2 Reborn (2015) | 82.6 | 69.2 | 62.2 | 57.7 | |
| Final Fantasy XV Benchmark (2018) | 66.9 | 34.4 | 19.6 | 14.4 | |
| X-Plane 11.11 (2018) | 36.9 | 27.4 | 23.9 | ||
| Far Cry 5 (2018) | 87 | 48 | 45 | 42 | 28 |
| Strange Brigade (2018) | 184.8 | 76.7 | 64.2 | 54.3 | |
| God of War (2022) | 35 | 30 | 24 | 18 | 12 |
| GRID Legends (2022) | 97.5 | 68.3 | 57.6 | 41.7 | 31.3 |
| Vampire Bloodhunt (2022) | 127 | 87 | 62 | 55 | 34 |
| F1 22 (2022) | 127.2 | 49.5 | 46.3 | 33 | 2.85 |
| FIFA 23 (2022) | 70 (visible stuttering) | 62 | 40 | 41 | 30 |
Emissions – A low-key multimedia laptop
Noise emissions
More than a background noise is not audible outside of maximum performance. As a rule, Acer's notebook is almost silent.
During heavy use, the fan speed speeds up regularly, but at an acceptable rate. Screaming fans are not an issue here. Even at the highest cooling performance, the noise level remains within a tolerable range. The Swift X is definitely audible then, but quiet compared to a full-fledged gaming notebook or a creator laptop from the premium segment.
Unfortunately, our test device produces an unpleasant electronic noise. Presumably, this is related to an incorrectly manufactured transistor. We couldn't pinpoint the exact source. However, it was noticeable that it only occurred during low workloads and initially fell silent after processing a higher workload. After each restart, however, it occurred again.
Noise level
| Idle |
| 25 / 25 / 26.4 dB(A) |
| Load |
| 36.5 / 43 dB(A) |
 | ||
30 dB silent 40 dB(A) audible 50 dB(A) loud |
||
min: | ||
| Acer Swift X SFX16-52G-52VE A370M, i5-1240P, Micron 3400 MTFDKBA512TFH 512GB | Acer Aspire 5 A515-57G-53N8 GeForce RTX 2050 Mobile, i5-1240P, Micron 2450 512GB MTFDKBA512TFK | Lenovo ThinkPad T16 G1 21BWS00200 Iris Xe G7 80EUs, i5-1240P, Samsung PM9A1 MZVL2512HCJQ | Asus ZenBook Flip 15 Q539ZD A370M, i7-12700H, SK Hynix HFM001TD3JX013N | Lenovo IdeaPad Gaming 3 15IAH7 GeForce RTX 3050 Ti Laptop GPU, i5-12500H, Intel SSD 660p SSDPEKNW512G8 | HP Omen 16-c0077ng Radeon RX 6600M, R7 5800H, Samsung PM981a MZVLB1T0HBLR | Lenovo ThinkBook 16 G4+ IAP GeForce RTX 2050 Mobile, i7-12700H, Micron 2450 1TB MTFDKCD1T0TFK | |
|---|---|---|---|---|---|---|---|
| Noise | -11% | 14% | 6% | -16% | -23% | -4% | |
| off / environment * (dB) | 25 | 25 -0% | 23.3 7% | 23 8% | 25 -0% | 25 -0% | 24.2 3% |
| Idle Minimum * (dB) | 25 | 25 -0% | 23.3 7% | 23 8% | 29 -16% | 25 -0% | 24.2 3% |
| Idle Average * (dB) | 25 | 29 -16% | 23.3 7% | 23 8% | 30 -20% | 31.2 -25% | 24.2 3% |
| Idle Maximum * (dB) | 26.4 | 31 -17% | 23.3 12% | 24.7 6% | 32 -21% | 33.8 -28% | 24.2 8% |
| Load Average * (dB) | 36.5 | 46 -26% | 25.1 31% | 31.7 13% | 42 -15% | 55.4 -52% | 47 -29% |
| Load Maximum * (dB) | 43 | 47 -9% | 34 21% | 45.2 -5% | 54 -26% | 56 -30% | 47 -9% |
| Witcher 3 ultra * (dB) | 42 | 32.1 | 45.2 | 46 | 47 |
* ... smaller is better
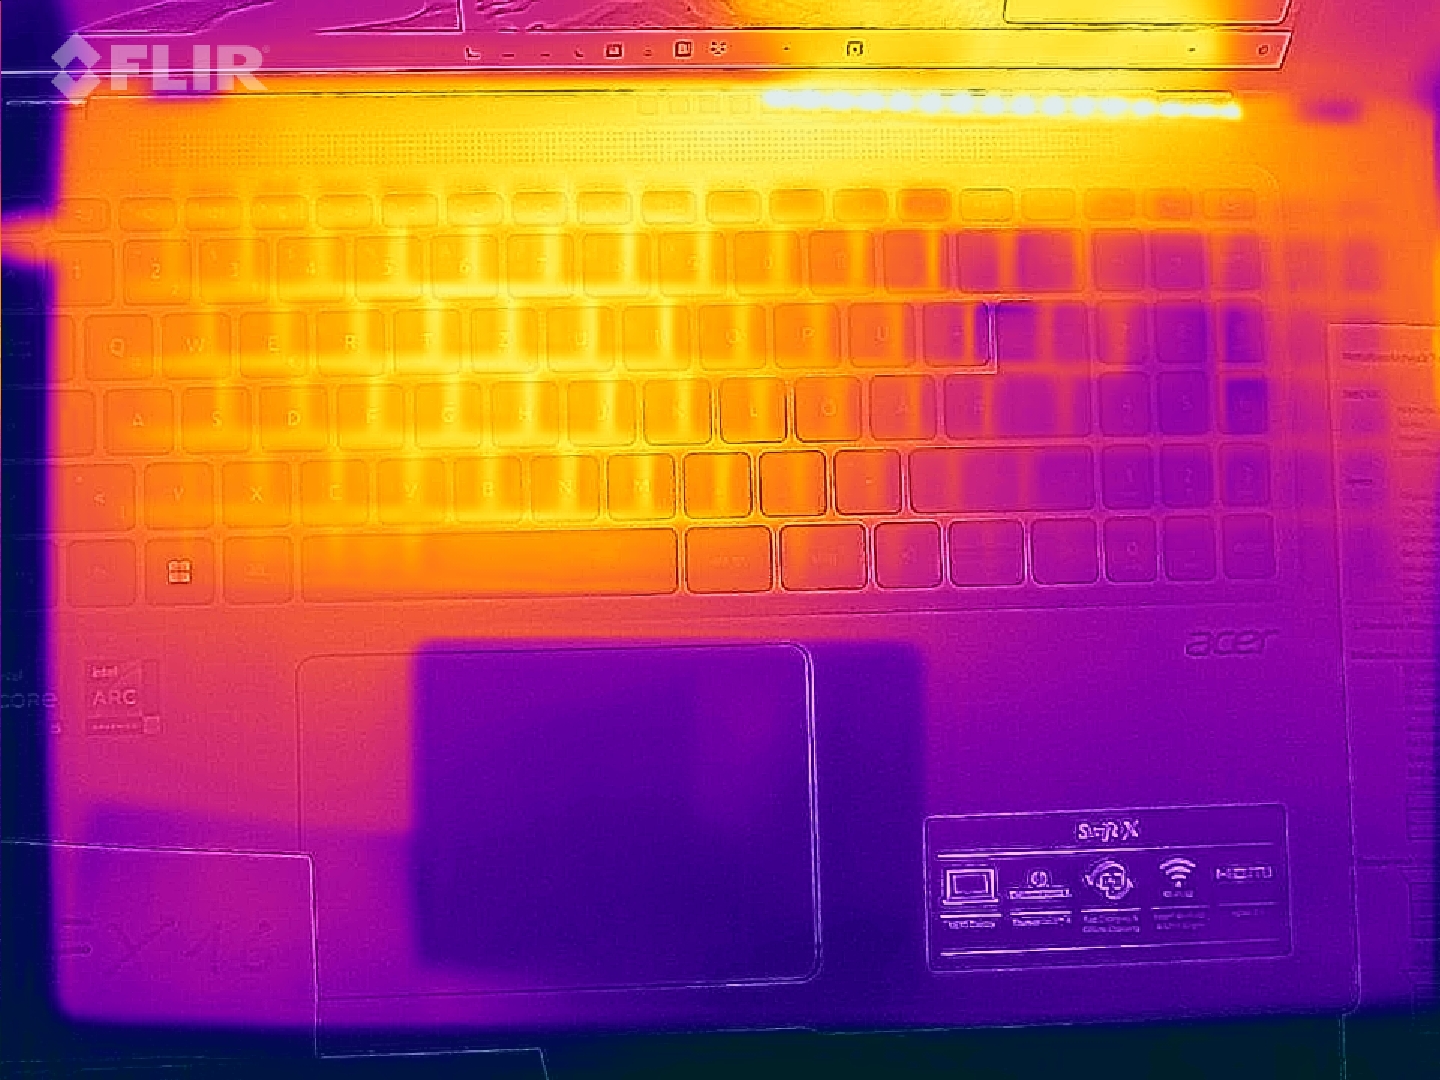
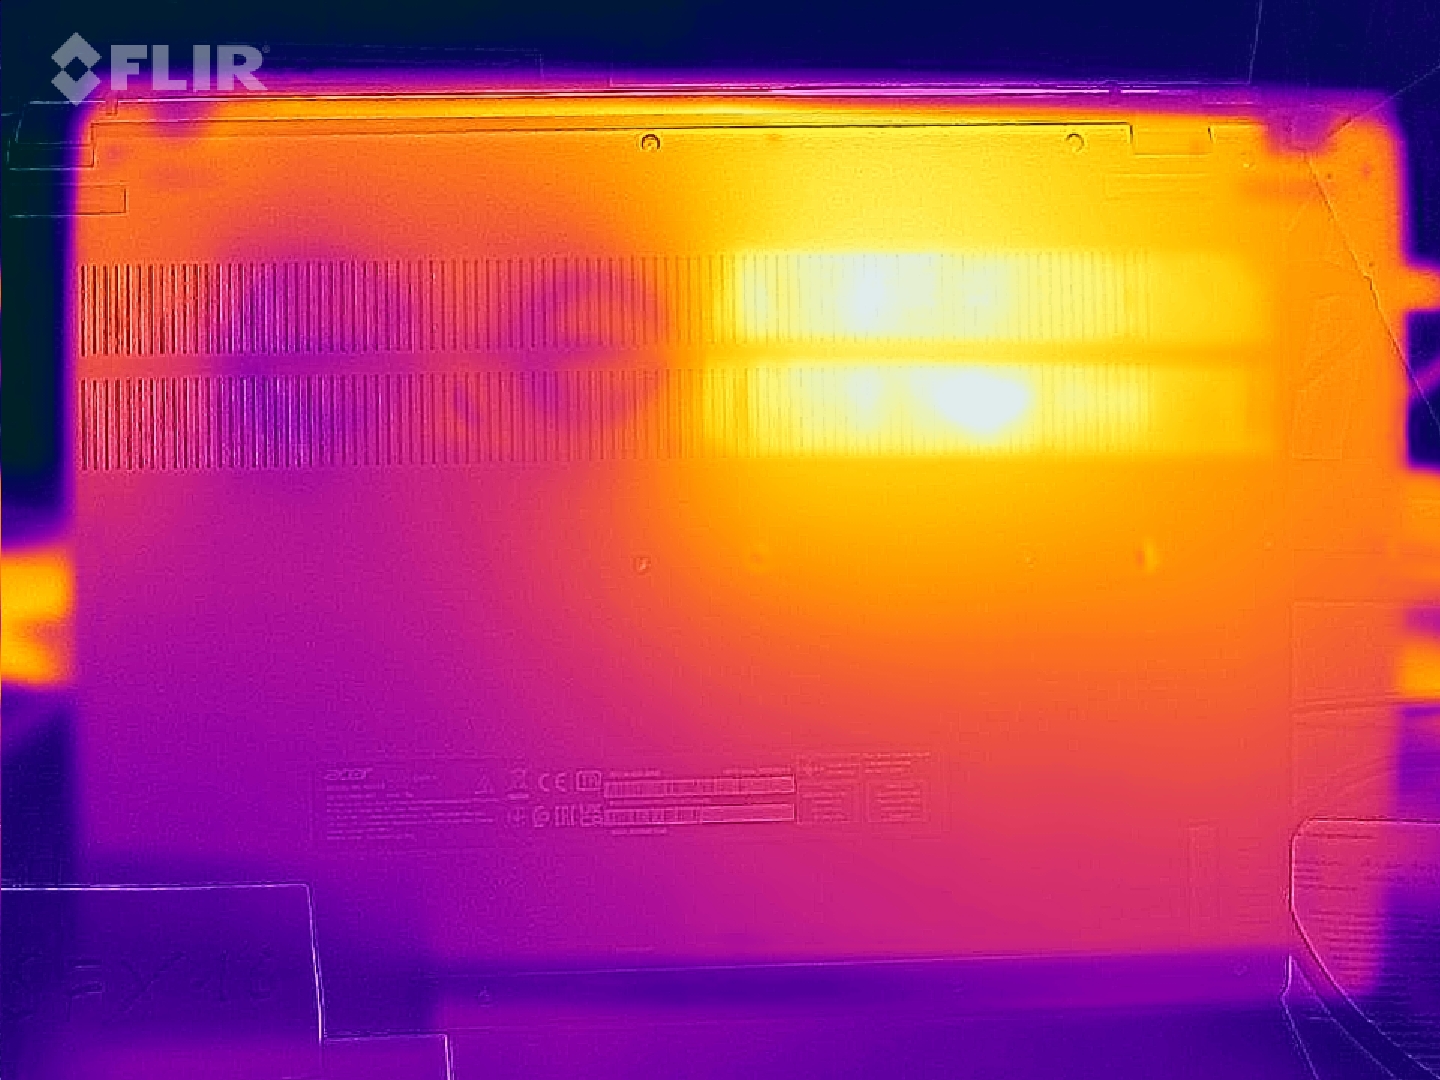
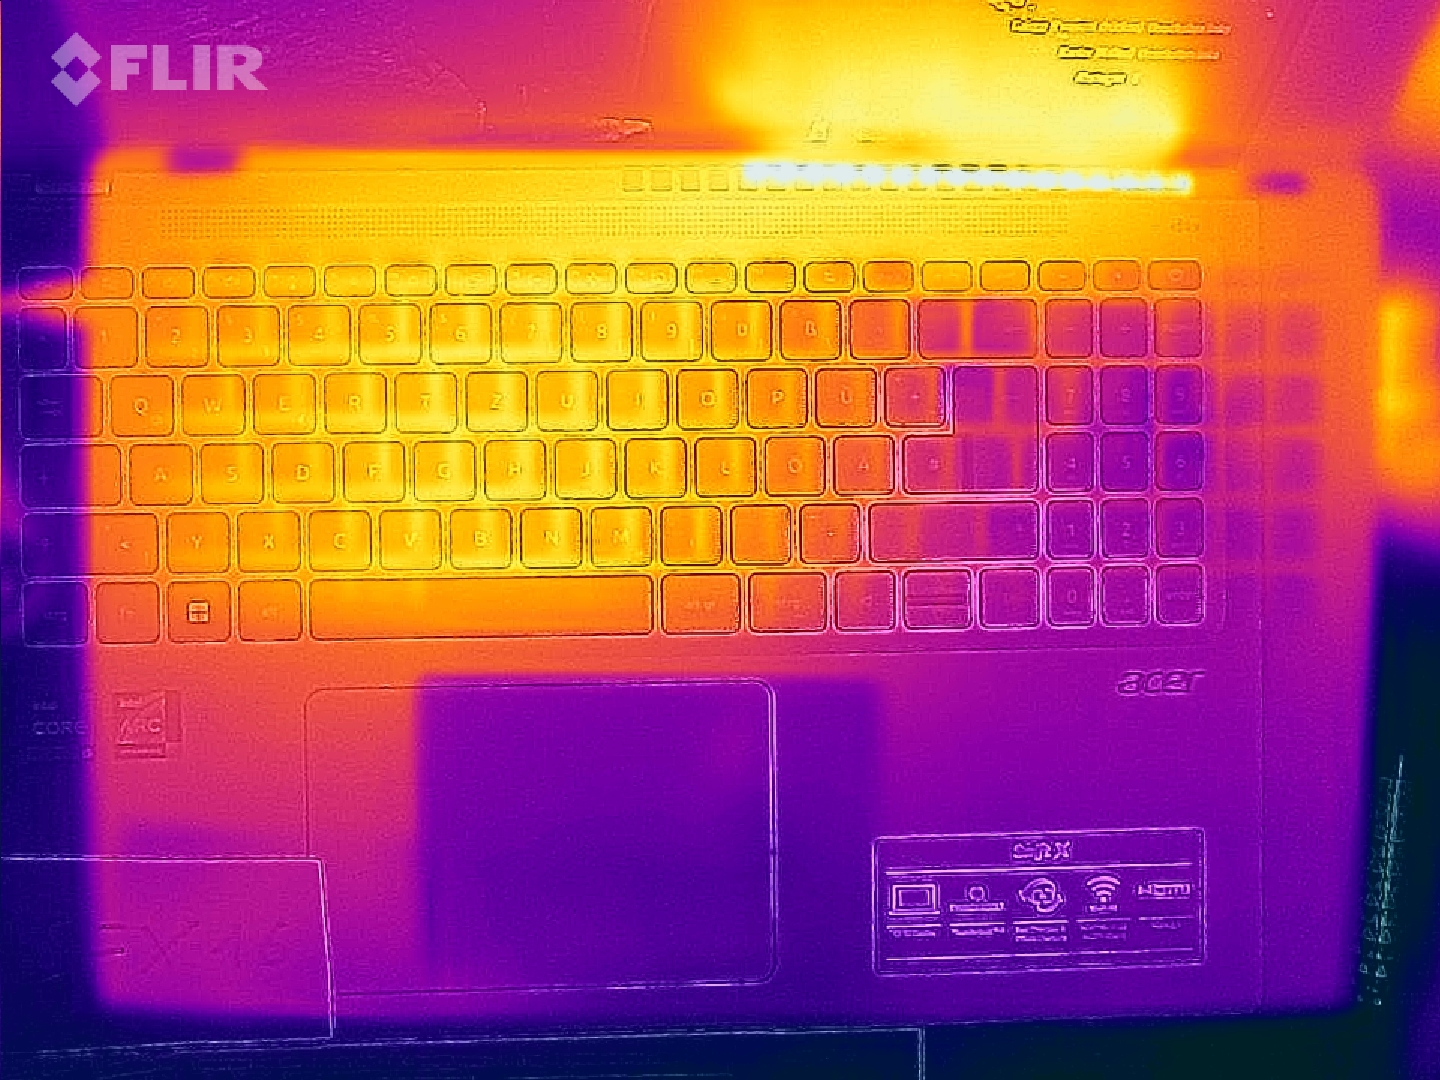
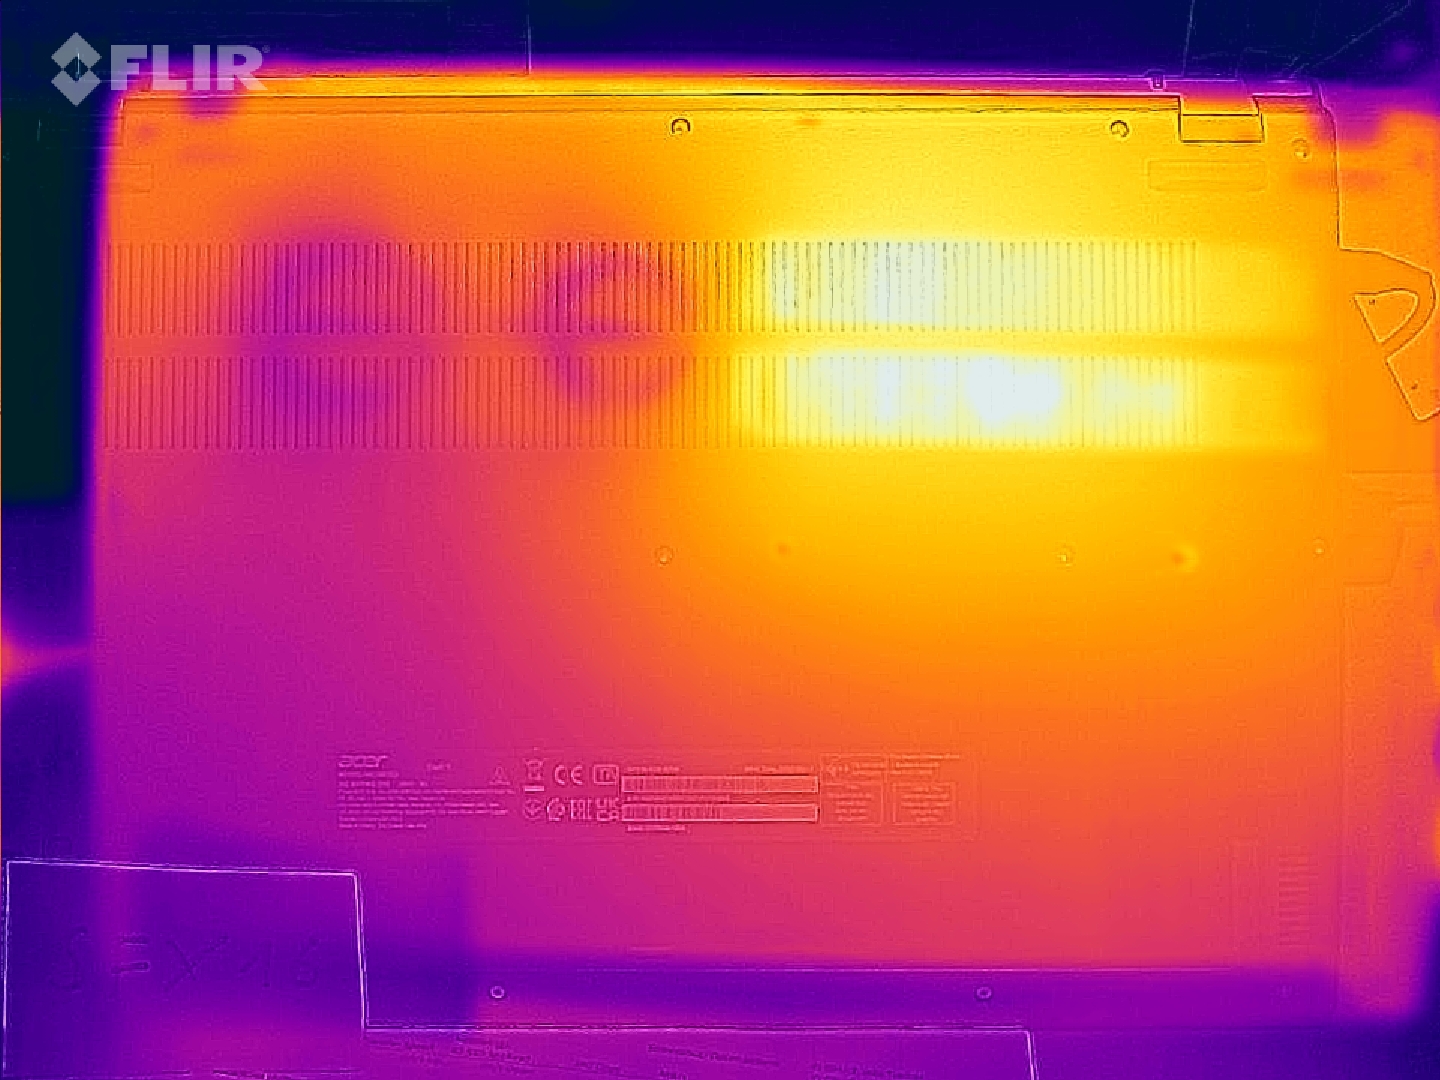
Temperature
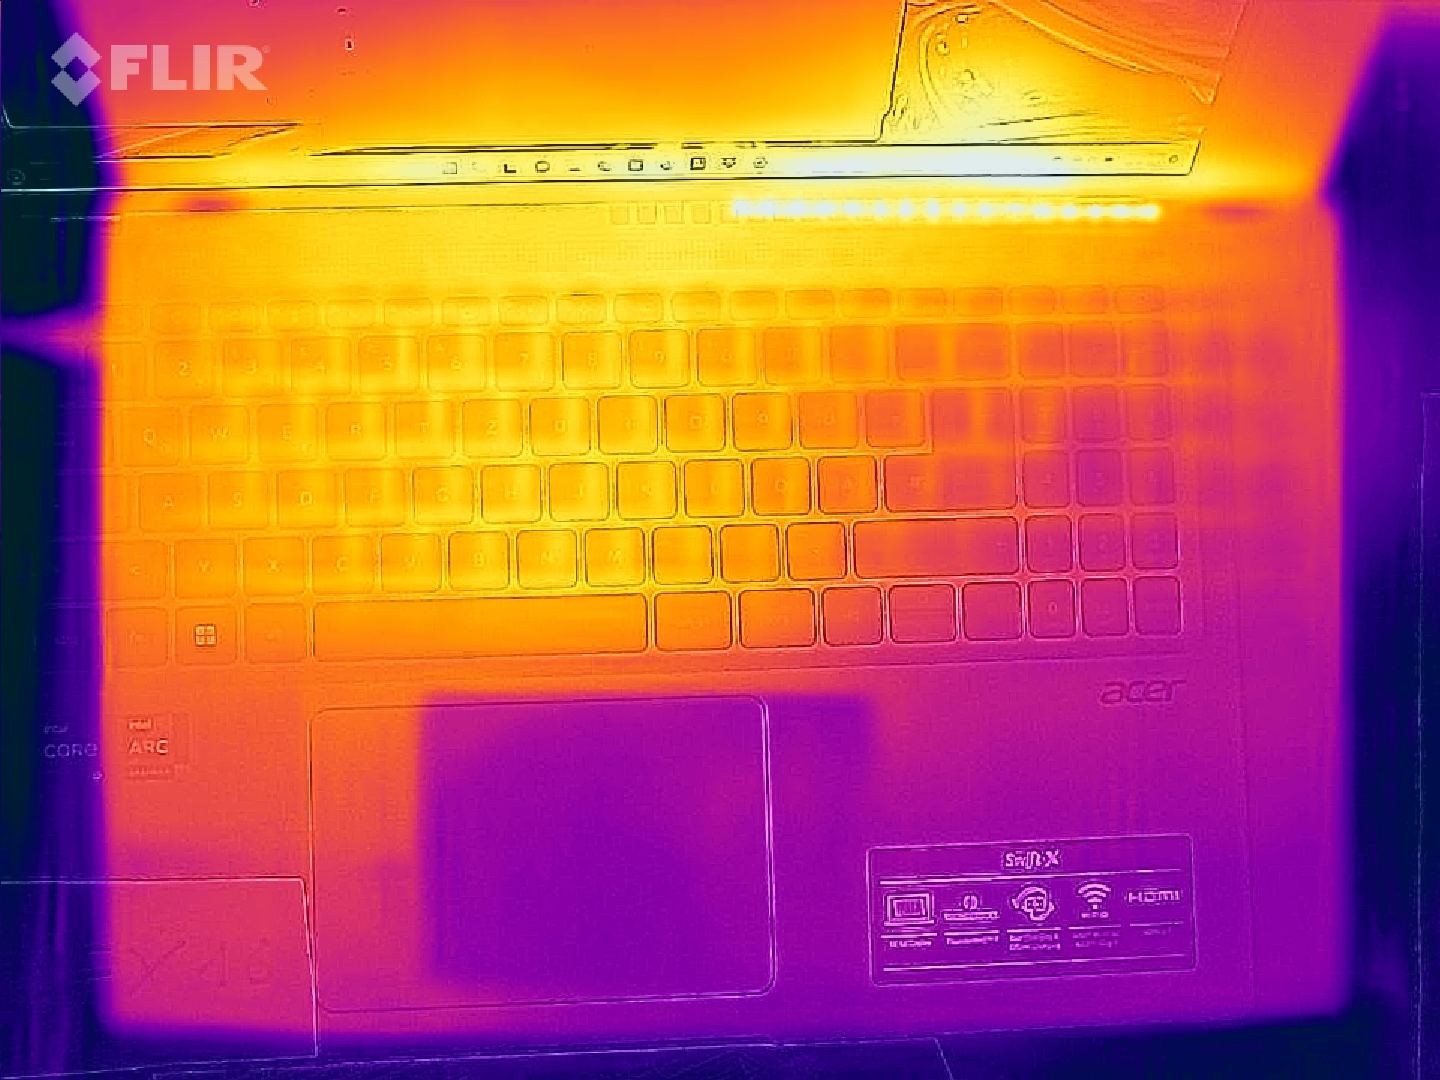
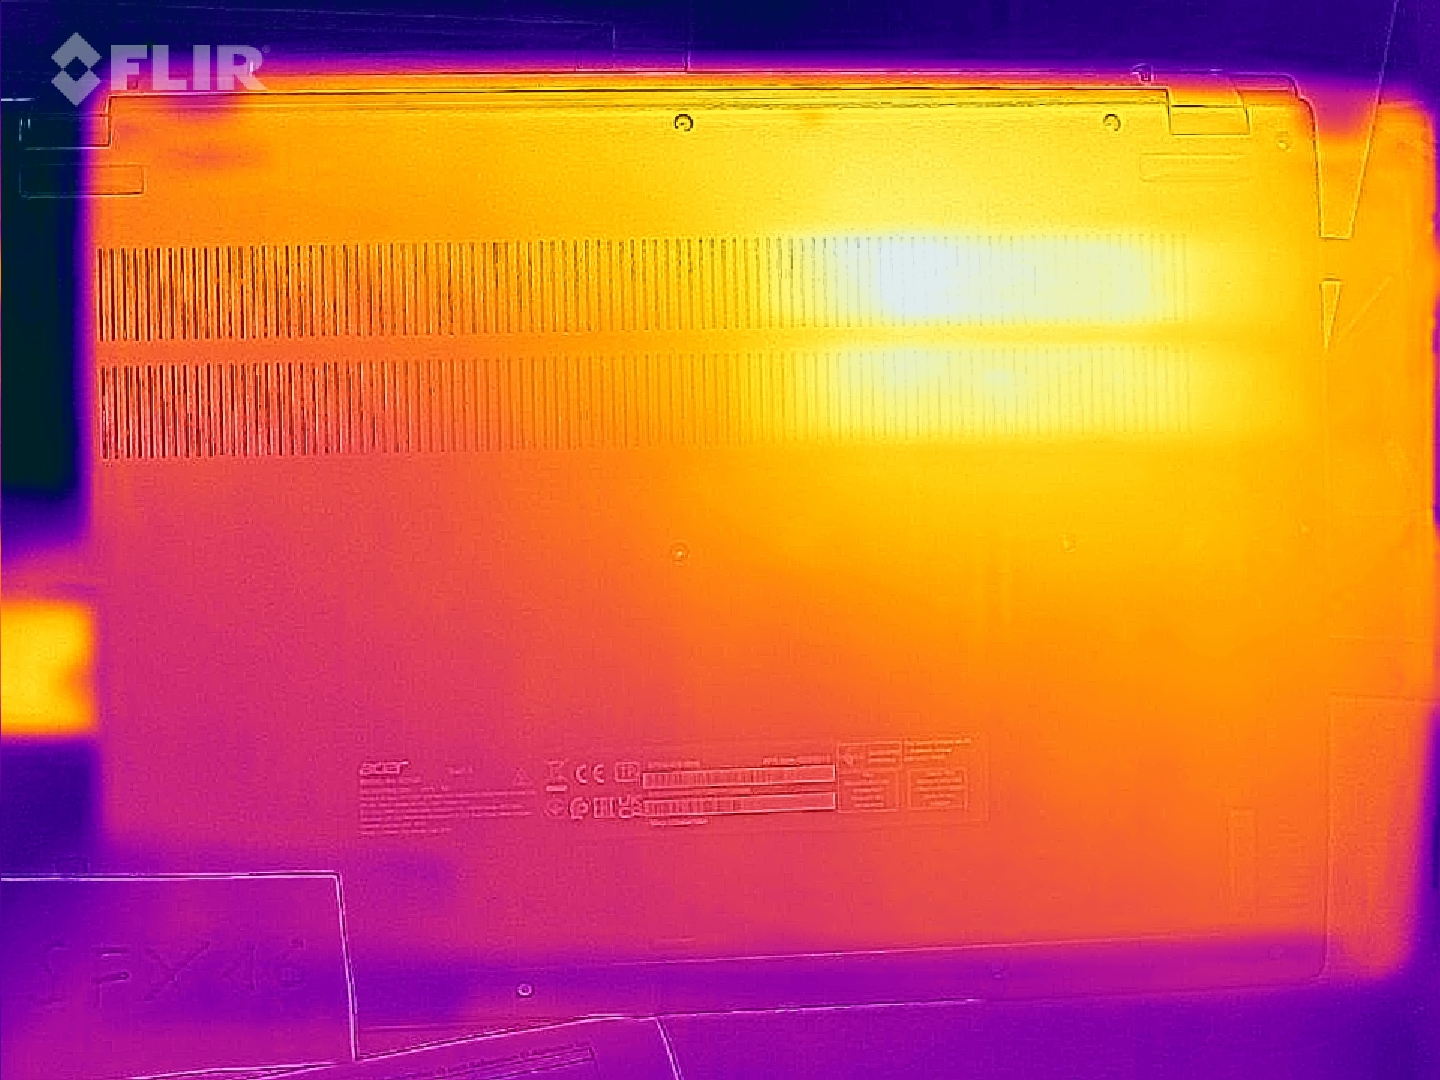
Even during simple tasks, the Acer Swift X SFX16 heats up a little. The keyboard starts to feel warm relatively quickly. The temperature increases under heavy use and reaches more than 50°C in the area of the dual fan. The position of the fan can be seen clearly on the thermal image of the top and bottom. However, this only applies in extreme situations. Only 43°C is reached in Witcher 3, which also pushes the laptop to its limits.
A special feature here is the air-permeable keyboard. As a result, unlike most competitors, the top heats up more than the bottom. Unfortunately, the measured temperatures seem too high for the actually limited power consumption and, consequently, also the heat development. In this context, the approach of letting the heated air take the natural path seems promising.
(-) The maximum temperature on the upper side is 52 °C / 126 F, compared to the average of 36.8 °C / 98 F, ranging from 21 to 71 °C for the class Multimedia.
(-) The bottom heats up to a maximum of 50.4 °C / 123 F, compared to the average of 39.1 °C / 102 F
(+) In idle usage, the average temperature for the upper side is 28.1 °C / 83 F, compared to the device average of 31.3 °C / 88 F.
(±) Playing The Witcher 3, the average temperature for the upper side is 33.5 °C / 92 F, compared to the device average of 31.3 °C / 88 F.
(-) The palmrests and touchpad can get very hot to the touch with a maximum of 41.4 °C / 106.5 F.
(-) The average temperature of the palmrest area of similar devices was 28.7 °C / 83.7 F (-12.7 °C / -22.8 F).
| Acer Swift X SFX16-52G-52VE Intel Core i5-1240P, Intel Arc A370M | Acer Aspire 5 A515-57G-53N8 Intel Core i5-1240P, NVIDIA GeForce RTX 2050 Mobile | Lenovo ThinkPad T16 G1 21BWS00200 Intel Core i5-1240P, Intel Iris Xe Graphics G7 80EUs | Asus ZenBook Flip 15 Q539ZD Intel Core i7-12700H, Intel Arc A370M | Lenovo IdeaPad Gaming 3 15IAH7 Intel Core i5-12500H, NVIDIA GeForce RTX 3050 Ti Laptop GPU | HP Omen 16-c0077ng AMD Ryzen 7 5800H, AMD Radeon RX 6600M | Lenovo ThinkBook 16 G4+ IAP Intel Core i7-12700H, NVIDIA GeForce RTX 2050 Mobile | |
|---|---|---|---|---|---|---|---|
| Heat | 13% | 4% | 18% | 13% | 9% | 12% | |
| Maximum Upper Side * (°C) | 52 | 43 17% | 45 13% | 36.4 30% | 47 10% | 40.6 22% | 42.9 17% |
| Maximum Bottom * (°C) | 50.4 | 48 5% | 42.8 15% | 40.4 20% | 52 -3% | 36 29% | 50.6 -0% |
| Idle Upper Side * (°C) | 30 | 26 13% | 33 -10% | 26.2 13% | 25 17% | 31.3 -4% | 26 13% |
| Idle Bottom * (°C) | 32.4 | 27 17% | 33.6 -4% | 29.2 10% | 24 26% | 36 -11% | 26.5 18% |
* ... smaller is better
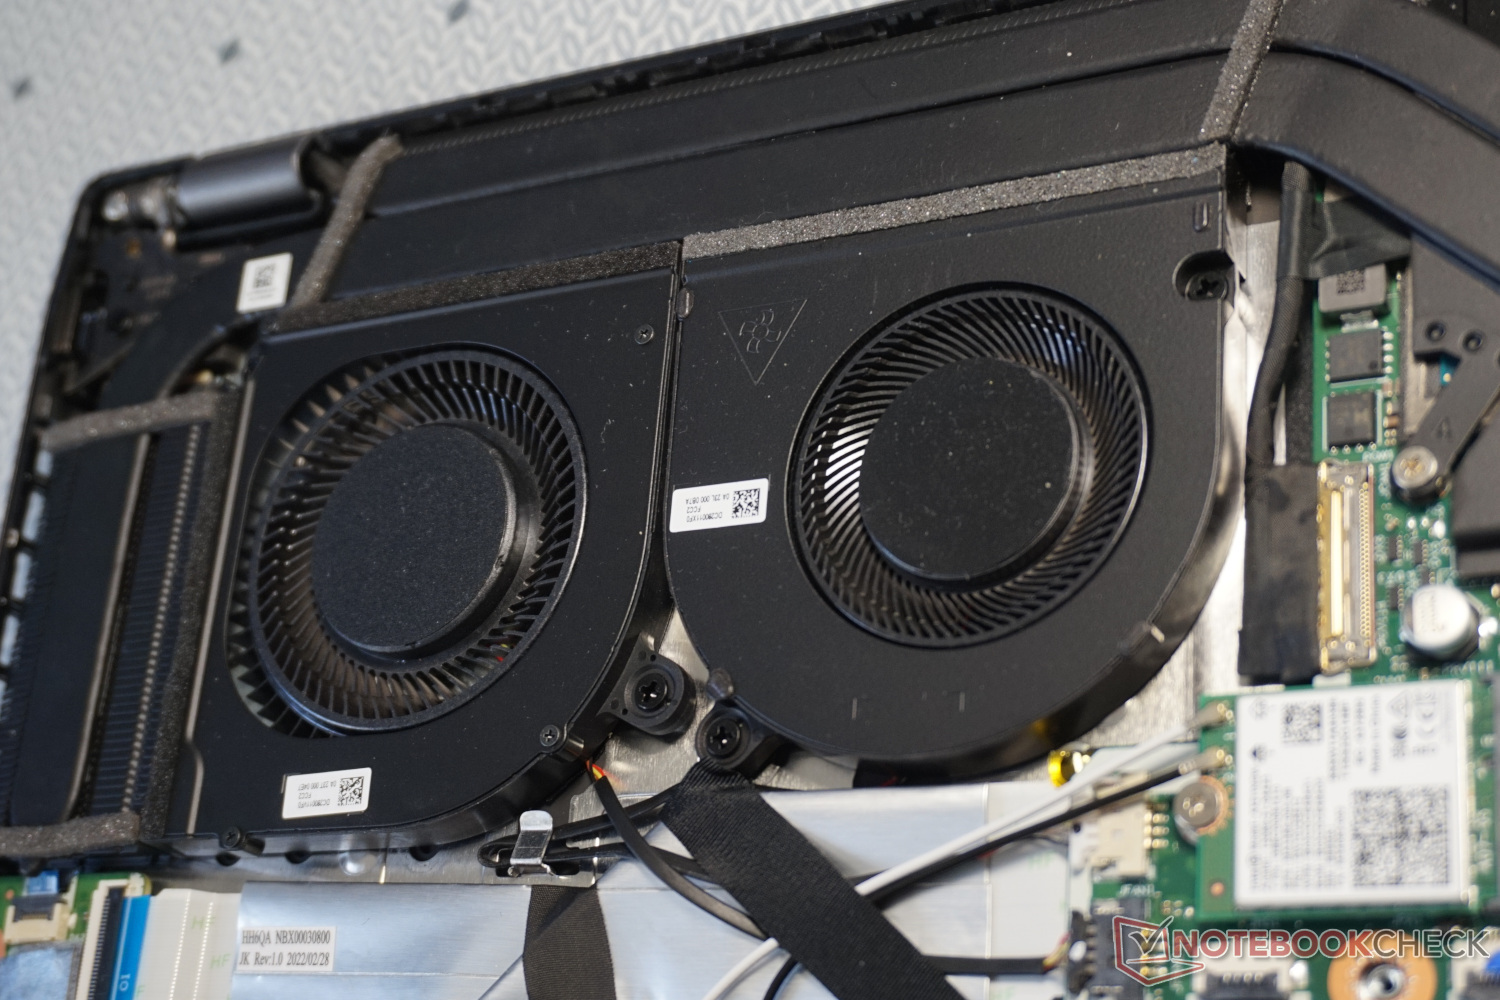
Stress test
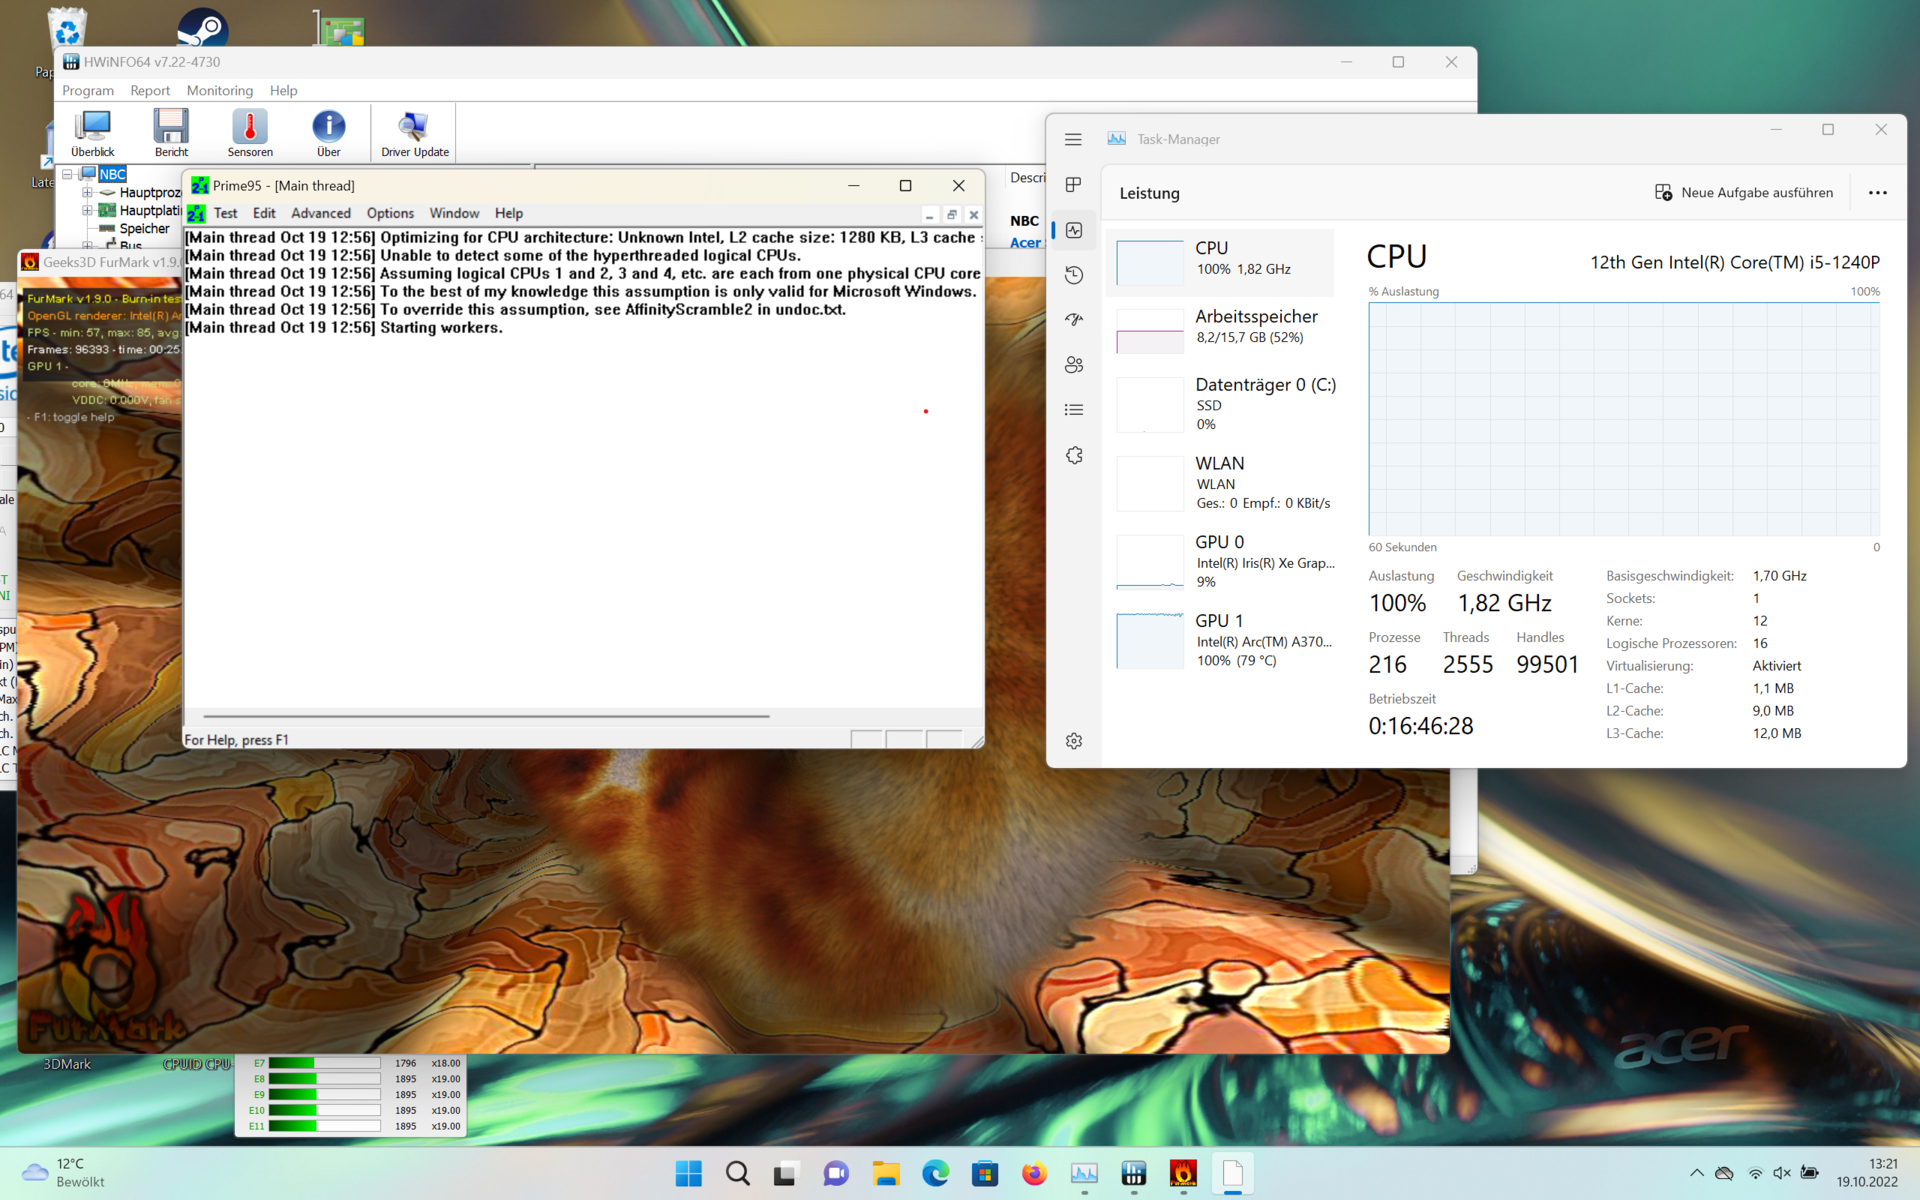
At maximum workload, which we manage with the help of Prime95 and Furmark, the CPU temperature can reach the critical limit of 100°C for a short time. However, this only applies to individual cores, never to the entire CPU.
Anything else would have been surprising, with a maximum power consumption of 100 watts and typically 70 W. The cooling with the two fans next to each other therefore works reliably.
The cooling performance can be seen clearly in the CPU's power consumption. The power limit 1 of 35 W, which defines the maximum load for just under 1 min, is reached again and again after a longer period of time. The processor can consume around 30 W throughout, so it maintained almost full performance during the stress test.
Speakers
At least for music, the two small stereo speakers are only suitable to a limited extent. There is almost no bass at all, and the lower mids, where guitars can be heard, for example, are also very weak.
Voices, on the other hand, sound pleasantly detail-rich and even. This is sufficient for video telephony, podcasts and watching live streams. Anything else requires external speakers or headphones.
Acer Swift X SFX16-52G-52VE audio analysis
(±) | speaker loudness is average but good (80.1 dB)
Bass 100 - 315 Hz
(-) | nearly no bass - on average 27.6% lower than median
(±) | linearity of bass is average (14.1% delta to prev. frequency)
Mids 400 - 2000 Hz
(+) | balanced mids - only 1.8% away from median
(+) | mids are linear (5.6% delta to prev. frequency)
Highs 2 - 16 kHz
(+) | balanced highs - only 2.9% away from median
(+) | highs are linear (5.7% delta to prev. frequency)
Overall 100 - 16.000 Hz
(±) | linearity of overall sound is average (18.3% difference to median)
Compared to same class
» 56% of all tested devices in this class were better, 7% similar, 38% worse
» The best had a delta of 5%, average was 17%, worst was 45%
Compared to all devices tested
» 40% of all tested devices were better, 8% similar, 52% worse
» The best had a delta of 4%, average was 23%, worst was 134%
Apple MacBook Pro 16 2021 M1 Pro audio analysis
(+) | speakers can play relatively loud (84.7 dB)
Bass 100 - 315 Hz
(+) | good bass - only 3.8% away from median
(+) | bass is linear (5.2% delta to prev. frequency)
Mids 400 - 2000 Hz
(+) | balanced mids - only 1.3% away from median
(+) | mids are linear (2.1% delta to prev. frequency)
Highs 2 - 16 kHz
(+) | balanced highs - only 1.9% away from median
(+) | highs are linear (2.7% delta to prev. frequency)
Overall 100 - 16.000 Hz
(+) | overall sound is linear (4.6% difference to median)
Compared to same class
» 0% of all tested devices in this class were better, 0% similar, 100% worse
» The best had a delta of 5%, average was 17%, worst was 45%
Compared to all devices tested
» 0% of all tested devices were better, 0% similar, 100% worse
» The best had a delta of 4%, average was 23%, worst was 134%
Energy management – low consumption, high endurance
Power consumption
When browsing, watching videos and similar tasks, the graphics chip remains disabled. The power consumption is correspondingly low for the multimedia class. Typically 8 W is only undercut by business and office notebooks.
Since the CPU and GPU tend to consume only modest amounts of power even under load, the Swift X's power consumption of just under 70 W is well below most laptops with an additional graphics card.
At peak values of over 100 W, we would have liked a slightly larger power supply. However, this would probably not have been allowed for Thunderbolt 4, so the discrepancy is manageable. The brief power peaks ought to be able to be absorbed by the electronics in any case.
| Off / Standby | |
| Idle | |
| Load |
|
Key:
min: | |
| Acer Swift X SFX16-52G-52VE i5-1240P, A370M, Micron 3400 MTFDKBA512TFH 512GB, , 2560x1600, 16" | Acer Aspire 5 A515-57G-53N8 i5-1240P, GeForce RTX 2050 Mobile, Micron 2450 512GB MTFDKBA512TFK, IPS, 1920x1080, 15.6" | Lenovo ThinkPad T16 G1 21BWS00200 i5-1240P, Iris Xe G7 80EUs, Samsung PM9A1 MZVL2512HCJQ, IPS, 1920x1200, 16" | Asus ZenBook Flip 15 Q539ZD i7-12700H, A370M, SK Hynix HFM001TD3JX013N, OLED, 2880x1620, 15.6" | Lenovo IdeaPad Gaming 3 15IAH7 i5-12500H, GeForce RTX 3050 Ti Laptop GPU, Intel SSD 660p SSDPEKNW512G8, IPS, 1920x1080, 15.6" | Lenovo ThinkBook 16 G4+ IAP i7-12700H, GeForce RTX 2050 Mobile, Micron 2450 1TB MTFDKCD1T0TFK, IPS, 2560x1600, 16" | Average Intel Arc A370M | Average of class Multimedia | |
|---|---|---|---|---|---|---|---|---|
| Power Consumption | 11% | 38% | -40% | -55% | -14% | -11% | -7% | |
| Idle Minimum * (Watt) | 5.7 | 4 30% | 2.9 49% | 9.1 -60% | 8 -40% | 5 12% | 6.17 ? -8% | 5.67 ? 1% |
| Idle Average * (Watt) | 8 | 8 -0% | 6 25% | 11.9 -49% | 10 -25% | 11.2 -40% | 9.17 ? -15% | 10.1 ? -26% |
| Idle Maximum * (Watt) | 10.4 | 13 -25% | 6.9 34% | 12.4 -19% | 16 -54% | 11.6 -12% | 11.3 ? -9% | 12.3 ? -18% |
| Load Average * (Watt) | 74 | 62 16% | 27.3 63% | 101.3 -37% | 99 -34% | 89.3 -21% | 81.8 ? -11% | 65.6 ? 11% |
| Witcher 3 ultra * (Watt) | 65 | 60 8% | 42.6 34% | 85.6 -32% | 144.6 -122% | 83 -28% | ||
| Load Maximum * (Watt) | 108.5 | 70 35% | 81.53 25% | 155.7 -44% | 168 -55% | 102 6% | 124.1 ? -14% | 113.2 ? -4% |
* ... smaller is better
Power consumption - The Witcher 3 / Stress test
Power consumption with external monitor
Battery life
The high efficiency of the Intel Core i5-1240P is evident in the battery runtime test. The battery lasted for almost 10 hours during simulated surfing as well as when playing a full HD movie in a continuous loop. At most, the battery's capacity of 56 Wh is slightly above average.
The lack of reduction in power consumption in battery mode is reflected in the runtime during high loads. Less than an hour is not satisfactory. After all, there is a lot of power available for this, even if only briefly.
| Acer Swift X SFX16-52G-52VE i5-1240P, A370M, 56 Wh | Acer Aspire 5 A515-57G-53N8 i5-1240P, GeForce RTX 2050 Mobile, 50 Wh | Asus ZenBook Flip 15 Q539ZD i7-12700H, A370M, 96 Wh | Lenovo IdeaPad Gaming 3 15IAH7 i5-12500H, GeForce RTX 3050 Ti Laptop GPU, 60 Wh | HP Omen 16-c0077ng R7 5800H, Radeon RX 6600M, 70 Wh | Lenovo ThinkBook 16 G4+ IAP i7-12700H, GeForce RTX 2050 Mobile, 71 Wh | Average of class Multimedia | |
|---|---|---|---|---|---|---|---|
| Battery runtime | 15% | 99% | -39% | -33% | 27% | 58% | |
| H.264 (h) | 9.8 | 7 -29% | 12.6 29% | 16.3 ? 66% | |||
| WiFi v1.3 (h) | 9.7 | 7.1 -27% | 9.4 -3% | 5.9 -39% | 6.1 -37% | 8.2 -15% | 12.1 ? 25% |
| Load (h) | 0.9 | 1.4 56% | 2.7 200% | 1.5 67% | 1.654 ? 84% | ||
| Witcher 3 ultra (h) | 1.4 |
Pros
Cons
Verdict - A fair few average scores for the Acer Swift X
No serious gaming performance is expected from the graphics card in the Acer SFX16-52G. Nevertheless, basic expectations are met even for complex 3D applications. In addition, the GPU harmonizes perfectly with the i5-1240P. This results in a notebook that can handle most tasks quickly and also perform graphics-intensive calculations.
Peak values are sought in vain. The weaknesses that go hand in hand with extensive, sometimes excessive, performance are equally absent in this regard. The laptop does not get too loud or too hot, and the battery life is also outstanding despite the average capacity. In addition, we liked the easy upgrade option for storage space and the generally good maintainability.
A strong impression with suitable performance rates for a multimedia notebook and the good display is tarnished by numerous, in some cases, unnecessary weaknesses in the Acer Swift X SFX16.
Acer has made savings in other areas in order to be able to implement the convincing basic features, including a good display. The housing yields too much in the area of the display cover. The input devices could also be of a higher quality, especially the touchpad.
In addition, the cooling system is not entirely convincing; the components' high efficiency could have been emphasized with a slightly better performance. Flawed speakers and the lack of a card slot detract a little from what is actually a very good general impression.
Still, the Swift X remains a good choice if editing pictures and videos is the most graphically demanding task. After all, the sheer performance is exactly on the level that is demanded just below gaming notebooks. On the other hand, if you want to gamble from time to time, Lenovo ThinkBook 16 G4+ or, even better, HP Omen 16-c0077ng are the more suitable choice. If a high-quality monitor is available on the desk, the Acer Aspire 5 A515 could also be recommended, the display of which performed so disappointingly in our test.
Price and availability
The Acer Swift X SFX16-52G-52VE that we tested is currently available at notebooksbilliger.de for €1,299 (~$1,291). The variant with the faster i7 processor and 1 TB SSD costs €1,499 (~$1,490).
Acer Swift X SFX16-52G-52VE
- 10/21/2022 v7 (old)
Translated
Price comparison

